Embed Size (px)
Citation preview
1
TURKISH AIRLINES June 2015
1

2
3
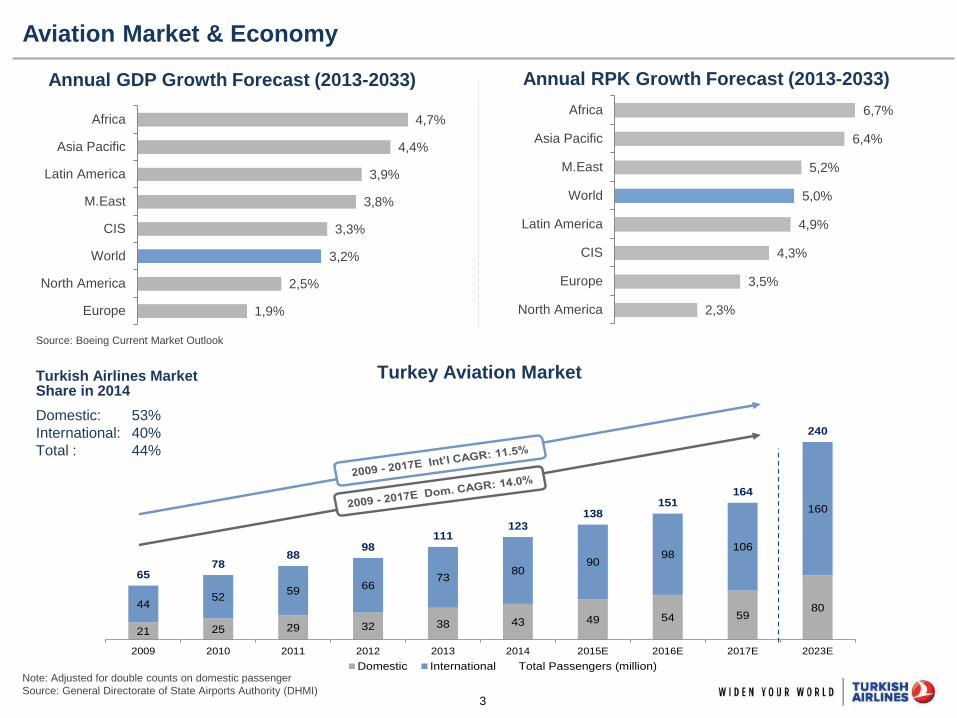
4,7%
4,4%
3,9%
3,8%
3,3%
3,2%
2,5%
1,9%
Africa
Asia Pacific
Latin America
M.East
CIS
World
North America
Europe
Source: Boeing Current Market Outlook
Aviation Market & Economy
Annual GDP Growth Forecast (2013-2033) Annual RPK Growth Forecast (2013-2033)
6,7%
6,4%
5,2%
5,0%
4,9%
4,3%
3,5%
2,3%
Africa
Asia Pacific
M.East
World
Latin America
CIS
Europe
North America
21 25 29 32 38 43 49 54 598044
5259
6673
8090
98106
160
6578
8898
111123
138151
164
240
2009 2010 2011 2012 2013 2014 2015E 2016E 2017E 2023E
Domestic International Total Passengers (million)
Turkey Aviation Market
Note: Adjusted for double counts on domestic passenger
Source: General Directorate of State Airports Authority (DHMI)
Turkish Airlines Market Share in 2014
Domestic: 53%
International: 40%
Total : 44%
4
1.000
2.000
3.000
4.000
5.000
6.000
7.000
8.000
9.000
10.000
11.000
12.000
90 100 110 120 130 140 150 160 170 180 190 200 210 220 230 240 250 260 270 280 290 300
We
ekl
y Fl
igh
ts
Destinations
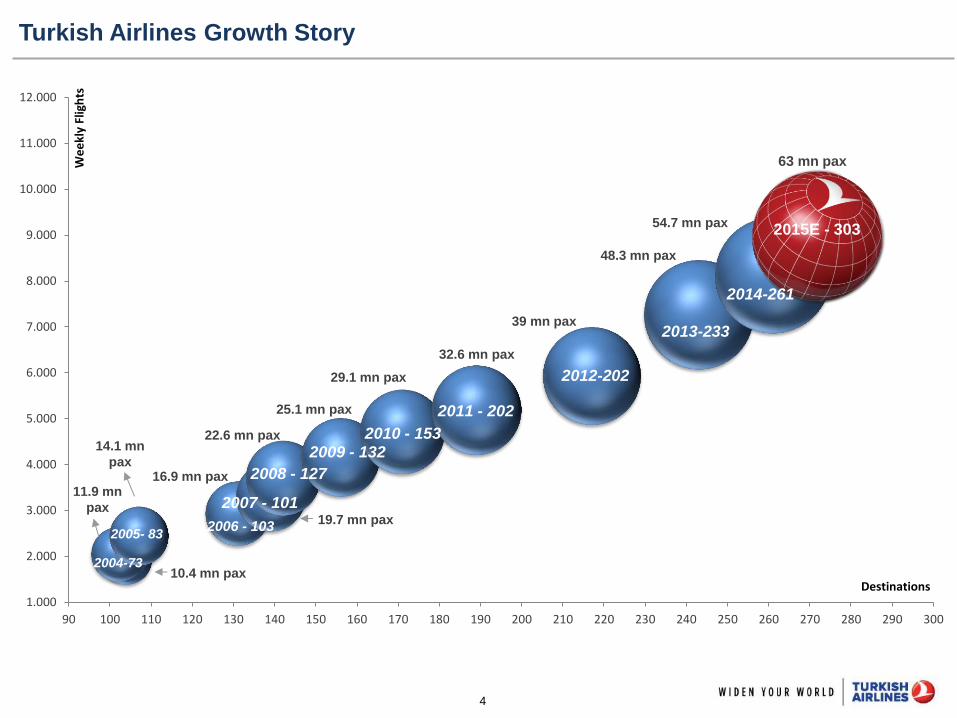
2006 - 103 2005- 83
2004-73
2007 - 101
2008 - 127
2009 - 132
2010 - 153
2013-233
2012-202
54.7 mn pax
10.4 mn pax
11.9 mn
pax
14.1 mn
pax 16.9 mn pax
19.7 mn pax
22.6 mn pax
25.1 mn pax
29.1 mn pax
32.6 mn pax
2011 - 202
39 mn pax
48.3 mn pax
2015E - 303
63 mn pax
Turkish Airlines Growth Story
2014-261
5
0%
1%
2%
3%
4%
5%
6%
7%
8%
9%
American United Delta Emirates Southwest ChinaSouthern
Air China Lufthansa British ChinaEastern
Air France Qantas TurkishAirlines
CathayPacific
LATAM Ryanair
2002 2003 2004 2005 2006 2007 2008 2009 2010 2011 2012 2013 2014
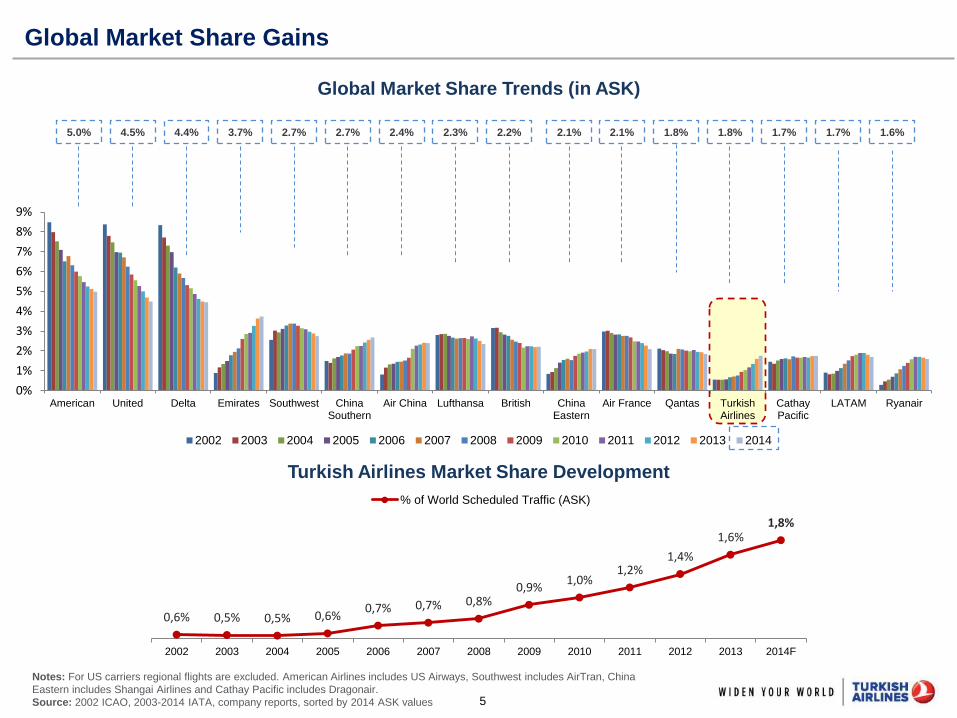
Global Market Share Gains
Notes: For US carriers regional flights are excluded. American Airlines includes US Airways, Southwest includes AirTran, China
Eastern includes Shangai Airlines and Cathay Pacific includes Dragonair.
Source: 2002 ICAO, 2003-2014 IATA, company reports, sorted by 2014 ASK values
Global Market Share Trends (in ASK)
Turkish Airlines Market Share Development
5.0% 4.5% 4.4% 3.7% 2.7% 2.7% 2.4% 2.2% 2.1% 2.1% 1.8% 1.7% 1.6% 1.8%
0,6% 0,5% 0,5% 0,6% 0,7% 0,7% 0,8%
0,9% 1,0%
1,2% 1,4%
1,6% 1,8%
2002 2003 2004 2005 2006 2007 2008 2009 2010 2011 2012 2013 2014F
% of World Scheduled Traffic (ASK)
2.3% 1.7%
6
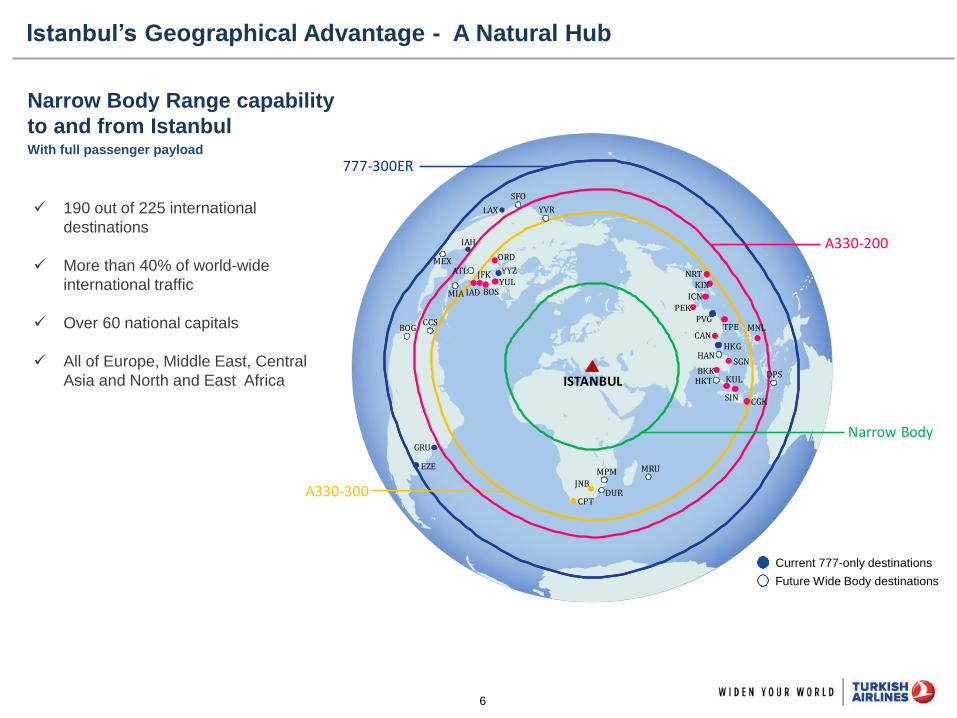
Istanbul’s Geographical Advantage - A Natural Hub
Narrow Body Range capability
to and from Istanbul With full passenger payload
190 out of 225 international
destinations
More than 40% of world-wide
international traffic
Over 60 national capitals
All of Europe, Middle East, Central
Asia and North and East Africa
777-300ER
ISTANBUL
BOS
HKG
NRT
PEK
BKK
JNB
LAX
GRU
EZE
A330-300
A330-200
SGN
CPT
CAN
IAD
IAH
JFK
ICN
KIX
KUL
SIN
ORD
CGK
YYZ
YUL
PVG
Narrow Body
SFO
MEX
BOGCCS
MIA
MNLTPE
MPM
DUR
YVR
DPS
HAN
ATL
MRU
HKT
Current 777-only destinations
Future Wide Body destinations
7 Strictly Private & Confidential
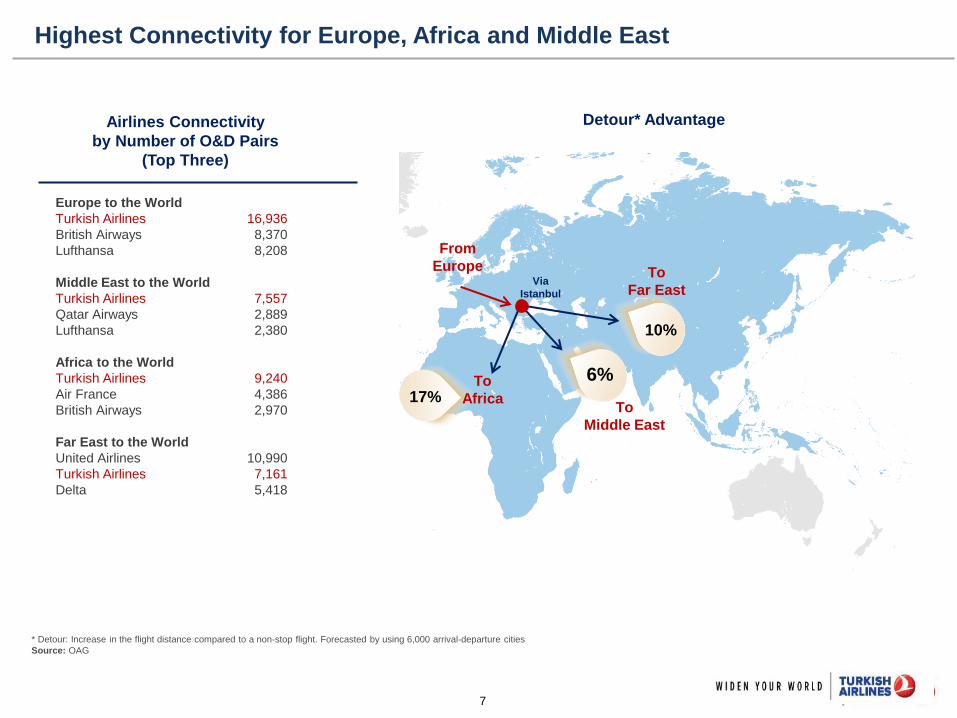
Highest Connectivity for Europe, Africa and Middle East
Europe to the World
Turkish Airlines 16,936
British Airways 8,370
Lufthansa 8,208
Middle East to the World
Turkish Airlines 7,557
Qatar Airways 2,889
Lufthansa 2,380
Africa to the World
Turkish Airlines 9,240
Air France 4,386
British Airways 2,970
Far East to the World
United Airlines 10,990
Turkish Airlines 7,161
Delta 5,418
17%
6%
10%
Detour* Advantage
Via
Istanbul
Airlines Connectivity
by Number of O&D Pairs
(Top Three)
From
Europe To
Far East
To
Middle East
To
Africa
* Detour: Increase in the flight distance compared to a non-stop flight. Forecasted by using 6,000 arrival-departure cities
Source: OAG
8
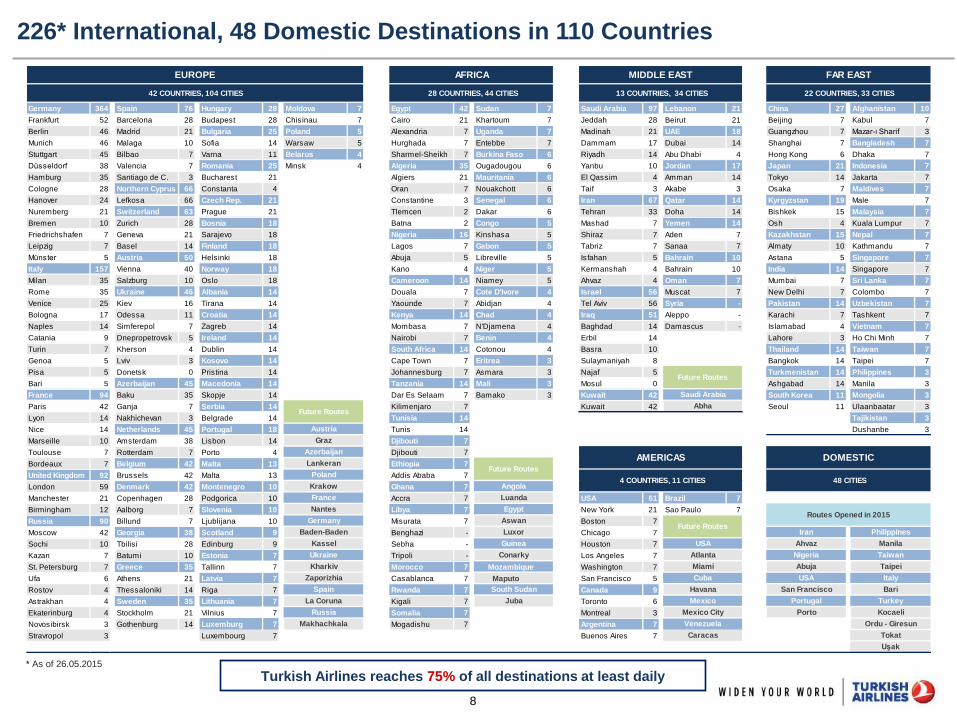
226* International, 48 Domestic Destinations in 110 Countries
* As of 26.05.2015
Turkish Airlines reaches 75% of all destinations at least daily
Germany 364 Spain 76 Hungary 28 Moldova 7 Egypt 42 Sudan 7 Saudi Arabia 97 Lebanon 21 China 27 Afghanistan 10
Frankfurt 52 Barcelona 28 Budapest 28 Chisinau 7 Cairo 21 Khartoum 7 Jeddah 28 Beirut 21 Beijing 7 Kabul 7
Berlin 46 Madrid 21 Bulgaria 25 Poland 5 Alexandria 7 Uganda 7 Madinah 21 UAE 18 Guangzhou 7 Mazar-ı Sharif 3
Munich 46 Malaga 10 Sofia 14 Warsaw 5 Hurghada 7 Entebbe 7 Dammam 17 Dubai 14 Shanghai 7 Bangladesh 7
Stuttgart 45 Bilbao 7 Varna 11 Belarus 4 Sharmel-Sheikh 7 Burkina Faso 6 Riyadh 14 Abu Dhabi 4 Hong Kong 6 Dhaka 7
Düsseldorf 38 Valencia 7 Romania 25 Minsk 4 Algeria 35 Ougadougou 6 Yanbu 10 Jordan 17 Japan 21 Indonesia 7
Hamburg 35 Santiago de C. 3 Bucharest 21 Algiers 21 Mauritania 6 El Qassim 4 Amman 14 Tokyo 14 Jakarta 7
Cologne 28 Northern Cyprus 66 Constanta 4 Oran 7 Nouakchott 6 Taif 3 Akabe 3 Osaka 7 Maldives 7
Hanover 24 Lefkosa 66 Czech Rep. 21 Constantine 3 Senegal 6 Iran 67 Qatar 14 Kyrgyzstan 19 Male 7
Nuremberg 21 Switzerland 63 Prague 21 Tlemcen 2 Dakar 6 Tehran 33 Doha 14 Bishkek 15 Malaysia 7
Bremen 10 Zurich 28 Bosnia 18 Batna 2 Congo 5 Mashad 7 Yemen 14 Osh 4 Kuala Lumpur 7
Friedrichshafen 7 Geneva 21 Sarajevo 18 Nigeria 16 Kinshasa 5 Shiraz 7 Aden 7 Kazakhstan 15 Nepal 7
Leipzig 7 Basel 14 Finland 18 Lagos 7 Gabon 5 Tabriz 7 Sanaa 7 Almaty 10 Kathmandu 7
Münster 5 Austria 50 Helsinki 18 Abuja 5 Libreville 5 Isfahan 5 Bahrain 10 Astana 5 Singapore 7
Italy 157 Vienna 40 Norway 18 Kano 4 Niger 5 Kermanshah 4 Bahrain 10 India 14 Singapore 7
Milan 35 Salzburg 10 Oslo 18 Cameroon 14 Niamey 5 Ahvaz 4 Oman 7 Mumbai 7 Sri Lanka 7
Rome 35 Ukraine 46 Albania 14 Douala 7 Cote D'Ivore 4 Israel 56 Muscat 7 New Delhi 7 Colombo 7
Venice 25 Kiev 16 Tirana 14 Yaounde 7 Abidjan 4 Tel Aviv 56 Syria - Pakistan 14 Uzbekistan 7
Bologna 17 Odessa 11 Croatia 14 Kenya 14 Chad 4 Iraq 51 Aleppo - Karachi 7 Tashkent 7
Naples 14 Simferepol 7 Zagreb 14 Mombasa 7 N'Djamena 4 Baghdad 14 Damascus - Islamabad 4 Vietnam 7
Catania 9 Dnepropetrovsk 5 Ireland 14 Nairobi 7 Benin 4 Erbil 14 Lahore 3 Ho Chi Minh 7
Turin 7 Kherson 4 Dublin 14 South Africa 14 Cotonou 4 Basra 10 Thailand 14 Taiwan 7
Genoa 5 Lviv 3 Kosovo 14 Cape Town 7 Eritrea 3 Sulaymaniyah 8 Bangkok 14 Taipei 7
Pisa 5 Donetsk 0 Pristina 14 Johannesburg 7 Asmara 3 Najaf 5 Turkmenistan 14 Philippines 3
Bari 5 Azerbaijan 45 Macedonia 14 Tanzania 14 Mali 3 Mosul 0 Ashgabad 14 Manila 3
France 94 Baku 35 Skopje 14 Dar Es Selaam 7 Bamako 3 Kuwait 42 South Korea 11 Mongolia 3
Paris 42 Ganja 7 Serbia 14 Kilimenjaro 7 Kuwait 42 Seoul 11 Ulaanbaatar 3
Lyon 14 Nakhichevan 3 Belgrade 14 Tunisia 14 Tajikistan 3
Nice 14 Netherlands 45 Portugal 18 Tunis 14 Dushanbe 3
Marseille 10 Amsterdam 38 Lisbon 14 Djibouti 7
Toulouse 7 Rotterdam 7 Porto 4 Djibouti 7
Bordeaux 7 Belgium 42 Malta 13 Ethiopia 7
United Kingdom 92 Brussels 42 Malta 13 Addis Ababa 7
London 59 Denmark 42 Montenegro 10 Ghana 7
Manchester 21 Copenhagen 28 Podgorica 10 Accra 7 USA 61 Brazil 7
Birmingham 12 Aalborg 7 Slovenia 10 Libya 7 New York 21 Sao Paulo 7
Russia 90 Billund 7 Ljublijana 10 Misurata 7 Boston 7
Moscow 42 Georgia 38 Scotland 9 Benghazi - Chicago 7
Sochi 10 Tbilisi 28 Edinburg 9 Sebha - Houston 7
Kazan 7 Batumi 10 Estonia 7 Tripoli - Los Angeles 7
St. Petersburg 7 Greece 35 Tallinn 7 Morocco 7 Mozambique Washington 7
Ufa 6 Athens 21 Latvia 7 Casablanca 7 Maputo San Francisco 5
Rostov 4 Thessaloniki 14 Riga 7 Rwanda 7 Canada 9
Astrakhan 4 Sweden 35 Lithuania 7 Kigali 7 Toronto 6
Ekaterinburg 4 Stockholm 21 Vilnius 7 Somalia 7 Montreal 3
Novosibirsk 3 Gothenburg 14 Luxemburg 7 Mogadishu 7 Argentina 7
Stravropol 3 Luxembourg 7 Buenos Aires 7
Zaporizhia Cuba
HavanaSpain
Uşak
Ordu - Giresun
Mexico City
Makhachkala
Porto Kocaeli
Tokat
USA
San Francisco
Italy
Bari
Portugal TurkeyLa Coruna
South Sudan
Venezuela
Russia
Juba
Caracas
Mexico
Ukraine
Guinea
Nigeria Taiwan
Kharkiv
Conarky
Miami Abuja Taipei
Atlanta
Future Routes
Routes Opened in 2015
Kassel
Egypt
France
Aswan
USA
Iran PhilippinesLuxor
Ahvaz Manila
Nantes
Germany
Krakow
Baden-Baden
Luanda
Azerbaijan
Lankeran
Poland
AMERICAS DOMESTICFuture Routes
4 COUNTRIES, 11 CITIES 48 CITIESAngola
EUROPE AFRICA MIDDLE EAST FAR EAST
42 COUNTRIES, 104 CITIES 28 COUNTRIES, 44 CITIES 13 COUNTRIES, 34 CITIES 22 COUNTRIES, 33 CITIES
Future Routes
Future Routes
Austria
Saudi Arabia
Graz
Abha
9
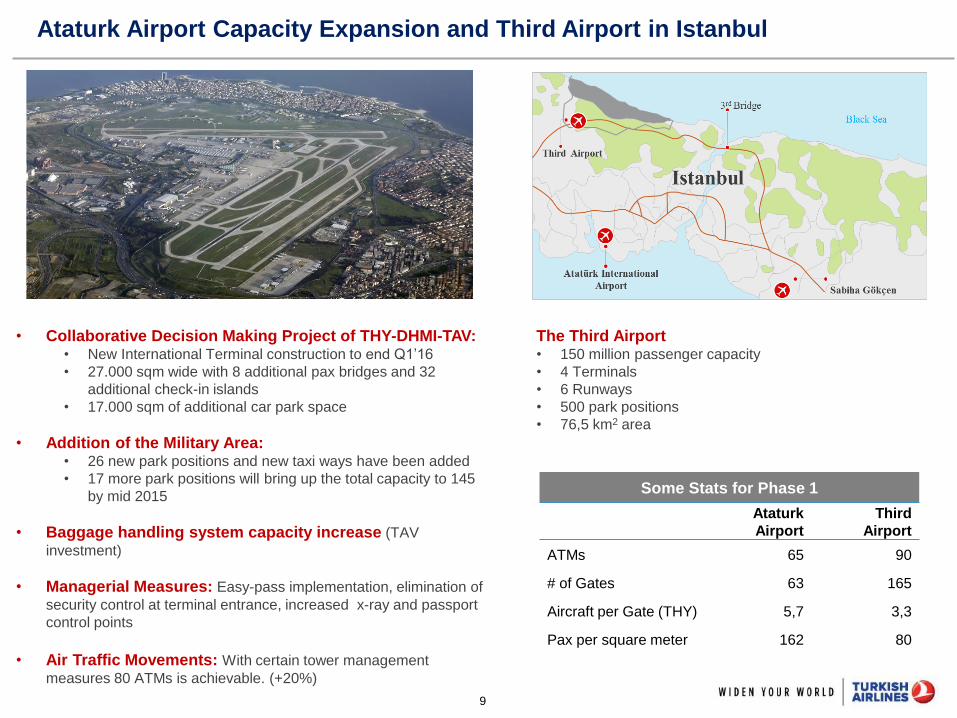
Ataturk Airport Capacity Expansion and Third Airport in Istanbul
• Collaborative Decision Making Project of THY-DHMI-TAV: • New International Terminal construction to end Q1’16
• 27.000 sqm wide with 8 additional pax bridges and 32
additional check-in islands
• 17.000 sqm of additional car park space
• Addition of the Military Area: • 26 new park positions and new taxi ways have been added
• 17 more park positions will bring up the total capacity to 145
by mid 2015
• Baggage handling system capacity increase (TAV
investment)
• Managerial Measures: Easy-pass implementation, elimination of
security control at terminal entrance, increased x-ray and passport
control points
• Air Traffic Movements: With certain tower management
measures 80 ATMs is achievable. (+20%)
Some Stats for Phase 1
Ataturk
Airport
Third
Airport
ATMs 65 90
# of Gates 63 165
Aircraft per Gate (THY) 5,7 3,3
Pax per square meter 162 80
The Third Airport • 150 million passenger capacity
• 4 Terminals
• 6 Runways
• 500 park positions
• 76,5 km2 area
10 Strictly Private & Confidential
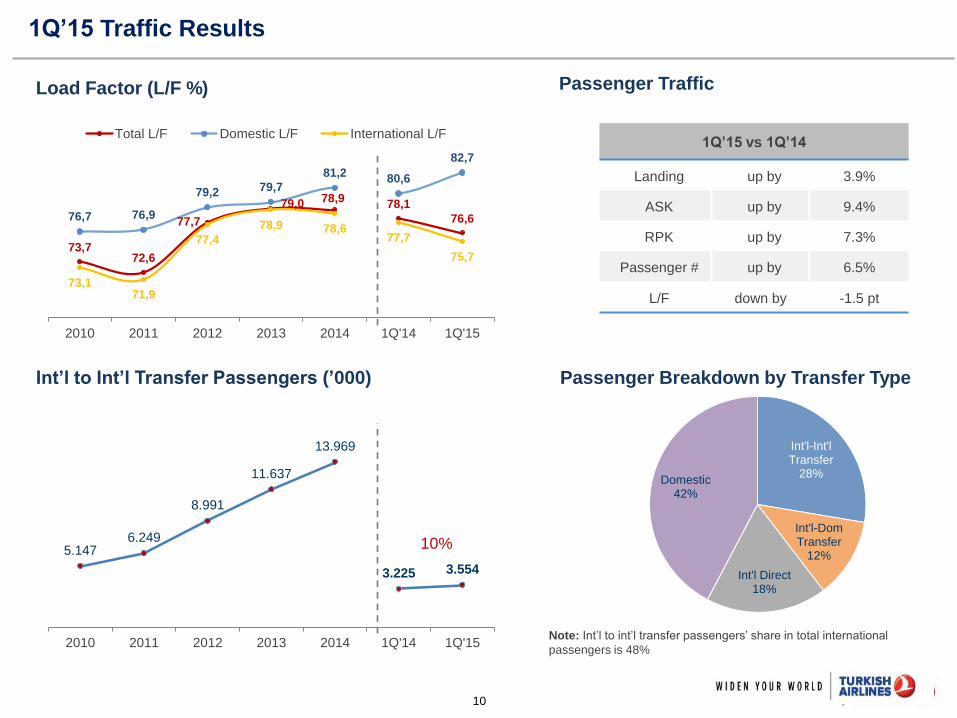
1Q’15 Traffic Results
73,7 72,6
77,7
79,0 78,9 78,1
76,6 76,7 76,9
79,2 79,7
81,2 80,6
82,7
73,1 71,9
77,4
78,9 78,6 77,7
75,7
2010 2011 2012 2013 2014 1Q'14 1Q'15
Total L/F Domestic L/F International L/F
Load Factor (L/F %)
1Q’15 vs 1Q’14
Landing up by 3.9%
ASK up by 9.4%
RPK up by 7.3%
Passenger # up by 6.5%
L/F down by -1.5 pt
Passenger Traffic
5.147 6.249
8.991
11.637
13.969
3.225 3.554
2010 2011 2012 2013 2014 1Q'14 1Q'15
Int’l to Int’l Transfer Passengers (’000)
Note: Int’l to int’l transfer passengers’ share in total international
passengers is 48%
Int'l-Int'l Transfer
28%
Int'l-Dom Transfer
12%
Int'l Direct 18%
Domestic 42%
Passenger Breakdown by Transfer Type
10%
11
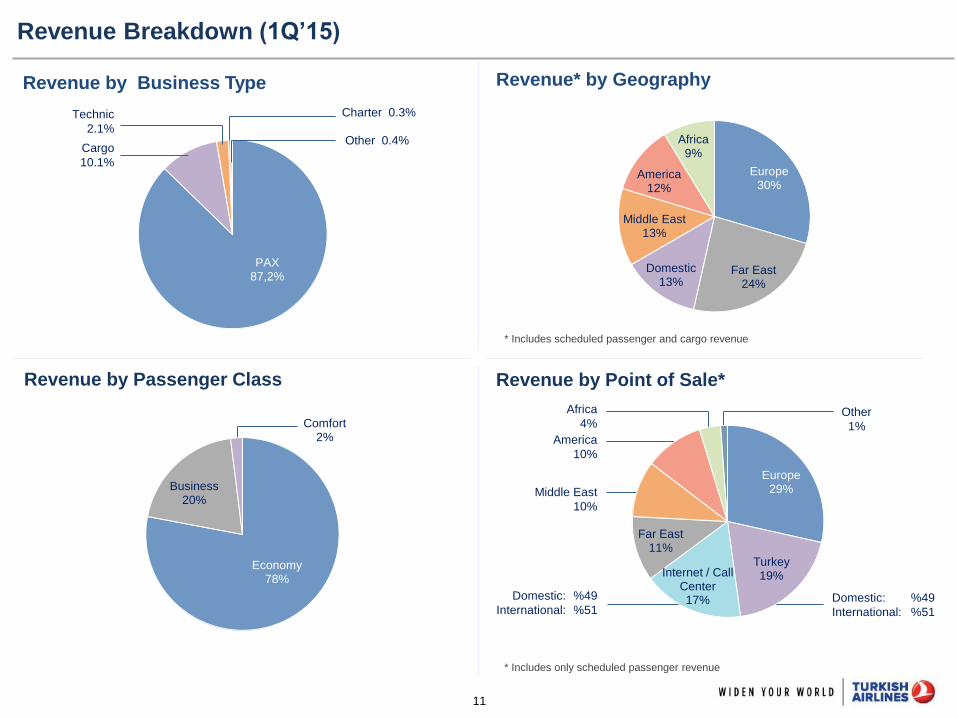
PAX 87,2%
Europe 30%
Far East 24%
Domestic 13%
Middle East 13%
America 12%
Africa 9%
Charter 0.3%
Revenue* by Geography
Revenue Breakdown (1Q’15)
Revenue by Business Type
Revenue by Passenger Class Revenue by Point of Sale*
* Includes scheduled passenger and cargo revenue
* Includes only scheduled passenger revenue
America
10%
Middle East
10%
Domestic:
International:
%49
%51 Domestic:
International:
%49
%51
Other
1%
Africa
4%
Other 0.4%
Technic
2.1%
Cargo
10.1%
Economy 78%
Business 20%
Comfort 2%
Europe 29%
Turkey 19% Internet / Call
Center 17%
Far East 11%
12
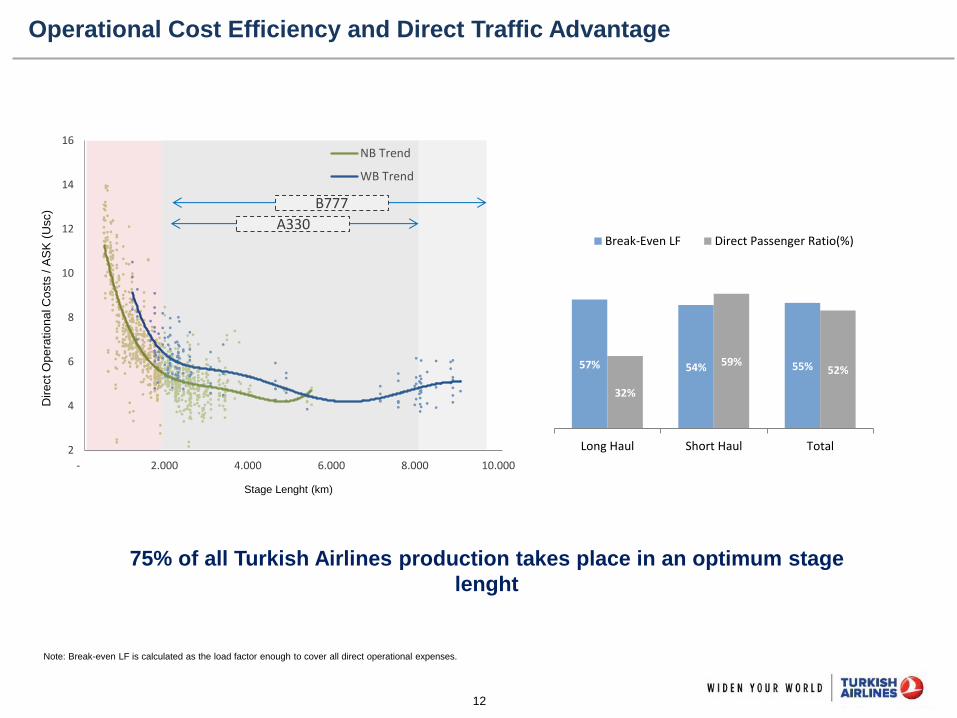
Operational Cost Efficiency and Direct Traffic Advantage
75% of all Turkish Airlines production takes place in an optimum stage
lenght
57% 54% 55%
32%
59% 52%
Long Haul Short Haul Total
Break-Even LF Direct Passenger Ratio(%)
Note: Break-even LF is calculated as the load factor enough to cover all direct operational expenses.
Dir
ect O
pe
ratio
na
l Costs
/ A
SK
(U
sc)
Stage Lenght (km)
2
4
6
8
10
12
14
16
- 2.000 4.000 6.000 8.000 10.000
NB Trend
WB Trend
B777
A330

13
Average Daily Flight Utilization (hrs)
13:20 13:18
14:20
15:04 15:05
14:15 14:23
11:55 11:20
11:47 12:18 12:12 12:11
11:28
12:02 11:40
12:11 12:39 12:43 12:28
12:02
2010 2011 2012 2013 2014 1Q'14 1Q'15
WB Long-Haul NB Medium Haul Total
10% increase in Utilization should decrease total CASK by 3%
Fixed Cost Ratio (%)
2009 - 2014 Utilization Increase : %9
%36 %32 %28 %27 %27 %28 %29
14
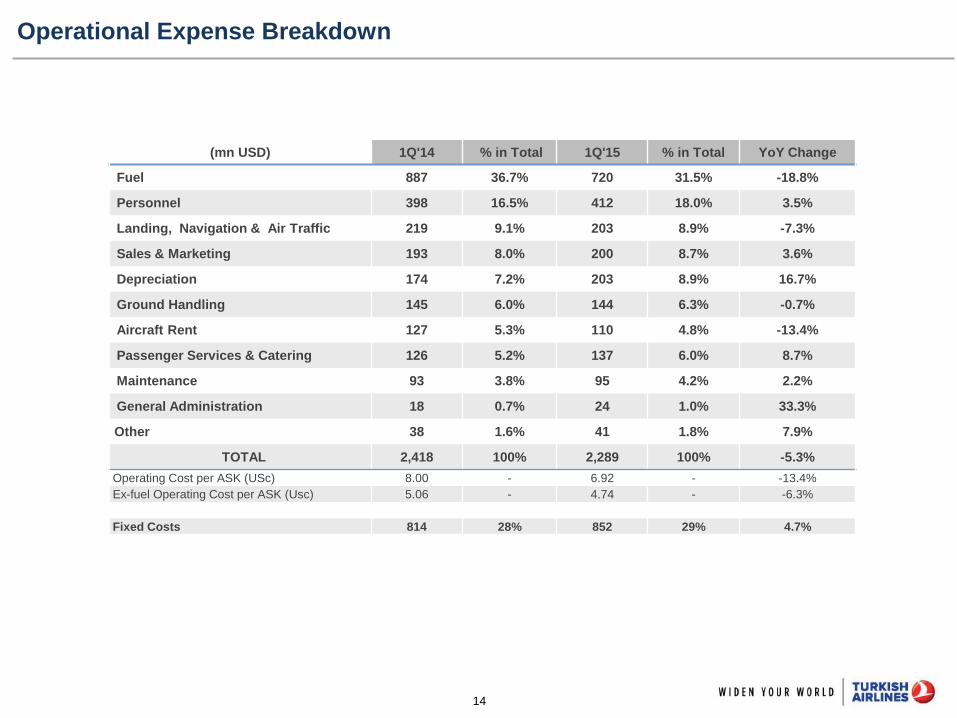
Operational Expense Breakdown
(mn USD) 1Q'14 % in Total 1Q'15 % in Total YoY Change
Fuel 887 36.7% 720 31.5% -18.8%
Personnel 398 16.5% 412 18.0% 3.5%
Landing, Navigation & Air Traffic 219 9.1% 203 8.9% -7.3%
Sales & Marketing 193 8.0% 200 8.7% 3.6%
Depreciation 174 7.2% 203 8.9% 16.7%
Ground Handling 145 6.0% 144 6.3% -0.7%
Aircraft Rent 127 5.3% 110 4.8% -13.4%
Passenger Services & Catering 126 5.2% 137 6.0% 8.7%
Maintenance 93 3.8% 95 4.2% 2.2%
General Administration 18 0.7% 24 1.0% 33.3%
Other 38 1.6% 41 1.8% 7.9%
TOTAL 2,418 100% 2,289 100% -5.3%
Operating Cost per ASK (USc) 8.00 - 6.92 - -13.4%
Ex-fuel Operating Cost per ASK (Usc) 5.06 - 4.74 - -6.3%
Fixed Costs 814 28% 852 29% 4.7%
15
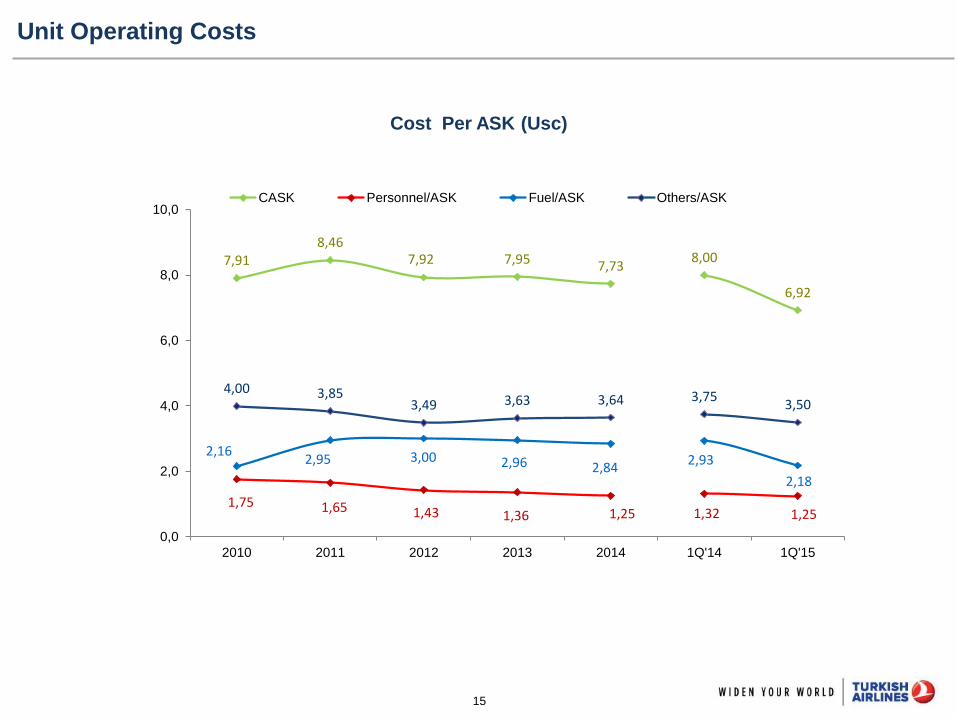
Cost Per ASK (Usc)
Unit Operating Costs
7,91 8,46
7,92 7,95 7,73 8,00
6,92
1,75 1,65 1,43 1,36 1,25 1,32 1,25
2,16 2,95 3,00 2,96 2,84
2,93
2,18
4,00 3,85 3,49 3,63 3,64 3,75
3,50
0,0
2,0
4,0
6,0
8,0
10,0
2010 2011 2012 2013 2014 1Q'14 1Q'15
CASK Personnel/ASK Fuel/ASK Others/ASK
16
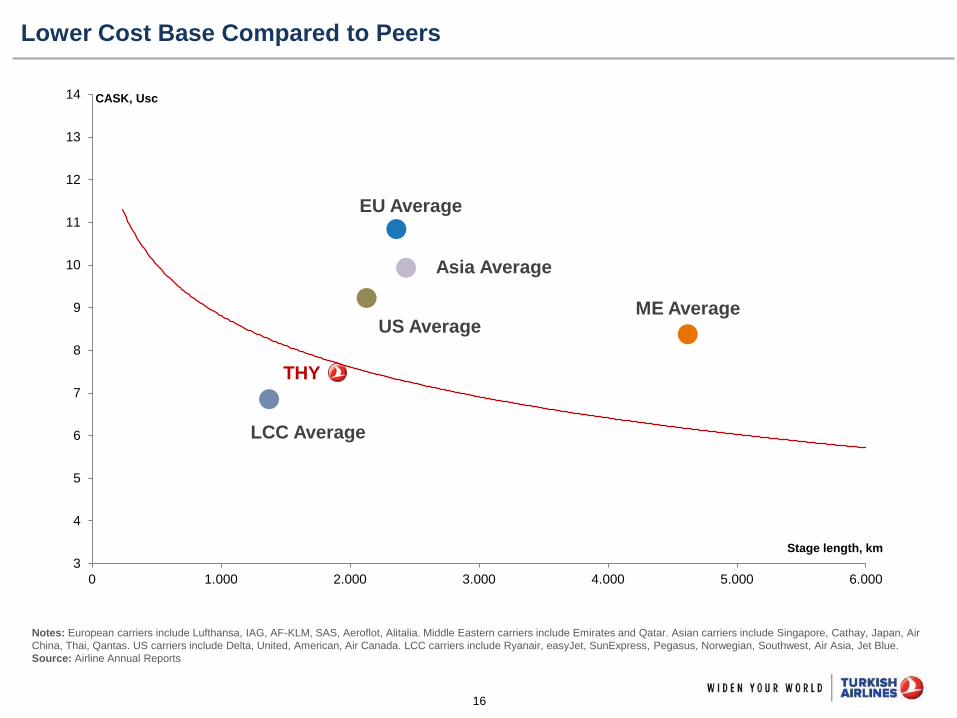
Lower Cost Base Compared to Peers
Notes: European carriers include Lufthansa, IAG, AF-KLM, SAS, Aeroflot, Alitalia. Middle Eastern carriers include Emirates and Qatar. Asian carriers include Singapore, Cathay, Japan, Air
China, Thai, Qantas. US carriers include Delta, United, American, Air Canada. LCC carriers include Ryanair, easyJet, SunExpress, Pegasus, Norwegian, Southwest, Air Asia, Jet Blue.
Source: Airline Annual Reports
LCC Average
ME Average
EU Average
US Average
Asia Average
THY
3
4
5
6
7
8
9
10
11
12
13
14
0 1.000 2.000 3.000 4.000 5.000 6.000
CASK, Usc
Stage length, km
17
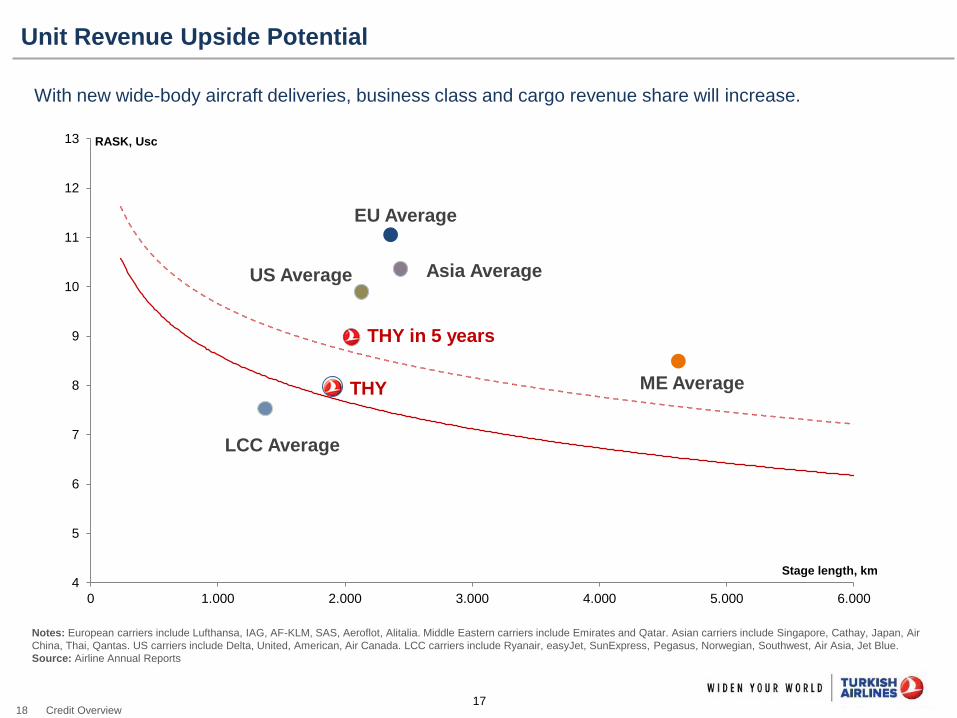
Unit Revenue Upside Potential
18 Credit Overview
THY in 5 years
EU Average
LCC Average
ME Average
US Average Asia Average
THY
4
5
6
7
8
9
10
11
12
13
0 1.000 2.000 3.000 4.000 5.000 6.000
RASK, Usc
Stage length, km
Notes: European carriers include Lufthansa, IAG, AF-KLM, SAS, Aeroflot, Alitalia. Middle Eastern carriers include Emirates and Qatar. Asian carriers include Singapore, Cathay, Japan, Air
China, Thai, Qantas. US carriers include Delta, United, American, Air Canada. LCC carriers include Ryanair, easyJet, SunExpress, Pegasus, Norwegian, Southwest, Air Asia, Jet Blue.
Source: Airline Annual Reports
With new wide-body aircraft deliveries, business class and cargo revenue share will increase.
18
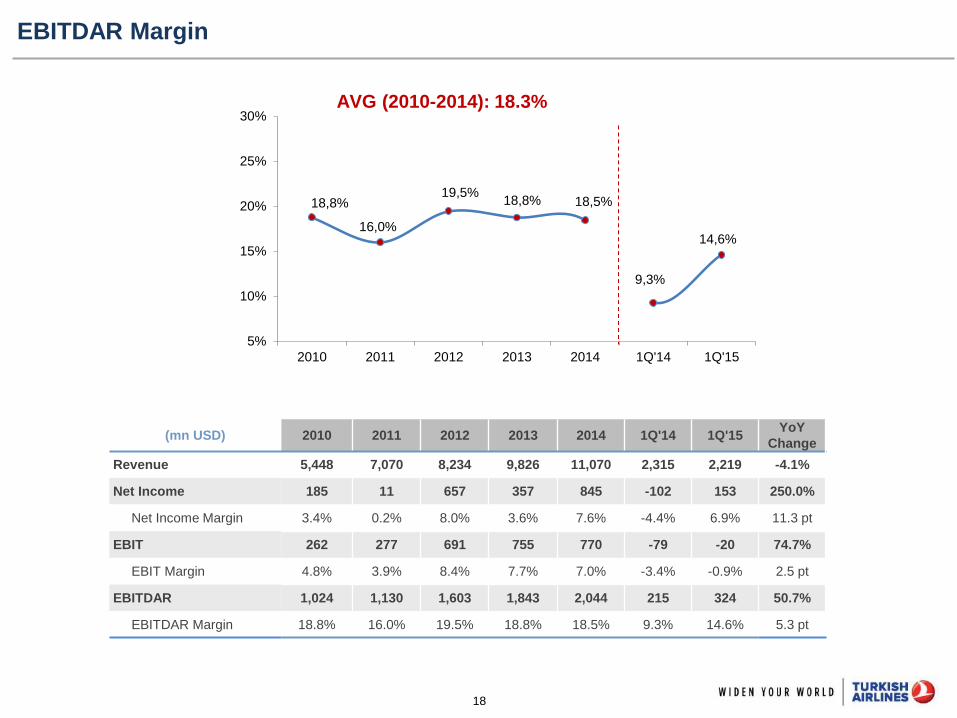
EBITDAR Margin
(mn USD) 2010 2011 2012 2013 2014 1Q'14 1Q'15 YoY
Change
Revenue 5,448 7,070 8,234 9,826 11,070 2,315 2,219 -4.1%
Net Income 185 11 657 357 845 -102 153 250.0%
Net Income Margin 3.4% 0.2% 8.0% 3.6% 7.6% -4.4% 6.9% 11.3 pt
EBIT 262 277 691 755 770 -79 -20 74.7%
EBIT Margin 4.8% 3.9% 8.4% 7.7% 7.0% -3.4% -0.9% 2.5 pt
EBITDAR 1,024 1,130 1,603 1,843 2,044 215 324 50.7%
EBITDAR Margin 18.8% 16.0% 19.5% 18.8% 18.5% 9.3% 14.6% 5.3 pt
18,8%
16,0%
19,5% 18,8% 18,5%
9,3%
14,6%
5%
10%
15%
20%
25%
30%
2010 2011 2012 2013 2014 1Q'14 1Q'15
AVG (2010-2014): 18.3%
19
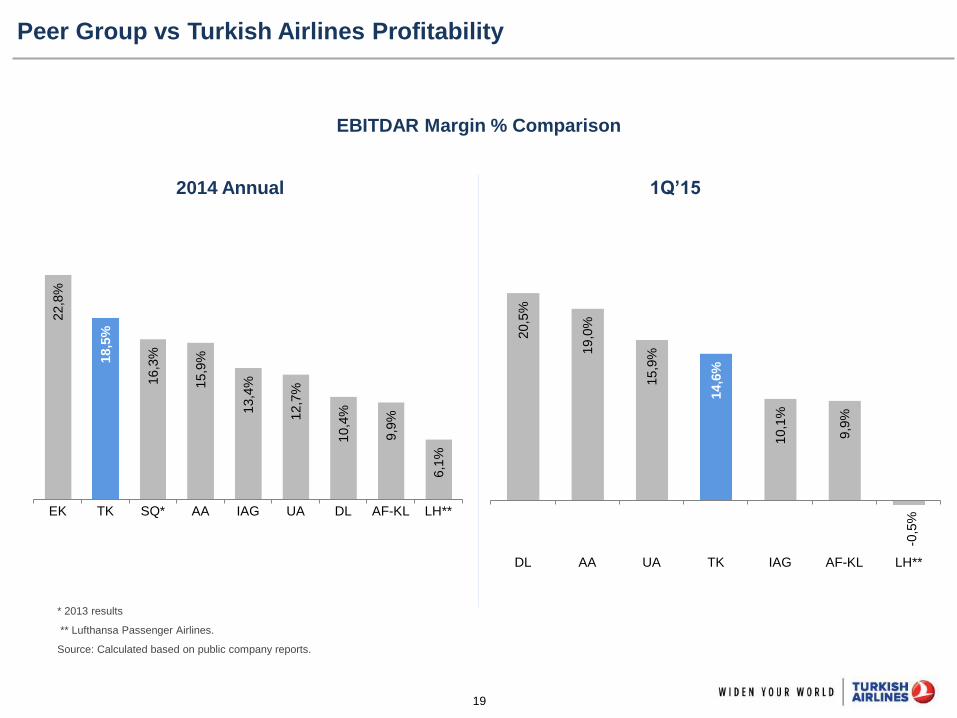
EBITDAR Margin % Comparison
2014 Annual
Peer Group vs Turkish Airlines Profitability
* 2013 results
** Lufthansa Passenger Airlines.
Source: Calculated based on public company reports.
22,8
%
18,5
%
16,3
%
15,9
%
13,4
%
12,7
%
10,4
%
9,9
%
6,1
%
EK TK SQ* AA IAG UA DL AF-KL LH**
1Q’15
20,5
%
19,0
%
15,9
%
14,6
%
10,1
%
9,9
%
-0,5
%
DL AA UA TK IAG AF-KL LH**
20
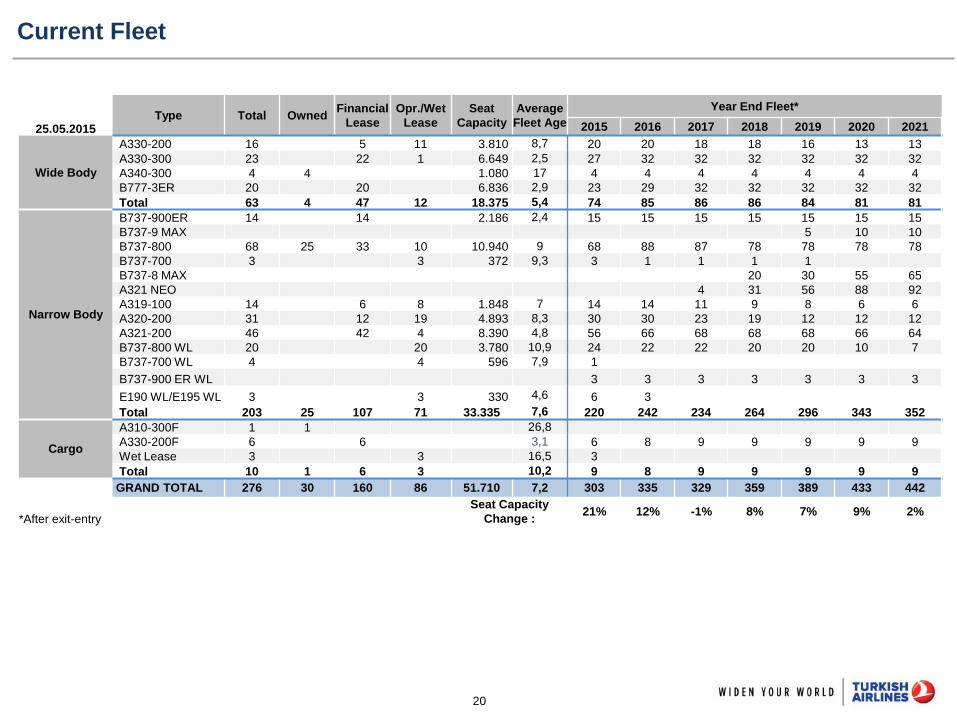
Current Fleet
25.05.2015 Type Total Owned
Financial
Lease
Opr./Wet
Lease
Seat
Capacity
Average
Fleet Age
Year End Fleet*
2015 2016 2017 2018 2019 2020 2021
Wide Body
A330-200 16 5 11 3.810 8,7 20 20 18 18 16 13 13
A330-300 23 22 1 6.649 2,5 27 32 32 32 32 32 32
A340-300 4 4 1.080 17 4 4 4 4 4 4 4
B777-3ER 20 20 6.836 2,9 23 29 32 32 32 32 32
Total 63 4 47 12 18.375 5,4 74 85 86 86 84 81 81
Narrow Body
B737-900ER 14 14 2.186 2,4 15 15 15 15 15 15 15
B737-9 MAX 5 10 10
B737-800 68 25 33 10 10.940 9 68 88 87 78 78 78 78
B737-700 3 3 372 9,3 3 1 1 1 1
B737-8 MAX 20 30 55 65
A321 NEO 4 31 56 88 92
A319-100 14 6 8 1.848 7 14 14 11 9 8 6 6
A320-200 31 12 19 4.893 8,3 30 30 23 19 12 12 12
A321-200 46 42 4 8.390 4,8 56 66 68 68 68 66 64
B737-800 WL 20 20 3.780 10,9 24 22 22 20 20 10 7
B737-700 WL 4 4 596 7,9 1
B737-900 ER WL 3 3 3 3 3 3 3
E190 WL/E195 WL 3 3 330 4,6 6 3
Total 203 25 107 71 33.335 7,6 220 242 234 264 296 343 352
Cargo
A310-300F 1 1 26,8
A330-200F 6 6 3,1 6 8 9 9 9 9 9
Wet Lease 3 3 16,5 3
Total 10 1 6 3 10,2 9 8 9 9 9 9 9
GRAND TOTAL 276 30 160 86 51.710 7,2 303 335 329 359 389 433 442
*After exit-entry
Seat Capacity
Change : 21% 12% -1% 8% 7% 9% 2%
21
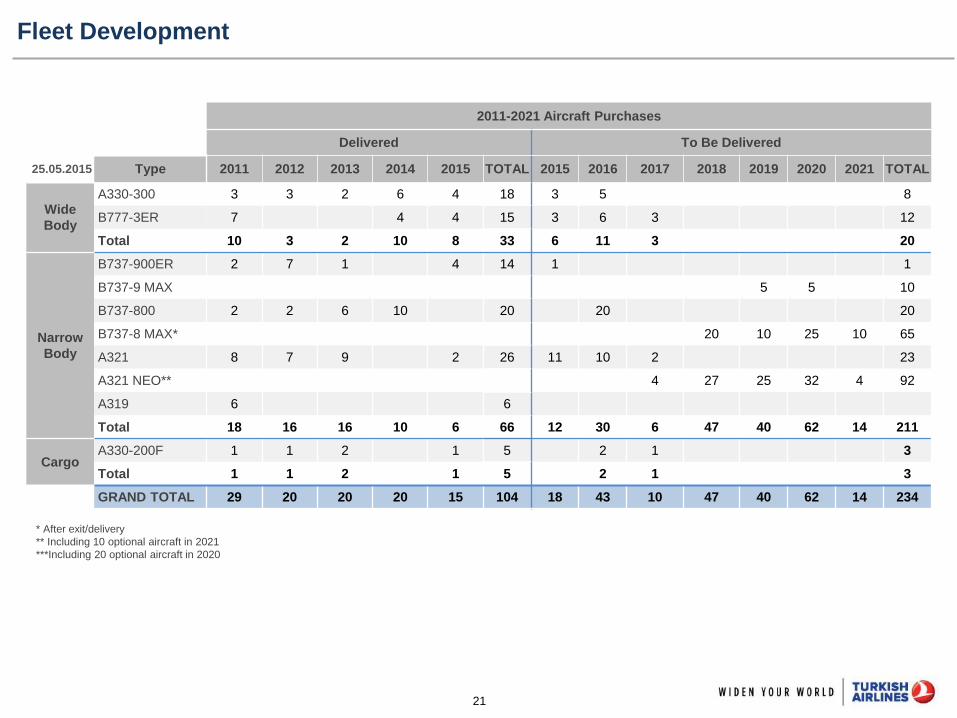
Fleet Development
* After exit/delivery
** Including 10 optional aircraft in 2021
***Including 20 optional aircraft in 2020
2011-2021 Aircraft Purchases
Delivered To Be Delivered
25.05.2015 Type 2011 2012 2013 2014 2015 TOTAL 2015 2016 2017 2018 2019 2020 2021 TOTAL
Wide
Body
A330-300 3 3 2 6 4 18 3 5 8
B777-3ER 7 4 4 15 3 6 3 12
Total 10 3 2 10 8 33 6 11 3 20
Narrow
Body
B737-900ER 2 7 1 4 14 1 1
B737-9 MAX 5 5 10
B737-800 2 2 6 10 20 20 20
B737-8 MAX* 20 10 25 10 65
A321 8 7 9 2 26 11 10 2 23
A321 NEO** 4 27 25 32 4 92
A319 6 6
Total 18 16 16 10 6 66 12 30 6 47 40 62 14 211
Cargo A330-200F 1 1 2 1 5 2 1 3
Total 1 1 2 1 5 2 1 3
GRAND TOTAL 29 20 20 20 15 104 18 43 10 47 40 62 14 234
22
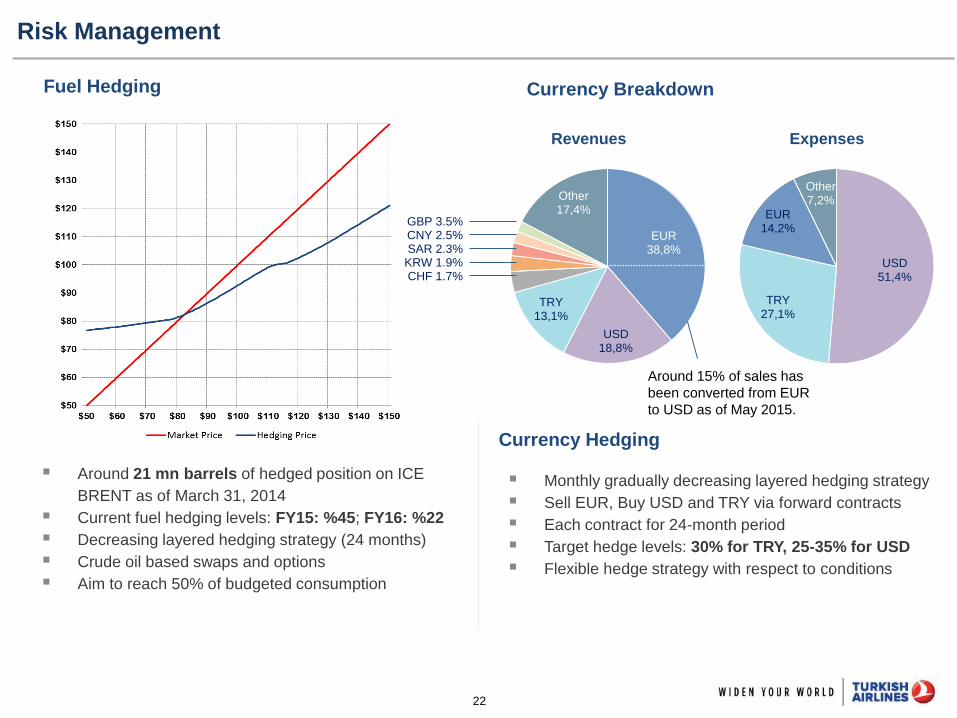
Monthly gradually decreasing layered hedging strategy
Sell EUR, Buy USD and TRY via forward contracts
Each contract for 24-month period
Target hedge levels: 30% for TRY, 25-35% for USD
Flexible hedge strategy with respect to conditions
Fuel Hedging Currency Breakdown
Around 21 mn barrels of hedged position on ICE
BRENT as of March 31, 2014
Current fuel hedging levels: FY15: %45; FY16: %22
Decreasing layered hedging strategy (24 months)
Crude oil based swaps and options
Aim to reach 50% of budgeted consumption
Currency Hedging
Revenues Expenses
Risk Management
EUR 38,8%
USD 18,8%
TRY 13,1%
Other 17,4%
USD 51,4%
TRY 27,1%
EUR 14,2%
Other 7,2%
GBP 3.5% CNY 2.5% SAR 2.3%
KRW 1.9% CHF 1.7%
Around 15% of sales has
been converted from EUR
to USD as of May 2015.
23
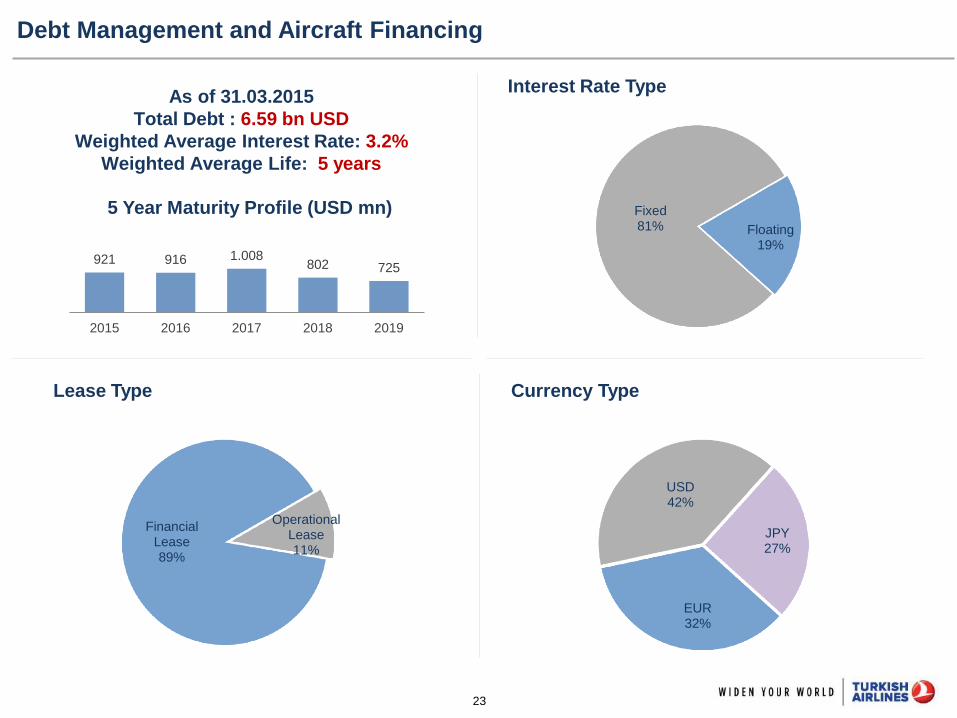
Debt Management and Aircraft Financing
As of 31.03.2015
Total Debt : 6.59 bn USD
Weighted Average Interest Rate: 3.2%
Weighted Average Life: 5 years
Lease Type
Interest Rate Type
Operational Lease 11%
Financial Lease 89%
EUR 32%
USD 42%
JPY 27%
Floating 19%
Fixed 81%
5 Year Maturity Profile (USD mn)
Currency Type
921 916 1.008 802 725
2015 2016 2017 2018 2019

24
Branding and Customer Satisfaction
The Best Airline in Europe for the last 4 years
2014 Skytrax World Airline Awards:
Best Airline Europe
Best Airline in Southern Europe
Best Business Class Lounge Dining
Best Business Class Onboard Catering
New CRM Project
New Sales System Project
Marketing 2.0 Project
The Airline That Speaks the Worlds Language
WEB 3.0 Project
11+ Languages
Fast and Reliable Web Service
Personalized Customer Experience
Live in August 2015
Ongoing Projects
25
Coşkun KILIÇ, CFO Tel: +90 (212) 463-6363 x-13630
Duygu İNCEÖZ, IR Manager E-Mail: [email protected]
THANK YOU
26
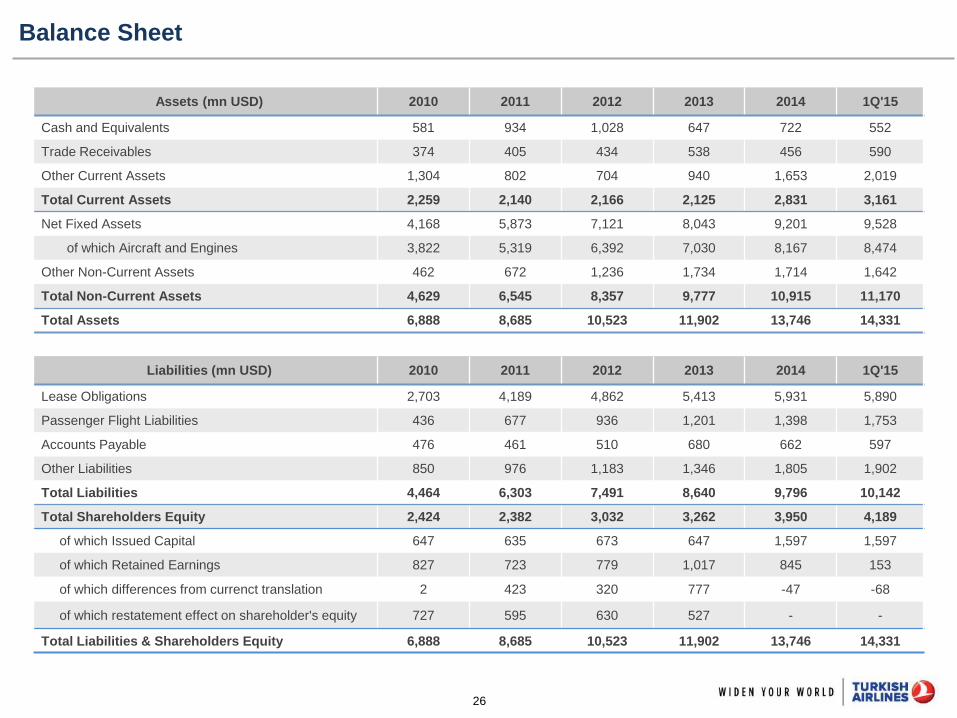
Balance Sheet
Assets (mn USD) 2010 2011 2012 2013 2014 1Q'15
Cash and Equivalents 581 934 1,028 647 722 552
Trade Receivables 374 405 434 538 456 590
Other Current Assets 1,304 802 704 940 1,653 2,019
Total Current Assets 2,259 2,140 2,166 2,125 2,831 3,161
Net Fixed Assets 4,168 5,873 7,121 8,043 9,201 9,528
of which Aircraft and Engines 3,822 5,319 6,392 7,030 8,167 8,474
Other Non-Current Assets 462 672 1,236 1,734 1,714 1,642
Total Non-Current Assets 4,629 6,545 8,357 9,777 10,915 11,170
Total Assets 6,888 8,685 10,523 11,902 13,746 14,331
Liabilities (mn USD) 2010 2011 2012 2013 2014 1Q'15
Lease Obligations 2,703 4,189 4,862 5,413 5,931 5,890
Passenger Flight Liabilities 436 677 936 1,201 1,398 1,753
Accounts Payable 476 461 510 680 662 597
Other Liabilities 850 976 1,183 1,346 1,805 1,902
Total Liabilities 4,464 6,303 7,491 8,640 9,796 10,142
Total Shareholders Equity 2,424 2,382 3,032 3,262 3,950 4,189
of which Issued Capital 647 635 673 647 1,597 1,597
of which Retained Earnings 827 723 779 1,017 845 153
of which differences from currenct translation 2 423 320 777 -47 -68
of which restatement effect on shareholder's equity 727 595 630 527 - -
Total Liabilities & Shareholders Equity 6,888 8,685 10,523 11,902 13,746 14,331
27
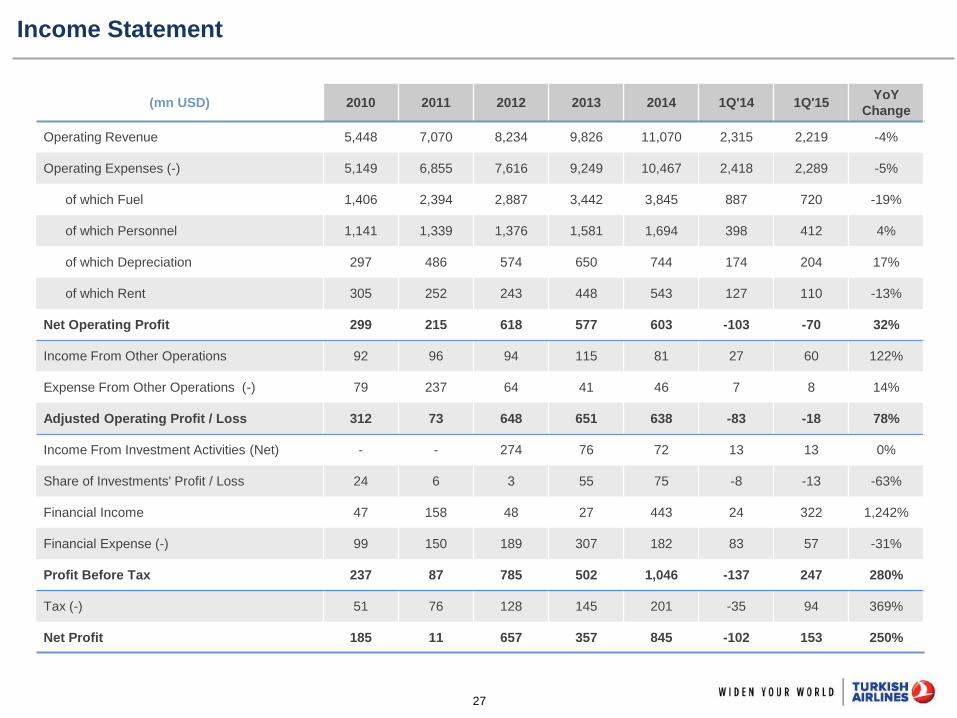
Income Statement
(mn USD) 2010 2011 2012 2013 2014 1Q'14 1Q'15 YoY
Change
Operating Revenue 5,448 7,070 8,234 9,826 11,070 2,315 2,219 -4%
Operating Expenses (-) 5,149 6,855 7,616 9,249 10,467 2,418 2,289 -5%
of which Fuel 1,406 2,394 2,887 3,442 3,845 887 720 -19%
of which Personnel 1,141 1,339 1,376 1,581 1,694 398 412 4%
of which Depreciation 297 486 574 650 744 174 204 17%
of which Rent 305 252 243 448 543 127 110 -13%
Net Operating Profit 299 215 618 577 603 -103 -70 32%
Income From Other Operations 92 96 94 115 81 27 60 122%
Expense From Other Operations (-) 79 237 64 41 46 7 8 14%
Adjusted Operating Profit / Loss 312 73 648 651 638 -83 -18 78%
Income From Investment Activities (Net) - - 274 76 72 13 13 0%
Share of Investments' Profit / Loss 24 6 3 55 75 -8 -13 -63%
Financial Income 47 158 48 27 443 24 322 1,242%
Financial Expense (-) 99 150 189 307 182 83 57 -31%
Profit Before Tax 237 87 785 502 1,046 -137 247 280%
Tax (-) 51 76 128 145 201 -35 94 369%
Net Profit 185 11 657 357 845 -102 153 250%
28
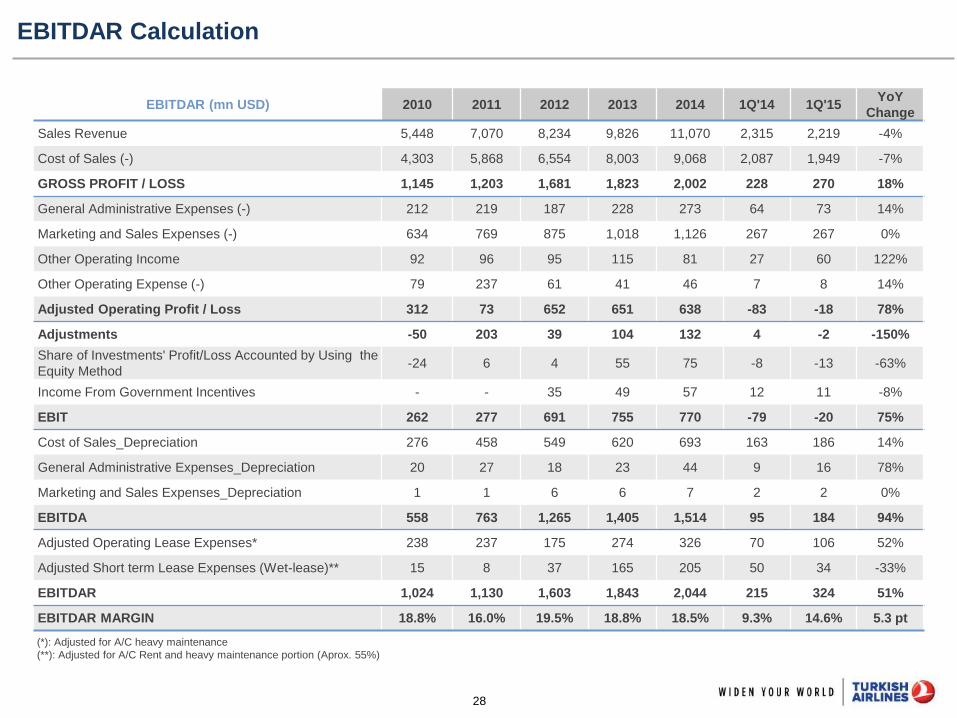
EBITDAR Calculation
(*): Adjusted for A/C heavy maintenance
(**): Adjusted for A/C Rent and heavy maintenance portion (Aprox. 55%)
EBITDAR (mn USD) 2010 2011 2012 2013 2014 1Q'14 1Q'15 YoY
Change
Sales Revenue 5,448 7,070 8,234 9,826 11,070 2,315 2,219 -4%
Cost of Sales (-) 4,303 5,868 6,554 8,003 9,068 2,087 1,949 -7%
GROSS PROFIT / LOSS 1,145 1,203 1,681 1,823 2,002 228 270 18%
General Administrative Expenses (-) 212 219 187 228 273 64 73 14%
Marketing and Sales Expenses (-) 634 769 875 1,018 1,126 267 267 0%
Other Operating Income 92 96 95 115 81 27 60 122%
Other Operating Expense (-) 79 237 61 41 46 7 8 14%
Adjusted Operating Profit / Loss 312 73 652 651 638 -83 -18 78%
Adjustments -50 203 39 104 132 4 -2 -150%
Share of Investments' Profit/Loss Accounted by Using the
Equity Method -24 6 4 55 75 -8 -13 -63%
Income From Government Incentives - - 35 49 57 12 11 -8%
EBIT 262 277 691 755 770 -79 -20 75%
Cost of Sales_Depreciation 276 458 549 620 693 163 186 14%
General Administrative Expenses_Depreciation 20 27 18 23 44 9 16 78%
Marketing and Sales Expenses_Depreciation 1 1 6 6 7 2 2 0%
EBITDA 558 763 1,265 1,405 1,514 95 184 94%
Adjusted Operating Lease Expenses* 238 237 175 274 326 70 106 52%
Adjusted Short term Lease Expenses (Wet-lease)** 15 8 37 165 205 50 34 -33%
EBITDAR 1,024 1,130 1,603 1,843 2,044 215 324 51%
EBITDAR MARGIN 18.8% 16.0% 19.5% 18.8% 18.5% 9.3% 14.6% 5.3 pt
29
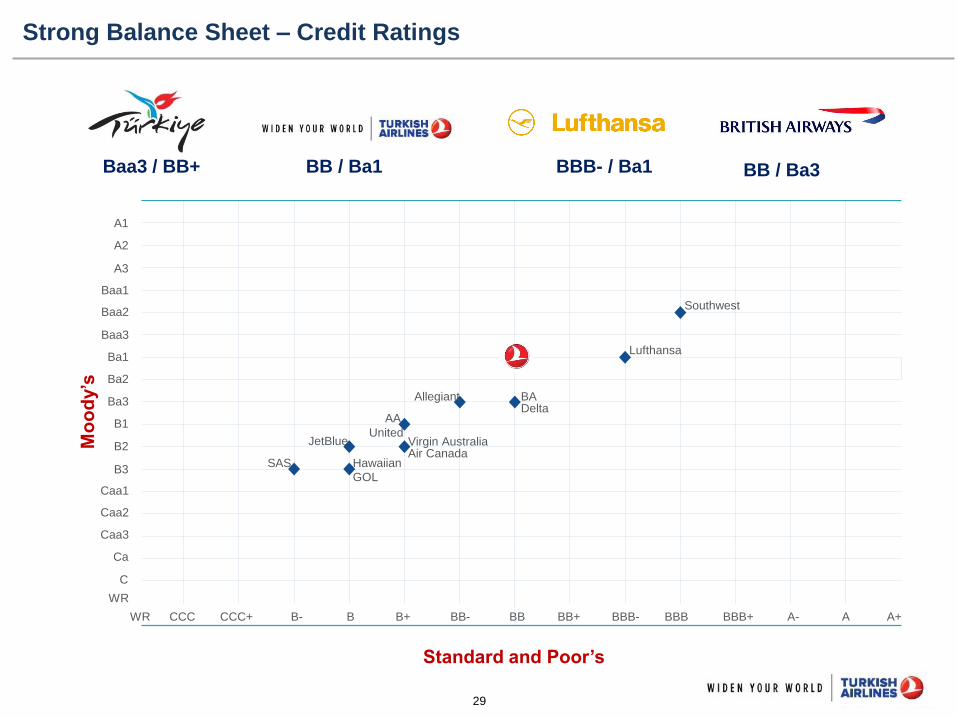
Strong Balance Sheet – Credit Ratings
Mo
od
y’s
Standard and Poor’s
BBB- / Ba1 BB / Ba3 BB / Ba1 Baa3 / BB+
A1
A2
A3
Baa1
Baa2
Baa3
Ba1
Ba2
Ba3
B1
B2
B3
Caa1
Caa2
Caa3
Ca
C
WR
CCC CCC+ B- B B+ BB- BB BB+ BBB- BBB BBB+ A- A A+WR
BA
Lufthansa
Southwest
DeltaAllegiant
AA
Virgin AustraliaAir Canada
United
GOL
JetBlue
HawaiianSAS
30
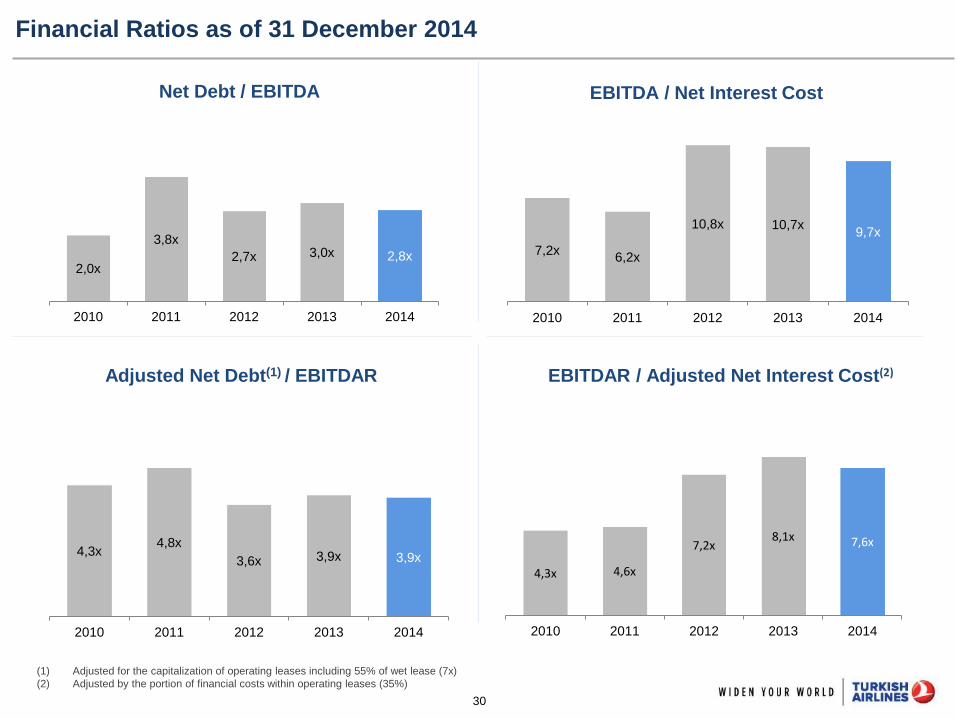
Financial Ratios as of 31 December 2014
Net Debt / EBITDA
Adjusted Net Debt(1) / EBITDAR
EBITDA / Net Interest Cost
EBITDAR / Adjusted Net Interest Cost(2)
(1) Adjusted for the capitalization of operating leases including 55% of wet lease (7x)
(2) Adjusted by the portion of financial costs within operating leases (35%)
2,0x
3,8x
2,7x 3,0x 2,8x
2010 2011 2012 2013 2014
4,3x 4,8x
3,6x 3,9x 3,9x
2010 2011 2012 2013 2014
7,2x 6,2x
10,8x 10,7x 9,7x
2010 2011 2012 2013 2014
4,3x 4,6x
7,2x 8,1x 7,6x
2010 2011 2012 2013 2014
31
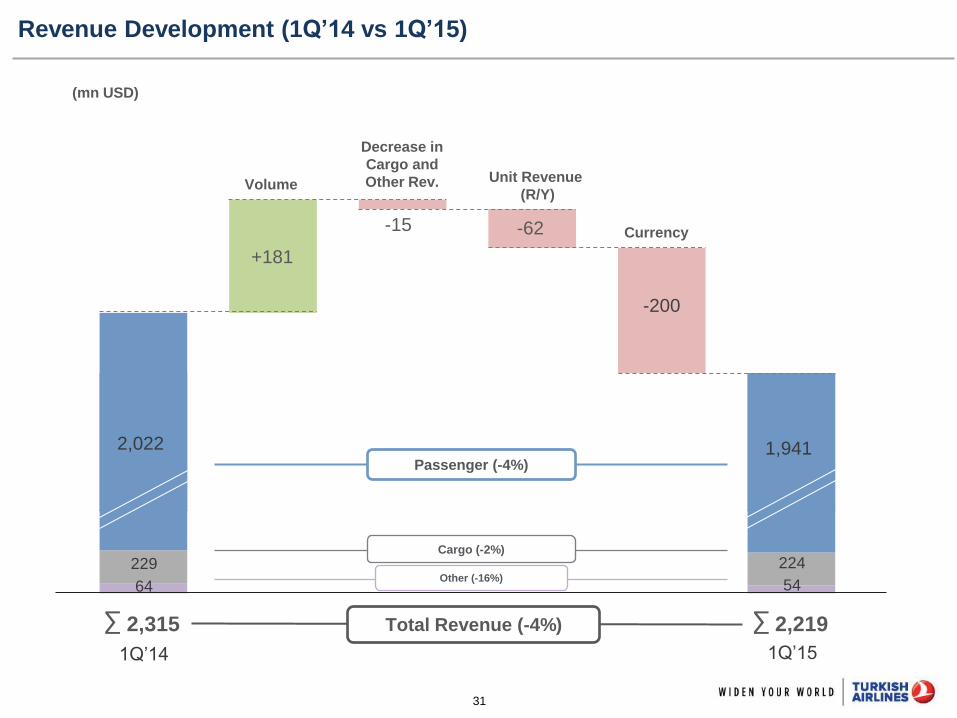
Revenue Development (1Q’14 vs 1Q’15)
2,315 Total Revenue (-4%) ∑ 2,219 ∑
Other (-16%)
Cargo (-2%)
229
64
2,022
+181
-15 -62
-200
54
224
1,941
Currency
Volume
Decrease in
Cargo and
Other Rev. Unit Revenue
(R/Y)
Passenger (-4%)
(mn USD)
1Q’14 1Q’15
32
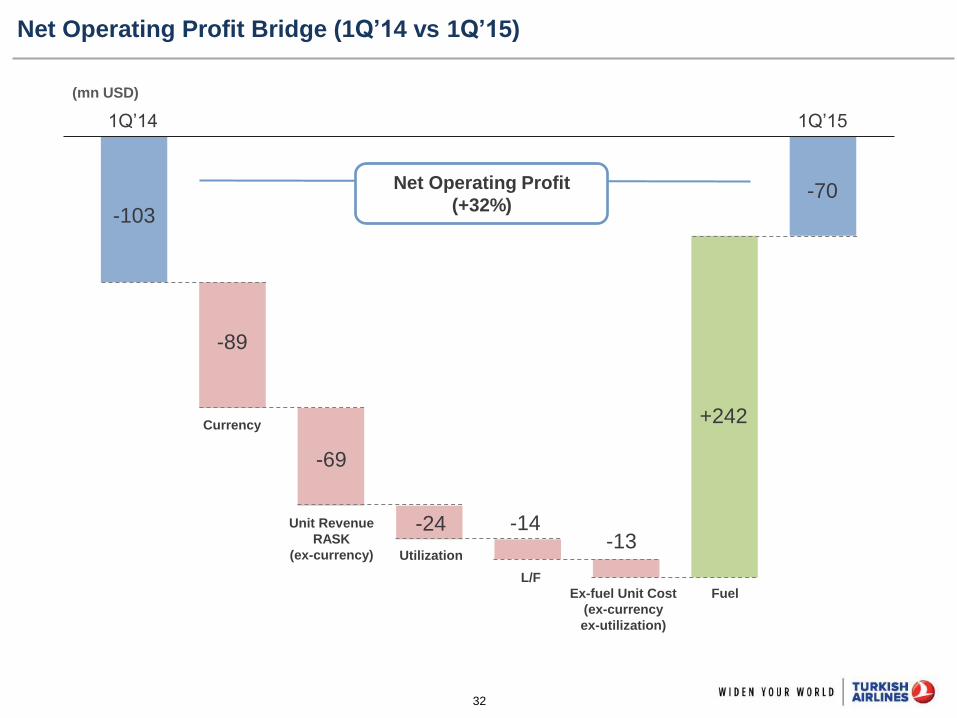
Net Operating Profit Bridge (1Q’14 vs 1Q’15)
-103
-89
-13
-69
-14 -24
+242
-70
Unit Revenue
RASK
(ex-currency)
L/F
Utilization
Fuel
Currency
Ex-fuel Unit Cost
(ex-currency
ex-utilization)
1Q’14 1Q’15
Net Operating Profit
(+32%)
(mn USD)
33
8,70
7,77
1Q'14 1Q'15
8,70 8,57
1Q'14 1Q'15
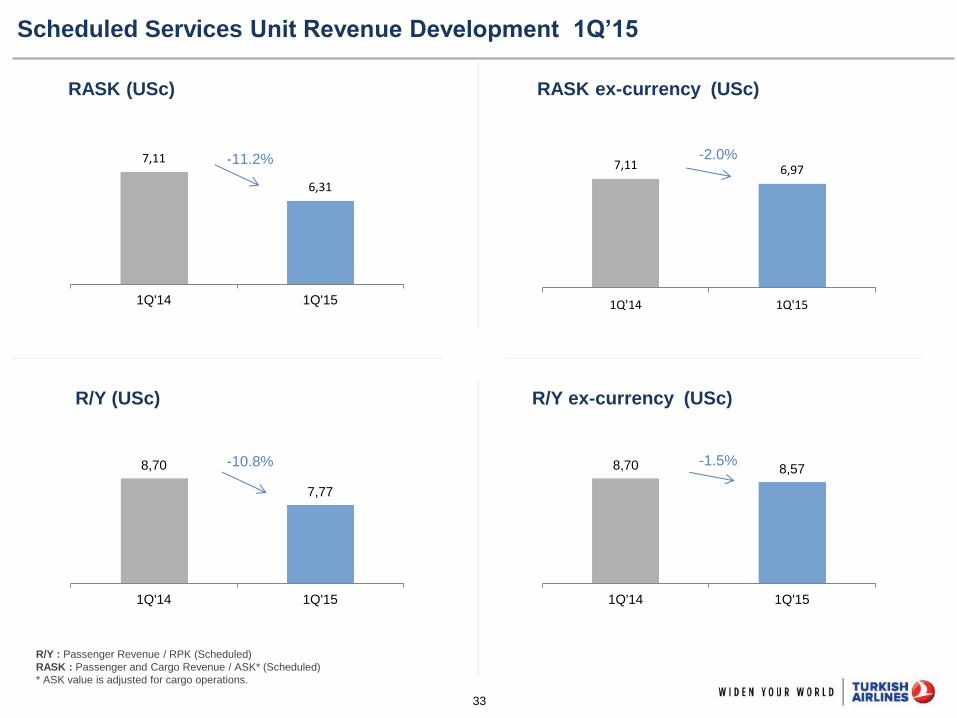
Scheduled Services Unit Revenue Development 1Q’15
RASK ex-currency (USc)
R/Y : Passenger Revenue / RPK (Scheduled)
RASK : Passenger and Cargo Revenue / ASK* (Scheduled)
* ASK value is adjusted for cargo operations.
R/Y (USc) R/Y ex-currency (USc)
RASK (USc)
-10.8% -1.5%
7,11
6,31
1Q'14 1Q'15
7,11 6,97
1Q'14 1Q'15
-11.2% -2.0%
34
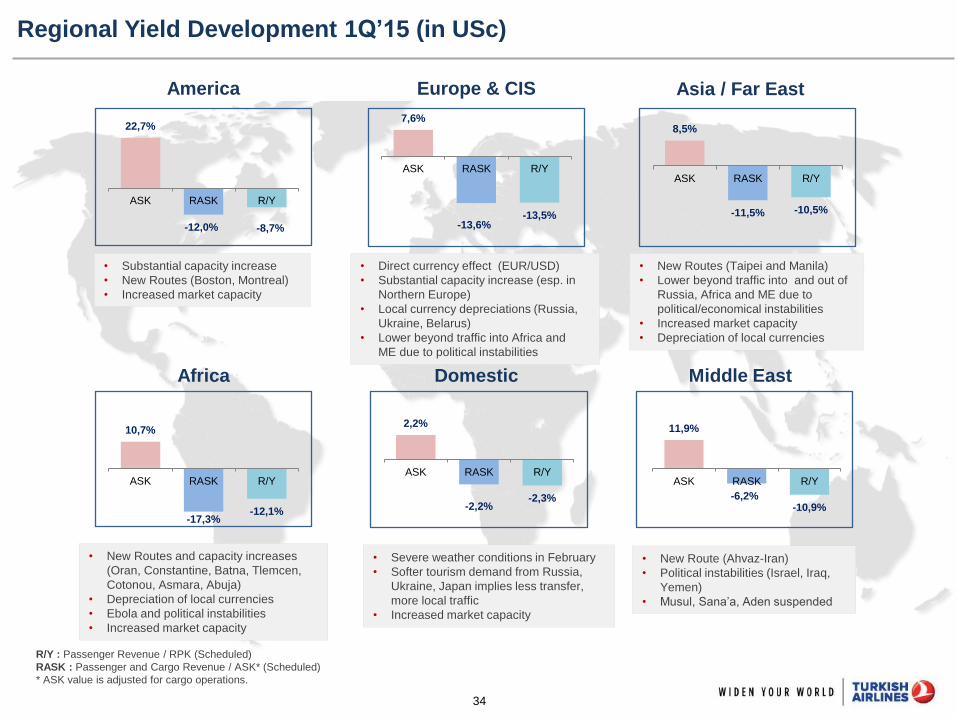
Regional Yield Development 1Q’15 (in USc)
Domestic
America
Middle East Africa
• Substantial capacity increase
• New Routes (Boston, Montreal)
• Increased market capacity
Europe & CIS Asia / Far East
• Direct currency effect (EUR/USD)
• Substantial capacity increase (esp. in
Northern Europe)
• Local currency depreciations (Russia,
Ukraine, Belarus)
• Lower beyond traffic into Africa and
ME due to political instabilities
• New Routes (Taipei and Manila)
• Lower beyond traffic into and out of
Russia, Africa and ME due to
political/economical instabilities
• Increased market capacity
• Depreciation of local currencies
• New Routes and capacity increases
(Oran, Constantine, Batna, Tlemcen,
Cotonou, Asmara, Abuja)
• Depreciation of local currencies
• Ebola and political instabilities
• Increased market capacity
• Severe weather conditions in February
• Softer tourism demand from Russia,
Ukraine, Japan implies less transfer,
more local traffic
• Increased market capacity
• New Route (Ahvaz-Iran)
• Political instabilities (Israel, Iraq,
Yemen)
• Musul, Sana’a, Aden suspended
R/Y : Passenger Revenue / RPK (Scheduled)
RASK : Passenger and Cargo Revenue / ASK* (Scheduled)
* ASK value is adjusted for cargo operations.
22,7%
-12,0% -8,7%
ASK RASK R/Y
7,6%
-13,6% -13,5%
ASK RASK R/Y
8,5%
-11,5% -10,5%
ASK RASK R/Y
10,7%
-17,3% -12,1%
ASK RASK R/Y
2,2%
-2,2% -2,3%
ASK RASK R/Y
11,9%
-6,2% -10,9%
ASK RASK R/Y
35
314
388
471
565
668
157
160
0 100 200 300 400 500 600 700 800
2010
2011
2012
2013
2014
1Q'14
1Q'15
405 578
719 871 973
229 224
2010 2011 2012 2013 2014 1Q'14 1Q'15
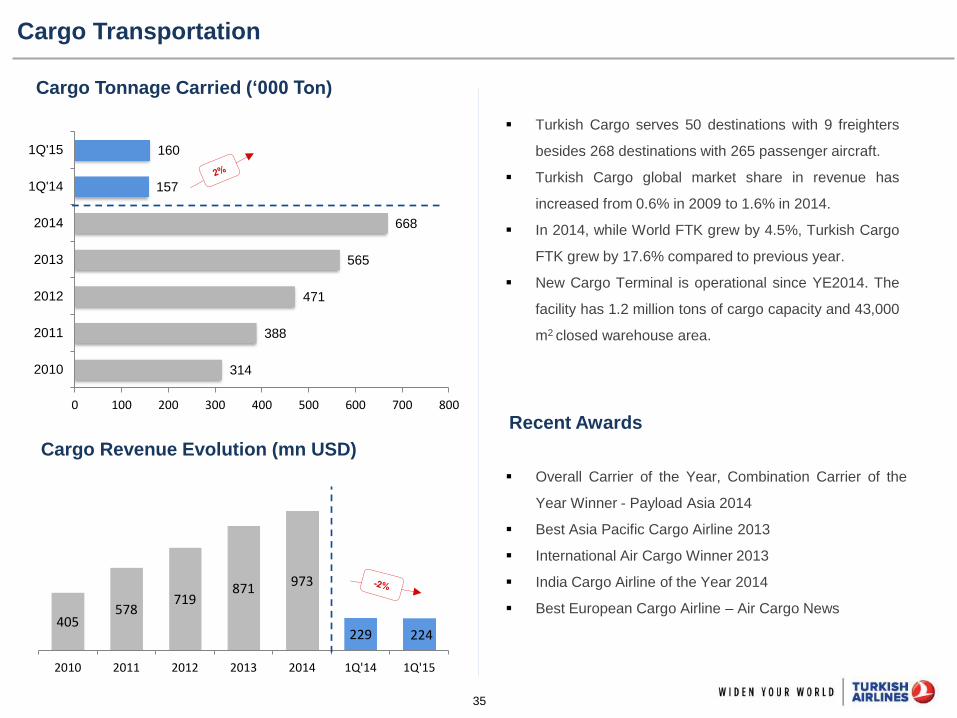
Cargo Transportation
Cargo Revenue Evolution (mn USD)
Cargo Tonnage Carried (‘000 Ton)
Turkish Cargo serves 50 destinations with 9 freighters
besides 268 destinations with 265 passenger aircraft.
Turkish Cargo global market share in revenue has
increased from 0.6% in 2009 to 1.6% in 2014.
In 2014, while World FTK grew by 4.5%, Turkish Cargo
FTK grew by 17.6% compared to previous year.
New Cargo Terminal is operational since YE2014. The
facility has 1.2 million tons of cargo capacity and 43,000
m2 closed warehouse area.
Overall Carrier of the Year, Combination Carrier of the
Year Winner - Payload Asia 2014
Best Asia Pacific Cargo Airline 2013
International Air Cargo Winner 2013
India Cargo Airline of the Year 2014
Best European Cargo Airline – Air Cargo News
Recent Awards
36
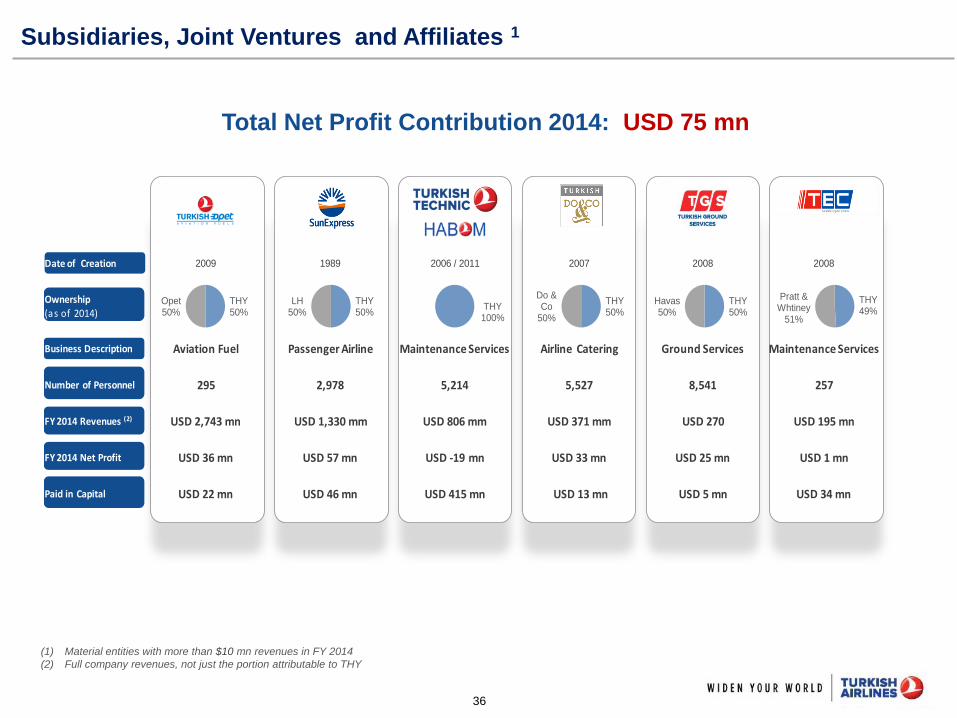
Subsidiaries, Joint Ventures and Affiliates 1
(1) Material entities with more than $10 mn revenues in FY 2014
(2) Full company revenues, not just the portion attributable to THY
Total Net Profit Contribution 2014: USD 75 mn
THY50%
Opet50%
THY50%
LH50%
THY100%
THY50%
Do & Co
50%
THY50%
Havas50%
THY49%
Pratt & Whtiney
51%
Date of Creation 2009 1989 2006 / 2011 2007 2008 2008
Ownership(as of 2014)
Business Description Aviation Fuel Passenger Airline Maintenance Services Airline Catering Ground Services Maintenance Services
Number of Personnel 295 2,978 5,214 5,527 8,541 257
FY 2014 Revenues (2) USD 2,743 mn USD 1,330 mm USD 806 mm USD 371 mm USD 270 USD 195 mn
FY 2014 Net Profit USD 36 mn USD 57 mn USD -19 mn USD 33 mn USD 25 mn USD 1 mn
Paid in Capital USD 22 mn USD 46 mn USD 415 mn USD 13 mn USD 5 mn USD 34 mn
37
Türk Hava Yolları A.O. (the “Incorporation” or ‘’Turkish Airlines’’) has prepared this presentation for the sole purpose of providing information about its
business, operations, operational and financial results. The information in this presentation is subject to updating, revision and amendment. This
presentation is not, and does not support to be comprehensive and to contain all information related to Turkish Airlines.
This presentation does not constitute or form part of any offer or invitation to sell or issue, or any solicitation of any offer to purchase or subscribe for, any
securities of Turkish Airlines nor any of its subsidiaries or their respective affiliates nor should it or any part of it or the fact of its distribution form the
basis of, or be relied on in connection with, any contract or investment decision in relation thereto. This presentation is not intended for distribution to, or
use by, any person or entity in any jurisdiction or country where such distribution would be contrary to law or regulation. The information contained in this
presentation has not been subject to any independent audit or review and may contain forward-looking statements, estimates and projections.
Statements herein, other than statements of historical fact, regarding future events or prospects, are forward-looking statements. Although Turkish
Airlines believes that the estimates and projections reflected in the forward-looking statements are reasonable, they may prove materially incorrect, and
actual results may materially differ. As a result, you should not rely on these forward-looking statements. Turkish Airlines undertakes no obligation to
update or revise any forward-looking statements, whether as a result of new information, future events or otherwise, except to the extent required by law.
Any forward-looking statement in this presentation speaks only as of the date on which it is made, and Turkish Airlines undertakes no obligation to
update any forward-looking statement to reflect events or circumstances after the date on which the statement is made or to reflect the occurrence of
unanticipated events, except to the extent required by law.
Industry, market and competitive data and certain industry forecasts used in this presentation were obtained from internal research, market research,
publicly available information and industry publications and other market commentaries. Industry publications generally state that the information
contained therein has been obtained from sources believed to be reliable at the relevant time, but that the accuracy and completeness of such
information is not guaranteed. Similarly, internal research, market research, industry publications and other publicly available information, while believed
to be reliable, have not been independently verified, and Turkish Airlines does not make any representation as to the completeness or accuracy of such
information.
No representation, warranty or undertaking, expressed or implied, is or will be made by Turkish Airlines or its shareholders, affiliates, advisors or
representatives or any other person as to, and no reliance should be placed on, the fairness, accuracy, completeness or correctness of the information
or the opinions contained in this presentation (or whether any information has been omitted from this presentation). Turkish Airlines, to the extent
permitted by law, and each of its respective directors, officers, employees, affiliates, advisors or representatives disclaims all liability whatsoever (in
negligence or otherwise) for any loss however arising, directly or indirectly, from any use of this presentation or its contents or otherwise arising in
connection with this presentation.
This presentation should not be construed as financial, legal, tax, accounting, investment or other advice or a recommendation with respect to any
investment. Under no circumstances is this information and material to be construed as a prospectus, supplement, offering memorandum or
advertisement, and neither any part of this presentation nor any information or statement contained herein shall form the basis of or be relied upon in
connection with any contract, commitment or investment decision.
By reading this presentation or attending or listening to any relevant meeting, conference call or webcast organized by the Company, you agree to be
bound by the above provisions.
Disclaimer