Embed Size (px)
Citation preview

Mette Huberman, Tom Parrish, Stephanie Hannan,
Melissa Arellanes, and Larisa Shambaugh
American Institutes for Research
Turnaround Schools in California:
Who Are They and What Strategies
Do They Use?
November 2011
This work was supported by the California Comprehensive Center at WestEd, a partnership with American Institutes for Research (AIR) and School Services of California. This document was developed under a grant from the U.S. Department of Education. However, the content does not necessarily represent the policy of the Department of Education, and you should not assume endorsement by the federal government.
Copyright © 2008 WestEd. All rights reserved. No part of this publication may be reproduced or distributed in any form or by any means, or stored in a database or retrieval system, without the prior written permission of the publisher. The California Comprehensive Center, a partnership of WestEd, American Institutes for Research, and School Services of California, is part of the federal network of 16 Regional Comprehensive Centers.

Turnaround Schools in California: Who Are They and What Strategies Do They Use?
i
Acknowledgments
The authors of this report would like to thank the principals who agreed to be interviewed and who
provided valuable information about the turnaround processes at their schools. We also would like to
thank our WestEd colleagues and California Department of Education (CDE) staff who participated in a
vetting meeting to discuss our definition of turnaround schools: Julie Baltazar (CDE), Keith Coppage
(CDE), Patti Crotti (WestEd), Ken Futernick (WestEd), Rick Miller (Capitol Impact), Marty Orland
(WestEd), Rose Owens-West (WestEd), Christine Swenson (CDE), and Fred Tempes (WestEd). Finally,
we would like to acknowledge our AIR colleagues, Patrice Fabel, Rebecca Epstein Herman, and Sami
Kitmitto, for their contributions to the study and this report.

Turnaround Schools in California: Who Are They and What Strategies Do They Use?
ii
Executive Summary
The concept of identifying and turning around underperforming schools has been central to the focus
and intent of federal and state accountability provisions over the past decade. More recently, the focus
on school turnaround has intensified. To help inform the current dialogue on turnaround, this study
specifies a set of criteria for identifying turnaround schools in California and summarizes the strategies
that a sample of principals from these schools reported as essential to improved outcomes at their
schools.
In embarking on this study, we found that the definition of turnaround performance in schools varies
broadly across the research literature. This lack of precision and agreement regarding turnaround
school performance is a concern because these studies often cite lessons from turnaround schools that
have been selected in very different ways. To this end, using student achievement data over a seven-year
period (from 2003–04 to 2009–10) and in conjunction with a group of California stakeholders, we
developed a clear process for identifying turnaround schools. The turnaround criteria are not proposed
as necessarily the best criteria but rather as one clear, transparent, and replicable approach to identify
turnaround schools in California.
We specified a pre-turnaround period over three years (Years 1–3, from 2003–04 to 2005–06), a
turnaround period over the next three years (Years 4–6, from 2006–07 to 2008–09), and a final
sustained performance year (Year 7, 2009–10). We analyzed data for all California public schools,
including charter schools, applying the following criteria:
Schools had to be considered low performing in the pre-turnaround period. We defined low
performance as schools in the lowest third of school performance in English language arts (ELA)
and mathematics.
Schools had to show growth over time as evidence that they had improved. Specifically, schools
had to have minimum growth, defined as at least 0.2 standard deviations, during the turnaround
period. All student subgroups also had to demonstrate minimum growth, defined as no drop in
performance for students eligible for free or reduced-price lunch, African American students,
Hispanic student, students with disabilities, and/or English learners (ELs) during the turnaround
period.
In addition to the minimum growth, to ensure that schools did not just demonstrate individual
growth but also grew compared to other schools in the state, schools had to end up in at least
the middle third of school performance.
Our definition focuses on schools that educated a similar population of students over time, so
growth cannot be attributed to a large change in student population or size. To ensure that the
student population did not change substantially over time, we filtered out schools that showed a
decrease in the percentage of students eligible for free or reduced-price lunch, African American
students, Hispanic students, and/or ELs greater than 15 percentage points between Year 1 and
Year 7. In addition, we filtered out schools with a decrease in enrollment greater than 20
percent during the same period.
To capture at least schools‘ initial capacity to sustain their heightened performance, we selected
schools only if their scores did not decline more than 0.1 standard deviations between Years 6
and 7. Also, their student subgroup performance could not decline more than 0.2 standard
deviations during this same period.

Turnaround Schools in California: Who Are They and What Strategies Do They Use?
iii
This process resulted in 44 schools (or 2 percent statewide) meeting these criteria. Of these, 35 were
elementary schools, 4 were middle schools, and 5 were high schools. From this pool, we selected a
sample of nine schools (four elementary, three middle, and two high schools) for interviews and analysis.
Based on the interviews, the key strategies reported by at least three of the nine principals as
contributing to their schools‘ turnaround include the following:
1. Instructional strategies focused on student subgroups (six principals)
2. An emphasis on teacher collaboration (six principals)
3. Strong instructional leadership (five principals)
4. Regular use of assessments and analysis of data (four principals)
5. Increased parent involvement (four principals)
6. Guidance and support provided by the district (four principals)
7. Use of student engagement strategies (three principals)
8. Use of extended learning time (three principals)
The principals cited these strategies as working in conjunction with one another, and they are not
purported as a ―recipe‖ for success. Furthermore, the manner in which the principals implemented
these strategies varied from school to school. In addition to identifying successful strategies, the
principals shared challenges they had faced in the turnaround process. The following challenges were
identified by at least three principals:
Budget cuts (eight principals)
Negative perceptions of the school (five principals)
Lack of teacher buy-in to improvement efforts (four principals)
Staff who were not the right fit (four principals)
More generally, the principals acknowledged that school improvement does not occur overnight; there
are both successes and failures that occur in the turnaround process. But a clear focus, determination,
and strategy are needed to achieve and sustain growth.
Given the increased focus of federal and state education policy on turning around low-performing
schools, it seems important to more clearly define how to measure successful turnaround. The federal
government has provided a clear definition of low performance by identifying the measures for selecting
the 5 percent persistently lowest achieving schools in each state through School Improvement Grants
(SIGs). Federal and state governments should now consider what constitutes realistic yet rigorous goals
that these schools should meet to demonstrate success. To assist with this process, this study specified
a set of criteria for defining both low performance and turnaround for schools in California.
Clearer criteria for identifying turnaround schools also can inform current policy discussions at the
federal and state levels regarding the appropriate intervention models to improve persistently struggling
schools. For example, the examples of school turnaround in this report do not match up well with the
elements of current federal intervention models for school turnaround. For instance, the schools
profiled here do not provide evidence of large numbers of teaching staff or school leaders being
replaced. In addition, we heard from several of these schools about the importance of the role of the
school district in its turnaround efforts—an element largely lacking from the current federal intervention

Turnaround Schools in California: Who Are They and What Strategies Do They Use?
iv
models. The findings from this report, and similar efforts from others to understand what successful
school turnaround looks like, may be useful in adding clarity to future turnaround research and policy
discussions and in informing future intervention models required for the lowest performing schools.
Lessons learned from turnaround schools such as the ones contained in this report are only one aspect
that can contribute to the field‘s knowledge on this important focus on the needs of our most struggling
schools. Much work is still needed in this area that this report cannot address, for example,
understanding further why some schools sustain their turnaround success over time and others do not.
Currently, however, with examples of successful turnaround identified, school districts, states, and the
federal government could adopt more explicit roles of brokering the knowledge and expertise for peer-
to-peer learning from practitioners who have experienced success in these improvement efforts. These
―on-the-ground‖ experts can speak more directly to others still facing the important task of improving
learning for students in low-performing schools. Some of the principals interviewed for this study
reported that they had engaged in knowledge sharing (both inside and outside their districts) to learn
about policies and practices identified as effective from successful turnaround sites. For instance, CDE
may consider setting up structures for sharing school improvement strategies across schools and
districts.1
1 For approaches to facilitate and implement school visitations between lower and higher performing schools, see
Huberman, Fabel, Arellanes, and Parrish (2011).

Turnaround Schools in California: Who Are They and What Strategies Do They Use?
v
Contents
Executive Summary ........................................................................................................................................................... ii
Introduction ........................................................................................................................................................................ 1
Study Background: Different Turnaround Definitions and Practices .................................................................... 2
School Selection Methodology ....................................................................................................................................... 3
Selected Schools‘ Demographic and Achievement Patterns ................................................................................... 6
Data Collection and Analysis ........................................................................................................................................ 10
Schools‘ Reported Turnaround Strategies ................................................................................................................ 10
1. Instructional Strategies Focused on Student Subgroups ............................................................................... 11
2. An Emphasis on Teacher Collaboration ........................................................................................................... 12
3. Strong Instructional Leadership .......................................................................................................................... 13
4. Regular Use of Assessments and Analysis of Data ......................................................................................... 13
5. Increased Parent Involvement ............................................................................................................................. 14
6. Guidance and Support Provided by the District ............................................................................................. 15
7. Use of Student Engagement Strategies .............................................................................................................. 15
8. Use of Extended Learning Time .......................................................................................................................... 16
School Profiles .................................................................................................................................................................. 17
122nd Street Elementary School: Quick Wins Followed by Focus on Instruction and Collaboration .. 17
General Grant Middle School: Continuous Improvement from Within Combined with District-wide
Efforts ............................................................................................................................................................................. 19
Sweetwater High School: Steady Progress with District Guidance and Support ........................................ 21
Challenges Faced in the Turnaround Process........................................................................................................... 23
Advice to Other Schools and Districts ...................................................................................................................... 24
Implications for Policy and Practice ............................................................................................................................. 25
References ......................................................................................................................................................................... 27
Appendix A: English Language Arts and Mathematics Proficiency Rates ........................................................... 29

Turnaround Schools in California: Who Are They and What Strategies Do They Use?
1
Introduction
The concept of identifying and turning around underperforming schools has been central to the focus
and intent of federal and state accountability provisions over the past decade. The No Child Left Behind
(NCLB) Act of 2001 includes criteria for determining schools‘ progress and consequences for
insufficient improvement over time. For example, after five consecutive years of inadequate progress,
NCLB requires that schools restructure through conversion to a charter school, replace staff, hire an
external contractor to operate the school, invite the state to take over the school, or implement some
other significant reform that fundamentally changes the school.
More recently, the focus on school turnaround has intensified. The Obama administration‘s Blueprint for
Reform lists improving student achievement in the nation‘s lowest performing schools as one of four
major areas of focus (U.S. Department of Education, 2010). The long-standing SIG program was recently
bolstered by a $3-billion infusion from the federal stimulus package, allocating funds to the lowest
performing schools in a state. These funds are intended to pursue substantial changes using one of four
models:2
Transformation. The principal is replaced. Staff need not be changed but must be evaluated in
part by their students‘ outcomes. In addition, the school must make changes in professional
development, instruction, curriculum, learning time, and operating flexibility (school-level
autonomy over budgetary and staffing decisions). This model assumes that the core instructional
staff members at a failing school are competent but need new leadership, programs, training, and
support.
Turnaround. The principal and at least one half of the staff are replaced, and the instructional
program is revised. In addition, the school must implement new types of professional
development, use data to inform instruction, expand learning time, provide wraparound
services, and develop new governance structures. This model also calls for operating flexibility
for the school. Turnaround is designed to bring in new, highly qualified staff, as well as new
programs, training, and support.
Restart. The school is closed and then reopened under the direction of a charter or education
management organization (EMO). Restart assumes that private operators will foster greater
innovation and improvement.
Closure. The school is closed, and the students attend other schools in the district. Closure is
intended to offer students a better chance for success at another school.
Despite this increased focus on school turnaround—and a developing research base regarding
turnaround across a broad set of organizations (Rhim et al., 2007), several federal and local studies
specifically focused on turnaround schools (Aladjem et al., 2010; Calkins et al., 2007; Hansen & Choi,
2011; Herman et al., 2008), and several high-profile national publications on this topic (Education Trust,
2005; Kutash et al., 2010b; Rhim et al., 2007)—there is no common definition of what constitutes a
turnaround school. This lack of uniform definition regarding turnaround schools is a concern, as the
research often cites lessons learned about school turnaround based on examples selected using
substantially different criteria.
This study attempts to define turnaround schools in California, both what constitutes low-performing or
―failing‖ schools and what constitutes turnaround or ―success‖ for these schools. The study clearly
2 These models are also used in the Race to the Top (RTT) initiative. For more information on these models, see
www.ed.gov/blog/2010/03/whats-possible-turning-around-americas-lowest-achieving-schools/.

Turnaround Schools in California: Who Are They and What Strategies Do They Use?
2
specifies the criteria used for identifying and selecting turnaround schools and then provides summaries
of the strategies that a sample of principals from these schools reported as essential to their schools‘
improved outcomes. Our set of criteria, developed in conjunction with a group of California education
stakeholders, is not proposed as the sole definition for school turnaround; rather, the study intends to
provide a definition of both low performance and turnaround for schools in California. We applied these
criteria to all California schools using data from a seven-year period to identify these schools. We then
interviewed the selected schools‘ principals to identify the strategies they believed were responsible for
their turnaround success.
In the remainder of this report, we first review different approaches for defining school turnaround and
the various turnaround strategies identified in previous studies. We then describe the methods used in
this study to define and select turnaround schools in California and present the selected schools‘
demographic and achievement patterns. Subsequently, we describe the data collection and analysis
procedures, followed by eight overall strategies identified across the schools and three individual school
profiles. We conclude with implications for policy and practice.
Study Background: Different Turnaround Definitions and Practices
In response to the sharpened focus on accountability and the need to intervene in cases of extended
periods of low performance in schools, general interest has developed in how and under what
conditions schools are able to achieve quick and substantial change. How one defines turnaround can
greatly impact the lessons gleaned from these schools‘ practices. Across studies, the definition for how
to measure school turnaround varies greatly. The recently released School Turnaround Field Guide (Kutash
et al., 2010a) notes that the word turnaround has been ―used broadly and means different things to
different people‖ (p. 12). The definition from Calkins et al. (2007) is, ―a dramatic and comprehensive
intervention in a low-performing school that: a) produces significant gains in achievement within two
years; and b) readies the school for the longer process of transformation into a high-performing
organization‖ (p. 73). However, Kutash et al. (2010a; 2010b) raise key questions associated with this
definition that illustrate some of the main issues in the field, such as what ―low performance‖ and
―significant growth‖ mean, what the timeframe for turnaround is, and what the role of the district is in
the turnaround process. In an attempt to test Calkins et al.‘s definition of turnaround, Kutash et al.
(2010b) conducted more than 50 interviews with state and district representatives and practitioners.
Although they found general agreement on the concept, the authors also reported continued debate
over the specific elements for defining turnaround.
As an example of how turnaround definitions can vary greatly, we compared two recent studies on the
topic. In one large federal study, Herman et al. (2008) defined turnaround schools based on two criteria.
First, these schools had to begin as ―chronically poor performers,‖ defined as 20 percent or more of
students failing to meet state standards of proficiency in mathematics or reading over two or more
consecutive years. Second, these schools then had to show ―substantial gains‖ in student achievement by
reducing by at least 10 percentage points the proportion of students failing to meet state standards for
proficiency in mathematics or reading in a ―short time‖ (i.e., no more than three years).
A second large, federally funded national study on this topic (Aladjem et al., 2010) employed a
substantially different definition to identify turnaround schools. In specifying initial low performance, all
selected schools had to be in the bottom 50 percent based on their 1999–2000 scores. They then had
to make annual gains in standardized achievement scores in reading and mathematics from 1999–2000 to
2004–05 and be in the top 50 percent of gainers in each year. The authors excluded schools whose
percentage of free or reduced-price lunch program participants and/or minority students changed by
more than 15 percent in a given year.
Turnaround Schools in California: Who Are They and What Strategies Do They Use?
3
Because the criteria for these two studies are so different, the resulting turnaround schools are
dramatically different. Applying the turnaround criteria from the first study to California data from
2006–07 to 2009–10 resulted in more than 40 percent of all California schools qualifying as turnaround
schools. In contrast, based on the definition used, the second study reported that ―few schools
nationwide met the criteria‖ (Aladjem et al., 2010).
Using different schools—identified through different criteria—these studies identified overlapping but
not identical practices in successful turnaround schools. Herman et al. (2008) summarized 10 case
studies of 35 schools that had turned around according to the study‘s definition and, based on their
summary, provided four recommendations for successful practices: (1) signal the need for dramatic
change with strong leadership; (2) maintain a consistent focus on improving instruction; (3) make visible
improvements early in the school turnaround process (quick wins); and (4) build a committed staff.
Aladjem et al. (2010), using retrospective, in-depth qualitative case studies of 11 schools, found that
strong leadership, teachers, and staff; the use of data to identify effective practices; strong instructional
support strategies; and support from the external community were important factors in these schools‘
turnaround efforts.
The district‘s role in improving low-performing schools also has been found to be key to the schools‘
improvements (Baroody 2011; Knudson et al., 2010; Kutash et al., 2010b). District systems can ensure
that schools have the resources, structures, and procedures available to leverage reforms that sustain
the ongoing improvement of low-performing schools.
Despite the promising strategies highlighted, Stuit (2010) found that public schools in need of
turnaround are often resistant to change, lingering in a low-performing state for years. Using
mathematics and reading proficiency scores over two academic years (2002–03 and 2003–04), Stuit
identified 2,025 chronically low-performing charter and district schools across 10 states and tracked
them from 2003–04 through 2008–09 to determine how many were turned around, showed moderate
improvement closed, or remained low performing. By 2008–09, 72 percent of the initially low-
performing charter schools remained in operation and remained low performing, compared with 80
percent of district schools. The report emphasizes the extreme rareness of turnaround schools,
specifically noting that the probability of turnarounds across all 10 states was approximately 1 percent.
School Selection Methodology
For this study, using the most recent publicly available California student achievement data3 over a
seven-year period (from 2003–04 through 2009–10), we applied a 10-step process to define turnaround
schools, taking into account some of the issues identified in the literature (e.g., the definitions of low
performance, growth, and sustainability of performance).4
We specified a pre-turnaround period over three years (Years 1–3, from 2003–04 to 2005–06), a
turnaround period over the next three years (Years 4–6, from 2006–07 to 2008–09), and a single
sustained performance year (Year 7, 2009–10). We included all California public schools, including
charter schools.5 The 10 selection criteria are as follows:
3 We used California Standards Test (CST) data from the Standardized Testing and Reporting (STAR) databases
and demographic data and performance measures from the Base Academic Performance Index (API) databases. 4 This definition was discussed and vetted by CDE staff and WestEd colleagues as a partner in the California
Comprehensive Center in a meeting in December 2010. 5 Charter schools were included in the analysis to gauge the difference, if any, between these and regular public
schools‘ approach to turnaround.

Turnaround Schools in California: Who Are They and What Strategies Do They Use?
4
1. Missing Test Data. To be included in the analysis, schools had to have both mathematics and
English language arts (ELA) California Standards Test (CST) scores for at least five of the seven
years: at least two years of data for the pre-turnaround period, at least two years of data for the turnaround period, and one year of data for the sustained year
2. Initial Low Performance. Schools had to be in the bottom third of standardized6 average mathematics/ELA mean scale CST scores in the pre-turnaround period (i.e., Years 1–3).
3. Minimum Growth Over Time. Schools had to demonstrate a growth of at least 0.2 standard
deviations over the three years. To measure this, we calculated the difference between pre-
turnaround and turnaround standardized average mathematics/ELA CST scores.
4. Subgroup Growth. To ensure that the performance of student subgroups grew over time,
schools could not have a negative growth in standardized average mathematics/ELA CST scores
from the pre-turnaround to the turnaround period for the following subgroups: African
American, Hispanic, poverty, students with disabilities, ELs.
5. Growth Endpoint. Schools had to increase their performance between the pre-turnaround
and turnaround periods to at least the middle third of school performance based on their three-
year standardized average mathematics/ELA scores. That is, if a school grew 0.2 standard
deviation (Criterion 3) but stayed within the bottom third of school performance, it would not
meet this growth endpoint criterion.
6. Demographic Filters.7 To control for changes in demographics that are likely to explain
achievement growth, we filtered out schools that showed a decrease in the percentage of tested
students eligible for free or reduced-price lunch, minority students (i.e., Hispanic and African
American students), and ELs greater than 15 percentage points between Year 1 and Year 7.8
7. Enrollment Filter. We added a similar control for changes in student enrollment. We
dropped schools that showed a decrease in enrollment (based on the number of students
tested) greater than 20 percent between Year 1 and Year 7 under the premise that schools
could have transferred their lower performing students to other sites.
8. Similar Schools Rank. As an additional performance criterion, schools had to attain a
California Similar Schools Rank9 of 5 or above (on a scale from 1 to 10, where 10 is the highest) in Year 7.
9. Sustained Performance. To ensure that schools sustained their performance, we calculated
the gain in standardized average mathematics/ELA CST scores between Year 6 and Year 7.
Schools could not decline more than 0.1 standard deviations between Year 6 and Year 7.
10. Subgroup Sustained Performance. Similar to the subgroup growth criterion (Criterion 4),
schools could not have a decline in standardized average mathematics/ELA CST scores of more
than 0.2 standard deviations between Year 6 and Year 7 for the following subgroups: African
American, Hispanic, poverty, students with disabilities, ELs.
6 ELA and mathematics mean scale scores were standardized by grade level, weighted by the percentage of
students who took the test, and summed across all grade levels in the school. (Although the test is not vertically
equated, this does not affect our analysis because we standardized the test scores by grade level.) 7 Demographic data are from the Base API database, which uses the percentage of students tested. 8 We did not eliminate schools that had increases in these at-risk populations because that demographic change is
unlikely to offer an alternative explanation for school achievement gains. 9 For the California Similar Schools Rank, schools are ranked into deciles according to school type: elementary,
middle, and high school. To determine the Similar Schools Rank for a school, a comparison group of 100 similar
schools of the same type is formed for that school, based on similar demographic characteristics. For more
information, see: http://www.cde.ca.gov/ta/ac/ap/glossary11b.asp

Turnaround Schools in California: Who Are They and What Strategies Do They Use?
5
As Exhibit 1 shows, from a pool of 2,407 schools in the lowest third of mathematics/ELA performance
(Criterion 2), we ended up with 44 schools (or 2 percent) that met all the criteria. Of these 44 schools,
35 were elementary schools, 4 were middle schools, and 5 were high schools.
Exhibit 1: Number and Percentage of Schools that Met the Turnaround Criteria After
Applying Each Criterion
Elementary Schools Middle Schools High Schools All Schools
5,695 100% 1,290 100% 1,329 100% 8,31410
100%
1. Missing Test Data 5,023 88% 1,169 91% 1,025 77% 7,217 87%11
2. Initial Low Performance 1,675 33% 390 33% 342 33% 2,407 33%
Lowest Third of Schools 1,675 100% 390 100% 342 100% 2,407 100%
3. Minimum Growth 442 26% 77 20% 66 19% 585 24%
4. Subgroup Growth 338 20% 33 8% 60 18% 431 18%
5. Growth Endpoint 142 8% 14 4% 28 8% 184 8%
6. Demographic Filters 107 6% 13 3% 23 7% 143 6%
7. Enrollment Filter 85 5% 11 3% 21 6% 117 5%
8. Similar Schools Rank 79 5% 10 3% 18 5% 107 4%
9. Sustained Performance 41 2% 5 1% 13 4% 59 2%
10. Subgroup Sustained Perf. 35 2% 4 1% 5 1% 44 2%
Meeting the minimum growth criterion (Criterion 3) was particularly hard for schools because only 24
percent of the schools in the lowest third of school performance met this criterion. Meeting the
subgroup growth criterion (Criterion 4) decreased the percentage of schools another 6 percentage
points on average (and 12 percentage points for middle schools). In addition, meeting the fifth criterion
of increasing performance to at least the middle third of school performance decreased the percentage
of schools by another 10 percentage points. The remaining criteria (Criteria 6–10) reduced the
percentage of schools an additional 6 percentage points to 2 percent or 44 schools.
To select our sample of schools to study further, we ordered the remaining 44 schools from highest to
lowest growth within each school type. We then selected 10 schools (4 elementary schools, 3 middle
schools, and 3 high schools) with varying geographic location, district type, and school and district size
with the belief that this sample would provide a sufficient number of strong examples given our study
timeframe and resource constraints. We focused on schools of above-average poverty. (More details
are provided later in this report.)
We later excluded one of the selected high schools after learning that the student population had
changed during the turnaround period due to a change in its feeder school patterns. As these changes
seemed to substantially affect the school‘s change in performance observed over this period, we decided
to drop this school from further consideration.12
Interestingly, without applying any of the previous criteria and selecting schools strictly on the amount of
growth in student outcomes over the seven-year period, only six of the 35 elementary schools, one of
10 For this analysis, we excluded nontraditional public schools such as continuation schools, special education
schools, county schools, preschools, and adult schools. 11 The cases with missing test data were generally new charter schools (less than five years of available data), very
small schools (10 students or fewer in a given grade level), and K–1 schools (where student are not yet tested). 12 The percentage of Asian students increased by 25 percent, and African American students decreased by 13
percent during the study period, a condition not fully accounted for by our demographic filter (Criterion 6).

Turnaround Schools in California: Who Are They and What Strategies Do They Use?
6
the four middle schools, and four of the five high schools identified for this study would be among the
top 50 performers by school level. This lack of overlap in the school samples indicates the influence of
the criteria used in the turnaround selection.
The remainder of this report focuses on the findings from the nine schools in our sample.
Selected Schools’ Demographic and Achievement Patterns
Exhibit 2 shows that the nine selected schools are located in different unified (five), elementary school
(three), and high school (one) districts across five counties. The locations were urban (four), suburban
(three), and rural (two), and the districts ranged in size from the more than 670,000 students in the Los
Angeles Unified School District to 692 students in the Chatom Union School District in the Central
Valley.
Exhibit 2: District Demographics for Selected Turnaround Schools, 2009–10
Schools Districts District Type County Location District
Enrollment13
Elementary Schools
Del Rey Elementary Sanger Unified Unified Fresno Suburban 10,501
122nd Street Elementary Los Angeles Unified Unified Los Angeles Urban 671,088
St. Hope PS7 Charter Sacramento City Unified* Unified Sacramento Urban 47,890
Silver Wing Elementary Chula Vista Elementary Elementary San Diego Urban 27,473
Middle Schools
General Grant Middle Kings Canyon Joint Unified Unified Fresno Suburban 9,798
Mountain View Middle Chatom Union Elementary Stanislaus Rural 692
Prairie Vista Middle Hawthorne Elementary Los Angeles Suburban 9,139
High Schools
Kerman High Kerman Unified Unified Fresno Rural 4,503
Sweetwater High Sweetwater Union High High San Diego Urban 42,209
* St. Hope Public School 7 (PS7) Charter is part of the St. Hope Public School Charter Management Organization but located within Sacramento City Unified. Source: California Department of Education, Educational Demographics Office and Academic Accountability and Awards Division
The schools also varied in size, ranging from a middle school with 222 students to a high school with
an enrollment of 2,456, as shown in Exhibit 3. The poverty levels of the selected schools were above
average by design, ranging from 63 percent to 94 percent, with three schools reporting poverty levels of
greater than 90 percent. Schools also tended to have high EL populations, high percentages of Hispanic
students, and low Asian student populations. The exception was the charter school that had a low
percentage of ELs (3 percent) but a much higher African American population (78 percent) than the
other sampled schools.
13 The average enrollment for unified school districts in California is 12,909 students.

Turnaround Schools in California: Who Are They and What Strategies Do They Use?
7
Exhibit 3: School Demographics for Selected Turnaround Schools, 2009–10
Schools Grade Span
Enrollment Poverty
Level English
Learners
Students with
Disabilities
African Americans
Asians Hispanics Whites
Elementary Schools
Del Rey Elementary K–6 269 94% 50% 7% 0% 6% 91% 1%
122nd Street Elementary K–5 674 86% 53% 13% 19% 0% 81% 0%
St. Hope PS7 Charter* K–8 378 63% 3% 1% 78% 2% 8% 3%
Silver Wing Elementary K–6 430 66% 56% 8% 2% 1% 54% 33%
State Average 529 58% 28% 11% 7% 9% 49% 30%
Middle Schools
General Grant Middle 6–8 548 91% 37% 11% 0% 0% 94% 5%
Mountain View Middle 6–8 222 75% 44% 8% 0% 0% 51% 49%
Prairie Vista Middle 6–8 1,028 92% 30% 8% 25% 3% 67% 2%
State Average 825 56% 19% 10% 8% 8% 49% 29%
High Schools
Kerman High 9–12 1,201 71% 22% 9% 1% 7% 79% 13%
Sweetwater High 9–12 2,456 84% 28% 10% 2% 1% 81% 2%
State Average 1,394 50% 14% 9% 9% 8% 45% 34%
* St. Hope PS7 Charter opened in 2003–04 with Grades K–4 and added one grade level each year until 2007–08 when it became a K–8 school. Source: California Department of Education, Educational Demographics Office and Academic Accountability and Awards Division
Looking at average ELA and mathematics mean scale scores on the CST, Exhibit 4 shows that
elementary schools (in particular the charter school) tended to make greater gains than the middle
schools and high schools over the seven-year period. However, all schools (with the exception of the
charter school) ended up performing at or about the state average. Thus, these schools did not, for the
most part, make ―dramatic improvements‖ in their performance, but showed slow and steady progress
over time. This is especially important to note because current federal policy is pushing for dramatic
improvements in the country‘s lowest performing schools. (See the appendix for exhibits that show the
ELA and mathematics proficiency rates separately for the nine schools over the same time period.)

Turnaround Schools in California: Who Are They and What Strategies Do They Use?
8
Exhibit 4: Average ELA and Mathematics CST Mean Scale Scores for Selected Turnaround
Schools, Year 1 (2003–04) to Year 7 (2009–10)14
Source: California Department of Education: Evaluation, Research, and Analysis Office
Mean scale scores are just one measure of student achievement. The schools‘ results on the state
accountability measure—the Academic Performance Index (API)—that schools use as a common
measure for success also show the same patterns for improvement over time. The API scores range
from 200 to 1000 and, as shown in Exhibit 5, while all schools were scoring below 700 points on the API
in Year 1, most schools ended up at about 800 (the statewide goal for API) in Year 7.
14 Note that ―0‖ in these graphs represent the state average.

Turnaround Schools in California: Who Are They and What Strategies Do They Use?
9
Exhibit 5: Growth API* for Selected Turnaround Schools, Year 1 (2003–04) and Year 7
(2009–10)
* Note: Growth APIs cannot be compared from one year to the next. Source: California Department of Education: Evaluation, Research, and Analysis Office
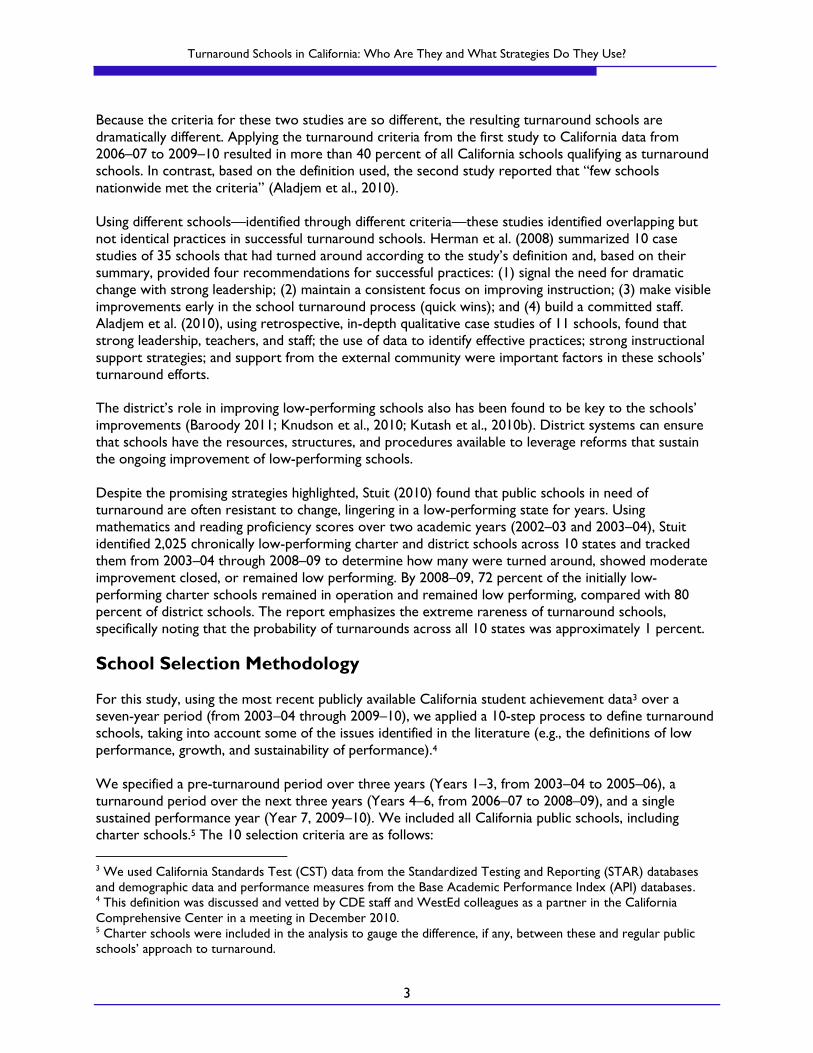
Finally, looking at another measure of student achievement in California, as shown in Exhibit 6, all nine
schools improved their state school rankings15 to at least 4 (on a scale from 1 to 10), with four of the
schools ending with a ranking of 6 in Year 7. Again, this illustrates that these schools did not make
dramatic improvement but rather incremental improvement over time.
15 Schools are ranked in 10 categories of equal size, called deciles, from 1 (lowest) to 10 (highest). A school's
statewide rank compares that school with other schools of the same type in the entire state. The school types are
elementary, middle, and high schools. Each decile contains 10 percent of all schools of that type. For more
information, see http://www.cde.ca.gov/ta/ac/ap/glossary11b.asp.
Turnaround Schools in California: Who Are They and What Strategies Do They Use?
10
Exhibit 6: State Rankings for Selected Turnaround Schools, Year 1 (2003–04) and Year 7
(2009–10)
State Ranking
Year 1 Year 7
Elementary Schools
Del Rey Elementary 1 6
122nd Street Elementary 1 6
Silver Wing Elementary 2 6
St. Hope PS7 Charter * 9
Middle Schools
General Grant Middle 3 5
Mountain View Middle 4 6
Prairie Vista Middle 3 5
High Schools
Kerman High 3 4
Sweetwater High 2 4
* St. Hope PS7 Charter opened in 2003, so it was not eligible to receive a ranking in Year 1.
Data Collection and Analysis
During one-hour phone interviews with the principals of these schools, we discussed the policies,
programs, and practices they associated with their school‘s turnaround student performance. To guide
the discussion, an interview protocol was organized around the strategies identified in the literature:
Strong leadership and staff
Cohesive instructional strategies
Use of data to change instruction
Teacher collaboration
Extended learning time
District/external support
However, the discussion was not limited to these strategies because the respondents were asked to
outline the most important factors without prompting. The interviews were recorded and transcribed.
We then coded the interview data by construct and analyzed these data for specific themes and
strategies that at least three of the nine principals reported as having had an impact on their schools‘
turnaround performance. Subsequently, we selected three comprehensive turnaround stories to
profile—one at each grade level (elementary, middle, and high school). The nine principals‘ reported
turnaround strategies are presented in the following section, which is followed by the three school
profiles.
Schools’ Reported Turnaround Strategies
In this section, we summarize the strategies cited by at least three of the nine principals as contributing
to their schools‘ turnaround performance. The eight identified strategies are listed in order of
frequency:

Turnaround Schools in California: Who Are They and What Strategies Do They Use?
11
1. Instructional strategies focused on student subgroups (six principals)
2. An emphasis on teacher collaboration (six principals)
3. Strong instructional leadership (five principals)
4. Regular use of assessments and data analysis (four principals)
5. Increased parent involvement (four principals)
6. Guidance and support provided by the district (four principals)
7. Use of student engagement strategies (three principals)
8. Use of extended learning time (three principals)
We elaborate on these themes and provide concrete examples of specific strategies that principals
reported as most important in contributing to the turnaround of their schools.
1. Instructional Strategies Focused on Student Subgroups
The strategy cited most frequently across the nine interviews was a focus on instructional improvements
targeted to student subgroups, especially ELs. Six principals (Del Rey Elementary, Silver Wing
Elementary, Mountain View Middle, General Grant Middle, Prairie Vista Middle, and Kerman High)
stated that they had implemented instructional strategies such as English Language Development (ELD),
Sheltered Instruction Observation Protocol (SIOP) model, Response to Intervention (RTI), and intensive
language programs to improve learning for ELs, special education students, and students scoring below
basic on the CST.
At Mountain View Middle, for example, the principal reported that the biggest factor in her school‘s
turnaround process was a focus on ELs. When she became the principal in 2004, she began analyzing
student data and found that many ELs at Level 3 (the intermediate of five levels) on the California English
Language Development Test (CELDT) had not made progress for three years, even though ELs are
supposed to progress one level per year. A staff committee decided to shadow Level 3 ELs to determine
why the students were not progressing, using 3½-hour observations. The observers recorded what
students were doing every five minutes (e.g., talking, reading, writing, listening) and discovered that these
students were not speaking or actively participating; they were listening only.
The committee also asked students about their learning process (e.g., What helps you the most? What
makes you most frustrated? What would you like the teacher to do?), finding, for instance, that some
students wanted teachers to call on them more (because getting the answer wrong when you are called
on is not as bad as getting the answer wrong when raising your hand). The teachers shifted their
approach from protecting these students by not putting them on the spot to more actively calling on
them. The principal also described how this shift gave students more confidence and increased
opportunities to practice their vocabulary and content knowledge.
As another example, the Silver Wing Elementary principal reported that the school implemented the
SIOP model. The dual goals for SIOP or sheltered instruction are to provide access to grade-level
content and to promote the development of English language proficiency. In sheltered English classes,
teachers use clear, direct, simple English, and a wide range of scaffolding strategies. The learning
activities connect new content to students‘ prior knowledge, require collaboration among students, and
spiral through curriculum material. In 2007–08, Silver Wing‘s staff received training in SIOP provided by
consultants who modeled lessons for teachers that were video-recorded for future use. The principal

Turnaround Schools in California: Who Are They and What Strategies Do They Use?
12
explained that SIOP helped teachers better plan their lessons, clarify the intent of their teaching
strategies, and adapt content to meet the needs of all students.
The principals of Del Rey Elementary and General Grant Middle reported that the implementation of
ELD and RTI strategies in their schools contributed to their schools‘ turnaround. Both principals noted
that these efforts were part of district-wide initiatives, with training and coaching provided by their
districts and outside sources. Through administration of assessments and analysis of data for ELs, staff
were able to determine learning gaps and focus their efforts on those needs. In discussing RTI‘s impact
on students, the Del Ray principal shared, ―What we are noticing now, that is wonderful, is that they
[the upper-grade teachers] are getting new kids without the gap. My fifth grade teacher said, ‗It is
amazing because every child is reading.‘‖
Finally, both the Prairie Vista Middle and Kerman High principals reported using language programs and
strategies to meet the needs of students scoring below basic on the CST in ELA. At Kerman High, they
implemented Scholastics Read 180, which is an intensive English class required for students scoring
below basic. When this program went district-wide, district staff spent two years training teachers on
learning strategies for ELD standards. Now, students who are classified as ELs are automatically enrolled
in ELD and English core classes, which focus on vocabulary, reading, and writing. To exit from these
courses, students must score proficient or higher on the CST, or over the course of two consecutive
years score 4 or 5 (out of 5) on the CELDT. According to the principal, Kerman High has been offering
fewer ELD and English core classes because ELs are now reclassified at earlier grade levels.
Similarly, Prairie Vista‘s principal stated that the implementation of the Language! program (a reading
intervention program for students scoring below basic) and a district-wide formative assessment led to
successful common teaching and course placement strategies that increased student achievement,
especially for ELs and special education students. To support the implementation and fidelity of
Language!, Prairie Vista‘s principal hired a coach who worked with the language teachers and observed
lessons, gave feedback, and modeled lessons two to three times a month for two years. ―[We] trained
all our language arts, math, and science teachers on these instructional strategies because they were
really good for all kids.‖
2. An Emphasis on Teacher Collaboration
An emphasis on teacher collaboration was reported as essential by six of the nine school principals
(122nd Street Elementary, Del Rey Elementary, General Grant Middle, Mountain View Middle, Prairie
Vista Middle, and Sweetwater High). These principals noted the need to prioritize and create time in
their schedule for teacher collaboration. At some schools (Del Rey Elementary, General Grant Middle,
Mountain View Middle, and Sweetwater High), this was a district-wide effort, whereas at other schools
(122nd Street Elementary and Prairie Vista Middle), the principals deliberately worked on changing the
culture around teacher collaboration at their school sites.
At Del Rey Elementary, for example, the principal said a majority of staff in the district was trained on
how to implement professional learning communities (PLCs), and at the school site, the school created
teams to collaborate, share strategies, and discuss student performance. Grade-level PLCs meet every
Wednesday, in addition to vertical cross-grade team meetings that meet on an as-needed basis (e.g., to
plan for ELD instruction across grades). The school also has an academic council (the academic
leadership team) that meets every Monday and receives district training on different strategies to
improve student achievement. ―Teachers have opened their doors to other teachers, creating a
supportive environment where they share successes and challenges,‖ reported the principal. In addition,
the principals at General Grant Middle and Sweetwater High described their PLCs as the strategy that
coalesce their efforts on data analysis, instructional strategies, and other improvement efforts.

Turnaround Schools in California: Who Are They and What Strategies Do They Use?
13
The principal of Prairie Vista Middle described how, during her five years as principal, the school
experienced an essential shift toward a collaborative culture, but this also had been facilitated by a major
turnover of staff: "About three or four years ago, we had tremendous teacher turnover, and I was able
to hire a lot of new teachers at a time when shared common instructional practices were being adopted
and collaboration was coming around. It was going to be required that everybody take part in these
conversations. I don‘t know that everybody was comfortable with this, which may have led to some
teachers finding other jobs in other districts. Whatever the reason, it was an opportunity for us
to bring in some new teachers."
She also designed the schedule with time set aside for teacher collaboration, which allowed teachers to
analyze their data and discuss specific successes and challenges in their classrooms. The principal noted
that teacher collaboration ―didn‘t turn around overnight, but now it‘s built into the culture of the
school.‖
A similar change in culture took place at 122nd Street Elementary, whose principal reported developing
collaboration focused on the best instructional strategies with the assistance of an instructional coach.
However, unlike Prairie Vista Middle School, this cultural shift took place with the existing teachers. In
addition to classroom observations carried out by the coach, teachers also observed each other, further
facilitating collaboration. According to the principal, these efforts resulted in a cohesive staff, constantly
working together on developing lessons and addressing instructional challenges.
3. Strong Instructional Leadership
Although only one principal (Del Rey Elementary) explicitly mentioned instructional leadership as
contributing to the school‘s turnaround efforts, four other principals (122nd Street Elementary, Silver
Wing Elementary, General Grant Middle, and Mountain View Middle) described their role as strongly
focused on instructional leadership. For example, the principal at 122nd Street Elementary noted that
standards-based instructional practices had not been a priority previously, and her instructional focus set
a foundation for which the school was able to successfully turn around. Three principals (Del Rey
Elementary, Silver Wing Elementary, and General Grant Middle) explicitly emphasized the importance of
the principal being in the classrooms, doing walk-throughs, and providing ongoing feedback to teachers.
One principal (at Mountain View Middle) summed it up this way: ―The quality of instruction in the
classroom—that‘s my focus.‖
4. Regular Use of Assessments and Analysis of Data
Four principals (Silver Wing Elementary, St. Hope PS7 Charter, Prairie Vista Middle, and Sweetwater
High) mentioned the regular use of assessments and analysis of data as a key turnaround strategy. The
St. Hope PS7 Charter principal noted that school staff analyze student data on a weekly basis. By the end
of every Saturday (a non-instructional day), teachers submit a data report to the principal, their grade-
level team, and lead teacher. The data report contains the teacher‘s expectations for student mastery of
the week‘s material, identifies which students did not meet this level, reflects on why students were not
successful, and describes what the teacher will do differently next week. By Sunday, the principal reviews
the report and provides feedback on what the teacher can improve for the following week. The
principal stated that students‘ scores have gone up and attributes that to ―the fact that we‘re looking at
data every single week and the teacher has to really stop, think, and focus on ‗what did I do this week,
how did my kids do, and as a result what can I do differently next week to get better results?‘‖ The
school also administers benchmark assessments every six to seven weeks and uses Data Director as its
data management system.

Turnaround Schools in California: Who Are They and What Strategies Do They Use?
14
In 2008–09, Silver Wing Elementary, along with three other schools in the district, began implementing
the Grade-Level Assessment of Standards (GLAS) every six to eight weeks. To create the GLAS,
curriculum and instruction resource teachers worked with teachers on reviewing the California
standards to select relevant assessment items from Intel Assess (a company that assists schools in
creating formative assessments). The principal said, ―The teachers highly regard this assessment because
it allows them to monitor student progress every six to eight weeks, then to go back and through
Universal Access, hit those standards that the students are still struggling in or are not proficient on just
yet."
Similarly, at Prairie Vista Middle, the principal described how special project teachers, who support
teachers in mathematics or language arts, work strategically with struggling students and oversee the
data system for their instructional focus area. The principal also noted that the district-wide interim
assessments (both a trimester benchmark and an end-of-unit assessment) provide teachers with an
accurate measurement of student learning and allow them to make instructional adjustments if needed.
In addition, the assessments have created opportunities for teacher collaboration both within and across
middle schools in the district. According to the principal, ―The faculty has come together to have those
difficult conversations about what are best practices and what‘s best for student learning."
Finally, at Sweetwater High, a district-wide focus on data was described as key to the school‘s
improvement. A strong reliance on data, especially in the use of common assessments, exists throughout
the system. The principal indicated that the use of data for the purpose of student interventions is
important because it helps not only to determine who needs help, but also how to properly serve them.
He also noted that the school uses data to place students in accelerated classes and that all Sweetwater
teachers use the same data system (Data Director), which allows the use of data to be thoroughly
integrated into the school‘s overall instructional strategy.
5. Increased Parent Involvement
Although only one principal (St. Hope PS7 Charter) explicitly mentioned parent involvement as having
contributed to the school‘s improved performance, three other principals (122nd Street Elementary,
Silver Wing Elementary, and Sweetwater High) described substantial parent involvement efforts in this
area. For example, at 122nd Street Elementary, the principal invited parents to observe classrooms and
arranged informal meetings with parents. The principal reported that the increased parent engagement
led to ―people coming to the door asking ‗Please take my child‘ because they want their kid to be
successful too.‖
In addition, at Silver Wing Elementary, the school implemented an Everyone‘s A Reader program, which
trained parents on how to read with students. Parents, who were taught very simple teaching strategies
by the curriculum and instruction resource teacher, now work as volunteers on a weekly basis at the
school. ―It has empowered parents, not just in English but also in Spanish because we do have an
alternative bilingual program."
Finally, at Sweetwater High, through a federal GEAR UP grant,16 an external provider created six-week
institutes where parents learn about issues such as college-entrance requirements, study skills, and can
receive a certificate of completion. According to the principal, this effort helped change the culture to
focus more on academics.
16
This grant program is designed to increase the number of low-income students who are prepared to enter and
succeed in postsecondary education. GEAR UP provides six-year grants to states and partnerships to provide
services at high-poverty middle and high schools. GEAR UP grantees serve an entire cohort of students beginning
no later than the seventh grade and follow the cohort through high school.

Turnaround Schools in California: Who Are They and What Strategies Do They Use?
15
The principal at St. Hope PS7 Charter aimed to set high expectations by requiring that all students,
parents, and teachers to sign a contract outlining the expectation that the student will go to college, as
the most important factor in their high performance. Parents must agree to provide 40 hours of service
to the school every year. Although only 45 percent of the parents met this goal last year, the remainder
is expected to make up the missing hours. When students and teachers do not live up to the school‘s
high expectations, students get detention or miss field trips, and teachers are let go if they are not able
to improve their performance. ―We are very adamant that we are going to do what‘s best for kids and
not what‘s going to make adults comfortable, and if it‘s not the right fit and not the best match in the
classroom, the kids are not learning and achieving where they should be, then we‘ll make a change.‖
6. Guidance and Support Provided by the District
Although none of the principals explicitly attributed their turnaround efforts to their districts, four of
the principals (Del Rey Elementary, Silver Wing Elementary, General Grant Middle, and Sweetwater
High) described substantial guidance and support being provided by their respective districts. The
principals from Del Rey, General Grant, and Sweetwater all noted that their districts had provided
parameters and support for implementation of PLCs and district-wide assessments, as well as specific
instructional strategies in the case of Del Rey and General Grant. At Silver Wing, the principal
emphasized key district efforts that had helped turn around the school.
The Silver Wing principal described the importance of support received from district executive
directors, who are assigned 8 to 11 schools for which they are held personally responsible for their
success. The executive directors are highly qualified principals who were able to turn around schools
themselves. ―They become your mentor and that person that you turn to. Walk-throughs are
imperative. They come into your school site, and they walk through your school site with you. They
provide that second pair of eyes that is needed just to tell you, ‗Yes, you are on target‘ or ‗You are not
on target.‘ They are able to answer your questions in terms of budget, discipline, parental involvement.
They are able to assist in just about anything, and I think it is really refreshing.‖
7. Use of Student Engagement Strategies
Three school principals (Del Rey Elementary, Silver Wing Elementary, and General Grant Middle)
reported focusing on strategies related to how students are engaged in learning. At Del Rey Elementary
and General Grant Middle, principals noted that ELD and RTI were combined with Explicit Direct
Instruction (EDI) strategies. EDI focuses on the use of (a) instructional grouping (using flexible skill
grouping as opposed to "tracking"); (b) instructional time (increasing academic learning time—the time
students are successfully engaged); and (c) continuous assessment (providing ongoing, in-classroom
assessments to inform instructional practice).
The principal at Del Rey Elementary described EDI this way: ―When you look at teacher practices and
how teachers have traditionally taught, the teacher is lecturing 80 percent of the time, and the kids are
responding only 20 percent. With EDI, it is the opposite of that. The teacher is constantly checking for
understanding after every several minutes within a lesson. They [students] are more engaged with white
boards and response. They are doing a lot of pair-sharing, and once you see a problem, you can take
care of it immediately so you don‘t have to go to the end of your lesson and realize that half of the class
doesn‘t know what you‘re teaching. There are very specific steps in your instruction and a huge amount
of student engagement."
As a certified coach in EDI, the Del Rey principal was able to train the teachers initially; teachers then
received additional training through DataWorks (a professional development provider). New teachers at

Turnaround Schools in California: Who Are They and What Strategies Do They Use?
16
Del Rey get trained in EDI, paired with a partner teacher, and immediately start implementing EDI in
their classroom, according to the principal. At General Grant Middle, the EDI training is provided by the
district, including a data coach who works with both the principal and the teachers. The Del Rey
principal summed up the impact of EDI this way: ―Once we all got started doing EDI, we really became a
student-centered environment.‖
Another student engagement strategy, the Gradual Release of Responsibility (GRR) model, was
implemented as part of Silver Wing Elementary‘s turnaround strategy. The GRR consists of four
teaching and learning phases: (1) demonstration by the teacher (I do, you watch); (2) shared
demonstration with moderate teacher support (I do, you help); (3) guided practice with low teacher
support (You do, I help); and (4) independent practice with little to no teacher support (You do, I
watch). Silver Wing‘s principal explained that GRR was implemented in 2007 with training of all district
administrators and school instructional leadership teams (ILTs) by Doug Fischer (a professor of language
and literacy education in the Department of Teacher Education at San Diego State University). The ILTs
then disseminated the information to their schools. According to the Silver Wing Elementary principal,
GRR allowed the district to become decentralized but to have a common language and to collaborate
on focus lessons. Through GRR, teachers‘ focus shifted to establishing a purpose for learning,
emphasizing academic language, and holding students accountable through accountable talk (i.e., to
encourage students to respond in complete sentences and to articulate their reasoning). ―[GRR] has
helped us to communicate with students what it is that they are learning and why they are learning it. …
The teachers are all using the same strategies, and they are all being held accountable for the same
instructional routines.‖
8. Use of Extended Learning Time
At three schools (St. Hope PS7 Charter, General Grant Middle, and Sweetwater High), principals
reported the use of extended learning time as a factor in their improved performance. At St. Hope PS7
Charter, this strategy is used with all students, whereas at General Grant Middle and Sweetwater High,
only lower performing students are required to participate in extra instruction time.
The principal at St. Hope PS7 Charter explained that the extended school day has existed since the
school opened because the school leadership argued that the traditional school day was not long enough
for students to master all of the grade-level standards, take elective courses, and participate in
extracurricular activities. The extended school day begins at 7:45 a.m. for all students, but ends at 2:45
p.m. for kindergarten, 3:45 p.m. for Grades 1–2, 4:00 p.m. for Grades 3–5, and 5:00 p.m. for Grades 6–
8. The middle school students get an hour of homework time from 4:00 to 5:00 p.m. every day with
their classroom teacher, which also means that teachers are required to stay at school until 5:00 p.m.
The school has been able to afford the extended day through the use of Title I funds and increases in
class size.
General Grant Middle and Sweetwater High provide extended learning time for students who are not
meeting performance expectations. According to the principal at General Grant Middle, the school
offers an extended school day during certain periods of the year for students who are not showing
progress on the district‘s benchmark assessment. These students participate in an additional hour of
school for 12 days (three days a week for four weeks) to be re-taught one or two standards. ―The only
thing we could do was lengthen the school day because some of our students have so many gaps in their
learning,‖ explained the principal. To get students to see this experience as a positive opportunity, the
extended day is incentivized with awards for perfect attendance and improved performance. The
principal also explained that the school uses data to regroup and match students to teachers for the
extended portion of the day based on the teachers‘ instructional strengths. She also noted that this

Turnaround Schools in California: Who Are They and What Strategies Do They Use?
17
approach, which involves a majority of the school (approximately 300 students each year), has improved
student achievement and the teachers‘ delivery of instructional material.
At Sweetwater High, learning time, both in and outside of the school day, was substantially increased
through targeted interventions, such as afterschool, Saturday, and support classes. Using data from
quarterly benchmark and common assessments throughout the district, students are placed by level in
different extended learning settings. The support classes offered typically are in mathematics or English
in a double-block period, so that students receive 10 (as opposed to 5) hours of instruction per week.
One fourth to one third of the entire school typically attends Saturday classes, illustrating what the
principal noted as a culture shift toward students‘ caring more about their academic progress. In
addition, if a student scores beneath a certain threshold, the student is assigned mandatory afterschool
or Saturday tutoring for support on specific standards. ―The percent of 10th graders passing the
California High School Exit Exam the first time has had a very profound impact on the increases on the
API.‖
School Profiles
The strategies identified in the previous section do not work in isolation; rather, the components
operate in conjunction with one another as illustrated by the three school profiles in this section. The
principal at 122nd Street Elementary School described a process that first focused on ―quick wins‖ (i.e.,
improving school facilities and increasing parental involvement), followed by a focus on professional
development, coaching, and increased teacher collaboration. The principal at General Grant Middle
School emphasized a process of continuous improvement of existing strategies that met the needs of
students (e.g., a focus on academic vocabulary) combined with other district-wide instructional efforts.
Finally, the principal at Sweetwater High School discussed a process entailing steady progress focused on
developing students‘ belief in their academic potential coupled with guidance and support from the
district. The stories of these three school are detailed in this section.
122nd Street Elementary School: Quick Wins Followed by Focus on Instruction and
Collaboration
122nd Street Elementary School, located in Los Angeles, is a diverse public elementary school serving
almost 700 students, predominantly Hispanic and African American, in kindergarten through fifth grade.
With a high-need student population—half of whom are ELs and a large majority of whom qualify for
free or reduced-price lunch—122nd Street has shown steady growth in student achievement over the
past six years. The school, which was in Year 2 of program improvement in 2004–05, has since been
recognized recently with multiple accolades, including being recognized as a California Distinguished
School in 2010 and receiving Title I Achieving School and California Business for Educational Excellence
awards in 2011.
The principal, Robin Benton, has led the improvement process at 122nd Street Elementary since taking
over as principal in 2005. After first focusing on initial efforts to visibly change the school, she turned to
specific steps to improve both instructional practices and the collaborative culture.
Quick Wins. The school‘s turnaround process began with a few visible improvements, or quick wins,
which created a more welcoming learning environment. As a new principal at 122nd Street in 2005, Ms.
Benton decided to jump-start the improvement process by first focusing on two issues: the school‘s
deteriorating facilities and the lack of parental involvement. At that time, the facilities were unsafe and in
need of repair and campus lighting was poor. Fixing the playground, the auditorium, and installing

Turnaround Schools in California: Who Are They and What Strategies Do They Use?
18
school-wide lighting, the principal explained, led to students taking more pride in their school, which
appeared to bolster attendance.
At the same, to increase engagement, the school invited parents to observe classrooms and arranged
informal meetings between the principal and parents. Ms. Benton said, ―The teachers were asked to
open their doors to allow parents to see what's going on in the classroom. I started having meetings,
both formal and informal, with the parents. … Sometimes parents just want to come and talk to you.
So I implemented procedures where parents could do that. … That in itself brought about major
change.‖ She reported that this strategy increased parent engagement and trust in the school‘s ability to
provide students with a successful education.
After tackling those issues, Ms. Benton turned her focus on the instructional programs and practices,
attributing her school‘s improved performance to three strategies:
Professional development focused on reading, mathematics, and gifted instruction
Hiring full-time instructional coaches in mathematics and reading to support teachers
Creating teacher collaboration opportunities centered around instruction
Professional Development. Ms. Benton decided that the school‘s professional development strategy
needed strong, common instructional approaches across all classrooms. She explained, ―We started
improving and revising how teachers were trained back in 2005. … The reason it came about was [that
although] many of the teachers were very talented, there were many varieties of instructional strategies
that I didn‘t see. As one solution, I required all teachers to be retrained in both math and ELA
[instruction].‖
Ms. Benton decided to initially focus on ELA professional development because ―that's the bridge
towards other success. … [Students] have to know how to read, comprehend, and write in order to
be successful in other content areas.‖ Therefore, all teachers were required to participate in trainings on
the Open Court curriculum, which consisted of a one-week intensive summer Reading First training
offered by the county, followed by trainings throughout the school year offered by the district. She also
reported that the school‘s paraprofessionals received literacy training and worked after school as
homework tutors. In addition, over the next three years, 30 percent of staff received instructional
training for teaching gifted students at the University of Southern California. According to Ms. Benton,
these professional development efforts improved the quality of instruction at the school.
Instructional Coaches. Full-time instructional coaches were available to provide assistance to all
teachers. These positions were designed to support teachers in all aspects of instruction, including
weekly meetings around lesson design and delivery, aligning instruction to California standards,
instructional modeling, classroom observations, and debriefing on lessons. The principal emphasized that
the coaches were a good fit for the school because they were approachable, believed in supporting the
teachers in different aspects of instruction, and were knowledgeable on literacy and mathematics
instruction.
The principal indicated that she thought this would lead to success because the teachers were talented,
dedicated, and needed encouragement to work on a different level, and ―that is exactly what happened.‖
The lesson-design training led by the coaches was held by grade level, on an as-needed basis, and
occurred up to three hours a week, often during weekly afterschool meetings funded by the district.
According to the principal, the implementation of the coaching model, which the district supported by
providing funding, positively impacted the school‘s performance.
Turnaround Schools in California: Who Are They and What Strategies Do They Use?
19
Teacher Collaboration. The principal cited the importance of opportunities for staff to collaborate
on instruction. Although Ms. Benton reported that there had been a collaborative culture in the past,
she said the culture shifted from personal relationships (e.g., discussions about personal vacations) to
collaboration focused on the best instructional strategies (e.g., discussions on successes and challenges).
She designated a coaching room; changed the daily schedule so that each grade level would take recess,
lunch, and physical education at the same time to ensure teachers could spend time together; and
rearranged classrooms to facilitate grade-level discussions and interactions. In addition to the
instructional coaches‘ classroom observations, teachers also observed each other, which further
facilitated teacher collaboration. According to the principal, these efforts resulted in a cohesive staff,
constantly working together on developing lessons and addressing instructional challenges.
Although the principal identified these changes in instructional practice as the crux of her school‘s
successful improvement efforts, she also noted other factors important to the school‘s success, including
an afterschool program, which allowed extended learning time for students who needed more support,
and teacher-created formative assessments, which were implemented twice a week for mathematics and
once a week for ELA.
Ms. Benton also noted that the school‘s progress has included challenges. Over the last three years, she
has had to lay off qualified teachers because of budget constraints, including 11 teachers, the majority of
whom she said were excellent instructors. Funding for the district tutoring program, the Urban Teacher
Planning Program, also was cut, which resulted in the termination of a targeted afterschool program.
These layoffs and cuts have lowered teacher morale, and the principal indicated the need to find new
ways to reignite enthusiasm and boost spirits.
General Grant Middle School: Continuous Improvement from Within Combined
with District-wide Efforts
General Grant Middle School, located in California‘s Central Valley, serves Grades 6–8 in the Kings
Canyon Joint Unified School District. In 2009–10, General Grant had approximately 550 students, a
majority of whom were eligible for free or reduced-price lunch and Hispanic, and approximately one
third of whom were ELs. The school made continuous progress in its student achievement over time by
focusing and fine-tuning strategies and initiatives that show results. Over the past seven years, from
2003–04 to 2009–10, General Grant increased its proficiency rates by about 40 percent in both
mathematics (from 19 percent to 61 percent) and ELA (from 22 percent to 59 percent).
The principal, Monica Benner, has been at the school since 1995, first as a teacher and then as an
assistant principal before becoming principal in 2008. She stated that her school has turned around
through continuous improvement of existing strategies that meet the needs of students. Specifically, the
principal cited the following four factors as most important to the success of General Grant:
Collaboration and teamwork of the staff within and across schools
Intensive focus for all students on academic vocabulary and independent reading
Extended learning time (extra instruction for students who do not meet standards)
Improvement of instruction through the creation of professional learning communities (PLCs)
focused on clear instructional strategies including English Language Development (ELD), Explicit
Direct Instruction (EDI), and Response to Intervention (RTI).

Turnaround Schools in California: Who Are They and What Strategies Do They Use?
20
Teacher Collaboration. Ms. Benner reported building improvement efforts on the belief that it ―takes
the whole team‖—teachers, support staff, and students—to improve a school, and that General Grant‘s
collaboration and teamwork set the foundation for its success by embracing school-wide modifications
of instructional strategies, continuously analyzing data, and sharing best practices. To allow for a
collaborative school culture, she described how in the 2004–05 school year the district instituted an
early dismissal every Wednesday, providing teachers with an explicit time and focus to analyze student
data, give and receive feedback with goal setting, review sample lessons, and discuss best instructional
practices.
Ms. Benner indicated that teachers share data with one another and participate in at least three peer
observations every trimester, and that she and her Learning Director also conduct routine walk-
throughs. In addition, all teachers (not just those working with ELs) administer the CELDT, so they see
this as an integral part of their responsibilities. Ms. Benner also described how her staff meet with
colleagues from other middle schools in the district once a month. At these meetings, they jointly
developed common formative assessments aligned to the standards, which now allows them to compare
results across schools using common measures as the basis for improving results.
Focus on Academic Vocabulary. The principal cited the focus on academic vocabulary and the use
of data as the basis for soliciting school-wide buy-in for continuous improvement efforts. About 10
years ago, upon noting the school‘s low ELA scores, General Grant introduced Accelerated Reader,
reading software for Grades K–12. Four years ago, the school added a focus on academic vocabulary,
grounded in a number of research frameworks (Robert Marzano‘s academic word list and Kate
Kinsella‘s instructional strategies). Now, all students participate in a common first period when all
teachers, including physical education teachers, teach 30 minutes of academic vocabulary, followed by 30
minutes of independent reading practice monitored by Accelerated Reader. The addition of academic
vocabulary produced positive results in the second and third years of implementation and, according to
Ms. Benner, has become a ―common ground for everyone‖ as the entire school is ―speaking the same
language.‖ The principal said that this strategy was ―good for kids, but better for teachers‖ because it
gave them a clear focus on academic vocabulary throughout all subjects. Teaching these classes has
produced a camaraderie among the staff as they began to work together to provide, practice, and refine
best teaching practices that are now utilized across the curriculum. According to Ms. Benner, the
combination of these instructional practices is where General Grant saw its best results.
Extended Learning Time. In addition to focusing on reading and academic vocabulary during the
school day, the school offers an extended day during certain periods of the year for students who are
not showing progress on the district‘s benchmark assessment. Starting in the 2009–10 school year, the
school used results from the district benchmark exam to determine which students should participate in
an additional hour of school for 12 days (three days a week for four weeks) in order to be re-taught one
or two standards. The school uses data to regroup and match the students to teachers based on the
teachers‘ strengths. Ms. Benner noted that this approach, which involves a majority of the school
(approximately 300 students each year), has improved student achievement and the teachers‘ delivery of
instructional material.
District-wide Efforts. Ms. Benner attributed a large part of the school‗s success to district-wide
efforts. With the district‘s focus on Great Instruction the First Time and Every Time (GIFT), she
reported how General Grant embedded the district‘s three instructional initiatives—ELD, EDI, and
RTI—into every classroom. With a push from the district office four years ago to have more unified
curriculum, textbooks, and instructional strategies, the school refocused its efforts with ELD and RTI
and added a focus on EDI within the past two years.

Turnaround Schools in California: Who Are They and What Strategies Do They Use?
21
The principal and her teachers participate in PLCs, which serve as an ―umbrella‖ to implement these
three instructional components where agenda development, goal-setting, and data analysis take place.
She described how, in one PLC meeting focused on ELD, staff broke down the CELDT data and
provided teachers with sentence frames to hang in their classrooms to reinforce the idea that all
students should speak in complete sentences. She said that many of the PLCs focus on EDI because of
the ―intense introspection and knowledge of curriculum needed to craft a quality EDI lesson,‖ but PLCs
also have allowed teachers to truly improve the delivery of their instruction and focus on student
engagement.
Although the staff experienced success with these strategies, not everything the school implemented has
been successful. Ms. Benner said that, for a long time, ―We‘d spin our wheels and work really hard …
but our focus was off target. There had to be a shift from teachers focusing on teaching to student
learning.‖ For instance, one year the school grouped all ELs at the Level 3 (out of five levels) on the
CELDT in one core ELA class but found that this process did not increase student achievement or
English proficiency and so reverted to a more integrated grouping strategy the following year. She also
reported that the school had experimented with an afterschool reading program that did not produce
strong results. The principal did not see improvements until after the daily academic vocabulary lesson
was introduced. The school also hired an external support provider to deliver extended-day
intervention classes, but after one year Ms. Benner concluded that the school staff ―need[ed] to be the
ones to work with [the] students to make a difference. … Outside groups don‘t know the needs of our
students as well as the teachers who see them every day. Our data indicated that our teachers working
with our students provided the highest gains in student achievement.‖
In short, she reported continuously fine-tuning existing strategies and examining data to determine what
had the biggest impact on student academic success, which has enabled students to exhibit continued
academic growth. As a result of these strategies—all clearly focused on classroom instruction and
grounded in data use—the school has created a ―no-excuses environment‖ where teachers take
responsibility for all students‘ success.
Sweetwater High School: Steady Progress with District Guidance and Support
Sweetwater High is a traditional public high school located in National City, a high-poverty
neighborhood in San Diego County. The school has approximately 2,450 students, the large majority of
whom are Hispanic and eligible for free or reduced-price lunch, and one third ELs. Sweetwater has
shown steady progress over the past seven years. Between 2003–04 and 2009–10, the high school
increased its proficiency rates from 34 percent to 55 percent in mathematics and from 32 percent to 46
percent in ELA.
Principal Roman Del Rosario had been at Sweetwater for only one year at the time of the interview but
had been a vice principal at another school in the district for three years, as well as a long-time resident
of the neighborhood. He strongly credited the prior principal, Wesley Braddock, as instrumental to the
school‘s turnaround. He also described the school as having had an extended period of growth, then
leveling off until he became principal and was able to help Sweetwater regain momentum. The
foundation for the school‘s progress was a keen focus on developing students‘ belief in their academic
potential as well as key guidance and support from the district. Beyond this, three main strategies were
cited as key:
Extended learning time through targeted academic interventions
Data used to determine appropriate interventions
Professional learning communities

Turnaround Schools in California: Who Are They and What Strategies Do They Use?
22
Extended Learning Time. According to Mr. Del Rosario, learning time, both in and outside of the
school day, was substantially increased through targeted interventions, such as afterschool, Saturday, and
support classes. Using data from quarterly benchmark and common assessments conducted throughout
the district, students are placed by level in different extended learning settings. The support classes
offered are typically in core areas—mathematics or ELA—working as a double-block period, so that
students receive ten as opposed to five hours of instruction per week. One fourth to one third of the
entire school typically attends Saturday classes, illustrating the culture shift toward students‘ caring more
about their academic progress. In addition, students scoring beneath a certain threshold are assigned
mandatory afterschool or Saturday tutoring.
Use of Data. A district-wide focus on data was described as key to the school‘s improvement.
A strong reliance on data, especially in the use of common assessments, was said to exist throughout
the school system. According to the principal, ―Being able to use data to be thoughtful in framing the
conversation about how we evaluate students … makes a big difference.‖ Mr. Del Rosario indicated that
using data for the purpose of student interventions is most important as it helps not only to determine
who needs help, but also how to properly serve them. The school also uses data to place students in
accelerated classes and all Sweetwater High teachers use the same data system (Data Director), which
allows the use of data to be thoroughly integrated into the school‘s overall instructional strategy.
Professional Learning Communities. The principal reported using a district-wide PLC model to
foster a collaborative environment where teachers work together to analyze key standards and
concepts, flesh out the crucial content and skills students need to learn, plan assessments and lessons,
and discuss how to best deliver instruction. According to the principal, the data use and extended
interventions are ―driven through the PLCs,‖ combining all of the components into a comprehensive
strategy. In addition, systems supporting collaboration through the use of peer coaching to build
interdependence were noted.
Role of the District. The district‘s strong role in Sweetwater‘s turnaround process was referenced
throughout the interview. According to the principal, ―The superintendent enabled us … to implement
systematic improvement and instruction.‖ Mr. Del Rosario reported that, with the district supports in
place, Sweetwater successfully established a culture of high expectations for students and implemented
other policies to target students who test at basic and below, such as parent conferences and student
performance contracts. The principal stated that the school makes the wrong decision very difficult for
students. ―If a student is not participating in our comprehensive program of support, it's going to be
difficult for them. They're going to be receiving a lot of negative reinforcements.‖ To achieve positive
results through student interventions, the principal described how Sweetwater has greatly limited
excuses from students for not getting extra support.
Although the principal has encountered a few challenges during his time at Sweetwater, he said he was
able to address them by ―continuing to move forward in the belief that all our students, when properly
prepared, can go directly to a four-year university.‖ For example, the principal had to institute a
common way to evaluate students because the variability in grading (Ds or Fs being given to students
who were scoring proficient or advanced on state assessments) led them to having low completion of A
to G requirements.17 This decision was grounded in ―the idea that when we focus on student learning,
students should receive better grades. And when they receive better grades, more of them will go to
17 A to G requirements refer to certified high school courses required for entrance to the University of California
and the California State University systems: four years of English; three years of mathematics; two years of science
and history/social science; and one year of foreign language, visual and performing arts, and college preparatory
electives.

Turnaround Schools in California: Who Are They and What Strategies Do They Use?
23
college.‖ The principal also made adjustments to teaching assignments so that the same teacher who
taught an English class also taught the English support class, saying that this gave the students the
greatest opportunity to succeed.
Sweetwater‘s turnaround process was characterized by a combination of district-level strategies and
supports, as well as school-level leadership and continued modifications of strategies. Targeting the goal
of 90 percent of students going to college, the school is working on creating a partnership with the
National City community, which will involve asking parents, local businesses, and city officials to support
this ambitious goal. With this partnership on the horizon, the academic-focused culture, and the district
systems in place, the principal said he is ―very confident that [Sweetwater High is] going to have massive
growth over the next five years.‖
Challenges Faced in the Turnaround Process
In addition to identifying schools‘ successful strategies, we asked the principals about the challenges they
had faced in the turnaround process. The following challenges were identified by at least three
principals:
Budget cuts (eight principals)
Negative perceptions of the school (five principals)
Lack of teacher buy-in to improvement efforts (four principals)
Staff who were not the right fit (four principals)
Budget Cuts. Budgetary issues were cited as a challenge across eight of the nine schools (apart from
General Grant Middle), which is consistent with the budget challenges for California schools. Having to
dismiss qualified teachers was reported as one of the toughest challenges by one principal (122nd Street
Elementary), especially because pink slips are handed out during CST testing ―when teachers should be
at their best‖ and ―it affects the overall school morale.‖ This principal said that she is ―constantly fighting
and trying to come up with ways to keep the teacher morale going‖ such as celebrating Teacher
Appreciation Week. This principal also mentioned that cutting funding for an afterschool program that
allowed the school to see the ―most gain in student achievement‖ was ―a big hit to the school site.‖
Although some principals cited ways they had found to cope with the fiscal crisis, others focused on it as
a main challenge. As Kerman High‘s principal stated, ―We are trying to maximize all of our scheduled
resources to meet the needs of our students and yet trying to stay within a budget that sometimes
seems to be somewhat unrealistic.‖
Negative Perceptions. Five principals (122nd Street Elementary, Del Rey Elementary, General Grant
Middle, Kerman High, and Sweetwater High) also reported a struggle to change the negative perceptions
of their schools. Low motivation for improvement existed among the staff, the students, and the
community because, according to principals, the focus was on blaming parents and students‘
disadvantaged backgrounds for students‘ low achievement. The principal of 122nd Street Elementary
described how the belief that ―kids can‘t learn‖ was common in her community, but that the school has
now ―proven [that] with consistency, systems in place, and a dedicated staff, it can happen.‖ According
to the principal of General Grant Middle, staff members was able to change the negative perception of
their school by focusing their attention on what they could control instead of focusing on the factors
beyond their control. ―We got away from blaming. We have to get to the point of, what can we do?
These are our kids. We have them for three to five years. What can we do to help them succeed?‖

Turnaround Schools in California: Who Are They and What Strategies Do They Use?
24
Lack of Teacher Buy-In. Four principals (Del Rey Elementary, Silver Wing Elementary, Prairie Vista
Middle, Sweetwater High) noted that they struggled with convincing teachers to fully adopt new
instructional strategies for improving their schools. The first years of implementing new strategies
seemed to be the toughest for these principals, with some teachers ―rebelling and angry.‖ But, as the
principal from Prairie Vista Middle stated, ―You start with a small group of early adopters and … over
time, there‘s been increased levels of adoption.‖ For the principal at Del Rey Elementary, the most
teacher buy-in occurred when teachers began to see ―kids responding and learning, and that it was
actually working."
Wrong Staff. Four principals (122nd Street Elementary, St. Hope PS7 Charter, General Grant Middle,
and Mountain View Middle) mentioned having staff who were not the right fit with their school as a
challenge. According to St. Hope PS7 Charter‘s principal, the school previously ―just did not hire the
right people … because it was not made a priority.‖ Through honest communication and evaluations,
General Grant Middle was able to replace ineffective staff, which ―allowed [the school] to hire and place
teachers in the right positions with the right skills, experience, and belief system to meet the needs of
our students.‖ Two principals described specific, proactive strategies in making sure that their school
hired the right staff. The principal of St. Hope PS7 Charter stated that teachers were released from the
school because they ―were not meeting expectations.‖ In addition, after two coaches ―didn‘t work‖ at
122nd Street Elementary, the principal described selecting someone more competent and appropriate
for the job.
In summary, we heard from at least five principals that the turnaround process at these schools included
challenges such as budget cuts and struggles to change the negative perceptions of their schools.
However, at least five principals also reported that focusing on improving instructional strategies for ELs
and other student subgroups; creating structures and cultures for teacher collaboration; and ensuring
strong instructional leadership helped to overcome these challenges and improve the overall
performance at their schools.
Advice to Other Schools and Districts
When asked what advice they would give to other schools attempting to turn around their
performance, all principals indicated the importance of being actively involved in the process. Four
principals (St. Hope PS7 Charter, General Grant Middle, Mountain View Middle, and Kerman High)
stressed the importance of creating a positive school culture by empowering teachers to be
instructional leaders. Two others (Del Rey Elementary and Silver Wing Elementary) advised principals to
enter the classroom on a regular basis. As one recommended, ―Make it known that you are going to be
coming into the classroom on a daily basis. Students should not be surprised when they see you in the
classroom.‖
Three principals (Del Rey Elementary, General Grant Middle, and Sweetwater High) also described the
need to make adjustments to strategies to fit their students‘ needs. The principal at Del Rey Elementary
described trying to implement a standards-based curriculum for about a month but found that students
needed specific interventions so the school went back to its RTI strategies. The principal at Sweetwater
High found that making the adjustment so that students‘ core English and support classes are taught by
the same teacher worked better for them. It took experimenting with a few different ELA instructional
strategies for General Grant Middle to reach its best results, according to the principal.
Many of the principals acknowledged that school improvement does not occur overnight and that a clear
focus, determination, and strategy are needed in order to achieve and sustain growth. While stressing
that turning around a school takes time, the principal of General Grant Middle indicated that the

Turnaround Schools in California: Who Are They and What Strategies Do They Use?
25
improvements occur by using data to modify approaches, explaining ―There‘s no magic bullet. It‘s not
going to happen overnight. You need to make informed decisions based on your data and take small
chunks through continuous fine-tuning.‖
Another principal (122nd Street Elementary) emphasized that principals should focus on one specific
aspect of the school to jump-start the improvement process. She explained, ―You can look at
operations; you can look at school safety; you can look at facilities; you can look at classroom
instruction. Decide to focus one thing at a time, and [be] an active part in whatever it is that you decide
to focus on.‖ The principal of St. Hope PS7 Charter also alluded to the fact that you cannot focus your
attention on everything, indicating that principals should learn about successful strategies from principals
at high-performing schools and then prioritize the approach they consider to have the most leverage.
Regarding advice to district administrators, two principals (Silver Wing Elementary and Mountain View
Middle) mentioned that district leaders should participate in classroom observations in order to
understand the needs of the site. Finally, two principals (Del Rey Elementary and Sweetwater High)
advised districts to leverage research-based practices and hone a particular focus.
Implications for Policy and Practice
Federal and state accountability systems have focused mainly on what constitutes low performance or
failure rather than on what school turnaround or success entails. For example, SIGs are given to the
lowest 5 percent of schools but do not specify when schools have been successful or have turned
around. Federal and state governments should now consider what constitutes realistic yet rigorous goals
that these schools should meet to demonstrate success. To assist with this process, this study specified
a set of criteria for defining both low performance and turnaround for schools in California. We found
few examples of schools that had made dramatic improvement.18 Rather, we found that over seven
years, a small number of schools had been able to make steady progress from the bottom third to the
middle third of schools in the state. These findings are important to consider as federal and state
governments determine what the most struggling schools can and should be expected to do to turn
around.
To create more consistency in the field, federal and state governments should consider clearly defining
what turnaround entails in terms of low performance, growth in performance, turnaround timeframe,
subgroup performance, and sustainability of performance. This would facilitate research and policy
discussions regarding turnaround. It is difficult to have a meaningful discussion or to conduct research
about the important concept of turning around low-performing schools without greater clarity about
what this means in practice.
Clearer criteria for identifying turnaround schools also can inform current policy discussions at the
federal and state levels regarding the appropriate intervention models to improve persistently struggling
schools. Indeed, the examples of school turnaround in this report do not match up well with the
elements of current federal intervention models for school turnaround. For instance, the schools
profiled here do not provide evidence of large numbers of teaching staff or school leaders being
replaced, which is a major emphasis of the current federal intervention models in the SIG and Race to
the Top initiatives. Rather, a majority of the principals interviewed for the study emphasized working
with existing staff to improve their performance through teacher collaboration, analysis of data, and use
of targeted instructional strategies. About one half of the principals also reported on the importance of
18 Although state data show some schools rising ―dramatically‖ during this period, after ―filters‖ for such factors as
substantial changes in student demographics were employed, these schools failed to meet the full set of turnaround
criteria developed for these analyses.
Turnaround Schools in California: Who Are They and What Strategies Do They Use?
26
the guidance and support provided by their respective districts, an element that the four federal
intervention models generally do not address.
Lessons learned from turnaround schools such as the ones contained in this report are only one aspect
that can contribute to the field‘s knowledge on this important focus on the needs of our most struggling
schools. Much work is still needed in this area that this report cannot address, such as understanding
further why some schools sustain their turnaround efforts over time and others do not.
Currently, however, with examples of successful turnaround identified, districts, states, and the federal
government could adopt more explicit roles of brokering the knowledge and expertise for peer-to-peer
learning from practitioners who have experienced success in these improvement efforts. These on–the-
ground experts can speak more directly to others still facing the important task of improving learning
for students in low-performing schools. Some of the principals interviewed for this study reported that
they had engaged in knowledge sharing (both inside and outside their districts) to learn about policies
and practices identified as effective from successful turnaround sites. For instance, the California
Department of Education may consider setting up structures for sharing school improvement strategies
across schools and districts.19
19 For approaches to facilitate and implement school visitations between lower and higher performing schools, see
Huberman et al. (2011).

Turnaround Schools in California: Who Are They and What Strategies Do They Use?
27
References
Aladjem, D. K., Birman, B. F., Orland, M., Harr-Robins, J., Heredia, A., Parrish, T. B., & Ruffini, S. J.
(2010). Achieving dramatic school improvement: An exploratory study. Washington, DC: U.S.
Department of Education, Office of Planning, Evaluation and Policy Development, Policy and
Program Studies Service. Retrieved November 27, 2011, from
http://www.wested.org/online_pubs/dramatic-improvement-report.pdf
Baroody, K. (2011). Turning around the nation’s lowest-performing school: Five steps districts can take to
improve their chances of success. Washington, DC: Center for American Progress. Retrieved
November 27, 2011, from http://www.americanprogress.org/issues/2011/02/pdf/five_steps.pdf
Calkins, A., Guenther, W., Belfiore, B., & Lash, D. (2007). The turnaround challenge: Why American’s best
opportunity to dramatically improve student achievement lies in our worst-performing schools. Boston,
MA: Mass Insight Education & Research Institute. Retrieved November 27, 2011, from
http://www.massinsight.org/publications/turnaround/51/file/1/pubs/2010/04/15/TheTurnaroundC
hallenge_MainReport.pdf
Education Trust. (2005). Gaining traction, gaining ground: How some high schools accelerate learning for
struggling students. Washington, DC: Author. Retrieved November 27, 2010, from
http://www.edtrust.org/sites/edtrust.org/files/publications/files/GainingTractionGainingGround.pd
f
Hansen, M., & Choi, K. (2011). Chronically low-performing schools and turnaround: Findings in three states.
(CALDER Working Paper #60). Retrieved November 27, 2011, from
http://www.caldercenter.org/publications.cfm
Herman, R., Dawson, P., Dee, T., Greene, J., Maynard, R., & Redding, S. (2008). Turning around
chronically low-performing schools: A practice guide (NCEE No. 2008-4020). Washington, DC:
National Center for Education Evaluation and Regional Assistance, Institute of Education
Sciences, U. S. Department of Education. Retrieved November 27, 2011, from
http://ies.ed.gov/ncee/wwc/pdf/practice_guides/Turnaround_pg_04181.pdf
Huberman, M., Fabel, P., Arellanes, M., & Parrish, P. (2011). School visitations in four California counties:
Experiences and lessons learned from year two. Sacramento, CA: California Comprehensive Center at
WestEd.
Knudson, J., Shambaugh, L., & O‘Day, J. (2011). Beyond the school: Exploring a systemic approach to school
turnaround (Policy and Practice Brief). San Mateo, CA: California Collaborative on District Reform.
Retrieved November 28, 2011, from
http://www.cacollaborative.org/Portals/0/CA_Collaborative_School_Turnaround.pdf
Kutash, J., Nico, E., Gorin, E., Rahmatullah, S., & Tallant, K. (2010a). The school turnaround field guide. San
Francisco: FSG Social Impact Advisors. Retrieved November 27, 2011, from
http://www.wallacefoundation.org/knowledge-center/school-leadership/district-policy-and-
practice/Documents/The-School-Turnaround-Field-Guide.pdf

Turnaround Schools in California: Who Are They and What Strategies Do They Use?
28
Kutash, J., Nico, E., Gorin, E., Tallant, K., & Rahmatullah, S. (2010b). School turnaround: A brief overview of
the landscape and key issues. San Francisco: FSG Social Impact Advisors. Retrieved September 27,
2011, from http://www.galeaders.org/site/documents/education_turnaround_brief.pdf
Rhim, L. M., Kowal, J. M., Hassel, B. C., & Hassel, E. A. (with Crittenden, S.). (2007). School turnarounds: A
review of the cross-sector evidence on dramatic organizational improvement (Report prepared for the
Center on Innovation & Improvement). Chapel Hill, NC: Public Impact, Academic Development
Institute. Retrieved November 27, 2011, from
http://www.centerii.org/survey/downloads/Turnarounds-Color.pdf
Stuit, D. (2010). Are bad schools immortal? The scarcity of turnarounds and shutdowns in both charter
and district sectors. Washington, DC: Thomas B. Fordham Institute. Retrieved [Registration
required] November 27, 2011, from http://www.edexcellence.net/publications-
issues/publications/are-bad-schools-immortal.html
U.S. Department of Education. (2010). A blueprint for reform: The reauthorization of the Elementary and
Secondary Education Act. Washington, DC: Author. Retrieved November 27, 2011, from
http://www2.ed.gov/policy/elsec/leg/blueprint/blueprint.pdf

Turnaround Schools in California: Who Are They and What Strategies Do They Use?
29
Appendix A: English Language Arts and Mathematics Proficiency Rates
Exhibit A1: English Language Arts Proficiency Rates for Selected Turnaround Schools,
Year 1 (2003–04) to Year 7 (2009–10)
Source: California Department of Education: Evaluation, Research, and Analysis Office

Turnaround Schools in California: Who Are They and What Strategies Do They Use?
30
Exhibit A2: Mathematics Proficiency Rates for Selected Turnaround Schools, Year 1 (2003–
04) to Year 7 (2009–10)
Source: California Department of Education: Evaluation, Research, and Analysis Office