Embed Size (px)
Citation preview
Plainville, MA
Turtle Brook Culvert at Shepard St In Turnpike Lake
June 2021
CULVERT EVALUATION REPORT

Turtle Brook Culvert at Shepard St Plainville, MA
In Turnpike Lake
CULVERT EVALUATION REPORT Prepared by: BETA GROUP, INC. Prepared for: Town of Plainville June 2021

Turtle Brook Culvert at Shepard St Culvert Evaluation Report
Plainville, MA
i
TABLE OF CONTENTS 1.0 Project Locus.................................................................................................................................. 1
2.0 Objective of Report ........................................................................................................................ 2
3.0 Calculation Methods and Assumptions........................................................................................... 2
4.0 Project Area Location and Culvert Description................................................................................ 2
5.0 Culvert Condition ........................................................................................................................... 2
6.0 Data Collection .............................................................................................................................. 3
7.0 HydroCAD Model – Verify Capacity Estimating Lake Storage .......................................................... 4
8.0 Conclusions and Recommendations ............................................................................................... 4
8.1. Structure .................................................................................................................................. 4
8.2. Flood Impacts........................................................................................................................... 4
8.3. Cost Estimate ........................................................................................................................... 4
LIST OF TABLES Table 6-1: Data Sources ........................................................................................................................... 3
Table 6-2: Hydrologic Data ...................................................................................................................... 3
LIST OF FIGURES Figure 1-1: Project Locus – USGS ............................................................................................................. 1
LIST OF APPENDICES Appendix A – Structures Inspection Field Report Appendix B – Photo Survey Appendix C – StreamStats Data Appendix D – FEMA and FIS Study DATA Appendix E – Hydrologic Data/Climate Change Adjustment Appendix F – HydroCAD Calculations Appendix G – Order of Magnitude Construction Costs


Turtle Brook Culvert at Shepard St Culvert Evaluation Report
Plainville, MA
1
1.0 PROJECT LOCUS
Figure 1-1: Project Locus – USGS

2
2.0 OBJECTIVE OF REPORT
This report is provided to document the existing condition, capacity and vulnerable of this culvert to
climate change. It is meant to evaluate potential issues such structural stability and flooding issues
associated with higher current rainfall depths. This information will be utilized to prioritize capital
improvement projects for the protection of public infrastructure, roadway and utilities, potentially
improve the environment and connectivity of the stream.
The culvert was analyzed for the 10- and 100-year storm events for capacity and flooding purposes.
3.0 CALCULATION METHODS AND ASSUMPTIONS
The hydrologic and hydraulic flow calculations were completed stormwater runoff is analyzed using the following:
• Flood Insurance Study revised June 9, 2014
• Flood Insurance Rate Map Norfolk County. Massachusetts 25021C0339F effective July 16, 2015
provided by Federal Emergency Management Agency
• Culvert information was obtained via a field observation completed in May 2021.
• StreamStats flows data (workspace ID: MA20210504144106929000) (see Appendix C):
• HydroCAD 10.00 to verify capacity based on storage in the upper and middle Turnpike Lake
• Technical Paper No. 40 (TP-40) Rainfall Frequency Atlas of the United States
• NOAA Atlas 14 Point Precipitation Frequency Estimates
4.0 PROJECT AREA LOCATION AND CULVERT DESCRIPTION
Turtle Brook flows into the north end of and through Turnpike Lake which is bisected by Washington
Street and Shepard Street.
The culvert system at Shepard Street consists of two corrugated metal pipes (CMPs) with a stone headwall on either side. The west CMP is 2’-6” in diameter and the east CMP is 2’-0” in diameter. The north headwall is approximately 19’-9” long and 1’-9” high. The south headwall is approximately 21’-0” long and 2’-10” high. The south headwall continues on to a masonry wall on the southeast side. The direction of flow is north to south and the depth of flow varies.
The roadway width over the structure is 19’-8” with a 6’-0” shoulder to the headwall on the north side and a 6’-4” shoulder to the headwall on the south side. There is a speed bump located on the west approach.
There are overhead wires on the south side. There is no guardrail present over the culvert or at either approach.
5.0 CULVERT CONDITION
The overall condition of the structure is fair with a few deficiencies noted. The condition of the CMPs were good, with no deficiencies noted. Both headwalls have some areas of hairline cracks and loose/missing mortar. The north headwall is displaced up to 5” and has several cracks (See Photos 5 and 6). The south headwall is also displaced about 6” and has several cracks (See Photos 12 and 13). The south headwall was found to have undermining of at least 6” in depth. The south headwall continues to a stone masonry wall to the southeast. This southeast wall has heavy vegetation and is displaced (Photo 14). There appears

Turtle Brook Culvert at Shepard St Culvert Evaluation Report
Plainville, MA
3
to be a scour hole present just outside the south entrance to the CMPs. The flow elevation rapidly drops off at this location, approximately 18” out from the CMPs.
The roadway over the culvert and at each approach is in good condition. There is an area of heavy ponding on the north side of the east approach (Photo 16). There is a newly installed speed bump on the west approach (Photo 15).
6.0 DATA COLLECTION
The following are the data sources and hydrologic data use for this evaluation
Table 6-1: Data Sources
Data Type Source Details
Culvert Data BETA Group, Inc. (2021) Field Measurements
Structural Evaluation BETA Group, Inc. (2021)
Project Locus USGS
Aerial Mapping Google Earth (2020)
Flood Data Flood Insurance Rate Map (FIRM) Zone AE –elevation 199
Community Panel No. 25021C 0339F
Stream Profile FEMA – FIS Norfolk County, MA Turtle Brook Flood Profile 228P
StreamStats Report USGS (2020) Workspace ID: MA20210504144106929000
Table 6-2: Hydrologic Data
Hydraulic Design Data Flood of Record
Drain Area 4.28 sq. mi. Discharge Unknown
Bank Full Width Frequency Unknown
Design Flood Discharge 165 cfs* Maximum Elevation Unknown
Design Flood Frequency 10-year Date March 1968
Base (100-year) Flood Data*
Base Flood Discharge* 334 cfs* Base Flood Elevation 199 (NGVD)
*Adjusted for Climate Change – See Appendix E

4
7.0 HYDROCAD MODEL – VERIFY CAPACITY ESTIMATING LAKE STORAGE
A basic HydroCAD model was developed using rainfall data from, watershed area from StreamStats data,with estimated surface condition (CN) and time of concentration chosen to approximate the estimatedflows from StreamStats data for the 10 year storm event. The lake area was approximated using thesurface area provided by MassGIS (Oliver) and the measurements of the culvert from the fieldobservations. Note elevations are on an assume datum.
The results indicate that the culverts are adequate to accommodate the 10-year storm event. Thedifference between the peak elevation for the lake and the roadway elevation is 0.6± feet.
8.0 CONCLUSIONS AND RECOMMENDATIONS
8.1.STRUCTURE
The overall condition of the CMPs is good, and the headwalls are fair condition. Based on recent inspectionfindings, BETA recommends that the following items be addressed:
Address undermining and fill in scour void on the south side with rip rap. This should beconsidered a High Priority to protect against future deterioration.
Rebuild stone masonry walls to avoid washout and protect roadway surface.
Clear vegetation around masonry walls.
Inspections should be conducted at intervals not exceeding 12 months to monitor overall culvertconditions.
8.2.FLOOD IMPACTS
The existing culverts can convey the design storm flow without over topping the road. Any replacement ofthis structure should consider providing a culvert that meets the Massachusetts Stream Crossing Standards toprovide better connectivity for aquatic species.
The road will continue to flood during the 100-year storm event unless the downstream outlets to the lakeare improved.
8.3.COST ESTIMATE
BUDGETARY COST ESTIMATE
Repairs
Construction: $32,000
Engineering: $8,000
Total: $40,000

APPENDIX AStructures Inspection Field Report

Bridge/Culvert Inspection ChecklistTown of Plainville, Massachusetts
Shepard Street Turnpike LakeGeneral:Street Name: Waterway: Culvert ID:
Peter Kotowski Senior Structural EngineerInspectors:Name: Position:
Brandon Nelson Staff EngineerName: Position:
None NoneName: Position:
Inspection Conditions:5/12/2021 Sunny/Partly CloudyDate: Weather: 54°FTemp:
General Information:(2) Corrugated Metal Pipes UnknownBridge Type: Construction Date:
2'-6" & 2'-0" Diameter PipesHydraulic Opening Height (Feet):
2'-6" & 2'-0" Diameter PipesHydraulic Opening Width/Span Length (Feet):
4.25Out-To-Out Length (Feet):
Varies 6" (Min.) - 11Depth of Fill Over Culvert Inches:
1.25'Depth of Flow During Inspection: SouthDirection of Flow:
Overhead Wires, WaterUtilities Carried By Structure:
NADrainage Structures:
Fill Scour Voids at South opening; Rebuild Stone Masonry Headwalls; Clear Overgrown VegetationRecommendations:
Abutments/Culvert Sidewalls:Wall is displaced approx. 5"-18"; 1.5" wide crack over pipe; 1/4" wide crack @ eastern endNorth Sidewall:
6" undermining of headwall; 6" leteral displacementSouth Sidewall:
NACenter Pier:
NAChannel Walls:
6Abutment North Sidewall Rating: 6Abutment South Sidewall Rating:
NACenter Pier Rating: NAChannel Wall Rating:
Superstructure/Culvert Roof:NACondition Notes:
NARating:
Culvert Floor/ChannelApprox. 3.7' of Scour noted at downstrScour:
No debris notedFloor/Channel Notes:
NADebris: 5Floor/Channel Rating:
6/21/2021

Bridge/Culvert Inspection ChecklistTown of Plainville, Massachusetts
Training/Wingwalls:HeadwallNorth East Wall: Masonry BrickNorth West Wall Type: 6North West Wall Rating:
Areas of loose/missing stonesNorth East Wall:
NANorth West Wall: NANorth West Wall Type: NANorth West Wall Rating:
NANorth West Wall:
WingwallSouth East Wall: Stone MasonrySouth East Wall Type: 6South East Wall Rating:
Areas of loose/missing stonesSouth East Wall:
WingwallSouth West Wall: Stone/MasonrySouth West Wall Type: 6South West Wall Rating:
Areas of loose/missing stonesSouth West Wall:
See Sidewall NotesHead Wall: See Sidewall NoteHead Wall Type: Head Wall Rating:See Sidewall NotesHead Wall Notes:
Roadway Condition:
NANorth Roadway Approach Condition:
NANorth Roadway Approach Settlement:
NANorth Roadway Approach Alignement:
NANorth Roadway (Feet):
NANorth Roadway Rating:
NASouth Roadway Approach Condition:
NASouth Roadway Approach Settlement:
NASouth Roadway Approach Alignement:
NASouth Roadway (Feet):
NASouth Roadway Rating:
Water ponding; Minor crackingEast Roadway Approach Condition:
Hole forming N. side of roadEast Roadway Approach Settlement:
Slight horiz. CurveEast Roadway Approach Alignement:
19.67'East Roadway (Feet):
6East Roadway Rating:
Minor cracking; Speed bump installedWest Roadway Approach Condition:
NAWest Roadway Approach Settlement:
StraightWest Roadway Approach Alignement:
19.67'West Roadway (Feet):
6West Roadway Rating:
Safety BarrierNo guardrail or barrier presentBridge Rail Type:
NA - No barrier presentBridge Rail Condition:
NABridge Rail Rating:
NA - No approach safety rail/barrierApproach Rail Notes:
Culvert/Bridge Roadway Condition:
Culvert/Bridge Roadway Settlement:
Culvert/Bridge Roadway Alignment:
Minor cracking
NA
Straight
Culvert/Roadway (Feet):
Culvert/Roadway Rating:
19.67'
6
6/21/2021


2
APPENDIX BPhoto Survey

Turtle Brook Culvert at Shepard St Photo Survey
Plainville, MA June 2021
Photo 1 Looking Northwest: North Side of CMPs
Photo 2 Looking North: Turnpike Lake

Turtle Brook Culvert at Shepard St Photo Survey
Plainville, MA June 2021
Photo 3 North Side of CMPs
Photo 4 Looking Southwest: Northwest Portion of Headwall

Turtle Brook Culvert at Shepard St Photo Survey
Plainville, MA June 2021
Photo 5 Looking South: North Headwall at CMPs
Photo 6 Looking Southeast: Southeast Portion of Headwall

Turtle Brook Culvert at Shepard St Photo Survey
Plainville, MA June 2021
Photo 7 Looking Southwest: South side of CMPs
Photo 8 Looking South: Turnpike Lake

Turtle Brook Culvert at Shepard St Photo Survey
Plainville, MA June 2021
Photo 9 South Side of CMPs
Photo 10 Looking Southeast: Southwest Headwall Corner

Turtle Brook Culvert at Shepard St Photo Survey
Plainville, MA June 2021
Photo 11 Looking Northwest: Southwest Portion of Headwall
Photo 12 Looking North: South Headwall at CMPs

Turtle Brook Culvert at Shepard St Photo Survey
Plainville, MA June 2021
Photo 13 Looking Northeast: Northeast Portion of Headwall
Photo 14 Looking East: Southeast Masonry Wall

Turtle Brook Culvert at Shepard St Photo Survey
Plainville, MA June 2021
Photo 15 Looking East: West Approach
Photo 16 Looking West: East Approach

APPENDIX CStreamStats Data

5/4/2021 StreamStats
https://streamstats.usgs.gov/ss/ 1/3
Shepard St Culvert - StreamStats Report
Basin Characteristics
ParameterCode Parameter Description Value Unit
DRNAREA Area that drains to a point on a stream 1.91 squaremiles
ELEV Mean Basin Elevation 272 feet
LC06STOR Percentage of water bodies and wetlands determined fromthe NLCD 2006
10.34 percent
BSLDEM10M Mean basin slope computed from 10 m DEM 5.926 percent
Region ID: MAWorkspace ID: MA20210504144106929000Clicked Point (Latitude, Longitude): 42.01974, -71.31378Time: 2021-05-04 10:41:28 -0400

5/4/2021 StreamStats
https://streamstats.usgs.gov/ss/ 2/3
Peak-Flow Statistics Parameters [Peak Statewide 2016 5156]
ParameterCode Parameter Name Value Units
MinLimit
MaxLimit
DRNAREA Drainage Area 1.91 squaremiles
0.16 512
ELEV Mean Basin Elevation 272 feet 80.6 1948
LC06STOR Percent Storage fromNLCD2006
10.34 percent 0 32.3
Peak-Flow Statistics Flow Report [Peak Statewide 2016 5156]
PIl: Prediction Interval-Lower, PIu: Prediction Interval-Upper, SEp: Standard Error ofPrediction, SE: Standard Error (other -- see report)
Statistic Value Unit PIl PIu SEp
50-percent AEP flood 61.3 ft^3/s 31.3 120 42.3
20-percent AEP flood 102 ft^3/s 51.3 203 43.4
10-percent AEP flood 135 ft^3/s 66.3 275 44.7
4-percent AEP flood 182 ft^3/s 86.4 383 47.1
2-percent AEP flood 221 ft^3/s 102 481 49.4
1-percent AEP flood 263 ft^3/s 117 590 51.8
0.5-percent AEP flood 308 ft^3/s 133 712 54.1
0.2-percent AEP flood 373 ft^3/s 154 904 57.6
Peak-Flow Statistics Citations
Zarriello, P.J.,2017, Magnitude of flood flows at selected annual exceedance probabilitiesfor streams in Massachusetts: U.S. Geological Survey Scientific Investigations Report2016–5156, 99 p. (https://dx.doi.org/10.3133/sir20165156)
Bankfull Statistics Parameters [Bankfull Statewide SIR2013 5155]
ParameterCode Parameter Name Value Units
MinLimit
MaxLimit
DRNAREA Drainage Area 1.91 squaremiles
0.6 329
BSLDEM10M Mean Basin Slope from 10mDEM
5.926 percent 2.2 23.9
5/4/2021 StreamStats
https://streamstats.usgs.gov/ss/ 3/3
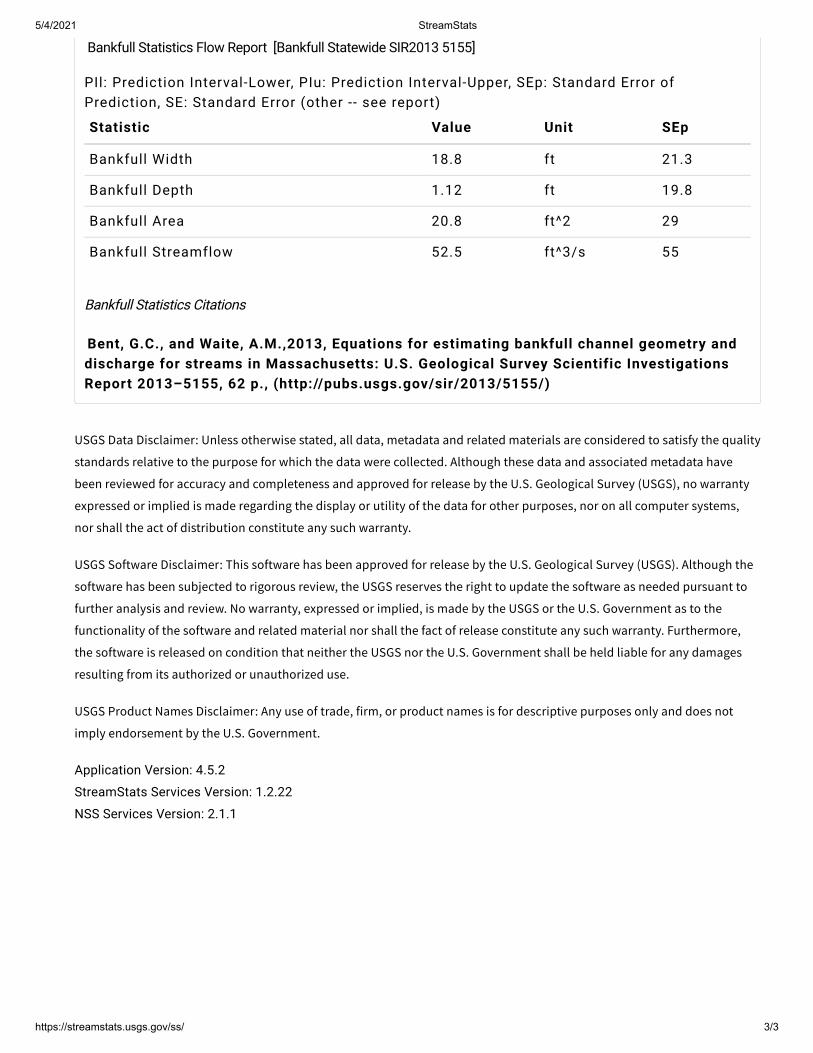
Bankfull Statistics Flow Report [Bankfull Statewide SIR2013 5155]
PIl: Prediction Interval-Lower, PIu: Prediction Interval-Upper, SEp: Standard Error ofPrediction, SE: Standard Error (other -- see report)
Statistic Value Unit SEp
Bankfull Width 18.8 ft 21.3
Bankfull Depth 1.12 ft 19.8
Bankfull Area 20.8 ft^2 29
Bankfull Streamflow 52.5 ft^3/s 55
Bankfull Statistics Citations
Bent, G.C., and Waite, A.M.,2013, Equations for estimating bankfull channel geometry anddischarge for streams in Massachusetts: U.S. Geological Survey Scientific InvestigationsReport 2013–5155, 62 p., (http://pubs.usgs.gov/sir/2013/5155/)
USGS Data Disclaimer: Unless otherwise stated, all data, metadata and related materials are considered to satisfy the quality
standards relative to the purpose for which the data were collected. Although these data and associated metadata have
been reviewed for accuracy and completeness and approved for release by the U.S. Geological Survey (USGS), no warranty
expressed or implied is made regarding the display or utility of the data for other purposes, nor on all computer systems,
nor shall the act of distribution constitute any such warranty.
USGS Software Disclaimer: This software has been approved for release by the U.S. Geological Survey (USGS). Although the
software has been subjected to rigorous review, the USGS reserves the right to update the software as needed pursuant to
further analysis and review. No warranty, expressed or implied, is made by the USGS or the U.S. Government as to the
functionality of the software and related material nor shall the fact of release constitute any such warranty. Furthermore,
the software is released on condition that neither the USGS nor the U.S. Government shall be held liable for any damages
resulting from its authorized or unauthorized use.
USGS Product Names Disclaimer: Any use of trade, firm, or product names is for descriptive purposes only and does not
imply endorsement by the U.S. Government.
Application Version: 4.5.2
StreamStats Services Version: 1.2.22
NSS Services Version: 2.1.1

APPENDIX DFEMA and FIS Study Information

FEMA FLOOD INSURANCE STUDY (FIS) INFORMATION

National Flood Hazard Layer FIRMette
0 500 1,000 1,500 2,000250Feet
Ü
SEE FIS REPORT FOR DETAILED LEGEND AND INDEX MAP FOR FIRM PANEL LAYOUT
SPECIAL FLOODHAZARD AREAS
Without Base Flood Elevation (BFE)Zone A, V, A99
With BFE or DepthZone AE, AO, AH, VE, AR
Regulatory Floodway
0.2% Annual Chance Flood Hazard, Areasof 1% annual chance flood with averagedepth less than one foot or with drainageareas of less than one square mileZone X
Future Conditions 1% AnnualChance Flood HazardZone X
Area with Reduced Flood Risk due toLevee. See Notes.Zone X
Area with Flood Risk due to LeveeZone D
NO SCREENArea of Minimal Flood HazardZone X
Area of Undetermined Flood HazardZone D
Channel, Culvert, or Storm Sewer
Levee, Dike, or Floodwall
Cross Sections with 1% Annual Chance17.5 Water Surface Elevation
Coastal Transect
Coastal Transect BaselineProfile BaselineHydrographic Feature
Base Flood Elevation Line (BFE)
Effective LOMRs
Limit of StudyJurisdiction Boundary
Digital Data Available
No Digital Data Available
Unmapped
This map complies with FEMA's standards for the use ofdigital flood maps if it is not void as described below.The basemap shown complies with FEMA's basemapaccuracy standards
The flood hazard information is derived directly from theauthoritative NFHL web services provided by FEMA. This mapwas exported on 5/4/2021 at 11:27 AM and does notreflect changes or amendments subsequent to this date andtime. The NFHL and effective information may change orbecome superseded by new data over time.
This map image is void if the one or more of the following mapelements do not appear: basemap imagery, flood zone labels,legend, scale bar, map creation date, community identifiers,FIRM panel number, and FIRM effective date. Map images forunmapped and unmodernized areas cannot be used forregulatory purposes.
Legend
OTHER AREAS OFFLOOD HAZARD
OTHER AREAS
GENERALSTRUCTURES
OTHERFEATURES
MAP PANELS
8
B20.2
The pin displayed on the map is an approximatepoint selected by the user and does not representan authoritative property location.
1:6,000
71°19'1"W 42°1'26"N
71°18'24"W 42°0'59"N
Basemap: USGS National Map: Orthoimagery: Data refreshed October, 2020


2
APPENDIX EHydrologic Data/Climate Change Adjustment

Turtle Brook Culvert at Shepard St Culvert Evaluation ReportPlainville, MA
3
Hydrologic Data
StreamStats flows data (workspace ID: MA20210504144106929000) will be used to evaluate the culvert whichare listed as follows:
10 Yr = 165 cfs 25 Yr. = 182 cfs 50 Yr = 221 cfs 100 Yr = 263 cfs
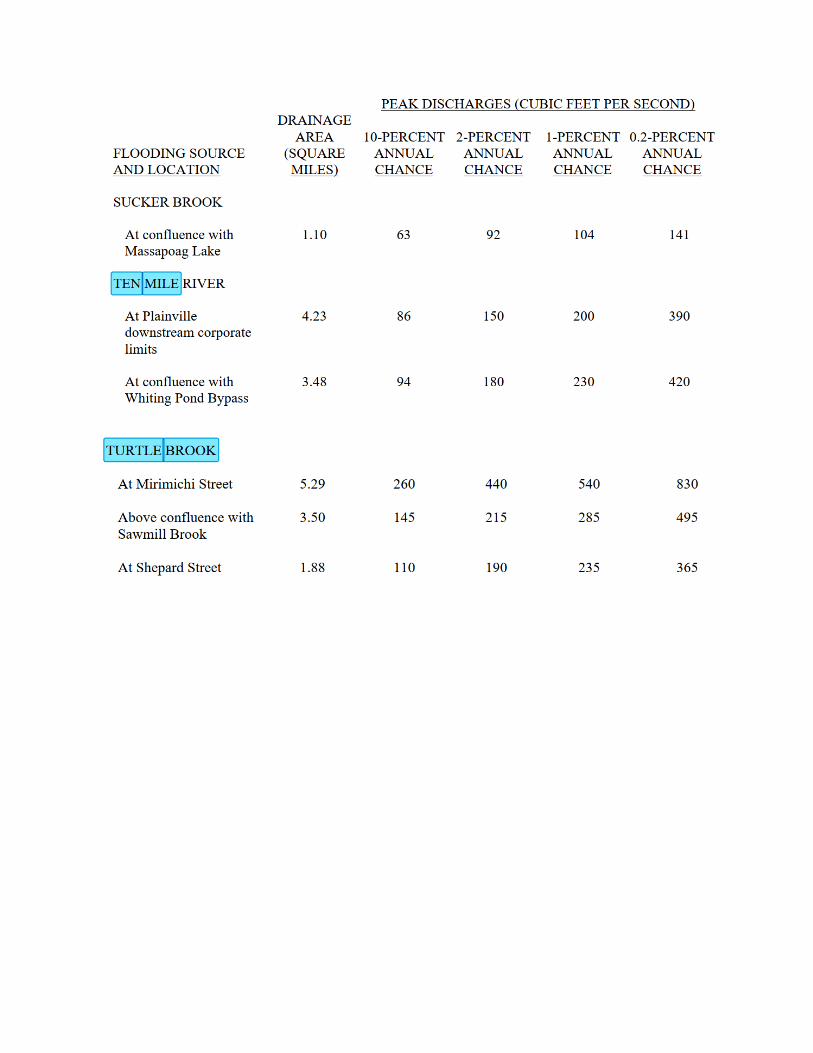
FEMA FIS Study also lists the flows at this site as follows:
10 Yr = 110 cfs 50 Yr = 190 cfs 100 Yr = 235 cfs
Climate Change Adjustment
To adjust for climate change, BETA incorporated an adjustment of the StreamStats peak flow data usingcurrent (NOAA Atlas 14) rainfall data compared to the outdated TP-40 data.

Hydrology Handbook for Conservation Commissioners March 2002 F-3

F-4 Hydrology Handbook for Conservation Commissioners March 2002

Hydrology Handbook for Conservation Commissioners March 2002 F-5

4

APPENDIX FHydroCAD Calculations

1S
Turtle Brook Watershed
3R
Turnpile Lake South
2P
Upper & Middle Turnpike Lake
Routing Diagram for Turnpike LakePrepared by BETA Group, Printed 6/21/2021
HydroCAD® 10.00-26 s/n 10406 © 2020 HydroCAD Software Solutions LLC
Subcat Reach Pond Link

Type III 24-hr 10 Year Rainfall=5.20"Turnpike Lake Printed 6/21/2021Prepared by BETA Group
Page 2HydroCAD® 10.00-26 s/n 10406 © 2020 HydroCAD Software Solutions LLC
Time span=5.00-24.00 hrs, dt=0.05 hrs, 381 pointsRunoff by SCS TR-20 method, UH=SCS, Weighted-CN
Reach routing by Stor-Ind+Trans method - Pond routing by Stor-Ind method
Runoff Area=1,222.000 ac 0.00% Impervious Runoff Depth>0.72"Subcatchment 1S: Turtle Brook Watershed Tc=165.0 min CN=50 Runoff=166.10 cfs 73.247 af
Inflow=32.32 cfs 20.372 afReach 3R: Turnpile Lake South Outflow=32.32 cfs 20.372 af
Peak Elev=10.46' Storage=52.934 af Inflow=166.10 cfs 73.247 afPond 2P: Upper & Middle Turnpike Lake Primary=32.32 cfs 20.372 af Secondary=0.00 cfs 0.000 af Outflow=32.32 cfs 20.372 af
Total Runoff Area = 1,222.000 ac Runoff Volume = 73.247 af Average Runoff Depth = 0.72"100.00% Pervious = 1,222.000 ac 0.00% Impervious = 0.000 ac

Type III 24-hr 10 Year Rainfall=5.20"Turnpike Lake Printed 6/21/2021Prepared by BETA Group
Page 3HydroCAD® 10.00-26 s/n 10406 © 2020 HydroCAD Software Solutions LLC
Summary for Subcatchment 1S: Turtle Brook Watershed
Runoff = 166.10 cfs @ 14.67 hrs, Volume= 73.247 af, Depth> 0.72"
Runoff by SCS TR-20 method, UH=SCS, Weighted-CN, Time Span= 5.00-24.00 hrs, dt= 0.05 hrsType III 24-hr 10 Year Rainfall=5.20"
Area (ac) CN Description* 1,222.000 50
1,222.000 100.00% Pervious Area
Tc Length Slope Velocity Capacity Description(min) (feet) (ft/ft) (ft/sec) (cfs)165.0 Direct Entry,
Subcatchment 1S: Turtle Brook Watershed
Runoff
Hydrograph
Time (hours)24232221201918171615141312111098765
Flow
(cf
s)
180170160
150140130120
110100
908070
60504030
2010
0
Type III 24-hr10 Year Rainfall=5.20"Runoff Area=1,222.000 acRunoff Volume=73.247 afRunoff Depth>0.72"Tc=165.0 minCN=50
166.10 cfs

Type III 24-hr 10 Year Rainfall=5.20"Turnpike Lake Printed 6/21/2021Prepared by BETA Group
Page 4HydroCAD® 10.00-26 s/n 10406 © 2020 HydroCAD Software Solutions LLC
Summary for Reach 3R: Turnpile Lake South
[40] Hint: Not Described (Outflow=Inflow)
Inflow Area = 1,222.000 ac, 0.00% Impervious, Inflow Depth > 0.20" for 10 Year eventInflow = 32.32 cfs @ 23.34 hrs, Volume= 20.372 afOutflow = 32.32 cfs @ 23.34 hrs, Volume= 20.372 af, Atten= 0%, Lag= 0.0 min
Routing by Stor-Ind+Trans method, Time Span= 5.00-24.00 hrs, dt= 0.05 hrs
Reach 3R: Turnpile Lake South
InflowOutflow
Hydrograph
Time (hours)24232221201918171615141312111098765
Flow
(cf
s)
3634323028262422201816141210
86420
Inflow Area=1,222.000 ac32.32 cfs
32.32 cfs

Type III 24-hr 10 Year Rainfall=5.20"Turnpike Lake Printed 6/21/2021Prepared by BETA Group
Page 5HydroCAD® 10.00-26 s/n 10406 © 2020 HydroCAD Software Solutions LLC
Summary for Pond 2P: Upper & Middle Turnpike Lake
[44] Hint: Outlet device #1 is below defined storage
Inflow Area = 1,222.000 ac, 0.00% Impervious, Inflow Depth > 0.72" for 10 Year eventInflow = 166.10 cfs @ 14.67 hrs, Volume= 73.247 afOutflow = 32.32 cfs @ 23.34 hrs, Volume= 20.372 af, Atten= 81%, Lag= 519.9 minPrimary = 32.32 cfs @ 23.34 hrs, Volume= 20.372 afSecondary = 0.00 cfs @ 5.00 hrs, Volume= 0.000 af
Routing by Stor-Ind method, Time Span= 5.00-24.00 hrs, dt= 0.05 hrsPeak Elev= 10.46' @ 23.34 hrs Surf.Area= 20.628 ac Storage= 52.934 af
Plug-Flow detention time= 356.2 min calculated for 20.372 af (28% of inflow)Center-of-Mass det. time= 181.5 min ( 1,201.2 - 1,019.8 )
Volume Invert Avail.Storage Storage Description#1 7.85' 85.075 af Custom Stage Data (Prismatic) Listed below (Recalc)
Elevation Surf.Area Inc.Store Cum.Store(feet) (acres) (acre-feet) (acre-feet)7.85 20.000 0.000 0.000
12.00 21.000 85.075 85.075
Device Routing Invert Outlet Devices#1 Primary 7.85' 24.0" Round Culvert 24"CMP L= 40.0' CMP, projecting, no headwall, Ke= 0.900
Inlet / Outlet Invert= 7.85' / 7.60' S= 0.0063 '/' Cc= 0.900 n= 0.024, Flow Area= 3.14 sf#2 Primary 7.95' 30.0" Round Culvert 30"CMP L= 40.0' CMP, projecting, no headwall, Ke= 0.900
Inlet / Outlet Invert= 7.95' / 7.50' S= 0.0113 '/' Cc= 0.900 n= 0.024, Flow Area= 4.91 sf#3 Secondary 11.05' 30.0' long x 30.0' breadth Broad-Crested Rectangular Weir
Head (feet) 0.20 0.40 0.60 0.80 1.00 1.20 1.40 1.60Coef. (English) 2.68 2.70 2.70 2.64 2.63 2.64 2.64 2.63
Primary OutFlow Max=32.33 cfs @ 23.34 hrs HW=10.46' (Free Discharge)1=Culvert 24"CMP (Barrel Controls 12.91 cfs @ 4.13 fps)2=Culvert 30"CMP (Barrel Controls 19.42 cfs @ 4.90 fps)
Secondary OutFlow Max=0.00 cfs @ 5.00 hrs HW=7.85' (Free Discharge)3=Broad-Crested Rectangular Weir ( Controls 0.00 cfs)

Type III 24-hr 10 Year Rainfall=5.20"Turnpike Lake Printed 6/21/2021Prepared by BETA Group
Page 6HydroCAD® 10.00-26 s/n 10406 © 2020 HydroCAD Software Solutions LLC
Pond 2P: Upper & Middle Turnpike Lake
InflowOutflowPrimarySecondary
Hydrograph
Time (hours)24232221201918171615141312111098765
Flow
(cf
s)
180170160150140130120110100
908070605040302010
0
Inflow Area=1,222.000 acPeak Elev=10.46'Storage=52.934 af
166.10 cfs
32.32 cfs32.32 cfs
0.00 cfs

APPENDIX GOrder of Magnitude Construction Costs

JOB Plainville No. 7624CALCULATED BY TMW DATE 6/25/2021CHECKED BY DATEDESCRIPTION Cost Analysis SHEET NO.
Shepard Street over Turtle Brook/Turnpike Lake
Repairs:
Masonry Repairs (Replace Stones, Repoint Joints, Fill Voids)Headwall Repairs = 20.00 sf
SE Side Wingwall Repairs= 20.00 sfSW Side Wingwall Repairs= 20.00 sf
Approximate Depth of Repairs = 1.00 ftArea of Repairs in CY = 2.22 cy
Stone Masonry Wall in Cement Mortar (Item 685.) = $900.00 Per CY Masonry Repairs = $2,000
Scour Repairs (Fill in Holes)South Headwall Scour Length = 10.00 ft
Assumed Height of Scour = 3.70 ftApproximate Depth of Scour = 0.50 ft
Area of Repairs in CF = 18.50 cfConc.Filled Grout Bags for Scour (Item 920.9901.) = $1,100.00 Per CF Scour Repairs = $20,350
Contingency & Misc. Items = 30.00% of construction cost Contingency & Misc. Items = $6,705
Mobilization/Demobilization = 10.00% of total construction cost Mobilization/Demobilization = $2,906Cost of Repairs = $31,960.50
Call = $32,000.00
25% Engineering Cost = $8,000
TOTAL COST = $40,000