Embed Size (px)
Citation preview

page 1
3D Visualization
with
TNTmips®
TNTedit™
TNTview ®
PERSPECTIVES
Tutorial
3D PerspectiveVisualization
page 2
3D Visualization
You can print or read this booklet in color from MicroImages’ Web site. TheWeb site is also your source for the newest tutorial booklets on other topics.You can download an installation guide, sample data, and the latest versionof TNTmips Free.
http://www.microimages.com
Before Getting StartedThis booklet introduces techniques for constructing and manipulating 3D viewsin TNTmips®, TNTedit™, and TNTview®. You can drape 2D objects over aterrain surface provided by a raster object with cells containing elevation valuesor display vector, CAD or TIN objects with full 3D coordinates. This bookletintroduces you to the basic 3D visualization tools in the Display process.
Prerequisite Skills This booklet assumes that you have completed the exercisesin the tutorials Displaying Geospatial Data and TNT Product Concepts. Theexercises in those booklets present basic skills for selecting and viewing objectsstored in Project Files and getting around in TNTmips. Please consult thosebooklets for any review you need. In addition, the exercises on using 3D Groupsin display and page layouts require familiarity with the tutorial Making MapLayouts.
Sample Data The exercises presented in this booklet use sample data that isdistributed with the TNT products. If you do not have access to a TNT productsDVD, you can download the data from MicroImages’ web site. In particular, thisbooklet uses objects in the VIEW3D, TERRAIN, and SANMATEO data collections. Makea read-write copy of these files on your hard drive; you may encounter problemsif you work directly with the read-only sample data on the DVD.
More Documentation This booklet is intended only as an introduction to 3Dvisualization. Details of the processes described here can be found in a variety oftutorial booklets, Technical Guides, and Quick Guides, which are all availablefrom MicroImages’ web site.
TNTmips® Pro and TNTmips Free TNTmips (the Map and Image ProcessingSystem) comes in three versions: the professional version of TNTmips (TNTmipsPro), the low-cost TNTmips Basic version, and the TNTmips Free version. Allversions run exactly the same code from the TNT products DVD and have nearlythe same features. If you did not purchase the professional version (whichrequires a software license key) or TNTmips Basic, then TNTmips operates inTNTmips Free mode. The 3D perspective display features are also available inTNTedit and TNTview. All of the exercises in this tutorial can be completed inTNTmips Free using the sample data provided.
Randall B. Smith, Ph.D., and Keith Ghormley, 28 August 2013©MicroImages, Inc., 1997-2013

page 3
3D Visualization
choose Main /Display from theTNTmips menu tostart the displayprocess
Welcome to 3D Visualization
The exercises on pages 4-20 introduce setting up andadjusting 3D views. Special3D effects with vectorobjects are discussed onpages 21-29. Pages 30-35cover use of 3D groups inlayouts, stereo viewing, andmanifolds.
Above: Crow Butte elevation with composite TMsatellite image, DLG vector themes, and soil polygons.Below: Crow Butte elevation with composite TM.
The Display process in TNTmips provides a num-ber of flexible tools for 3D and stereo 3D visualizationof many kinds of project materials. You can use theprocess with raster, vector, shape, CAD, and TINobjects. You can use a large array of drape objectsover a wide-area surface to define a complexview.
An essential concept under-lies every feature in theprocess: the distinction be-tween terrain layers and drapelayers. A terrain or surfacelayer is a raster layer whosecell values are used as eleva-tion values to define a surfaceviewable as a wireframe mesh.A drape layer contains a ras-ter, vector, shape, or CADobject that takes its 3D shapefrom a surface object belowit in the layer list in the Dis-play Manager. One surfacelayer can also support anynumber of drape objectsabove it in the layer list.When multiple terrain anddrape layers are used, eachdrape layer is rendered on theterrain layer closest below inthe layer list.
3D geometric objects thatcontain elevation values for their elements can beviewed directly in 3D views without the need for araster terrain layer. Geometric objects include TINobjects, which always include 3D coordinates, andvector, CAD, and shape objects, which can be cre-ated or imported with 3D coordinates.

page 4
3D Visualization
Create a New 3D DisplaySTEPS
choose Display / New /3D Display from theDisplay Manager windowin the Select Objectwindow navigate to theVIEW3D data directory andselect MWDEM from theVIEW3D Project File as aterrain layerselect VIEW3D / MWDEM
again as a display layer(drape)keep this group open forthe next exercise
When you create a New 3D Display, you are auto-matically prompted to select a raster to serve as theterrain, then for one or more objects to display(drape) over that terrain. You can choose the terrainraster again to use as the drape layer if you wish. Anelevation raster used as a drape raster is easier tovisualize if it is displayed with relief shading or witha color palette, as in this exercise.
After you select the objects, the process opens twoview windows. View 1 is the standard 2D View win-dow that should be familiar to you from 2D Displays.View 2 is a perspective view window in which thedata layers are rendered in 3D. Each View opens bydefault with a LegendView pane on the left side. Youcan use the Hide/Show checkbox in LegendView tocontrol whether an individual layer is shown in thatparticular View, so the 2D and perspective views canshow or hide different layers. The Hide/Show layercheckboxes in the Display Manager act globallyacross all Views.
The MWDEM drape object isdisplayed in the 2D and 3DView windows.
The raster object you selectas the terrain layer must bea grayscale raster. Youcannot use color-compositeraster objects as a terrainlayer.

page 5
3D Visualization
Wireframe and Solid ViewSTEPS
(optional:) use thelayer icon buttonson the DisplayManager to openthe drape and surfacelayers’ Layer Controlswindows and selectwireframe colorsturn on theWireframe Viewicon button on View 2
NOTE: to conserve space on the page, the sidebar has been turned off in theperspective view illustrations on this and subsequent pages using the Show/ Hide Sidebar button (with black triangle icon).
The 3D perspective window shows eitherwireframe or solid renderings of the spatial data.
Wireframe View
The 3D view window can show either a wireframeview of the surface or a solid view. The wireframeis a rectangular mesh of lines that shows the extentsand general shape of the terrain layer and can berendered into the view instantaneously. Solid viewrenders the drape layer onto the terrain layer and sorequires a longer display time. The Wireframe Viewicon button on the 3D view toggles the window be-tween these two states. The initial default mode issolid view, but after that the 3D view opens in what-ever mode was last used in the previous session.
You can change the windowbackground color by choos-ing Color from theperspective view’s Optionsmenu. You can change thewireframe color for any ras-ter drape layer in the RasterLayer Controls dialog thatopens when you click thelayer’s object icon button inthe layers list in the DisplayManager (or select Controlsfrom a layer’s right mousebutton menu in the DisplayManager or the viewsidebar). The wireframecolor selection is on the Ras-ter Layer Controls window’s3D tabbed panel. Note thateach surface and drape layerhas its own wireframe color.Since the topmost layer isthe drape layer, its wireframecolor is the one that showsin the 3D view.

page 6
3D Visualization
Change Viewing Direction and Distance
Solid View withviewer positionchanged to showa view of theterrain towardthe southwestand from agreater distance.
The 3D view opens with the group centered in theview. The view direction is toward the northeastfrom a point above the terrain. You can make simpleadjustments to the viewing geometry using the con-trols below the icon buttons on the 3D view window.
You can enter a numeric value into the Heading fieldor press the downward arrow button and choose acardinal direction (North, Northeast, and so on) fromthe menu. Likewise, you can enter a pitch value inthe numeric field or use the menu to choose a pitchangle between 45 degrees up or down in 5-degreeincrements. Use the Distance slider to vary the dis-tance (in meters) from the “viewer” to the center ofthe view. The default distance range of the slider isautomatically extended when you drag the slider toone of its endpoints. The current distance is shownin the numeric field to the right of the slider; youcan also type a desired distance into this field. Withthe perspective view in solid view mode, as you dragthe Distance slider the view temporarily reverts towireframe mode to provide a continuously-chang-ing preview. When you release the slider, theperspective view redraws automatically in solid view.
Definitions:
Heading is the horizontalview direction in degreesclockwise from north.
Pitch is the vertical angle ofthe view direction relative tothe horizontal; downwardangles are negative.
STEPSturn off theWireframe Viewpress the arrowicon button forHeading andchoose Southwest fromthe dropdown menuchoose Down 15degrees from the Pitchmenumove the Distance sliderto the right until the valueshown in the field to theright of the slider isaround 15000

page 7
3D Visualization
Surface Layer Controls
Wireframe viewwith verticalscale set to 2.0to providevertical exag-geration. Thesmaller wire-frame samplingset hereprovides adenserrepresentaion ofthe surface.
The Object settings on the Surface Layer Controlswindow allow you to modify the vertical scaling fora terrain layer. Setting the Scale value greater than1.0 provides vertical exaggeration that can be usefulin visualizing low-relief terrains. The Offset value isadded uniformly to the entire terrain to shift all el-evations up or down by the same amount. Forexample, you might want to use the same elevationraster as two different surface layers in the samegroup with different drape layers. You could thenoffset one of these terrains upward so that both canbe seen at the same time in the perspective view.
The sampling value for the wireframe deter-mines how dense the wireframe appears.The MWDEM terrain layer in these exerciseshas a default sampling rate of 16. Thatmeans that the lines in the wireframe arederived from values in every 16th row andevery 16th column of the raster object. To see morelines in the wireframe, change the sampling value toa smaller number. To see a sparser mesh,increase the sampling value. The denserthe mesh, the more detail you can see in thesurface in wireframe view.
Always change the wireframe sampling rate with thesurface layer controls. The wireframes for drapelayers use the same sampling rate as the surfacelayer.
STEPSturn on theWireframe Viewicon button on theperspective viewwindowpress the LayerControls iconbutton for the terrainlayer in the Displaymanagerin the Surface LayerControls window, clickthe 3D tab and choose 8from the WireframeSampling menu
on the Object tabbedpanel change the Scalefield to 2.0
press [Apply] on theSurface Layer Controlswindow

page 8
3D Visualization
Setting Terrain Rendering AccuracySTEPS
in the Surface LayerControls window Objectpanel, set the Scale to1.0on the 3D panel, movethe Rendering Accuracyslider all the way to theleft; the numeric fieldshould read 0.5
press [Apply] on theSurface Layer Controlswindowturn offWireframe Viewmode on theperspective viewwindow
Solid View with Rendering Accuracy set to 0.5 showsgreater terrain detail than the view shown previously.
The terrain surface for solid 3D views is modeled asa variable-resolution triangular mesh of elevationvalues sampled from the terrain raster. Foregroundand high-relief areas are represented by small tri-angles that can accurately represent terrain details.Background and low-relief areas that require lessdetail are modeled by larger triangles. This triangu-lation model is reconstructed each time the 3Dviewpoint changes.
The elevation of each triangle vertex alwaysequals the elevation in the correspondingterrain raster cell. The edges and faces oflarger triangles, however, can deviate in el-evation from the terrain raster cells they
cross or span. The Rendering Accuracy value setsthe maximum allowed vertical deviation between anytriangle edge or face in the terrain model and thecorresponding terrain raster cell value. These de-viations translate directly to offsets up or down inthe 3D view, so the accuracy value is measured inscreen pixels. The range of this setting is from 0.5 to10 screen pixels, with a default value of 3.0. Reduc-ing the Rendering Accuracy setting provides a moreaccurate, detailed terrain rendering in Solid View bycausing large triangles in the terrain model to besplit into smaller, more accurate triangles. Becausemore triangles must be processed, rendering times
are slower,though thed i f f e renceshould onlybe signficantfor large ter-rain rasters.

page 9
3D Visualization
Stored Terrain PropertiesSTEPS
When you Import a rasterfile in TNTmips, the ImportParameters dialog for manyfile formats includes theoption to Compute 3DSurface Properties. Turnthis toggle button on to havethe surface propertiescomputed during the Importprocedure. They will thenbe used automatically anytime the raster is used as aterrain layer.
press [OK] on theSurface Layer Controlswindow
Computation of the variable triangulation used forterrain rendering in the 3D view requires not onlythe raw elevation values in the terrain raster but alsoseveral additional neighborhood properties of eachterrain raster cell, such as a measure of local relief.Because these terrain properties are independent ofviewpoint, they can be computed once for the ter-rain raster, then used for each new viewpoint toquickly rebuild the variable triangulation.
The Display process automatically computes sur-face properties for a raster the first time it is used asa terrain layer (in particular, the first time the terrainis rendered in solid view). The time required for thisinitial computation is directly related to the size ofthe terrain raster and can be several minutes for largerrasters. Terrain properties are saved with the rasterobject by default so that they do not need to berecomputed in later sessions. Saving the terrain prop-erties increases the stored size of the terrain rasterby 2 to 10 times (depending on the raster’s size anddata type), but in subsequent 3D viewingsessions the terrain properties are read au-tomatically from the stored structure, so thefirst display of the 3D scene is not delayed.
A toggle button on the Surface Layer Con-trols window (Save optimization structure for faststartup) controls this storage behavior. This toggleis turned on by default, and is inactive if the currentterrain raster already has stored surface properties(as in this exercise). If you turn the toggle off beforerendering the 3D view with a new terrain raster (or ifthe terrain raster is on a read-only medium), the ter-rain properties are stored in a temporary file andused only for the duration of the current 3D viewingsession. You should allow surface properties to bepermanently stored for any raster that you expect toreuse as a terrain layer.
The toggle is inactive in thisexample because the MWDEM
raster we are using for theterrain layer already hasstored surface properties.

page 10
3D Visualization
3D Viewpoint ControlsSTEPS
press theViewpointControls icon button inthe 3D view windowin the 3D ViewpointControls window, dragthe Distance slider to theright until the entirewireframe is visible in the3D view and release
Position graphic Elevation graphic
Zoom In and Zoom Out actions differ from distance adjustments. TheDistance sliders move the viewpoint and thus change the geometry ofthe perspective view. Zoom actions simply enlarge or reduce the view.
The Viewpoint Controls iconbutton opens the 3D ViewpointControls window.
The Viewpoint Controls window provides a morecomprehensive set of controls for changing the view-ing geometry of the 3D view. The position andelevation graphics in the upper left corner of thewindow are controls (described on the next page)for changing heading and pitch angle. The ViewerPosition fields show the current map coordinates,elevation, and height of the viewer. The View Di-rection fields (just above the bank of sliders) recordthe current heading (left value) and pitch (right
value). The Distance and ElevationScale sliders replicate the previously-described controls found on the 3Dview window and Surface Layer Con-trols window, respectively. Theremaining sliders are associated withstereo viewing and display of 3Dshapes, described subsequently. Anyof the numeric fields on the ViewpointControls window can be manually ed-ited to reset the associated value.
The Add Layericon opens amenu that letsyou selectadditional surfaceor drape objectsof any type.

page 11
3D Visualization
Position and Elevation ControlsSTEPS
drag the elevationcontrol through its arcand observe the effecton the wireframedrag the position controlaround the extents boxand observe the effecton the wireframe
+30 degrees
+15 degrees
0 degrees
Above: three positions of the elevation control.
The graphic controls in the 3D Viewpoint Controlswindow allow you to rotate the 3D model aroundvertical (position control) and horizontal (Elevationcontrol) axes. The position control consists of ablue T-shaped graphic representing the viewer po-sition and heading (long bar of the T) that you canrotate around a rectangle that represents the extentsof the terrain raster layer. As youmove the viewer indicator, thewireframe in the 3D View windowrotates to show the change inviewer position and heading.
The vertical and horizontal linesof the elevation control depict aside view of the 3D space. Youcan swing the T-indicator througha semicircular arc and change thepitch angle from straight above(+90 degrees), to edge-on (0 de-grees), to straight below thesurface (-90 degrees).
Drag the position control in acircle around the extents box.

page 12
3D Visualization
Center Object in View Toggle
STEPSturn off the Center Objectin View toggle in theViewpoint Controlswindowdrag the position graphicto shift the viewerpositiondrag the elevationgraphic up and down tochange the viewerelevationhold down the shift keywhile dragging theposition indicator tochange the headinghold down the shift keywhile dragging theelevation graphic tochange the pitch
You can use the Zoombuttons to zoom eithercontrol graphic in or out.
NOTE: the Distancesliders have no effectwhen the Center Object inView toggle is turned off.
The Center Object in View toggle onthe Viewpoint Controls window deter-mines the mode of the position and
elevation graphic controls. When the toggle is on(the default state), the 3D model stays centered inthe 3D View window, and the controls rotate theviewer around this fixed center point. When thetoggle is off the model is free to move in the 3Dview, and the position and elevation graphics changefrom rotation to translation mode. You can drag theposition graphic in this mode in any direction toreposition the viewer horizontally without chang-ing the heading. Likewise, you can drag theelevation graphic up or down to change the viewerelevation without changing the pitch. Be carefulwhen the Center Object in View toggle is off, be-cause you can easily point the view away from thesurface and see nothing but an empty 3D window.(You can always recover a “lost” terrain by turningon the Center Object in View toggle.)
The position and elevation graphic controlsalso have another mode when the Center Ob-ject in View toggle is off. If you hold downthe shift key while dragging on the long barof the T indicator, you can pivot either con-trol graphic in place. In this way you canchange the viewer heading and pitch withoutchanging the horizontal position or elevation.

page 13
3D Visualization
Adjust Viewpoint ToolThe 2D View window provides an additional meansof changing the viewer position and viewing direc-tion of the associated 3D view. Turning on theAdjust Viewpoint tool on the toolbar reveals a set ofgraphics in the 2D view: a four-sided polygon showsthe general extents of the 3D view, a cross showsthe viewer position, and a circled cross shows thelocation of the 3D view center. (The near and dis-tant edges of the extents polygon may not be visiblein some viewing geometries.) The mouse cursorassumes a “cross-arrows” shape over most of the2D view; use the mouse in this mode to drag theview center indicator to a new location. When themouse is close to the viewer position indicator, thecursor changes to the “rotate arrows” shape, andyou can drag the indicator to pivot the vieweraround the center.
Adjust Viewpoint tool
The AdjustViewpoint tool, 3DViewpoint Controlswindow, and theviewpoint controlson the 3D Viewwindow are allinterlinked; eachset updates whenanother control ischanged.
center of view
viewerposition
heading
3D viewextents
STEPSturn the Center Object inView toggle on againin the 2D View window,choose Options / HiddenFeaturesscroll down in theCustomize window to theTool Selection Toolbargroup and turn on theAdjust Viewpointcheckbox, then press[OK]turn on the AdjustViewpoint tool inthe 2D view windowdrag and rotate the toolin the 2D view andobserve the result in the3D view
Pivot around the center by dragging theposition “+” with the “rotate arrows”cursor:
Move the3D modelby draggingthe centerindicatorwith the“crossarrows”cursor:

page 14
3D Visualization
Adjust Viewpoint Tool UncenteredSTEPS
turn off the Center Objectin View toggle in the 3DViewpoint Controlswindownote the changes in theAdjust Viewpoint toolgraphicsdrag the viewer positionindicator to reposition theviewdrag the heading arrowto rotate the view aroundthe viewer positionturn the Center Object inView toggle on again
When the Center Object in View toggle is turned offin the 3D Viewpoint Controls window, the view cen-ter indicator disappears in the 2D view and thebehavior of the Adjust Viewpoint tool graphicchanges. The cross arrow cursor now allows you todrag (rather than rotate) the viewer position indica-tor to reposition (translate) the view relative to theterrain model. Move the mouse close to the headingarrow; the cursor changes to the “rotate arrows”shape, allowing you to drag the heading arrow torotate the view around the viewer position.
Move the 3D view relative to the terrain model by draggingthe viewer position “+” with the “cross arrows” cursor:
Pivot theview aroundthe viewerposition bydragging theheadingarrow withthe “rotatearrows”cursor:

page 15
3D Visualization
Floating Drape LayersYou can add any number of raster drape layers to agroup with a 3D view. Each of these drape layerstakes its shape from the underlying terrain layer.However, if all of the drape layers have the samespatial extents, the uppermost layer will obscurethose underneath. There are several solutions to thisproblem in 3D viewing. One is to “float” the ob-scuring layer(s) above those below by setting apositive Z Offset for the layer in the Raster LayerControls window.
In this exercise you add a composite raster layer (anatural-color Landsat satellite image) to the groupand float it above the color-coded image of the el-evation surface.
STEPSpress the AddObjects iconbutton on the DisplayManager windowselect raster object COMP
from the VIEW3D ProjectFilein the DisplayManager, left-clickon the Raster Controlsicon button for the COMP
drape layerin the Raster LayerControls window for thecomp layer, click on the3D tabenter 6000 in the ZOffset field on the 3D
panel and press[Apply]
Use the ZOffset field onthe RasterLayer Controlswindow’s 3Dpanel to float adrape layerabove theterrain.
Raster drapelayers in obliqueperspective viewsrequire much higherspatial detail in theforeground than in the distantbackground. The selected TextureFilter determines how the draperaster and its pyramid tiers aresampled to produce different parts ofthe perspective view smoothly andefficiently. For more information seethe Technical Guide entitled TextureFilters for 3D Rendering.
page 16
3D Visualization
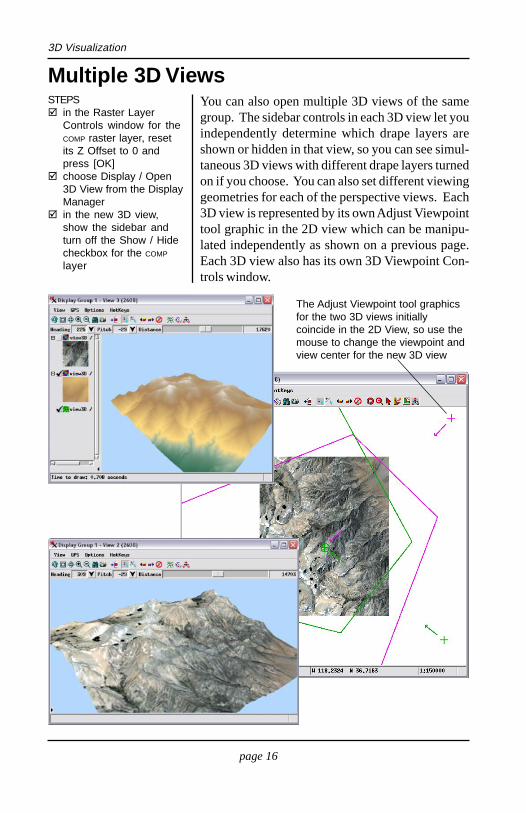
Multiple 3D ViewsYou can also open multiple 3D views of the samegroup. The sidebar controls in each 3D view let youindependently determine which drape layers areshown or hidden in that view, so you can see simul-taneous 3D views with different drape layers turnedon if you choose. You can also set different viewinggeometries for each of the perspective views. Each3D view is represented by its own Adjust Viewpointtool graphic in the 2D view which can be manipu-lated independently as shown on a previous page.Each 3D view also has its own 3D Viewpoint Con-trols window.
STEPSin the Raster LayerControls window for theCOMP raster layer, resetits Z Offset to 0 andpress [OK]choose Display / Open3D View from the DisplayManagerin the new 3D view,show the sidebar andturn off the Show / Hidecheckbox for the COMP
layer
The Adjust Viewpoint tool graphicsfor the two 3D views initiallycoincide in the 2D View, so use themouse to change the viewpoint andview center for the new 3D view

page 17
3D Visualization
Vector Drape LayersGeometric objects (vector, CAD, and shape objects)with 2D coordinates can also be used as drape lay-ers in a 3D perspective view. Lines, polygons, andlabels in these layers are rendered onto the underly-ing terrain surface just as raster drape layers are.Styles used for rendering the elements in the 2D vieware also rendered in the 3D view, including trans-parent polygon fills. Bit-map and hatch fills forpolygons can be rendered in the 3D view but are notoptimal for perspective viewing. Solid color poly-gon fills (with or without partial transparency) workbest for vector objects that will be viewed in 3D.DataTiip information for geometric elements and forraster cell values are also available when the mousecursor is hovered over relevant locations in the 3Dview.
Special 3D effects are available for point and poly-gon elements in 2D vector objects. Vector objectswith 3D coordinates are also treated differently than2D vector objects. These topics are discussed fur-ther on subsequent pages.
STEPSpress the AddObjects iconbutton on the DisplayManager windowselect vector objectsFEATURES and HYDRO fromthe VIEW3D Project Filepause the mouse cursorover features in the 3Dview and note theDataTip
NOTE: display of fills forpolygon elements in the 3Dwindow requires appropriatesettings in the layer’s VectorLayer Controls window. Besure that the Polygon Fillingmenu on the Polygonstabbed panel is set toEnable for 2D and 3D.
choose Display / Close from the Display Managerwhen you have completed this exercise

page 18
3D Visualization
Transparency and Relief ShadingSTEPS
choose Display / Openfrom the DisplayManager windownavigate to the TERRAIN
data collection andchoose Display Group3D from the SHADE
Project Filein the DisplayManager, left-clickon the Raster Controlsicon button for the upperdrape layer (MWDEM2)on the Options panel ofthe Raster LayerControls window forMWDEM2, note theTransparency field value,then press [OK]turn off the Show / Hidecheckbox for the MWDEM2layeropen the RasterControls windowfor the lower drapelayer (MWDEM1)on the Shading panelof the Raster LayerControls window formwdem1, note thatthe Relief Shadingtoggle is turned on,then press [OK]turn on the Show /Hide checkbox forMWDEM2
choose Display /Close from the DisplayManager when youhave completed thisexercise
A group that incorporates a 3D view can be savedalong with all 3D view settings using the Save Asoption from the Display menu in the Display Man-ager. In this exercise you open a saved 3D groupwith multiple raster drape layers illustrating the useof transparency and relief shading in 3D views.
Two raster drape layers are included in this group.The lower drape layer, which is the elevation rasterthat is also used as the terrain, has relief shadingturned on for the raster. The upper drape layer is acopy of the elevation raster that is displayed with acolor palette and with 40% transparency. The use ofpartial transparency for this upper raster layer al-lows the relief-shaded image and the color-mappedversion to visually blend in both the 2D and 3D viewsto create a relief-shaded view with color-coded el-evations. Both transparency levels and the reliefshading option can be set in adrape layer’s Raster Layer Con-trols window.

page 19
3D Visualization
Pedestal and FenceYou can enclose any raster drape layer in a coloredpedestal and/or fence using controls on the RasterLayer Controls window’s Options tabbed panel.These vertical, curtain-like elements are drawn alongthe boundaries of the raster layer (excluding any cellsdesignated as transparent by a null value, null mask,or display mask). A pedestal is drawn verticallydownward from the terrain surface to the designatedbase elevation; a fence is drawn vertically upwardfrom the surface to the designated top elevation. Youcan choose colors for the pedestal and fence and seta transparency value for either color in the standardColor Editor window.
The terrain surface in this example combines seafloorbathymetry and coastal topography for a portion ofMonterey Bay, California (USA). A partiallytransparent blue fence extends upward from theseafloor surface to sea level (0 elevation) to suggestthe presence of water yet enable submarine featuresbehind the fence to remain visible.
STEPSchoose Display / New /3D Display from theDisplay Managernavigate to the VIEW3D
directory and chooseBATH_DEM from the MONBAY
Project File as the terrainlayer and COLORSHADE asthe display layermove the Distance slideron the 3D view to theright until the entireterrain is visibleopen the RasterLayer Controlswindow for theCOLORSHADE layer and clickon the 3D tabturn on the ShowPedestal and ShowFence toggle buttonsenter -3500 in the BaseElevation fieldpress the color button tothe right of the ShowFence Togglenote the Transparencyfield value in the ColorEditor and press [OK]press [OK] on the RasterLayer Controls window
choose Display / Close from the Display Managerwhen you have completed this exercise
The pedestal and fencefaces are automatically shadedusing the illumination settingsdiscussed on a later page.

page 20
3D Visualization
Perspective and Parallel ProjectionsThe 3D view can display layers in either perspectiveor parallel projection using the Perspective Projec-tion toggle on the 3D Viewpoint controls window.The default perspective projection varies the scaleof the scene to provide a realistic sense of depthand distance. Objects appear larger in the fore-ground than in the background, and sets of parallellines converge toward a distant vanishing point. Ina parallel projection, any sets of parallel lines remainparallel in the 3D view. Scale is constant throughoutthe view, so objects of the same size appear the sameregardless of their position in the scene. This pro-jection therefore conveys less sense of 3D depth inthe view.
STEPSpress the AddObjects iconbutton on the DisplayManager windownavigate to the SANMATEO
data directory and selectobjects TM_321 andGEOLMAP from theSANMATEO Project Filechoose Display / Open3D View from theDisplay Managerchoose Northwest fromthe Heading icon buttonmenu in the 3D view
In Parallel Projection,parallel lines remain parallelthroughout the view.
In Perspective Projection,parallel lines convergetowards a vanishing point.
The Perspective Projection button on the 3D Viewpoint Controls window toggles the3D view between perspective and parallel projections. This toggle is only activewhen the current group includes a terrain layer. 3D groups lacking a terrainsurface are always shown in perspective projection.
A terrain surface is not required for 3D perspectiveviews. Without a terrain surface, all display layersare projected onto a horizontal planar surface. A 3Dview of a group with no terrain surface is useful fordisplays of a stack of floating layers or for otherspecialized 3D effects (see the following pages).

page 21
3D Visualization
2D Points on StalksSpecial 3D effects are available for points and poly-gons in 2D vector objects. Both types of elementscan be raised above the surface in 3D views usingcontrols on the 3D tabbed panel of the Vector LayerControls window.
2D point symbols can be rendered vertically (alwaysfacing toward the viewer) and elevated above (orbelow) the surface on a stalk (vertical line). Thesize of the stalk is determined by the value in a nu-meric field you designate in the vector object’s pointdatabase and from the current selection on the Unitsmenu. The Mode menu setting determines whetherthe stalk size is used as a height above the local sur-face or as an absolute elevation (height above the 0elevation datum regardless of local surface eleva-tion).
The QUAKES2 vector object in this example mapsepicenter locations for earthquakes. The Richtermagnitude of each earthquake is used as the heightof the stalk in kilometers. (Since no surface is inuse, there is no difference between Height and El-evation mode in this case.) The point symbols areset using a ThemeMap also based on the earthquakemagnitude. The 3D display of the stalked pointsthus serves as a 3D bar graph of the earthquakemagnitude.
STEPSadd vector objectQUAKES2 from theSANMATEO Project Filepress the LayerControls iconbutton for the QUAKES2layer in the DisplayManageron the Vector LayerControls window’s 3Dtabbed panel, chooseHeight from the Modemenu in the ExtrudedPoints panepress [Field] in theExtruded Points panein the Select Table/Fieldwindow, choose Importfrom the Table list andMagn from the Field listand press [OK]choose kilometers fromthe Units menu in theExtruded Points paneand press [OK] on theVector Layer Controlswindowadjust the viewpoint inthe 3D view
3D view of 2Dpoints on stalks
Use controls in the 3Dpanel’s Points pane toset stalked pointparameters.

page 22
3D Visualization
Style Point Symbols for 3D PerspectiveSTEPS
open the VectorLayer Controlswindow for the QUAKES2layeron the Points tabbedpanel, choose All Samefrom the Style menu andpress [Apply]note the uniform screensize of all of the pointsymbolson the Points tabbedpanel, press [Edit] nextto the Style menuin the Edit Styleswindow, choose UserDefined on the At Scale:menuenter 100000 in thenumeric field next to theAt Scale: menu andpress [OK] on the StyleEditorpress [OK] on the VectorLayer Controls window
The visual perspective effect in 3D views can beenhanced if you set proper style parameters for yourvector elements. In this exercise we switch to AllSame styling for point symbols to illustrate the ef-fect of symbol scaling on perspective views.
Point symbols (and line/border widths) can be set tohave a constant size on the screen regardless of themap scale, or be sized relative to a particular mapscale. In the 2D view, map-scaled symbols get largerin the view when you zoom in and smaller when youzoom out. These scaling effects also carry over intothe 3D perspective view. Map-scaled symbols ap-pear larger in the foreground of the 3D view andsmaller in the background, contributing to the vi-sual perspective effect. The same principle appliesto the widths of line elements and polygon bordersin vector drape layers.
Point symbols with fixed screen size (above)and scaled to a map scale (below).
Point symbols and linestyles appear larger in theforeground when theelement style definitionuses a Design scale orUser Defined scale.

page 23
3D Visualization
Style Point StalksSTEPS
open the VectorLayer Controlswindow for the QUAKES2layerin the Points tabbedpanel chooseImport_Magn from theStyle menuin the Extruded Pointspane of the 3D panelchoose By Theme fromthe Line Style menupress [Apply] on theVector Layer Controlswindowreopen the Vector LayerControls window for theQUAKES2 layerin the Extruded Pointspane of the 3D panel turnon the Use Color Stacktoggle button and press[OK]
Stalked points have three components: the elevatedbillboard symbol, the stalk line, and a base symbolon the surface. Point symbols are styled using con-trols on the Points tabbed panel on the Vector LayerControls window. The stalk line and base are styledusing controls on the 3D tabbed panel. Each of thesecomponents can be styled independently using themenu choices All Same, By Attribute, By Theme, orBy Script. (For general information on styling vec-tor elements, see the tutorial entitled Creating andUsing Styles.)
In the previous exercises the stalk line and base wereeach styled All Same. In this exercise the stalk linesare styled By Theme (using a previously-preparedtheme table) with colors assigned by earthquakemagnitude ranges. In the initial display, each stalkis rendered with a single color. In the second dis-play, with the Use Color Stack option turned on, allof the magnitude ranges through which a stalk passesare shown by their assigned col-ors on the stalk and thicker linewidths are used for higher mag-nitudes.
Use the Base Style menus to set upstyling for the base point symbols.
Points with stalk linesstyled by theme.
Points with stalk lines styledby theme with the colorstack option turned on.
Use the Line Style menus toset up styling for stalk lines.
color-stack stalk lines

page 24
3D Visualization
Extruded Solid PolygonsYou can also use the 3D panel on the Vector LayerControls window to “extrude” vector polygons inthe 3D view so they appear as solid objects extend-ing above or below the terrain. Settings for extrudedpolygons are very similar to those for stalked points:set the Mode menu to Height or Elevation and se-lect the numeric field and units to supply thosevalues. If a terrain surface is used, a polygon maycover an area of varying surface elevation. Whenyou use the Height mode, you can choose either theminimum or maximum elevation on the polygonboundary as the datum for the polygon height.
The vector object used in this exercise maps areasof varying maximum predicted seismic intensity fora model earthquake. The Height field in theMaxPredIntens table in the polygon database con-tains a height in meters for each intensity level.
STEPSright-click on the QUAKES2layer entry in the DisplayManager and chooseRemove Layer from themenurepeat for the GEOLMAP
layeradd vector objectSEISMAP to thegroupopen the VectorLayer Controlswindow for the SEISMAP
layerin the Extruded Polygonspane of the 3D panelchoose Height from theMode menupress [Field] in theExtruded Polygons panein the Select Table/Fieldwindow, chooseMaxPredIntens from theTable list and Height fromthe Field list and press[OK]press [OK] on the VectorLayer Controls windowadjust the viewpoint inthe 3D view
Use the controls in thePolygons pane to set upextruded polygons.
Wireframe colors forextruded polygons
Belowsurface
Abovesurface
page 25
3D Visualization
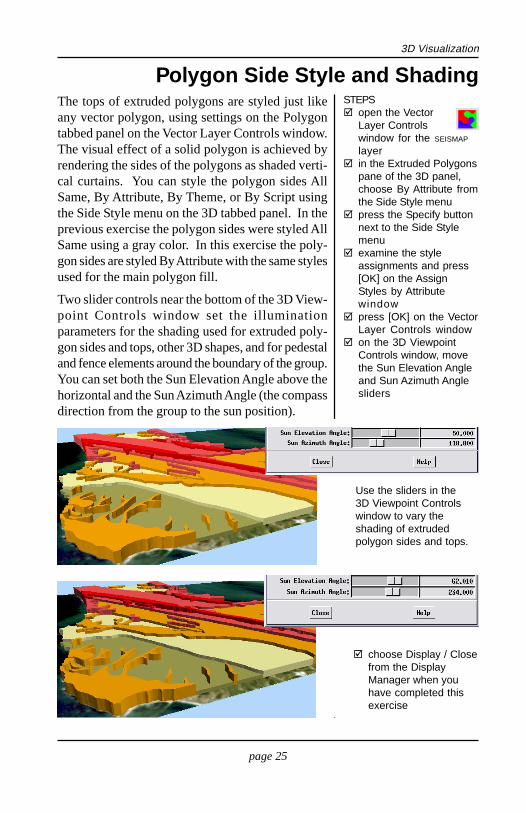
Polygon Side Style and ShadingThe tops of extruded polygons are styled just likeany vector polygon, using settings on the Polygontabbed panel on the Vector Layer Controls window.The visual effect of a solid polygon is achieved byrendering the sides of the polygons as shaded verti-cal curtains. You can style the polygon sides AllSame, By Attribute, By Theme, or By Script usingthe Side Style menu on the 3D tabbed panel. In theprevious exercise the polygon sides were styled AllSame using a gray color. In this exercise the poly-gon sides are styled By Attribute with the same stylesused for the main polygon fill.
Two slider controls near the bottom of the 3D View-point Controls window set the illuminationparameters for the shading used for extruded poly-gon sides and tops, other 3D shapes, and for pedestaland fence elements around the boundary of the group.You can set both the Sun Elevation Angle above thehorizontal and the Sun Azimuth Angle (the compassdirection from the group to the sun position).
Use the sliders in the3D Viewpoint Controlswindow to vary theshading of extrudedpolygon sides and tops.
choose Display / Closefrom the DisplayManager when youhave completed thisexercise
STEPSopen the VectorLayer Controlswindow for the SEISMAP
layerin the Extruded Polygonspane of the 3D panel,choose By Attribute fromthe Side Style menupress the Specify buttonnext to the Side Stylemenuexamine the styleassignments and press[OK] on the AssignStyles by Attributewindowpress [OK] on the VectorLayer Controls windowon the 3D ViewpointControls window, movethe Sun Elevation Angleand Sun Azimuth Anglesliders

page 26
3D Visualization
Solid Polygons over TerrainPolygon extrusion parameters must be chosen judi-ciously when the vector layer is draped over a terrainwith considerable relief. In this example, vectorpolygons in a mountainous terrain delineate areasranked in two categories of need for prescribed burn-ing for wildfire suppression. When the polygonsare extruded in Height mode, the difference in ter-rain elevation between some polygons in the samecategory causes their extruded tops to be at signifi-cantly different elevations. Changing to Elevationmode imposes a fixed elevation on the tops of allextruded polygons in each category. Polygon heightand elevation values must be chosen according tothe terrain characteristics to ensure that the top ofeach extruded polygon is higher than any point onits boundary. Polygons not meeting this restrictionare not rendered as solid objects in the 3D view;only their boundaries are rendered on the terrain.
Burn Priority Polygonsbefore extrusion. Notethe considerable differencesin elevation within and between polygons.
Low
Moderate
Extruded in Height mode
Extruded in Elevation mode
Moderate:Height = 700 m
Low:Height = 550 m
Moderate:Elevation = 4000 m
Low:Elevation = 3750 m
STEPSchoose Display / Openfrom the DisplayManager windownavigate to the VIEW3D
data collection andselect BURNGROUP fromthe VIEW3D Project Fileopen the VectorLayer Controlswindow for the BURN_ND
layerin the Extruded Polygonspane on the 3D panel,choose Height from theMode menupress [Field] in theExtruded Polygons pane,select BURN.HEIGHT andpress [OK] on the SelectTable/Field windowpress [Apply] on theVector Layer Controlswindowrepeat the last 4 steps,choosing Elevation fromthe Mode menu andBURN.ELEV as thefield

page 27
3D Visualization
Solid Polygons with Color StackWhen solid polygon sides are styled By Attributeor By Theme, you have the option of turning on theUse Color Stack toggle. The polygons in this ex-ample are Nebraska counties with attachedpopulation statistics for 1990 and 2000, includingpopulation growth or loss (negative growth). Poly-gon extrusion is used to graphically depict thespatial variation in population growth and loss.
In the GrowthGroup, polygons with net populationgrowth are selected by script for display and theme-mapped by 5% growth increments. A secondcomputed database field with growth values multi-plied by 5 was used to provide the polygon heights(in kilometers) and was also used for a side styletheme map. In the LossGroup, counties with netpopulation loss are selected and similarly styled.Since their growth values are negative, these solidpolygons extend downwardfrom the datum level. Separat-ing growth and loss intoseparate displays makes iteasier to see the details of each.
STEPSchoose Display / Closefrom the DisplayManager to close theprevious groupchoose Display / Openand select GROWTHGROUP
from the NEPOP ProjectFilerepeat the previous step,this time choosingLOSSGROUP from theNEPOP Project Fileopen the VectorLayer Controlswindow for the NECOUNTY
layer in GROWTHGROUP
examine the ExtrudedPolygon settings on the3D panel, then press[OK]
Counties withPopulation Growth1990-2000
Counties withPopulation Loss1990-2000
Theme-mapped in 5%increments in color-stacked side style.
Theme-mapped in 5%increments in color-stacked side style.
right-click on the LOSSGROUP entry in the Display Managerand choose Close Group; repeat for GROWTHGROUP

page 28
3D Visualization
3D Vector LayersSTEPS
add vector objectsSTREAM3D, SEC3D,and PEAKS3D from theVIEW3D Project File in anew display groupchoose Display / Open3D View
Close-up of cylindrical pipe(line) and spherical (point)symbols in the 3D view.
A 3D vector object (one that has z-coordinate val-ues for its elements) can be displayed by itself in 3Dperspective without requiring a separate terrain ras-ter layer. The process uses the z-coordinate valuesfor each element for elevations and renders the ob-ject in 3D independent from any other surface object.The objects used in this exercise include a set of 3Dvector lines of stream courses (derived from theTNTmips Watershed process), points with 3D loca-tions of section corners, and points with 3Dpositions of named mountain peaks.
In addition, point and line elements in 3D vectorobjects are automatically rendered as solid shapes
in 3D views if they meetcertain styling con-straints. 3D points arerendered in 3D as solidspheres (if styled for2D with a standardfilled circle symbol) oras solid cubes (if styledfor 2D with a standardsquare or other sym-bol). 3D lines styled for2D with solid line stylesare rendered in the 3Dview as continuous cy-lindrical pipes.
The size and width cri-teria you have set up for these symbolsare maintained in the 3D view. Settingsizes by map scale provides fore-ground-background size variationconsistent with a perspective view.Shading effects for these 3D solidshapes can be adjusted using the SunAngle sliders on the 3D ViewpointControls window.

page 29
3D Visualization
3D Vector Layers with Draped TerrainIf 3D vector elements are displayed along with adraped terrain layer, the solid symbols for 3D pointsor lines that lie on or just above the terrain may in-tersect the terrain surface. These symbols arerendered accordingly: the portion of the symbol be-low the surface is hidden by any opaque layer drapingthat surface.
In this example, the elevations for all of the 3D vec-tor elements coincide with those in the newly-addedMWDEM terrain layer, so many of these symbols arepartially hidden by the COMP drape layer. Setting anegative offset value for this terrain layer lowers itand its drape layer, allowing the 3D vector elementsto float above the surface without intersecting it.
STEPSpress the AddTerrain icon buttonon the Display Managertool barselect raster MWDEM fromthe VIEW3D Project Filepress the LayerControls iconbutton for the newterrain layeron the Object tabbedpanel of the SurfaceLayer Controls windowenter -500 in the Offsetfield and press [OK]add raster objectCOMP from theVIEW3D Project Fileto the group
choose Display / Closefrom the DisplayManager when youhave completed thisexercise
page 30
3D Visualization
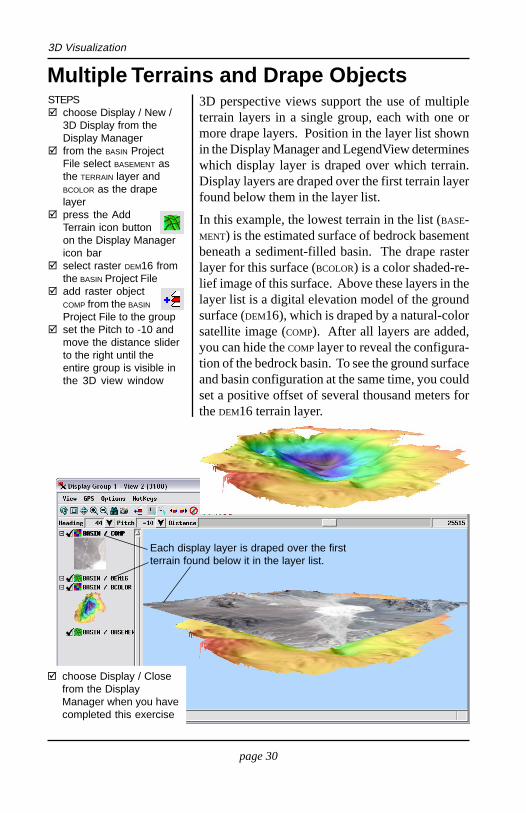
Multiple Terrains and Drape Objects3D perspective views support the use of multipleterrain layers in a single group, each with one ormore drape layers. Position in the layer list shownin the Display Manager and LegendView determineswhich display layer is draped over which terrain.Display layers are draped over the first terrain layerfound below them in the layer list.
In this example, the lowest terrain in the list (BASE-MENT) is the estimated surface of bedrock basementbeneath a sediment-filled basin. The drape rasterlayer for this surface (BCOLOR) is a color shaded-re-lief image of this surface. Above these layers in thelayer list is a digital elevation model of the groundsurface (DEM16), which is draped by a natural-colorsatellite image (COMP). After all layers are added,you can hide the COMP layer to reveal the configura-tion of the bedrock basin. To see the ground surfaceand basin configuration at the same time, you couldset a positive offset of several thousand meters forthe DEM16 terrain layer.
STEPSchoose Display / New /3D Display from theDisplay Managerfrom the BASIN ProjectFile select BASEMENT asthe TERRAIN layer andBCOLOR as the drapelayerpress the AddTerrain icon buttonon the Display Managericon barselect raster DEM16 fromthe BASIN Project Fileadd raster objectCOMP from the BASIN
Project File to the groupset the Pitch to -10 andmove the distance sliderto the right until theentire group is visible inthe 3D view window
choose Display / Closefrom the DisplayManager when you havecompleted this exercise
Each display layer is draped over the firstterrain found below it in the layer list.
page 31
3D Visualization
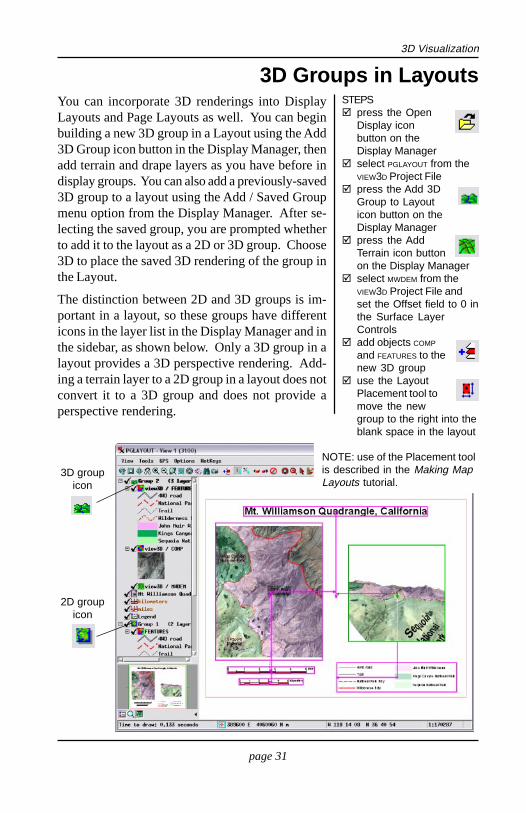
3D Groups in LayoutsYou can incorporate 3D renderings into DisplayLayouts and Page Layouts as well. You can beginbuilding a new 3D group in a Layout using the Add3D Group icon button in the Display Manager, thenadd terrain and drape layers as you have before indisplay groups. You can also add a previously-saved3D group to a layout using the Add / Saved Groupmenu option from the Display Manager. After se-lecting the saved group, you are prompted whetherto add it to the layout as a 2D or 3D group. Choose3D to place the saved 3D rendering of the group inthe Layout.
The distinction between 2D and 3D groups is im-portant in a layout, so these groups have differenticons in the layer list in the Display Manager and inthe sidebar, as shown below. Only a 3D group in alayout provides a 3D perspective rendering. Add-ing a terrain layer to a 2D group in a layout does notconvert it to a 3D group and does not provide aperspective rendering.
STEPSpress the OpenDisplay iconbutton on theDisplay Managerselect PGLAYOUT from theVIEW3D Project Filepress the Add 3DGroup to Layouticon button on theDisplay Managerpress the AddTerrain icon buttonon the Display Managerselect MWDEM from theVIEW3D Project File andset the Offset field to 0 inthe Surface LayerControlsadd objects COMP
and FEATURES to thenew 3D groupuse the LayoutPlacement tool tomove the newgroup to the right into theblank space in the layout
NOTE: use of the Placement toolis described in the Making MapLayouts tutorial.
3D groupicon
2D groupicon

page 32
3D Visualization
3D Viewpoint Selection WindowNotice that the new 3D group you created is con-fined to a rectangular box that does not show thefull extents of the perspective rendering. 3D groupsin layouts have an associated 3D Viewpoint Selec-tion window in addition to the 3D ViewpointControls. To open both windows, right-click on thegroup’s list entry in either the Display Manager orLegendView, then choose Viewpoint Controls fromthe right mouse-button menu.
The 3D Viewpoint Selection window provides anelastic box that you can resize and reposition to in-dicate which rectangular portion of the perspectiverendering you want to include in the layout. Dragthe window border to resize it or use the zoom but-tons if needed to assist in placing the rectangle. Youcan use the controls on the standard 3D ViewpointControls window to change the viewpoint for the3D group as in previous exercises. After applyingthe changes you may need to use the Placement tooland Group Settings to change the placement and rela-tive zoom of the 3D group.
STEPSright-click on the Group 2list entry in the DisplayManagerchoose ViewpointControls from the rightmouse button menuadjust the 3D ViewpointControls as desiredpress the ZoomOut icon button onthe 3D ViewpointSelection window orresize the window toshow the entire 3Drenderingdrag and resize theelastic box in theViewpoint Selectionwindow to determine thegroup extentspress the ApplyChanges iconbutton in the 3DViewpoint Selectionwindow
The elastic box in the 3D ViewpointSelection window determines the area ofthe 3D group that is shown in the layout.

page 33
3D Visualization
Stereo 3D ViewsThe 3D view can also provide stereo viewing of your3D scenes. In stereo mode the 3D view generatesoffset left and right images of the scene that providethe illusion of depth when viewed with a stereo view-ing device. These devices can include stereomonitors or electronically shuttered glasses (whichuse column-interlaced or line-interlaced images), amirror stereoscope (images in separate frames), ortwo-color anaglyph glasses like those used for 3Dmovies. You can set stereo device options by choos-ing Options / Stereo Settings from the 3D view.
The group viewed in this exercise is a low obliqueview of mountainous terrain set up for viewing withanaglyph glasses with a red left lens and cyan rightlens. A mountain ridge extends from the lower leftforeground toward the upper right, with anotherset of more distant peaks in the upper left. If youmove your head slowly from side to side while view-ing with anaglyph glasses, the distant parts of thescene should appear to move more than the fore-ground.
STEPSchoose Display / Closeon the Display Managerto close the previouslayout, choosing Nowhen asked whether tosave changesopen group STEREO
from the VIEW3D
Project Filepress the StereoView icon buttonon the 3D viewin the Stereo DeviceSettings window thatappears, chooseAnaglyph from theStereo Mode menu andpress [OK}
Anaglyph stereo images canbe viewed with inexpensivecardboard glasses not onlyon computer monitors, butalso projected on a screenin a classroom or meeting oron a color print.

page 34
3D Visualization
Stereo Viewing SettingsIn Wireframe View mode separate wireframes are ren-dered for the left and right stereo images. With the3D view set for anaglyph viewing, each of thesewireframes is rendered in the appropriate color (redand cyan in this case), so the wireframe can also beviewed in stereo. This makes anaglyph stereo andwireframe mode a good choice for setting up stereoviewing parameters, even when the final stereo viewwill be rendered for another stereo viewing device.
Controls for two important stereo viewing param-eters are found on the 3D Viewpoint Controlswindow. The Stereo Base Distance is the distancefrom the viewer to the plane of zero offset betweenthe left and right images. In wireframe mode this isthe distance at which the different-colored wireframelines merge. Typically the zero-offset plane shouldbe in the foreground of or just in front of the view.The Stereo Depth Scale value determines the amountof stereo separation between left and right images.A scale value of 0 produces no separation and nostereo effect. As stereo separation increases, thesense of stereo depth also inceases. Setting the scaletoo high, however, may cause viewing discomfort or
destroy the stereo effect.
STEPSopen the 3DViewpointControls windowswitch toWireframe Viewmode but keep thestereo mode turned onin the 3D ViewpointControls, move theStereo Base Distanceslider back and forth andnote the effect on thestereo wireframesrepeat with the StereoDepth Scale slider
choose Display / Closefrom the DisplayManager when you havecompleted this exercise

page 35
3D Visualization
Manifolds in 3D ViewsIn addition to the terrain and drape layers you haveworked with in previous exercises, 3D views canalso include manifolds: raster or vector objects thatcontain their own shape and position information inthe form of a set of 3D georeference control points.The 3D view uses these special control points (cre-ated using the 3D Piecewise Affine georeferencemodel) to create a 3D triangular mesh representingthe manifold surface on which the object is then pro-jected. A manifold can be viewed by itself in the 3Dview or in combination with a conventional terrainraster and its drape layer(s).
A manifold can be in the form of a simple verticalplane (such as a cross-section or profile), obliqueplane, curving vertical curtain, or a more general3D shape. The manifold in this group is a vectorobject representing a vertical water-column sectionacross Monterey Submarine Canyon, offshore Cali-fornia. The colored areas in the manifold representhypothetical zones of differing current velocity inthe canyon. The outer, lowest-velocity zone has beenstyled with a partially transparent color to reveal theseafloor morphology behind it.
You can set up araster or a 2D vectorobject to display as amanifold using theGeoreferenceprocess. Simplyassign 3D controlpoints using the 3DPiecewise Affinemodel. Refer tovarious TechnicalGuides atmicroimages.com formore information.
Manifold objects are onlydisplayed in 3D views. TheGeoreference and SpatialData Editor 2D views displaya “flat” view of the manifoldobject to allow editingoperations.
STEPSpress the OpenDisplay iconbutton on the DisplayManagerselect group MANGP fromthe MONBAY Project Fileadd vector objectPROFILE from thesame file to the 3D groupuse the Adjust Viewpointtool to view the manifoldfrom different viewingpositions

page 36
3D VisualizationAdvanced Software for Geospatial AnalysisPERSPECTIVES
MicroImages, Inc. publishes a complete line of professional software for advancedgeospatial data visualization, analysis, and publishing. Contact us or visit our web site fordetailed product information.
TNTmips Pro TNTmips Pro is a professional system for fully integrated GIS, imageanalysis, CAD, TIN, desktop cartography, and geospatial database management.
TNTmips Basic TNTmips Basic is a low-cost version of TNTmips for small projects.
TNTmips Free TNTmips Free is a free version of TNTmips for students and profession-als with small projects. You can download TNTmips Free from MicroImages’ web site.
TNTedit TNTedit provides interactive tools to create, georeference, and edit vector, image,CAD, TIN, and relational database project materials in a wide variety of formats.
TNTview TNTview has the same powerful display features as TNTmips and is perfect forthose who do not need the technical processing and preparation features of TNTmips.
TNTatlas TNTatlas lets you publish and distribute your spatial project materials on CD orDVD at low cost. TNTatlas CDs/DVDs can be used on any popular computing platform.
Index
3D vector.........................................28,293D Viewpoint Controls..................10-12,343D Viewpoint Selection...........................32Adjust Viewpoint tool............................13-14anaglyph glasses......................................33-34center object in view................................12,14distance... . . . . . . . . . . . . . . . . . . . . . . . . . . . . . . . . . . . . . . .6drape object........................................3,4elevation control.................................11extruded polygons.................................24-27fence...............................................19floating layers........................................15i l luminat ion. . . . . . . . . . . . . . . . . . . . . . . . . . . . . . . .25layouts........................................31,32manifolds ..................................................35multiple 3D views in a group...................16offset layers................................................15
parallel projection...................................20perspective projection............................20pedestal. . . . . . . . . . . . . . . . . . . . . . . . . . . . . . . . . . . . . . . . . .19points on stalks.....................................21-23position control......................................11relief shading..........................................18solid polygons.........................................24-27solid view...................................................5stereo view.............................................33,34surface layer controls.......................................7surface object........................................3,4terrain object.............................................3,4terrain properties....................................9transparency.......................................18vector layers..........................................17wireframe view.......................................5,34