Embed Size (px)
Citation preview
1
Tutorial 6: Creating a Point Layer and Adding Data to the Attribute Table Tutorial Content 6.1. When should I use a point layer to represent data? 6.2. How can I add data to an attribute table?
a) Customising the Attribute Table b) Adding Point Data to the Layer c) Adding Data to the Attribute Table
6.3. How do I save my edit session? 6.4. Can I create a shortcut to common editing commands? 6.5. How can I customise the Point Layer? Open your saved tutorial map project. 6.1. Points Point layers are used to represent data that has a precise geographical location, an example at a detailed level might be trees which have been mapped as part of a tree survey. At a regional or national level, points might be used to represent the location of individual towns and cities. In this example we are going to create points which represent the approximate site of some of the former industrial water mills in the Loxley Valley. We are also going to indicate whether the water mills are considered to be of archaeological significance – being listed on the Sites and Monuments Records (SMR) – by adding data to the layer’s attribute table. A small selection of the Loxley Valley’s former mills is listed in the table below, along with their SMR status. These are the mills we will plot. Mill Name Listed on the Sites and Monuments Record Low Bradfield Corn Mill No Dam Flask Corn Mill No Dam Flask Paper Mill No Loxley Wire Mills Yes Olive Paper Mill Yes The locations of the water mills listed in the table have been indicated on the map below, which is from Crossley, D. 1989. Water Power on the Sheffield Rivers. Sheffield Trades Historical Association and the University of Sheffield. Page 77.

2
Low Bradfield Corn Mill Dam Flask Corn Mill Dam Flask Paper Mill Loxley Wire Mills Olive Paper Mill

3
6.2. Adding data to an Attribute Table a) Customising the Attribute Table In this example we also want to add information to the point layer’s attribute table. First we need to open the attribute table. Right click on the layer name in the table of contents, in this case the point layer created in Tutorial 5: water_mills. Then select the option Open Attribute Table from the drop down menu. The Attributes Table window will open. We have not yet added any data to the layer, so the table has no lines of data in it. We want to add two new columns (known as fields) to the table so that we can add the name of the water mill and record whether it is listed on the SMR. Click on the ‘Table Options’ button in the menu bar of the window and select 'Add Field. . .' from the drop down menu.
The ‘Add Field’ window will open. First we want to create a column for the name of the water mill. In the ‘Name:’ text box type water_mill. In the ‘Type:’ text box select the option Text from the drop down list. Click OK. *Note: Don’t include spaces in field names, use an underscore instead (_) and keep the length of the ‘name’ with less than 10 characters. The new water_mill column will be added to the attribute table. Now we want to add a second column (field) to indicate whether the mill is listed on the SMR. Click on Table Options again and select Add Field. Create a ‘Text’ field and name the field ‘SMR_listed’. Click OK. The new field will be added to the right of the water_mill field that we just created. Note: you might need to use the bar at the bottom of the window to scroll along to see it. Close the attribute table.
OS map data © Crown Copyright/database right 2011. An Ordnance Survey/EDINA supplied service.

4
b) 6.2.2. Adding Point Data to the Layer To add data to the ‘water_mills’ shapefile we need to start an ‘Edit Session’. When you finish adding the necessary information to your data layer you must end the ‘Edit Session’. All edits are temporary until you have chosen to save and permanently apply them to the layer. You can also quit an ‘Edit Session’ without saving the changes.
Click on the ‘Editor Toolbar’ icon in the menu bar. The ‘Editor’ toolbar will be displayed.
Click on the drop down list in the ‘Editor’ toolbar and select the option Start Editing. The ‘Start Editing’ window will open. Click on your ‘water_mills’ shapefile in the list. It is necessary to specify which layer is to be edited so that ArcMap knows which layer is to be modified. You can also click on the source folders to locate shapefiles that you have saved. Click OK. Creating Features and Feature Templates Data is added to a layer in ArcGIS 10 by using the ‘Create Features’ window, which will automatically open and dock on the right of the map display when you start editing. When adding data to a new shapefile, sometimes you must first create a New Feature Template. A Feature Template is where all the necessary information (name, description, type, etc.) regarding the features created are recorded. If your Create Features windows do not show your layer like this, then it is necessary to create a feature template; if it does, follow the steps after creating a Feature Template. To create a Feature Template click on Organize Templates in the Create Features window.
5
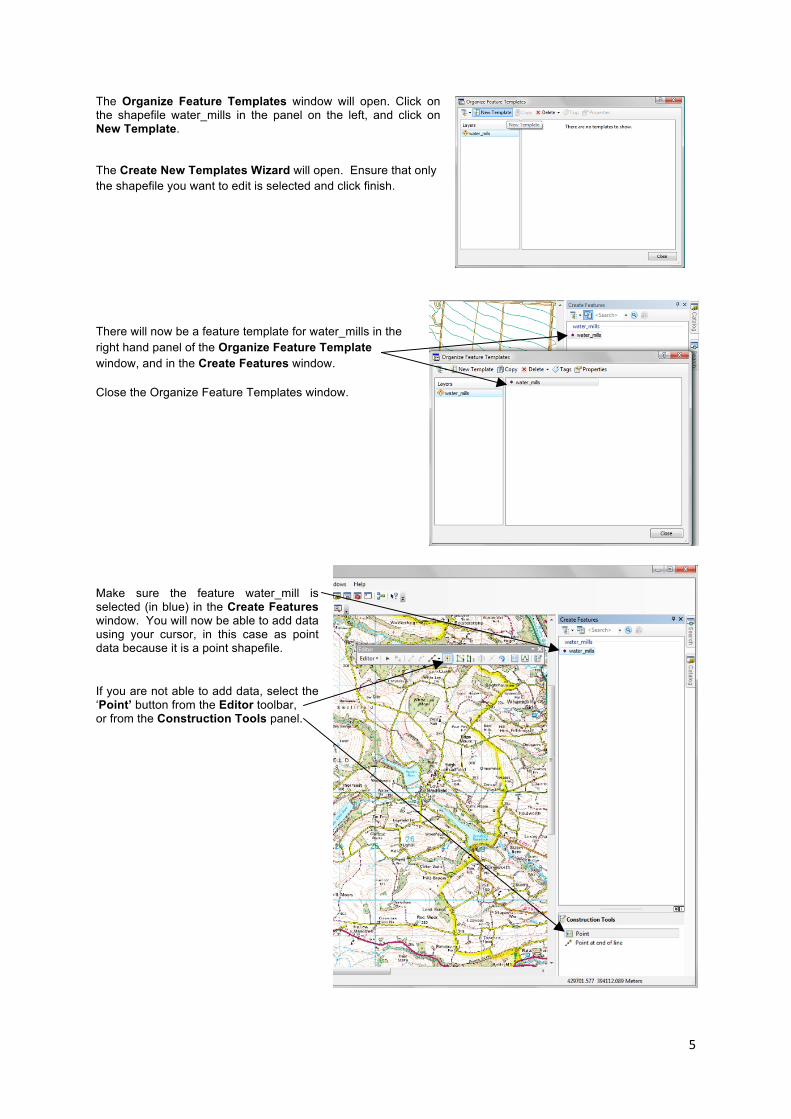
The Organize Feature Templates window will open. Click on the shapefile water_mills in the panel on the left, and click on New Template. The Create New Templates Wizard will open. Ensure that only the shapefile you want to edit is selected and click finish.
There will now be a feature template for water_mills in the right hand panel of the Organize Feature Template window, and in the Create Features window.
Close the Organize Feature Templates window.
Make sure the feature water_mill is selected (in blue) in the Create Features window. You will now be able to add data using your cursor, in this case as point data because it is a point shapefile.
If you are not able to add data, select the ‘Point’ button from the Editor toolbar, or from the Construction Tools panel.

6
We are now ready to add our points to indicate the locations of the five water mills listed in the table. Refer to the map above from Crossley (1989) for the approximate locations of the mills. You might want to use the zoom tools in ArcMap to help find the right location. When you have identified the correct location, you can add a point by clicking. In this example we have zoomed in on the OS plan of the area of Low Bradfield to add a point for the site of the ‘Low Bradfield Corn Mill’ You might need to turn on the ‘Raster-50k-sk28’ layer to help you navigate your way around the Loxley Valley. After you have added a point, it is best to add the attribute data for that point to the layer attribute table before you add the next point (see the following section).
OS map data © Crown Copyright/database right 2009. An Ordnance Survey/EDINA supplied service.

7
c) Adding Data to the Attribute Table
We want to add the details to the attribute table for the Low Bradfield Corn Mill point. Click on the ‘Attributes’ icon in the ‘Editor’ toolbar.
The ‘Attributes’ panel will open in the Create Features window. Click on water_mill. You will be able to add the name to the table. Type ‘Low Bradfield Corn Mill’. Click SMR_listed. The corn mill is not listed, so type ‘No’. We can check that this information has been recorded in the table by opening it. Right click on the layer name in the table of contents and select Open Attribute Table from the drop down menu. Close the table window and try adding the remaining points to the layer. Don’t worry if you can’t find the exact locations of the mills, we are just using this as an example. Just add the points in the approximate location. After you have added a point, add the attribute information for that point.

8
6.3. Saving your Points and Ending your Edit Session Once you have added your five points and the attribute information, you need to save your edits and end your Edit Session. Select ‘Save Edits’ from the drop down menu in the ‘Editor’ toolbar. It is a good idea to save your edits as you go along, rather than waiting until you have added all the data to a layer and just saving at the end. To end the editing session select ‘Stop Editing’ from the same drop down menu. If you just select ‘Stop Editing’ and you haven’t saved some of your ‘Edits’ you will be asked if you want to save the edits at this point. 6.4. Creating a Shortcut to the Common Editing Commands It is possible to create a shortcut to common editing commands, such as ‘Start Editing’, on the toolbar rather than having to access them in the menu. Click on Customize in the menu bar and select Toolbars. Click on Customize... at the bottom of the list. The Customize window will open. Leave this window open. Click on Editor in the Editor toolbar. Click on the Start Editing command, hold down and drag next to the ‘Editor’ menu in the toolbar. Do the same for the Stop Editing and Save Edits commands. Right click each command and select the option Default Style from the drop down menu. Each command will now be represented by an icon. Now it is possible to start and stop editing with one click. Close the ‘Customize’ window.
OS map data © Crown Copyright/database right 2011. An Ordnance Survey/EDINA supplied service.

9
6.5. Customising the Point Layer Your attribute table should contain entries for the five water mills and you should have five points in the map area. The points use a default symbology chosen by ArcMap. We can customise the points using ‘Symbol Selector’. Click on the point symbol in the table of contents to display the ‘Symbol Selector’ window. Select a symbol from the options in the window. Select a colour under ‘Current Symbol’ by clicking on the coloured box, more colour options will be displayed. The point size can also be changed by altering the value in the box next to ‘Size’. When happy with your selection click OK.
In this example the points have been coloured red and use point size 10. At the moment the layer is coloured using a single symbol. We can also colour the points based on the information recorded in the attribute table. In this example we are going to colour the points differently depending on whether the water mill is listed on the SMR. Right click on the layer name in the table of contents and select Properties from the drop down menu to open the ‘Layer Properties’ window. Select the Symbology tab. Select ‘Categories’ option and click on ‘Unique values’. In ‘Value Field’ drop down list all the fields in the attribute table are displayed. In this case we want ‘SMR-listed’. Click on Add All Values. . .
OS map data © Crown Copyright/database right 2009. An Ordnance Survey/EDINA supplied service.

10
ArcMap will assign a colour to your points. You can customise the colour and symbol by double clicking on them to open the ‘Symbol Selector’. Click Apply, and then click OK. The water mill points are now coloured differently depending on whether they are listed on the SMR.
OS map data © Crown Copyright/database right 2009. An Ordnance Survey/EDINA supplied service.