Embed Size (px)
Citation preview
Tutorial: Analyzing Locks and WaitsIntel® VTune™ Amplifier for Windows* OS
C++ Sample Application Code
Legal Information
ImportantThis document was last updated for the Intel VTune Amplifier 2017 product release. If you are
using this tutorial with a newer version of VTune Amplifier, you may see differences in analysis
type names and user interface design.
ContentsLegal Information................................................................................ 3Overview..............................................................................................4
Chapter 1: Navigation Quick Start
Chapter 2: Analyzing Locks and WaitsVisual Studio* IDE: Choose Project and Build Application................................ 9Standalone GUI: Build Application and Create New Project............................ 15Run Locks and Waits Analysis.................................................................... 21Interpret Result Data................................................................................21Analyze Code.......................................................................................... 25Remove Lock...........................................................................................27Compare with Previous Result....................................................................29
Chapter 3: Summary
Chapter 4: Key Terms
Tutorial: Analyzing Locks and Waits
2
Legal InformationNo license (express or implied, by estoppel or otherwise to any intellectual property rights is granted by this document.
Intel disclaims all express and implied warranties, including without limitation, the implied warranties of merchantability, fitness for a particular purpose, and non-infringement, as well as any warranty arising from course of performance, course of dealing, or usage in trade.
This document contains information on products, services and/or processes in development. All information provided here is subject to change without notice. Contact your Intel representative to obtain the latest forecast, schedule, specifications and roadmaps.
The products and services described may contain defects or errors which may cause deviations from published specifications. Current characterized errata are available on request.
Intel, the Intel logo, Intel Atom, Intel Core, Intel Xeon Phi, VTune and Xeon are trademarks of Intel Corporation in the U.S. and/or other countries.
*Other names and brands may be claimed as the property of others.
Microsoft, Windows, and the Windows logo are trademarks, or registered trademarks of Microsoft Corporation in the United States and/or other countries.
Java is a registered trademark of Oracle and/or its affiliates.
OpenCL and the OpenCL logo are trademarks of Apple Inc. used by permission by Khronos.
Copyright 2011-2018 Intel Corporation.
This software and the related documents are Intel copyrighted materials, and your use of them is governed by the express license under which they were provided to you (License). Unless the License provides otherwise, you may not use, modify, copy, publish, distribute, disclose or transmit this software or the related documents without Intel's prior written permission.
This software and the related documents are provided as is, with no express or implied warranties, other than those that are expressly stated in the License.
3
Overview
Discover how to use the Locks and Waits analysis of Intel® VTune™ Amplifier to identify one of themost common reasons for an inefficient parallel application - threads waiting too long on synchronizationobjects (locks) while processor cores are underutilized. Focus your tuning efforts on objects with long waitswhere the system is underutilized.
About ThisTutorial
This tutorial uses the sample analyze_locks application and guides you throughbasic steps required to analyze the code for locks and waits.
EstimatedDuration
10-15 minutes.
LearningObjectives
After you complete this tutorial, you should be able to:
• Choose an analysis target.• Choose the Locks and Waits analysis type.• Run the Locks and Waits analysis.• Identify the synchronization objects with long waits and poor thread concurrency
level.• Analyze the source code to locate the most critical code lines.• Compare results before and after optimization.
More Resources • Intel VTune Amplifier tutorials (HTML, PDF): https://software.intel.com/en-us/articles/intel-vtune-amplifier-tutorials/
• Intel VTune Amplifier support page: https://software.intel.com/en-us/intel-vtune-amplifier-xe-support/
• Intel Parallel Studio XE support page: https://software.intel.com/en-us/intel-parallel-studio-xe/
• Intel System Studio support page: https://software.intel.com/en-us/intel-system-studio/
Start Here
Tutorial: Analyzing Locks and Waits
4

Navigation Quick Start 1 Intel® VTune™ Amplifier provides information on code performance for users developing serial and
multithreaded applications on Windows*, Linux*, Android, and OS X* operating systems. VTune Amplifierhelps you analyze algorithm choices and identify where and how your application can benefit from availablehardware resources.
VTune Amplifier XE AccessTo access the VTune Amplifier in the Visual Studio* IDE: From the Windows* Start menu, choose IntelParallel Studio XE version > Parallel Studio XE version with [VS2012 | VS2013 | VS2015].
To access the Standalone VTune Amplifier GUI, do one of the following:
• From the Windows* Start menu, choose Intel Parallel Studio XE version > Intel VTune Amplifier XEversion.
• From the Windows* Start menu, choose Intel Parallel Studio XE version > Command Prompt >Parallel Studio XE > IA-32 Visual Studio [2012 | 2013 | 2015] mode to set your environment, thentype amplxe-gui. You can also set the environment manually by running the <install-dir>\amplxe-vars.bat file.
VTune Amplifier for Systems AccessTo access the VTune Amplifier in the Visual Studio* IDE: From the Windows* Start menu, choose IntelParallel Studio XE version > Parallel Studio XE version with [VS2012 | VS2013 | VS2015].
To access the Standalone VTune Amplifier GUI, do one of the following:
• From the Windows* Start menu, choose Intel VTune Amplifier <version> for Systems•
From Eclipse*, click the Launch Intel VTune Amplifier button from the toolbar or select the IntelSystem Studio > VTune Amplifier > Launch VTune Amplifier menu option
5
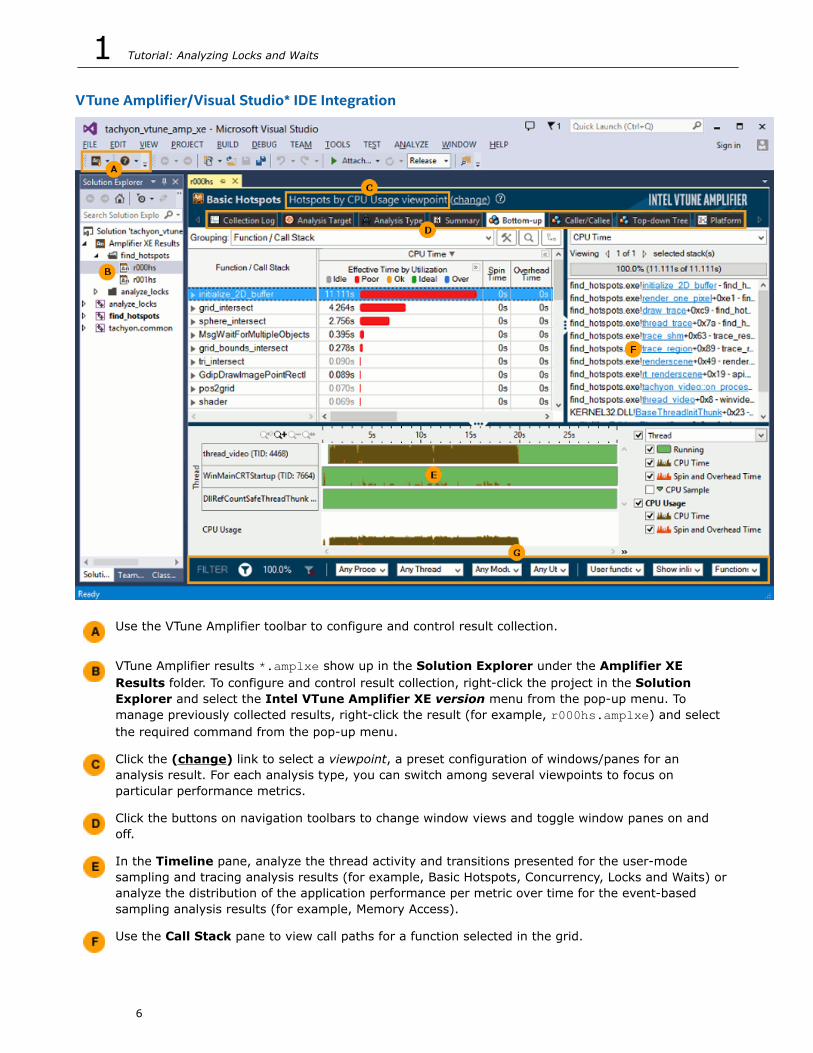
VTune Amplifier/Visual Studio* IDE Integration
Use the VTune Amplifier toolbar to configure and control result collection.
VTune Amplifier results *.amplxe show up in the Solution Explorer under the Amplifier XEResults folder. To configure and control result collection, right-click the project in the SolutionExplorer and select the Intel VTune Amplifier XE version menu from the pop-up menu. Tomanage previously collected results, right-click the result (for example, r000hs.amplxe) and selectthe required command from the pop-up menu.
Click the (change) link to select a viewpoint, a preset configuration of windows/panes for ananalysis result. For each analysis type, you can switch among several viewpoints to focus onparticular performance metrics.
Click the buttons on navigation toolbars to change window views and toggle window panes on andoff.
In the Timeline pane, analyze the thread activity and transitions presented for the user-modesampling and tracing analysis results (for example, Basic Hotspots, Concurrency, Locks and Waits) oranalyze the distribution of the application performance per metric over time for the event-basedsampling analysis results (for example, Memory Access).
Use the Call Stack pane to view call paths for a function selected in the grid.
1 Tutorial: Analyzing Locks and Waits
6
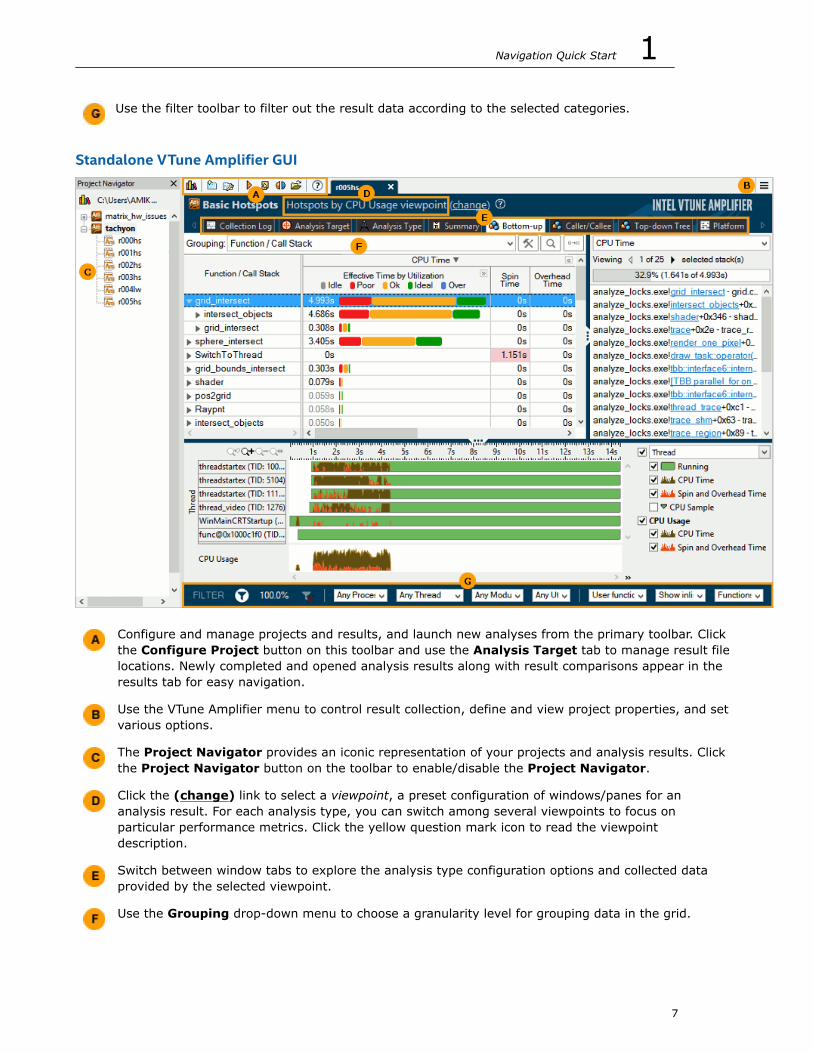
Use the filter toolbar to filter out the result data according to the selected categories.
Standalone VTune Amplifier GUI
Configure and manage projects and results, and launch new analyses from the primary toolbar. Clickthe Configure Project button on this toolbar and use the Analysis Target tab to manage result filelocations. Newly completed and opened analysis results along with result comparisons appear in theresults tab for easy navigation.
Use the VTune Amplifier menu to control result collection, define and view project properties, and setvarious options.
The Project Navigator provides an iconic representation of your projects and analysis results. Clickthe Project Navigator button on the toolbar to enable/disable the Project Navigator.
Click the (change) link to select a viewpoint, a preset configuration of windows/panes for ananalysis result. For each analysis type, you can switch among several viewpoints to focus onparticular performance metrics. Click the yellow question mark icon to read the viewpointdescription.
Switch between window tabs to explore the analysis type configuration options and collected dataprovided by the selected viewpoint.
Use the Grouping drop-down menu to choose a granularity level for grouping data in the grid.
Navigation Quick Start 1
7

Use the filter toolbar to filter out the result data according to the selected categories.
See AlsoClick here for more Getting Started Tutorials
1 Tutorial: Analyzing Locks and Waits
8
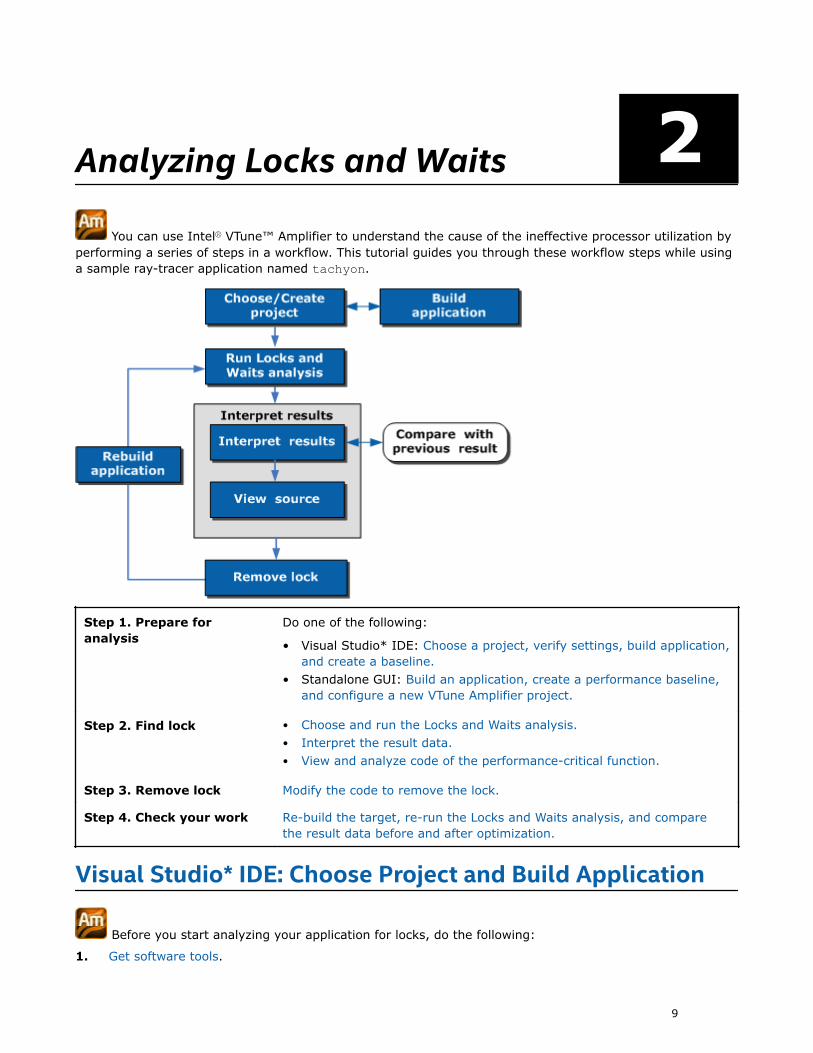
Analyzing Locks and Waits 2 You can use Intel® VTune™ Amplifier to understand the cause of the ineffective processor utilization by
performing a series of steps in a workflow. This tutorial guides you through these workflow steps while usinga sample ray-tracer application named tachyon.
Step 1. Prepare foranalysis
Do one of the following:
• Visual Studio* IDE: Choose a project, verify settings, build application,and create a baseline.
• Standalone GUI: Build an application, create a performance baseline,and configure a new VTune Amplifier project.
Step 2. Find lock • Choose and run the Locks and Waits analysis.• Interpret the result data.• View and analyze code of the performance-critical function.
Step 3. Remove lock Modify the code to remove the lock.
Step 4. Check your work Re-build the target, re-run the Locks and Waits analysis, and comparethe result data before and after optimization.
Visual Studio* IDE: Choose Project and Build Application
Before you start analyzing your application for locks, do the following:
1. Get software tools.
9

2. Choose a project.3. Configure the Microsoft* symbol server.4. Verify optimal compiler/linker options.5. Build the target in the release mode.6. Create a performance baseline.7. Launch the VTune Amplifier from Microsoft Visual Studio
NOTE:
• The steps below are provided for Microsoft Visual Studio* 2013. Steps for other versions of VisualStudio IDE may slightly differ. See online help for details.
• Steps provided by this tutorial are generic and applicable to any application. You may choose tofollow the proposed workflow using your own application.
Get Software ToolsYou need the following tools to try tutorial steps yourself using the tachyon sample application:
• Intel® VTune™ Amplifier, including sample applications• zip file extraction utility• Supported compiler (see Release Notes for more information)
Acquire Intel VTune Amplifier
If you do not already have access to the VTune Amplifier, you can download an evaluation copy from http://software.intel.com/en-us/articles/intel-software-evaluation-center/.
NOTE:
This document focuses on using the VTune™ Amplifier in Intel® Parallel Studio XE Professional Edition.You may see minor differences if you installed a different Intel product. For more information onproduct capabilities in your installed product, see the product-specific supplemental documentation in<install-dir>/<Intel_product>/documentation/.
Install and Set Up VTune Amplifier Sample Applications
1. Copy the tachyon_vtune_amp_xe.zip file from the <install-dir>\samples\<locale>\C++\directory to a writable directory or share on your system.
NOTE:
The default installation path for the VTune Amplifier XE is [Program Files]\IntelSWTools\VTuneAmplifier XE <version>. For the VTune Amplifier for Systems, the default <install_dir> is[Program Files]\IntelSWTools\system_studio_<version>\VTune Amplifier for Systems.
2. Extract the sample from the .zip file.
NOTE:
• Samples are non-deterministic. Your screens may vary from the screen captures shown throughoutthis tutorial.
• Samples are designed only to illustrate the VTune Amplifier features; they do not represent bestpractices for creating code.
2 Tutorial: Analyzing Locks and Waits
10
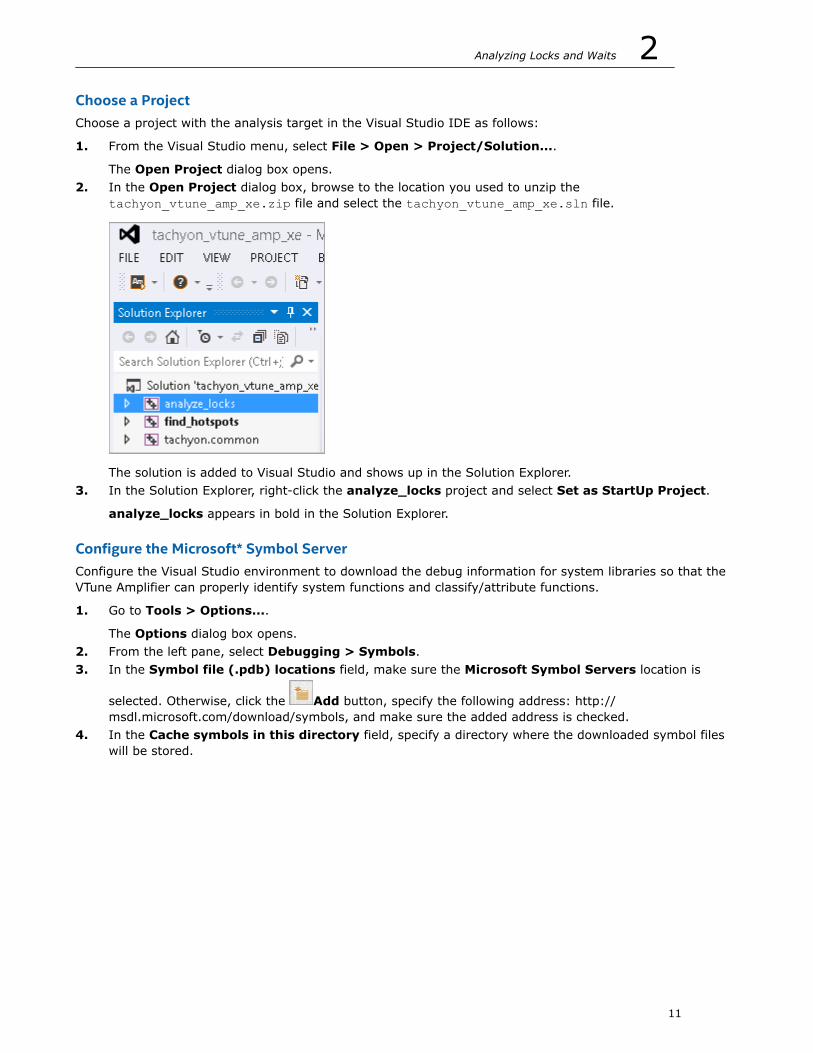
Choose a ProjectChoose a project with the analysis target in the Visual Studio IDE as follows:
1. From the Visual Studio menu, select File > Open > Project/Solution....
The Open Project dialog box opens.2. In the Open Project dialog box, browse to the location you used to unzip the
tachyon_vtune_amp_xe.zip file and select the tachyon_vtune_amp_xe.sln file.
The solution is added to Visual Studio and shows up in the Solution Explorer.3. In the Solution Explorer, right-click the analyze_locks project and select Set as StartUp Project.
analyze_locks appears in bold in the Solution Explorer.
Configure the Microsoft* Symbol ServerConfigure the Visual Studio environment to download the debug information for system libraries so that theVTune Amplifier can properly identify system functions and classify/attribute functions.
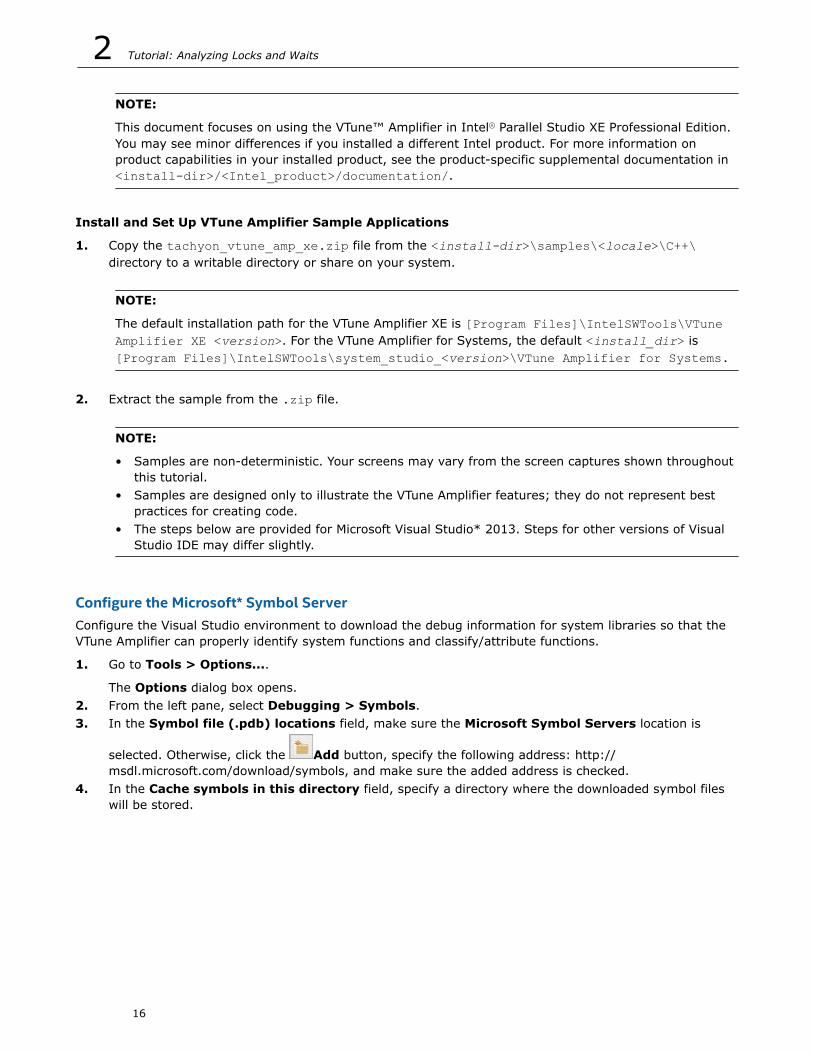
1. Go to Tools > Options....
The Options dialog box opens.2. From the left pane, select Debugging > Symbols.3. In the Symbol file (.pdb) locations field, make sure the Microsoft Symbol Servers location is
selected. Otherwise, click the Add button, specify the following address: http://msdl.microsoft.com/download/symbols, and make sure the added address is checked.
4. In the Cache symbols in this directory field, specify a directory where the downloaded symbol fileswill be stored.
Analyzing Locks and Waits 2
11
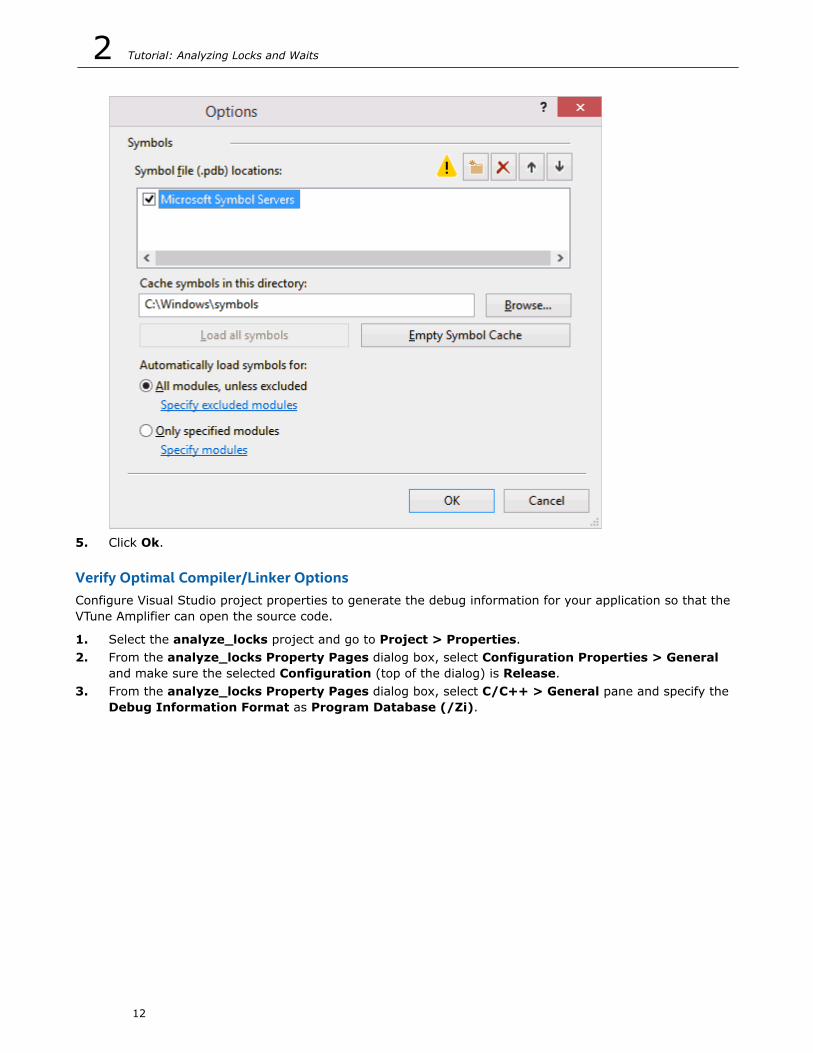
5. Click Ok.
Verify Optimal Compiler/Linker OptionsConfigure Visual Studio project properties to generate the debug information for your application so that theVTune Amplifier can open the source code.
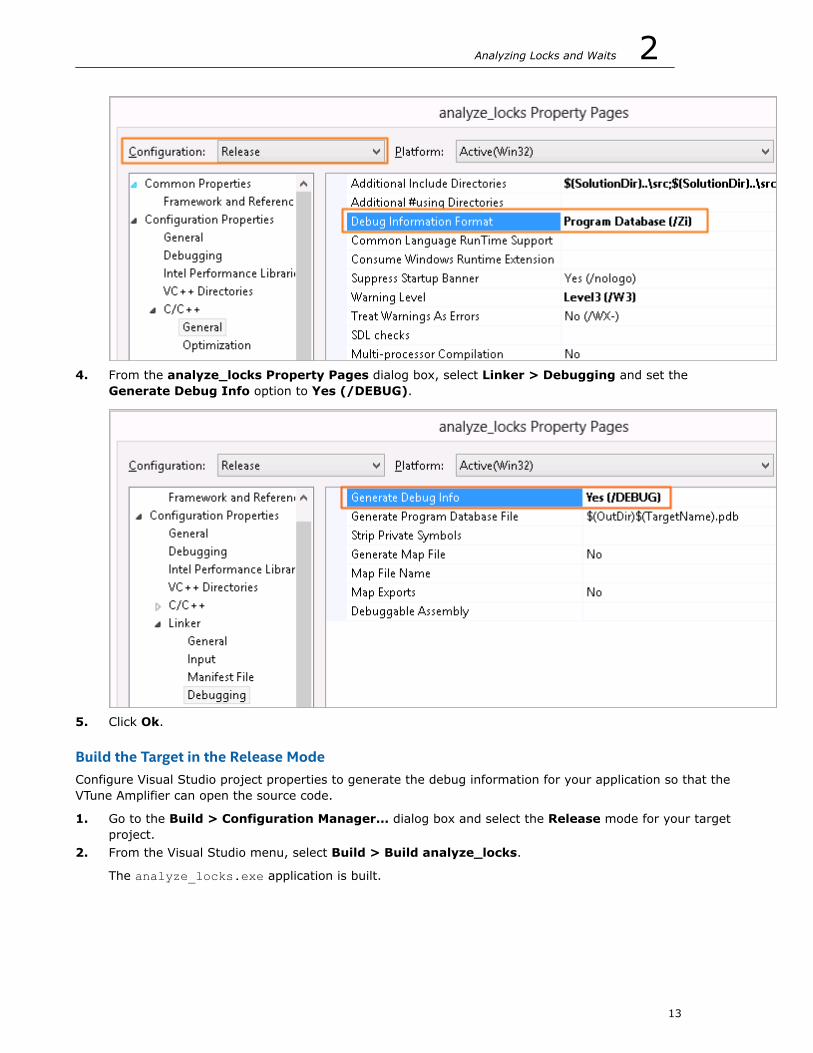
1. Select the analyze_locks project and go to Project > Properties.2. From the analyze_locks Property Pages dialog box, select Configuration Properties > General
and make sure the selected Configuration (top of the dialog) is Release.3. From the analyze_locks Property Pages dialog box, select C/C++ > General pane and specify the
Debug Information Format as Program Database (/Zi).
2 Tutorial: Analyzing Locks and Waits
12
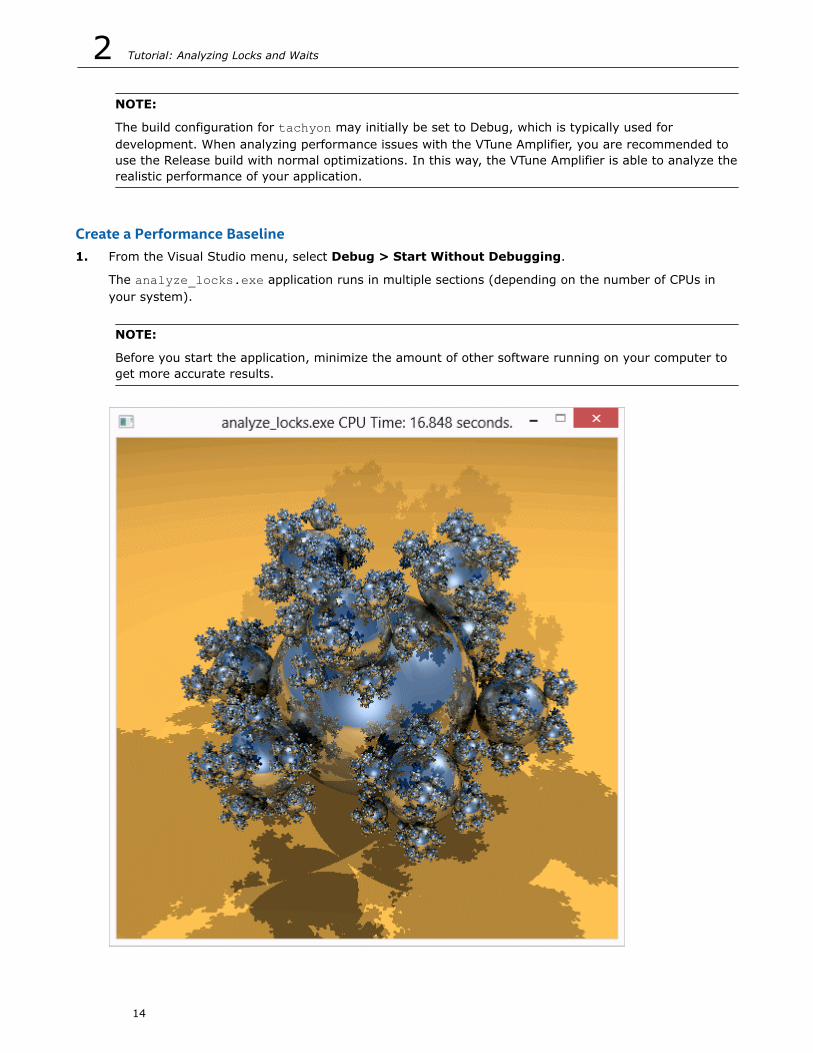
4. From the analyze_locks Property Pages dialog box, select Linker > Debugging and set theGenerate Debug Info option to Yes (/DEBUG).
5. Click Ok.
Build the Target in the Release ModeConfigure Visual Studio project properties to generate the debug information for your application so that theVTune Amplifier can open the source code.
1. Go to the Build > Configuration Manager... dialog box and select the Release mode for your targetproject.
2. From the Visual Studio menu, select Build > Build analyze_locks.
The analyze_locks.exe application is built.
Analyzing Locks and Waits 2
13
NOTE:
The build configuration for tachyon may initially be set to Debug, which is typically used fordevelopment. When analyzing performance issues with the VTune Amplifier, you are recommended touse the Release build with normal optimizations. In this way, the VTune Amplifier is able to analyze therealistic performance of your application.
Create a Performance Baseline1. From the Visual Studio menu, select Debug > Start Without Debugging.
The analyze_locks.exe application runs in multiple sections (depending on the number of CPUs inyour system).
NOTE:
Before you start the application, minimize the amount of other software running on your computer toget more accurate results.
2 Tutorial: Analyzing Locks and Waits
14
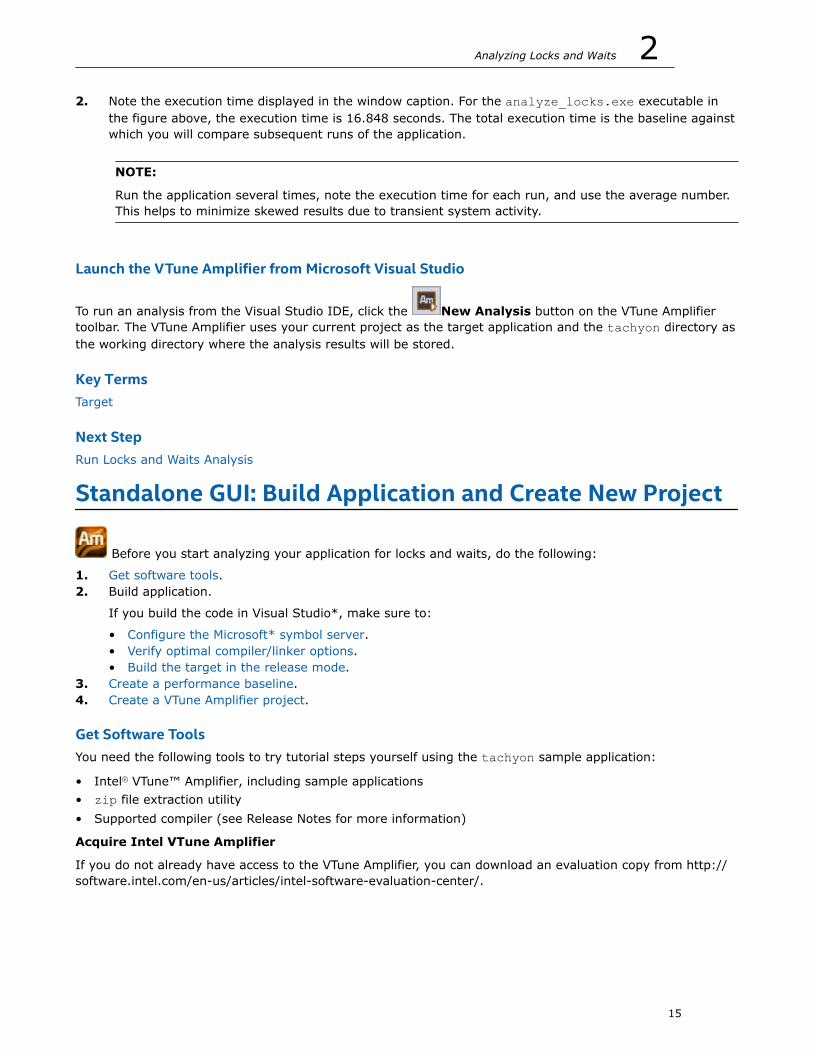
2. Note the execution time displayed in the window caption. For the analyze_locks.exe executable inthe figure above, the execution time is 16.848 seconds. The total execution time is the baseline againstwhich you will compare subsequent runs of the application.
NOTE:
Run the application several times, note the execution time for each run, and use the average number.This helps to minimize skewed results due to transient system activity.
Launch the VTune Amplifier from Microsoft Visual Studio
To run an analysis from the Visual Studio IDE, click the New Analysis button on the VTune Amplifiertoolbar. The VTune Amplifier uses your current project as the target application and the tachyon directory asthe working directory where the analysis results will be stored.
Key TermsTarget
Next StepRun Locks and Waits Analysis
Standalone GUI: Build Application and Create New Project
Before you start analyzing your application for locks and waits, do the following:
1. Get software tools.2. Build application.
If you build the code in Visual Studio*, make sure to:
• Configure the Microsoft* symbol server.• Verify optimal compiler/linker options.• Build the target in the release mode.
3. Create a performance baseline.4. Create a VTune Amplifier project.
Get Software ToolsYou need the following tools to try tutorial steps yourself using the tachyon sample application:
• Intel® VTune™ Amplifier, including sample applications• zip file extraction utility• Supported compiler (see Release Notes for more information)
Acquire Intel VTune Amplifier
If you do not already have access to the VTune Amplifier, you can download an evaluation copy from http://software.intel.com/en-us/articles/intel-software-evaluation-center/.
Analyzing Locks and Waits 2
15
NOTE:
This document focuses on using the VTune™ Amplifier in Intel® Parallel Studio XE Professional Edition.You may see minor differences if you installed a different Intel product. For more information onproduct capabilities in your installed product, see the product-specific supplemental documentation in<install-dir>/<Intel_product>/documentation/.
Install and Set Up VTune Amplifier Sample Applications
1. Copy the tachyon_vtune_amp_xe.zip file from the <install-dir>\samples\<locale>\C++\directory to a writable directory or share on your system.
NOTE:
The default installation path for the VTune Amplifier XE is [Program Files]\IntelSWTools\VTuneAmplifier XE <version>. For the VTune Amplifier for Systems, the default <install_dir> is[Program Files]\IntelSWTools\system_studio_<version>\VTune Amplifier for Systems.
2. Extract the sample from the .zip file.
NOTE:
• Samples are non-deterministic. Your screens may vary from the screen captures shown throughoutthis tutorial.
• Samples are designed only to illustrate the VTune Amplifier features; they do not represent bestpractices for creating code.
• The steps below are provided for Microsoft Visual Studio* 2013. Steps for other versions of VisualStudio IDE may differ slightly.
Configure the Microsoft* Symbol ServerConfigure the Visual Studio environment to download the debug information for system libraries so that theVTune Amplifier can properly identify system functions and classify/attribute functions.
1. Go to Tools > Options....
The Options dialog box opens.2. From the left pane, select Debugging > Symbols.3. In the Symbol file (.pdb) locations field, make sure the Microsoft Symbol Servers location is
selected. Otherwise, click the Add button, specify the following address: http://msdl.microsoft.com/download/symbols, and make sure the added address is checked.
4. In the Cache symbols in this directory field, specify a directory where the downloaded symbol fileswill be stored.
2 Tutorial: Analyzing Locks and Waits
16
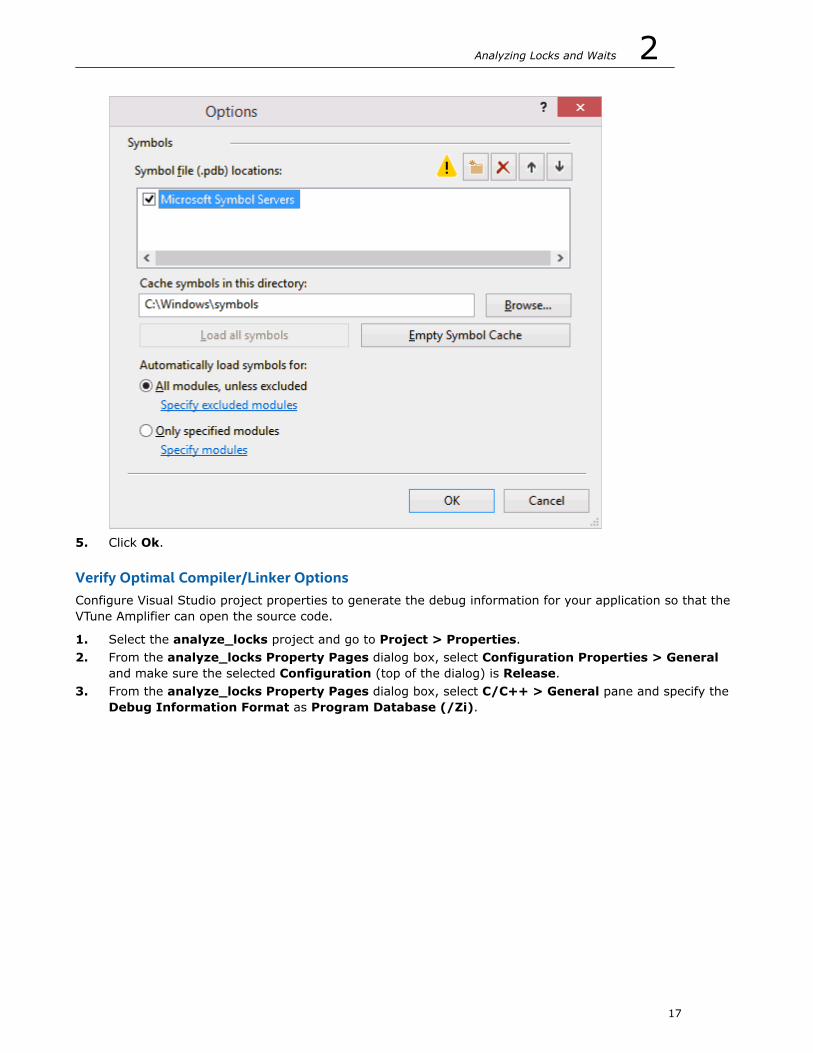
5. Click Ok.
Verify Optimal Compiler/Linker OptionsConfigure Visual Studio project properties to generate the debug information for your application so that theVTune Amplifier can open the source code.
1. Select the analyze_locks project and go to Project > Properties.2. From the analyze_locks Property Pages dialog box, select Configuration Properties > General
and make sure the selected Configuration (top of the dialog) is Release.3. From the analyze_locks Property Pages dialog box, select C/C++ > General pane and specify the
Debug Information Format as Program Database (/Zi).
Analyzing Locks and Waits 2
17
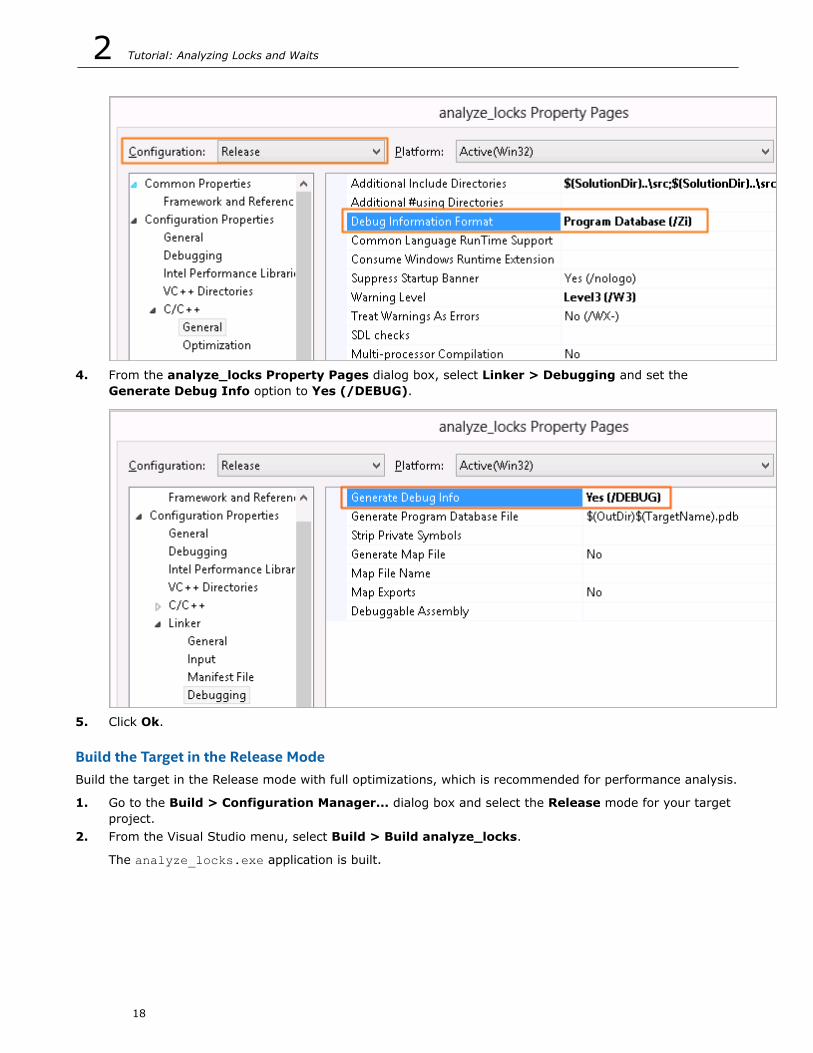
4. From the analyze_locks Property Pages dialog box, select Linker > Debugging and set theGenerate Debug Info option to Yes (/DEBUG).
5. Click Ok.
Build the Target in the Release ModeBuild the target in the Release mode with full optimizations, which is recommended for performance analysis.
1. Go to the Build > Configuration Manager... dialog box and select the Release mode for your targetproject.
2. From the Visual Studio menu, select Build > Build analyze_locks.
The analyze_locks.exe application is built.
2 Tutorial: Analyzing Locks and Waits
18

NOTE:
The build configuration for tachyon may initially be set to Debug, which is typically used fordevelopment. When analyzing performance issues with the VTune Amplifier, you are recommended touse the Release build with normal optimizations. In this way, the VTune Amplifier is able to analyze therealistic performance of your application.
Create a Performance Baseline1. From the Visual Studio menu, select Debug > Start Without Debugging.
The analyze_locks application runs in multiple sections (depending on the number of CPUs in yoursystem).
NOTE:
Before you start the application, minimize the amount of other software running on your computer toget more accurate results.
Analyzing Locks and Waits 2
19
2. Note the execution time displayed in the window caption. For the analyze_locks executable in thefigure above, the execution time is 16.848 seconds. The total execution time is the baseline againstwhich you will compare subsequent runs of the application.
NOTE:
Run the application several times, note the execution time for each run, and use the average number.This helps to minimize skewed results due to transient system activity.
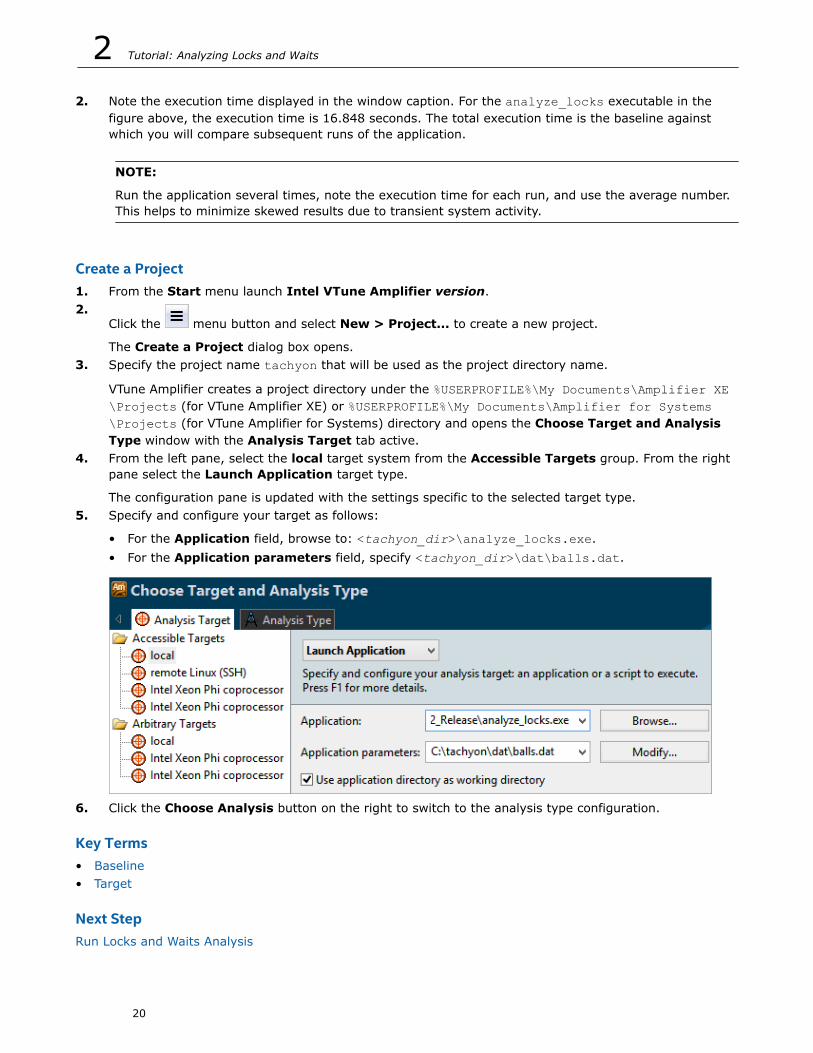
Create a Project1. From the Start menu launch Intel VTune Amplifier version.2.
Click the menu button and select New > Project... to create a new project.
The Create a Project dialog box opens.3. Specify the project name tachyon that will be used as the project directory name.
VTune Amplifier creates a project directory under the %USERPROFILE%\My Documents\Amplifier XE\Projects (for VTune Amplifier XE) or %USERPROFILE%\My Documents\Amplifier for Systems\Projects (for VTune Amplifier for Systems) directory and opens the Choose Target and AnalysisType window with the Analysis Target tab active.
4. From the left pane, select the local target system from the Accessible Targets group. From the rightpane select the Launch Application target type.
The configuration pane is updated with the settings specific to the selected target type.5. Specify and configure your target as follows:
• For the Application field, browse to: <tachyon_dir>\analyze_locks.exe.• For the Application parameters field, specify <tachyon_dir>\dat\balls.dat.
6. Click the Choose Analysis button on the right to switch to the analysis type configuration.
Key Terms• Baseline• Target
Next StepRun Locks and Waits Analysis
2 Tutorial: Analyzing Locks and Waits
20
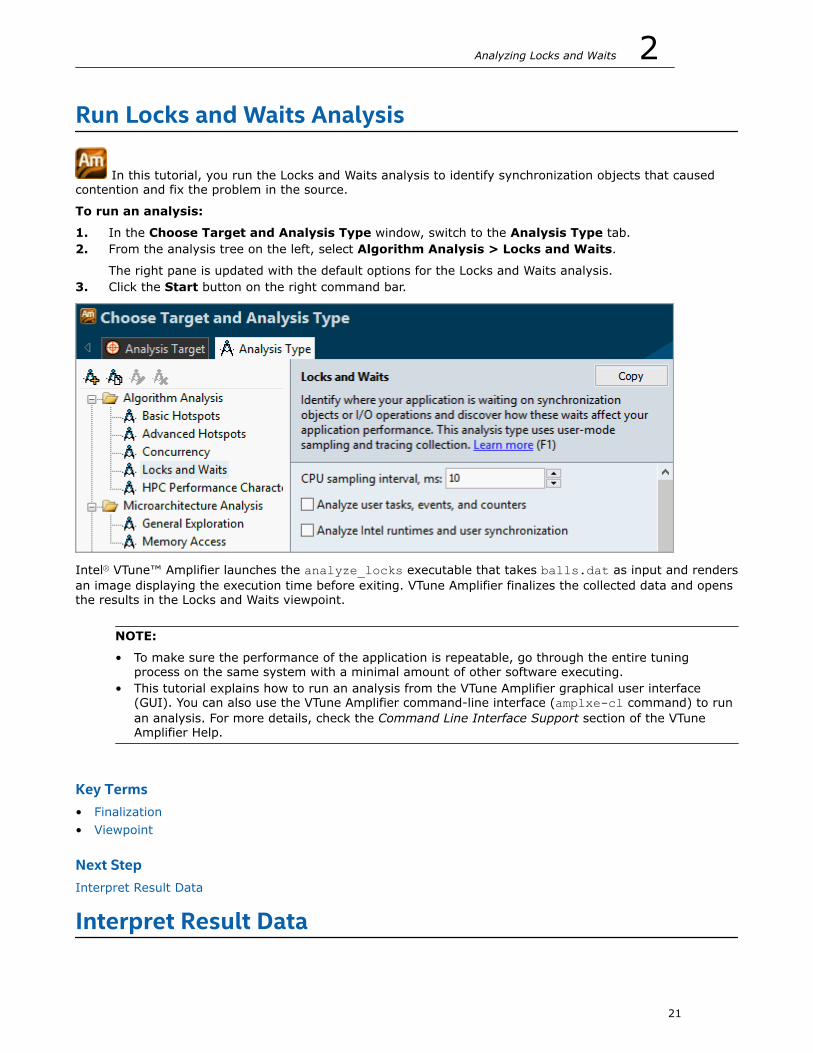
Run Locks and Waits Analysis
In this tutorial, you run the Locks and Waits analysis to identify synchronization objects that causedcontention and fix the problem in the source.
To run an analysis:
1. In the Choose Target and Analysis Type window, switch to the Analysis Type tab.2. From the analysis tree on the left, select Algorithm Analysis > Locks and Waits.
The right pane is updated with the default options for the Locks and Waits analysis.3. Click the Start button on the right command bar.
Intel® VTune™ Amplifier launches the analyze_locks executable that takes balls.dat as input and rendersan image displaying the execution time before exiting. VTune Amplifier finalizes the collected data and opensthe results in the Locks and Waits viewpoint.
NOTE:
• To make sure the performance of the application is repeatable, go through the entire tuningprocess on the same system with a minimal amount of other software executing.
• This tutorial explains how to run an analysis from the VTune Amplifier graphical user interface(GUI). You can also use the VTune Amplifier command-line interface (amplxe-cl command) to runan analysis. For more details, check the Command Line Interface Support section of the VTuneAmplifier Help.
Key Terms• Finalization• Viewpoint
Next StepInterpret Result Data
Interpret Result Data
Analyzing Locks and Waits 2
21
When the sample application exits, the Intel® VTune™ Amplifier finalizes the results and opens theLocks and Waits viewpoint where each window or pane is configured to display CPU time utilization of thesynchronization objects during a wait. To interpret the data on the sample code performance, do thefollowing:
1. Analyze the basic performance metrics provided by the Locks and Waits analysis.2. Identify locks.
NOTE:
The screen shots and execution time data provided in this tutorial are created on a system with 12CPU cores. Your data may vary depending on the number and type of CPU cores on your system.
Analyze the Basic Locks and Waits MetricsStart with exploring the data provided in the Summary window for the whole application performance. To
interpret the data, hover over the question mark icons to read the pop-up help and better understandwhat each performance metric means.
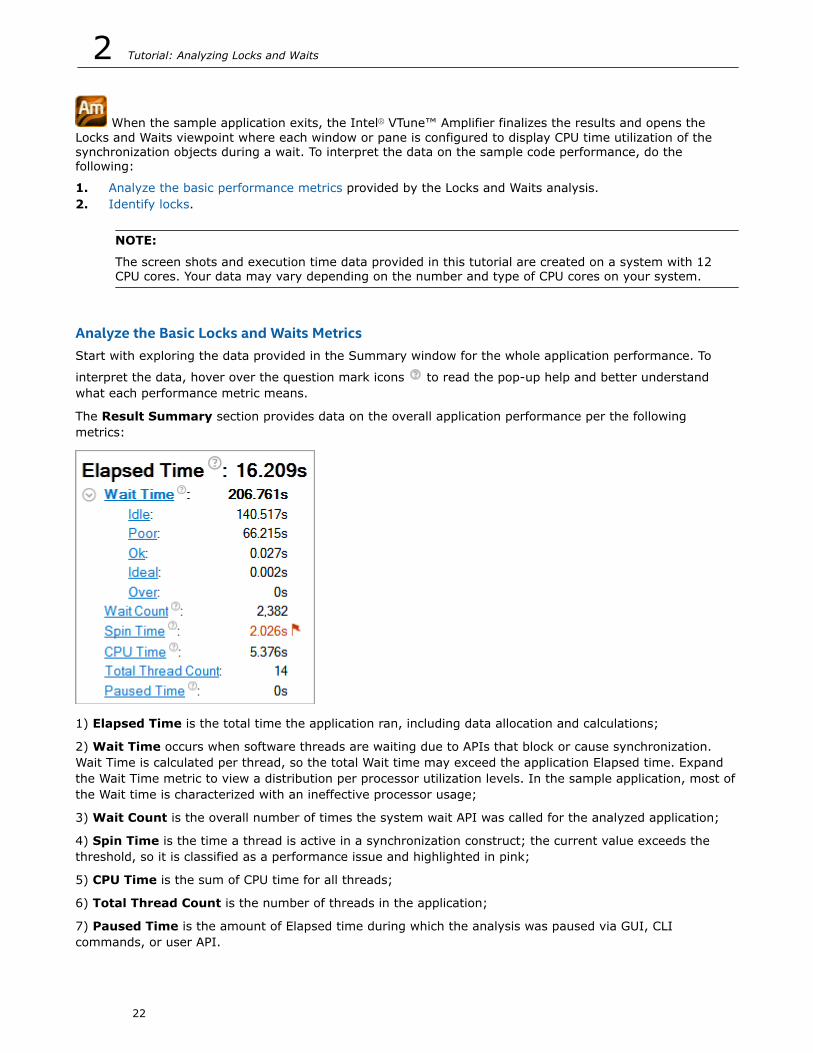
The Result Summary section provides data on the overall application performance per the followingmetrics:
1) Elapsed Time is the total time the application ran, including data allocation and calculations;
2) Wait Time occurs when software threads are waiting due to APIs that block or cause synchronization.Wait Time is calculated per thread, so the total Wait time may exceed the application Elapsed time. Expandthe Wait Time metric to view a distribution per processor utilization levels. In the sample application, most ofthe Wait time is characterized with an ineffective processor usage;
3) Wait Count is the overall number of times the system wait API was called for the analyzed application;
4) Spin Time is the time a thread is active in a synchronization construct; the current value exceeds thethreshold, so it is classified as a performance issue and highlighted in pink;
5) CPU Time is the sum of CPU time for all threads;
6) Total Thread Count is the number of threads in the application;
7) Paused Time is the amount of Elapsed time during which the analysis was paused via GUI, CLIcommands, or user API.
2 Tutorial: Analyzing Locks and Waits
22
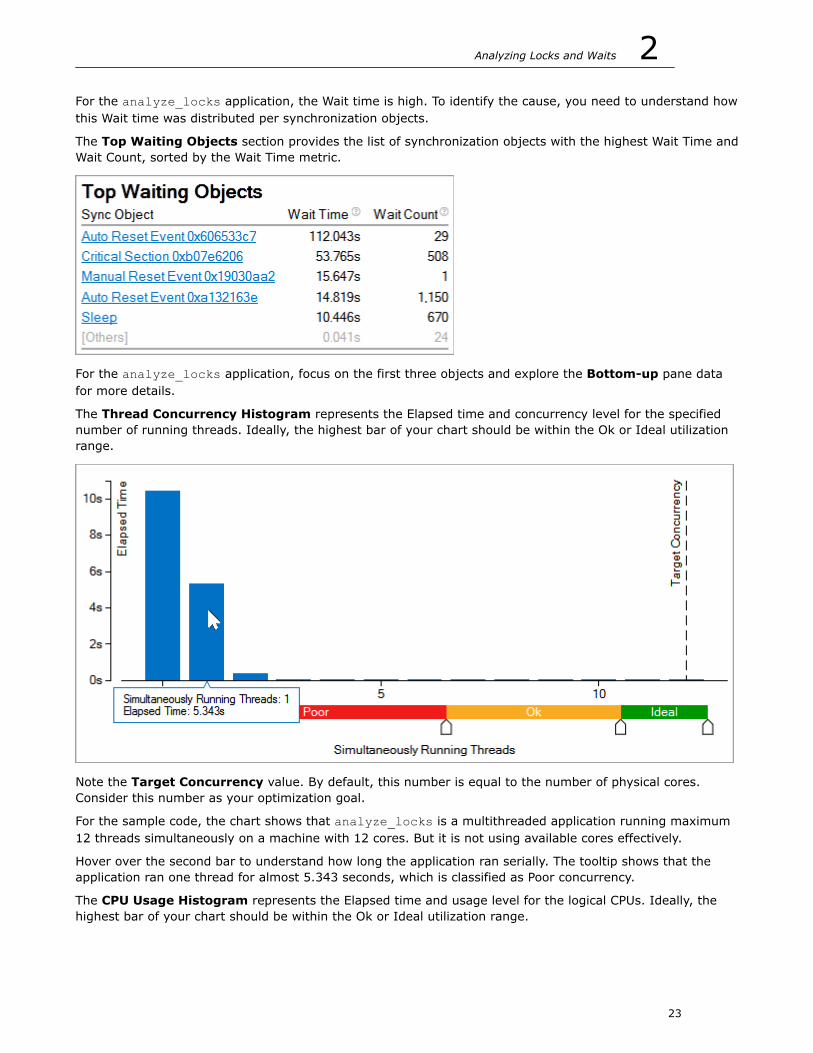
For the analyze_locks application, the Wait time is high. To identify the cause, you need to understand howthis Wait time was distributed per synchronization objects.
The Top Waiting Objects section provides the list of synchronization objects with the highest Wait Time andWait Count, sorted by the Wait Time metric.
For the analyze_locks application, focus on the first three objects and explore the Bottom-up pane datafor more details.
The Thread Concurrency Histogram represents the Elapsed time and concurrency level for the specifiednumber of running threads. Ideally, the highest bar of your chart should be within the Ok or Ideal utilizationrange.
Note the Target Concurrency value. By default, this number is equal to the number of physical cores.Consider this number as your optimization goal.
For the sample code, the chart shows that analyze_locks is a multithreaded application running maximum12 threads simultaneously on a machine with 12 cores. But it is not using available cores effectively.
Hover over the second bar to understand how long the application ran serially. The tooltip shows that theapplication ran one thread for almost 5.343 seconds, which is classified as Poor concurrency.
The CPU Usage Histogram represents the Elapsed time and usage level for the logical CPUs. Ideally, thehighest bar of your chart should be within the Ok or Ideal utilization range.
Analyzing Locks and Waits 2
23
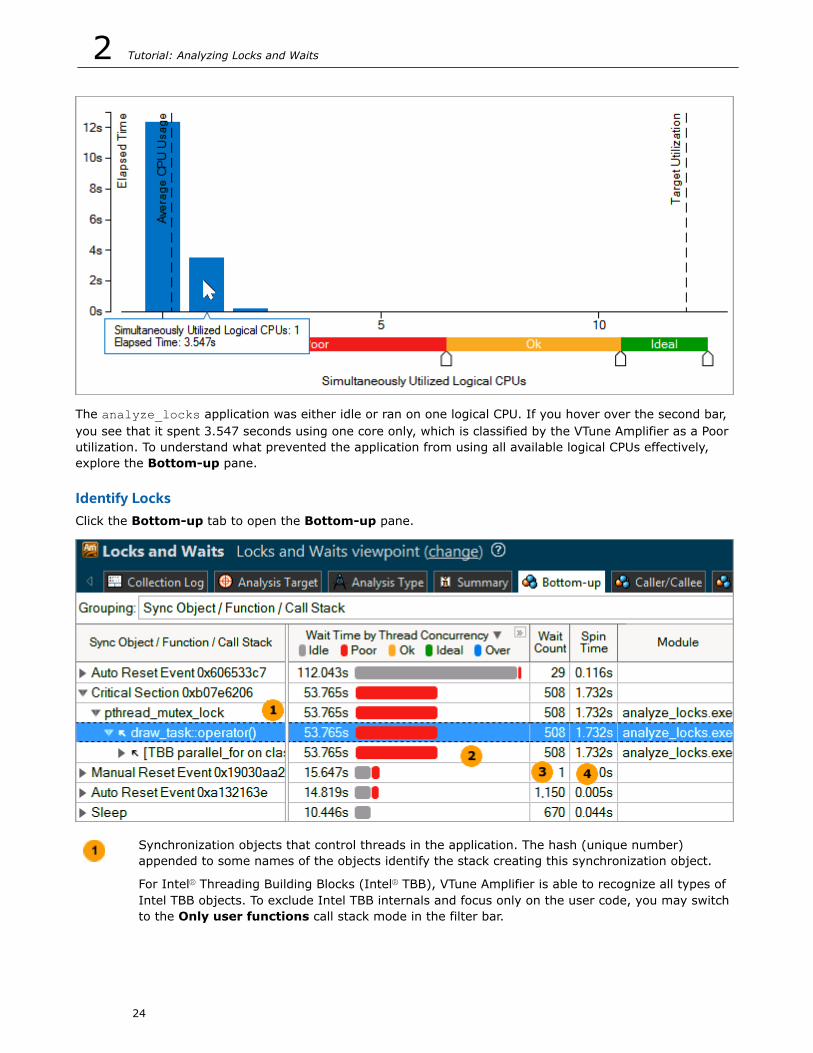
The analyze_locks application was either idle or ran on one logical CPU. If you hover over the second bar,you see that it spent 3.547 seconds using one core only, which is classified by the VTune Amplifier as a Poorutilization. To understand what prevented the application from using all available logical CPUs effectively,explore the Bottom-up pane.
Identify LocksClick the Bottom-up tab to open the Bottom-up pane.
Synchronization objects that control threads in the application. The hash (unique number)appended to some names of the objects identify the stack creating this synchronization object.
For Intel® Threading Building Blocks (Intel® TBB), VTune Amplifier is able to recognize all types ofIntel TBB objects. To exclude Intel TBB internals and focus only on the user code, you may switchto the Only user functions call stack mode in the filter bar.
2 Tutorial: Analyzing Locks and Waits
24
The utilization of the processor time when a given thread waited for some event to occur. Bydefault, the synchronization objects are sorted by Wait Time by Thread Concurrency . Barsshowing OK or Ideal level (orange and green) show effective thread concurrency for existingnumber of cores. You should focus your optimization efforts on functions with the longest poor
concurrency (red bars if the bar format is selected). Next, search for the longest over-utilized
time (blue bars).
Number of times the corresponding system wait API was called. For a lock, it is the number oftimes the lock was contended and caused a wait. Usually you are recommended to focus yourtuning efforts on the waits with both high Wait Time and Wait Count values, especially if theyhave poor utilization.
Wait time, during which the CPU is busy. This often occurs when a synchronization API causes theCPU to poll while the software thread is waiting. Some Spin time may be preferable to thealternative of the increased thread context switches. However, too much Spin time can reflect lostopportunity for productive work.
For the analyzed sample code, you see that the second object caused the longest Wait Time with Poor threadconcurrency . The red bar in the Wait Time by Thread Concurrency column indicates that most of thetime for this object processor cores were underutilized. It is a Critical Section that shows much serial time
and is causing a wait. Click the arrow sign at the object name to expand the node and see the draw_taskwait function that contains this critical section and call stack. Double-click this wait function to see the sourcecode.
Key Terms• CPU usage• Elapsed time• Wait time
Next StepAnalyze Code
Analyze Code
You identified the critical section that caused significant Wait time and poor processor utilization.Double-click this critical section in the Bottom-up pane to view the source. Intel® VTune™ Amplifier openssource and disassembly code. Focus on the Source pane and analyze the source code:
1. Understand basic options provided in the Source window.2. Identify the hottest code lines.
Analyzing Locks and Waits 2
25
Understand Basic Source View Options
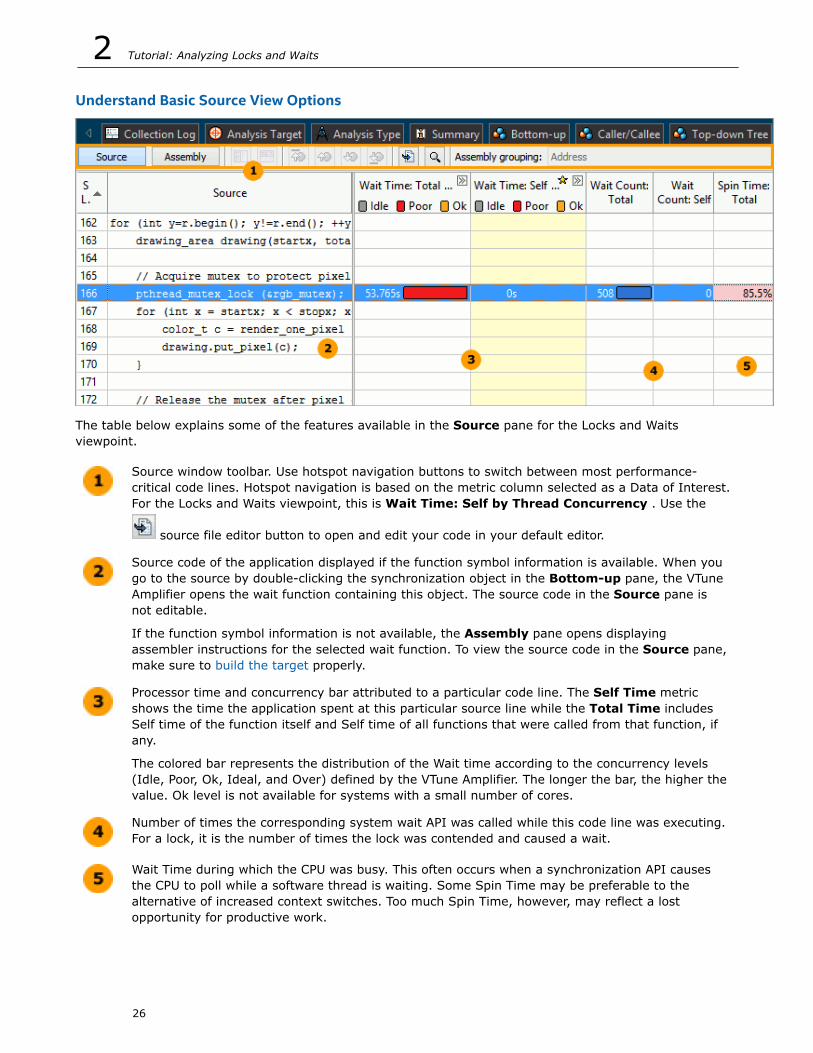
The table below explains some of the features available in the Source pane for the Locks and Waitsviewpoint.
Source window toolbar. Use hotspot navigation buttons to switch between most performance-critical code lines. Hotspot navigation is based on the metric column selected as a Data of Interest.For the Locks and Waits viewpoint, this is Wait Time: Self by Thread Concurrency . Use the
source file editor button to open and edit your code in your default editor.
Source code of the application displayed if the function symbol information is available. When yougo to the source by double-clicking the synchronization object in the Bottom-up pane, the VTuneAmplifier opens the wait function containing this object. The source code in the Source pane isnot editable.
If the function symbol information is not available, the Assembly pane opens displayingassembler instructions for the selected wait function. To view the source code in the Source pane,make sure to build the target properly.
Processor time and concurrency bar attributed to a particular code line. The Self Time metricshows the time the application spent at this particular source line while the Total Time includesSelf time of the function itself and Self time of all functions that were called from that function, ifany.
The colored bar represents the distribution of the Wait time according to the concurrency levels(Idle, Poor, Ok, Ideal, and Over) defined by the VTune Amplifier. The longer the bar, the higher thevalue. Ok level is not available for systems with a small number of cores.
Number of times the corresponding system wait API was called while this code line was executing.For a lock, it is the number of times the lock was contended and caused a wait.
Wait Time during which the CPU was busy. This often occurs when a synchronization API causesthe CPU to poll while a software thread is waiting. Some Spin Time may be preferable to thealternative of increased context switches. Too much Spin Time, however, may reflect a lostopportunity for productive work.
2 Tutorial: Analyzing Locks and Waits
26
Identify the Hottest Code LinesFor the sample code, the VTune Amplifier highlights line 166 entering the rgb_mutex mutex in thedraw_task function. The draw_task function was waiting for almost 54 seconds while this code line wasexecuting and most of the time the processor was underutilized. During this time, the critical section wascontended 508 times.
The rgb_mutex is the place where the application is serializing. Each thread has to wait for the mutex to beavailable before it can proceed. Only one thread can be in the mutex at a time. You need to optimize the
code to make it more concurrent. Click the Source Editor button on the Source window toolbar to openthe code editor and optimize the code.
Key Terms• CPU Usage• Wait Time
Next StepRemove Lock
Remove Lock
In the Source window, you located the critical section that caused a significant wait while theprocessor cores were underutilized and generated multiple wait count. Focus on this line and do thefollowing:
1. Open the code editor.2. Modify the code to remove the lock.
Open the Code Editor
Click the Source Editor button to open the analyze_locks.cpp file in your default editor at the hotspotcode line:
Analyzing Locks and Waits 2
27
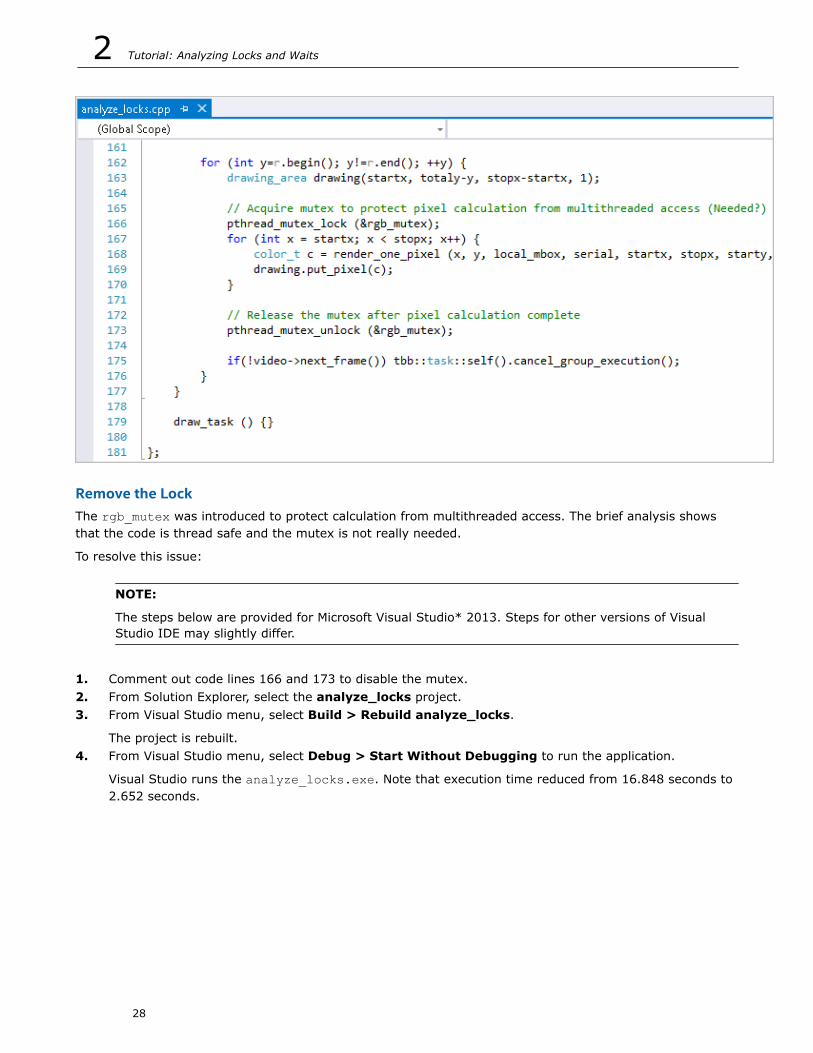
Remove the LockThe rgb_mutex was introduced to protect calculation from multithreaded access. The brief analysis showsthat the code is thread safe and the mutex is not really needed.
To resolve this issue:
NOTE:
The steps below are provided for Microsoft Visual Studio* 2013. Steps for other versions of VisualStudio IDE may slightly differ.
1. Comment out code lines 166 and 173 to disable the mutex.2. From Solution Explorer, select the analyze_locks project.3. From Visual Studio menu, select Build > Rebuild analyze_locks.
The project is rebuilt.4. From Visual Studio menu, select Debug > Start Without Debugging to run the application.
Visual Studio runs the analyze_locks.exe. Note that execution time reduced from 16.848 seconds to2.652 seconds.
2 Tutorial: Analyzing Locks and Waits
28
Key TermsHotspot
Next StepCompare with Previous Result
Compare with Previous Result
You made sure that removing the mutex gave you optimization in the application execution time. Tounderstand the impact of your changes and how the CPU utilization has changed, re-run the Locks and Waitsanalysis on the optimized code and compare results:
1. Compare results before and after optimization.2. Identify the performance gain.
Analyzing Locks and Waits 2
29
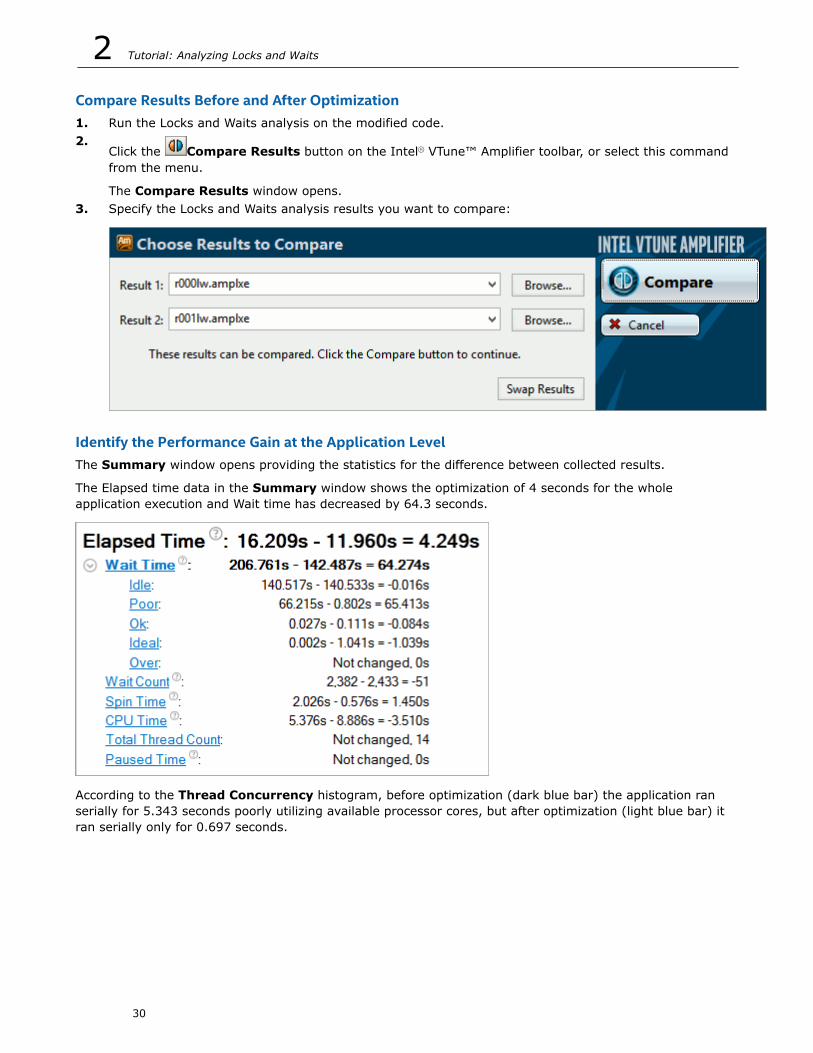
Compare Results Before and After Optimization1. Run the Locks and Waits analysis on the modified code.2.
Click the Compare Results button on the Intel® VTune™ Amplifier toolbar, or select this commandfrom the menu.
The Compare Results window opens.3. Specify the Locks and Waits analysis results you want to compare:
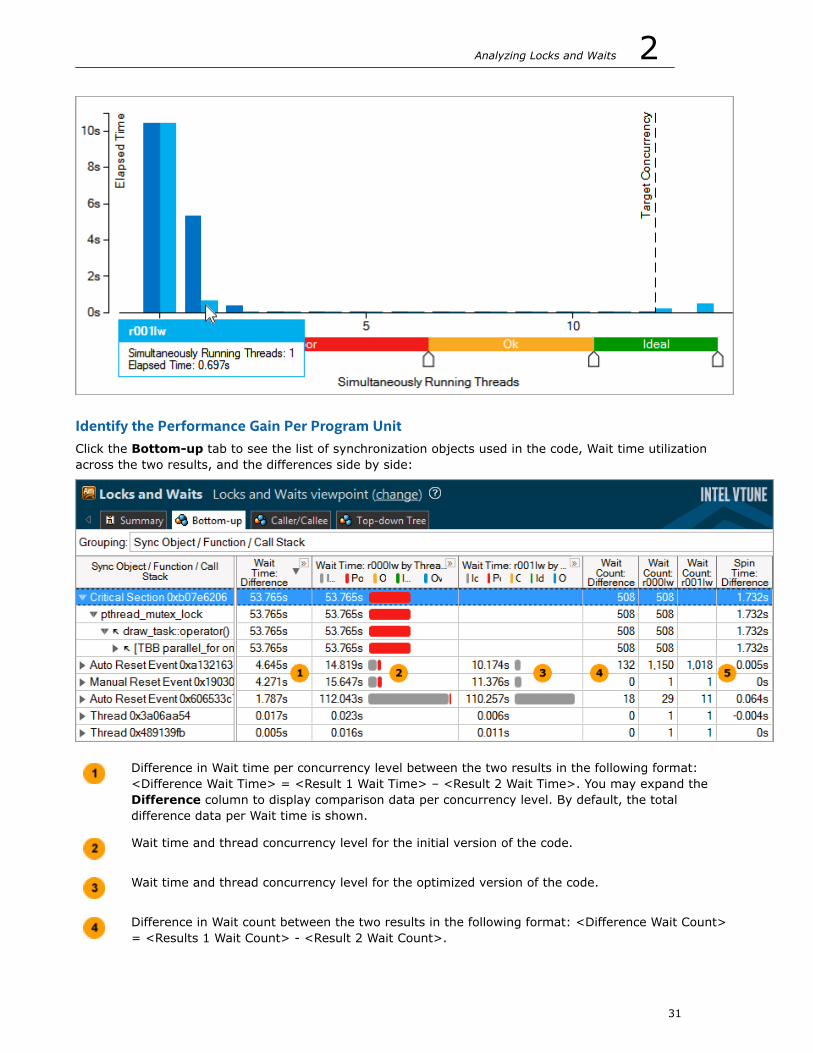
Identify the Performance Gain at the Application LevelThe Summary window opens providing the statistics for the difference between collected results.
The Elapsed time data in the Summary window shows the optimization of 4 seconds for the wholeapplication execution and Wait time has decreased by 64.3 seconds.
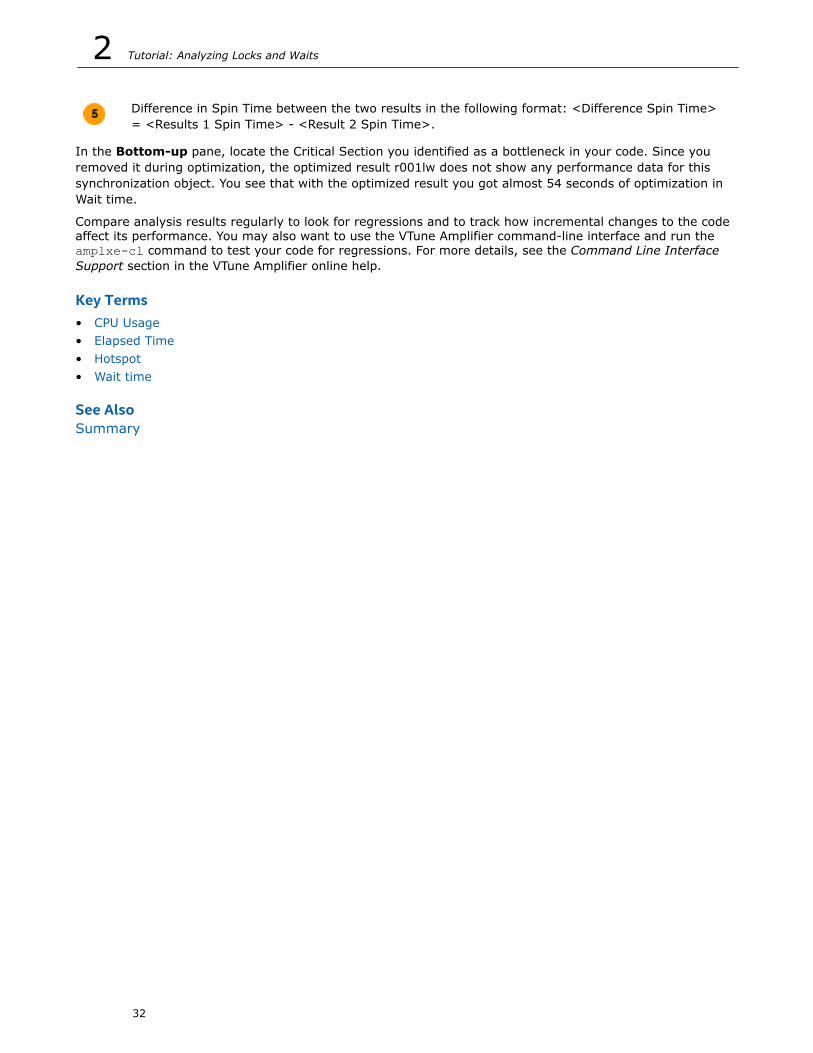
According to the Thread Concurrency histogram, before optimization (dark blue bar) the application ranserially for 5.343 seconds poorly utilizing available processor cores, but after optimization (light blue bar) itran serially only for 0.697 seconds.
2 Tutorial: Analyzing Locks and Waits
30
Identify the Performance Gain Per Program UnitClick the Bottom-up tab to see the list of synchronization objects used in the code, Wait time utilizationacross the two results, and the differences side by side:
Difference in Wait time per concurrency level between the two results in the following format:<Difference Wait Time> = <Result 1 Wait Time> – <Result 2 Wait Time>. You may expand theDifference column to display comparison data per concurrency level. By default, the totaldifference data per Wait time is shown.
Wait time and thread concurrency level for the initial version of the code.
Wait time and thread concurrency level for the optimized version of the code.
Difference in Wait count between the two results in the following format: <Difference Wait Count>= <Results 1 Wait Count> - <Result 2 Wait Count>.
Analyzing Locks and Waits 2
31
Difference in Spin Time between the two results in the following format: <Difference Spin Time>= <Results 1 Spin Time> - <Result 2 Spin Time>.
In the Bottom-up pane, locate the Critical Section you identified as a bottleneck in your code. Since youremoved it during optimization, the optimized result r001lw does not show any performance data for thissynchronization object. You see that with the optimized result you got almost 54 seconds of optimization inWait time.
Compare analysis results regularly to look for regressions and to track how incremental changes to the codeaffect its performance. You may also want to use the VTune Amplifier command-line interface and run theamplxe-cl command to test your code for regressions. For more details, see the Command Line InterfaceSupport section in the VTune Amplifier online help.
Key Terms• CPU Usage• Elapsed Time• Hotspot• Wait time
See AlsoSummary
2 Tutorial: Analyzing Locks and Waits
32
Summary 3 You have completed the Analyzing Locks and Waits tutorial. Here are some important things to
remember when using the Intel® VTune™ Amplifier to analyze your code for locks and waits:
Step Tutorial Recap Key Tutorial Take-aways
1. Prepare foranalysis
If you used the Visual Studio* IDE:You selected the analyze_locksproject as the target for the Locksand Waits analysis.
If you used the standalone GUI: Youset up your environment to enablegenerating symbol information forsystem libraries and your binary files,built the target in the Release mode,created the performance baseline,and created the VTune Amplifierproject for your analysis target. Yourapplication is ready for analysis.
• Configure the Microsoft* symbol serverand your project properties to get themost accurate results for system anduser binaries and to analyze theperformance of your application at thecode line level.
• Create a performance baseline tocompare the application versions beforeand after optimization. Make sure to usethe same workload for each applicationrun.
• Use the Analysis Target tab to chooseand configure your analysis target. ForVisual Studio* projects, the analysistarget settings are inheritedautomatically.
2. Find lock You ran the Locks and Waits datacollection and identified the followinghotspots:• Synchronization object with the
high Wait Time and Wait Countvalues and poor threadconcurrency that could be a lockaffecting application parallelism.Your next step is to analyze thecode of this function.
• Code section that caused asignificant wait and during whichthe processor was poorly utilized.
• Use the Analysis Type tab to choose,configure, and run the analysis. You canalso run the analysis from command lineusing the amplxe-cl command.
• Start analyzing the performance of yourapplication with the Summary windowto explore the performance metrics forthe whole application. Then, move to theBottom-up window to analyze thesynchronization objects. Focus on thesynchronization objects that under- orover-utilized the available logical CPUsand have the highest Wait time and WaitCount values. By default, the objectswith the highest Wait time values showup at the top of the window.
3. Remove lock You optimized the applicationexecution time by removing theunnecessary mutex that caused a lotof Wait time.
Expand the most time-criticalsynchronization object in the Bottom-uppane and double-click the wait function itbelongs to. This opens the source code forthis wait function and you can navigate tothe most performance critical source lines.
4. Check yourwork
You ran the Locks and Waits analysison the optimized code and comparedthe results before and afteroptimization using the Comparemode of the VTune Amplifier. The
• Perform regular regression testing bycomparing analysis results before andafter optimization. From GUI, click the
33

Step Tutorial Recap Key Tutorial Take-aways
comparison shows that, with theoptimized version of theanalyze_locks application (r001lwresult), you managed to remove thelock preventing applicationparallelism and significantly reducethe application execution time.
Compare Results button on theVTune Amplifier toolbar. From commandline, use the amplxe-cl command.
• Expand each data column by clicking the button to identify the performance
gain per thread concurrency level.
Next step: Prepare your own application(s) for analysis. Then use the VTune Amplifier to find and eliminatelocks preventing parallelism.
See AlsoClick here for more Getting Started Tutorials
3 Tutorial: Analyzing Locks and Waits
34
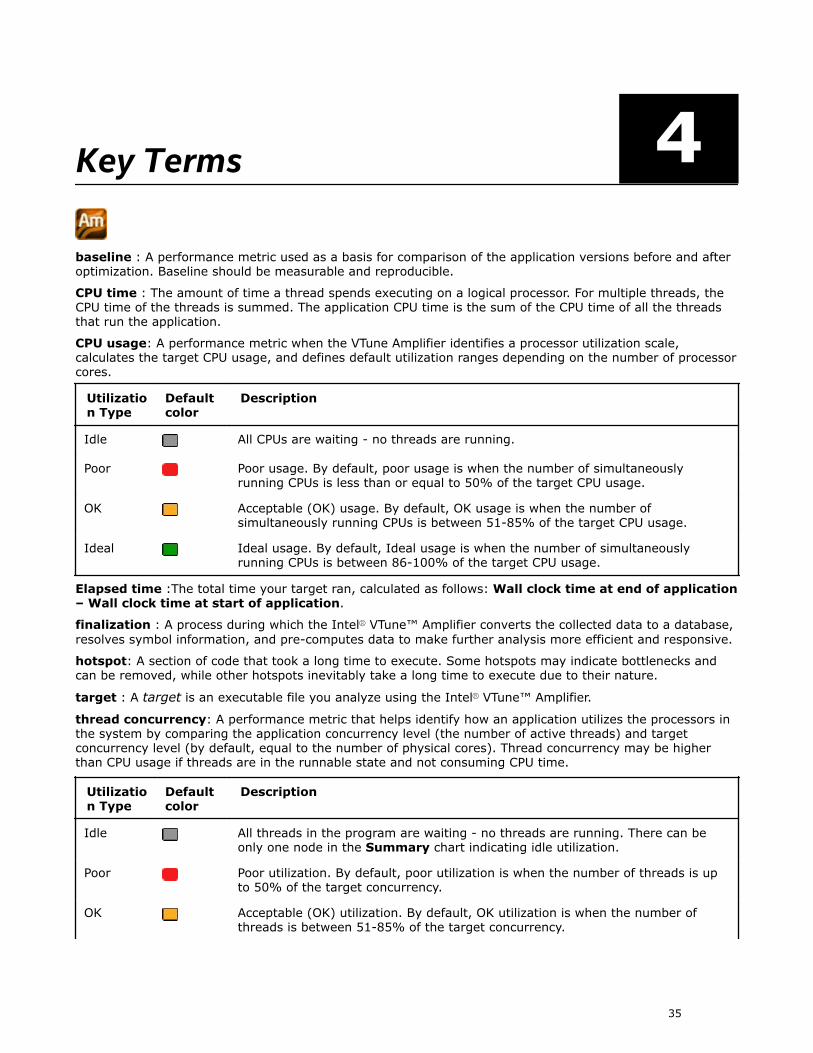
Key Terms 4baseline : A performance metric used as a basis for comparison of the application versions before and afteroptimization. Baseline should be measurable and reproducible.
CPU time : The amount of time a thread spends executing on a logical processor. For multiple threads, theCPU time of the threads is summed. The application CPU time is the sum of the CPU time of all the threadsthat run the application.
CPU usage: A performance metric when the VTune Amplifier identifies a processor utilization scale,calculates the target CPU usage, and defines default utilization ranges depending on the number of processorcores.
Utilization Type
Defaultcolor
Description
Idle All CPUs are waiting - no threads are running.
Poor Poor usage. By default, poor usage is when the number of simultaneouslyrunning CPUs is less than or equal to 50% of the target CPU usage.
OK Acceptable (OK) usage. By default, OK usage is when the number ofsimultaneously running CPUs is between 51-85% of the target CPU usage.
Ideal Ideal usage. By default, Ideal usage is when the number of simultaneouslyrunning CPUs is between 86-100% of the target CPU usage.
Elapsed time :The total time your target ran, calculated as follows: Wall clock time at end of application– Wall clock time at start of application.
finalization : A process during which the Intel® VTune™ Amplifier converts the collected data to a database,resolves symbol information, and pre-computes data to make further analysis more efficient and responsive.
hotspot: A section of code that took a long time to execute. Some hotspots may indicate bottlenecks andcan be removed, while other hotspots inevitably take a long time to execute due to their nature.
target : A target is an executable file you analyze using the Intel® VTune™ Amplifier.
thread concurrency: A performance metric that helps identify how an application utilizes the processors inthe system by comparing the application concurrency level (the number of active threads) and targetconcurrency level (by default, equal to the number of physical cores). Thread concurrency may be higherthan CPU usage if threads are in the runnable state and not consuming CPU time.
Utilization Type
Defaultcolor
Description
Idle All threads in the program are waiting - no threads are running. There can beonly one node in the Summary chart indicating idle utilization.
Poor Poor utilization. By default, poor utilization is when the number of threads is upto 50% of the target concurrency.
OK Acceptable (OK) utilization. By default, OK utilization is when the number ofthreads is between 51-85% of the target concurrency.
35
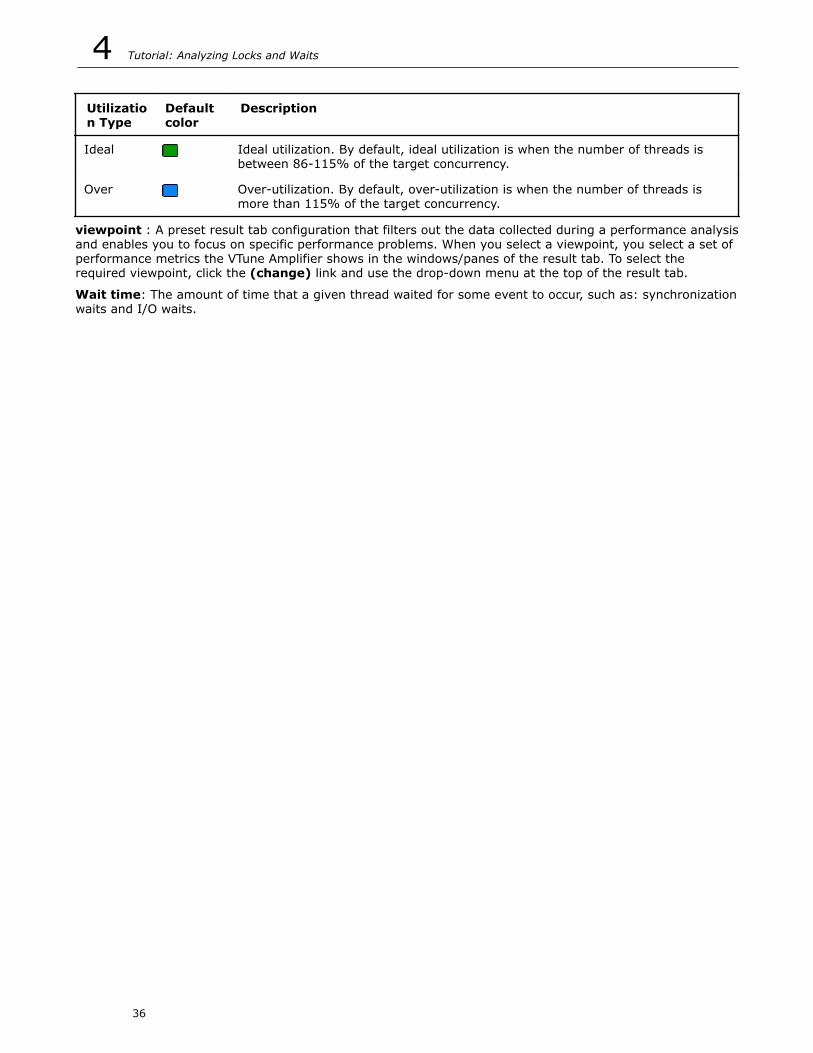
Utilization Type
Defaultcolor
Description
Ideal Ideal utilization. By default, ideal utilization is when the number of threads isbetween 86-115% of the target concurrency.
Over Over-utilization. By default, over-utilization is when the number of threads ismore than 115% of the target concurrency.
viewpoint : A preset result tab configuration that filters out the data collected during a performance analysisand enables you to focus on specific performance problems. When you select a viewpoint, you select a set ofperformance metrics the VTune Amplifier shows in the windows/panes of the result tab. To select therequired viewpoint, click the (change) link and use the drop-down menu at the top of the result tab.
Wait time: The amount of time that a given thread waited for some event to occur, such as: synchronizationwaits and I/O waits.
4 Tutorial: Analyzing Locks and Waits
36