Embed Size (px)
Citation preview
Page 1 of 8
Tutorial: Assessing and Computing the Safety Integrity Level (SIL) for Turbo Machinery Protection
Curt Miller
SIS SILverstone LLC
General Manager / Principal Consultant
11999 Katy Freeway, Suite 600
Houston, TX 77079
Ph: 832-439-3793
Justin Kassie
Tesoro
Lead Reliability Engineer
2350 E. 223rd Street, Carson CA 90745
Ph: 310-233-6034
Dan Poston
LyondellBasell
Consulting Engineer, Global Projects & Engineering
202 N. Castlegory Rd, Houston, Texas 77049
Ph: 832-679-8710
ABSTRACT
The application of Safety Integrity Level (SIL) to support risk
management strategy on turbo machinery protection systems is
relatively new to the process industry. Few end users and
manufacturers fully understand the methodology used for
determining, assessing and computing the SIL of protection
systems on their machines.
SIL is quickly becoming the new standard by which the industry,
manufacturers and end users will be held to by regulators as good
engineering practice. Specifically supporting turbomachinery, the
latest API Standard 670, Machinery Protection Systems [R1] has
embraced such methodology and included Appendix L, an
informative section on Safety Integrity Level on its application.
This tutorial attempts to explain the Basics of SIL, how it is
applied, and what end users need to know to effectively assess their
machinery protection systems. It provides examples for assessing
existing systems and how to compute SIL levels for new and older
systems. It shows common SIL ratings for turbine driven trains,
reciprocating compressors, motor and gas turbine driven
equipment. This tutorial will also highlight the economic
justification and cost benefit of utilizing SIL on machinery
protection systems.
Not knowing or understanding SIL as it applies to machinery
protection will not be an excuse in the future. This tutorial will
provide a good opportunity to learn more about SIL and its
application to turbo machinery protection.
BACKGROUND ON RISK MANAGEMENT AND
APPLICATION OF SIL
The need for a more quantitative approach to risk mitigation dates
back over 20 years. The background leading to such practices is
supported in this first section which details previous incidents,
process safety codes and standards, and a review of qualitative
deficiencies.
Historical Incidents and Incentives for Change
Most are familiar with the large catastrophic incidents that
stimulated the process safety changes. Namely, who could forget?
Flixborough, England
Bhopal, India
Piper Alpha
Philips, Pasadena
In each of these cases, risk was not recognized and catastrophic
results occurred due to changes made without a full review of
engineered protective systems.
But are you aware of the magnitude of rotating equipment failure
for similar issues? In 2009, Mr. Edward Clark published Steam
Turbine Overspeed Incidents and it combined listings from three
respected consultants [R2]. Below is a table summarizing the
number of serious consequences from the 110 turbine overspeed
cases presented in the study.
Consequence Period No. %/Period
Major $$ Cost During Ops 30 27%
Fatality During Ops 3 4%
During Testing 3 12%
Major Incidents/ Total 36/110 33%
Table 1: Summary of Steam Turbine Overspeed Incidents
Page 2 of 8
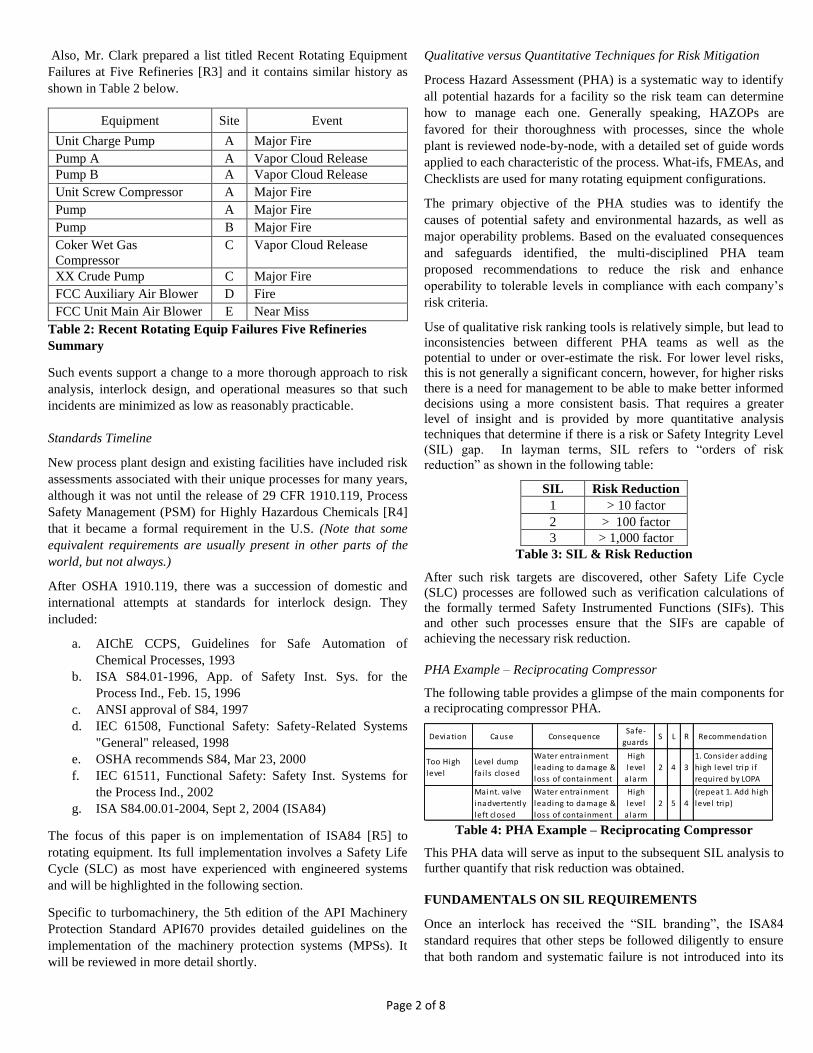
Also, Mr. Clark prepared a list titled Recent Rotating Equipment
Failures at Five Refineries [R3] and it contains similar history as
shown in Table 2 below.
Equipment Site Event
Unit Charge Pump A Major Fire
Pump A A Vapor Cloud Release
Pump B A Vapor Cloud Release
Unit Screw Compressor A Major Fire
Pump A Major Fire
Pump B Major Fire
Coker Wet Gas
Compressor
C Vapor Cloud Release
XX Crude Pump C Major Fire
FCC Auxiliary Air Blower D Fire
FCC Unit Main Air Blower E Near Miss
Table 2: Recent Rotating Equip Failures Five Refineries
Summary
Such events support a change to a more thorough approach to risk
analysis, interlock design, and operational measures so that such
incidents are minimized as low as reasonably practicable.
Standards Timeline
New process plant design and existing facilities have included risk
assessments associated with their unique processes for many years,
although it was not until the release of 29 CFR 1910.119, Process
Safety Management (PSM) for Highly Hazardous Chemicals [R4]
that it became a formal requirement in the U.S. (Note that some
equivalent requirements are usually present in other parts of the
world, but not always.)
After OSHA 1910.119, there was a succession of domestic and
international attempts at standards for interlock design. They
included:
a. AIChE CCPS, Guidelines for Safe Automation of
Chemical Processes, 1993
b. ISA S84.01-1996, App. of Safety Inst. Sys. for the
Process Ind., Feb. 15, 1996
c. ANSI approval of S84, 1997
d. IEC 61508, Functional Safety: Safety-Related Systems
"General" released, 1998
e. OSHA recommends S84, Mar 23, 2000
f. IEC 61511, Functional Safety: Safety Inst. Systems for
the Process Ind., 2002
g. ISA S84.00.01-2004, Sept 2, 2004 (ISA84)
The focus of this paper is on implementation of ISA84 [R5] to
rotating equipment. Its full implementation involves a Safety Life
Cycle (SLC) as most have experienced with engineered systems
and will be highlighted in the following section.
Specific to turbomachinery, the 5th edition of the API Machinery
Protection Standard API670 provides detailed guidelines on the
implementation of the machinery protection systems (MPSs). It
will be reviewed in more detail shortly.
Qualitative versus Quantitative Techniques for Risk Mitigation
Process Hazard Assessment (PHA) is a systematic way to identify
all potential hazards for a facility so the risk team can determine
how to manage each one. Generally speaking, HAZOPs are
favored for their thoroughness with processes, since the whole
plant is reviewed node-by-node, with a detailed set of guide words
applied to each characteristic of the process. What-ifs, FMEAs, and
Checklists are used for many rotating equipment configurations.
The primary objective of the PHA studies was to identify the
causes of potential safety and environmental hazards, as well as
major operability problems. Based on the evaluated consequences
and safeguards identified, the multi-disciplined PHA team
proposed recommendations to reduce the risk and enhance
operability to tolerable levels in compliance with each company’s
risk criteria.
Use of qualitative risk ranking tools is relatively simple, but lead to
inconsistencies between different PHA teams as well as the
potential to under or over-estimate the risk. For lower level risks,
this is not generally a significant concern, however, for higher risks
there is a need for management to be able to make better informed
decisions using a more consistent basis. That requires a greater
level of insight and is provided by more quantitative analysis
techniques that determine if there is a risk or Safety Integrity Level
(SIL) gap. In layman terms, SIL refers to “orders of risk
reduction” as shown in the following table:
SIL Risk Reduction
1 > 10 factor
2 > 100 factor
3 > 1,000 factor
Table 3: SIL & Risk Reduction
After such risk targets are discovered, other Safety Life Cycle
(SLC) processes are followed such as verification calculations of
the formally termed Safety Instrumented Functions (SIFs). This
and other such processes ensure that the SIFs are capable of
achieving the necessary risk reduction.
PHA Example – Reciprocating Compressor
The following table provides a glimpse of the main components for
a reciprocating compressor PHA.
Deviation Cause ConsequenceSafe-
guardsS L R Recommendation
Too High
level
Level dump
fa i ls closed
Water entra inment
leading to damage &
loss of containment
High
level
a larm
2 4 3
1. Cons ider adding
high level trip i f
required by LOPA
Maint. va lve
inadvertently
left closed
Water entra inment
leading to damage &
loss of containment
High
level
a larm
2 5 4
(repeat 1. Add high
level trip)
Table 4: PHA Example – Reciprocating Compressor
This PHA data will serve as input to the subsequent SIL analysis to
further quantify that risk reduction was obtained.
FUNDAMENTALS ON SIL REQUIREMENTS
Once an interlock has received the “SIL branding”, the ISA84
standard requires that other steps be followed diligently to ensure
that both random and systematic failure is not introduced into its
Page 3 of 8
design and operability. The highlights of this process are captured
in the remainder of this section.
Functional Safety Management (FSM)
The first ISA 84 objective is to specify safety lifecycle (SLC)
management and technical activities needed to implement the
safety instrumented system. It should designate responsibilities for
each SLC phase and the activities within that phase.
The basic FSM tasks include:
1. Defining a safety lifecycle process.
2. Developing a functional safety management procedure.
3. Develop a project execution safety plan.
Functional safety management (FSM) is specifically noted to act as
an extension to existing monitored quality systems and processes.
This quality-based philosophy of “plan, execute according to plan,
verify, document, and improve based on the resulting experience”
carries through the entire safety lifecycle.
Alternative SIL Determination Methods
There are various graphical and numerical techniques to determine
the required SIL value to achieve a target risk goal. Those cited in
ISA84 follow in Table 2.
Annex Name Origin
A ALARP* (As Low as Reasonably
Practicable)
UK **
B Semi-Quantitative USA
C Safety Layer Matrix USA
D Calibrated Risk Graph: Semi-
Qualitative
UK + Finland
E Risk Graph: Qualitative Germany
F Layer of Protection Analysis
(LOPA)
USA
Table 5: Comparison of different SIL Selection Methods
Each of these methods should give roughly the same answer if
they're "calibrated" to the same tolerable risk. The real choice in
technique depends more on what fits best with a company’s
existing risk management philosophy and procedures. For each
hazard, the SIL technique must take into account:
1. The corporations' tolerable limits
2. Full and mitigated consequences of each hazard
3. Root cause or initiating event frequency
4. Number and effectiveness of independent safeguards
If there's a gap between the tolerable and current hazard frequency
(taking into account the applicable safeguards, but not the SIF),
then added protection is required. It can be either a SIF or other
layers of protection.
Layer of Protection Analysis (LOPA)
Layer of Protection Analysis (LOPA) is one of the more popular
SIL methods utilized. LOPA has been described as a semi-
quantitative method of risk analysis and is a new and progressive
approach to risk reduction for the process industries. The key
elements that differentiate it from other qualitative SIL selection
formats are:
• Quantification of the risk accounting for initiating cause
frequency and independent layers of protection (IPL),
where IPLs prevent the propagation and fulfillment of a
hazardous event.
• Application of conditional modifiers (probabilities) that
affect the likelihood of the hazardous event being enabled
or mitigation and thus alters the hazardous event outcome.
The LOPA methodology helps us predict with greater certainty and
consistency whether or not the risk complies with corporate
criteria.
Data used in the LOPAs and their references are normally
documented in each company’s guidance document.
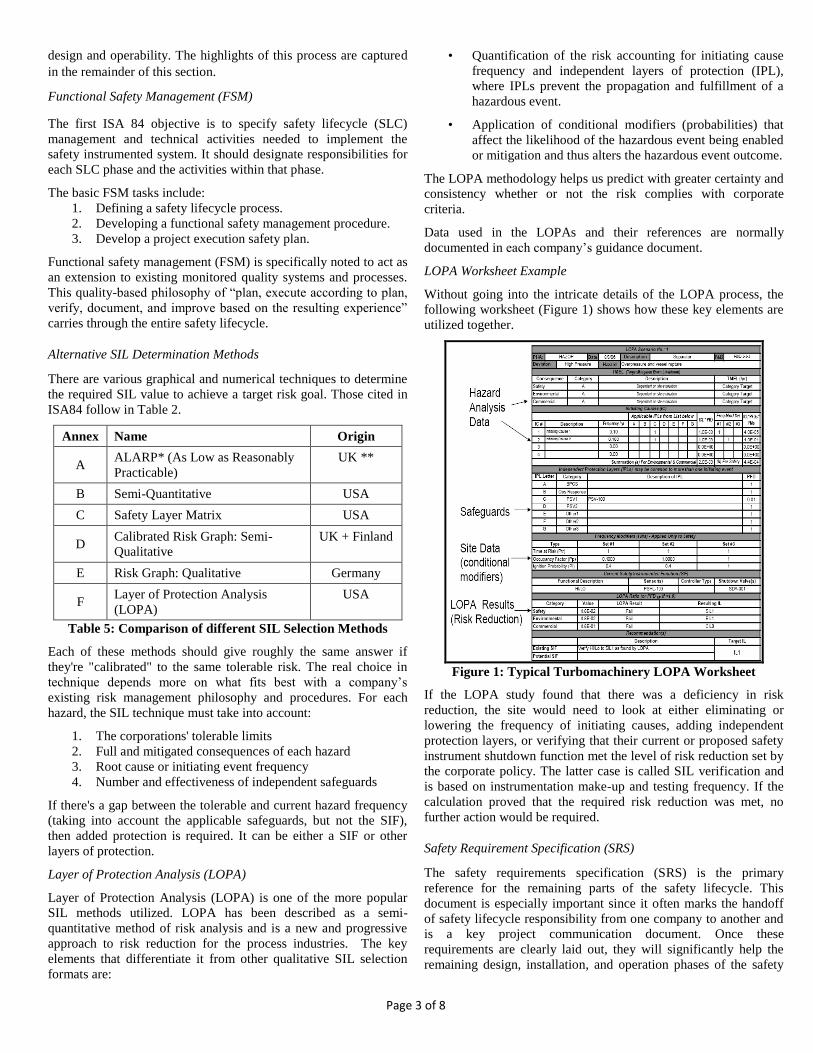
LOPA Worksheet Example
Without going into the intricate details of the LOPA process, the
following worksheet (Figure 1) shows how these key elements are
utilized together.
Figure 1: Typical Turbomachinery LOPA Worksheet
If the LOPA study found that there was a deficiency in risk
reduction, the site would need to look at either eliminating or
lowering the frequency of initiating causes, adding independent
protection layers, or verifying that their current or proposed safety
instrument shutdown function met the level of risk reduction set by
the corporate policy. The latter case is called SIL verification and
is based on instrumentation make-up and testing frequency. If the
calculation proved that the required risk reduction was met, no
further action would be required.
Safety Requirement Specification (SRS)
The safety requirements specification (SRS) is the primary
reference for the remaining parts of the safety lifecycle. This
document is especially important since it often marks the handoff
of safety lifecycle responsibility from one company to another and
is a key project communication document. Once these
requirements are clearly laid out, they will significantly help the
remaining design, installation, and operation phases of the safety
Page 4 of 8
systems lifecycle. The SRS addresses both functional and integrity
specifications as stated below.
The functional part of the SRS describes what the safety
instrumented function does when harm from a given hazard is
imminent. Required details include process inputs and their trip
set-points, safety system outputs and their actions, and the logical
relationship between each of them. This is a similar requirement
for any control loop within the basic process control system, but in
the SRS case, improved safety, not production, is the goal. Some of
the specified functional requirements that have been included in
ISA84 are included in Table 6.
ISA84 SRS Functional Requirements
Defined safe state
SIS process measurements and their trip points
SIS process output actions
The functional relationship between inputs / outputs
Manual shutdown detail
Energize or de-energize to trip specification
Action(s) to be taken on loss of energy source(s) to SIS
Method to reset the SIS after a shutdown
Table 6: ISA84 SRS Functional Requirements
The integrity part of the SRS describes “how well” the safety
instrumented function needs to work when harm from a given
hazard is imminent. In this part of the SRS, it must specify such
things as the required SIL, as well as necessary diagnostics,
maintenance, and testing. Some of the specified integrity
requirements that have been included in ISA84 are included in
Table 7.
ISA84 SRS Integrity Requirements
Proof test intervals
Response time for the SIS to bring process to safe state
SIL & operational demand mode (demand or continuous)
Maximum allowable spurious trip rate
Failure modes & desired response of the SIS (alarms, auto
s/d)
All interfaces between the SIS and any other system
(BPCS, ops)
The extremes of all SIS environmental conditions
Requirements for diagnostics to achieve the required SIL
Table 7: ISA84 SRS Integrity Requirements
Verification Calculations
Each safety instrumented function (SIF) design must now be
verified through probabilistic calculations. (See ISA84 Clause
11.9.1) The key here is to do the probabilistic calculations for each
SIF which will verify safety and spurious trip performance criteria
as well as optimize design to economically meet the requirements
for each different function. The spurious trip discovery could be
quite significant for plant production where it has been stated that
up to 18% of plant trips are associated with instrumentation.
Verification calculations are performed after the other conceptual
design steps have been completed at draft level. See Safety
Instrumented Systems Verification -Practical Probabilistic
Calculations [R6] for more information on this subject.
If calculations show that the draft design does not meet the SIL
target, the choices are:
1. Shorten the testing interval, but not beyond the practical
point for operations
2. Select better technology/equipment.
3. Add redundancy or other IPLs
The conceptual design iterations will continue until the SIL or risk
reduction target is met with the overall most economical system.
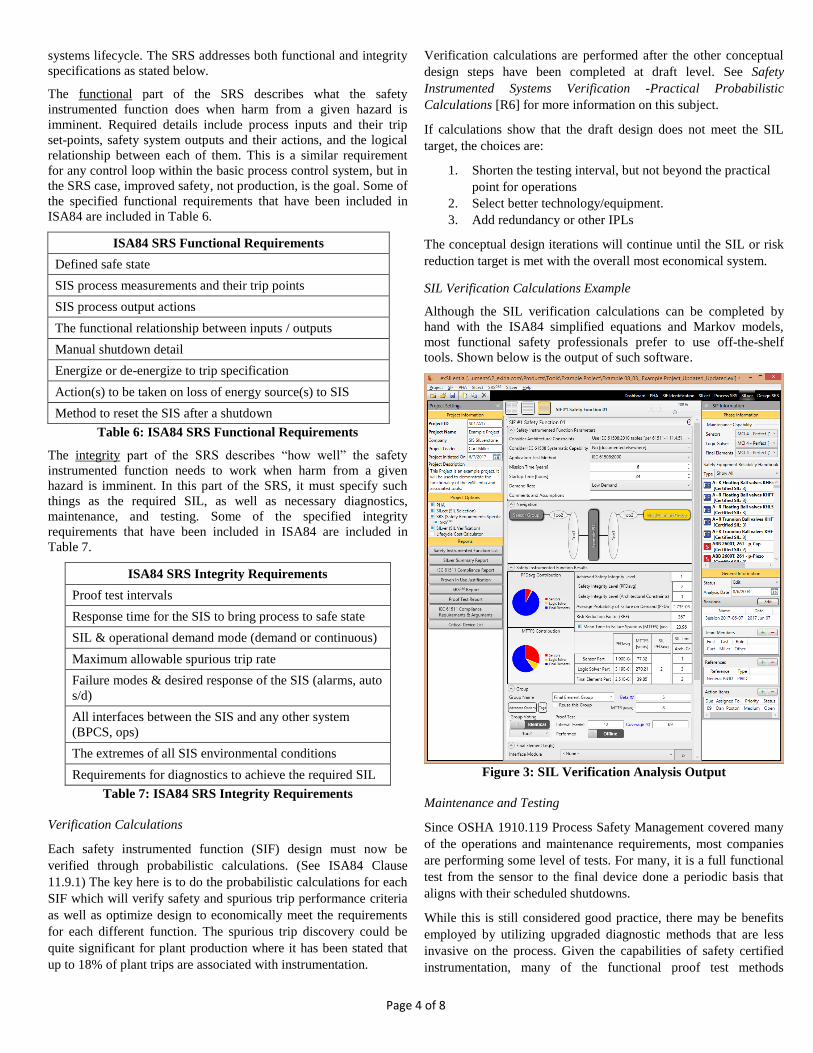
SIL Verification Calculations Example
Although the SIL verification calculations can be completed by
hand with the ISA84 simplified equations and Markov models,
most functional safety professionals prefer to use off-the-shelf
tools. Shown below is the output of such software.
Figure 3: SIL Verification Analysis Output
Maintenance and Testing
Since OSHA 1910.119 Process Safety Management covered many
of the operations and maintenance requirements, most companies
are performing some level of tests. For many, it is a full functional
test from the sensor to the final device done a periodic basis that
aligns with their scheduled shutdowns.
While this is still considered good practice, there may be benefits
employed by utilizing upgraded diagnostic methods that are less
invasive on the process. Given the capabilities of safety certified
instrumentation, many of the functional proof test methods
Page 5 of 8
developed for relays and pneumatic instruments is not only less
effective, but very costly compared to more appropriate methods.
The biggest issue with proof testing is that no methods have 100%
coverage of dangerous failures. To account for this discrepancy,
replacement or “rebuild to new” (i.e. mission times) now must be
specified for all equipment and they must be within the useful life
of the component.
The second issue discovered when reviewing site test practices is
that most procedures included the full functional test, but testing of
the diagnostic routines was not completed. Since the associated
SIFs verification included such diagnostics, such test practices had
to be upgraded to account for detection of faults, degraded
architecture, and presentation of associated alarms.
Example – Optimized Turbine Testing and Maintenance
As discussed in above, no proof tests are 100% effective in
detecting all covert faults. Due to such a limitation,
turbomachinery specialists in one corporation inherently
understood this issue and have been rebuilding their critical trip
and throttle valves in every turnaround for years. This level of
maintenance, coupled with optimized partial stroke testing
techniques, has helped each site meet their SIL2 safety and
production goals simultaneously.
SPECIFIC APPLICATIONS OF SIL WITHIN API670
Although API Machinery Protection Standard API670 has been
around since the 1980s, the November 2014 update adds over 150
pages of new content. The most notable changes are shown in the
following table:
Clause
/Annex Specification
8 Electronic Overspeed -More detailed discussion
9 Surge detection (New)
10 ESD (New)
K Surge Detection (New)
L Safety Integrity Level (New)
M Spurious Shutdowns (New)
N Condition Monitoring (New)
O Overspeed (New)
P Recip Compressors (New)
Q Wireless (New)
Table 8: New Clauses & Annexes in API670
Such additions support a cohesive strategy with the other process
and machine functional safety standards.
Emergency Shutdown Device (ESD) and API670
The Emergency Shutdown Device (ESD) detailed in clause 10 is
synonymous to the SIS detailed by ISA84. By having such a
“single brain” for supporting all the critical safety functions, the
first requirement of consolidating all trip demands and ensuring
“proper timing and sequencing for a safe shutdown” is met.
There is latitude on whether all the shutdown logic is performed in
the ESD. If it is not and separate surge, monitoring, and overspeed
systems are tied into the ESD, the overall system is considered to
have “distributed architecture”. If such functions are included in
the ESD, then it is termed “Integrated Architecture”.
Annex L – Safety Integrity Level
Annex L provides a 17-page introduction of the SIL concepts and
correlates their application to turbomachinery standards. Although
the risk graph methodology is not as prevalent in the USA as it is
in Europe, its principals still apply to those that have standardized
on LOPA as mentioned earlier.
Key takeaways from this SIL annex include:
SIL compliance, although associated directly to the ESD
logic solver, should be extended to the I/O devices
Separation of control and safety is imperative
SIL is determined by performance requirements set by
each user, not by prescriptive methods
Such practices line up closely with those of the currently functional
standards like ISA84.
Annex M – Spurious Shutdowns
Since safe, fault tolerant methods with higher spurious trip rates
may at times oppose process uptime (i.e. machine reliability), this
annex “recommends some practice to reduce the risk of economic
losses”.
Key takeaways from this spurious trip annex include:
Utilization of fault tolerant designs for safety and
reliability
Applying preventative diagnostics where applicable
Regarding plant impact examples, the following table truly
supports such measures.
Process Application Spurious Trip Cost
Oil & Gas Platforms Up to $2 million/day
Polystrene 20 days to recover at
$20k/day=$400k
Refinery Coker Heater $35k/day
Refinery Catalytic
Cracker $500k
Complete Refinery $1 million/day
Ammonia & Urea Plants $1 million/day
Power Generation $100k/MW hour to $millions/site
Ethylene $1 million to include getting
product to spec
Table 9: Spurious Trip Cost in Different Process Industries
[R7]
Page 6 of 8
COMMON SIL RATINGS FOR ROTATING EQUIPMENT
As shown in the preceding section, the process of SIL assignment
takes into account the end user’s risk target, consequence severity,
initiating cause frequency, the number of safeguards, and the
application of conditional modifiers, so the final SIL requirement
can vary widely. Utilizing the experience of the authors and a
broad perspective of reviews, the following table offers a glimpse
of what could be expected.
SIL Target
Driver Application High Low Norm
Steam turbine Overspeed SIL2 SIL1 SIL1
Centrifugal
Compressor
Anti-Surge SIL2 None SIL1
High Level SIL2 None SIL1
Gas turbine Light Off SIL2 SIL1 SIL1
Turbine Generator Overspeed SIL2 SIL2 SIL2
Reciprocating
Compressor
High Level SIL2 None SIL1
HP discharge SIL2 None SIL1
Table 10: Common SIL Targets for Rotating Equipment
Naturally, each company must review each application individually
to avoid either over- specification, or more imperative for safety,
under-specification of turbomachinery SIL.
ECONOMIC JUSTIFICATION OF SIL
Based on the previous publication on turbomachinery failures at
refineries [R3] and a general review of their applications, the
following table summarizes where the SIL principles could be
applied.
Equipment Event SIL
Case? Issue
Charge
Pump
Major Fire Yes Failure of lube oil
trip
Pump A Vapor Cloud Yes Seal pressure trip
Pump B Vapor Cloud
Release
Yes Seal pressure
interlock
Unit Screw
Comp
Major Fire Yes Failure of lube oil
trip
Pump Major Fire Mech Vibration?
Pump Major Fire Yes Vibration trip
Coker Wet
Gas Comp
Vapor Cloud
Release
Yes Vibration trip
Crude
Pump
Major Fire Mech
issue
Vibration?
FCC Aux
Air Blower
Fire Yes Surge detection
FCC Main
Air Blower
Near Miss Yes Integrity issue of
interlock
Table 11: Recent Rotating Equip Failures Five Refineries
Summary of SIL Issues
Of those, the majority may have been prevented following better
SIL functional safety management.
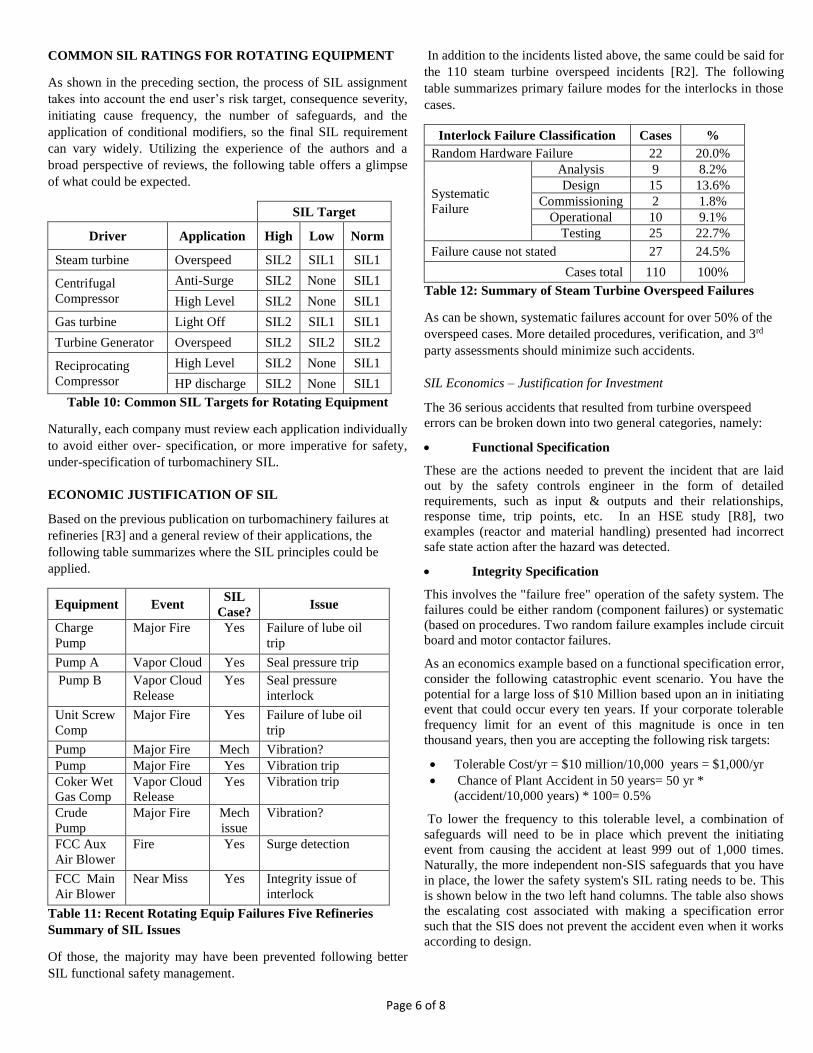
In addition to the incidents listed above, the same could be said for
the 110 steam turbine overspeed incidents [R2]. The following
table summarizes primary failure modes for the interlocks in those
cases.
Interlock Failure Classification Cases %
Random Hardware Failure 22 20.0%
Systematic
Failure
Analysis 9 8.2%
Design 15 13.6%
Commissioning 2 1.8%
Operational 10 9.1%
Testing 25 22.7%
Failure cause not stated 27 24.5%
Cases total 110 100%
Table 12: Summary of Steam Turbine Overspeed Failures
As can be shown, systematic failures account for over 50% of the
overspeed cases. More detailed procedures, verification, and 3rd
party assessments should minimize such accidents.
SIL Economics – Justification for Investment
The 36 serious accidents that resulted from turbine overspeed
errors can be broken down into two general categories, namely:
Functional Specification
These are the actions needed to prevent the incident that are laid
out by the safety controls engineer in the form of detailed
requirements, such as input & outputs and their relationships,
response time, trip points, etc. In an HSE study [R8], two
examples (reactor and material handling) presented had incorrect
safe state action after the hazard was detected.
Integrity Specification
This involves the "failure free" operation of the safety system. The
failures could be either random (component failures) or systematic
(based on procedures. Two random failure examples include circuit
board and motor contactor failures.
As an economics example based on a functional specification error,
consider the following catastrophic event scenario. You have the
potential for a large loss of $10 Million based upon an in initiating
event that could occur every ten years. If your corporate tolerable
frequency limit for an event of this magnitude is once in ten
thousand years, then you are accepting the following risk targets:
Tolerable Cost/yr = $10 million/10,000 years = $1,000/yr
Chance of Plant Accident in 50 years= 50 yr *
(accident/10,000 years) * 100= 0.5%
To lower the frequency to this tolerable level, a combination of
safeguards will need to be in place which prevent the initiating
event from causing the accident at least 999 out of 1,000 times.
Naturally, the more independent non-SIS safeguards that you have
in place, the lower the safety system's SIL rating needs to be. This
is shown below in the two left hand columns. The table also shows
the escalating cost associated with making a specification error
such that the SIS does not prevent the accident even when it works
according to design.
Page 7 of 8
Table 13: Exposure with Loss of SIS Protection
As the table dramatically shows, it is increasingly important to get
the functional specification correct when working with higher SIL
values. This is why the ISA 84-2004 safety lifecycle design stages
and the methods to reduce systematic errors are based upon each
safety function’s SIL value. The higher the SIL, the more strenuous
your safety lifecycle reviews and cross checks must be to ensure
that systematic errors are kept in check.
As we noted, the safety lifecycle deals with both random and
systematic causes of accidents. The random part is addressed and
managed with the part of SIL related to probability of failure upon
demand averaged (PFDavg) and risk reduction factor. But since it
represents only part of the safety system specification and only part
of the sources for dangerous errors, more is needed. Other
systematic problems, such as failing to consider alternate paths to
the accident or not fully specifying all of the elements of the safety
function can kill people just as dead. Thus, the functional safety
management parts of the safety lifecycle that address these
systematic errors are vitally needed to provide the required risk
reduction.
EXAMPLE: THE COMPLETE SIL PROCESS APPLIED TO
A HIGH HORSEPOWER TURBINE
These unique SIL processes were recently utilized on a critical
high horsepower turbine application and will be generally
discussed so that the overall safety lifecycle can be understood.
1. Utilizing a HAZOP to Identify a High Severity Hazard
Per OHSA 1910.119 regulatory requirements for review of process
hazards every 5 years, a HAZOP was conducted and the team
concluded that a loss of load based on a coupling failure would
result in turbine overspeed. Such an event was considered
significant and had severe personnel injury and mechanical impacts
2. Applying a LOPA Review to Quantify Risk
Since the user wanted to follow Recognized and Generally
Accepted Good Engineering Practice (RAGAGEP) for risk
mitigation, LOPA practices were adapted to further quantify risk
exposure. The turbine overspeed scenario met the criteria for
further detailed analysis through LOPA due to its severe safety
consequences.
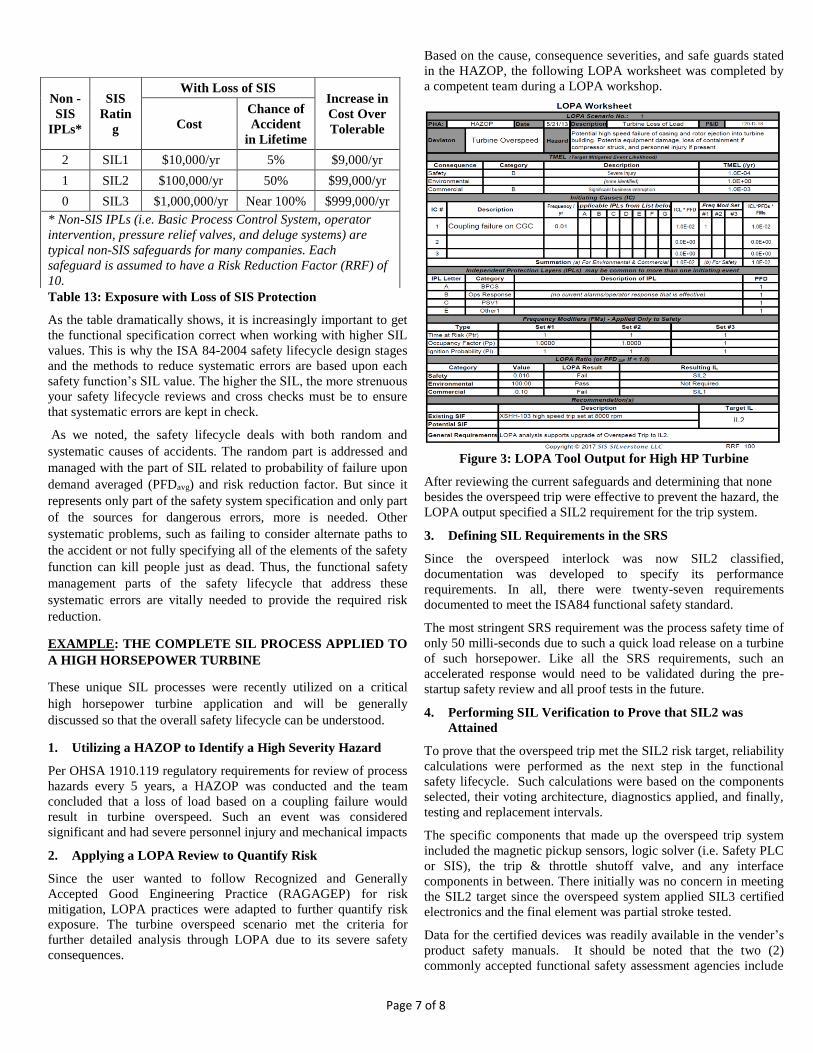
Based on the cause, consequence severities, and safe guards stated
in the HAZOP, the following LOPA worksheet was completed by
a competent team during a LOPA workshop.
Figure 3: LOPA Tool Output for High HP Turbine
After reviewing the current safeguards and determining that none
besides the overspeed trip were effective to prevent the hazard, the
LOPA output specified a SIL2 requirement for the trip system.
3. Defining SIL Requirements in the SRS
Since the overspeed interlock was now SIL2 classified,
documentation was developed to specify its performance
requirements. In all, there were twenty-seven requirements
documented to meet the ISA84 functional safety standard.
The most stringent SRS requirement was the process safety time of
only 50 milli-seconds due to such a quick load release on a turbine
of such horsepower. Like all the SRS requirements, such an
accelerated response would need to be validated during the pre-
startup safety review and all proof tests in the future.
4. Performing SIL Verification to Prove that SIL2 was
Attained
To prove that the overspeed trip met the SIL2 risk target, reliability
calculations were performed as the next step in the functional
safety lifecycle. Such calculations were based on the components
selected, their voting architecture, diagnostics applied, and finally,
testing and replacement intervals.
The specific components that made up the overspeed trip system
included the magnetic pickup sensors, logic solver (i.e. Safety PLC
or SIS), the trip & throttle shutoff valve, and any interface
components in between. There initially was no concern in meeting
the SIL2 target since the overspeed system applied SIL3 certified
electronics and the final element was partial stroke tested.
Data for the certified devices was readily available in the vender’s
product safety manuals. It should be noted that the two (2)
commonly accepted functional safety assessment agencies include
Non -
SIS
IPLs*
SIS
Ratin
g
With Loss of SIS Increase in
Cost Over
Tolerable Cost
Chance of
Accident
in Lifetime
2 SIL1 $10,000/yr 5% $9,000/yr
1 SIL2 $100,000/yr 50% $99,000/yr
0 SIL3 $1,000,000/yr Near 100% $999,000/yr
* Non-SIS IPLs (i.e. Basic Process Control System, operator
intervention, pressure relief valves, and deluge systems) are
typical non-SIS safeguards for many companies. Each
safeguard is assumed to have a Risk Reduction Factor (RRF) of
10.
Page 8 of 8
TUV and exida Certification and the standard adhered to is
IEC61508 [R9].
Since the trip & throttle valve had not been certified and the
manufacturer had no failure mode specific data, the SIS project
engineer contracted a Failure Modes, Effects, and Diagnostics
Analysis (FMEDA). This analysis was specific to the OEM’s valve
assembly and therefore resulted in a precise, yet conservative data
set to be used in the SIL verification calculations.. Otherwise,
conservative data based on generic components would have been
used and the SIL2 risk target likely would not have been met.
Another SIL2 issue surfaced when an emergency trip device (ETD)
was discovered in the turbine mechanical drawings. The ETD was
critical to the overspeed trip since it acted as an interface
component for dumping the hydraulic power fluid. Since it could
not be tested by the partial stoke apparatus, it became a SIL2
limiter and the overspeed system became degraded to SIL1.
Fortunately, the design team found an alternative solution to avoid
adding an inline steam valve (~ $300k).
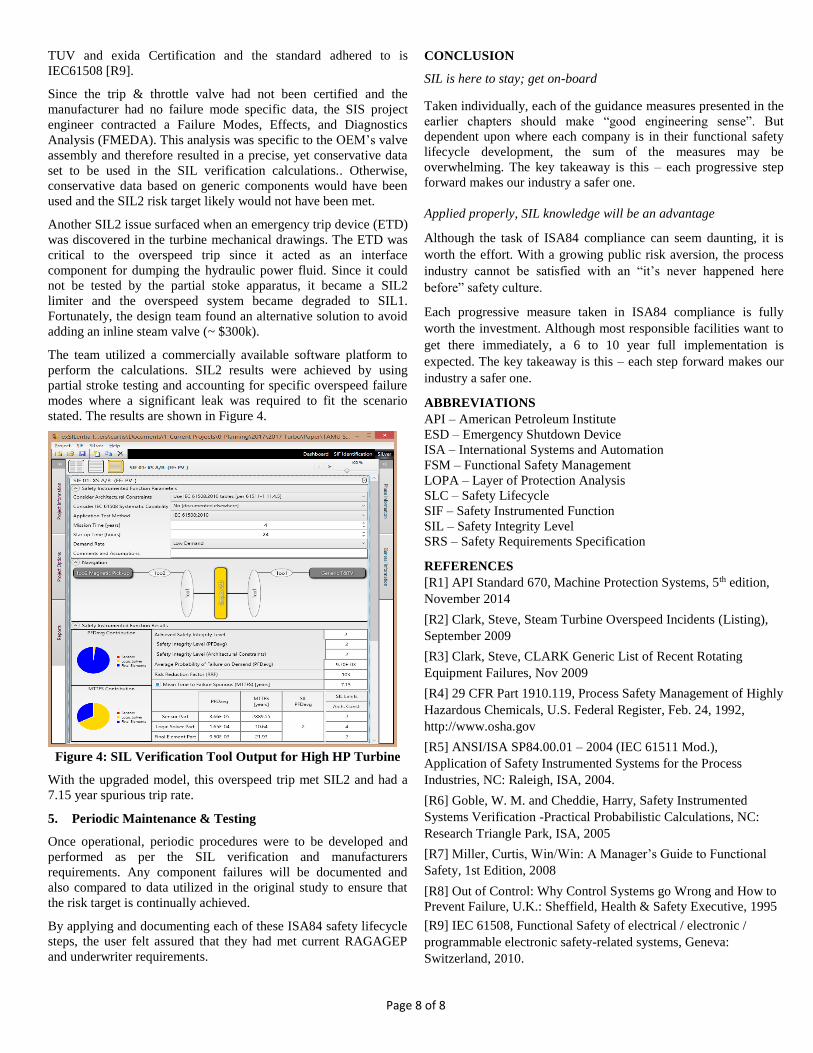
The team utilized a commercially available software platform to
perform the calculations. SIL2 results were achieved by using
partial stroke testing and accounting for specific overspeed failure
modes where a significant leak was required to fit the scenario
stated. The results are shown in Figure 4.
Figure 4: SIL Verification Tool Output for High HP Turbine
With the upgraded model, this overspeed trip met SIL2 and had a
7.15 year spurious trip rate.
5. Periodic Maintenance & Testing
Once operational, periodic procedures were to be developed and
performed as per the SIL verification and manufacturers
requirements. Any component failures will be documented and
also compared to data utilized in the original study to ensure that
the risk target is continually achieved.
By applying and documenting each of these ISA84 safety lifecycle
steps, the user felt assured that they had met current RAGAGEP
and underwriter requirements.
CONCLUSION
SIL is here to stay; get on-board
Taken individually, each of the guidance measures presented in the
earlier chapters should make “good engineering sense”. But
dependent upon where each company is in their functional safety
lifecycle development, the sum of the measures may be
overwhelming. The key takeaway is this – each progressive step
forward makes our industry a safer one.
Applied properly, SIL knowledge will be an advantage
Although the task of ISA84 compliance can seem daunting, it is
worth the effort. With a growing public risk aversion, the process
industry cannot be satisfied with an “it’s never happened here
before” safety culture.
Each progressive measure taken in ISA84 compliance is fully
worth the investment. Although most responsible facilities want to
get there immediately, a 6 to 10 year full implementation is
expected. The key takeaway is this – each step forward makes our
industry a safer one.
ABBREVIATIONS
API – American Petroleum Institute
ESD – Emergency Shutdown Device
ISA – International Systems and Automation
FSM – Functional Safety Management
LOPA – Layer of Protection Analysis
SLC – Safety Lifecycle
SIF – Safety Instrumented Function
SIL – Safety Integrity Level
SRS – Safety Requirements Specification
REFERENCES
[R1] API Standard 670, Machine Protection Systems, 5th edition,
November 2014
[R2] Clark, Steve, Steam Turbine Overspeed Incidents (Listing),
September 2009
[R3] Clark, Steve, CLARK Generic List of Recent Rotating
Equipment Failures, Nov 2009
[R4] 29 CFR Part 1910.119, Process Safety Management of Highly
Hazardous Chemicals, U.S. Federal Register, Feb. 24, 1992,
http://www.osha.gov
[R5] ANSI/ISA SP84.00.01 – 2004 (IEC 61511 Mod.),
Application of Safety Instrumented Systems for the Process
Industries, NC: Raleigh, ISA, 2004.
[R6] Goble, W. M. and Cheddie, Harry, Safety Instrumented
Systems Verification -Practical Probabilistic Calculations, NC:
Research Triangle Park, ISA, 2005
[R7] Miller, Curtis, Win/Win: A Manager’s Guide to Functional
Safety, 1st Edition, 2008
[R8] Out of Control: Why Control Systems go Wrong and How to
Prevent Failure, U.K.: Sheffield, Health & Safety Executive, 1995
[R9] IEC 61508, Functional Safety of electrical / electronic /
programmable electronic safety-related systems, Geneva:
Switzerland, 2010.


![Intruder Notification System & Security in Cloud Computing ... · service (CS) clients must ... computing is its use of virtualized systems & cloud computing [10]. Trustworthy integrity](https://img.pdfslide.net/doc/110x75/5e84b2e564439752b6571614/intruder-notification-system-security-in-cloud-computing-service-cs.jpg)