Embed Size (px)
Citation preview
Tutorial
E-Mail: [email protected]
ChIPBase: decoding the transcriptional regulation of lncRNAs, mRNAs and miRNAs from ChIP-Seq data
© 2012, Jian-Hua Yang, The Qu lab at Sun Yat-sen University
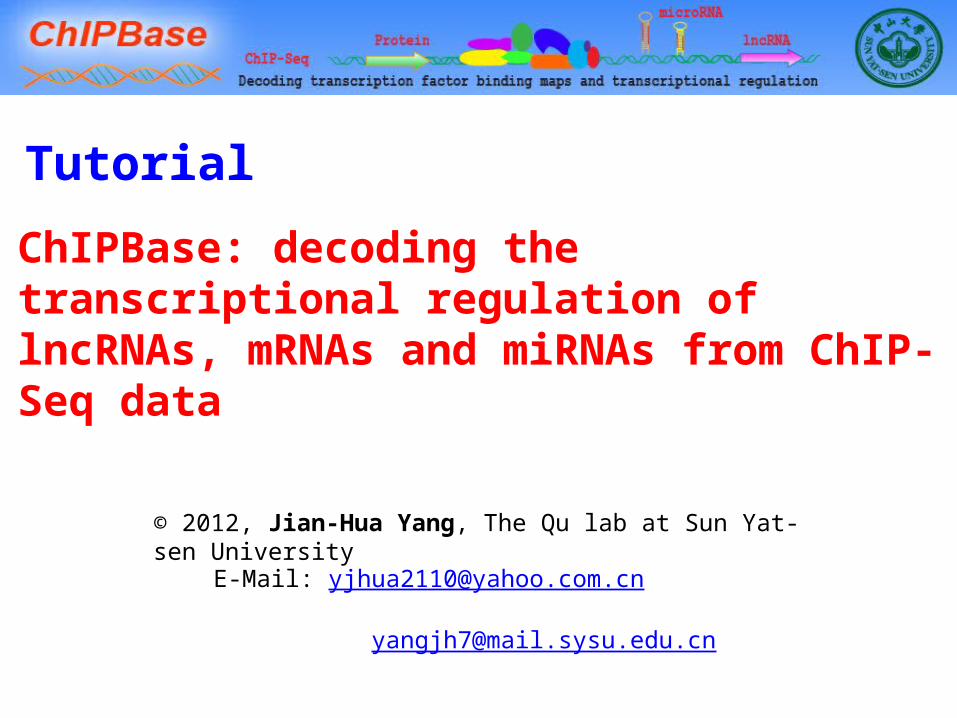
The distinctive features of ChIPBase
Most comprehensive transcription factor binding maps1
2 First platform for transcriptional regulation of lncRNAs
3 Most comprehensive TF->miRNA->Target networks
4 Expression profiles of lncRNAs/mRNAs in 22 tissues
5 Transcriptional regulation of other ncRNAs and mRNAs
6 Diverse tools/browsers for the transcriptional regulation
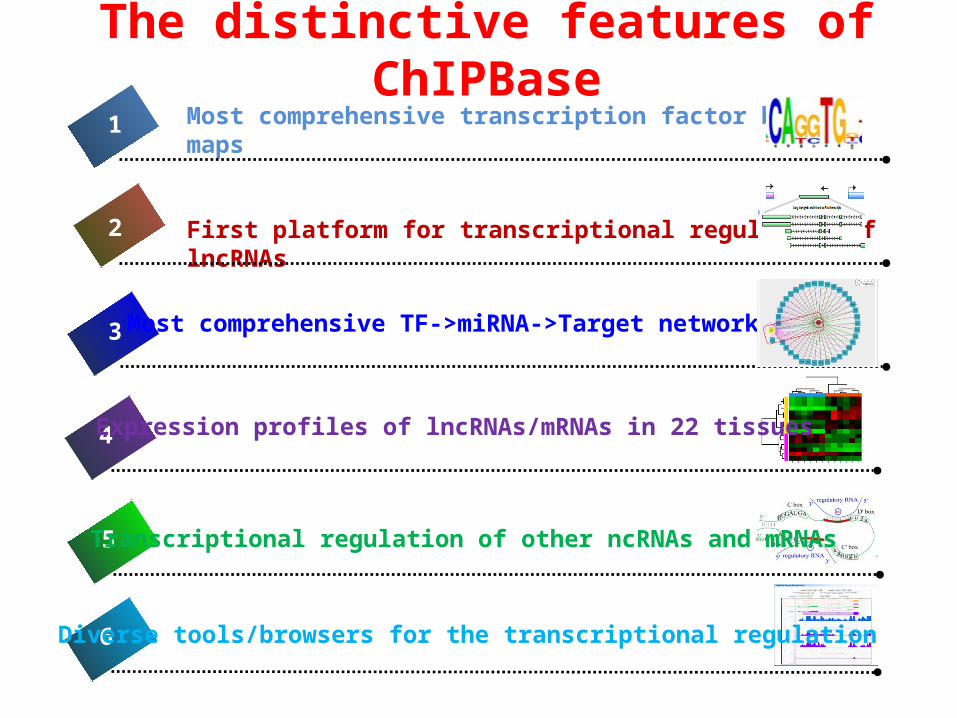
The core framework of ChIPBase
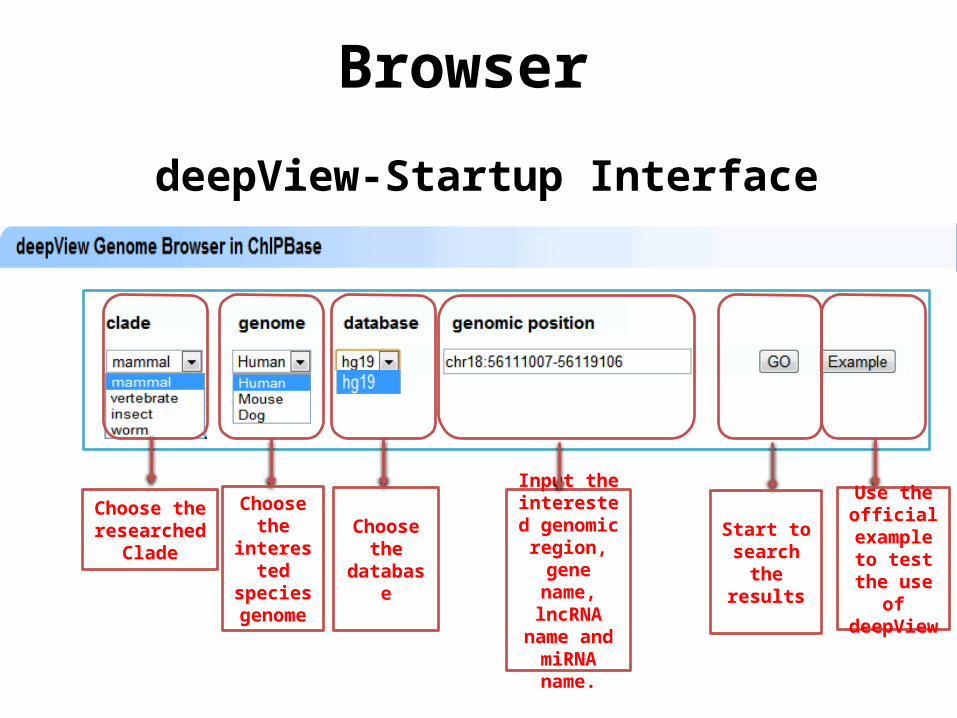
Browser
deepView-Startup Interface
Choose the researched
Clade
Choose the
interested species genome
Choose the
database
Input the interested genomic
region, gene name,
lncRNA name and miRNA
name.
Start to search the
results
Use the official
example to test the use
of deepView
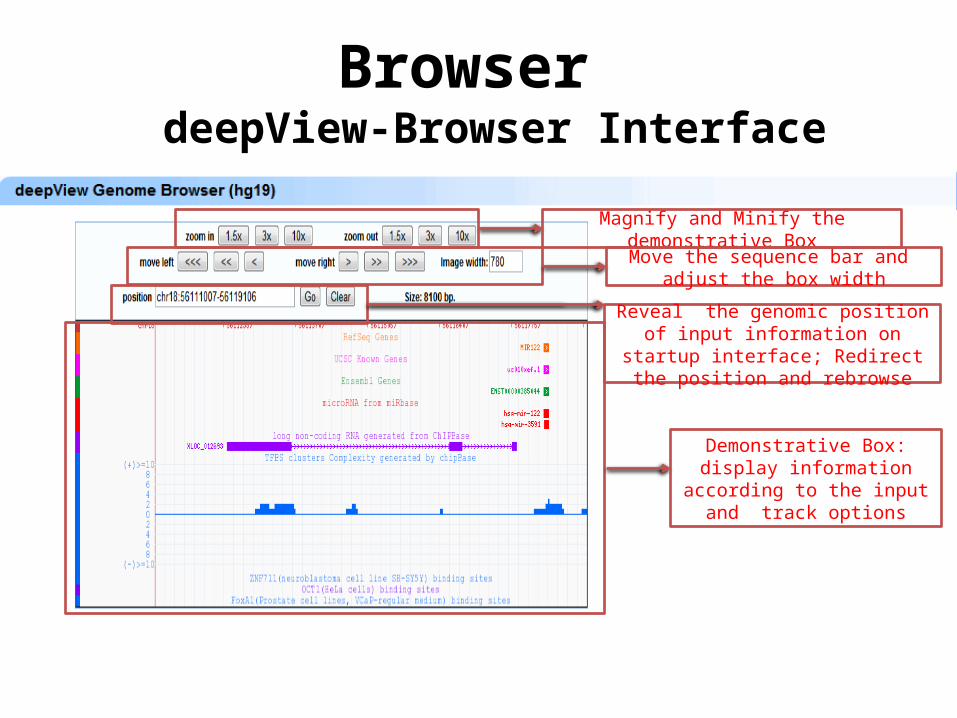
BrowserdeepView-Browser Interface
Magnify and Minify the demonstrative BoxMove the sequence bar and adjust the
box width
Reveal the genomic position of input information on startup interface; Redirect
the position and rebrowse
Demonstrative Box: display information according to the
input and track options
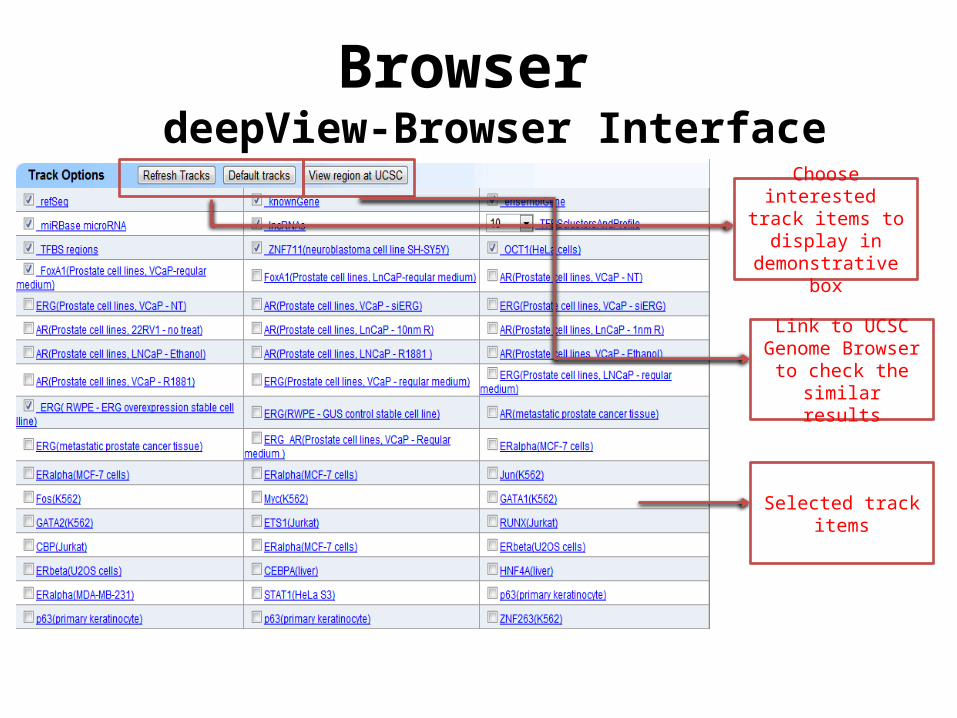
BrowserdeepView-Browser Interface
fff Choose interested track items to display in demonstrative box
Link to UCSC Genome Browser to check the
similar results
Selected track items
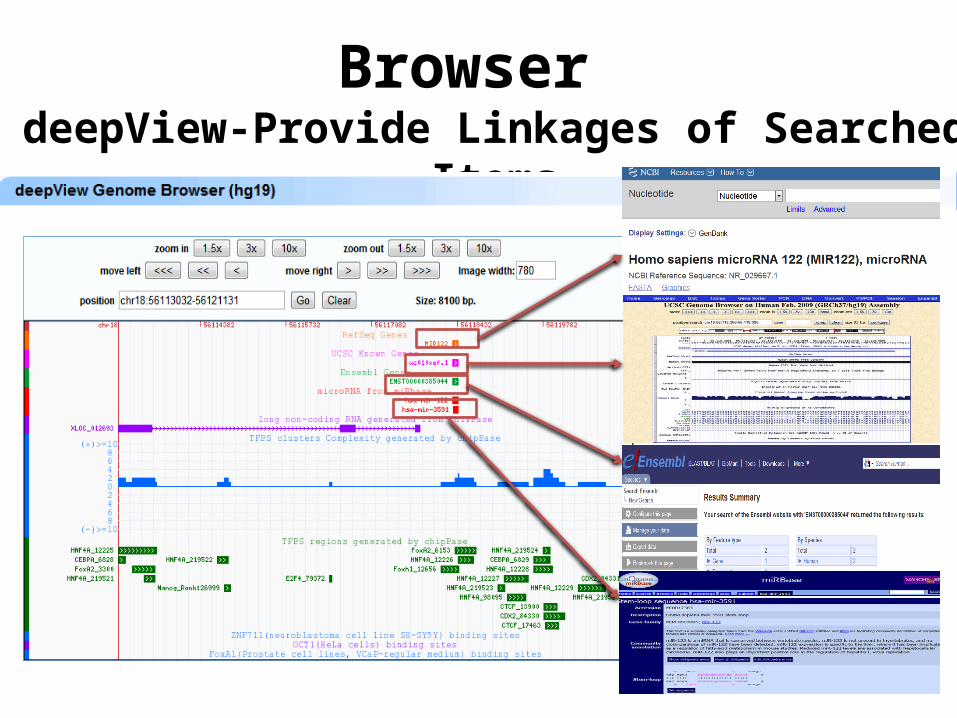
BrowserdeepView-Provide Linkages of Searched Items
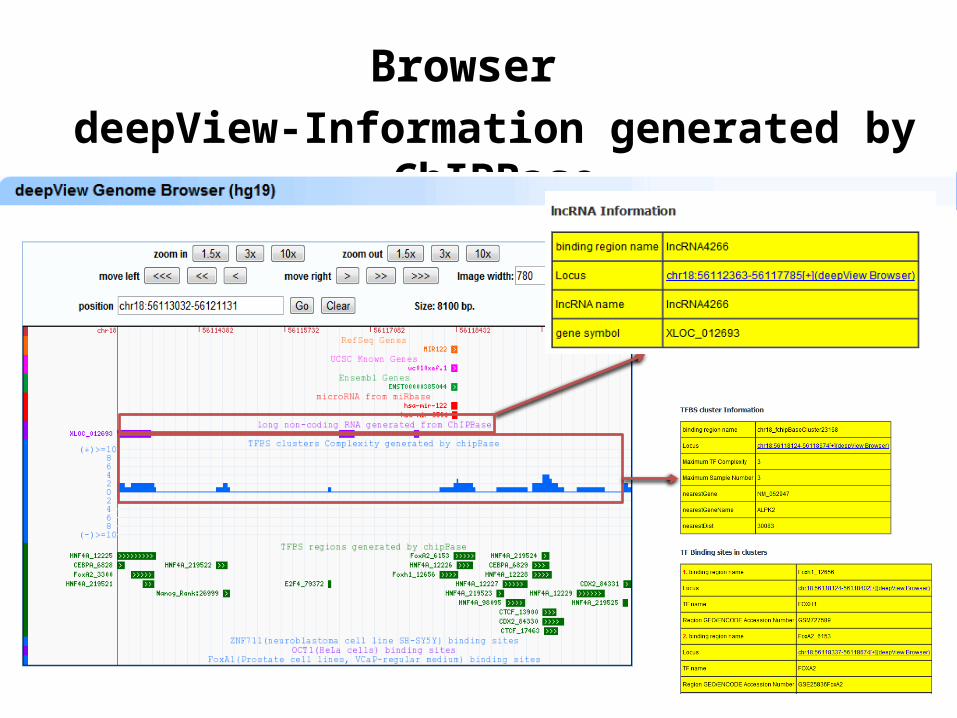
BrowserdeepView-Information generated by ChIPBase
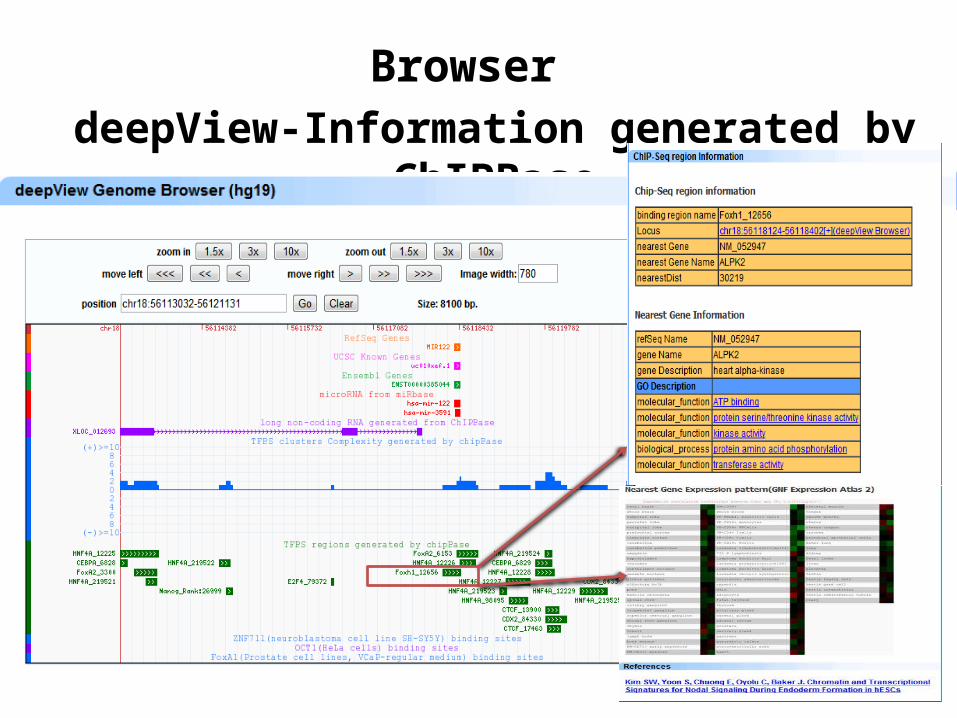
BrowserdeepView-Information generated by ChIPBase
Browser
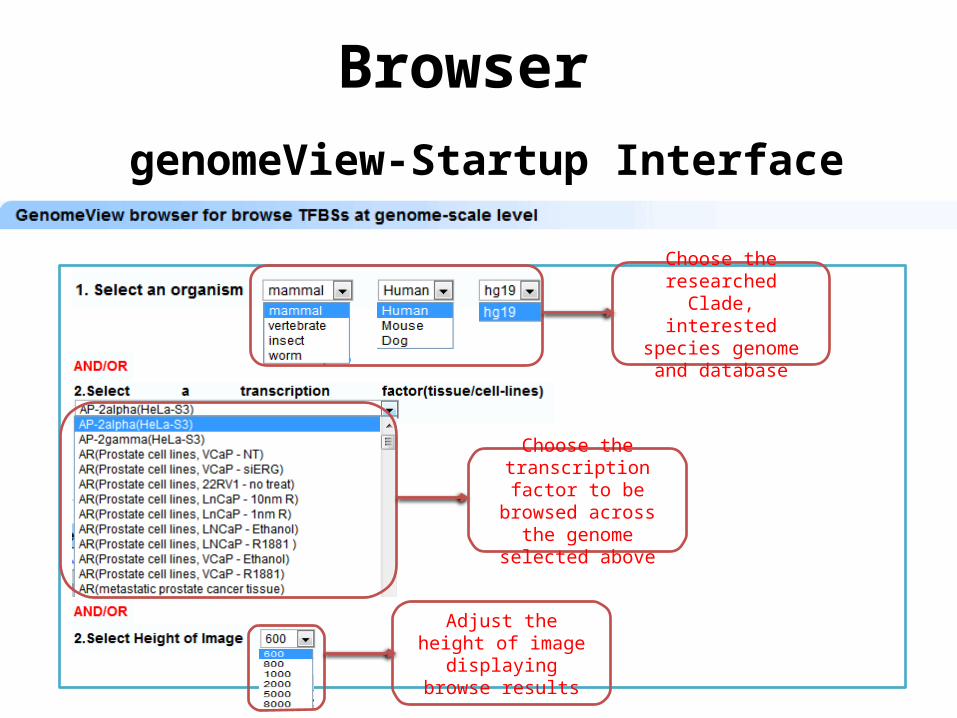
genomeView-Startup Interface
Choose the researched Clade, interested species
genome and database
Choose the transcription factor to be browsed across the genome
selected above
Adjust the height of image displaying browse
results
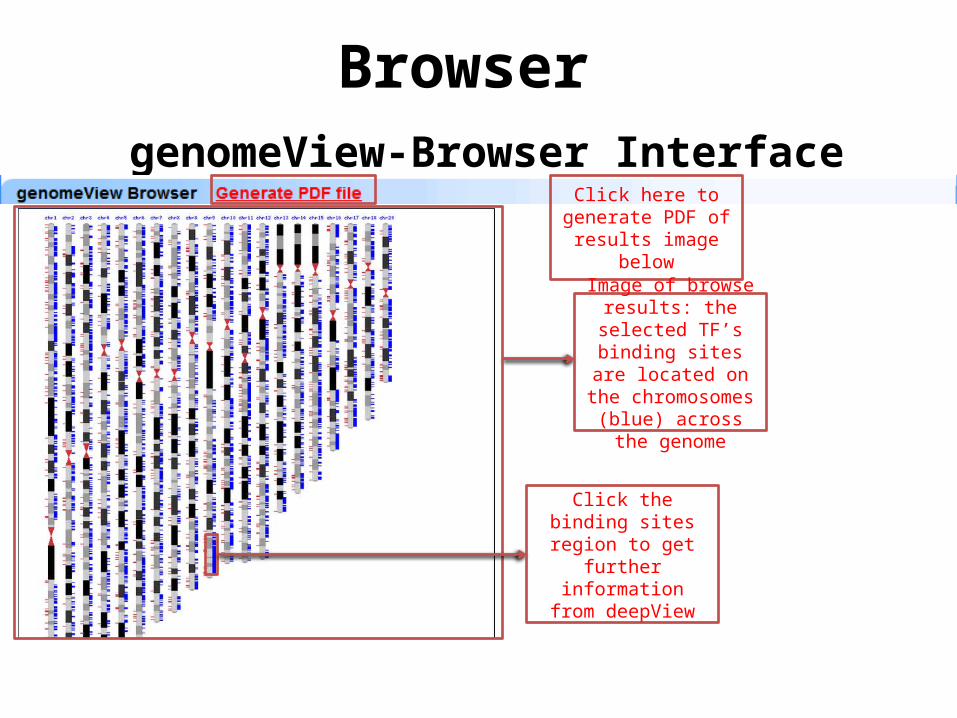
BrowsergenomeView-Browser Interface
Click here to generate PDF of results image
below
Image of browse results: the selected TF’s binding sites are
located on the chromosomes (blue) across the genome
Click the binding sites region to get further
information from deepView
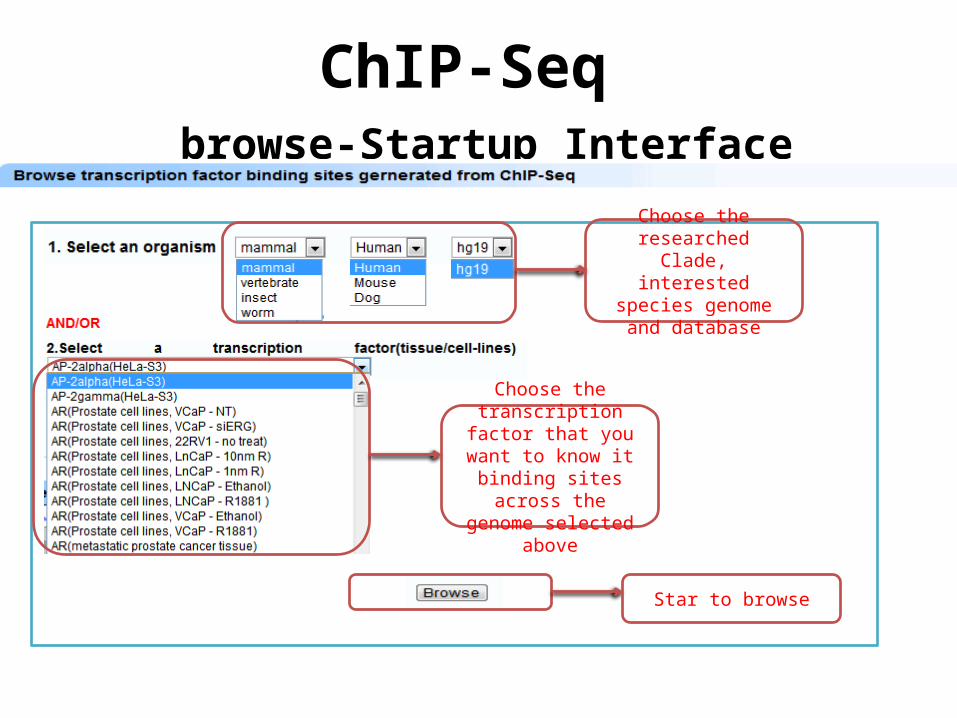
ChIP-Seqbrowse-Startup Interface
Choose the researched Clade, interested species
genome and database
Choose the transcription factor that you want to
know it binding sites across the genome
selected above
Star to browse
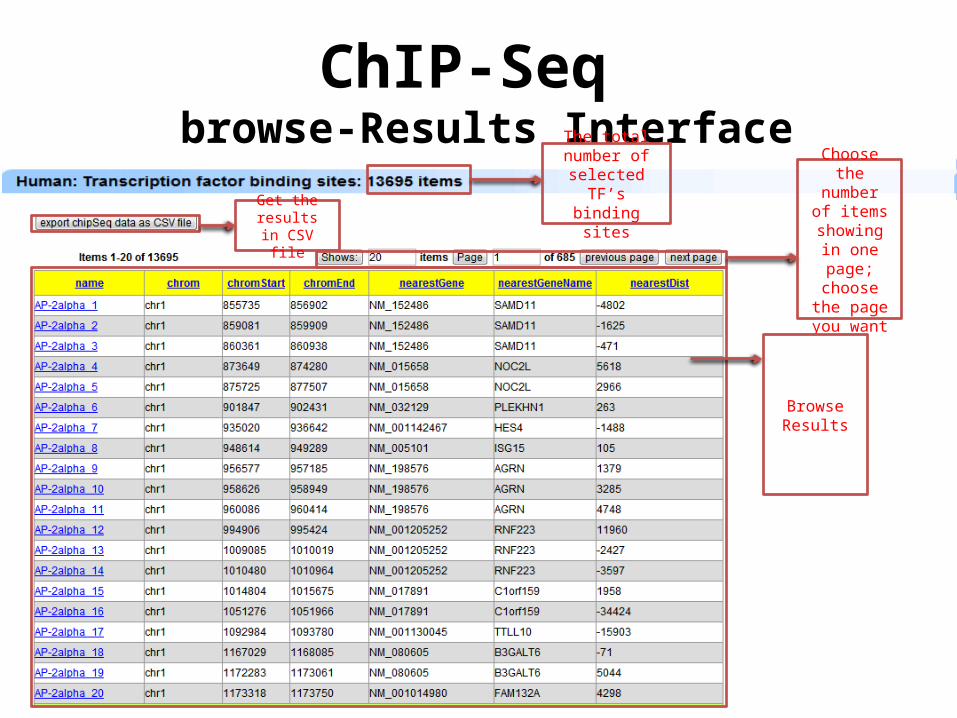
ChIP-Seqbrowse-Results Interface
The total number of
selected TF’s binding sitesGet the
results in CSV file
Choose the number of
items showing in one page;
choose the page you
want
Browse Results
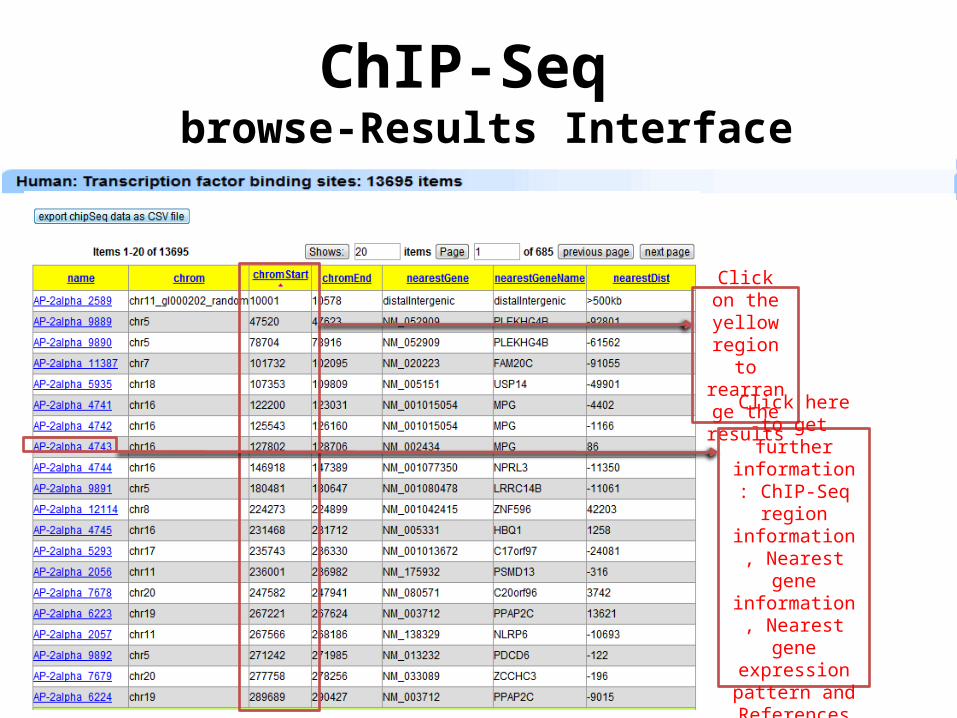
ChIP-Seqbrowse-Results Interface
Click on the yellow region to rearrange
the results
Click here to get further
information: ChIP-Seq region
information, Nearest gene information, Nearest gene
expression pattern and References
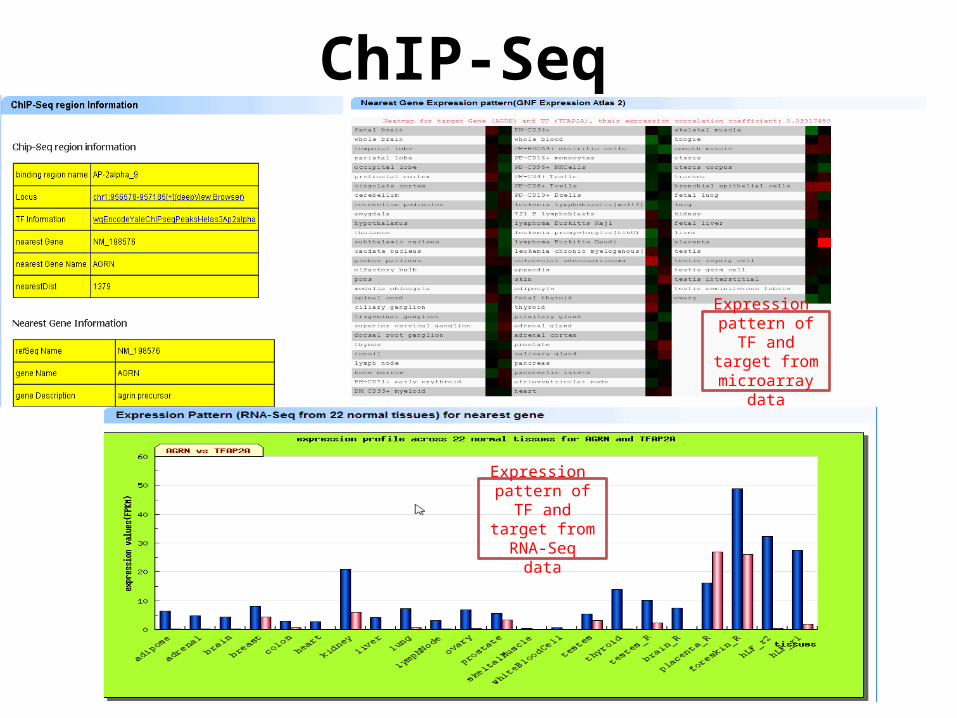
ChIP-Seq
Expression pattern of TF
and target from microarray data
Expression pattern of TF
and target from RNA-Seq data
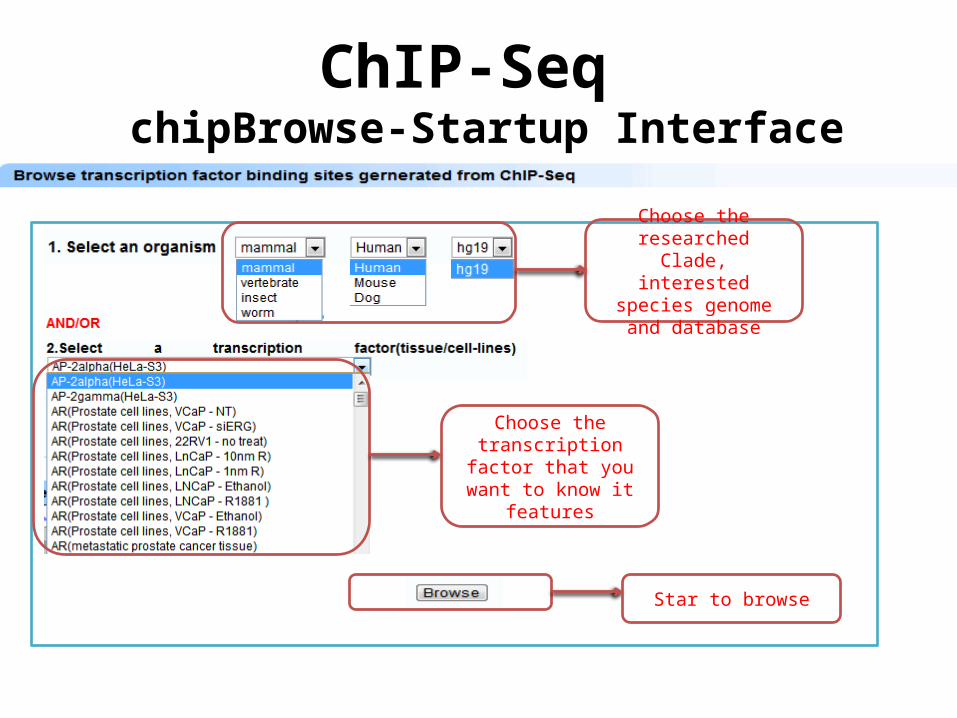
ChIP-SeqchipBrowse-Startup Interface
Choose the researched Clade, interested species
genome and database
Choose the transcription factor that you want to
know it features
Star to browse
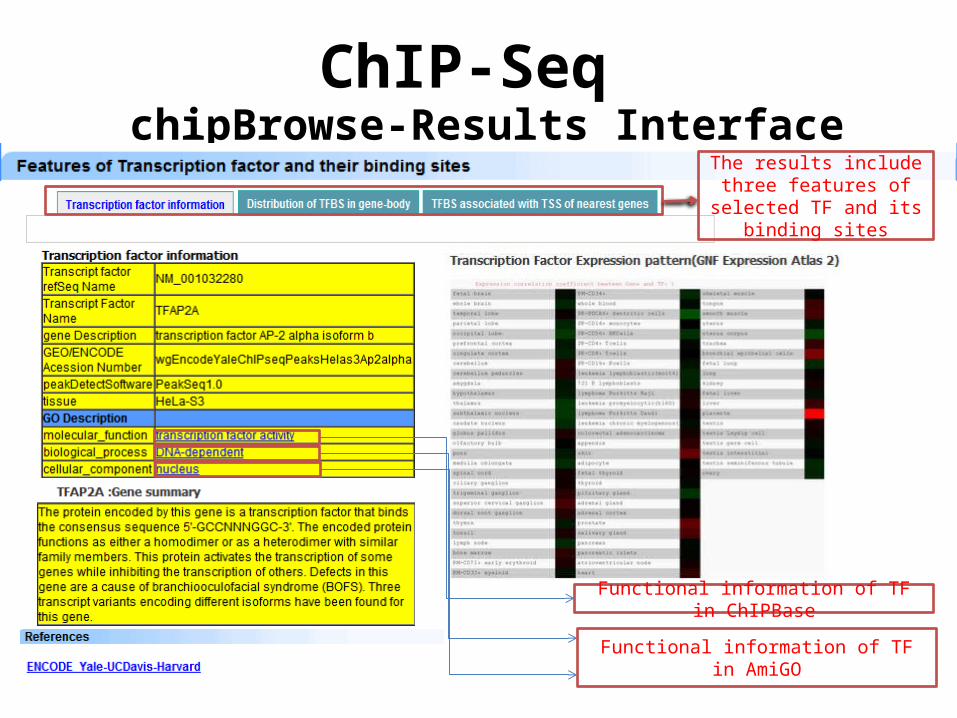
ChIP-SeqchipBrowse-Results Interface
The results include three features of selected TF and
its binding sites
Functional information of TF in ChIPBase
Functional information of TF in AmiGO
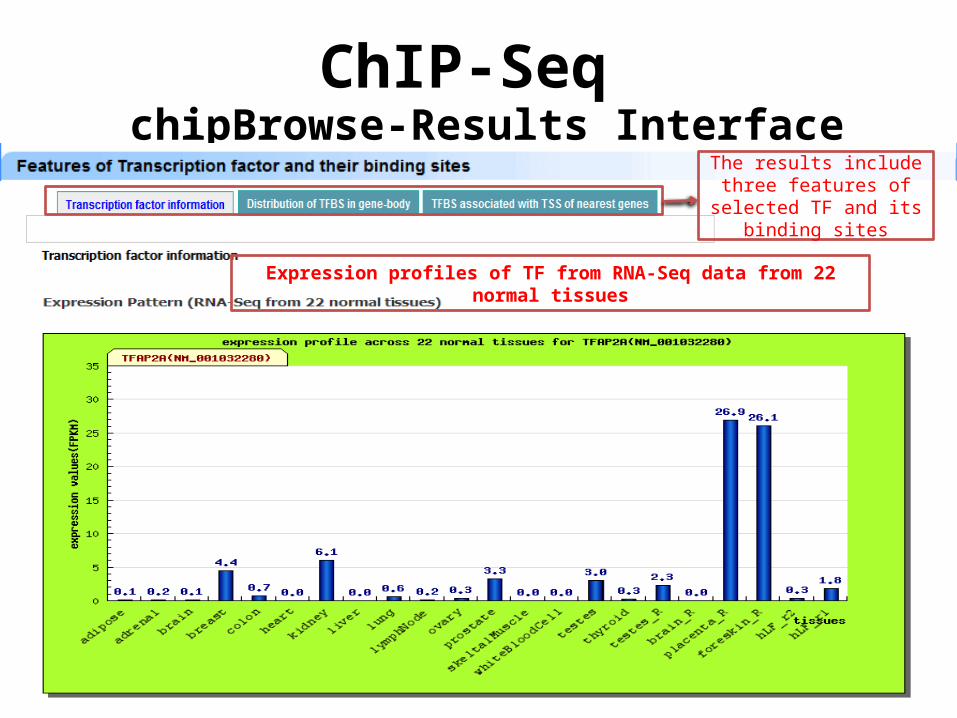
ChIP-SeqchipBrowse-Results Interface
The results include three features of selected TF and
its binding sites
Expression profiles of TF from RNA-Seq data from 22 normal tissues
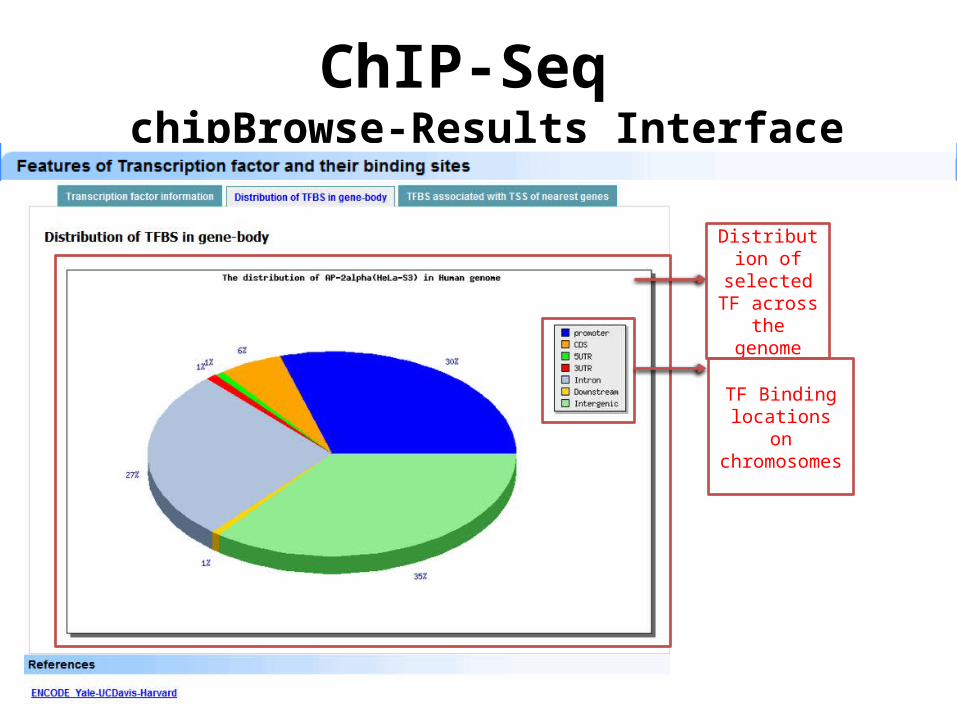
ChIP-SeqchipBrowse-Results Interface
Distribution of selected TF
across the genome
TF Binding locations on
chromosomes
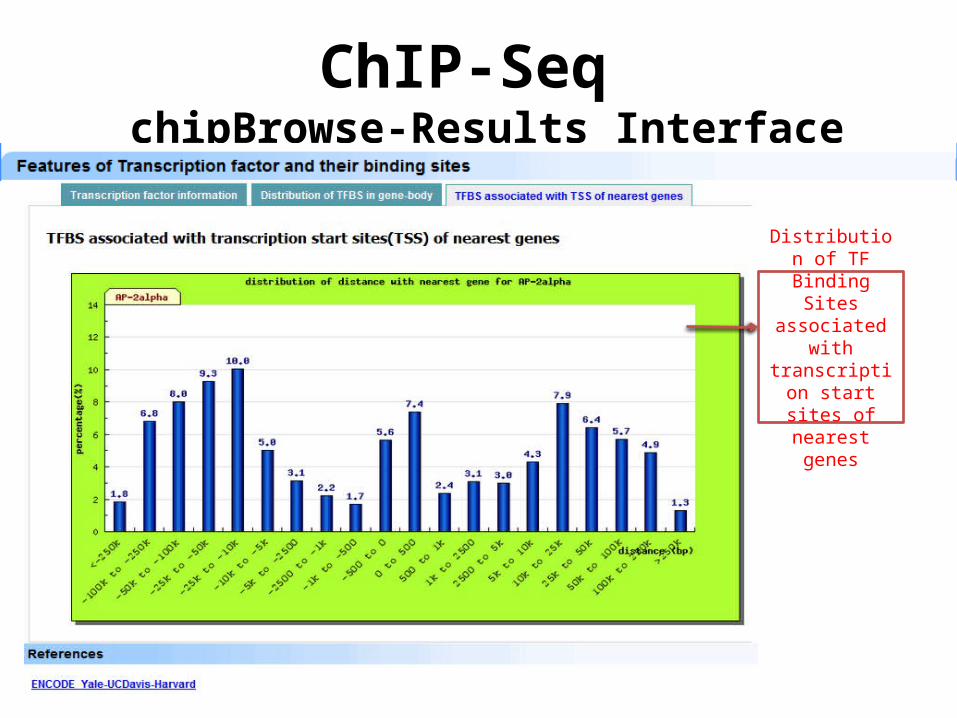
ChIP-SeqchipBrowse-Results Interface
Distribution of TF Binding Sites associated with
transcription start sites of
nearest genes
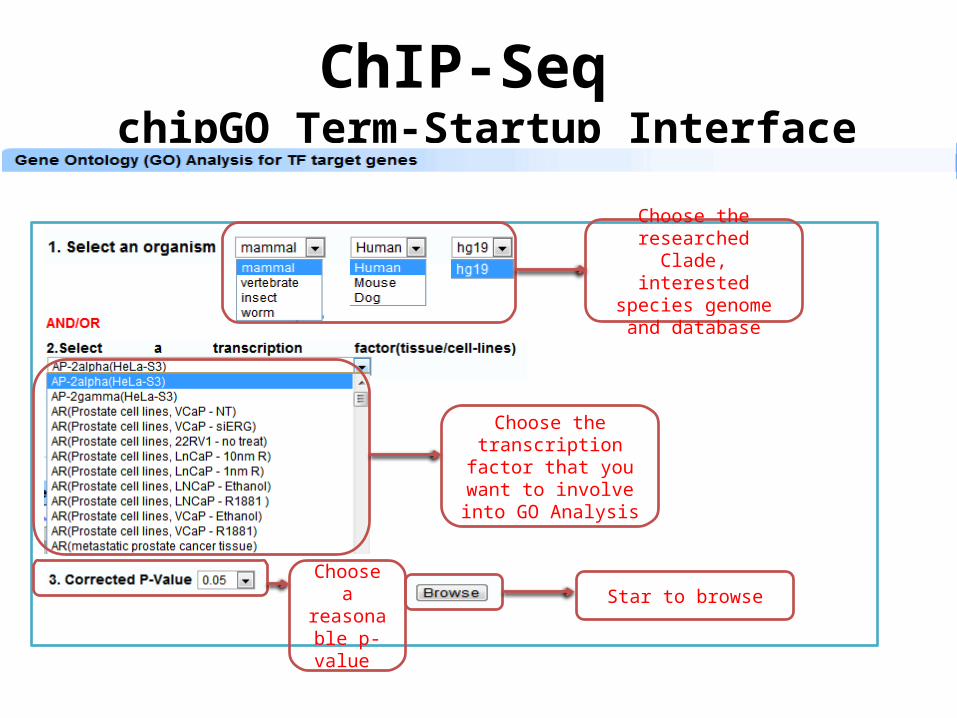
ChIP-SeqchipGO Term-Startup Interface
Choose the researched Clade, interested species
genome and database
Choose the transcription factor that you want to involve into GO Analysis
Star to browseChoose a reasonable
p-value
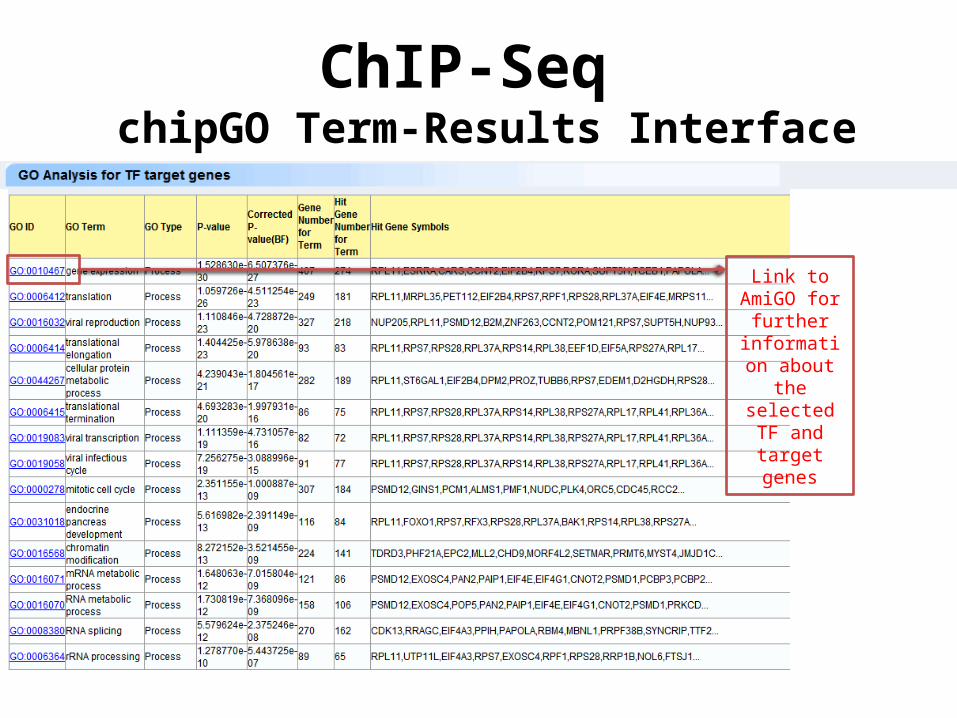
ChIP-SeqchipGO Term-Results Interface
Link to AmiGO for further
information about the
selected TF and target
genes
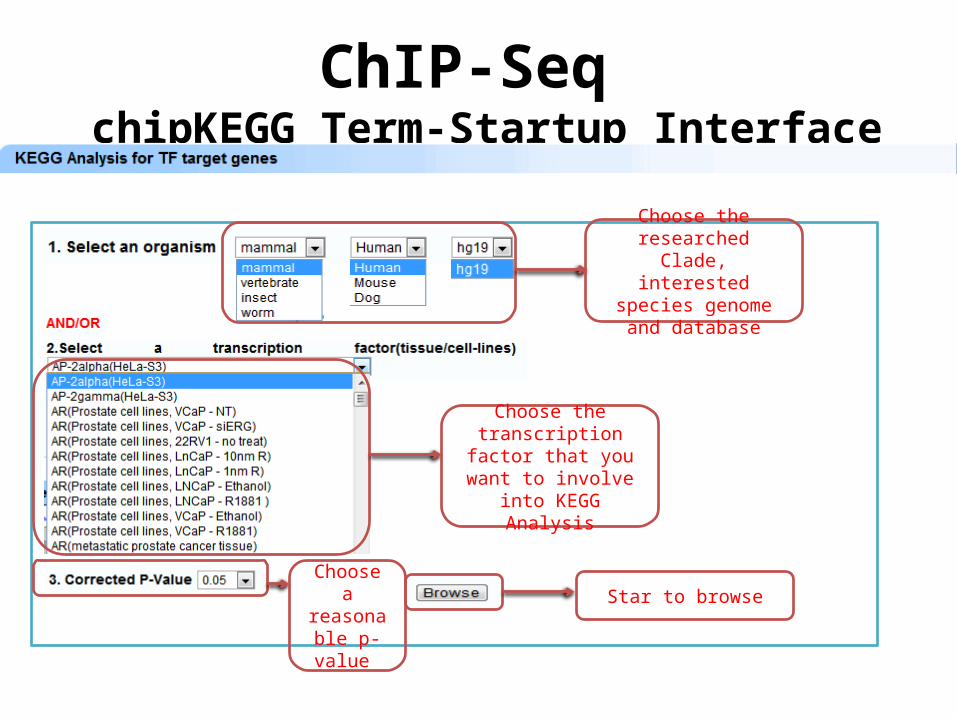
ChIP-SeqchipKEGG Term-Startup Interface
Choose the researched Clade, interested species
genome and database
Choose the transcription factor that you want to
involve into KEGG Analysis
Star to browseChoose a reasonable
p-value
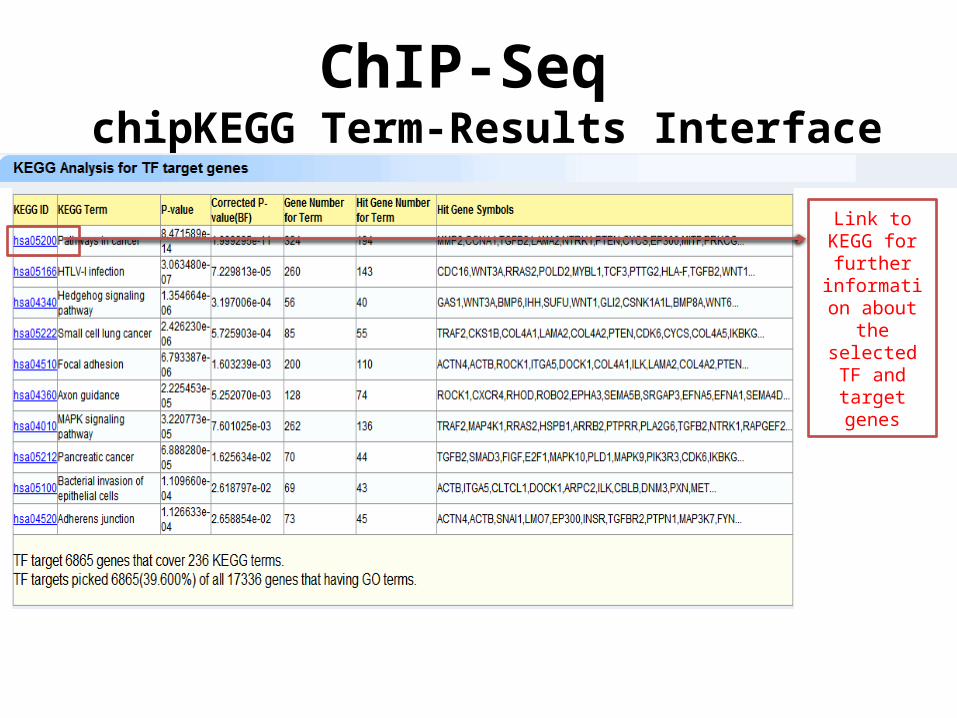
ChIP-SeqchipKEGG Term-Results Interface
Link to KEGG for further
information about the
selected TF and target
genes
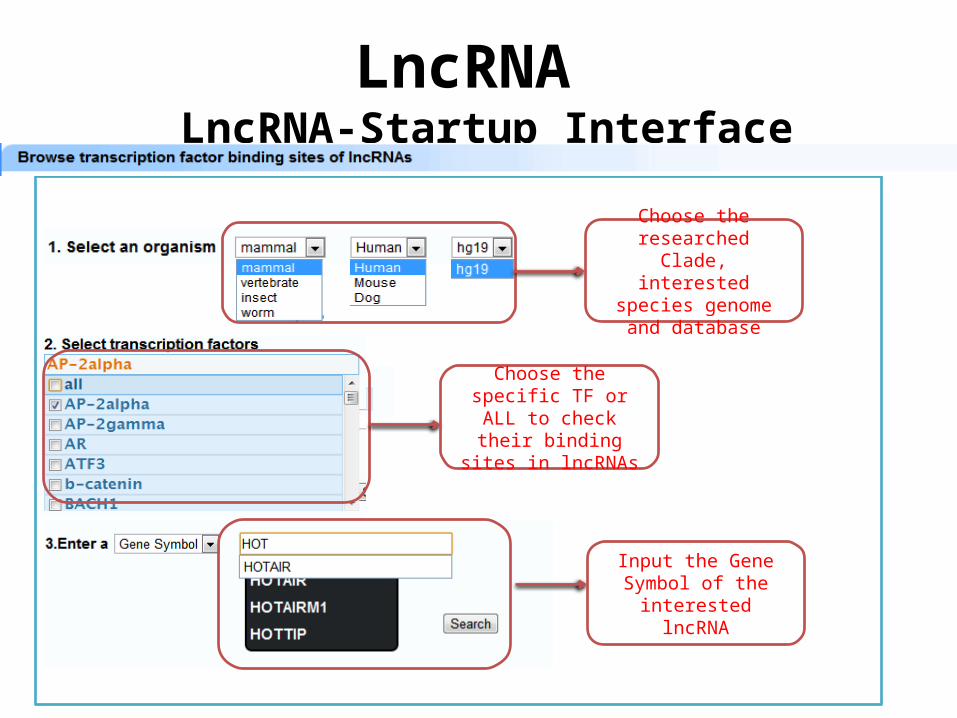
LncRNALncRNA-Startup Interface
Choose the researched Clade, interested species
genome and database
Input the Gene Symbol of the interested lncRNA
Choose the specific TF or ALL to check their
binding sites in lncRNAs
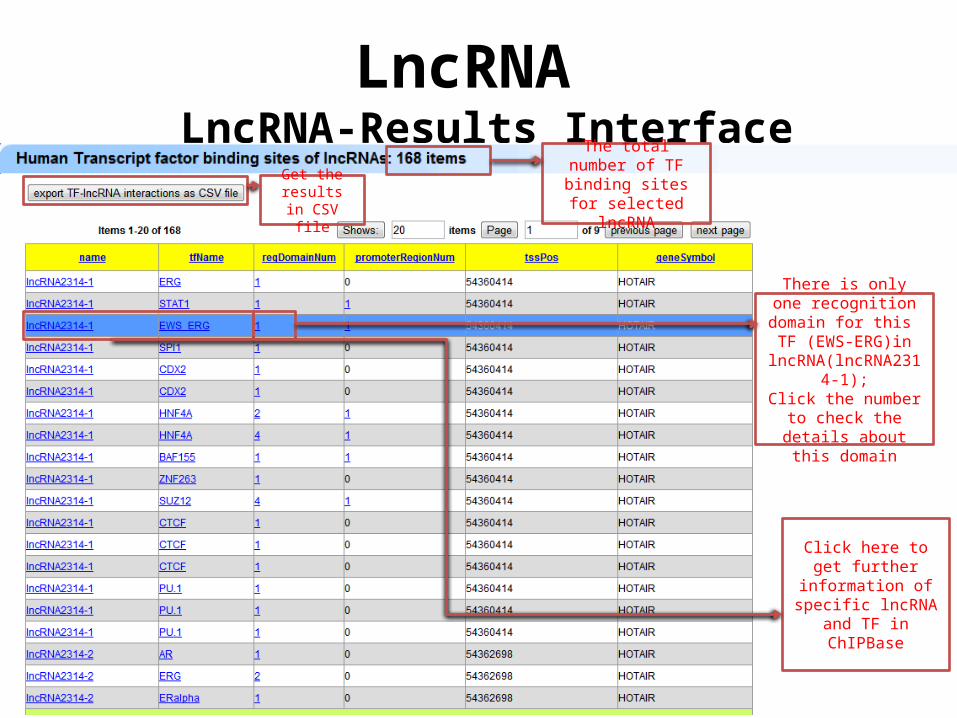
LncRNALncRNA-Results Interface
The total number of TF binding sites for
selected lncRNAGet the
results in CSV file
Click here to get further information of specific lncRNA and TF
in ChIPBase
There is only one recognition domain for
this TF (EWS-ERG)in lncRNA(lncRNA2314-1);
Click the number to check the details about
this domain
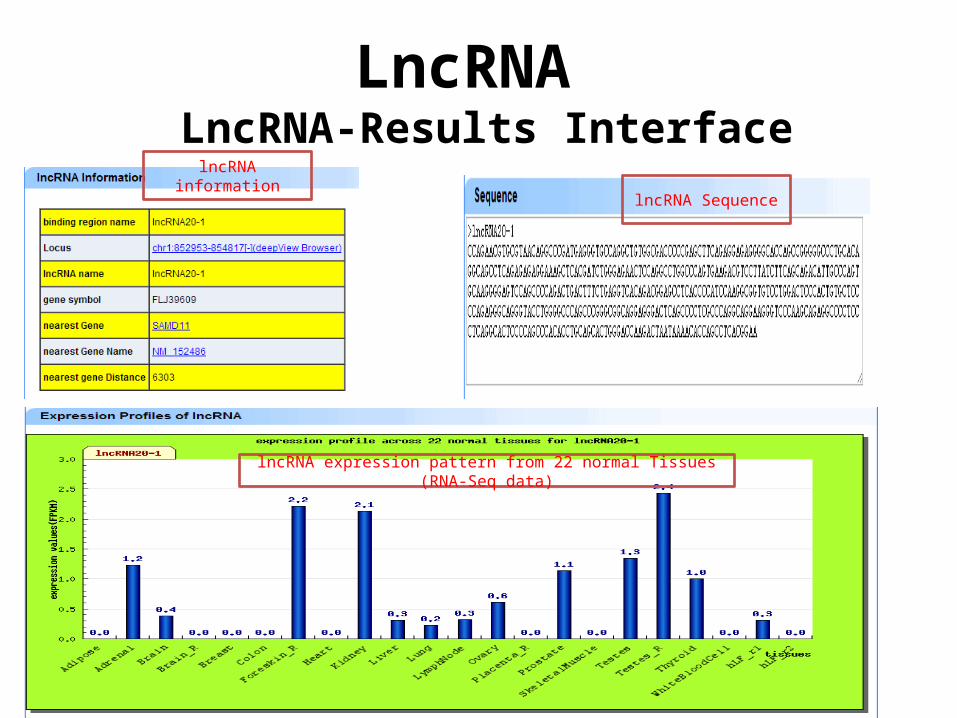
LncRNALncRNA-Results Interface
lncRNA informationlncRNA Sequence
lncRNA expression pattern from 22 normal Tissues (RNA-Seq data)
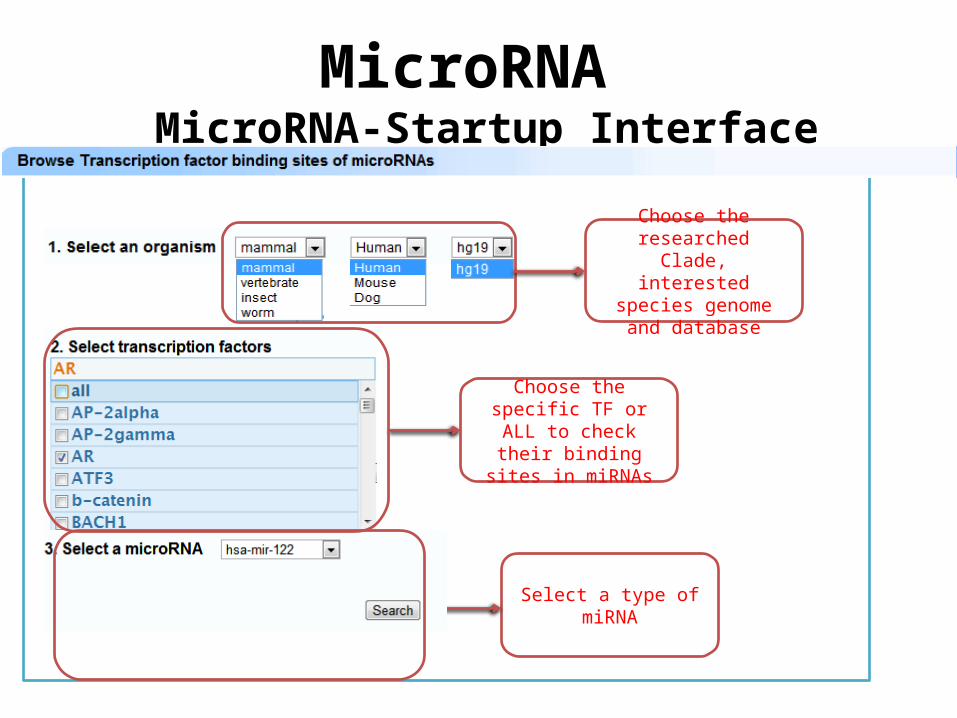
MicroRNAMicroRNA-Startup Interface
Choose the researched Clade, interested species
genome and database
Select a type of miRNA
Choose the specific TF or ALL to check their
binding sites in miRNAs
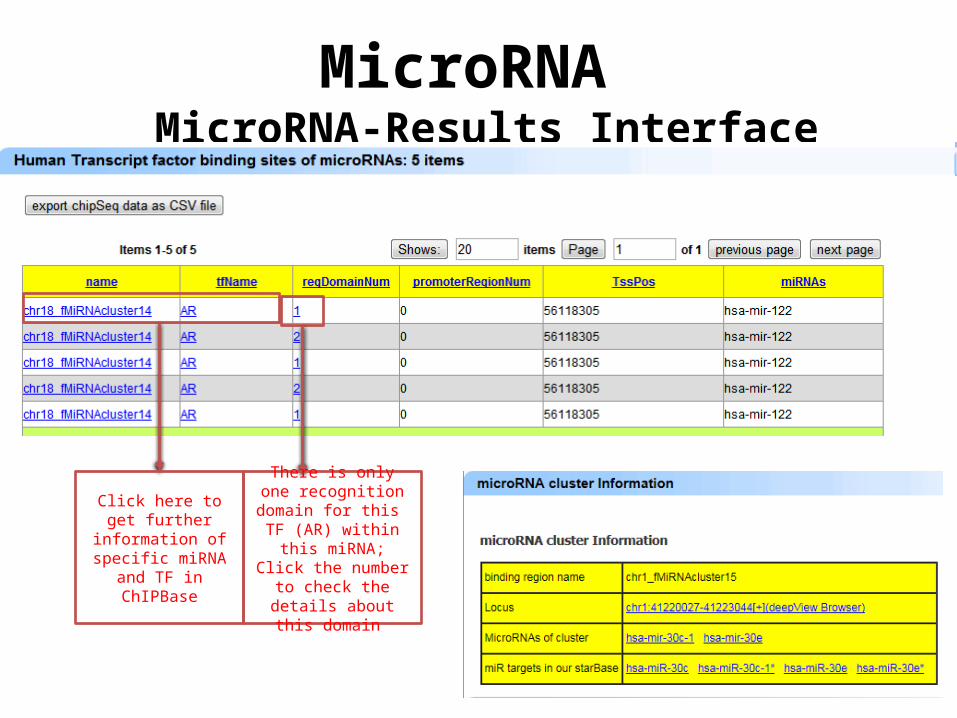
MicroRNAMicroRNA-Results Interface
Click here to get further information of specific miRNA and TF
in ChIPBase
There is only one recognition domain for this TF (AR) within this
miRNA;Click the number to
check the details about this domain
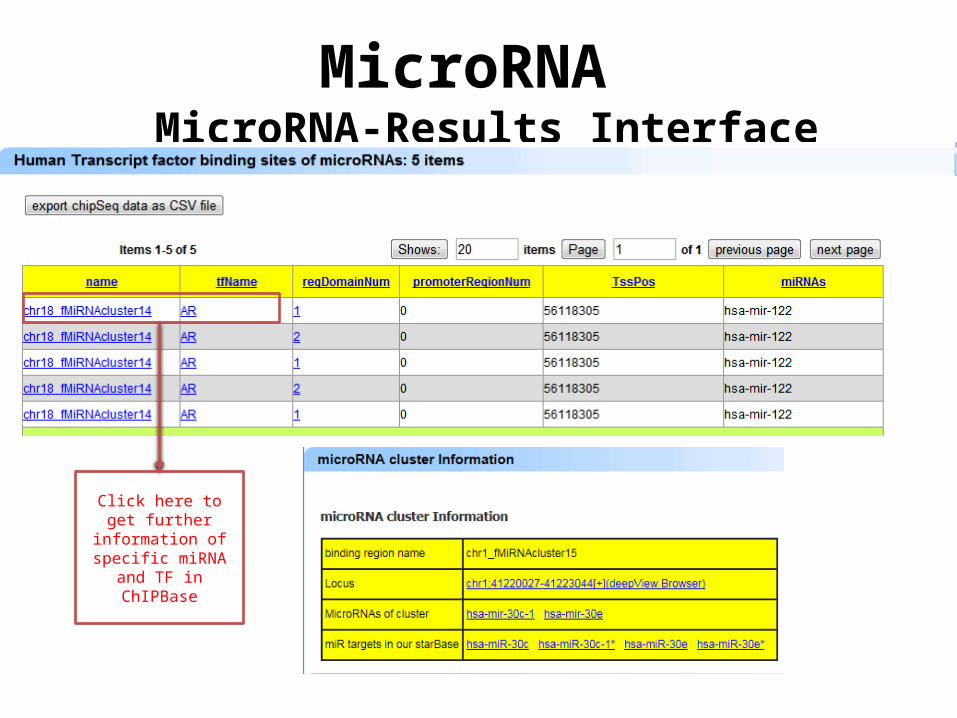
MicroRNAMicroRNA-Results Interface
Click here to get further information of specific miRNA and TF
in ChIPBase
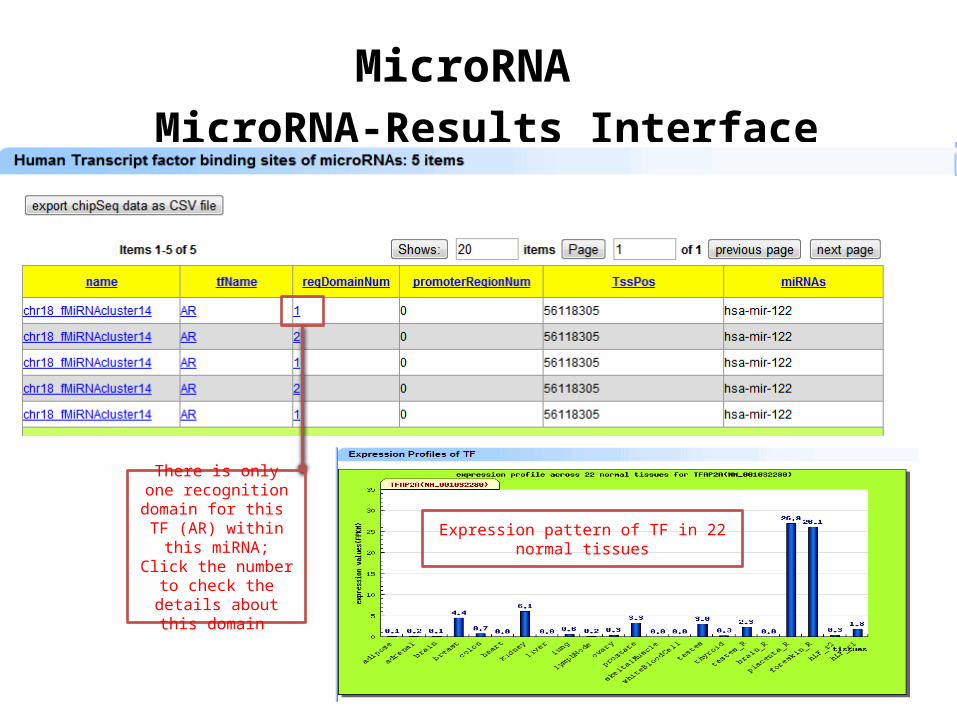
MicroRNAMicroRNA-Results Interface
There is only one recognition domain for this TF (AR) within this
miRNA;Click the number to
check the details about this domain
Expression pattern of TF in 22 normal tissues
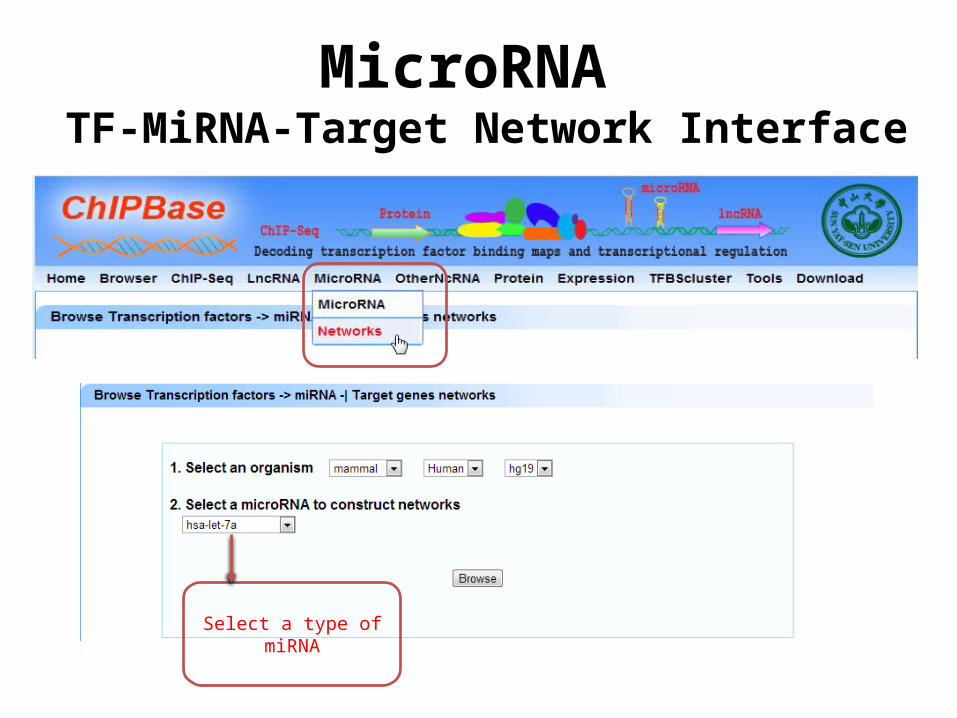
MicroRNATF-MiRNA-Target Network Interface
Select a type of miRNA
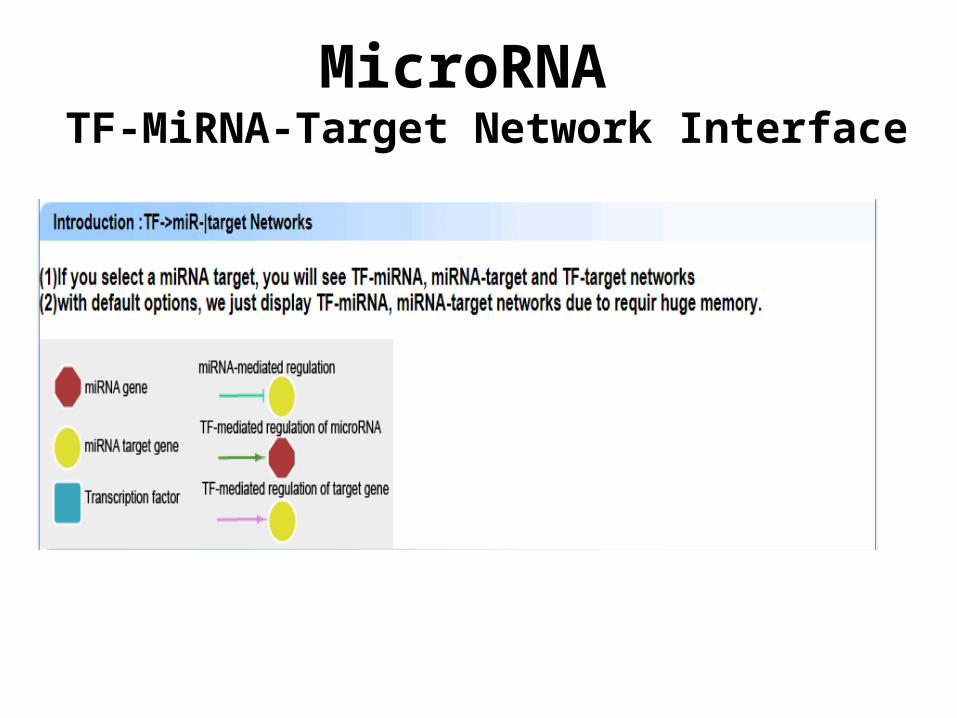
MicroRNATF-MiRNA-Target Network Interface
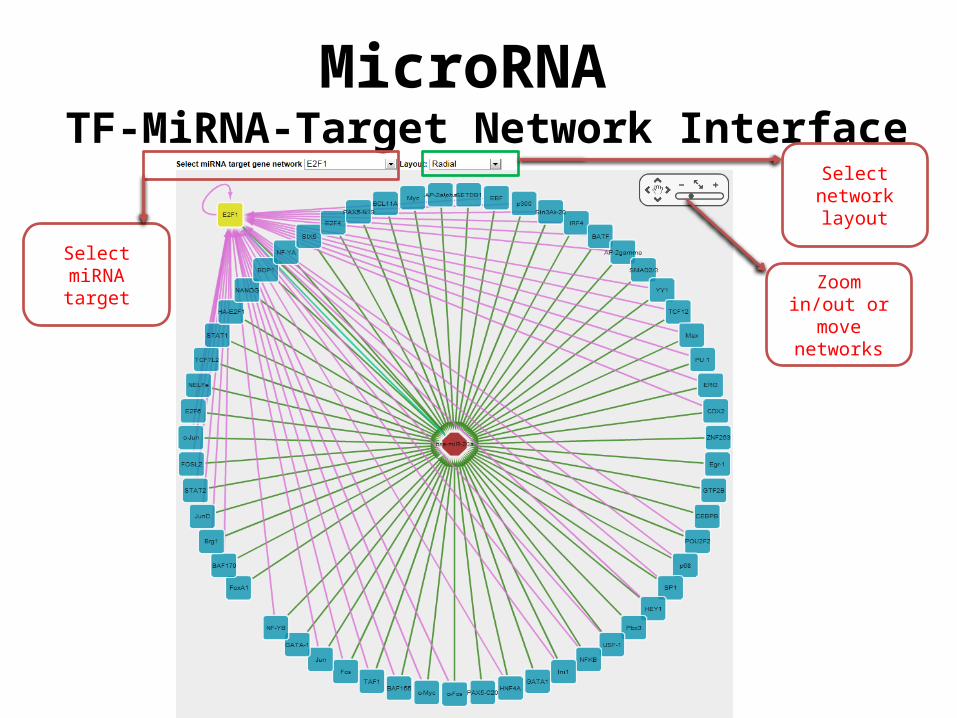
MicroRNATF-MiRNA-Target Network Interface
Select miRNA target
Select network layout
Zoom in/out or move
networks
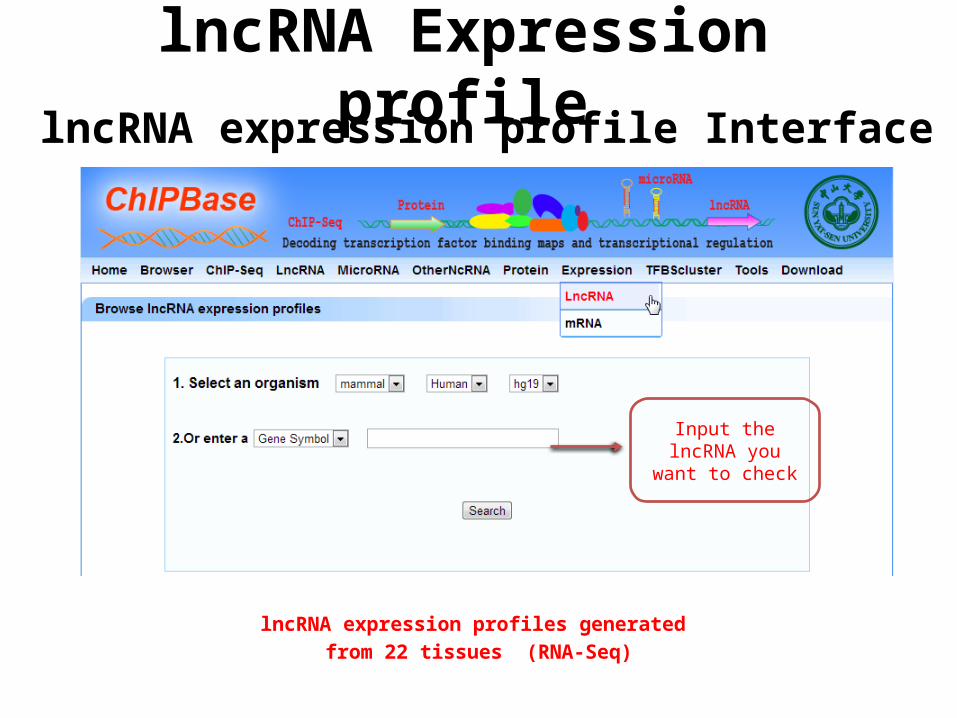
lncRNA Expression profilelncRNA expression profile Interface
Input the lncRNA you want to check
lncRNA expression profiles generated from 22 tissues (RNA-Seq)
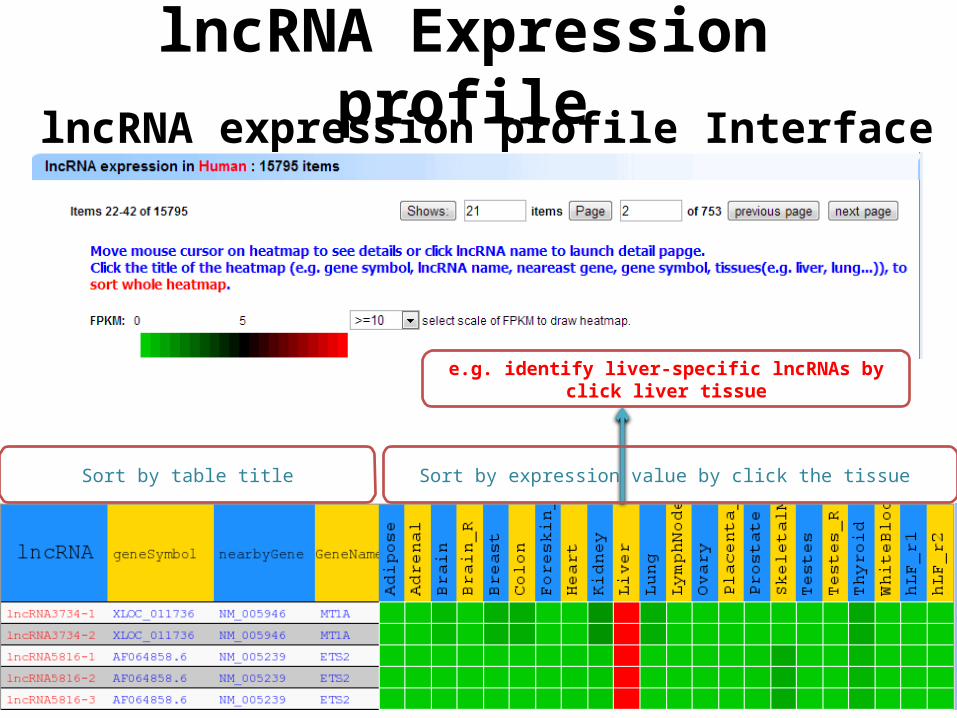
lncRNA Expression profilelncRNA expression profile Interface
Sort by table title Sort by expression value by click the tissue
e.g. identify liver-specific lncRNAs by click liver tissue
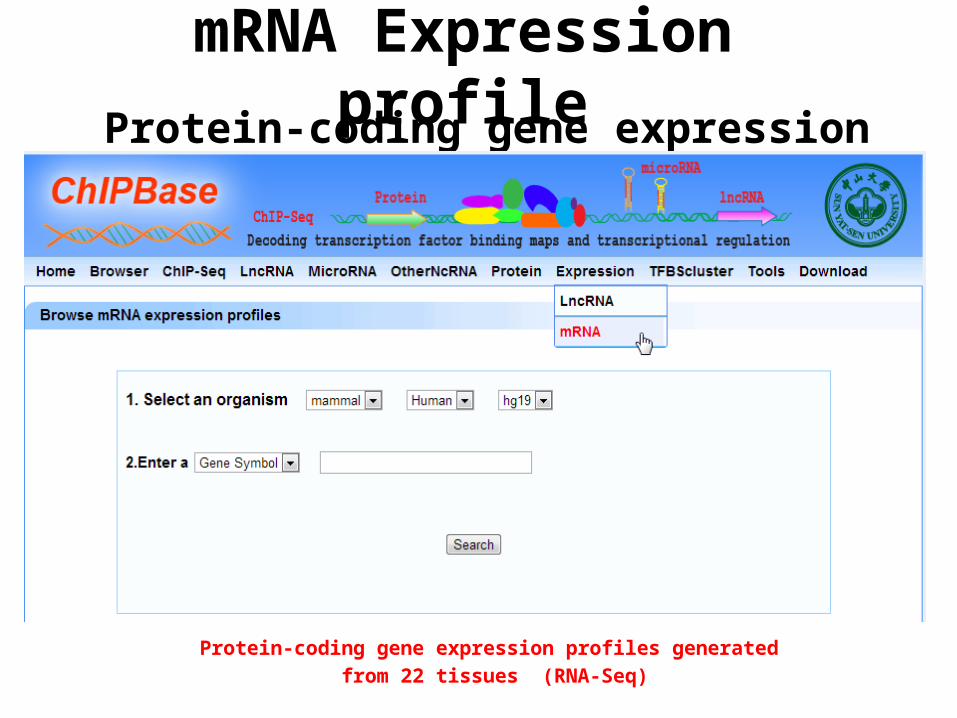
mRNA Expression profileProtein-coding gene expression profile Interface
Protein-coding gene expression profiles generated from 22 tissues (RNA-Seq)
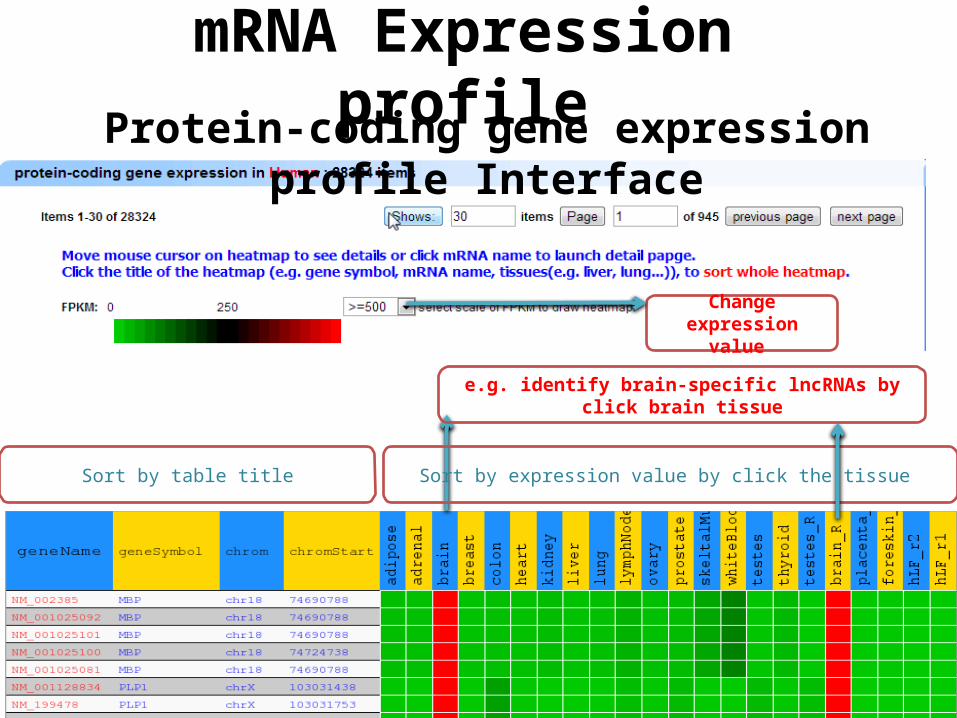
mRNA Expression profileProtein-coding gene expression profile Interface
Sort by table title Sort by expression value by click the tissue
Change expression value
e.g. identify brain-specific lncRNAs by click brain tissue
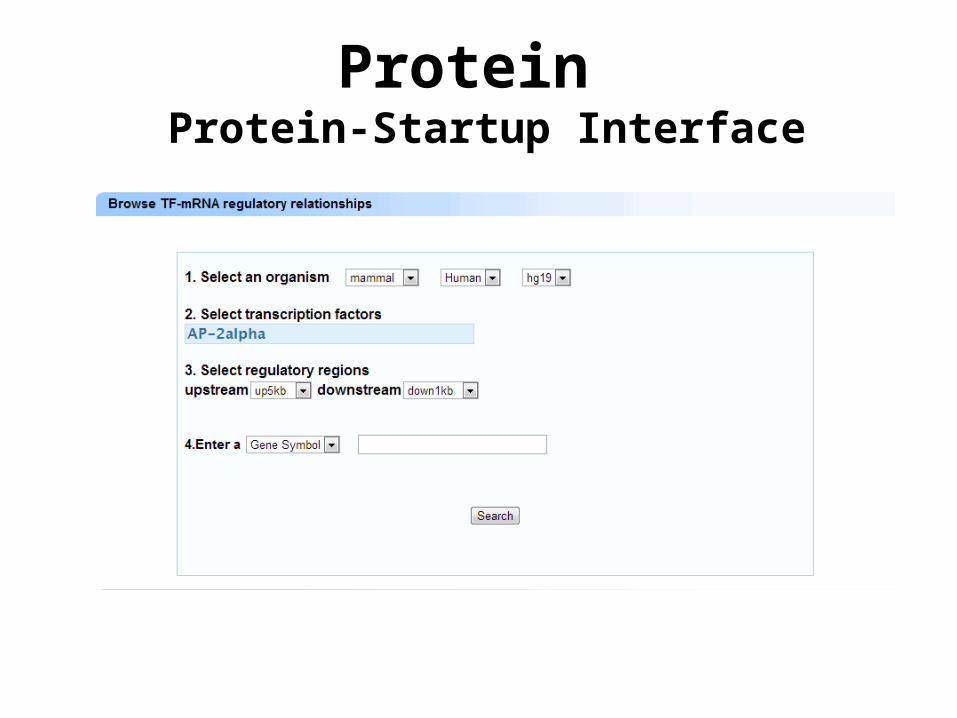
ProteinProtein-Startup Interface
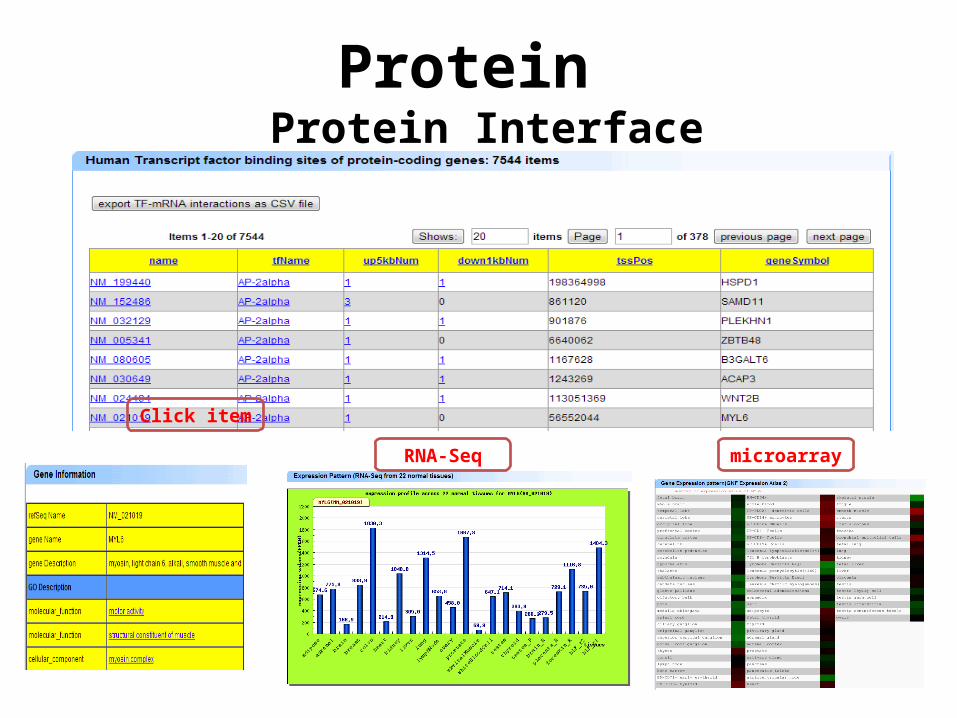
ProteinProtein Interface
Click item
RNA-Seq microarray
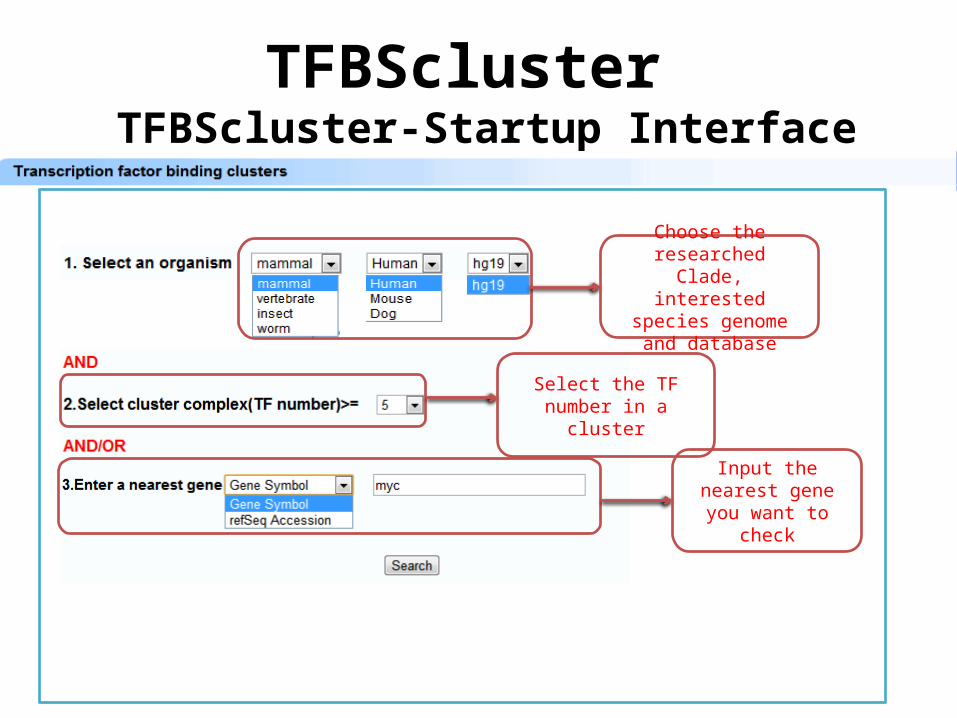
TFBSclusterTFBScluster-Startup Interface
Choose the researched Clade, interested species
genome and database
Input the Gene Symbol of the interested lncRNA
Choose the specific TF or ALL to check their
binding sites in lncRNAs
Choose the researched Clade, interested species
genome and database
Select the TF number in a cluster
Input the nearest gene you want to
check
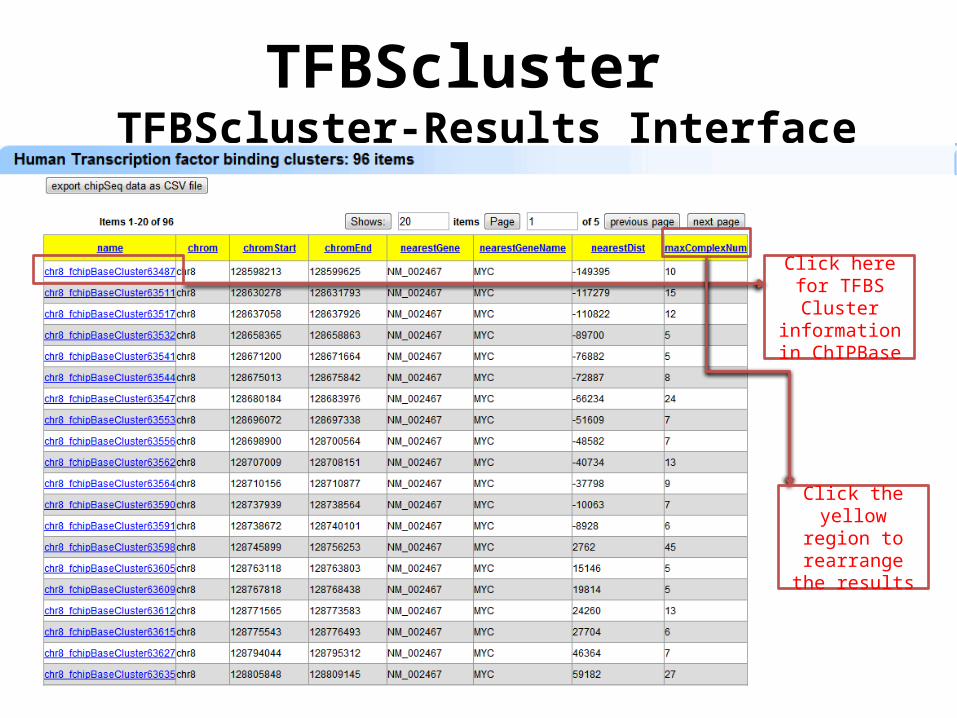
TFBSclusterTFBScluster-Results Interface
Click here for TFBS Cluster
information in ChIPBase
Click the yellow region to
rearrange the results
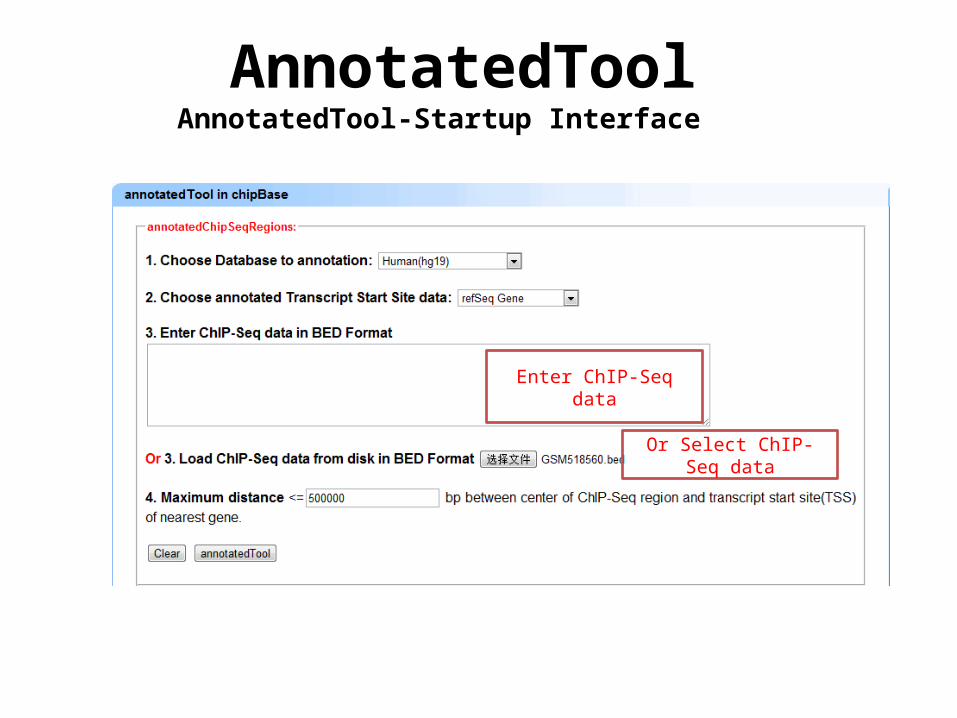
AnnotatedToolAnnotatedTool-Startup Interface
Enter ChIP-Seq data
Or Select ChIP-Seq data
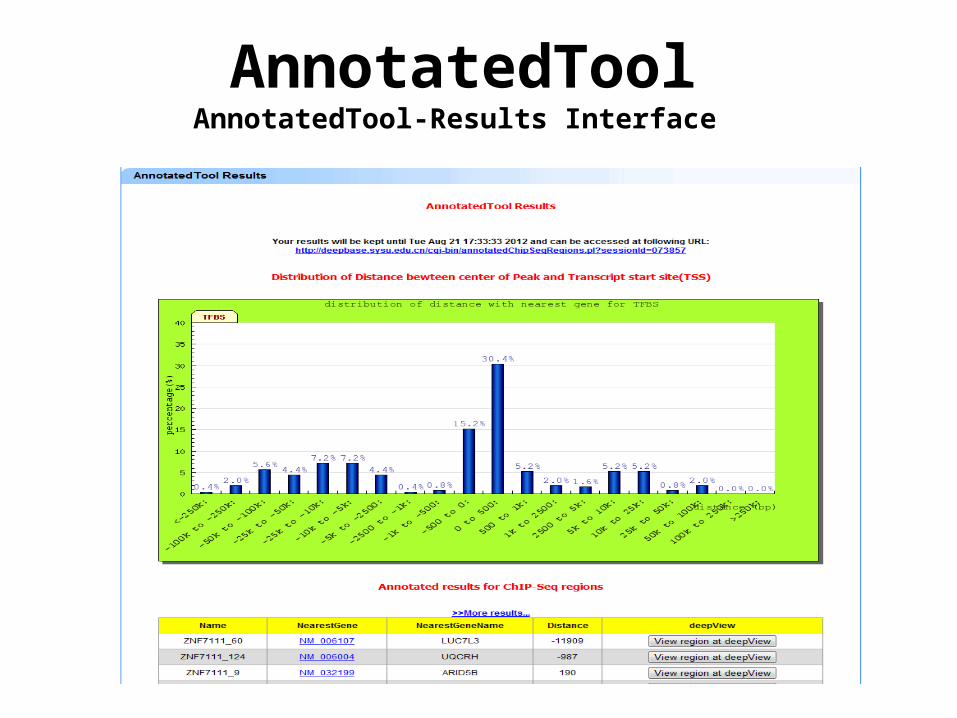
AnnotatedToolAnnotatedTool-Results Interface
Congratulations! you have already finished the tutorial of ChIPBase! Now it’s time for you to try it in your own research projects. Good luck!
Thanks for your interest in our ChIPBase!!!