Embed Size (px)
Citation preview
Tutorial for MASTAN2Tutorial for MASTAN2version 3.0version 3.0
Developed by:
Ronald D. ZiemianProfessor of Civil Engineering
Bucknell University
William McGuireProfessor of Civil Engineering, Emeritus
Cornell University
JOHN WILEY & SONS, INC.New York Chichester WeinheimBrisbane Singapore Toronto
Continue
ExitCopyright 2007, R.D. Ziemian and W. McGuire. All rights reserved.
Tutorial TopicsTutorial Topics
Introduction
Getting started
Window layout
Step-by-step example
Overview of commands
Programming user defined code
< click on a topic >
Additional information
Samples of MASTAN2 models
IntroductionIntroduction
MASTAN2 is an interactive graphics program that provides preprocessing, analysis, and postprocessing capabilities. Preprocessing options include definition of structural geometry, support conditions, applied loads, and element properties. The analysis routines provide the user the opportunity to perform first- or second-order elastic or inelastic analyses of two- or three-dimensional frames and trusses subjected to static loads. Postprocessing capabilities include the interpretation of structural behavior through deformation and force diagrams, printed output, and facilities for plotting response curves. MASTAN2 is based on MATLAB®, a premier software package for numeric computing and data analysis.
In many ways, MASTAN2 is similar to today’s commercially available software in functionality. The number of pre- and post-processing options, however, have been limited in order to minimize the amount of time needed for a user to become proficient at its use. The program’s linear and nonlinear analysis routines are based on the theoretical and numerical formulations presented in the text Matrix Structural Analysis, 2nd Edition, by McGuire, Gallagher, and Ziemian. In this regard, the reader is strongly encouraged to use this software as a tool for demonstration, reviewing examples, solving problems, and perhaps performing analysis and design studies. Where MASTAN2 has been written in modular format, the reader is also provided the opportunity to develop and implement additional or alternative analysis routines directly within the program.
MATLAB is a registered trademark of The MathWorks, Inc., 3 Apple Hill Drive, Natick, MA 01760-2098.
Getting StartedGetting Started
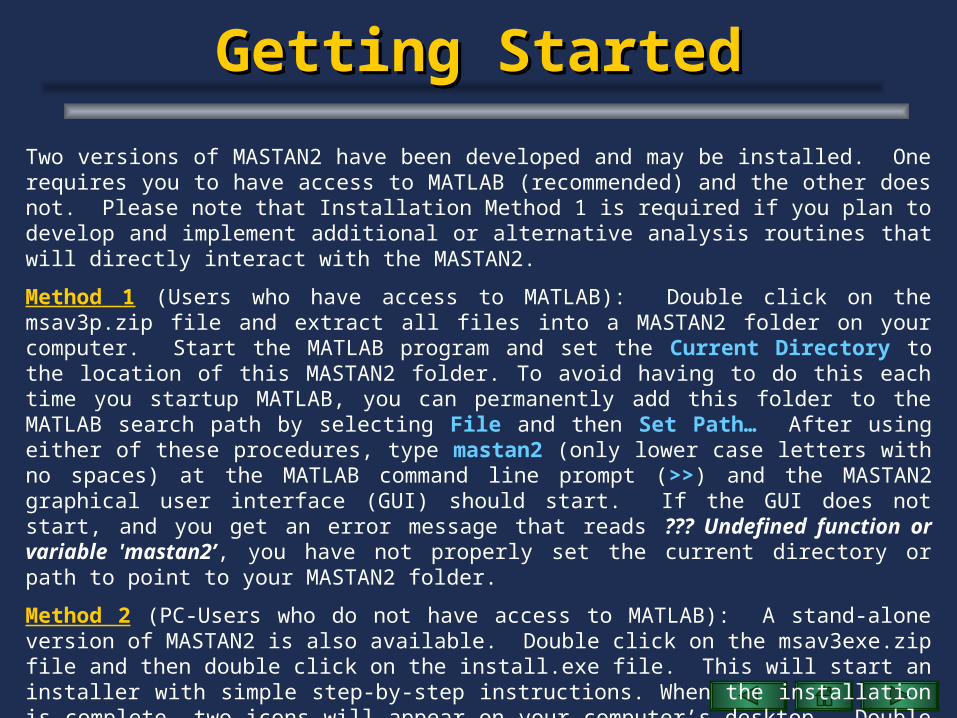
Two versions of MASTAN2 have been developed and may be installed. One requires you to have access to MATLAB (recommended) and the other does not. Please note that Installation Method 1 is required if you plan to develop and implement additional or alternative analysis routines that will directly interact with the MASTAN2.
Method 1 (Users who have access to MATLAB): Double click on the msav3p.zip file and extract all files into a MASTAN2 folder on your computer. Start the MATLAB program and set the Current Directory to the location of this MASTAN2 folder. To avoid having to do this each time you startup MATLAB, you can permanently add this folder to the MATLAB search path by selecting File and then Set Path… After using either of these procedures, type mastan2 (only lower case letters with no spaces) at the MATLAB command line prompt (>>) and the MASTAN2 graphical user interface (GUI) should start. If the GUI does not start, and you get an error message that reads ??? Undefined function or variable 'mastan2’, you have not properly set the current directory or path to point to your MASTAN2 folder.
Method 2 (PC-Users who do not have access to MATLAB): A stand-alone version of MASTAN2 is also available. Double click on the msav3exe.zip file and then double click on the install.exe file. This will start an installer with simple step-by-step instructions. When the installation is complete, two icons will appear on your computer’s desktop. Double click on the MASTAN2v3 icon to start MASTAN2. Note that it may take up to a minute for the program to initially start. The second icon provides access to an interactive tutorial. Note that this stand-alone version provides all the same functionality except that you cannot prepare user defined code that will interact with MASTAN2.
Window LayoutWindow Layout
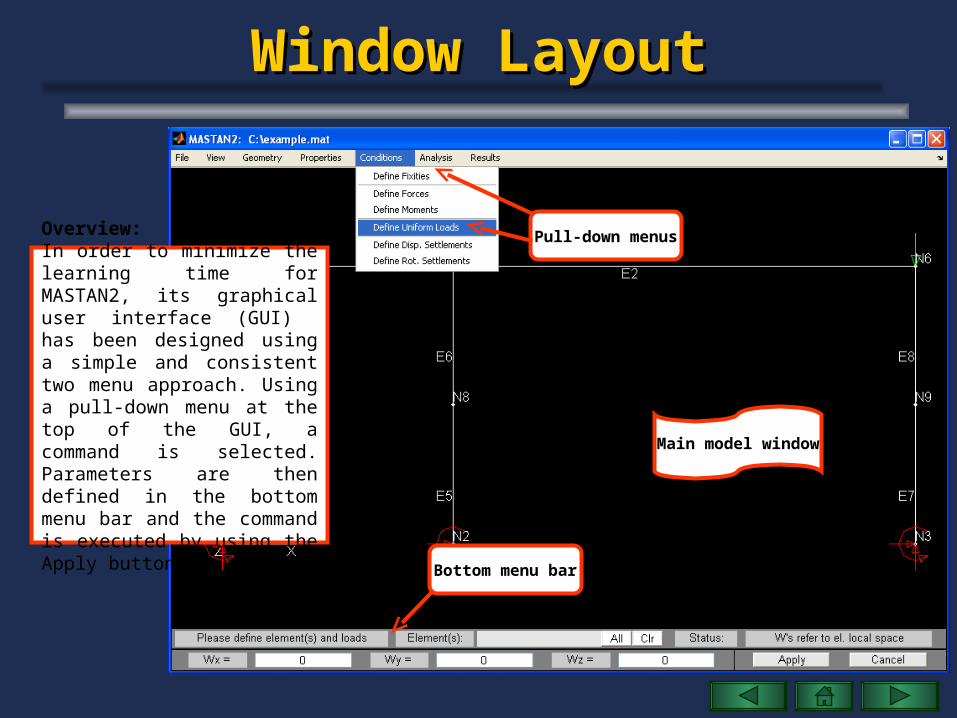
Pull-down menus
Bottom menu bar
Main model window
Overview:In order to minimize the learning time for MASTAN2, its graphical user interface (GUI) has been designed using a simple and consistent two menu approach. Using a pull-down menu at the top of the GUI, a command is selected. Parameters are then defined in the bottom menu bar and the command is executed by using the Apply button.
Step-by-Step ExampleStep-by-Step Example
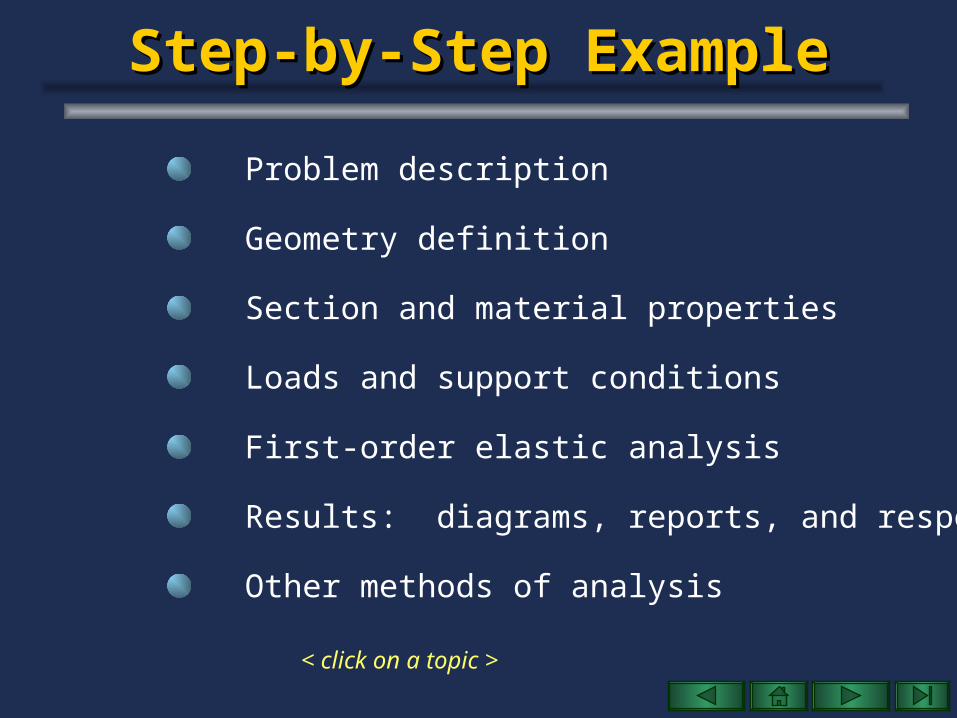
Problem description
Geometry definition
Section and material properties
Loads and support conditions
First-order elastic analysis
Results: diagrams, reports, and response curves
Other methods of analysis
< click on a topic >
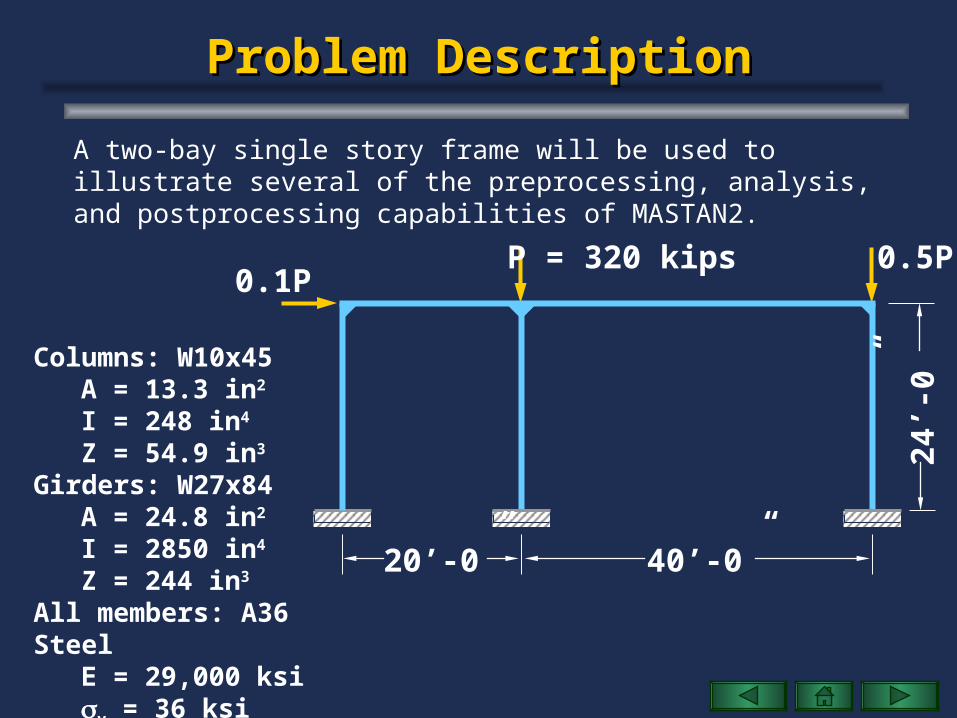
Columns: W10x45A = 13.3 in2
I = 248 in4
Z = 54.9 in3
Girders: W27x84A = 24.8 in2
I = 2850 in4
Z = 244 in3
All members: A36 SteelE = 29,000 ksiy = 36 ksi
Problem DescriptionProblem Description
P = 320 kips
A two-bay single story frame will be used to illustrate several of the preprocessing, analysis, and postprocessing capabilities of MASTAN2.
0.5P0.1P
20’-0”
24’-
0”
40’-0”
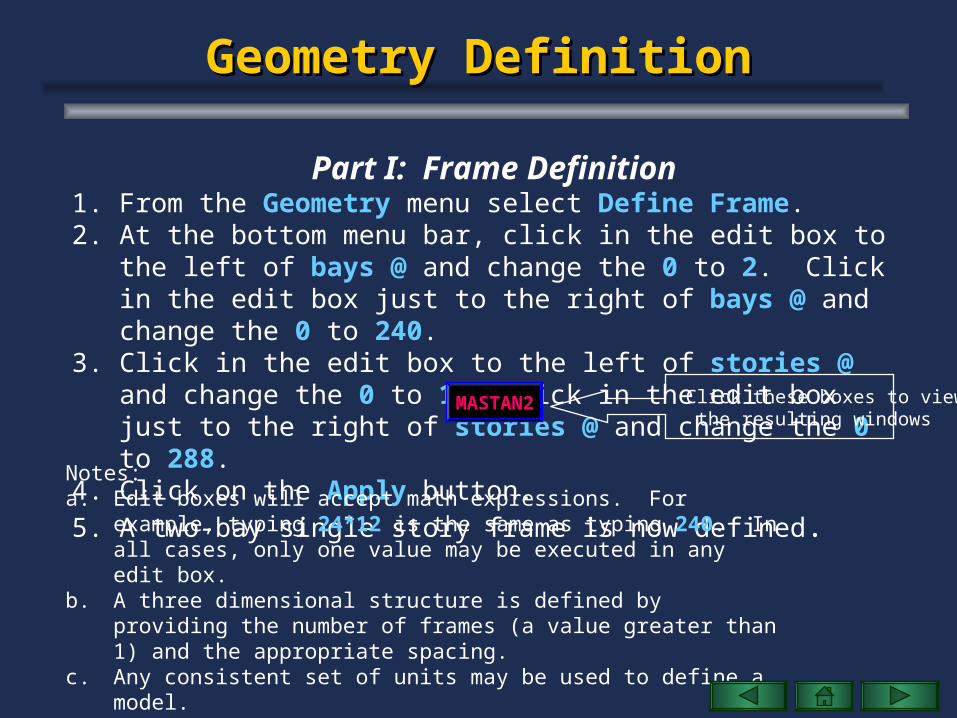
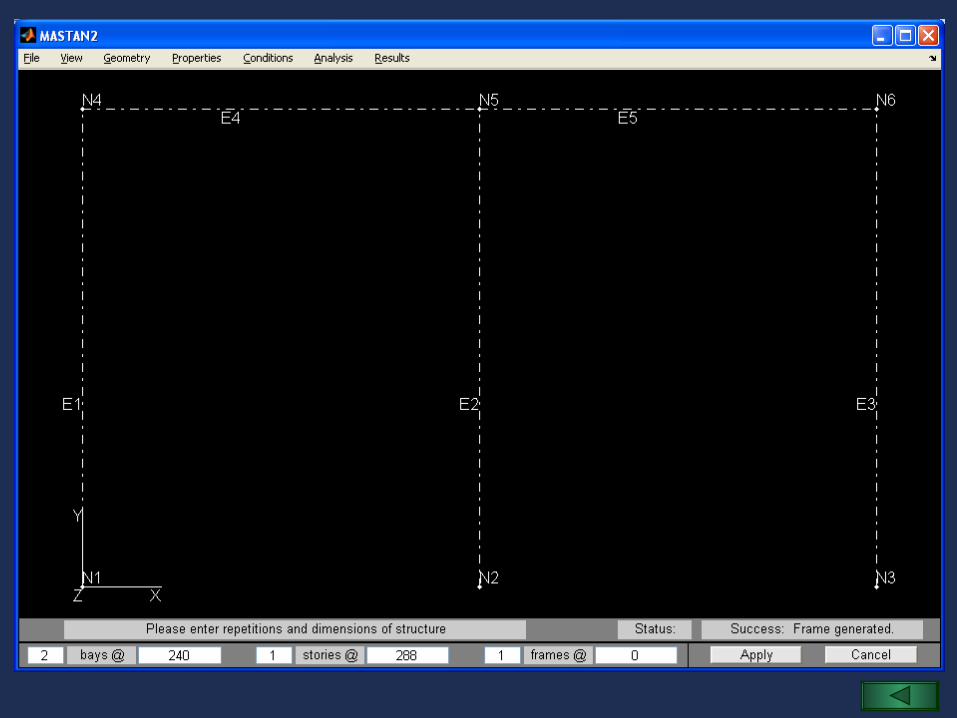
Geometry DefinitionGeometry Definition
Part I: Frame Definition1. From the Geometry menu select Define Frame.2. At the bottom menu bar, click in the edit box to the left of bays @ and
change the 0 to 2. Click in the edit box just to the right of bays @ and change the 0 to 240.
3. Click in the edit box to the left of stories @ and change the 0 to 1. Click in the edit box just to the right of stories @ and change the 0 to 288.
4. Click on the Apply button.
5. A two-bay single story frame is now defined.Notes:a. Edit boxes will accept math expressions. For example, typing 24*12 is the
same as typing 240. In all cases, only one value may be executed in any edit box.
b. A three dimensional structure is defined by providing the number of frames (a value greater than 1) and the appropriate spacing.
c. Any consistent set of units may be used to define a model.
MASTAN2 Click these boxes to view the resulting windows
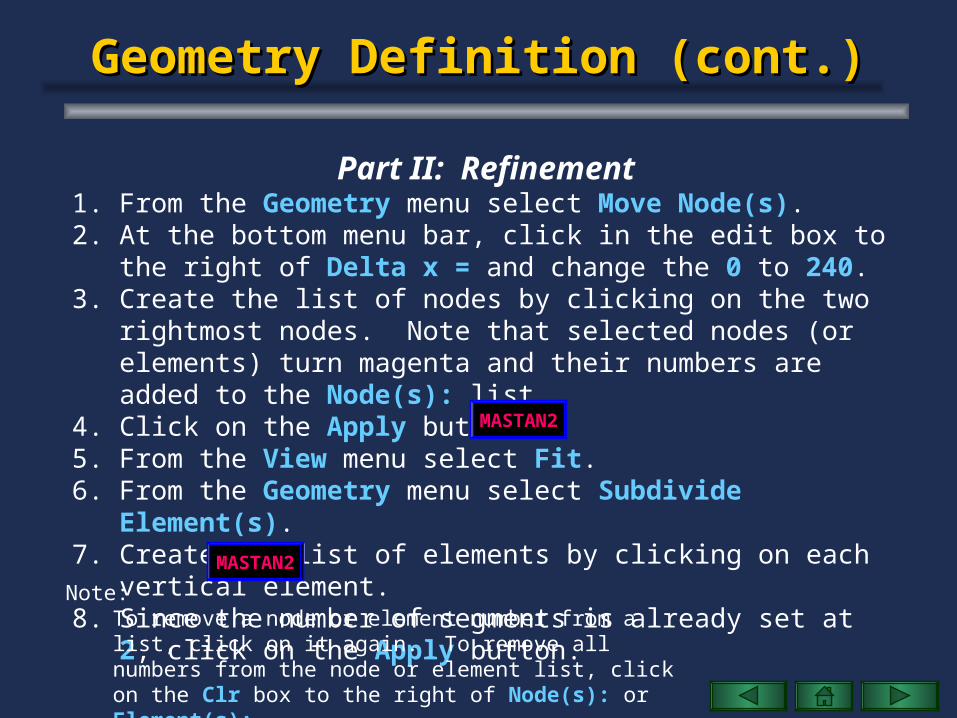
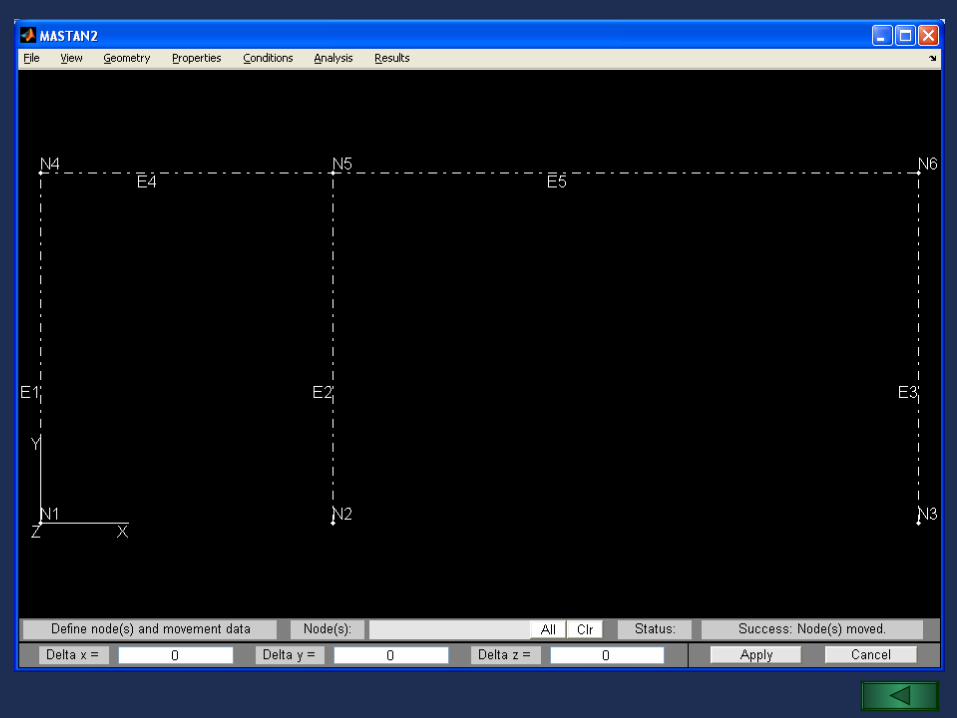
Geometry Definition (cont.)Geometry Definition (cont.)
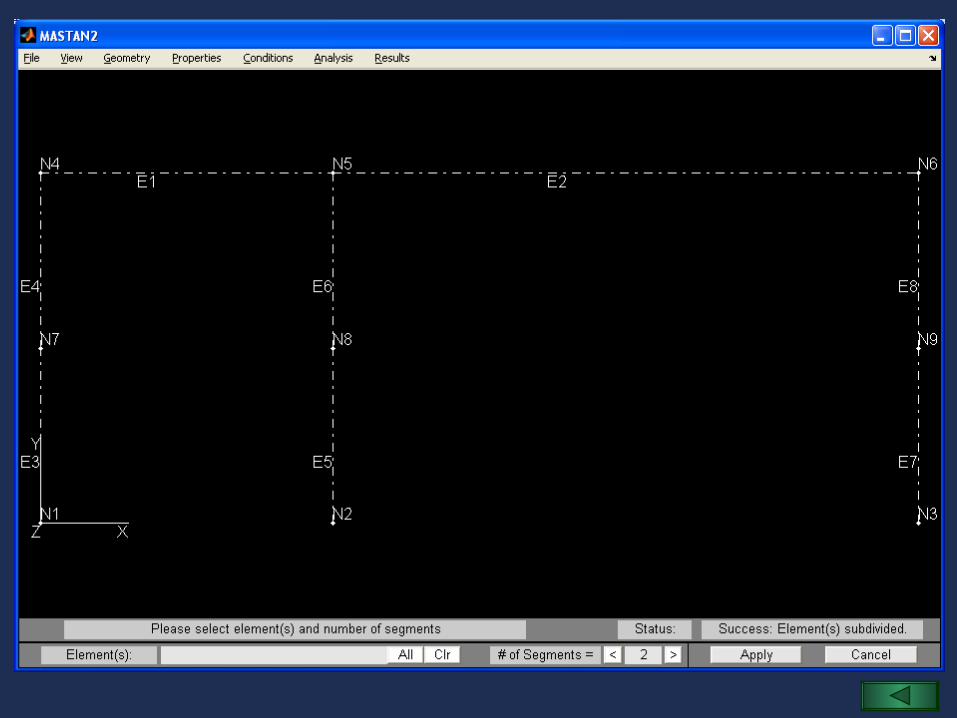
Part II: Refinement1. From the Geometry menu select Move Node(s).2. At the bottom menu bar, click in the edit box to the right of Delta x =
and change the 0 to 240.3. Create the list of nodes by clicking on the two rightmost nodes. Note
that selected nodes (or elements) turn magenta and their numbers are added to the Node(s): list.
4. Click on the Apply button.5. From the View menu select Fit.6. From the Geometry menu select Subdivide Element(s).7. Create the list of elements by clicking on each vertical element.8. Since the number of segments is already set at 2, click on the Apply
button.Note:
To remove a node or element number from a list, click on it again. To remove all numbers from the node or element list, click on the Clr box to the right of Node(s): or Element(s):.
MASTAN2
MASTAN2
Section and Material PropertiesSection and Material Properties
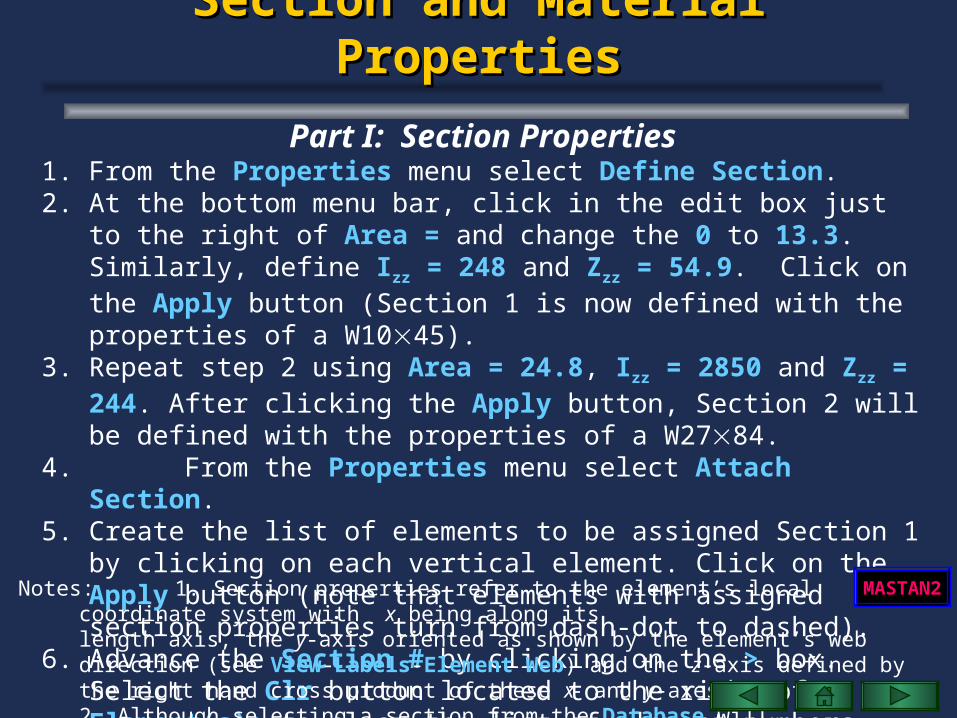
Part I: Section Properties1. From the Properties menu select Define Section.2. At the bottom menu bar, click in the edit box just to the right of Area = and
change the 0 to 13.3. Similarly, define Izz = 248 and Zzz = 54.9. Click on the Apply button (Section 1 is now defined with the properties of a W1045).
3. Repeat step 2 using Area = 24.8, Izz = 2850 and Zzz = 244. After clicking the Apply button, Section 2 will be defined with the properties of a W2784.
4. From the Properties menu select Attach Section.5. Create the list of elements to be assigned Section 1 by clicking on each
vertical element. Click on the Apply button (note that elements with assigned section properties turn from dash-dot to dashed).
6. Advance the Section # by clicking on the > box. Select the Clr button located to the right of Element(s): to clear the list of element numbers.
7. Assign Section 2 properties to all horizontal elements by repeating step 5.Notes: 1. Section properties refer to the element’s local coordinate system with x being along its
length axis, the y-axis oriented as shown by the element’s web direction (see View-Labels-Element Web) and the z-axis defined by the right hand cross product of these x- and y-axes.2. Although selecting a section from the Database will automatically type in all relevant properties, you must still click on the Apply button to define the section.
MASTAN2
Section and Material Prop. (cont.)Section and Material Prop. (cont.)
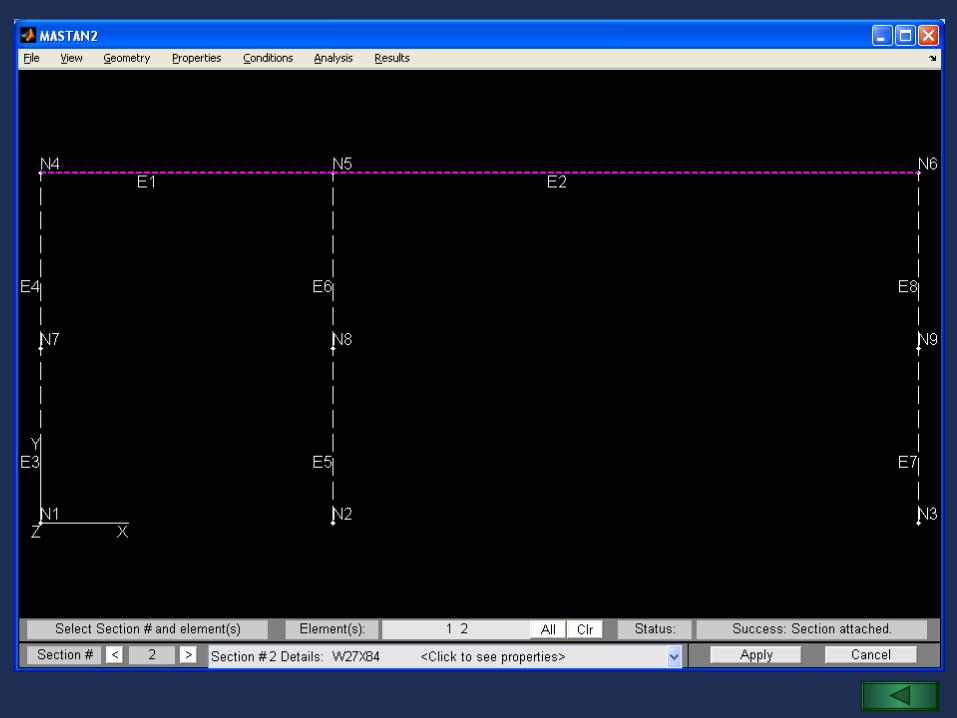
Part II: Material Properties1. From the Properties menu select Define Material.2. At the bottom menu bar, click in the edit box just to the right of E = and
change the 0 to 29000 (not 29,000). Similarly, define Fy = 36 and the Name of the material as A36. Click on the Apply button (Material #1 is now defined with the properties of A36 steel).
3. From the Properties menu select Attach Material.4. At the bottom menu bar, create the list of elements to be assigned the
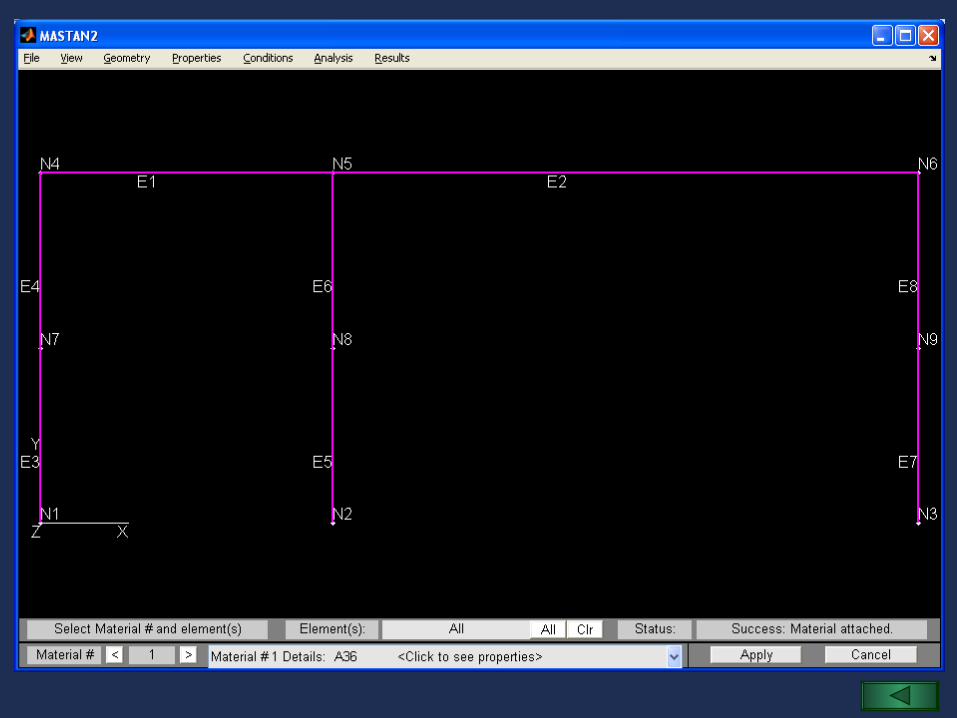
properties of Material 1 by clicking on the All button to the right of Element(s):. Click on the Apply button (note that elements with assigned section and material properties turn to solid).
Notes:1. As indicated earlier, MASTAN2 will work for any consistent set of units. In this example all
force units are in kips and all length units are in inches.2. Similar to section properties, properties for more than one material can be defined and
assigned to different elements.3. Definition and attached elements of section and material properties may be confirmed with
Properties-Information-Section. or Properties-Information-Material.
MASTAN2
Loads and Support ConditionsLoads and Support Conditions
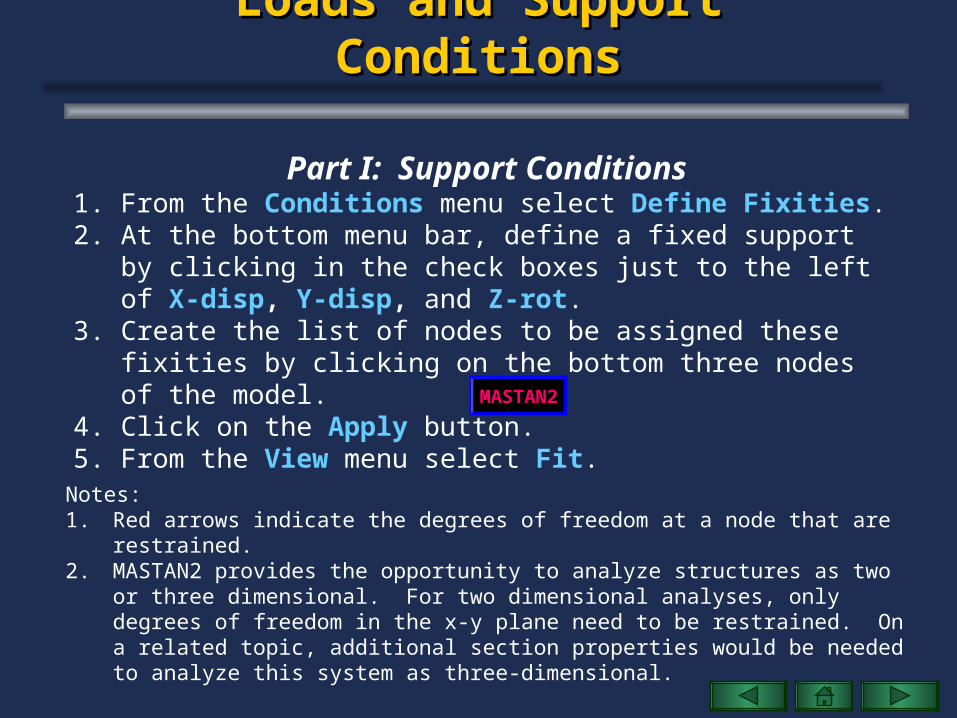
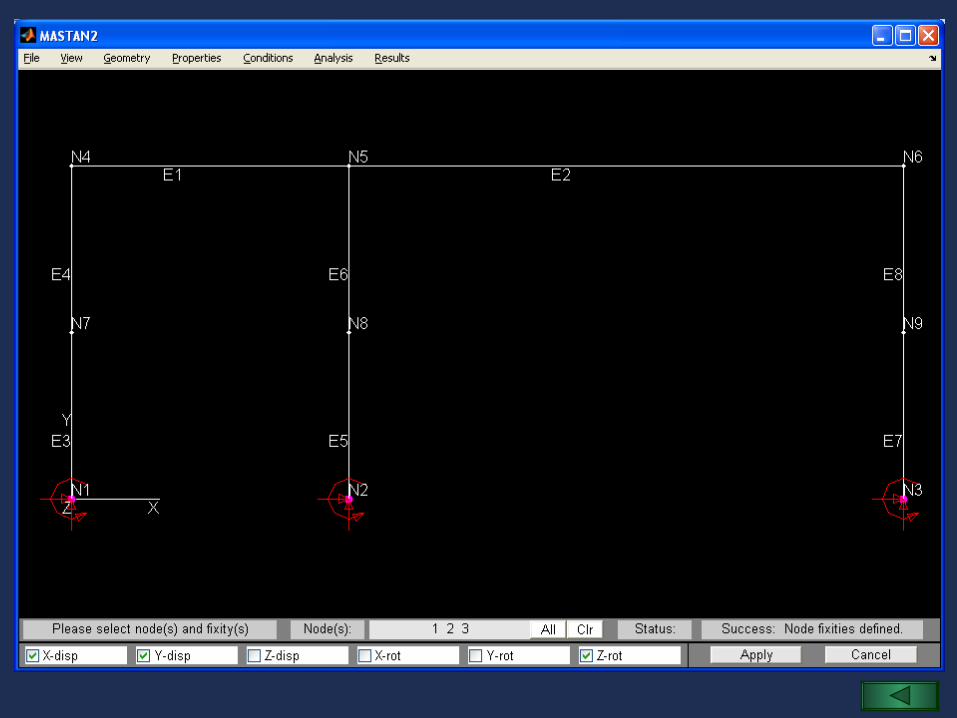
Part I: Support Conditions1. From the Conditions menu select Define Fixities.2. At the bottom menu bar, define a fixed support by clicking in the check
boxes just to the left of X-disp, Y-disp, and Z-rot.3. Create the list of nodes to be assigned these fixities by clicking on the
bottom three nodes of the model.4. Click on the Apply button.5. From the View menu select Fit.
Notes:1. Red arrows indicate the degrees of freedom at a node that are restrained.2. MASTAN2 provides the opportunity to analyze structures as two or three dimensional. For
two dimensional analyses, only degrees of freedom in the x-y plane need to be restrained. On a related topic, additional section properties would be needed to analyze this system as three-dimensional.
MASTAN2
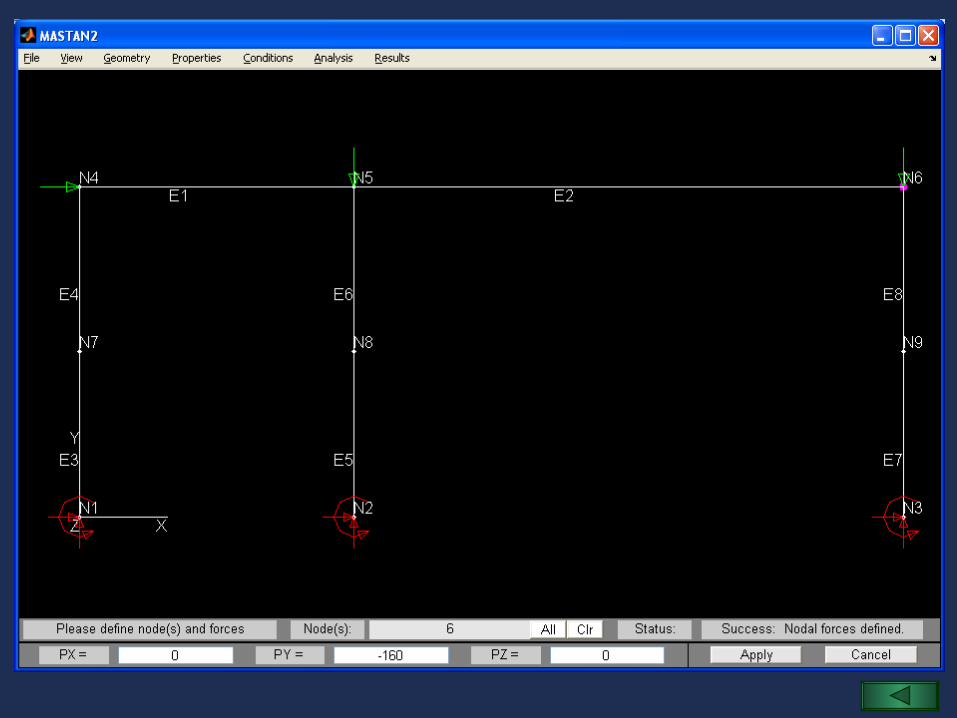
Loads and Support Cond. (cont.)Loads and Support Cond. (cont.)
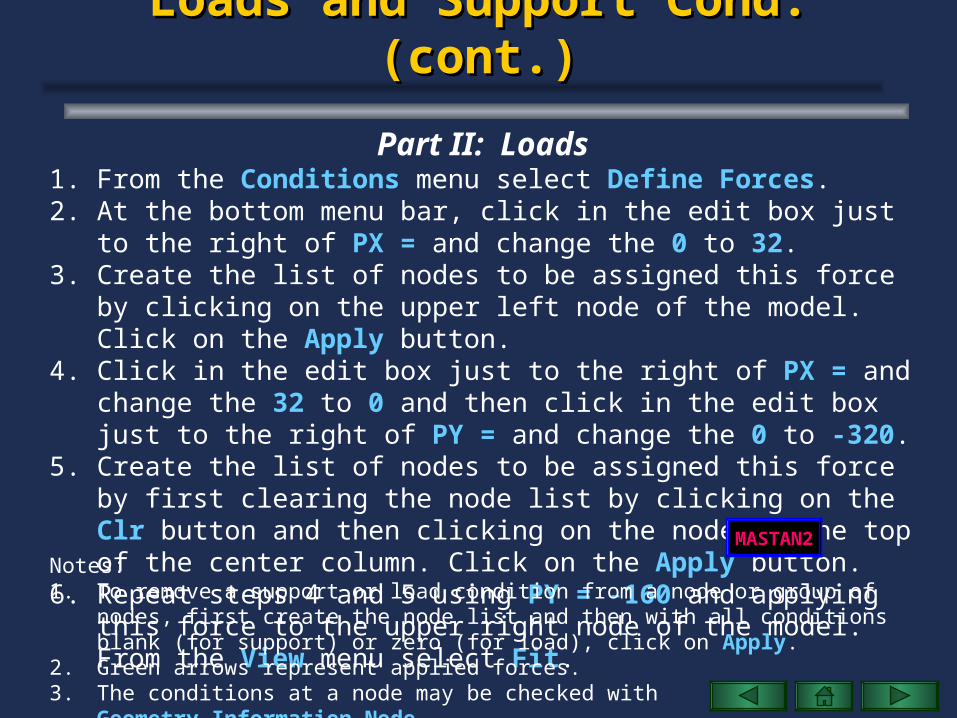
Part II: Loads1. From the Conditions menu select Define Forces.2. At the bottom menu bar, click in the edit box just to the right of PX = and
change the 0 to 32.3. Create the list of nodes to be assigned this force by clicking on the upper left
node of the model. Click on the Apply button. 4. Click in the edit box just to the right of PX = and change the 32 to 0 and
then click in the edit box just to the right of PY = and change the 0 to -320.5. Create the list of nodes to be assigned this force by first clearing the node
list by clicking on the Clr button and then clicking on the node at the top of the center column. Click on the Apply button.
6. Repeat steps 4 and 5 using PY = -160 and applying this force to the upper right node of the model. From the View menu select Fit.
Notes:1. To remove a support or load condition from a node or group of nodes, first create the node list
and then with all conditions blank (for support) or zero (for load), click on Apply.2. Green arrows represent applied forces.3. The conditions at a node may be checked with
Geometry-Information-Node.
MASTAN2
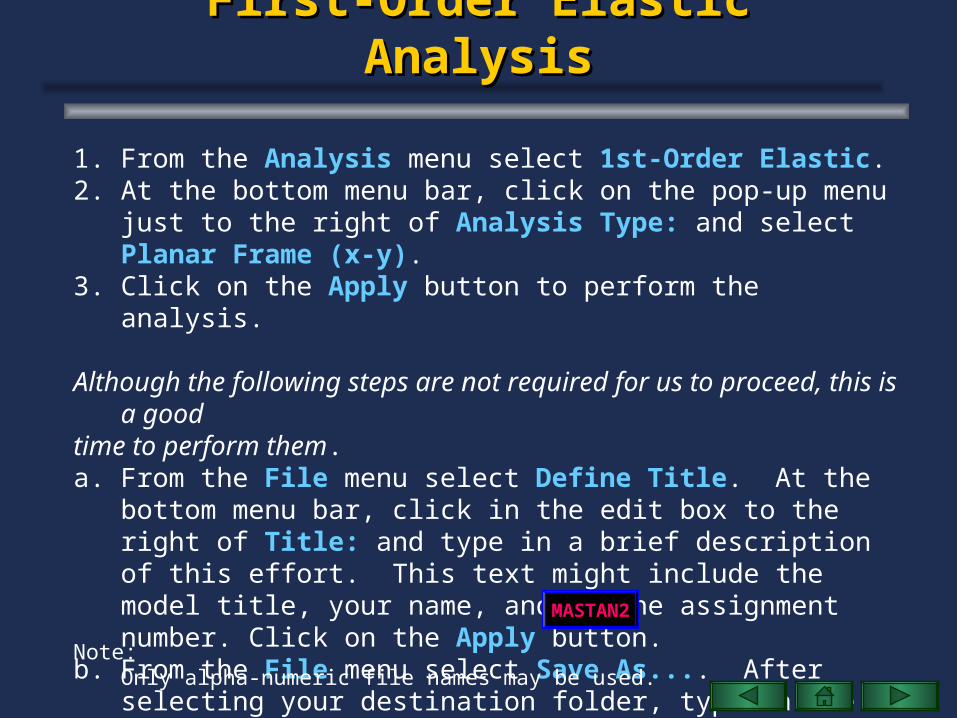
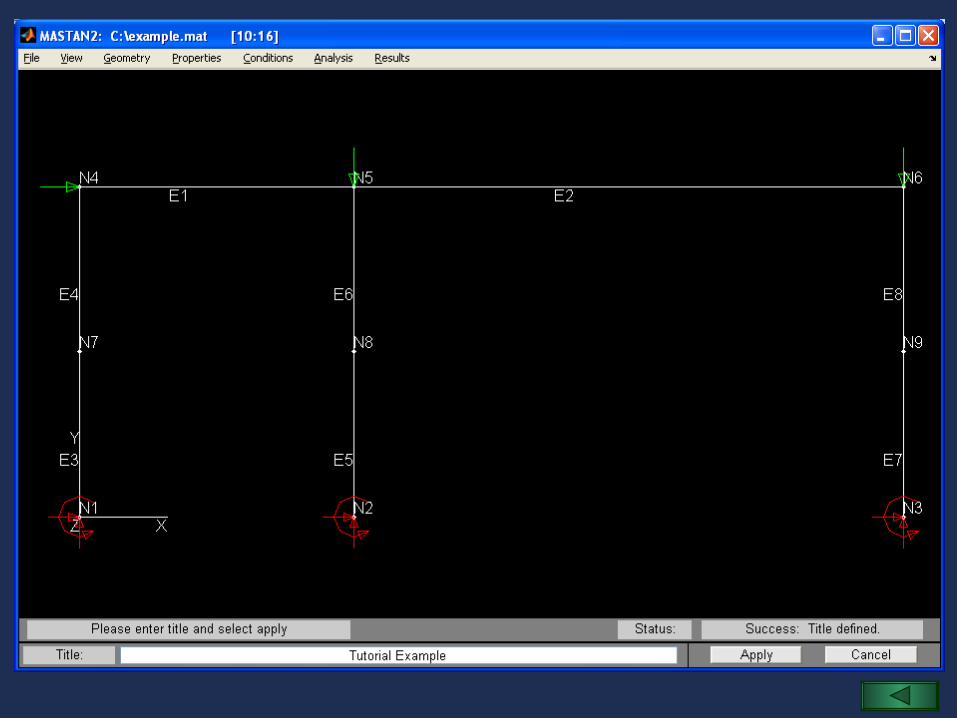
First-Order Elastic AnalysisFirst-Order Elastic Analysis
1. From the Analysis menu select 1st-Order Elastic.2. At the bottom menu bar, click on the pop-up menu just to the right of
Analysis Type: and select Planar Frame (x-y).3. Click on the Apply button to perform the analysis.
Although the following steps are not required for us to proceed, this is a goodtime to perform them.a. From the File menu select Define Title. At the bottom menu bar, click in
the edit box to the right of Title: and type in a brief description of this effort. This text might include the model title, your name, and/or the assignment number. Click on the Apply button.
b. From the File menu select Save As.... After selecting your destination folder, type in the filename example and click Save. Note that the top of the window has now changed to include the file name and directory as well as the time the file was last saved.
Note:Only alpha-numeric file names may be used.
MASTAN2
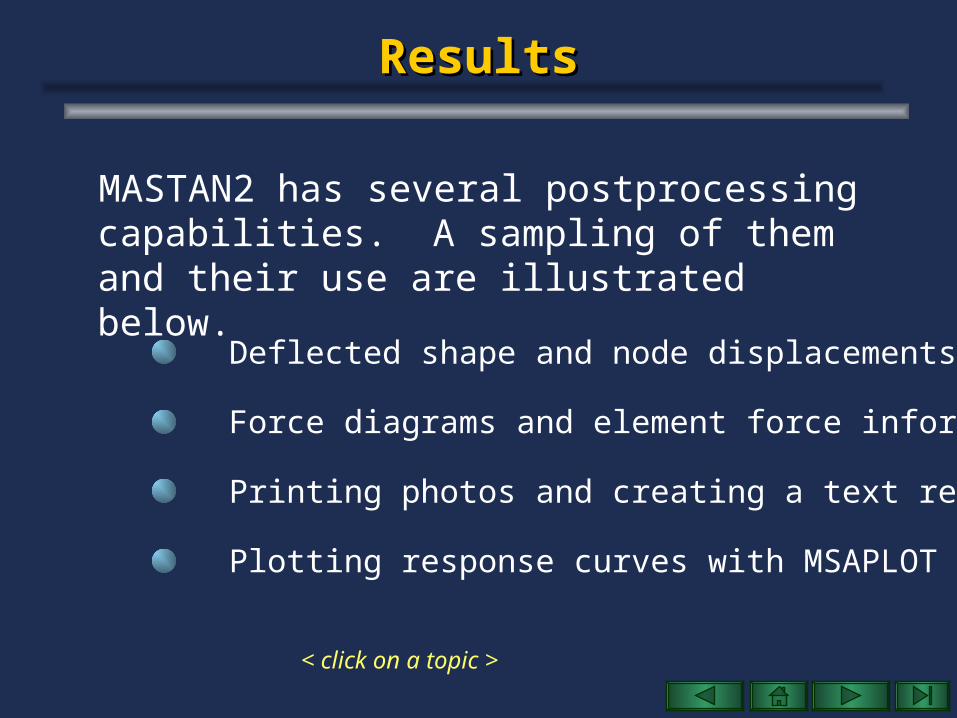
ResultsResults
Deflected shape and node displacements/reactions
Force diagrams and element force information
Printing photos and creating a text report
Plotting response curves with MSAPLOT
MASTAN2 has several postprocessing capabilities. A sampling of them and their use are illustrated below.
< click on a topic >
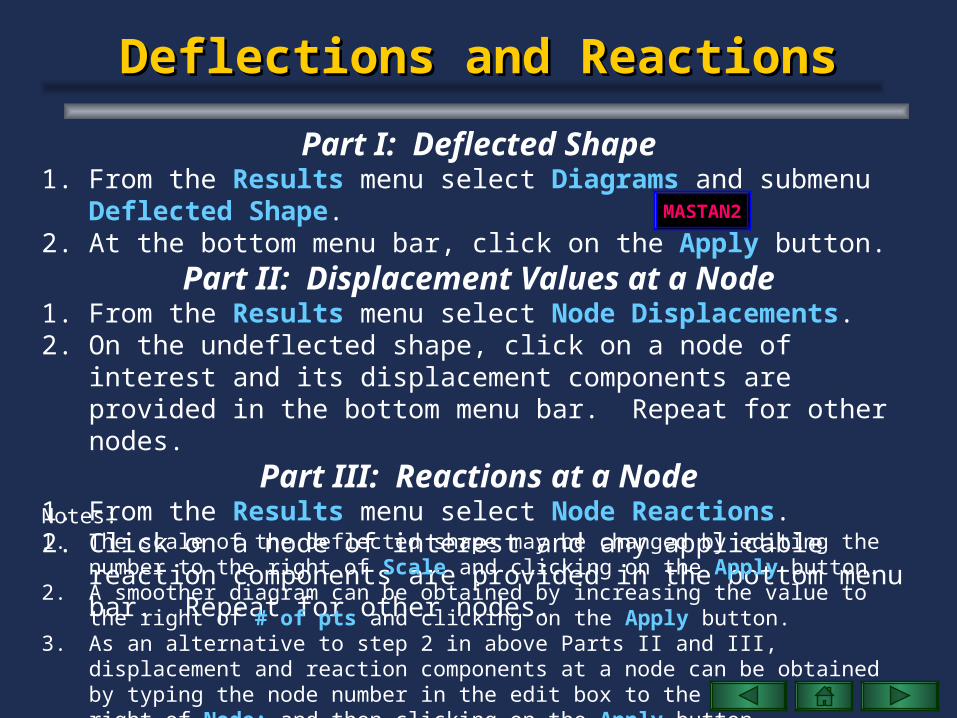
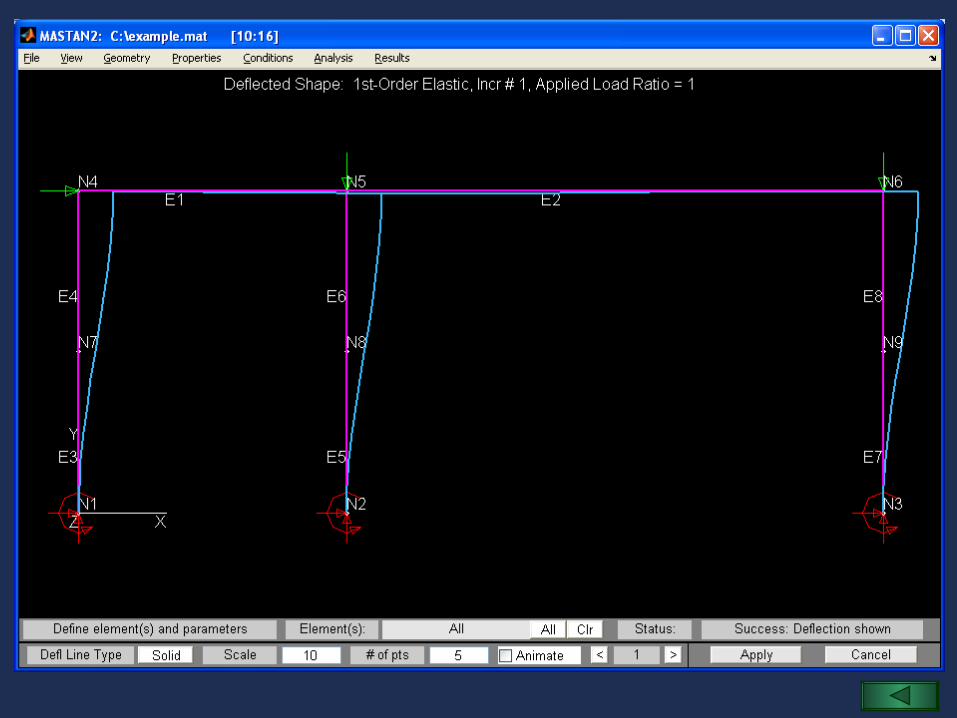
Deflections and ReactionsDeflections and Reactions
Part I: Deflected Shape1. From the Results menu select Diagrams and submenu Deflected Shape.2. At the bottom menu bar, click on the Apply button.
Part II: Displacement Values at a Node1. From the Results menu select Node Displacements.2. On the undeflected shape, click on a node of interest and its displacement
components are provided in the bottom menu bar. Repeat for other nodes.
Part III: Reactions at a Node1. From the Results menu select Node Reactions.2. Click on a node of interest and any applicable reaction components are
provided in the bottom menu bar. Repeat for other nodes.Notes:1. The scale of the deflected shape may be changed by editing the number to the right of Scale and
clicking on the Apply button.2. A smoother diagram can be obtained by increasing the value to the right of # of pts and clicking
on the Apply button.3. As an alternative to step 2 in above Parts II and III, displacement and reaction components at a
node can be obtained by typing the node number in the edit box to theright of Node: and then clicking on the Apply button.
MASTAN2
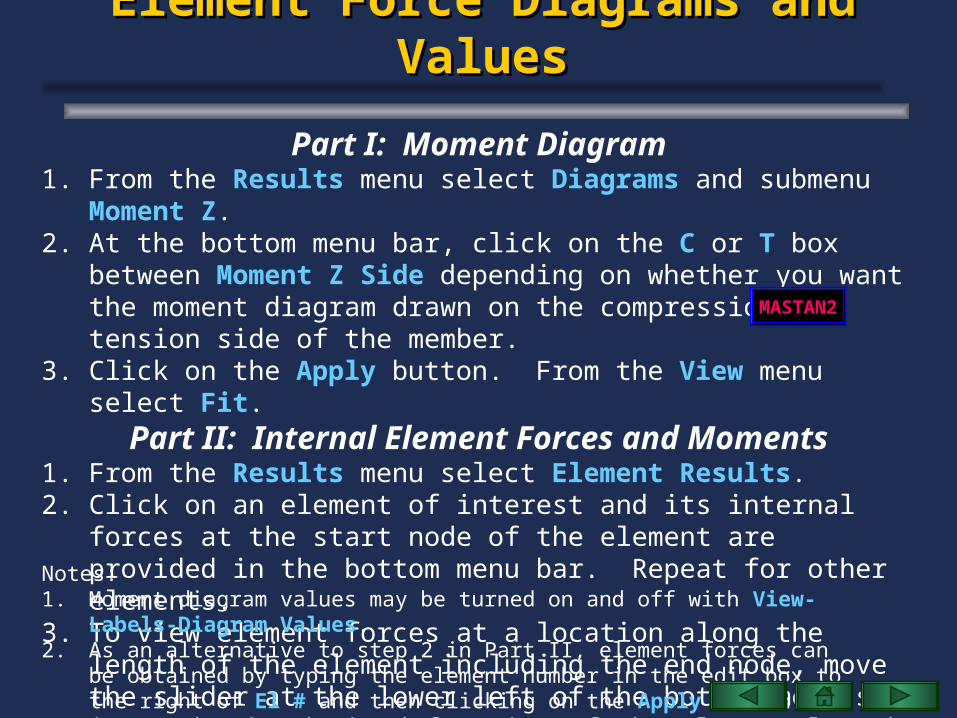
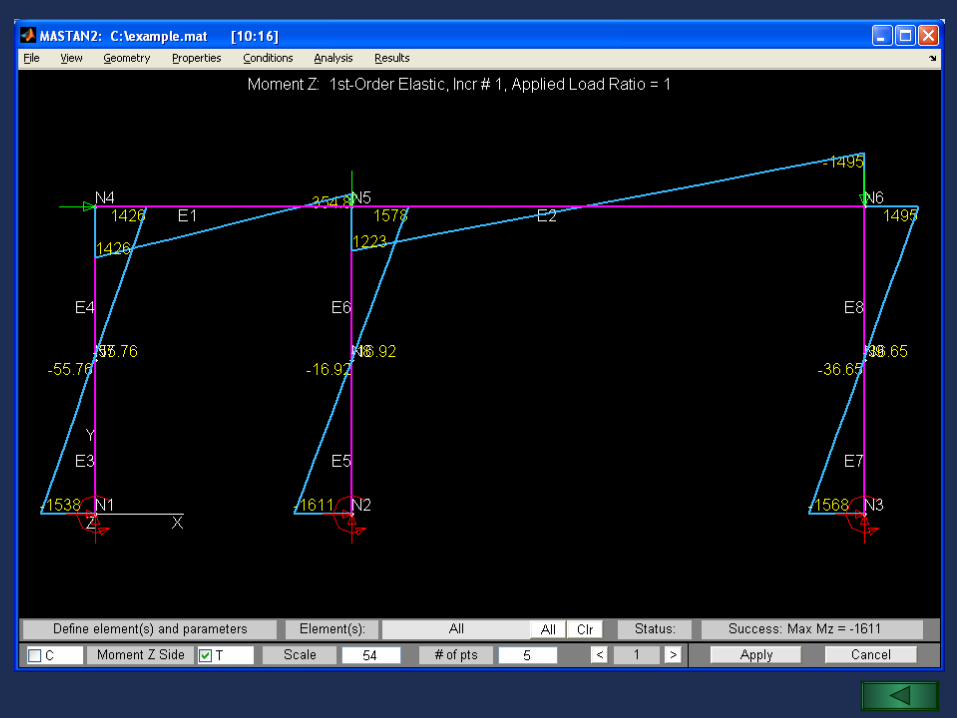
Element Force Diagrams and ValuesElement Force Diagrams and Values
Part I: Moment Diagram1. From the Results menu select Diagrams and submenu Moment Z.2. At the bottom menu bar, click on the C or T box between Moment Z Side
depending on whether you want the moment diagram drawn on the compression or tension side of the member.
3. Click on the Apply button. From the View menu select Fit.
Part II: Internal Element Forces and Moments1. From the Results menu select Element Results.2. Click on an element of interest and its internal forces at the start node of the
element are provided in the bottom menu bar. Repeat for other elements.3. To view element forces at a location along the length of the element
including the end node, move the slider at the lower left of the bottom menu so it reads the desired fraction of the element length and click Apply.
Notes:1. Moment diagram values may be turned on and off with View-Labels-Diagram Values.2. As an alternative to step 2 in Part II, element forces can be obtained by typing the
element number in the edit box to the right of El # and then clicking on the Apply button.
MASTAN2
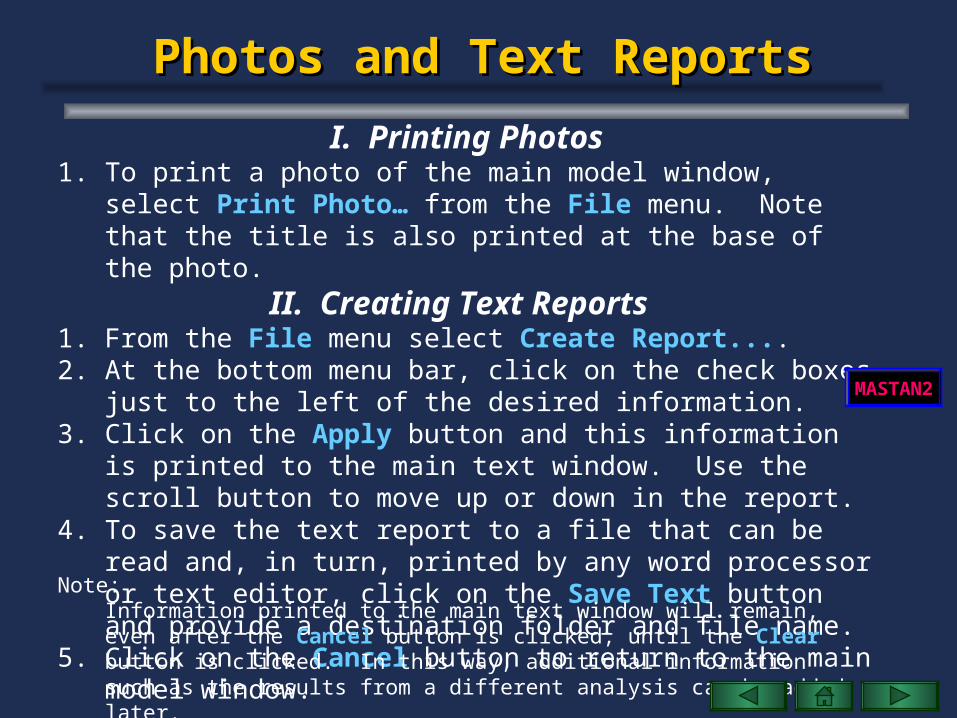
Photos and Text ReportsPhotos and Text Reports
I. Printing Photos1. To print a photo of the main model window, select Print Photo… from
the File menu. Note that the title is also printed at the base of the photo.
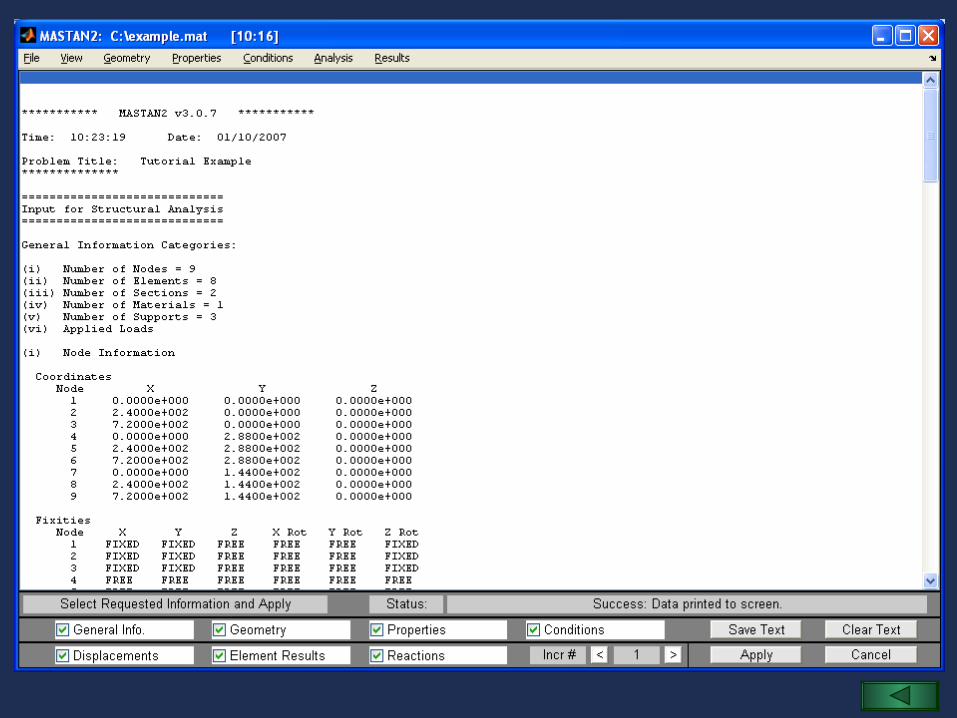
II. Creating Text Reports 1. From the File menu select Create Report....2. At the bottom menu bar, click on the check boxes just to the left of the
desired information.3. Click on the Apply button and this information is printed to the main
text window. Use the scroll button to move up or down in the report.4. To save the text report to a file that can be read and, in turn, printed by
any word processor or text editor, click on the Save Text button and provide a destination folder and file name.
5. Click on the Cancel button to return to the main model window.Note:
Information printed to the main text window will remain, even after the Cancel button is clicked, until the Clear button is clicked. In this way, additional information such as the results from a different analysis can be added later.
MASTAN2
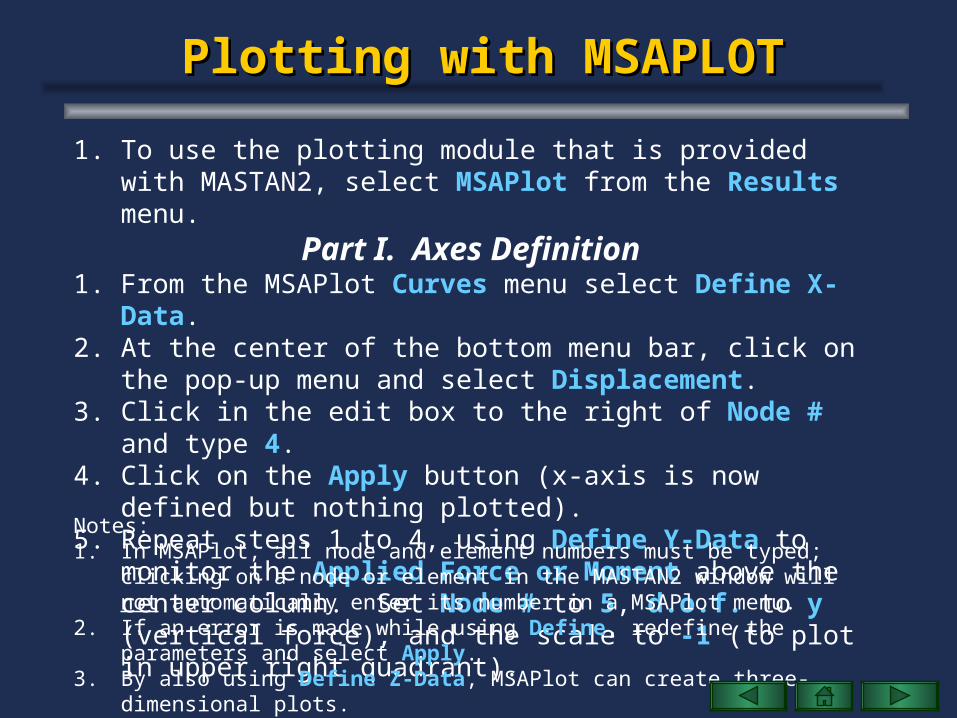
Plotting with MSAPLOTPlotting with MSAPLOT
1. To use the plotting module that is provided with MASTAN2, select MSAPlot from the Results menu.
Part I. Axes Definition 1. From the MSAPlot Curves menu select Define X-Data.2. At the center of the bottom menu bar, click on the pop-up menu and
select Displacement.3. Click in the edit box to the right of Node # and type 4.4. Click on the Apply button (x-axis is now defined but nothing plotted).5. Repeat steps 1 to 4, using Define Y-Data to monitor the Applied
Force or Moment above the center column. Set Node # to 5, d.o.f. to y (vertical force), and the scale to -1 (to plot in upper right quadrant).
Notes:1. In MSAPlot, all node and element numbers must be typed; clicking on a node or
element in the MASTAN2 window will not automatically enter its number in a MSAPlot menu.
2. If an error is made while using Define, redefine the parameters and select Apply.3. By also using Define Z-Data, MSAPlot can create three-dimensional plots.
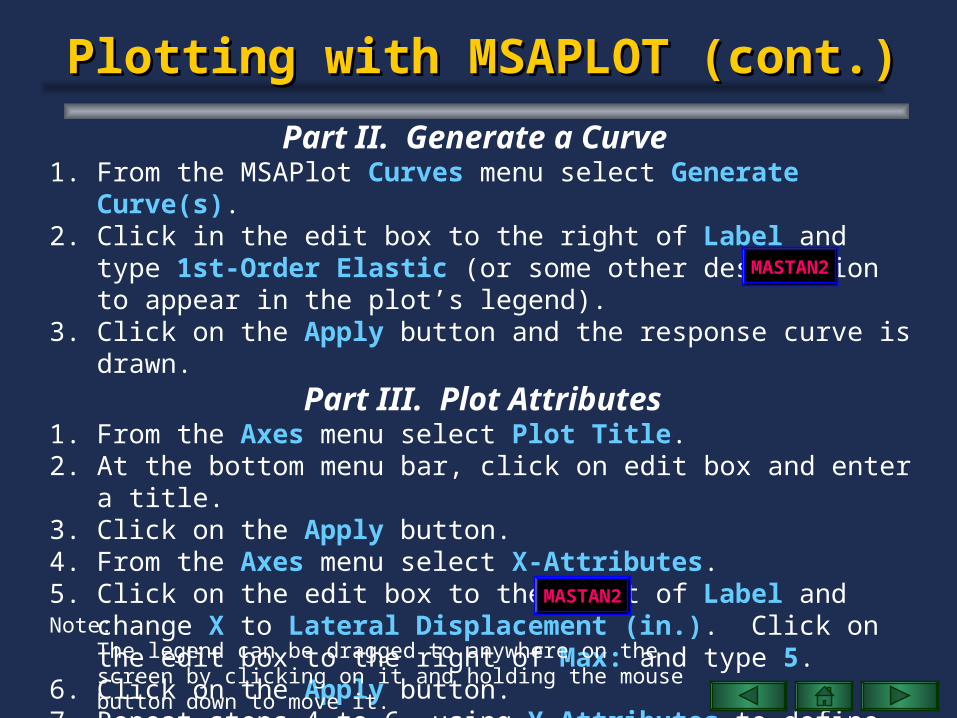
Plotting with MSAPLOT (cont.)Plotting with MSAPLOT (cont.)
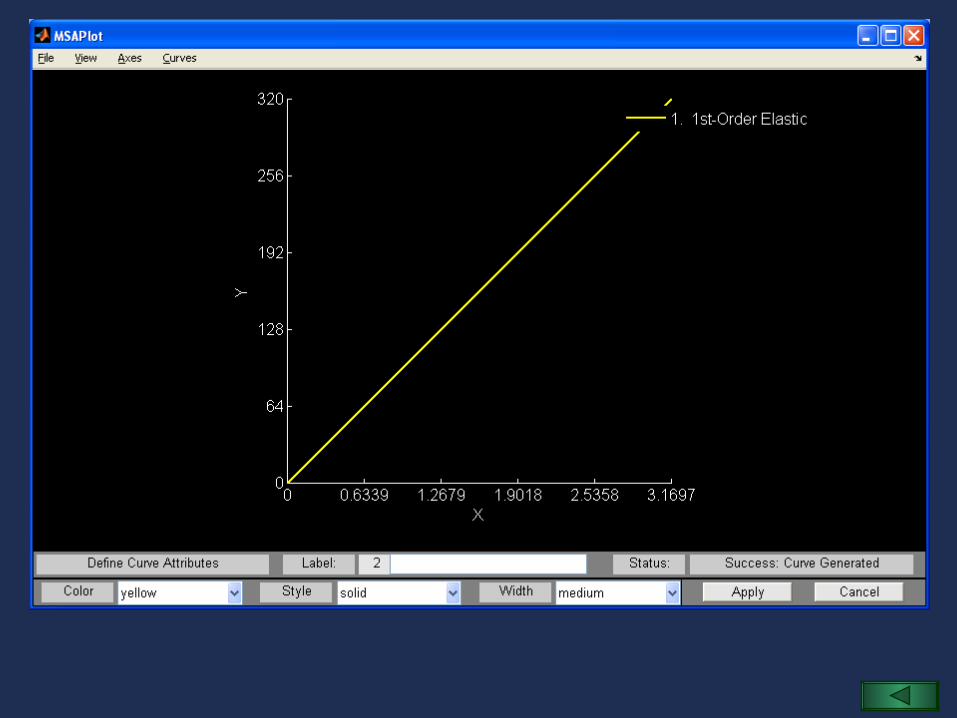
Part II. Generate a Curve 1. From the MSAPlot Curves menu select Generate Curve(s).2. Click in the edit box to the right of Label and type 1st-Order Elastic (or
some other description to appear in the plot’s legend).3. Click on the Apply button and the response curve is drawn.
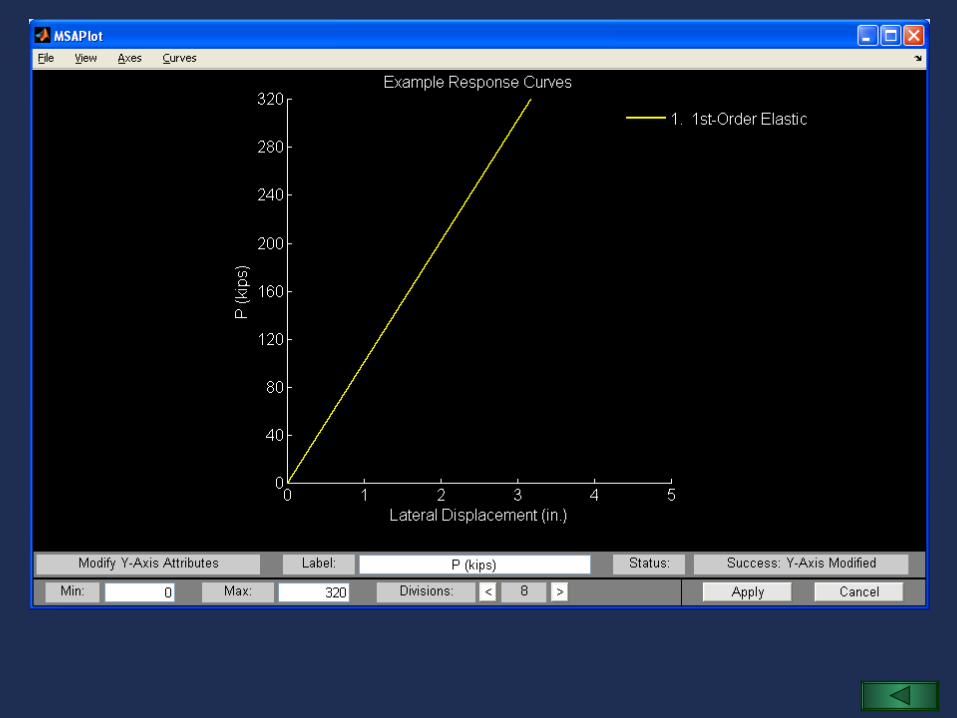
Part III. Plot Attributes1. From the Axes menu select Plot Title.2. At the bottom menu bar, click on edit box and enter a title.3. Click on the Apply button.4. From the Axes menu select X-Attributes.5. Click on the edit box to the right of Label and change X to Lateral
Displacement (in.). Click on the edit box to the right of Max: and type 5.6. Click on the Apply button.7. Repeat steps 4 to 6, using Y-Attributes to define the y-label as P (kips) and
increasing the number of Divisions to 8.Note:
The legend can be dragged to anywhere on the screen by clicking on it and holding the mouse button down to move it.
MASTAN2
MASTAN2
Other Methods of AnalysisOther Methods of Analysis
MASTAN2 provides seven different methods of analysis. These will beillustrated by using the current example problem and plotted results.
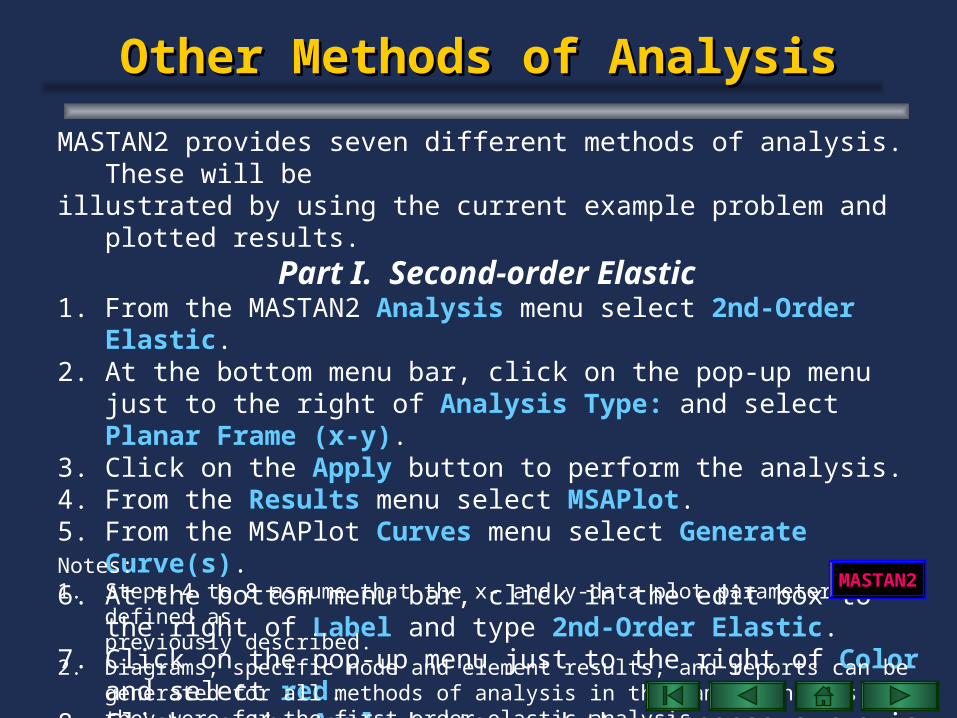
Part I. Second-order Elastic 1. From the MASTAN2 Analysis menu select 2nd-Order Elastic.2. At the bottom menu bar, click on the pop-up menu just to the right of
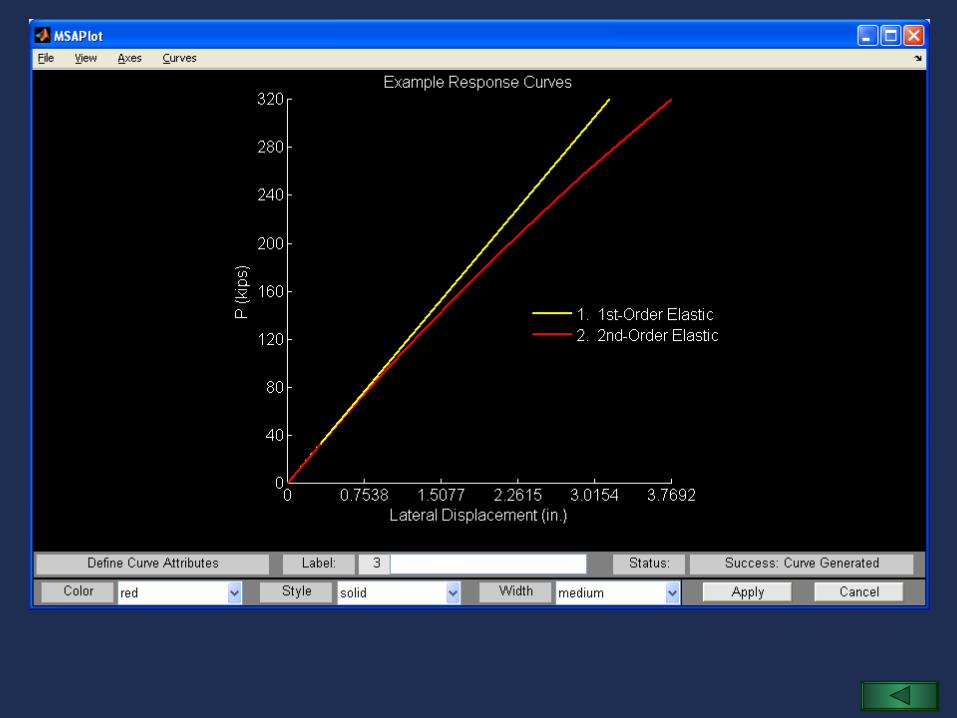
Analysis Type: and select Planar Frame (x-y).3. Click on the Apply button to perform the analysis.4. From the Results menu select MSAPlot.5. From the MSAPlot Curves menu select Generate Curve(s).6. At the bottom menu bar, click in the edit box to the right of Label and type
2nd-Order Elastic.7. Click on the pop-up menu just to the right of Color and select red.8. Click on the Apply button and the response curve is added to the plot.Notes:1. Steps 4 to 8 assume that the x- and y-data plot parameters were defined as
previously described.2. Diagrams, specific node and element results, and reports can be
generated for all methods of analysis in the same manner asthey were for the first-order elastic analysis.
MASTAN2
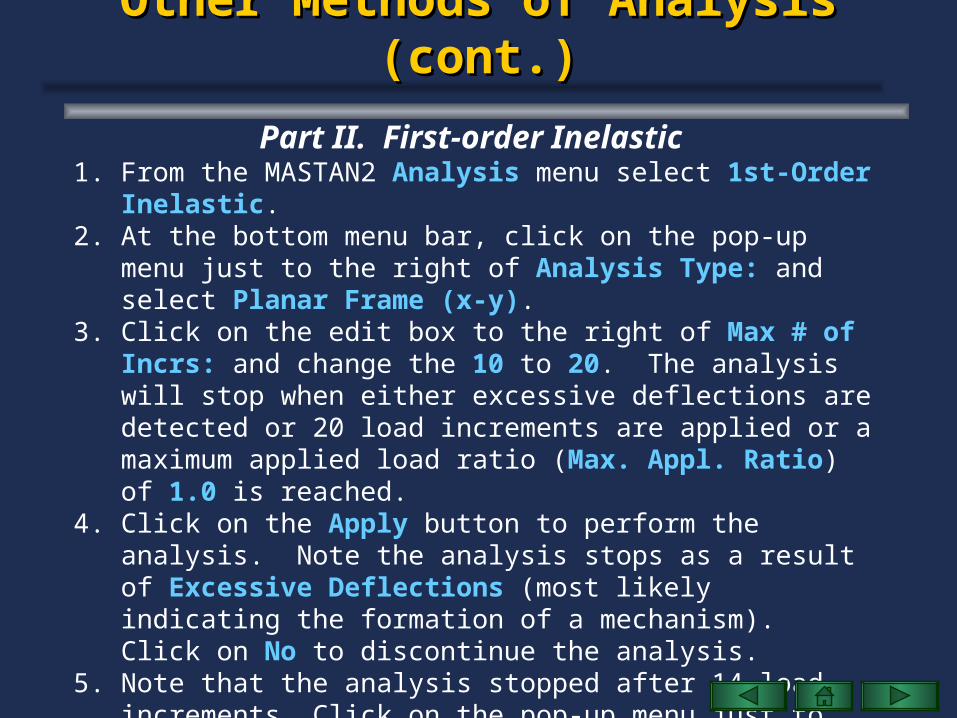
Other Methods of Analysis (cont.)Other Methods of Analysis (cont.)
Part II. First-order Inelastic 1. From the MASTAN2 Analysis menu select 1st-Order Inelastic.2. At the bottom menu bar, click on the pop-up menu just to the right of
Analysis Type: and select Planar Frame (x-y).3. Click on the edit box to the right of Max # of Incrs: and change the 10
to 20. The analysis will stop when either excessive deflections are detected or 20 load increments are applied or a maximum applied load ratio (Max. Appl. Ratio) of 1.0 is reached.
4. Click on the Apply button to perform the analysis. Note the analysis stops as a result of Excessive Deflections (most likely indicating the formation of a mechanism). Click on No to discontinue the analysis.
5. Note that the analysis stopped after 14 load increments. Click on the pop-up menu just to the left of Apply and select Continue Prev.
6. Click on the edit box to the right of Max # of Incrs: and change 20 to 15. This will let the analysis run for one additional increment.
< move to next slide for additional instructions >
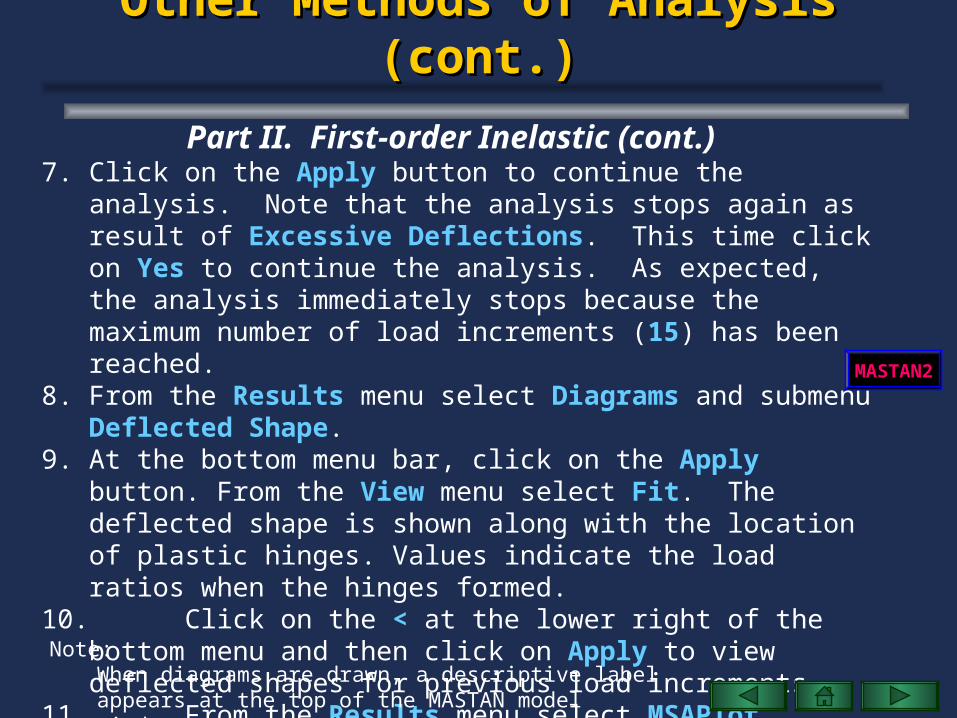
Other Methods of Analysis (cont.)Other Methods of Analysis (cont.)
Part II. First-order Inelastic (cont.) 7. Click on the Apply button to continue the analysis. Note that the
analysis stops again as result of Excessive Deflections. This time click on Yes to continue the analysis. As expected, the analysis immediately stops because the maximum number of load increments (15) has been reached.
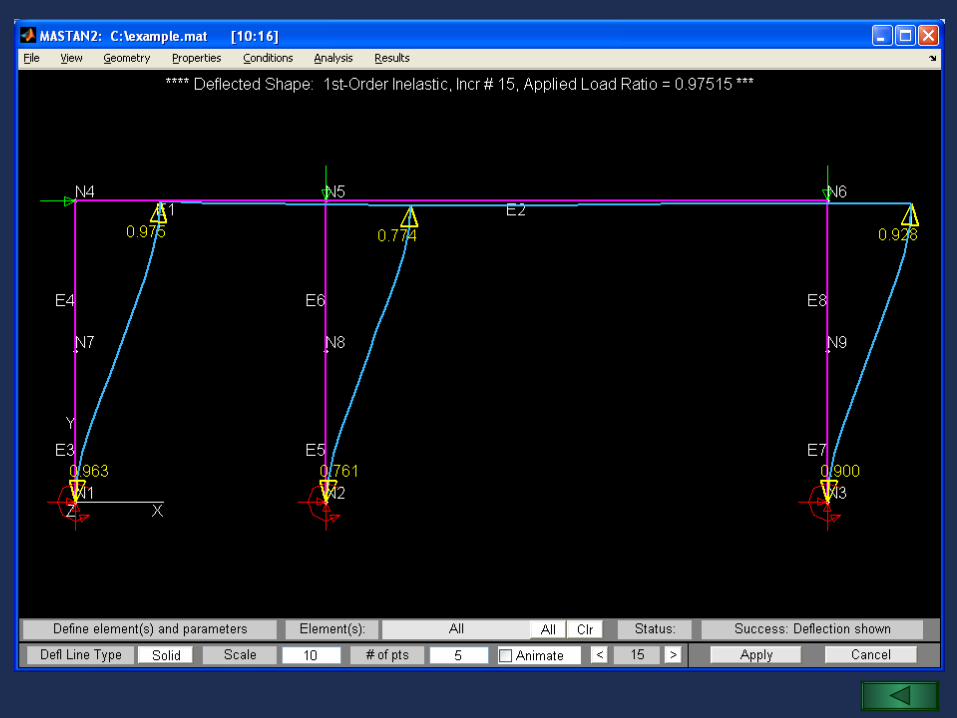
8. From the Results menu select Diagrams and submenu Deflected Shape.9. At the bottom menu bar, click on the Apply button. From the View menu
select Fit. The deflected shape is shown along with the location of plastic hinges. Values indicate the load ratios when the hinges formed.
10. Click on the < at the lower right of the bottom menu and then click on Apply to view deflected shapes for previous load increments.
11. From the Results menu select MSAPlot.12. At the bottom menu bar, click in the edit box to the right of Label and
type 1st-Order Inelastic.13. Change the Color to blue and click on the Apply button. The response
curve for this analysis is added to the plot.
MASTAN2
Note:When diagrams are drawn, a descriptive label appears at the top of the MASTAN model window.
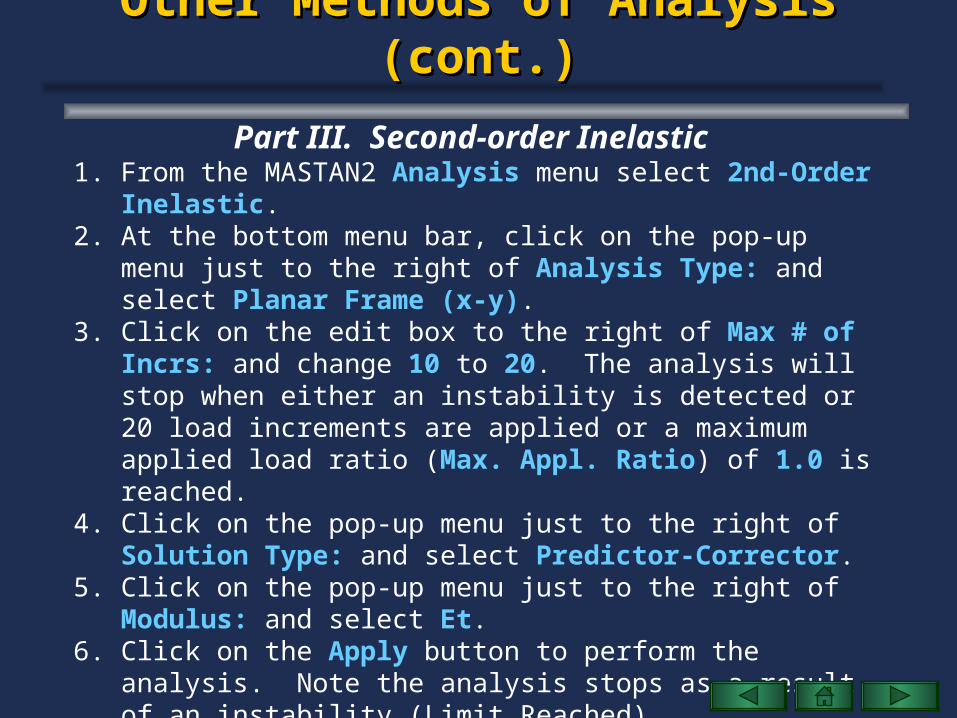
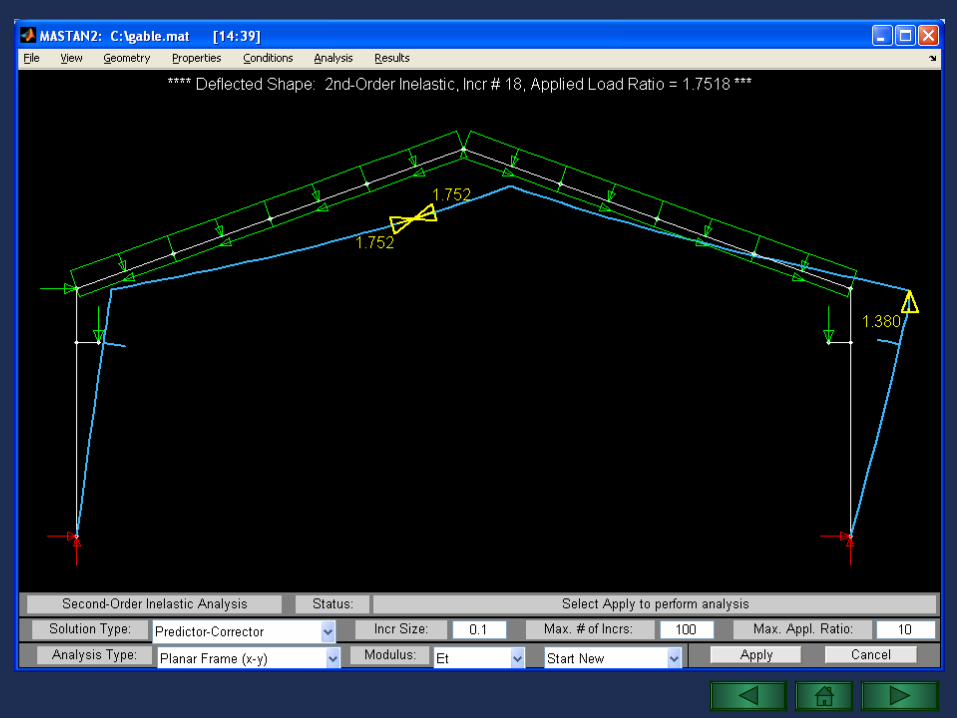
Other Methods of Analysis (cont.)Other Methods of Analysis (cont.)
Part III. Second-order Inelastic 1. From the MASTAN2 Analysis menu select 2nd-Order Inelastic.2. At the bottom menu bar, click on the pop-up menu just to the right of
Analysis Type: and select Planar Frame (x-y).3. Click on the edit box to the right of Max # of Incrs: and change 10 to
20. The analysis will stop when either an instability is detected or 20 load increments are applied or a maximum applied load ratio (Max. Appl. Ratio) of 1.0 is reached.
4. Click on the pop-up menu just to the right of Solution Type: and select Predictor-Corrector.
5. Click on the pop-up menu just to the right of Modulus: and select Et. 6. Click on the Apply button to perform the analysis. Note the analysis
stops as a result of an instability (Limit Reached).7. Click on the pop-up menu just to the right of Apply and select
Continue Prev.
< move to next slide for additional instructions >
Other Methods of Analysis (cont.)Other Methods of Analysis (cont.)
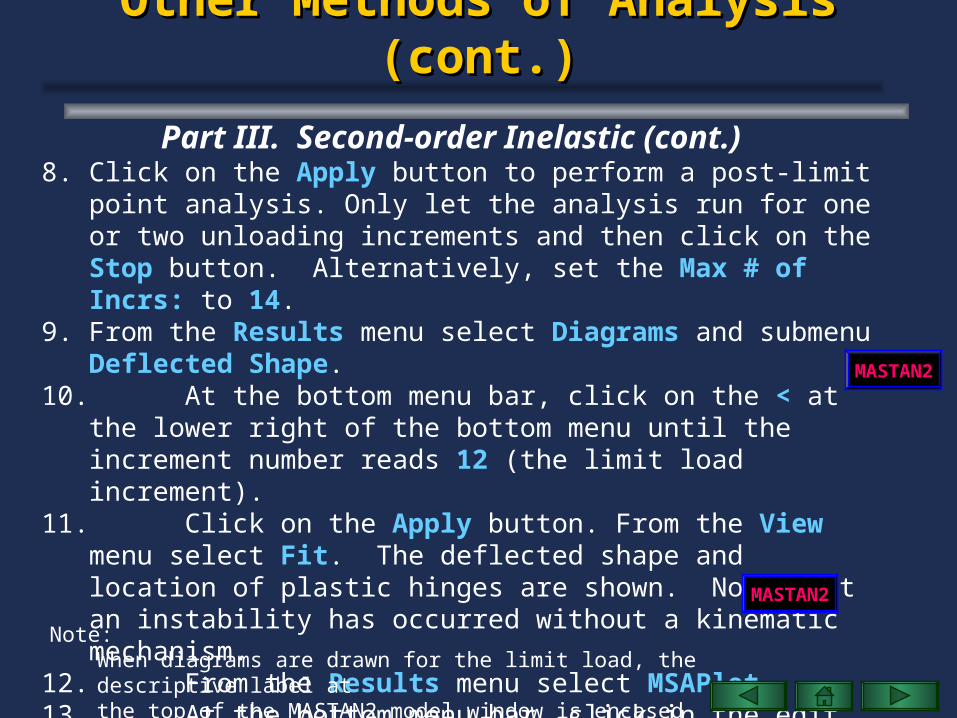
Part III. Second-order Inelastic (cont.) 8. Click on the Apply button to perform a post-limit point analysis. Only let
the analysis run for one or two unloading increments and then click on the Stop button. Alternatively, set the Max # of Incrs: to 14.
9. From the Results menu select Diagrams and submenu Deflected Shape.10. At the bottom menu bar, click on the < at the lower right of the bottom
menu until the increment number reads 12 (the limit load increment).11. Click on the Apply button. From the View menu select Fit. The
deflected shape and location of plastic hinges are shown. Note that an instability has occurred without a kinematic mechanism.
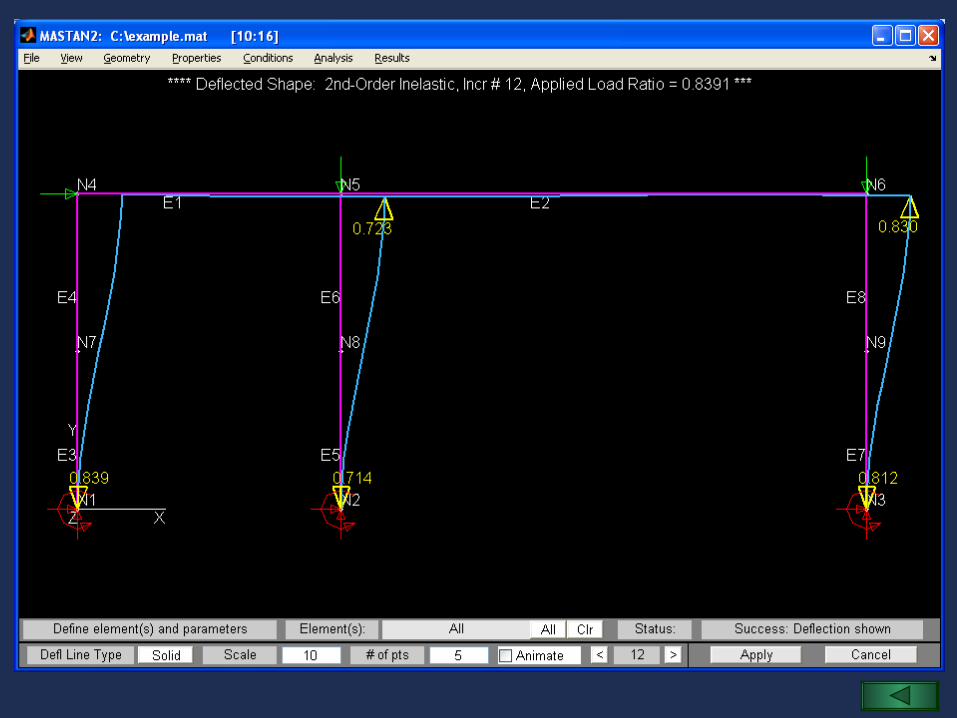
12. From the Results menu select MSAPlot.13. At the bottom menu bar, click in the edit box to the right of Label and
type 2nd-Order Inelastic.14. Change the Color to green and click on the Apply button. The response
curve for all four methods of analysis are shown in the plot.
MASTAN2
Note:When diagrams are drawn for the limit load, the descriptive label atthe top of the MASTAN2 model window is encased in *** ’s.
MASTAN2
Other Methods of Analysis (cont.)Other Methods of Analysis (cont.)
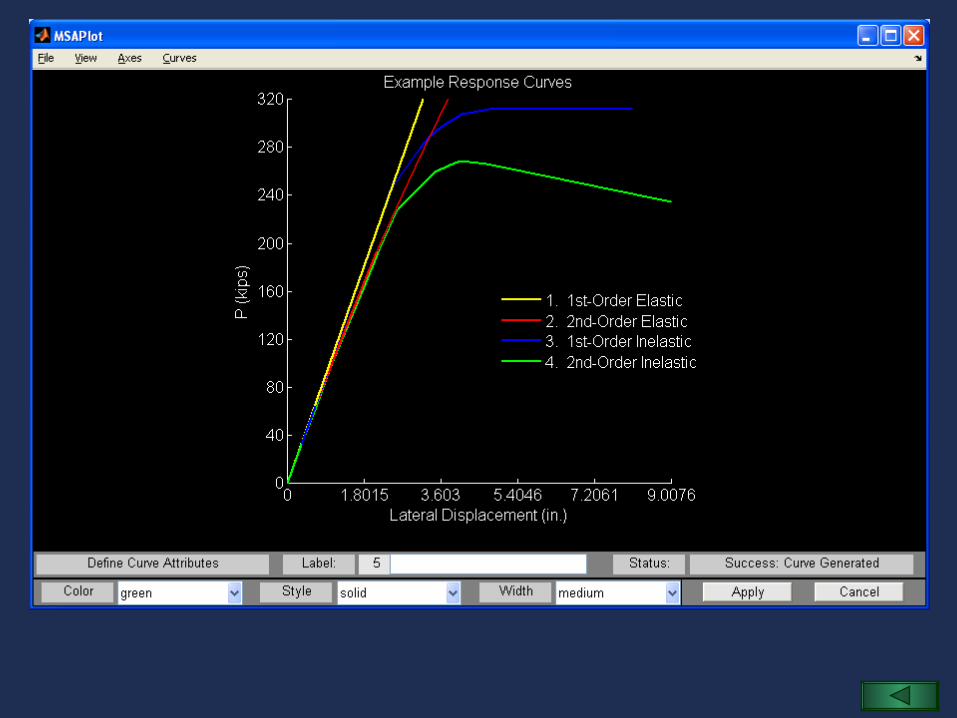
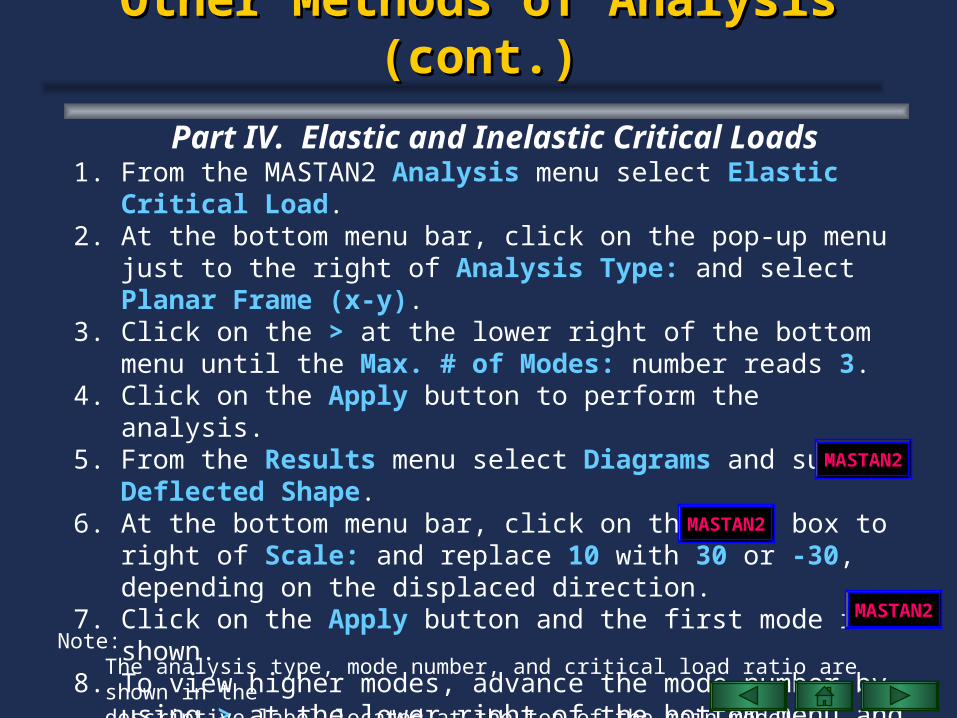
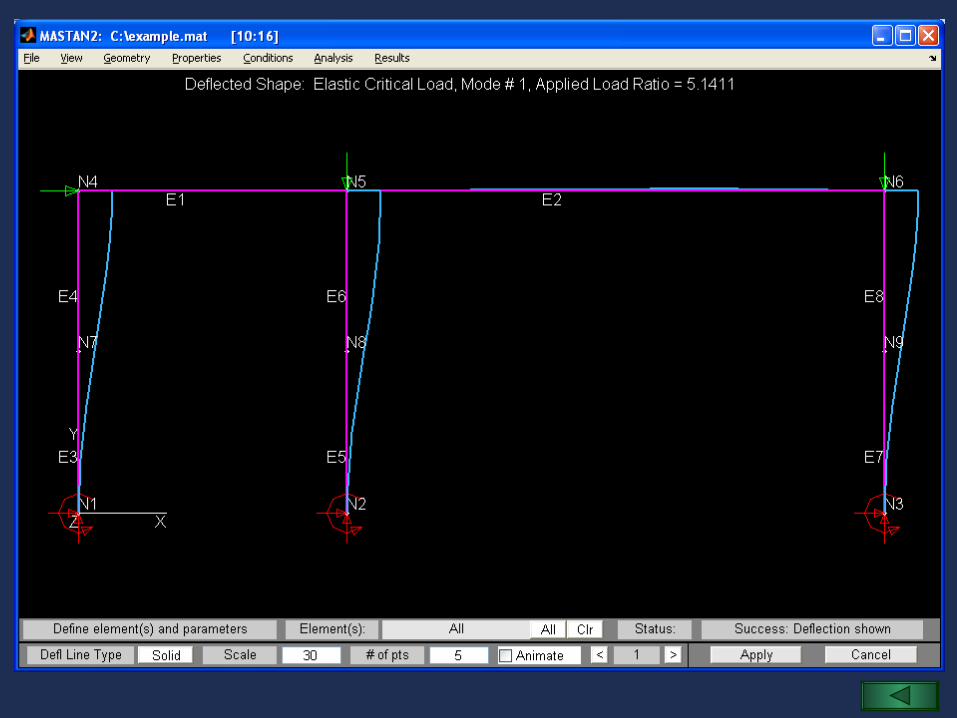
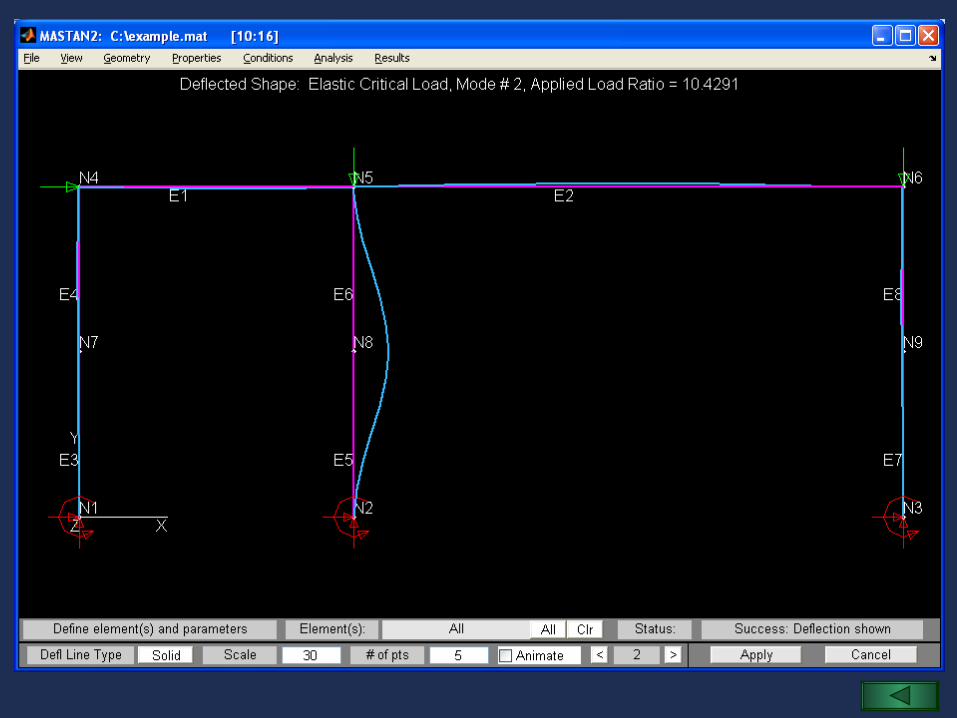
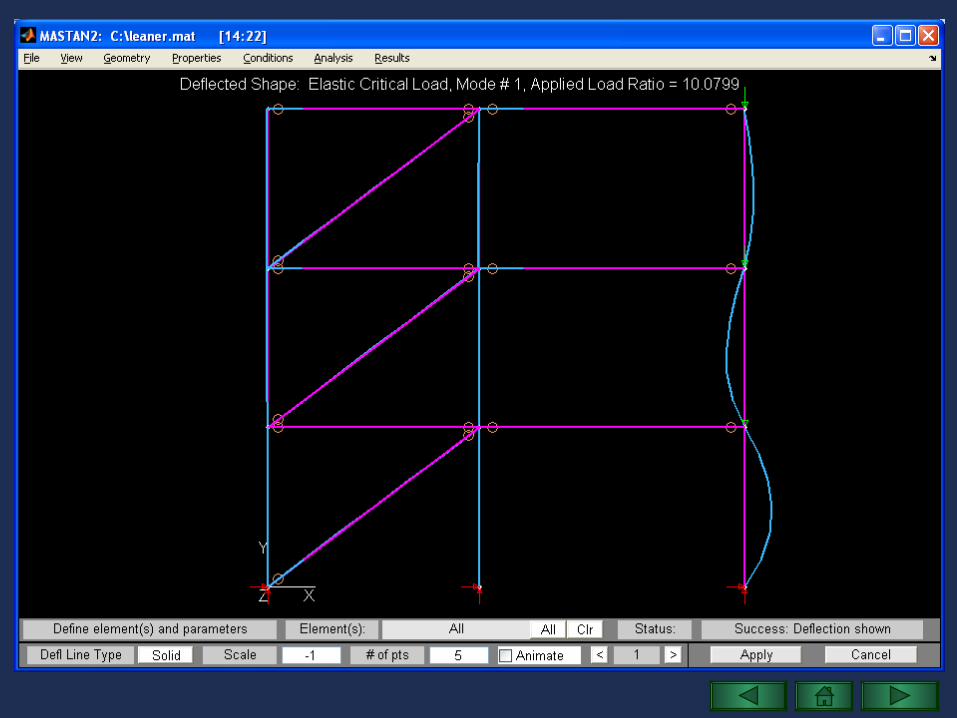
Part IV. Elastic and Inelastic Critical Loads1. From the MASTAN2 Analysis menu select Elastic Critical Load.2. At the bottom menu bar, click on the pop-up menu just to the right of
Analysis Type: and select Planar Frame (x-y).3. Click on the > at the lower right of the bottom menu until the Max. # of
Modes: number reads 3. 4. Click on the Apply button to perform the analysis.5. From the Results menu select Diagrams and submenu Deflected Shape.6. At the bottom menu bar, click on the edit box to right of Scale: and
replace 10 with 30 or -30, depending on the displaced direction.7. Click on the Apply button and the first mode is shown.8. To view higher modes, advance the mode number by using > at the lower
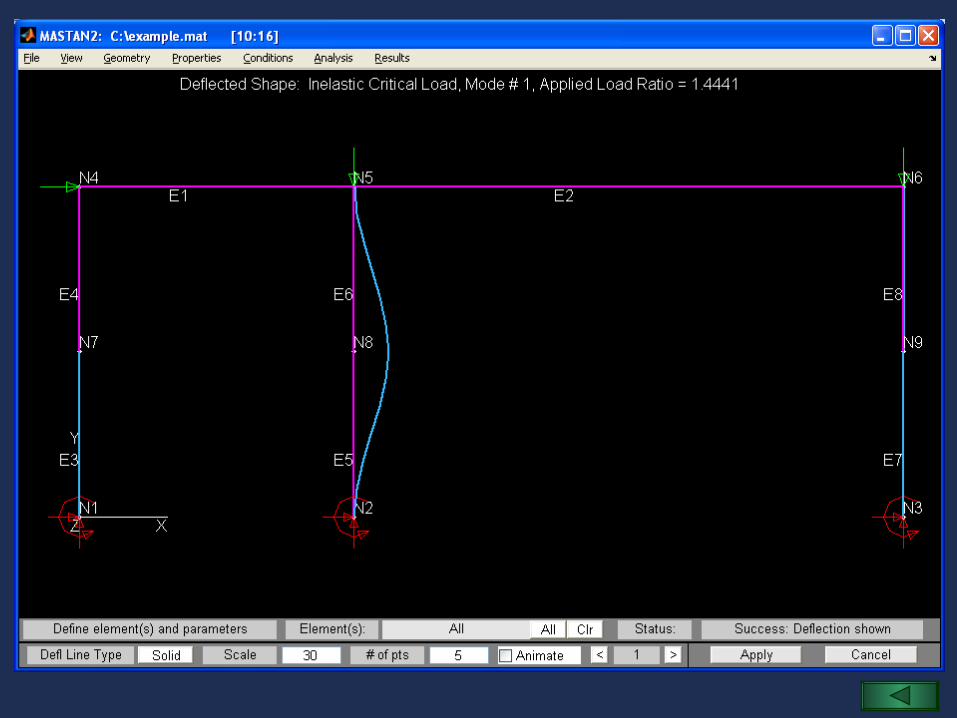
right of the bottom menu and then click on Apply.9. From the Analysis menu select Inelastic Critical Load and repeat steps
2, 4, 5, and 7. Note that only one inelastic mode can be calculated.
Note:The analysis type, mode number, and critical load ratio are shown in thedescriptive label located at the top of the main model window.
MASTAN2
MASTAN2
MASTAN2
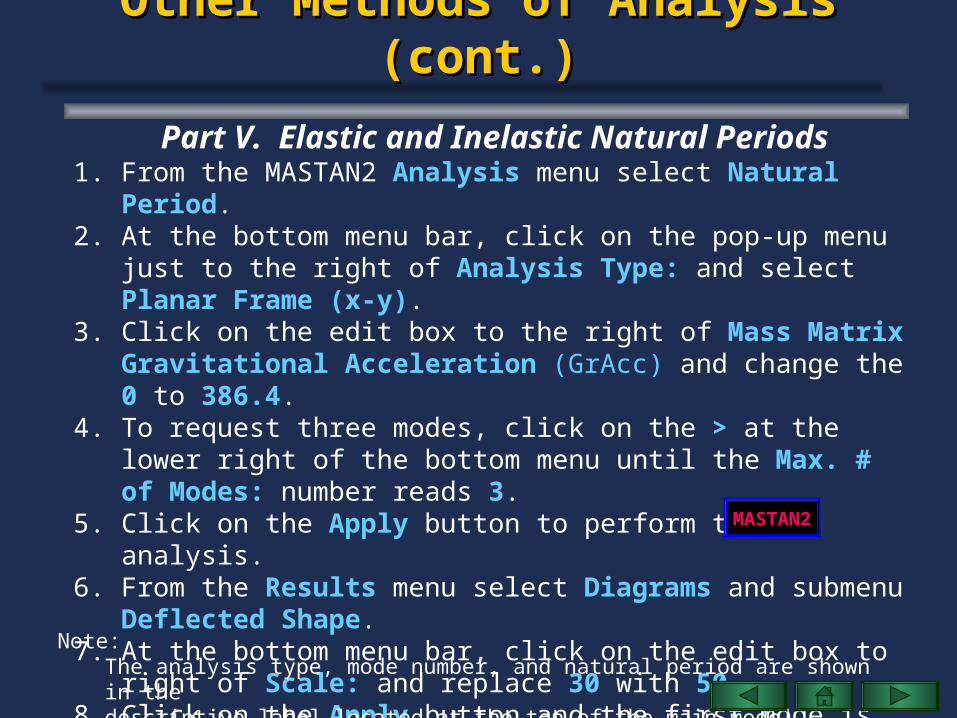
Other Methods of Analysis (cont.)Other Methods of Analysis (cont.)
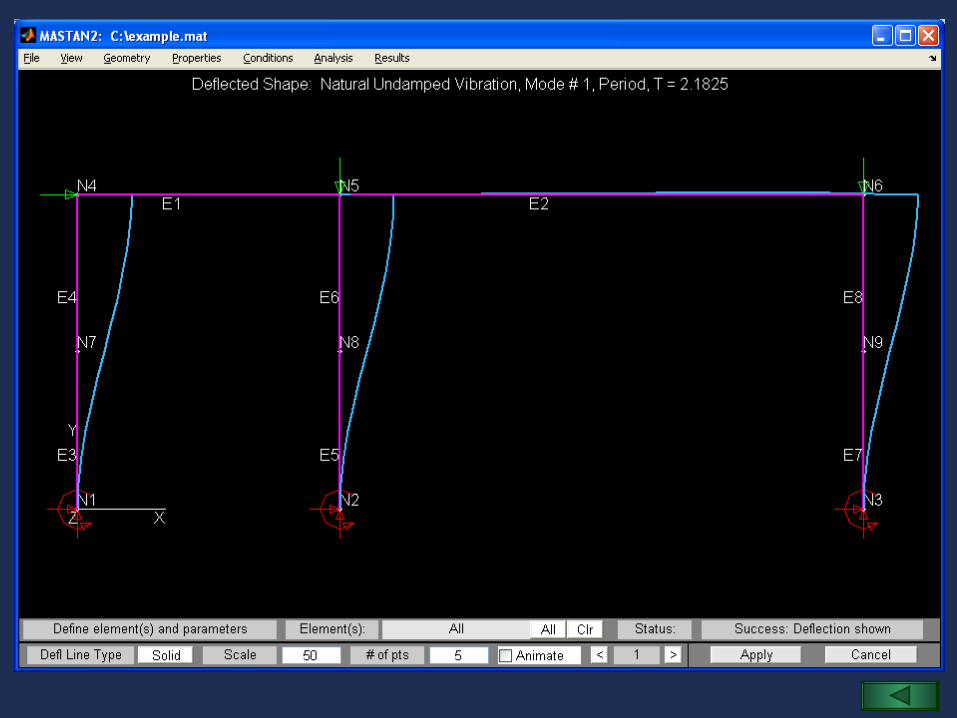
Part V. Elastic and Inelastic Natural Periods1. From the MASTAN2 Analysis menu select Natural Period.2. At the bottom menu bar, click on the pop-up menu just to the right of
Analysis Type: and select Planar Frame (x-y).3. Click on the edit box to the right of Mass Matrix Gravitational
Acceleration (GrAcc) and change the 0 to 386.4.4. To request three modes, click on the > at the lower right of the bottom
menu until the Max. # of Modes: number reads 3. 5. Click on the Apply button to perform the analysis.6. From the Results menu select Diagrams and submenu Deflected Shape.7. At the bottom menu bar, click on the edit box to right of Scale: and
replace 30 with 50.8. Click on the Apply button and the first mode is shown.9. To view animations and/or higher modes, check the Animate box, and as
desired, advance the mode number by using > at the lower right of the bottom menu, and then click on Apply.
Note:The analysis type, mode number, and natural period are shown in thedescriptive label located at the top of the main model window.
MASTAN2
Other Methods of Analysis (cont.)Other Methods of Analysis (cont.)
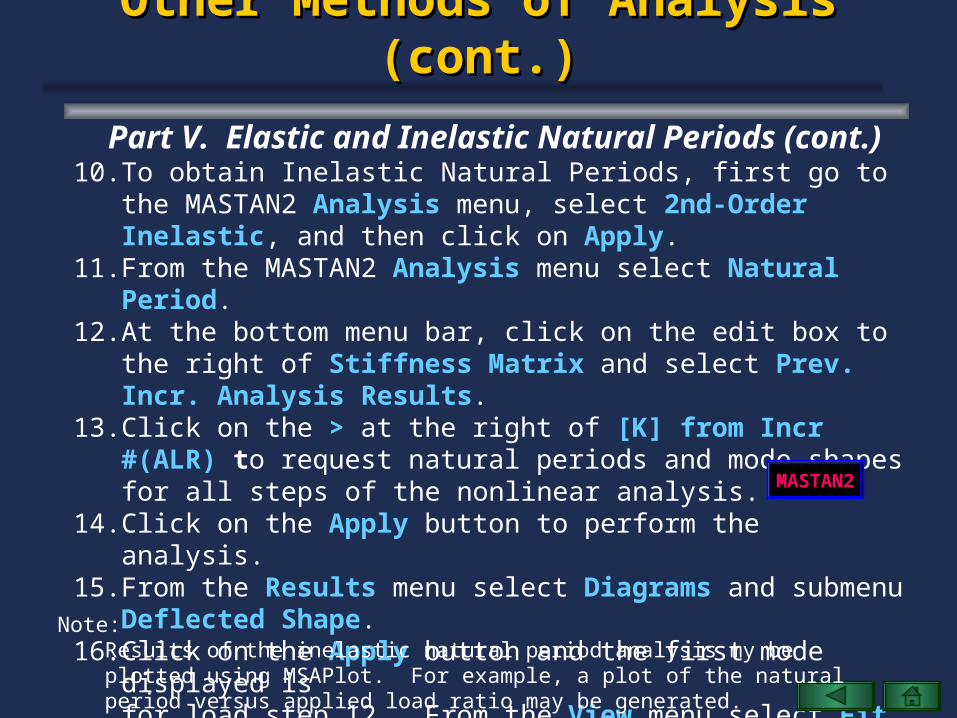
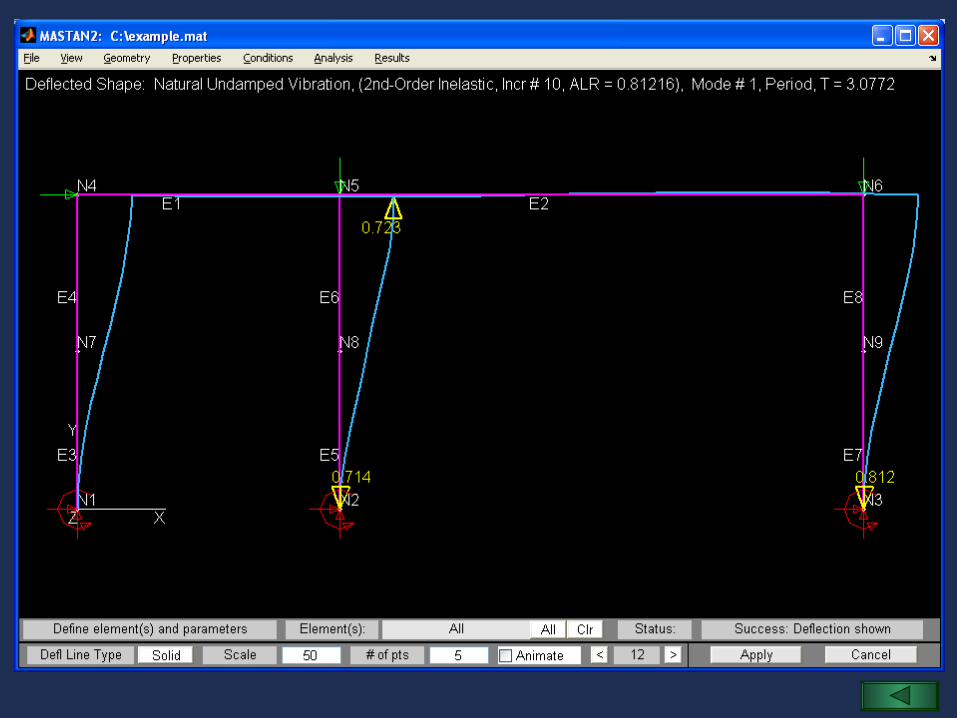
Part V. Elastic and Inelastic Natural Periods (cont.)10. To obtain Inelastic Natural Periods, first go to the MASTAN2 Analysis
menu, select 2nd-Order Inelastic, and then click on Apply.11. From the MASTAN2 Analysis menu select Natural Period.12. At the bottom menu bar, click on the edit box to the right of Stiffness
Matrix and select Prev. Incr. Analysis Results.13. Click on the > at the right of [K] from Incr #(ALR) to request natural
periods and mode shapes for all steps of the nonlinear analysis.14. Click on the Apply button to perform the analysis.15. From the Results menu select Diagrams and submenu Deflected Shape.16. Click on the Apply button and the first mode displayed is
for load step 12. From the View menu select Fit. 17. To view animations and/or different load steps, check the Animate box,
and as desired advance the step number by using < or > at the lower right of the bottom menu, and then click on Apply.
MASTAN2
Note:Results of the inelastic natural period analysis my be plotted using MSAPlot. For example, a plot of the natural period versus applied load ratio may be generated.
Samples of MASTAN2 ModelsSamples of MASTAN2 Models
Two-dimensional gable frame
Two-dimensional braced frame with leaning columns
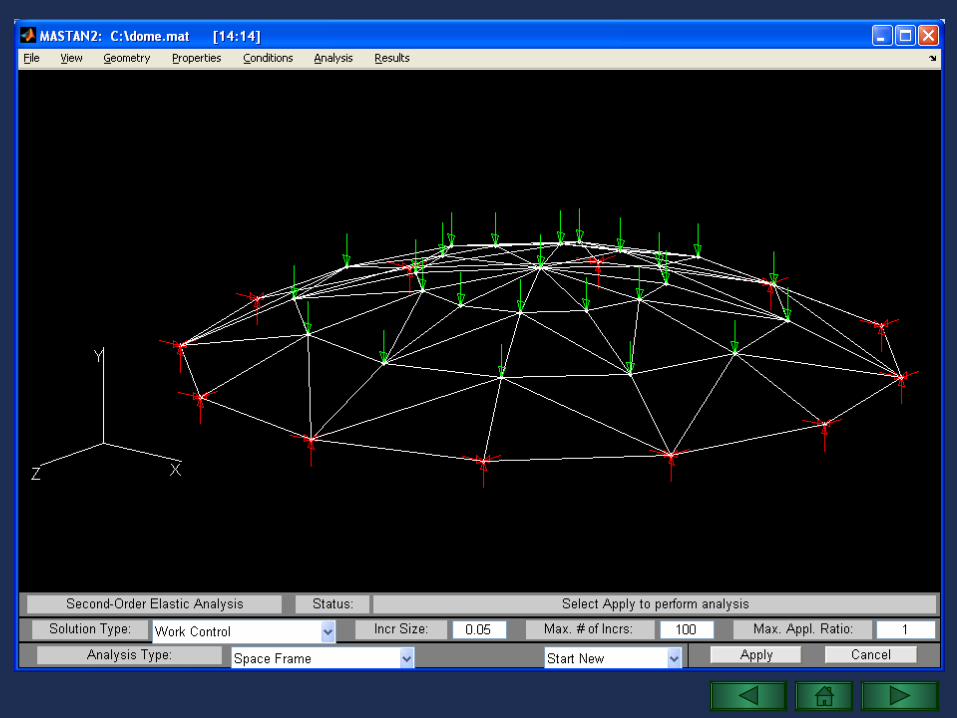
Three-dimensional dome structure
MASTAN2 can be used to model various two- and three-dimensional frames and trusses. Samples of these are provided below.
< click on a description >
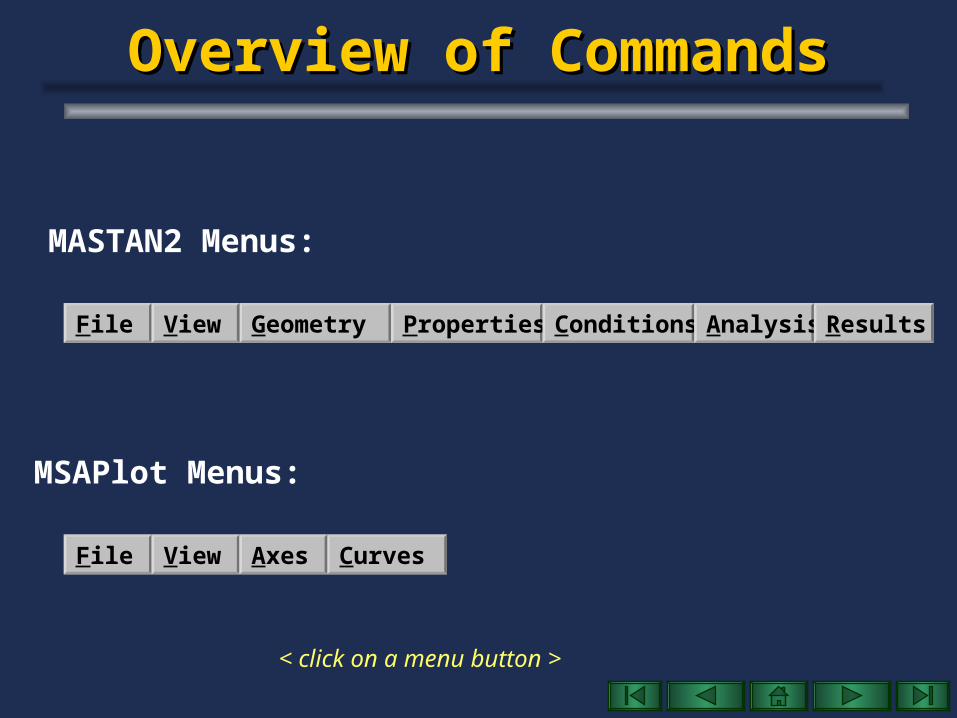
Overview of CommandsOverview of Commands
File GeometryView Properties Conditions Analysis Results
MASTAN2 Menus:
File View
MSAPlot Menus:
CurvesAxes
< click on a menu button >
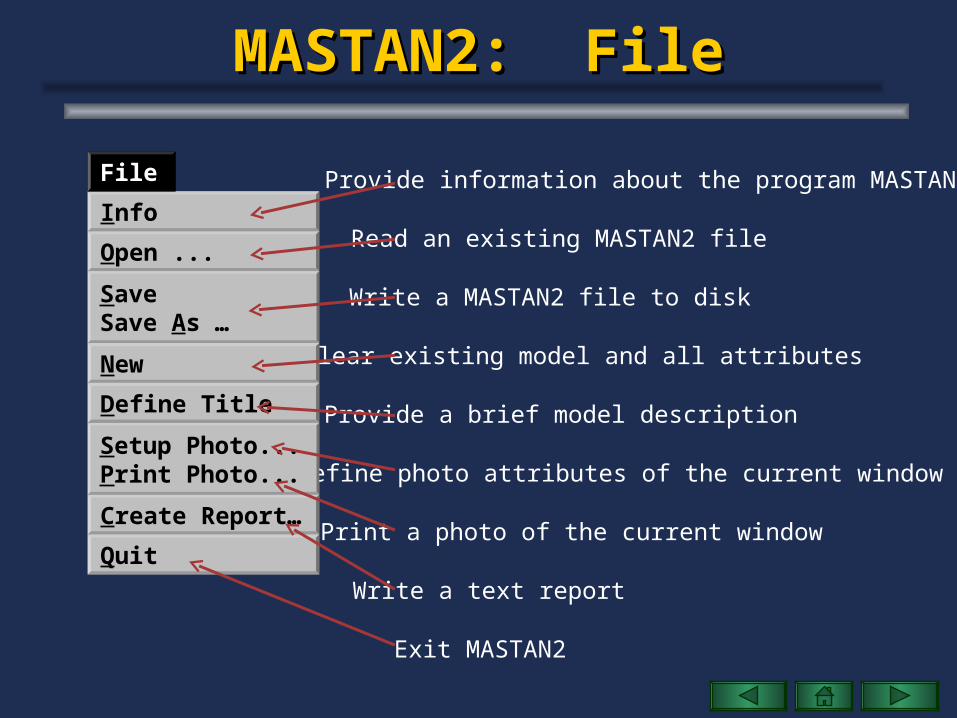
MASTAN2: FileMASTAN2: File
Read an existing MASTAN2 file
Provide information about the program MASTAN2
Write a MASTAN2 file to disk
Clear existing model and all attributes
Provide a brief model description
Exit MASTAN2
Define photo attributes of the current window
Write a text report
Create Report…
New
Open ...
Setup Photo...Print Photo...
Info
SaveSave As …
Define Title
File
QuitPrint a photo of the current window
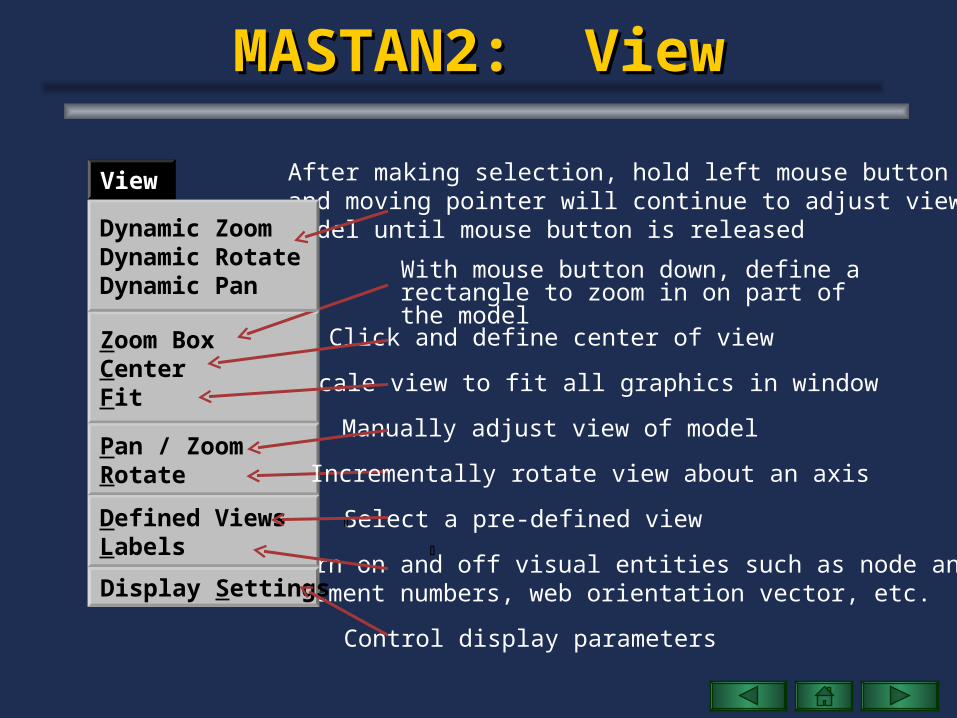
MASTAN2: ViewMASTAN2: View
After making selection, hold left mouse button downand moving pointer will continue to adjust view ofmodel until mouse button is released
With mouse button down, define a rectangle to zoom in on part of the model
Click and define center of view
Scale view to fit all graphics in window
Control display parameters
Turn on and off visual entities such as node andelement numbers, web orientation vector, etc.
Select a pre-defined view
Zoom BoxCenterFit
Display Settings
Pan / ZoomRotate
Defined Views Labels
View
Dynamic ZoomDynamic RotateDynamic Pan
Incrementally rotate view about an axis
Manually adjust view of model
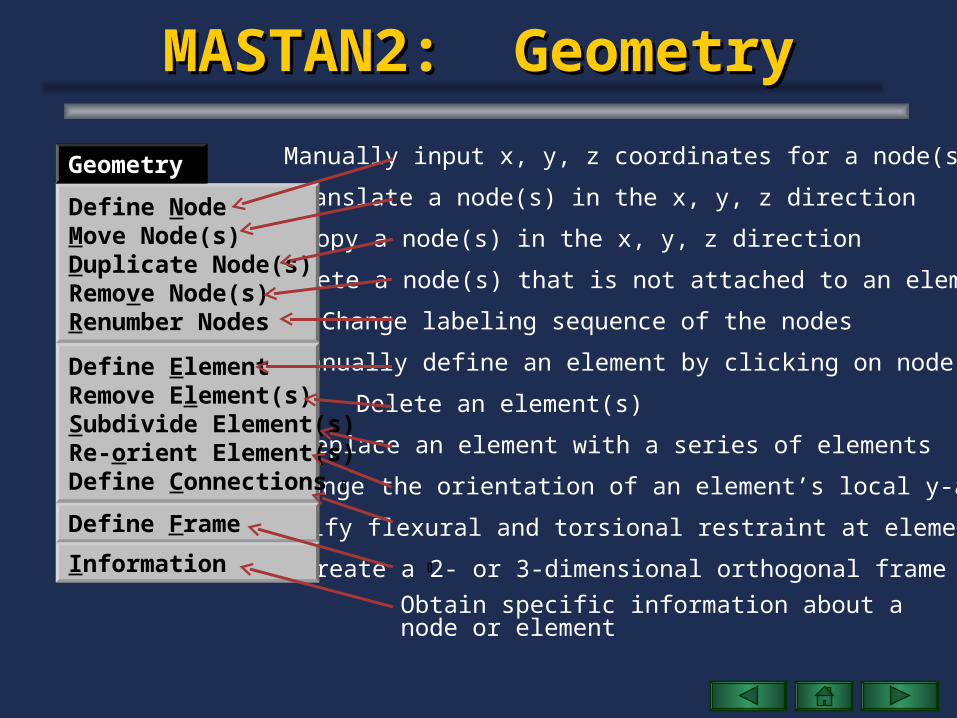
MASTAN2: GeometryMASTAN2: Geometry
Delete a node(s) that is not attached to an element
Manually input x, y, z coordinates for a node(s)
Obtain specific information about a node or element
Manually define an element by clicking on node(s)
Delete an element(s)
Modify flexural and torsional restraint at element ends
Change the orientation of an element’s local y-axis
Replace an element with a series of elements
Translate a node(s) in the x, y, z direction
Copy a node(s) in the x, y, z direction
Change labeling sequence of the nodes
Create a 2- or 3-dimensional orthogonal frame
Define NodeMove Node(s)Duplicate Node(s)Remove Node(s)Renumber Nodes
Define Frame
Define ElementRemove Element(s)Subdivide Element(s)Re-orient Element(s)Define Connections
Information
Geometry
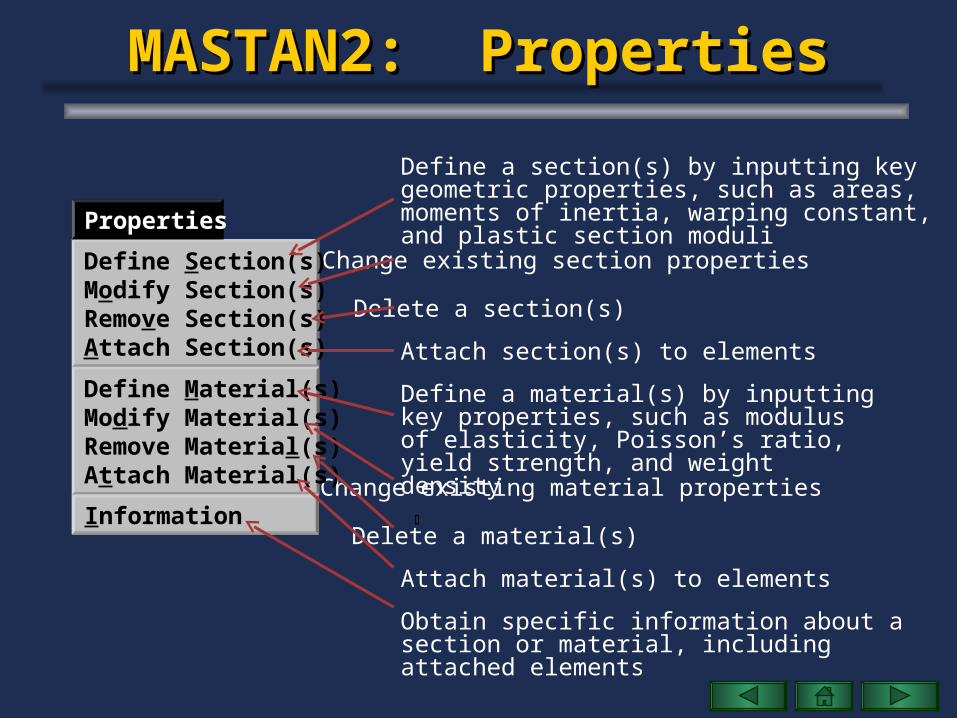
MASTAN2: PropertiesMASTAN2: Properties
Define a section(s) by inputting key geometric properties, such as areas, moments of inertia, warping constant, and plastic section moduli
Change existing section properties
Delete a section(s)
Attach section(s) to elements
Define a material(s) by inputting key properties, such as modulus of elasticity, Poisson’s ratio, yield strength, and weight density
Change existing material properties
Delete a material(s)
Attach material(s) to elements
Define Section(s)Modify Section(s)Remove Section(s)Attach Section(s)
Define Material(s)Modify Material(s)Remove Material(s)Attach Material(s)
Properties
Obtain specific information about a section or material, including attached elements
Information
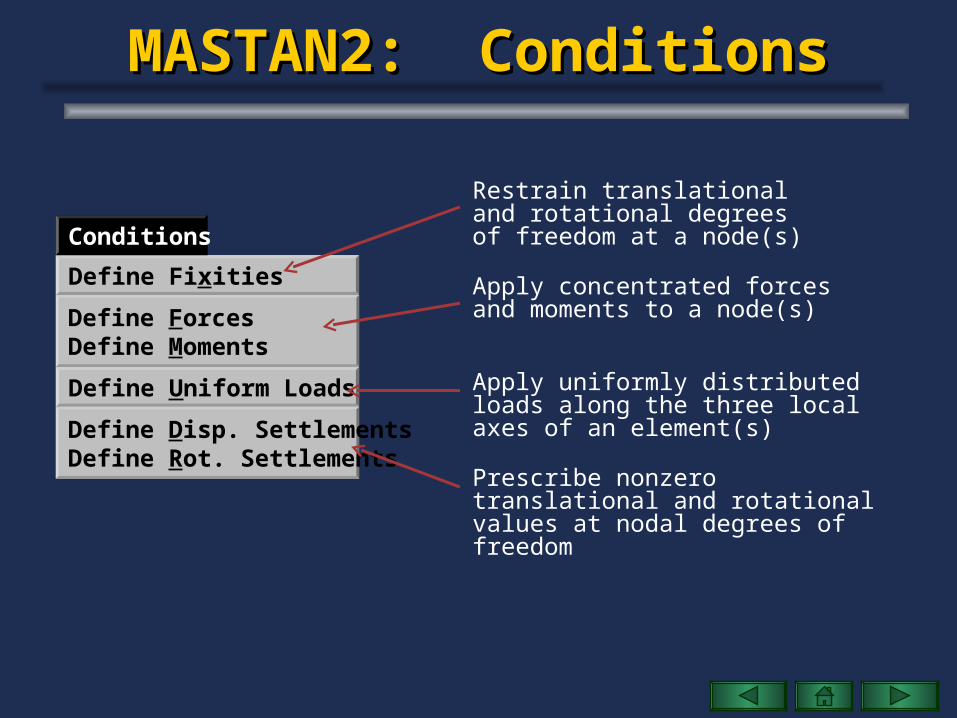
MASTAN2: ConditionsMASTAN2: Conditions
Restrain translational and rotational degrees of freedom at a node(s)
Apply uniformly distributed loads along the three local axes of an element(s)
Prescribe nonzero translational and rotational values at nodal degrees of freedom
Apply concentrated forces and moments to a node(s)
Define Uniform Loads
Define Disp. SettlementsDefine Rot. Settlements
Define Fixities
Define ForcesDefine Moments
Conditions
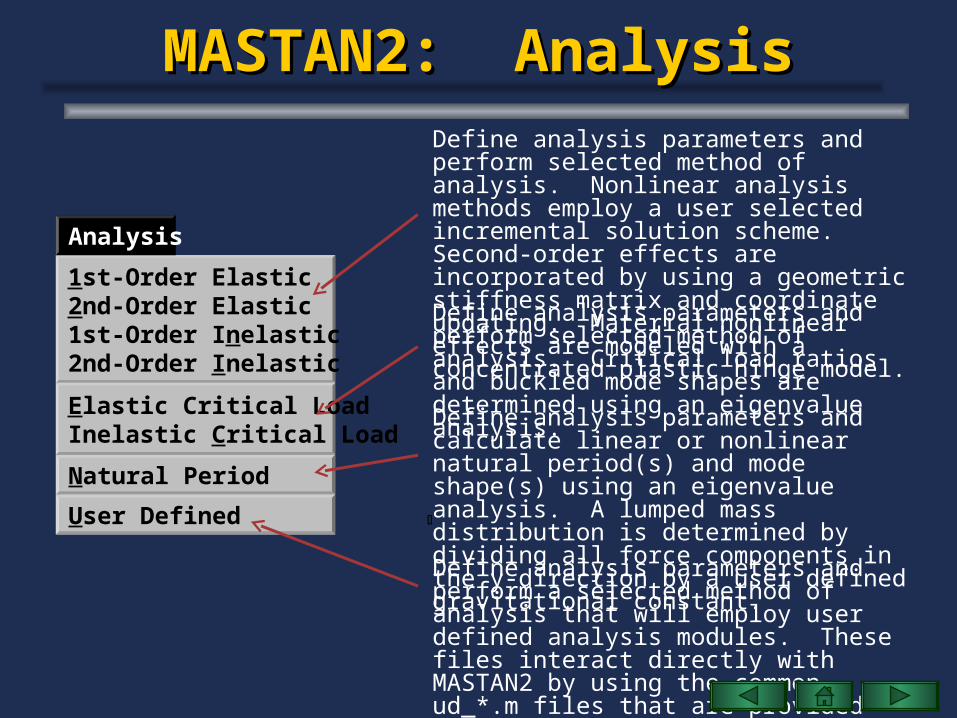
Define analysis parameters and perform a selected method of analysis that will employ user defined analysis modules. These files interact directly with MASTAN2 by using the common ud_*.m files that are provided with this software.
MASTAN2: AnalysisMASTAN2: AnalysisDefine analysis parameters and perform selected method of analysis. Nonlinear analysis methods employ a user selected incremental solution scheme. Second-order effects are incorporated by using a geometric stiffness matrix and coordinate updating. Material nonlinear effects are modeled with a concentrated plastic hinge model.
Define analysis parameters and perform selected method of analysis. Critical load ratios and buckled mode shapes are determined using an eigenvalue analysis.
1st-Order Elastic2nd-Order Elastic1st-Order Inelastic2nd-Order Inelastic
Natural Period
Elastic Critical LoadInelastic Critical Load
Analysis
User Defined
Define analysis parameters and calculate linear or nonlinear natural period(s) and mode shape(s) using an eigenvalue analysis. A lumped mass distribution is determined by dividing all force components in the y-direction by a user defined gravitational constant.
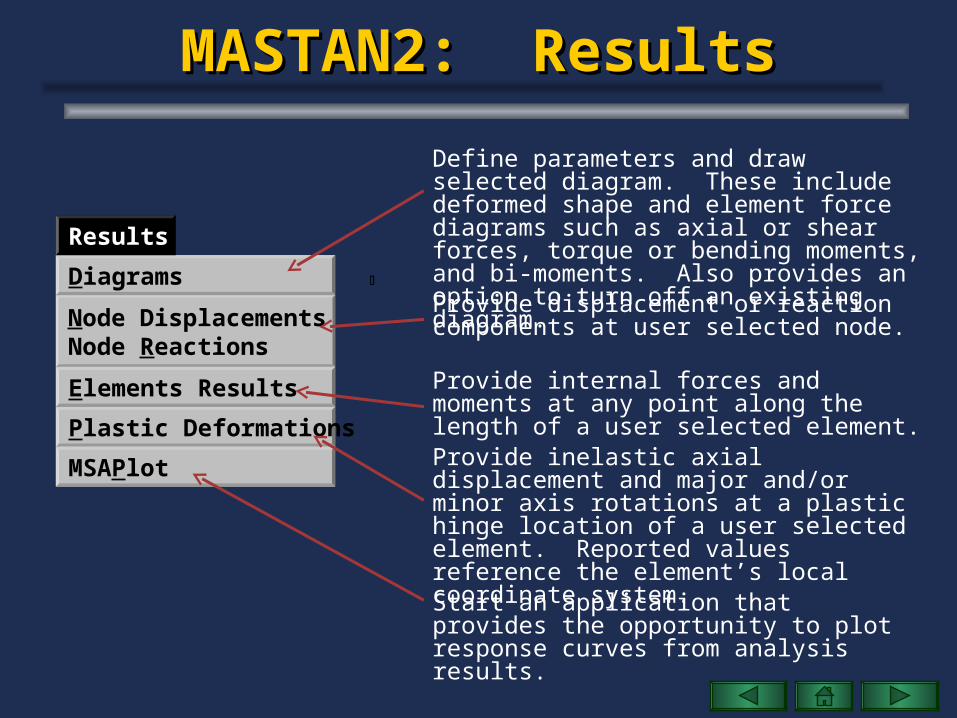
MASTAN2: ResultsMASTAN2: Results
Define parameters and draw selected diagram. These include deformed shape and element force diagrams such as axial or shear forces, torque or bending moments, and bi-moments. Also provides an option to turn off an existing diagram.
Provide displacement or reaction components at user selected node.
Start an application that provides the opportunity to plot response curves from analysis results.
Provide internal forces and moments at any point along the length of a user selected element.
Node DisplacementsNode Reactions
Plastic Deformations
Diagrams
Elements Results
Results
MSAPlot Provide inelastic axial displacement and major and/or minor axis rotations at a plastic hinge location of a user selected element. Reported values reference the element’s local coordinate system.
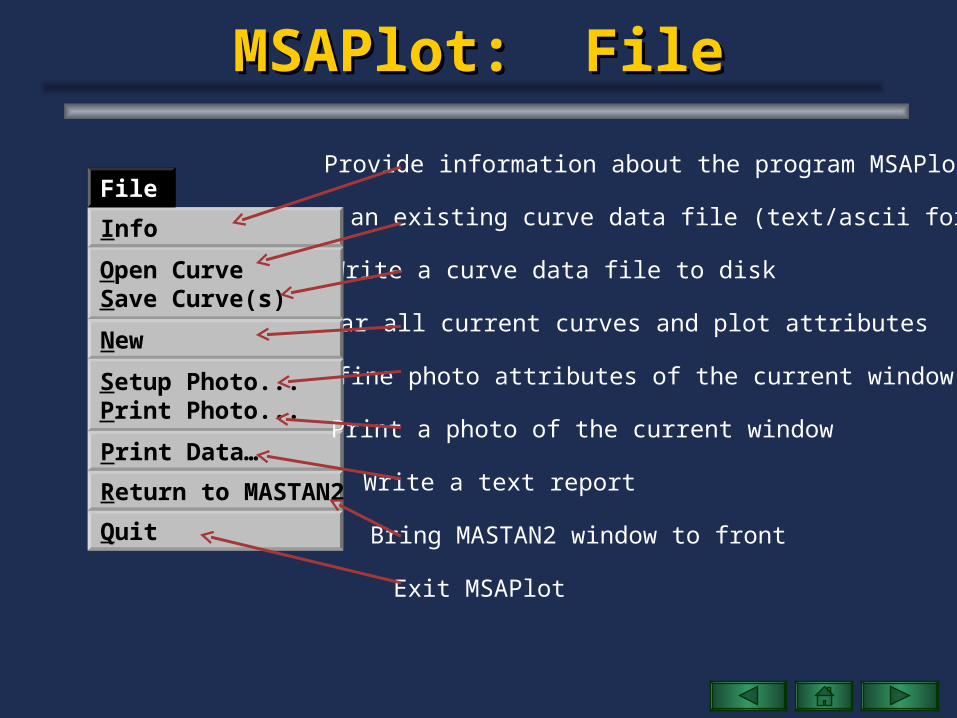
MSAPlot: FileMSAPlot: File
Read an existing curve data file (text/ascii format)
Provide information about the program MSAPlot
Write a curve data file to disk
Clear all current curves and plot attributes
Exit MSAPlot
Write a text report
Open CurveSave Curve(s)
Info
Quit
New
Return to MASTAN2
File
Bring MASTAN2 window to front
Define photo attributes of the current window
Print Data…
Setup Photo...Print Photo...
Print a photo of the current window
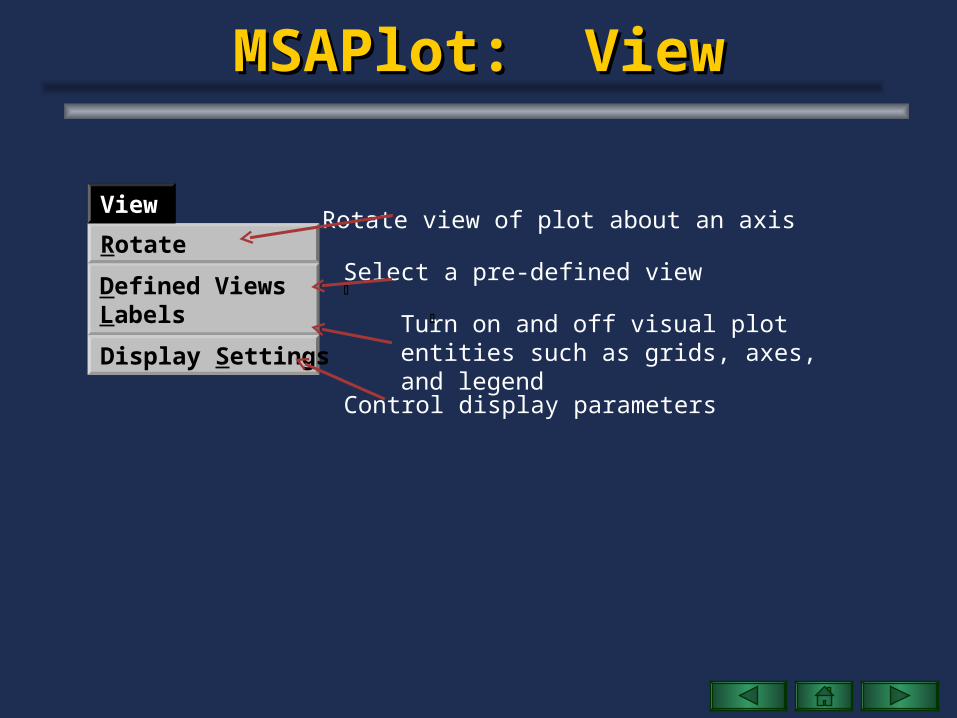
MSAPlot: ViewMSAPlot: View
Rotate view of plot about an axis
Control display parameters
Turn on and off visual plot entities such as grids, axes, and legend
Select a pre-defined viewDefined Views Labels
Rotate
Display Settings
View
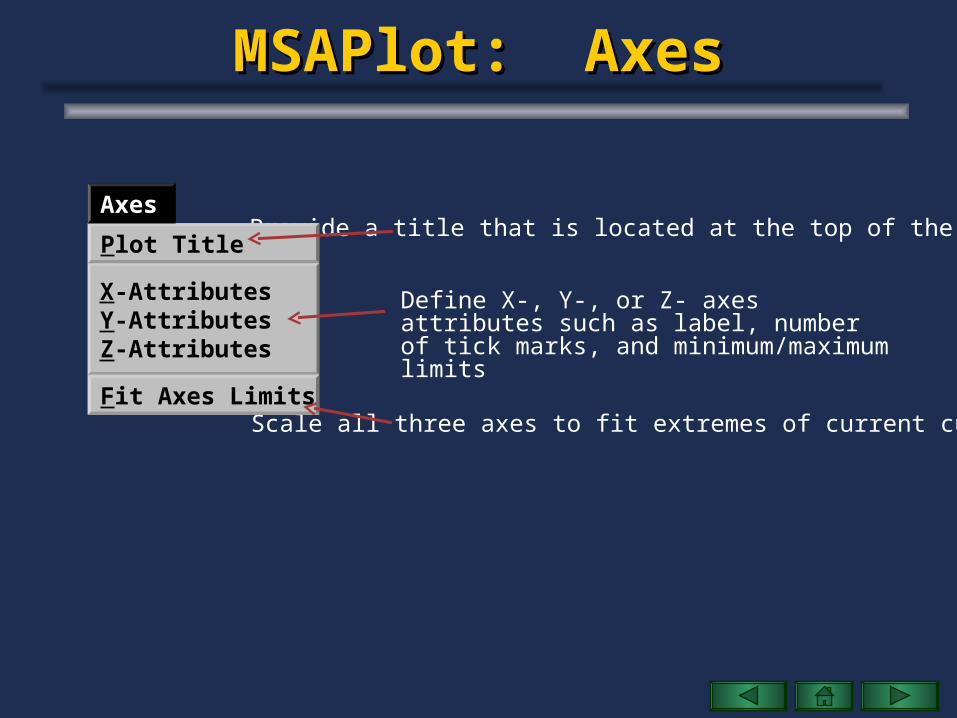
MSAPlot: AxesMSAPlot: Axes
Define X-, Y-, or Z- axes attributes such as label, number of tick marks, and minimum/maximum limits
Scale all three axes to fit extremes of current curve data
Provide a title that is located at the top of the plot
X-AttributesY-AttributesZ-Attributes
Plot Title
Fit Axes Limits
Axes
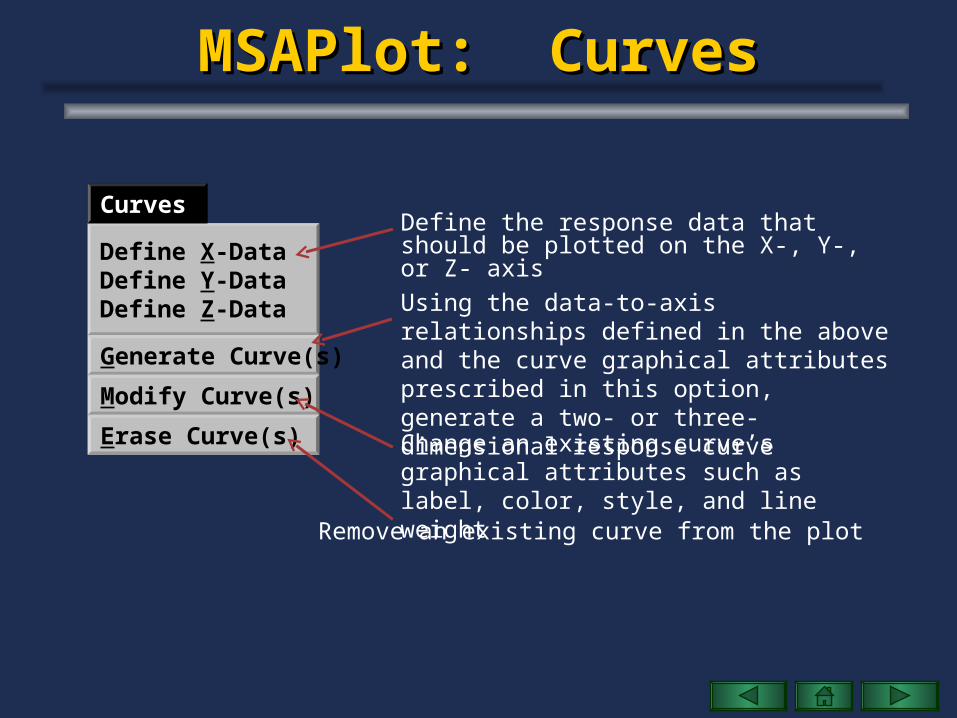
MSAPlot: CurvesMSAPlot: Curves
Define the response data that should be plotted on the X-, Y-, or Z- axis
Using the data-to-axis relationships defined in the above and the curve graphical attributes prescribed in this option, generate a two- or three-dimensional response curve
Remove an existing curve from the plot
Change an existing curve’s graphical attributes such as label, color, style, and line weight
Define X-DataDefine Y-DataDefine Z-Data
Generate Curve(s)
Modify Curve(s)
Erase Curve(s)
Curves
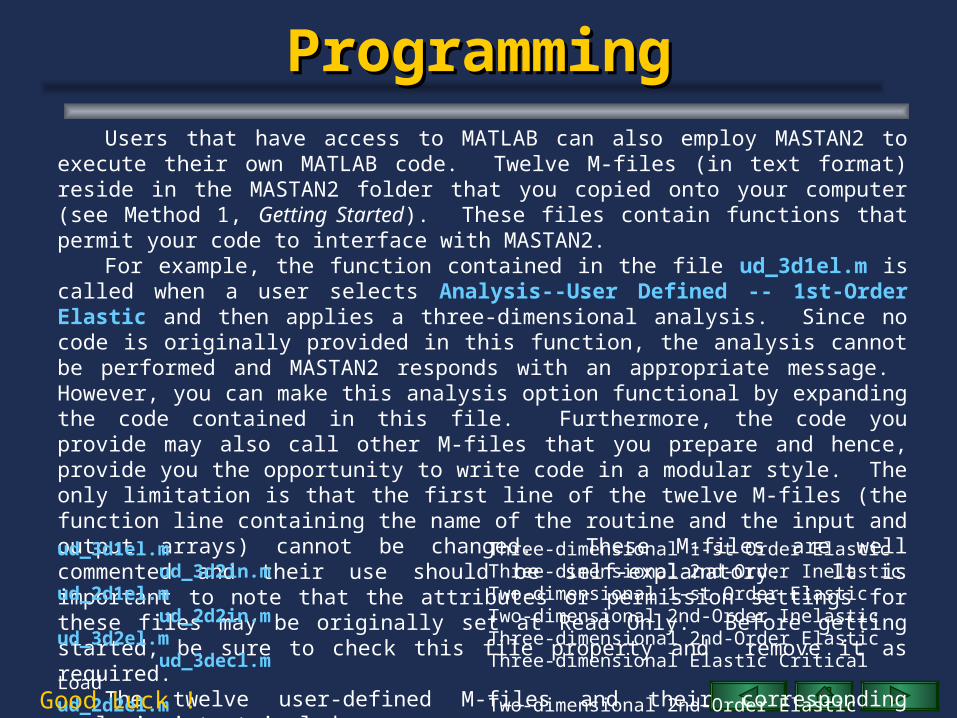
ProgrammingProgrammingUsers that have access to MATLAB can also employ MASTAN2 to execute their own
MATLAB code. Twelve M-files (in text format) reside in the MASTAN2 folder that you copied onto your computer (see Method 1, Getting Started). These files contain functions that permit your code to interface with MASTAN2.
For example, the function contained in the file ud_3d1el.m is called when a user selects Analysis--User Defined -- 1st-Order Elastic and then applies a three-dimensional analysis. Since no code is originally provided in this function, the analysis cannot be performed and MASTAN2 responds with an appropriate message. However, you can make this analysis option functional by expanding the code contained in this file. Furthermore, the code you provide may also call other M-files that you prepare and hence, provide you the opportunity to write code in a modular style. The only limitation is that the first line of the twelve M-files (the function line containing the name of the routine and the input and output arrays) cannot be changed. These M-files are well commented and their use should be self-explanatory. It is important to note that the attributes or permission settings for these files may be originally set at Read Only. Before getting started, be sure to check this file property and remove it as required.
The twelve user-defined M-files and their corresponding analysis intent include:ud_3d1el.m Three-dimensional 1-st Order Elastic ud_3d2in.m Three-dimensional 2nd-Order Inelasticud_2d1el.m Two-dimensional 1-st Order Elastic ud_2d2in.m Two-dimensional 2nd-Order Inelastic ud_3d2el.m Three-dimensional 2nd-Order Elastic ud_3decl.m Three-dimensional Elastic Critical Loadud_2d2el.m Two-dimensional 2nd-Order Elastic ud_2decl.m Two-dimensional Elastic Critical Load ud_3d1in.m Three-dimensional 1-st Order Inelastic ud_3dicl.m Three-dimensional Inelastic Critical Load ud_2d1in.m Two-dimensional 1-st Order Inelastic ud_2dicl.m Two-dimensional Inelastic Critical Load
Good Luck !

Additional InformationAdditional Information
Additional information and updates for MASTAN2 may be provided at the following URL:
http://www.mastan2.com