Embed Size (px)
Citation preview
Tutorial Letter 102/0/2017 ADVANCED MANAGEMENT ACCOUNTING Year module Department of Financial Intelligence
This tutorial letter contains important information about your module.
MAC4861/102/0/2017
BARCODE
MAC4861
NMA4861
ZMA4861
2 MAC4861/102
MODULE PURPOSE
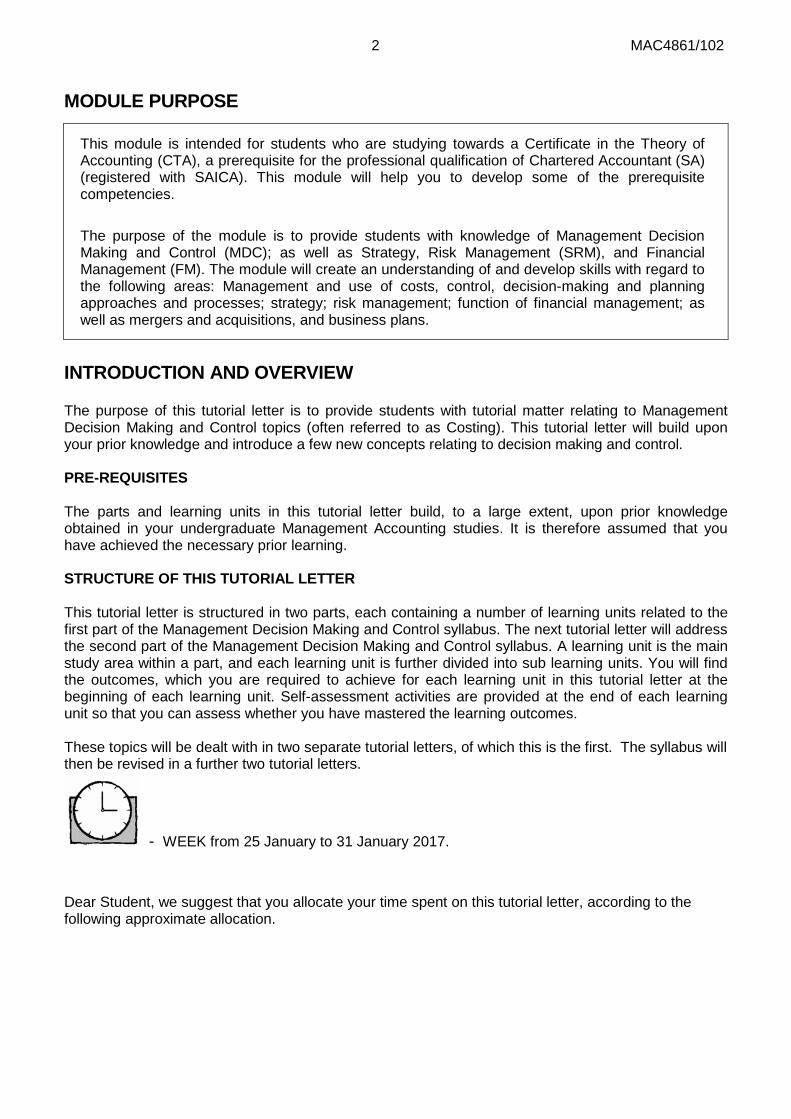
INTRODUCTION AND OVERVIEW The purpose of this tutorial letter is to provide students with tutorial matter relating to Management Decision Making and Control topics (often referred to as Costing). This tutorial letter will build upon your prior knowledge and introduce a few new concepts relating to decision making and control. PRE-REQUISITES The parts and learning units in this tutorial letter build, to a large extent, upon prior knowledge obtained in your undergraduate Management Accounting studies. It is therefore assumed that you have achieved the necessary prior learning. STRUCTURE OF THIS TUTORIAL LETTER This tutorial letter is structured in two parts, each containing a number of learning units related to the first part of the Management Decision Making and Control syllabus. The next tutorial letter will address the second part of the Management Decision Making and Control syllabus. A learning unit is the main study area within a part, and each learning unit is further divided into sub learning units. You will find the outcomes, which you are required to achieve for each learning unit in this tutorial letter at the beginning of each learning unit. Self-assessment activities are provided at the end of each learning unit so that you can assess whether you have mastered the learning outcomes. These topics will be dealt with in two separate tutorial letters, of which this is the first. The syllabus will then be revised in a further two tutorial letters.
- WEEK from 25 January to 31 January 2017.
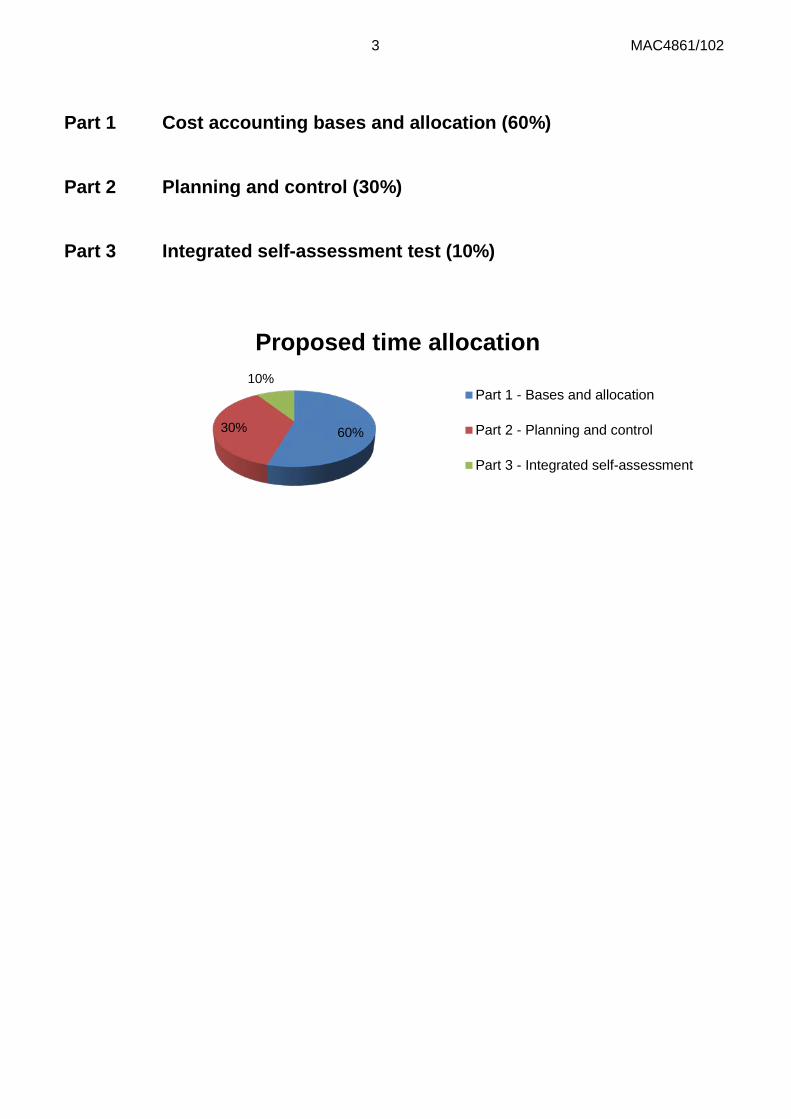
Dear Student, we suggest that you allocate your time spent on this tutorial letter, according to the following approximate allocation.
This module is intended for students who are studying towards a Certificate in the Theory of Accounting (CTA), a prerequisite for the professional qualification of Chartered Accountant (SA) (registered with SAICA). This module will help you to develop some of the prerequisite competencies. The purpose of the module is to provide students with knowledge of Management Decision Making and Control (MDC); as well as Strategy, Risk Management (SRM), and Financial Management (FM). The module will create an understanding of and develop skills with regard to the following areas: Management and use of costs, control, decision-making and planning approaches and processes; strategy; risk management; function of financial management; as well as mergers and acquisitions, and business plans.
3 MAC4861/102
Part 1 Cost accounting bases and allocation (60%) Part 2 Planning and control (30%) Part 3 Integrated self-assessment test (10%)
60% 30%
10%
Proposed time allocation
Part 1 - Bases and allocation
Part 2 - Planning and control
Part 3 - Integrated self-assessment
4 MAC4861/102
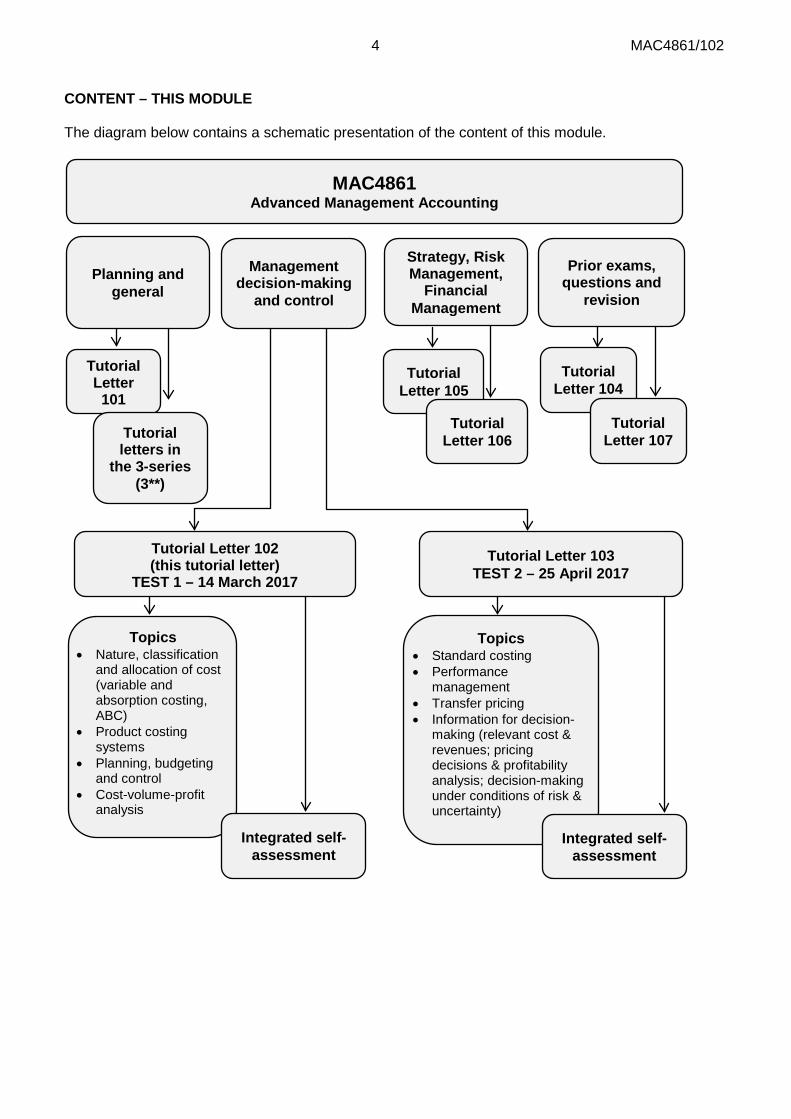
CONTENT – THIS MODULE The diagram below contains a schematic presentation of the content of this module.
MAC4861 Advanced Management Accounting
Tutorial Letter 101
Planning and general
Management decision-making
and control
Topics • Nature, classification
and allocation of cost (variable and absorption costing, ABC)
• Product costing systems
• Planning, budgeting and control
• Cost-volume-profit analysis
Topics • Standard costing • Performance
management • Transfer pricing • Information for decision-
making (relevant cost & revenues; pricing decisions & profitability analysis; decision-making under conditions of risk & uncertainty)
Tutorial letters in
the 3-series (3**)
Integrated self-assessment
Prior exams, questions and
revision
Tutorial Letter 104
Tutorial Letter 107
Tutorial Letter 102 (this tutorial letter)
TEST 1 – 14 March 2017 Tutorial Letter 103
TEST 2 – 25 April 2017
Strategy, Risk Management,
Financial Management
Tutorial Letter 105
Tutorial Letter 106
Integrated self-assessment
5 MAC4861/102
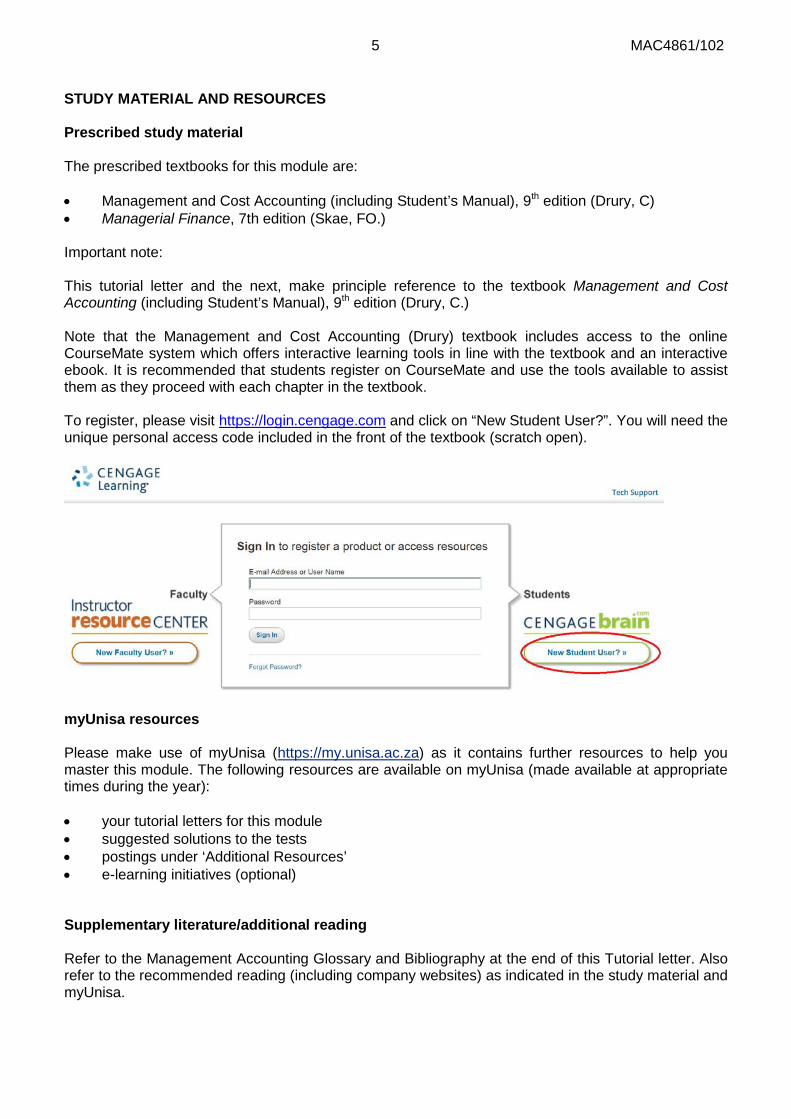
STUDY MATERIAL AND RESOURCES Prescribed study material The prescribed textbooks for this module are: • Management and Cost Accounting (including Student’s Manual), 9th edition (Drury, C) • Managerial Finance, 7th edition (Skae, FO.) Important note: This tutorial letter and the next, make principle reference to the textbook Management and Cost Accounting (including Student’s Manual), 9th edition (Drury, C.) Note that the Management and Cost Accounting (Drury) textbook includes access to the online CourseMate system which offers interactive learning tools in line with the textbook and an interactive ebook. It is recommended that students register on CourseMate and use the tools available to assist them as they proceed with each chapter in the textbook. To register, please visit https://login.cengage.com and click on “New Student User?”. You will need the unique personal access code included in the front of the textbook (scratch open).
myUnisa resources Please make use of myUnisa (https://my.unisa.ac.za) as it contains further resources to help you master this module. The following resources are available on myUnisa (made available at appropriate times during the year): • your tutorial letters for this module • suggested solutions to the tests • postings under ‘Additional Resources’ • e-learning initiatives (optional) Supplementary literature/additional reading Refer to the Management Accounting Glossary and Bibliography at the end of this Tutorial letter. Also refer to the recommended reading (including company websites) as indicated in the study material and myUnisa.

6 MAC4861/102
General information and CTA news For general information and CTA news please refer to the CTA Support Page. The CTA support page can be accessed from our CAS website landing page. The short URL for this page is: www.unisa.ac.za/cas/cta
STUDY SCHOOLS Please refer to follow-up tutorial letters in the SASALL 300-series for more details. If these classes are offered in your area, it is strongly recommended that you attend. These classes will support you with your studies and help you gain a better understanding of the module. TESTS The learning units assessed by Test 1 will cover predominately (but not exclusively) the content of Topics 1-3 contained in this tutorial letter; and Test 2 will cover predominately (but exclusively) the content of Topics 4 – 7 contained in tutorial letter 103. It is important to realise that the examination papers of this module will integrate between the various learning units and disciplines. In preparation for the exam, you can therefore also expect some level of integration in the tests.
7 MAC4861/102
STUDY PROGRAMME A study programme has been published in Tutorial Letter SASALL301. Please utilise this to plan you studies. Note If you struggle with any of the learning units we strongly recommend that you allocate additional time – above and beyond the time indicated in the study programme. CONCLUSION We trust that the preceding sections will assist you in approaching your studies (linked to this tutorial letter) in a methodical manner and with a greater level of understanding. We hope you enjoy this part of your studies! Regards, Your Advanced Management Accounting lecturers
8 MAC4861/102
MAC4861
ADVANCED MANAGEMENT ACCOUNTING TUTORIAL LETTER 102 / 2017
PAGE MODULE PURPOSE ...................................................... ERROR! BOOKMARK NOT DEFINED. PART 1 – COST ACCOUNTING BASES AND ALLOCATION .................................................. 9 LEARNING UNIT 1 – Nature, classification and allocation of cost ............................................. 10 LEARNING UNIT 1.1 – Nature and classification of cost .................................................... 11 LEARNING UNIT 1.2 – Variable and absorption costing ............................................................ 17 LEARNING UNIT 1.3 – Activity-based costing (ABC) ......................................................... 35 LEARNING UNIT 2 – Product costing systems ......................................................................... 47 LEARNING UNIT 2.1 – Job costing .................................................................................... 48 LEARNING UNIT 2.2 – Process costing... .......................................................................... 53 LEARNING UNIT 2.3 – Joint and by-product costing... ....................................................... 59 PART 2 – PLANNING AND CONTROL ................................................................................... 67 LEARNING UNIT 3 – Planning, budgeting and control .............................................................. 67 LEARNING UNIT 3.1 – Budgeting and management control systems ................................ 68 LEARNING UNIT 3.2 – Cost management techniques/principles ............................................. 80 LEARNING UNIT 3.3 – Cost-volume-profit analysis ........................................................... 85 INTEGRATED SELF-ASSESSMENTS ..................................................................................... 94
ACTIVITY 1 ....................................................................................................................... 95 ACTIVITY 2 ....................................................................................................................... 99
2016 TEST 1 AND SOLUTION ....................................................................................... 107 2015 TEST 1 AND SOLUTION ....................................................................................... 114
MANAGEMENT ACCOUNTING GLOSSARY ........................................................................ 123
9 MAC4861/102
PART 1 - COST ACCOUNTING BASES AND ALLOCATION
PART 1 - PURPOSE The purpose of part 1 is to equip students with a critical and informed understanding of • key terms and guidelines • concepts and established principles in order to classify, to record and to present costs for the valuation of inventories and to compile Statements of Comprehensive Income on different bases.
DEEL 1 - DOEL Die doel met deel 1 is om studente toe te rus met ‘n kritiese en ingeligte begrip van die • sleutelterme en riglyne • konsepte en gevestigde beginsels ten einde koste te klassifiseer, te boek te stel en voor te lê vir die waardasie van voorraad en die opstel van State van Omvattende Inkomste op verskillende grondslae.
TOPICS: 1. Nature, classification and allocation of cost 2. Costing of material, labour and overhead Introduction Management accounting deals with accounting information within the organisation, focussing on critical information so that operational and strategic planning can be undertaken, decisions can be made, control can be exercised and problems addressed. There is no formal framework which regulates management accounting. A logical mind and approach is, however, required to deal with the aforementioned focus areas.
10 MAC4861/102
LEARNING UNIT 1 – Nature, classification and allocation of cost
LEARNING UNIT 1 LEARNING OUTCOMES After studying this topic, you should be able to do the following: ● Describe the definitions relevant to costing terms and systems. ● Classify costs and apply cost concepts and cost estimation techniques in various scenarios. ● Apply knowledge of variable and absorption costing systems in a case study scenario. ● Advise on an applicable method when analysing a scenario. ● Apply results of the over- and under-recovery of overheads calculation to a practical case study and correctly account for it in the Statement of Comprehensive Income. ● Apply an activity-based costing Approach to costing information in a scenario. ● Advise management on which type of costing system is appropriate and how the systems differ.
LEEREENHEID 1 LEERUITKOMSTE Na bestudering van hierdie onderwerp behoort u in staat te wees om die volgende te doen • Die definisies relevant tot kostestelsels te omskryf. • Koste te klassifiseer en koste konsepte en kosteberamingstegnieke toe te pas in verskeie scenario's. • Advies oor ‘n gepaste werkswyse te gee wanneer ‘n scenario ontleed word. ● Kennis van veranderlike- en absorpsiekostestelsels in ‘n gevallestudie/scenario toe te pas. • Gevolge van die berekening van die oor- en onderverhaling van bokoste op ‘n praktiese gevallestudie toe te pas en dit korrek in die Staat van Omvattende Inkomste weer te gee. • Pas ‘n aktiwiteitsgebaseerde kostebenadering op koste inligting in ‘n scenario toe. • Adviseer bestuur aangaande die tipe kostestelsel wat toepaslik is en hoe die stelsels verskil.
LEARNING UNIT TITLE
LEARNING UNIT 1.1 Nature and classification of cost
LEARNING UNIT 1.2 Variable and absorption costing
LEARNING UNIT 1.3 Activity-based costing
11 MAC4861/102
LEARNING UNIT 1.1 Nature and classification of cost
Prior learning
This course assumes that students have already mastered the work equivalent to that presented in Unisa’s preceding undergraduate degree. Please ensure that you are up to date with the prior learning for the nature, classification and allocation of costs. If not, please refer to your undergraduate study material and revise the following indicated pages of the textbook, namely Drury, using the page numbers below:
Prior learning Drury 9th edition
Before studying this topic, you should be able to: • Define and illustrate a cost. • Understand the meaning of the important cost definitions. • Distinguish between variable and fixed costs. • Apply and describe the different methods of estimating costs. • Calculate regression equations using the
least-squares methods and evaluate the goodness of fit, using the coefficient of correlation and coefficient of determination.
• Application of the high-low method.
Applicable references: Drury Chapter 2: An introduction to cost terms and concepts. Pages 25–41 Drury Chapter 23: Cost estimation and cost behaviour. Pages 628–639 Drury Chapter 8: Separation of semi-variable costs. Pages 188–189 Course Mate: Glossary and flashcards: Chapter 2, 23 & 8 (Note with chapter 8 you will do (CVP in a later unit ∴ focus only on separation of semi-variable costs for now)
Introduction In this learning unit you will revise the nature of costs and the methods used to classify them. You will specifically revisit the application of the high-low method to distinguish between fixed and variable costs. The following are brief descriptions of the critical terms in this study unit. Bear in mind that the classification of costs will vary between organisations and within a particular organisation according to a particular management function. Cost The cost of any item, whether production or service driven, is determined by a quantifiable measurement and a value measurement.
12 MAC4861/102
Cost classification Classification is linked to the intended use of the cost information: i.e. for inventory valuation, planning, decision-making or control purposes. Cost behaviour Cost behaviour is driven by the different levels of activity and a variety of measures. Cost estimation Different methods are used for cost estimation, of which the high-low method is found most often in questions. High-low method
Note that in practice you would probably not use this method as it is more crude than statistical or software driven solutions (Drury 7th ed, pages 600–601, Drury 8th ed, pages 613-614). We will highlight a few problem areas in the application of the high-low method as it is often one of the first steps in answering a question, and is often misconstrued.
This method takes the highest and lowest activity levels and associated costs from the available information and calculates the change in volume and cost which has occurred between them. The assumption is that the change in total costs between the two levels is attributable to the variable costs, because fixed costs stay the same within a normal capacity range (0%–100%).
Total cost = (Variable cost x units produced) + Fixed costs
Variable cost per unit
Cost at highest activity level – Cost at lowest activity level = Units produced at highest activity level – units produced at lowest activity level
Focus notes 1. The costs should be from the same fiscal period, i.e. the effect of inflation should be negated.
When working with figures derived under different inflationery conditions, all figures should first be INDEXED to the same year. Thereafter the high-low method can be Applied.
2. The selection of high and low is based on the activity level, not on the cost or value level. 3. Always remember that a high-low scenario is only applicable where there are different costs for
two different levels of activity, during a specified time period. You CAN’T compare a budgeted and actual activity and do a high-low method application based on that. The high-low method is based on two levels of budgeted activity or two levels of actual activity.
4. If you notice an inconsistent increase/reduction in total costs relative to a specific activity, (non-
linearity,) ignore that activity level in your consideration of the high and low points. It is important that you review all the data points, before deciding on the high and low levels.
13 MAC4861/102
Online Resources (CourseMate) – Drury 9th ed The Drury 9th edition includes private access to an interactive online site, CourseMate. It provides a student with the following learning tools: ● flashcards ● glossary This will assist you when you are studying the notes as part of your revision. Please note that these entire resources focus on learning the definitions. At MAC4861 level you are required to understand these definitions and apply in a case study. You should focus on application.
Activity 1: Basic revision example
Attempt question: (Drury Textbook) 9th ed: Question 2.28 p 42 (Solution p 723) This question is for revision of sunk and opportunity costs for decision making. Keep in mind that Mrs J has 2 options: should Mrs J continue with the business or should Mrs J sublet the shop to her friend? What will the cost/salary involve with the two options.
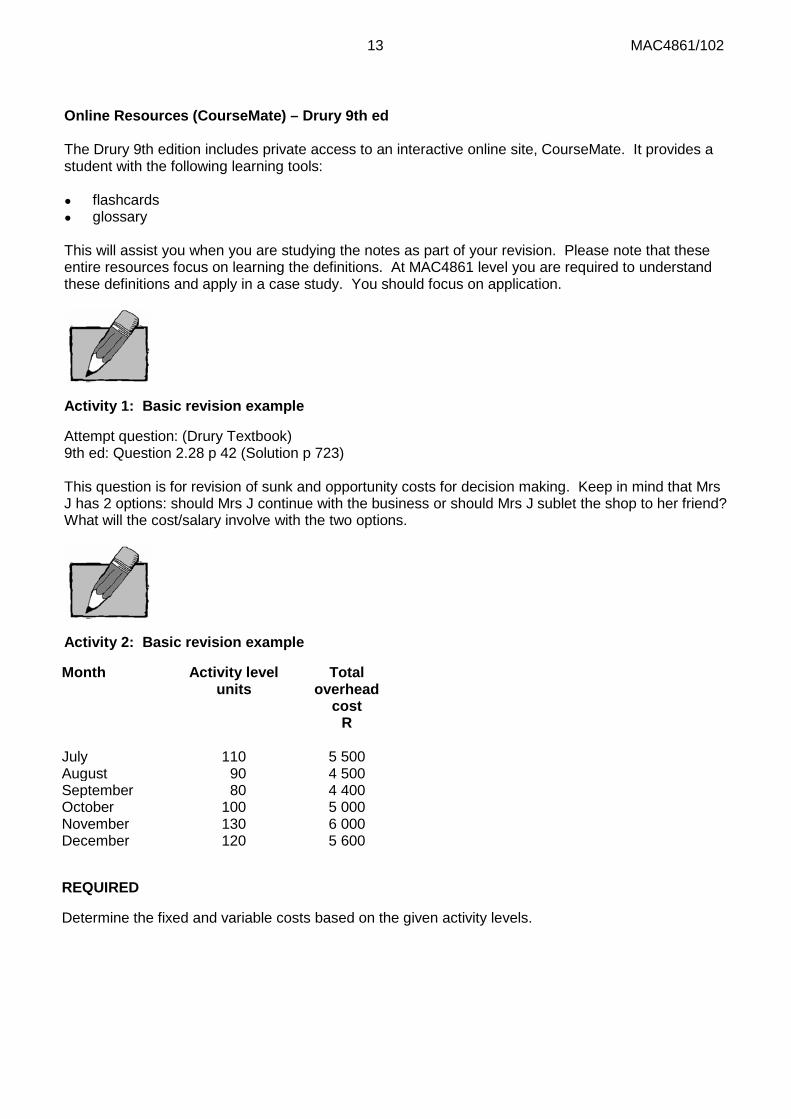
Activity 2: Basic revision example
Month Activity level units
Total overhead
cost R
July 110 5 500 August 90 4 500 September 80 4 400 October 100 5 000 November 130 6 000 December 120 5 600
REQUIRED
Determine the fixed and variable costs based on the given activity levels.
14 MAC4861/102
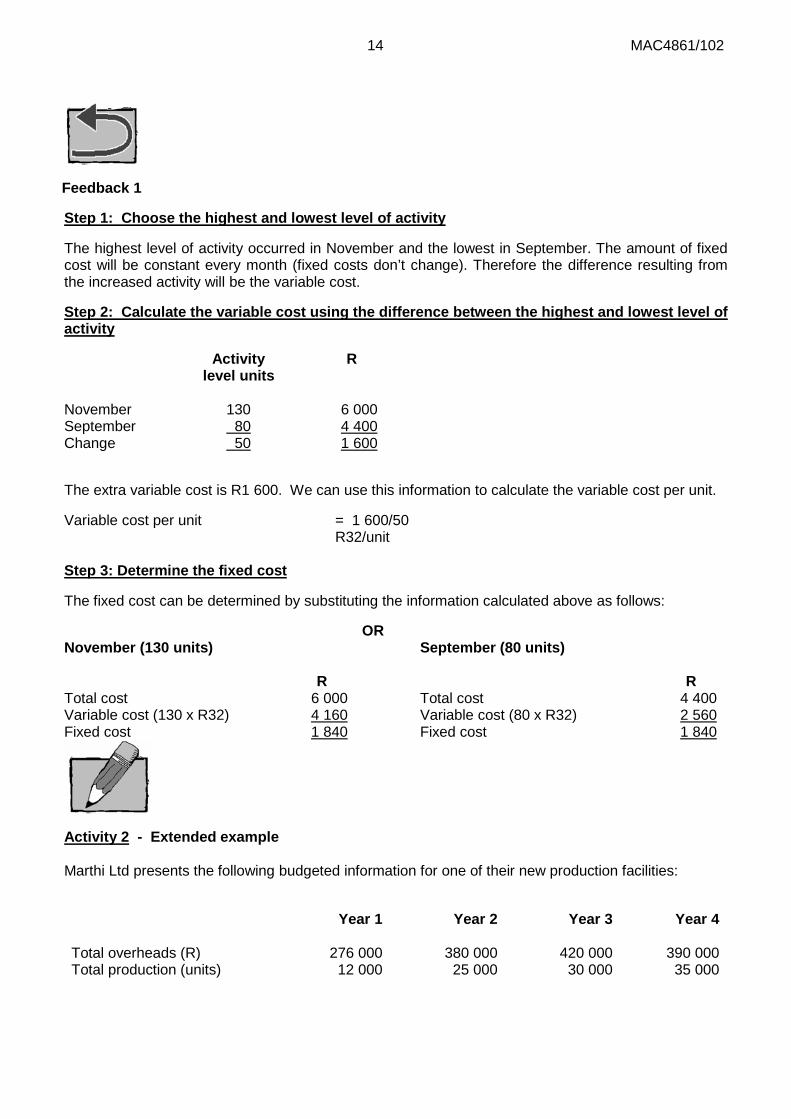
Feedback 1
Step 1: Choose the highest and lowest level of activity
The highest level of activity occurred in November and the lowest in September. The amount of fixed cost will be constant every month (fixed costs don’t change). Therefore the difference resulting from the increased activity will be the variable cost.
Step 2: Calculate the variable cost using the difference between the highest and lowest level of activity
Activity level units
R
November 130 6 000 September 80 4 400 Change 50 1 600
The extra variable cost is R1 600. We can use this information to calculate the variable cost per unit.
Variable cost per unit = 1 600/50 R32/unit Step 3: Determine the fixed cost
The fixed cost can be determined by substituting the information calculated above as follows:
November (130 units)
OR
September (80 units)
R R Total cost 6 000 Total cost 4 400 Variable cost (130 x R32) 4 160 Variable cost (80 x R32) 2 560 Fixed cost 1 840 Fixed cost 1 840
Activity 2 - Extended example Marthi Ltd presents the following budgeted information for one of their new production facilities:
Year 1 Year 2 Year 3 Year 4
Total overheads (R) 276 000 380 000 420 000 390 000 Total production (units) 12 000 25 000 30 000 35 000
15 MAC4861/102
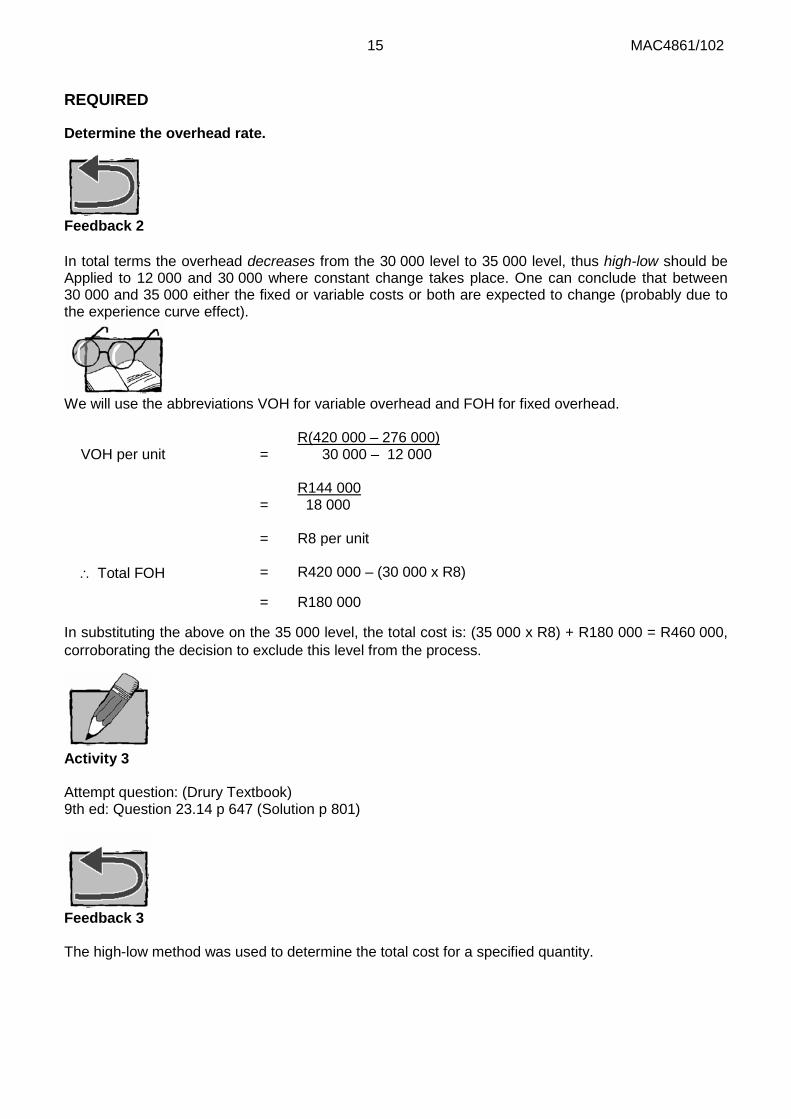
REQUIRED
Determine the overhead rate.
Feedback 2 In total terms the overhead decreases from the 30 000 level to 35 000 level, thus high-low should be Applied to 12 000 and 30 000 where constant change takes place. One can conclude that between 30 000 and 35 000 either the fixed or variable costs or both are expected to change (probably due to the experience curve effect).
We will use the abbreviations VOH for variable overhead and FOH for fixed overhead.
VOH per unit
=
R(420 000 – 276 000) 30 000 – 12 000
= R144 000 18 000
= R8 per unit ∴ Total FOH = R420 000 – (30 000 x R8)
= R180 000
In substituting the above on the 35 000 level, the total cost is: (35 000 x R8) + R180 000 = R460 000, corroborating the decision to exclude this level from the process.
Activity 3 Attempt question: (Drury Textbook) 9th ed: Question 23.14 p 647 (Solution p 801)
Feedback 3 The high-low method was used to determine the total cost for a specified quantity.
16 MAC4861/102
Summary In this study unit, we revisited cost classification, behaviour and estimation with emphasis on applying the high-low method.
Self-assessment activity Before you move on to the next study unit, please ensure that you have grasped the following concepts: Yes/No 1. What is a cost object? Explain how sales commission will be treated when
(i) the product is the cost object (ii) the customer is the cost object
2. Maintaining a cost database.
3. Cost estimation: Regression analysis and high-low method. Explain under which circumstances a particular method may be more applicable.
4. Provide an example of a fixed and a variable cost in a • manufacturing environment • retail environment • service environment without using the same example more than once.
17 MAC4861/102
LEARNING UNIT 1.2 Variable and absorption costing
Prior learning
This course assumes that students have already mastered the work equivalent to that presented in Unisa’s preceding undergraduate degree. Please ensure that you are up to date with the prior learning for variable and absorption costing. If not, please refer to your undergraduate study material and revise the following indicated pages of the textbook, namely Drury, using the page numbers below:
Prior learning Drury 9th ed
Before studying this topic, you should be able to do the following: • Describe the various denominator levels that
can be used with an absorption costing system.
• Justify why budgeted overhead rates should be used in preference to actual overhead rates.
• Calculate and explain the accounting treatment of the under-/over-recovery of overheads.
• Reallocate service departments’ overheads where service departments render services to each other and to production departments.
• Explain the differences between an absorption costing and a variable costing system.
• Prepare profit statements based on an absorption and variable costing system.
• Reconcile and explain the difference in profits between absorption and variable costing profit calculations.
• Explain the arguments for and against variable and absorption costing.
Applicable references: • Drury: Chapter 3: Cost assignment.
Pages 51–60.
• Drury: Chapter 3: Budgeted overhead rates and under- and over-recovery of overheads. Pages 64–70.
● Drury: Chapter 3: Inter-service department reallocations.
Pages 72–76. • Drury: Chapter 7: Income effects of alternative cost
accumulation systems. Pages 151–162. Leave out the following sections of Chapter 7:
o Appendix 7.1 Derivation of the profit function for an
absorption costing system. Pages 163–164
• Now study IAS2 again. CourseMate (Online resource): Study glossary and flashcards to revise definitions.
Introduction In the previous study unit, we used the nature of a cost to classify it as either fixed or variable, although in practice many costs will have a dual nature or follow a step pattern. We will now use these classifications to assign overhead cost to products.
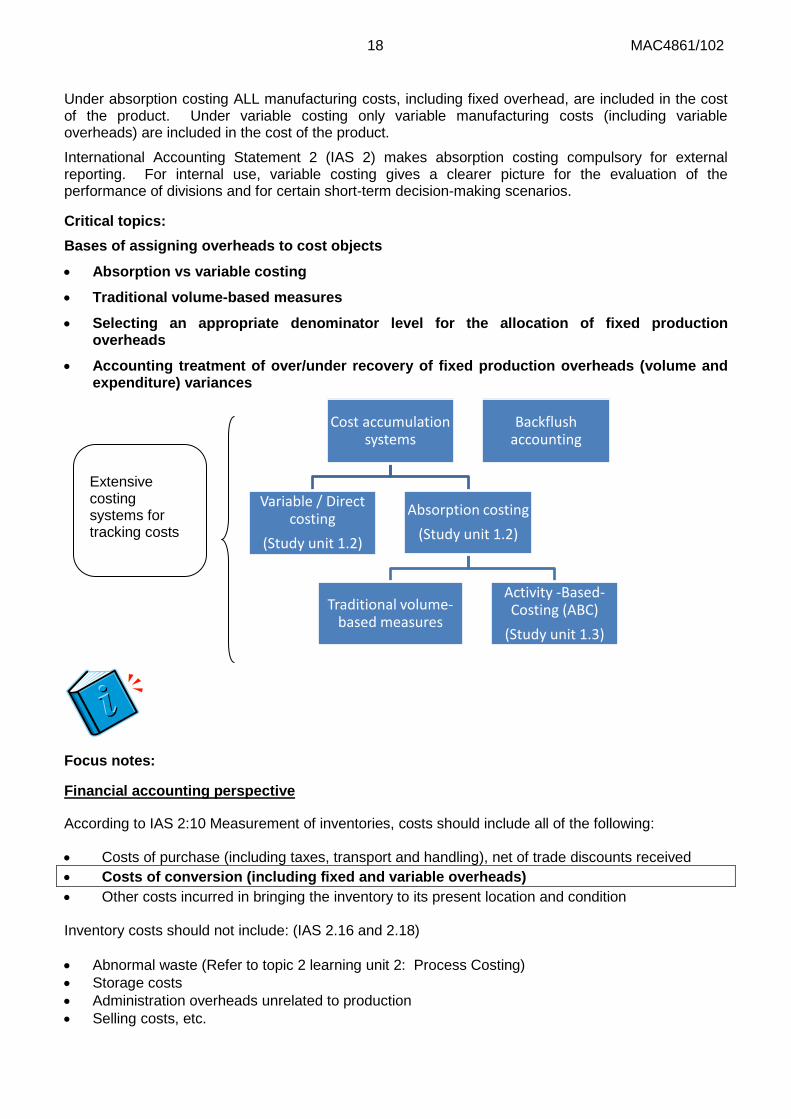
In this study unit, we revisit types of cost accumulation systems, namely absorption costing and variable/direct costing systems, specifically those using traditional volume-based measures. In the next topic we will look at another absorption costing system, namely activity-based costing (ABC).
18 MAC4861/102
Under absorption costing ALL manufacturing costs, including fixed overhead, are included in the cost of the product. Under variable costing only variable manufacturing costs (including variable overheads) are included in the cost of the product.
International Accounting Statement 2 (IAS 2) makes absorption costing compulsory for external reporting. For internal use, variable costing gives a clearer picture for the evaluation of the performance of divisions and for certain short-term decision-making scenarios.
Critical topics: Bases of assigning overheads to cost objects
• Absorption vs variable costing
• Traditional volume-based measures
• Selecting an appropriate denominator level for the allocation of fixed production overheads
• Accounting treatment of over/under recovery of fixed production overheads (volume and expenditure) variances
Focus notes:
Financial accounting perspective
According to IAS 2:10 Measurement of inventories, costs should include all of the following:
• Costs of purchase (including taxes, transport and handling), net of trade discounts received • Costs of conversion (including fixed and variable overheads) • Other costs incurred in bringing the inventory to its present location and condition Inventory costs should not include: (IAS 2.16 and 2.18) • Abnormal waste (Refer to topic 2 learning unit 2: Process Costing) • Storage costs • Administration overheads unrelated to production • Selling costs, etc.
Cost accumulation systems
Variable / Direct costing
(Study unit 1.2)
Absorption costing (Study unit 1.2)
Traditional volume- based measures
Activity -Based- Costing (ABC)
(Study unit 1.3)
Backflush accounting
Extensive costing systems for tracking costs
19 MAC4861/102
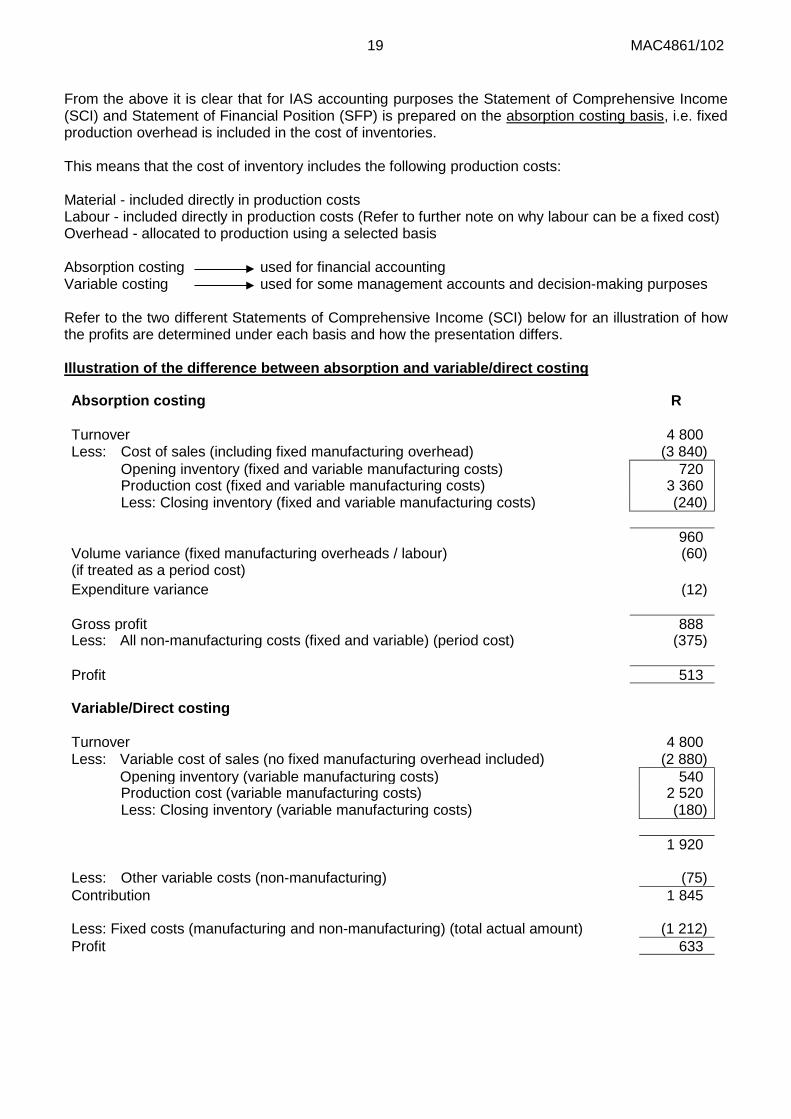
From the above it is clear that for IAS accounting purposes the Statement of Comprehensive Income (SCI) and Statement of Financial Position (SFP) is prepared on the absorption costing basis, i.e. fixed production overhead is included in the cost of inventories. This means that the cost of inventory includes the following production costs: Material - included directly in production costs Labour - included directly in production costs (Refer to further note on why labour can be a fixed cost) Overhead - allocated to production using a selected basis Absorption costing used for financial accounting Variable costing used for some management accounts and decision-making purposes Refer to the two different Statements of Comprehensive Income (SCI) below for an illustration of how the profits are determined under each basis and how the presentation differs. Illustration of the difference between absorption and variable/direct costing
Absorption costing R
Turnover 4 800 Less: Cost of sales (including fixed manufacturing overhead) (3 840) Opening inventory (fixed and variable manufacturing costs) 720 Production cost (fixed and variable manufacturing costs) 3 360 Less: Closing inventory (fixed and variable manufacturing costs) (240) 960 Volume variance (fixed manufacturing overheads / labour) (if treated as a period cost)
(60)
Expenditure variance (12) Gross profit 888 Less: All non-manufacturing costs (fixed and variable) (period cost) (375) Profit 513 Variable/Direct costing
Turnover 4 800 Less: Variable cost of sales (no fixed manufacturing overhead included) (2 880) Opening inventory (variable manufacturing costs) 540 Production cost (variable manufacturing costs) 2 520 Less: Closing inventory (variable manufacturing costs) (180) 1 920 Less: Other variable costs (non-manufacturing) (75) Contribution 1 845 Less: Fixed costs (manufacturing and non-manufacturing) (total actual amount) (1 212) Profit 633
20 MAC4861/102
Additional information: • Contribution = Turnover – ALL variable costs
• When absorption costing is applied: Under- of over-recovery of overheads = Volume variance + Expenditure variance.
• When variable costing is applied: Under- or over-recovery of overheads = Expenditure variance. The volume variance is not applicable when variable costing is applied.
• An adverse volume variance means that actual production volume is less than the budgeted allocation base used. A favourable volume variance: actual production volume is more than the budgeted allocation base used.
• The volume variance for overhead/labour should be included ABOVE the gross profit line, as part of the production cost for the period under review (due to different teaching applications, under/over recovery below the line will still earn marks when clearly shown).
• The volume and expenditure variances are only calculated when doing a SCI on the absorption costing method. The expenditure variance is covered in tandem with the volume variance as they are often confused with one another.
The discussion which follows covers questions and answers that students generally experience problems with:
Why is labour in most instances a fixed cost? Should I treat labour the same way that I treat other fixed manufacturing production overhead?
“Labour costs have traditionally been regarded as variable on the assumption that management can retrench workers in the event that production levels decline. In practice, downsizing and retrenching workers is not a unilateral decision and negotiations are required with unions before wide-scale retrenchments can be implemented. In any event, retrenchments are not an everyday occurrence. To assume that labour costs are variable because of the potential to reduce these may be inappropriate.” Machines or plant can also be taken out of production. That does not make costs relating to machines or plant variable!
Furthermore, in many production facilities, employees oversee automated machines. Their labour effort cannot be traced to individual units. This type of labour would then also be classified as overhead and usually fixed due to the same reason as explained above.
Therefore labour is often a fixed cost and should then be treated in the same manner as fixed overheads. In scenarios presented to you, we will clearly indicate if some labour is variable, i.e. piece work. In the absence of this you may assume that the manufacturing labour component is included in fixed production overheads.
So why are you using the estimated/budgeted fixed overheads and calculating a rate? When do you calculate the cost of your product? Do you need to know the cost price as you sell it throughout the year or do you calculate it when you have all the information at the end of the year?
You don’t know what your actual overhead is going to be until the end of the year, but you can’t delay your cost calculations until the end of the year. How will you quote the selling price of your products if you don’t know the cost price? We estimate the activity level to calculate a budgeted overhead rate because we need to know, more or less, what the cost price of our production is and we need to know this before the end of the year. (Refer to page 64 in Drury 9th edition for a full explanation of why budgeted overhead rates are used).
21 MAC4861/102
How do we allocate manufacturing overheads to products?
Manufacturing overheads cannot be traced directly to products. They are assigned to products using cost allocations. A cost allocation is the process of estimating the cost of resources consumed by products that involves the use of surrogate rather than direct measures, as set out in learning unit 2.
To calculate the budgeted overhead rate:
Budgeted overhead Overhead rate = appropriate allocation base
Focus note:
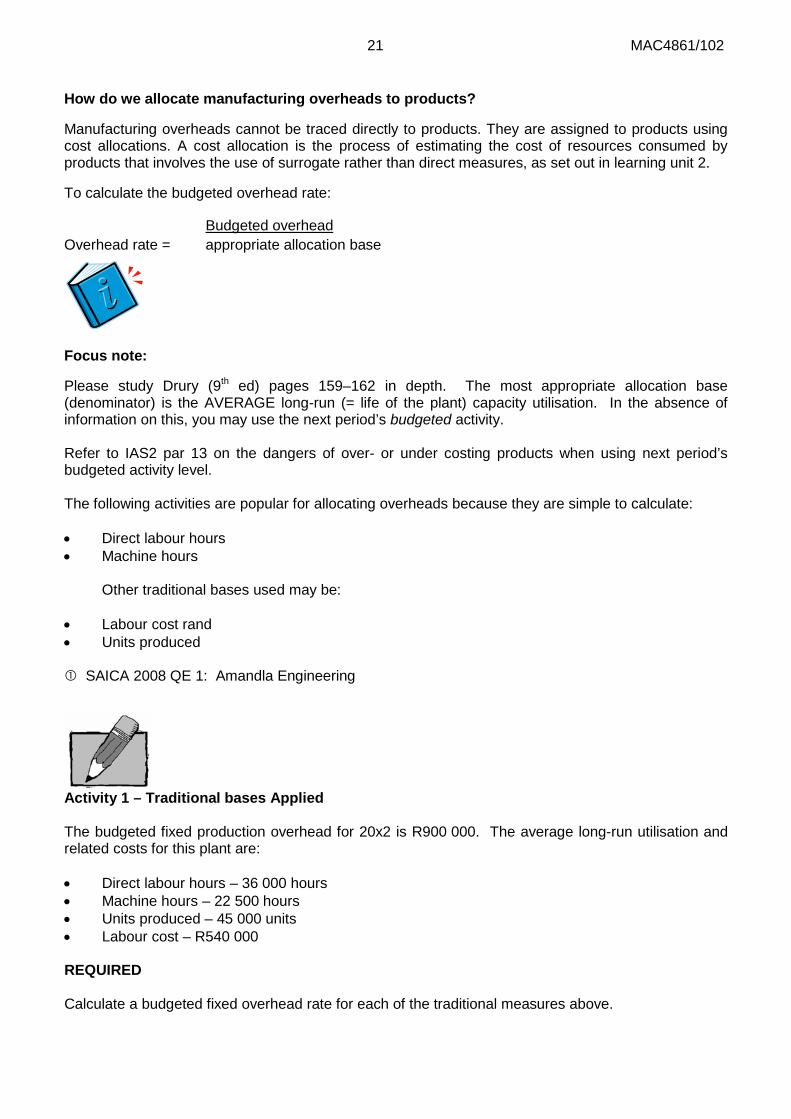
Please study Drury (9th ed) pages 159–162 in depth. The most appropriate allocation base (denominator) is the AVERAGE long-run (= life of the plant) capacity utilisation. In the absence of information on this, you may use the next period’s budgeted activity. Refer to IAS2 par 13 on the dangers of over- or under costing products when using next period’s budgeted activity level. The following activities are popular for allocating overheads because they are simple to calculate: • Direct labour hours • Machine hours
Other traditional bases used may be:
• Labour cost rand • Units produced SAICA 2008 QE 1: Amandla Engineering
Activity 1 – Traditional bases Applied The budgeted fixed production overhead for 20x2 is R900 000. The average long-run utilisation and related costs for this plant are: • Direct labour hours – 36 000 hours • Machine hours – 22 500 hours • Units produced – 45 000 units • Labour cost – R540 000
REQUIRED Calculate a budgeted fixed overhead rate for each of the traditional measures above.
22 MAC4861/102
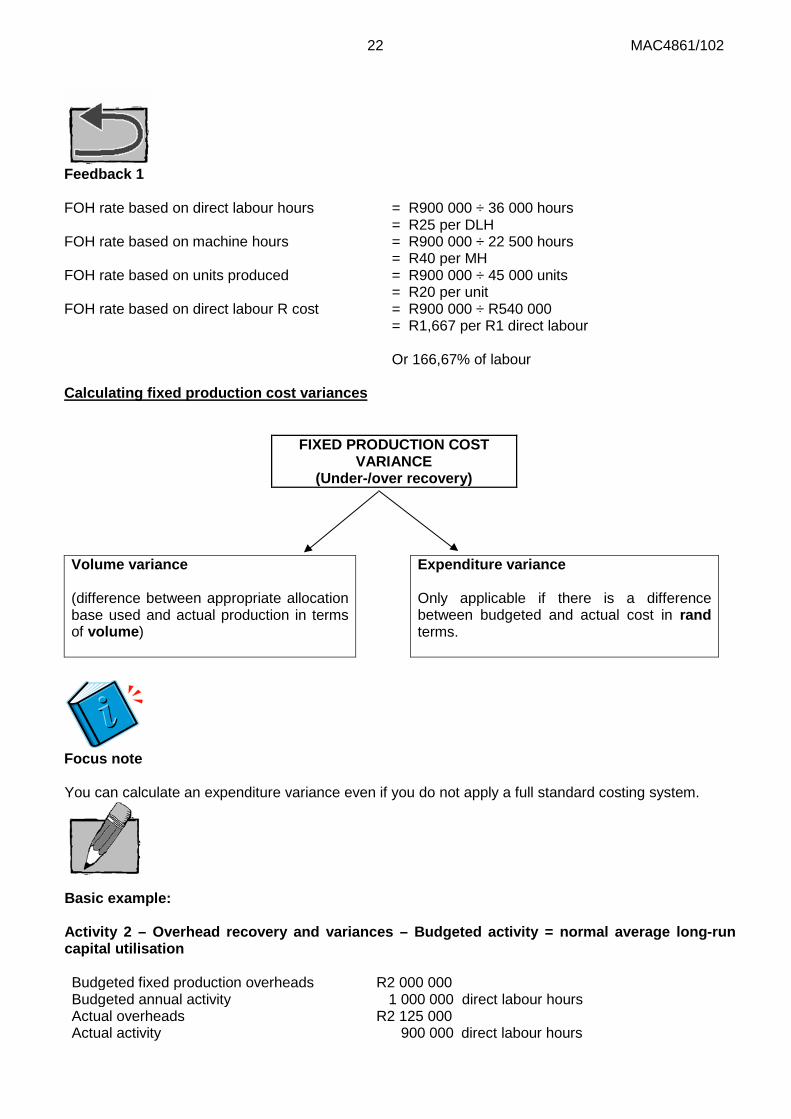
Feedback 1 FOH rate based on direct labour hours = R900 000 ÷ 36 000 hours
= R25 per DLH FOH rate based on machine hours = R900 000 ÷ 22 500 hours
= R40 per MH FOH rate based on units produced = R900 000 ÷ 45 000 units
= R20 per unit FOH rate based on direct labour R cost = R900 000 ÷ R540 000
= R1,667 per R1 direct labour Or 166,67% of labour
Calculating fixed production cost variances
FIXED PRODUCTION COST VARIANCE
(Under-/over recovery)
Volume variance (difference between appropriate allocation base used and actual production in terms of volume)
Expenditure variance Only applicable if there is a difference between budgeted and actual cost in rand terms.
Focus note You can calculate an expenditure variance even if you do not apply a full standard costing system.
Basic example: Activity 2 – Overhead recovery and variances – Budgeted activity = normal average long-run capital utilisation Budgeted fixed production overheads R2 000 000 Budgeted annual activity 1 000 000 direct labour hours Actual overheads R2 125 000 Actual activity 900 000 direct labour hours
23 MAC4861/102
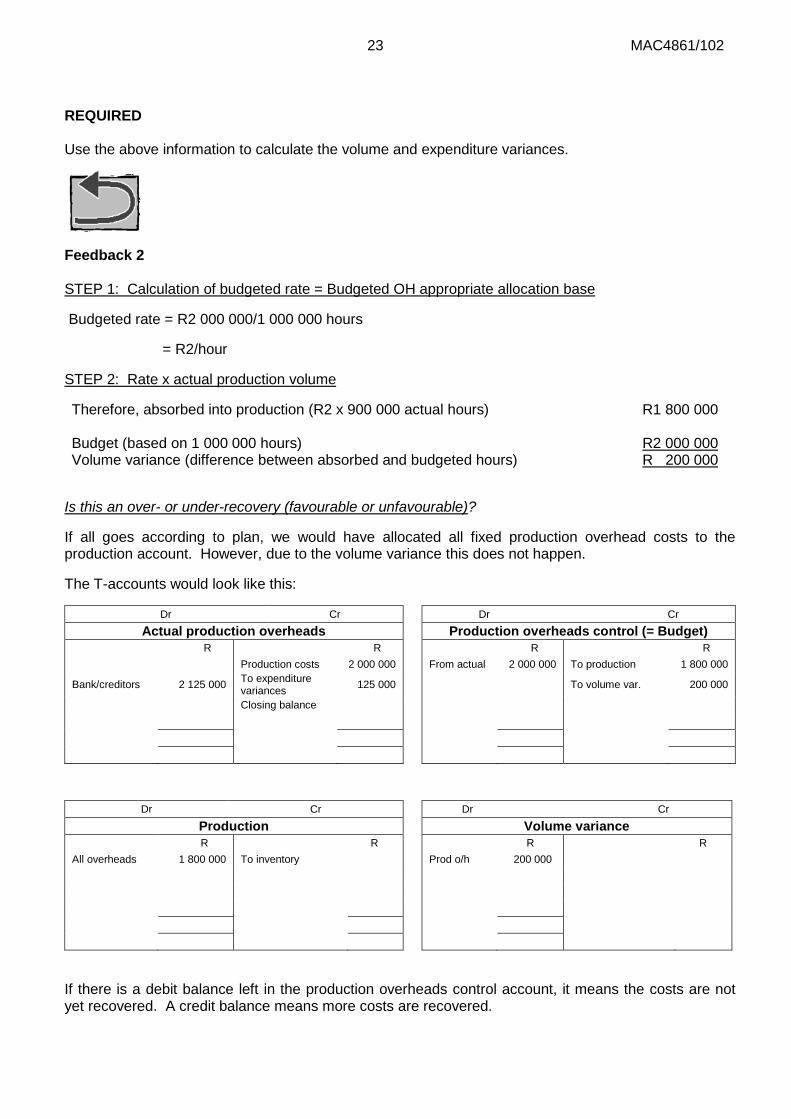
REQUIRED Use the above information to calculate the volume and expenditure variances.
Feedback 2
STEP 1: Calculation of budgeted rate = Budgeted OH appropriate allocation base
Budgeted rate = R2 000 000/1 000 000 hours
= R2/hour
STEP 2: Rate x actual production volume
Therefore, absorbed into production (R2 x 900 000 actual hours) R1 800 000
Budget (based on 1 000 000 hours) R2 000 000 Volume variance (difference between absorbed and budgeted hours) R 200 000
Is this an over- or under-recovery (favourable or unfavourable)?
If all goes according to plan, we would have allocated all fixed production overhead costs to the production account. However, due to the volume variance this does not happen.
The T-accounts would look like this:
Dr Cr Dr Cr Actual production overheads Production overheads control (= Budget)
R R R R Production costs 2 000 000 From actual 2 000 000 To production 1 800 000
Bank/creditors 2 125 000 To expenditure variances 125 000 To volume var. 200 000
Closing balance
Dr Cr Dr Cr
Production Volume variance R R R R
All overheads 1 800 000 To inventory Prod o/h 200 000
If there is a debit balance left in the production overheads control account, it means the costs are not yet recovered. A credit balance means more costs are recovered.
24 MAC4861/102
Therefore, I have an adverse volume variance of R200 000 (unfavourable). This is treated as a period cost, not a product cost, therefore the adverse volume variance should not be debited to production costs (expense account).
Expenditure variance
This is a separate calculation and is NOT concerned with the recovery of fixed overheads. Expenditure variance = Actual overhead expense – budgeted overhead expense Expenditure variance = R2 125 000 – R2 000 000 = R125 000 Unfavourable
This is treated as a period cost and should not be debited to production costs (expense account).
Activity 3 – Overhead recovery Use the same information as in activity 2, but now assume that: Actual annual activity 1 050 000 direct labour hours
REQUIRED Calculate the volume and expenditure variances.
Feedback 3
Charged to production (R2 x 1 050 000 actual hours) R 2 100 000 Budgeted overheads (Based on 1 000 000 hours) R 2 000 000 Volume variance R 100 000
This is a favourable volume variance and would usually be a credit or negative period “cost”. Refer to page 26 for the accounting treatment where this variance is “unusually” high.
Activity 4 – Overhead and volumes
The Rubber Company’s Cape Town factory budgeted that their 20x2 overhead would be R4 800 000. Their normal average long-run manufacturing level is 80 000 fan belts. The actual costs for 20x2 were R4 890 000 and 75 000 fan belts were manufactured.
25 MAC4861/102
REQUIRED Calculate the volume variance and explain how it will be treated. Note: Your budgeted production can equal actual and you would still (!) have a volume variance if: Budgeted activity greater than or less than average long-run activity is used in determining allocation rate!
Feedback 4
The fixed overhead rate is determined based on the normal average capacity level, in this case 80 000 units.
Budgeted overhead rate
= R4 800 000 ÷ 80 000 fan belts
= R60/fan belt Expenditure variance
Actual incurred R4 890 000 ∴ Budget R4 800 000 Variance: Expenditure
R90 000 Unfavourable
Volume variance
Manufactured units are less than the allocation base, there is thus an ‘under-recovery’ (less) of cost as each unit manufactured will receive the budgeted rate.
∴ ‘Under-allocation’: volume variance R 300 000
[80 000 units – 75 000 units] =(5 000 units x R60)
OR
Detailed disclosure: Budgeted R4 800 000 Allocated to production 4 500 000
Alternative: R4 800 000 – R4 500 000 R300 000 Volume variance
It appears as if there is a favourable variance (in rand terms), but you should consider the units manufactured, which are less than budget and therefore unfavourable. Under absorption costing the volume variance is unfavourable and must be treated as a period cost.
Please note that the above activities use overhead. If a question states that labour cost is FIXED, labour cost should be treated in exactly the same manner as overhead.
FOR MANAGEMENT ACCOUNTING PURPOSES YOU MUST SHOW THE EXPENDITURE VARIANCE AND THE VOLUME VARIANCE SEPARATELY ON THE SCI FOR ABSORPTION COSTING, BECAUSE THAT IS WHAT NEEDS TO BE MANAGED. DON’T JUST INCLUDE ACTUAL OVERHEADS EXPENSE.
26 MAC4861/102
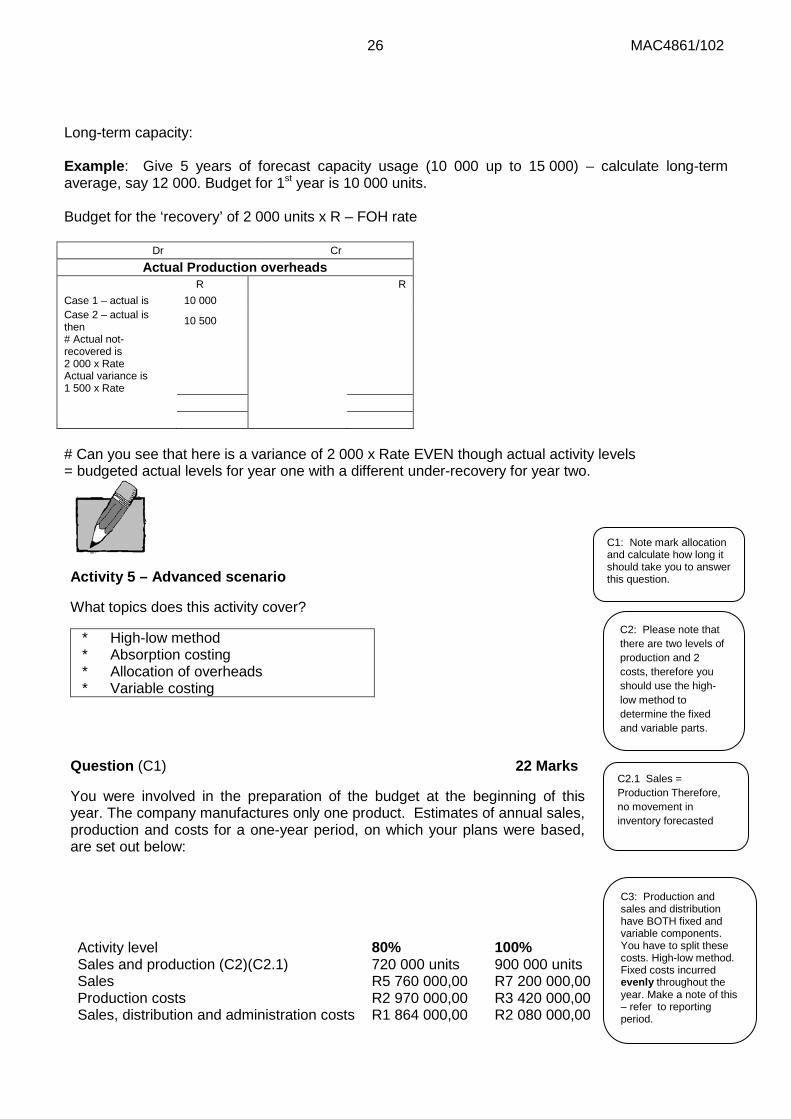
Long-term capacity: Example: Give 5 years of forecast capacity usage (10 000 up to 15 000) – calculate long-term average, say 12 000. Budget for 1st year is 10 000 units. Budget for the ‘recovery’ of 2 000 units x R – FOH rate
Dr Cr Actual Production overheads
R R Case 1 – actual is 10 000 Case 2 – actual is then 10 500
# Actual not-recovered is 2 000 x Rate Actual variance is 1 500 x Rate
# Can you see that here is a variance of 2 000 x Rate EVEN though actual activity levels = budgeted actual levels for year one with a different under-recovery for year two.
Activity 5 – Advanced scenario
What topics does this activity cover?
* High-low method * Absorption costing * Allocation of overheads * Variable costing
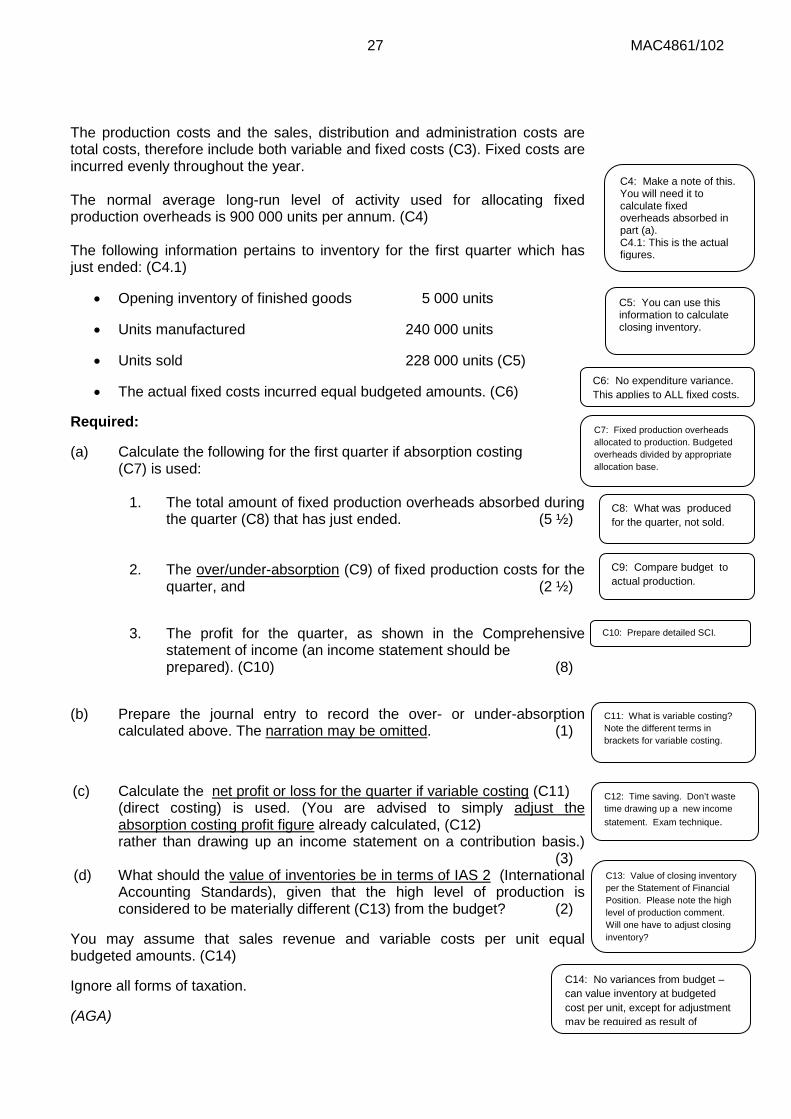
Question (C1) 22 Marks
You were involved in the preparation of the budget at the beginning of this year. The company manufactures only one product. Estimates of annual sales, production and costs for a one-year period, on which your plans were based, are set out below:
Activity level 80% 100% Sales and production (C2)(C2.1) 720 000 units 900 000 units Sales R5 760 000,00 R7 200 000,00 Production costs R2 970 000,00 R3 420 000,00 Sales, distribution and administration costs R1 864 000,00 R2 080 000,00
C1: Note mark allocation and calculate how long it should take you to answer this question.
C2: Please note that there are two levels of production and 2 costs, therefore you should use the high-low method to determine the fixed and variable parts.
C3: Production and sales and distribution have BOTH fixed and variable components. You have to split these costs. High-low method. Fixed costs incurred evenly throughout the year. Make a note of this – refer to reporting period.
C2.1 Sales = Production Therefore, no movement in inventory forecasted
27 MAC4861/102
The production costs and the sales, distribution and administration costs are total costs, therefore include both variable and fixed costs (C3). Fixed costs are incurred evenly throughout the year. The normal average long-run level of activity used for allocating fixed production overheads is 900 000 units per annum. (C4) The following information pertains to inventory for the first quarter which has just ended: (C4.1)
• Opening inventory of finished goods 5 000 units
• Units manufactured 240 000 units
• Units sold 228 000 units (C5)
• The actual fixed costs incurred equal budgeted amounts. (C6)
Required:
(a) Calculate the following for the first quarter if absorption costing (C7) is used:
1. The total amount of fixed production overheads absorbed during
the quarter (C8) that has just ended. (5 ½)
2. The over/under-absorption (C9) of fixed production costs for the quarter, and (2 ½)
3. The profit for the quarter, as shown in the Comprehensive
statement of income (an income statement should be prepared). (C10) (8)
(b) Prepare the journal entry to record the over- or under-absorption calculated above. The narration may be omitted. (1)
(c) Calculate the net profit or loss for the quarter if variable costing (C11) (direct costing) is used. (You are advised to simply adjust the absorption costing profit figure already calculated, (C12) rather than drawing up an income statement on a contribution basis.) (3)
(d) What should the value of inventories be in terms of IAS 2 (International Accounting Standards), given that the high level of production is considered to be materially different (C13) from the budget? (2)
You may assume that sales revenue and variable costs per unit equal budgeted amounts. (C14)
Ignore all forms of taxation.
(AGA)
C4: Make a note of this. You will need it to calculate fixed overheads absorbed in part (a). C4.1: This is the actual figures.
C5: You can use this information to calculate closing inventory.
C7: Fixed production overheads allocated to production. Budgeted overheads divided by appropriate allocation base.
C8: What was produced for the quarter, not sold.
C9: Compare budget to actual production.
C10: Prepare detailed SCI.
C11: What is variable costing? Note the different terms in brackets for variable costing.
C12: Time saving. Don’t waste time drawing up a new income statement. Exam technique.
C13: Value of closing inventory per the Statement of Financial Position. Please note the high level of production comment. Will one have to adjust closing inventory?
C6: No expenditure variance. This applies to ALL fixed costs.
C14: No variances from budget – can value inventory at budgeted cost per unit, except for adjustment may be required as result of
28 MAC4861/102
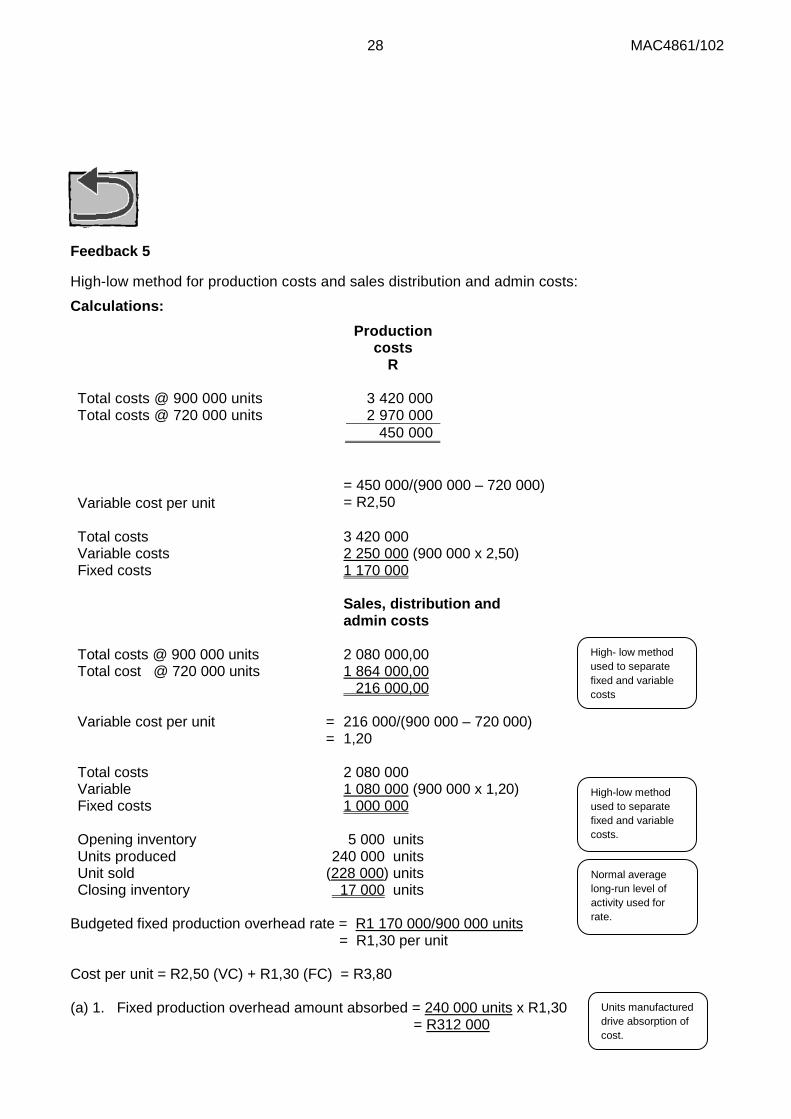
Feedback 5
High-low method for production costs and sales distribution and admin costs: Calculations:
Production costs
R
Total costs @ 900 000 units 3 420 000 Total costs @ 720 000 units 2 970 000
450 000
Variable cost per unit
= 450 000/(900 000 – 720 000) = R2,50
Total costs 3 420 000 Variable costs 2 250 000 (900 000 x 2,50) Fixed costs 1 170 000 Sales, distribution and
admin costs Total costs @ 900 000 units 2 080 000,00 Total cost @ 720 000 units 1 864 000,00 216 000,00 Variable cost per unit = 216 000/(900 000 – 720 000) = 1,20 Total costs 2 080 000 Variable 1 080 000 (900 000 x 1,20) Fixed costs 1 000 000
Opening inventory 5 000 units Units produced 240 000 units Unit sold (228 000) units Closing inventory 17 000 units
Budgeted fixed production overhead rate = R1 170 000/900 000 units = R1,30 per unit
Cost per unit = R2,50 (VC) + R1,30 (FC) = R3,80 (a) 1. Fixed production overhead amount absorbed = 240 000 units x R1,30
= R312 000
High- low method used to separate fixed and variable costs
Units manufactured drive absorption of cost.
High-low method used to separate fixed and variable costs.
Normal average long-run level of activity used for rate.
29 MAC4861/102
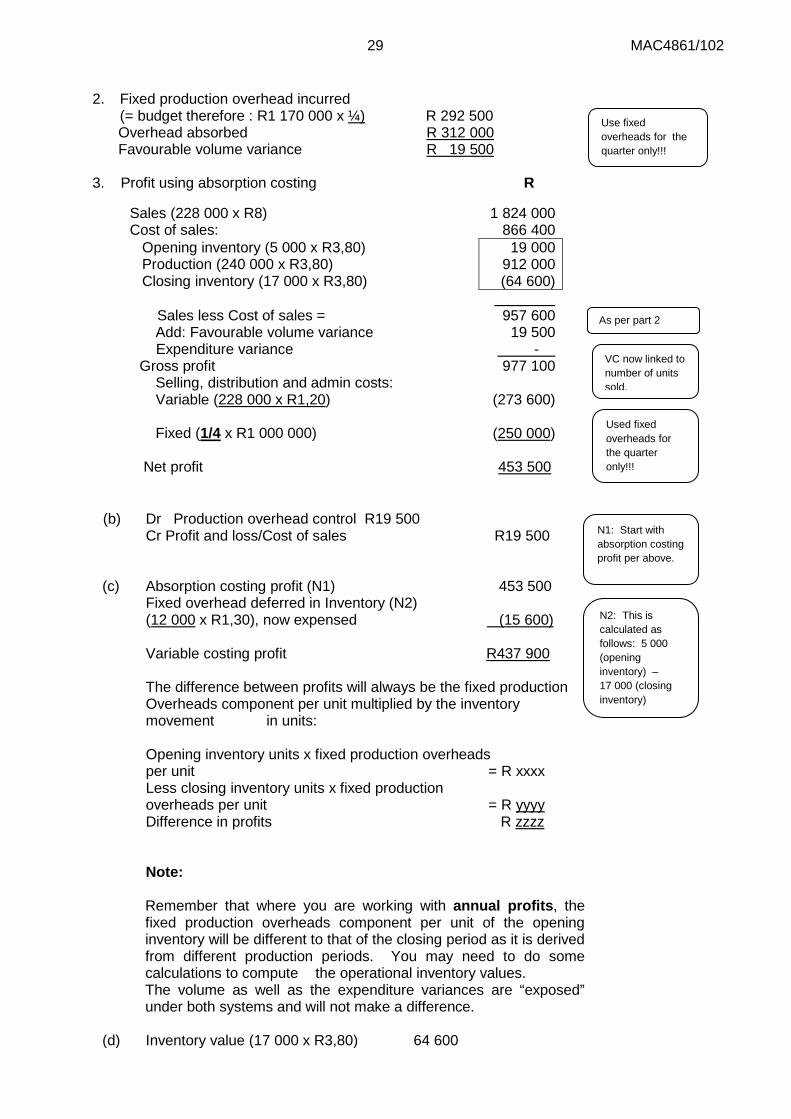
2. Fixed production overhead incurred
(= budget therefore : R1 170 000 x ¼) R 292 500 Overhead absorbed R 312 000 Favourable volume variance R 19 500
3. Profit using absorption costing R
Sales (228 000 x R8) 1 824 000 Cost of sales: 866 400 Opening inventory (5 000 x R3,80) Production (240 000 x R3,80) Closing inventory (17 000 x R3,80)
19 000 912 000 (64 600)
Sales less Cost of sales =
Add: Favourable volume variance Expenditure variance Gross profit
Selling, distribution and admin costs: Variable (228 000 x R1,20)
Fixed (1/4 x R1 000 000)
957 600
19 500 - 977 100
(273 600)
(250 000)
Net profit 453 500
(b) Dr Production overhead control R19 500 Cr Profit and loss/Cost of sales R19 500
(c) Absorption costing profit (N1) 453 500 Fixed overhead deferred in Inventory (N2) (12 000 x R1,30), now expensed (15 600) Variable costing profit R437 900
The difference between profits will always be the fixed production Overheads component per unit multiplied by the inventory movement in units: Opening inventory units x fixed production overheads per unit = R xxxx Less closing inventory units x fixed production overheads per unit = R yyyy Difference in profits R zzzz Note:
Remember that where you are working with annual profits, the fixed production overheads component per unit of the opening inventory will be different to that of the closing period as it is derived from different production periods. You may need to do some calculations to compute the operational inventory values. The volume as well as the expenditure variances are “exposed” under both systems and will not make a difference.
(d) Inventory value (17 000 x R3,80) 64 600
Use fixed overheads for the quarter only!!!
N1: Start with absorption costing profit per above.
N2: This is calculated as follows: 5 000 (opening inventory) – 17 000 (closing inventory)
Used fixed overheads for the quarter only!!!
As per part 2
VC now linked to number of units sold.
30 MAC4861/102
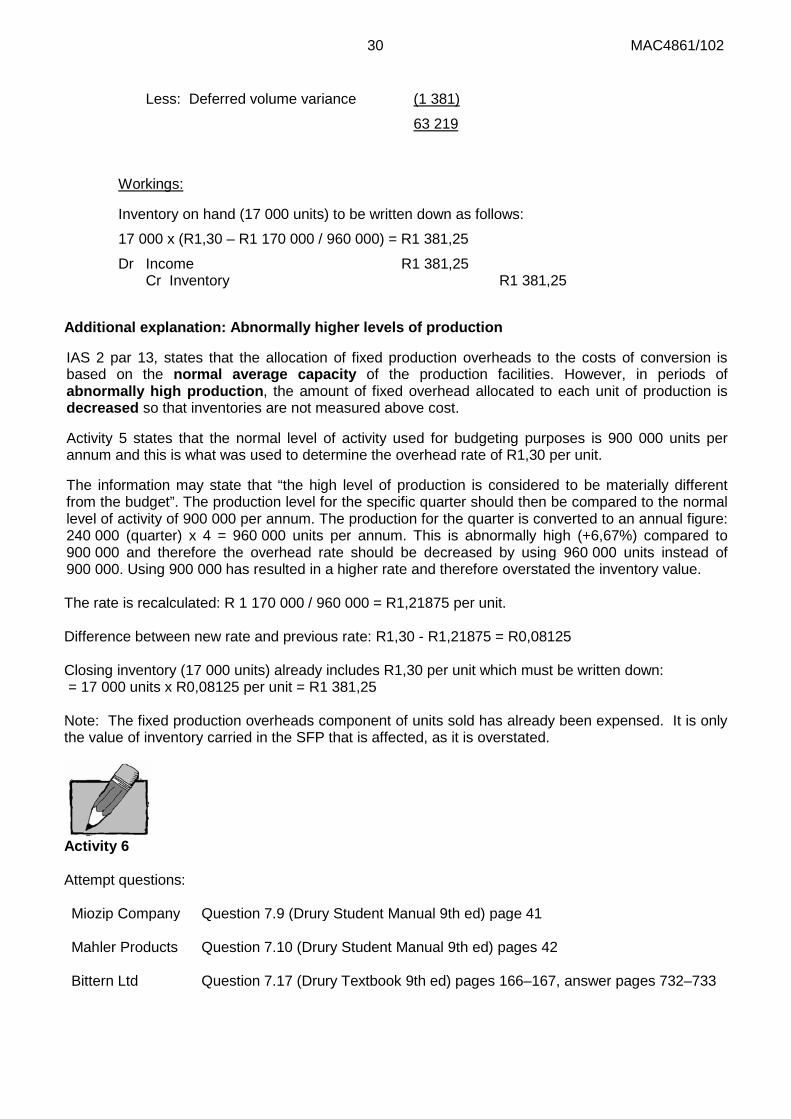
Less: Deferred volume variance (1 381)
63 219
Workings:
Inventory on hand (17 000 units) to be written down as follows:
17 000 x (R1,30 – R1 170 000 / 960 000) = R1 381,25
Dr Income R1 381,25 Cr Inventory R1 381,25
Additional explanation: Abnormally higher levels of production
IAS 2 par 13, states that the allocation of fixed production overheads to the costs of conversion is based on the normal average capacity of the production facilities. However, in periods of abnormally high production, the amount of fixed overhead allocated to each unit of production is decreased so that inventories are not measured above cost.
Activity 5 states that the normal level of activity used for budgeting purposes is 900 000 units per annum and this is what was used to determine the overhead rate of R1,30 per unit.
The information may state that “the high level of production is considered to be materially different from the budget”. The production level for the specific quarter should then be compared to the normal level of activity of 900 000 per annum. The production for the quarter is converted to an annual figure: 240 000 (quarter) x 4 = 960 000 units per annum. This is abnormally high (+6,67%) compared to 900 000 and therefore the overhead rate should be decreased by using 960 000 units instead of 900 000. Using 900 000 has resulted in a higher rate and therefore overstated the inventory value. The rate is recalculated: R 1 170 000 / 960 000 = R1,21875 per unit. Difference between new rate and previous rate: R1,30 - R1,21875 = R0,08125 Closing inventory (17 000 units) already includes R1,30 per unit which must be written down: = 17 000 units x R0,08125 per unit = R1 381,25 Note: The fixed production overheads component of units sold has already been expensed. It is only the value of inventory carried in the SFP that is affected, as it is overstated.
Activity 6 Attempt questions: Miozip Company Question 7.9 (Drury Student Manual 9th ed) page 41 Mahler Products Question 7.10 (Drury Student Manual 9th ed) pages 42 Bittern Ltd Question 7.17 (Drury Textbook 9th ed) pages 166–167, answer pages 732–733
31 MAC4861/102
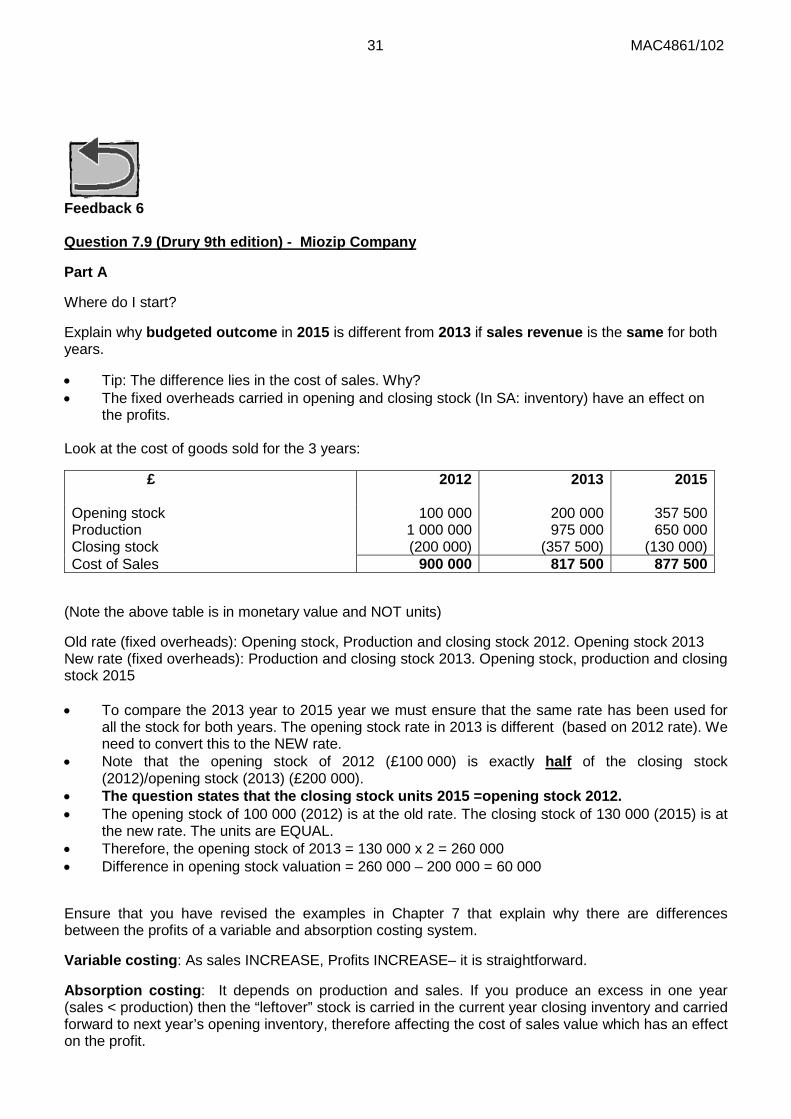
Feedback 6 Question 7.9 (Drury 9th edition) - Miozip Company
Part A
Where do I start?
Explain why budgeted outcome in 2015 is different from 2013 if sales revenue is the same for both years.
• Tip: The difference lies in the cost of sales. Why? • The fixed overheads carried in opening and closing stock (In SA: inventory) have an effect on
the profits.
Look at the cost of goods sold for the 3 years:
£ 2012 2013
2015
Opening stock 100 000 200 000 357 500 Production 1 000 000 975 000 650 000 Closing stock (200 000) (357 500) (130 000) Cost of Sales 900 000 817 500 877 500
(Note the above table is in monetary value and NOT units)
Old rate (fixed overheads): Opening stock, Production and closing stock 2012. Opening stock 2013 New rate (fixed overheads): Production and closing stock 2013. Opening stock, production and closing stock 2015 • To compare the 2013 year to 2015 year we must ensure that the same rate has been used for
all the stock for both years. The opening stock rate in 2013 is different (based on 2012 rate). We need to convert this to the NEW rate.
• Note that the opening stock of 2012 (£100 000) is exactly half of the closing stock (2012)/opening stock (2013) (£200 000).
• The question states that the closing stock units 2015 =opening stock 2012. • The opening stock of 100 000 (2012) is at the old rate. The closing stock of 130 000 (2015) is at
the new rate. The units are EQUAL. • Therefore, the opening stock of 2013 = 130 000 x 2 = 260 000 • Difference in opening stock valuation = 260 000 – 200 000 = 60 000
Ensure that you have revised the examples in Chapter 7 that explain why there are differences between the profits of a variable and absorption costing system.
Variable costing: As sales INCREASE, Profits INCREASE– it is straightforward.
Absorption costing: It depends on production and sales. If you produce an excess in one year (sales < production) then the “leftover” stock is carried in the current year closing inventory and carried forward to next year’s opening inventory, therefore affecting the cost of sales value which has an effect on the profit.
32 MAC4861/102
• Additional non allocation = 300 000 – 150 000 = 150 000
Part B
You are given the total production cost. You will be able to calculate what amount of fixed cost was charged to production from the information given in the question. Using this information you will be able to ascertain which portion of your costs are variable. Total costs (given) – Fixed costs (calculated) = Variable costs.
Question 7.10 (Drury 9th edition) – Mahler Products
Part A
The question asks you to "explain the situation in the last paragraph”. The last paragraph basically tells you that the sales revenue has increased in the second half of the year, so it was assumed that the profits were increased. However, the profits have decreased in the second half. Explain why this has happened.
What information has been given in the scenario?
• 2 departments: A and B • Each department makes one product • Cost per unit is given? What costs are included in the cost of each product? Material, Labour,
Variable overheads and fixed overheads, therefore the SCI (Statement of Changes in Income and Expense) has been prepared on an absorption costing basis.
• 6-monthly Profit and loss accounts for Departments A and B- 1 July 20XX to 30 June 20XX.
From the information given above it is clear what the problem is. The SCIE is prepared on an absorption costing basis and therefore the fixed overhead expenses carried in opening and closing stock is distorting the actual cost of sales which affects the final profit figure.
The question also asks you to illustrate the answer with appropriate supporting calculations.
What calculations should I show to prove that the absorption costing system distorts the profits? What is an ideal costing system? Variable costing. This is because profit varies directly with sales. As sales increase, profit increases.
Time management: Don’t prepare an entire SCIE. What is the difference between a variable costing system and absorption costing system? Fixed overheads are included in opening and closing stock in the cost of sales of the absorption costing system. Calculate how much fixed overheads have been included in opening and closing stock and recalculate what your profit would have been if the effect of fixed overheads was excluded.
Tip: You are given the total opening and closing stock (in pounds). You know what is the cost per unit (given in the scenario), therefore you will be able to calculate the units for opening and closing stock.
Reflection
What should I learn from 7.9 and 7.10?
In a variable costing system, fixed overheads are a period cost and are thus charged directly against profits
In an absorption costing system, fixed overheads are a product cost and are therefore included in the valuation of stock (part of cost of sales). This means that cost of sales and thus profits will be affected by the changes in stocks. Therefore the stock movements can have an unfavourable effect on profits even though sales/revenue increases.
33 MAC4861/102
Question 7.17 Drury 9th ed – Preparation of variable and absorption costing statements and an explanation of the differences in profits – Bittern Ltd
What information has been given in the scenario?
• Variable costs • Semi-variable costs (high-low?) • Fixed overheads (What do they want me to do with this?)
The company uses a variable/marginal costing system? Management wants to compare this to an absorption costing system. How is an SCI prepared on a variable costing basis?
What does it mean to prepare an SCI on an absorption costing basis? What should I keep in mind?
• The fixed overheads are included in the cost of the product • To assign overheads I have to calculate and overhead rate: Overhead rate = Budgeted
overheads (rand) / Allocation basis (labour hrs, machine hrs, units) • Expenditure variance? Is there an expenditure variance? There will be an expenditure variance
if there is a difference between budgeted and actual overheads. Required
A: The following information was obtained from the required section:
• Calculate profit for a 3 year period • Normal production level –1 000 units – will I use this to allocate my overheads?
• 3 different scenarios : 1. Stable Production, Sales and Inventory
2. Fluctuating Production and Inventory 3. Fluctuating Sales and Inventory
• The scenarios given above provide guidance on how your answer should be structured. How will your calculations look in each of the 3 scenarios? Where do I start?
• Sort out your costs per unit. What is my product cost? What is the variable product cost? What is the fixed product cost? (Remember that you will have to allocate the fixed overhead cost to each product using an overhead rate.)
• What are my units? • Note: there is no additional or lower allocation of fixed costs in the absorption costing SCI in
part i) of the solution. • Guidance for the absorption costing SCI in part ii) of the solution:
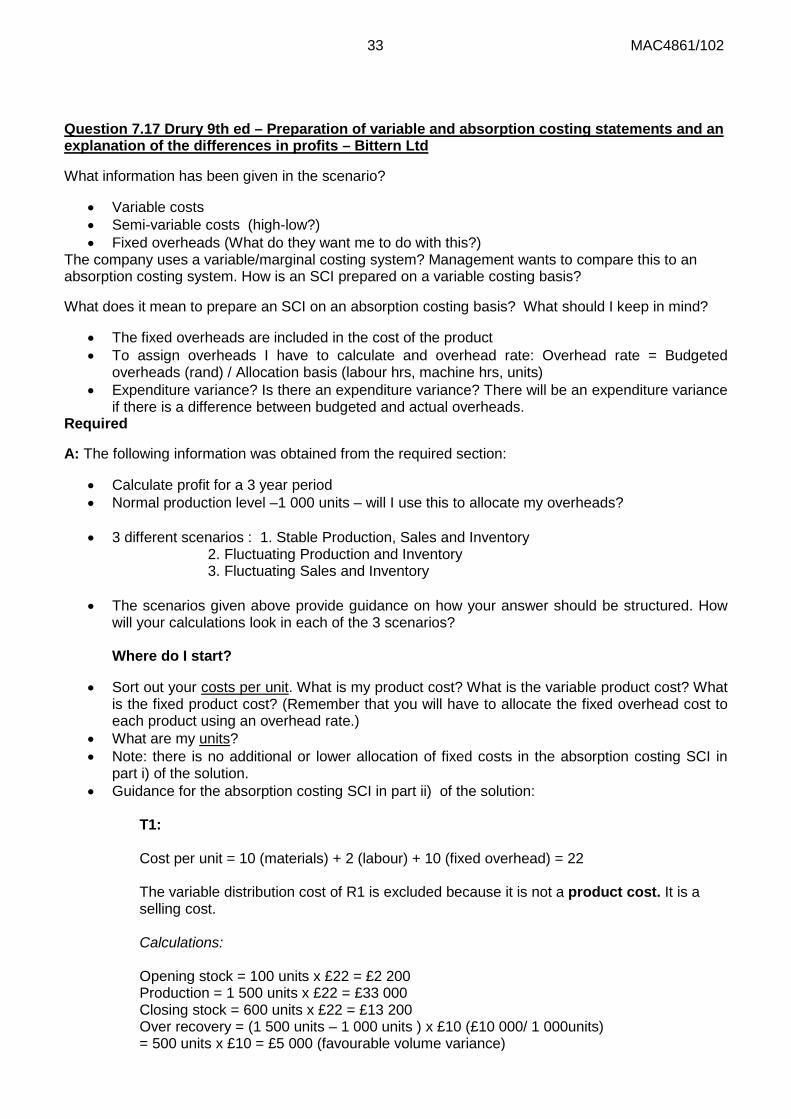
T1: Cost per unit = 10 (materials) + 2 (labour) + 10 (fixed overhead) = 22 The variable distribution cost of R1 is excluded because it is not a product cost. It is a selling cost. Calculations: Opening stock = 100 units x £22 = £2 200 Production = 1 500 units x £22 = £33 000 Closing stock = 600 units x £22 = £13 200 Over recovery = (1 500 units – 1 000 units ) x £10 (£10 000/ 1 000units) = 500 units x £10 = £5 000 (favourable volume variance)
34 MAC4861/102
T2:
Under recovery = (800 units – 1 000 units ) x £ 10 = £ 2 000 (adverse volume variance)
Note: there is no expenditure variance so the over or under recovery consists of only the volume variance.
Compare your answers to the solutions on the pages as indicated above. Where you have gone wrong, reflect upon why it has happened, as that will improve the learning process. Is there anything specific/strange/unusual in the solutions that you want to point out?
Summary In this learning unit we covered the calculation of an appropriate fixed overhead rate and the preparation of the SCI using the absorption and variable costing methods.
Self-assessment activity
Before you move on to the next learning unit please ensure that you understand and can apply the following concepts:
Topic
Yes/No
1. Difference between variable and absorption costing 2. Definition of manufacturing overheads 3. Treatment of fixed labour costs 4. Calculation of appropriate fixed production overhead allocation rate 5. Proper accounting treatment of volume and expenditure variances 6. Present SCI on the variable and absorption costing basis 7. Reconcile profits derived from different costing bases 8. Explain why profits differ on variable and absorption costing basis.
9. Calculation of overheads/labour allocated and volume variances 10. Calculation of the expenditure variance.
35 MAC4861/102
LEARNING UNIT 1.3 Activity-based costing (ABC) and related concepts
Prior learning
This course assumes that students have already mastered the work equivalent to that presented in Unisa’s preceding undergraduate degree. Please ensure that you are up to date with the prior learning for the topic of activity-based costing. If not, please refer to your undergraduate study material and revise the following indicated pages of the textbook, namely Drury, using the page numbers below:
Prior learning Drury 9th ed
Before studying this topic, you should be able to: • Describe the differences between activity-
based and traditional costing systems. • Explain why traditional costing systems can
provide misleading information for decision-making.
• Identify and explain each of the four stages involved designing ABC systems.
• Apply an activity-based costing approach to costing information. • Describe activity-based budgeting.
Applicable references: • Drury: Chapter 11:
Activity-based costing. Pages 257–274
LEAVE OUT: ABC IN SERVICE ORGANISATIONS
● Drury: Chapter 3: Illustration of the two stage process for an
ABC system. Pages 60–64 • Drury: Chapter 15: • Activity-based budgeting. Pages 388–390
Critical topics: • Activity-based costing and cost drivers • ABC profitability analysis • Activity-based budgeting and activity-based management (resource consumption
models)
Introduction
Even though activity-based costing (ABC) is presented as a separate topic in management accounting, it is in reality an extension of the previous topic: ‘absorption costing’. The reason is that ABC is quite simply a different absorption costing method for the allocation of fixed manufacturing overheads to products. The only difference between ABC and the traditional methods is that ABC makes use of different activities as its allocation base, whereas the traditional methods made use of volume-related bases, such as machine or labour hours, for the allocation of overheads to products.
36 MAC4861/102
Why do we use ABC?
ABC is used as it may lead to more accurate pricing of products, which will therefore influence all decision-making with regard to those products, e.g. whether or not to withdraw a product or what price to charge for it.
Traditionally, overhead costs were small in comparison to directly measurable and traceable costs, such as material costs, and the method of allocation of those costs to products was therefore largely unimportant. However, in the advanced manufacturing environment that companies are currently trading in, fixed overhead costs have escalated dramatically, and now make up a substantial portion of the cost of a product. It is therefore becoming increasingly important to allocate the cost of the overheads correctly to the products involved, to ensure the continued success and competitiveness of a firm.
ABC is also useful in the costing of cost objects separate from products. When ABC is Applied to support activity hierarchies, costs for diverse cost objects such as a whole product line a production plant, a customer, customer groups (geographic area) etc. can be computed. This is important for analyses of profitability of the diverse cost objects in support of management’s decisions regarding allocation (or withdrawing) of resources. ABC and its related concepts are therefore a very handy arrangement tool in optimising the fixed production and other support activity infrastructure of an entity.
How to attempt an ABC question What information should you be looking for?
• STEP 1: ABC calculation questions often ask a student to compare an ABC system with an existing method of costing products. You should thus separate the information for the existing method of costing and the ABC method.
• STEP 2: Existing method – the company could, for example, be using a traditional absorption costing method or direct/variable costing. You have to ascertain what the existing method of costing is as this will be the first calculation. Every question is different because every company is different.
• STEP 3: ABC – Identify the activities and their relevant cost drivers and decide which cost driver matches a specific overhead cost. Calculate the cost per activity using the cost drivers and then allocate costs to products/cost objects based on their usage of the activity.
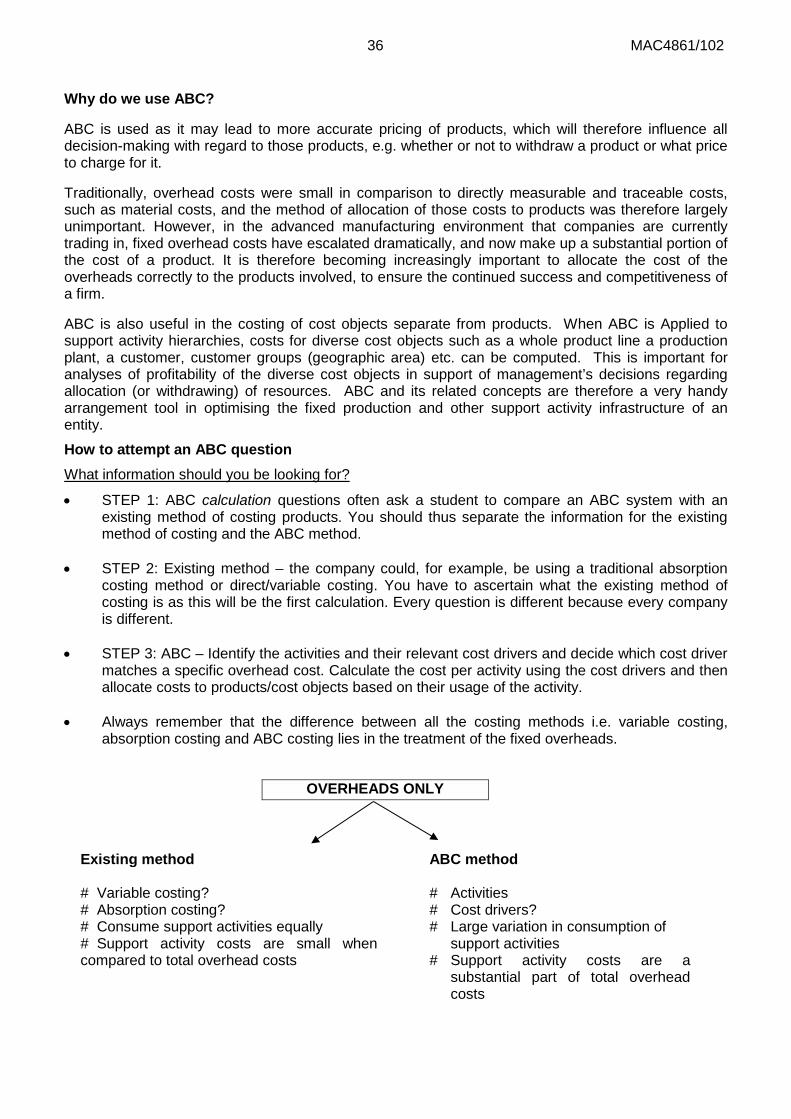
• Always remember that the difference between all the costing methods i.e. variable costing, absorption costing and ABC costing lies in the treatment of the fixed overheads.
OVERHEADS ONLY
Existing method
ABC method
# Variable costing? # Absorption costing?
# Activities # Cost drivers?
# Consume support activities equally # Support activity costs are small when compared to total overhead costs
# Large variation in consumption of support activities # Support activity costs are a substantial part of total overhead costs
37 MAC4861/102
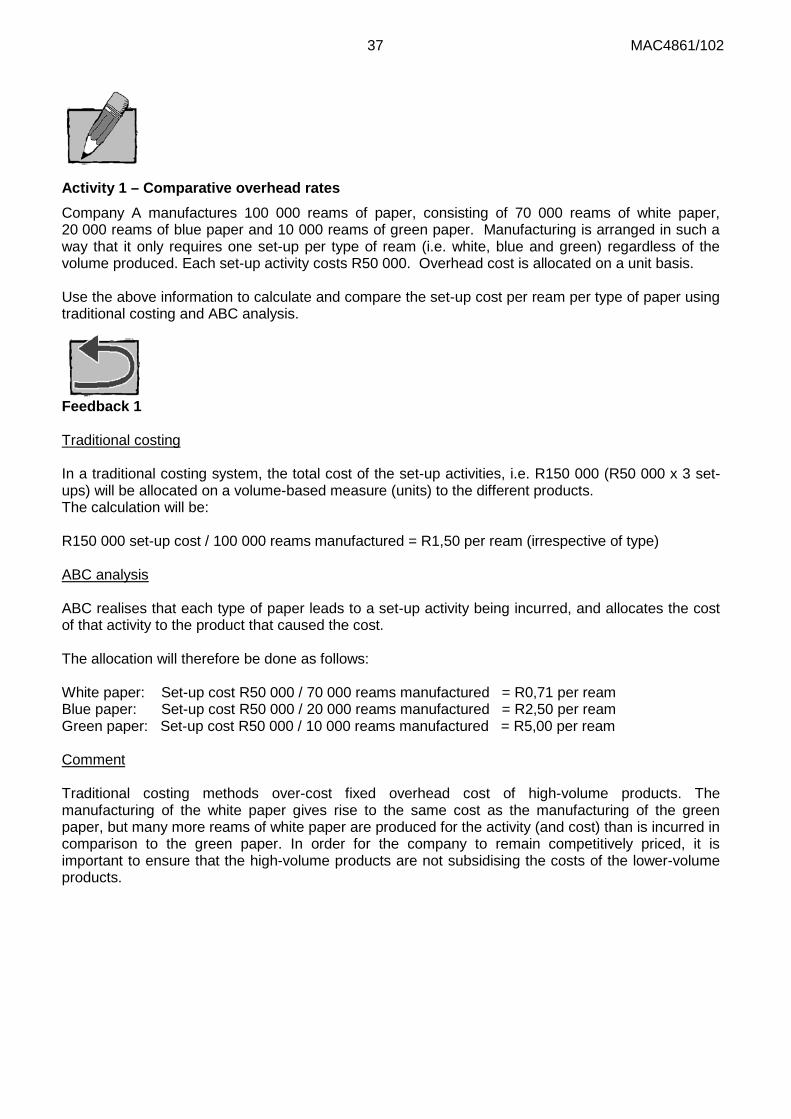
Activity 1 – Comparative overhead rates Company A manufactures 100 000 reams of paper, consisting of 70 000 reams of white paper, 20 000 reams of blue paper and 10 000 reams of green paper. Manufacturing is arranged in such a way that it only requires one set-up per type of ream (i.e. white, blue and green) regardless of the volume produced. Each set-up activity costs R50 000. Overhead cost is allocated on a unit basis. Use the above information to calculate and compare the set-up cost per ream per type of paper using traditional costing and ABC analysis.
Feedback 1 Traditional costing In a traditional costing system, the total cost of the set-up activities, i.e. R150 000 (R50 000 x 3 set-ups) will be allocated on a volume-based measure (units) to the different products. The calculation will be: R150 000 set-up cost / 100 000 reams manufactured = R1,50 per ream (irrespective of type) ABC analysis ABC realises that each type of paper leads to a set-up activity being incurred, and allocates the cost of that activity to the product that caused the cost. The allocation will therefore be done as follows: White paper: Set-up cost R50 000 / 70 000 reams manufactured = R0,71 per ream Blue paper: Set-up cost R50 000 / 20 000 reams manufactured = R2,50 per ream Green paper: Set-up cost R50 000 / 10 000 reams manufactured = R5,00 per ream Comment Traditional costing methods over-cost fixed overhead cost of high-volume products. The manufacturing of the white paper gives rise to the same cost as the manufacturing of the green paper, but many more reams of white paper are produced for the activity (and cost) than is incurred in comparison to the green paper. In order for the company to remain competitively priced, it is important to ensure that the high-volume products are not subsidising the costs of the lower-volume products.
38 MAC4861/102
Activity 2
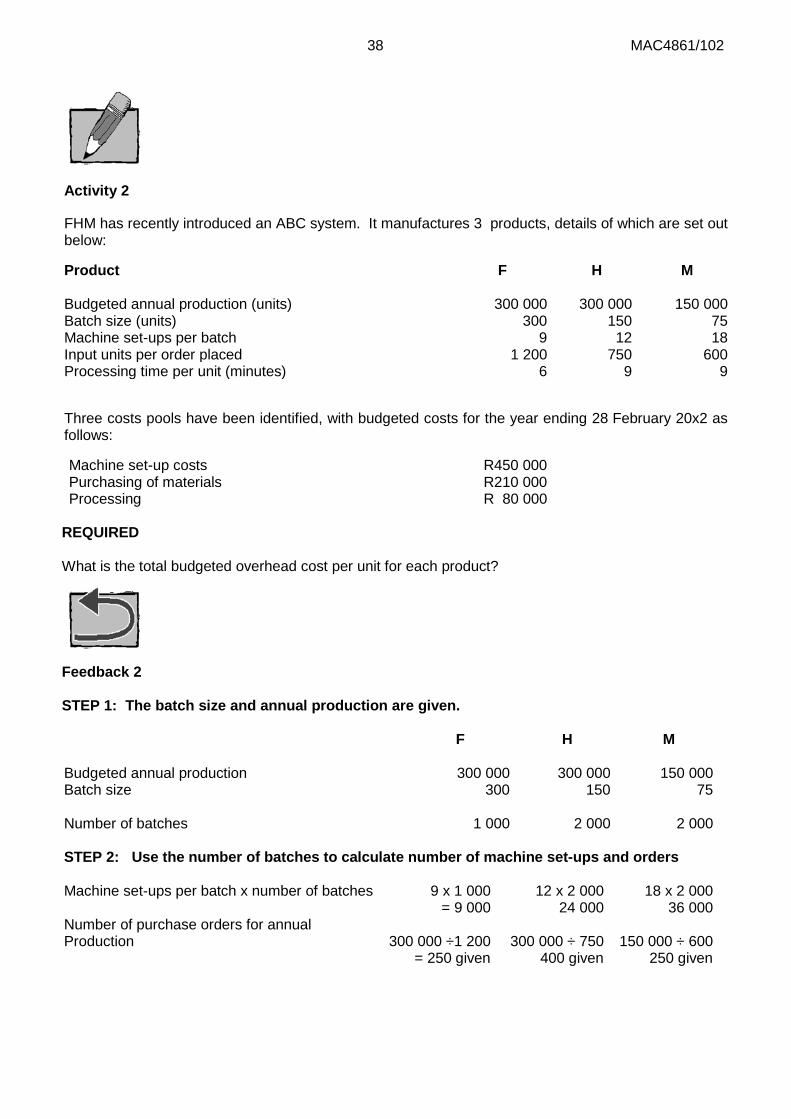
FHM has recently introduced an ABC system. It manufactures 3 products, details of which are set out below:
Product F H M Budgeted annual production (units) 300 000 300 000 150 000 Batch size (units) 300 150 75 Machine set-ups per batch 9 12 18 Input units per order placed 1 200 750 600 Processing time per unit (minutes) 6 9 9
Three costs pools have been identified, with budgeted costs for the year ending 28 February 20x2 as follows:
Machine set-up costs R450 000 Purchasing of materials R210 000 Processing R 80 000
REQUIRED What is the total budgeted overhead cost per unit for each product?
Feedback 2 STEP 1: The batch size and annual production are given. F H M
Budgeted annual production 300 000 300 000 150 000 Batch size 300 150 75 Number of batches 1 000 2 000 2 000 STEP 2: Use the number of batches to calculate number of machine set-ups and orders Machine set-ups per batch x number of batches 9 x 1 000 12 x 2 000 18 x 2 000
= 9 000 24 000 36 000 Number of purchase orders for annual Production
300 000 ÷1 200
= 250 given
300 000 ÷ 750
400 given
150 000 ÷ 600
250 given
39 MAC4861/102
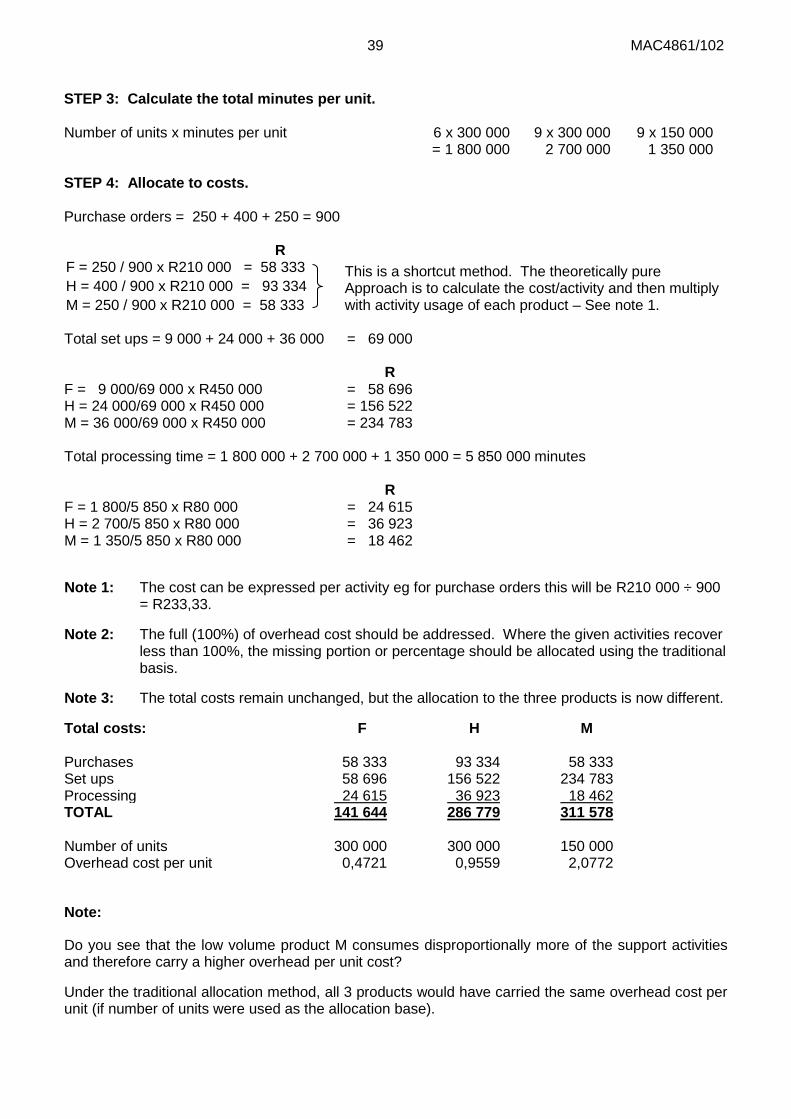
STEP 3: Calculate the total minutes per unit. Number of units x minutes per unit 6 x 300 000 9 x 300 000 9 x 150 000 = 1 800 000 2 700 000 1 350 000 STEP 4: Allocate to costs. Purchase orders = 250 + 400 + 250 = 900
R F = 250 / 900 x R210 000 = 58 333 This is a shortcut method. The theoretically pure
Approach is to calculate the cost/activity and then multiply with activity usage of each product – See note 1.
H = 400 / 900 x R210 000 = 93 334 M = 250 / 900 x R210 000 = 58 333 Total set ups = 9 000 + 24 000 + 36 000 = 69 000 R F = 9 000/69 000 x R450 000 = 58 696 H = 24 000/69 000 x R450 000 = 156 522 M = 36 000/69 000 x R450 000 = 234 783 Total processing time = 1 800 000 + 2 700 000 + 1 350 000 = 5 850 000 minutes R F = 1 800/5 850 x R80 000 = 24 615 H = 2 700/5 850 x R80 000 = 36 923 M = 1 350/5 850 x R80 000 = 18 462
Note 1: The cost can be expressed per activity eg for purchase orders this will be R210 000 ÷ 900 = R233,33.
Note 2: The full (100%) of overhead cost should be addressed. Where the given activities recover less than 100%, the missing portion or percentage should be allocated using the traditional basis.
Note 3: The total costs remain unchanged, but the allocation to the three products is now different.
Total costs: F
H M
Purchases 58 333 93 334 58 333 Set ups 58 696 156 522 234 783 Processing 24 615 36 923 18 462 TOTAL 141 644 286 779 311 578 Number of units 300 000 300 000 150 000 Overhead cost per unit 0,4721 0,9559 2,0772
Note:
Do you see that the low volume product M consumes disproportionally more of the support activities and therefore carry a higher overhead per unit cost?
Under the traditional allocation method, all 3 products would have carried the same overhead cost per unit (if number of units were used as the allocation base).
40 MAC4861/102
Activity-based budgeting (ABB) (pages 388–390: Drury 9th ed)
Activity-based budgeting is a logical progression from activity-based costing and management. The following are the approaches to or benefits gained by using activity-based budgeting and conventional budgeting:
1. ABB focuses on the appropriate value chain necessary for the organisation to meet its strategic needs.
2. The forecast workload is specifically determined from a customer’s perspective rather than from
an organisational constraint perspective. 3. Conventional budgeting normally follows the convention of budgeting for cost elements (expense
items) within cost centres or departments and “rolling” these up (or consolidating them) into organisational budgets. ABB questions the existence of each process and each activity in requiring it to be classified as value-adding or not. The ABB may be the trigger to start business process redesign.
4. Conventional budgets classify costs primarily between fixed and variable costs. The
classification of cost into the activity levels of unit, batch, product, process or facility variable costs provides a new insight into cost behaviour.
5. ABB requires the same detailed level of understanding of the process and product structures
that a proper ABC & M system would require. Conventional budgets usually do not require this type of detailed analysis.
6. ABB specifically focuses on the customer, marketing and distribution channels as cost objects. 7. ABB focuses on those elements of a business that may give it a competitive advantage. Benchmarking is normally an integral part of ABB. 8. ABB specifically focuses on support costs and their relationships to primary activities. 9. One of the strongest advantages of a conventional ABC system is its preoccupation with non-
financial information whereas ABB focuses primarily on the requisite activities to operate an effective organisation.
10. When an ABB system is linked to a quality management system, a specific focus on wastage can be incorporated into the budgeting process. Activity-based management (ABM)
Study Drury 9th ed, pages 567–571.
41 MAC4861/102
Activity 3 – Comparative methods and product profitability Benco Limited manufactures two types of 'Twizzle' standard and deluxe. Details of the two products are given below.
Standard
Deluxe
Annual sales – units 12 000 12 000 Selling price per unit R65 R87 Batch size – units 1 000 50 Labour time per unit – hours 2 2,5 Labour rate per hour R8 R8 Material costs per unit R22 R32 Special parts per unit 1 4 Set-ups per batch 1 3 Number of sales invoices issued per year 50 240
In recent months Benco Limited has been trying to persuade customers who buy the standard type to purchase the deluxe version instead. An analysis of overhead costs for Benco Limited has provided the following information.
Overhead analysis R Cost driver
Set-up costs 73 200 number of set-ups Special part handling costs 60 000 number of special parts Customer invoicing costs 29 000 number of invoices Material handling costs 63 000 number of batches Other overheads 108 000 labour hours
REQUIRED Marks (a) Calculate the profit per unit and the return on sales for standard and deluxe Twizzles
using: (i) traditional labour-based absorption of overheads (ii) activity-based costing methods
(10)
(b) Write a brief report to the management of Benco that (i) recommends managerial action in the light of the information calculated in (a)
above (ii) explains how activity-based techniques can be used to improve performance
(10)
Note: Both manufacturing overhead and sales overhead are incorporated into this activity.
42 MAC4861/102
Feedback 3 (a) Calculation of labour-based costs and activity-based costs
The layout of this answer follows the pattern of a spreadsheet. You may choose not to follow this format.
Overheads R Drivers Total
Driver Volume
Driver Rate
R
Std volume
Deluxe volume
R for Std
R for Deluxe
Set-up 73 200 Set-ups 732 100 12 720 1 200 72 000 Special part handling
60 000
Special parts
60 000
1
12 000
48 000
12 000
48 000
Customer invoices
29 000
Invoices
290
100
50
240
5 000
24 000
Material handling
63 000
Batches
252
250
12
240
3 000
60 000
Other overheads
108 000
Hours
54 000
2
24 000
30 000
48 000
60 000
Total cost 333 200 69 200 264 000 Unit cost (÷ 12 000 units) 5,77 22,00
The driver volume is obtained by taking the annual sales units and dividing or multiplying that by the activity. Eg. for Delux set-ups: (12 000 ÷ 50) x 3 = 720 STD set-up (2 000 ÷ 1 000) x 1 = 12. Total volume then 720 + 12 = 732. The driver rate is obtained by taking the total cost and dividing that by the total driver volume. Eg. for set-ups: R73 200 ÷ 732 = 100. This value is then multiplied by the usage for the particular product: 720 times for the Delux, thus R72 000. (i)
Labour based rate – used as given in required section
Overhead cost R333 200 Number of hours 54 000 (12 000 x 2 + 12 000 x 2,5) as above Overhead rate R333 200 / 54 000 = R6,17 per labour hour [Remember: combined overhead] (2)
43 MAC4861/102
Profit calculation
Standard Deluxe Materials
22,00
32,00
Labour 16,00 20,00 Overheads at R6,17 12,34 15,43 (1) Total cost 50,34 67,43 (1) Selling price 65,00 87,00 Profit per unit 14,66 19,57 (1) Return on sales 22,55% 22,50% Contribution 27 35
(ii) Activity-based costing rate Standard Deluxe
Materials 22,00 32,00 Labour 16,00 20,00 Set-up 0,10 6,00 Special part handling 1,00 4,00 Customer invoices 0,42 2,00 Material handling 0,25 5,00 Other overheads 4,00 5,00 (3) Total cost 43,77 74,00 (1) Sale price 65,00 87,00 Profit per unit 21,23 13,00 (1) Return on sales 33% 15%
(b)
Report to management
A formal report (not produced here) is required and marks will be allocated for the report header.
(1)
(i)
Recommendations in light of calculations made in (a) above
In the report to the management of Benco the following points can be made: Using the traditional basis, the return on sales (ROS) is the same for both
versions. With a higher absolute (per unit) margin for Deluxe, it is sensible to attempt to sell Deluxe at the expense of Standard. This decision should be based on the contribution (as fixed costs are already committed), subject to market constraints, and production capacity!
(1)
ABC indicates that the return per unit on Standard is higher and the ROS is double that of Deluxe. It Appears that the wrong marketing strategy is being advanced because the contribution on Standard is still higher!
(1)
Where a discussion is required, it will often be more time-efficient to show the overhead cost per activity and use that information in the discussion.
These are calculated from the costs and individual costs, in the table in (a), divided by 12 000 units (the volume) or it can be done per total.
44 MAC4861/102
To make Deluxe as profitable as Standard, one or both of two strategies are
required: Increase price - success will depend on market. However, for a return similar to Standard a price of around R106 will be needed for Deluxe. This is unlikely to allow increased sales, unless marketing can persuade customers that price indicates quality, etc. Cut costs - the activity analysis indicates where overhead cost is being expended. Thus cost-cutting will require changes in production. Set-ups are expensive for Deluxe, as are the special part handling costs, and general handling costs. Could the production process be improved to reduce set-ups?
(1)
(1)
• ABC unit costs imply long-run variability only (fixed in short-term) and thus costs may not change quickly or without positive management decisions.
(1)
(ii)
How activity-based techniques can be used to improve performance
Activity-based techniques can be used to improve performance in the following ways:
Comparing prices with the cost of resources used to produce goods and services, management will usually wish to earn a profit in excess of the activity-based costs, but there are circumstances where this will not apply.
(1)
Firms usually benefit from ABC when they have a range of products with varying degrees of complexity, particularly in their consumption of differing firm resources as ABC costs often reveal the degree of cross-subsidy that occurs. Refer to labour hours vs the difference in driver volumes.
(1)
Products with very different production volumes produce different costs under ABC. (1)
Benefit only arises if the ABC information can be used to change practices, either by changing prices and/or cutting costs. Resources should only be supplied to the extent that it is required.
(1)
Activity-based analysis can be used to identify where excessive costs are being incurred, and lead to changes that will reduce these costs.
(1)
ABM can be used to examine the overhead cost base and identify areas for cost reduction, by eliminating activities that are not needed (non-value adding).
(1)
Problems arise from: availability of data, particularly cost driver data, cost of implementation and whether it exceeds the benefit.
(1)
Implementation problems may result in none or less of the potential benefit being achieved.
(1)
Maximum 10
45 MAC4861/102
Activity 4 Attempt questions: (Drury Student Manual) 9th ed: Question 11.5 pages 74–75 9th ed: Question 11.2 pages 72–73 9th ed: Question 11.4 page 74
Feedback 4 Question 11.5 (9th ed)
What type of a business is this?
They are a healthcare company specializing in surgical procedures (hip, knee and shoulder replacement operations.)
What has been given in the scenario?
Current method and ABC method
You are required to calculate the profit per procedure on the current method and then on ABC method.
Tip: use 2 different colours pens or highlighters to underline which part of the given information relates to the current information and which relates to the additional information given for ABC. If you sort this out now it will limit confusion when you are writing out your solution.
Note the way in which the total number of cost drivers has been calculated for each activity.
Summary In this learning unit we focussed on the application of activity-based costing and related concepts in terms of fixed overhead allocation, reduction and product pricing.
46 MAC4861/102
Self-assessment activity
Before you move on to the next learning unit please ensure that you have grasped the following concepts: Topic
Yes/No
1. An activity 2. Cost driver 3. Cost driver rate 4. Activity (resource) demand 5. Activity hierarchies 6. Profitability analyses using ABC 7. ABM and ABB
47 MAC4861/102
LEARNING UNIT 2 – PRODUCT COSTING SYSTEMS
LEARNING UNIT 2 LEARNING OUTCOMES After studying this topic, you should be able to do the following in a case study/scenario:
• Record and account for material, labour and overhead costs in the general ledger. • Value purchased and manufactured inventory using the FIFO or weighted average cost
methods. • Cost specific jobs (manufacturing or service). • Value work-in-process in a process costing system involving more than one process. • Determine whether separate products should be processed further after split-off point. • Apply backflush accounting in a JIT environment. • Correctly account for the treatment of normal and abnormal losses. • Consider the allocation of joint costs and treatment of by-products and their proceeds.
LEEREENHEID 2 LEERUITKOMSTE Ná bestudering van hierdie onderwerp behoort u in staat te wees om die volgende in ‘n gevalle- studie/scenario te doen:
• Pas die teboekstelling en verantwoording van grondstowwe, arbeid en bokoste in die grootboek toe.
• Waardeer gekoopte en vervaardigde voorraad deur middel van die EIEU of die geweegde gemiddelde metode.
• Bepaal die koste vir spesifieke take (vervaardiging of dienste). • Bepaal of afsonderlike produkte na die skeidingspunt verder verwerk moet word. • Pas terugvoerrekeningkunde in ‘n net-betyds-omgewing toe. • Verantwoord die hantering van normale en abnormale verliese korrek. • Oorweeg die toedeling van gesamentlike koste en hantering van neweprodukte en hul
opbrengste. LEARNING UNIT TITLE LEARNING UNIT 2.1 Job costing
LEARNING UNIT 2.2 Process costing
LEARNING UNIT 2.3 Joint and by-products
48 MAC4861/102
Introduction
This topic deals with the recording and allocation of costs using job, process and joint costing systems to value products manufactured or services rendered. It will largely follow a revision route with closer focus on areas where students’ past assessments indicated shortcomings in knowledge.
LEARNING UNIT 2.1 Job costing
Prior learning
This course assumes that students have already mastered the work equivalent to that presented in Unisa’s preceding undergraduate degree. Please ensure that you are up to date with the prior learning for the topic job costing. If not, please refer to your undergraduate study material and revise the indicated pages of the textbook, namely Drury, using the page numbers below:
Prior learning Drury 9th ed
Before studying this topic, you should be able to do the following: • Describe the materials recording procedure. • Distinguish between first-in-first-out (FIFO), and
average cost methods of stores pricing. • Describe the accounting procedure for labour
costs. • Describe the accounting procedure for manufac-
turing and non-manufacturing overheads. • Describe accounting procedures for jobs
completed and products sold.
Applicable references: • Drury: Chapter 4: Accounting entries for a job costing system: Pages 85–98
Introduction
The bulk of this chapter in Drury focuses on the accounting entries for the acquisition of materials, labour and various overhead expenditures in the general ledger. These initial accounting entries are common to most entities regardless of their costing system. The valuation of raw materials and other start items is also common to all. The next step is the allocation of these costs to cost objects and at this point the costing system used by an entity will make a difference. In this learning unit we look at job costing which is used when an entity produces products or services where each unit or batch of output is unique or customised and the cost of each unit needs to be calculated separately, e.g. building contracts, book publishing and an audit engagement. Another practical example of job costing will be the servicing of a car where the required parts and the time spent is booked to the car’s job card and then invoiced.
Process costing is used when entities continuously produce large quantities of homogeneous or similar products or services and it is unnecessary to assign costs to each unit produced. Process costing is discussed in the next learning unit.
Costs are classified as direct or indirect costs. Indirect costs are recorded in an overhead account. The indirect costs will include the costs of service departments, which may be apportioned to different cost centres or products. Production overhead is then absorbed into production.
49 MAC4861/102
The most common way of absorbing overhead into products in a traditional costing system was covered in learning unit 1.2. In learning unit 1.3 the overhead was absorbed on the basis of a cost per activity based on an activity-based costing system.
Focus note
The basic recording process for the car service in the costing system:
Direct parts Goes directly to WIP (work-in-progress – Job 123 GP (from inventory – parts section)
Direct labour Goes directly to WIP (work-in-progress from time spent/clocked) Overheads Absorbed into WIP (using absorption basis where traditional absorption
costing or activity-based costing) On completion Job cost for 123 GP transferred to Completed Jobs and invoiced. In a
manufacturing set-up the cost would be transferred to finished goods, ready for sale/delivery.
Note:
The invoice that the customer sees contains only parts and labour AFTER the appropriate mark-up has been Applied to each to cover the overheads and profit margin!
Study
Summary Drury 9th ed, pages 100 – 101
Activity 1
Revision
Attempt question: (Drury Textbook) 9th ed: Question 4.18 p 104
This question will revise what you have already learnt on integrated accounting in undergraduate.
This exercise is done to revise the flow of accounting entries in an integrated accounting system.
What is an integrated accounting system? Refer to page 101 (9th ed.).
50 MAC4861/102
Study figure 4.1 on page 101 (9th ed) and refer to it whilst doing the question so that you have a better illustration of the flow of accounting entries.
Activity 2
Attempt question: (Drury Student Manual) 9th ed: Question 4.7 p 18
Feedback 2
Question 4.7 (9th ed)
What is given?
• 2 products – A and B • Selling price per unit • Opening stocks of raw materials and finished goods • Information on raw materials, labour and overheads for the year • Non-production overheads
What is required?
• To prepare raw material stock account, production overheads and finished goods stock account.
• Tip: Draw up the 3 T-accounts and fill in the opening balances and purchases/amount charged for the year for each account. Then start doing your calculations.
• Prepare a profit and loss account. • Tip: You need to show the profit, therefore you will put in sales, cost of sales (this should be
calculated in part A), expenses – it’s like an SCIE. • Calculate and explain the difference between profit and loss if marginal costing method is
employed. • What is marginal/direct costing? How would your SCIE be prepared if it was done on this
basis? Please also note that the question asks for a calculation AND an explanation. Many students lose marks unnecessarily because they don’t do both.
51 MAC4861/102
Where do I start?
Part A
Note the following:
Labour is charged at £8 per hour. Overtime is 1.25 times. Therefore Labour = £8 x 1,25 = £10.
The question states that the overtime premiums are treated as an indirect production cost. Therefore this must be included in the overhead control account. So this means that the premium portion must be included in the overhead account. The overtime rate (£10) – normal rate (£8) = £2 per hour.
What should be debited to overhead control account?
Debit: Overhead premium 3 250hrs x £2 = £ 6 500
Other indirect labour costs – given £186 470 £192 970
Production overhead costs – given £549 630
This question states that overheads are absorbed at a rate of £10 per hour. This was calculated for you.
How many hours does it take to produce Product A? 1 hour
How many hours does it take to produce Product B? 1.2 hours
Therefore £10 x 1 hr = £10 per unit A – 41 000 units of A were produced, 41 000 x 10 = £410 000.
£10 x 1.2hrs = £12 per unit B – 27 000 units of B were produced, 27 000 x 12 = £324 000.
Units:
Product A
Product B
Opening stock 3 200 3 100 + Production 41 000 27 000 - Sales (38 000) (28 000) Closing stock 6 200 2 100
Part B
Calculations
Sales:
Product A: 38 000 units x £35 = £1 330 000
Product B: 28 000 units x £39 = £1 092 000
52 MAC4861/102
Cost of sales:
This was calculated as follows in part A:
Product A: 38 000 units x (7.20 materials + 9.60 labour+ 12 overheads)
= 38 000 x 25.20
= £957 600
Product B: 28 000 units x (11.60 materials + 9.60 labour + 12 overheads) = 28 000 x 33.20
Specifically note the valuation of the closing inventory and the treatment of the over/under absorbed overhead. This variance forms part of the production costs. This is a good integration question, combining accounting entries and different costing bases.
Summary
In this learning unit we reviewed the recording process in general and how it would apply in a job costing system.
Self-assessment activity
Before you move on to the next learning unit, please ensure that you have grasped the following concepts:
Topic
Yes/No
1. How to record materials, labour and overheads 2. The treatment of inventory for FIFO and weighted average cost methods 3. The accounting treatment for jobs completed and products sold
53 MAC4861/102
LEARNING UNIT 2.2 Process costing
Prior learning
This course assumes that students have already mastered the work equivalent to that presented in Unisa’s preceding undergraduate degree. Please ensure that you are up to date with the prior learning for process costing. If not, please refer to your undergraduate study material and revise the following indicated pages of the textbook, namely Drury, using the page numbers below:
Prior learning Drury 9th ed
Before studying this topic, you should be able to do the following: • Explain when process costing systems are
appropriate. • Explain the accounting treatment of normal and
abnormal losses. • Prepare process, normal loss, abnormal loss and
abnormal gain accounts. • Prepare a process costing
statement; and value inventories.
Applicable references: • Drury: Chapter 5: Process Costing. Pages 107–127
Introduction In the previous learning unit we looked at job costing, which is a costing system used when the cost of each unique unit produced needs to be calculated separately. On the other end of the scale are entities that continuously produce large quantities of homogeneous or similar products or services, making it unnecessary to assign costs to each unit produced. Process costing systems are therefore used to calculate the average cost per unit by dividing the total costs for a specific process for a period by the number of units passing through the process for that period, e.g. oil refineries, breweries and paper manufacturers. Measurement in a process costing system takes place by way of equivalent and completed units. To do this, work-in-progress must be converted to the ‘equivalent’ of fully completed units. The learning unit will be dealt with by way of revision.
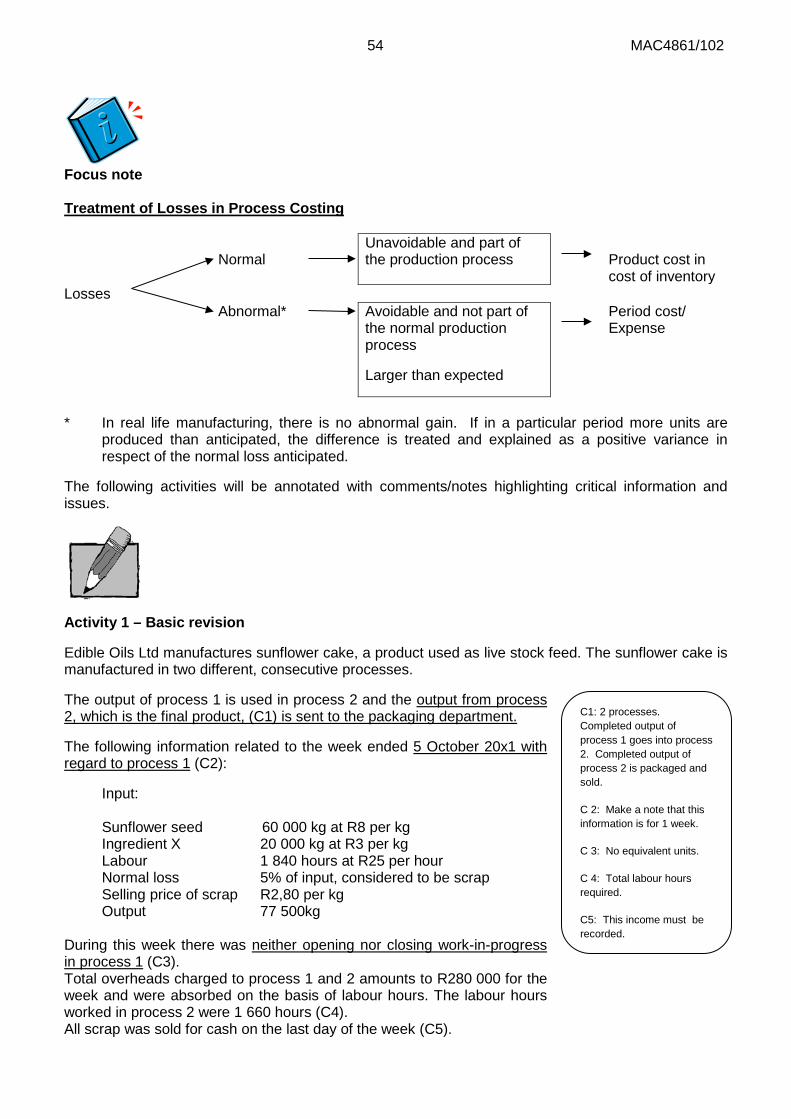
54 MAC4861/102
Focus note
Treatment of Losses in Process Costing
Normal Unavoidable and part of
the production process
Product cost in cost of inventory
Losses Abnormal* Avoidable and not part of
the normal production process
Larger than expected
Period cost/ Expense
* In real life manufacturing, there is no abnormal gain. If in a particular period more units are produced than anticipated, the difference is treated and explained as a positive variance in respect of the normal loss anticipated.
The following activities will be annotated with comments/notes highlighting critical information and issues.
Activity 1 – Basic revision
Edible Oils Ltd manufactures sunflower cake, a product used as live stock feed. The sunflower cake is manufactured in two different, consecutive processes.
The output of process 1 is used in process 2 and the output from process 2, which is the final product, (C1) is sent to the packaging department.
The following information related to the week ended 5 October 20x1 with regard to process 1 (C2):
Input: Sunflower seed 60 000 kg at R8 per kg Ingredient X 20 000 kg at R3 per kg Labour 1 840 hours at R25 per hour Normal loss 5% of input, considered to be scrap Selling price of scrap R2,80 per kg Output 77 500kg
During this week there was neither opening nor closing work-in-progress in process 1 (C3). Total overheads charged to process 1 and 2 amounts to R280 000 for the week and were absorbed on the basis of labour hours. The labour hours worked in process 2 were 1 660 hours (C4). All scrap was sold for cash on the last day of the week (C5).
C1: 2 processes. Completed output of process 1 goes into process 2. Completed output of process 2 is packaged and sold.
C 2: Make a note that this information is for 1 week.
C 3: No equivalent units.
C 4: Total labour hours required.
C5: This income must be recorded.
55 MAC4861/102
REQUIRED
(a) Prepare, using only the information provided above, the following accounts for the week ended 5 October 20x1. 1. Process 1 account 2. Abnormal loss/gain account 3. Scrap proceeds account (14)
(b) Briefly explain how to distinguish a by-product from a joint product (learning unit 2.3). (4) (Source: AGA)
Feedback 1
QUANTITY STATEMENT TEMPLATE – First-in-first-out (FIFO) & Weighted average method (WAM)
a. Quantity Statement for 5 October 20x1 (weighted average method) – Process 1
Physical units Equivalent units
Input
Output Raw material Conversion cost
(kg) Detail (kg) Kg % Kg % Opening work-in-process
80 000 Put into production Completed and transferred 77 500 77 500 100% 77 500 100% Normal loss 4 000 - - Abnormal loss (1 500) (1 500) 100% (1 500) 100%
80 000 80 000 76 000 76 000
Production Cost Statement for 5 October 20x1 – WAM – Process 1
Total R
Material Conversion cost
Sunflower seed 480 000 Ingredient 60 000 Labour 46 000 Overheads 147 200 Proceeds Net loss (11 200) Total 722 000 528 800 193 200 Cost per unit 9,50 = 6,958 + 2,542
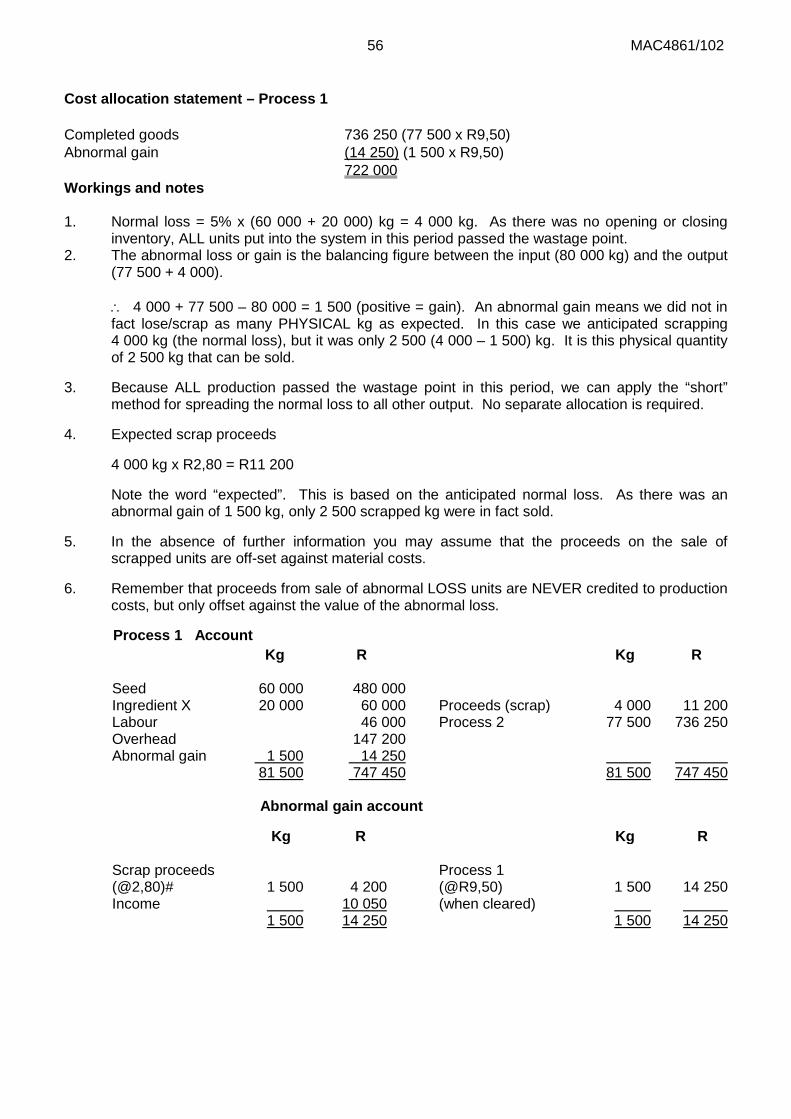
56 MAC4861/102
Cost allocation statement – Process 1 Completed goods 736 250 (77 500 x R9,50) Abnormal gain (14 250) (1 500 x R9,50) 722 000 Workings and notes 1. Normal loss = 5% x (60 000 + 20 000) kg = 4 000 kg. As there was no opening or closing
inventory, ALL units put into the system in this period passed the wastage point. 2. The abnormal loss or gain is the balancing figure between the input (80 000 kg) and the output
(77 500 + 4 000).
∴ 4 000 + 77 500 – 80 000 = 1 500 (positive = gain). An abnormal gain means we did not in fact lose/scrap as many PHYSICAL kg as expected. In this case we anticipated scrapping 4 000 kg (the normal loss), but it was only 2 500 (4 000 – 1 500) kg. It is this physical quantity of 2 500 kg that can be sold.
3. Because ALL production passed the wastage point in this period, we can apply the “short” method for spreading the normal loss to all other output. No separate allocation is required.
4. Expected scrap proceeds
4 000 kg x R2,80 = R11 200
Note the word “expected”. This is based on the anticipated normal loss. As there was an abnormal gain of 1 500 kg, only 2 500 scrapped kg were in fact sold.
5. In the absence of further information you may assume that the proceeds on the sale of scrapped units are off-set against material costs.
6. Remember that proceeds from sale of abnormal LOSS units are NEVER credited to production costs, but only offset against the value of the abnormal loss.
Process 1 Account Kg R Kg R Seed Ingredient X
60 000 20 000
480 000 60 000
Proceeds (scrap)
4 000
11 200
Labour 46 000 Process 2 77 500 736 250 Overhead 147 200 Abnormal gain 1 500 14 250 81 500 747 450 81 500 747 450
Abnormal gain account
Kg R Kg R Scrap proceeds (@2,80)#
1 500
4 200
Process 1 (@R9,50)
1 500
14 250
Income 10 050 (when cleared) 1 500 14 250 1 500 14 250
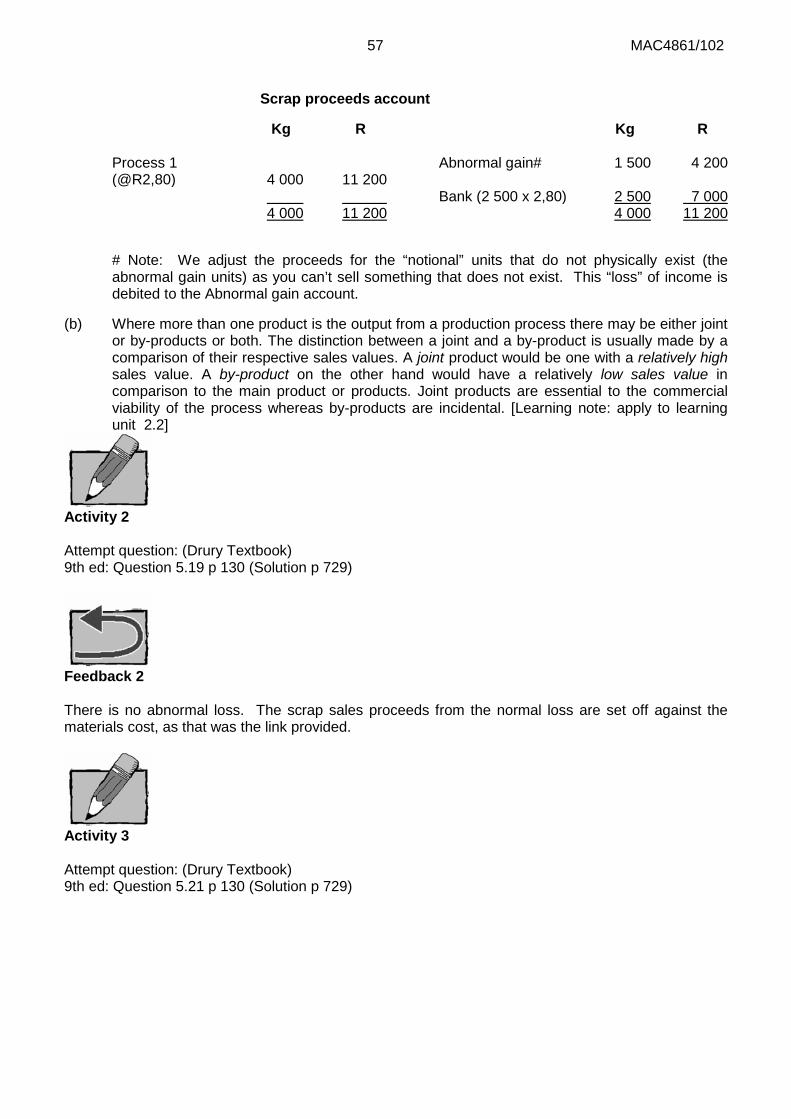
57 MAC4861/102
Scrap proceeds account
Kg R Kg R Process 1 (@R2,80)
4 000
11 200
Abnormal gain# 1 500 4 200
Bank (2 500 x 2,80) 2 500 7 000 4 000 11 200 4 000 11 200
# Note: We adjust the proceeds for the “notional” units that do not physically exist (the abnormal gain units) as you can’t sell something that does not exist. This “loss” of income is debited to the Abnormal gain account.
(b) Where more than one product is the output from a production process there may be either joint or by-products or both. The distinction between a joint and a by-product is usually made by a comparison of their respective sales values. A joint product would be one with a relatively high sales value. A by-product on the other hand would have a relatively low sales value in comparison to the main product or products. Joint products are essential to the commercial viability of the process whereas by-products are incidental. [Learning note: apply to learning unit 2.2]
Activity 2 Attempt question: (Drury Textbook) 9th ed: Question 5.19 p 130 (Solution p 729)
Feedback 2 There is no abnormal loss. The scrap sales proceeds from the normal loss are set off against the materials cost, as that was the link provided.
Activity 3 Attempt question: (Drury Textbook) 9th ed: Question 5.21 p 130 (Solution p 729)
58 MAC4861/102
Activity 4 Attempt question: (Drury Student Manual) 9th ed: Question 5.13 p 27
Feedback 4 Note the following: • Difference in layout of Quantity Statement and Production Cost Statement. • Output is dependent on the initial input. • Output includes reworked units. • Reworked units are not subject to the normal 10% loss, being reworked. • Completed and equivalent units are required. • Possible integration with standard costing system.
Summary In this learning unit we revisited the determination of cost per completed and equivalent unit in a process costing system.
Self-assessment activity Before you move on to the next learning unit, please ensure that you have grasped the following concepts: Topic
Yes/No
1. The difference between a job costing system and a process costing system 2. Equivalent units 3. Normal loss 4. Abnormal loss or gain 5. The FIFO and weighted average methods of inventory valuation 6. Allocation of normal loss – when to use “short” or absorption method and when to
use the “long” or allocation method 7. Value output from the process 8. Treatment of proceeds from the sale of normal and abnormal units scrapped or
“off-cuts” or by-products
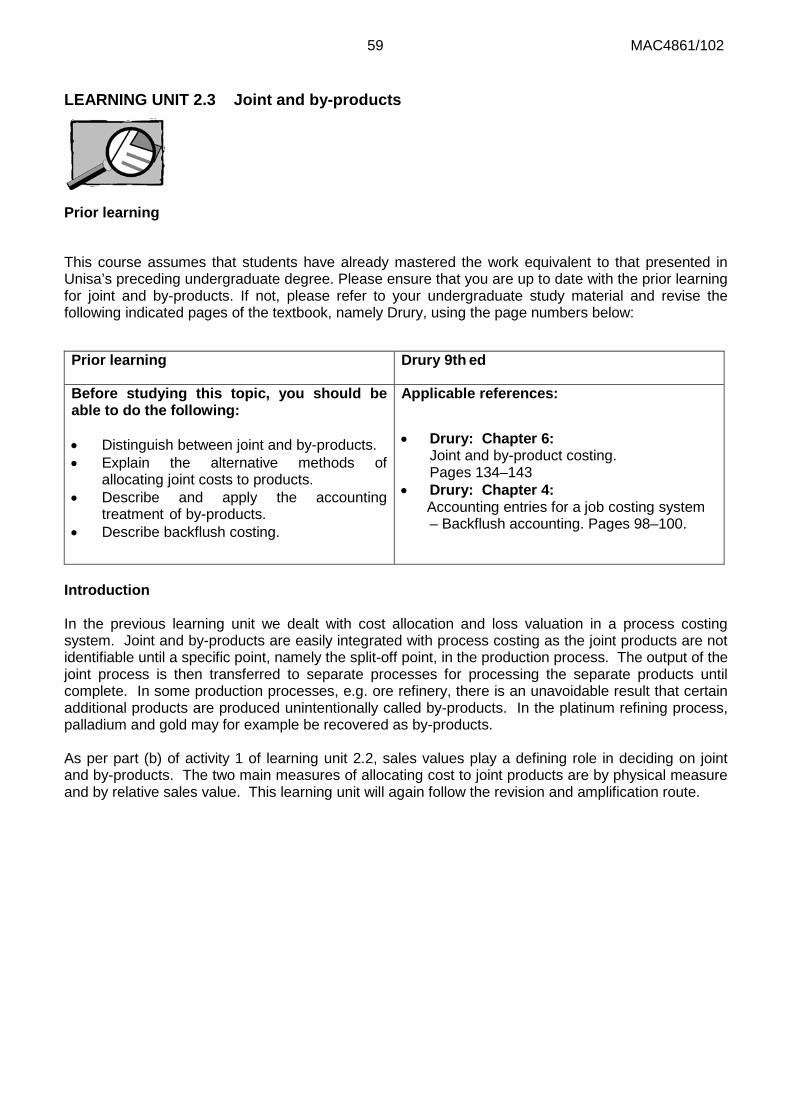
59 MAC4861/102
LEARNING UNIT 2.3 Joint and by-products
Prior learning
This course assumes that students have already mastered the work equivalent to that presented in Unisa’s preceding undergraduate degree. Please ensure that you are up to date with the prior learning for joint and by-products. If not, please refer to your undergraduate study material and revise the following indicated pages of the textbook, namely Drury, using the page numbers below:
Prior learning Drury 9th ed
Before studying this topic, you should be able to do the following: • Distinguish between joint and by-products. • Explain the alternative methods of
allocating joint costs to products. • Describe and apply the accounting
treatment of by-products. • Describe backflush costing.
Applicable references: • Drury: Chapter 6: Joint and by-product costing. Pages 134–143 • Drury: Chapter 4: Accounting entries for a job costing system
– Backflush accounting. Pages 98–100.
Introduction In the previous learning unit we dealt with cost allocation and loss valuation in a process costing system. Joint and by-products are easily integrated with process costing as the joint products are not identifiable until a specific point, namely the split-off point, in the production process. The output of the joint process is then transferred to separate processes for processing the separate products until complete. In some production processes, e.g. ore refinery, there is an unavoidable result that certain additional products are produced unintentionally called by-products. In the platinum refining process, palladium and gold may for example be recovered as by-products. As per part (b) of activity 1 of learning unit 2.2, sales values play a defining role in deciding on joint and by-products. The two main measures of allocating cost to joint products are by physical measure and by relative sales value. This learning unit will again follow the revision and amplification route.
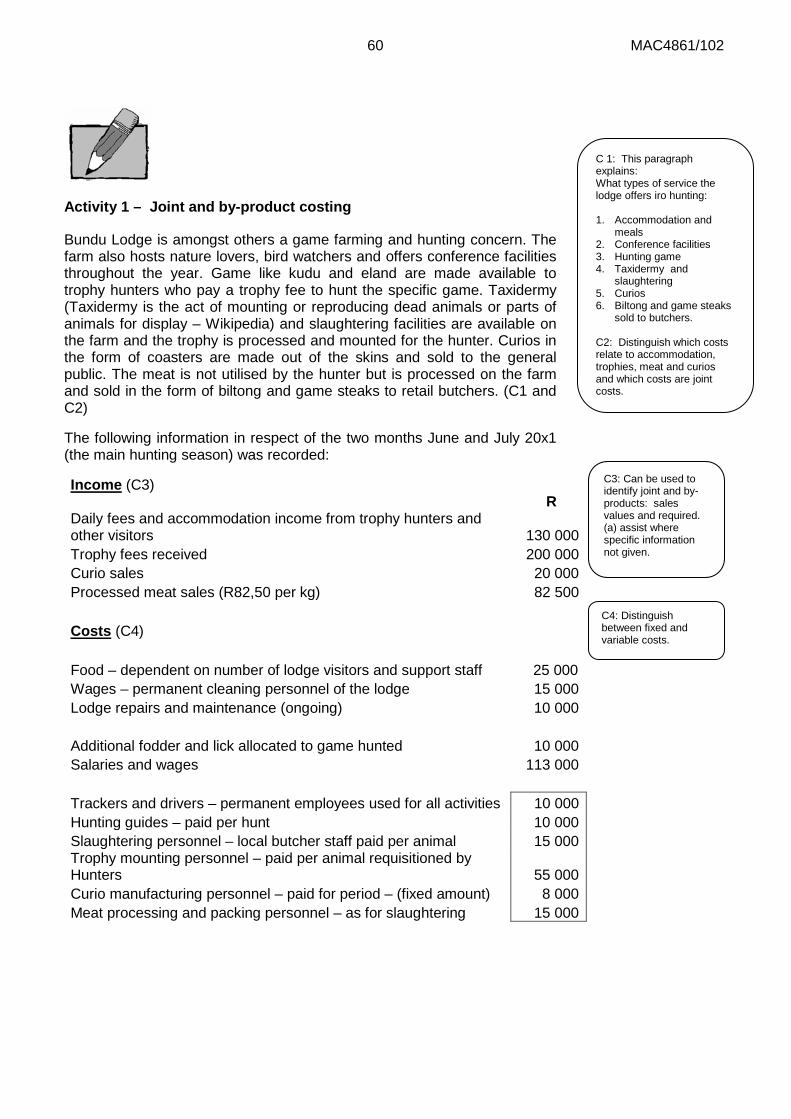
60 MAC4861/102
Activity 1 – Joint and by-product costing
Bundu Lodge is amongst others a game farming and hunting concern. The farm also hosts nature lovers, bird watchers and offers conference facilities throughout the year. Game like kudu and eland are made available to trophy hunters who pay a trophy fee to hunt the specific game. Taxidermy (Taxidermy is the act of mounting or reproducing dead animals or parts of animals for display – Wikipedia) and slaughtering facilities are available on the farm and the trophy is processed and mounted for the hunter. Curios in the form of coasters are made out of the skins and sold to the general public. The meat is not utilised by the hunter but is processed on the farm and sold in the form of biltong and game steaks to retail butchers. (C1 and C2)
The following information in respect of the two months June and July 20x1 (the main hunting season) was recorded:
Income (C3)
R
Daily fees and accommodation income from trophy hunters and other visitors 130 000 Trophy fees received
200 000
Curio sales
20 000 Processed meat sales (R82,50 per kg)
82 500
Costs (C4)
Food – dependent on number of lodge visitors and support staff 25 000 Wages – permanent cleaning personnel of the lodge 15 000 Lodge repairs and maintenance (ongoing)
10 000
Additional fodder and lick allocated to game hunted 10 000 Salaries and wages
113 000
Trackers and drivers – permanent employees used for all activities 10 000 Hunting guides – paid per hunt
10 000
Slaughtering personnel – local butcher staff paid per animal 15 000 Trophy mounting personnel – paid per animal requisitioned by Hunters 55 000 Curio manufacturing personnel – paid for period – (fixed amount) 8 000 Meat processing and packing personnel – as for slaughtering 15 000
C 1: This paragraph explains: What types of service the lodge offers iro hunting: 1. Accommodation and meals 2. Conference facilities 3. Hunting game 4. Taxidermy and slaughtering 5. Curios 6. Biltong and game steaks sold to butchers. C2: Distinguish which costs relate to accommodation, trophies, meat and curios and which costs are joint costs.
C3: Can be used to identify joint and by-products: sales values and required. (a) assist where specific information not given.
C4: Distinguish between fixed and variable costs.
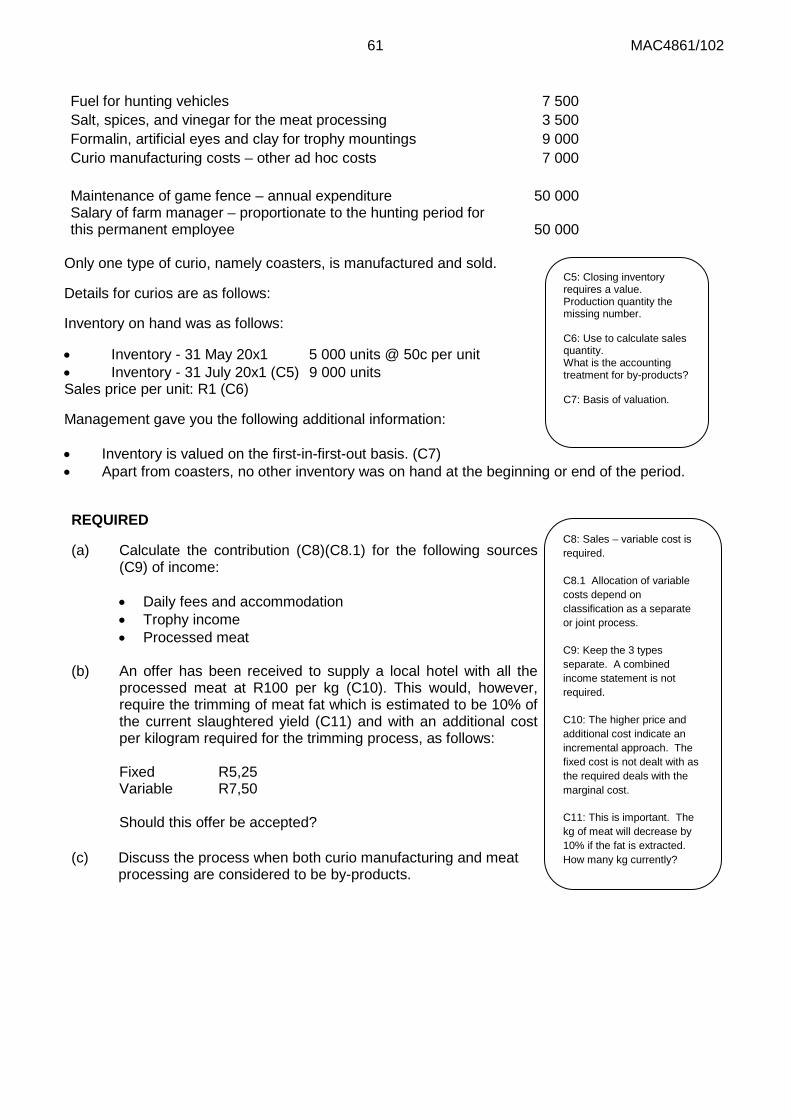
61 MAC4861/102
Fuel for hunting vehicles
7 500
Salt, spices, and vinegar for the meat processing 3 500 Formalin, artificial eyes and clay for trophy mountings 9 000 Curio manufacturing costs – other ad hoc costs 7 000
Maintenance of game fence – annual expenditure 50 000 Salary of farm manager – proportionate to the hunting period for this permanent employee 50 000
Only one type of curio, namely coasters, is manufactured and sold.
Details for curios are as follows:
Inventory on hand was as follows:
• Inventory - 31 May 20x1 5 000 units @ 50c per unit • Inventory - 31 July 20x1 (C5) 9 000 units Sales price per unit: R1 (C6)
Management gave you the following additional information: • Inventory is valued on the first-in-first-out basis. (C7) • Apart from coasters, no other inventory was on hand at the beginning or end of the period.
REQUIRED
(a) Calculate the contribution (C8)(C8.1) for the following sources (C9) of income: • Daily fees and accommodation • Trophy income • Processed meat
(b) An offer has been received to supply a local hotel with all the
processed meat at R100 per kg (C10). This would, however, require the trimming of meat fat which is estimated to be 10% of the current slaughtered yield (C11) and with an additional cost per kilogram required for the trimming process, as follows: Fixed R5,25 Variable R7,50
Should this offer be accepted?
(c) Discuss the process when both curio manufacturing and meat processing are considered to be by-products.
C5: Closing inventory requires a value. Production quantity the missing number. C6: Use to calculate sales quantity. What is the accounting treatment for by-products? C7: Basis of valuation.
C8: Sales – variable cost is required.
C8.1 Allocation of variable costs depend on classification as a separate or joint process.
C9: Keep the 3 types separate. A combined income statement is not required.
C10: The higher price and additional cost indicate an incremental approach. The fixed cost is not dealt with as the required deals with the marginal cost.
C11: This is important. The kg of meat will decrease by 10% if the fat is extracted. How many kg currently?
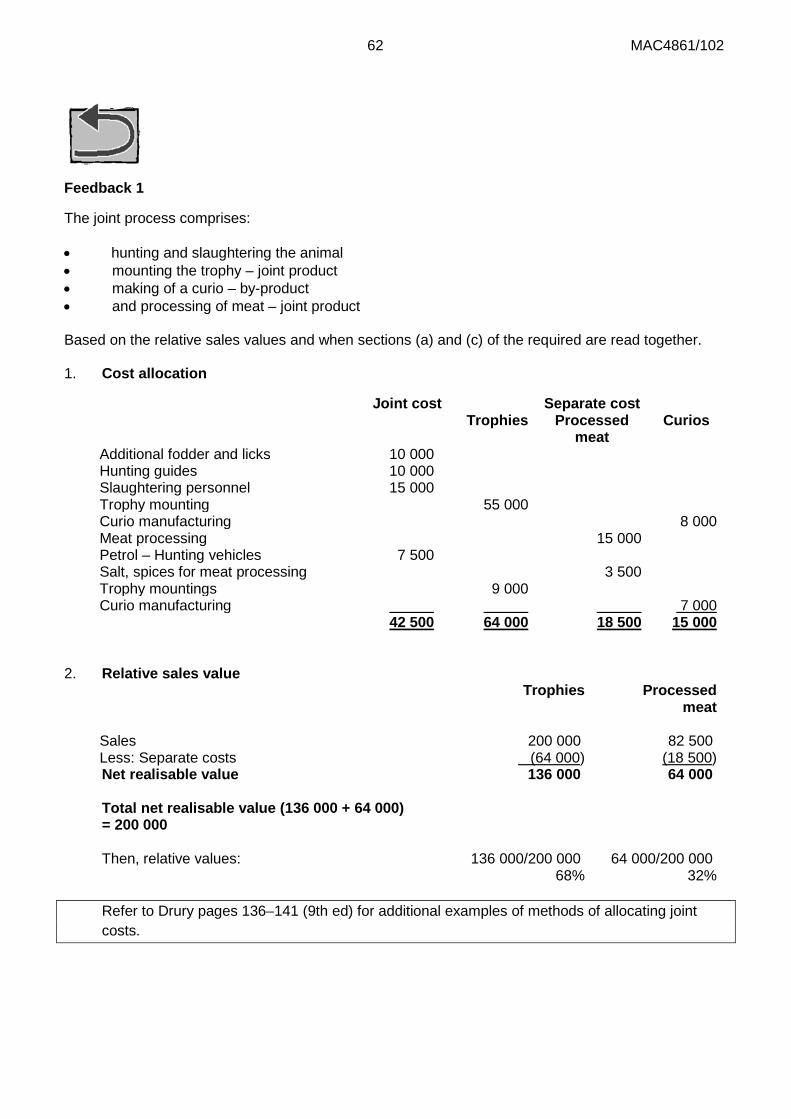
62 MAC4861/102
Feedback 1
The joint process comprises: • hunting and slaughtering the animal • mounting the trophy – joint product • making of a curio – by-product • and processing of meat – joint product Based on the relative sales values and when sections (a) and (c) of the required are read together. 1. Cost allocation
Joint cost Separate cost Trophies Processed
meat Curios
Additional fodder and licks 10 000 Hunting guides 10 000 Slaughtering personnel 15 000 Trophy mounting 55 000 Curio manufacturing 8 000 Meat processing 15 000 Petrol – Hunting vehicles 7 500 Salt, spices for meat processing 3 500 Trophy mountings 9 000 Curio manufacturing 7 000
42 500 64 000 18 500 15 000
2. Relative sales value Trophies
Processed
meat
Sales 200 000 82 500 Less: Separate costs (64 000) (18 500)
Net realisable value 136 000 64 000 Total net realisable value (136 000 + 64 000) = 200 000
Then, relative values: 136 000/200 000 64 000/200 000 68% 32%
Refer to Drury pages 136–141 (9th ed) for additional examples of methods of allocating joint
costs.
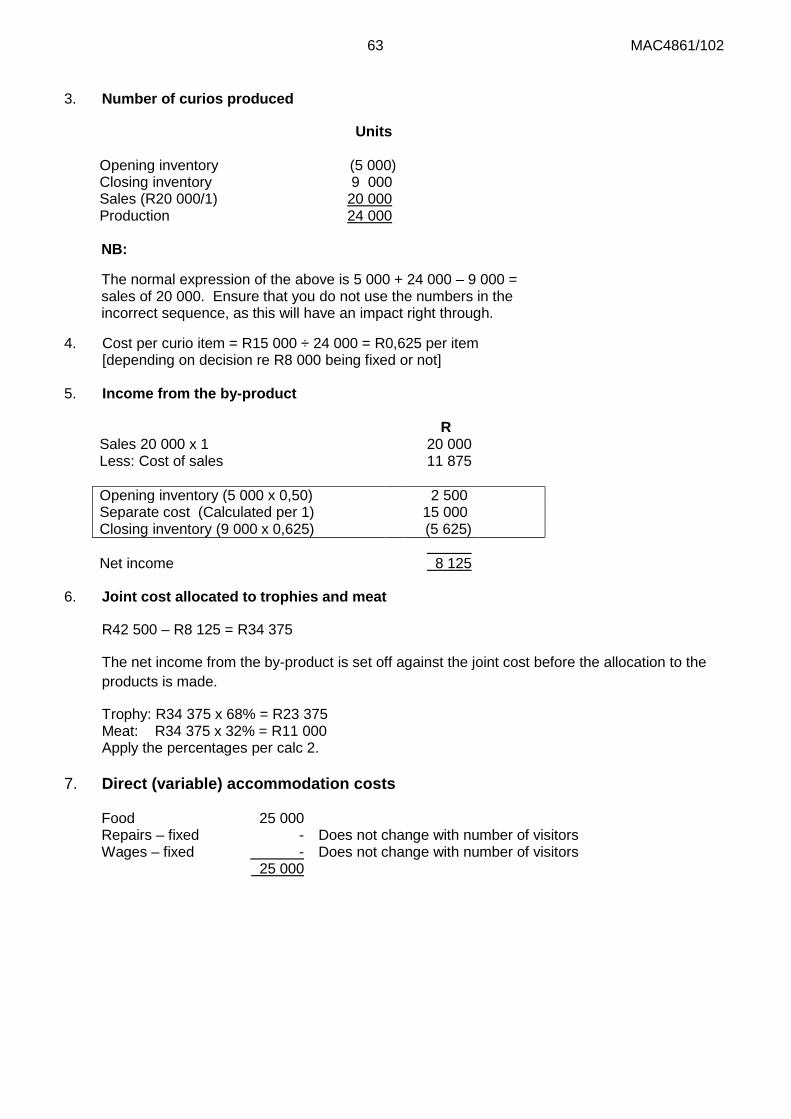
63 MAC4861/102
3. Number of curios produced
Units
Opening inventory (5 000) Closing inventory 9 000 Sales (R20 000/1) 20 000 Production 24 000 NB:
The normal expression of the above is 5 000 + 24 000 – 9 000 = sales of 20 000. Ensure that you do not use the numbers in the incorrect sequence, as this will have an impact right through.
4. Cost per curio item = R15 000 ÷ 24 000 = R0,625 per item [depending on decision re R8 000 being fixed or not] 5. Income from the by-product
R Sales 20 000 x 1 20 000 Less: Cost of sales 11 875 Opening inventory (5 000 x 0,50) 2 500 Separate cost (Calculated per 1) 15 000 Closing inventory (9 000 x 0,625) (5 625) Net income 8 125
6. Joint cost allocated to trophies and meat
R42 500 – R8 125 = R34 375
The net income from the by-product is set off against the joint cost before the allocation to the products is made.
Trophy: R34 375 x 68% = R23 375 Meat: R34 375 x 32% = R11 000 Apply the percentages per calc 2.
7. Direct (variable) accommodation costs Food 25 000 Repairs – fixed - Does not change with number of visitors Wages – fixed - Does not change with number of visitors 25 000
64 MAC4861/102
REQUIRED (a) Contribution income per income source
Accommo- dation
Trophy Meat
Sales/Income 130 000 200 000 82 500 Less: Variable cost 25 000 87 375 29 500 Separate 25 000 64 000 18 500 Joint - 23 375 11 000 Net income Note: The question required calculation of contribution. Therefore all fixed costs are ignored.
105 000 112 625 53 000
(b) New offer R
Sales value after further processing (900 kg x R100)(see calc.) 90 000 Less: Current sales of processed meat 82 500 Incremental sales offered 7 500 Less: Additional cost 1 000 x (5,25 + 7,50) 12 750 Net loss (5 250)
Calculation:
Current kg sold = R82 500 ÷ R82,50 = 1 000 kg 10% is lost through trimming of fat 900 kg lean meat sold The offer should thus not be accepted because no additional income would be earned. Note – the additional cost is based on the input quantity, whilst sales are the output quantity: normal loss in process costing. (c) Two by-products
The net income from the two by-products will be set off against the ‘joint’ cost, which becomes a cost only for the trophy mounting process.
Activity 2
Attempt question: (Drury Textbook) 9th ed: Question 6.15 p 147 (Solution p 731)
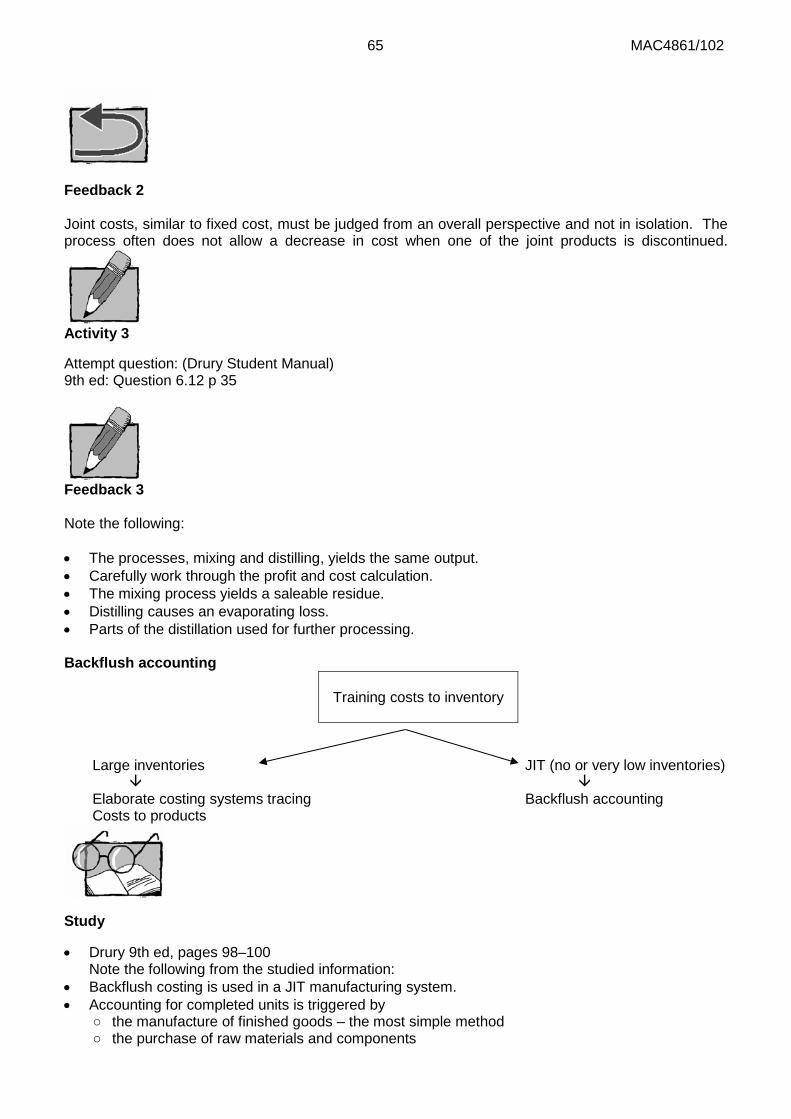
65 MAC4861/102
Feedback 2 Joint costs, similar to fixed cost, must be judged from an overall perspective and not in isolation. The process often does not allow a decrease in cost when one of the joint products is discontinued.
Activity 3
Attempt question: (Drury Student Manual) 9th ed: Question 6.12 p 35
Feedback 3 Note the following: • The processes, mixing and distilling, yields the same output. • Carefully work through the profit and cost calculation. • The mixing process yields a saleable residue. • Distilling causes an evaporating loss. • Parts of the distillation used for further processing. Backflush accounting
Training costs to inventory
Large inventories
JIT (no or very low inventories)
Elaborate costing systems tracing Costs to products
Backflush accounting
Study
• Drury 9th ed, pages 98–100 Note the following from the studied information: • Backflush costing is used in a JIT manufacturing system. • Accounting for completed units is triggered by
○ the manufacture of finished goods – the most simple method ○ the purchase of raw materials and components
66 MAC4861/102
Summary In this learning unit we focussed on the determination of joint and by-products, the allocation of joint costs and the accounting treatment of by-products. The circumstances for applying backflush accounting were described.
Self-assessment activity
Before you move on to the next learning unit, please ensure that you have grasped the following concepts: Topic
Yes/No
1. Conversion costs 2. Identifying joint products 3. Allocating joint product costs 4. Further processing costs 5. Measures for allocating joint costs 6. Treatment of by-products and their sales value and further processing costs 7. Backflush accounting situations
67 MAC4861/102
PART 2 – Planning and control
PART 2 PURPOSE The purpose of part 2 is to enable students to have a critical and informed understanding of the key terms, rules, concepts and established principles of planning and control techniques.
LEARNING UNIT 3 – Planning, budgeting and control
LEARNING UNIT 3 LEARNING OUTCOMES After studying this topic, you should be able to do the following:
• Design and compile fixed and flexible budgets. • Explain how costs are controlled using various management tools. • Calculate and interpret the break-even point and margin of safety of a business under different
scenarios and advise management based on your calculations.
LEEREENHEID 3 LEERUITKOMSTE Na bestudering van hierdie onderwerp, behoort u in staat te wees om die volgende te doen: • Ontwerp en stel vaste en veranderlike begrotings op. • Verduidelik hoe koste beheer word deur verskeie bestuurstegnieke te gebruik. • Bereken die gelykbreekpunt en veiligheidsmarge van ‘n besigheid in verskeie scenario’s en
adviseer die bestuur op grond van u berekeninge.
LEARNING UNIT TITLE LEARNING UNIT 3.1 Budgeting and management control systems LEARNING UNIT 3.2 Other cost management techniques/principles LEARNING UNIT 3.3 Cost-volume-profit analysis
68 MAC4861/102
LEARNING UNIT 3.1 Budgeting and management control systems
Prior learning This course assumes that students have already mastered the work equivalent to that presented in Unisa’s preceding undergraduate degree. Please ensure that you are up to date with the prior learning for the topic of budgeting and management control systems. If not, please refer to your undergraduate study material and revise the following indicated pages of the textbook, namely Drury, using the page numbers below:
Prior learning Drury 9th ed
Before studying this topic, you should be able to deal with the following: • Corporate strategy and long-term planning
o Competitive advantage o Porter’s models o Value chain o Supply chain
• Budgeting
o Master, capital, cash and subsidiary budgets
o Fixed and flexible budgeting o Zero-based budgeting o Activity-based budgeting o Stages in planning functions, etc. o Responsibility centres o Behavioural aspects
Applicable references: • Drury: Chapter 15: The budgeting process. Pages 368-398. ● Drury: Chapter 16: Management Control Systems. Pages 411-420. • Drury: Chapter 15: Criticisms of budgeting. Pages 393-395.
● Management control systems
Introduction
In your prior learning you looked at the long-term planning aspect of the planning and control process. In this learning unit we will study budgeting or short-term planning. A basic revision activity dealing with flexible budgeting will be followed with sections to be studied, highlighted core issues and further activities. We will then look at criticisms against budgeting and alternative ways to determine budgeted figures. Lastly we will cover other management control systems (apart from the budget). Budgets are driven by the organisation’s long-term planning. A budget is defined as a formal plan to co-ordinate the use of different resources to achieve a pre-set and desired goal whilst taking company strategy into account.
In using budgets as a controlling mechanism, management should always be aware of the impact of the controllability principle. We will now first investigate that concept.
69 MAC4861/102
The controllability principle
An important aspect of responsibility accounting is the principle of holding the manager of the responsibility centre accountable only for the items that are significantly influenced (controllable) by the manager. There are various methods for dealing with the distorting effects of uncontrollable factors including amongst others, the use of flexible budgets and ex post budget adjustments.
Flexible budgeting helps to obtain meaningful results by removing the uncontrollable impact of volume changes on expenses. The originally budgeted variable and semi-variable costs must be flexed to the actual level of activity achieved during the period under review. Fixed expenses are not flexed. Flexible budgets are also a very important aspect of standard costing which is discussed in the next topic.
Forecasting errors may arise due to the environmental and economic conditions not realising as anticipated. Ex post budget adjustments can be made to remove the effect of forecasting errors (uncontrollable factors) from the manager’s performance reports. Ex post variance analysis will also be discussed further in the next topic, i.e. standard costing.
Study
• Drury (9th ed), pages 414–417
Note the following from the studied information:
• the meaning of the controllability principle • dealing with the effects of uncontrollable factors before and after the measurement period • guidelines for applying the controllability principle You will notice that flexing the budget is one way of acknowledging factors that influence volume which were outside the control of the manager/entity. We will now do a revision activity for compiling a flexed budget.
Activity 1 – Basic revision example
Siyahlala Lodges is a grouping of guest houses in Khayelitsha and Langa townships that are very popular with overseas tourists. Mama Khuzwayo is the owner of the guest houses. The facilities offer clean and highly competitive budget accommodation. There is a standard charge per room per night with each room accommodating up to two guests. For each guest house there is a restaurant facility that specialises in indigenous South African foods. You have been assigned to assist Mama Khuzwayo with the introduction of a budgetary control system. You establish that sometime in early 20x2, Mama Khuzwayo’s niece had attempted to assist with the implementation of a budgetary control system, but did not complete the exercise as she had to return to her university studies in Canada. You establish the following from her notes:
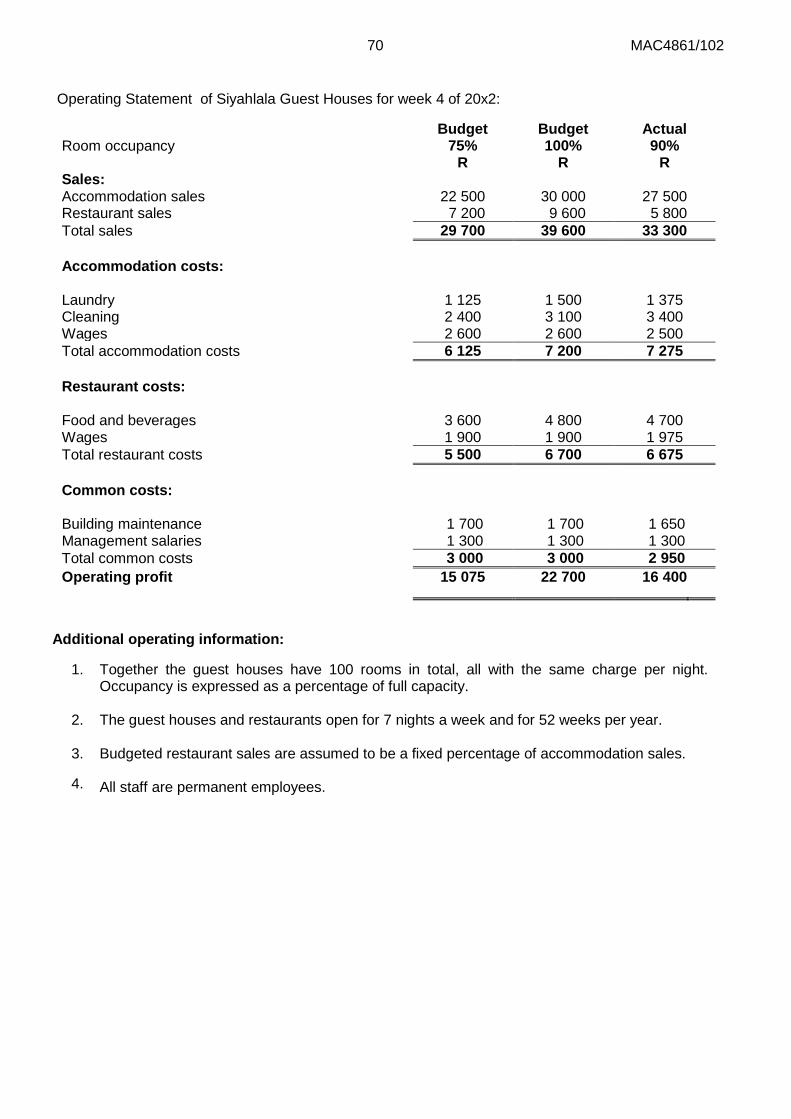
70 MAC4861/102
Operating Statement of Siyahlala Guest Houses for week 4 of 20x2:
Budget Budget Actual Room occupancy 75% 100% 90%
R R R Sales: Accommodation sales 22 500 30 000 27 500 Restaurant sales 7 200 9 600 5 800 Total sales 29 700 39 600 33 300 Accommodation costs:
Laundry 1 125 1 500 1 375 Cleaning 2 400 3 100 3 400 Wages 2 600 2 600 2 500 Total accommodation costs 6 125 7 200 7 275 Restaurant costs:
Food and beverages 3 600 4 800 4 700 Wages 1 900 1 900 1 975 Total restaurant costs 5 500 6 700 6 675 Common costs:
Building maintenance 1 700 1 700 1 650 Management salaries 1 300 1 300 1 300 Total common costs 3 000 3 000 2 950 Operating profit 15 075 22 700 16 400
Additional operating information:
1. Together the guest houses have 100 rooms in total, all with the same charge per night. Occupancy is expressed as a percentage of full capacity.
2. The guest houses and restaurants open for 7 nights a week and for 52 weeks per year.
3.
4.
Budgeted restaurant sales are assumed to be a fixed percentage of accommodation sales. All staff are permanent employees.
71 MAC4861/102
REQUIRED Marks (a) Calculate the number of room nights sold per week for 100%, 90% and 75%
occupancy levels.
(3) (b) Using the budgeted figures prepared by Mama Khuzwayo’s niece as a basis,
calculate: (i) the variable cost per room-night for cleaning (ii) the fixed cost per week for cleaning
(3) (1)
(c) Prepare a flexed budgeted operating statement for the guest houses for week 4 for an occupancy level of 90% showing the following: ● the budgeted contribution for each profit centre ● the budgeted attributable profit for each profit centre ● the budgeted profit for the guest houses in total
(16)
(d) Based on your flexed budget in (c) above and any other information you deem necessary, calculate the budgeted break-even sales value for the accommodation profit centre.
(2) (e) Calculate, for the restaurants only, the total variances between the actual results for
week 4 and the flexed budget figures you have calculated in part (c). Comment on the performance of the restaurants.
(9)
Feedback 1 – Basic flexed budget revision example
(a) Calculate the number of room nights sold per week for 100%, 90% and 75% occupancy levels.
Room occupancy 75% 100% 90%
Room nights 100 rooms x 7 nights x 75%
100 rooms x 7 nights x 100%
100 rooms x 7 nights x 90%
= 525 room nights per week
= 700 room nights per week
= 630 room nights per week
(3)
The hospitality industry, amongst others, uses occupancy levels to indicate their capacity usage. Full capacity is expressed as room nights, 700 as calculated above. This level is seldom reached as (some) rooms may require maintenance or refurbishment. Refer to Tsogo Sun or Sun International financial statements for more detail.
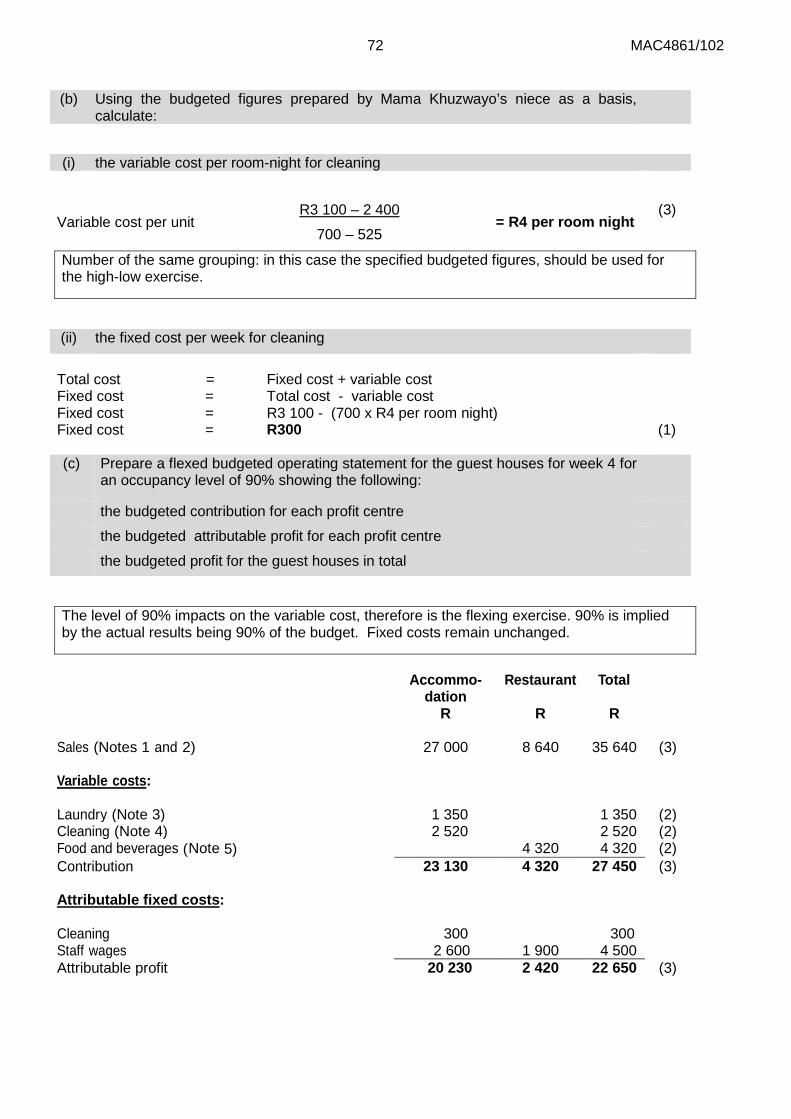
72 MAC4861/102
(b) Using the budgeted figures prepared by Mama Khuzwayo’s niece as a basis,
calculate:
(i) the variable cost per room-night for cleaning
Variable cost per unit R3 100 – 2 400
700 – 525 = R4 per room night
(3)
Number of the same grouping: in this case the specified budgeted figures, should be used for the high-low exercise.
(ii) the fixed cost per week for cleaning
Total cost = Fixed cost + variable cost Fixed cost = Total cost - variable cost Fixed cost = R3 100 - (700 x R4 per room night) Fixed cost = R300 (1) (c) Prepare a flexed budgeted operating statement for the guest houses for week 4 for
an occupancy level of 90% showing the following:
the budgeted contribution for each profit centre
the budgeted attributable profit for each profit centre
the budgeted profit for the guest houses in total
The level of 90% impacts on the variable cost, therefore is the flexing exercise. 90% is implied by the actual results being 90% of the budget. Fixed costs remain unchanged.
Accommo-
dation
Restaurant
Total
R R R
Sales (Notes 1 and 2) 27 000 8 640 35 640 (3) Variable costs:
Laundry (Note 3) 1 350 1 350 (2) Cleaning (Note 4) 2 520 2 520 (2) Food and beverages (Note 5) 4 320 4 320 (2) Contribution 23 130 4 320 27 450 (3)
Attributable fixed costs:
Cleaning 300 300 Staff wages 2 600 1 900 4 500 Attributable profit 20 230 2 420 22 650 (3)
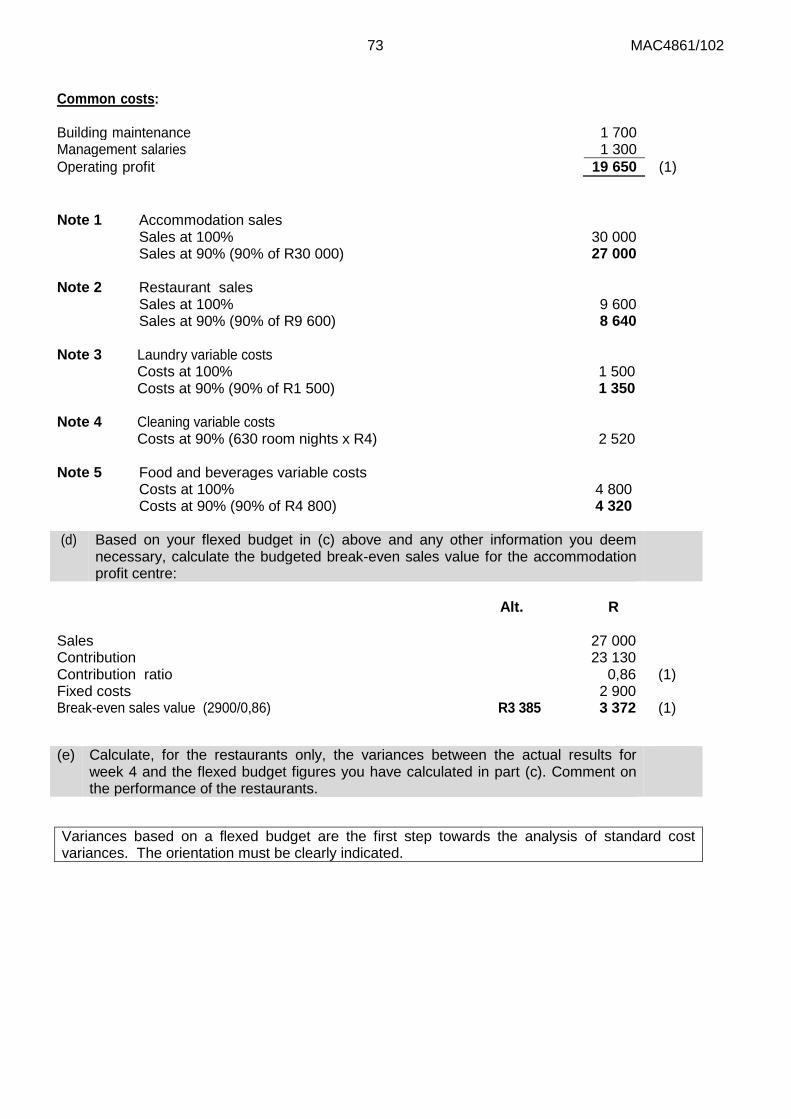
73 MAC4861/102
Common costs:
Building maintenance 1 700 Management salaries 1 300 Operating profit 19 650 (1)
Note 1 Accommodation sales Sales at 100% 30 000 Sales at 90% (90% of R30 000)
27 000
Note 2 Restaurant sales Sales at 100% 9 600 Sales at 90% (90% of R9 600) 8 640
Note 3 Laundry variable costs Costs at 100% 1 500 Costs at 90% (90% of R1 500)
1 350
Note 4 Cleaning variable costs Costs at 90% (630 room nights x R4) 2 520
Note 5 Food and beverages variable costs Costs at 100% 4 800 Costs at 90% (90% of R4 800) 4 320 (d) Based on your flexed budget in (c) above and any other information you deem
necessary, calculate the budgeted break-even sales value for the accommodation profit centre:
Alt. R
Sales 27 000 Contribution 23 130 Contribution ratio 0,86 (1) Fixed costs 2 900 Break-even sales value (2900/0,86) R3 385 3 372 (1)
(e) Calculate, for the restaurants only, the variances between the actual results for week 4 and the flexed budget figures you have calculated in part (c). Comment on the performance of the restaurants.
Variances based on a flexed budget are the first step towards the analysis of standard cost variances. The orientation must be clearly indicated.
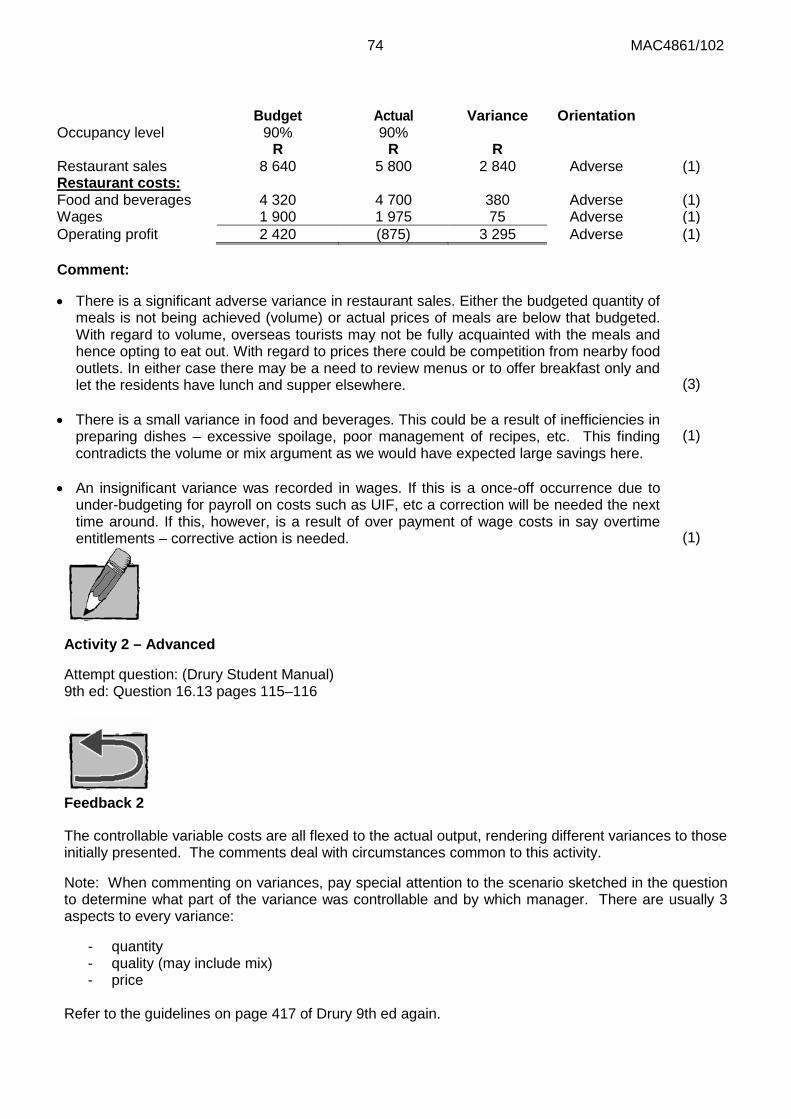
74 MAC4861/102
Budget
Actual
Variance
Orientation
Occupancy level 90% 90% R R R Restaurant sales 8 640 5 800 2 840 Adverse (1) Restaurant costs: Food and beverages 4 320 4 700 380 Adverse (1) Wages 1 900 1 975 75 Adverse (1) Operating profit 2 420 (875) 3 295 Adverse (1)
Comment:
• There is a significant adverse variance in restaurant sales. Either the budgeted quantity of meals is not being achieved (volume) or actual prices of meals are below that budgeted. With regard to volume, overseas tourists may not be fully acquainted with the meals and hence opting to eat out. With regard to prices there could be competition from nearby food outlets. In either case there may be a need to review menus or to offer breakfast only and let the residents have lunch and supper elsewhere.
(3)
• There is a small variance in food and beverages. This could be a result of inefficiencies in preparing dishes – excessive spoilage, poor management of recipes, etc. This finding contradicts the volume or mix argument as we would have expected large savings here.
(1)
• An insignificant variance was recorded in wages. If this is a once-off occurrence due to under-budgeting for payroll on costs such as UIF, etc a correction will be needed the next time around. If this, however, is a result of over payment of wage costs in say overtime entitlements – corrective action is needed.
(1)
Activity 2 – Advanced
Attempt question: (Drury Student Manual) 9th ed: Question 16.13 pages 115–116
Feedback 2
The controllable variable costs are all flexed to the actual output, rendering different variances to those initially presented. The comments deal with circumstances common to this activity.
Note: When commenting on variances, pay special attention to the scenario sketched in the question to determine what part of the variance was controllable and by which manager. There are usually 3 aspects to every variance:
- quantity - quality (may include mix) - price
Refer to the guidelines on page 417 of Drury 9th ed again.
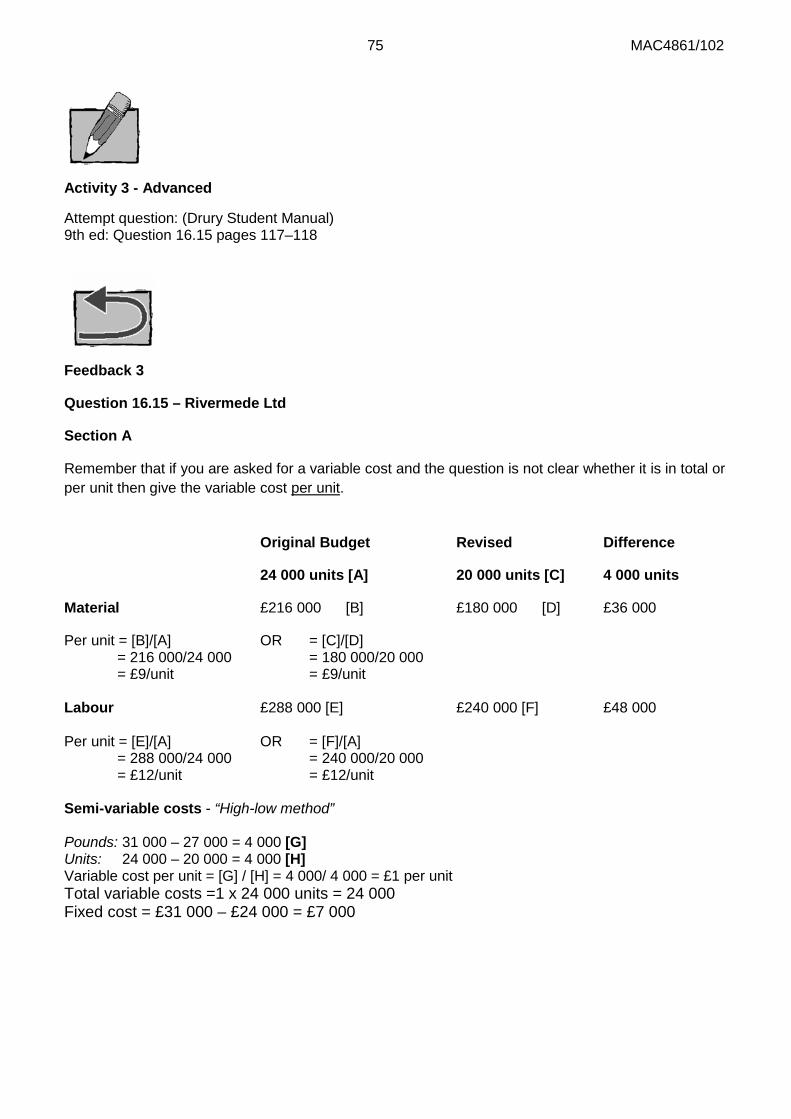
75 MAC4861/102
Activity 3 - Advanced
Attempt question: (Drury Student Manual) 9th ed: Question 16.15 pages 117–118
Feedback 3
Question 16.15 – Rivermede Ltd
Section A
Remember that if you are asked for a variable cost and the question is not clear whether it is in total or per unit then give the variable cost per unit.
Original Budget Revised Difference
24 000 units [A] 20 000 units [C] 4 000 units
Material £216 000 [B] £180 000 [D] £36 000
Per unit = [B]/[A] OR = [C]/[D] = 216 000/24 000 = 180 000/20 000 = £9/unit = £9/unit Labour £288 000 [E] £240 000 [F] £48 000 Per unit = [E]/[A] OR = [F]/[A] = 288 000/24 000 = 240 000/20 000 = £12/unit = £12/unit Semi-variable costs - “High-low method” Pounds: 31 000 – 27 000 = 4 000 [G] Units: 24 000 – 20 000 = 4 000 [H] Variable cost per unit = [G] / [H] = 4 000/ 4 000 = £1 per unit Total variable costs =1 x 24 000 units = 24 000 Fixed cost = £31 000 – £24 000 = £7 000
76 MAC4861/102
The budgeting process in non-profit-making organisations
The budgeting process in a non-profit-making organisation normally focuses on determining the costs of maintaining current activities and adding the costs of any planned expansions.
Study
• Drury pages 390–391 (9th ed).
Note the following from the studied information:
• the difference between budgeting in non-profit organisations and profit organisations • the use of line-item budgets in non-profit organisations
Zero-based budgeting (ZBB)
Zero-based budgeting is a process where budgets are drawn up from scratch each year. The process is time-consuming and costly to implement, and is therefore frequently carried out on a three- to five-year interval, rather than annually.
Study • Drury pages 391–393 (9th ed).
Note the following from the studied information:
• the difference between zero-based budgeting and incremental budgeting • the implementation of zero-based budgeting • the advantages and disadvantages of zero-based budgeting
Activity 4 Attempt question: (Drury Textbook) 9th ed: Question 15.26 p 401 (Solution p 764)
77 MAC4861/102
Feedback 4 Take particular note of the benefits from and problems with the implementation of ZBB. Criticisms of budgeting Critics have in recent years called for the abandonment of traditional budgeting and suggested that organisations should move “beyond budgeting”.
Study • Drury (9th ed) pages 393–395
Note the following from the studied information:
• the main criticisms of the traditional annual budgeting process • the use of rolling forecasts as the main alternative to annual budgeting
Activity 5
Attempt question: (Drury Student Manual) 9th ed: Question 15.13 p 108
Summary In this learning unit we focussed on further aspects related to budgeting other than those covered at the undergraduate level. We studied the controllability principle, budgeting in non-profit organisations, zero-based budgeting and criticisms of budgeting.
Self-assessment activity Attempt question: (Drury Textbook) 9th ed: Question 16.20 Page 427 (Solution pages 764–765).
78 MAC4861/102
Feedback Question 16.20 (9th ed)
What information have you been given?
A variance has been calculated between budgeted and actual figures.
What is the problem with this calculation? The budget is based on 6 400 units and the actual is based on 7 140 units. You are not comparing apples with apples. To make a proper comparison with the actual figures you must convert your budget into a budget that is based on 7 140 units (since the actual units are 7 140). In other words “flex” your budget. The fixed costs will remain the same in the flexed budget but the variable costs will have to be restated. You have to determine the fixed and variable costs.
Assembly labour hours 5 000 7 500 10 000
Overhead costs $54 500 $76 500 $90 000
The change contains $9 000 of fixed overheads
Stepped fixed overheads change after 7 000 units. Therefore the stepped fixed cost included in the overhead cost for 5 000 hours is different from that included in the overhead cost for 7 500 and 10 000 hours. The stepped fixed cost included for 7 500 and 10 000 hours is the same and therefore they can be used for the high-low method to split the variable and fixed costs.
High low
$ units
90 000 10 000
76 500 7 500
13 500 2 500
Variable cost per unit = $13 500/2 500 units
= $5,40 per unit
Fixed costs = 76 500 – (5.40 x 7 500)
= $76 500 – $40 500
= $36 000
Less: ( $9 000) (included in the $36 000 is this fixed cost amount)
$27 000 Stepped fixed cost
Variable overheads flexed budget = 7 140 x 5,40 = $38 556
79 MAC4861/102
Original budget – 6 400 units
Assembly labour = $51 970 (given) – $2 050 (manager)
= $ 49 920 variable cost
Per unit = $49 920/6400 units = $7,80 per unit
Total overheads given in scenario $62 060
Variable overheads ($5,40 x 6 400 units) ($34 560)
Fixed costs (central headquarters) ($9 000)
Stepped fixed cost $18 500
Flexed budget – 7 140 units
Assembly labour = $49 920/6 400
= $7,80 per unit x 7 140
= $55 692
Furniture packs = $224 000/ 6 400
= $35 per unit x 7 140 units
= $249 900
Other materials = $23 040/6 400
= $3,60 per unit x 7 140
= $25 704
Variable overheads = $5,40 x 7 140
= $38 556
Budgeted stepped fixed cost = $27 000 = actual stepped fixed cost, because the question states that the actual fixed costs for April = budgeted fixed costs.
80 MAC4861/102
LEARNING UNIT 3.2 – Cost management techniques/principles Introduction In the previous learning unit we covered the budgeting process (including reporting on variances to the budget) and other management controls as tools to ensure that objectives are achieved. However, these controls will not necessarily lead to improvements in sales and reduction in costs on their own.
In this learning unit we will study some of the changes in the operating environment of companies and some of the developments in cost management necessitated by these changes.
Changes and developments in the business environment
The modern business environment exposes organisations to increased competition, shorter product life cycles, greater customer demands and the increased use of information technology. As part of these developments, management accounting practices are converging internationally.
Study
Drury chapter 1: 9th ed
Pages 9–11 Global competition/growth in the service industry. Pages 11–12 Changing product life cycles Pages 13–15 Focus on customer satisfaction and new management approaches; ethical
behaviour Page 12 The impact of information technology Page 16 International convergence of management accounting practices
Note the following from the studied information:
• The changes experienced by manufacturing companies due to international competition and imports competing with their products in terms of innovation, variety, quality, cost and customer service.
• The increased competition experienced by service organisations due to privatisation and deregulation leading to more focus on cost management and information needs.
• The dramatic decrease in product life cycles due to global competition, technological innovation and increased customer demands and requirements.
• The key success factors that affect customer satisfaction, namely, cost efficiency, quality, time and innovation.
• New management approaches to achieve customer satisfaction, namely, continuous improvement, employee empowerment, social responsibility and corporate ethics.
• The impact of information technology on customers and on the way that companies produce and sell products and services and record business information.
• Differences in international convergence of management accounting practices at the macro and micro levels.
81 MAC4861/102
Management control systems
Control is a process aimed at ensuring that an organisation follows its planned activities and meets its objectives. Management accounting control systems (which includes the budget) are only one of the various control mechanisms that companies use in the overall control process. We shall first look at different types of controls used by companies in the overall control process.
Study
Drury chapter 16 9th ed
Pages 405–407 Different types of controls Pages 407–408 Feedback and feed-forward controls Pages 408–409 Harmful side-effects of controls Pages 409–410 Advantages and disadvantages of different types of controls Pages 421–422 Side-effects arising from using accounting information for performance
evaluation Pages 422–423 Alternative uses of management accounting information
Note the following from the studied information: • the three categories of controls included in the management control process, namely, action
controls, personnel and cultural controls and results (output) controls • the difference between feedback and feed-forward controls • the harmful side-effects of controls • the advantages and disadvantages of the different categories of control
Activity 1
Attempt question: (Drury Textbook) 9th ed: Question 16.27 p 430 (Solution p 767)
Feedback 1
The focus is on negative behavioural consequences as employees should be ‘incentivised’ to counter these. Link the issues to the budgeting process in your organisation.
82 MAC4861/102
Cost management techniques Cost management is synonymous with cost reduction and focuses on continuous improvement and change. Cost management tends to be used on an ad hoc basis when the opportunity for cost reduction arises and often does not involve the use of accounting techniques. In contrast, traditional cost control systems are applied on a continuous basis and rely heavily on accounting techniques. The emphasis is on cost containment and tends to preserve the status quo without questioning the way existing activities are performed. A typical example is the comparison of actual results against the budget.
Ideally cost management should reduce costs but not at the expense of customer satisfaction.
Study
Drury chapter 21: 9th ed
Pages 561–562 Life-cycle costing Pages 562–567 Target costing Pages 567 Kaizen costing Pages 567–571 Activity-based management (see also learning unit 1.3) Pages 571–572 Benchmarking Pages 527 Business process re-engineering Pages 572–576 Just-in-time systems Pages 576–581 Quality cost management Pages 581–583 Environmental cost management Pages 584–585 Cost management and the value chain
Note the following from the studied information:
• Life-cycle costing determines the costs and revenues over a product’s entire life-cycle including the pre-manufacturing stage (i.e. research and development and design) and the post-manufacturing stage (i.e. post sales service, abandonment and disposal costs).
• The use of target costing as a cost management tool in addition to a mechanism for determining selling prices.
• The difference between target costing and kaizen costing. • The use of activity-based management to manage activities and thus manage costs in the long
term. • The goals and main features of just-in-time (JIT) production methods. • The use of backflush costing to do the accounting entries for a JIT manufacturing system. • The use of a cost of quality report as well as an environmental cost report. Notice the similarities
in the type of costs as well as layout. • The use of value chain analysis to increase customer satisfaction and manage costs more
effectively.
83 MAC4861/102
Activity 2
Attempt question: (Drury Student Manual) 9th ed: Question 21.2 p 151 Attempt question: (Drury Textbook) 9th ed: Question 21.26 p 595 (Solution p 793) Enrichment activity
Google ‘JIT’ and ‘Toyoto’ and read about the real life impact of this policy on the company, before and after the 2011 quakes that hit Japan.
Benchmarking
External and internal benchmarking can be used to compare key activities or processes in order to improve them.
Study • Drury (9th ed) pages 571–572 (Benchmarking)
Note the following from the studied information:
• the advantages and disadvantages of benchmarking
Activity 3 Attempt question: (Drury Student Manual) 9th ed: Question 21.3 Strategic management accounting (SMA)
CIMA defines strategic management accounting as “a form of management accounting in which emphasis is placed on information which relates to factors external to the entity, as well as non-financial information and internally generated information.”
84 MAC4861/102
Study • Drury pages 598–601 (Drury 9th ed)
Also refer to the learning unit in Finance Tutorial Letter 104 regarding strategy.
Summary
In this learning unit we looked at changes in the business environment and developments in cost management techniques and philosophies. We also investigated other management control systems and their influence on employee behaviour. The use of benchmarking was also explained.
Self-assessment activity
Ensure that you can describe the following concepts briefly in a paragraph:
1 Action or behavioural controls 2 Personnel, cultural and social controls 3 Results or output controls 4 Feedback and feed-forward controls 5 Life-cycle costing 6 Target costing 7 Kaizen costing 8 Activity-based management 9 Benchmarking 10 Business process re-engineering 11 Just-in-time systems 12 Quality cost management 13 Environmental cost management 14 Cost management and the value chain 15 Strategic management accounting
Enrichment activity
Google the following concepts and read about a company that employs them:
• Life-cycle costing
• Kaizen costing
• Just-in-time systems
You can also look it up in Wikipedia at http://www.wikipedia.org for more background on the history and applications.
85 MAC4861/102
LEARNING UNIT 3.3 Cost-volume-profit analysis
Prior learning
This course assumes that students have already mastered the work equivalent to that presented in Unisa’s preceding undergraduate degree. Please ensure that you are up to date with the prior learning for cost-volume-profit analysis. If not, please refer to your undergraduate study material and revise the following indicated pages of the textbook, namely Drury, using the page numbers below:
Prior learning Drury 9th ed
Before studying this topic, you should be able to do the following:
Applicable references:
• Calculate a break-even point and margin of safety.
• Calculate sensitivities for changes in any variables in the CVP model.
Drury: Chapter 8: Cost-Volume-Profit analysis. Pages 172–190
Introduction
In previous learning units, we looked at cost accumulation for inventory valuation and profit measurement using different bases. In this learning unit, we will consider the use of the same basic financial information for decision-making by means of cost-volume-profit (CVP) analysis. CVP is especially valuable during planning and budgeting as it gives a broad indication of expected outcomes at different levels for different variables in the CVP model. The breakeven analysis and margin of safety are also very useful tools in measuring the riskiness of various plans or scenarios in the budget.
Focus notes Why does a business have to calculate a break-even point? • When you start a business you want to determine what sales level is required for it to survive.
• For a typical start-up business, it is critical to ensure that ongoing operating costs are covered by sales revenue in the short to medium term.
• In the long term, the business can focus on making a profit. Once again the breakeven point and margin of safety will indicate the riskiness or sensitivities of various plans or strategies.
86 MAC4861/102
Application of CVP • Please note that ALL variable costs and ALL fixed costs (production AND non-production costs) are included in the break-even calculation.
• Contribution per unit equals the sales price per unit less ALL variable costs per unit. The contribution margin ratio is the contribution expressed as a percentage of sales.
• The net profit figure in a break-even calculation is ALWAYS BEFORE TAX. Therefore if you are told in a question that you are trying to achieve a net profit AFTER tax of, for example R50 000, you must first convert the R50 000 to a BEFORE tax amount before you use it in the break-even calculation.
• Remember that a break-even point (in units) should always be ROUNDED UP as one less unit sold will lead to a small loss.
• Unit information usually indicates a break-even in units and value/monetary information (eg rand or a ratio based on rand) a break-even in rand.
• The net profit is derived from the units sold in excess of the breakeven point, i.e. the contribution from the margin of safety sales.
• The margin of safety % indicates by how much sales volume can decline before the entity makes NIL profit.
• Sensitivity % for other variables in the model indicates how big a change can be absorbed before the entity makes no profit.
- ∆ in selling price/unit
- ∆ in variable cost/unit
- ∆ in total fixed costs
Impact of factors
All other factors remaining the same:
• An increase in selling price per unit will increase the contribution per unit and decrease the break-even sales required.
• An increase in variable cost per unit will decrease the contribution per unit and increase the break-even sales required.
• An increase in total fixed cost will increase the sales required to break even. Generally, you will first have to determine the nature of the costs before proceeding with the break-even calculation.
Activity 1 – Basic revision principles
Work through example 8.1 in Drury page 176 (9th ed).
87 MAC4861/102
Feedback 1 The contribution is: per unit £20 - £10 = £10 or on a value basis £10/£20 = 50% 60 000 The break-even: (units) then 10 = 6 000 tickets 60 000 The break-even: (revenue) then 0,5 = £ 120 000 Or 6 000 tickets at £20 each To make a profit of £30 000, the profit is treated as a ‘given’ and becomes equivalent to a fixed cost for that event (or period). 60 000 + 30 000 The equation now becomes (in units) 10 = 9 000 tickets A sale of 8 000 tickets will tickets will yield a profit of: 8 000 x 10 (contribution pu) – 60 000 = £20 000. The required selling price for 8 000 tickets with a required profit of £30 000 becomes: 8 000x
= 170 000 with
x = 170 000 ÷ 8 000 = £21,25
NB: Note that in this example you were presented with the variable and fixed costs. Generally, you will first have to determine the nature of the costs before proceeding with the break-even calculation.
Activity 2 – Basic application The founder and majority stakeholder of Tekkie Town explained in a 2011 press interview that he started the business by buying 12 000 pairs of tekkies and boots at R100 per pair. He sold 80% of this inventory at double the cost price from selected venues and special events to keep the fixed cost as low as possible. Assume the fixed cost to be R240 000 for this event. The balance of the inventory could not be sold and was donated to various charities. REQUIRED Calculate the break-even in rand and the margin of safety for this event.
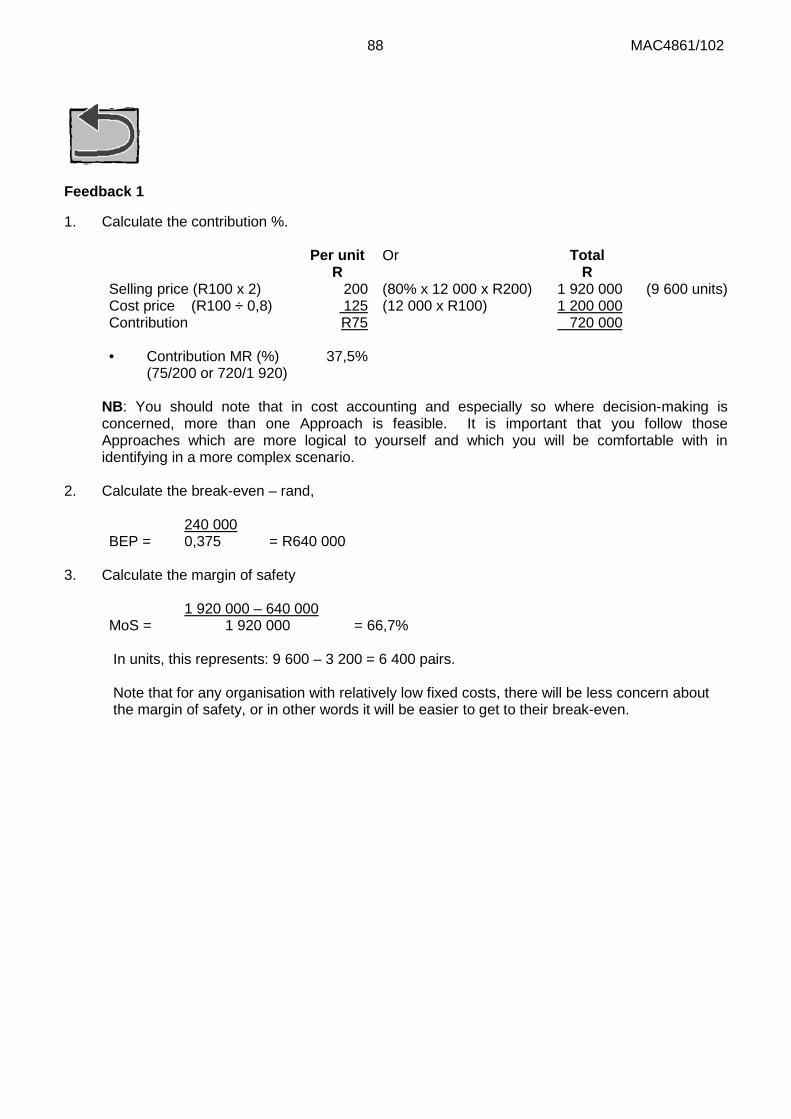
88 MAC4861/102
Feedback 1
1. Calculate the contribution %.
Per unit R
Or Total R
Selling price (R100 x 2) 200 (80% x 12 000 x R200) 1 920 000 (9 600 units) Cost price (R100 ÷ 0,8) 125 (12 000 x R100) 1 200 000 Contribution R75 720 000 • Contribution MR (%) (75/200 or 720/1 920)
37,5%
NB: You should note that in cost accounting and especially so where decision-making is concerned, more than one Approach is feasible. It is important that you follow those Approaches which are more logical to yourself and which you will be comfortable with in identifying in a more complex scenario.
2. Calculate the break-even – rand,
240 000 BEP = 0,375 = R640 000
3. Calculate the margin of safety
1 920 000 – 640 000 MoS = 1 920 000 = 66,7%
In units, this represents: 9 600 – 3 200 = 6 400 pairs. Note that for any organisation with relatively low fixed costs, there will be less concern about the margin of safety, or in other words it will be easier to get to their break-even.
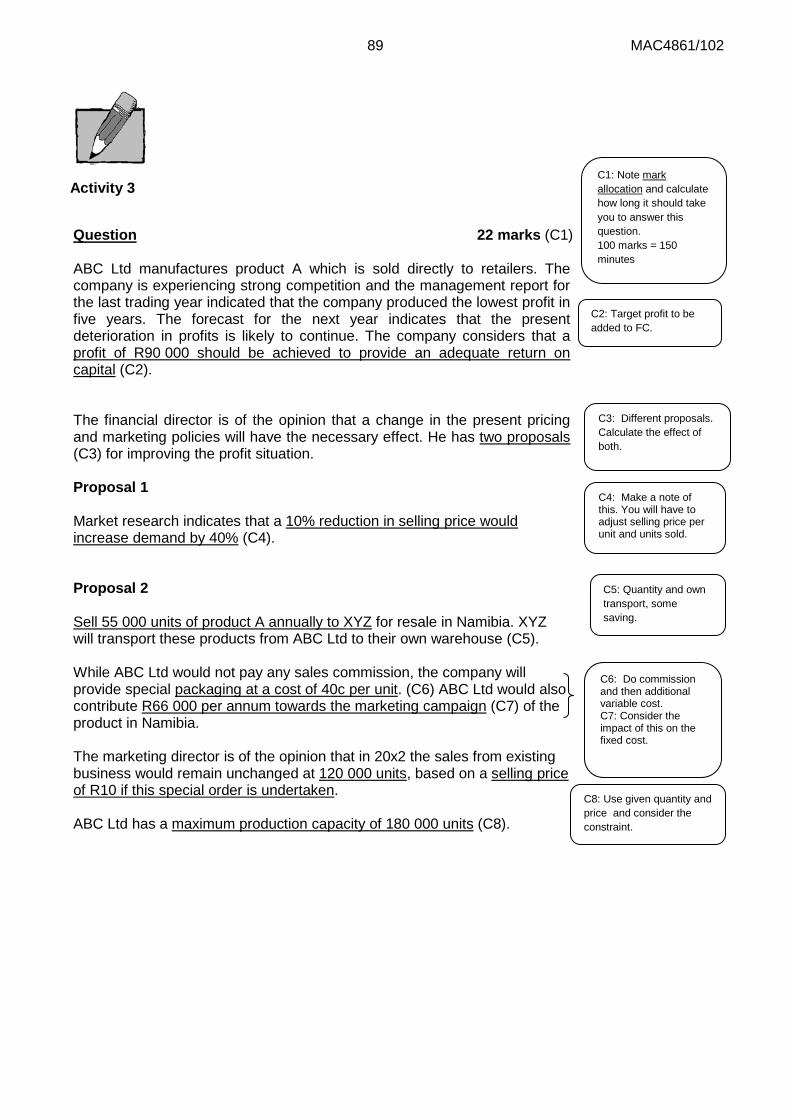
89 MAC4861/102
Activity 3
Question 22 marks (C1) ABC Ltd manufactures product A which is sold directly to retailers. The company is experiencing strong competition and the management report for the last trading year indicated that the company produced the lowest profit in five years. The forecast for the next year indicates that the present deterioration in profits is likely to continue. The company considers that a profit of R90 000 should be achieved to provide an adequate return on capital (C2). The financial director is of the opinion that a change in the present pricing and marketing policies will have the necessary effect. He has two proposals (C3) for improving the profit situation. Proposal 1 Market research indicates that a 10% reduction in selling price would increase demand by 40% (C4). Proposal 2 Sell 55 000 units of product A annually to XYZ for resale in Namibia. XYZ will transport these products from ABC Ltd to their own warehouse (C5). While ABC Ltd would not pay any sales commission, the company will provide special packaging at a cost of 40c per unit. (C6) ABC Ltd would also contribute R66 000 per annum towards the marketing campaign (C7) of the product in Namibia. The marketing director is of the opinion that in 20x2 the sales from existing business would remain unchanged at 120 000 units, based on a selling price of R10 if this special order is undertaken. ABC Ltd has a maximum production capacity of 180 000 units (C8).
C1: Note mark allocation and calculate how long it should take you to answer this question. 100 marks = 150 minutes
C4: Make a note of this. You will have to adjust selling price per unit and units sold.
C6: Do commission and then additional variable cost. C7: Consider the impact of this on the fixed cost.
C5: Quantity and own transport, some saving.
C2: Target profit to be added to FC.
C3: Different proposals. Calculate the effect of both.
C8: Use given quantity and price and consider the constraint.
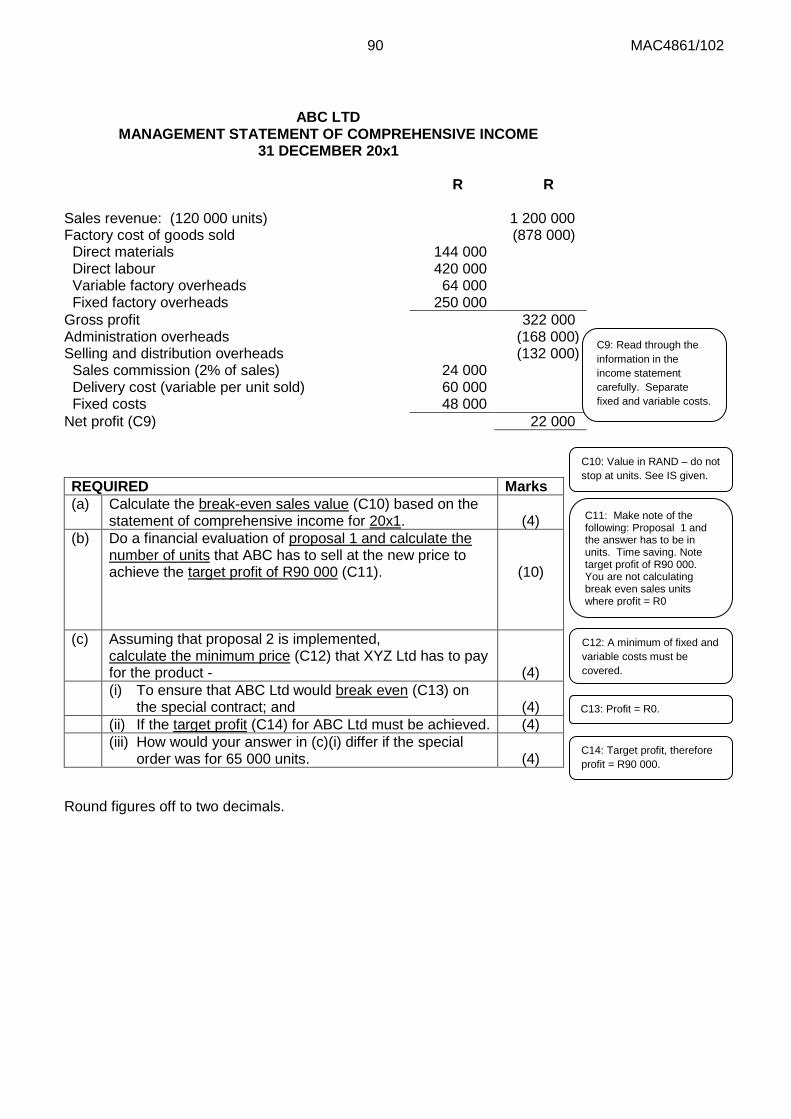
90 MAC4861/102
ABC LTD MANAGEMENT STATEMENT OF COMPREHENSIVE INCOME
31 DECEMBER 20x1
R R
Sales revenue: (120 000 units) 1 200 000 Factory cost of goods sold (878 000) Direct materials 144 000 Direct labour 420 000 Variable factory overheads 64 000 Fixed factory overheads 250 000 Gross profit 322 000 Administration overheads (168 000) Selling and distribution overheads (132 000) Sales commission (2% of sales) 24 000 Delivery cost (variable per unit sold) 60 000 Fixed costs 48 000 Net profit (C9) 22 000
REQUIRED Marks (a) Calculate the break-even sales value (C10) based on the
statement of comprehensive income for 20x1.
(4)
(b) Do a financial evaluation of proposal 1 and calculate the number of units that ABC has to sell at the new price to achieve the target profit of R90 000 (C11).
(10)
(c) Assuming that proposal 2 is implemented, calculate the minimum price (C12) that XYZ Ltd has to pay for the product -
(4)
(i) To ensure that ABC Ltd would break even (C13) on the special contract; and
(4)
(ii) If the target profit (C14) for ABC Ltd must be achieved. (4) (iii) How would your answer in (c)(i) differ if the special
order was for 65 000 units.
(4)
Round figures off to two decimals.
C10: Value in RAND – do not stop at units. See IS given.
C11: Make note of the following: Proposal 1 and the answer has to be in units. Time saving. Note target profit of R90 000. You are not calculating break even sales units where profit = R0
C12: A minimum of fixed and variable costs must be covered.
C13: Profit = R0.
C14: Target profit, therefore profit = R90 000.
C9: Read through the information in the income statement carefully. Separate fixed and variable costs.
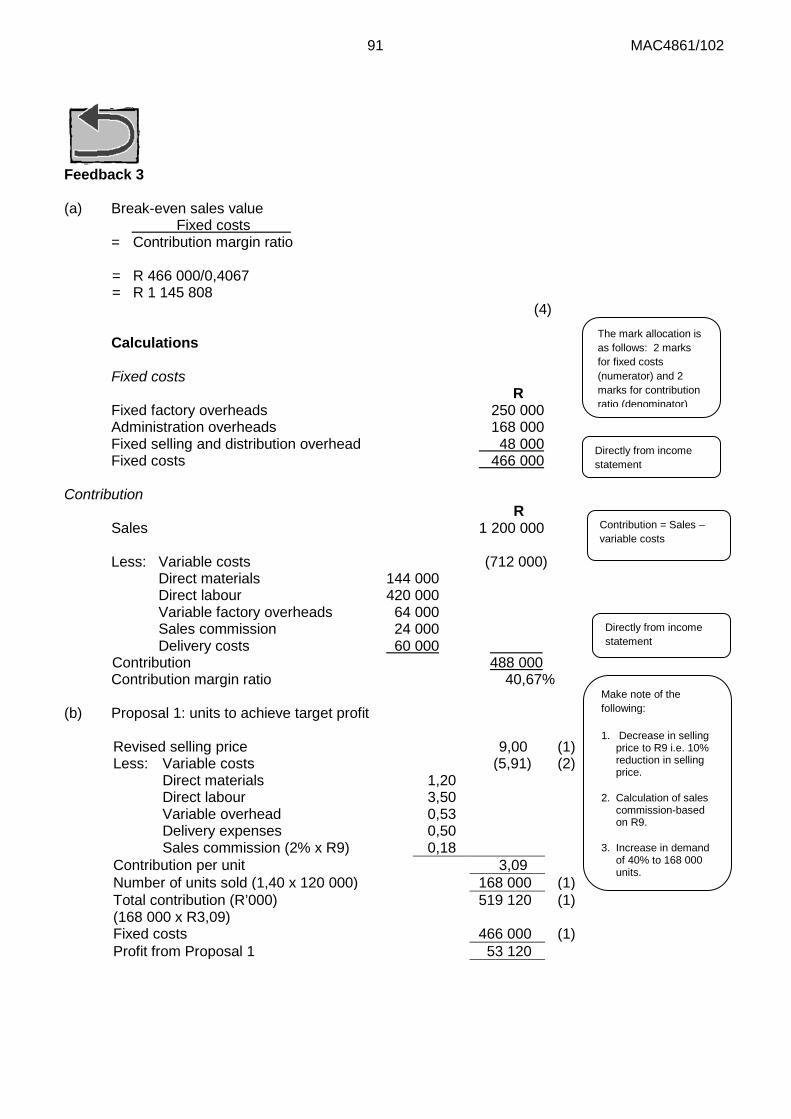
91 MAC4861/102
Feedback 3 (a) Break-even sales value Fixed costs = Contribution margin ratio
= R 466 000/0,4067 = R 1 145 808 (4)
Calculations Fixed costs R Fixed factory overheads 250 000 Administration overheads 168 000 Fixed selling and distribution overhead 48 000 Fixed costs 466 000 Contribution R Sales 1 200 000 Less: Variable costs (712 000) Direct materials 144 000
Direct labour 420 000 Variable factory overheads 64 000 Sales commission 24 000 Delivery costs 60 000 Contribution 488 000
Contribution margin ratio 40,67% (b) Proposal 1: units to achieve target profit Revised selling price 9,00 (1) Less: Variable costs (5,91) (2) Direct materials 1,20 Direct labour 3,50 Variable overhead 0,53 Delivery expenses 0,50 Sales commission (2% x R9) 0,18 Contribution per unit 3,09 Number of units sold (1,40 x 120 000) 168 000 (1) Total contribution (R’000) (168 000 x R3,09)
519 120 (1)
Fixed costs 466 000 (1) Profit from Proposal 1 53 120
The mark allocation is as follows: 2 marks for fixed costs (numerator) and 2 marks for contribution ratio (denominator)
Directly from income statement
Contribution = Sales – variable costs
Make note of the following:
1. Decrease in selling price to R9 i.e. 10% reduction in selling price.
2. Calculation of sales commission-based on R9.
3. Increase in demand of 40% to 168 000 units.
Directly from income statement
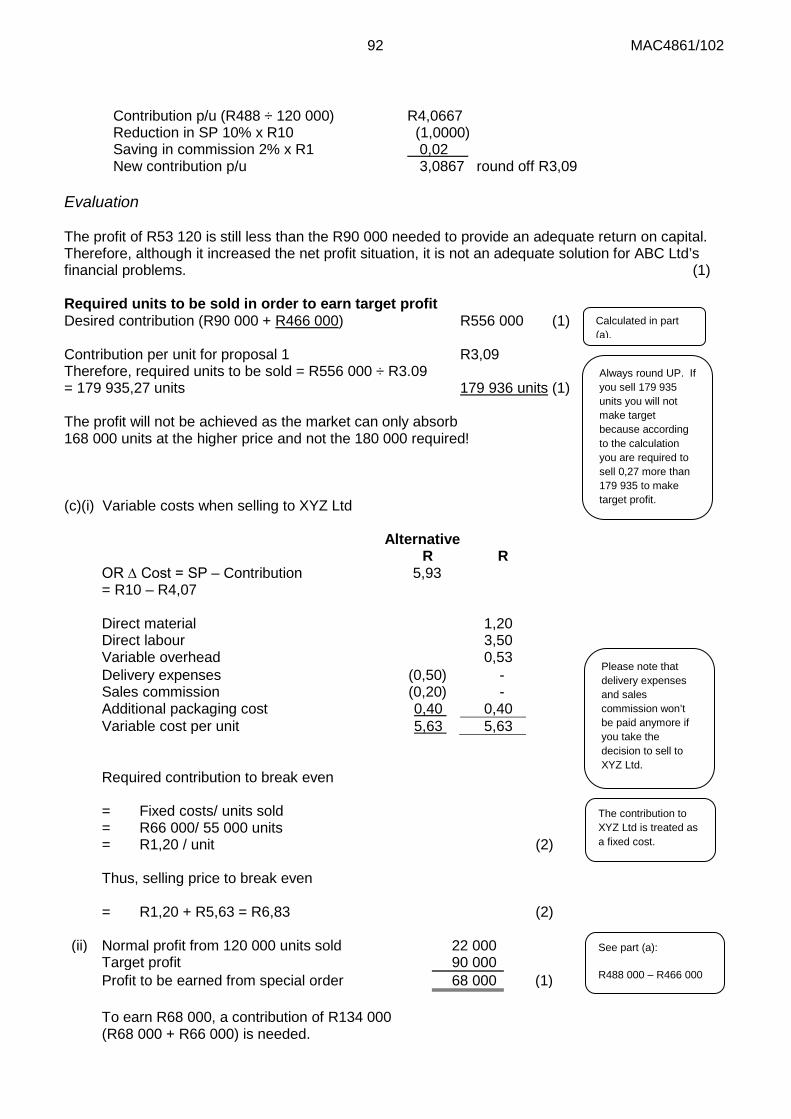
92 MAC4861/102
Contribution p/u (R488 ÷ 120 000) R4,0667 Reduction in SP 10% x R10 (1,0000) Saving in commission 2% x R1 0,02 New contribution p/u 3,0867 round off R3,09 Evaluation The profit of R53 120 is still less than the R90 000 needed to provide an adequate return on capital. Therefore, although it increased the net profit situation, it is not an adequate solution for ABC Ltd’s financial problems. (1) Required units to be sold in order to earn target profit Desired contribution (R90 000 + R466 000) R556 000 (1) Contribution per unit for proposal 1 R3,09 Therefore, required units to be sold = R556 000 ÷ R3.09 = 179 935,27 units 179 936 units (1) The profit will not be achieved as the market can only absorb 168 000 units at the higher price and not the 180 000 required! (c)(i) Variable costs when selling to XYZ Ltd Alternative R R OR ∆ Cost = SP – Contribution 5,93 = R10 – R4,07
Direct material 1,20 Direct labour 3,50 Variable overhead 0,53 Delivery expenses (0,50) - Sales commission (0,20) - Additional packaging cost 0,40 0,40 Variable cost per unit 5,63 5,63 Required contribution to break even = Fixed costs/ units sold = R66 000/ 55 000 units = R1,20 / unit (2) Thus, selling price to break even = R1,20 + R5,63 = R6,83 (2) (ii) Normal profit from 120 000 units sold 22 000 Target profit 90 000
Profit to be earned from special order 68 000 (1) To earn R68 000, a contribution of R134 000 (R68 000 + R66 000) is needed.
Calculated in part (a).
Always round UP. If you sell 179 935 units you will not make target because according to the calculation you are required to sell 0,27 more than 179 935 to make target profit.
The contribution to XYZ Ltd is treated as a fixed cost.
See part (a):
R488 000 – R466 000
Please note that delivery expenses and sales commission won’t be paid anymore if you take the decision to sell to XYZ Ltd.
93 MAC4861/102
That is R2,44 (R134 000/55 000) per unit. Thus, selling price for special order: R2,44 + R5,63 = R8,07
(iii) Production capacity is limited to 180 000 units 120 000 + 65 000 = 185 000 units: 5 000 units from existing sales would have to be sacrificed.
Opportunity cost to be covered 5 000 x R4,07 = R20 350 Spread over 65 000 units (R20 350 ÷ 65 000) Other variable costs Fixed costs R66 000/65 000 Selling price for special order
R0,31 5,63 1,02 6,96
(1) (1) (1) (1)
Activity 4 Attempt question 18, only parts (d) and (e), in the Question Bank (South Ltd).
Summary In this learning unit we focused on the calculation of the break-even point, the margin of safety and the impact of changes in calculation components on profit.
Self-assessment activity
Knowledge check:
Before proceeding to the next learning unit, ensure that you are familiar with the following concepts:
Yes/No 1. Classification of costs 2. Determination of fixed and variable costs 3. Definition and calculation of contribution 4. Calculation of the break-even point 5. Interpretation of margin of safety and other sensitivity percentages 6. Effect of change of a given factor on profit or other relevant issue
94 MAC4861/102
Integrated self-assessments As mentioned in the Introduction you will now have the opportunity to assess whether you can apply your technical knowledge of individual topics, in an integrated scenario. We will start with an easier case study and then progress to a more advanced one.
General guidelines You should attempt the case studies under exam conditions. Time yourself. In real tests, you receive the scenario first and have reading time before receiving the required section. You should attempt the case studies in this tutorial letter in the same manner.
Read the information in the scenario at least twice.
Ensure that you have read every line in the scenario. Remember that you have to use all the information that is given to you. Read the scenario line by line and highlight important information, relating this as far as possible to particular topics and principles even though you do not yet know the content of the required section. Read the ‘required’ very attentively. Note specifically what you should present in the answer, i.e.: - budget, actual or forecast amounts – what advice is required - for the year, month or week - standard or actual - costing basis (variable or absorption) This is the methodology that you should use for every question that you attempt. We will now take you through activities to illustrate the approach. You are also advised to work through as many questions as possible in the Drury Student Manual. Use information encountered for the first time to build up a data base of ‘info statements’ linked to ‘what to do’s’. This is what you need to look for when reading a test or examination scenario. Once you have read and understood the scenario and the ‘required’ you can start answering the question.
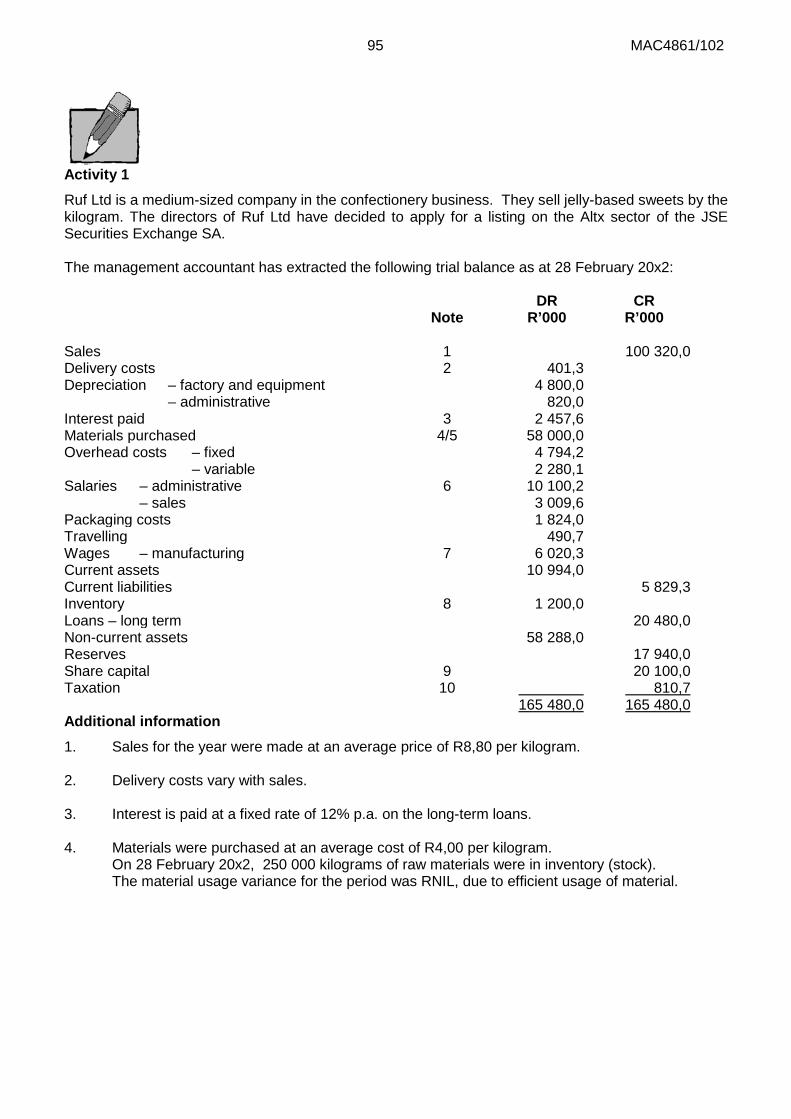
95 MAC4861/102
Activity 1 Ruf Ltd is a medium-sized company in the confectionery business. They sell jelly-based sweets by the kilogram. The directors of Ruf Ltd have decided to apply for a listing on the Altx sector of the JSE Securities Exchange SA. The management accountant has extracted the following trial balance as at 28 February 20x2: DR CR Note R’000 R’000 Sales 1 100 320,0 Delivery costs 2 401,3 Depreciation – factory and equipment 4 800,0 – administrative 820,0 Interest paid 3 2 457,6 Materials purchased 4/5 58 000,0 Overhead costs – fixed 4 794,2 – variable 2 280,1 Salaries – administrative 6 10 100,2 – sales 3 009,6 Packaging costs 1 824,0 Travelling 490,7 Wages – manufacturing 7 6 020,3 Current assets 10 994,0 Current liabilities 5 829,3 Inventory 8 1 200,0 Loans – long term 20 480,0 Non-current assets 58 288,0 Reserves 17 940,0 Share capital 9 20 100,0 Taxation 10 810,7 165 480,0 165 480,0 Additional information
1. Sales for the year were made at an average price of R8,80 per kilogram. 2. Delivery costs vary with sales. 3. Interest is paid at a fixed rate of 12% p.a. on the long-term loans. 4. Materials were purchased at an average cost of R4,00 per kilogram. On 28 February 20x2, 250 000 kilograms of raw materials were in inventory (stock). The material usage variance for the period was RNIL, due to efficient usage of material.
96 MAC4861/102
5. Ruf Ltd has determined the standard cost of one kilogram of sweets (from 1 March 20x1 to 28 February 20x2) to be:
R Material (1,25 kg input @ R3,96 / kg 4,95 Depreciation – manufacturing 0,40 Overheads – fixed 0,40 Overheads – variable 0,20 Packaging 0,15 Wages 0,50
6,60
The standard cost per kilogram was based on production of 12 000 000 kilograms sweets. 6. Administrative salaries are considered to be of a fixed nature. 7. Manufacturing wages are considered to be of a fixed nature. 8. Inventory on 1 March 20x1 consisted only of completed product, valued at R6,00 per kilogram - no raw materials were held on this date. 9. Valuation of closing inventory: Raw materials at cost and completed products at standard cost. REQUIRED Marks Calculate Ruf Ltd’s profit before taxation for the year ended 28 February 20x2. (No variances are required.)
(20)
The given information can also be used for break-even calculations and standard costing analysis • Consider what information you would have used in such a case. • If you were a lecturer, what other areas could you have assessed with the given information, or
by adding some extra information? (Test 2006: adapted)
Feedback 1
Note 1: What were you provided with in this question? • A trial balance – take note of all the balances that are given to you in this question. • Sales @ average net price • Materials @ average net cost • Opening and closing inventory of raw materials and finished goods always a good starting
point for a question. Questions often give 3 of the 4. • Cost per kilogram of sweets (fixed overheads are included in this balance) • Fixed and variable expenses • 20 marks equal 30 minutes based on 40 test marks in one hour
97 MAC4861/102
Note 2: Read the required carefully Even if you don’t immediately understand what the question is asking, it will still be a guide for what to look for in the scenario. Keep the following in mind: 1. The required section usually follows the flow in the scenario. 2. The marks shown will be indicative of the time to be spent on a particular section. Pay attention
to the critical words e.g. calculate, evaluate, advise and so on. Note 3: Calculate Ruf Ltd’s profit before taxation for the year ended 28 February 20x2. (No variances are required.) All inventories are valued at standard cost. What do you understand from this? • Year end – 28 February 20x2 (Check what are the dates of the information given to you in the
question, note that your year end is 28/02/x2.) • On what basis should the profit be determined and closing inventory valued? The standard cost
includes fixed cost per kg, therefore the absorption method Applies. • No variances are required – what do they mean? Even though standard costs are provided (for
inventory valuation purposes), it will not be necessary to calculate a volume variance for fixed overheads or any other variance.
• Closing inventories at actual and standard cost – make note of this. • The material usage variance is RNIL. This implies that all material issued to production was used
efficiently, that is at the required standard! • You can therefore use the materials issued to determine how many units were manufactured! Note 4: • The first objective is to split the costs between manufacturing and non-manufacturing, as only manufacturing costs may be taken into inventory. ● Quantities for sales and production must be determined to get the impact on inventory. ● In this case production is less than normal capacity of 12 000 000 kg; however, no volume variance was required – relating to allocation of fixed overhead. ● Inventory at 28 February 20x2 consists of both material and completed product. ● Sales cost is usually a function of total sales value. • The inventory in the trial balance relates only to completed units (opening balance) per note 8.
Note 4 states that there were raw materials on hand in 20x2. The implication is that one must determine whether there were also completed units on that date (20x2).
Statement of Comprehensive Income for Management Purposes
R’000 Sales (11 400 000 kgs @ 8,80) [Good practice to show quantity and price]
100 320,0 (1)
Opening inventory (200 000 @ 6,00 – given note 8) 1 200,0 (2) Materials 58 000,0 (1) Depreciation – manufacturing 4 800,0 (1) Overheads – fixed 4 794,2 (1) Overheads – variable 2 280,1 (1) Packaging 1 824,0 (1) Wages 6 020,3 (1) Closing inventory (2 320,0) (1) Cost of sales 76 598,6 (1) Gross profit 23 721,4
98 MAC4861/102
Delivery costs
401,3 Depreciation – admin 820,0 Salaries – admin 10 100,2 – sales 3 009,6 Travelling 490,7 Operational costs 14 821,8 (2) Operating profit Finance charges 8 899,6 (1) Net profit 2 457,6 6 442,0
Calculation 1. Materials purchased 58 000 000 ÷ 4 = 14 500 000 kg
(1)
2.
Production
RAW kg
Opening inventory (given in note 8) 0 Purchased 14 500 000 Closing inventory (note 4) 250 000 Issued production 14 250 000 (1) (÷ 1,25 kg standard)
Opening (Note 8: R1 200 ÷ R6,00) Sales Produced – same as sales (14 250 000 kg ÷ 1,25 kg standard)
COMPLETE Kg
200 000
(11 400 000) 11 400 000
(1)
∴ Closing inventory – complete (no change on O/I) 200 000 (1) 3. Inventory R Materials 250 000 x R4 1 000 000 (1) Product 200 000 x R6,60 (standard cost price) 1 320 000 (1) 2 320 000
Raw materials
Finished goods
Kg
Units
Opening balance Given 0
200,000
(1 200 000 / 6)
Purchased 58 000 000/4 = 14 500 000 Produced
(14 250 000) ÷ 1,25
11 400 000
Less: Issued to production #2
(14 250 000) Sold (11 400 000)
(Balancing figure)
[100 320000/ 8,80]
Equal Closing inventory
250,000
200,000 (Balancing
figure)
@ Actual/Standard
at R4
at R6,60
1,000,000
1,320,000
99 MAC4861/102
Activity 2 – Advanced
Crax Ltd has for many years produced its own well-known brand of savoury snacks exclusively for the retail consumer market (Spar, Checkers, etc). Recently, it introduced a reduced fat product, hoping to penetrate the highly lucrative diet food market, but its penetration into this market has been slower than predicted. Production takes place at its highly automated plant in Pinetown. The production process starts with the mixing of ingredients (flour, butter and oil) and kneading of the dough. Dough is then cut into forms and baked. After baking the savoury spices are sprinkled over just before sealing into individual packets. Retail snacks are sold in packets of 250 g. The diet snacks are 20% smaller per biscuit than the retail snacks, uses less butter and oil and it is also slightly less savoury in order to cut down on kilojoules. It is baked longer for a more crispy effect. Due to the lower butter and oil content, it takes longer to knead the dough. Diet snacks come in packets of 200 g. The size of the foil wrapping of individual packets are similar for the retail packets and the diet packets. Crax’s existing costing system is very unsophisticated and the system does not distinguish between savoury snacks produced for the retail market or those for the diet market. The costs include direct materials being flour, butter and oil (used to make the dough) and savoury spices, as well as fixed overhead costs. A single fixed overhead cost pool for all other conversion costs related to production exists. Fixed production overhead costs are allocated to inventory on the basis of kilograms processed. Although the dough for the two products differ in terms of its contents, the physical quantities are used as an allocation base. This year’s total actual costs of producing 21 600 000 packets for the retail market and 3 000 000 packets for the diet market are: R Flour, butter, oil (“dough”) used 24 000 000 Savoury spices 6 000 000 All other production costs 10 476 000 Recently, Crax lost the bid for a large new contract for Weigh-Less branded snacks. Its bid price was reportedly R0,20 per kg higher than the winning bid. This came as a shock to Crax as they only added a 4% profit margin onto its cost to arrive at the bid price per kilogram, as the industry is fiercely competitive. Moreover, their plant was widely acknowledged as being in the upper quartile for operating efficiency. The finance manager was subsequently fired for producing inaccurate costing information. The new financial manager decided to explore several ways of refining the costing system. Firstly, it was identified that R1 230 000 of the R10 476 000 production costs pertained to packaging costs (foil wrappings). Packaging time per product unit is identical for the two products. In terms of savoury spices, 96% of orders (time and value) was spent on retail and the remainder on the diet orders.
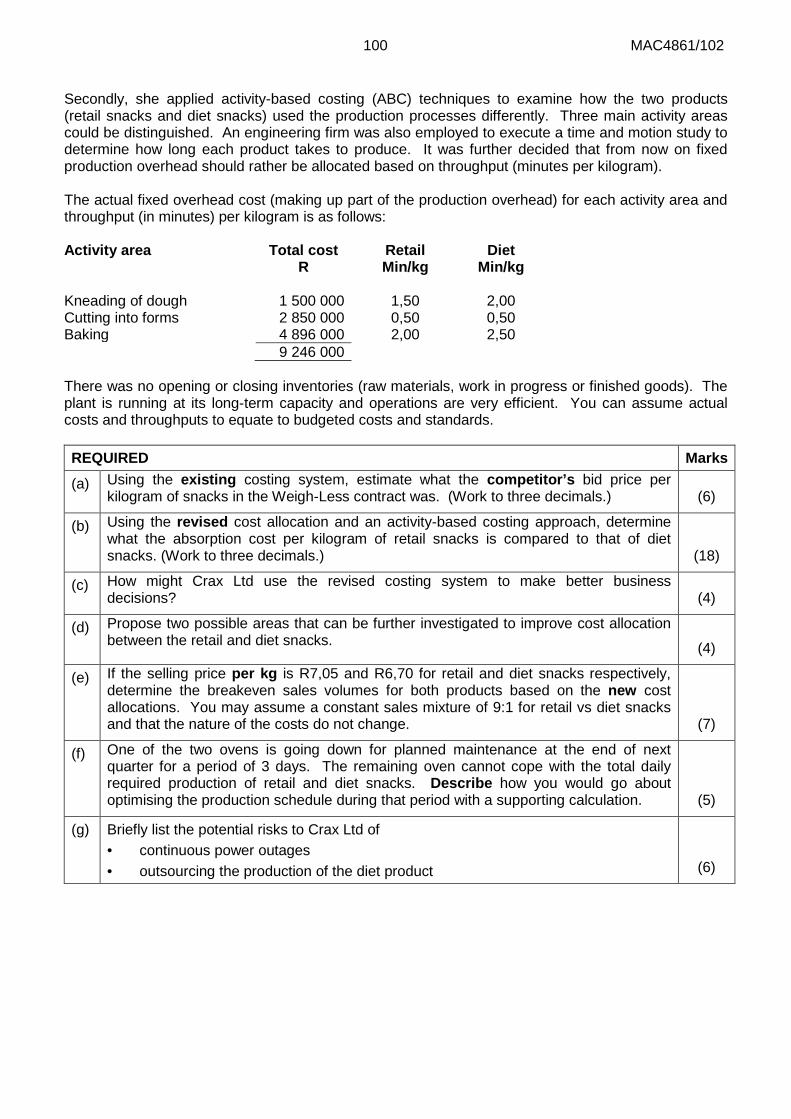
100 MAC4861/102
Secondly, she applied activity-based costing (ABC) techniques to examine how the two products (retail snacks and diet snacks) used the production processes differently. Three main activity areas could be distinguished. An engineering firm was also employed to execute a time and motion study to determine how long each product takes to produce. It was further decided that from now on fixed production overhead should rather be allocated based on throughput (minutes per kilogram). The actual fixed overhead cost (making up part of the production overhead) for each activity area and throughput (in minutes) per kilogram is as follows: Activity area Total cost
R Retail Min/kg
Diet Min/kg
Kneading of dough Cutting into forms Baking
1 500 000 2 850 000 4 896 000
1,50 0,50 2,00
2,00 0,50 2,50
9 246 000 There was no opening or closing inventories (raw materials, work in progress or finished goods). The plant is running at its long-term capacity and operations are very efficient. You can assume actual costs and throughputs to equate to budgeted costs and standards. REQUIRED Marks
(a) Using the existing costing system, estimate what the competitor’s bid price per kilogram of snacks in the Weigh-Less contract was. (Work to three decimals.) (6)
(b) Using the revised cost allocation and an activity-based costing approach, determine what the absorption cost per kilogram of retail snacks is compared to that of diet snacks. (Work to three decimals.)
(18)
(c) How might Crax Ltd use the revised costing system to make better business decisions? (4)
(d) Propose two possible areas that can be further investigated to improve cost allocation between the retail and diet snacks.
(4)
(e) If the selling price per kg is R7,05 and R6,70 for retail and diet snacks respectively, determine the breakeven sales volumes for both products based on the new cost allocations. You may assume a constant sales mixture of 9:1 for retail vs diet snacks and that the nature of the costs do not change.
(7)
(f) One of the two ovens is going down for planned maintenance at the end of next quarter for a period of 3 days. The remaining oven cannot cope with the total daily required production of retail and diet snacks. Describe how you would go about optimising the production schedule during that period with a supporting calculation.
(5)
(g) Briefly list the potential risks to Crax Ltd of • continuous power outages • outsourcing the production of the diet product (6)
101 MAC4861/102
Feedback 2
Note 1: What have they given in this question? • 2 products, different weights • Same size wrapping • Fixed overhead pool allocated on weight (kgs) • Production quantities • Dough also on physical (kg) basis, as above for FOH • Special order not accepted • Special order: 4% margin on cost – high efficiency • Overhead cost split into packaging and three activities, all time driven • No opening or closing inventory, implies production = sales • Running at LT capacity and efficiency, see margin above • Actual costs equate to budgeted costs Note 2: Read the required carefully. You will now have an idea of how the question information relates to the required section. Keep in mind that the marks shown will be indicative of the time to be spent as a particular section (50 marks = 75 minutes). Note the highlighted words: (a) Existing … competitor’s (b) Revised (e) per kg … new (cost) (f) describe … Note 3: What do you understand from this? (a) Using the existing ( absorption costing) costing system, estimate what the competitors’ bid price … ( benchmark for costs). (b) … revised cost allocation and an activity-based approach (approach is given): (c) …use the revised cost system (ABC), to make practical recommendations; start with the revised cost calculated in (b)) (d) … two further areas to improve … ( look at what is the same under the old and may change when using the new) (e) … sales price per kg … calculate BE based on new cost (ABC) and given mix … ( contribution and variable and fixed cost required) (f) Describe … with a supporting calculation ( oven implies baking the constraint) (g) Risks ( relevant to the current processes) NB: Note the request to work to three (3) decimals. Note 4: Focus notes Use the focus notes to correct your mistakes.
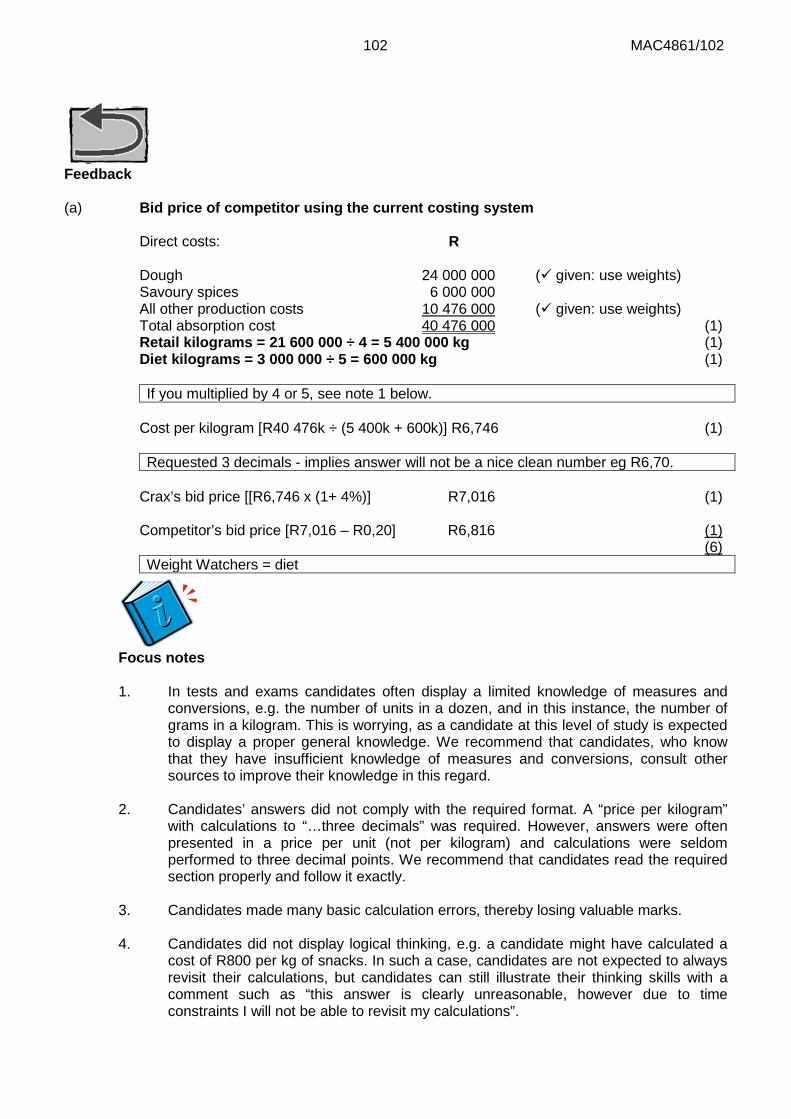
102 MAC4861/102
Feedback (a) Bid price of competitor using the current costing system
Direct costs: R Dough 24 000 000 ( given: use weights) Savoury spices 6 000 000 All other production costs 10 476 000 ( given: use weights) Total absorption cost 40 476 000 (1) Retail kilograms = 21 600 000 ÷ 4 = 5 400 000 kg (1) Diet kilograms = 3 000 000 ÷ 5 = 600 000 kg (1) If you multiplied by 4 or 5, see note 1 below.
Cost per kilogram [R40 476k ÷ (5 400k + 600k)] R6,746 (1) Requested 3 decimals - implies answer will not be a nice clean number eg R6,70.
Crax’s bid price [[R6,746 x (1+ 4%)] R7,016 (1) Competitor’s bid price [R7,016 – R0,20] R6,816 (1) (6) Weight Watchers = diet
Focus notes 1. In tests and exams candidates often display a limited knowledge of measures and
conversions, e.g. the number of units in a dozen, and in this instance, the number of grams in a kilogram. This is worrying, as a candidate at this level of study is expected to display a proper general knowledge. We recommend that candidates, who know that they have insufficient knowledge of measures and conversions, consult other sources to improve their knowledge in this regard.
2. Candidates’ answers did not comply with the required format. A “price per kilogram”
with calculations to “…three decimals” was required. However, answers were often presented in a price per unit (not per kilogram) and calculations were seldom performed to three decimal points. We recommend that candidates read the required section properly and follow it exactly.
3. Candidates made many basic calculation errors, thereby losing valuable marks. 4. Candidates did not display logical thinking, e.g. a candidate might have calculated a
cost of R800 per kg of snacks. In such a case, candidates are not expected to always revisit their calculations, but candidates can still illustrate their thinking skills with a comment such as “this answer is clearly unreasonable, however due to time constraints I will not be able to revisit my calculations”.
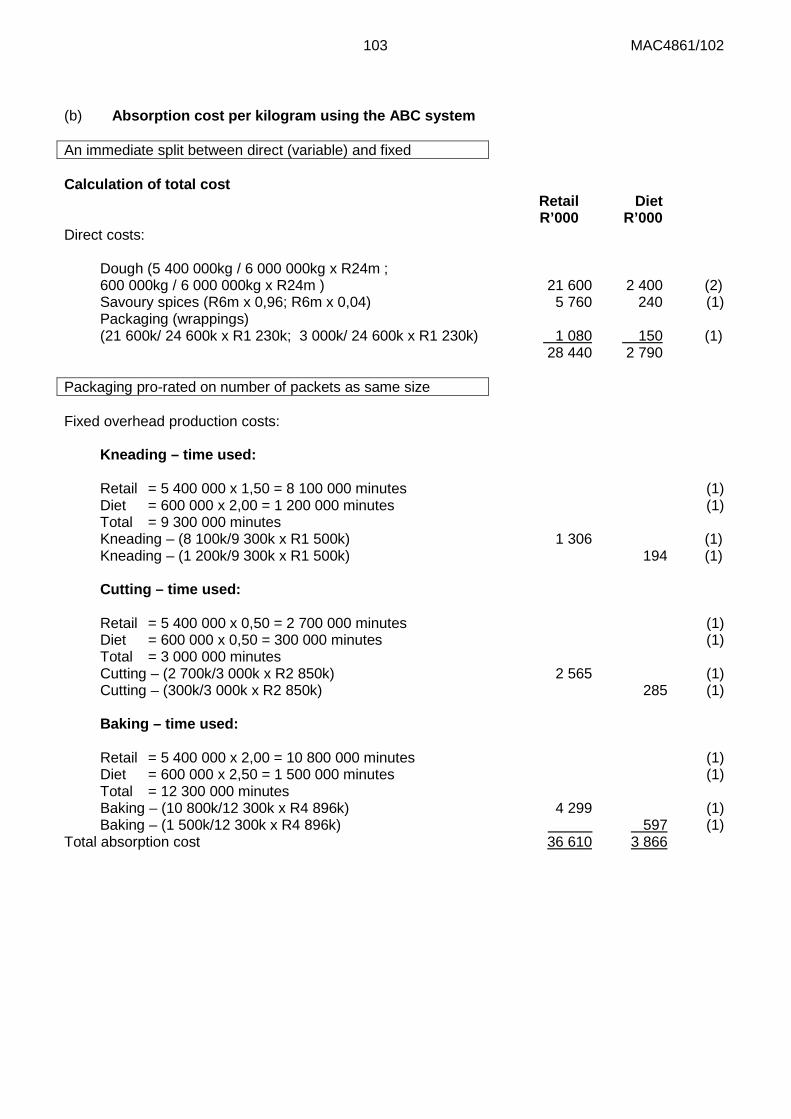
103 MAC4861/102
(b) Absorption cost per kilogram using the ABC system An immediate split between direct (variable) and fixed Calculation of total cost
Retail Diet R’000 R’000
Direct costs: Dough (5 400 000kg / 6 000 000kg x R24m ; 600 000kg / 6 000 000kg x R24m ) 21 600 2 400 (2) Savoury spices (R6m x 0,96; R6m x 0,04) 5 760 240 (1) Packaging (wrappings) (21 600k/ 24 600k x R1 230k; 3 000k/ 24 600k x R1 230k) 1 080 150 (1) 28 440 2 790 Packaging pro-rated on number of packets as same size Fixed overhead production costs: Kneading – time used: Retail = 5 400 000 x 1,50 = 8 100 000 minutes (1) Diet = 600 000 x 2,00 = 1 200 000 minutes (1) Total = 9 300 000 minutes Kneading – (8 100k/9 300k x R1 500k) 1 306 (1) Kneading – (1 200k/9 300k x R1 500k) 194 (1) Cutting – time used: Retail = 5 400 000 x 0,50 = 2 700 000 minutes (1) Diet = 600 000 x 0,50 = 300 000 minutes (1) Total = 3 000 000 minutes Cutting – (2 700k/3 000k x R2 850k) 2 565 (1) Cutting – (300k/3 000k x R2 850k) 285 (1) Baking – time used: Retail = 5 400 000 x 2,00 = 10 800 000 minutes (1) Diet = 600 000 x 2,50 = 1 500 000 minutes (1) Total = 12 300 000 minutes Baking – (10 800k/12 300k x R4 896k) 4 299 (1) Baking – (1 500k/12 300k x R4 896k) 597 (1) Total absorption cost 36 610 3 866
104 MAC4861/102
Check: total cost (R36 610 000 + R3 866 000 = R40 476 000) Costs are allocated based on kg x minutes as the throughput are defined as min/kg. You should not have used packets x minutes. Cost per kilogram (R36 610 000 ÷ 5 400 000 kg); (R3 866 000 ÷ 600 000 kg) R6,780 R6,443 (2)
(18)
Focus notes Candidates’ answers did not comply with the required format. No comments or explanations were required yet some students found the time for it. Also see point 2 under part (a) above for comments that also apply here. (c) Comment on the ABC impact
• Pricing decisions: Adding the normal 4% mark-up to the cost per kilogram of the diet snacks of R6,443 would have given a bid price of R6,701. (1) • This would have beaten the competitor’s bid of R6,816 and Crax Ltd would have gotten the order. (1) • Product design decisions: ABC provides a road map as to how to reduce the costs of individual products by analysing the relative components. (1) • By focussing on the high cost components overall costs can be reduced by managing costs (matching resource supply with resource demand ABM) (1) • Process improvements: Each activity area is now highlighted as a separate cost. Improvements in efficiencies can also drive down costs per kilogram. (1) • Product profitability analysis: ABC will allow the company to perform a product profitability analysis and in doing so to formulate a better idea of the profitability of the different products being manufactured. (1) • Other valid point [maximum of 1 point] (1) Maximum (4)
Focus notes This part of the question was answered poorly. Candidates displayed a lack of insight and struggled to apply theory to practical situations. For such questions, it is recommended that candidates plan their answers properly and apply lateral thinking.
105 MAC4861/102
(d) Additional areas to investigate
• Can cost of ordering be obtained and allocated according to number of raw material orders placed?
• Setup costs related to changing the cutting dies from the larger retail snacks to the smaller diet snacks.
• Setup costs related to changing the flavour of the savoury spices, e.g. salt & vinegar to cheese.
• Setup costs related to changing the setting in order that less savoury spice is added to the diet snacks.
• Setup costs related to changing the foil wrapping for the diet snacks. • Diet snacks use less butter and oil: determine actual usage for direct costs. • Amount of foil in packaging might well be different between the two products – hence
requiring a different cost allocation. • An alternative basis could be considered for the allocation of spice costs – e.g.
consumption based. • Is there a difference between the degrees Celsius at which the two products are baked?
Might have impact on allocation of electricity costs? • Any other valid point. [maximum of 1 point]
Two each, maximum (4)
Focus notes This part of the question was also answered poorly. Setup costs were seldom addressed, and an alternative basis for the allocation of costs relating to spices and wrApping were seldom mentioned.
(e) Breakeven sales mixture:
Retail R/kg Diet R/kg
Selling price – given 7,05 6,70 (1) Variable costs – See (b) Retail (R28 440k / 5 400k) 5,27 (1) Diet (R2 790k / 600k) 4,65 (1) Contribution 1,78 2,05 (1)
Weighted average contribution mixture = [(9 x 1,78) + (1 x 2,05)]/10 = R1,807 (1) Breakeven = (1 500 000 + 2 850 000 + 4 896 000) [Fixed costs] / 1,807 = 5 116 768 kg (1) Ratio: 4 605 092 kg (round up) retail and 511 677kg diet. [split 9/10 and 1/10] (1)
(7) This is defined as “common” fixed costs as the two products are manufactured on the same machines. See Drury (9th ed) pages 182–184 for multi-product CVP.
If it was two production lines, we could do the alternative.
Common fixed costs can only be avoided if none of the products are manufactured.
106 MAC4861/102
Focus notes The relative simplicity of a breakeven sales-volume calculation does not underscore the importance of this figure. Here it was slightly complicated by two different products contributing to fixed costs, which seem to have posed a problem to many candidates. Students who experienced difficulty with this section, are advised to obtain further practice by attempting several other questions on this topic.
(f) Optimising production • As the oven represents a scarce/limited resource, the contribution should be determined per limiting factor – thus contribution per baking minute. (1) • You should calculate the contribution per minute by dividing the contribution per kg (calculated in part e) by the number of minutes of baking time per kg. (1) • Preference should be given to filling orders first for the product with the highest contribution per minute. (1)
Retail Diet Contribution per kg 1,78 2,05 Baking time per kg (min per kg) 2,00 2,50 Contribution per baking minute 0,89 0,82 (2) __ ∴ Retail snacks should be given preference Maximum 5
(g) Power outages • Product not fully/properly baked and lost (1) • Cost base increase due to above (1) • Sales and deliveries not met, customers may be lost (1) • Damage to equipment in the long-term resulting from power surges (1) • Opportunity cost of underutilising capital equipment (1) Outsourcing • Knowledge base taken over by outsourcing party (1) • Lost market, taken over by 3rd party (1) • Non-delivery by 3rd party in terms of agreement (1) • Sub-standard quality products delivered or increased cost of monitoring (1) Maximum 6
Focus notes For this part, candidates unexpectedly failed to score high marks. In future, candidates could improve their answers to similar questions by using the assumption (unless stated otherwise) that one valid-point will earn only one mark. For such questions, candidates should also attempt to incorporate real-world factors where possible and apply lateral-thinking.
107 MAC4861/102
TEST 1 (2016) QUESTION 1 40 marks THIS TEST CONSISTS OF TWO INDEPENDENT PARTS, PARTS A AND B, BOTH OF WHICH MUST BE ATTEMPTED.
Ignore value-added taxation
PART A 20 marks
Ixopho Limited manufactures three joint products namely IX, OP and HO, in a joint process. The following process account relates to the activities of February 2016 and is typical of the monthly results of operating this process:
JOINT PROCESS ACCOUNT
Litres R Litres R Opening work in process 1 500 7 980 Normal loss 15 000 30 000 Materials 150 000 375 000 Output IX 37 500 212 813 Conversion costs: Output OP 22 500 127 686 Variable 150 000 Output HO 67 500 383 063 Fixed 270 000 Closing work in
process
1 200
5 300 Abnormal loss 7 800 44 118 151 500 802 980 151 500 802 980
When referring to “output” it implies the product is complete and available for sale. Each one of the products can be sold just after the joint process, but each one of them can also be processed further before being sold. The following further processing costs and selling prices per litre are expected:
Product Selling price after split-off point
Selling price after further processing
Further variable processing cost
after split-off point R/litre
R/litre R/litre
IX 9,38 12,60 2,63 OP 7,80 9,68 1,43 HO 10,20 11,18 1,28
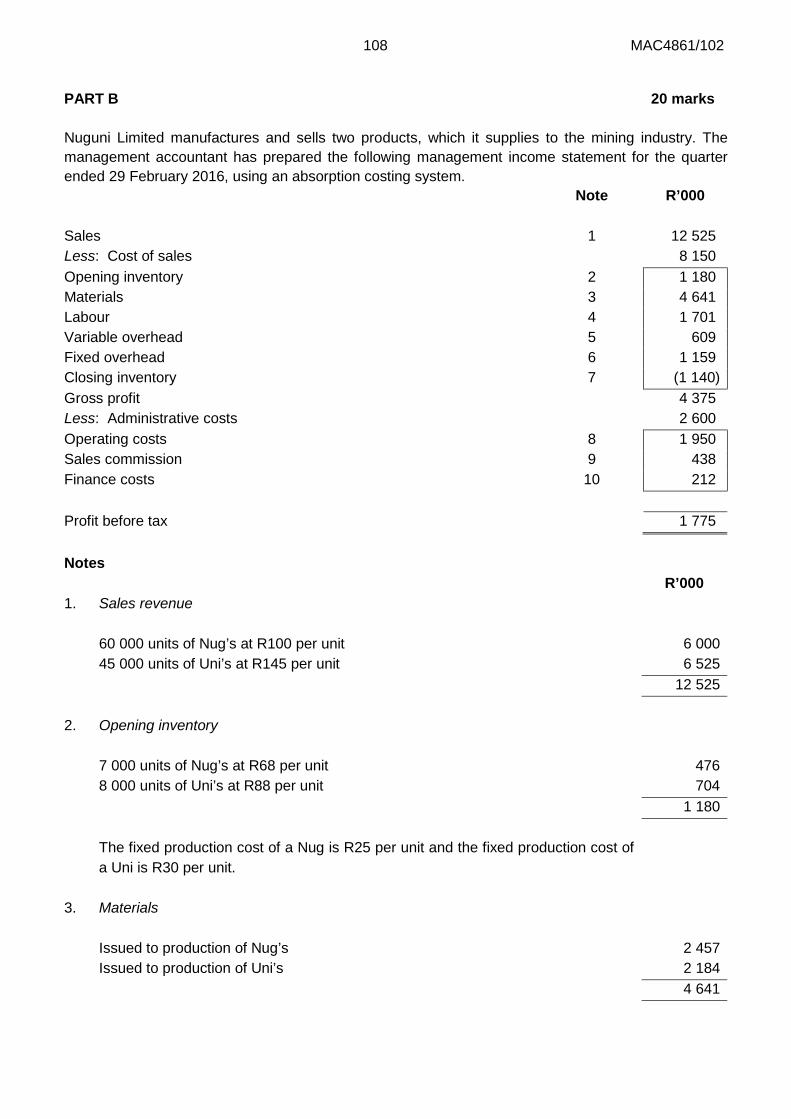
108 MAC4861/102
PART B 20 marks Nuguni Limited manufactures and sells two products, which it supplies to the mining industry. The management accountant has prepared the following management income statement for the quarter ended 29 February 2016, using an absorption costing system. Note R’000 Sales 1 12 525 Less: Cost of sales 8 150 Opening inventory 2 1 180 Materials 3 4 641 Labour 4 1 701 Variable overhead 5 609 Fixed overhead 6 1 159 Closing inventory 7 (1 140) Gross profit 4 375 Less: Administrative costs 2 600 Operating costs 8 1 950 Sales commission 9 438 Finance costs 10 212 Profit before tax 1 775 Notes R’000 1. Sales revenue 60 000 units of Nug’s at R100 per unit 6 000 45 000 units of Uni’s at R145 per unit 6 525 12 525 2. Opening inventory 7 000 units of Nug’s at R68 per unit 476 8 000 units of Uni’s at R88 per unit 704 1 180 The fixed production cost of a Nug is R25 per unit and the fixed production cost of
a Uni is R30 per unit.
3. Materials Issued to production of Nug’s 2 457 Issued to production of Uni’s 2 184 4 641
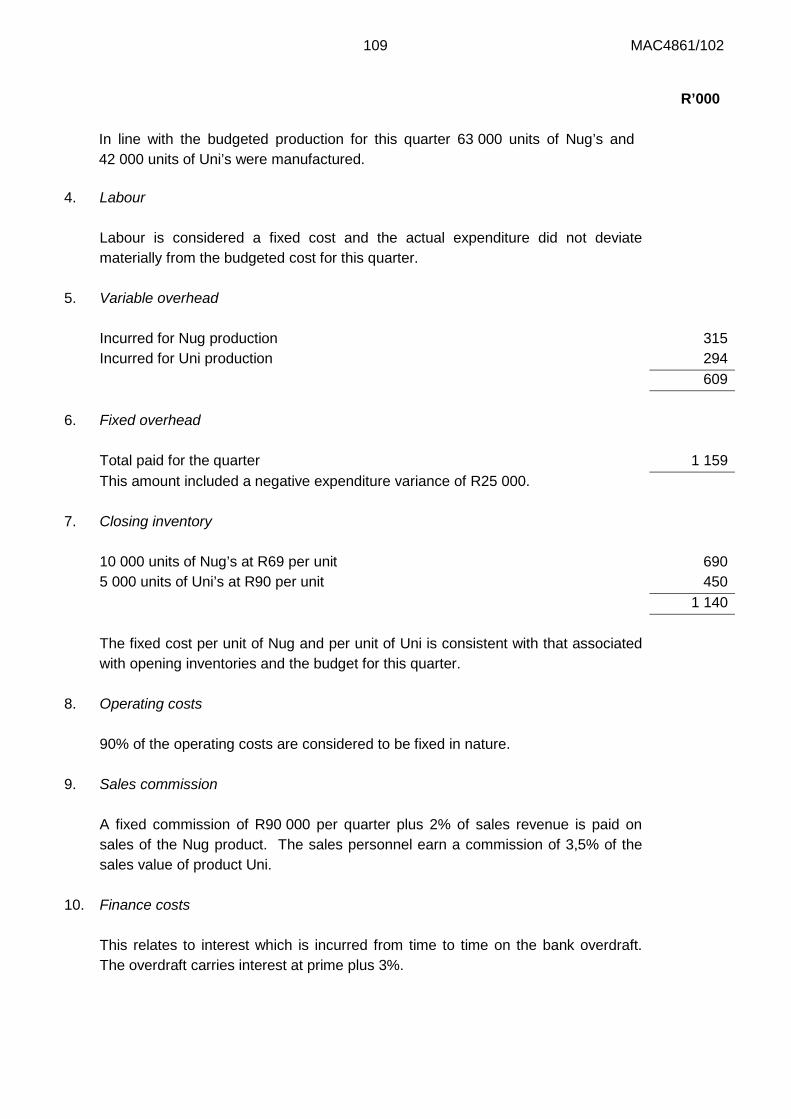
109 MAC4861/102
In line with the budgeted production for this quarter 63 000 units of Nug’s and 42 000 units of Uni’s were manufactured.
R’000
4. Labour Labour is considered a fixed cost and the actual expenditure did not deviate
materially from the budgeted cost for this quarter.
5. Variable overhead Incurred for Nug production 315 Incurred for Uni production 294 609 6. Fixed overhead Total paid for the quarter 1 159 This amount included a negative expenditure variance of R25 000. 7. Closing inventory 10 000 units of Nug’s at R69 per unit 690 5 000 units of Uni’s at R90 per unit 450 1 140 The fixed cost per unit of Nug and per unit of Uni is consistent with that associated
with opening inventories and the budget for this quarter.
8. Operating costs 90% of the operating costs are considered to be fixed in nature. 9. Sales commission A fixed commission of R90 000 per quarter plus 2% of sales revenue is paid on
sales of the Nug product. The sales personnel earn a commission of 3,5% of the sales value of product Uni.
10. Finance costs This relates to interest which is incurred from time to time on the bank overdraft.
The overdraft carries interest at prime plus 3%.
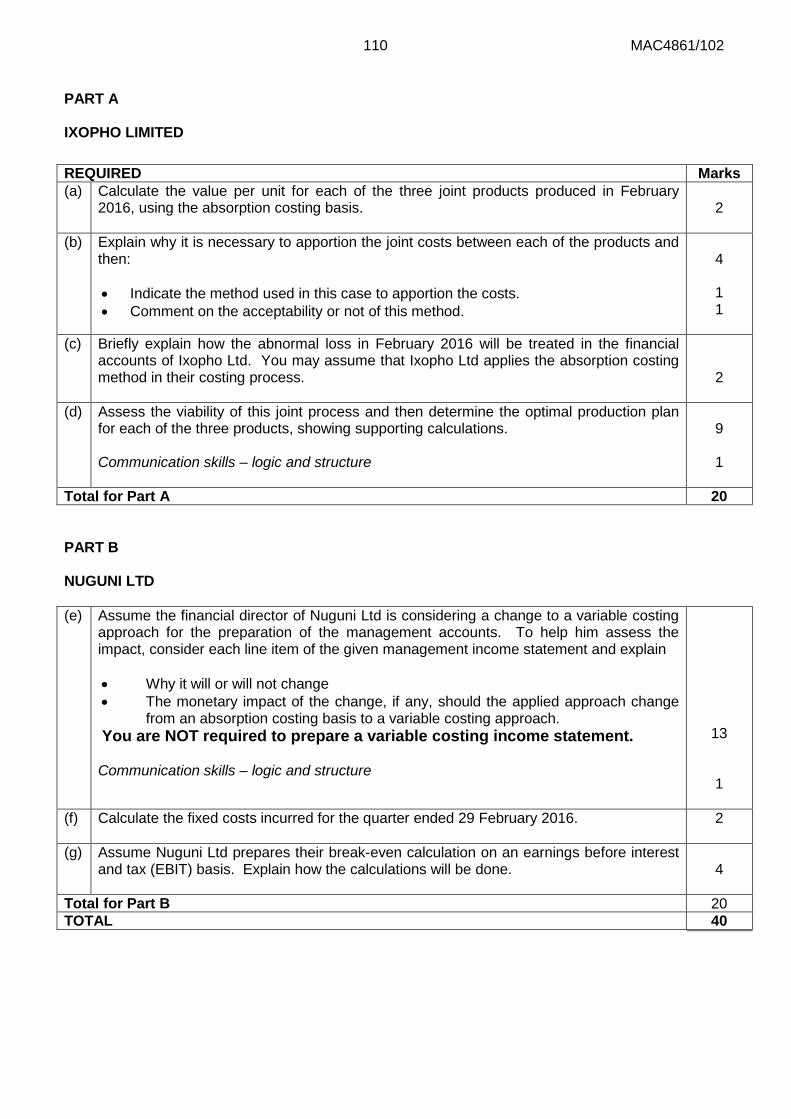
110 MAC4861/102
PART A IXOPHO LIMITED REQUIRED Marks (a) Calculate the value per unit for each of the three joint products produced in February
2016, using the absorption costing basis.
2
(b) Explain why it is necessary to apportion the joint costs between each of the products and then: • Indicate the method used in this case to apportion the costs. • Comment on the acceptability or not of this method.
4 1 1
(c) Briefly explain how the abnormal loss in February 2016 will be treated in the financial accounts of Ixopho Ltd. You may assume that Ixopho Ltd applies the absorption costing method in their costing process.
2
(d) Assess the viability of this joint process and then determine the optimal production plan for each of the three products, showing supporting calculations. Communication skills – logic and structure
9 1
Total for Part A 20
PART B NUGUNI LTD
(e) Assume the financial director of Nuguni Ltd is considering a change to a variable costing approach for the preparation of the management accounts. To help him assess the impact, consider each line item of the given management income statement and explain • Why it will or will not change • The monetary impact of the change, if any, should the applied approach change
from an absorption costing basis to a variable costing approach. You are NOT required to prepare a variable costing income statement. Communication skills – logic and structure
13 1
(f) Calculate the fixed costs incurred for the quarter ended 29 February 2016. 2
(g) Assume Nuguni Ltd prepares their break-even calculation on an earnings before interest and tax (EBIT) basis. Explain how the calculations will be done.
4
Total for Part B 20 TOTAL 40
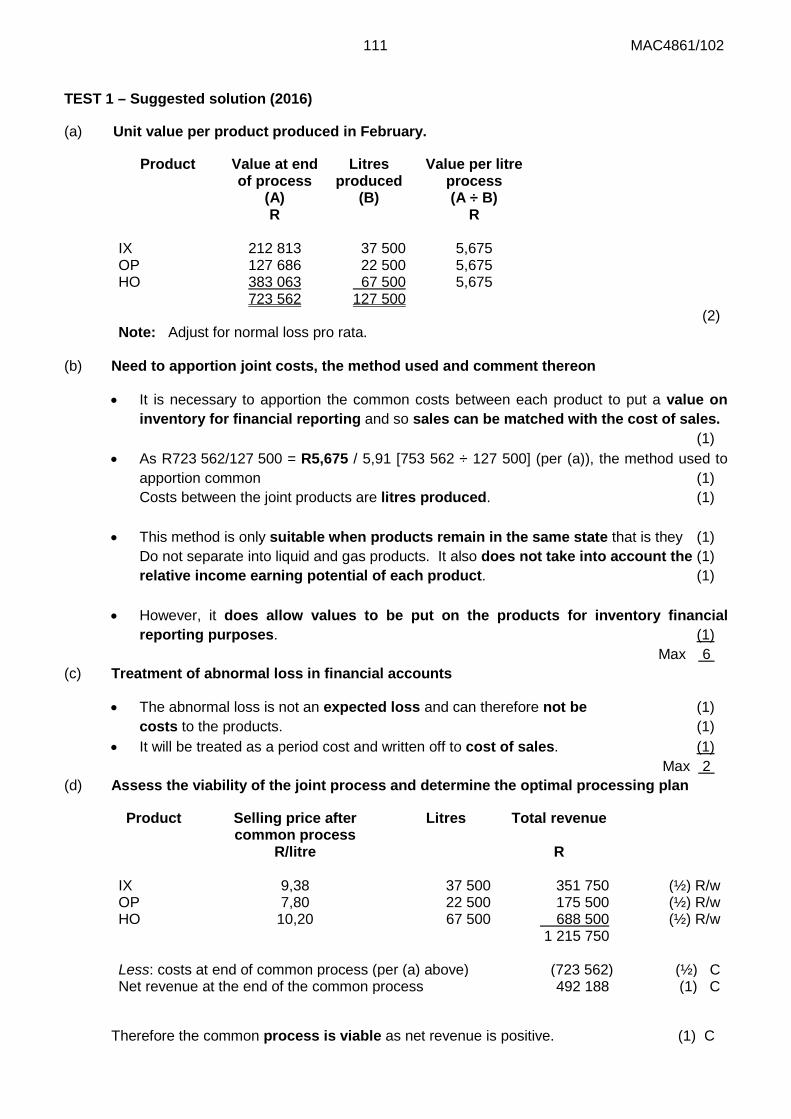
111 MAC4861/102
TEST 1 – Suggested solution (2016)
(a) Unit value per product produced in February.
Product Value at end of process
(A)
Litres produced
(B)
Value per litre process (A ÷ B)
R
R
IX 212 813 37 500 5,675 OP 127 686 22 500 5,675 HO 383 063 67 500 5,675 723 562 127 500 Note: Adjust for normal loss pro rata.
(2)
(b) Need to apportion joint costs, the method used and comment thereon
• It is necessary to apportion the common costs between each product to put a value on inventory for financial reporting and so sales can be matched with the cost of sales. (1)
• As R723 562/127 500 = R5,675 / 5,91 [753 562 ÷ 127 500] (per (a)), the method used to apportion common (1) Costs between the joint products are litres produced. (1)
• This method is only suitable when products remain in the same state that is they (1) Do not separate into liquid and gas products. It also does not take into account the (1) relative income earning potential of each product. (1) • However, it does allow values to be put on the products for inventory financial reporting purposes. (1) Max 6
(c) Treatment of abnormal loss in financial accounts
• The abnormal loss is not an expected loss and can therefore not be (1) costs to the products. (1) • It will be treated as a period cost and written off to cost of sales. (1) Max 2
(d) Assess the viability of the joint process and determine the optimal processing plan
Product Selling price after common process
Litres Total revenue
R/litre
R
IX 9,38 37 500 351 750 (½) R/w OP 7,80 22 500 175 500 (½) R/w HO 10,20 67 500 688 500 (½) R/w 1 215 750 Less: costs at end of common process (per (a) above) (723 562) (½) C Net revenue at the end of the common process 492 188 (1) C
Therefore the common process is viable as net revenue is positive. (1) C
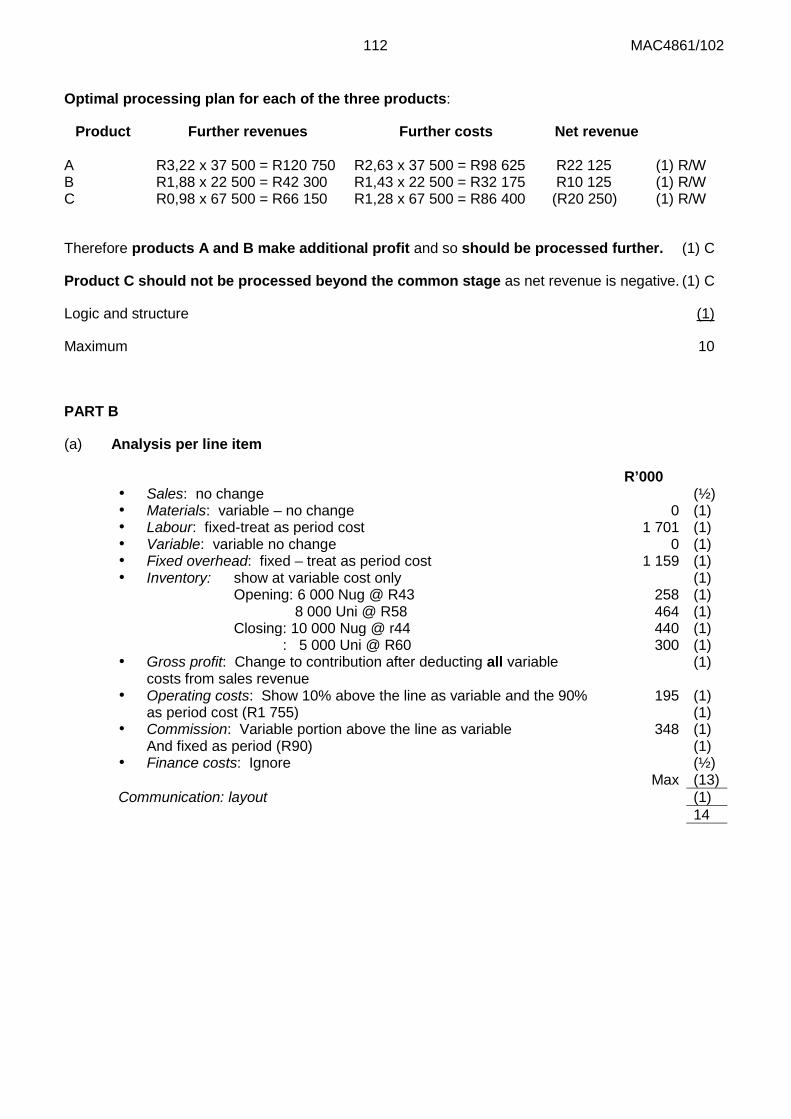
112 MAC4861/102
Optimal processing plan for each of the three products:
Product Further revenues Further costs Net revenue A R3,22 x 37 500 = R120 750 R2,63 x 37 500 = R98 625 R22 125 (1) R/W B R1,88 x 22 500 = R42 300 R1,43 x 22 500 = R32 175 R10 125 (1) R/W C R0,98 x 67 500 = R66 150 R1,28 x 67 500 = R86 400 (R20 250) (1) R/W
Therefore products A and B make additional profit and so should be processed further. (1) C
Product C should not be processed beyond the common stage as net revenue is negative. (1) C
Logic and structure (1)
Maximum 10
PART B
(a) Analysis per line item
R’000 Sales: no change (½) Materials: variable – no change 0 (1) Labour: fixed-treat as period cost 1 701 (1) Variable: variable no change 0 (1) Fixed overhead: fixed – treat as period cost 1 159 (1) Inventory: show at variable cost only (1)
Opening: 6 000 Nug @ R43 258 (1) 8 000 Uni @ R58 464 (1) Closing: 10 000 Nug @ r44 440 (1) : 5 000 Uni @ R60 300 (1) Gross profit: Change to contribution after deducting all variable
costs from sales revenue
(1)
Operating costs: Show 10% above the line as variable and the 90% as period cost (R1 755)
195 (1) (1)
Commission: Variable portion above the line as variable And fixed as period (R90)
348 (1) (1)
Finance costs: Ignore (½) Max (13) Communication: layout (1) 14
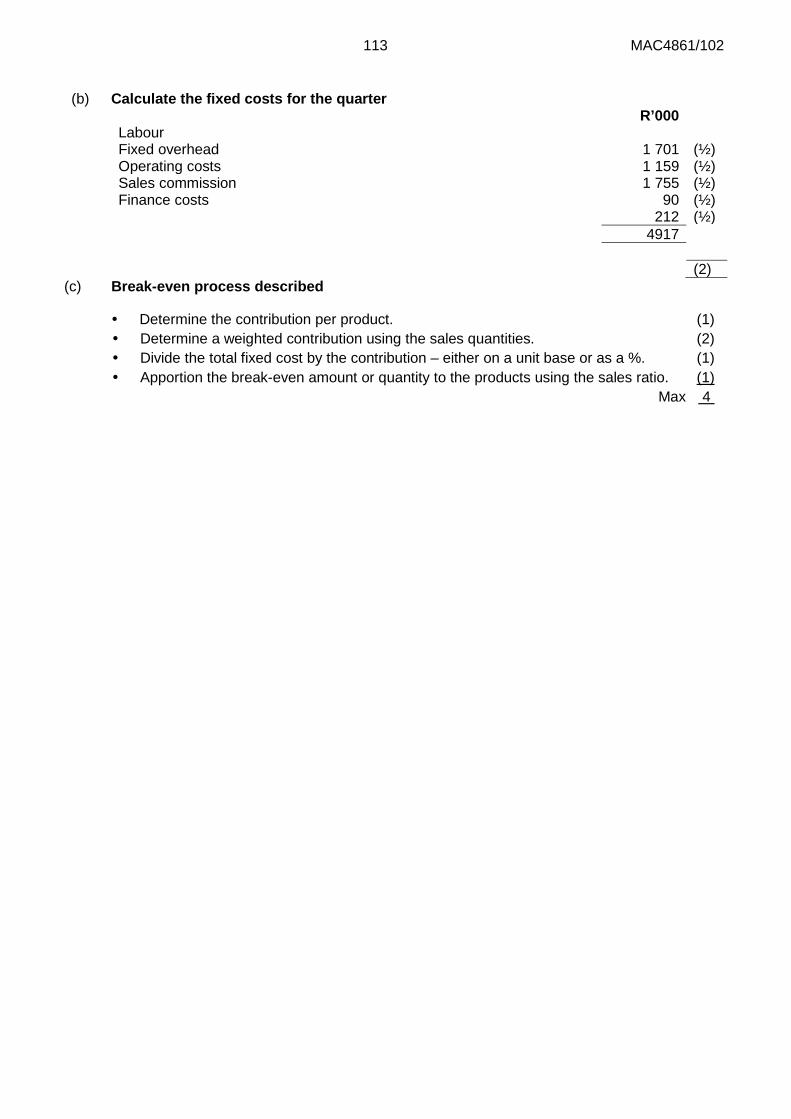
113 MAC4861/102
(b) Calculate the fixed costs for the quarter
R’000 Labour Fixed overhead 1 701 (½) Operating costs 1 159 (½) Sales commission 1 755 (½) Finance costs 90 (½) 212 (½) 4917 (2)
(c) Break-even process described
Determine the contribution per product. (1) Determine a weighted contribution using the sales quantities. (2) Divide the total fixed cost by the contribution – either on a unit base or as a %. (1) Apportion the break-even amount or quantity to the products using the sales ratio. (1)
Max 4
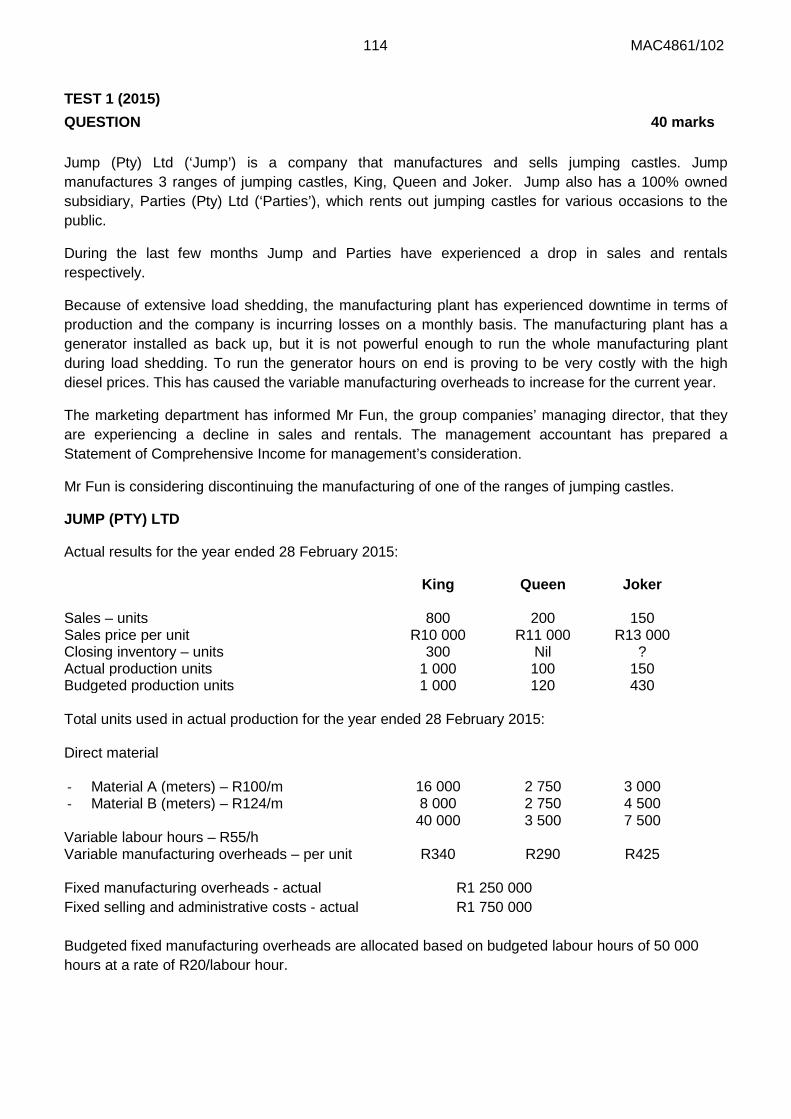
114 MAC4861/102
TEST 1 (2015) QUESTION 40 marks Jump (Pty) Ltd (‘Jump’) is a company that manufactures and sells jumping castles. Jump manufactures 3 ranges of jumping castles, King, Queen and Joker. Jump also has a 100% owned subsidiary, Parties (Pty) Ltd (‘Parties’), which rents out jumping castles for various occasions to the public.
During the last few months Jump and Parties have experienced a drop in sales and rentals respectively.
Because of extensive load shedding, the manufacturing plant has experienced downtime in terms of production and the company is incurring losses on a monthly basis. The manufacturing plant has a generator installed as back up, but it is not powerful enough to run the whole manufacturing plant during load shedding. To run the generator hours on end is proving to be very costly with the high diesel prices. This has caused the variable manufacturing overheads to increase for the current year.
The marketing department has informed Mr Fun, the group companies’ managing director, that they are experiencing a decline in sales and rentals. The management accountant has prepared a Statement of Comprehensive Income for management’s consideration.
Mr Fun is considering discontinuing the manufacturing of one of the ranges of jumping castles.
JUMP (PTY) LTD
Actual results for the year ended 28 February 2015:
King
Queen Joker
Sales – units 800 200 150 Sales price per unit R10 000 R11 000 R13 000 Closing inventory – units 300 Nil ? Actual production units 1 000 100 150 Budgeted production units 1 000 120 430 Total units used in actual production for the year ended 28 February 2015: Direct material
- Material A (meters) – R100/m 16 000 2 750 3 000 - Material B (meters) – R124/m 8 000 2 750 4 500 Variable labour hours – R55/h
40 000 3 500 7 500
Variable manufacturing overheads – per unit R340 R290 R425 Fixed manufacturing overheads - actual R1 250 000 Fixed selling and administrative costs - actual R1 750 000 Budgeted fixed manufacturing overheads are allocated based on budgeted labour hours of 50 000 hours at a rate of R20/labour hour.
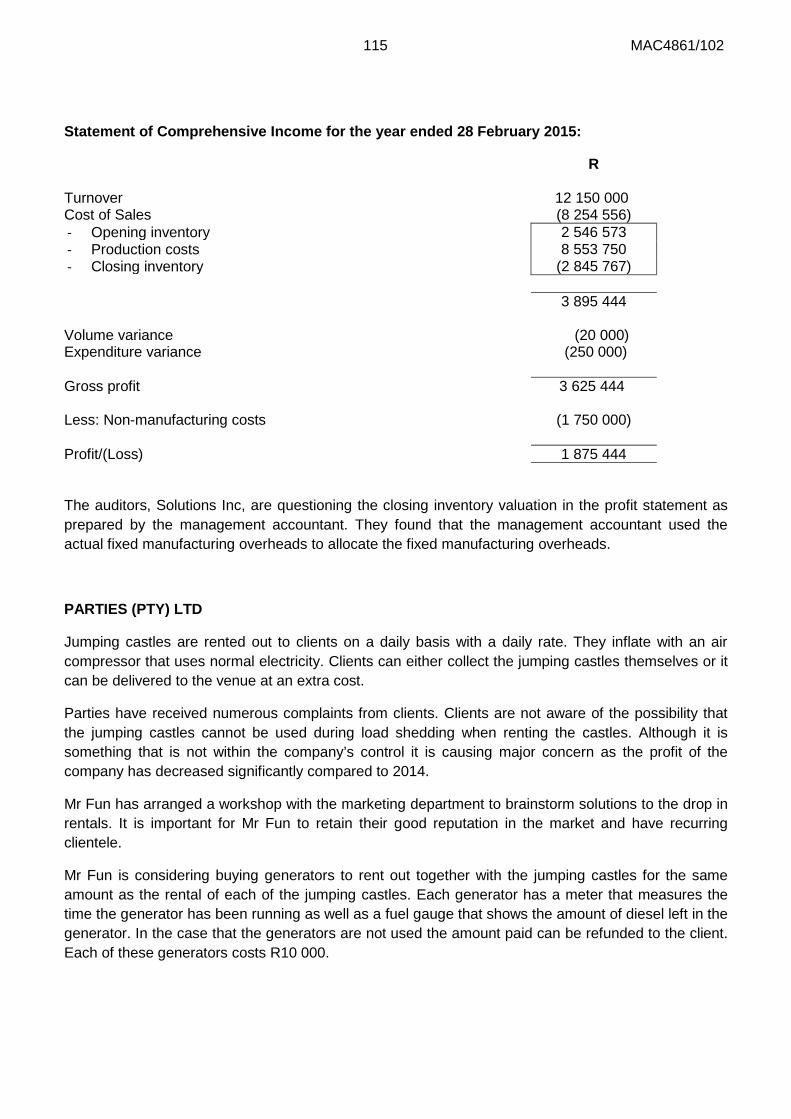
115 MAC4861/102
Statement of Comprehensive Income for the year ended 28 February 2015:
R Turnover 12 150 000 Cost of Sales (8 254 556) - Opening inventory 2 546 573 - Production costs 8 553 750 - Closing inventory (2 845 767) 3 895 444 Volume variance (20 000) Expenditure variance (250 000) Gross profit 3 625 444 Less: Non-manufacturing costs (1 750 000) Profit/(Loss) 1 875 444 The auditors, Solutions Inc, are questioning the closing inventory valuation in the profit statement as prepared by the management accountant. They found that the management accountant used the actual fixed manufacturing overheads to allocate the fixed manufacturing overheads.
PARTIES (PTY) LTD
Jumping castles are rented out to clients on a daily basis with a daily rate. They inflate with an air compressor that uses normal electricity. Clients can either collect the jumping castles themselves or it can be delivered to the venue at an extra cost.
Parties have received numerous complaints from clients. Clients are not aware of the possibility that the jumping castles cannot be used during load shedding when renting the castles. Although it is something that is not within the company’s control it is causing major concern as the profit of the company has decreased significantly compared to 2014.
Mr Fun has arranged a workshop with the marketing department to brainstorm solutions to the drop in rentals. It is important for Mr Fun to retain their good reputation in the market and have recurring clientele.
Mr Fun is considering buying generators to rent out together with the jumping castles for the same amount as the rental of each of the jumping castles. Each generator has a meter that measures the time the generator has been running as well as a fuel gauge that shows the amount of diesel left in the generator. In the case that the generators are not used the amount paid can be refunded to the client. Each of these generators costs R10 000.
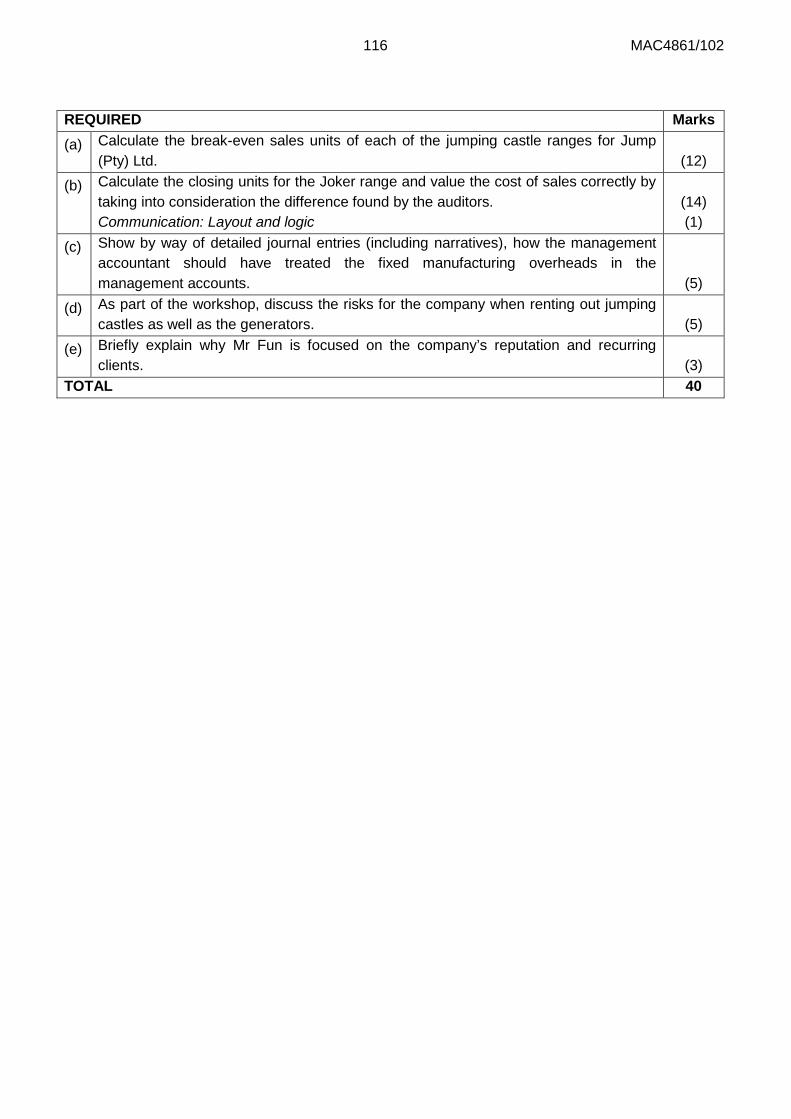
116 MAC4861/102
REQUIRED Marks (a) Calculate the break-even sales units of each of the jumping castle ranges for Jump
(Pty) Ltd.
(12)
(b) Calculate the closing units for the Joker range and value the cost of sales correctly by taking into consideration the difference found by the auditors. Communication: Layout and logic
(14) (1)
(c) Show by way of detailed journal entries (including narratives), how the management accountant should have treated the fixed manufacturing overheads in the management accounts.
(5)
(d) As part of the workshop, discuss the risks for the company when renting out jumping castles as well as the generators.
(5)
(e) Briefly explain why Mr Fun is focused on the company’s reputation and recurring clients.
(3)
TOTAL 40
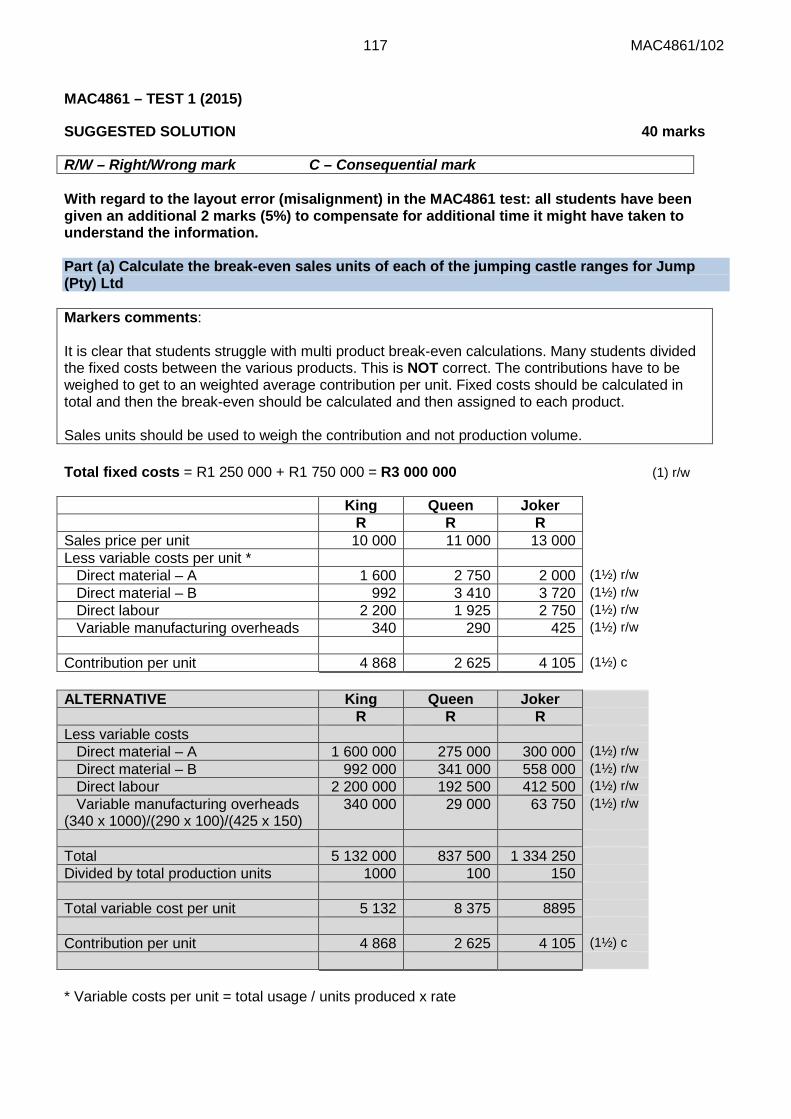
117 MAC4861/102
MAC4861 – TEST 1 (2015)
SUGGESTED SOLUTION 40 marks
R/W – Right/Wrong mark C – Consequential mark With regard to the layout error (misalignment) in the MAC4861 test: all students have been given an additional 2 marks (5%) to compensate for additional time it might have taken to understand the information. Part (a) Calculate the break-even sales units of each of the jumping castle ranges for Jump (Pty) Ltd Markers comments: It is clear that students struggle with multi product break-even calculations. Many students divided the fixed costs between the various products. This is NOT correct. The contributions have to be weighed to get to an weighted average contribution per unit. Fixed costs should be calculated in total and then the break-even should be calculated and then assigned to each product. Sales units should be used to weigh the contribution and not production volume. Total fixed costs = R1 250 000 + R1 750 000 = R3 000 000 (1) r/w
King Queen Joker R R R
Sales price per unit 10 000 11 000 13 000 Less variable costs per unit * Direct material – A 1 600 2 750 2 000 (1½) r/w Direct material – B 992 3 410 3 720 (1½) r/w Direct labour 2 200 1 925 2 750 (1½) r/w Variable manufacturing overheads 340 290 425 (1½) r/w Contribution per unit 4 868 2 625 4 105 (1½) c ALTERNATIVE King Queen Joker
R R R Less variable costs Direct material – A 1 600 000 275 000 300 000 (1½) r/w Direct material – B 992 000 341 000 558 000 (1½) r/w Direct labour 2 200 000 192 500 412 500 (1½) r/w Variable manufacturing overheads (340 x 1000)/(290 x 100)/(425 x 150)
340 000 29 000 63 750 (1½) r/w
Total 5 132 000 837 500 1 334 250 Divided by total production units 1000 100 150 Total variable cost per unit 5 132 8 375 8895 Contribution per unit 4 868 2 625 4 105 (1½) c * Variable costs per unit = total usage / units produced x rate
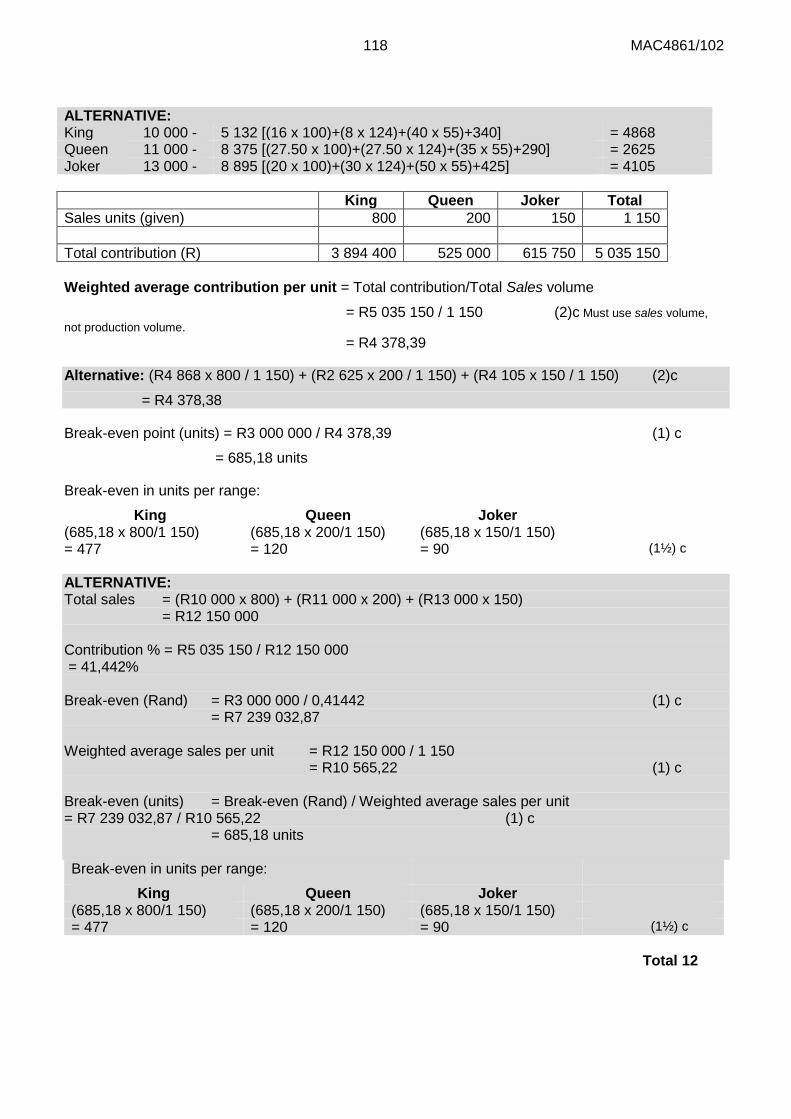
118 MAC4861/102
ALTERNATIVE: King 10 000 - 5 132 [(16 x 100)+(8 x 124)+(40 x 55)+340] = 4868 Queen 11 000 - 8 375 [(27.50 x 100)+(27.50 x 124)+(35 x 55)+290] = 2625 Joker 13 000 - 8 895 [(20 x 100)+(30 x 124)+(50 x 55)+425] = 4105 King Queen Joker Total Sales units (given) 800 200 150 1 150 Total contribution (R) 3 894 400 525 000 615 750 5 035 150 Weighted average contribution per unit = Total contribution/Total Sales volume
= R5 035 150 / 1 150 (2)c Must use sales volume, not production volume. = R4 378,39
Alternative: (R4 868 x 800 / 1 150) + (R2 625 x 200 / 1 150) + (R4 105 x 150 / 1 150) (2)c
= R4 378,38
Break-even point (units) = R3 000 000 / R4 378,39 (1) c
= 685,18 units
Break-even in units per range:
King Queen Joker (685,18 x 800/1 150) (685,18 x 200/1 150) (685,18 x 150/1 150) = 477 = 120 = 90 (1½) c ALTERNATIVE: Total sales = (R10 000 x 800) + (R11 000 x 200) + (R13 000 x 150) = R12 150 000 Contribution % = R5 035 150 / R12 150 000 = 41,442% Break-even (Rand) = R3 000 000 / 0,41442 (1) c = R7 239 032,87 Weighted average sales per unit = R12 150 000 / 1 150 = R10 565,22 (1) c Break-even (units) = Break-even (Rand) / Weighted average sales per unit = R7 239 032,87 / R10 565,22 (1) c = 685,18 units Break-even in units per range:
King Queen Joker (685,18 x 800/1 150) (685,18 x 200/1 150) (685,18 x 150/1 150) = 477 = 120 = 90 (1½) c
Total 12
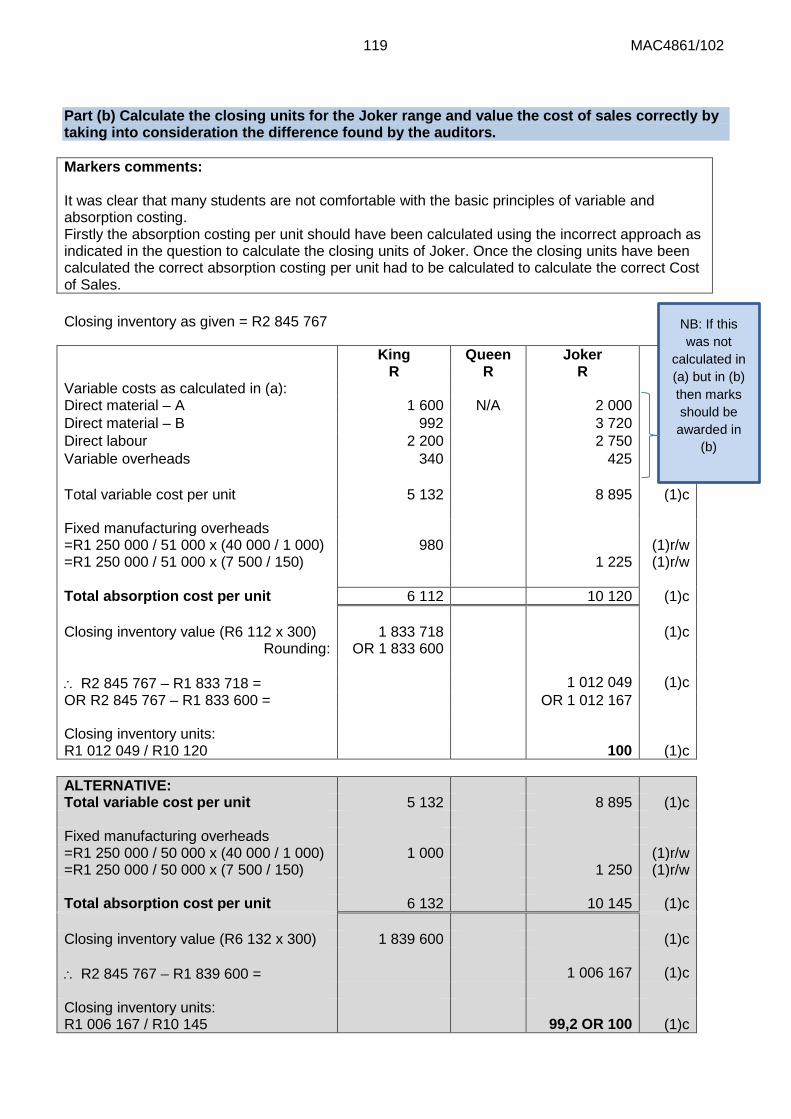
119 MAC4861/102
Part (b) Calculate the closing units for the Joker range and value the cost of sales correctly by taking into consideration the difference found by the auditors. Markers comments: It was clear that many students are not comfortable with the basic principles of variable and absorption costing. Firstly the absorption costing per unit should have been calculated using the incorrect approach as indicated in the question to calculate the closing units of Joker. Once the closing units have been calculated the correct absorption costing per unit had to be calculated to calculate the correct Cost of Sales. Closing inventory as given = R2 845 767
King Queen Joker R R R Variable costs as calculated in (a): Direct material – A 1 600 N/A 2 000 Direct material – B 992 3 720 Direct labour 2 200 2 750 Variable overheads 340 425 Total variable cost per unit 5 132 8 895 (1)c Fixed manufacturing overheads =R1 250 000 / 51 000 x (40 000 / 1 000) 980 (1)r/w =R1 250 000 / 51 000 x (7 500 / 150) 1 225 (1)r/w Total absorption cost per unit 6 112 10 120 (1)c Closing inventory value (R6 112 x 300) 1 833 718 (1)c
Rounding: OR 1 833 600 ∴ R2 845 767 – R1 833 718 = 1 012 049 (1)c OR R2 845 767 – R1 833 600 = OR 1 012 167 Closing inventory units: R1 012 049 / R10 120
100
(1)c
ALTERNATIVE: Total variable cost per unit 5 132 8 895 (1)c Fixed manufacturing overheads =R1 250 000 / 50 000 x (40 000 / 1 000) 1 000 (1)r/w =R1 250 000 / 50 000 x (7 500 / 150) 1 250 (1)r/w Total absorption cost per unit 6 132 10 145 (1)c Closing inventory value (R6 132 x 300) 1 839 600 (1)c ∴ R2 845 767 – R1 839 600 = 1 006 167 (1)c Closing inventory units: R1 006 167 / R10 145
99,2 OR 100
(1)c
NB: If this was not
calculated in (a) but in (b) then marks should be awarded in
(b)
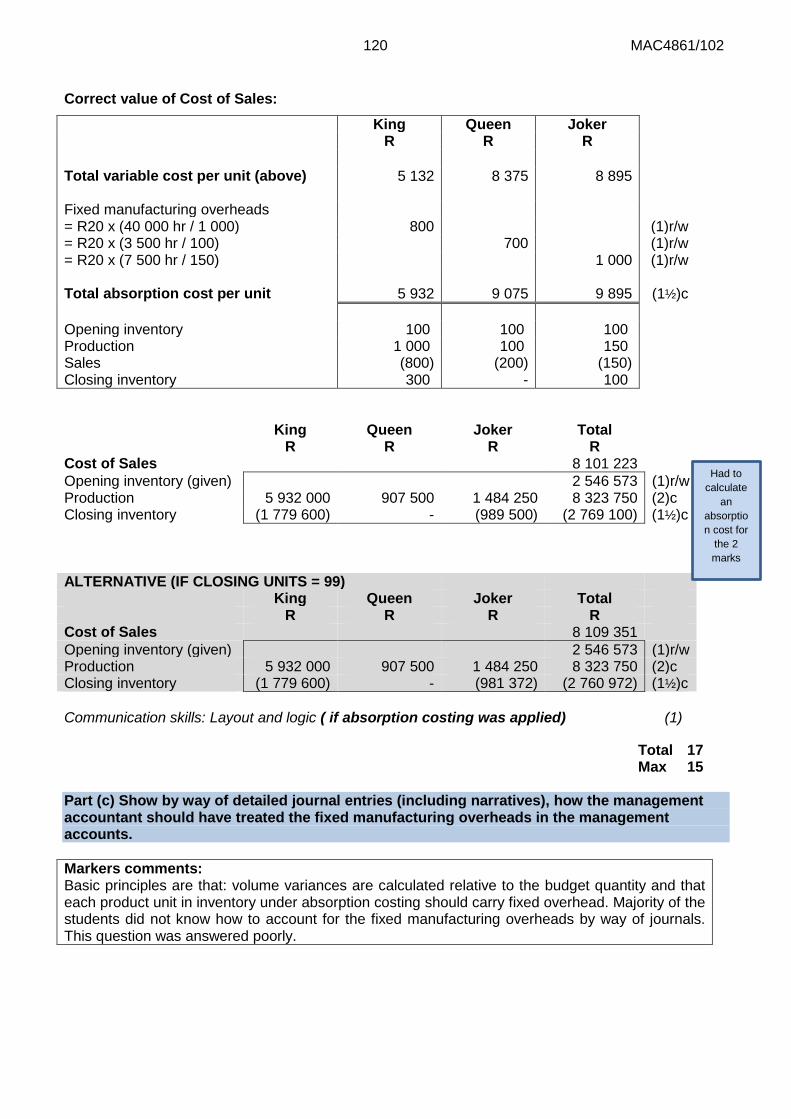
120 MAC4861/102
Correct value of Cost of Sales:
King Queen Joker R R R Total variable cost per unit (above) 5 132 8 375 8 895 Fixed manufacturing overheads = R20 x (40 000 hr / 1 000) 800 (1)r/w = R20 x (3 500 hr / 100) 700 (1)r/w = R20 x (7 500 hr / 150) 1 000 (1)r/w Total absorption cost per unit 5 932 9 075 9 895 (1½)c Opening inventory 100 100 100 Production 1 000 100 150 Sales (800) (200) (150) Closing inventory 300 - 100
King Queen Joker Total R R R R
Cost of Sales 8 101 223 Opening inventory (given) 2 546 573 (1)r/w Production 5 932 000 907 500 1 484 250 8 323 750 (2)c Closing inventory (1 779 600) - (989 500) (2 769 100) (1½)c
ALTERNATIVE (IF CLOSING UNITS = 99) King Queen Joker Total R R R R
Cost of Sales 8 109 351 Opening inventory (given) 2 546 573 (1)r/w Production 5 932 000 907 500 1 484 250 8 323 750 (2)c Closing inventory (1 779 600) - (981 372) (2 760 972) (1½)c Communication skills: Layout and logic ( if absorption costing was applied) (1)
Total 17 Max 15
Part (c) Show by way of detailed journal entries (including narratives), how the management accountant should have treated the fixed manufacturing overheads in the management accounts. Markers comments: Basic principles are that: volume variances are calculated relative to the budget quantity and that each product unit in inventory under absorption costing should carry fixed overhead. Majority of the students did not know how to account for the fixed manufacturing overheads by way of journals. This question was answered poorly.
Had to calculate
an absorption cost for
the 2 marks
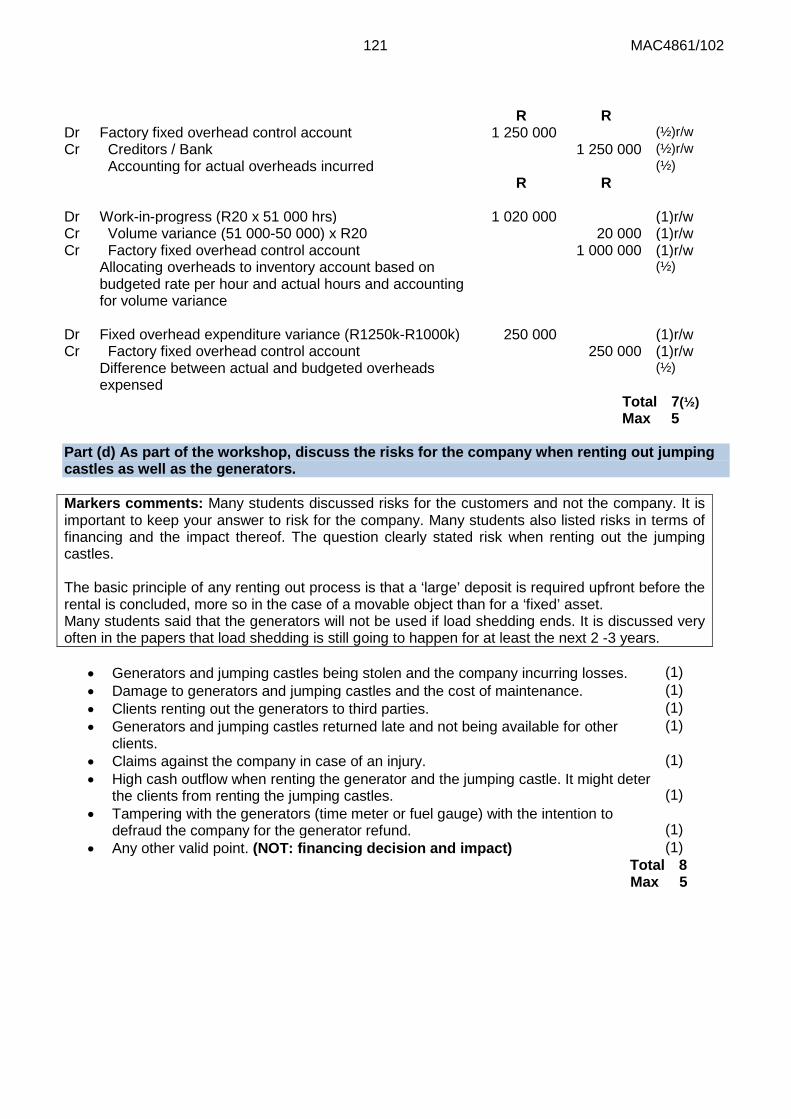
121 MAC4861/102
R
R
Dr Factory fixed overhead control account 1 250 000 (½)r/w Cr Creditors / Bank 1 250 000 (½)r/w Accounting for actual overheads incurred (½) R R Dr Work-in-progress (R20 x 51 000 hrs) 1 020 000 (1)r/w Cr Volume variance (51 000-50 000) x R20 20 000 (1)r/w Cr Factory fixed overhead control account 1 000 000 (1)r/w Allocating overheads to inventory account based on
budgeted rate per hour and actual hours and accounting for volume variance
(½)
Dr Fixed overhead expenditure variance (R1250k-R1000k) 250 000 (1)r/w Cr Factory fixed overhead control account 250 000 (1)r/w Difference between actual and budgeted overheads
expensed (½)
Total 7(½) Max 5
Part (d) As part of the workshop, discuss the risks for the company when renting out jumping castles as well as the generators. Markers comments: Many students discussed risks for the customers and not the company. It is important to keep your answer to risk for the company. Many students also listed risks in terms of financing and the impact thereof. The question clearly stated risk when renting out the jumping castles. The basic principle of any renting out process is that a ‘large’ deposit is required upfront before the rental is concluded, more so in the case of a movable object than for a ‘fixed’ asset. Many students said that the generators will not be used if load shedding ends. It is discussed very often in the papers that load shedding is still going to happen for at least the next 2 -3 years.
• Generators and jumping castles being stolen and the company incurring losses. (1) • Damage to generators and jumping castles and the cost of maintenance. (1) • Clients renting out the generators to third parties. (1) • Generators and jumping castles returned late and not being available for other
clients. (1)
• Claims against the company in case of an injury. (1) • High cash outflow when renting the generator and the jumping castle. It might deter
the clients from renting the jumping castles. (1)
• Tampering with the generators (time meter or fuel gauge) with the intention to defraud the company for the generator refund.
(1)
• Any other valid point. (NOT: financing decision and impact) (1) Total 8 Max 5
122 MAC4861/102
Part (e) Briefly explain why Mr Fun is focused on the company’s reputation and recurring clients. Markers comments: This question was answered well overall.
• If the company gets a bad reputation then they will not rent/sell jumping castles, which will result in financial losses and vice versa.
(1)
• There is a lot of competition and the company needs to keep a good reputation. Loss of clients can result in financial losses.
(1)
• It is cheaper in terms of marketing costs, to keep an existing client than to obtain a new client.
(1)
• An existing customer base facilitates the sale of value added or add-on products and services.
(1)
• Good reputation and recurring clients can be an asset, which can increase shareholder value.
(1)
• Recurring business i.t.o. rentals can make budgeting easier for the following year. (1) • Any other valid point (1)
Total 7 Max 3
TOTAL 40
123 MAC4861/102
MANAGEMENT ACCOUNTING GLOSSARY
Backflush costing: a simplified cost-accounting system in which all manufacturing costs are charged directly to Cost of Goods Sold; end-of-period adjustments are then made to credit Cost of Goods Sold and debit the respective inventory accounts.
Cost object: anything which we want to know the cost of.
Direct cost: all costs that can be specifically and exclusively identified with a cost object.
Indirect cost: costs that can’t be specifically and exclusively identified with a cost object.
Product cost: those costs that are identified with the product produced and are included in the inventory valuation.
Period cost: those costs that do not form part of the cost of the product and are thus not included in the inventory valuation. They are treated as expenses in the period that they were incurred.
Variable cost: a cost which varies in direct proportion to the level of activity.
Fixed cost: a cost which within certain output or revenue limits tends to be unaffected by fluctuations in the levels of activity (output or revenue).
Semi- variable cost: costs that have both a fixed and variable component.
Mixed cost: See semi-variable cost.
Semi-fixed cost: fixed costs that increase in fixed increments once certain limits are exceeded.
Step-fixed cost: See semi-fixed cost.
Relevant costs and revenues: are those future costs and revenues that will be affected by the decision being taken. All relevant costs/revenues should be considered in management decision making.
Irrelevant costs and revenues: those that won’t be affected (remain unaltered) by the decision.
Sunk cost: costs created by a decision made in the past which cannot be changed by a decision to be made in the future. It is money already spent that can’t be recovered. Committed cost: costs created by a decision made in the past, or a contract concluded in the past and cannot be changed by a decision to be made in the future. Although the money may only be spent in the future, the entity cannot legally refuse to pay. Opportunity cost: the value of the benefit sacrificed when one course of action is chosen instead of the best alternative one. It represents the loss of a benefit that was unavoidable because another option/course of action was chosen. Incremental costs or revenues: the difference in total cost or revenue between alternatives; calculated to assist decision making. Differential costs or revenues: See incremental costs. Marginal costs or revenue: the additional cost or revenue of one additional unit of output.
124 MAC4861/102
Limiting factor: any factor that is in scarce supply and that stops the organisation from expanding its activities further, that is, it limits the organisation’s activities. Cost allocation: the process of assigning costs to a product when a direct measure does not exist for the quantity of resources consumed by that product. Allocation base: basis that is used to allocate costs to cost objects. Cost driver: see allocation base. Blanket overhead rate: the single overhead rate that is calculated for the organisation as a whole. Over/under recovery of overheads: This occurs when the allocation base used to allocate overheads is different from the budgeted and actual activity. This is called a volume variance. Standard costs: predetermined target costs that should be incurred under efficient operating conditions. Normal loss: losses that occur under efficient operating conditions and are unavoidable. Abnormal loss: losses that are not expected to occur under efficient operation conditions. Equivalent production: In process costing, when you convert the work-in-progress units into finished equivalents so that you can calculate a unit cost. FIFO (First-in-first-out): a method of inventory valuation where you assume that the first item received in inventory will be the first item to be issued. LIFO(Last-in-first-out): a method of inventory valuation where you assume that the last item received in inventory will be the first item to be issued. Cannot be used for GAAP valuations. Joint product: This is when a group of products are produced at the same time and each product has a significant relative sales value. It only becomes distinguishable after the split-off point. Flexed budget: a budget that is reconstituted after accommodating a change in sales and production volumes. By-products: products that are part of a simultaneous production process which have a small sales value in comparison to joint products. It’s production is incidental. Absorption costing: a costing method that allocates all manufacturing costs (including fixed production overheads) to the cost of the product. Variable costing: a costing method that only traces variable manufacturing costs to the cost of the product. Direct costing: See variable costing. Marginal costing: See variable costing. Contribution: Sales less all variable costs.
Normal average long-run capacity: a measure of the capacity required to satisfy average customer demand for the duration of several years. This takes into consideration seasonal and cyclical demands and increasing or decreasing trends in demand.
125 MAC4861/102
Break-even point: the sales volume point where neither a profit or a loss is made, i.e. profit = 0 or where all fixed costs are recovered.
Margin of safety: the difference between the expected level of sales and the break-even sales level.
High-low method: a mathematical technique used to separate mixed costs into their fixed and variable components.
Outsourcing: the process of obtaining goods or services from outside suppliers instead of producing the same goods or providing the same services within the organisation.
Cost-plus pricing: when a selling price is determined by adding an appropriate percentage mark-up to the estimated cost.
Target costing: when the cost price is determined by subtracting the standard or desired profit margin from the target selling price.
Standard deviation: the measure of the dispersion of a probability distribution.
Probability distribution: the list of all possible outcomes of an event and the probability that each will occur.
Budgeting: concerned with the implementation of a long-term planning target for the year ahead.
Long-term plan: a statement of the preliminary targets and activities required by an organisation to achieve its strategic plans with a broad estimate of the resources required.
Return on investment (ROI): measures how a firm uses its capital to generate a profit. The equation used to calculate ROI is Divisional controllable profit/Controllable net assets employed.
Residual income (RI): an Approach to measuring an investment centre’s performance. It is the net operating income that an investment centre earns above the minimum required return on its operating assets.
Economic value added (EVA): a measure of a company's financial performance based on the residual wealth, calculated by deducting the cost of capital from its operating profit (adjusted for taxes on a cash basis). The formula for calculating EVA is as follows: = Net Operating Profit After Taxes (NOPAT) - (Capital Cost of Capital).
Controllable investment: used to refer to the net asset base that is controllable by divisional managers.
Controllable contribution: total divisional revenues less all costs that are controlled by the divisional manager, excluding allocated costs from Head Office.
Transfer pricing: refer to the prices set on goods or services transferred between two departments or subsidiaries of a company. A transfer price is therefore the price which a receiving division will pay for the internal transfer of inventory or products by a supplying division.
Regression equation: identifies an estimated relationship between a dependant variable (cost) and one or more independent variables (i.e. an activity measure or cost driver) based on past observations.
126 MAC4861/102
Correlation coefficient (costing): measures the degree of association (or correlation) between the dependent and the independent variable.
Linear programming: a mathematical technique that can be Applied to the problem of rationing limited facilities and resources among many alternative uses in such a way that the optimum benefits can be derived from their utilization. It seeks to find a feasible combination of output that will maximise minimize the objective function.
Objective function: refers to the quantification (in a mathematical function/formula) of an objective, for example: maximizing profits or minimising costs.
Inflation: a sustained, rapid increase in prices, as measured by some broad index (such as Consumer Price Index) over months or years, and mirrored in the correspondingly decreasing purchasing power of the currency.
Economic order quantity (EOQ): used to determine the optimal length of production runs or the size of material orders. The objective is to determine how many units must be produced per production run, or how many units of inventory must be ordered per order.
Bibliography: Drury, C. Management and cost accounting. 8th edition. Drury, C. Management and cost accounting. 9th edition. Skae, FO. Managerial finance. 7th edition.
http://highered.mcgraw-hill.com/sites/0072830085/student_view0/chapter17/glossary.html
http://www.investorwords.com/4250/Return_on_Investment.html
http://www.accountingformanagement.com/residual_income_measure_of_performance.htm
http://www.investopedia.com/terms/e/eva.asp