Embed Size (px)
Citation preview

TTTuuutttooorrriiiaaalll OOOnnn MMMeeetttaaa---AAAnnnaaalllyyysssiiisss IIInnn RRRR useR! Conference 2013
Stephanie KovalchikResearch Fellow, National Cancer Institute
Tutorial On Meta-Analysis In R file:///Users/kovalchiksa/master/tutorial/user2013/index.html#200
1 of 204 6/23/13 1:10 PM

TTuuttoorriiaall OOuuttlliinneeOverview
Searching The Literature
Fixed Effects Model
Random Effects Model
Evaluating Heterogeneity
Meta-Regression
Publication Bias
Comparing R Packages For Standard Meta-Analysis
Some Advanced Topics
·
·
·
·
·
·
·
·
·
2/204
Tutorial On Meta-Analysis In R file:///Users/kovalchiksa/master/tutorial/user2013/index.html#200
2 of 204 6/23/13 1:10 PM

OOvveerrvviieeww
3/204
Tutorial On Meta-Analysis In R file:///Users/kovalchiksa/master/tutorial/user2013/index.html#200
3 of 204 6/23/13 1:10 PM

WWhhaatt IIss MMeettaa--AAnnaallyyssiiss??
The analysis of analyses.
-- Gene V. Glass
Primary, secondary and meta-analysis of research,
Educational Researcher, 1976.
“ ”
4/204
Tutorial On Meta-Analysis In R file:///Users/kovalchiksa/master/tutorial/user2013/index.html#200
4 of 204 6/23/13 1:10 PM

WWhhaatt IIss MMeettaa--AAnnaallyyssiiss??
More formally...a meta-analysis is the synthesis of:
Giving greater weight to studies with:
compatible effects ( )
(Preferably, but not necessarily, from randomized controlled trials)
· K Yi
·
Less variance ( ), and
More precision ( )
· Vi
· = 1/Wi Vi
5/204
Tutorial On Meta-Analysis In R file:///Users/kovalchiksa/master/tutorial/user2013/index.html#200
5 of 204 6/23/13 1:10 PM
TTyyppeess OOff EEffffeeccttss
An "effect" could be almost any aggregate statistic of interest:
Mean, Mean difference, Mean change
Risk ratio, Odds ratio, Risk difference
Incidence rate, Prevalence, Proportion
Correlation
·
·
·
·
6/204
Tutorial On Meta-Analysis In R file:///Users/kovalchiksa/master/tutorial/user2013/index.html#200
6 of 204 6/23/13 1:10 PM

AA HHiigghh--IImmppaacctt EExxaammppllee:: FFaallll OOff AAvvaannddiiaa
Source: Nissen SE, Wolski K. N Engl J Med 2007;356:2457-71.
7/204
Tutorial On Meta-Analysis In R file:///Users/kovalchiksa/master/tutorial/user2013/index.html#200
7 of 204 6/23/13 1:10 PM

CCoonndduuccttiinngg MMeettaa--AAnnaallyysseess iinn R
8/204
Tutorial On Meta-Analysis In R file:///Users/kovalchiksa/master/tutorial/user2013/index.html#200
8 of 204 6/23/13 1:10 PM

FFiirrsstt......GGeettttiinngg SSttaarrtteedd WWiitthh R
Official home page: http://www.R-project.org
Introduction under "What is R?"
Download base system at: http://cran.r-project.org
Extend with user-contributed packages -> install.packages
Find further introductory material with help.start
·
·
·
·
·
9/204
Tutorial On Meta-Analysis In R file:///Users/kovalchiksa/master/tutorial/user2013/index.html#200
9 of 204 6/23/13 1:10 PM
WWhhyy PPeerrffoorrmm MMeettaa--AAnnaallyysseess IInn R??
R is a free, open-source, & powerful statistical environment
Run on Windows, Mac OS, and Linux platforms
Has 20+ meta-analytic packages on CRAN
Tools for meta-regression, Bayesian meta-analysis, multivariatemeta-analyses, etc.
Easy (in most cases) to customize and extend these tools
·
·
·
·
·
10/204
Tutorial On Meta-Analysis In R file:///Users/kovalchiksa/master/tutorial/user2013/index.html#200
10 of 204 6/23/13 1:10 PM

WWaarrnniinngg:: SSttiillll......DDoo NNoott BBeeggiinn HHeerree!!
A meta-analysis starts with a systematic review.
A systematic review is a scientific summary of all availableevidence on a specific research question.
An exhaustive search of the literature will require more than R.
Note: If available studies are too few or too different ameta-analysis may not be appropriate.
·
·
·
·
11/204
Tutorial On Meta-Analysis In R file:///Users/kovalchiksa/master/tutorial/user2013/index.html#200
11 of 204 6/23/13 1:10 PM

SSeeaarrcchhiinngg TThhee LLiitteerraattuurree WWiitthh R
12/204
Tutorial On Meta-Analysis In R file:///Users/kovalchiksa/master/tutorial/user2013/index.html#200
12 of 204 6/23/13 1:10 PM

PPaacckkaaggee RISmed
Not many packages for helping with early stages of a systematicreview.
But, I created the RISmed package to import metadata from NCBIdatabases into R.
Using this package, one can search, store, and easily minemetadata on PubMed articles.
RISmed tools are not comprehensive enough to complete asystematic review but may be a helpful aid.
·
·
·
·
13/204
Tutorial On Meta-Analysis In R file:///Users/kovalchiksa/master/tutorial/user2013/index.html#200
13 of 204 6/23/13 1:10 PM

IImmppoorrttiinngg PPuubbMMeedd DDaattaa WWiitthh RISmed
Create EUtilsSummary object for specified query.1.
Retrieve matching records with EUtilsGet.2.
14/204
Tutorial On Meta-Analysis In R file:///Users/kovalchiksa/master/tutorial/user2013/index.html#200
14 of 204 6/23/13 1:10 PM
IImmppoorrttiinngg PPuubbMMeedd DDaattaa WWiitthh RISmed
Syntax
EUtilsSummary( [query], [db], [search.limits])
query: String query as given on PubMed site
db: String name of NCBI database
search.limits: Additional arguments to restrict search
·
·
·
15/204
Tutorial On Meta-Analysis In R file:///Users/kovalchiksa/master/tutorial/user2013/index.html#200
15 of 204 6/23/13 1:10 PM

EExxaammppllee:: EUtilsSummary
The following code performs a PubMed query of all BMJ articles with"rofecoxib" in the title.
library(RISmed) # Load Package
fit <- EUtilsSummary("rofecoxib[ti]+British Medical Journal[jo]", db = "pubmed")
16/204
Tutorial On Meta-Analysis In R file:///Users/kovalchiksa/master/tutorial/user2013/index.html#200
16 of 204 6/23/13 1:10 PM

EExxaammppllee:: MMeetthhooddss FFoorr EUtilsSummary
QueryTranslation(fit) # Extract the translated query
## [1] "rofecoxib[ti] AND (\"Br Med J\"[Journal] OR \"Br Med J (Clin Res Ed)
\"[Journal] OR \"BMJ\"[Journal])"
QueryCount(fit) # Extract the number of matched records
## [1] 16
17/204
Tutorial On Meta-Analysis In R file:///Users/kovalchiksa/master/tutorial/user2013/index.html#200
17 of 204 6/23/13 1:10 PM

EExxaammppllee:: EUtilsGet
Now we can extract the metadata for the queried records.
fetch <- EUtilsGet(fit)
fetch # Medline Object
## PubMed query: rofecoxib[ti] AND ("Br Med J"[Journal] OR "
## Br Med J (Clin Res Ed)"[Journal] OR "BMJ"[Journal])
##
## Records: 16
18/204
Tutorial On Meta-Analysis In R file:///Users/kovalchiksa/master/tutorial/user2013/index.html#200
18 of 204 6/23/13 1:10 PM

MMeetthhooddss FFoorr Medline OObbjjeecctt
getSlots("Medline") # Available methods
## Query PMID Year
## "character" "character" "numeric"
## Month Day Author
## "numeric" "numeric" "list"
## ISSN Title ArticleTitle
## "character" "character" "character"
## ELocationID AbstractText Affiliation
## "character" "character" "character"
## Language PublicationType MedlineTA
## "character" "character" "character"
## NlmUniqueID ISSNLinking Hour
## "character" "character" "numeric"
## Minute PublicationStatus ArticleId
## "numeric" "character" "character"
## Volume Issue ISOAbbreviation
## "character" "character" "character"
## MedlinePgn CopyrightInformation Country
## "character" "character" "character"
## GrantID Acronym Agency
## "character" "character" "character"
## RegistryNumber RefSource CollectiveName
## "character" "character" "character"
## Mesh
## "list"
19/204
Tutorial On Meta-Analysis In R file:///Users/kovalchiksa/master/tutorial/user2013/index.html#200
19 of 204 6/23/13 1:10 PM

EExxaammppllee:: Medline OObbjjeecctt
ArticleTitle(fetch)[1:5]
## [1] "Merck pays $1bn penalty in relation to promotion of rofecoxib."
## [2] "Merck to pay $58m in settlement over rofecoxib advertising."
## [3] "94% of patients suing Merck over rofecoxib agree to company's offer."
## [4] "Merck to pay $5bn in rofecoxib claims."
## [5] "Merck appeals rofecoxib verdict."
20/204
Tutorial On Meta-Analysis In R file:///Users/kovalchiksa/master/tutorial/user2013/index.html#200
20 of 204 6/23/13 1:10 PM

EExxaammppllee:: Medline OObbjjeecctt
Author(fetch)[[1]]
## LastName ForeName Initials order
## 1 Tanne Janice Hopkins JH 1
Year(fetch)
## [1] 2011 2008 2008 2007 2007 2006 2005 2005 2004 2004 2004 2004 2004 2003
## [15] 2002 2001
21/204
Tutorial On Meta-Analysis In R file:///Users/kovalchiksa/master/tutorial/user2013/index.html#200
21 of 204 6/23/13 1:10 PM

YYoouurr TTuurrnn:: WWoorrkkiinngg WWiitthh Medline OObbjjeecctt
Using the "rofecoxib" Medline object,
Determine the first year a matching article appeared.1.
What was the title of this article?2.
Do some authors have multiple matching records?3.
If so, which authors?4.
22/204
Tutorial On Meta-Analysis In R file:///Users/kovalchiksa/master/tutorial/user2013/index.html#200
22 of 204 6/23/13 1:10 PM

WWoorrkkiinngg WWiitthh Medline OObbjjeecctt
min(Year(fetch)) # Earliest year
## [1] 2001
ArticleTitle(fetch)[Year(fetch) == 2001] # Title of earliest record(s)
## [1] "FDA warns Merck over its promotion of rofecoxib."
23/204
Tutorial On Meta-Analysis In R file:///Users/kovalchiksa/master/tutorial/user2013/index.html#200
23 of 204 6/23/13 1:10 PM

WWoorrkkiinngg WWiitthh Medline OObbjjeecctt
AuthorList <- Author(fetch) # Extract list of authors
LastFirst <- sapply(AuthorList, function(x) paste(x$LastName, x$ForeName))
sort(table(unlist(LastFirst)), dec = TRUE)[1:3] # Tabulate & Sort
## Tanne Janice Hopkins Charatan Fred Abenhaim Lucien
## 4 3 1
24/204
Tutorial On Meta-Analysis In R file:///Users/kovalchiksa/master/tutorial/user2013/index.html#200
24 of 204 6/23/13 1:10 PM

BBaassiicc MMeettaa--AAnnaallyyssiiss IInn R
25/204
Tutorial On Meta-Analysis In R file:///Users/kovalchiksa/master/tutorial/user2013/index.html#200
25 of 204 6/23/13 1:10 PM

RR PPaacckkaaggeess FFoorr SSttaannddaarrdd MMeettaa--AAnnaallyyssiiss
In no particular order...
meta (Author: Guido Schwarzer)
metafor (Author: Wolfgang Viechtbauer)
rmeta (Author: Thomas Lumley)
·
·
·
26/204
Tutorial On Meta-Analysis In R file:///Users/kovalchiksa/master/tutorial/user2013/index.html#200
26 of 204 6/23/13 1:10 PM

DDaattaasseettss FFoorr PPaacckkaaggee EExxaammpplleess
BCG vaccine trials (from metafor)1.
Amlodipine angina treatment trials (from meta)2.
27/204
Tutorial On Meta-Analysis In R file:///Users/kovalchiksa/master/tutorial/user2013/index.html#200
27 of 204 6/23/13 1:10 PM

DDaattaasseett 11:: BBCCGG VVaacccciinnee TTrriiaallss
Overview: 13 vaccine trials of Bacillus Calmette–Guérin (BCG)vaccine vs. no vaccine
Treatment goal: Prevention of tuberculosis
Primary endpoint: Tuberculosis infection
Possible explanatory variables:
·
·
·
·
latitude of study region
treatment allocation method
year published
-
-
-
28/204
Tutorial On Meta-Analysis In R file:///Users/kovalchiksa/master/tutorial/user2013/index.html#200
28 of 204 6/23/13 1:10 PM

LLooaaddiinngg BBCCGG DDaattaasseett
A version of the BCG dataset is provided by package metafor
library(metafor) # Load package
data(dat.bcg) # BCG meta-analytic dataset
str(dat.bcg) # Describe meta-analysis structure
## 'data.frame': 13 obs. of 9 variables:
## $ trial : int 1 2 3 4 5 6 7 8 9 10 ...
## $ author: chr "Aronson" "Ferguson & Simes" "Rosenthal et al" "Hart & Sutherland" ...
## $ year : int 1948 1949 1960 1977 1973 1953 1973 1980 1968 1961 ...
## $ tpos : int 4 6 3 62 33 180 8 505 29 17 ...
## $ tneg : int 119 300 228 13536 5036 1361 2537 87886 7470 1699 ...
## $ cpos : int 11 29 11 248 47 372 10 499 45 65 ...
## $ cneg : int 128 274 209 12619 5761 1079 619 87892 7232 1600 ...
## $ ablat : int 44 55 42 52 13 44 19 13 27 42 ...
## $ alloc : chr "random" "random" "random" "random" ...
29/204
Tutorial On Meta-Analysis In R file:///Users/kovalchiksa/master/tutorial/user2013/index.html#200
29 of 204 6/23/13 1:10 PM

DDaattaasseett 22:: AAmmllooddiippiinnee TTrreeaattmmeenntt TTrriiaallss
Overview: 8 randomized controlled trials (RCTs) of amlodipine vs.placebo
Treatment goal: Reduce harms of angina (chest pain)
Primary endpoint: Work capacity (ratio of exercise time after tobefore intervention)
·
·
·
30/204
Tutorial On Meta-Analysis In R file:///Users/kovalchiksa/master/tutorial/user2013/index.html#200
30 of 204 6/23/13 1:10 PM

LLooaaddiinngg amlodipine DDaattaasseett
A version of the amlodipine dataset is provided by package meta
library(meta) # Load package
data(amlodipine) # amlodipine meta-analytic dataset
str(amlodipine) # Describe meta-analysis structure
## 'data.frame': 8 obs. of 7 variables:
## $ study : Factor w/ 8 levels "Protocol 154",..: 1 2 3 4 5 6 7 8
## $ n.amlo : int 46 30 75 12 32 31 27 46
## $ mean.amlo: num 0.232 0.281 0.189 0.093 0.162 ...
## $ var.amlo : num 0.2254 0.1441 0.1981 0.1389 0.0961 ...
## $ n.plac : int 48 26 72 12 34 31 27 47
## $ mean.plac: num -0.0027 0.027 0.0443 0.2277 0.0056 ...
## $ var.plac : num 0.0007 0.1139 0.4972 0.0488 0.0955 ...
31/204
Tutorial On Meta-Analysis In R file:///Users/kovalchiksa/master/tutorial/user2013/index.html#200
31 of 204 6/23/13 1:10 PM

EEffffeecctt SSiizzeess ((EESSss))
An effect size could be almost any summary statistic (e.g. amean, a difference in proportions, an adjusted odds ratio, etc.)
Conventional meta-analytic models assume normality of ESs.
Because of the CLT, this will holds for most ESs given largeenough samples.
To normalize ESs, a log-transform is common.
·
·
·
·
32/204
Tutorial On Meta-Analysis In R file:///Users/kovalchiksa/master/tutorial/user2013/index.html#200
32 of 204 6/23/13 1:10 PM
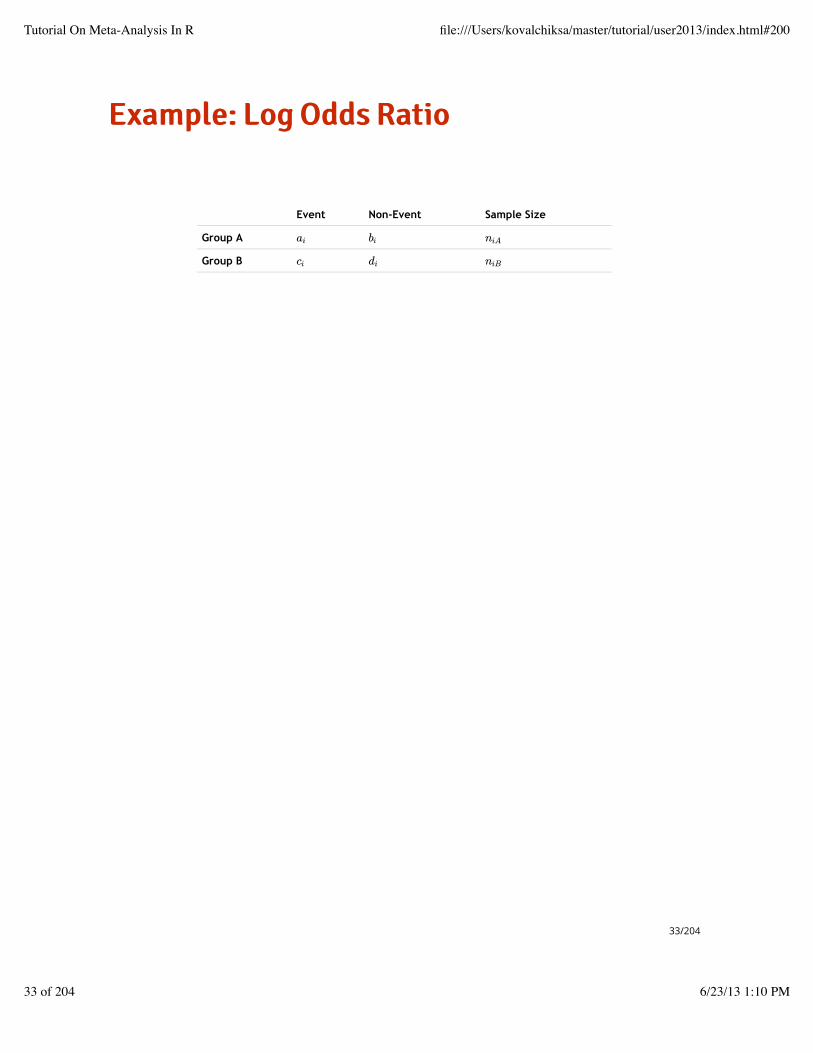
EExxaammppllee:: LLoogg OOddddss RRaattiioo
Event Non-Event Sample Size
Group A
Group B
ai bi niA
ci di niB
33/204
Tutorial On Meta-Analysis In R file:///Users/kovalchiksa/master/tutorial/user2013/index.html#200
33 of 204 6/23/13 1:10 PM
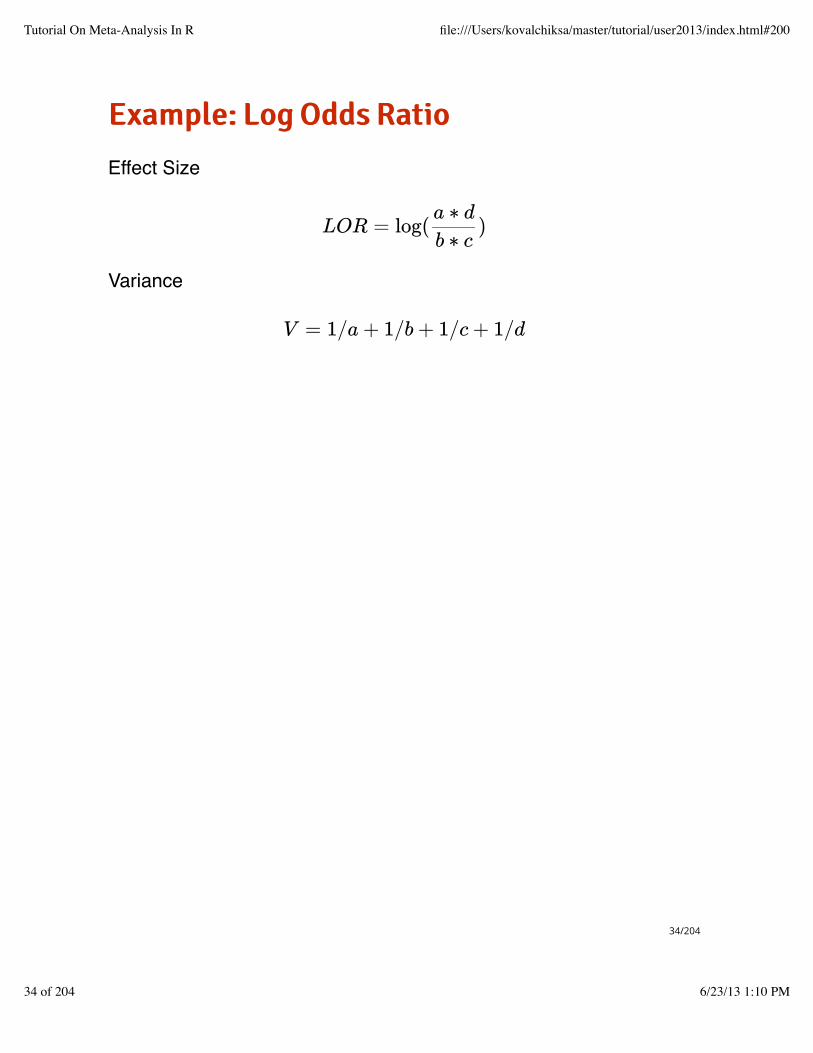
EExxaammppllee:: LLoogg OOddddss RRaattiioo
Effect Size
Variance
LOR = log( )a ∗ d
b ∗ c
V = 1/a + 1/b + 1/c + 1/d
34/204
Tutorial On Meta-Analysis In R file:///Users/kovalchiksa/master/tutorial/user2013/index.html#200
34 of 204 6/23/13 1:10 PM

CCaallccuullaattiinngg:: LLoogg OOddddss RRaattiiooY <- with(dat.bcg, log(tpos * cneg/(tneg * cpos)))
V <- with(dat.bcg, 1/tpos + 1/cneg + 1/tneg + 1/cpos)
cbind(Y, V)
## Y V
## [1,] -0.93869 0.357125
## [2,] -1.66619 0.208132
## [3,] -1.38629 0.433413
## [4,] -1.45644 0.020314
## [5,] -0.21914 0.051952
## [6,] -0.95812 0.009905
## [7,] -1.63378 0.227010
## [8,] 0.01202 0.004007
## [9,] -0.47175 0.056977
## [10,] -1.40121 0.075422
## [11,] -0.34085 0.012525
## [12,] 0.44663 0.534162
## [13,] -0.01734 0.071635
35/204
Tutorial On Meta-Analysis In R file:///Users/kovalchiksa/master/tutorial/user2013/index.html#200
35 of 204 6/23/13 1:10 PM

UUssiinngg metafor FFoorr EESS CCaallccuullaattiioonn
escalc does the work of calculating ESs.
Give the necessary data components (i.e. sample size, events ineach treatment group, etc.).
Indicate the ES you want with measure.
Many, many, types of single group and between-group ESs.
·
·
·
·
36/204
Tutorial On Meta-Analysis In R file:///Users/kovalchiksa/master/tutorial/user2013/index.html#200
36 of 204 6/23/13 1:10 PM

UUssiinngg metafor FFoorr EESS CCaallccuullaattiioonn
Syntax
ES <- escalc(endpoints, variances, measure, data,
...)
endpoints: arguments or formula containing endpoint values
variances: arguments containing endpoint variances
measure: character value indicating type of ES
data: data frame containing named variables
·
·
·
·
37/204
Tutorial On Meta-Analysis In R file:///Users/kovalchiksa/master/tutorial/user2013/index.html#200
37 of 204 6/23/13 1:10 PM

EEffffeecctt SSiizzee:: LLoogg OOddddss RRaattiioo
ES <- escalc(ai = tpos, bi = tneg, ci = cpos, di = cneg,
data = dat.bcg,
measure = "OR")
cbind(ES$yi, ES$vi)
38/204
Tutorial On Meta-Analysis In R file:///Users/kovalchiksa/master/tutorial/user2013/index.html#200
38 of 204 6/23/13 1:10 PM

EEffffeecctt SSiizzee:: LLoogg OOddddss RRaattiioo
## [,1] [,2]
## [1,] -0.93869 0.357125
## [2,] -1.66619 0.208132
## [3,] -1.38629 0.433413
## [4,] -1.45644 0.020314
## [5,] -0.21914 0.051952
## [6,] -0.95812 0.009905
## [7,] -1.63378 0.227010
## [8,] 0.01202 0.004007
## [9,] -0.47175 0.056977
## [10,] -1.40121 0.075422
## [11,] -0.34085 0.012525
## [12,] 0.44663 0.534162
## [13,] -0.01734 0.071635
39/204
Tutorial On Meta-Analysis In R file:///Users/kovalchiksa/master/tutorial/user2013/index.html#200
39 of 204 6/23/13 1:10 PM

FFoorrmmuullaa--BBaasseedd SSppeecciiffiiccaattiioonn
What if my data is in a "long" format?
That is, what if I have multiple rows per study, corresponding todifference treatment groups?
In that case, you may prefer specifying the variables for the EScalculation using a formula.
·
·
·
40/204
Tutorial On Meta-Analysis In R file:///Users/kovalchiksa/master/tutorial/user2013/index.html#200
40 of 204 6/23/13 1:10 PM

FFoorrmmuullaa--BBaasseedd SSppeecciiffiiccaattiioonn
Syntax
Note: The exact syntax will vary a bit depending on the ES type.
escalc(formula = outcome ~ group | study, data = data, weights = n)
41/204
Tutorial On Meta-Analysis In R file:///Users/kovalchiksa/master/tutorial/user2013/index.html#200
41 of 204 6/23/13 1:10 PM
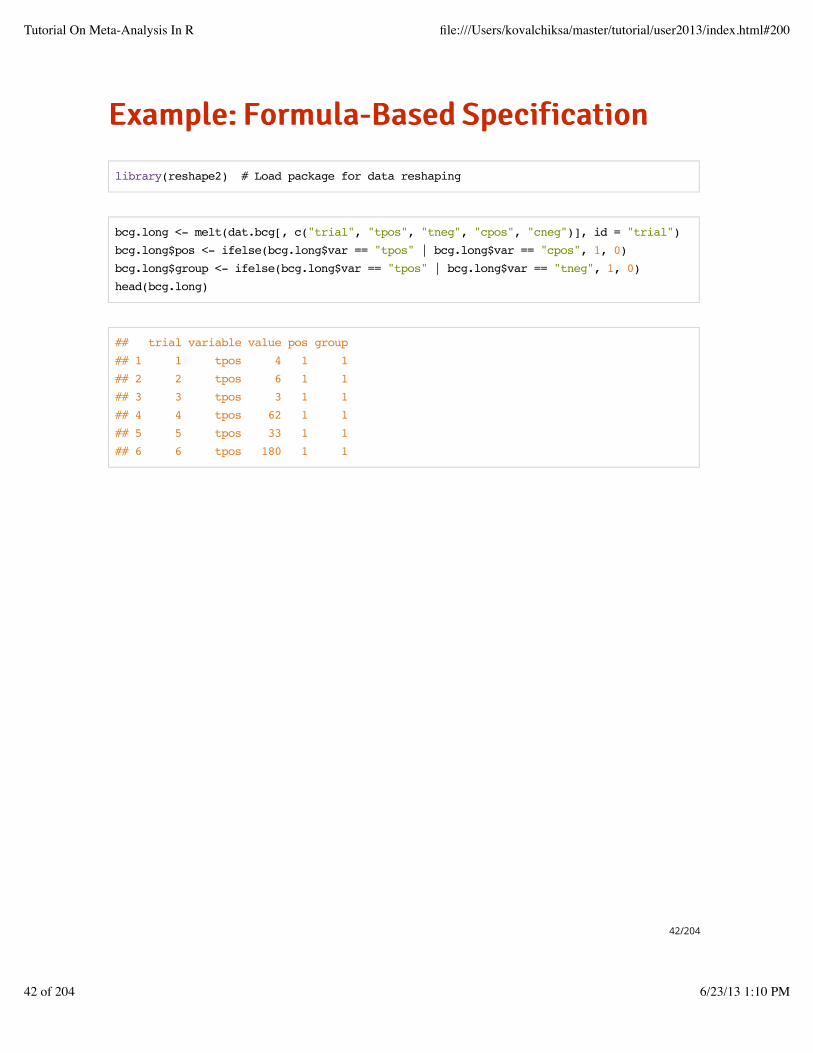
EExxaammppllee:: FFoorrmmuullaa--BBaasseedd SSppeecciiffiiccaattiioonn
library(reshape2) # Load package for data reshaping
bcg.long <- melt(dat.bcg[, c("trial", "tpos", "tneg", "cpos", "cneg")], id = "trial")
bcg.long$pos <- ifelse(bcg.long$var == "tpos" | bcg.long$var == "cpos", 1, 0)
bcg.long$group <- ifelse(bcg.long$var == "tpos" | bcg.long$var == "tneg", 1, 0)
head(bcg.long)
## trial variable value pos group
## 1 1 tpos 4 1 1
## 2 2 tpos 6 1 1
## 3 3 tpos 3 1 1
## 4 4 tpos 62 1 1
## 5 5 tpos 33 1 1
## 6 6 tpos 180 1 1
42/204
Tutorial On Meta-Analysis In R file:///Users/kovalchiksa/master/tutorial/user2013/index.html#200
42 of 204 6/23/13 1:10 PM

EExxaammppllee:: FFoorrmmuullaa--BBaasseedd SSppeecciiffiiccaattiioonn
escalc(factor(pos) ~ factor(group) | factor(trial),
weights = value,
data = bcg.long,
measure = "OR")
43/204
Tutorial On Meta-Analysis In R file:///Users/kovalchiksa/master/tutorial/user2013/index.html#200
43 of 204 6/23/13 1:10 PM
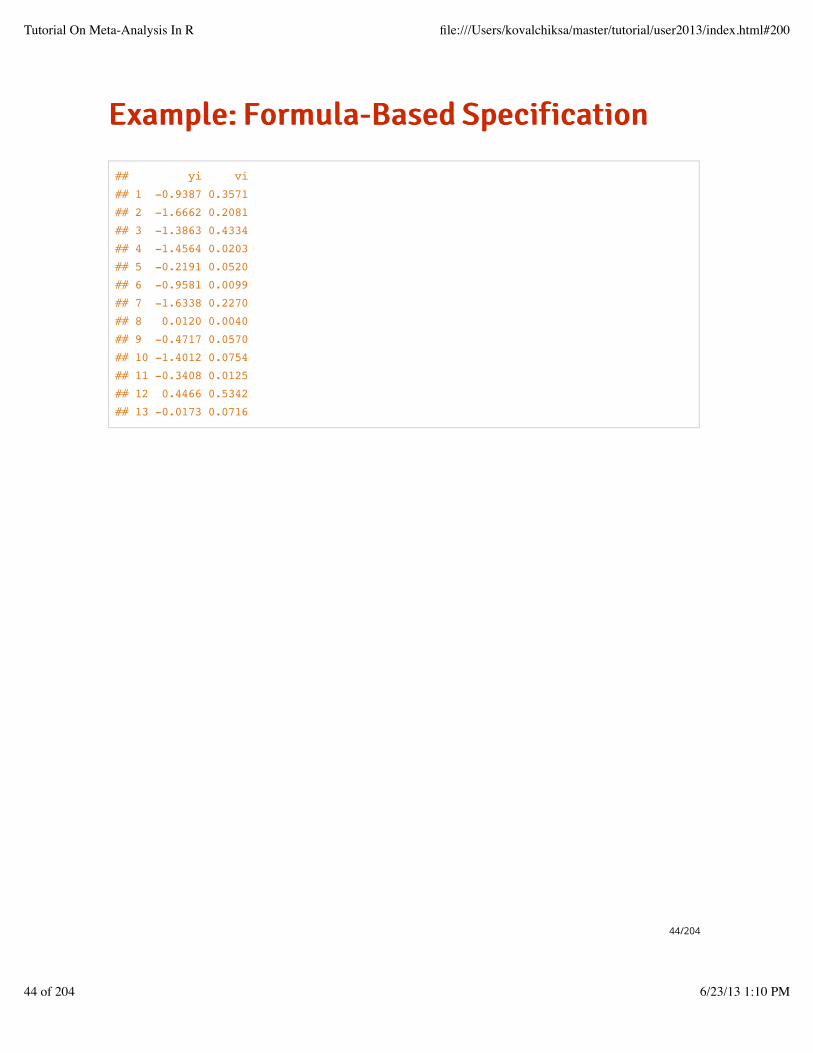
EExxaammppllee:: FFoorrmmuullaa--BBaasseedd SSppeecciiffiiccaattiioonn
## yi vi
## 1 -0.9387 0.3571
## 2 -1.6662 0.2081
## 3 -1.3863 0.4334
## 4 -1.4564 0.0203
## 5 -0.2191 0.0520
## 6 -0.9581 0.0099
## 7 -1.6338 0.2270
## 8 0.0120 0.0040
## 9 -0.4717 0.0570
## 10 -1.4012 0.0754
## 11 -0.3408 0.0125
## 12 0.4466 0.5342
## 13 -0.0173 0.0716
44/204
Tutorial On Meta-Analysis In R file:///Users/kovalchiksa/master/tutorial/user2013/index.html#200
44 of 204 6/23/13 1:10 PM

escalc && rma
rma is the main modeling function of metafor.
rma is also a wrapper for escalc, and will compute ESs beforemodeling (if you like).
You usually won't work with escalc directly.
But if you want the ESs (yi) and variances (vi) without modeling,use escalc.
By default, escalc appends the yi and vi to the dataset.
To return only yi and vi set append=TRUE.
·
·
·
·
·
·
45/204
Tutorial On Meta-Analysis In R file:///Users/kovalchiksa/master/tutorial/user2013/index.html#200
45 of 204 6/23/13 1:10 PM

SSuummmmaarriizziinngg EEffffeeccttss
46/204
Tutorial On Meta-Analysis In R file:///Users/kovalchiksa/master/tutorial/user2013/index.html#200
46 of 204 6/23/13 1:10 PM

SSuummmmaarriizziinngg EEffffeeccttss:: BBaassiicc FFrraammeewwoorrkk
Normal Assumption
Summary Effect Size is a Weighted Average
Each Study's Contribution
∼ N(θ, )Yi Vi
= / , Var( ) = 1/θ ∑i
YiWi ∑i
Wi θ ∑i
Wi
= /λi Wi ∑i
Wi
47/204
Tutorial On Meta-Analysis In R file:///Users/kovalchiksa/master/tutorial/user2013/index.html#200
47 of 204 6/23/13 1:10 PM
MMooddeelliinngg AApppprrooaacchheess
Fixed
-> Same mean ES, zero between-study variance
Random
-> Different mean ES, between-study variance
Mixed
-> Study-level regression for mean ES
·
·
·
48/204
Tutorial On Meta-Analysis In R file:///Users/kovalchiksa/master/tutorial/user2013/index.html#200
48 of 204 6/23/13 1:10 PM

FFiixxeedd EEffffeeccttss MMooddeell
Same mean ES, known variance·
= θ + ,Yi ei
∼ N(0, ).ei Vi
49/204
Tutorial On Meta-Analysis In R file:///Users/kovalchiksa/master/tutorial/user2013/index.html#200
49 of 204 6/23/13 1:10 PM

RRaannddoomm EEffffeeccttss MMooddeell
Different mean ES, between-study variance·
= θ + + ,Yi θi ei
∼ N(0, ),θi τ 2
∼ N(0, ).ei Vi
50/204
Tutorial On Meta-Analysis In R file:///Users/kovalchiksa/master/tutorial/user2013/index.html#200
50 of 204 6/23/13 1:10 PM

MMiixxeedd EEffffeeccttss MMooddeell ((MMeettaa--RReeggrreessssiioonn))
= Study-level covariates
Study-level regression for mean ES·
= + + ,Yi β′xi θi ei
∼ N(0, ),θi τ 2
∼ N(0, ).ei Vi
xi
51/204
Tutorial On Meta-Analysis In R file:///Users/kovalchiksa/master/tutorial/user2013/index.html#200
51 of 204 6/23/13 1:10 PM
FFiixxeedd VVeerrssuuss RRaannddoomm EEffffeeccttss
The FE model is a description of the studies.
The RE model regards the studies as a sample of a largeruniverse of studies.
The RE model can be used to infer what would likely happen if anew study were performed, the FE model cannot.
Common practice is to report both fixed and random effectsmodel results.
· K
· K
·
·
52/204
Tutorial On Meta-Analysis In R file:///Users/kovalchiksa/master/tutorial/user2013/index.html#200
52 of 204 6/23/13 1:10 PM

FFiixxeedd EEffffeeccttss
53/204
Tutorial On Meta-Analysis In R file:///Users/kovalchiksa/master/tutorial/user2013/index.html#200
53 of 204 6/23/13 1:10 PM

RRaannddoomm EEffffeeccttss
Summary ES has more uncertainty because of between-study variance.
54/204
Tutorial On Meta-Analysis In R file:///Users/kovalchiksa/master/tutorial/user2013/index.html#200
54 of 204 6/23/13 1:10 PM

FFiixxeedd EEffffeeccttss WWiitthh metafor
REML = Restricted Maximum Likelihood
All model summaries are made with the rma function.
rma stands for random effects meta-analysis
The default method is a REML RE model, but the FE model canalso be fit.
·
·
·
55/204
Tutorial On Meta-Analysis In R file:///Users/kovalchiksa/master/tutorial/user2013/index.html#200
55 of 204 6/23/13 1:10 PM
FFuunnccttiioonn rma
Syntax
rma(yi, vi, method, ...)
yi effect size
vi variances
method type of model approach
·
·
·
56/204
Tutorial On Meta-Analysis In R file:///Users/kovalchiksa/master/tutorial/user2013/index.html#200
56 of 204 6/23/13 1:10 PM

MMooddeelliinngg MMeetthhooddss FFoorr rma IInncclluuddee::
"FE" = Fixed Effects
"DL" = DerSimonian-Laird
"HE" = Hedges estimator
"ML" = Maximum Likelihood
"REML" = Restricted ML
·
·
·
·
·
57/204
Tutorial On Meta-Analysis In R file:///Users/kovalchiksa/master/tutorial/user2013/index.html#200
57 of 204 6/23/13 1:10 PM

FFiittttiinngg TThhee FFiixxeedd EEffffeeccttss MMooddeell
58/204
Tutorial On Meta-Analysis In R file:///Users/kovalchiksa/master/tutorial/user2013/index.html#200
58 of 204 6/23/13 1:10 PM

EExxaammppllee:: BBCCGG FFEE MMooddeell
result.or <- rma(yi = Y, vi = V, method = "FE") # Log Odds Ratio
summary(result.or)
## Fixed-Effects Model (k = 13)
##
## logLik deviance AIC BIC
## -76.0290 163.1649 154.0580 154.6229
##
## Test for Heterogeneity:
## Q(df = 12) = 163.1649, p-val < .0001
##
## Model Results:
##
## estimate se zval pval ci.lb ci.ub
## -0.4361 0.0423 -10.3190 <.0001 -0.5190 -0.3533 ***
59/204
Tutorial On Meta-Analysis In R file:///Users/kovalchiksa/master/tutorial/user2013/index.html#200
59 of 204 6/23/13 1:10 PM

WWrraappppeerr FFoorr escalc
Have rma calculate the ESs, if you haven't done it yourself.
args(rma)
## function (yi, vi, sei, weights, ai, bi, ci, di, n1i, n2i, x1i,
## x2i, t1i, t2i, m1i, m2i, sd1i, sd2i, xi, mi, ri, ti, sdi,
## ni, mods, measure = "GEN", intercept = TRUE, data, slab,
## subset, add = 1/2, to = "only0", drop00 = FALSE, vtype = "LS",
## method = "REML", weighted = TRUE, knha = FALSE, level = 95,
## digits = 4, btt, tau2, verbose = FALSE, control)
## NULL
60/204
Tutorial On Meta-Analysis In R file:///Users/kovalchiksa/master/tutorial/user2013/index.html#200
60 of 204 6/23/13 1:10 PM

EExxaammppllee:: MMeeaann DDiiffffeerreennccee
result.md <- rma(m1 = mean.amlo, m2 = mean.plac,
sd1 = sqrt(var.amlo), sd2 = sqrt(var.plac),
n1 = n.amlo, n2 = n.plac,
method = "FE", measure = "MD",
data = amlodipine)
61/204
Tutorial On Meta-Analysis In R file:///Users/kovalchiksa/master/tutorial/user2013/index.html#200
61 of 204 6/23/13 1:10 PM

WWhhaatt IIss RReettuurrnneedd?? rma CCllaassss
-> The function rma returns an object of the class rma.
-> This object behaves like a list.
-> You can use the function names to see available elements.
names(result.md) # Components of rma
62/204
Tutorial On Meta-Analysis In R file:///Users/kovalchiksa/master/tutorial/user2013/index.html#200
62 of 204 6/23/13 1:10 PM

CCoommppoonneennttss OOff rma
names(result.md)
## [1] "b" "se" "zval" "pval" "ci.lb"
## [6] "ci.ub" "vb" "tau2" "se.tau2" "k"
## [11] "k.f" "k.eff" "p" "p.eff" "parms"
## [16] "m" "QE" "QEp" "QM" "QMp"
## [21] "I2" "H2" "int.only" "int.incl" "allvipos"
## [26] "yi" "vi" "X" "yi.f" "vi.f"
## [31] "X.f" "ai.f" "bi.f" "ci.f" "di.f"
## [36] "x1i.f" "x2i.f" "t1i.f" "t2i.f" "ni"
## [41] "ni.f" "ids" "not.na" "slab" "slab.null"
## [46] "measure" "method" "weighted" "knha" "robust"
## [51] "s2w" "btt" "intercept" "digits" "level"
## [56] "control" "add" "to" "drop00" "fit.stats"
63/204
Tutorial On Meta-Analysis In R file:///Users/kovalchiksa/master/tutorial/user2013/index.html#200
63 of 204 6/23/13 1:10 PM

FFrreeqquueennttllyy UUsseedd EElleemmeennttss
Name Description
b Summary effect
ci.lb Left endpoint of CI
ci.ub Right endpoint of CI
vb Variance-covariance of summary effects
fit.stats Model fit statistics
yi Vector of study effect sizes
vi Vector of effect size variances
64/204
Tutorial On Meta-Analysis In R file:///Users/kovalchiksa/master/tutorial/user2013/index.html#200
64 of 204 6/23/13 1:10 PM

YYoouurr TTuurrnn:: FFiixxeedd EEffffeeccttss,, MMeeaann DDiiffffeerreennccee
For the mean difference in the amlodipine trial determine:
The summary effect1.
The 95% confidence interval2.
65/204
Tutorial On Meta-Analysis In R file:///Users/kovalchiksa/master/tutorial/user2013/index.html#200
65 of 204 6/23/13 1:10 PM

YYoouurr TTuurrnn:: FFiixxeedd EEffffeeccttss,, MMeeaann DDiiffffeerreennccee
result.md$b
## [,1]
## intrcpt 0.1619
c(result.md$ci.lb, result.md$ci.ub)
## [1] 0.0986 0.2252
66/204
Tutorial On Meta-Analysis In R file:///Users/kovalchiksa/master/tutorial/user2013/index.html#200
66 of 204 6/23/13 1:10 PM

YYoouurr TTuurrnn:: SSttuuddyy CCoonnttrriibbuuttiioonnss
Determine the percentage each study contributed to the overalleffect size summary.
1.
Which study contributes the most? How much?2.
Use a barplot to show the percentages graphically.3.
67/204
Tutorial On Meta-Analysis In R file:///Users/kovalchiksa/master/tutorial/user2013/index.html#200
67 of 204 6/23/13 1:10 PM

YYoouurr TTuurrnn:: SSttuuddyy CCoonnttrriibbuuttiioonnss
contributions <- 1/result.md$vi/sum(1/result.md$vi) * 100
cbind(contributions)
## contributions
## [1,] 21.219
## [2,] 11.355
## [3,] 10.923
## [4,] 6.667
## [5,] 17.943
## [6,] 10.848
## [7,] 1.661
## [8,] 19.385
68/204
Tutorial On Meta-Analysis In R file:///Users/kovalchiksa/master/tutorial/user2013/index.html#200
68 of 204 6/23/13 1:10 PM

YYoouurr TTuurrnn:: SSttuuddyy CCoonnttrriibbuuttiioonnss
max(contributions)
## [1] 21.22
amlodipine$study[which(contributions == max(contributions))]
## [1] Protocol 154
## 8 Levels: Protocol 154 Protocol 156 Protocol 157 ... Protocol 306
69/204
Tutorial On Meta-Analysis In R file:///Users/kovalchiksa/master/tutorial/user2013/index.html#200
69 of 204 6/23/13 1:10 PM

YYoouurr TTuurrnn:: SSttuuddyy CCoonnttrriibbuuttiioonnss
contributions <- 1/result.md$vi/sum(1/result.md$vi) * 100
par(mar = c(5, 10, 5, 5))
barplot(contributions, names = amlodipine$study,
xlim = c(0, 50), las = 2, horiz = T,
col = "royalblue")
70/204
Tutorial On Meta-Analysis In R file:///Users/kovalchiksa/master/tutorial/user2013/index.html#200
70 of 204 6/23/13 1:10 PM

YYoouurr TTuurrnn:: SSttuuddyy CCoonnttrriibbuuttiioonnss
71/204
Tutorial On Meta-Analysis In R file:///Users/kovalchiksa/master/tutorial/user2013/index.html#200
71 of 204 6/23/13 1:10 PM

MMeetthhooddss FFoorr rma OObbjjeecctt
Name Description
coef Summary effect
confint Confidence interval
summary Summary table of meta-analytic model
72/204
Tutorial On Meta-Analysis In R file:///Users/kovalchiksa/master/tutorial/user2013/index.html#200
72 of 204 6/23/13 1:10 PM

MMeetthhooddss FFoorr rma OObbjjeecctt
summary(result.md)
## Fixed-Effects Model (k = 8)
##
## logLik deviance AIC BIC
## 4.7834 12.3311 -7.5669 -7.4874
##
## Test for Heterogeneity:
## Q(df = 7) = 12.3311, p-val = 0.0902
##
## Model Results:
##
## estimate se zval pval ci.lb ci.ub
## 0.1619 0.0323 5.0134 <.0001 0.0986 0.2252 ***
73/204
Tutorial On Meta-Analysis In R file:///Users/kovalchiksa/master/tutorial/user2013/index.html#200
73 of 204 6/23/13 1:10 PM

MMeetthhooddss FFoorr rma OObbjjeecctt
coef(result.md)
## intrcpt
## 0.1619
74/204
Tutorial On Meta-Analysis In R file:///Users/kovalchiksa/master/tutorial/user2013/index.html#200
74 of 204 6/23/13 1:10 PM

MMeetthhooddss FFoorr rma OObbjjeecctt
confint(result.md) # Heterogeneity measures do not apply for FE model
##
## estimate ci.lb ci.ub
## tau^2 NA 0.0000 0.1667
## tau NA 0.0000 0.4082
## I^2(%) NA 0.0000 95.0658
## H^2 NA 1.0000 20.2667
75/204
Tutorial On Meta-Analysis In R file:///Users/kovalchiksa/master/tutorial/user2013/index.html#200
75 of 204 6/23/13 1:10 PM

FFiittttiinngg TThhee RRaannddoomm EEffffeeccttss MMooddeell
76/204
Tutorial On Meta-Analysis In R file:///Users/kovalchiksa/master/tutorial/user2013/index.html#200
76 of 204 6/23/13 1:10 PM

RRaannddoomm EEffffeeccttss MMooddeell
Suppose between-study variance ( ) is non-zero.
Methods differ on how they estimate .
Many iterative and non-iterative approaches to estimating havebeen proposed.
· τ 2
· τ 2
· τ 2
77/204
Tutorial On Meta-Analysis In R file:///Users/kovalchiksa/master/tutorial/user2013/index.html#200
77 of 204 6/23/13 1:10 PM

EEssttiimmaattoorrss ooff
The rma function offers the following estimators:
Method Estimator
DL DerSimonian-Laird (Most Common)
HE Hedges
HS Hunter-Schmidt
SJ Sidik-Jonkman
ML Maximum-likelihood
REML Restricted maximum-likelihood (Default)
EB Empirical Bayes
τ 2
78/204
Tutorial On Meta-Analysis In R file:///Users/kovalchiksa/master/tutorial/user2013/index.html#200
78 of 204 6/23/13 1:10 PM

BBeettwweeeenn--SSttuuddyy VVaarriiaannccee
The rma function offers the following estimators:
Method Estimator
DL DerSimonian-Laird (Most Common)
HE Hedges
HS Hunter-Schmidt
SJ Sidik-Jonkman
ML Maximum-likelihood
REML Restricted maximum-likelihood (Default)
EB Empirical Bayes
No method is universally superior, but Viechtbauer's simulationstudy (2002) suggests REML has the most recommendableproperties.
79/204
Tutorial On Meta-Analysis In R file:///Users/kovalchiksa/master/tutorial/user2013/index.html#200
79 of 204 6/23/13 1:10 PM

EExxaammppllee:: RREE MMooddeell,, MMeeaann DDiiffffeerreennccee
result.md <- rma(m1 = mean.amlo, m2 = mean.plac,
sd1 = sqrt(var.amlo), sd2 = sqrt(var.plac),
n1 = n.amlo, n2 = n.plac,
method = "REML", measure = "MD",
data = amlodipine)
80/204
Tutorial On Meta-Analysis In R file:///Users/kovalchiksa/master/tutorial/user2013/index.html#200
80 of 204 6/23/13 1:10 PM

EExxaammppllee:: RREE MMooddeell,, MMeeaann DDiiffffeerreennccee
summary(result.md)
## Random-Effects Model (k = 8; tau^2 estimator: REML)
##
## logLik deviance AIC BIC
## 3.3094 -6.6188 -2.6188 -2.7270
##
## tau^2 (estimated amount of total heterogeneity): 0.0001 (SE = 0.0042)
## tau (square root of estimated tau^2 value): 0.0116
## I^2 (total heterogeneity / total variability): 1.54%
## H^2 (total variability / sampling variability): 1.02
##
## Test for Heterogeneity:
## Q(df = 7) = 12.3311, p-val = 0.0902
##
## Model Results:
##
## estimate se zval pval ci.lb ci.ub
## 0.1617 0.0326 4.9584 <.0001 0.0978 0.2257 ***
81/204
Tutorial On Meta-Analysis In R file:///Users/kovalchiksa/master/tutorial/user2013/index.html#200
81 of 204 6/23/13 1:10 PM
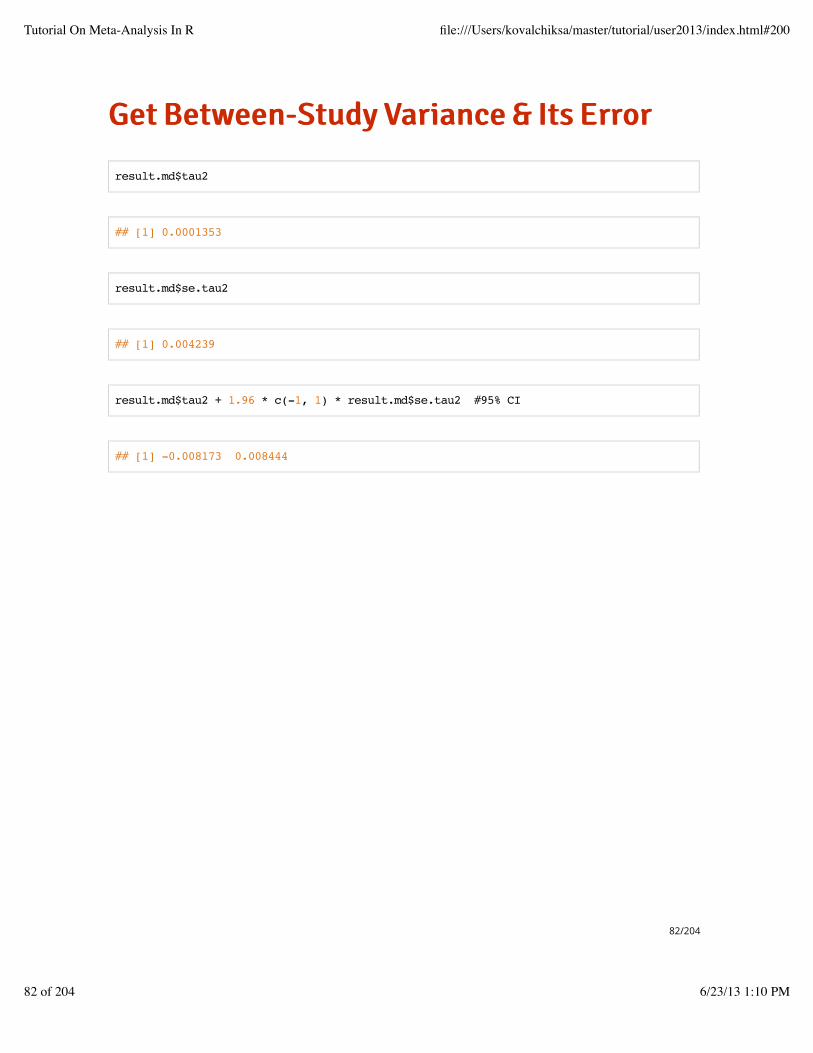
GGeett BBeettwweeeenn--SSttuuddyy VVaarriiaannccee && IIttss EErrrroorr
result.md$tau2
## [1] 0.0001353
result.md$se.tau2
## [1] 0.004239
result.md$tau2 + 1.96 * c(-1, 1) * result.md$se.tau2 #95% CI
## [1] -0.008173 0.008444
82/204
Tutorial On Meta-Analysis In R file:///Users/kovalchiksa/master/tutorial/user2013/index.html#200
82 of 204 6/23/13 1:10 PM

HHooww MMuucchh CCaann EEssttiimmaatteess OOff DDiiffffeerr??τ 2
estimators <- c("DL", "REML", "HE", "HS", "SJ", "ML", "EB")
taus <- sapply(estimators, function(method) {
rma(m1 = mean.amlo, m2 = mean.plac,
sd1 = sqrt(var.amlo), sd2 = sqrt(var.plac),
n1 = n.amlo, n2 = n.plac,
method = method, measure = "MD",
data = amlodipine)$tau2
})
83/204
Tutorial On Meta-Analysis In R file:///Users/kovalchiksa/master/tutorial/user2013/index.html#200
83 of 204 6/23/13 1:10 PM

PPlloott OOff EEssttiimmaatteessτ 2
plot(y = taus, x = 1:length(taus),
type = "h", pch = 19,
axes = FALSE, xlab = "Estimators")
axis(2, las = 1)
axis(1, at = 1:length(taus), lab = estimators)
84/204
Tutorial On Meta-Analysis In R file:///Users/kovalchiksa/master/tutorial/user2013/index.html#200
84 of 204 6/23/13 1:10 PM

PPlloott OOff EEssttiimmaatteessτ 2
85/204
Tutorial On Meta-Analysis In R file:///Users/kovalchiksa/master/tutorial/user2013/index.html#200
85 of 204 6/23/13 1:10 PM

DDeerrSSiimmoonniiaann--LLaaiirrdd
Method of moments estimator; Most popular approach
= max{0, }τ 2 Q − (K − 1)
− /∑i Wi ∑i W 2i ∑i Wi
Q = ( −∑i
Wi Yi Y )2
= ∑ / ∑Y W WiYi Wi
86/204
Tutorial On Meta-Analysis In R file:///Users/kovalchiksa/master/tutorial/user2013/index.html#200
86 of 204 6/23/13 1:10 PM
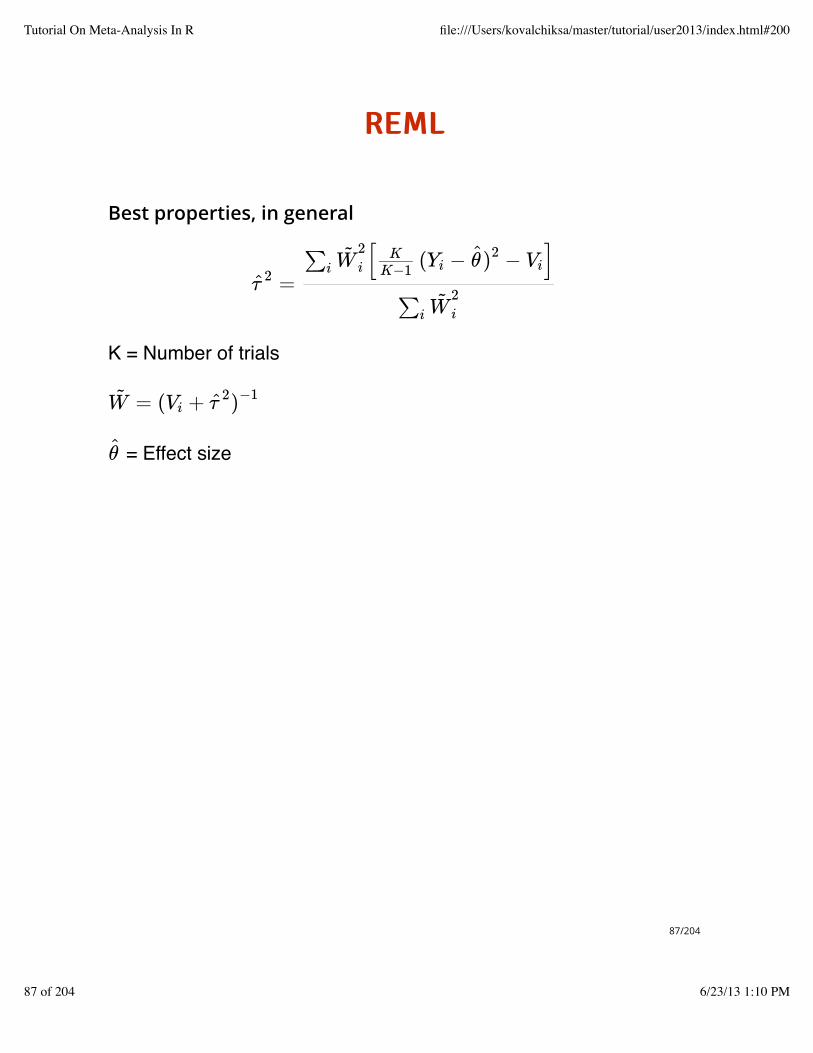
RREEMMLL
Best properties, in general
K = Number of trials
= Effect size
=τ 2[ ( − − ]∑i W
2i
KK−1 Yi θ)2 Vi
∑i W2i
= ( +W Vi τ 2)−1
θ
87/204
Tutorial On Meta-Analysis In R file:///Users/kovalchiksa/master/tutorial/user2013/index.html#200
87 of 204 6/23/13 1:10 PM

MMaaxxiimmuumm--LLiikkeelliihhoooodd
=τ 2[( − − ]∑i W 2
i Yi θ)2 Vi
∑i W 2i
88/204
Tutorial On Meta-Analysis In R file:///Users/kovalchiksa/master/tutorial/user2013/index.html#200
88 of 204 6/23/13 1:10 PM

HHeeddggeess
= −τ 2 ( −∑i Yi Y )2
(K − 1)∑i Vi
K
89/204
Tutorial On Meta-Analysis In R file:///Users/kovalchiksa/master/tutorial/user2013/index.html#200
89 of 204 6/23/13 1:10 PM

SSiiddiikk--JJoonnkkmmaann
= ( −τ 20 k−1 ∑
i
Yi Y )2
= (θ ∑i
W i)−1 ∑
i
W iYi
= /(K − 1) ( −τ 2 τ 20 ∑
i
W i Yi θ)2
90/204
Tutorial On Meta-Analysis In R file:///Users/kovalchiksa/master/tutorial/user2013/index.html#200
90 of 204 6/23/13 1:10 PM

1100--mmiinnuuttee BBrreeaakk
91/204
Tutorial On Meta-Analysis In R file:///Users/kovalchiksa/master/tutorial/user2013/index.html#200
91 of 204 6/23/13 1:10 PM

EEvvaalluuaattiinngg HHeetteerrooggeenneeiittyy
92/204
Tutorial On Meta-Analysis In R file:///Users/kovalchiksa/master/tutorial/user2013/index.html#200
92 of 204 6/23/13 1:10 PM

TTeessttiinngg FFoorr HHeetteerrooggeenneeiittyy:: QQ TTeesstt
Q = ( −∑i
Wi Yi θ)2
Q is the weighted deviations about the summary effect size.
Larger values of Q reflect greater between-study heterogeneity.
When , , which leads to a chi-squared testfor heterogeneity.
·
·
· = 0τ 2 Q ∼ (K − 1)χ2
93/204
Tutorial On Meta-Analysis In R file:///Users/kovalchiksa/master/tutorial/user2013/index.html#200
93 of 204 6/23/13 1:10 PM

EExxaammppllee:: QQ--tteesstt,, MMeeaann DDiiffffeerreenncceess
MD <- with(amlodipine, mean.amlo - mean.plac)
W <- 1/with(amlodipine, var.amlo/n.amlo + var.plac/n.plac)
Q <- sum(W * (MD - sum(W * MD)/sum(W))^2)
94/204
Tutorial On Meta-Analysis In R file:///Users/kovalchiksa/master/tutorial/user2013/index.html#200
94 of 204 6/23/13 1:10 PM

EExxaammppllee:: QQ--tteesstt,, MMeeaann DDiiffffeerreenncceess
Q
## [1] 12.33
df <- length(MD) - 1
pchisq(Q, df = df, lower = FALSE) # HOW LIKELY UNDER NULL?
## [1] 0.09018
95/204
Tutorial On Meta-Analysis In R file:///Users/kovalchiksa/master/tutorial/user2013/index.html#200
95 of 204 6/23/13 1:10 PM

EExxaammppllee:: QQ--tteesstt,, MMeeaann DDiiffffeerreenncceess
curve(1 - pchisq(x, df = df), 0, 20)
abline(v = Q, col = "red", lwd = 2)
96/204
Tutorial On Meta-Analysis In R file:///Users/kovalchiksa/master/tutorial/user2013/index.html#200
96 of 204 6/23/13 1:10 PM

QQ--tteesstt CCoommeess WWiitthh rma OObbjjeecctt
result.md$QE
## [1] 12.33
result.md$QEp
## [1] 0.09018
97/204
Tutorial On Meta-Analysis In R file:///Users/kovalchiksa/master/tutorial/user2013/index.html#200
97 of 204 6/23/13 1:10 PM

YYoouurr TTuurrnn:: QQ--tteesstt,, LLoogg OOddddss RRaattiioo
Obtain the Q-test for the meta-analysis of log odds ratios withthe BCG Vaccine Trials.
1.
What does the test suggest about between-study heterogeneity?2.
98/204
Tutorial On Meta-Analysis In R file:///Users/kovalchiksa/master/tutorial/user2013/index.html#200
98 of 204 6/23/13 1:10 PM

YYoouurr TTuurrnn:: QQ--tteesstt,, LLoogg OOddddss RRaattiioo
result.or <- rma(yi = Y, vi = V, method = "DL") # DerSimonian-Laird
result.or$QE
## [1] 163.2
result.or$QEp
## [1] 1.189e-28
99/204
Tutorial On Meta-Analysis In R file:///Users/kovalchiksa/master/tutorial/user2013/index.html#200
99 of 204 6/23/13 1:10 PM

RReemmaarrkkss OOnn QQ--tteesstt
The chi-squared approximation is valid when study sample sizesare large.
Type I error is generally accurate if normal distribution assumptionand sample sizes are not too small.
Q-test has low power (<0.80) when the number of studies and/orsample sizes is small.
·
·
·
100/204
Tutorial On Meta-Analysis In R file:///Users/kovalchiksa/master/tutorial/user2013/index.html#200
100 of 204 6/23/13 1:10 PM
RReemmaarrkkss OOnn QQ--tteesstt
Bottom Line: If there are few trials in the meta-analysis (as isusually the case), the Q-test is likely underpowered for detectingtrue heterogeneity.
101/204
Tutorial On Meta-Analysis In R file:///Users/kovalchiksa/master/tutorial/user2013/index.html#200
101 of 204 6/23/13 1:10 PM

IInnddiicceess OOff HHeetteerrooggeenneeiittyy
Higgins'
, Index
Intra-class correlation (ICC)
· τ 2
· I 2
· H 2 H
·
102/204
Tutorial On Meta-Analysis In R file:///Users/kovalchiksa/master/tutorial/user2013/index.html#200
102 of 204 6/23/13 1:10 PM

HHiiggggiinnss''
Interpretation = Percentage of "unexplained" variance
df = Degrees of Freedom
For random-effects meta-analysis, df =
I 2
= (Q − df)/Q × 100I 2
K − 1
103/204
Tutorial On Meta-Analysis In R file:///Users/kovalchiksa/master/tutorial/user2013/index.html#200
103 of 204 6/23/13 1:10 PM

TThhrreesshhoollddss FFoorr
Judging the severity of measured heterogeneity is subjective,however Higgins suggests these rules of thumb:
I 2
0% to 30% Low
30% to 60% Moderate
50% to 90% Substantial
75% to 100% Considerable
· →
· →
· →
· →
104/204
Tutorial On Meta-Analysis In R file:///Users/kovalchiksa/master/tutorial/user2013/index.html#200
104 of 204 6/23/13 1:10 PM

EExxaammppllee:: ,, MMeeaann DDiiffffeerreenncceessI 2
(Q - df)/Q * 100
## [1] 43.23
# From rma object
I2 <- with(result.md, (QE - (k - 1))/QE * 100)
I2
## [1] 43.23
105/204
Tutorial On Meta-Analysis In R file:///Users/kovalchiksa/master/tutorial/user2013/index.html#200
105 of 204 6/23/13 1:10 PM

Is the ratio of to the Q-test's degrees of freedom,
index is the .
suggests there is unexplained heterogeneity.
H 2
Q
= ,H 2 Q
df
1/ = 1 − .H 2 I 2
100
H H 2−−−√
H > 1
106/204
Tutorial On Meta-Analysis In R file:///Users/kovalchiksa/master/tutorial/user2013/index.html#200
106 of 204 6/23/13 1:10 PM

EExxaammppllee:: H 2
Q/df
## [1] 1.762
1/(1 - I2/100)
## [1] 1.762
107/204
Tutorial On Meta-Analysis In R file:///Users/kovalchiksa/master/tutorial/user2013/index.html#200
107 of 204 6/23/13 1:10 PM

IInnttrraa--CCllaassss CCoorrrreellaattiioonn
After fitting RMA and getting measure of , we can compute theintra-class correlation (ICC)
τ 2
ICC =τ 2
+τ 2 S2
=S2 ∑ (K − 1)Wi
(∑ − ∑Wi)2 W 2
i
108/204
Tutorial On Meta-Analysis In R file:///Users/kovalchiksa/master/tutorial/user2013/index.html#200
108 of 204 6/23/13 1:10 PM

EExxaammppllee:: IInnttrraa--CCllaassss CCoorrrreellaattiioonn
S2 <- sum(W * (length(W) - 1))/(sum(W)^2 - sum(W^2))
result.md$tau2/(result.md$tau2 + S2)
## [1] 0.0154
result.md$I2
## [1] 1.54
109/204
Tutorial On Meta-Analysis In R file:///Users/kovalchiksa/master/tutorial/user2013/index.html#200
109 of 204 6/23/13 1:10 PM

RReellaattiioonnsshhiipp BBeettwweeeenn IICCCC,, ,, I 2 H 2
What happened in the previous example?
We saw that
This is because metafor uses the more general definitions of and , which are based on .
To get the conventional estimates, which do not depend on ,use method DL.
·
· = ICC × 100I 2
· I 2
H 2 τ 2
· τ 2
110/204
Tutorial On Meta-Analysis In R file:///Users/kovalchiksa/master/tutorial/user2013/index.html#200
110 of 204 6/23/13 1:10 PM

&& IInn metafor
where, is the weighted numerator of the DL estimator
I 2 H 2
= ICC × 100I 2
= ( + )/H 2 τ 2 σ2 σ2
σ2 τ 2
=σ2 [(K − 1)(∑ − ∑ / ∑ )]Wi W 2i Wi
−1
111/204
Tutorial On Meta-Analysis In R file:///Users/kovalchiksa/master/tutorial/user2013/index.html#200
111 of 204 6/23/13 1:10 PM
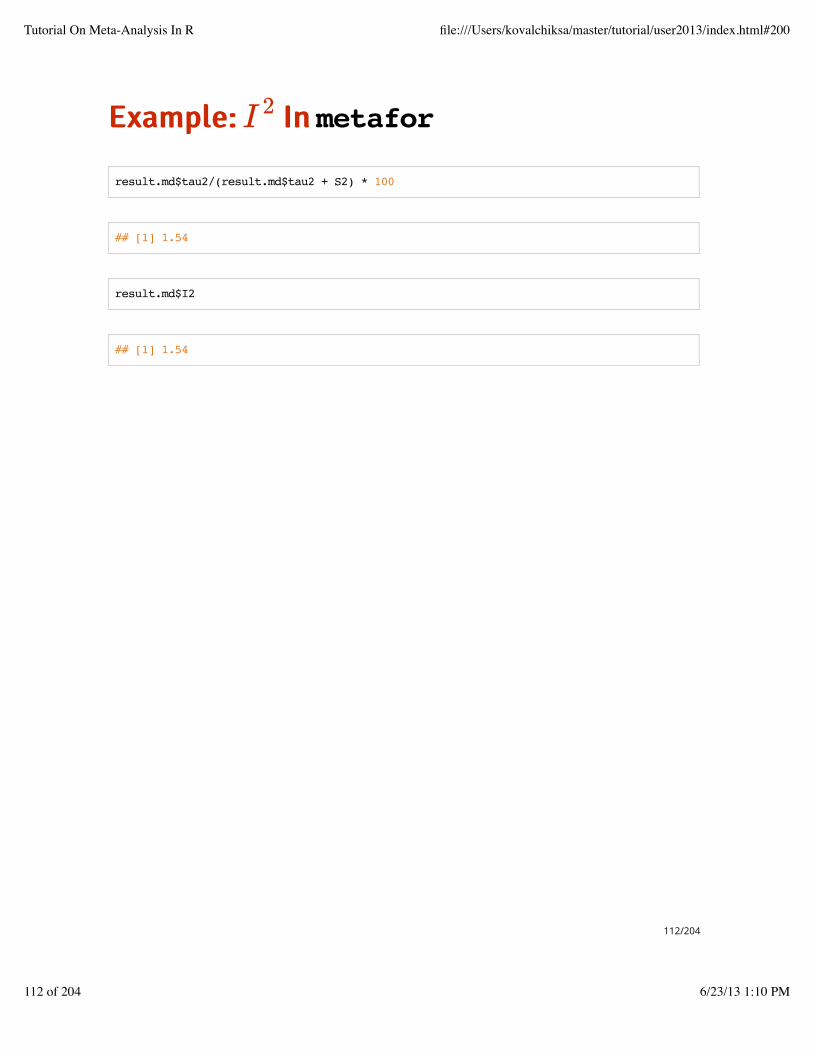
EExxaammppllee:: IInn metaforI 2
result.md$tau2/(result.md$tau2 + S2) * 100
## [1] 1.54
result.md$I2
## [1] 1.54
112/204
Tutorial On Meta-Analysis In R file:///Users/kovalchiksa/master/tutorial/user2013/index.html#200
112 of 204 6/23/13 1:10 PM

EExxaammppllee:: IInn metaforH 2
sigma2 <- (length(Y) - 1) * (sum(W) - sum(W^2)/sum(W))^(-1)
result.md$tau2/sigma2 + 1 #H2
## [1] 1.009
result.md$H2
## [1] 1.016
113/204
Tutorial On Meta-Analysis In R file:///Users/kovalchiksa/master/tutorial/user2013/index.html#200
113 of 204 6/23/13 1:10 PM

EExxaammppllee:: && CCoonnvveennttiioonnaall EEssttiimmaatteessI 2 H 2
result.md <- rma(m1 = mean.amlo, m2 = mean.plac,
sd1 = sqrt(var.amlo), sd2 = sqrt(var.plac),
n1 = n.amlo, n2 = n.plac,
method = "DL", measure = "MD", data = amlodipine)
result.md$I2
## [1] 43.23
result.md$H2
## [1] 1.762
114/204
Tutorial On Meta-Analysis In R file:///Users/kovalchiksa/master/tutorial/user2013/index.html#200
114 of 204 6/23/13 1:10 PM

CCoonnffiiddeennccee IInntteerrvvaallss FFoorr IInnddiicceess
A Q-profile method for an exact confidence interval for isprovided with the confint method of rma objects.
The CI for is used to derive CIs for the remaining heterogeneityindices, which are all monotonic transformations of .
· τ 2
· τ 2
τ 2
115/204
Tutorial On Meta-Analysis In R file:///Users/kovalchiksa/master/tutorial/user2013/index.html#200
115 of 204 6/23/13 1:10 PM

EExxaammppllee:: CCoonnffiiddeennccee IInntteerrvvaallss FFoorr IInnddiicceess
confint(result.md)
##
## estimate ci.lb ci.ub
## tau^2 0.0066 0.0000 0.1667
## tau 0.0812 0.0000 0.4082
## I^2(%) 43.2328 0.0000 95.0658
## H^2 1.7616 1.0000 20.2667
116/204
Tutorial On Meta-Analysis In R file:///Users/kovalchiksa/master/tutorial/user2013/index.html#200
116 of 204 6/23/13 1:10 PM

YYoouurr TTuurrnn:: CCoonnffiiddeennccee IInntteerrvvaallss FFoorr IICCCC
Use the confint method to obtain a 95% CI for the ICC of themean difference DL meta-analysis.
1.
117/204
Tutorial On Meta-Analysis In R file:///Users/kovalchiksa/master/tutorial/user2013/index.html#200
117 of 204 6/23/13 1:10 PM

YYoouurr TTuurrnn:: CCoonnffiiddeennccee IInntteerrvvaallss FFoorr IICCCC
names(confint(result.md))
## [1] "random" "digits" "tau2.min"
I2CI <- confint(result.md)$random[3, ]
I2CI/100
## estimate ci.lb ci.ub
## 0.4323 0.0000 0.9507
118/204
Tutorial On Meta-Analysis In R file:///Users/kovalchiksa/master/tutorial/user2013/index.html#200
118 of 204 6/23/13 1:10 PM

VViissuuaalliizziinngg HHeetteerrooggeenneeiittyy
119/204
Tutorial On Meta-Analysis In R file:///Users/kovalchiksa/master/tutorial/user2013/index.html#200
119 of 204 6/23/13 1:10 PM

TThhee FFoorreesstt PPlloott
Seeing the forest through the trees...“ ”Is a plot of effect sizes and their precisions
Is the most common way to report the results of a meta-analysis
Can help identify patterns across effects
Can help spot large variation in effects or possible outliers
·
·
·
·
120/204
Tutorial On Meta-Analysis In R file:///Users/kovalchiksa/master/tutorial/user2013/index.html#200
120 of 204 6/23/13 1:10 PM

FFoorreesstt PPlloott FFoorr rma OObbjjeeccttss
forest(result.md) # DEFAULT PLOT
121/204
Tutorial On Meta-Analysis In R file:///Users/kovalchiksa/master/tutorial/user2013/index.html#200
121 of 204 6/23/13 1:10 PM
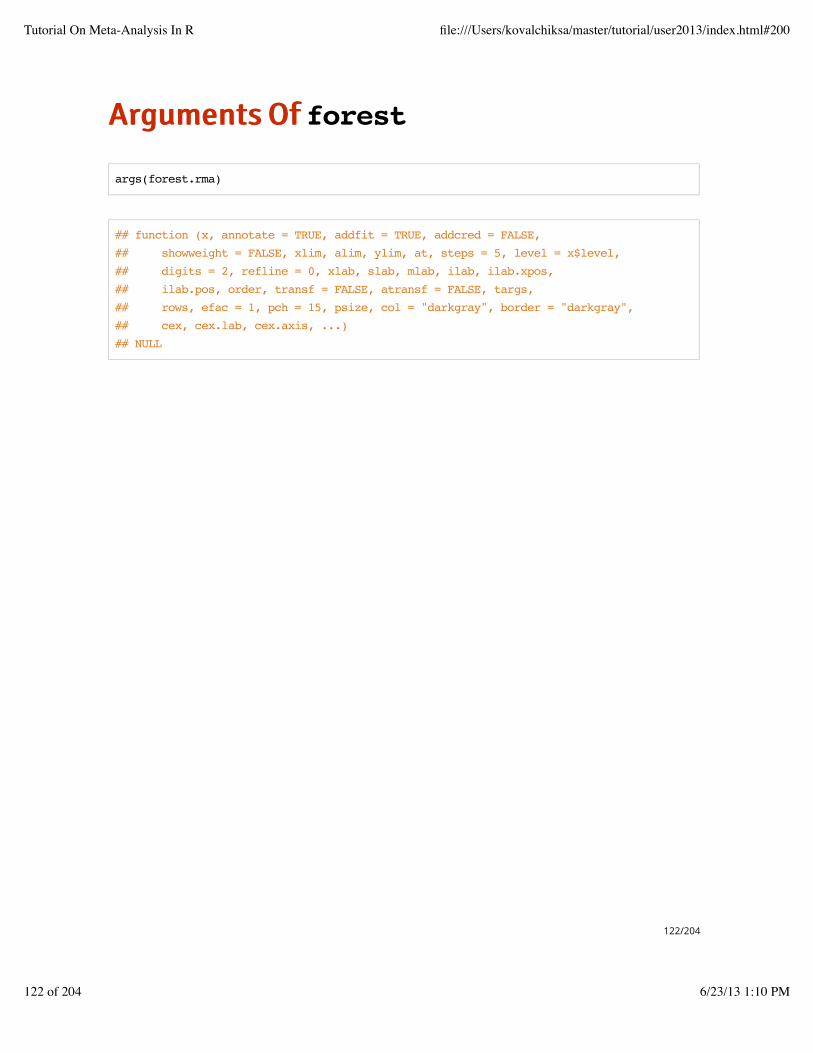
AArrgguummeennttss OOff forest
args(forest.rma)
## function (x, annotate = TRUE, addfit = TRUE, addcred = FALSE,
## showweight = FALSE, xlim, alim, ylim, at, steps = 5, level = x$level,
## digits = 2, refline = 0, xlab, slab, mlab, ilab, ilab.xpos,
## ilab.pos, order, transf = FALSE, atransf = FALSE, targs,
## rows, efac = 1, pch = 15, psize, col = "darkgray", border = "darkgray",
## cex, cex.lab, cex.axis, ...)
## NULL
122/204
Tutorial On Meta-Analysis In R file:///Users/kovalchiksa/master/tutorial/user2013/index.html#200
122 of 204 6/23/13 1:10 PM

CCuussttoommiizziinngg FFoorreesstt PPlloott
Some typical modifications:
order: Sort by "obs", "fit", "prec", etc.
slab: Change study labels
ilab: Add study information
transf: Apply function to effects
psize: Symbol sizes
·
·
·
·
·
123/204
Tutorial On Meta-Analysis In R file:///Users/kovalchiksa/master/tutorial/user2013/index.html#200
123 of 204 6/23/13 1:10 PM

EExxaammppllee:: CCuussttoommiizziinngg FFoorreesstt PPlloott
In the following, we modify the study labels and add the (fake) yearof publication.
study.names <- paste("Study", letters[1:8])
study.year <- 2000 + sample(0:9, 8, replace = T)
forest(result.md, order = "obs",
slab = study.names,
ilab = study.year,
ilab.xpos = result.md$b - 1,
refline = result.md$b)
124/204
Tutorial On Meta-Analysis In R file:///Users/kovalchiksa/master/tutorial/user2013/index.html#200
124 of 204 6/23/13 1:10 PM

EExxaammppllee:: CCuussttoommiizziinngg FFoorreesstt PPlloott
125/204
Tutorial On Meta-Analysis In R file:///Users/kovalchiksa/master/tutorial/user2013/index.html#200
125 of 204 6/23/13 1:10 PM

EExxaammppllee:: CCuussttoommiizziinngg FFoorreesstt PPlloott
In the following, we plot the ORs of the BCG trials and order thestudies by precision.
forest(result.or, order = "prec", transf = exp, refline = 1)
126/204
Tutorial On Meta-Analysis In R file:///Users/kovalchiksa/master/tutorial/user2013/index.html#200
126 of 204 6/23/13 1:10 PM

EExxaammppllee:: CCuussttoommiizziinngg FFoorreesstt PPlloott
127/204
Tutorial On Meta-Analysis In R file:///Users/kovalchiksa/master/tutorial/user2013/index.html#200
127 of 204 6/23/13 1:10 PM

YYoouurr TTuurrnn:: CCuussttoommiizziinngg FFoorreesstt PPlloott
Modify the previous plot by adding the sample size and year ofthe studies.
1.
128/204
Tutorial On Meta-Analysis In R file:///Users/kovalchiksa/master/tutorial/user2013/index.html#200
128 of 204 6/23/13 1:10 PM

YYoouurr TTuurrnn:: CCuussttoommiizziinngg FFoorreesstt PPlloott
dat.bcg$n <- with(dat.bcg, tpos + tneg + cpos + cneg)
forest(result.or, order = "prec",
ilab = dat.bcg[, c("n", "year")],
ilab.xpos = exp(result.or$b) - c(4, 2),
transf = exp, refline = 1)
129/204
Tutorial On Meta-Analysis In R file:///Users/kovalchiksa/master/tutorial/user2013/index.html#200
129 of 204 6/23/13 1:10 PM

YYoouurr TTuurrnn:: CCuussttoommiizziinngg FFoorreesstt PPlloott
130/204
Tutorial On Meta-Analysis In R file:///Users/kovalchiksa/master/tutorial/user2013/index.html#200
130 of 204 6/23/13 1:10 PM

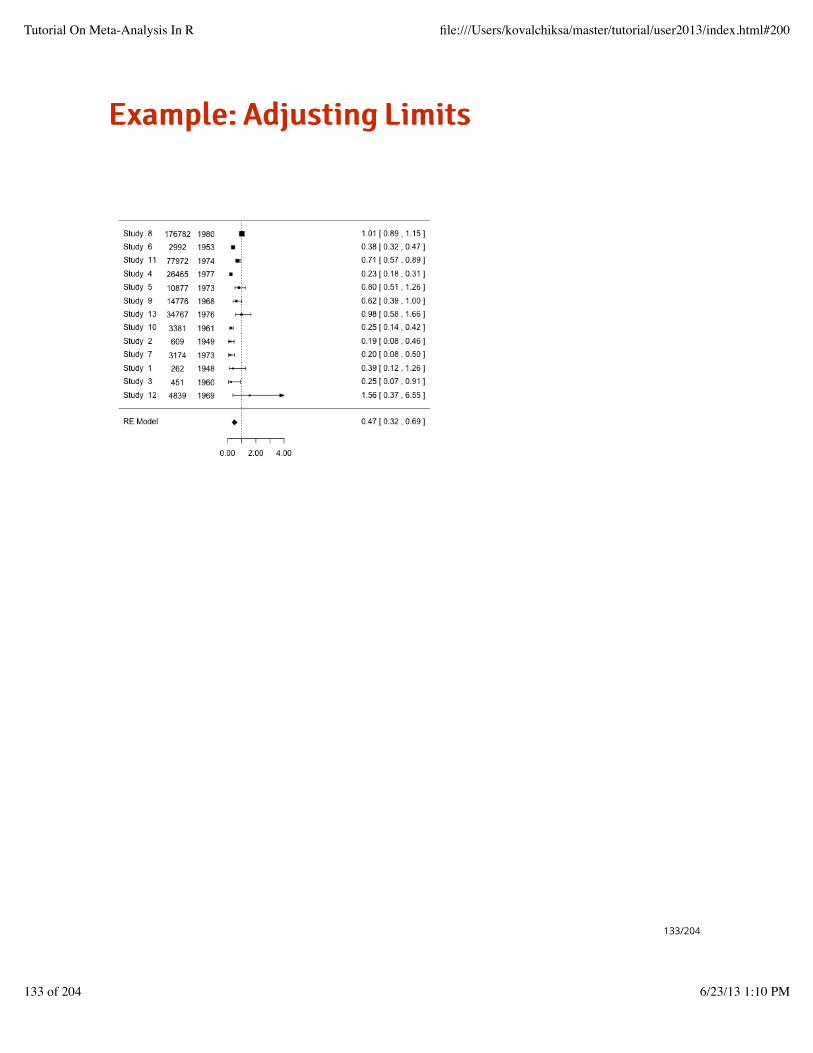
AAddjjuussttiinngg LLiimmiittss
You can change the min and max of the drawn region with theargument alim.
This must include all effects.
CIs will be clipped if outside the restricted area.
An arrow will indicate clipped CIs.
·
·
·
·
131/204
Tutorial On Meta-Analysis In R file:///Users/kovalchiksa/master/tutorial/user2013/index.html#200
131 of 204 6/23/13 1:10 PM

EExxaammppllee:: AAddjjuussttiinngg LLiimmiittss
forest(result.or, order = "prec",
ilab = dat.bcg[, c("n", "year")],
ilab.xpos = exp(result.or$b) - c(4, 2),
transf = exp, refline = 1,
alim = c(0, 4))
132/204
Tutorial On Meta-Analysis In R file:///Users/kovalchiksa/master/tutorial/user2013/index.html#200
132 of 204 6/23/13 1:10 PM
EExxaammppllee:: AAddjjuussttiinngg LLiimmiittss
133/204
Tutorial On Meta-Analysis In R file:///Users/kovalchiksa/master/tutorial/user2013/index.html#200
133 of 204 6/23/13 1:10 PM

SSeennssiittiivviittyy AAnnaallyysseess
134/204
Tutorial On Meta-Analysis In R file:///Users/kovalchiksa/master/tutorial/user2013/index.html#200
134 of 204 6/23/13 1:10 PM

CCaassee DDiiaaggnnoossttiiccss
A single outlying trial could be the source of substantialheterogeneity.
To identify suspicious cases, a leave-one-out method can be usedwhereby we rerun the meta-analysis, iteratively removing studies.
In the metafor package this is accomplished with the leave1outfunction.
·
·
·
135/204
Tutorial On Meta-Analysis In R file:///Users/kovalchiksa/master/tutorial/user2013/index.html#200
135 of 204 6/23/13 1:10 PM
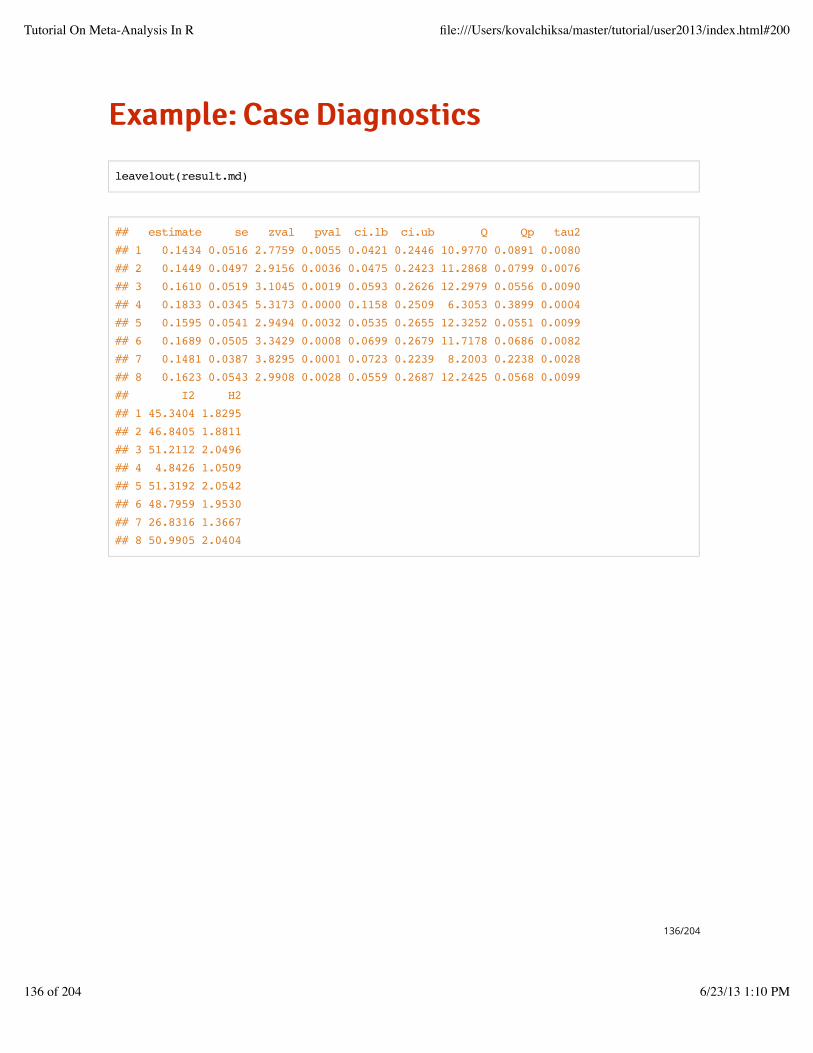
EExxaammppllee:: CCaassee DDiiaaggnnoossttiiccss
leave1out(result.md)
## estimate se zval pval ci.lb ci.ub Q Qp tau2
## 1 0.1434 0.0516 2.7759 0.0055 0.0421 0.2446 10.9770 0.0891 0.0080
## 2 0.1449 0.0497 2.9156 0.0036 0.0475 0.2423 11.2868 0.0799 0.0076
## 3 0.1610 0.0519 3.1045 0.0019 0.0593 0.2626 12.2979 0.0556 0.0090
## 4 0.1833 0.0345 5.3173 0.0000 0.1158 0.2509 6.3053 0.3899 0.0004
## 5 0.1595 0.0541 2.9494 0.0032 0.0535 0.2655 12.3252 0.0551 0.0099
## 6 0.1689 0.0505 3.3429 0.0008 0.0699 0.2679 11.7178 0.0686 0.0082
## 7 0.1481 0.0387 3.8295 0.0001 0.0723 0.2239 8.2003 0.2238 0.0028
## 8 0.1623 0.0543 2.9908 0.0028 0.0559 0.2687 12.2425 0.0568 0.0099
## I2 H2
## 1 45.3404 1.8295
## 2 46.8405 1.8811
## 3 51.2112 2.0496
## 4 4.8426 1.0509
## 5 51.3192 2.0542
## 6 48.7959 1.9530
## 7 26.8316 1.3667
## 8 50.9905 2.0404
136/204
Tutorial On Meta-Analysis In R file:///Users/kovalchiksa/master/tutorial/user2013/index.html#200
136 of 204 6/23/13 1:10 PM
YYoouurr TTuurrnn:: CCaassee DDiiaaggnnoossttiiccss,, BBCCGG TTrriiaallss
Which trial contributes the most to the BCG OR meta-analysis?1.
Do any of the trials reduce to %?2.
Does the removal of any trial change the main conclusion aboutthe efficacy of BCG?
3.
I 2 < 30
137/204
Tutorial On Meta-Analysis In R file:///Users/kovalchiksa/master/tutorial/user2013/index.html#200
137 of 204 6/23/13 1:10 PM
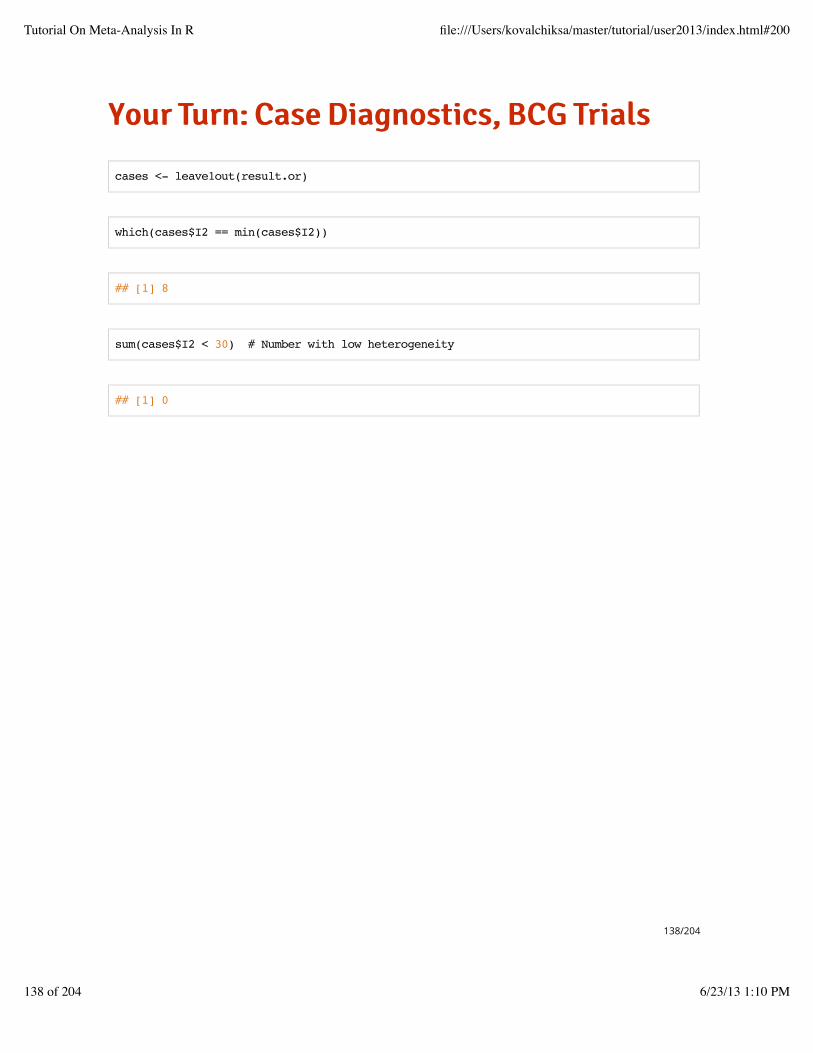
YYoouurr TTuurrnn:: CCaassee DDiiaaggnnoossttiiccss,, BBCCGG TTrriiaallss
cases <- leave1out(result.or)
which(cases$I2 == min(cases$I2))
## [1] 8
sum(cases$I2 < 30) # Number with low heterogeneity
## [1] 0
138/204
Tutorial On Meta-Analysis In R file:///Users/kovalchiksa/master/tutorial/user2013/index.html#200
138 of 204 6/23/13 1:10 PM

YYoouurr TTuurrnn:: CCaassee DDiiaaggnnoossttiiccss,, BBCCGG TTrriiaallss
cbind(exp(cases$estimate), cases$pval < 0.05)
## [,1] [,2]
## [1,] 0.4784 1
## [2,] 0.5047 1
## [3,] 0.4885 1
## [4,] 0.5173 1
## [5,] 0.4493 1
## [6,] 0.4835 1
## [7,] 0.5025 1
## [8,] 0.4379 1
## [9,] 0.4605 1
## [10,] 0.5033 1
## [11,] 0.4510 1
## [12,] 0.4499 1
## [13,] 0.4424 1
139/204
Tutorial On Meta-Analysis In R file:///Users/kovalchiksa/master/tutorial/user2013/index.html#200
139 of 204 6/23/13 1:10 PM
EExxppllaaiinniinngg HHeetteerrooggeenneeiittyy::MMeettaa--RReeggrreessssiioonn
140/204
Tutorial On Meta-Analysis In R file:///Users/kovalchiksa/master/tutorial/user2013/index.html#200
140 of 204 6/23/13 1:10 PM

MMeettaa--RReeggrreessssiioonn WWiitthh rma
Specify study covariates through the mods argument
The mods argument takes a matrix of covariates
·
· p
141/204
Tutorial On Meta-Analysis In R file:///Users/kovalchiksa/master/tutorial/user2013/index.html#200
141 of 204 6/23/13 1:10 PM

EExxaammppllee:: LLaattiittuuddee AAnndd BBCCGG TTrriiaall RReessuullttss
result.ormr <- rma(ai = tpos, bi = tneg, ci = cpos, di = cneg,
data = dat.bcg,
mods = dat.bcg[, "ablat"],
measure = "OR",
method = "DL")
142/204
Tutorial On Meta-Analysis In R file:///Users/kovalchiksa/master/tutorial/user2013/index.html#200
142 of 204 6/23/13 1:10 PM

EExxaammppllee:: LLaattiittuuddee AAnndd BBCCGG TTrriiaall RReessuullttss
summary(result.ormr)
## Mixed-Effects Model (k = 13; tau^2 estimator: DL)
##
## tau^2 (estimated amount of residual heterogeneity): 0.0480 (SE = 0.0451)
## tau (square root of estimated tau^2 value): 0.2191
## I^2 (residual heterogeneity / unaccounted variability): 56.17%
## H^2 (unaccounted variability / sampling variability): 2.28
##
## Test for Residual Heterogeneity:
## QE(df = 11) = 25.0954, p-val = 0.0088
##
## Test of Moderators (coefficient(s) 2):
## QM(df = 1) = 26.1628, p-val < .0001
##
## Model Results:
##
## estimate se zval pval ci.lb ci.ub
## intrcpt 0.3030 0.2109 1.4370 0.1507 -0.1103 0.7163
## mods -0.0316 0.0062 -5.1150 <.0001 -0.0437 -0.0195 ***
143/204
Tutorial On Meta-Analysis In R file:///Users/kovalchiksa/master/tutorial/user2013/index.html#200
143 of 204 6/23/13 1:10 PM

CChhaannggee IInn EEssttiimmaattee && HHeetteerrooggeenneeiittyy
exp(c(result.or$b, result.ormr$b[1]))
## [1] 0.4736 1.3540
c(result.or$I2, result.ormr$I2)
## [1] 92.65 56.17
144/204
Tutorial On Meta-Analysis In R file:///Users/kovalchiksa/master/tutorial/user2013/index.html#200
144 of 204 6/23/13 1:10 PM

CChhaannggee IInn EEssttiimmaattee && HHeetteerrooggeenneeiittyy
What happened?
The effect of treatment changed direction.
Remember: This is a linear not logistic regression.
As fit, the intercept (treatment log-odds) corresponds to a studyconducted in a region with latitude = 0.
·
·
·
·
145/204
Tutorial On Meta-Analysis In R file:///Users/kovalchiksa/master/tutorial/user2013/index.html#200
145 of 204 6/23/13 1:10 PM

YYoouurr TTuurrnn:: MMeettaa--RReeggrreessssiioonn
Determine to what extent the study design (alloc) explains theremaining heterogeneity in the BCG vaccine trials.
1.
Center latitude on the median, so that the intercept correspondsto the log-odds effect of BCG at the median latitude.
2.
What is the percentage change in as compared to the REmodel?
3. I 2
146/204
Tutorial On Meta-Analysis In R file:///Users/kovalchiksa/master/tutorial/user2013/index.html#200
146 of 204 6/23/13 1:10 PM
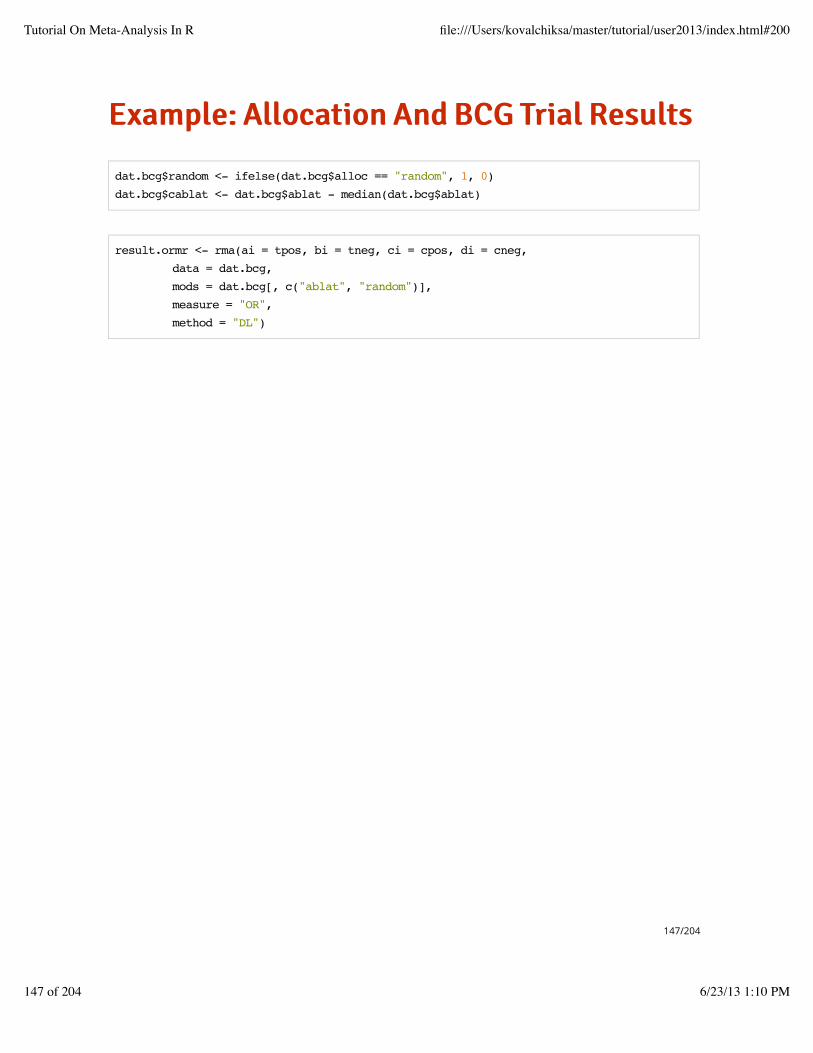
EExxaammppllee:: AAllllooccaattiioonn AAnndd BBCCGG TTrriiaall RReessuullttss
dat.bcg$random <- ifelse(dat.bcg$alloc == "random", 1, 0)
dat.bcg$cablat <- dat.bcg$ablat - median(dat.bcg$ablat)
result.ormr <- rma(ai = tpos, bi = tneg, ci = cpos, di = cneg,
data = dat.bcg,
mods = dat.bcg[, c("ablat", "random")],
measure = "OR",
method = "DL")
147/204
Tutorial On Meta-Analysis In R file:///Users/kovalchiksa/master/tutorial/user2013/index.html#200
147 of 204 6/23/13 1:10 PM

EExxaammppllee:: AAllllooccaattiioonn AAnndd BBCCGG TTrriiaall RReessuullttss
summary(result.ormr)
## Mixed-Effects Model (k = 13; tau^2 estimator: DL)
##
## tau^2 (estimated amount of residual heterogeneity): 0.0732 (SE = 0.0677)
## tau (square root of estimated tau^2 value): 0.2706
## I^2 (residual heterogeneity / unaccounted variability): 60.10%
## H^2 (unaccounted variability / sampling variability): 2.51
##
## Test for Residual Heterogeneity:
## QE(df = 10) = 25.0624, p-val = 0.0052
##
## Test of Moderators (coefficient(s) 2,3):
## QM(df = 2) = 20.0425, p-val < .0001
##
## Model Results:
##
## estimate se zval pval ci.lb ci.ub
## intrcpt 0.3643 0.2596 1.4037 0.1604 -0.1444 0.8731
## ablat -0.0307 0.0072 -4.2829 <.0001 -0.0447 -0.0166 ***
## random -0.2029 0.2124 -0.9551 0.3395 -0.6191 0.2134
148/204
Tutorial On Meta-Analysis In R file:///Users/kovalchiksa/master/tutorial/user2013/index.html#200
148 of 204 6/23/13 1:10 PM

EExxaammppllee:: AAllllooccaattiioonn AAnndd BBCCGG TTrriiaall RReessuullttss
c(result.ormr$I2, result.or$I2)
## [1] 60.10 92.65
(result.or$I2 - result.ormr$I2)/result.or$I2 * 100
## [1] 35.13
149/204
Tutorial On Meta-Analysis In R file:///Users/kovalchiksa/master/tutorial/user2013/index.html#200
149 of 204 6/23/13 1:10 PM
PPuubblliiccaattiioonn BBiiaass
150/204
Tutorial On Meta-Analysis In R file:///Users/kovalchiksa/master/tutorial/user2013/index.html#200
150 of 204 6/23/13 1:10 PM

`TThhee FFiillee--DDrraawweerr'' PPrroobblleemm
It is possible that studies showing a significant intervention effectare more often published than studies with null results.
When a meta-analysis is based only on studies reported in theliterature, null studies relegated to the file-drawer could bias thesummary intervention effect in the direction of efficacy.
·
·
151/204
Tutorial On Meta-Analysis In R file:///Users/kovalchiksa/master/tutorial/user2013/index.html#200
151 of 204 6/23/13 1:10 PM
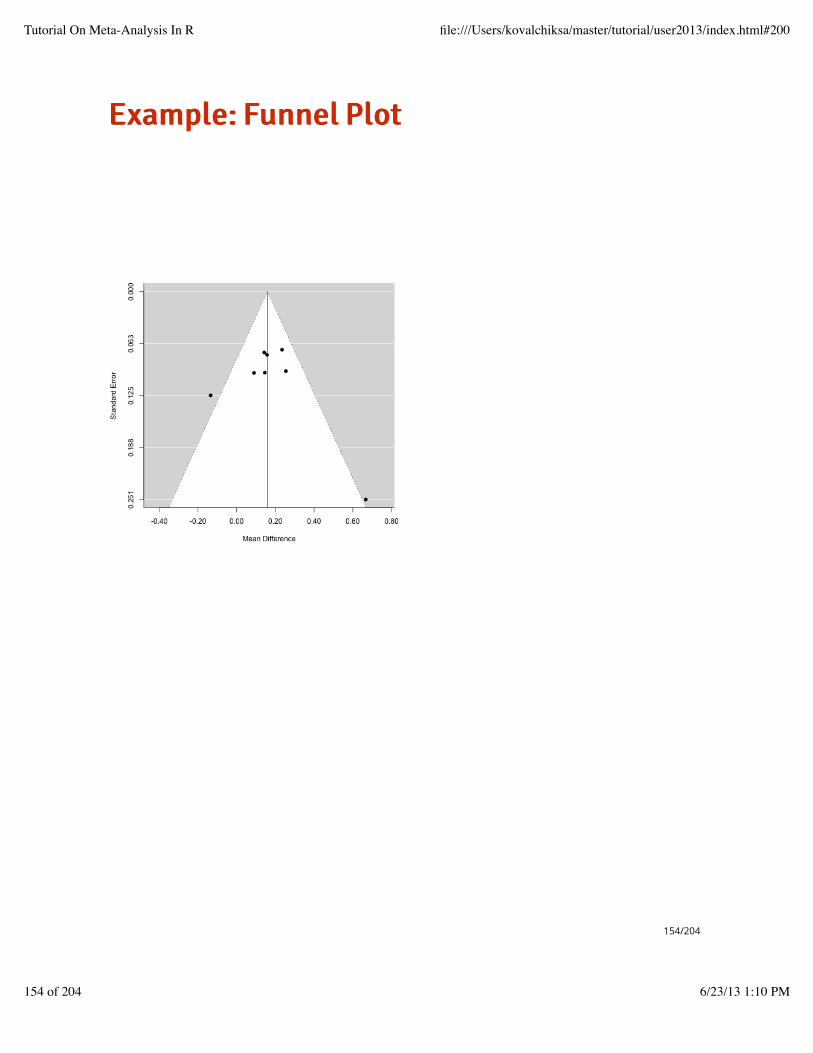
DDeetteeccttiinngg PPuubblliiccaattiioonn BBiiaass:: FFuunnnneell PPlloott
A funnel plot is a scatter plot of the intervention effect estimatesagainst a measure of study precision.
Asymmetry (gaps) in the funnel may be indicative of publicationbias.
Some authors argue that judging asymmetry is too subjective tobe useful.
Spurious asymmetry can result from heterogeneity or when ESsare correlated with precision.
·
·
·
·
152/204
Tutorial On Meta-Analysis In R file:///Users/kovalchiksa/master/tutorial/user2013/index.html#200
152 of 204 6/23/13 1:10 PM

EExxaammppllee:: FFuunnnneell PPlloott
metafor method for generating funnel plots from rma objects.
Use addtau2=TRUE to add between-study error.
funnel(result.md)
153/204
Tutorial On Meta-Analysis In R file:///Users/kovalchiksa/master/tutorial/user2013/index.html#200
153 of 204 6/23/13 1:10 PM
EExxaammppllee:: FFuunnnneell PPlloott
154/204
Tutorial On Meta-Analysis In R file:///Users/kovalchiksa/master/tutorial/user2013/index.html#200
154 of 204 6/23/13 1:10 PM

SSeennssiittiivviittyy AAnnaallyysseess FFoorr PPuubblliiccaattiioonn BBiiaass
Judging asymmetry in the funnel plot can be difficult.
So you will usually want to consider some additional ways ofassessing the threat of publication bias.
Sensitivity Analyses:
·
·
·
Trim-and-Fill
Fail Safe N
-
-
155/204
Tutorial On Meta-Analysis In R file:///Users/kovalchiksa/master/tutorial/user2013/index.html#200
155 of 204 6/23/13 1:10 PM

TTrriimm--aanndd--FFiillll MMeetthhoodd
The trim and fill method estimates the number of missing NULLstudies from the meta-analysis.
The method trimfill of the metafor package augments theobserved data and returns the fitted rma object with the missingstudies included.
These points can be added to the funnel plot.
·
·
·
156/204
Tutorial On Meta-Analysis In R file:///Users/kovalchiksa/master/tutorial/user2013/index.html#200
156 of 204 6/23/13 1:10 PM
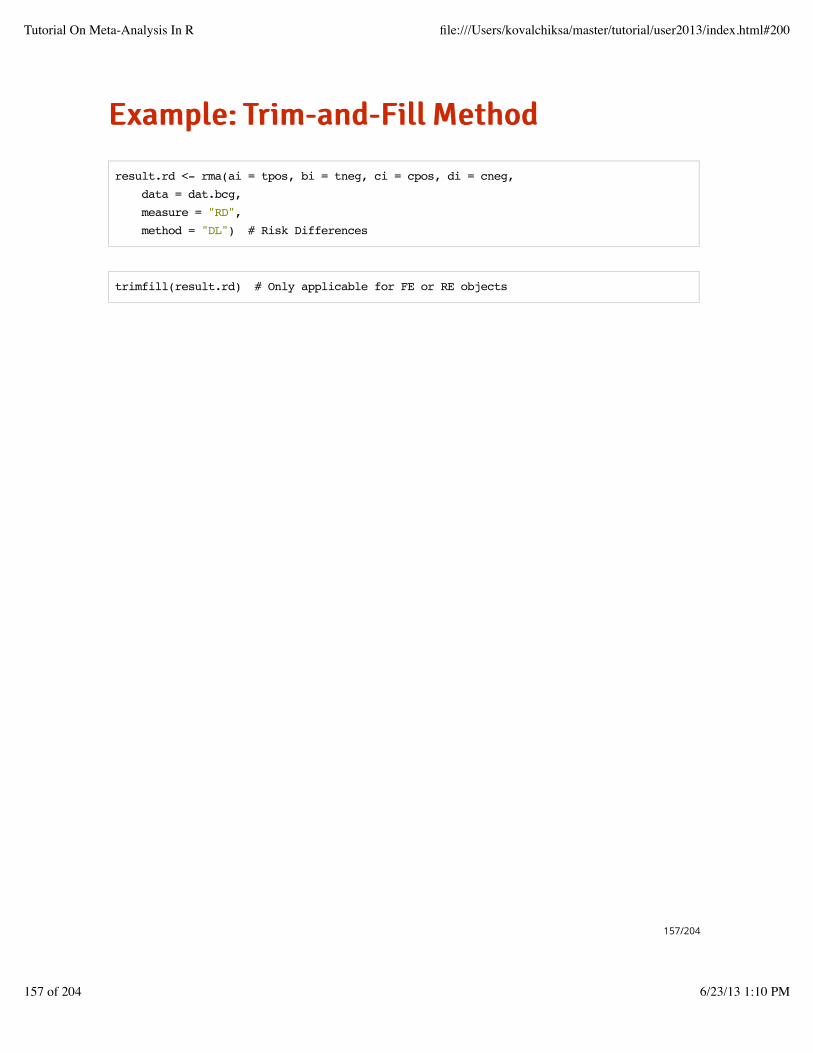
EExxaammppllee:: TTrriimm--aanndd--FFiillll MMeetthhoodd
result.rd <- rma(ai = tpos, bi = tneg, ci = cpos, di = cneg,
data = dat.bcg,
measure = "RD",
method = "DL") # Risk Differences
trimfill(result.rd) # Only applicable for FE or RE objects
157/204
Tutorial On Meta-Analysis In R file:///Users/kovalchiksa/master/tutorial/user2013/index.html#200
157 of 204 6/23/13 1:10 PM

EExxaammppllee:: TTrriimm--aanndd--FFiillll MMeetthhoodd
## Estimated number of missing studies on the right side: 4
##
## Random-Effects Model (k = 17; tau^2 estimator: DL)
##
## tau^2 (estimated amount of total heterogeneity): 0.0000 (SE = 0.0000)
## tau (square root of estimated tau^2 value): 0.0051
## I^2 (total heterogeneity / total variability): 95.83%
## H^2 (total variability / sampling variability): 23.98
##
## Test for Heterogeneity:
## Q(df = 16) = 383.6062, p-val < .0001
##
## Model Results:
##
## estimate se zval pval ci.lb ci.ub
## -0.0049 0.0018 -2.7858 0.0053 -0.0084 -0.0015 **
158/204
Tutorial On Meta-Analysis In R file:///Users/kovalchiksa/master/tutorial/user2013/index.html#200
158 of 204 6/23/13 1:10 PM

EExxaammppllee:: TTrriimm--aanndd--FFiillll MMeetthhoodd
funnel(trimfill(result.rd))
159/204
Tutorial On Meta-Analysis In R file:///Users/kovalchiksa/master/tutorial/user2013/index.html#200
159 of 204 6/23/13 1:10 PM

FFaaiill--SSaaffee NN
Rosenthal method (sometimes called a ʻfile drawer analysisʼ)
Is the number of NULL studies that have to be added to reducethe significance of the meta-analysis to (usually 0.05)
·
·α
160/204
Tutorial On Meta-Analysis In R file:///Users/kovalchiksa/master/tutorial/user2013/index.html#200
160 of 204 6/23/13 1:10 PM

EExxaammppllee:: FFaaiill--SSaaffee MMeetthhoodd
value <- fsn(y = result.md$yi, v = result.md$vi)
value
##
## Fail-safe N Calculation Using the Rosenthal Approach
##
## Observed Significance Level: <.0001
## Target Significance Level: 0.05
##
## Fail-safe N: 65
161/204
Tutorial On Meta-Analysis In R file:///Users/kovalchiksa/master/tutorial/user2013/index.html#200
161 of 204 6/23/13 1:10 PM

EExxaammppllee:: FFaaiill--SSaaffee MMeetthhoodd
value$fsnum
## [1] 65
value$alpha # Target Significance Level
## [1] 0.05
162/204
Tutorial On Meta-Analysis In R file:///Users/kovalchiksa/master/tutorial/user2013/index.html#200
162 of 204 6/23/13 1:10 PM

OOtthheerr R PPaacckkaaggeess ffoorr MMeettaa--AAnnaallyyssiiss
163/204
Tutorial On Meta-Analysis In R file:///Users/kovalchiksa/master/tutorial/user2013/index.html#200
163 of 204 6/23/13 1:10 PM

PPaacckkaaggeess rmeta AAnndd meta
Package metafor is the most comprehensive of currentlyavailable R packages for performing meta-analysis, but some mayfind its design overly complex (think iTunes)
The package meta has a lot of overlap in provided methods, but itseparates modeling functions by endpoint type
The package rmeta only has DSL random effects modeling andno meta-regression modeling functions, which might be fine forsome purposes
The reliability of all of these packages is very good
·
·
·
·
164/204
Tutorial On Meta-Analysis In R file:///Users/kovalchiksa/master/tutorial/user2013/index.html#200
164 of 204 6/23/13 1:10 PM

Main Functions:
library(meta) # Package meta
metabin: Meta-analysis for binary outcome
metacont: Meta-analysis for continuous outcome
metareg: Meta-regression
forest: Forest plot
funnel: Funnel plot
trimfill: Trim-and-fill method
metabias: Test of asymmetry in funnel plot
·
·
·
·
·
·
·
165/204
Tutorial On Meta-Analysis In R file:///Users/kovalchiksa/master/tutorial/user2013/index.html#200
165 of 204 6/23/13 1:10 PM

EExxaammppllee OOff metabin
dat.bcg$tn <- dat.bcg$tpos + dat.bcg$tneg
dat.bcg$cn <- dat.bcg$cpos + dat.bcg$cneg
result.or.meta <- metabin(event.e = tpos, n.e = tn, event.c = cpos, n.c = cn,
data = dat.bcg,
sm = "OR",
method = "Inverse",
method.tau = "REML")
166/204
Tutorial On Meta-Analysis In R file:///Users/kovalchiksa/master/tutorial/user2013/index.html#200
166 of 204 6/23/13 1:10 PM

RReettuurrnneedd OObbjjeecctt HHaass MMaannyy CCoommppoonneennttss
names(result.or.meta)
## [1] "event.e" "n.e" "event.c" "n.c"
## [5] "studlab" "TE" "seTE" "w.fixed"
## [9] "w.random" "TE.fixed" "seTE.fixed" "lower.fixed"
## [13] "upper.fixed" "zval.fixed" "pval.fixed" "TE.random"
## [17] "seTE.random" "lower.random" "upper.random" "zval.random"
## [21] "pval.random" "k" "Q" "tau"
## [25] "se.tau2" "Q.CMH" "sm" "method"
## [29] "sparse" "incr" "allincr" "addincr"
## [33] "allstudies" "MH.exact" "RR.cochrane" "incr.e"
## [37] "incr.c" "level" "level.comb" "comb.fixed"
## [41] "comb.random" "hakn" "df.hakn" "method.tau"
## [45] "tau.preset" "TE.tau" "method.bias" "title"
## [49] "complab" "outclab" "label.e" "label.c"
## [53] "label.left" "label.right" "call" "warn"
## [57] "print.byvar" "print.CMH" "version"
167/204
Tutorial On Meta-Analysis In R file:///Users/kovalchiksa/master/tutorial/user2013/index.html#200
167 of 204 6/23/13 1:10 PM
KKeeyy CCoommppoonneennttssw.fixed, w.random: Weight of individual studies
TE.fixed, TE.random: Estimated overall treatment effect
lower.fixed, upper.fixed: Lower and upper confidenceintervals
lower.random, upper.random: Lower and upper confidenceintervals
k: Number of studies
tau: Estimated between-study variance
Q: Heterogeneity statistic
·
·
·
·
·
·
·
168/204
Tutorial On Meta-Analysis In R file:///Users/kovalchiksa/master/tutorial/user2013/index.html#200
168 of 204 6/23/13 1:10 PM

EExxaammppllee OOff metabin
summary(result.or.meta)
## Number of studies combined: k=13
##
## OR 95%-CI z p.value
## Fixed effect model 0.647 [0.595; 0.702] -10.319 < 0.0001
## Random effects model 0.475 [0.330; 0.683] -4.006 < 0.0001
##
## Quantifying heterogeneity:
## tau^2 = 0.3378; H = 3.69 [3.04; 4.47]; I^2 = 92.6% [89.2%; 95%]
##
## Test of heterogeneity:
## Q d.f. p.value
## 163.16 12 < 0.0001
##
## Details on meta-analytical method:
## - Inverse variance method
## - restricted maximum-likelihood estimator for tau^2
169/204
Tutorial On Meta-Analysis In R file:///Users/kovalchiksa/master/tutorial/user2013/index.html#200
169 of 204 6/23/13 1:10 PM
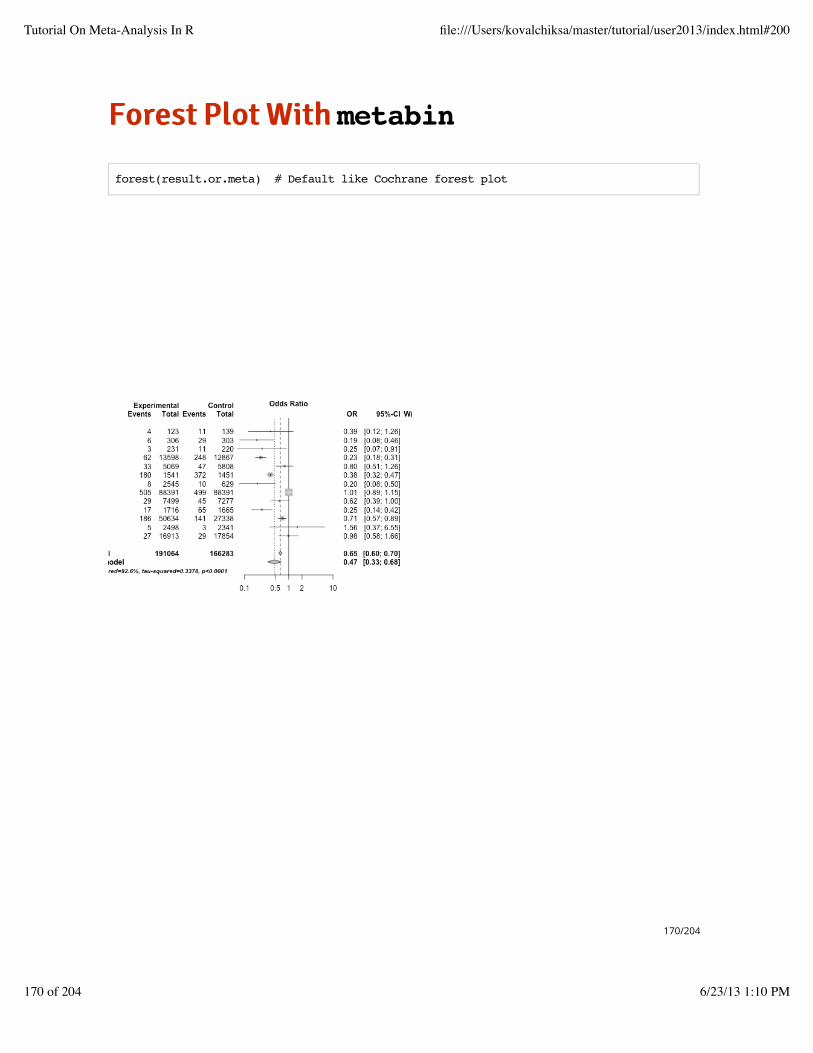
FFoorreesstt PPlloott WWiitthh metabin
forest(result.or.meta) # Default like Cochrane forest plot
170/204
Tutorial On Meta-Analysis In R file:///Users/kovalchiksa/master/tutorial/user2013/index.html#200
170 of 204 6/23/13 1:10 PM
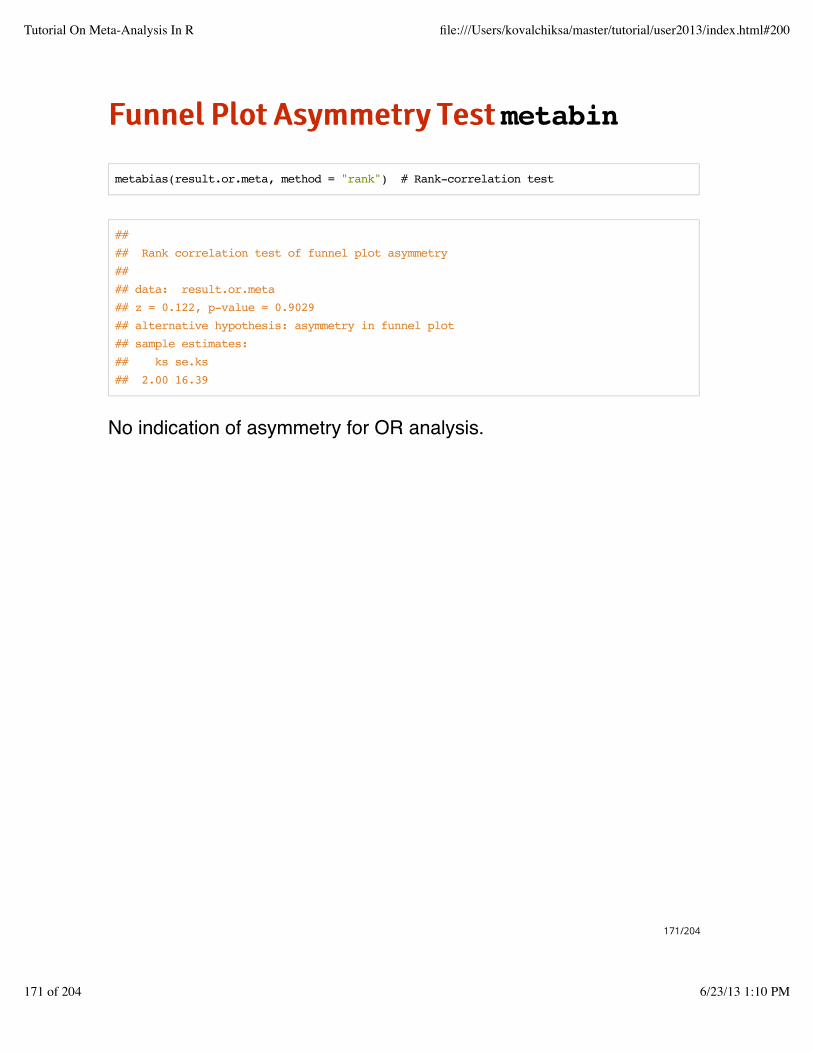
FFuunnnneell PPlloott AAssyymmmmeettrryy TTeesstt metabin
No indication of asymmetry for OR analysis.
metabias(result.or.meta, method = "rank") # Rank-correlation test
##
## Rank correlation test of funnel plot asymmetry
##
## data: result.or.meta
## z = 0.122, p-value = 0.9029
## alternative hypothesis: asymmetry in funnel plot
## sample estimates:
## ks se.ks
## 2.00 16.39
171/204
Tutorial On Meta-Analysis In R file:///Users/kovalchiksa/master/tutorial/user2013/index.html#200
171 of 204 6/23/13 1:10 PM

Key Functions:
library(rmeta) # rmeta package
meta.DSL: RE meta-analysis (Binary only)
meta.MH: FE meta-analysis (Mantel-Haenszel)
meta.summaries: Fixed/Random given ES and weights
forestplot: Forest plot
funnelplot: Funnel plot
·
·
·
·
·
172/204
Tutorial On Meta-Analysis In R file:///Users/kovalchiksa/master/tutorial/user2013/index.html#200
172 of 204 6/23/13 1:10 PM

MMaanntteell--HHaaeennsszzeell OORR
rmeta has the fewest features of the packages we havediscussed.
One potential advantage is the fixed-effects Mantel-Haenszelmethod for combined ORs.
Like Peto's OR, this is a FE model that can be advantageous forhandling studies with rare events.
·
·
·
173/204
Tutorial On Meta-Analysis In R file:///Users/kovalchiksa/master/tutorial/user2013/index.html#200
173 of 204 6/23/13 1:10 PM
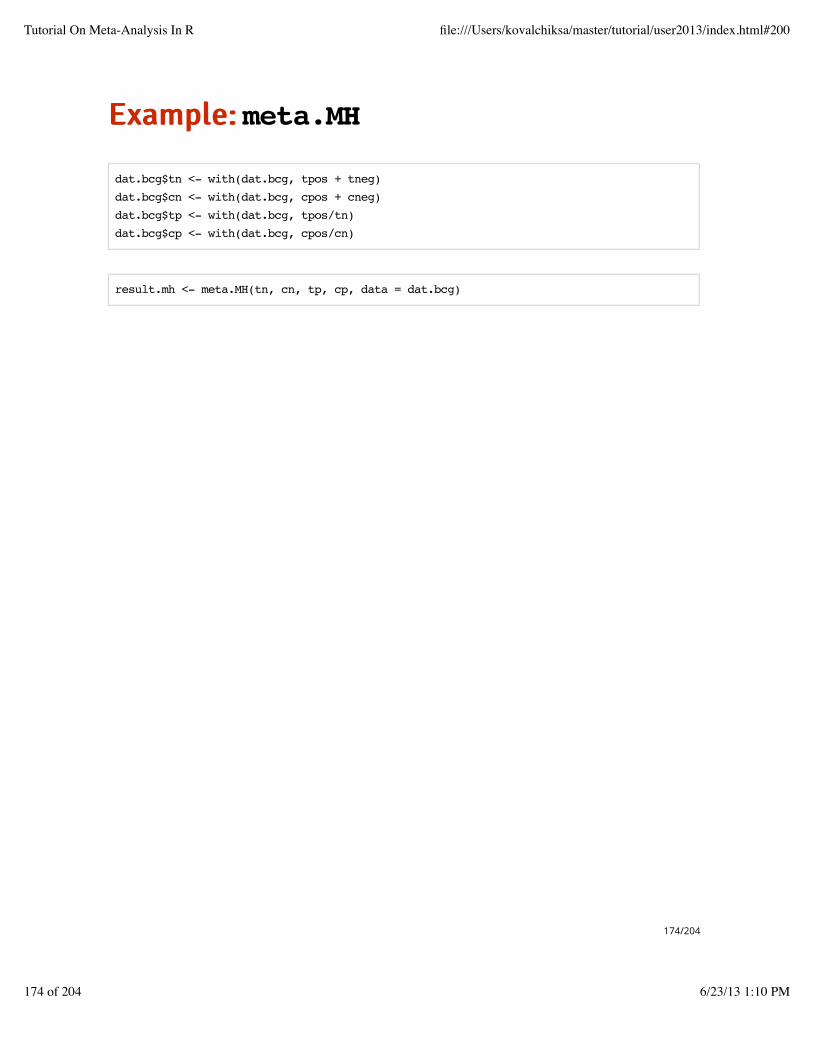
EExxaammppllee:: meta.MH
dat.bcg$tn <- with(dat.bcg, tpos + tneg)
dat.bcg$cn <- with(dat.bcg, cpos + cneg)
dat.bcg$tp <- with(dat.bcg, tpos/tn)
dat.bcg$cp <- with(dat.bcg, cpos/cn)
result.mh <- meta.MH(tn, cn, tp, cp, data = dat.bcg)
174/204
Tutorial On Meta-Analysis In R file:///Users/kovalchiksa/master/tutorial/user2013/index.html#200
174 of 204 6/23/13 1:10 PM

RReettuurrnneedd OObbjjeecctt OOff meta.MH
names(result.mh)
## [1] "logOR" "selogOR" "logMH" "selogMH" "MHtest"
## [6] "het" "call" "names" "conf.level" "statistic"
175/204
Tutorial On Meta-Analysis In R file:///Users/kovalchiksa/master/tutorial/user2013/index.html#200
175 of 204 6/23/13 1:10 PM

KKeeyy CCoommppoonneennttss
logOR: Log odds ratio
logMH: Estimated overall log OR
selogMH: Standard error of overall log OR
MHtest: Mantel-Haenszel -test that OR=1
het: Woolfʼs chi-square for heterogeneity, df, p-value
·
·
·
· χ2
·
176/204
Tutorial On Meta-Analysis In R file:///Users/kovalchiksa/master/tutorial/user2013/index.html#200
176 of 204 6/23/13 1:10 PM
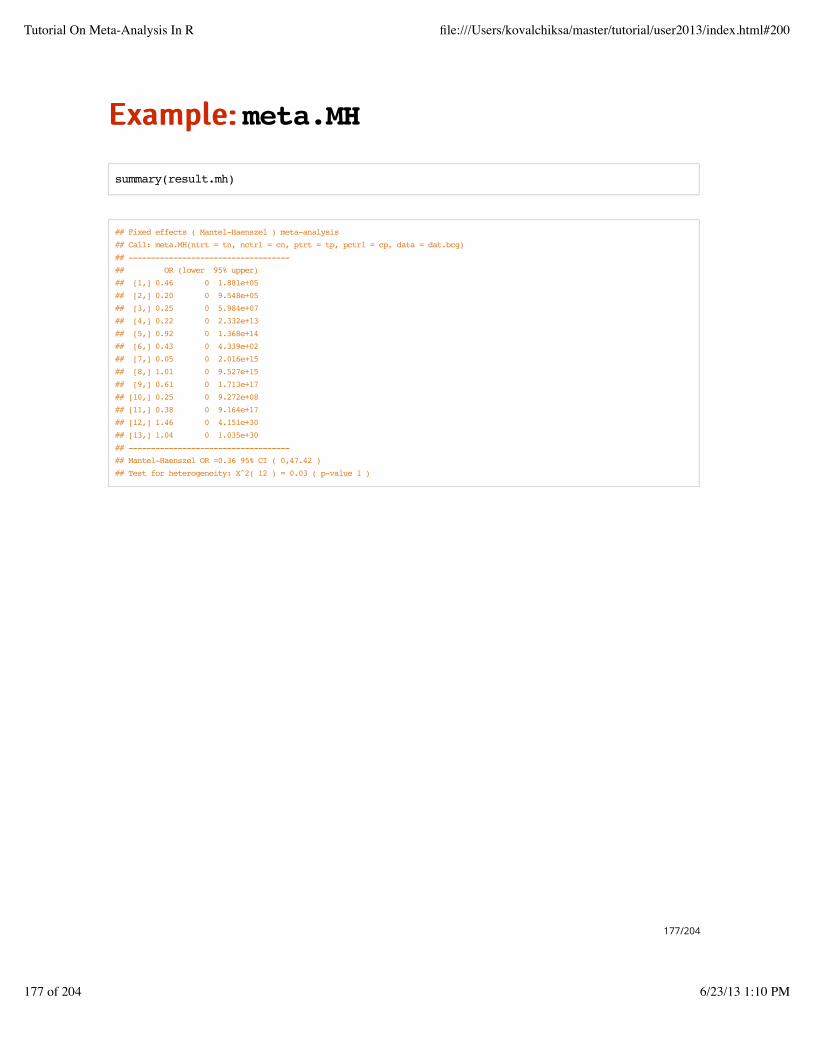
EExxaammppllee:: meta.MH
summary(result.mh)
## Fixed effects ( Mantel-Haenszel ) meta-analysis
## Call: meta.MH(ntrt = tn, nctrl = cn, ptrt = tp, pctrl = cp, data = dat.bcg)
## ------------------------------------
## OR (lower 95% upper)
## [1,] 0.46 0 1.881e+05
## [2,] 0.20 0 9.548e+05
## [3,] 0.25 0 5.984e+07
## [4,] 0.22 0 2.332e+13
## [5,] 0.92 0 1.368e+14
## [6,] 0.43 0 4.339e+02
## [7,] 0.05 0 2.016e+15
## [8,] 1.01 0 9.527e+15
## [9,] 0.61 0 1.713e+17
## [10,] 0.25 0 9.272e+08
## [11,] 0.38 0 9.164e+17
## [12,] 1.46 0 4.151e+30
## [13,] 1.04 0 1.035e+30
## ------------------------------------
## Mantel-Haenszel OR =0.36 95% CI ( 0,47.42 )
## Test for heterogeneity: X^2( 12 ) = 0.03 ( p-value 1 )
177/204
Tutorial On Meta-Analysis In R file:///Users/kovalchiksa/master/tutorial/user2013/index.html#200
177 of 204 6/23/13 1:10 PM

EExxaammppllee:: meta.MH
c(exp(result.or$b), exp(result.mh$logMH)) # Compare with RE model
## [1] 0.4736 0.3635
result.mh$MHtest
## [1] 0.1825 0.6692
178/204
Tutorial On Meta-Analysis In R file:///Users/kovalchiksa/master/tutorial/user2013/index.html#200
178 of 204 6/23/13 1:10 PM
CCoommppaarriinngg metafor,, rmeta,, meta
179/204
Tutorial On Meta-Analysis In R file:///Users/kovalchiksa/master/tutorial/user2013/index.html#200
179 of 204 6/23/13 1:10 PM

OOvveerraallll
Feature metafor rmeta meta
Comprehensive modeling options
Simple, well-designed syntax
Documentation: Thorough
Documentation: Easy to follow
Provides tools for meta-regression (from rma)
Publication-ready graphics
Provides tools to assess threat of publication bias
Provides tools to perform sensitivity analyses
✓ ✓
✓ ✓
✓ ✓
✓
✓ ✓
✓ ✓
✓ ✓ ✓
✓
180/204
Tutorial On Meta-Analysis In R file:///Users/kovalchiksa/master/tutorial/user2013/index.html#200
180 of 204 6/23/13 1:10 PM

CCaallccuullaatteedd EEffffeecctt SSiizzeess
Effect Size metafor rmeta meta
Relative Risk
Odds Ratio
Risk Difference
Mean Difference
Standardized Mean Difference
Correlation Coefficient
✓ ✓
✓ ✓ ✓
✓ ✓
✓ ✓
✓ ✓
✓ ✓
181/204
Tutorial On Meta-Analysis In R file:///Users/kovalchiksa/master/tutorial/user2013/index.html#200
181 of 204 6/23/13 1:10 PM

SSyynntthheessiiss MMeetthhooddss
Method metafor rmeta meta
Peto's OR
Mantel-Haenszel OR
DerSimonian-Laird RE
REML RE
Hedges
Sidik-Jonkman
Meta-Regression
✓ ✓
✓ ✓
✓ ✓
✓ ✓
✓ ✓
✓ ✓
✓ ✓
182/204
Tutorial On Meta-Analysis In R file:///Users/kovalchiksa/master/tutorial/user2013/index.html#200
182 of 204 6/23/13 1:10 PM

CCoommppuutteedd && AAcccceessiibbllee HHeetteerrooggeenneeiittyyMMeeaassuurreess
Heterogeneity Index metafor rmeta meta
τ 2 ✓ ✓ ✓
I 2 ✓
H 2 ✓
183/204
Tutorial On Meta-Analysis In R file:///Users/kovalchiksa/master/tutorial/user2013/index.html#200
183 of 204 6/23/13 1:10 PM

CCoommppuutteedd && AAcccceessiibbllee CCoonnffiiddeenncceeIInntteerrvvaallss
Estimate metafor rmeta meta
Study Effects
Summary Effect
✓
✓ ✓ ✓
τ 2 ✓
I 2 ✓
184/204
Tutorial On Meta-Analysis In R file:///Users/kovalchiksa/master/tutorial/user2013/index.html#200
184 of 204 6/23/13 1:10 PM

GGrraapphhiiccss
Plot metafor rmeta meta
Forest Plot
Funnel Plot
Galbraith (Radial) Plot
L'Abbe Plot
Trim-and-Fill Plot
✓ ✓ ✓
✓ ✓ ✓
✓ ✓
✓ ✓
✓ ✓
185/204
Tutorial On Meta-Analysis In R file:///Users/kovalchiksa/master/tutorial/user2013/index.html#200
185 of 204 6/23/13 1:10 PM

SSoommee AAddvvaanncceedd TTooppiiccss
186/204
Tutorial On Meta-Analysis In R file:///Users/kovalchiksa/master/tutorial/user2013/index.html#200
186 of 204 6/23/13 1:10 PM

ZZeerroo CCoouunnttss
No events in one or both treatment groups can createcomputational problems in standard meta-analytic approaches.
Most proprietary programs handle this by adding 0.5 to zerocounts.
Mantel-Haenszel only requires correction if zero counts occur forsame treatment arm in all studies.
Peto's odds ratio only requires correction if zero counts in botharms of one or more studies.
·
·
·
·
187/204
Tutorial On Meta-Analysis In R file:///Users/kovalchiksa/master/tutorial/user2013/index.html#200
187 of 204 6/23/13 1:10 PM
PPaattiieenntt--LLeevveell MMeettaa--AAnnaallyyssiiss
Always preferred but are rarely possible to undertake.
More often only some studies have IPD and focusing only onthese can introduce selection bias.
If bias is not of concern, synthesize with hierarchical modeling.
glmm and coxme packages are commonly used for hierarchicalmodeling in R.
I have written the ipdmeta package for assessing the power ofsubgroup effects with IPD meta-analysis.
·
·
·
·
·
188/204
Tutorial On Meta-Analysis In R file:///Users/kovalchiksa/master/tutorial/user2013/index.html#200
188 of 204 6/23/13 1:10 PM

MMeettaa--AAnnaallyysseess OOff OObbsseerrvvaattiioonnaall SSttuuddiieess
Great care is needed in assessing compatibility of effects whenconsidering meta-analysis of non-randomized studies.
When "treatment" is not randomized, greater heterogeneitybetween studies is expected.
The reason for this is that outcomes will be more sensitive to thesample characteristics and adjustment methods a study has used.
In general, one should use the most fully-adjusted measure ofeffect.
·
·
·
·
189/204
Tutorial On Meta-Analysis In R file:///Users/kovalchiksa/master/tutorial/user2013/index.html#200
189 of 204 6/23/13 1:10 PM

CCoonnffiiddeennccee DDiissttrriibbuuttiioonn MMeetthhoodd
We have focused on the summary of effect sizes.
It is also possible to summarize evidence across trials bycombining confidence intervals, the so-called "confidencedistribution method".
Some advantages of combining CDs:
·
·
·
Robust to outlying studies
Yields exact CI for combining 2 by 2 tables, even with rareevents
-
-
190/204
Tutorial On Meta-Analysis In R file:///Users/kovalchiksa/master/tutorial/user2013/index.html#200
190 of 204 6/23/13 1:10 PM

MMeettaa--AAnnaallyyssiiss OOff GGeennoommiicc DDaattaa
Standard FE or RE methodology can be applied to performmeta-analyses of genomic data (e.g., GWAS, microarray, etc.).
But these data introduce further issues:
·
·
Missing data
Platform discrepancies between studies
Multiplicity
Efficiency
-
-
-
-
191/204
Tutorial On Meta-Analysis In R file:///Users/kovalchiksa/master/tutorial/user2013/index.html#200
191 of 204 6/23/13 1:10 PM
MMuullttiivvaarriiaattee MMeettaa--AAnnaallyyssiiss
There may be multiple endpoints of interest.
A multivariate meta-analysis combines estimates of multipleoutcomes, accounting for their correlation.
Multivariate meta-regression can also incorporate the effects ofstudy-level predictors.
·
·
·
192/204
Tutorial On Meta-Analysis In R file:///Users/kovalchiksa/master/tutorial/user2013/index.html#200
192 of 204 6/23/13 1:10 PM

NNeettwwoorrkk MMeettaa--AAnnaallyyssiiss
A disease may have multiple trial-tested treatments.
In general, only a subset of treatments will have been consideredin any given trial.
When there is interest in comparing the efficacy among all trials,when not all have been directly compared in available trials, anetwork (or mixed-treatment) meta-analysis can be performed.
Proposed network meta-analysis methods usually involveBayesian approaches and require careful assessment ofconsistency in treatment comparisons.
·
·
·
·
193/204
Tutorial On Meta-Analysis In R file:///Users/kovalchiksa/master/tutorial/user2013/index.html#200
193 of 204 6/23/13 1:10 PM

BBaayyeessiiaann MMeettaa--AAnnaallyyssiiss
Bayesian meta-analysis focuses on estimating a posteriordistribution of effect rather than a summary effect estimate.
A Bayesian framework can be advantageous for:
·
·
Accounting for possible bias
Making mixed-treatment comparisons
Conducting multivariate analyses
-
-
-
194/204
Tutorial On Meta-Analysis In R file:///Users/kovalchiksa/master/tutorial/user2013/index.html#200
194 of 204 6/23/13 1:10 PM

PPaacckkaaggeess FFoorr AAddvvaanncceedd MMeettaa--AAnnaallyysseess
Topic Related Packages
Confidence Distribution Method gmeta (Not yet on CRAN)
Network Meta-Analysis gemtc
Multivariate Meta-Analysis mmeta, mvmeta, bamdit, mada,
HSROC, metamisc
Bayesian Meta-Analysis bamdit, bspmma
Genomic Meta-Analysis metABEL, gap, MAMA
195/204
Tutorial On Meta-Analysis In R file:///Users/kovalchiksa/master/tutorial/user2013/index.html#200
195 of 204 6/23/13 1:10 PM

KKeeyy MMeessssaaggeess
Remember...
Not to begin here!1.
That meta-analytic summaries are all about weighted averages2.
That evaluating bias and heterogeneity are essential steps ofmeta-analysis
3.
You now have a basic knowledge of how to use multiple Rpackages to perform conventional meta-analyses
4.
196/204
Tutorial On Meta-Analysis In R file:///Users/kovalchiksa/master/tutorial/user2013/index.html#200
196 of 204 6/23/13 1:10 PM

RReessoouurrcceess FFoorr SSyysstteemmaattiicc RReevviieewwssCochrane Collaboration Handbook
Preferred Reporting Items for Systematic Reviews andMeta-Analyses (PRISMA Statement)
Meta-analysis of Observational Studies in Epidemiology (MOOSEStatement)
·
·
·
197/204
Tutorial On Meta-Analysis In R file:///Users/kovalchiksa/master/tutorial/user2013/index.html#200
197 of 204 6/23/13 1:10 PM

FFuurrtthheerr RReeaaddiinnggOverview (1)
Cochrane Handbook
CRAN Task View on Meta-Analysis.
Chen D-G, Peace KE. Applied meta-analysis with R. Boca Raton, Florida: Taylor & Francis Group; 2013.
Ellis PD. The essential guide to effect sizes : statistical power, meta-analysis, and the interpretation of
research results. Cambridge ; New York: Cambridge University Press; 2010.
Hartung J, Knapp G, Sinha BK. Statistical meta-analysis with applications. Hoboken, N.J.: Wiley; 2008.
·
·
·
·
·
198/204
Tutorial On Meta-Analysis In R file:///Users/kovalchiksa/master/tutorial/user2013/index.html#200
198 of 204 6/23/13 1:10 PM

Overview (2)
Hartung J, Knapp G. On tests of the overall treatment effect in meta-analysis with normally distributed
responses. Stat Med 2001;20:1771-82.
Hedges LV, Olkin I. Statistical methods for meta-analysis. Orlando: Academic Press; 1985.
Hunter JE, Schmidt FL. Methods of meta-analysis : correcting error and bias in research findings. 2nd ed.
Thousand Oaks, Calif.: Sage; 2004.
·
·
·
199/204
Tutorial On Meta-Analysis In R file:///Users/kovalchiksa/master/tutorial/user2013/index.html#200
199 of 204 6/23/13 1:10 PM

Heterogeneity
DerSimonian R, Laird N. Meta-analysis in clinical trials. Control Clin Trials 1986;7:177-88.
Hardy RJ, et al. Detecting and describing heterogeneity in meta-analysis. Stat Med 1998;17:841-56.
Higgins JP, Thompson SG. Quantifying heterogeneity in a meta-analysis. Stat Med 2002;21:1539-58.
Knapp G, Biggerstaff BJ, Hartung J. Assessing the amount of heterogeneity in random-effects
meta-analysis. Biom J 2006;48:271-85.
Viechtbauer W. Hypothesis tests for population heterogeneity in meta-analysis. Br J Math Stat Psychol
2007;60:29-60.
Viechtbauer W. Confidence intervals for the amount of heterogeneity in meta-analysis. Stat Med
2007;26:37-52.
·
·
·
·
·
·
200/204
Tutorial On Meta-Analysis In R file:///Users/kovalchiksa/master/tutorial/user2013/index.html#200
200 of 204 6/23/13 1:10 PM
Advanced Topics (1)
Cai T, Parast L, Ryan L. Meta-analysis for rare events. Stat Med 2010;29:2078-89.
Dukic V, Gatsonis C. Meta-analysis of diagnostic test accuracy assessment studies with varying number of
thresholds. Biometrics 2003;59:936-46.
Gasparrini A, Armstrong B, Kenward MG. Multivariate meta-analysis for non-linear and other multi-
parameter associations. Stat Med 2012;31:3821-39.
Kovalchik SA. Aggregate-data estimation of an individual patient data linear random effects meta-analysis
with a patient covariate-treatment interaction term. Biostatistics 2013;14:273-83.
Kovalchik SA, Cumberland WG. Using aggregate data to estimate the standard error of a treatment-
covariate interaction in an individual patient data meta-analysis. Biom J 2012;54:370-84.
·
·
·
·
·
201/204
Tutorial On Meta-Analysis In R file:///Users/kovalchiksa/master/tutorial/user2013/index.html#200
201 of 204 6/23/13 1:10 PM

Advanced Topics (1)
Lin DY, Zeng D. On the relative efficiency of using summary statistics versus individual-level data in
meta-analysis. Biometrika 2010;97:321-32.
Singh K, Xie M, Strawdermann. Combining information from independent sources through confidence
distribution. Annals of Statistics 2005;33:159-183.
Thompson SG, Higgins JP. How should meta-regression analyses be undertaken and interpreted? Stat
Med 2002;21:1559-73.
van Houwelingen HC, Arends LR, Stijnen T. Advanced methods in meta-analysis: multivariate approach
and meta-regression. Stat Med 2002;21:589-624.
·
·
·
·
202/204
Tutorial On Meta-Analysis In R file:///Users/kovalchiksa/master/tutorial/user2013/index.html#200
202 of 204 6/23/13 1:10 PM
Applications
Colditz GA, Brewer TF, Berkey CS, et al. Efficacy of BCG vaccine in the prevention of tuberculosis.
Meta-analysis of the published literature. JAMA 1994;271:698-702.
Nissen SE, Wolski K. Effect of rosiglitazone on the risk of myocardial infarction and death from
cardiovascular causes. N Engl J Med 2007;356:2457-71.
·
·
203/204
Tutorial On Meta-Analysis In R file:///Users/kovalchiksa/master/tutorial/user2013/index.html#200
203 of 204 6/23/13 1:10 PM

204/204
Tutorial On Meta-Analysis In R file:///Users/kovalchiksa/master/tutorial/user2013/index.html#200
204 of 204 6/23/13 1:10 PM


![META [DADOS] / META [DATA]](https://img.pdfslide.net/doc/110x75/5790780b1a28ab6874c09b8f/meta-dados-meta-data.jpg)