Embed Size (px)
Citation preview
Tutorial: Tensor Approximation in Visualization and Computer Graphics
IntroductionRenato Pajarola, Susanne K. Suter, and Roland Ruiters
Introduction
• Renato Pajarola
‣ Professor, Visualization and MultiMedia Lab, University of Zürich
• Susanne K. Suter
‣ Postdoc, Visualization and MultiMedia Lab, University of Zürich
• Roland Ruiters
‣ PhD Student, Computer Graphics Group, University of Bonn
2
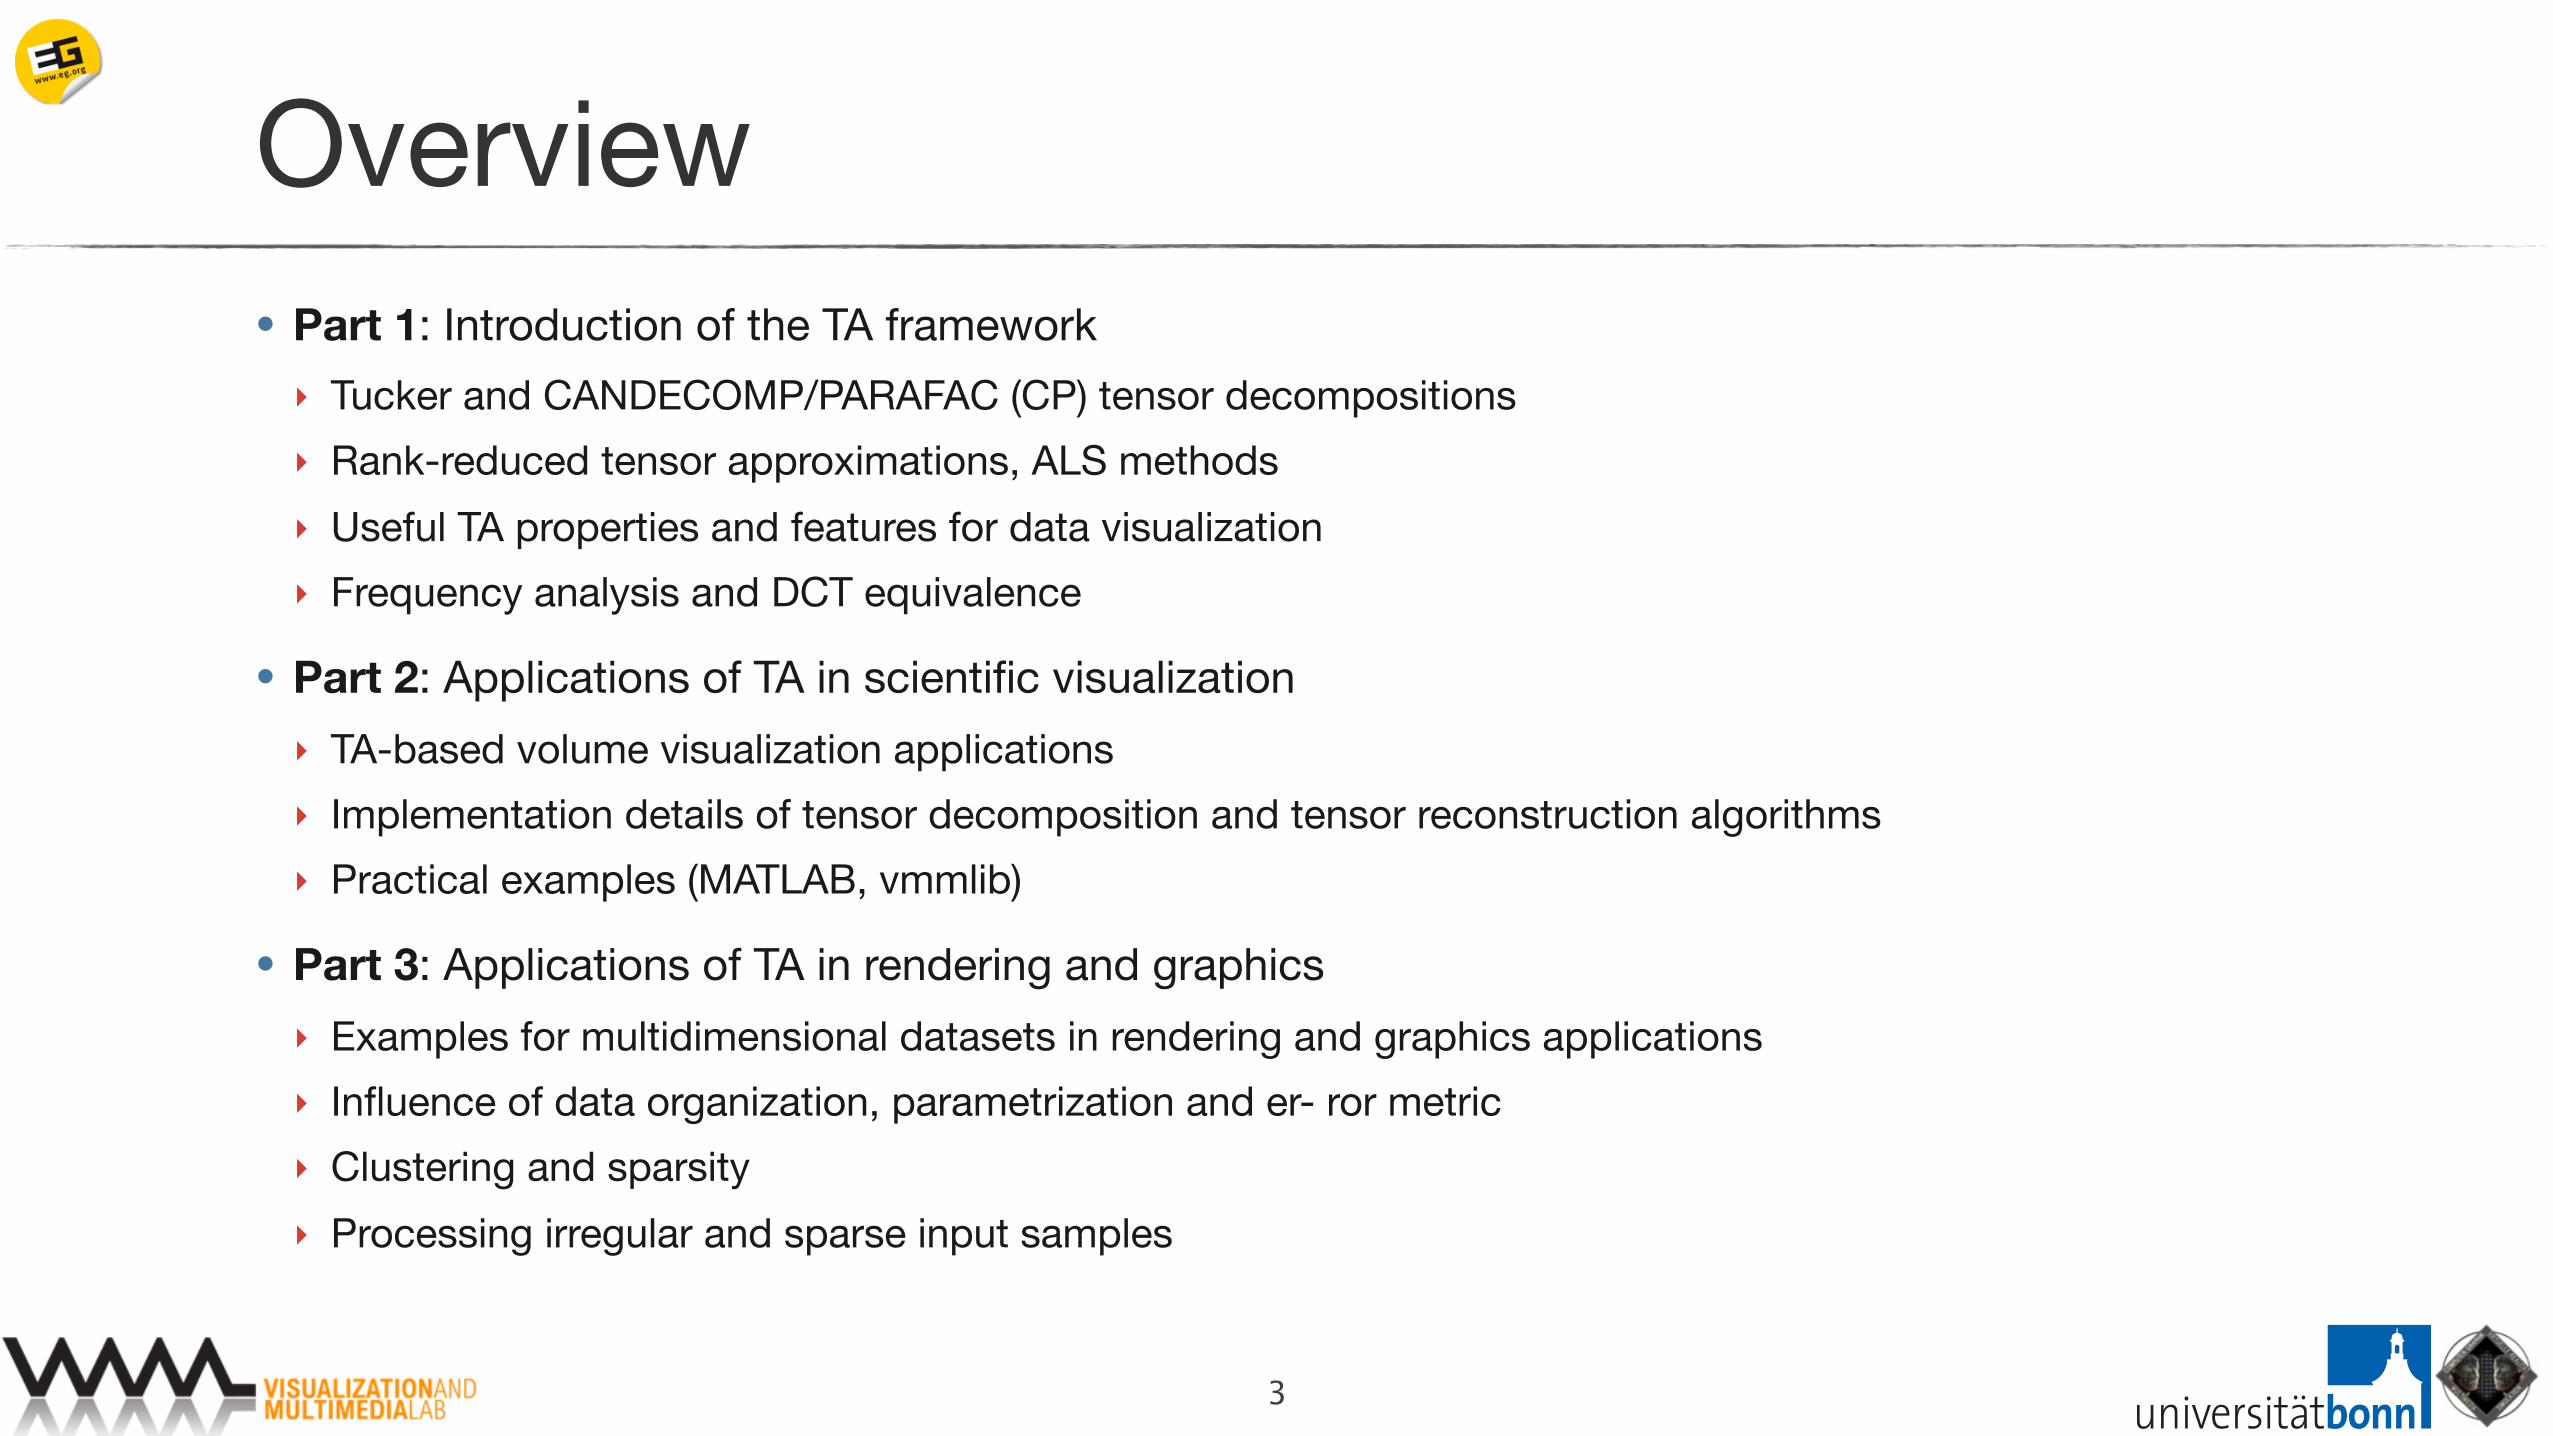
Overview• Part 1: Introduction of the TA framework
‣ Tucker and CANDECOMP/PARAFAC (CP) tensor decompositions
‣ Rank-reduced tensor approximations, ALS methods
‣ Useful TA properties and features for data visualization
‣ Frequency analysis and DCT equivalence
• Part 2: Applications of TA in scientific visualization
‣ TA-based volume visualization applications
‣ Implementation details of tensor decomposition and tensor reconstruction algorithms
‣ Practical examples (MATLAB, vmmlib)
• Part 3: Applications of TA in rendering and graphics
‣ Examples for multidimensional datasets in rendering and graphics applications
‣ Influence of data organization, parametrization and er- ror metric
‣ Clustering and sparsity
‣ Processing irregular and sparse input samples
3
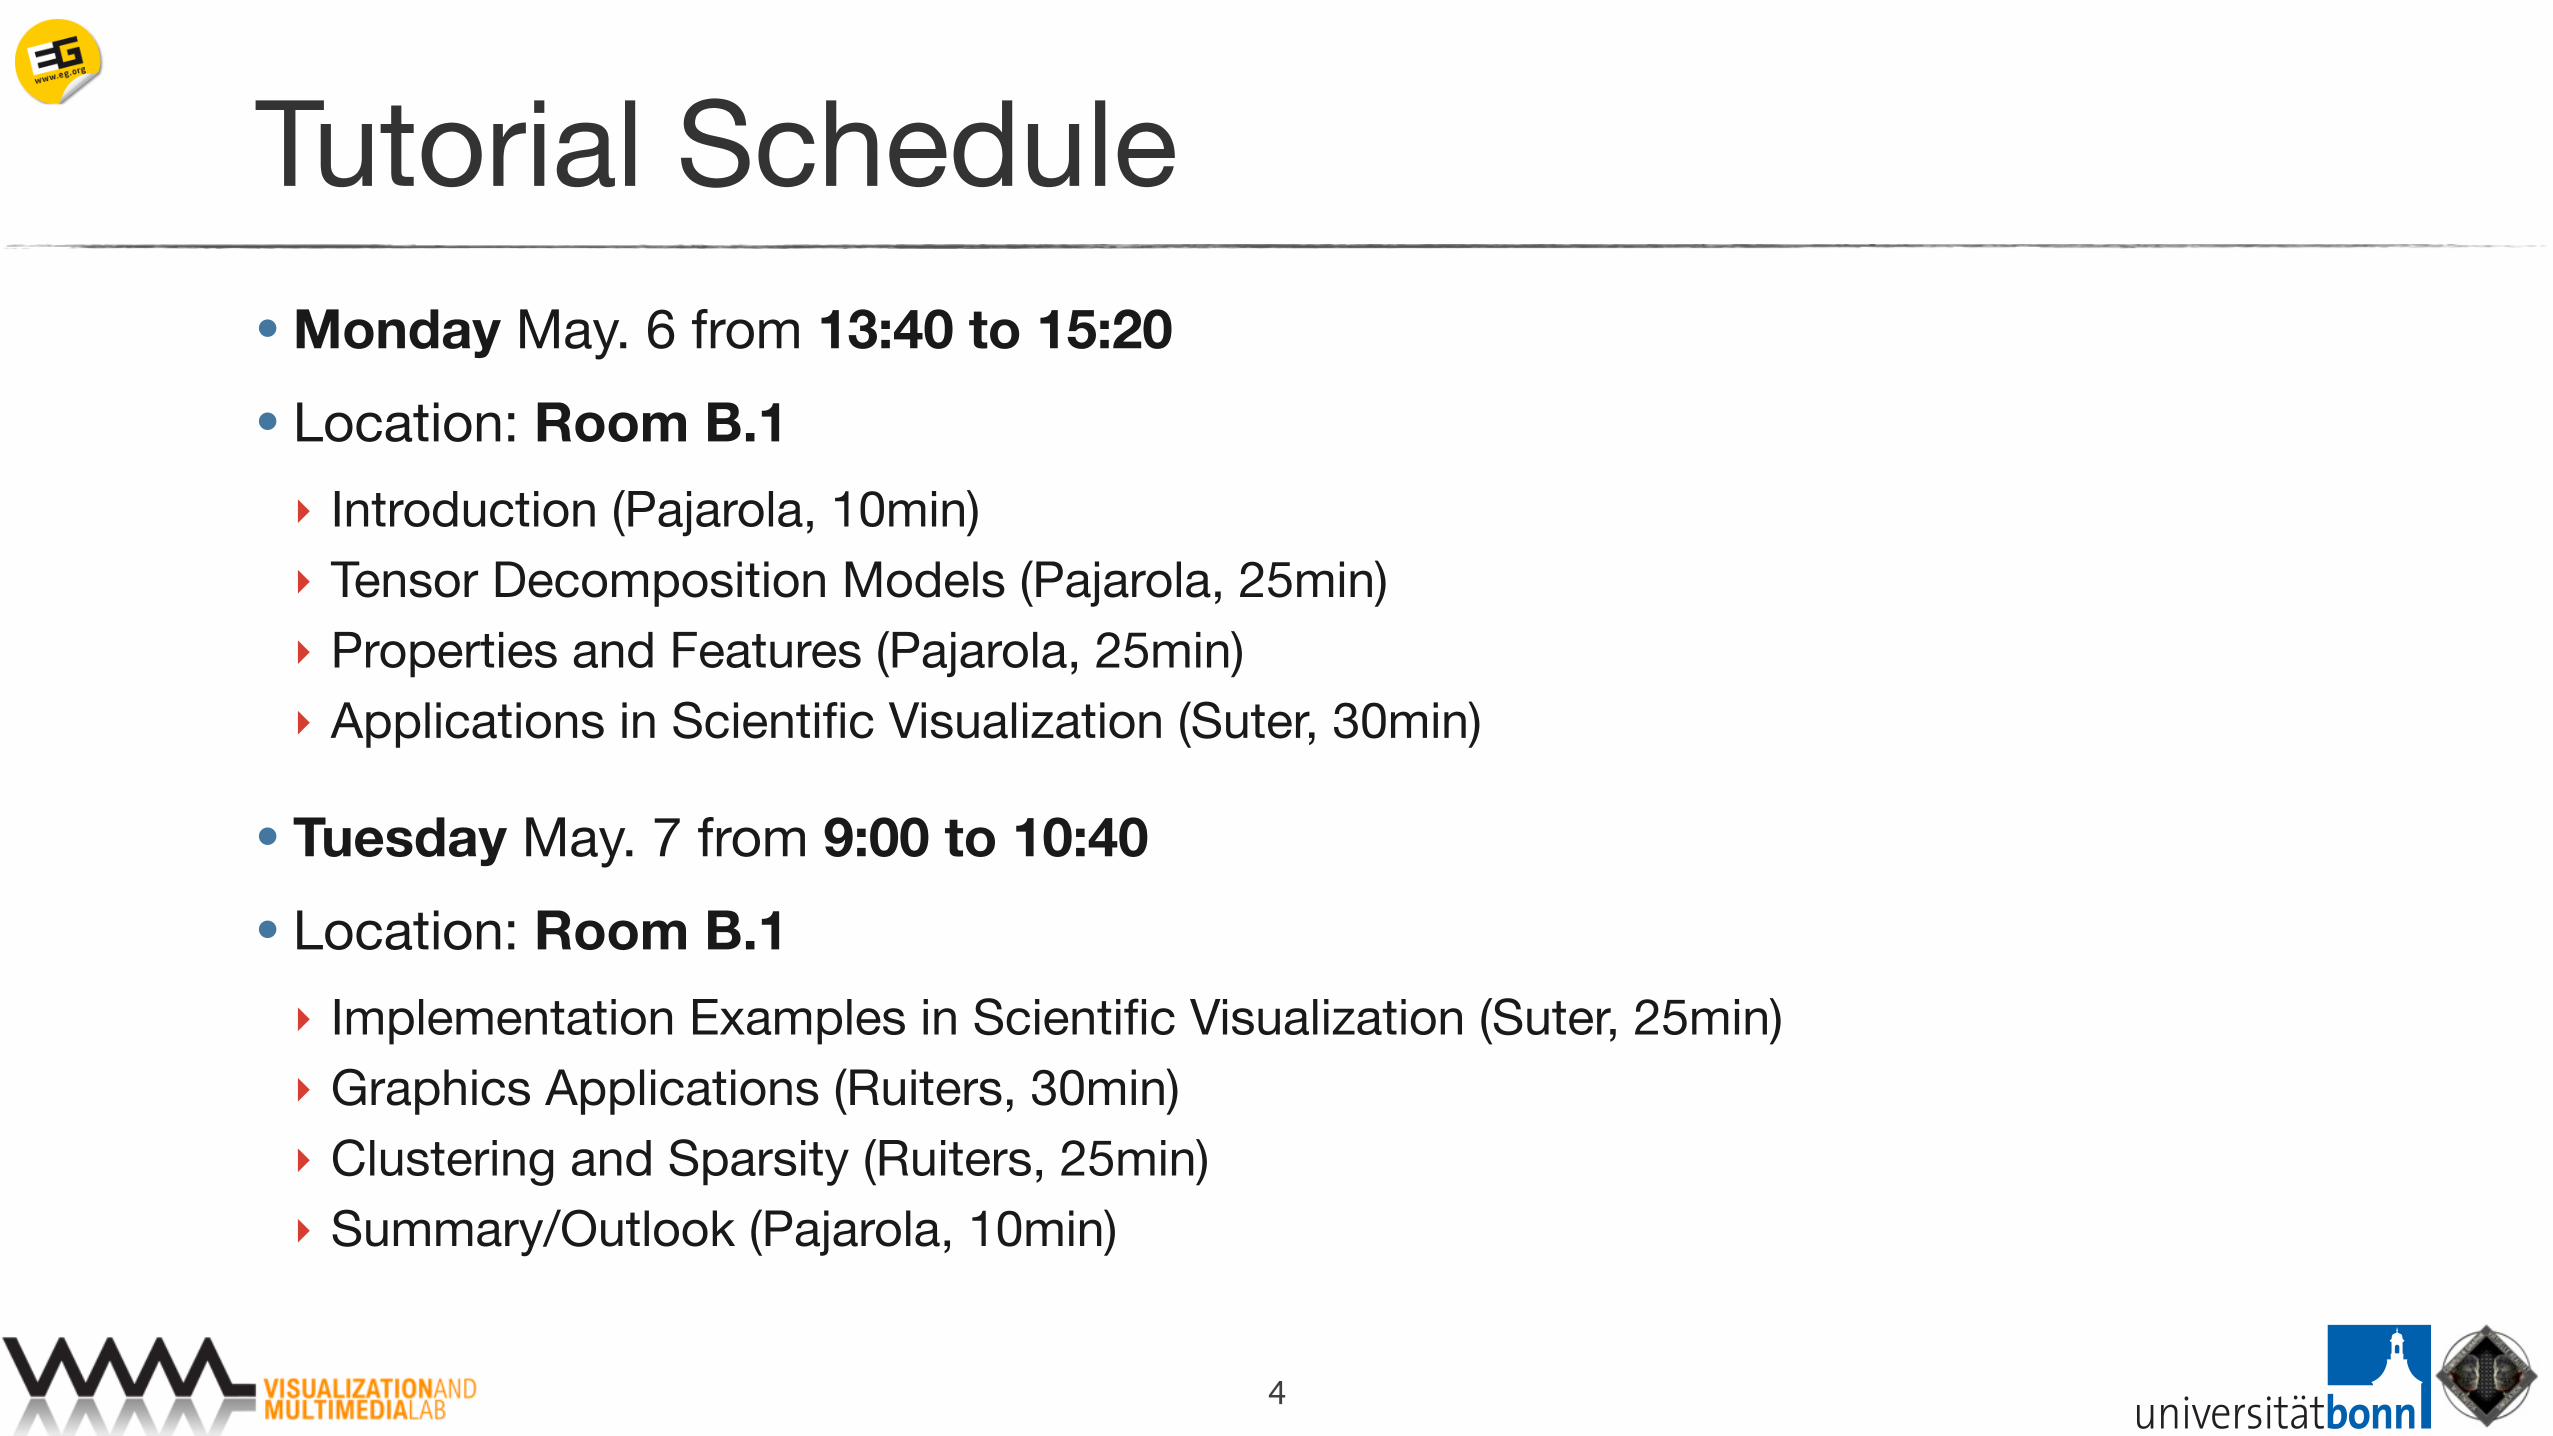
Tutorial Schedule• Monday May. 6 from 13:40 to 15:20
• Location: Room B.1
‣ Introduction (Pajarola, 10min)‣ Tensor Decomposition Models (Pajarola, 25min)‣ Properties and Features (Pajarola, 25min)‣ Applications in Scientific Visualization (Suter, 30min)
• Tuesday May. 7 from 9:00 to 10:40
• Location: Room B.1
‣ Implementation Examples in Scientific Visualization (Suter, 25min)‣ Graphics Applications (Ruiters, 30min)‣ Clustering and Sparsity (Ruiters, 25min)‣ Summary/Outlook (Pajarola, 10min)
4
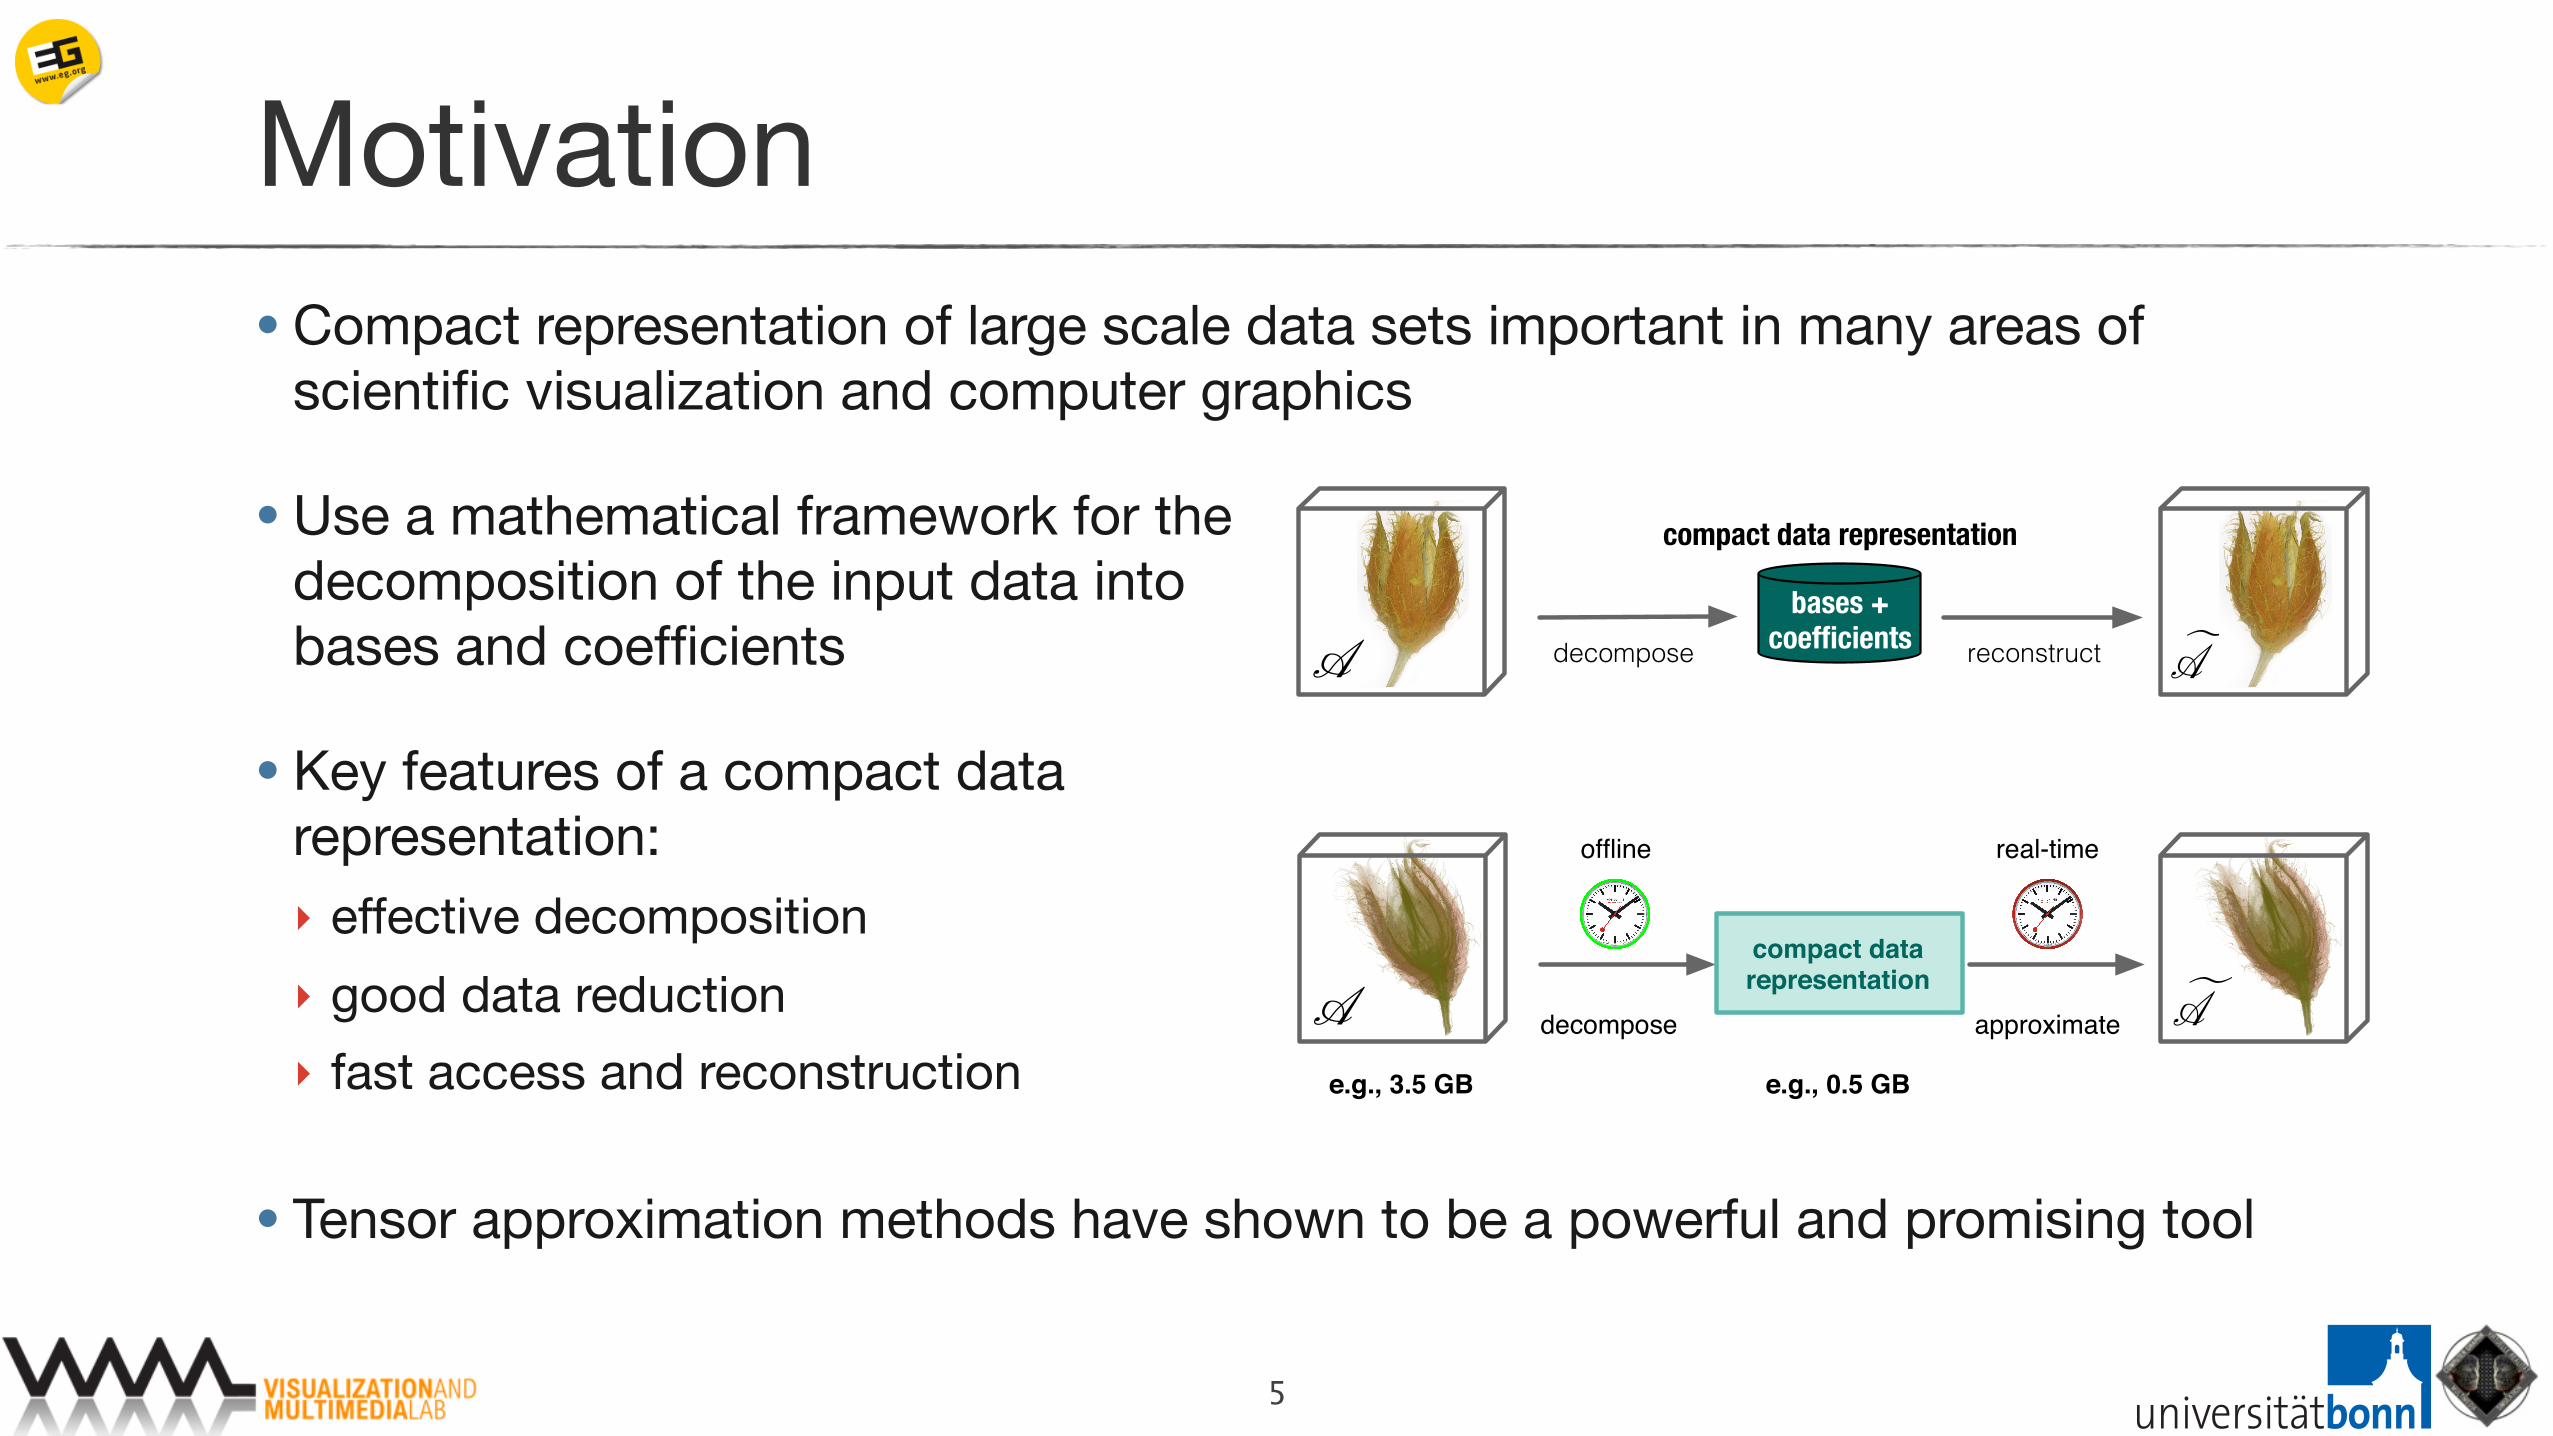
Motivation• Compact representation of large scale data sets important in many areas of
scientific visualization and computer graphics
• Use a mathematical framework for the decomposition of the input data into bases and coefficients
• Key features of a compact data representation:‣ effective decomposition
‣ good data reduction
‣ fast access and reconstruction
• Tensor approximation methods have shown to be a powerful and promising tool
5
�AA decompose reconstruct
bases +coefficients
compact data representation
�AA
offline real-time
decompose approximate
compact datarepresentation
e.g., 3.5 GB e.g., 0.5 GB
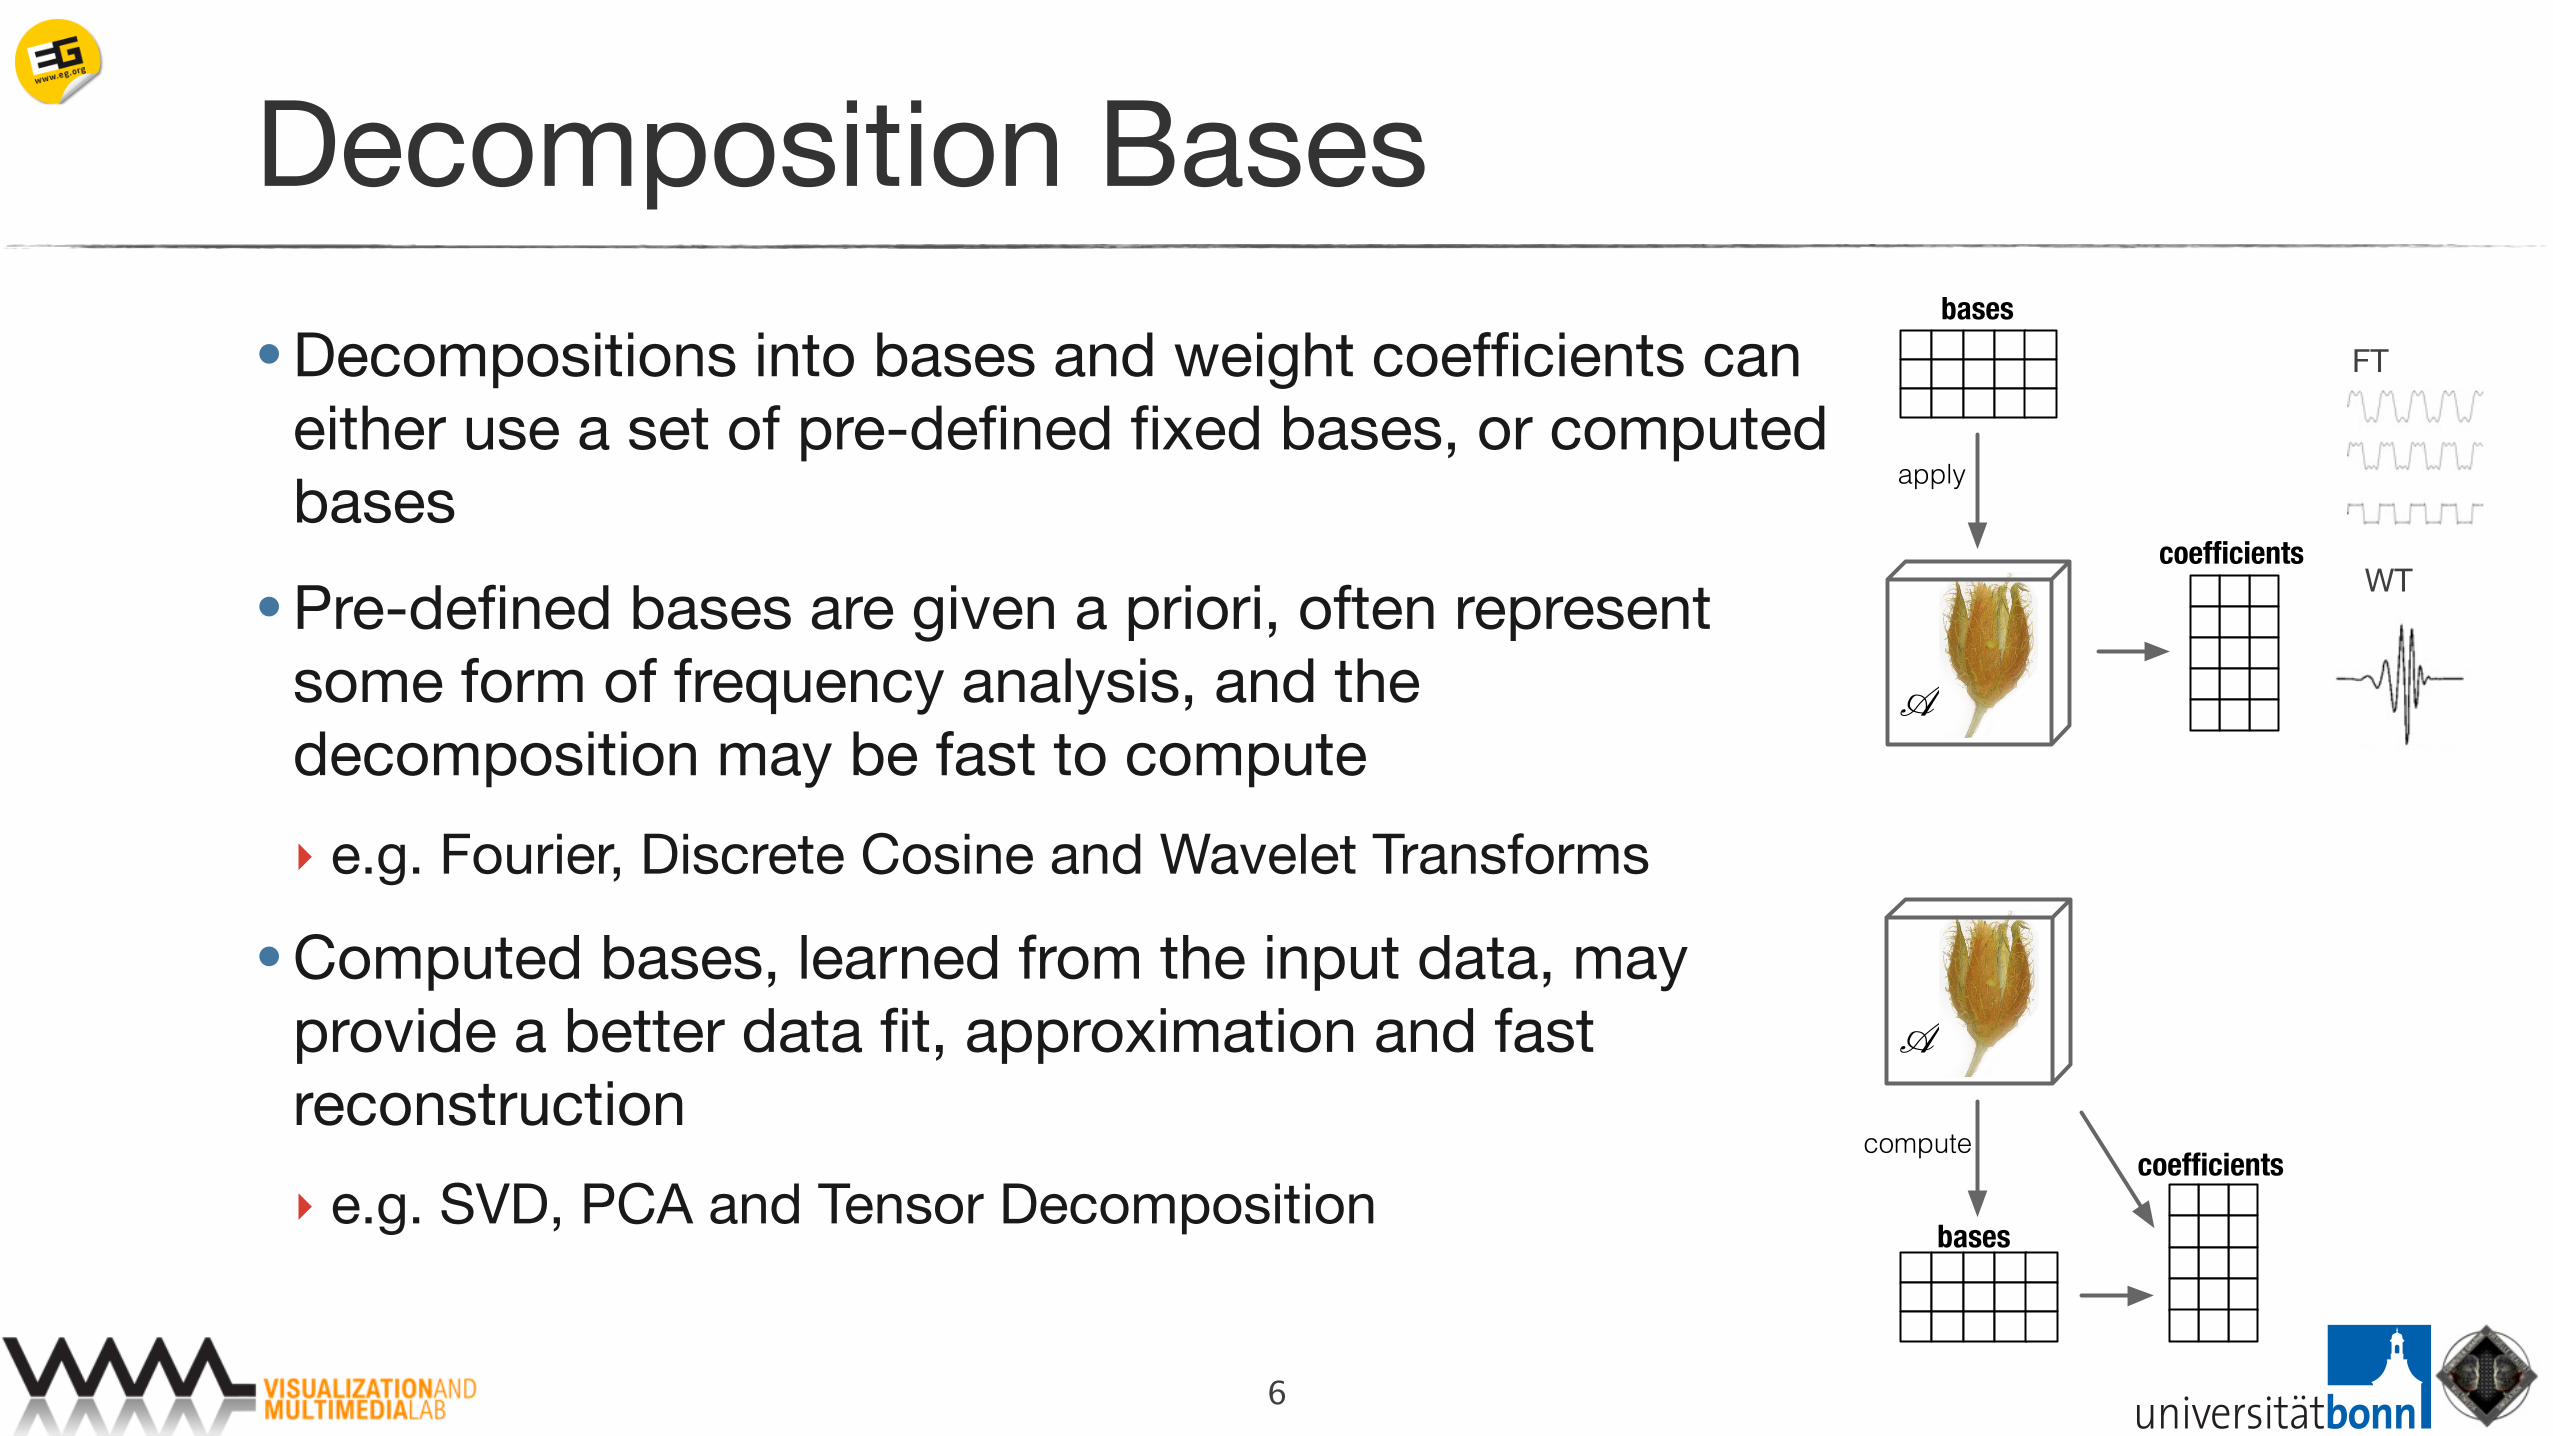
Decomposition Bases
• Decompositions into bases and weight coefficients can either use a set of pre-defined fixed bases, or computed bases
• Pre-defined bases are given a priori, often represent some form of frequency analysis, and the decomposition may be fast to compute
‣ e.g. Fourier, Discrete Cosine and Wavelet Transforms
• Computed bases, learned from the input data, may provide a better data fit, approximation and fast reconstruction
‣ e.g. SVD, PCA and Tensor Decomposition
6
compute
bases
coefficients
A
apply
bases
coefficients
A
FT
WT
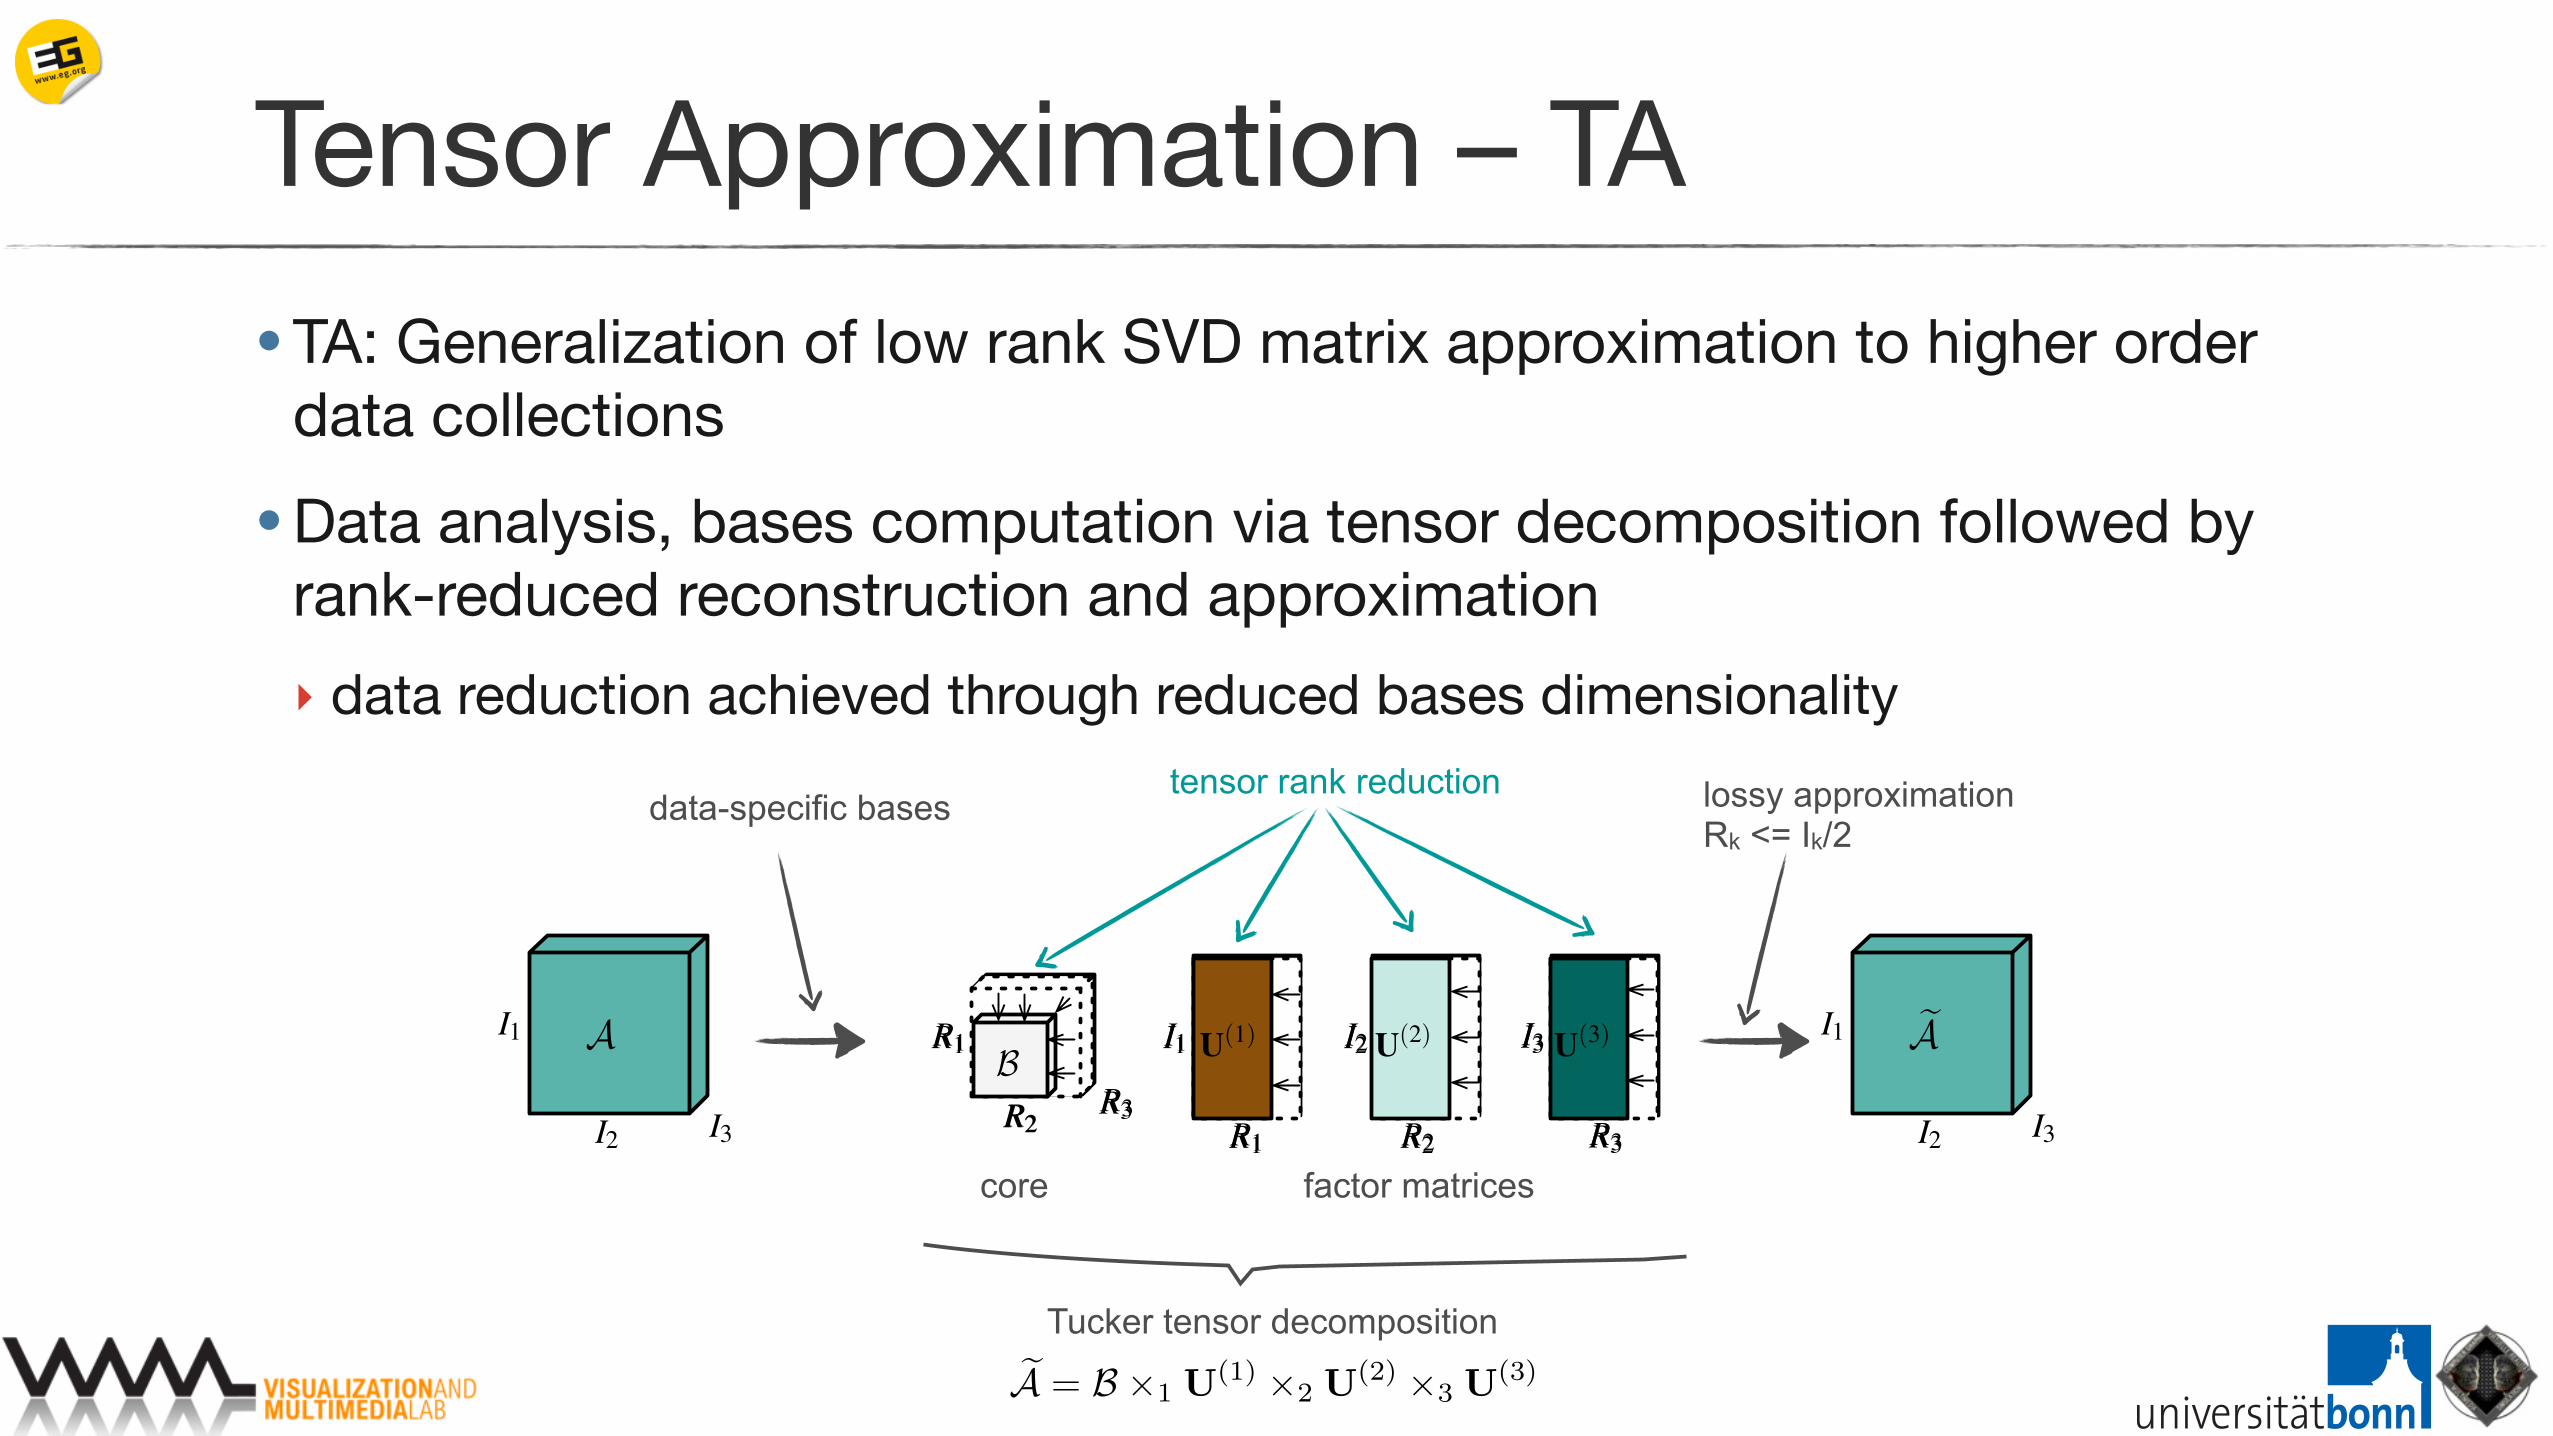
Tensor Approximation – TA• TA: Generalization of low rank SVD matrix approximation to higher order
data collections
• Data analysis, bases computation via tensor decomposition followed by rank-reduced reconstruction and approximation
‣ data reduction achieved through reduced bases dimensionality
�A = B ×1 U(1) ×2 U
(2) ×3 U(3)
Tucker tensor decomposition
U(3)U(1) U(2)I1 I2 I3
R1 R2 R3
R1
R2R3
B
core factor matrices
lossy approximationRk <= Ik/2
data-specific bases
I1
I2 I3
�A I1
I2 I3
�AU(3)U(1) U(2)I1 I2 I3
R1 R2 R3
R1
R2R3
B
tensor rank reduction