Embed Size (px)
Citation preview
1
Twenty years and Counting:
Thoughts about Measuring the Upper Tail*
Thomas Piketty (Paris School of Economics)
Emmanuel Saez (UC Berkeley)
Gabriel Zucman (UC Berkeley)
This version: July 7, 2021
Abstract. This article first describes the main developments in measuring the upper tail of the
income and wealth distributions over the last twenty years. Second, it points out some of the key
methodological challenges and how better data could address them. Third, it discusses the
academic and policy impacts of upper tail measurement.
*This paper has been prepared for a special issue of the Journal of Economic Inequality entitled
“Finding the Upper Tail”. Piketty: Paris School of Economics, 48 Boulevard Jourdan, 75014 Paris,
(e-mail: [email protected]); Saez: University of California, Berkeley, CA 94720, (e-mail:
[email protected]); Zucman: University of California, Berkeley, CA 94720, (e-mail:
[email protected]). We acknowledge funding from the Berkeley Center for Equitable
Growth, the Berkeley Stone Center on Wealth and Income Inequality, and the European Research
Council.
2
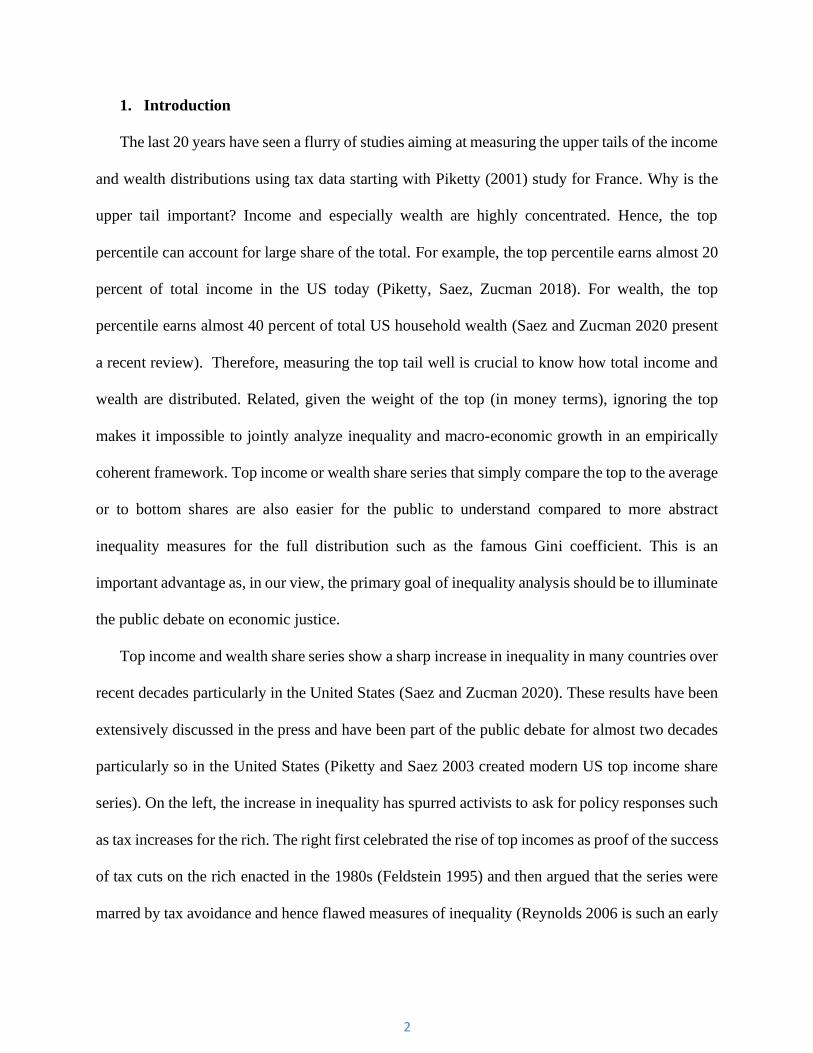
1. Introduction
The last 20 years have seen a flurry of studies aiming at measuring the upper tails of the income
and wealth distributions using tax data starting with Piketty (2001) study for France. Why is the
upper tail important? Income and especially wealth are highly concentrated. Hence, the top
percentile can account for large share of the total. For example, the top percentile earns almost 20
percent of total income in the US today (Piketty, Saez, Zucman 2018). For wealth, the top
percentile earns almost 40 percent of total US household wealth (Saez and Zucman 2020 present
a recent review). Therefore, measuring the top tail well is crucial to know how total income and
wealth are distributed. Related, given the weight of the top (in money terms), ignoring the top
makes it impossible to jointly analyze inequality and macro-economic growth in an empirically
coherent framework. Top income or wealth share series that simply compare the top to the average
or to bottom shares are also easier for the public to understand compared to more abstract
inequality measures for the full distribution such as the famous Gini coefficient. This is an
important advantage as, in our view, the primary goal of inequality analysis should be to illuminate
the public debate on economic justice.
Top income and wealth share series show a sharp increase in inequality in many countries over
recent decades particularly in the United States (Saez and Zucman 2020). These results have been
extensively discussed in the press and have been part of the public debate for almost two decades
particularly so in the United States (Piketty and Saez 2003 created modern US top income share
series). On the left, the increase in inequality has spurred activists to ask for policy responses such
as tax increases for the rich. The right first celebrated the rise of top incomes as proof of the success
of tax cuts on the rich enacted in the 1980s (Feldstein 1995) and then argued that the series were
marred by tax avoidance and hence flawed measures of inequality (Reynolds 2006 is such an early
3
attempt). Therefore, there is no doubt that increasing top shares can be a potent argument in the
policy debate and hence that measuring the top tail well is highly valuable to illuminate the debate.
In this article, we will first describe the main developments in measuring the upper tail of the
wealth and income over the last twenty years. Second, we will discuss the key methodological
challenges and how better data could address them. Third, we will discuss the academic and policy
impacts of upper tail measurement.
1. Methodological developments
Long history. Using tax data to measure the top tail of income or wealth distributions has a long
and august tradition in economics. In the late 19th century, Vilfredo Pareto famously discovered
that top tails follow power distributions looking at tabulations of income and wealth tax data for
Swiss cantons (Pareto 1896). The “Pareto” parameter of the power distribution became a classical
measure of the “thinness” of the top tail over the next 50 years. The Pareto parameter is very easy
to estimate using basic tabulations of taxpayers by brackets that have been routinely produced by
tax administrations since the modern income tax started in the late 19th or early 20th century in
most advanced economies. But it is a somewhat abstract parameter that measures the weight of the
superrich among the rich rather than the weight of the rich in the economy.1
In the mid-20th century, Simon Kuznets estimated top income shares by dividing income
accruing to a top group (such as the top percentile) by a total income denominator estimated from
1 With a Pareto distribution, the average income above a given income level z is always b*z where b is a constant typically between 2 and 3 for income or wealth distributions (b is inversely related to the Pareto parameter a by the formula b=a/(a-1). Similarly, the “shares within shares” are directly related to b. The share of the top p’ percentile in the top p percentile is (p’/p)^(1/b), e.g., with b=3, the share of the top .1% in the top 1% is .1^(1/3)=46% or almost half.
4
the new national accounts (Kuznets 1953). This key innovation is more data demanding as it
requires estimating a denominator that typically cannot be estimated solely from tax data (as many
taxpayers do not have to file). But it creates a statistic that has much more intuitive meaning than
the abstract Pareto parameter and hence more impactful in both the academic and policy debates.
The interest in tax data to measure inequality waned as micro-level survey data became
available. However, survey data cannot capture well the top tail for two related reasons. First, the
sample size of surveys is in general too small to provide an accurate statistical representation of
the very top (e.g., a random survey of 10,000 contains only 10 units from the top .1% and 1 unit
from the top .01%). Second, it is hard to disentangle truly high incomes from measurement error
(due for example to inaccurately adding an extra 0). Indeed, to avoid erroneously large incomes
that wreak havoc with averages, surveys generally use top coding. Survey data that capture the top
well such as the US Survey of Consumer Finances use underlying administrative tax data to
oversample and correctly represent the top percentile.
Revival of top income studies. Twenty years ago, Thomas Piketty revived the study of the top
tail using tax data by creating century long top income shares for France (Piketty 2001). The key
innovations relative to Kuznets were a longer time frame, disaggregating the top into finer fractiles
(such as the top .1% or even the top .01%) where changes were the most dramatic, and a very
different interpretation of the results. Far from a Kuznets’ curve technological phenomenon, top
income shares in France went down sharply over the first half of the 20th century due to large
shocks such as economic downturns, wars, inflation, or dramatic policy regime changes such as
confiscations or taxation of the rich.
5
After France, many countries were studied and the data series were compiled in the World
Top Income Database (Alvaredo et al. 2011). Thanks to over a hundred researchers, the database
expanded to include series on income concentration for more than thirty countries, spanning over
most of the 20th, early 21st centuries, and, in some cases, going back to the 19th century (Aktinson
and Piketty 2007, 2010 gather such studies and Atkinson, Piketty and Saez 2011 provides a
review).
Most remarkably, the database showed that, like France, virtually all countries experienced
a dramatic reduction in top income shares over the first part of the 20th century but with a strong
divergence in recent decades: English speaking countries such as the United States or the United
Kingdom experienced a sharp increase in top income shares since 1980 while Japan or continental
European countries such as France did not. This divergence among advanced economies again
showed that inequality is not driven solely by technological progress or globalization forces but
rather by institutions and policy developments in each country. For example, top income shares in
the US and UK start increasing exactly in 1980 after Reagan and Thatcher come into power and
start implementing their neoliberal revolutions. No such break is visible in other countries.
The main weakness of these top income share studies was their reliance on fiscal income
as reported on individual tax returns. The definition of fiscal income may vary overtime and across
countries based on tax laws so that the top income shares may not be fully comparable. Fiscal
income may not include important components of income such as retained earnings of corporations
that are particularly important at the top. Furthermore, tax evasion and tax avoidance may reduce
reported incomes relative to real incomes and the extent of tax evasion and tax avoidance may also
vary over time and across countries based on the strength of tax enforcement and the tax avoiding
opportunities available. For example, the fraction of national income from National Accounts
6
reported in individual income tax data has declined from 70 percent in the late 1970s to about 60
percent in 2018 (Saez and Zucman 2020). The gap is even larger in survey data, such as the Current
Population Survey, which do not capture top incomes well. Therefore, inequality measures using
fiscal income or survey data are not consistent with macro-economic measures of economic growth
making it impossible to integrate inequality and growth statistics.
Another limitation is that fiscal income is generally a before tax and before transfer income
concept and it is valuable to estimate inequality both on a before tax basis but also on an after-tax
and after transfers basis.
Distributional national accounts. The systematic solution to these weaknesses is to adopt a
consistent and comprehensive definition of income over time and across countries exactly as
National Accounting had developed aggregate income concepts and estimation guidelines that are
followed in most countries (United Nations System of National Accounts 2008). The idea,
pioneered for the United States by Piketty, Saez, and Zucman (2018) and for France by Garbinti,
Goupille-Lebret and Piketty (2018), is to create “distributional national accounts” that distribute
the national account aggregates over the population. The ultimate goal is to produce measures of
all the key income components (such as labor and capital income), wealth main asset classes (real
estate, business ownership, etc.), taxes and transfers from National accounts in a micro-level
database that aggregates to the National Accounts. Such a database allows researchers to construct
a wide range of inequality measures. It is possible to estimate top income statistics for both pre-
tax incomes and post-tax incomes, and for specific demographic subgroups (such as the working
age population, male vs. female, etc.) that are fully consistent with macro-economic aggregates.
The most comprehensive income definition accruing to residents of a given country is national
7
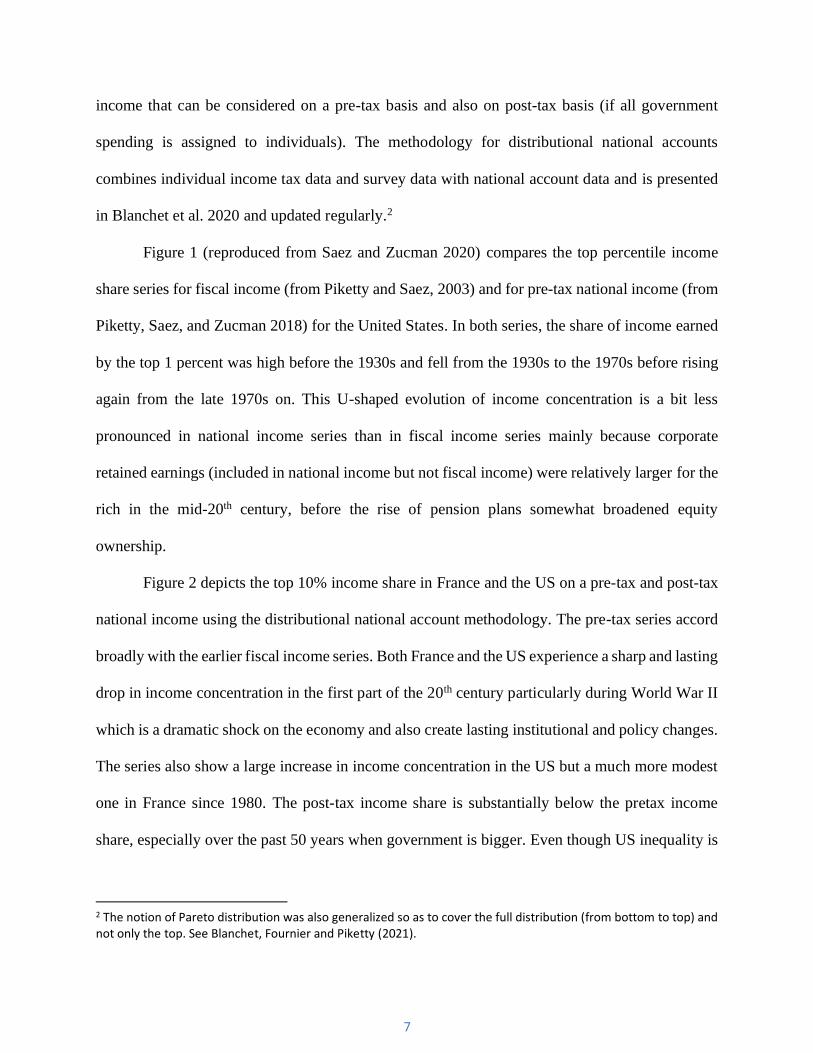
income that can be considered on a pre-tax basis and also on post-tax basis (if all government
spending is assigned to individuals). The methodology for distributional national accounts
combines individual income tax data and survey data with national account data and is presented
in Blanchet et al. 2020 and updated regularly.2
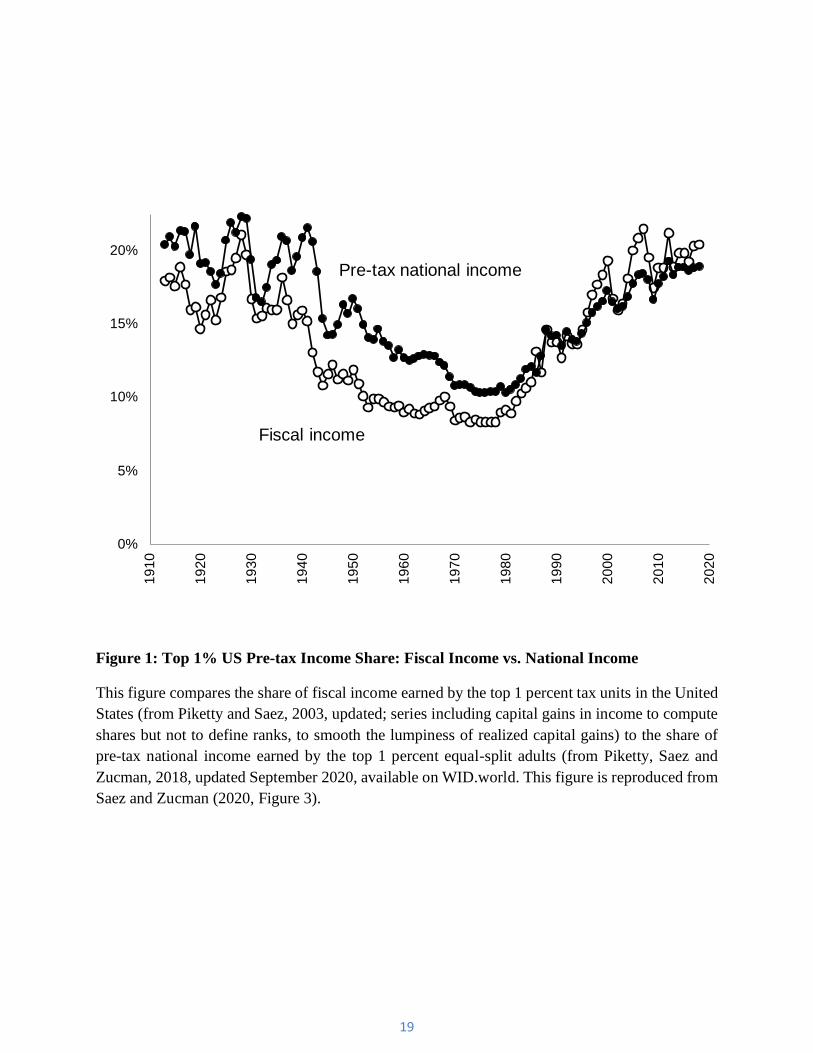
Figure 1 (reproduced from Saez and Zucman 2020) compares the top percentile income
share series for fiscal income (from Piketty and Saez, 2003) and for pre-tax national income (from
Piketty, Saez, and Zucman 2018) for the United States. In both series, the share of income earned
by the top 1 percent was high before the 1930s and fell from the 1930s to the 1970s before rising
again from the late 1970s on. This U-shaped evolution of income concentration is a bit less
pronounced in national income series than in fiscal income series mainly because corporate
retained earnings (included in national income but not fiscal income) were relatively larger for the
rich in the mid-20th century, before the rise of pension plans somewhat broadened equity
ownership.
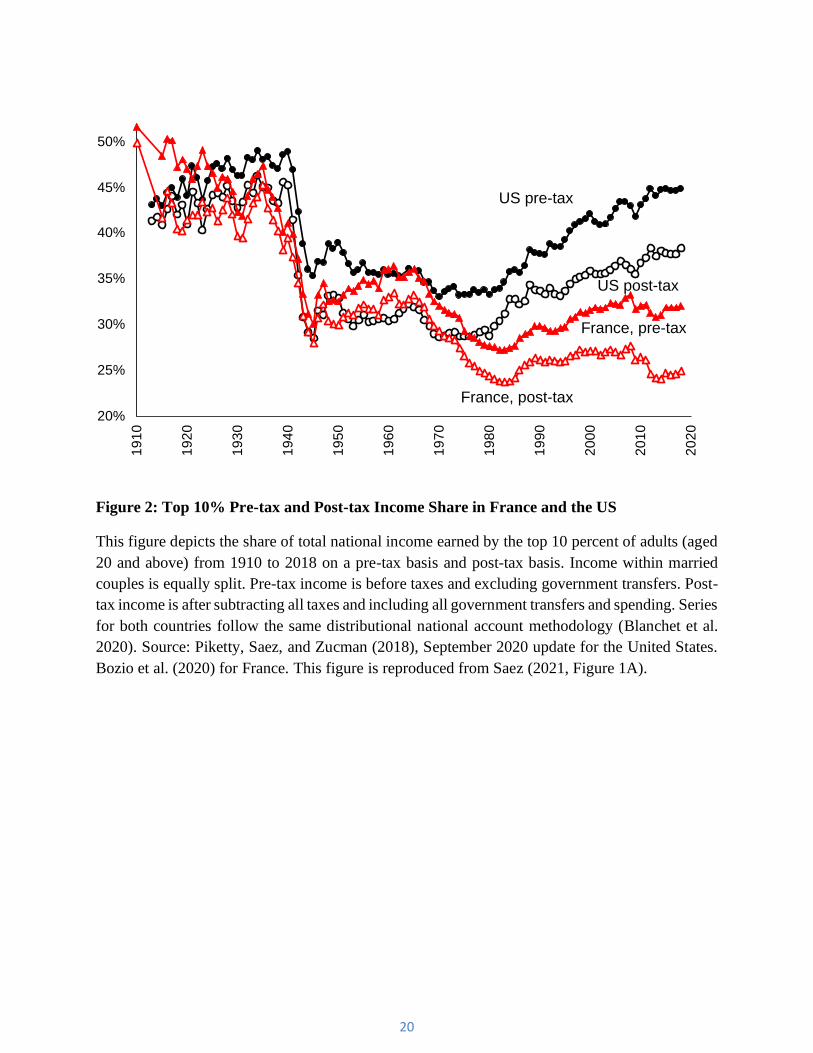
Figure 2 depicts the top 10% income share in France and the US on a pre-tax and post-tax
national income using the distributional national account methodology. The pre-tax series accord
broadly with the earlier fiscal income series. Both France and the US experience a sharp and lasting
drop in income concentration in the first part of the 20th century particularly during World War II
which is a dramatic shock on the economy and also create lasting institutional and policy changes.
The series also show a large increase in income concentration in the US but a much more modest
one in France since 1980. The post-tax income share is substantially below the pretax income
share, especially over the past 50 years when government is bigger. Even though US inequality is
2 The notion of Pareto distribution was also generalized so as to cover the full distribution (from bottom to top) and not only the top. See Blanchet, Fournier and Piketty (2021).
8
almost as high now as it was in the early twentieth century on a pretax basis, it is still substantially
lower on a post-tax basis. For France, inequality on a post-tax basis today is close to its all-time
low.
Worldwide coverage. The next innovation was to create inequality data for all countries
worldwide so as to have really global coverage. Given the huge differences in data availability
across countries, this required developing a range of methods based on available data and
extrapolating from neighboring or similar countries when inequality data are almost entirely
missing. These estimates are gathered in the World Inequality Database and described in detail in
the World Inequality Reports (Alvaredo et al. 2018 and Chancel et al. 2022). This empirical
strategy follows national accounts that can be created from relatively basic data and further refined
when better data become available. The quality and accuracy of the inequality statistics varies
across countries (and the time periods covered) but this can be flagged in the database itself. As
time passes and countries (hopefully) develop their data infrastructure, the quality of the World
Inequality Database will also improve.
2. Challenges
Estimating top tail inequality statistics is always going to be work in progress, particularly so with
the more ambitious Distributional National Accounts that have a global aim. There will always be
ways to improve the database. Let us point out some of the main challenges on measuring the top
tail.
9
Corporate vs. individual interface. A significant fraction of income and wealth of the rich
derives from business profits and business ownership. In most countries, most large businesses are
organized as corporations and taxed separately by the corporate tax. As a result, corporate income
is not taxed at the individual level and corporate ownership of individuals is generally not recorded
by the tax administration. This is the main weakness of fiscal income and a key motivation for
shifting to national income. However, corporate ownership and the corresponding corporate profits
for individuals have to be imputed based on imperfect proxies available on individual tax returns
such as dividends or realized capital gains. As the recent ProPublica leak of June 2021 has made
clear (Eisinger, Ernsthausen and Kiel 2021), deca-billionaires and even centi-billionaires often
report income on their individual tax returns that is negligible relative to their wealth or the true
economic income accruing to this wealth because their business does not distribute dividends and
they do not sell shares and realize capital gains. This is perhaps the most important blind spot in
our ability to measure the top tail well. This issue is increasingly important as corporate tax rates
have fallen significantly in most advanced economies and are now generally well below top
individual tax rate, generating strong incentives for the rich to incorporate their economic activity
and retain earnings within their corporations (Saez and Zucman 2019). In the US for example, if
the current low federal corporate tax rate of 21% becomes entrenched (it is uncertain at this time
whether the new Biden administration will succeed in increasing it much at all), it is likely that the
super-rich will further use the corporate form. This will render fiscal income from individual tax
returns less informative making the distributional national accounts approach even more crucial
but also more challenging as imputing corporate ownership is imperfect.
Therefore, a crucial step to improve the measurement of the top tail would be for tax
administrations to collect systematically corporate ownership information so that corporate wealth
10
and corporate profits can be linked to final individual owners. Some countries such as Chile or
Norway already collect such information to administer taxes.3 This information is already collected
by private financial institutions (such as the Depository Trust Company in the United States) that
act as centralized securities depositories to keep track of ownership of securities.
Top wealth. Wealth is much more concentrated than income making it even more challenging to
capture wealth well through surveys. While most countries have individual income taxes, very few
have wealth taxes. Even in countries with wealth taxes, large legal exemptions (such as business
assets for owners-managers in the case of the former French wealth tax for example) or weak
enforcement make it challenging to estimate wealth from wealth tax statistics. Capital income from
individual tax returns can be used to estimate wealth using capitalization techniques. This old
method was recently revived by Saez and Zucman (2016) for the United States. This can work
well in countries that still tax capital income fairly comprehensively (such as the United States)
but is more challenging when a lot of capital income is exempt or taxed separately from the
individual income tax (such as in France for example, see Garbinti, Goupille and Piketty 2021).
An important step to improve wealth estimates would be for tax administrations to require
reporting of balances for most financial assets as is already done for some asset classes in the
United States (such as Individual Retirement Accounts or mortgage debt) or for most asset classes
in Denmark (this reporting requirement was first used to administer the Danish wealth tax but was
found useful for income tax enforcement even after the wealth tax was abolished).
3 The US already collects such information for the large class of passthrough businesses (partnerships and S-corporations which are sometimes very large and complex) that are taxed solely at the individual level.
11
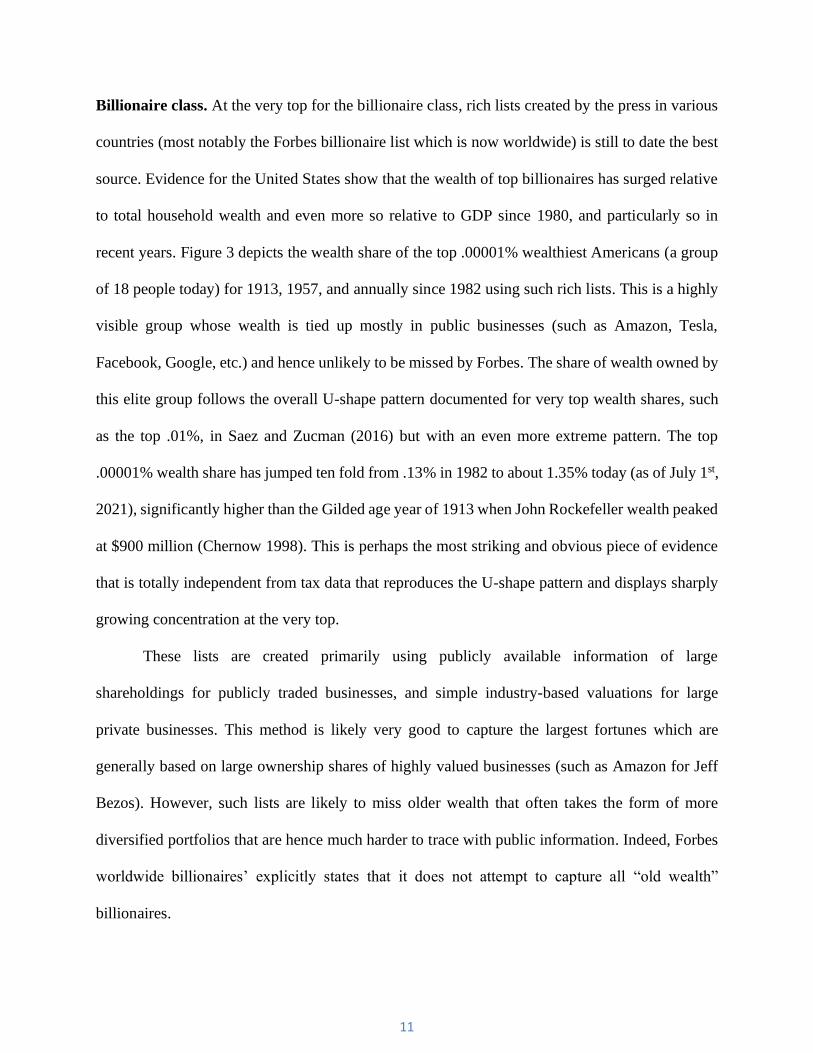
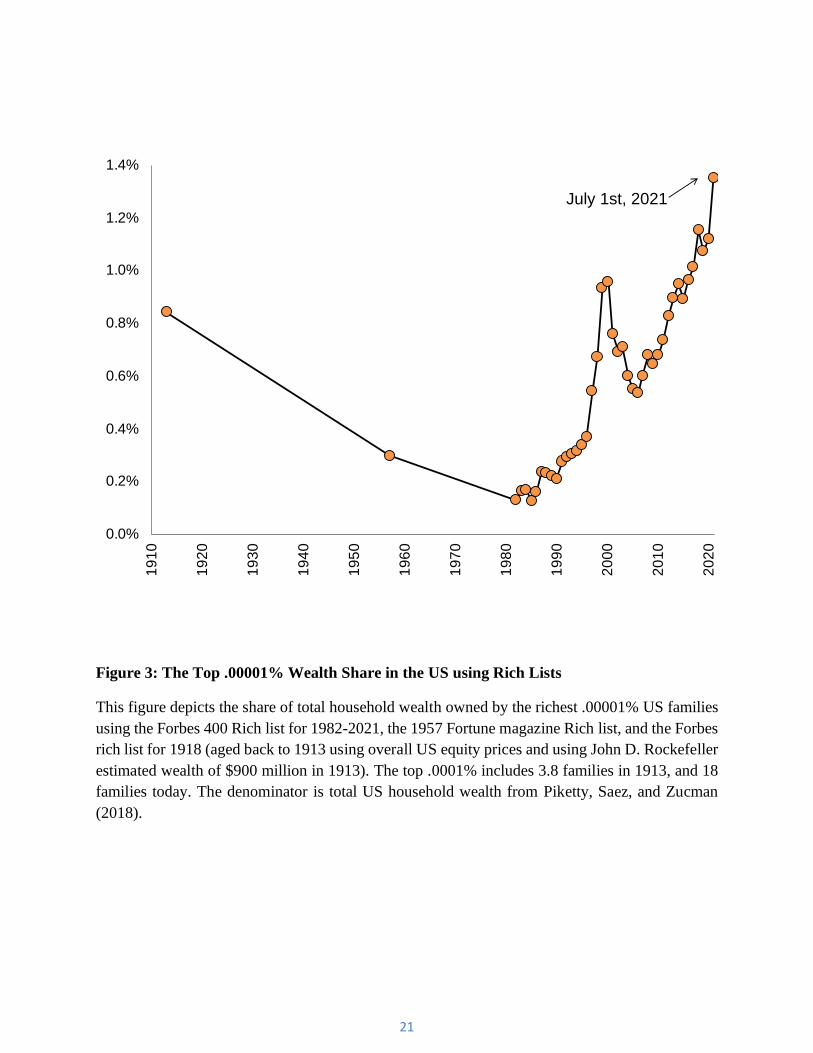
Billionaire class. At the very top for the billionaire class, rich lists created by the press in various
countries (most notably the Forbes billionaire list which is now worldwide) is still to date the best
source. Evidence for the United States show that the wealth of top billionaires has surged relative
to total household wealth and even more so relative to GDP since 1980, and particularly so in
recent years. Figure 3 depicts the wealth share of the top .00001% wealthiest Americans (a group
of 18 people today) for 1913, 1957, and annually since 1982 using such rich lists. This is a highly
visible group whose wealth is tied up mostly in public businesses (such as Amazon, Tesla,
Facebook, Google, etc.) and hence unlikely to be missed by Forbes. The share of wealth owned by
this elite group follows the overall U-shape pattern documented for very top wealth shares, such
as the top .01%, in Saez and Zucman (2016) but with an even more extreme pattern. The top
.00001% wealth share has jumped ten fold from .13% in 1982 to about 1.35% today (as of July 1st,
2021), significantly higher than the Gilded age year of 1913 when John Rockefeller wealth peaked
at $900 million (Chernow 1998). This is perhaps the most striking and obvious piece of evidence
that is totally independent from tax data that reproduces the U-shape pattern and displays sharply
growing concentration at the very top.
These lists are created primarily using publicly available information of large
shareholdings for publicly traded businesses, and simple industry-based valuations for large
private businesses. This method is likely very good to capture the largest fortunes which are
generally based on large ownership shares of highly valued businesses (such as Amazon for Jeff
Bezos). However, such lists are likely to miss older wealth that often takes the form of more
diversified portfolios that are hence much harder to trace with public information. Indeed, Forbes
worldwide billionaires’ explicitly states that it does not attempt to capture all “old wealth”
billionaires.
12
Therefore, measuring billionaire wealth well would require a well enforced and
comprehensive wealth tax (such as recently proposed in the US public policy debate) or more
systematic information on financial assets and business ownership collected through the tax system
as currently done for example in Denmark or Norway.
Tax progressivity at the very top. One important aspect of the public policy debate about the top
tail is the actual progressivity of the tax system at the top of the distribution. Saez and Zucman
(2019) estimate that the US tax system is regressive in 2018 above the top .01% and that the top
400 wealthiest pay a lower tax rate of 23% (relative to their true economic income) than the
average economy wide tax rate of 28%. The ProPublica leak of 2021 (Eisinger, Ernsthausen and
Kiel 2021) suggests that the top 25 wealthiest American pay even lower individual income taxes
(relative to wealth) than estimated by Saez and Zucman (2019) for the top 400. Measuring tax
progressivity at the very top up to the billionaire class raises both conceptual and empirical
challenges.
Empirically, measuring the tax burden on billionaires would require merging not only
individual tax data to the Forbes list but also corporate tax data (to measure the tax paid on
corporate profits of owners), to estate tax data (to measure taxes paid at death), and possibly other
taxes as well. No such comprehensive study has been done yet.
Conceptually, tax burdens are generally defined relative to income. This is indeed the method
used by most official statistics and also adopted in the Distributional National Accounts
methodology. However, many of the very largest fortunes such as Jeff Bezos with Amazon or Elon
Musk with Tesla arise through the explosive growth of new global businesses even before
significant profits materialize. I.e., the wealth arises today primarily in expectation of future
13
profits. Therefore, the true economic income of Jeff Bezos or Elon Musk might be very small
relative to their wealth gains. Yet, it is clear that wealth increases ability to pay taxes over and
above the true economic income it generates. Therefore, it is important to think about how to
combine income and wealth to generate a measure of an “ability of pay” denominator to construct
measures of tax progressivity across income or wealth groups. Saez and Zucman (2019) skirt the
issue by assuming an overall rate of return on billionaires wealth (based on aggregate returns by
asset classes). Traditionally, public economists favored a Haig-Simons definition of income that
also includes gains in wealth due to price effects (which are not included in national accounts).
This measure has merit over a longer-time horizon (such as a decade or a life-time) as a way to
capture wealth accumulation due to price effects but is very noisy on an annual basis due to very
large fluctuations in stock prices (see Robbins 2018 for a detailed analysis and discussion in the
US context). Recently, Bozio et al. 2018 propose instead a forward looking measure using
“augmented income” as denominator, i.e. income plus the annuitized value of wealth (i.e., wealth
divided by years of life expected based on age and gender) in the case of France. They find a
sharply regressive profile of effective tax rates with respect to augmented income within the upper
half of the distribution.
In our view, distributional tax statistics has been left primarily to government agencies but is
an area that deserves more attention from academic research particularly when studying the top
tail.
3. Policy impact
As the success of Piketty’s (2014) book attests, measuring the top tail is highly relevant in the
public policy debate. By calling for a global wealth tax in response to growing concentration of
14
income and wealth, the book certainly renewed public policy interest in progressive wealth
taxation. We can discuss policy impact of top tail measurement along several dimensions.
First, measuring the level of income or wealth at the top tail is crucial for evaluating the
fiscal capacity at the top of the income and wealth distributions. When income and wealth
concentration is high as in the US today, this fiscal capacity is large. This type of debate played
out in the US when wealth tax proposals were made.
Second, measuring the trend in top tail inequality is an important factor when deciding
which group should face a tax increase or a tax decrease. Indeed, it is easier to impose tax increases
when incomes are growing. Therefore, if incomes at the top are growing much faster than average
as is the case in the US since 1980, it is easier to justify a tax increase falling disproportionately
on the top. Growing inequality is indeed often mentioned by advocates of higher taxes on the rich.
Third, understanding the evolution in top tail inequality can affect how the public views
about the fairness of the economic system and how to best reform it. How income is split between
labor and capital has been the classical distinction, and many of the recent top tail studies starting
with Piketty (2001) carefully try to disentangle labor vs. capital explanations. More generally,
societies’ understanding of the drivers of top tail inequality is likely to play a large role in shaping
policy regarding social inequality (see Piketty 2020 for a wide historical analysis; see also Saez
2021).
15
References
Alvaredo, Facundo, Anthony B. Atkinson, Thomas Piketty, and Emmanuel Saez. 2011-2015.
The World Top Incomes Database. Online between January 2011 and December 2015.
Alvaredo, Facundo, Lucas Chancel, Thomas Piketty, Emmanuel Saez, and Gabriel Zucman
(eds.) 2018. The World Inequality Report 2018. Cambridge: Harvard University Press.
Atkinson, Anthony B., and Thomas Piketty. 2007. Top Incomes over the Twentieth Century. A
Contrast Between European and English Speaking Countries. Oxford: Oxford University Press.
Atkinson, Anthony B., and Thomas Piketty. 2010. Top Incomes. A Global Perspective. Oxford:
Oxford University Press.
Atkinson, Anthony B., Thomas Piketty, and Emmanuel Saez. 2011. “Top Incomes in the Long-
Run of History”, Journal of Economic Literature, 49(1), 3-71.
Blanchet, Thomas, Lucas Chancel et al. 2020. Distributional National Accounts Guidelines:
Methods and Concepts Used in the World Inequality Database. Paris: World Inequality Lab.
Blanchet, Thomas, Juliette Fournier and Thomas Piketty, 2021 “Generalized Pareto Curves:
Theory and Evidence”, forthcoming in Review of Income and Wealth.
Bozio, Antoine, Bertrand Garbinti, Jonathan Goupille-Lebret, Malka Guillot, and Thomas
Piketty. 2018, “Inequality and Redistribution in France, 1990-2018: Evidence from Post-Tax
Distributional National Accounts (DINA)”, WIL Working Paper
Bozio, Antoine, Bertrand Garbinti, Jonathan Goupille-Lebret, Malka Guillot, and Thomas
16
Piketty. 2020. “Predistribution vs. Redistribution: Evidence from France and the U.S.”, WIL
Working Paper.
Chancel, Lucas, Thomas Piketty, Emmanuel Saez, and Gabriel Zucman (eds.) 2022. The
World Inequality Report 2021. Cambridge: Harvard University Press.
Chernow, Ron. 1998. Titan: The Life of John D. Rockefeller, Sr. New York: Random House.
Eisinger, Jesse, Jeff Ernsthausen and Paul Kiel. 2021. “The Secret IRS Files: Trove of Never-
Before-Seen Records Reveal How the Wealthiest Avoid Income Tax.” ProPublica June 8, 2021.
Feldstein, Martin. 1995. “The Effect of Marginal Tax Rates on Taxable Income: A Panel Study
of the 1986 Tax Reform Act.” Journal of Political Economy 103(3): 551–72.
Garbinti, Bertrand, Jonathan Goupille-Lebret, and Thomas Piketty. 2018. “Inequality
Dynamics in France, 1900-2014: Evidence from Distributional National Accounts (DINA)”,
Journal of Public Economics.
Garbinti, Bertrand, Jonathan Goupille-Lebret, and Thomas Piketty. 2021. “Accounting for
Wealth Inequality Dynamics: Methods, Estimates and Simulations for France” forthcoming
Journal of the European Economic Association.
Kuznets, Simon. 1953. Shares of Upper Income Groups in Income and Savings. NBER
Pareto, Vilfredo. 1896. “La courbe de la répartition de la richesse.” Ecrits sur la courbe de la
répartition de la richesse, (Pareto writings collected by G. Busino, Librairie Droz, 1965), 1-15.
Piketty, Thomas. 2001. Les hauts revenus en France au XXème siècle: Inégalités et
redistributions 1901–1998. Paris: Grasset.
17
Piketty, Thomas. 2014. Capital in the 21st Century. Cambridge: Harvard University Press.
Piketty, Thomas. 2020. Capital and Ideology. Cambridge: Harvard University Press.
Piketty, Thomas and Lucas Chancel. 2021. “Global Income Inequality 1820-2020”, WIL
Working Paper.
Piketty, Thomas, and Emmanuel Saez. 2003. “Income Inequality in the United States, 1913-
1998,” Quarterly Journal of Economics, 118(1), 1-39.
Piketty, Thomas, Emmanuel Saez, and Gabriel Zucman. 2018. “Distributional National
Accounts: Methods and Estimates for the United States.” Quarterly Journal of Economics 133 (2):
553–609.
Reynolds, Alan. 2006. Income and Wealth. Greenwood Publishing Group, 2006.
Robbins, Jacob. 2018. “Capital Gains and the Distribution of Income in the United State.” PhD
thesis, Brown University.
Saez, Emmanuel. 2021. "Public Economics and Inequality: Uncovering our Social Nature",
American Economic Association, Papers and Proceedings, 111, 2021, 1-26
Saez, Emmanuel and Gabriel Zucman. 2016.“Wealth Inequality in the United States: Evidence
from Capitalized Income Tax Data,” Quarterly Journal of Economics 131(2), 519-578.
Saez, Emmanuel and Gabriel Zucman. 2019. The Triumph of Injustice: How the Rich Dodge
Taxes and How to Make them Pay, New York: W.W. Norton.
Saez, Emmanuel and Gabriel Zucman. 2020. “The Rise of Income and Wealth Inequality in
America: Evidence from Distributional Macroeconomic Accounts”, Journal of Economic
18
Perspectives 34(4), Fall 2020, 3-26.
United Nations. 2009. “System of National Accounts 2008,” European Communities,
International Monetary Fund, Organisation for Economic Co-operation and Development, United
Nations, and World Bank.
19
Figure 1: Top 1% US Pre-tax Income Share: Fiscal Income vs. National Income
This figure compares the share of fiscal income earned by the top 1 percent tax units in the United
States (from Piketty and Saez, 2003, updated; series including capital gains in income to compute
shares but not to define ranks, to smooth the lumpiness of realized capital gains) to the share of
pre-tax national income earned by the top 1 percent equal-split adults (from Piketty, Saez and
Zucman, 2018, updated September 2020, available on WID.world. This figure is reproduced from
Saez and Zucman (2020, Figure 3).
0%
5%
10%
15%
20%
19
10
19
20
19
30
19
40
19
50
19
60
19
70
19
80
19
90
20
00
20
10
20
20
Pre-tax national income
Fiscal income
20
Figure 2: Top 10% Pre-tax and Post-tax Income Share in France and the US
This figure depicts the share of total national income earned by the top 10 percent of adults (aged
20 and above) from 1910 to 2018 on a pre-tax basis and post-tax basis. Income within married
couples is equally split. Pre-tax income is before taxes and excluding government transfers. Post-
tax income is after subtracting all taxes and including all government transfers and spending. Series
for both countries follow the same distributional national account methodology (Blanchet et al.
2020). Source: Piketty, Saez, and Zucman (2018), September 2020 update for the United States.
Bozio et al. (2020) for France. This figure is reproduced from Saez (2021, Figure 1A).
20%
25%
30%
35%
40%
45%
50%1
91
0
19
20
19
30
19
40
19
50
19
60
19
70
19
80
19
90
20
00
20
10
20
20
France, post-tax
US pre-tax
US post-tax
France, pre-tax
21
Figure 3: The Top .00001% Wealth Share in the US using Rich Lists
This figure depicts the share of total household wealth owned by the richest .00001% US families
using the Forbes 400 Rich list for 1982-2021, the 1957 Fortune magazine Rich list, and the Forbes
rich list for 1918 (aged back to 1913 using overall US equity prices and using John D. Rockefeller
estimated wealth of $900 million in 1913). The top .0001% includes 3.8 families in 1913, and 18
families today. The denominator is total US household wealth from Piketty, Saez, and Zucman
(2018).
0.0%
0.2%
0.4%
0.6%
0.8%
1.0%
1.2%
1.4%1
91
0
19
20
19
30
19
40
19
50
19
60
19
70
19
80
19
90
20
00
20
10
20
20
July 1st, 2021