Embed Size (px)
Citation preview
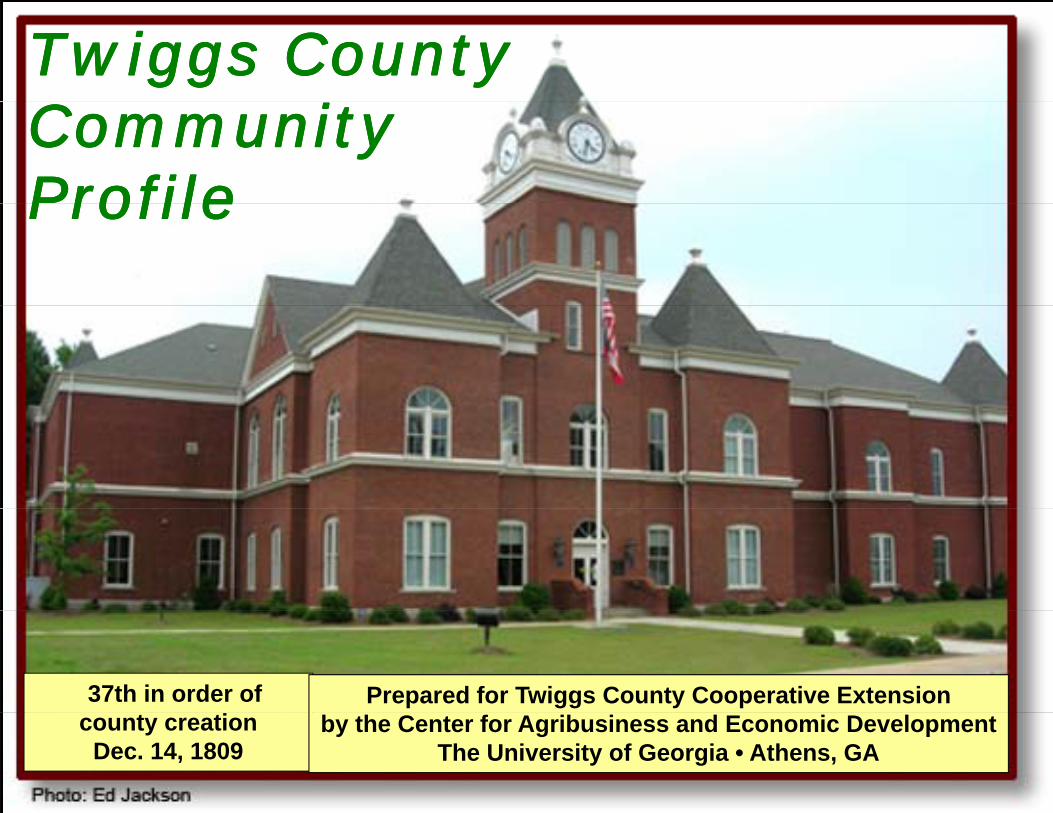
Twiggs CountyTwiggs CountyCommunityCommunityProfileProfileProfileProfile
37th in order of Prepared for Twiggs County Cooperative Extensioncounty creation
Dec. 14, 1809by the Center for Agribusiness and Economic Development
The University of Georgia • Athens, GA
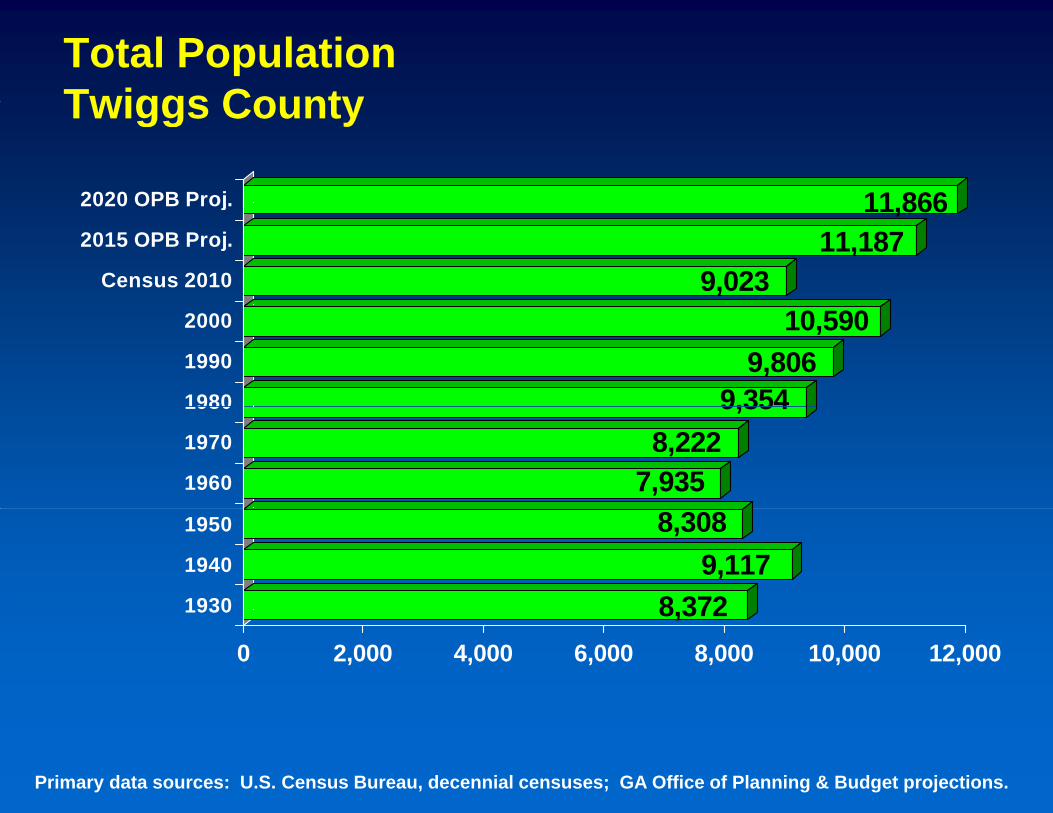
Total PopulationTwiggs County
11 8662020 OPB Proj.
Twiggs County
9,02311,187
11,866
Census 2010
2015 OPB Proj.
2020 OPB Proj.
9,3549,806
10,590
1980
1990
2000
7,9358,222
9,354
1960
1970
1980
8 3729,117
8,308
1930
1940
1950
8,3720 2,000 4,000 6,000 8,000 10,000 12,000
1930
Primary data sources: U.S. Census Bureau, decennial censuses; GA Office of Planning & Budget projections.
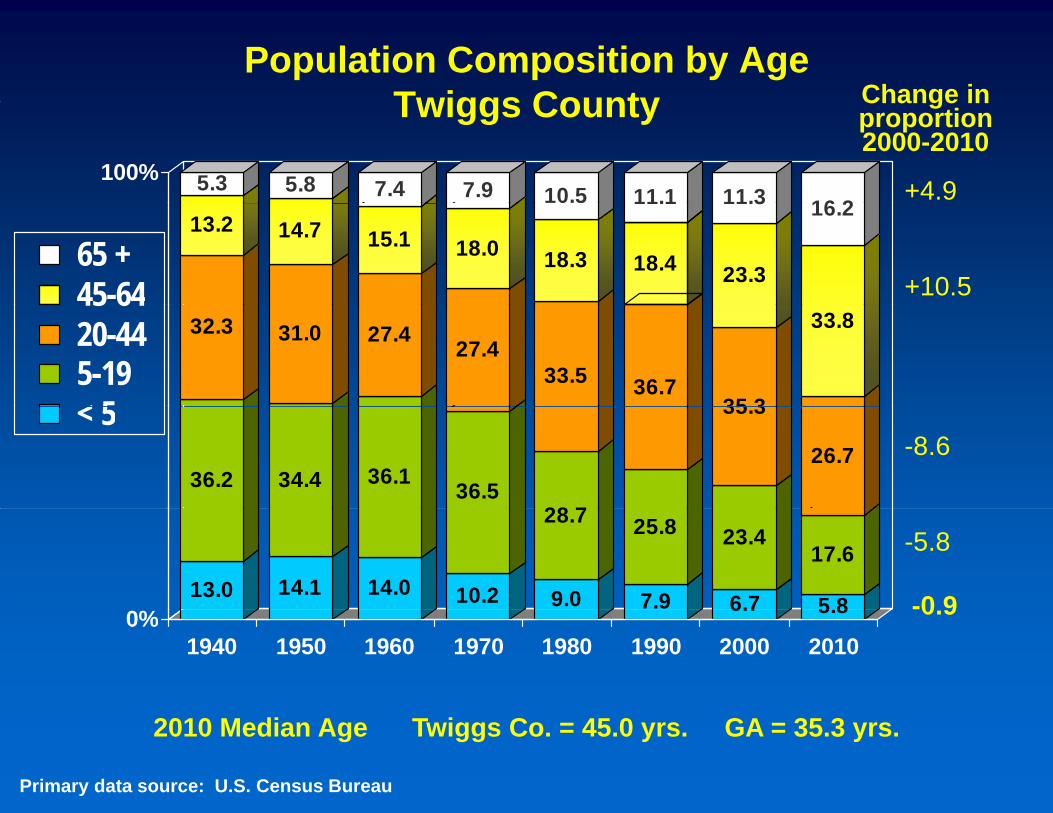
Population Composition by AgeTwiggs County Change inTwiggs County
5.3 5.8 7.4 7.9 10.5 11.1 11.3 16 2100%
+4.9
Change in proportion 2000-2010
13.2 14.7 15.1 18.0 18.3 18.4
11.1
23.3
11.3 16.2
65 + 45-64 +10.5
32.3 31.0 27.4 27.433.5 36.7
35 3
33.8 45 64 20-44 5-19 < 5
36.2 34.4 36.1 36.528 7
35.3
26.7
< 5-8.6
13.0 14.1 14.0 10.2 9.0
28.7
7.9
25.8
6.7
23.4
5.8
17.6
0%
-5.8
-0 96.7 5.80%1940 1950 1960 1970 1980 1990 2000 2010
0.9
2010 Median Age Twiggs Co. = 45.0 yrs. GA = 35.3 yrs.
Primary data source: U.S. Census Bureau
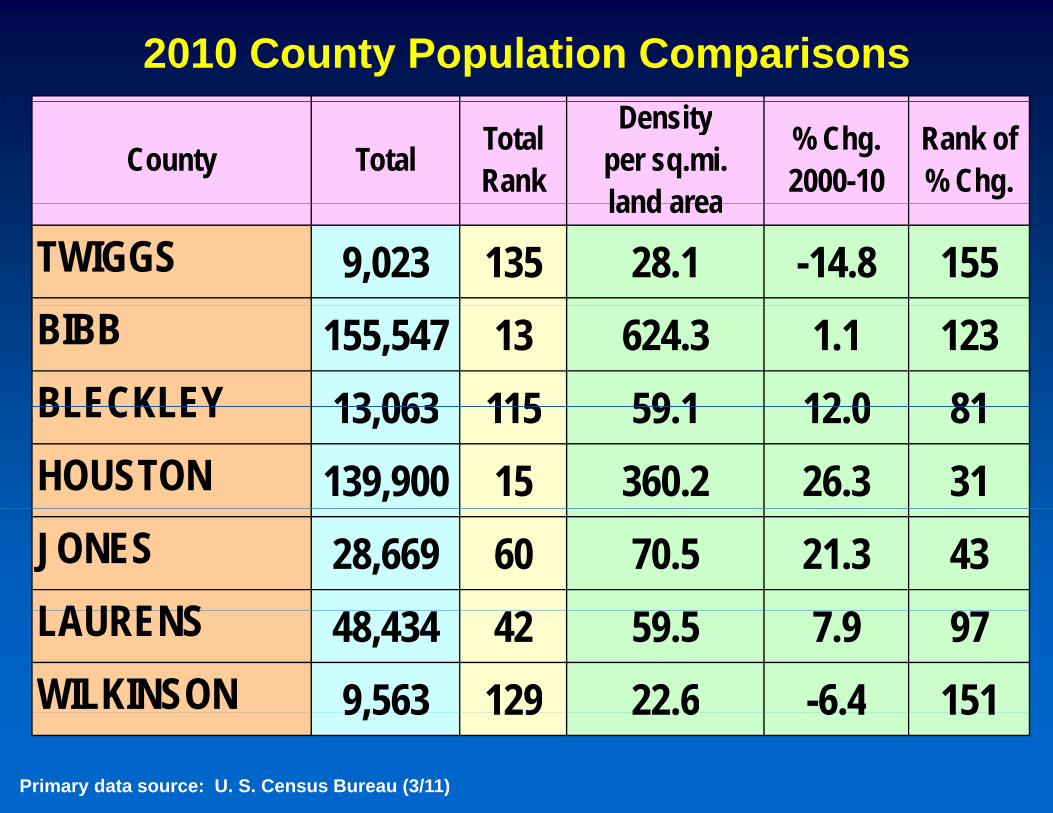
2010 County Population Comparisons
County Total TotalRank
Densityper sq.mi.land area
% Chg.2000-10
Rank of% Chg.land area
TWIGGS 9,023 135 28.1 -14.8 155BIBB 155,547 13 624.3 1.1 123BLECKLEY 13 063 115 59 1 12 0 81BLECKLEY 13,063 115 59.1 12.0 81HOUSTON 139,900 15 360.2 26.3 31JONES 28,669 60 70.5 21.3 43LAURENSLAURENS 48,434 42 59.5 7.9 97WILKINSON 9,563 129 22.6 -6.4 1519,563 129 22.6 6.4 151
Primary data source: U. S. Census Bureau (3/11)
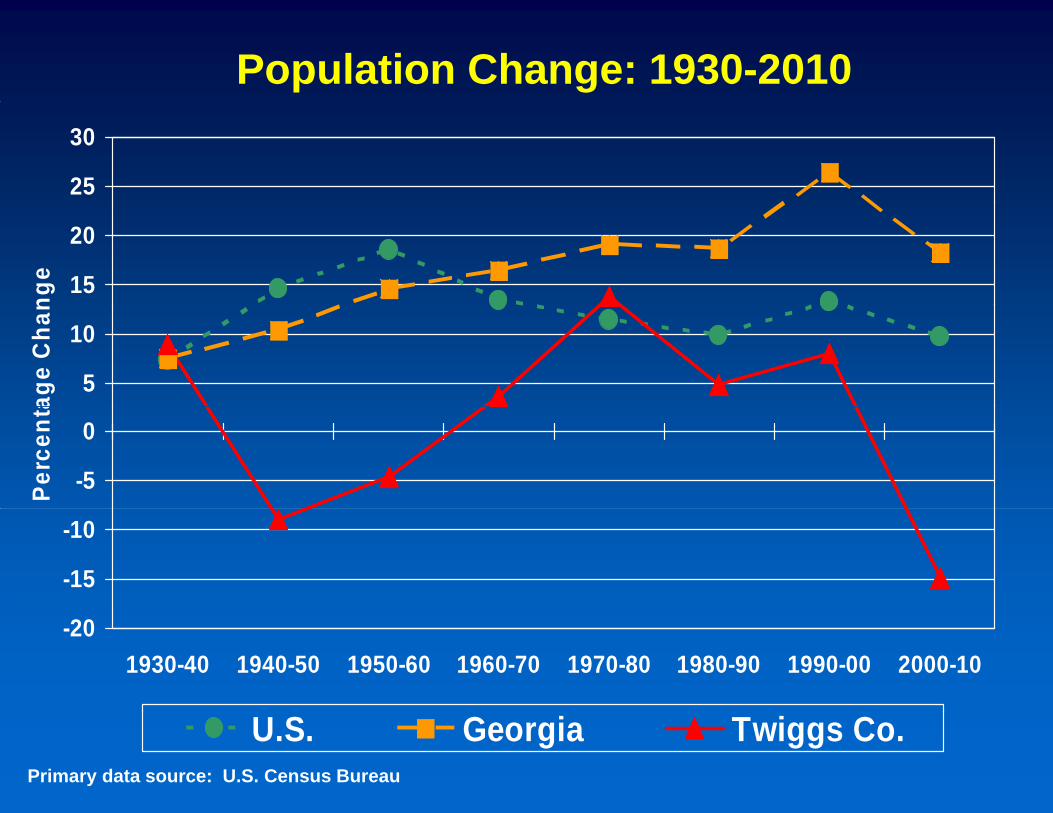
Population Change: 1930-2010
25
30
15
20
nge
5
10
age
Cha
n
-5
0
Perc
enta
-15
-10
-201930-40 1940-50 1950-60 1960-70 1970-80 1980-90 1990-00 2000-10
U.S. Georgia Twiggs Co.Primary data source: U.S. Census Bureau
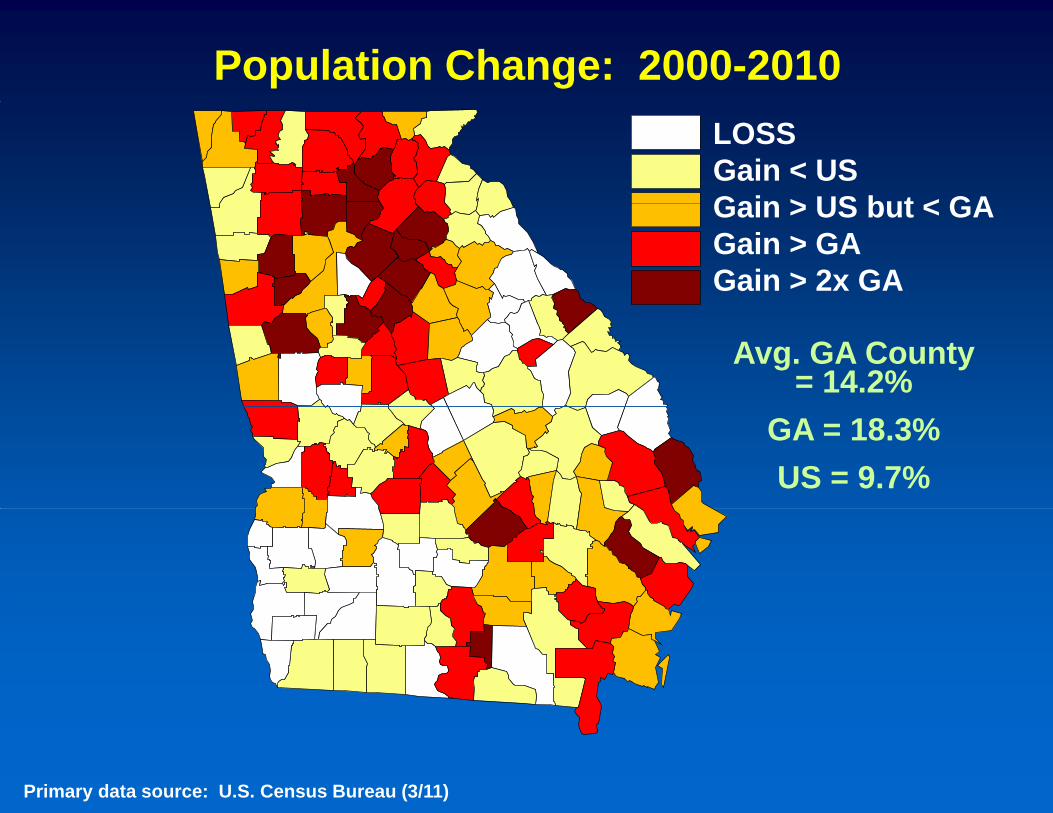
Population Change: 2000-2010LOSSGain < USGain > US but < GAGain > US but < GAGain > GAGain > 2x GA
Avg. GA County = 14.2%
GA = 18.3%US = 9.7%
Primary data source: U.S. Census Bureau (3/11)
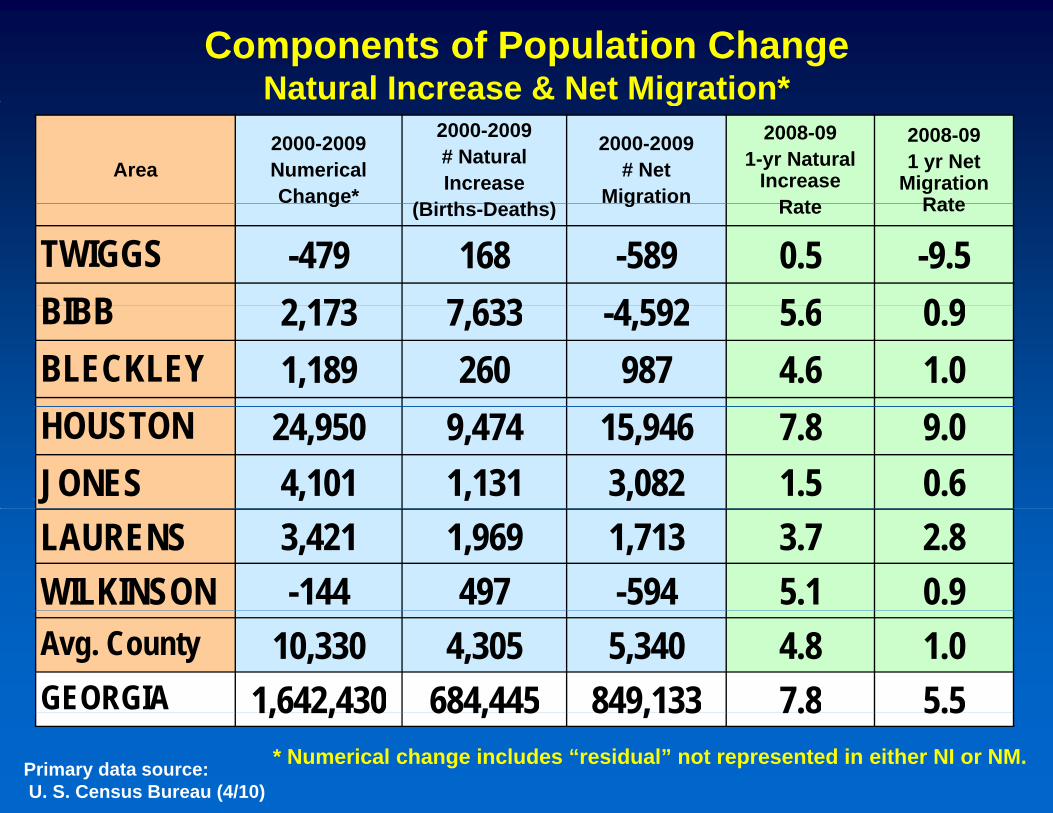
Components of Population ChangeNatural Increase & Net Migration*g
Area2000-2009NumericalChange*
2000-2009# NaturalIncrease
(Bi th D th )
2000-2009# Net
Migration
2008-091-yr Natural
IncreaseRate
2008-091 yr Net
Migration Rateg (Births-Deaths) g Rate Rate
TWIGGS -479 168 -589 0.5 -9.5BIBB 2 173 7 633 4 592 5 6 0 9BIBB 2,173 7,633 -4,592 5.6 0.9BLECKLEY 1,189 260 987 4.6 1.0HOUSTON 24,950 9,474 15,946 7.8 9.0JONES 4,101 1,131 3,082 1.5 0.6LAURENS 3,421 1,969 1,713 3.7 2.8WILKINSON -144 497 -594 5.1 0.9Avg. County 10,330 4,305 5,340 4.8 1.0GEORGIA 1,642,430 684,445 849,133 7.8 5.51,642,430 684,445 849,133 7.8 5.5
* Numerical change includes “residual” not represented in either NI or NM.Primary data source:U. S. Census Bureau (4/10)
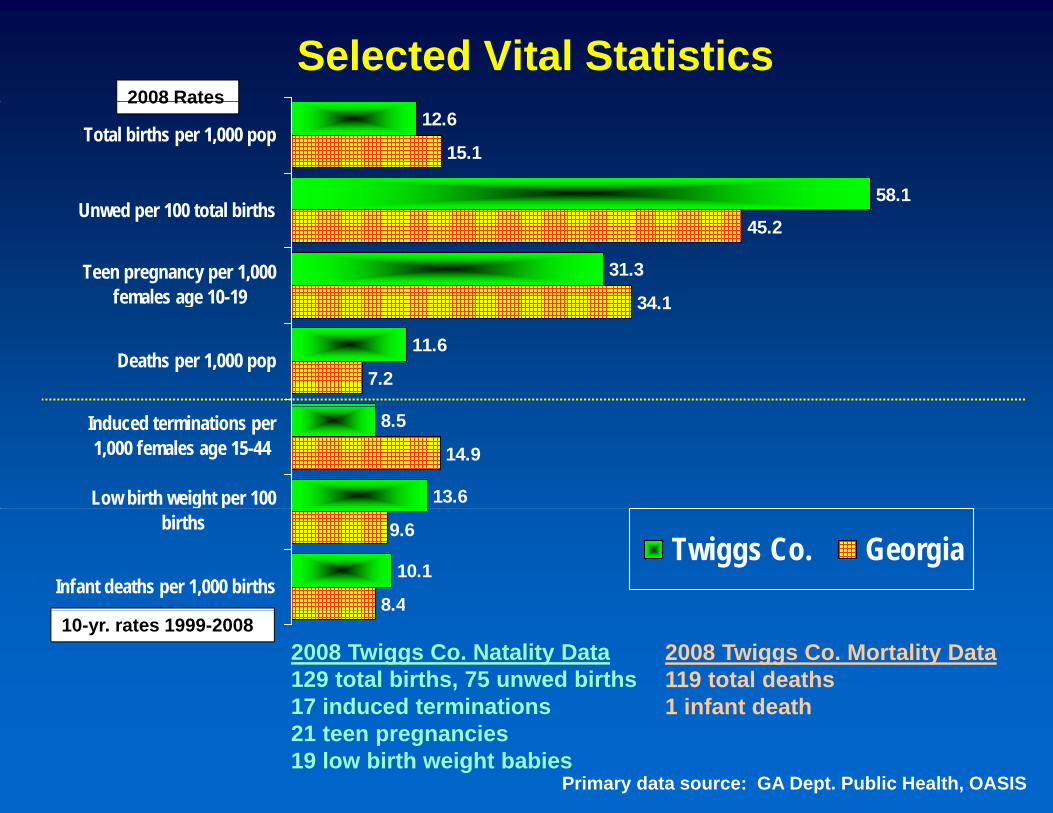
Selected Vital Statistics2008 Rates
12.6
15.1
58.1
Total births per 1,000 pop
U d 100 t t l bi th
2008 Rates
31.3
45.2
34 1
Unwed per 100 total births
Teen pregnancy per 1,000females age 10-19
11.6
34.1
7.2
g
Deaths per 1,000 pop
8.5
13.6
14.9Induced terminations per1,000 females age 15-44
Low birth weight per 100
10.1
8.4
9.6births
Infant deaths per 1,000 birthsTwiggs Co. Georgia
8.4
2008 Twiggs Co. Natality Data129 total births, 75 unwed births17 induced terminations
2008 Twiggs Co. Mortality Data119 total deaths1 infant death
10-yr. rates 1999-2008
17 induced terminations21 teen pregnancies19 low birth weight babies
1 infant death
Primary data source: GA Dept. Public Health, OASIS
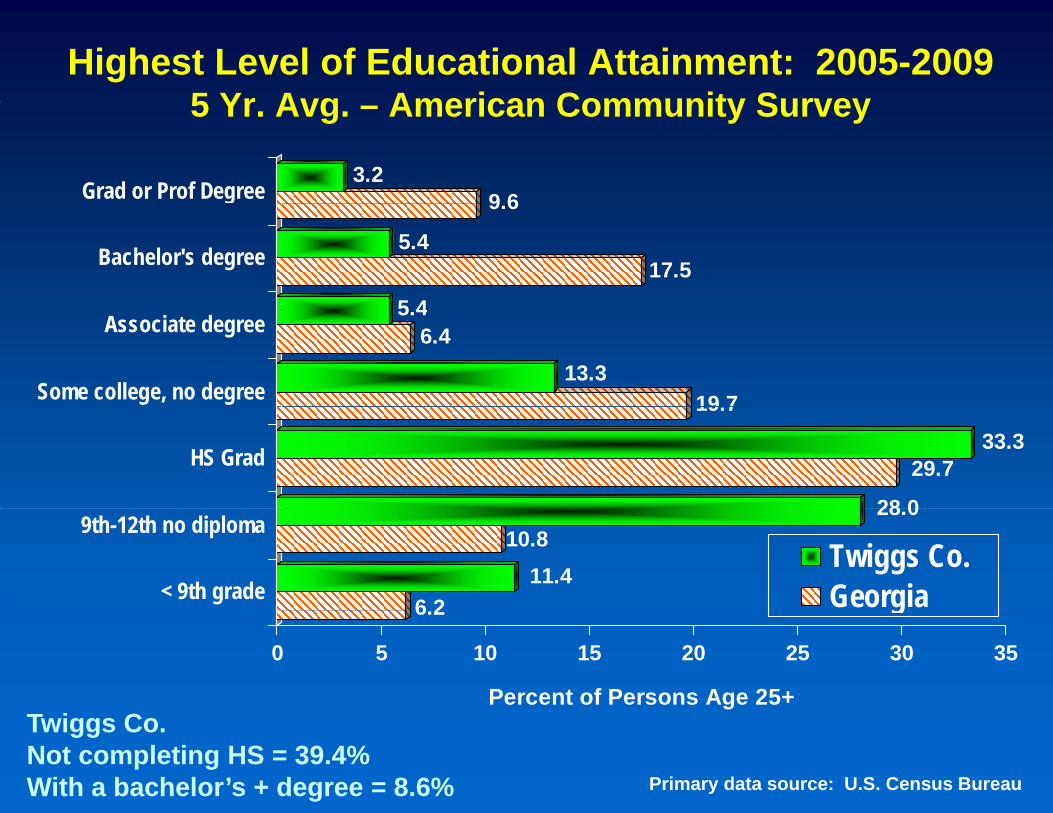
Highest Level of Educational Attainment: 2005-20095 Yr Avg American Community Survey
9 63.2
Grad or Prof Degree
5 Yr. Avg. – American Community Survey
5 4
17.55.4
9.6
Bachelor's degree
19 713.3
6.45.4
Some college, no degree
Associate degree
28 0
29.733.3
19.7
HS Grad
6 211.4
10.828.0
< 9th grade
9th-12th no diplomaTwiggs Co.Georgia6.2
0 5 10 15 20 25 30 35
Percent of Persons Age 25+
g
Primary data source: U.S. Census Bureau
Twiggs Co. Not completing HS = 39.4%With a bachelor’s + degree = 8.6%
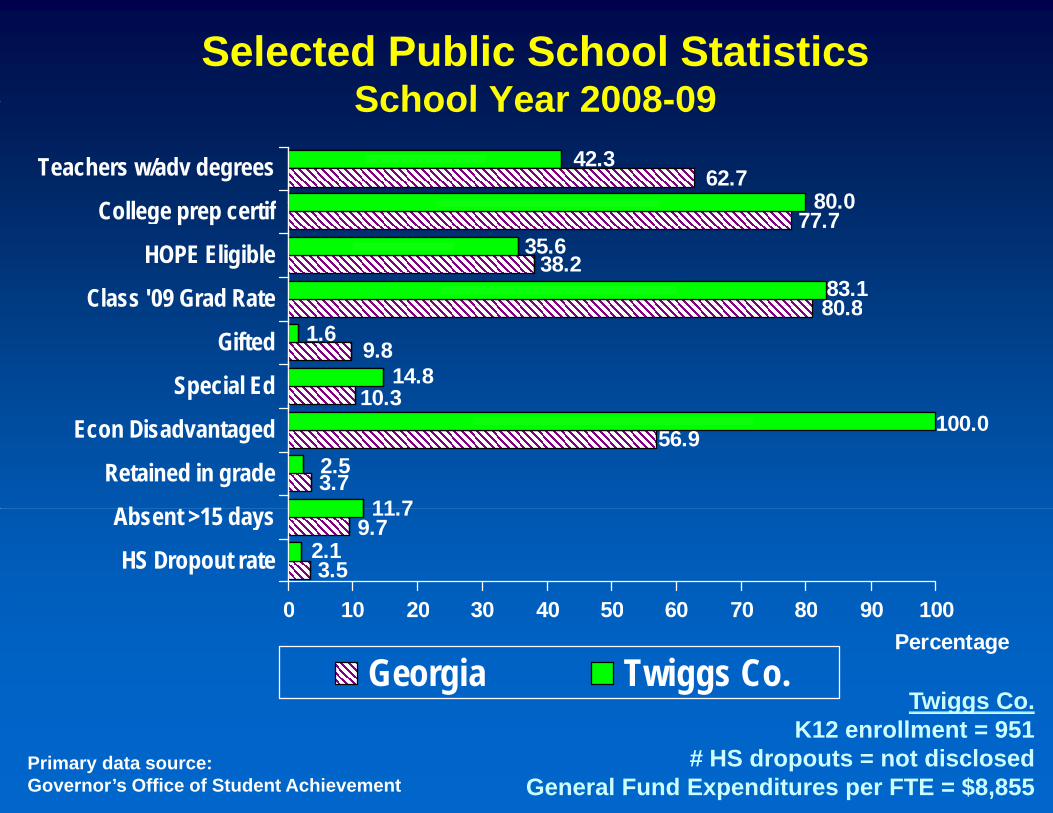
Selected Public School StatisticsSchool Year 2008-09
80 062.7
42.3
C ll tif
Teachers w/adv degrees
School Year 2008-09
80 883.1
38.235.6
77.780.0
Class '09 Grad Rate
HOPE Eligible
College prep certif
10.314.8
9.81.6
80.8
Special Ed
Gifted
Class 09 Grad Rate
11 73.72.5
56.9100.0
Ab t 15 d
Retained in grade
Econ Disadvantaged
3.52.1
9.711.7
0 10 20 30 40 50 60 70 80 90 100
HS Dropout rate
Absent >15 days
0 10 20 30 40 50 60 70 80 90 100Percentage
Georgia Twiggs Co.Twiggs Co.
Primary data source:Governor’s Office of Student Achievement
ggK12 enrollment = 951
# HS dropouts = not disclosedGeneral Fund Expenditures per FTE = $8,855
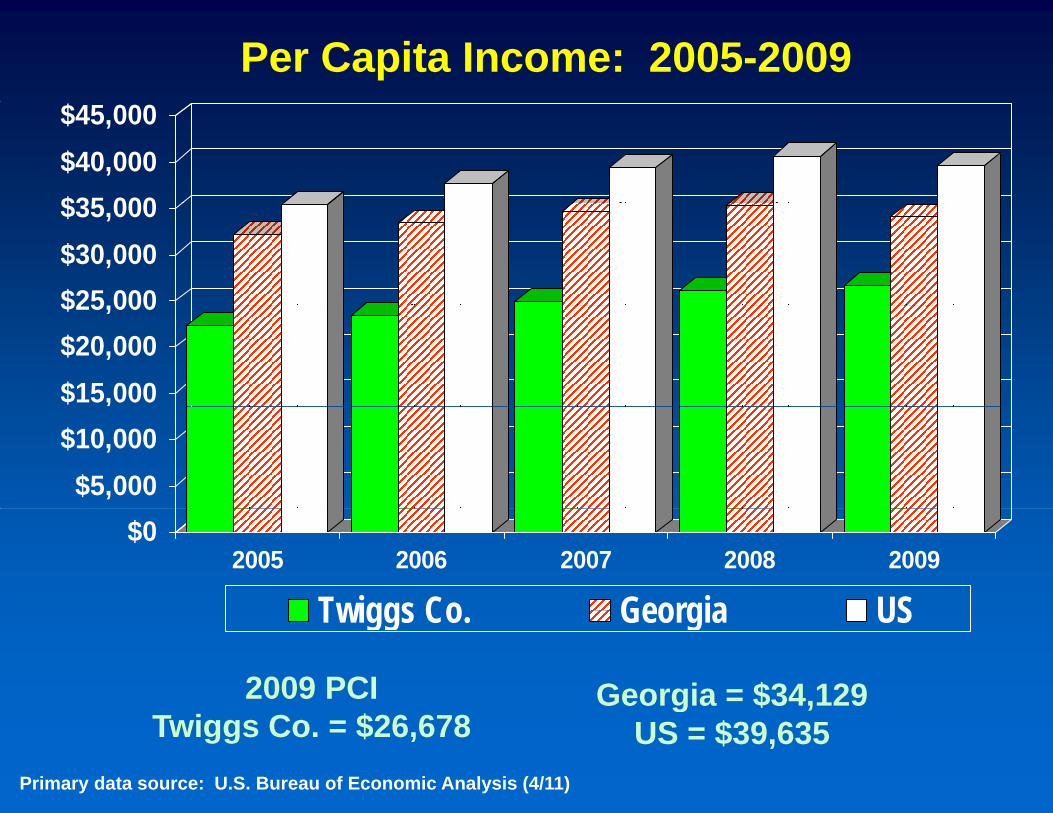
Per Capita Income: 2005-2009
$35 000$40,000$45,000
$25 000$30,000$35,000
$15,000$20,000$25,000
$5,000$10,000
$02005 2006 2007 2008 2009
Twiggs Co Georgia US
2009 PCI Georgia = $34,129
Twiggs Co. Georgia US
Primary data source: U.S. Bureau of Economic Analysis (4/11)
Twiggs Co. = $26,678g
US = $39,635
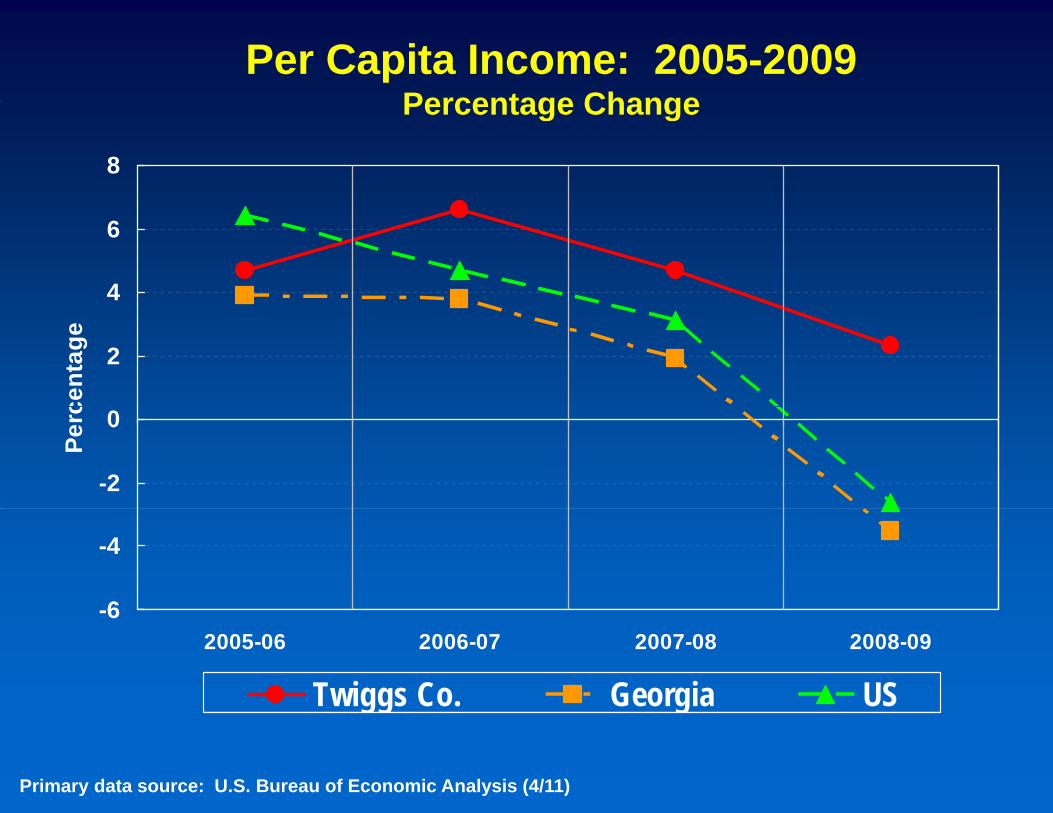
Per Capita Income: 2005-2009Percentage ChangePercentage Change
8
4
6
2
cent
age
-2
0
Perc
-6
-4
-62005-06 2006-07 2007-08 2008-09
Twiggs Co. Georgia USgg g
Primary data source: U.S. Bureau of Economic Analysis (4/11)
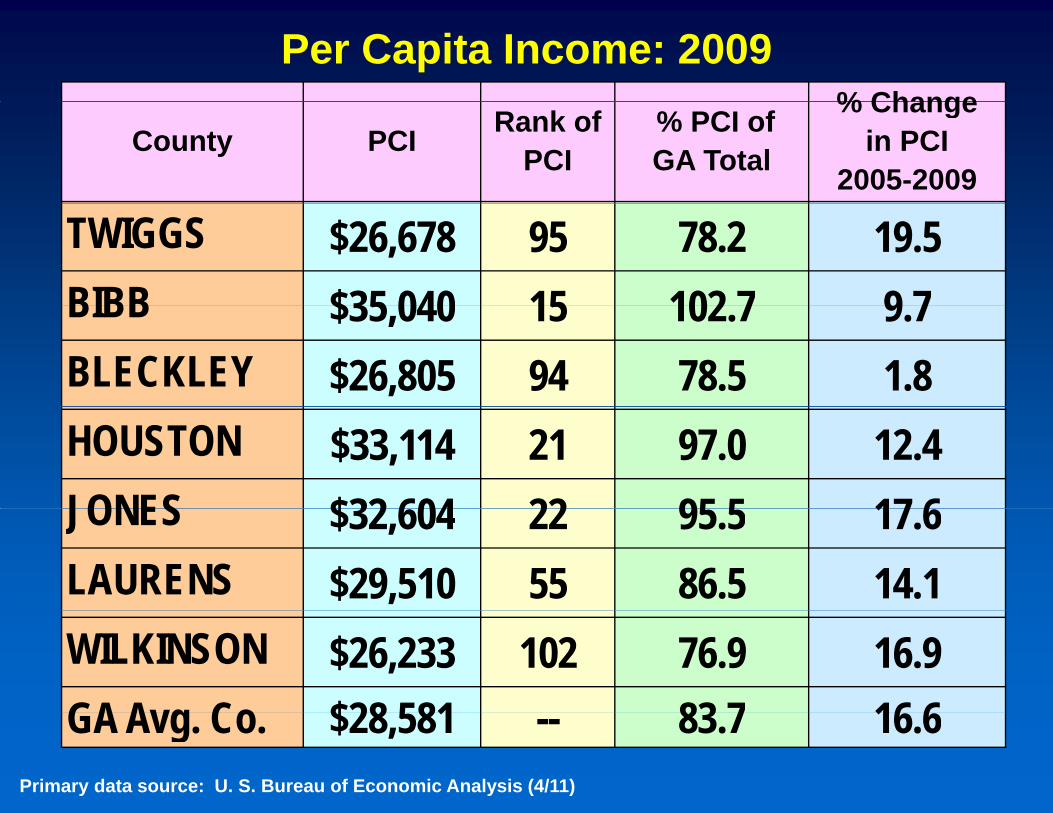
Per Capita Income: 2009% Change
County PCI Rank ofPCI
% PCI ofGA Total
% Changein PCI
2005-2009
TWIGGS $26,678 95 78.2 19.5BIBB $35 040 15 102 7 9 7BIBB $35,040 15 102.7 9.7BLECKLEY $26,805 94 78.5 1.8HOUSTON $33,114 21 97.0 12.4JONES $32 604 22 95 5 17 6JONES $32,604 22 95.5 17.6LAURENS $29,510 55 86.5 14.1WILKINSON $26,233 102 76.9 16.9GA Avg Co $28 581 83 7 16 6GA Avg. Co. $28,581 -- 83.7 16.6
Primary data source: U. S. Bureau of Economic Analysis (4/11)
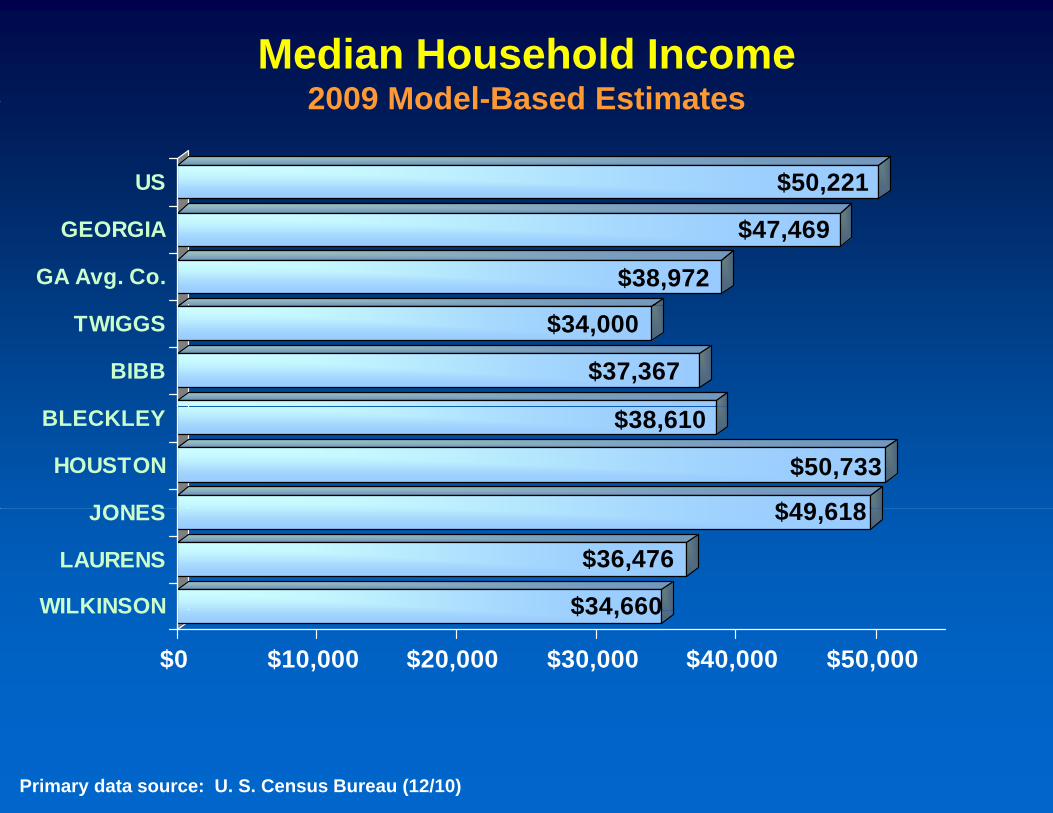
Median Household Income2009 Model-Based Estimates
$50,221US
2009 Model-Based Estimates
$38,972
$47,469GEORGIA
GA Avg. Co.
$37,367
$34,000TWIGGS
BIBB
$49 618
$50,733
$38,610BLECKLEY
HOUSTON
JONES
$34 660
$36,476
$49,618JONES
LAURENS
WILKINSON $34,660
$0 $10,000 $20,000 $30,000 $40,000 $50,000
WILKINSON
Primary data source: U. S. Census Bureau (12/10)
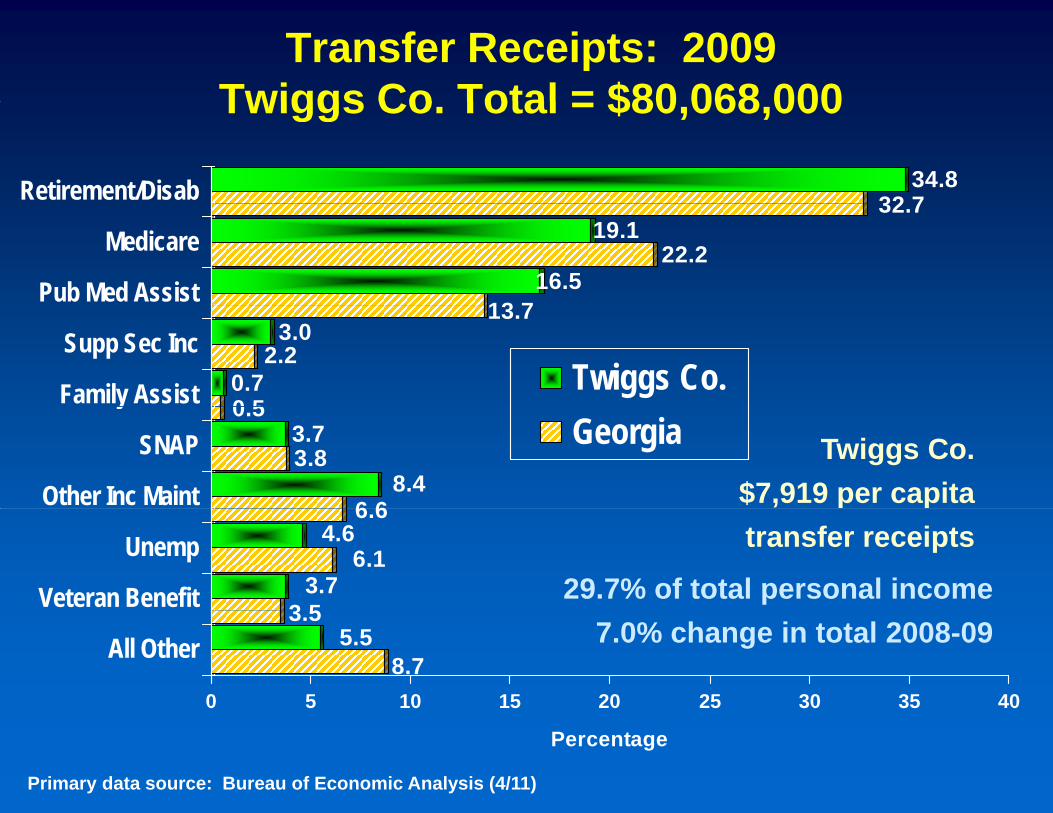
Transfer Receipts: 2009Twiggs Co Total = $80 068 000
32 734.8Retirement/Disab
Twiggs Co. Total = $80,068,000
13 716.5
22.219.1
32.7
Pub Med Assist
Medicare
0 50.7
2.23.0
13.7
Family Assist
Supp Sec IncTwiggs Co.
6 68.4
3.83.7
0.5
Other Inc Maint
SNAP
yGeorgia Twiggs Co.
$7,919 per capita
3 53.7
6.14.6
6.6
Veteran Benefit
Unemp transfer receipts
29.7% of total personal income
8.75.5
3.5
0 5 10 15 20 25 30 35 40
All Other 7.0% change in total 2008-09
Percentage
Primary data source: Bureau of Economic Analysis (4/11)
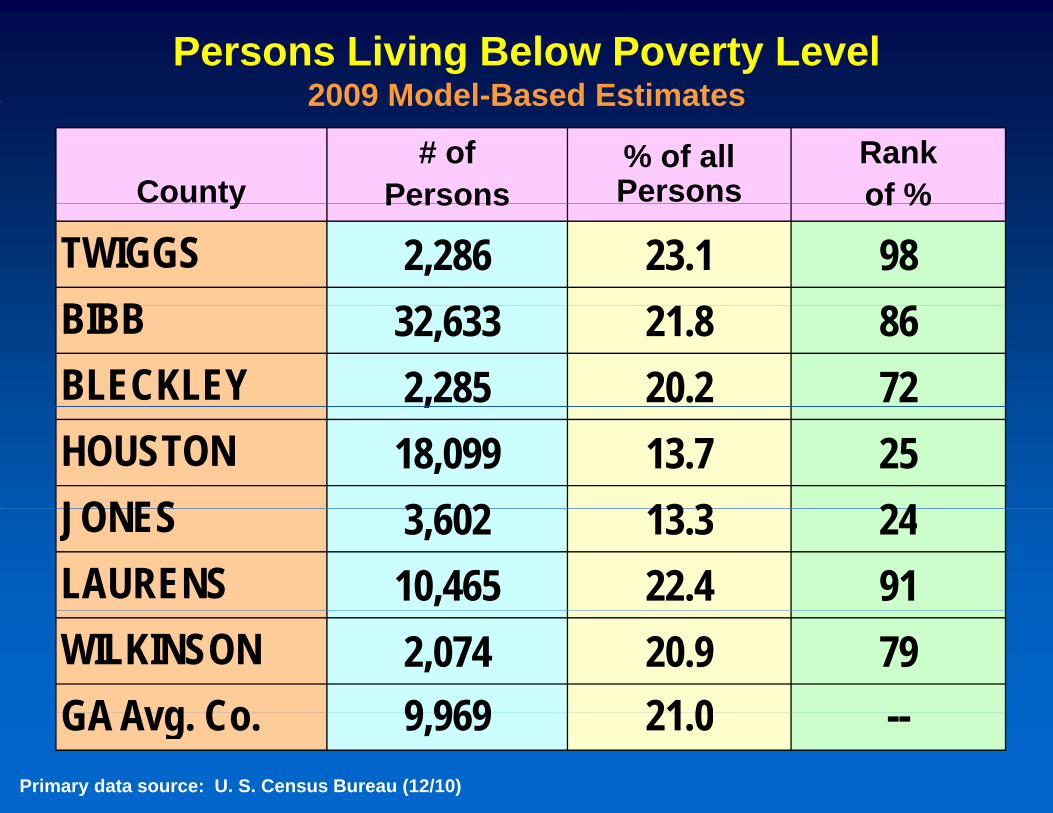
Persons Living Below Poverty Level2009 Model-Based Estimates2009 Model Based Estimates
County# of
Persons% of all Persons
Rankof %y Persons of %
TWIGGS 2,286 23.1 98BIBBBIBB 32,633 21.8 86BLECKLEY 2,285 20.2 72,HOUSTON 18,099 13.7 25JONES 3 602 13 3 24JONES 3,602 13.3 24LAURENS 10,465 22.4 91WILKINSON 2,074 20.9 79GA Avg Co 9 969 21 0GA Avg. Co. 9,969 21.0 --
Primary data source: U. S. Census Bureau (12/10)
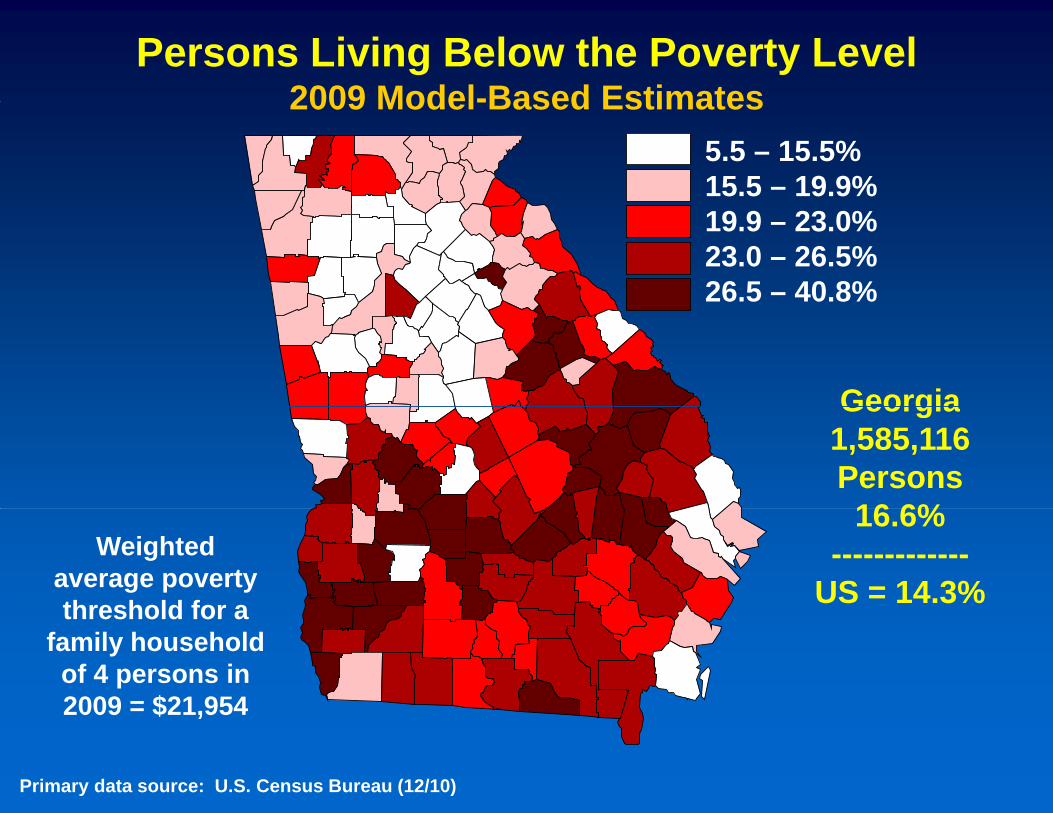
Persons Living Below the Poverty Level2009 Model-Based Estimates2009 Model-Based Estimates
5.5 – 15.5%15.5 – 19.9%19.9 – 23.0%23.0 – 26.5%26.5 – 40.8%
GeorgiaGeorgia1,585,116Persons16 6%16.6%
-------------US = 14.3%
Weighted average poverty threshold for athreshold for a
family household of 4 persons in 2009 = $21,954
Primary data source: U.S. Census Bureau (12/10)
2009 $21,954
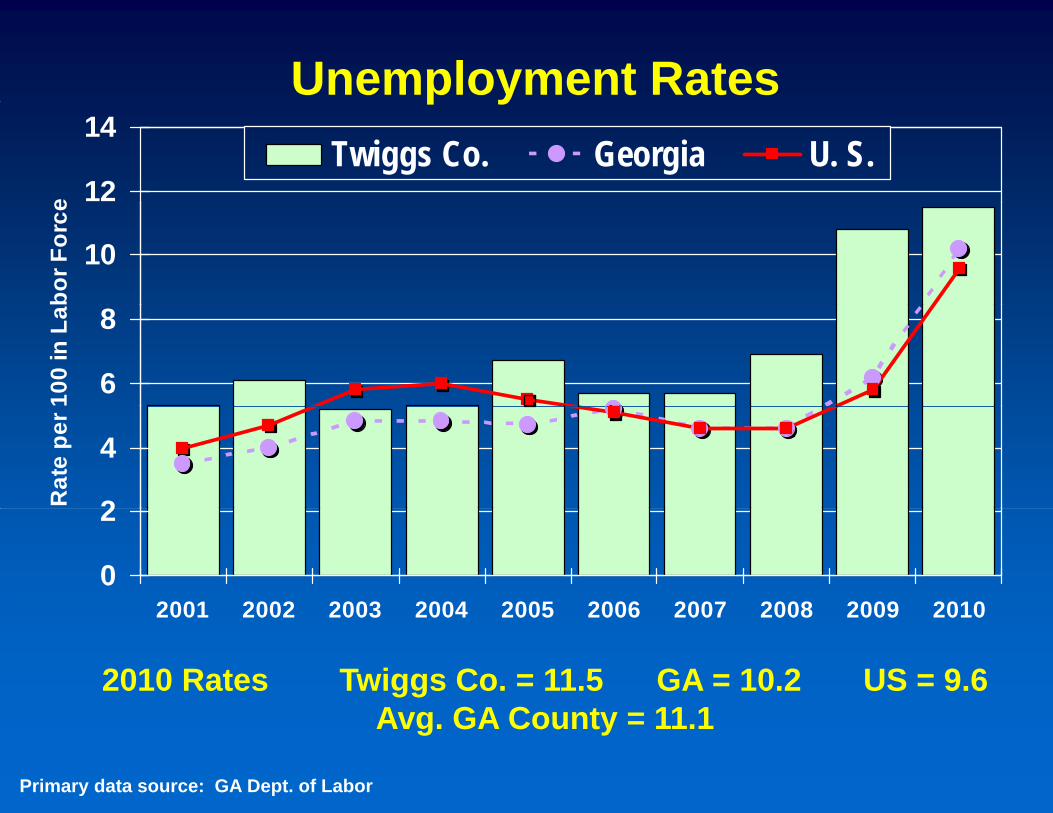
Unemployment Ratesp y
12
14
e
Twiggs Co. Georgia U. S.
10
bor F
orce
6
8
100
in L
a
2
4
Rat
e pe
r
0
2
2001 2002 2003 2004 2005 2006 2007 2008 2009 20102001 2002 2003 2004 2005 2006 2007 2008 2009 2010
2010 Rates Twiggs Co. = 11.5 GA = 10.2 US = 9.6A g GA Co nt 11 1Avg. GA County = 11.1
Primary data source: GA Dept. of Labor
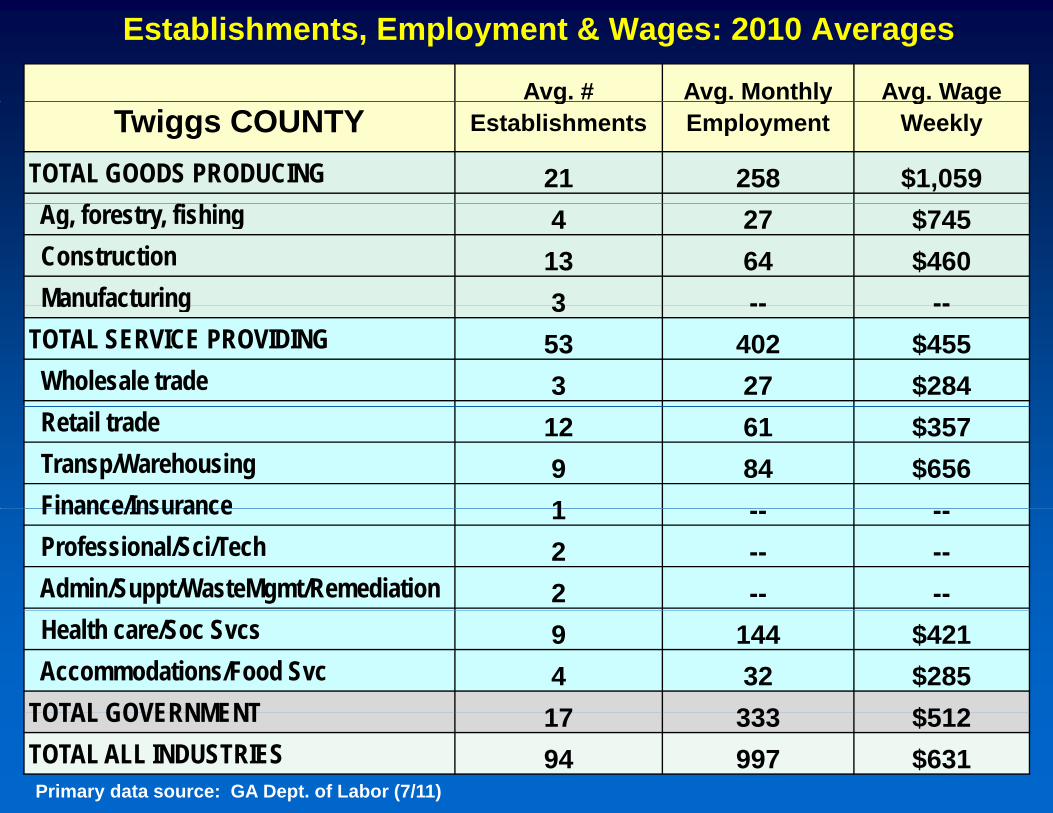
Establishments, Employment & Wages: 2010 Averages
Avg. # Avg. Monthly Avg. WageTwiggs COUNTY
gEstablishments
g yEmployment
g gWeekly
TOTAL GOODS PRODUCING 21 258 $1,059Ag, forestry, fishing 4 27 $745Construction 13 64 $460Manufacturing 3 -- --Manufacturing 3 -- --
TOTAL SERVICE PROVIDING 53 402 $455Wholesale trade 3 27 $284Retail trade 12 61 $357Transp/Warehousing 9 84 $656Finance/Insurance 1Finance/Insurance 1 -- --Professional/Sci/Tech 2 -- --Admin/Suppt/WasteMgmt/Remediation 2 -- --Health care/Soc Svcs 9 144 $421Accommodations/Food Svc 4 32 $285
TOTAL GOVERNMENT 17 333 $512TOTAL GOVERNMENT 17 333 $512TOTAL ALL INDUSTRIES 94 997 $631Primary data source: GA Dept. of Labor (7/11)
Employment Comparisons by Industry Group: 2010
T i C A GA C t G i
25.9
Twiggs Co. Avg. GA County Georgia
21.9Goods Producing
13.9
40.3
50.7
68 0
Service Providing
33.4
68.0
27.3
17 8
Government
17.8
Primary data source: GA Dept. of Labor (7/11)
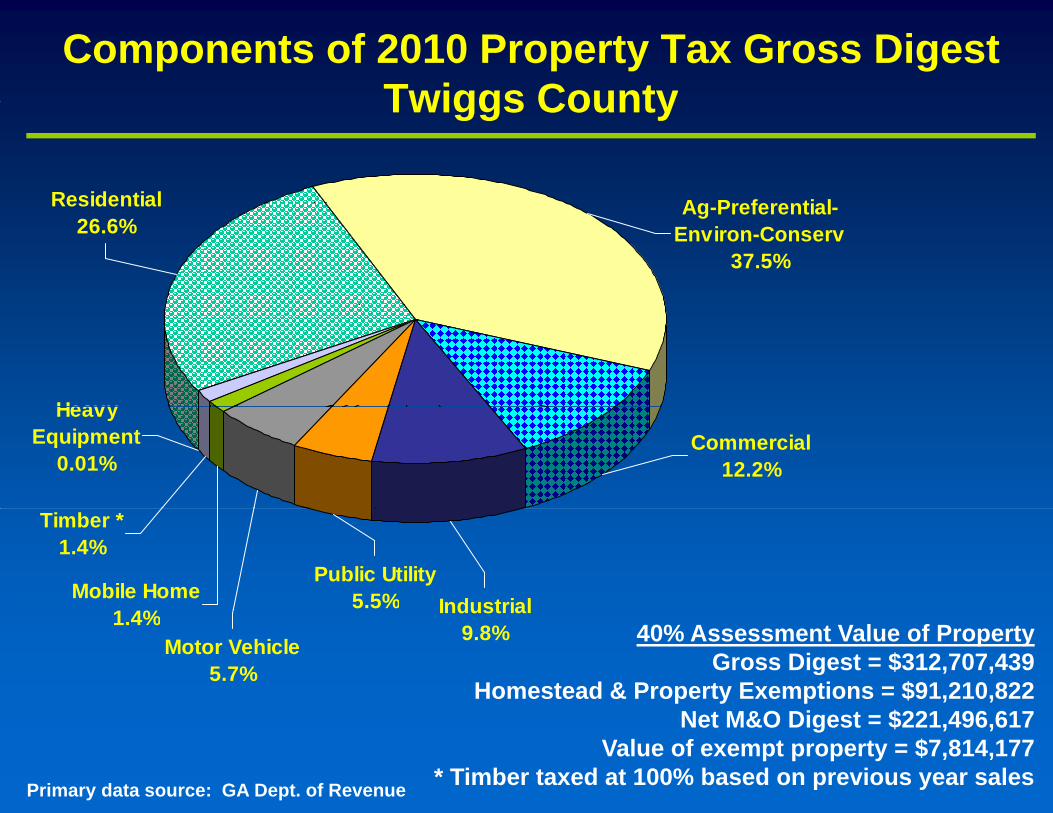
Components of 2010 Property Tax Gross DigestTwiggs County
Ag PreferentialResidential
Twiggs County
Ag-Preferential-Environ-Conserv
37.5%
Residential26.6%
HeavyCommercial
12.2%
Heavy Equipment
0.01%
Mobile Home1 4%
Public Utility5.5% Industrial
Timber *1.4%
1.4%Motor Vehicle
5.7%
Industrial9.8% 40% Assessment Value of Property
Gross Digest = $312,707,439Homestead & Property Exemptions = $91,210,822
N t M&O Di t $221 496 617Net M&O Digest = $221,496,617Value of exempt property = $7,814,177
* Timber taxed at 100% based on previous year salesPrimary data source: GA Dept. of Revenue
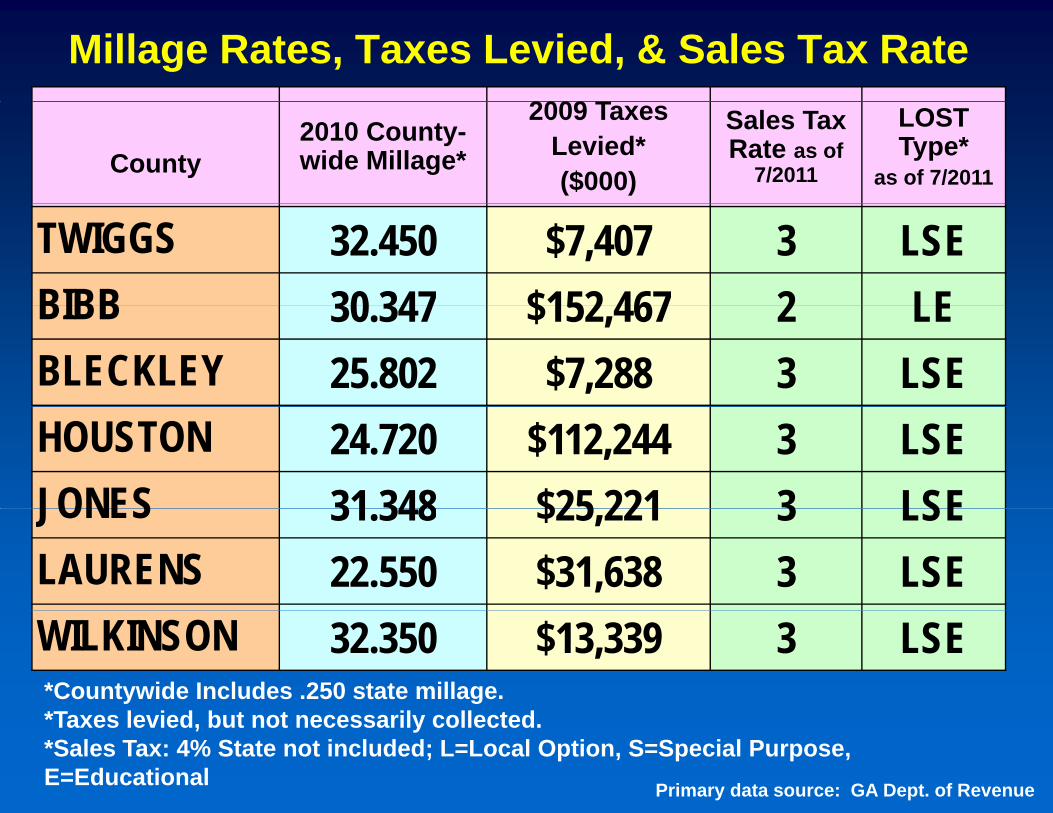
Millage Rates, Taxes Levied, & Sales Tax Rate2009 T
County2010 County-wide Millage*
2009 TaxesLevied*($000)
Sales Tax Rate as of
7/2011
LOST Type*
as of 7/2011
TWIGGS 32.450 $7,407 3 LSEBIBB 30 347 $152 467 2 LEBIBB 30.347 $152,467 2 LEBLECKLEY 25.802 $7,288 3 LSEHOUSTON 24.720 $112,244 3 LSEJONES 31 348 $25 221 3 LSEJONES 31.348 $25,221 3 LSELAURENS 22.550 $31,638 3 LSEWILKINSON 32.350 $13,339 3 LSE*Countywide Includes .250 state millage. *T l i d b t t il ll t d
Primary data source: GA Dept. of Revenue
*Taxes levied, but not necessarily collected. *Sales Tax: 4% State not included; L=Local Option, S=Special Purpose, E=Educational
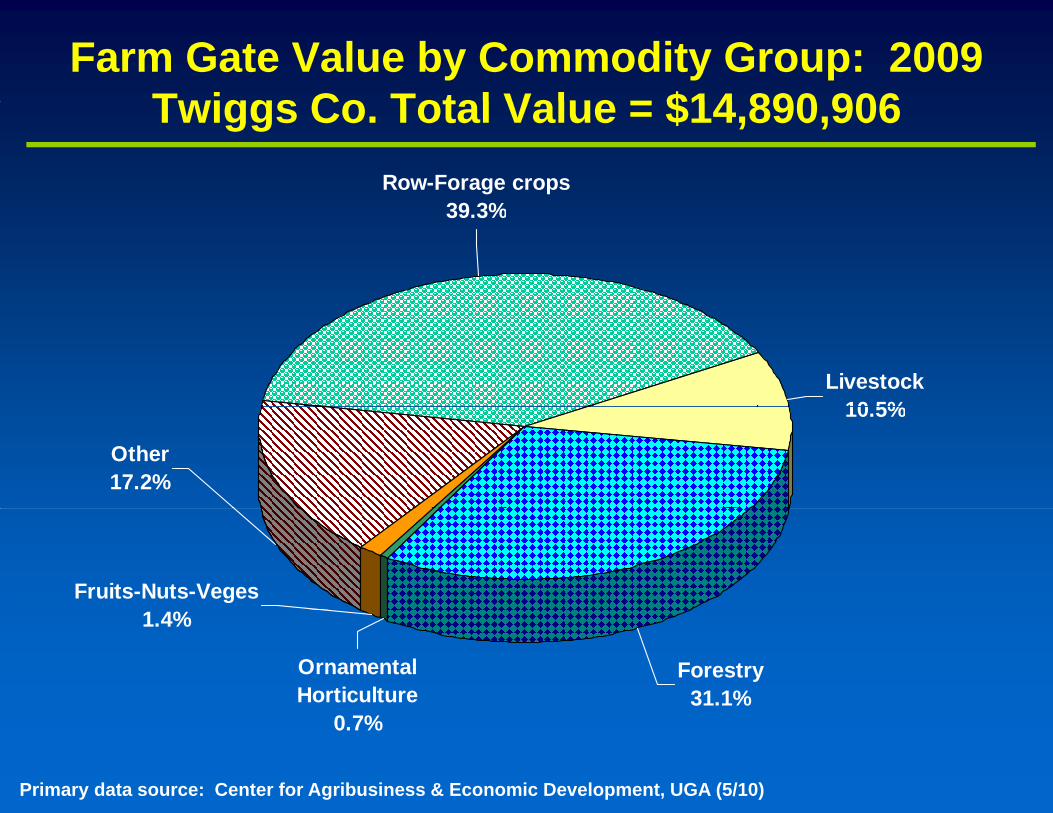
Farm Gate Value by Commodity Group: 2009Twiggs Co Total Value = $14 890 906Twiggs Co. Total Value = $14,890,906
Row-Forage crops39 3%39.3%
Livestock10 5%
Other17.2%
10.5%
Fruits-Nuts-Veges1.4%
Ornamental Horticulture
Forestry31.1%
0.7%
Primary data source: Center for Agribusiness & Economic Development, UGA (5/10)
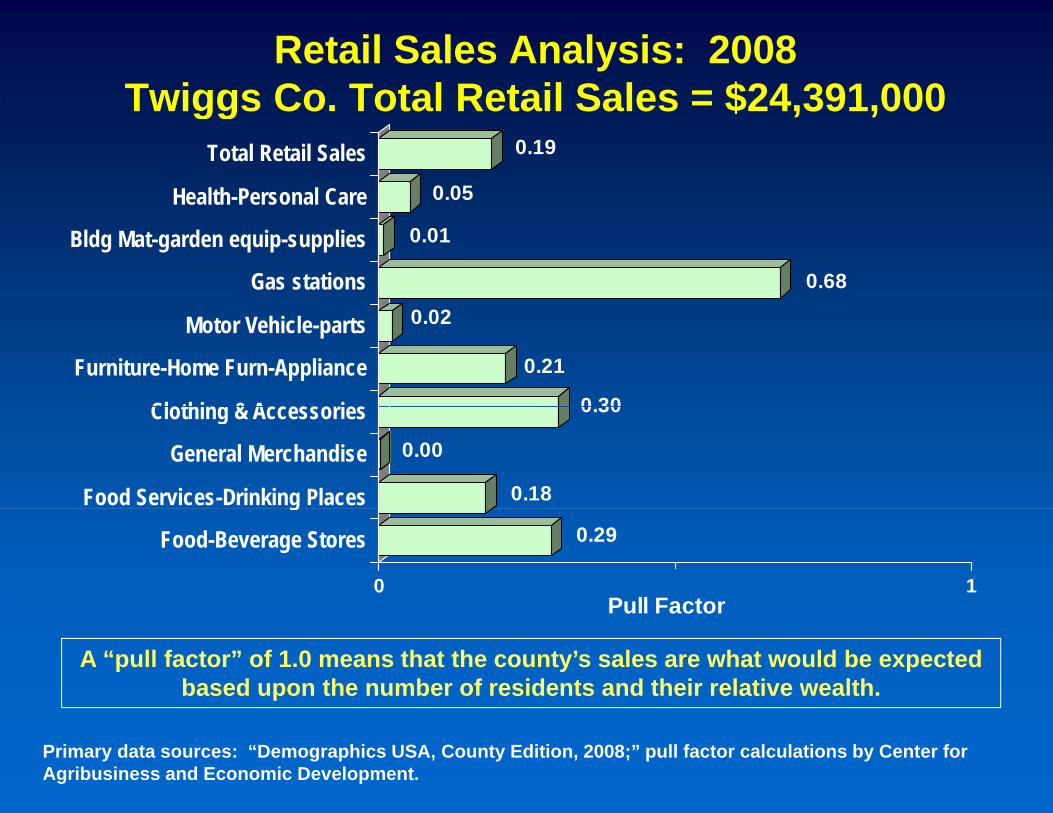
Retail Sales Analysis: 2008Twiggs Co Total Retail Sales = $24 391 000
0.05
0.19
Health-Personal Care
Total Retail Sales
Twiggs Co. Total Retail Sales = $24,391,000
0.68
0.01
Gas stations
Bldg Mat-garden equip-supplies
Health Personal Care
0 30
0.21
0.02
Cl thi & A i
Furniture-Home Furn-Appliance
Motor Vehicle-parts
0.18
0.00
0.30
Food Services-Drinking Places
General Merchandise
Clothing & Accessories
0.29
0 1Pull Factor
Food-Beverage Stores
g
Pull Factor
A “pull factor” of 1.0 means that the county’s sales are what would be expectedbased upon the number of residents and their relative wealth.
Primary data sources: “Demographics USA, County Edition, 2008;” pull factor calculations by Center for Agribusiness and Economic Development.
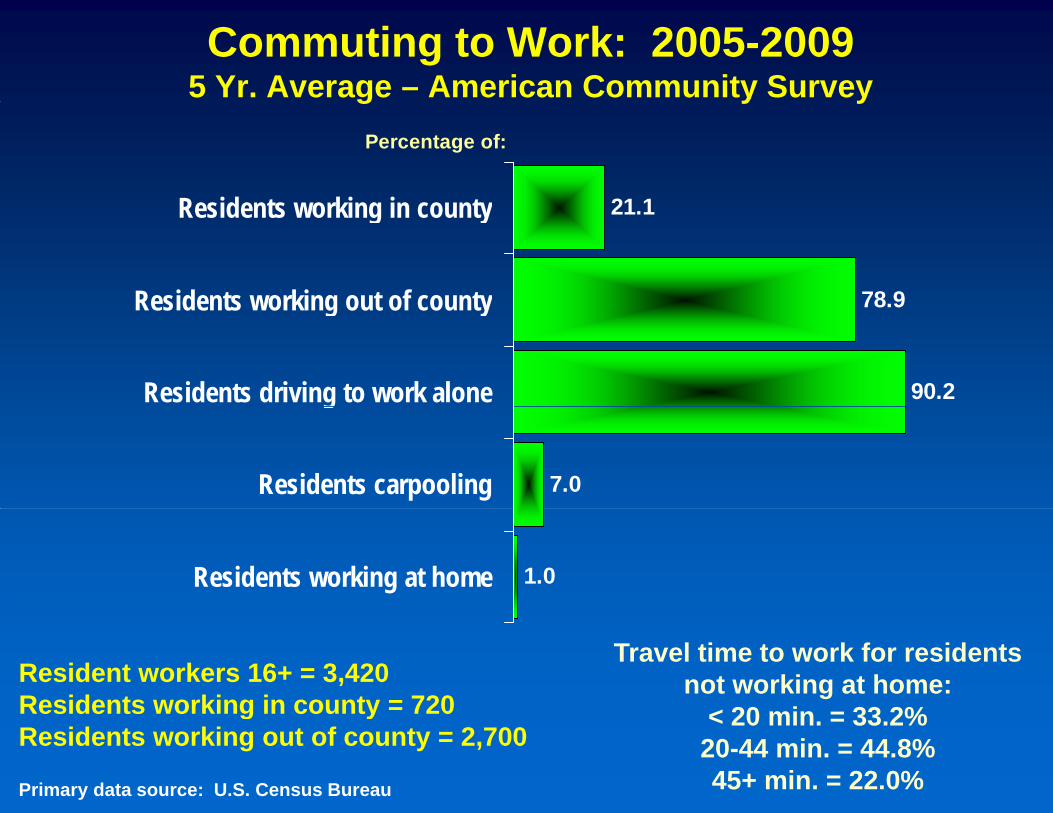
Commuting to Work: 2005-20095 Yr. Average – American Community Survey
21 1Residents working in county
Percentage of:
g y y
21.1
78.9
Residents working in county
Residents working out of county
90.2
78.9Residents working out of county
Residents driving to work alone
7.0
g
Residents carpooling
1.0Residents working at home
Resident workers 16+ = 3,420Residents working in county = 720
Travel time to work for residentsnot working at home:
< 20 min = 33 2%Residents working in county 720Residents working out of county = 2,700
Primary data source: U.S. Census Bureau
< 20 min. = 33.2%20-44 min. = 44.8%45+ min. = 22.0%
This study was developed to assist community leadership with their y p
future planning and decision making.
Special Area Report
P d f T i C t C ti E t i
p pSeptember 2011
Prepared for Twiggs County Cooperative Extensionby Susan R. Boatright
Center for Agribusiness and Economic DevelopmentCenter for Agribusiness and Economic DevelopmentCollege of Agricultural and Environmental Sciences
The University of Georgia • Athens GAThe University of Georgia • Athens, GAGeorgia Cooperative Extension
706-542-0760 • 706-542-8938706-542-0760 • 706-542-8938To learn more about your county, click on
“Georgia Statistics System” at our website:Georgia Statistics System at our website:www.caed.uga.edu