Embed Size (px)
Citation preview

Tilburg University
Two cases in high reliability organizing
van den Eede, G.G.P.
Publication date:2009
Link to publication in Tilburg University Research Portal
Citation for published version (APA):van den Eede, G. G. P. (2009). Two cases in high reliability organizing: A hermeneutic reconceptualization.CentER, Center for Economic Research.
General rightsCopyright and moral rights for the publications made accessible in the public portal are retained by the authors and/or other copyright ownersand it is a condition of accessing publications that users recognise and abide by the legal requirements associated with these rights.
• Users may download and print one copy of any publication from the public portal for the purpose of private study or research. • You may not further distribute the material or use it for any profit-making activity or commercial gain • You may freely distribute the URL identifying the publication in the public portal
Take down policyIf you believe that this document breaches copyright please contact us providing details, and we will remove access to the work immediatelyand investigate your claim.
Download date: 31. Jan. 2022

Two Cases in High Reliability Organizing:
a Hermeneutic Reconceptualization
GERD VAN DEN EEDE

ii Two Cases in High Reliability Organizing: a Hermeneutic Reconceptualization

iii
Two Cases in High Reliability Organizing:
a Hermeneutic Reconceptualization
Twee Gevalsstudies over Organiseren voor Hoge Betrouwbaarheid:
Een Hermeneutische Reconceptualisatie
PROEFSCHRIFT
ter verkrijging van de graad van doctor aan de Universiteit van Tilburg, op gezag van de rector
magnificus, prof. dr. Ph. Eijlander, in het openbaar te verdedigen ten overstaan van een door het
college voor promoties aangewezen commissie in de aula van de Universiteit op vrijdag 18
december 2009 om 14.15 uur
door
Gerd Geeraard Paula Van Den Eede
geboren op 7 juni 1970 te Dendermonde, België

iv Two Cases in High Reliability Organizing: a Hermeneutic Reconceptualization
Promotor: Prof. dr. P.M.A. Ribbers
Copromotor: dr. B.A. Van de Walle
Overige leden:
Univ.-Prof. dr.-Ing. F. Fiedrich
Prof. dr. T.J. Grant
Dr. F. Hardeman
Dr. A-F. Rutkowski
Prof. dr. M. Turoff
Prof. dr. D. Van Lindt
.

Table of Contents v
Table of Contents
TABLE OF CONTENTS ................................................................................................................................ V
LIST OF FIGURES ......................................................................................................................................XII
LIST OF TABLES .......................................................................................................................................XIII
GLOSSARY AND LIST OF ACRONYMS .................................................................................................... XVII
PREFACE................................................................................................................................................ XIX
CHAPTER 1 INTRODUCTION ...................................................................................................................... 1
1 INTRODUCTION ....................................................................................................................................... 1
2 A PHENOMENOLOGICAL TAXONOMY OF RELIABILITY ........................................................................................ 3
2.1 Defining reliability ....................................................................................................................... 3 2.1.1 Average reliability ................................................................................................................................3 2.1.2 Variance of reliability ...........................................................................................................................4 2.1.3 Our definition ......................................................................................................................................4
2.2 Reliability decomposed ................................................................................................................ 5 2.2.1 Safety ..................................................................................................................................................5 2.2.2 Effectiveness ........................................................................................................................................8 2.2.3 Efficiency ........................................................................................................................................... 10
2.3 Methods for evaluating reliability .............................................................................................. 11 2.3.1 Cartesian reductionism – Risk equation .............................................................................................. 11 2.3.2 Reasonian holism ............................................................................................................................... 12
3 TRIANGULATION ................................................................................................................................... 14
3.1 Multidisciplinary ........................................................................................................................ 14
3.2 Systems thinking ........................................................................................................................ 14
3.3 Paradox ..................................................................................................................................... 16
3.4 Triangulation: multidisciplinary, system theoretic and paradoxical ............................................. 18 3.4.1 Study unreliability as well as reliability ................................................................................................ 18 3.4.2 HRT relevance .................................................................................................................................... 20
4 COMPLEXITY 21
4.1 Decomposing complexity ........................................................................................................... 21
4.2 Measuring complexity................................................................................................................ 23
4.3 Managing complexity ................................................................................................................ 23
5 COUPLING 27
5.1 Decomposing coupling ............................................................................................................... 27
5.2 Measuring coupling ................................................................................................................... 28
5.3 Loose Coupling Theory (LCT) ...................................................................................................... 28 5.3.1 In search of reliability ......................................................................................................................... 29 5.3.2 Relevance .......................................................................................................................................... 29 5.3.3 Identification ..................................................................................................................................... 30 5.3.4 Managing coupling ............................................................................................................................. 32
6 RESEARCH QUESTIONS............................................................................................................................ 34
6.1 Are the organizations HROs?...................................................................................................... 34
6.2 What constitutes high reliability? ............................................................................................... 35
7 STRUCTURE OF THIS DISSERTATION ............................................................................................................ 36

vi Two Cases in High Reliability Organizing: a Hermeneutic Reconceptualization
CHAPTER 2 LITERATURE REVIEW ............................................................................................................. 37
1 INTRODUCTION ..................................................................................................................................... 37
2 NORMAL ACCIDENTS THEORY (NAT) ......................................................................................................... 38
2.1 Interactive complexity................................................................................................................ 39
2.2 Relevance .................................................................................................................................. 41
3 HIGH RELIABILITY THEORY (HRT) .............................................................................................................. 42
3.1 Definition .................................................................................................................................. 42
3.2 Two schools of thought: Berkeley and Michigan ......................................................................... 43 3.2.1 The Berkeley HRO School ................................................................................................................... 44 3.2.2 The Michigan HRO School .................................................................................................................. 44
3.3 HRO Research ............................................................................................................................ 49
4 CONTRASTING NAT AND HRT .................................................................................................................. 54
4.1 Critique from HRT on NAT .......................................................................................................... 56 4.1.1 Misreading......................................................................................................................................... 56 4.1.2 Static and univocal ............................................................................................................................. 57 4.1.3 Unfalsifiable ....................................................................................................................................... 57 4.1.4 Defeatism .......................................................................................................................................... 57
4.2 Critique from NAT on HRT .......................................................................................................... 57 4.2.1 Restricted organizational learning ...................................................................................................... 57 4.2.2 Cognitively impossible ........................................................................................................................ 58 4.2.3 The Cost of mindfulness ..................................................................................................................... 58 4.2.4 Undesirable side effects ..................................................................................................................... 59
4.3 Self-Criticism.............................................................................................................................. 59
4.4 Beyond contingency: thesis, antithesis and synthesis .................................................................. 59
5 SENSEMAKING ..................................................................................................................................... 61
6 INFORMATION SYSTEMS FIT ..................................................................................................................... 64
6.1 Introduction............................................................................................................................... 64 6.1.1 Problem statement ............................................................................................................................ 64 6.1.2 Rationale ........................................................................................................................................... 64
6.2 Information Systems (IS) ............................................................................................................ 66
6.3 IS Users ..................................................................................................................................... 67 6.3.1 Cognitive profile................................................................................................................................. 67 6.3.2 Worldview, prior experiences, assumptions and values ....................................................................... 67 6.3.3 Systems designer's implicit theories ................................................................................................... 68
6.4 IS Fit .......................................................................................................................................... 68 6.4.1 Task/System Fit (TSF) ......................................................................................................................... 68 6.4.2 Congruent Fit ..................................................................................................................................... 69
CHAPTER 3 RESEARCH METHODOLOGY .................................................................................................. 71
1 INTRODUCTION ..................................................................................................................................... 71
2 HRO CASE STUDIES ............................................................................................................................... 71
2.1 Bank Case .................................................................................................................................. 71 2.1.1 The company ..................................................................................................................................... 72 2.1.2 The IT department ............................................................................................................................. 72 2.1.3 The Incident management process ..................................................................................................... 73
2.2 NPP Case ................................................................................................................................... 80 2.2.1 The company ..................................................................................................................................... 80 2.2.2 The Nuclear Power Plant .................................................................................................................... 80 2.2.3 Maintenance & Repair Process ........................................................................................................... 82
3 HERMENEUTICS .................................................................................................................................... 86
3.1 The origins of hermeutics ........................................................................................................... 86

Table of Contents vii
3.2 Hermeneutic circle ..................................................................................................................... 88
3.3 Relevance of hermeneutics for our research ............................................................................... 90
3.4 Triangulation ............................................................................................................................. 90
4 HRO RESEARCH TAXONOMIES.................................................................................................................. 91
4.1 Positivist vs. interpretive ............................................................................................................ 91
4.2 Normative vs. descriptive ........................................................................................................... 92
4.3 Quantitative vs. qualitative ........................................................................................................ 92
4.4 Induction vs. deduction .............................................................................................................. 93
5 RESEARCH APPROACH ............................................................................................................................ 94
5.1 HRO Research guidelines ........................................................................................................... 94
5.2 Case study preparation .............................................................................................................. 94 5.2.1 Case study preparation ...................................................................................................................... 94 5.2.2 Researcher – subject interaction ........................................................................................................ 95
5.3 Interviews .................................................................................................................................. 97 5.3.1 Objective ........................................................................................................................................... 97 5.3.2 Interview organization ....................................................................................................................... 97 5.3.3 Protocol development ........................................................................................................................ 98 5.3.4 Interview organization and selection of interviewees .......................................................................... 98 5.3.5 Interviewing style ............................................................................................................................... 99
5.4 Interview analysis ...................................................................................................................... 99 5.4.1 Cognitive mapping ............................................................................................................................. 99 5.4.2 Diabolo technique ............................................................................................................................ 101
5.5 GSS Workshop ......................................................................................................................... 103
5.6 System dynamics modeling ...................................................................................................... 105 5.6.1 Application ...................................................................................................................................... 105 5.6.2 System dynamics ............................................................................................................................. 105 5.6.3 The need of system dynamics for studying HROs .............................................................................. 106
6 SURVEY 107
6.1 Rationale ................................................................................................................................. 107
6.2 Operationalizing the conceptual model .................................................................................... 108 6.2.1 Item generation ............................................................................................................................... 108 6.2.2 Constructs ....................................................................................................................................... 109
6.3 Survey administration .............................................................................................................. 110 6.3.1 Pilot ................................................................................................................................................. 110 6.3.2 Distribution...................................................................................................................................... 111 6.3.3 Population and sample ..................................................................................................................... 111
6.4 Data analysis ........................................................................................................................... 112 6.4.1 Data reduction ................................................................................................................................. 112 6.4.2 Scale validation ................................................................................................................................ 112 6.4.3 Analysis of Variance ......................................................................................................................... 113
7 CONCLUSION: BUILD-UP AND HERMENEUTIC CIRCLE OF UNDERSTANDING ......................................................... 114
CHAPTER 4 RECONCEPTUALIZATION ..................................................................................................... 117
1 A PRIORI CONCEPTUAL MODEL CONSTRUCT VALIDATION .............................................................................. 117
2 RECONCEPTUALIZING THE A PRIORI MODEL ............................................................................................... 118
3 HRT 120
3.1 Team Orientation .................................................................................................................... 120
3.2 Threat Flexibility ...................................................................................................................... 121 3.2.1 Threat Rigidity ................................................................................................................................. 121 3.2.2 Threat Flexibility .............................................................................................................................. 122
3.3 Efficiency ................................................................................................................................. 123

viii Two Cases in High Reliability Organizing: a Hermeneutic Reconceptualization
3.3.1 Slack ................................................................................................................................................ 124 3.3.2 Classical HRO paradigm on efficiency: the danger of fine-tuning ........................................................ 126 3.3.3 A balanced view on efficiency ........................................................................................................... 127
3.4 Sensitivity to Operations .......................................................................................................... 129
3.5 Preoccupation with Failure ...................................................................................................... 130
3.6 Deference to Expertise ............................................................................................................. 130 3.6.1 Trust ................................................................................................................................................ 130 3.6.2 Control slack .................................................................................................................................... 131 3.6.3 Hierarchy vs. bureaucracy ................................................................................................................ 131 3.6.4 Decision-making styles ..................................................................................................................... 132 3.6.5 Training ........................................................................................................................................... 132 3.6.6 Boundary spanners .......................................................................................................................... 133 3.6.7 Layered architecture ........................................................................................................................ 133
4 SENSEMAKING ................................................................................................................................... 133
4.1 Self .......................................................................................................................................... 135 Identity Constructing ................................................................................................................................ 135
4.2 Other ....................................................................................................................................... 135 Social ....................................................................................................................................................... 135
4.3 Scheme .................................................................................................................................... 136 Retrospective ........................................................................................................................................... 136 Cue Extracting .......................................................................................................................................... 137 Plausibility ................................................................................................................................................ 138 Enactment ................................................................................................................................................ 138
4.4 Ongoing .................................................................................................................................. 139
5 IS FIT 139
5.1 Registration ............................................................................................................................. 139 5.1.1 Routine-based reliability .................................................................................................................. 139 5.1.2 Mindfulness-based reliability ............................................................................................................ 140
5.2 Communication ....................................................................................................................... 140 5.2.1 IS and SenseMaking ......................................................................................................................... 140
6 STRUCTURE 142
6.1 Procedure ................................................................................................................................ 142 6.1.1 Standard Operating Procedure ......................................................................................................... 143 6.1.2 Improvisation................................................................................................................................... 143 6.1.3 Deviation from procedure ................................................................................................................ 144
6.2 Physical organization ............................................................................................................... 145 6.2.1 Proximity ......................................................................................................................................... 145 6.2.2 Team size ......................................................................................................................................... 146 6.2.3 Workload and time allocation........................................................................................................... 146
7 REQUISITE VARIETY .............................................................................................................................. 146
7.1 Experience ............................................................................................................................... 147
7.2 Temporary staff ....................................................................................................................... 147
7.3 Various Variances .................................................................................................................... 148
8 RELIABILITY 148
CHAPTER 5 CONCEPTUAL MODEL.......................................................................................................... 151
1 REVISED CONCEPTUAL MODEL ............................................................................................................... 151
2 PROPOSITIONS AND HYPOTHESES ............................................................................................................ 153
2.1 Research Question 1 ................................................................................................................ 153
2.2 Research Question 2 ................................................................................................................ 158
2.3 Summary of propositions and hypotheses ................................................................................ 163

Table of Contents ix
CHAPTER 6 DATA ANALYSIS .................................................................................................................. 169
1 RECONCEPTUALIZED MODEL CONSTRUCT VALIDATION.................................................................................. 169
1.1 Data reduction......................................................................................................................... 169
1.2 Scale validation ....................................................................................................................... 170
2 COMPARING THE BANK CASE AND THE NPP CASE [RQ1] .............................................................................. 171 Proposition 1-1 ......................................................................................................................................... 171 Proposition 1-2 ......................................................................................................................................... 171 Proposition 1-3 ......................................................................................................................................... 173 Proposition 1-4 ......................................................................................................................................... 178 Proposition 1-5 ......................................................................................................................................... 178 Proposition 1-6 ......................................................................................................................................... 180 Proposition 1-7 ......................................................................................................................................... 180 Proposition 1-8 ......................................................................................................................................... 188
3 MEASURING RELIABILITY [RQ2] ............................................................................................................. 190
3.1 Bank Case ................................................................................................................................ 190 Proposition 2-1 ......................................................................................................................................... 190 Proposition 2-2 ......................................................................................................................................... 192 Proposition 2-3 ......................................................................................................................................... 194 Proposition 2-4 ......................................................................................................................................... 194 Proposition 2-5 ......................................................................................................................................... 196 Proposition 2-6 ......................................................................................................................................... 196 Proposition 2-7 ......................................................................................................................................... 200 Proposition 2-8 ......................................................................................................................................... 201 Proposition 2-9 ......................................................................................................................................... 201 Proposition 2-10 ....................................................................................................................................... 204 Propostion 2-11 ........................................................................................................................................ 205
3.2 NPP Case ................................................................................................................................. 205 Proposition 2-1 ......................................................................................................................................... 205 Proposition 2-2 ......................................................................................................................................... 206 Proposition 2-3 ......................................................................................................................................... 208 Proposition 2-4 ......................................................................................................................................... 208 Proposition 2-5 ......................................................................................................................................... 209 Proposition 2-6 ......................................................................................................................................... 210 Proposition 2-7 ......................................................................................................................................... 211 Proposition 2-8 ......................................................................................................................................... 212 Proposition 2-9 ......................................................................................................................................... 212 Proposition 2-10 ....................................................................................................................................... 216 Propostion 2-11 ........................................................................................................................................ 217
CHAPTER 7 DISCUSSION ........................................................................................................................ 219
1 COMPARISON OF THE BANK CASE AND THE NPP CASE [RQ1] ........................................................................ 219 Proposition 1-1 ......................................................................................................................................... 219 Proposition 1-2 ......................................................................................................................................... 221 Proposition 1-3 ......................................................................................................................................... 225 Proposition 1-4 ......................................................................................................................................... 227 Proposition 1-5 ......................................................................................................................................... 230 Proposition 1-6 ......................................................................................................................................... 231 Proposition 1-7 ......................................................................................................................................... 231 Proposition 1-8 ......................................................................................................................................... 232
2 MEASURING RELIABILITY [RQ2] ............................................................................................................. 233 Proposition 2-1 ......................................................................................................................................... 233 Proposition 2-2 ......................................................................................................................................... 237

x Two Cases in High Reliability Organizing: a Hermeneutic Reconceptualization
Proposition 2-3 ......................................................................................................................................... 238 Proposition 2-4 ......................................................................................................................................... 238 Proposition 2-5 ......................................................................................................................................... 239 Proposition 2-6 ......................................................................................................................................... 239 Proposition 2-7 ......................................................................................................................................... 242 Proposition 2-8 ......................................................................................................................................... 242 Proposition 2-9 ......................................................................................................................................... 242 Proposition 2-10 ....................................................................................................................................... 246 Proposition 2-11 ....................................................................................................................................... 247
CHAPTER 8 CONCLUSIONS .................................................................................................................... 249
1 ANSWERING THE RESEARCH QUESTIONS AND MAIN FINDINGS ........................................................................ 249
1.1 RQ1 – Are the organizations HROs? ......................................................................................... 249
1.2 RQ2 – What constitutes high reliability? ................................................................................... 249
1.3 Main Findings: HRO paradoxes ................................................................................................ 250 1.3.1 The dose makes the poison .............................................................................................................. 250 1.3.2 Working smarter .............................................................................................................................. 250 1.3.3 Stability in cognition, variance in design............................................................................................ 251 1.3.4 Dynamic adaptation ......................................................................................................................... 252
2 MAIN CONTRIBUTIONS ......................................................................................................................... 252
2.1 Two cases ................................................................................................................................ 253 2.1.1 Incident management process .......................................................................................................... 253 2.1.2 Can ‘garden variety’ organizations learn from archetypical HROs?..................................................... 253 2.1.3 Can archetypical HROs learn from garden variety organizations? ...................................................... 253
2.2 High Reliability ........................................................................................................................ 254 2.2.1 A definition of reliability ................................................................................................................... 254 2.2.2 Reliability as dependent variable ...................................................................................................... 254 2.2.3 HRO properties as mean and as variance .......................................................................................... 255
2.3 Organizing ............................................................................................................................... 255 2.3.1 Reliability is dynamic ........................................................................................................................ 255 2.3.2 HRT as guide for organization science ............................................................................................... 255 2.3.3 Moderator variables......................................................................................................................... 256
2.4 Hermeneutic ............................................................................................................................ 256
2.5 Reconceptualization ................................................................................................................ 258 2.5.1 Towards a balanced theory on High Reliability by including Efficiency................................................ 258 2.5.2 Bridging the dichotomy between the Berkeley and the Michigan School ........................................... 258 2.5.3 Bridging the dichotomy between HRT and NAT ................................................................................. 259
2.6 Theory ..................................................................................................................................... 259 2.6.1 Is HRT a theory? ............................................................................................................................... 259 2.6.2 Theory type ..................................................................................................................................... 261
3 LIMITATIONS OF THIS STUDY .................................................................................................................. 262
4 FUTURE RESEARCH DIRECTIONS .............................................................................................................. 263
4.1 Stronger research collaboration ............................................................................................... 263
4.2 Loose Coupling Theory ............................................................................................................. 263
4.3 System Dynamics ..................................................................................................................... 264
4.4 Networked Reliability ............................................................................................................... 264
AUTHORED PUBLICATIONS ................................................................................................................... 267
REFERENCES .......................................................................................................................................... 269
APPENDICES .......................................................................................................................................... 291
APPENDIX A. INTERVIEW PROTOCOL (BANK CASE) ...................................................................................... 291

Table of Contents xi
APPENDIX B. INTERVIEW PROTOCOL (NPP CASE) ....................................................................................... 297
APPENDIX C. TESTING THE A PRIORI CONCEPTUAL MODEL ........................................................................... 303
APPENDIX D. DESCRIPTIVE RESPONDENT STATISTICS (BANK CASE) .................................................................. 309
APPENDIX E. DESCRIPTIVE RESPONDENT STATISTICS (NPP CASE) ................................................................... 313
APPENDIX F. DESCRIPTIVE TEAM STATISTICS (BANK CASE) ............................................................................ 322
APPENDIX G. DESCRIPTIVE TEAM STATISTICS (NPP CASE) ............................................................................. 326
APPENDIX H. DATA REDUCTION (BANK CASE) ............................................................................................ 328
APPENDIX I. DATA REDUCTION (NPP CASE) ............................................................................................. 339
APPENDIX J. NORMALIZED PROCESS RELIABILITY ........................................................................................ 349
APPENDIX K. INCIDENT MANAGEMENT WORKFLOW (BANK CASE) .................................................................. 352
SAMENVATTING (DUTCH SUMMARY) ................................................................................................... 353
ENDNOTES ............................................................................................................................................ 355

xii Two Cases in High Reliability Organizing: a Hermeneutic Reconceptualization
List of Figures
Figure 1.1 - Reliability decomposed............................................................................................................ 5
Figure 1.2 - Average rate per exposure of catastrophes and associated deaths in various industries and
human activities (Amalberti, Auroy, Berwick, & Barach, 2005, p. 758 - Reproduced with permission
from the Annals of Internal Medicine) ............................................................................................... 7
Figure 1.3 - Swiss Cheese Model (Modified from Reason, 1990, p. 208) .................................................... 12
Figure 1.4 - Combining Reliability and Flexibility (Van Den Eede, Kenis, & Van de Walle, 2004) ................. 19
Figure 1.5 - Embracing Paradox ................................................................................................................ 22
Figure 1.6 - Systems Space ....................................................................................................................... 26
Figure 1.7 - Loose Coupling Theory (Adapted from Orton & Weick, 1990, p. 217) ..................................... 33
Figure 2.1 - Interaction/Coupling Chart (Perrow, 1999, p. 327) .................................................................. 39
Figure 2.2 - Spread of HRO publications (1981-2008)................................................................................ 50
Figure 2.3 - Top 5 HRO Publications ......................................................................................................... 53
Figure 2.4 - IS Interaction Model .............................................................................................................. 65
Figure 3.1 - ITIL Service Support Module (Adapted from van Bon, Kemmerling, Pondman, & van der Veen,
2004) .............................................................................................................................................. 73
Figure 3.2 - Parameters influencing downtime (Brenner, 2006) ................................................................ 74
Figure 3.3 - Organization of the Incident Management process (Muhren, 2006) ....................................... 75
Figure 3.4 - The Incident life cycle (adapted from CCTA (Central Computer & Telecommunications Agency),
2000) .............................................................................................................................................. 76
Figure 3.5 - Maintenance & Repair process (Vanhuysse, 2005) ................................................................. 82
Figure 3.6 - Hermeneutic Circle (Butler, 1998) .......................................................................................... 89
Figure 3.7 - Example excerpt of a cognitive map with categorized nodes ................................................ 101
Figure 3.8 - Diabolo Technique............................................................................................................... 102
Figure 4.1 - The A Priori Conceptual Model ............................................................................................ 118
Figure 4.2 - Threat Rigidity (Sutcliffe & Vogus, 2003) .............................................................................. 122
Figure 4.3 - Threat Flexibility (Sutcliffe & Vogus, 2003) ........................................................................... 122
Figure 4.4 - Taylor-Russell diagram......................................................................................................... 129
Figure 4.5 - Self, Scheme and Other ....................................................................................................... 134
Figure 4.6 - Planning, Action and their Improvisation Synthesis (Clegg et al., 2002, p. 489) ..................... 144
Figure 5.1 - Reconceptualized Model ..................................................................................................... 151
Figure 5.2 - Propositions for RQ2 ........................................................................................................... 158
Figure 7.1 - Mindfulness (Adapted from Muhren, Van Den Eede, & Van de Walle 2007, p. 579) .............. 220
Figure 7.2 - Learning Cycle (Kolb 1976) ................................................................................................... 224
Figure 7.3 - The Evolution of SenseMaking Propensity ............................................................................ 229
Figure 0.1 - Incident Management Work Flow ........................................................................................ 352

List of Tables xiii
List of Tables
Table 1.1 - Overview of some reductionist risk management methods (Azadeh, 2000, p. 208) .................. 12
Table 1.2 - Properties of System Dimensions (Bennet & Bennet, 2004) ..................................................... 26
Table 1.3 - Tightly vs. loosely-coupled processes (Perrow, 1999, p. 92-93) ................................................ 27
Table 2.1 - Complex vs. linear systems (Perrow, 1999, p. 85-86;Berniker & Wolf, 2001) ............................ 40
Table 2.2 - HRO authors ........................................................................................................................... 51
Table 2.3 - HRO publications by sector ..................................................................................................... 52
Table 2.4 - Safety vs. Reliability ................................................................................................................ 53
Table 2.5 - Business Process and HRO ...................................................................................................... 53
Table 2.6 - Management Activities addressd by HRO literature ................................................................ 54
Table 2.7 - Research methods addressed by HRO literature ...................................................................... 54
Table 2.8 - Competing perspectives on Safety - Modified from Sagan (1993, p. 46) ................................... 55
Table 2.9 - SenseMaking properties (Weick, 1995) ................................................................................... 62
Table 3.1 - Description of the Incident Management process ................................................................... 77
Table 3.2 - Incident Impact Level (Bank) ................................................................................................... 78
Table 3.3 - Incident Urgency Level (Bank) ................................................................................................. 78
Table 3.4 - SLA Time frames ..................................................................................................................... 79
Table 3.5 - Priority levels in the M&R process (NPP) (Vanhuysse, 2005) .................................................... 83
Table 3.6 - Methodological principles for the interpretive process (Madison, 1988;Uysal, 2009, p. 7) ....... 87
Table 3.7 - Prescriptions for the Research Team (Roberts & Rousseau, 1989) ........................................... 94
Table 3.8 - Prescription for HRO Managers (Roberts & Rousseau, 1989) ................................................... 94
Table 3.9 - Number of interviews conducted in both case studies ............................................................. 97
Table 3.10 - Pilot descriptors for the Bank Case ...................................................................................... 110
Table 3.11 - Alternation between research taxonomies and research techniques ................................... 115
Table 3.12 - Hermeneutic research build-up (In analogy with Butler, 1998, p. 296) ................................. 116
Table 4.1 - Self, Scheme and Other ........................................................................................................ 134
Table 5.1 - Operationalizing the constructs ............................................................................................ 153
Table 5.2 - Resemblance between the Nuclear and the Financial sector ................................................. 154
Table 5.3 - Propositions and underlying constructs (RQ2) ....................................................................... 159
Table 5.4 - Summary of research propositions and hypotheses regarding Research Question 1 .............. 165
Table 5.5 - Summary of research propositions and hypotheses regarding Research Question 2 .............. 167
Table 6.1 - Item Composition and Scale Reliability of Bank Case Constructs ............................................ 170
Table 6.2 - Item Composition and Scale Reliability of NPP Case Constructs ............................................. 170
Table 6.3 - Comparison HRT propensity (team level) .............................................................................. 171
Table 6.4 - Comparison between cases on team construct level ............................................................. 172
Table 6.5 - ANOVA Descriptives for Face-to-face Communication (Bank) ................................................ 174
Table 6.6 - ANOVA for Face-to-face Communication (Bank) .................................................................... 176
Table 6.7 - ANOVA for Experience (NPP) ................................................................................................ 178
Table 6.8 - ANOVA for Experience vs. SeMa Scheme (Bank) .................................................................... 178
Table 6.9 - ANOVA Descriptive Statistics for Experience vs. SeMa Scheme (Bank) ................................... 178
Table 6.10 - HRO Construct Comparison................................................................................................. 179
Table 6.11 - ANOVA for Deference to expertise (Bank) ........................................................................... 182
Table 6.12 - Descriptives for ANOVA for Deference to Expertise (Bank) .................................................. 184
Table 6.13 - ANOVA for Preoccupaton with failure vs. Deference to Expertise (Bank) ............................. 184

xiv Two Cases in High Reliability Organizing: a Hermeneutic Reconceptualization
Table 6.14 - ANOVA for Deference to Expertise vs. Preoccupation with failure (NPP) .............................. 186
Table 6.15 - Descriptives for ANOVA for Deference to Expertise vs. Preoccupation with failure (NPP) ..... 187
Table 6.16 - ANOVA for Face-to-face Communication (NPP) ................................................................... 189
Table 6.17 - Construct Abbreviations ..................................................................................................... 190
Table 6.18 - Two-way ANOVA for Team Orientation ............................................................................... 191
Table 6.19 - Two-way ANOVA for Spread of Team Orientation ............................................................... 191
Table 6.20 - Two-way ANOVA for Threat Flexibility................................................................................. 191
Table 6.21 - One-way ANOVA for Threat Flexibility ................................................................................. 192
Table 6.22 - One-way ANOVA for Efficiency ............................................................................................ 192
Table 6.23 - Two-way ANOVA Analysis for Spread in SenseMaking Propensity ........................................ 193
Table 6.24 - Two-way ANOVA for Spread in Scheme ............................................................................... 193
Table 6.25 - Two-way ANOVA for Spread in Enactment .......................................................................... 194
Table 6.26 - Two-way ANOVA for timeliness of incident registration ...................................................... 194
Table 6.27 - Two-Way ANOVA for the use of dedicated IS and incident management focus .................... 195
Table 6.28 - Two-way ANOVA for Experience (DM5) and use of communication tools (DM112) .............. 196
Table 6.29 - One-way ANOVA for vicinity to IT headquarters .................................................................. 196
Table 6.30 - Two-way ANOVA for vicinity to IT headquarters .................................................................. 196
Table 6.31 - One-way ANOVA for spread in Physical Proximity ............................................................... 197
Table 6.32 - Two-way ANOVA for spread in Physical Proximity ............................................................... 197
Table 6.33 - Two-way ANOVA for spread in Physical Proximity ............................................................... 198
Table 6.34 - Two-way ANOVA for Team Size ........................................................................................... 198
Table 6.35 - One-way ANOVA of Workload............................................................................................. 198
Table 6.36 - Two-way ANOVA of Workload concerning the handling of urgent incidents ........................ 199
Table 6.37 - Two-way ANOVA of Time Allocation.................................................................................... 199
Table 6.38 - One-way ANOVA for Proximity ............................................................................................ 200
Table 6.39 - Workload............................................................................................................................ 200
Table 6.40 - Two-way ANOVA for Spread in HRO propensity................................................................... 201
Table 6.41 - Two-way ANOVA for Spread in HRT..................................................................................... 202
Table 6.42 - Two-way ANOVA for spread in Team Orientation ................................................................ 202
Table 6.43 - One-way ANOVA for Threat Flexibility ................................................................................. 202
Table 6.44 - Two-way ANOVA for Preoccupation with Failure ................................................................. 203
Table 6.45 - Two-way ANOVA for Spread in Preoccupation with Failure.................................................. 203
Table 6.46 - Two-way ANOVA for spread in Sensitivity to Operations ..................................................... 203
Table 6.47 - Two-way ANOVA for Spread in Deference to Expertise ........................................................ 204
Table 6.48 - One-way ANOVA for spread of Threat Flexibility ................................................................. 204
Table 6.49 - One-way ANOVA for spread of efficiency drivenness ........................................................... 205
Table 6.50 - Two-way ANOVA for Threat Flexibility................................................................................. 206
Table 6.51 - Two-way ANOVA for SenseMaking ...................................................................................... 206
Table 6.52 - Two-way ANOVA for Scheme .............................................................................................. 207
Table 6.53 - Two-way ANOVA for Enactment ......................................................................................... 208
Table 6.54 - One-way ANOVA for spread in the use of telephone ........................................................... 208
Table 6.55 - Two-way ANOVA Team Orientation & Media Richness ........................................................ 208
Table 6.56 - Deviation from procedure & Tool dedication....................................................................... 209
Table 6.57 - Two-way Anova for SeMa and Is Use ................................................................................... 209
Table 6.58 - Two-way ANOVA for Team Size ........................................................................................... 210
Table 6.59 - Two-way ANOVA for TeamSize (ctd).................................................................................... 211
Table 6.60 - One-way ANOVA for Workload (NPP) .................................................................................. 211
Table 6.61 - Workload (NPP) .................................................................................................................. 212
Table 6.62 - One-way ANOVA of Experience ........................................................................................... 212

List of Tables xv
Table 6.63 - Two-way ANOVA for spread in HRO propensity ................................................................... 213
Table 6.64 - Variance in Two-way ANOVA for Team Orientation ............................................................. 214
Table 6.65 - Two-way ANOVA for Spread in Threat Flexibility ................................................................. 214
Table 6.66 - Two-way ANOVA for combinations of Preoccupation with Failure ....................................... 215
Table 6.67 - Two-way ANOVA for variance in Sensitivity to Operations ................................................... 215
Table 6.68 - Two-way ANOVA for variance in Deference to Expertise ..................................................... 216
Table 8.1 - Structural components of theory (Gregor, 2006) ................................................................... 260
Table 8.2 - Testing HRT's theory type ..................................................................................................... 261
Table 0.1 - A Priori Survey Items for Sensitivity to Operations................................................................. 303
Table 0.2 - A Priori Survey Items for Reluctance to Simplify .................................................................... 303
Table 0.3 - A Priori Survey Items for Commitment to Resilience.............................................................. 303
Table 0.4 - A Priori Survey Items for Preoccupation with Failure ............................................................. 304
Table 0.5 - A Priori Survey Items for Deference to Expertise ................................................................... 304
Table 0.6 - Rotated Component Matrix of HRT items from Literature ..................................................... 306
Table 0.7 - KMO and Bartlett's Test for a priori HRT Variables (Bank) ...................................................... 306
Table 0.8 - Total Variance Explained of A Priori Factor Analysis for HRT items ......................................... 308
Table 0.9 - Items relating to Control Variables (Bank) ............................................................................. 328
Table 0.10 - KMO and Bartlett's Test for Control Variables (Bank)........................................................... 329
Table 0.11 - Total Variance Explained by the Factors for the Control Variables (Bank) ............................. 329
Table 0.12 - Rotated Component Matrix for Control Variables ................................................................ 330
Table 0.13 - Labeling of the factors based on moderator variables ......................................................... 331
Table 0.14 - Descriptive Statistics for items relating to HRT .................................................................... 332
Table 0.15 - KMO and Bartlett's Test for HRT Factor Analysis .................................................................. 332
Table 0.16 - Total Variance Explained by the HRT Factors (Bank) ............................................................ 333
Table 0.17 - Rotation Matrix for HRT constructs ..................................................................................... 335
Table 0.18 - Labeling of HRT constructs based on the research data ....................................................... 336
Table 0.19 - Descriptive Statistics for SenseMaking related items ........................................................... 337
Table 0.20 - KMO and Bartlett's Test for SenseMaking Factors (Bank) ..................................................... 338
Table 0.21 - Total Variance Explained by the SenseMaking Factors (Bank) .............................................. 338
Table 0.22 - Rotation Matrix for SenseMaking (Bank) ............................................................................. 338
Table 0.23 - Descriptive Statistics for items related to moderator items (NPP) ........................................ 339
Table 0.24 - KMO and Bartlett's Test for Factor Analysis on Control Variable Items (NPP) ....................... 340
Table 0.25 - Total Variance Explained by Control Factors (NPP) .............................................................. 340
Table 0.26 - Rotated Component Matrix for Control Variables (NPP Case) .............................................. 341
Table 0.27 - Items related to HRT ........................................................................................................... 343
Table 0.28 - KMO and Bartlett's Test for Factor Analysis on HRT items ................................................... 343
Table 0.29 - Total Variance Explained HRT constructs (NPP Case) ........................................................... 344
Table 0.30 - Rotated Component Matrix for HRT .................................................................................... 346
Table 0.31 - Items Related to SenseMaking ............................................................................................ 347
Table 0.32 - KMO and Bartlett's Test for Factor Analysis on SenseMaking items ..................................... 348
Table 0.33 - Rotated Component Matrix for SenseMaking (NPP Case) .................................................... 348
Table 0.34 - Descriptive Statistics for Normalized Reliability (Bank) ........................................................ 350
Table 0.35 - Descriptive Statistics for Normalized Reliability (NPP).......................................................... 351


Glossary and List of Acronyms xvii
Glossary and List of Acronyms
Effectiveness Refers to an absolute level of outcome attainment. Something that is
effective works well and produces the results that were intended.
Efficiency Refers to an input-output ratio or comparison of input (cost, time,
effort) and output (result, performance)
Hermeneutics Hermeneutics is defined as the theory or philosophy of the
interpretation of meaning. Several types of hermeneutic research
approaches exist, but in this research we adhere to the pragmatic-
constructivist approach where interpretation involves entering into the
interpretative norms of a community and where meaning operates and
is to be found within the historical contexts of the interpreter and
interpreted. Understanding works in broadening concentric circles.
HROs High Reliability Organization – Organizations where the risk of calamity
is very high, but that yet are successful in their avoidance and/or
mitigation.
HRT High Reliability Theory – The collection of work on HROs. It is a theory on
how a high degree of reliability can be achieved.
IM Incident Management – The process of handling incidents in an efficient
and effective manner.
LCT Loose Coupling Theory – LCT incorporates a multidimensional
perspective to the organizing process by studying the (1) causation, (2)
typology, (3) effects, (4) compensations and (5) organizational outcomes
of coupling. According to LCT’s dialectical perspective on loose coupling
‘not tightly coupled’ is not the same as ‘loosely coupled’. In this sense
LCT opposes against the one-dimensional approach to coupling of NAT.
NAT Normal Accidents Theory – A theory on reliability that posits that
accidents are a normal consequence of a system’s interactive complexity
and tight coupling
SeMa SenseMaking – The process of creating a mental model of a situation,
particularly when this situation is ambiguous.


Preface xix
Preface
Have no fear of perfection
– you’ll never reach it.
Salvador Dali
A preface should explain and thank; it has two audiences, those who might be interested in reading
the manuscript and those who have made reading possible.
Seventeen years after my graduating as a Master in Commercial Sciences, the goal is to get a PhD. In
that time a lot has happened: I got married, became a father of two, changed jobs a few times, made
and lost friends and relatives. Professionally I became fascinated by organizations and more
specifically by the coordination mechanisms they employ. Coordination is related to organization
design and organization behavior which in their turn are all about organization structure, decision
making, leadership style, culture etc. Not surprisingly therefore, postmodern science philosophy
teaches us that most problems are multidisciplinary. It seems as if no issue can be solved except
when tools, techniques or insights from neighboring fields of study are drawn in. As a child of
postmodern thought, my field of interest is broad, triggered by a complex observable reality that
emphasizes the necessity of taking a broad perspective on things. A doctoral thesis however has
little to do with this postmodern view. For a doctoral candidate, the exigencies are not to widen
one’s knowledge but to deepen it. Instead of getting to know more about more, one is encouraged
to learn more about less. Regarding my background and personal interest this represented a conflict:
how could I combine a genuine broad interest with the exigencies of a doctoral thesis that forces
one to specialize to the extreme? I found the solution by looking not at what is there, but by looking
at what is not there. Allow me to explain this a bit further by referring to the house building
metaphor. In building a house one needs bricks, lots of them. Some of these bricks are of more
interest than others (corner stones, foundation bricks, etc), but all of them are needed to build a
house. And the mason knows this. He does not want to find out the details off all the particular types
of bricks, for him it is enough that he has a general idea in order to be able to use the bricks to
construct the building. He is a generalist, driven by a strong desire to build. The worker in the brick
factory or stone quarry is completely different from the mason. He is interested in the particularities
of the brick or stone in terms of e.g. absorption capacity, hardness, heat resistance, isolation etc. He
specializes in them and is not interested in actually building the house. The mason can be compared
to the consultant or manager, the stone specialist to the academic.
Getting back to our idea of looking at what is not there, I state that what is not there is what links
the stones and bricks of a house. If it is mortar, it is a kind of glue that ties the stones together, if
there is no mortar, it are the written and unwritten laws of an invisible gravity. Taking the metaphor1
to organization studies, I chose to deal with the unwritten organizational laws of gravity by looking

xx Two Cases in High Reliability Organizing: a Hermeneutic Reconceptualization
at what links the organizational building blocks (like organization behavior, structure, decision
making, strategy etc.). I found a way of combining the objective of doctoral research with the desire
to become a mason. The key was to focus on the mortar instead of on the bricks, on the spaces
between the stones instead of on the stones themselves, on a language that uses a plethora of
underspecified formulations as a vehicle through which I could work on difficult conceptual
problems (Levine in Orton & Weick, 1990, p. 204). The set of constructs I have used throughout my
research – High Reliability Theory (HRT) and SenseMaking (SeMa) – are a reflection thereof. I
cordially invite you to be my guest on my journey into ‘making sense’ of what I have read, observed
and written, and to read this dissertation. I hope you will enjoy reading it as much as I have enjoyed
writing it.
Also from another perspective, writing a thesis is like building a house. When you start you have a
vague idea of what kind of building you want to construct, a house that fulfills your dreams, uttered
or unuttered. The new to build house holds a promise of a new life and of the excitement and
learning on the journey on your way to construction. Writing a doctoral dissertation shows more
than one characteristic of such a construction project. Once one decides to go on this journey the
dreams at times get very real, at other times however they seem to vanish with every step you take
in achieving it. Then you ask people, especially friends who are going or have been going the same
doctoral journey. They tell you their experiences and what they have gone through: The solitude, the
struggle with theory, method and data, the reward in the end. You nod your head but still think that
your own thesis will be different from all the others. In the end, you is still you. You still hold on to a
romantic view of the academic in search of Truth. And then complete disappointment overcomes
you and good friends really have to pull you through. The thing about PhD theses is that you come
across yourself in the process. You get to know your strengths and weaknesses, start to see where
the dangers and opportunities could be. These insights come at a cost however. You learn it the hard
way, there is no easy way. A PhD title is the proof of concept and the concept is you (David
Mendonça).
Writing an interdisciplinary thesis alone, is a contradiction in terms. I am not even able to pretend
that this piece of work was a solo-activity. The scientific mores, however, require that I am the one
and only author of the dissertation. However, I will use the plural ‘we’ throughout this thesis to
indicate that most of the inspiration and creativity arose out of teamwork and that all thoughts and
ideas presented in this thesis have been thoroughly improved through discussion with colleagues.
Needless to say, there are many people who have contributed to the completion of this thesis, in
one way or another, as friends, colleagues, inspirers, critics, financers and advisors. First of all, I want
to thank Bartel Van de Walle for being my thesis supervisor. He has been my guide in the doctoral
process. He learned me how to set up good research, and thought me the true meaning of academic
rigor. Above all he was a source of continuous inspiration and challenge. I thank him for the infinite
number of hours he spent with me at the university, on the road, on the phone or Skype, on the
research sites, on conferences etcetera. I especially am grateful for the way he welcomed me in his
personal life. Without his energy and commitment I would not have completed this dissertation. It is
as much his work as it is mine.

Preface xxi
Still at Tilburg University I want to thank Piet Ribbers for his efforts and support for improving my
thinking intellectually and his emphasis on keeping the academic line pure. Also for taking up the
role of promoter of my thesis.
I am grateful to Willem Muhren and Raphaël Smals from Tilburg University for being my companions
de route at the Bank and the NPP respectively. My thanks you go to Willem for his generosity in
everything: the practical assistance, his sparring-partnership in the discussion of our research lines,
the gratifying co-research in Sri Lanka, Congo and Finland, our joint papers and conference
participations. Likewise, my sincere gratitude goes to Raphaël for the way he has helped my thinking
– our thinking – on high reliability crystallize and for all his efforts in conducting my field research. I
am indebted to Willem and Raphaël for their write-up of the incident processes in both our case
studies.
I thank people at the former VLEKHO Business School, which has funded this thesis work. First and
for all, I want to thank Dirk Van Lindt for taking me on board and for granting me the opportunity to
start the doctoral research. It is his belief in me that paved the way for this dissertation. I also thank
him for his kind assistance in analyzing my research data. Also thank you to Micheline Goossens,
Karel Van Oostveldt and Wilfried Janssens, for their continuous belief in me. VLEKHO staff has gone
to great lengths in supporting me financially, but I will especially remember them for the feeling of
belonging they continuously gave me.
In addition, I am truly grateful for the time invested and interest shown by people at the two case
sites. First, at the Bank, special thanks go to the general manager, who acted as a sponsor for my
work and to Noël Van den Driessche, who profoundly believed in what we were doing and who
hoped that the outcomes of our research would have the potential of improving his organization. At
the Nuclear Power Plant I express thanks to Geert Backaert for the challenging conversations that
went to the heart of how a Nuclear Plant really operates. Also for the trust he has put in me and for
the unique and privileged opportunity he has granted me to be a first row witness of life at a nuclear
power plant. I am grateful to Jacques Vanhuysse for explaining to me the ins and outs of the
Maintenance & Repair Process and for facilitating my on-site observations and organizing the
interview sessions. My appreciation goes to Franki De Prekel for his help with retrieving legacy data
from the SAP database.
Down at NJIT, I have found great support in two people, Murray Turoff and Roxanne Hiltz: Murray,
for being Murray, my oracle and role model as a scholar in heart and soul. The continuous sharing of
his experience and the combing of his insights into practical relevance for my own research cannot
be overestimated; Roxanne, for her help in choosing the right set of data analysis techniques and
encouraging me with simple tricks like: “every night, sit down at your desk, and just write it, damn’it”
(Although I am not sure she actually said “damn’it”, but I’m pretty sure that’s what she meant).
There are a number of colleagues that over the years have given me advice that might seem
relatively insignificant at first sight but that have made a whole difference: David Mendonça, for
challenging my scientific competencies; Noël Houthoofd, for making clear to me that it is no use to
think ex-nihile about theories and fields of interest, without having the possibility to collect data;
Dirk Kenis, for acquainting me with Bartel and for being the committed co-author of my first
conference paper; Guido Pepermans, for making clear to me that in case of a PhD thesis ‘good is

xxii Two Cases in High Reliability Organizing: a Hermeneutic Reconceptualization
good enough’; Marc Craps, for the quality of his instructions in qualitative research; Hendrik
Slabbinck for his help when data did not want to yield up their secrets so easily; Kristof Stouthuysen
for the inspiring discussions on co-work; Koen Algoed for his encouragements and challenging
discussions; Geert Crauwels, for his wisdom on life, in general, and that of a PhD candidate in
particular.
Special thanks goes to my colleagues at Mechelen University College who have supported me during
the last phase of the doctoral process. I am especially grateful for their understanding and patience
when the combination of work and study was cumbersome. Still at Mechelen University College, my
sincerest gratitude goes to Peter Berghmans who has been an eyewitness from the start and whose
friendship is invaluable to me.
Last, but in fact first and foremost, my immense gratitude goes to my wife Els and our children,
Kerlijne and Hendrik. The hours I have spent physically at my computer and the hours that I was
absentminded and absorbed by research have deprived them from the quality time together they
were entitled to. It is their generous effort that has permitted me to succeed. Therefore I dedicate
this manuscript to them. Yes, I’m finally done.
Gerd Van Den Eede
November 2009

Introduction 1
Chapter 1 Introduction
The more we study the major problems of our time
the more we come to realize
that they cannot be understood in isolation.
They are systemic problems, which means
that they are interconnected and interdependent
Capra (1996)
1 Introduction The study of reliability is of considerable importance to society, and this from different
perspectives. Society and mankind seem to be devoted to risky ventures. Throughout its
evolution mankind has made progress by following a mixed strategy of risk averse and risk prone
behavior, of sticking to the known values on the one hand and of searching for the unknown and
the experiment on the other. This strategy has proved to be very rewarding considering the
‘success’ of our species. Many doubt this success from a socio-philosophical perspective, but
contemporary life unarguably is much more safe and satisfying than life of previous generations.
New technologies, new procedures, new places have been developed or discovered resulting in
more welfare and (sometimes) more wellbeing. Hence it pays off to take risk, at least if the
upside risk is greater than the downside risk.
With our apologies to Bob Dylan for stealing his title and to our readers for laboring an obvious
point, but in a doctoral dissertation on reliability, we have no choice but to state it: The times,
they are a-changin’. “To succeed, organizations must now contend with complex global markets,
large-scale systems, and a hyper-dynamic economic context, all of which require organizational
members to detect and manage unexpected events in a rapidly changing environment (Knight,
2004, p. 1). From a business perspective, reliability has shifted from the background to the focus
of interest in recent years. Internationally, the awareness of operational risk management has
increased tremendously2. Recent scandals stress the importance of operational reliability. Legal
or regulating frameworks like Basel II and Sarbanes-Oxley (on operational risk), Code Lippens in
Belgium and Code Tabaksblat in The Netherlands (on Corporate Governance) are streamlining
ethical management practice and offer benchmarks to do so.
Anno 2009 organization members want to be taken seriously, want to be part of the decision
making, want premium information on the organization and to foster their autonomy. The
paradigms of the nineties on becoming a learning organization, to name just this management
creed, should be seen in this light. However, there occasionally seems to be a discrepancy
between what managers preach and what they do. They preach openness and say they believe
in empowering their people, but in practice they want to keep control on everything and

2 Two Cases in High Reliability Organizing: a Hermeneutic Reconceptualization
everybody. This should not come as a surprise since one of the most compelling shifts of the last
decade has been the aforementioned need of being compliant.
With this dissertation we wish to make a contribution to the expertise developed by
organization scientists in recent years in the field of highly complex and tightly coupled
organizations (Roberts, Stout, & Halpern, 1994, p. 614). More particularly we hope to make clear
in which way High Reliability thinking can find the balance between the desire to be open and
the need to be in control, to exhibit a reliability that consists out of stability and flexibility. This
study aims at contributing to the debate on what constitutes organizational effectiveness and in
this sense it modestly subscribes to a long tradition that started with Adam Smith’s Wealth of
Nations (1776) and Frederick Taylor’s Principles of Scientific Management (1911). Contrary to
the mainstream organizational effectiveness research, the focus is not on efficiency (in the sense
of ‘doing the things right’), but on effectiveness (‘doing the right things’) and in this it
fundamentally differs from seminal publications like Peters’ and Waterman’s In Search of
Excellence (1982). However, this does not imply that the efficiency notion remains out of scope,
since efficiency will prove to be indispensable in understanding effectiveness. The purpose of
this research is to develop a theory that explains how organizational reliability can be enhanced
by balancing structural and contextual organization factors. The title of this dissertation does not
imply that we are going to find some kind of magic spell for assuring reliability, but that we are
searching for insights into what constitutes organizational reliability. Insight itself does not
increase predictability or reliability of complex systems, but it may give those trying to manage
such systems indications where and how to look for clues to remain on course within the
parameters of effectiveness and efficiency (Longstaff, 2003, p. 30). Based on our a priori
deduction from the literature and our field observations, we argue that contextual dimensions,
such as the degree of mindfulness and the way decisions are made, and structural dimensions,
such as the overall focus/implicit strategy on efficiency and the way the Information Systems are
used, have the potential of explaining (un)reliability.
This first chapter introduces the foundations our research is built upon: the whole of context,
axioms, choices, problem definition, limitations that underlies the search we have embarked on.
In line with Linstone and Turoff, we believe this is essential when building a framework that has
the potential of contributing to the body of scientific research: “Any human endeavor which
seeks recognition as a professional or scientific activity must clearly define the axioms upon
which it rests. The foundation of a discipline, as the foundations of a house, serves as a guide and
basis for the placement of the building blocks of knowledge gathered through research and
development activities. It is the definition, exposure, and investigation of the philosophical
foundation that distinguishes a scientific profession from other endeavors”(Linstone & Turoff,
1975, p. 15). *…+ “Have we taken a broad enough perspective of the basic problem? Have we
from the very beginning asked the right question? Have we focused on the right objectives? *…+
(Linstone & Turoff, 1975, p. 19). In view of this objective, the remainder of this chapter first
builds a phenomenological taxonomy of reliability, providing a definition of the reliability
concept (Section 2). Next, the principle of triangulation introduces the multidisciplinary, system
theoretic and paradoxical nature of our research (Section 3). Subsequently, the chapter
addresses the notions of complexity (Section 4) and coupling (Section 5) as they are at the heart
of what constitutes organizational reliability. Finally, the research questions are formulated
(Section 6) and the structure of the dissertation presented (Section 7).

Introduction 3
2 A Phenomenological Taxonomy of Reliability Reliability is fragile, not only in its physical manifestation, but also as a construct. Yet one talks
about reliability as if one perfectly knows what it means and that we all share the same mental
model. Nothing is further from the truth. Depending on the discipline, the context and the
individual or collective world-view of the person interpreting the term, the meaning of reliability
is fundamentally different3.
In this section we give an overview of the ways in which practice and academia deal with the
concept and we make a beginning of what could qualify as a more generic phenomenological
taxonomy of reliability, independent from the practitioner domain or scientific discipline. First,
we give an overview of popular definitions of reliability, with an indication of their strengths and
weaknesses and how they can be used in building the intended taxonomy. Next, we decompose
the notion into its constituting parts and make the distinction between the domains in which
concepts of reliability over the years are – or have been – applied (e.g. machine- or software-
reliability). Third, we combine these insights by asking whether reliability is a matter of ‘and/and’
or of ‘and/or’. Finding this answer is this dissertation’s leitmotiv.
2.1 Defining reliability Reliability can be defined in numerous ways, and the following is just a selection out of many
possible definitions. But two threads seem to emerge from literature and practice: (1) Average
reliability and (2) Variance of reliability. First, we look into how these two approaches get
operationalized. After that, we present the definition of reliability we adhere to in this
dissertation.
2.1.1 Average reliability
The first thing that comes to mind when thinking of reliability is that the object or process (tool,
system, organization…) should be effective ‘most of the time’, meaning that we implicitly think
in terms of averages. Often one can accept that something is not working, but it must work most
of the time. The following is a selection of different notions of average reliability (or the
probability thereof) in literature:
“*W]hat one can count upon not to fail in doing what is expected” (Weick & Sutcliffe, 2001, p.
91).
“System effectiveness is the probability that the system can successfully meet an operational
demand within a given time when operated under specified conditions” (Prasad et al., 2001,
p. 6).
“*T]he probability that a system will perform satisfactorily for at least a given period of time
when used under stated conditions”(Prasad et al., 2001, p. 2).
“System reliability is a measure of how well a system meets its design objective and it is
usually expressed in terms of the reliabilities of the subsystems or components” (Prasad et al.,
2001, p. 2).
“The probability of performing a specified function without failure under given conditions for
a specified period of time” (Arblaster, Griffith, Hochmuth, Howells, & Reeves, 2005, p. 28).

4 Two Cases in High Reliability Organizing: a Hermeneutic Reconceptualization
2.1.2 Variance of reliability
Another characteristic of reliability is its spread. Here we make a distinction between the total
time an object or process is reliable on the one hand, and the time spans between periods of
reliability and unreliability and the duration of this unreliability on the other hand. The following
is a sample indicating how this notion of variance of reliability is dealt with in literature:
The unusual capacity to produce collective outcomes of a certain minimum quality repeatedly
(Hannan & Freeman, 1984, p. 153): “In a world of uncertainty, potential members, investors,
and clients may value reliability of reliability more than efficiency. That is, rational actors may
be willing to pay a high price for the certainty that a given product or service of a certain
minimum quality will be available when it is needed. Reliability depends on the variance of
reliability (including its timeliness) rather than its average level. Organizations have higher
levels of reliability than ad hoc collectives in two senses: one cross-sectional and the other
temporal. Cross-sectional reliability means that an outcome chosen at random from a
population of organizations will have a lower variance than one chosen at random from a
population of other kinds of producers. Temporal reliability means the variability over time in
the quality (including timing of delivery) of an outcome is lower for those produced by
organizations than for those produced by ad hoc groups. Overall, we argue that the distinctive
competence of organizations is the capacity to generate collective actions with relatively
small variance in quality”.
“[T]he lack of unwanted, unanticipated, and unexplainable variance in reliability” (Hollnagel
1993, p. 51, Cited in Weick, Sutcliffe, & Obstfeld, 1999, p. 86).
“Performing reliability, maintainability and availability assessments of equipment, machines,
subsystems and system, reliability being the probability that an item will perform a required
function under stated conditions for a stated period; for example, how often a failure may
occur, the estimated mean time between failures, the mean repair times and the availability
and effectiveness factors” (Azadeh, 2000, p. 209).
For a computer engineer, IS reliability might stand for a small ‘mean time between failure’, or
an acceptable ‘mean time to repair’, or an agreed upon Failure unit (FIT).4
The aggregation of average reliability and spread in reliability is called availability. Availability
enables users who need to access information to do so without interference or obstruction, and
to receive it in the required format (Whitman & Mattord, 2008, p. 9). Availability does not mean
that information is automatically accessible to any user, but it needs verification of the user to
become reachable to that nominated user. Purposefulness is built in the term ‘availability’ – it
has connotations about benefit, relevancy, understanding, meaningfulness, effectiveness, and
immediate usability (Kuusisto, 2006, p. 2). A widely accepted equation for availability (Fox &
Patterson, 2002) is: Availability=MTTF/(MTTF+MTTR), where MTTF is the mean time to failure of
a system or subsystem (i.e. the reciprocal of reliability), MTTR is its mean time to recovery, and
Availability is a number between 0 and 1. The equation suggests that to improve availability, a
10x decrease in MTTR (for example) is just as valuable as a 10x increase in MTTF.
2.1.3 Our definition
So what determines these components of reliability? As can be derived from our discussion
above, the element time plays a central role. Note also that reliability is not value-free and also

Introduction 5
that its meaning depends very much on the context. The complexity of finding a good definition
of reliability is best captured by Rochlin: “The criteria for and evaluation of reliability, whether
defined positively by the dynamic of organizational structure and culture or negatively as the
avoidance of seemingly inevitable errors and failures, are even more demanding than the
traditional search for definitions and models of organizational effectiveness. Seen in this light,
the problem of arriving at a consensual definition becomes a primary research issue rather than
a disciplinary side-alley” (Rochlin, 1993, p. 30).
For the purpose of our research we integrate the various components of reliability into the
following generic definition of reliability:
Reliability is the system outcome that can be described as safe, effective and
efficient, in terms of average and variance.
It is the starting point for the decomposition that follows.
2.2 Reliability decomposed We approach the reliability notion from its relationship to adjacent notions: Safety (2.2.1) and
Performance, which in its turn can be decomposed as Effectiveness (2.2.2) and Efficiency (2.2.3).
We posit that all these notions are subsets of reliability, as can be derived from Figure 1.1.
Figure 1.1 - Reliability decomposed
In what follows, we deal with these concepts in more detail, limiting ourselves to those aspects
that are relevant to our research. First, we examine what can be learned from the study on
safety in view of overall organizational reliability. Next, we argue in what way insights from
engineering can contribute to organizational effectiveness. Finally, our focus is on the efficiency
paradigm, and more, in particular on the inherent tension with effectiveness.
2.2.1 Safety
A great deal of reliability literature is on safety, not reliability. There is an intuitive link between
both notions, so the study of safety in this sector can contribute to what we know on reliability
in a broader sense. In order to do so, the precise nature of safety needs to be explained first. We
do so by drawing mainly on findings from the nuclear energy sector, but first we provide a
Reliability
Safety
Perform-ance
Effi-ciency
Effec-tiveness
Average Variance

6 Two Cases in High Reliability Organizing: a Hermeneutic Reconceptualization
framework regarding safe and unsafe industries. In view of their potential contribution to the
understanding of reliability, we look at the difference between incidents, accidents and crises.
Incidents and accidents
Scholars5 in the field of reliability studies and safety all have their own interpretation of the
terms incident, accident and crisis. Perrow, for example, has proposed a taxonomy of incidents
and accidents, and to understand his conclusions it is important to know what he means by an
accident, and what he does not mean by it (1999, p. 65-66). A comparative analysis of these
terms, may allow us to gain insight in the mechanisms they originate from. Perrow defines
incident as a failure involving damage that is limited to parts or a unit, whether the failure
disrupts the system or not, meaning that the output ceases or decreases to the extent that
prompt repairs are be required (Perrow, 1999, p. 66). An accident is defined by Perrow as “an
event that is unintended, unfortunate, damages people or objects, affects the functioning of the
system of interest, and is non-trivial” (Perrow, 1999). There are two types of accidents:
component failure accidents, which “involve one or more component failures (part, unit, or
subsystem) that are linked in an anticipated sequence” and ‘normal accidents,’ or system
accidents (Perrow, 1994). Normal accidents encompass multiple component failure accidents,
and they are ‘normal’ because we expect that they will occur at some time in complex systems.
Perrow (1994) explains: “Two or more failures, none of them devastating in themselves in
isolation, come together in unexpected ways and defeat the safety devices [of a system] – [that
is+ the definition of a ‘normal accident’ or system accident”.
Crises
Pearson and Clair (Pearson & Clair, 1998) provide the following definition of crisis: a low-
probability, high impact event that threatens the viability of the organization and is
characterized by ambiguity of cause, effect, and means of resolution, as well as by a belief that
decisions must be made swiftly. This leads to the following characteristics:
highly ambiguous situations where causes and effects are unknown
a low probability of occurring but posing a major threat to the survival of an
organization.
little time to respond
surprise organizational members
dilemma in need of decision or judgment that will result in change for better or
worse.
Further Pearson and Clair (1998, p. 64) mention that all crises share the following characteristics:
a breakdown in the social construction of reality;
organizational leadership which is likely to come under close scrutiny. Turnover
of (or revolt against) leadership may be likely as well;
organizational members are likely to question the organization’s cultural beliefs
and to feel a need for a transformation of the culture;
crisis management is unlikely to be successful without a reformation of
organizational leadership and culture.

Introduction 7
Human factor
It has been reported upon in many disciplines that a compelling number of causes of accidents
and incidents can be attributed to human action so that there is a wide-spread consensus that
human error plays an important role in unreliability (Reason, 1990;1997). Bea and Moore (1993)
and Roberts and Bea (2001a) report up to 80% of maritime accidents finding their root in human
failure. Azadeh (2000) argues the same for security failures in organizations but also shows that
the technical failure should not be minimized either. Recent research on the Chernobyl nuclear
disaster (Salge & Milling, 2006, p. 89) has pointed out that this accident was caused by the
combination of human failures in the design of the reactor and on-line operations6. As such, this
suggests that a pure univocal emphasis on either human error (e.g. Dörner, 1996) or technical or
‘system’ failure (e.g. Perrow, 1999) cannot offer valuable insights.
Safe and unsafe industries
Amalberti et al. (2005) provide a framework (shown in Figure 1.2) for categorizing the risk of
catastrophic events across industries. They posit that the safe and unsafe industries differ
greatly since some sectors continue to have a low safety level (for example, transport by micro-
light aircraft or helicopter, and emergency surgery), some are stuck at an average safety level
(for example, road safety and occupational accidents in trade or fishing), some are at good levels
(for example, the petrochemical industry and anesthesiology), and the best have achieved safety
levels beyond 10–6 (for example, the nuclear power and civil aviation industries).
Figure 1.2 - Average rate per exposure of catastrophes and associated deaths in various industries and
human activities (Amalberti, Auroy, Berwick, & Barach, 2005, p. 758 - Reproduced with permission from
the Annals of Internal Medicine)
The convergence of safety and reliability in the nuclear energy sector
The nuclear energy sector, in recent years, has come to pay considerable attention to the
notions ‘safety’ and ‘safety culture’ (IAEA, 2002a;IAEA, 2002b). This is a particularly interesting
phenomenon as in the nuclear context safety and reliability seem to converge to a great extent.

8 Two Cases in High Reliability Organizing: a Hermeneutic Reconceptualization
Indeed, if the nuclear installation is performant it is also considered to be safe and, vice versa, in
order to be safe it has to be performant. Fucks (2004) puts it as follows: “Reliability is different
from nuclear safety because it indicates the quality of a device or equipment to function as
intended. Reliability is, for some part of the system or for the system as a whole, the probability
of non-failure”.7 In this she clearly makes the distinction between reliability (fiabilité) and safety
(sûreté). Nevertheless, especially in the field of nuclear energy production, both notions are
interrelated: human safety cannot be seen independent from reliability. In the same way as in
the case of mainstream organizations where operational reliability did not emerge suddenly,
also in the nuclear sector the topic of nuclear safety went through some phases before it got
shaped as we know it today. Fucks (2004, p. 24-25) distinguishes three major phases during
which quite an evolution took place from an engineering approach in the 1970s, over a technical
approach of human error in the 1980s, towards a human factor approach 1990s that valorizes
the existence and influence of a safety culture and the organizational factor. What started in the
nineties of the last century as an emphasis on the ‘organizational accident’ (Reason, 1997) is
reinforced at the beginning of this decennium by adding yet another dimension, that of a set of
mind oriented towards safety that goes beyond technical, procedural or managerial aspects of
safety (Fucks, 2004, p. 25).
2.2.2 Effectiveness
Lessons from engineering
We adhere to a quite straightforward definition of effectiveness: Something that is effective
works well and produces the results that were intended. In this dissertation we focus on the
non-technical aspects of effectiveness. We are therefore unconcerned with machine reliability
(e.g. in terms of technical redundancy) but rather are interested in aspects of reliability resulting
from procedure, culture, organization design, human resources management, co-ordination
mechanisms, etc. Nevertheless, we can learn from the reliability engineering principles for our
purpose because it is a much older discipline than organizational reliability and offers valuable
and tested jargon and insights. The primary goals of reliability are the following (Prasad et al.,
2001, p. 1):
1. Keeping the system as simple as is compatible with the reliability requirements;
2. Increasing the reliability of the components of the system;
3. Using parallel redundancy for the less reliable components;
4. Using standby redundancy which is switched to active components when failure occurs;
5. Using repair maintenance where failure components are replaced, but not immediately
switched in, as in (4);
6. Using preventive maintenance such that components are replaced by new ones
whenever they fail, or at some fixed interval, whichever comes first;
7. Using better arrangement for exchangeable components;
8. Using large safety factors or product improvement management program; and
9. Selecting burn-in components that have high infant-mortality.
Noteworthy is that Prasad and colleagues (2001, p. 1) argue that the implementation of the
above steps to improve system reliability will normally consume resources. A balance between
system reliability and resource consumption is essential.

Introduction 9
The above deals with the reliability of a ‘system’. A system can be characterized as a group of
stages or subsystems integrated to perform one or more specified operational functions (Prasad
et al., 2001). A ‘part’ or ‘element’ is the least subdivision of a system or an item that cannot
ordinarily be disassembled without being destroyed. A ‘component’ is a collection of parts which
represent a self-contained element of complete operating system. ‘Unit’ and ‘component’ are
synonymous; They are assembled to form a ‘stage’ or ‘subsystem’ (Prasad et al., 2001, p. 2).
In describing the reliability of a given system, it is necessary to specify:
the equipment failure process;
the system configuration which describes how the equipment is connected and the rules of
operation;
the state in which the system is defined to be failed.
The equipment failure process describes the probability law governing these failures. The system
configuration, on the other hand, defines the manner in which the system-reliability function will
behave. The third consideration in developing reliability function for a non-maintained system is
to define the conditions of a system failure (Prasad et al., 2001, p. 2).
Lessons from organization theory
Since Taylor and his Scientific Management till today, the topic of organizational effectiveness
has got a lot of attention. Especially the relation between effectiveness and efficiency has driven
research for many years. The general observation in this respect is that, although the best
performing organizations are both effective and efficient (Katz & Kahn, 1978), there may be
trade-offs between the two. Thus, an organization can be effective, efficient, both, or neither
(Ostroff & Schmitt, 1993).
With the publication of popular books such as Peters’ and Waterman’s In Search of Excellence
(1982), excellence (quality, continuous improvement, transformation, revitalization and so on)
was brought to the forefront. This quality focus has dominated management research and
practice until the beginning of the new millennium. Then the tone changed from an efficiency
focus to one that fosters effectiveness. The new creed became managing (operational) risk, with
much less focus on efficiency as a result. The problem with this literature is captured by Roberts:
“To the extent that the organizational literature deals with reliability at all, it deals with
effectiveness. However, the effectiveness literature deals with a whole range of outcomes, none
of which are reliability” (Roberts, 1990a, p. 103). Such a decomposition shows reliability is about
flexibility because a system that is perfect in repeating what it has done successfully in the past
has no guarantee that it will be able to deal with unpredictability, i.e., future events for which
there is no link with the past or the present (Weick et al., 1999, p. 86).
Because of this shift from efficiency towards reliability scholars began to investigate non-normal
organizational reliability situations from the mid eighties onwards (Whetten & Cameron, 1994),
including high reliability systems.
The combination of these two trends (i.e. a focus on effectiveness and the study of non-normal
organizational reliability) forms the basis for the research on organizational effectiveness in this
dissertation.

10 Two Cases in High Reliability Organizing: a Hermeneutic Reconceptualization
2.2.3 Efficiency
Whereas effectiveness refers to an absolute level of either input acquisition or outcome
attainment, efficiency refers to an input-output ratio or comparison (Ostroff & Schmitt, 1993, p.
1345). This description of both notions ignores the complex and paradoxical nature of the
relation between them. In this subsection, we tackle the duality that exists between them. To
this end we introduce efficiency-related concepts that are necessary for our line of reasoning.
Slack
It is assumed that organizational slack, in terms of time and human resources is important for
organizations coping with the challenges of the 21st century (Lawson, 2001). Increasingly
complex systems and technologies require more, not less, time for monitoring and processing
information. Flexibility and adaptation, creativity and innovation only exist when the
organization allows for sufficient slack in its processes. However, this is more easily said than
done since slack is often sacrificed on the altar of short-term efficiency. Even though there
seems to be a consensus that driving slack out of the processes is of no avail to long-term
effectiveness and that it is recommended that not all resources be committed to immediate
output efforts, it is the imperative of being profitable in the short run that is the main driver for
organizing.
For these reasons, any balance between effectiveness and efficiency is doomed to be brittle. Our
claim is that organizations capable of dealing with this fragility consistently, can be called high
reliability organizations.
Efficiency favors effectiveness
The general belief concerning the duality between effectiveness and efficiency holds that an
orientation towards effectiveness is a better determinant for organizational reliability than an
orientation towards efficiency (Lewin & Minton, 1986). However, following Ostroff and Schmitt
(1993), we hypothesize the opposite. In their study on school effectiveness and efficiency they
found support for the importance of a high level of cost consciousness. The acknowledgement of
this paradox is the basic thread running through the organizational choice model on competing
values (Quinn & Rohrbaugh, 1983). With this study we want to continue this line of research.
The question that comes to mind in this respect is whether reliability is a matter of adding
measures on top of each other or is it a matter of choosing measures to implement on the one
hand, and eliminating some other measures on the other hand? In other words: is it an additive
model8 or a ‘replacement’ model?9 The risk persists that one source of unreliability is replaced
by another source of unreliability.
Whereas ‘Excellence’ (Peters & Waterman, 1982) was the management creed of the eighties and
nineties of the previous century, the paradigm of this decade seems to have shifted towards
‘Reliability’. The reliability paradigm shows itself through an emphasis on operational risk
management in the aftermath of the Barings, Enron, WorldCom, Parmalat or Société Générale
failures, to name just these. The question that can be heard in boardrooms is: ‘Can we be certain
that our systems – in the broadest sense – will be sufficiently functional to guarantee business
continuity?’ And also: ‘What measures do we have in place to guarantee a sufficient recovery?’
This change is quite remarkable because also in business, until recently, reliability was not an
issue. There simply was no reason to take notice of it: business environments were more stable

Introduction 11
and less complex than they are today and a compelling regulation, forcing the organization to
put the reliability issue on the board table, was lacking. Besides, over the years the idea had
emerged that systems are safe and reliable. Indeed, most systems have a very impressive
reliability track record. Therefore, when thinking about reliability, the null hypothesis is that a
system is reliable and, because failure is the test criterion used, we can never accept that
hypothesis simply because we have failed to reject it over some given period of time (Wolf &
Berniker, 2008).
Therefore it is no wonder that reliability – although considered an organization’s bottom line –
has not revealed all its secrets in full yet. We can assume there still are some ‘dark sides’ that
need enlightenment, even sides we have not even started to realize they exist. With this study
we wish to address this dark side of reliability and while full comprehension is unlikely, but that
nevertheless some relevant progress can be made by changing perspectives.
2.3 Methods for evaluating reliability
2.3.1 Cartesian reductionism – Risk equation
Since the Renaissance, and until the beginning of the previous century, scientist were guided by
a strong Cartesian belief that if a system could be reduced to its basic forces and one could
compute how those forces interacted, one could predict anything (Longstaff, 2003, p. 11). The
study of reliability and risk would be reduced to an equation, its management to checklists,
analysis and evaluation. The method of the risk equation is the most straightforward and most
frequently used: “Risk is the uncertainty inherent in doing business; technically, it is the
probability associated with losses (or failure) of a system multiplied by the dollar loss if the risk is
realized” (Straub & Welke, 1998, p. 442).
This method has the appealing advantage that it is straightforward to understand, and – at least
at first sight – easy to implement and follow-up. This simplicity is deceiving, however, as has
been pointed out by several researchers. Baskerville, for instance, argues that even such simple
arithmetic becomes exceedingly complex because of “the interwoven nature of the wide variety
of threats, the vast array of safeguards, and the variance of levels of probability and loss that are
unique to every organization” (Baskerville, 2005, p. 6). He continues: “Threats and safeguards
are overlapping. As a consequence, a database of threats, probabilities, potential losses, and
potential safeguards can be complex” (Baskerville, 2005, p. 6).
Since modern times, we have learned a lot and in the post-modern era we live in, we have come
to realize that there is no such thing as a reliability or risk equation, much as this is desirable.
Nonetheless, some of the most important methods of assessing and evaluating risk and
reliability – for an overview of some of the methods, see Table 1.1 – seem to swear by the old
adagio of reductionism, be it with the necessary annotations or even self-criticism.
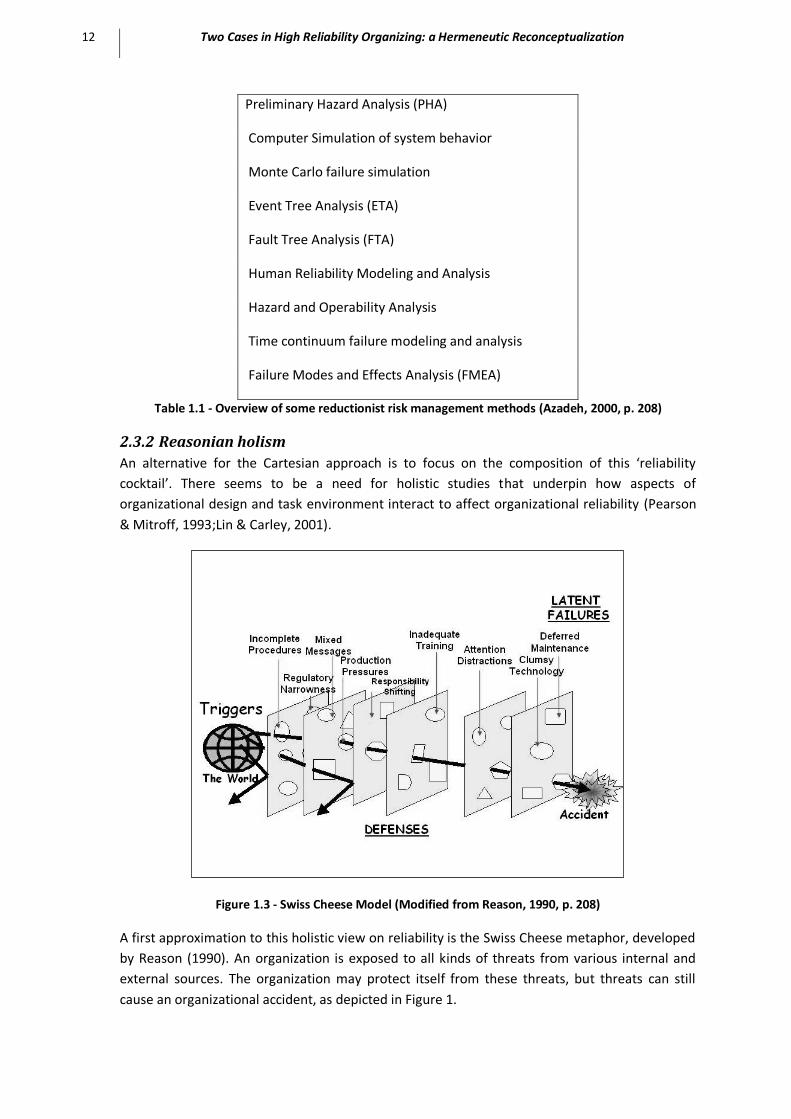
12 Two Cases in High Reliability Organizing: a Hermeneutic Reconceptualization
Preliminary Hazard Analysis (PHA)
Computer Simulation of system behavior
Monte Carlo failure simulation
Event Tree Analysis (ETA)
Fault Tree Analysis (FTA)
Human Reliability Modeling and Analysis
Hazard and Operability Analysis
Time continuum failure modeling and analysis
Failure Modes and Effects Analysis (FMEA)
Table 1.1 - Overview of some reductionist risk management methods (Azadeh, 2000, p. 208)
2.3.2 Reasonian holism
An alternative for the Cartesian approach is to focus on the composition of this ‘reliability
cocktail’. There seems to be a need for holistic studies that underpin how aspects of
organizational design and task environment interact to affect organizational reliability (Pearson
& Mitroff, 1993;Lin & Carley, 2001).
Figure 1.3 - Swiss Cheese Model (Modified from Reason, 1990, p. 208)
A first approximation to this holistic view on reliability is the Swiss Cheese metaphor, developed
by Reason (1990). An organization is exposed to all kinds of threats from various internal and
external sources. The organization may protect itself from these threats, but threats can still
cause an organizational accident, as depicted in Figure 1.

Introduction 13
Reason argues that each of the levels present in Figure 1.3 forms a layer that can prevent inputs
of a malicious nature (‘threats’) from propagating through the entire system. Each layer forms a
line of defense against specific types of threats. Because of the obvious analogy, this model of
perforated layers, or slices, is referred to as the ‘Swiss Cheese Model’ (Reason, 1990;Reason,
1997). Defenses, barriers, and safeguards occupy a key position in the system approach. High
technology systems have many defensive layers: some are engineered (alarms, physical barriers,
automatic shutdowns), others rely on people (surgeons, anesthetists, pilots, control room
operators), and others depend on procedures and administrative controls. For the purpose of
our research, the Swiss Cheese Model, we formulate three remarks.
First, in an ideal system, each defensive layer would be intact or should have a limited number of
‘holes’. Together, they should form a defense system that prevents threats of any kind to
effectuate in the system. However, in practice, in each of the layers in Figure 1.3 holes do exist,
allowing some threats to pass through a line of defense. Although a single threat crossing one of
the defenses may not directly result in disaster, such a threat can trigger another event or risk,
which may in the worst-case slip through the next line of defense, depending on where exactly
the gaps in the layers are.
Second, an additional problem is that – unlike in the Swiss cheese – the holes are continually
opening, shutting, and shifting their location. This is due to changes in the organization that are
bound to occur continuously as the organization develops and changes over time, the gaps in
the subsequent layers will be dynamic10. The consequence is that eventually, at one point in
time, the holes will line up, allowing a threat to escalate throughout the various layers of the
organization. The result is an organizational accident: a latent danger becoming manifest as it
bypasses all built-in defense mechanisms, routing its way through the holes in the system.
Third, because of the dynamic nature of organizing, when one hole is plugged, another one may
emerge elsewhere. Traditional risk management in such a setting is of not much use: finding the
holes in the cheese (risk identification), estimating their importance in terms of impact and
frequency (risk assessment), and finally, plugging them by effectuating the appropriate response
(risk mitigation). The mainstream risk frameworks and best-practices, evangelized by consultants
and business schools alike, propagate this same approach as sanctifying. We posit that
guaranteeing tomorrow’s reliability by managing today’s risks is at best a partial solution for the
foreseeable problems, but at worst, tells nothing about the future reliability in terms of the
management of the unforeseeable ones.
Fourth, as important as the holistic view offered by the systems thinking perspective, is the
constructivist triangulation approach we adhere to (Berghmans, Van Den Eede, & Van de Walle,
2008). In our philosophical assumption of the ontological and epistemological character of
reliability, risks cannot be treated as a physical attribute ‘out there’ that can be measured
(Oscarson, 2007). Risk identification based on this worldview assumes risks to be mediated
through social experience and interaction (Renn, 1998). This stems with a constructivist view,
which – in contrast to the objectivist approach – sees risk as a social artifact, produced by social
groups or institutions, and determined by structural forces in society (Oscarson, 2007).
From the above, one could derive that in a very complex environment, a univocal approach to
risk and reliability is not what is needed. More than one mechanism, tool, backup, etc. is

14 Two Cases in High Reliability Organizing: a Hermeneutic Reconceptualization
needed. The danger however is that too many mechanisms might interrelate in an unforeseen
manner. This idea refers to the notion of redundancy where you also see a two-sided cutting
sword. Redundancy is good, but too much redundancy is dangerous because the defense
mechanisms might interrelate, hence endangering the complete system. Besides, the
conventional practice of managers is to limit redundancy, to obtain the best possible fit to
contextual conditions, and to maximize efficiency (Nohria & Gulati, 1996). This viewpoint is
reflected in organization and economic theory. Transaction cost economists, for instance,
consider redundancy synonymous with resource waste. Agency theorists go even one step
further and think of redundancy as an opportunity for actors to pursue their own interests
rather than act in the interest of the organization (Jensen, 1993).
On the other hand, it has been acknowledged that redundancy also has positive aspects. Cyert
and March (1963), for example, proposed that organizations with slack find it easier to resolve
goal conflicts between political coalitions, because redundant structures offer alternative
options. They distinguish between three types of redundancy: (1) Information redundancy, (2)
Task redundancy and (3) Relation redundancy. Information redundancy could be defined as the
amount of unutilized possibilities to carry information. Once more, also this type of redundancy
has an upside and downside component. Carley (1990), for instance, pointed out that increasing
information redundancy may not only be a stimulus for (organizational) learning, leading to an
increase in reliability, but that at the same time it might be detrimental to reliability because it
adds to task complexity. As such, it is vital to find the balance between information redundancy
and task complexity. A typical example is provided by Jervis (1997, p. 570): “Adding redundant
safety equipment makes some accidents less likely but increases the chances of others due to the
operators greater confidence and the interaction effects among the devices”.
3 Triangulation If we genuinely want to understand more about reliability, we believe we must do so (1) by
relying on multiple disciplines, (2) by taking a systems thinking perspective, (3) by acknowledging
and fostering paradox and (4) by looking beyond the boundary.
3.1 Multidisciplinary A first road that can lead to understanding more about reliability is to study the implications of
alternative organizational choices in detail and to assess their impact on behavior, as this
behavior is known to shape overall organizational reliability (Bourrier, 2005, p. 100). The
numerous recent examples of collapses of organizational reliability (supra) teach that risks are
not homogenous by nature as they involve multiple aspects. Therefore, their management must
be multidisciplinary as well. For this reason, we make use of organization theory (in particular
organization design and organization behavior theory), economics, as well as information
systems and integrate theory by looking through these lenses. It is generally accepted that
dealing with a complex system involves a variety of disciplines (Azadeh, 2000, p. 210).
3.2 Systems thinking A second guideline is that one must be alert to critical problems falling between disciplines.
There is a need for an integrated method to identify gaps at interfaces and any overlooked weak
points. Indeed, the danger lies in the system, not in the components (Azadeh, 2000, p. 206).

Introduction 15
Hence, the gaps between the components are what should be the object of our study. Such calls
for a holistic kind of thinking, also known as systems thinking (McLucas, 2003;Alter, 2004).
Various approaches to organization studies are feasible, systems thinking being one of them,
even though “[systems thinking] can hardly be regarded as a new approach to scientific thought”
(Koontz, 1980, p. 180). For our own research, we take the way Scott Snook (2002) has managed
to identify these gaps in his application of systems thinking. This is explained next.
In what follows we subsequently address the nature of systems, their boundaries and of thinking
in an effort of finding out in what way they are valuable for understanding reliability.
Ludwig von Bertalanffy has described a system as “an entity which maintains its existence
through the mutual interaction of its parts” (Bellinger, 2008b). Crucial in the concept of system is
the fact that there is mutual interaction (cf. interactive complexity) which will over time lead to
emergent behavior that again is inherently part of the system. This interconnectedness in
combination with the time dimension will lead to characteristics that cannot be found as a
characteristic of the system’s individual components (Bellinger, 2008b). As a rule, people have
inadequate understanding of systemic behavior (Sterman, 1989). This means that often they
have no awareness for the drama that goes along with even a small failure or disruption.
Presumably, it is beyond their cognitive, meta-cognitive and affective capabilities so that they
notice too late what is really going on or that they make the wrong decisions to mitigate or
compensate for what is happening. This interconnectedness is what distinguishes systems from
non-systems.
In fact, systems thinking theorist Peter Senge advises against the bias of looking for problem
causes in convenient places, to look beyond the system boundary (Moberg, 2001, p. 21):
“[There] is a fundamental characteristic of complex human systems: ‘cause’ and ‘effect’ are not
close in time and space. By ‘effects’, I mean the obvious symptoms that indicate that there are
problems ... By ‘cause’ I mean the interaction of the underlying system that is most responsible
for generating the symptoms, and which, if recognized, could lead to changes producing lasting
improvement. Why is this a problem? Because most of us assume they are—most of us assume,
most of the time, that cause and effect are close in time and space” (Senge, 1990, p. 63).
One such view is systems thinking. (Successful) Systems thinking is about being able to see the
whole picture or context of a situation and its interconnections to its environment
(Wolstenholme, 2003, p. 20). Such a perspective enables unintended consequences of well-
intended actions to be pre-empted and minimized. Systems thinking reverses the three-stage
order of Machine-Age thinking:
(1) decomposition of that which is to be explained;
(2) explanation of the behavior or properties of the parts taken separately, and;
(3) aggregating these explanations into an explanation of the whole.
Note that this third step corresponds to synthesis.
Opposed to the Machine-Age thinking, the systems approach has a different characterization,
also three steps:
(1) Identify a containing whole (system) of which the thing to be explained is a part;

16 Two Cases in High Reliability Organizing: a Hermeneutic Reconceptualization
(2) Explain the behavior or properties of the containing whole and;
(3) Then explain the behavior or properties of the thing to be explained in terms of the role(s) or
function(s) within its containing whole.
Note that in this sequence, synthesis precedes analysis.
In analytical thinking, the thing to be explained is treated as a whole to be taken apart. In
synthetic thinking, the thing to be explained is treated as a part of a containing whole. The
former reduces the focus of the investigator; the latter expands it. These two approaches should
not (but often do) yield contradictory or conflicting results since they are complementary.
Development of this complementarity is a major task of systems thinking. Analysis focuses on
structure; it reveals how things work. Synthesis focuses on function; it reveals why things
operate as they do.
The cure for this deeply rooted practice can be best described as systems thinking. It forms the
backbone of this dissertation. Systems thinking suggests that when we understand the structure
of a system, we are in a much better position to understand and predict the behavior of the
individual elements (people) and their relationships and can therefore make better decisions.
Everybody's consciousness is limited by space and time, which presumes that a human being is
necessarily unable to know the world in its entirety. In this respect, systems thinking can serve
as an antidote for prejudice. In what follows we describe Reasonian holism as a way to go
beyond this innate limitation.
3.3 Paradox The notions of opposites, contradictions, dialectics, tensions, dilemmas, and paradoxes
constitute an important basis for social science theorizing (Das & Teng, 2000, p. 84). This should
not come as a surprise since all organization is founded on paradox (Clegg, da Cunha, & Cunha,
2002, p. 483-484). On the one hand, an organization consists of independent human beings who
freely commit to cooperate but on the other hand – in order to make this cooperation feasible –
see their freedom bounded by rules and control. In essence, this is a paradox of centripetal (i.e.
constraining) structure vs. centrifugal (i.e. enabling) structuring (Clegg et al., 2002). “Routines,
resource allocations, interpretive schemes and norms, are all examples of ‘poles’ that create
structural constraint. Structuring will be centrifugal and enabling. It is agency and everyday
practice that accomplishes structuring”. In our view, this last statement explains the persistence
of this paradoxical situation. A new deal of organizing is needed to cope with an endless array of
conflicting choices by creating an organizational culture with shared beliefs, values and
competencies without encouraging a herd mentality and trampling on the uniqueness of
individual personality and creativity (Thite, 2004, p. 139).
We believe such may be particularly true when studying a multifaceted reality like organizational
reliability. So far, we have illustrated that reliability is paradoxical by nature. In order to be
reliable, an organization has to be flexible and stable, efficient and effective, in the long run, but
also in the short run, etc. In general terms, logical paradox can be defined as "two contrary, or
even contradictory, propositions to which we are led by apparently sound arguments" (van
Heigenoort 1967 cited by Poole & van de Ven, 1989, p.563). Typical of a paradox is that these
opposites are clearly present and are generally accepted as worth striving for (Quinn &

Introduction 17
Cameron, 1988). Acknowledging this paradox and trying to understand or manage it is a far
better plan than trying to categorically choose for either of the two extremes. Indeed, such a
choice would merely result in a pendulum swinging between the two extremes, leading to a
tremendous loss of energy.
For this reason theory building has to “move away from ‘consistency’ and towards ‘the resolution
of tensions or oppositions’” (Poole & van de Ven, 1989, p. 563). Such an approach would mean
the emergence of "a dynamic theory that can handle both stability and change, that can
consider the tensions and conflicts inherent in human systems" (Quinn & Cameron, 1988, p. 27).
Poole and van de Ven posit that theories are “not statements of some ultimate ‘truth’ but rather
are alternative cuts of a multifaceted reality” (Poole & van de Ven, 1989, p. 563).
In this dissertation we follow Poole and van de Ven (1989, p. 562) in their methodology as they
distinguish four different modes of working with paradoxes:
1. accept the paradox and use it constructively (Opposition)
2. clarify levels of analysis (Spatial Separation)
3. temporally separate the two levels (Temporal Separation)
4. introduce new terms to resolve the paradox (Synthesis)
“A great deal can be learned from juxtaposing contradictory propositions and assumptions, even
if they are incompatible. Theorists may feel a strain toward cognitive consistency, but that does
not mean that theories must fit together neatly. Paradoxes remind theorists of this inconsistency
and enable them to study the dialectic between opposing levels and forces which are captured in
different theories” (Poole & van de Ven, 1989, p. 566). By contrasting theories, constructs and
concepts, we ask the questions that before were unuttered and attempt to make connections
that before were unthinkable. We temporally separate the levels on which they are analyzed by
making the distinction between (for instance) (1) individual vs. team vs. organization, (2)
collaborator vs. executive and (3) physical proximity vs. physical distance. Researchers who take
this approach must grapple with difficult and important theoretical problems. For instance:
despite much research on the aggregation of individual acts, attitudes, and preferences into
social actions, climates, and choices, these are still no completely satisfactory solution to the
paradox (Poole & van de Ven, 1989, p. 566). Finally, a set of new terms is needed to resolve the
paradox. “The resolution of paradoxes by level distinctions or temporal analysis leaves each set
of assumptions or processes basically intact. Both sides of the paradox are assumed
fundamentally sound, and the paradox is resolved by separating them and specifying how one
side influences the other. However, it is also possible that the paradox may stem from conceptual
limitations or flaws in theory or assumptions. To overcome these limitations it is necessary to
introduce new concepts or a new perspective” (Poole & van de Ven, 1989, p. 567). “However,
such advances are hard-won, and many apparent resolutions may lead to dead ends. When
perspectives radically shift, theorists may lose as well as gain. The new perspective may
oversimplify some issues or ignore the problems that originally gave rise to previous positions.
These risks are the price theorists pay for theoretical advances” (Poole & van de Ven, 1989, p.
567).

18 Two Cases in High Reliability Organizing: a Hermeneutic Reconceptualization
Throughout our research, we combine these four strategies of dealing with paradox. As such we
acknowledge the Genius of the ‘and’ (Graves & Waddock, 2000, p. 414) and oppose the Tyranny
of the ‘or’. In fact, the reconciliation between ‘or’ and ‘and’-like thinking lies in the notion of
ambiguity. Dealing with ambiguity is thinking in both the registers of ‘and’ and ‘or’.
3.4 Triangulation: multidisciplinary, system theoretic and
paradoxical This dissertation makes a start in acknowledging paradox and does so by proposing a system
theoretic perspective supported by a thorough triangulation of research theory and method. As
for theory, we build on High Reliability Theory (HRT) and SenseMaking (SeMa), while we
examine the role of Information Systems (IS) Fit. In the elaboration of this dissertation, we deal
with these issues in more detail. They are covered in Chapter 2. For method, we rely on
qualitative and quantitative data collection and analysis methods, the hermeneutic approach
underlying our research is presented in chapter 3, leading to a reconceptualization of our
theoretical framework in chapter 4. In chapter 5 the reconceptualized model is presented and
the propositions and hypotheses developed. They are analyzed in chapter 6 and discussed in
chapter 7.
3.4.1 Study unreliability as well as reliability
Management practice and literature tends to develop a bias towards the investigation of
successful organizations, thereby neglecting the research of failures (Denrell, 2003). Failures as
such are under-sampled which is dangerous because it is impossible to understand reliability if
one does not understand unreliability. The consequences are important. For instance (Denrell,
2003, p. 228), the fact that only successes are looked into, will mistakenly show that risky
behavior is rewarding in terms of reliability but this observation and conclusion does not take
into account that risk-taking in many cases has led to failure because these cases are under-
sampled. This might lead to a remarkable result in the sense that even if a practice is frequent
among organizations with high reliability, it does not follow that the practice is linked to success.
The most well-know example might very well be Peters’ and Waterman’s (1982) ‘In Search of
Excellence’. Like the drunken man who has lost his keys, the organization study discipline has a
tendency to look where the light is (Clarke, 1993;Roberts & Bea, 2001b). Instead they should pay
attention to a language that uses a plethora of underspecified formulations as a vehicle through
which one could work on difficult conceptual problems (Levine, quoted in Orton & Weick, 1990,
p. 204). One of the main conceptual problems is how to combine reliability and flexibility (c.q.
effectiveness and efficiency; bureaucracy and adhocracy). These concepts are worth pursuing
but difficult to realize simultaneously (Figure 1.4). This observation explains the almost
continuous swinging of the pendulum between extremes such as centralization and
decentralization, trust and control.

Introduction 19
Figure 1.4 - Combining Reliability and Flexibility (Van Den Eede, Kenis, & Van de Walle, 2004)
As discussed above, if the purpose is to find out what constitutes reliability it cannot be found in
any single element of the system. Hughes et al. after having investigated reliability in British air
traffic control, expressed it as follows (Hughes, Randall, & Shapiro, 1992, p. 119): “It is certainly
not to be found in the equipment….for a period of several months during our field work it was
failing regularly….Nor is it to be found in the rules and procedures, which are a resource for safe
operation but which can never cover every circumstance and condition. Nor is it to be found in
the personnel who, though very highly skilled, motivated and dedicated, are as prone as people
everywhere to human error. Rather we believe it is to be found in the cooperative activities of
controllers across the ‘totality’ of the system, and in particular in the way that it enforces the
active engagement of controllers, chiefs, and assistants with the material they are using and with
each other”.11 Behavior that is asymmetric (cf. Snowden) from the symmetric behavior that
could be expected when reading the procedures and organization charts. Although it is useful to
have a clear understanding of every element within a system, from a systems perspective, this
will not necessarily lead to a complete understanding of the whole system. This vision has some
resemblance with an old Indian story about the blind men and the elephant. They all touched a
different part of the animal. When they tried to describe what they felt, everyone gave a
different description, which leads to an inconsistent total image of the animal (Aerts, 2008, p.
45).
We adhere to Weick’s translation of Ashby’s law of requisite variety – only complexity can cope
with complexity – to the way organization studies should be conducted, namely to complicate
yourself (Weick, 1995, p. 56). This becomes obvious in the conceptual models built, the
combination of techniques that are used, and the underpinning theoretical frameworks. It
becomes even more obvious in the use of constructs stemming from High Reliability Theory
(HRT) or SenseMaking (SeMa). Such constructs have the potential of taking the discussion a bit
further than the traditional conclusions from contingency theory. We rely on them to address
the question whether there are design and behavioral characteristics that are robust (Lin &
Carley, 2001, p. 5) – in the sense of stable and flexible enough – to allow for an ‘all-seasons’
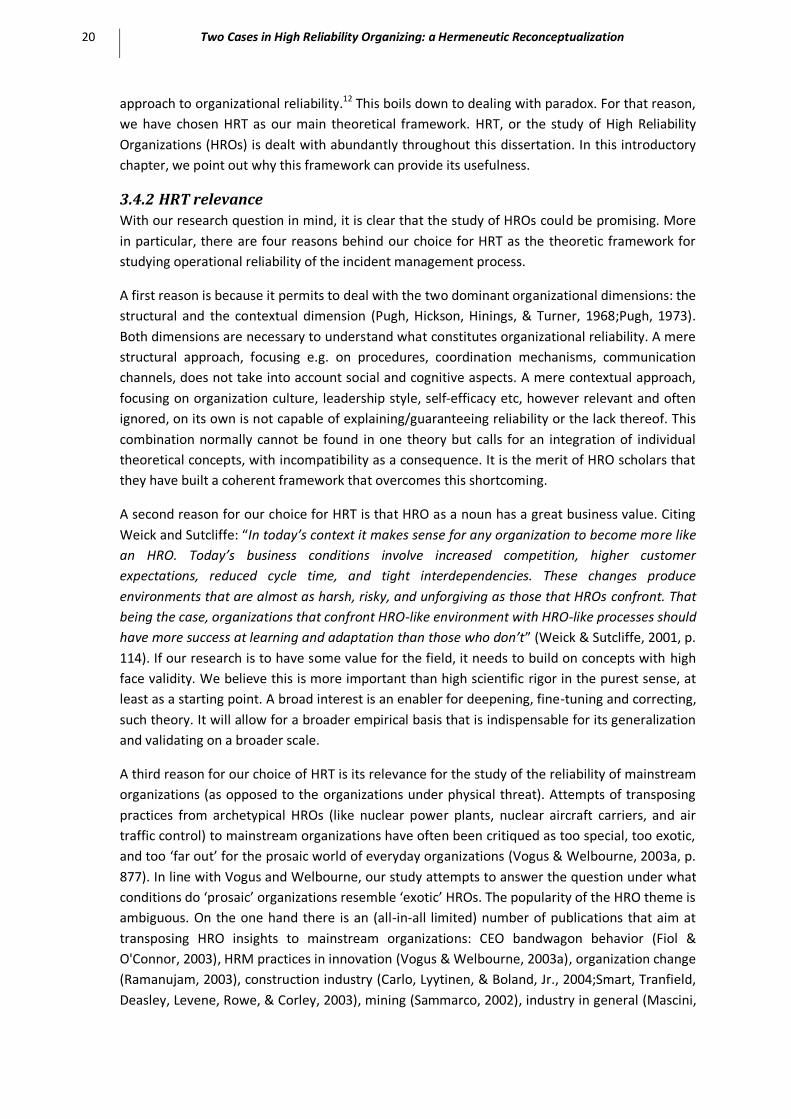
20 Two Cases in High Reliability Organizing: a Hermeneutic Reconceptualization
approach to organizational reliability.12 This boils down to dealing with paradox. For that reason,
we have chosen HRT as our main theoretical framework. HRT, or the study of High Reliability
Organizations (HROs) is dealt with abundantly throughout this dissertation. In this introductory
chapter, we point out why this framework can provide its usefulness.
3.4.2 HRT relevance
With our research question in mind, it is clear that the study of HROs could be promising. More
in particular, there are four reasons behind our choice for HRT as the theoretic framework for
studying operational reliability of the incident management process.
A first reason is because it permits to deal with the two dominant organizational dimensions: the
structural and the contextual dimension (Pugh, Hickson, Hinings, & Turner, 1968;Pugh, 1973).
Both dimensions are necessary to understand what constitutes organizational reliability. A mere
structural approach, focusing e.g. on procedures, coordination mechanisms, communication
channels, does not take into account social and cognitive aspects. A mere contextual approach,
focusing on organization culture, leadership style, self-efficacy etc, however relevant and often
ignored, on its own is not capable of explaining/guaranteeing reliability or the lack thereof. This
combination normally cannot be found in one theory but calls for an integration of individual
theoretical concepts, with incompatibility as a consequence. It is the merit of HRO scholars that
they have built a coherent framework that overcomes this shortcoming.
A second reason for our choice for HRT is that HRO as a noun has a great business value. Citing
Weick and Sutcliffe: “In today’s context it makes sense for any organization to become more like
an HRO. Today’s business conditions involve increased competition, higher customer
expectations, reduced cycle time, and tight interdependencies. These changes produce
environments that are almost as harsh, risky, and unforgiving as those that HROs confront. That
being the case, organizations that confront HRO-like environment with HRO-like processes should
have more success at learning and adaptation than those who don’t” (Weick & Sutcliffe, 2001, p.
114). If our research is to have some value for the field, it needs to build on concepts with high
face validity. We believe this is more important than high scientific rigor in the purest sense, at
least as a starting point. A broad interest is an enabler for deepening, fine-tuning and correcting,
such theory. It will allow for a broader empirical basis that is indispensable for its generalization
and validating on a broader scale.
A third reason for our choice of HRT is its relevance for the study of the reliability of mainstream
organizations (as opposed to the organizations under physical threat). Attempts of transposing
practices from archetypical HROs (like nuclear power plants, nuclear aircraft carriers, and air
traffic control) to mainstream organizations have often been critiqued as too special, too exotic,
and too ‘far out’ for the prosaic world of everyday organizations (Vogus & Welbourne, 2003a, p.
877). In line with Vogus and Welbourne, our study attempts to answer the question under what
conditions do ‘prosaic’ organizations resemble ‘exotic’ HROs. The popularity of the HRO theme is
ambiguous. On the one hand there is an (all-in-all limited) number of publications that aim at
transposing HRO insights to mainstream organizations: CEO bandwagon behavior (Fiol &
O'Connor, 2003), HRM practices in innovation (Vogus & Welbourne, 2003a), organization change
(Ramanujam, 2003), construction industry (Carlo, Lyytinen, & Boland, Jr., 2004;Smart, Tranfield,
Deasley, Levene, Rowe, & Corley, 2003), mining (Sammarco, 2002), industry in general (Mascini,

Introduction 21
1998;Azadeh, 2000;Cooke & Rohleder, 2006;Aase & Nybø, 2002;Qureshi, Ashraf, & Amer, 2007),
Banking (Roberts & Libuser, 1993;Ramanujam & Goodman, 2003;Ramanujam, 2003;Montefusco
& Pesapane, 2006;Van Den Eede, Van de Walle, & Rutkowski, 2006), electricity grids (Schulman,
Roe, van Eeten, & de Bruijne, 2004;Roe, Schulman, van Eeten, & de Bruijne, 2005;de Bruijne, van
Eeten, Roe, & Schulman, 2006;de Bruijne & van Eeten, 2007) and Telecommunications (de
Bruijne et al., 2006;de Bruijne, 2006;de Bruijne & van Eeten, 2007). A noteworthy effort has
been made to apply the HRO framework to the IT sector (Eisenhardt, 1993;Sullivan & Beach,
2002;Vogus & Welbourne, 2003a;McBride, 2008). A similar effort can be noticed in the field of
education (Rossi & Stringfield, 1995;Reynolds, Stringfield, & Schaffer, 2006;Hoy, Gage III, &
Tarter, 2007;Bellamy, Crawford, Marshall, & Coulter, 2005). Some single publications on e-
government by means of electronic voting (Moynihan, 2004), automobile industry (Drogoul,
Kinnersly, Roelen, & Kirwan, 2007), water supply (Roe et al., 2005), science (Baker, Jackson, &
Wanetick, 2005), architecture (Carlo et al., 2004), pastoralism (Roe, Huntsinger, & Labnow,
1998) and drug rehabilitation (Cooren, 2004). Some studies are at the edge of archetypical HRO
research and more mainstream organization types: Prison management (Babb & Ammons,
1996;Crichton, Flin, & Rattray, 2000), railways (Hale, Heijer, & Koornneef, 2003;Smart et al.,
2003;Rosness, Guttormsen, Steiro, Tinmannsvik, & Herrera, 2004;Busby, 2006;Drogoul et al.,
2007) and humanitarian relief (Ash & Smallman, 2008;Dougall, Horsley, & McLisky, 2008).
A fourth and last, less sophisticated, reason why we have used HRT is because it ‘spoke’ to us
(Walsham, 2006, p. 325).
4 Complexity
4.1 Decomposing complexity Since the fifties, the complexity theme holds an important position in literature on organizations
- scientific as well as popular. The form however, under which this theme appeared, has differed
considerably over the years. 13 In the beginning years, research appeared under other
denominators than complexity (see for instance Ashby 1954 for a well-known example). Over
the years, the tone also changed from ‘defeating complexity’ to ‘embracing complexity’ (Figure
1.5). A thread throughout this evolution nonetheless is that organizations had to match the
complexity of their environment (Boisot & Child, 1999, p. 237).
The notion of complexity plays a special role in this dissertation. First, it is the setting under
study; it is the object of our thinking. Second, it is the subject of our thinking in the sense that
complexity is the lens through which we look at complexity. The frameworks and jargons we use
are complex per se. It takes complexity to absorb complexity. Tsoukas calls this second-order
complexity as opposed to first-order complexity (Tsoukas & Hatch, 2001, p. 980-981).

22 Two Cases in High Reliability Organizing: a Hermeneutic Reconceptualization
Figure 1.5 - Embracing Paradox
Management and other social sciences are familiar with the terms ‘lessons learnt’, or ‘best
practices’. They imply that there is something like a general truth (be it contingent on a certain
type of situation) upon which we can draw for the future, actions that should be committed or
omitted.14 This line of reasoning implies that the future is foreseeable, but in many cases, it is
not.15 One of the questions one could ask is “If you cannot predict the future, is it possible to
manage a complex system?” Longstaff (2003) argues there are two answers to that
commonsense question and he leads us to the important distinction between ‘complex ‘and
‘complicated. The first answer is that not everything in a complex system exhibits the same high
degree of complexity. The objective hence is to make that distinction. The second answer has
more to do with hypocrisy than with science. Because the belief that ‘predictability rules’ is the
null hypothesis, adhering the alternative hypothesis by saying that ‘unpredictability rules’, is
detrimental for one’s career (Longstaff, 2003, p. 11). Much hypocrite as this might seem, it is
nevertheless an important motive behind human behavior and hence worth noticing and taking
into account when studying reliability.
Without prejudice to the above, we believe that a distinction between complex and complicated
can and should be made. If one makes this distinction, one could manage our contemporary
systems by concentrating on the complicated issues, threads, themes in the systems. The
complex counterparts can be observed – maybe one could even try to understand them – but
only by acknowledging the fact that under no circumstances they can be managed in the
traditional sense of controlling and leading (Fayol, 1916).
On the other hand, an organization must embrace complexity and keep it as high as possibly
acceptable without crossing the thin line between complexity and chaos.
So it will have become clear by now that complexity has two sides; that there are two ways of
approaching the topic of complexity (Ahlemeyer, 2001, p. 59): “One can describe complexity as
the problem, and then look for solutions. Complexity, after all, makes things difficult, and it may
easily get out of control. In this perspective, nothing is more welcome than an effective technique
of reducing complexity. Or one can conceive of complexity as a solution, a solution for a problem
yet to be described. Complexity then is not an unintended side effect of an otherwise complex
world, but a form of the world itself, a mode in which the world deals with itself. In this
perspective, a simple reduction of complexity which does not at the same time refer to new
Static
equilibrium
Individual
components
Dynamic
equilibrium
Systems
view on
components
Reduce
Complexity
Manage
Complexity
Embracing Paradox

Introduction 23
complexity is to be avoided”. By analogy with risk, we label the first type ‘downside complexity’,
the second ‘upside complexity’. Downside complexity stands for the negative consequences of
complexity. It appeals to the inherent peril of waste of energy, frustration or else even
organization- or system collapse. Upside complexity appeals to the positive aspects of
complexity. It stands for opportunity (chance) to yield a higher reliability than without
complexity.
4.2 Measuring complexity In literature we have found no complexity measure upon which there is a general agreement or
that is broadly used to determine organizational complexity. We believe the reason is – at least
in part – that the term is composed of two elements that are not univocal: organizational and
complexity. Organizational: can relate to people, processes, products and services; it can address
issues that are internally or externally oriented.
The concept of complexity itself can be seen as the number of interactions between
components; the degree/intensity at which that happens; the relationship cause-effect can be
considered with a delay between both indicating a higher degree of complexity; there is the
neighboring notion of complicatedness etc.
Variety offers a good proxy measure of complexity (Boisot & Child, 1999) but an even better
proxy is the complexity index (Ashmos, Duchon, & McDaniel, Jr., 2000).
4.3 Managing complexity Whether an organization prospers or merely survives, depends on how it manages complexity
(Ahlemeyer, 2001;Ashmos et al., 2000;Beard, 1978;Berniker & Wolf, 2001;Klatzky, 1970;Meyer &
Trice, 1979;Stacey, 1996;Stengers, 2004;Van Uden, 2005). Complexity can transgress into chaos
if it is not kept within a certain range (Bennet & Bennet, 2004). Since complexity refers primarily
to the number of decisions that need to be made and the number of factors that need to be
considered when making these decisions, this calls for a tremendous effort. According to Cannon
(1995, p. 96), as the cognitive capabilities of most people are limited to handle only a limited
number – working memory capacity is said to be five plus or minus two – this poses a problem to
dealing with complexity. However, successful organizations seem to accomplish a manageable
complexity-level. For this, they have a set of strategies. They are dealt with next.
Requisite variety
Requisite variety refers to Ashby’s (1962) argument that it takes internal complexity to cope with
external complexity. In this sense, a complexity absorption response involves holding multiple
and conflicting portrayals of the variety in the environment (Boisot & Child, 1999, p. 238).
“Managerial responses to complexity from the absorption perspective would include the
development of multiple and sometimes conflicting goals, the importance of a variety of
strategic activities, more informal and decentralized structural / decision making patterns, and a
wide variety of interactions and connections for decision making” (Ashmos et al., 2000, p. 581).16
Absorbing complexity means they “hold multiple and sometimes conflicting representations of
environmental variety, retaining in their behavioral repertoire a range of responses, each of
which operates at a lower level of specificity'' (Boisot & Child, 1999, p. 238).
24 Two Cases in High Reliability Organizing: a Hermeneutic Reconceptualization
The notion of requisite variety – despite its high face validity – is not without problem. For
instance, it is obvious that this need of requisite variety should be balanced with the limited
cognitive capabilities (supra) and the need of dealing with tight coupling. It has been reported in
military settings (Dov & Gil, 2003, p. 853) that is done by using a shared a meta-script system
that resulted in similar representations of the environment, i.e., conceptual convergence. This
reduces requisite variety to cognitively manageable proportions.17 Another caveat concerns the
contradiction between requisite variety and trust. “[I]t is argued that the management of
requisite variety must be accompanied by attention to power relations and the development of
practical wisdom, since diversity inevitably means differences in belief and opinion within groups
and potential increases in anxiety, which while necessary for innovation may often work against
the building of high levels of trust and shared understanding that may be required for such
innovation” (Moss, 2001, p. 11/20).
Simplification: codification and abstraction
At first sight in contradiction with the techniques of increasing requisite variety, are the set of
techniques that aim at streamlining the observed reality. They do so by codification (specifying
categories to which data are assigned) and abstraction (limiting the number of categories that
need to be considered in the first place) (Ashmos et al., 2000, p. 581). Popular tools include
Balanced Scorecards and Key Reliability Indicators. The opposing phenomena of Requisite
Variety and Simplification tend to occur together in organizations and as such, they are a nice
example of paradox. This a priori so, because both phenomena exhibit dynamic characteristics.
Organizations, for instance, tend to become simpler over time (Miller, 1993) and have a
propensity to increase variety. We refer here to organization growth models like the one of
Greiner (1972) where organizational variety increases in the wake of the solutions for
organizational crises.18
Sinks
The presence of ‘sinks’ that absorb external impacts and buffer subsystems from change will
make the system less complex (Longstaff, 2003): “For example, when the price of an input to a
product goes up but the firm can immediately pass this on to consumers this acts as a sink
protecting the firm from the impact of the price increase and makes it unnecessary for it to build
a complex system for response” (Longstaff, 2003, p. 17).
Shortening feedback loops
“Positive and negative feedback (and feed forwards) loops of different lengths. Long feedback
loops, with communication going through many agents or subsystems tend to be more complex”
(Longstaff, 2003, p. 16-17).
Also the connectivity, ‘the extent to which agents or units are all connected or are connected
through hubs’ will increase the complexity of the system” (Longstaff, 2003, p. 16-17).
A self-creating paradox – Acknowledge the boundaries
At several occasions in this dissertation, we stress the importance of looking ‘beyond the
boundary’. Paradoxically enough, this does not imply that boundaries have to be omitted. On
the contrary, they are needed: how else can one look behind them? However, there is more: in a
field that is as complex as reliability, taking a broad perspective is a merit, but it is also a vice if
there is no partitioning of knowledge. “We also realize, however, that some partitioning of

Introduction 25
knowledge is necessary and some boundaries to this knowledge must be set if meaningful
progress in summarizing and classifying pertinent knowledge is ever to be made” (Koontz, 1980,
p. 183).
Hence, our plea to acknowledge the boundaries, even though the aim of our approach – and
especially its systems thinking component – is to cut across the boundary perspective of
organizations. Boundaries are and remain vitally important for organizational structure. ‘You
can’t live with them, you can’t live without them’ In search of a balance, the key would seem to
be to recognize the boundaries, but to make them as transparent as possible. “To see them as
necessary ‘net curtains’, not ‘heavy drapes’” (Wolstenholme, 2003, p. 9).
Complexity and variety
Referring once again to the models of organizational growth (Greiner, 1972), we believe that
over time organizations/systems are capable of handling more and more complexity (Boisot &
Child, 1999, p. 238). They “*…+ differentiate internally, acquiring sophisticated data-processing
capabilities as they do so.” *…+ “With growth and specialization comes an ability to handle an
ever wider and varied range of internal representations of the external environment” (Boisot &
Child, 1999, p. 238). 19Ashby’s Law states that systems exhibiting a high degree of variety will be
better in dealing with complexity. The variety of control measures must match the variety of
disturbances (Gazendam & Jorna, 1998, p. 5).
Complexity , resilience and structure
If a complex system exhibits resilience it will bounce back from changes and is more likely to be
stable in the long term (Longstaff, 2003, p. 16-17). Lin and Carley (2001, p. 34) state they have
found empirical evidence that in response to crises, organizations should move to complex
structures with greater resource access.
Complexity is a young field searching for laws, theories, and principles that can be used to build
a structure and a discipline (Bennet & Bennet, 2004, p. 285). Nevertheless, sufficient knowledge
is present to understand that if an organization wants to prosper, or merely survive, such
depends on how it manages complexity. The inconvenience is that complexity can transgress
into chaos if it is not kept within a certain range (Figure 1.6). This calls for a tremendous effort
and the application of a strategy to accomplish a manageable complexity-level: pursuing
strategic chunking, sequential elaboration, organizational specialization/coordination and
intermediate measures of reliability (Cannon, 1995). It is our opinion however that these
strategies seem to aim at a reduction of complexity, and not its management.

26 Two Cases in High Reliability Organizing: a Hermeneutic Reconceptualization
Figure 1.6 - Systems Space
Simple Complicated Complex Complex Adaptive Chaotic
Little change over time
Large number of interrelated parts
Large number of interrelated parts
Large number of semi-autonomous agents that interact
Large number of parts that interact
Few elements Connections between parts are fixed
Nonlinear relationships and feedback loops
Co-evolves with environment through adaptation
Behavior independent of environment
Simple relationships
Non-organic Emergent properties different than sum of parts
Varying levels of self-organization
Minimal coherence
Non-organic Whole equal to sum of its parts
May be organic or non-organic
Partially ordered systems that evolve over time
Emergent behavior dependent on chance
No emergent properties
No emergent properties
Operates in perpetual disequilibrium Observable aggregate behavior Creates new emergent properties
Knowable and predictable patterns of behavior
Knowable and predictable patterns of behavior
Patterns of behavior difficult to understand and predict
Patterns of behavior may be unknowable but possibly fathomable
Random patterns of behavior
Table 1.2 - Properties of System Dimensions (Bennet & Bennet, 2004)

Introduction 27
The future is truly unknowable and therefore we must learn to live and deal with uncertainty,
surprise, paradox, and complexity (Bennet & Bennet, 2004, p. 297-298). In this dissertation we
therefore do not aim at reducing complexity – like suggested by Cannon (1995), but at keeping it
as high as possibly acceptable without crossing the thin line between complexity and chaos
(Table 1.2) and as suggested in the Cynefin framework (Kurtz & Snowden, 2003).
5 Coupling
5.1 Decomposing coupling Interdependence or coupling is the degree to which organization components – whether they be
applications, functions, departments or individuals – depend on each other. Loose-coupling
means that the components can operate independently from one another. Tight-coupling means
a continuous interchange of information, goods or services. Coupling has many dimensions.
Thompson (1967), for instance, in his framework of departmental interdependence, classifies in
three types of interdependence: pooled, sequential and reciprocal interdependence. Another
dimensional framework is to distinguish between piece, batch and continuous production.
However, no matter what framework is used to define tight or loose coupling, essential is the
question about availability of buffers, resources, time, and information that can enable recovery
from failures. The looser components are coupled, the more possible recovery paths exist. The
tighter they are coupled, the less an organization disposes of ways to recover (Berniker & Wolf,
2001). Table 1.3 shows the differences between tight and loose coupling from a technical
perspective.
Tight-coupling characteristics Loose-coupling characteristics
Time-dependent processes which
cannot wait
Processing delays are possible
Rigidly ordered processes (as in
sequence A must follow B)
Order of sequence can be changed
Only one path to a successful
outcome
Substitution is available
Little slack (requiring precise
quantities of specific resources for
successful operation).
Slack in resources is possible, buffers
and redundancies available
Table 1.3 - Tightly vs. loosely-coupled processes (Perrow, 1999, p. 92-93)
From the above one might conclude that tight-coupling is not a choice as it is the consequence
of requirements of the production or service delivery context. This may be true in part, but it is
also true that poorly run, financially less successful organizations will have fewer resources
available for e.g. preventative maintenance, replacement of aging equipment or modernization
and less slack operating resources (Berniker & Wolf, 2001). Besides, as Wolf (2001) notes, such
organizations may be forced to operate with tighter coupling as a result of cost cutting

28 Two Cases in High Reliability Organizing: a Hermeneutic Reconceptualization
measures, meaning that tight-coupling may be a managerial decision based upon budgetary
stress or profit targets.
We do not suggest a categorical approach to loose coupling, independent of the interactive
complexity of an organization’s context. Stronger even, we acknowledge that an exclusive focus
on reducing tight-coupling (e.g. by increasing redundancy) may lead to normal accidents if this is
done in a setting that merely addresses single loop learning (Bain, 1999).
5.2 Measuring coupling One way of measuring coupling is by looking at the resources that are available to the whole or
parts of an organization. Berniker and Wolf (2001), for instance, use Return On Assets (ROA) as a
measure of resource availability. They formulate an interesting remark concerning the relation
between tight coupling and slack when they see tight coupling as a management decision and
not as something that emerges independent of free will. “…as Perrow argues, poorly run
organizations will have more discrete errors that are available for unexpected interactions that
can defeat safety systems and thus will be more prone to ‘system accidents’ as he refers to
normal accidents. Less financially successful organizations have fewer resources available for
operational exigencies such as preventative maintenance, replacement of aging equipment or
modernization and less slack operating resources. Poor financial reliability can also trigger risky
actions including the use of low-bid outside contractors. But secondly, and Perrow does not note
this, poorly run or financially starved organizations may be forced to operate with tighter
coupling as a result of cost cutting measures. Tight coupling may not be just a requirement of the
manufacturing process, but may be a managerial decision based upon budgetary stress or profit
targets” (Berniker & Wolf, 2001, p. 22).
5.3 Loose Coupling Theory (LCT) The basis and trigger for this section is an article by Karl Weick (Weick, 2004), in which he links
Loose Coupling Theory (LCT) to high reliability theory (HRT) over normal accidents theory (NAT).
For this he takes Snook’s (2002) friendly fire analysis as a starting point. Weick synthesizes this
analysis as “reliability [that] had been achieved through a combination of differentiation,
specialization, training, culture, and redundancy. These efforts loosened system coupling and
made tasks more linear. But these very same moves toward higher reliability heightened
vulnerability to misidentification when units were rejoined under conditions of tight coupling and
interactive complexity” (Weick, 2004, p. 30). Since NAT is a theory on the causation of a specific
type of accidents, it is hard to assess directly the impact of complexity and tight-coupling on
overall reliability. Since HRT discerns strategies enhancing overall reliability, it is difficult to
evaluate directly the proneness of these strategies to specific, normal accidents. Therefore, the
effects of one theory's independent variables on the other theory's dependent variable will be
assessed indirectly. The questions asked become: Which effects do complexity and tight-
coupling have on the effectiveness of reliability-enhancing strategies discerned by HRT and,
hence, on overall reliability? How do HROs' reliability-promoting strategies impinge on
complexity and tight- coupling and, hence, on normal-accident proneness (Rijpma, 1997b, p.
16)?

Introduction 29
5.3.1 In search of reliability
As we have put forward in the preface to this dissertation, we do not aim at focusing on the
bricks. It is the mortar that interests us most. The things that become visible by relying on an
alternated combination of observation and reasoning. It boils down to searching for a story-line,
based on what we see, hear or read and what our mind does with these components. It is this
story-line that then can be checked against the observation and (other) theories in order to
falsify or validate the hypotheses that go with the story.
We are certainly not the first to take this approach. Our source of inspiration is Scott Snook who
with his Friendly Fire (2002) has shown us his journey in search of a story line that had the
potential to explain what happened in such a way that it could be abstracted from too specific a
context and transposed to a generic framework. Something in which he succeeded magnificently
by continuously, and over and over again looking at the same thing, but always from different
perspectives: individual, team, organizational; technological, human factor, procedures;
organization design; process, product; time, place; and finally complexity and coupling. With the
development of his Practical Drift, Snook found his story-line. It took a tour-de-force, but he did
it (Weick, 2001a).
The story of reliability is complex. Reliability is a ‘dynamic non-event’ (Weick, 1995), because
“organizations have to continuously manage and adapt to a changing and uncertain
environment, while producing a stable outcome, the avoidance of accidents” (Intosh-Murray &
Choo, 2002, p. 6). The tools and rigor that will have to be applied will be more comprehensive. A
mere reduction will not suffice. Neither will it help much only to take a different perspective in
the style of Snook. More is needed here. Our framework has to be wide and rich enough to allow
for insights to emerge by means of the alternation of observation-ratio combinations. On the
other hand, it has to be clear and acquainted enough to allow for the emergence to take place
and to make the conclusions interpretable. We rely on LCT to accomplish this task.
5.3.2 Relevance
Like Orton and Weick (1990) have pointed out via their literature review, Loose Coupling Theory
(LCT) incorporates a multidimensional perspective to the organizing process. “Organizational
participants are linked simultaneously by bureaucratic and cultural ties, by functional and
resource interdependencies, by vertical and horizontal linkages, etc.” (Beekun & Glick, 2001a, p.
229). Numerous possible combinations of coupling emerge which makes it – both from an
academic and practitioner’s perspective – an appealing phenomenon, but which at the same
time holds a latent danger when researched or applied wrongly. “Unless prescriptive statements
identify precisely which dimensions should be loose or tight, managers may implement coupling
inappropriately” (Beekun & Glick, 2001a, p. 229). Bottom-line is to make a scan of the
organization through the lens of coupling to gain a deeper understanding of it. We state that LCT
is the ideal scalpel for organizational dissection, before which all other instruments pale.
Therefore, we rely on the literature on loose coupling as an analytical tool to help us understand
the dialectical discussion that has surrounded organizational reliability. The concept of loose
coupling allows us to move in a more subtle and judicious direction toward understanding what
reliability means. As such, we use the loose coupling perspective not only as an organization
model to understand the degree to which organizational elements are linked, but as a cognitive

30 Two Cases in High Reliability Organizing: a Hermeneutic Reconceptualization
model to understand how Incident Management workers interpret, label, enact, or otherwise
make sense what occurs in their environments.
5.3.3 Identification
The thinking in terms of tight and loose coupling originated from Robert Glassman (1973) who
applied it in the context of biological systems. Soon it became clear that the concepts could
prove very useful in other domains as well (Longstaff, 2003, p. 30-31) since coupling in essence is
about organizing.
Coupling
Coupling is a tough concept. It is used with eagerness by many organization theory scholars.
However, there is no univocal interpretation of tight-coupling (Orton & Weick, 1990, p. 203). A
turning point in the development of Loose Coupling as a theory is the 1990 Orton and Weick
article in which the authors examined approximately 300 studies that invoke the concept of
loose coupling (Orton & Weick, 1990, p. 204). They divided the findings of their desk survey into
five different categories which they called ‘voices’: (1) causation, (2) typology, (3) effects, (4)
compensations and (5) organizational outcomes (Figure 1.7). They have linked them in a
“preliminary theory of the loosely coupled system” (p. 204), a theory they have relied on to
discuss some appealing organizational issues. We do not build on all aspects of LCT equally, but
limit ourselves to those aspects that are most promising when applied to the context of
management paradigms.
Loose Coupling
In fact, the phrase ‘loose coupling’ is a challenge because loose and coupled are opposites. But
the dynamics that emerge from the duality between the two components (loose and coupling)
make it in an interesting concept that is often more useful to deal with complex reality than the
straight-forward notion of ‘tight coupling’. Loose coupling implies some kind of mixture of
independent interdependence and dependent independence. Things are coupled but loosely,
things are loose but yet coupled in a way. In this respect loose coupling is not the other end of
the spectrum of tight coupling (Orton & Weick, 1990, p. 205). The notions of distinctiveness and
responsiveness are used to learn about the way systems are coupled. Furthermore it is
important to notice that asserting that a system is loosely coupled is to predicate specific
properties and a specific history to the system, rather than an absence of properties (Orton &
Weick, 1990, p. 219). “Coupled events are responsive, but each event also preserves its own
identity and some evidence of its physical or logical separateness” (Weick, 1976, p. 3). This
happens suddenly, occasionally, negligibly, indirectly and eventually. (Orton & Weick, 1990, p.
203) Longstaff (2003, p. 31) points out: “A system could be tightly coupled if its components
share many variables or the link between the variables is very strong. Engineered systems with
automatic controls are said to be tightly coupled (if A happens then B is the automatic and
immediate response)”. Weick continues (Weick, 1976, p. 3): “It might seem that the word
coupling is synonymous with words like connection, link, or interdependence, yet each of these
latter terms misses a crucial nuance. *…+ Loose coupling also carries connotations of
impermanence, dissolvability, and tacitness all of which are potentially crucial properties of the
‘glue’ that holds organizations together. Another way of looking at the coupling of systems or
organizations is to study the behavior of their components. “Tightly coupled organizations are
those where any change in one component (individuals or subsystems) of the system will
Introduction 31
engender an immediate response from the other component(s)” (Longstaff, 2003, p. 31). Orton
and Weick point out that several forms – they call this the voice of typology – of coupling exist:
among individuals, subunits, organizations, between organizations, hierarchical levels,
organizations and environments, among ideas, between activities and between intentions and
actions (Orton & Weick, 1990, p. 208).
Dialectical approach
Crucial in our discussion about coupling is the insight that ‘not tightly coupled’ is not the same as
‘loosely coupled’. To assert that a system is loosely coupled is to predicate specific properties
and a specific history to the system, rather than an absence of properties (Orton & Weick, 1990,
p. 219). This dialectical perspective on loose coupling opposes against a unidimensional
approach (e.g. by Perrow). By acknowledging the dynamics of the different views that can be
developed between the layers of loose coupling (Orton & Weick, 1990) the palette the
researcher has at his disposal for his investigation of organizational reliability has become much
richer than under a one-dimensional framework. In the words of Orton and Weick (1990, p. 204-
205): “[t]he resulting image is a system that is simultaneously open and closed, indeterminate
and rational, spontaneous and deliberate” (Orton & Weick, 1990, p. 204-205).
This dialectical perspective on loose coupling we have described stems with a Hegelian
perspective on Organizations. The dialectical perspective on loose coupling opposes against a
unidimensional approach (e.g. by Perrow, 1984). By acknowledging the dynamics of the different
views that can be developed between the layers of loose coupling (Orton & Weick, 1990), the
palette the researcher has at his disposal for his investigation of organizational reliability has
become much richer than under a unidimensional framework. In line with what we have said on
the philosophical stand that is needed in management, the possibility of a dialectical
interpretation of coupling offers a powerful tool for organization analysis and design.
Reality is not unidimensional, it is even deceiving because easy answers are always available for
he/she who is looking for them. Often there is little to win by going to the bone of the causation
of the accident, there are more forces present that foster the easy solution in terms of people to
blame, technology that did not work, procedures that were wrong etc. The X causes Y direct
effect is still the (social) science ideal (Orton & Weick, 1990, p. 218).
What loose coupling is not
Organizations that have thought about (be it implicitly of explicitly) the way their processes are
(loosely) coupled are interesting. One should not make the mistake to describe loose coupling as
the absence of a management effort and vision to be ‘on top of things’. The absence of features
of tight coupling does not boil down to being loosely coupled. The problem however is, that
“[W]hen researchers define organizations as monolithic corporate actors, they overemphasize
order and underemphasize elements; when researchers define organizations as mere aggregates
of individuals, they overemphasize elements and underemphasize order. If researchers begin with
richer definitions of organization, they will arrive at more accurate findings and conclusions”
(Orton & Weick, 1990, p. 216 & 218).
32 Two Cases in High Reliability Organizing: a Hermeneutic Reconceptualization
Relevance
The concept of loose coupling is a powerful yet underestimated one. Like Orton & Weick (1990,
p. 203) write: “Loose coupling, however, is a metaphor that has a rare combination of face
validity, metaphorical salience, and cutting-edge mysticism, all of which encourage researchers
to adopt the concept but do not help them to examine its underlying structure, themes, and
implications”. This combination is rare and is an interesting approach to systems thinking, to
looking beyond the boundary of the easily observable. The thing is that loose coupling all too
often is taken for granted, a bit in the same way the notion of complexity is. Seldom is it asked
what exactly is meant by it but everybody seems to be satisfied with a vague description. A
comprising definition is lacking and is even not desired. At best a circumscription by means of
examples and cases is the only description available.
5.3.4 Managing coupling
Now that we know what coupling (loose and tight) is, we should ask ourselves once again
whether loose coupling is worth striving for. One thing is certain: the Coupling concept is in an
interesting one. Many scholars have tackled it, all from different viewpoints, but nobody seems
to have dealt with it the way Karl Weick and his co-authors have (Weick, 1976;Orton & Weick,
1990). Their contribution is important because of their multidimensional study of the idea. They
seem to have taken coupling from the concept level to the construct level by pointing out what
causes coupling, what typifies it, what its effects are, how it compensates and what can be
expected as results.
Weick (1976) argued that loosely coupled systems could more accurately register their
environments through requisite variety. Registering improves when elements become more
numerous and the constraints among them weaken (Orton & Weick, 1990).
Anyway, it seems that the benefits of loose coupling cause some drawbacks to emerge as well.
These drawbacks are often found in form of a lack of traditional control mechanisms.
“As suggested earlier, it may not be the existence or nonexistence of loose coupling that is a
crucial coupling that is a crucial determinant of organizational functioning over time but rather
the patterning of loose and tight couplings” (Weick, 1976, p. 12).

Introduction 33
Figure 1.7 - Loose Coupling Theory (Adapted from Orton & Weick, 1990, p. 217)
The question remains how this lens and toolkit from LCT can contribute to this dynamics. The
answer is double. First, its approach goes to the essence of what organizations are: relating
‘things’, be it people, concepts, facilities, processes, etc.). Second, the phrase loose coupling has
a paradoxical nature since it implies a tension between determinacy (coupling) and
indeterminacy (looseness) (Beekun & Glick, 2001b, p. 228) And it is this tension, this suggestion
of a middle ground between the centrifugal tendencies of entrepreneurial creativity and the
inertial tendencies of formal administrative systems (Lubatkin, Florin, & Lane, 2001, p. 1370),
that keeps the balance between an innate tendency to organize things in a tightly coupled
(closed, rational, deliberate) way (Boone & van Witteloostuijn, 1995) on the one hand, and an on
the field ‘practical drifting’ towards loose coupling.
Therefore we fully agree with the following assertion from Weick and Orton (1990, p. 218):
“Loose coupling may be able to do for the study of organizational structure what bounded
rationality did for the study of decision making. By recognizing and explaining how decisions are
Causal indeterminacy
Fragmented external environment
Fragmented internalenvironment
Individuals
Subunits
Organizations
Hierarchical levels
Organizations and environments
Activities
Ideas
Intentions and actions
Modularity
Requisite variety
Behavioral discretion
Enhanced leadership
Shared values
Focused attention
Persistence
Buffering
Adaptability
Satisfaction
Effectiveness
Causes of
loose coupling
Types of
loose coupling
Direct effects of
loose coupling
Compensations for
loose coupling
Organizational outcomes
of loose coupling

34 Two Cases in High Reliability Organizing: a Hermeneutic Reconceptualization
made by humans with limited interest, time and energy, Simon required studies of decision
making to move into more subtle, more detailed, and more enigmatic directions. The concept of
loose coupling, with its recognition of numerous structural dimensions, its emphasis on
simultaneous coupling and decoupling, and its portrayal of structures as malleable through
managerial intervention, similarly forces researchers to move more deeply into the human
workings which underlie organizational structure. In the same way that bounded rationality has
led researchers to study the processes of decision making, rather than merely the outcomes,
loose coupling may lead researchers to study structure as something that organizations do,
rather than merely as something they have”. It is for this reason that we intend to rely heavily on
LCT for the discussion of our findings.
6 Research Questions Our dissertation builds on the research on High Reliability Organizations (HROs) to understand
and manage reliability and risk. For that reason, we transpose lessons learnt in the typical high
hazard domains of a Nuclear Power Plant (NPP) to the more mainstream, though still risky,
domain of Information Technology (IT) in the field of Banking. We do so in the context of the
operational risk management efforts in view of the incident management process20 of a large
Western-European NPP on the one hand, and an important European financial institution, on
the other hand. For clarity, we wish to stress that we leave the technology and its tight-coupling
and interactive complexity, like described (for instance) by Thompson (1967) and Perrow (1999)
out of the scope of our research. We focus solely on the handling of the incidents – not on the
incidents themselves.
6.1 Are the organizations HROs? Research on reliability is typical of high-hazard manufacturing settings, especially the ones that
heavily build on complex technologies like civil and military aviation and nuclear infrastructure,
oil refinery or transport over sea. The primary focus here is safety in the strictest sense:
safeguarding staff and infrastructure from calamity. As is shown in Chapter 2, these
organizations over the years have gained considerable expertise and can take pride in an
impressive track-record. Creed et al. distinguish HROs from what they call TEOs – Trial and error
organizations (Creed, Stout, & Roberts, 1993, p. 70). These are organizations that have the
luxury of learning through trial and error whereas in HROs the stakes are too high and any
mistake immediately is punished by catastrophe. Such catastrophe can be financial (severe loss,
even Bankruptcy), human (casualties) or a combination of both. This distinction is easily made in
theory, but much harder in practice. A first reason is that many organizations that cannot be
labeled HRO (because they lack the physicality that underlies this organization type) can be
labeled with the adjacent notion of High Reliability Seeking Organizations (HRSOs) (Vogus &
Welbourne, 2003a). Ericksen and Dyer (2005) label any organization that is confronted with
these tight coupling and interactive complexity as reliability-seeking organizations, while Vogus
and Welbourne (2003a) seem to reserve this term for these organizations on the condition that
they are not confronted with the physicality of technical infrastructure (and endangering life).
However, because of the relative obscurity of HRSO as a term, we continue to use the more
familiar HRO nominator. A second reason is that HROs do make errors, smaller ones mostly, but
at times also not so small ones. What is interesting however is the way these errors are dealt
with. A first particularity in this respect is that the organization takes learning from errors (and

Introduction 35
near-errors) seriously. In our Learning Organization era, many an organization posits it learns
from errors, but in the business-as-usual mentality, this is merely a slogan. A second trait of
HROs, and this is an even bigger discriminator from TEOs, is that errors do not disable them.
Our research aims at linking high reliability literature from physical high-risk settings to more
mainstream economical high-risk settings (in our case a financial institution).
Therefore the issue whether the organizations we study bear the HRO hallmarks is relevant. In
this respect, the first question our research needs to answer is:
Are the organizations we study HROs? [RQ1]
This question applies particularly to the Bank as mainstream and non-archetypical HRO, but does
not take for granted the HRO compliance of the NPP and will look for empirical underpinning of
this proposition. To answer the question whether the organizations we study are HROs, we split
it into three sub-questions.
- Are the HRO properties as described in literature observable in both organizations? [RQ1-1]
- Are the same constructs observable in both organizations? [RQ1-2]
- Has the NPP (as an archetypical HRO) the highest values on HRO properties? [RQ1-3]
These questions may seem obvious but we dare to doubt this.
6.2 What constitutes high reliability? A second question that is relevant in the field of reliability studies and that our research
addresses is what constitutes high reliability? What makes one team more reliable, more
performant than another team? Which contextual and/or structural dimensions contribute to
high reliability? In other words: is there something like an ideal ‘reliability cocktail’? In addition,
how do these dimensions (or constructs) interrelate? Can a non-archetypical HRO and
archetypical HRO learn from each other? With this second research question, we analyze the
interrelationships that exist between the different determinants and wish to come to an
integrating framework that has the potential of contributing to the explanation of reliability.
The second research question hence becomes:
What constitutes high reliability? [RQ2]
To answer this second research question, we split it up into three sub-questions.
- Do the HRO and SeMa constructs positively influence process reliability? [RQ2-1]
- Is there a difference in the reliability cocktail of a Bank and a NPP? [RQ2-2-2]
- Is there a difference in the reliability cocktail of one team, compared to another? [RQ2-3]

36 Two Cases in High Reliability Organizing: a Hermeneutic Reconceptualization
7 Structure of this Dissertation Following this introductory chapter – and with our research questions in mind – we next present
a review of literature on HRT and adjacent theories (Chapter 2). After that, the methodology
framework underlying our research is depicted (Chapter 3), in order to explain why and how we
have proceeded to the reconceptualization of what constitutes high reliability organizing
(Chapter 4). The result thereof is a conceptual model, with its underlying propositions and
hypotheses (Chapter 5). Subsequently, this conceputalized model is empirically tested and
analyzed (Chapter 6) and its results discussed (Chapter 7). A final chapter concludes on and
answers the research questions raised and points out this study’s contributions and limitations
(Chapter 8).

Literature Review 37
Chapter 2 Literature Review
It is the theory that decides what we can see
Albert Einstein
1 Introduction
This chapter builds the theoretical framework that is necessary to examine and understand
organizational reliability. The theme this framework is built around is High Reliability Theory (HRT),
but its study is enhanced with constructs that put it in a wider perspective, the perspective of
organizing itself.
Since Fayol (1916) we know that management – i.e. management’s functions – is about planning
(prévoir), organizing (organizer), leading (commander), coordinating (coordiner) and controlling
(controller). Chester Barnard (1938) – later followed by Peter Drucker (1974) – added to this that
management is about finding a balance between efficiency (doing the things right) and effectiveness
(doing the right thing). Together, these ideas are at the core of organization theory. “They [i.e.
management functions] are the basic aspects of management that have a high degree of universality
among different enterprises and different cultures. By using the functions of managers as a first step,
a logical and useful start can be made in setting up pigeonholes for classifying management
knowledge”(Koontz, 1980, p. 183). Later on, System theorists (See De Leeuw, 1982 for an
introduction) have added to these ‘pigeonholes’ a systems view, which encompasses a holistic
approach to organizing and organization and which reserves a special place for the management of
learning and knowledge.
Despite of the high face-validity of this classification, we feel the essence of management is not
captured by these categorizations. Although these activities certainly are what one thinks of when
talking about what a manager does, they are not at the heart of it. What drives leading, controlling,
planning, coordination, efficiency, effectiveness, learning and knowledge is a necessity to confront
the unknown. All the aforementioned activities are determined by it. We state that organizing is
looking for ways to enter uncharted territory. Man has developed tools to help him with this task:
rules and regulations, reporting, planning, meetings, etc. (Daft & Lengel, 1986).
Unfortunately, there is no ideal-type description of organization like the bureaucracy formulation by
Weber (1968). So one has to help oneself by means of approximations: “Formal organizations are
three things at once: contexts within which individual action takes place; sets of rules in the form of
propositional statements; and historical communities” (Tsoukas, 2000). This chapter wishes to go a
little beyond these approximations, applies insights, concepts, and constructs from a wide range of
disciplines to the study of organizational reliability.

38 Two Cases in High Reliability Organizing: a Hermeneutic Reconceptualization
If one looks back at cases of organizational unreliability, one always has the idea the mishap could
have been prevented had this or that been done or omitted. In addition, often this investigation
finds the same cause: human error. It has been argued that 80% of all accidents can be attributed to
a human mistake, in one way or another (Reason, 1997). The question arises however, whether this
is really the case. Is it not so that error investigations stop when they reach the black box they call
the human mind? The assumption taken in this study is that it are not so much the humans that are
in error, but the organizations and the procedures that shape them. So whenever the root-cause
analysis ascertains it has found what has gone wrong, it is always worthwhile to keep in mind that
other and more hidden elements are involved. It is precisely the objective of this literature review to
‘unhide’ these hidden elements. They are studied throughout this chapter; we name them, organize
them around a taxonomy and connect them to each other or to related or non-related elements
(Pearson & Clair, 1998).
To this end, we focus on High Reliability Theory (HRT)21, a theory that seems to be really well suited
for dealing with the complexity inherent to reliability. We do so by juxtaposing it against Normal
Accident Theory (NAT), since both bodies of research share the same basic assumptions regarding
the degree of coupling and interactive complexity. Ever since the eighties, these two sets of theories
have dominated the discussion on organizational reliability. On the surface, both theories can be
characterized as a pessimistic ‘accidents must happen’ and an optimistic ‘accidents can be avoided’
theory respectively. Remarkably, the origin of both NAT and HRT lies in one and the same
publication from 1982, a book on the human aspects of the nuclear meltdown at the 1979 Three
Mile Island power plant (Accident at Three Mile Island: The Human Dimensions1982). Both Charles
Perrow, whose work later culminated in his influential ‘Normal Accidents’ (Perrow, 1999, first edition
from 1984) and Todd La Porte, founder of the research group at Berkeley which has since conducted
research on highly reliable organizational reliability, contributed a chapter. Both authors laid the
foundations for two major ways of thinking about accidents and reliability which, subsequently,
were played off against one another (Rijpma, 1997a, p. 15).
In the remainder of this chapter, we argue that this juxtaposition is not completely appropriate and
that there are better ways of studying the reliability phenomenon. Indeed, by contrasting HRT
against NAT, HRT’s potential as well as its shortcomings, become apparent. In that respect, the
notions of (interactive) complexity and (tight) coupling are of particular importance since they play a
prominent role in HRT as well as in NAT. For this purpose, first both theories are studied in more
detail in the two subsequent sections (Sections 2 and 3), after which a synthesis emerges in Section
4. Next, section 5 introduces SenseMaking as an additional set of constructs that is considered useful
for the explanation of organizational reliability. Because of the vocation of this dissertation, we add
to this the study of the role of the fit between the Information Systems (IS) and the Incident
Management process they are meant to support. This study is the subject of the last section in this
literature review (Section 6).
2 Normal Accidents Theory (NAT) Society as a whole in general and separate organizations or systems in particular, face a paradox. On
the one hand, they become more and more powerful and on the other hand, they become more
vulnerable to threats than ever before. This is the basic premise underlying the theorizing on
organizational reliability initiated by Charles Perrow in his seminal ‘Normal Accidents’ publication

Literature Review 39
(1999, first edition 1984) and that has become known from then on as Normal Accidents Theory
(NAT). Even though Perrow is NAT’s founding father, the theory has been given a first (thorough)
empirical underpinning and brought to maturity by Scott Sagan (1993).
NAT posits that accidents are a normal consequence of a system’s interactive complexity and tight
coupling (See: Chapter 1 Introduction). This combination results in yet another irreconcilable
structural paradox: centralization, the method of dealing with the tight coupling, must be combined
with delegation (i.e. decentralization), the approach of dealing with complexity (Bierly III & Spencer,
1995, p. 639). The impossibility of a simultaneous centralization and decentralization means that
systems that are tightly coupled and are interactively complex are bound to fail. Therefore, from a
NAT perspective, the only organizations/systems being inherently reliable are either linearly loosely
coupled, linearly tightly coupled or loosely coupled complex (Respectively represented in quadrants
1, 3 and 4 from Figure 2.1).
Figure 2.1 - Interaction/Coupling Chart (Perrow, 1999, p. 327)
Both determinants are communicating vessels, though not necessarily balancing. When trying to
remediate vulnerability by reducing the tightness of the coupling, very often complexity increases
because the development and integration of effective supervising systems (Karvalics, 2002). In this
way, the smallest error or disorder can threaten the functioning of the entire system. Because of
their central role in the thinking about reliability, this subsection deals with these two determinants
of (un)reliability: (1) interactive complexity and (2) coupling, but we do so in a less univocal way than
suggested above. We leave room for nuance by not only warning for the danger of the complexity
and tight coupling, but equally by drawing the attention to their positive hallmarks. The thesis we
put forward is that an organization should not aim at the reduction of complexity and tight coupling,
but at managing them. In this respect, we first elaborate on the notion of interactive complexity
(2.1). We decompose it and formulate possible strategies for its management. We conclude with an
address to NAT’s relevance for the study of reliability (2.2).
2.1 Interactive complexity Complex systems have intricate interdependencies among their various parts and many variables
operating at the same time22 (Longstaff, 2003, p. 15). They exhibit cause and effect that are distinct
in time and show emergent behavior. They are typically nonlinear, with surprising compounding
effects as a result.23 Because of their non-linear character, “adding an element that can be
duplicated to the system may cause a shift in the total system that is much greater than the amount
added”. As a consequence, complexity can emerge suddenly: “as soon as you get more than a few
43
Loose
21
Tig
htC
OU
PLIN
G
ComplexLinear
INTERACTIONS
43
Loose
21
Tig
htC
OU
PLIN
G
ComplexLinear
INTERACTIONS

40 Two Cases in High Reliability Organizing: a Hermeneutic Reconceptualization
layers and more than a few variables the complexity starts to go up” (Longstaff, 2003, p. 23-24). The
measure of interactive complexity is the number of ways in which components of the system can
interact, which in its turn depends on the number of variables in the system, the number of
relationships between the variables and the number of feedback loops through which the variables
interact (Cooke & Rohleder, 2006, p. 215). Moreover, it is argued that a complex system exhibits
complex interactions when it has unfamiliar, unplanned, or unexpected sequences, which are not
visible or not immediately comprehensible. According to Perrow (1999), systems are either
‘complex’ or ‘linear’. Table 2.1 shows the characteristics of both typologies. Although Perrow defines
complexity by illustration rather than by rigorous definition, he illustrates his concept of interactive
complexity with examples (Berniker & Wolf, 2001, p. 17-18). While not rigorous, the concept of
complexity clearly conveys the idea that it is concerned with interactivity and not simply the number
of parts, components or subsystems present (Thompson, 1967).
Complex Linear
Component proximity Spatial segregation (of components and
subsystems)
Common-mode connections Dedicated connections
Interconnected subsystems Segregated subsystems
Limited substitutions Easy substitutions
Unfamiliar or unintended feedback loops Few feedback loops
Multiple and interacting controls Single purpose regulating controls
Indirect or inferential sources of information Direct information
Limited understanding of the processes
involved
Extensive understanding of process
technology.
Table 2.1 - Complex vs. linear systems (Perrow, 1999, p. 85-86;Berniker & Wolf, 2001)
Whereas linear systems are far more easy to manage, complex systems confront us with the
problem of ‘managing the unexpected’ (Weick & Sutcliffe, 2001) due to the unpredictable nature of
their interactions. These interactions are called ‘baffling’ (Perrow, 1999) because they surprise
organization members; they are not intended to exist, but yet do exist. “These [baffling interactions]
represent interactions that were not in our original design of the world and interactions that we, as
operators could not anticipate or guard against. What distinguishes these interactions is that they
were not designed into the system by anybody; no one intended them to be linked. They baffle us
because we acted in term of our own designs of a world that we expected to exist-but the world was
different” (Perrow, 1999)24. As such, these interactions are very difficult to anticipate.
Conceptually, complexity is the condition of a system, situation, or organization that is integrated
with some degree of order but has too many elements and relationships to understand in simple
analytic or logical ways. Examples are a team of people, a city, or an ant colony. Internal complexity,

Literature Review 41
from an organization’s viewpoint, is its ability to exhibit or contain a large number of states or
behaviors (Bennet & Bennet, 2004, p. 290). It is measured by its variety, the number of possible
states that the system can have. An organization of high variety has a large number of options and
choices of actions it can take to adjust itself internally or when responding to or influencing its
environment. If its variety becomes too high, the organization may become chaotic, with no
coherence of thought or action (Bennet & Bennet, 2004, p. 290).
In the Perrowian (technical) view, interdependence or coupling is the degree to which organization
components – whether they are applications, functions, departments or individuals – depend on
each other. Loose coupling means that the components can operate independently from one
another. Tight coupling means a continuous interchange of information, goods or services. The
degree of coupling can be inherent to the organization’s nature, but it can also be the result of
management decisions. Such is the case where organizations are forced to operate with tighter
coupling as a result of cost cutting measures, meaning that tight-coupling may be a managerial
decision based upon budgetary stress or profit targets.
2.2 Relevance The relevance of Perrow’s work has often been downplayed, because most accidents are not caused
by the combination of complex interactions and tight coupling. It has even been suggested that
some accidents are not caused by tight coupling but by loose coupling (Weick, 2001b). But
interactive complexity and tight coupling are strong concepts, independent of each other (Rijpma,
2003, p. 37). This is an explanation why NAT has had (and still has) a tremendous influence on
organizational reliability studies. With over 2800 citations (scholar.google.com) it definitely is an all-
time citation favorite. We believe its popularity can be explained by (amongst others) its broad
applicability, a high face validity, its theory foundation and the spirit of the times.
The dimensions of coupling and complexity, along which the risk bearing of an industry, organization
or technology is determined, are universally applicable over sectors, cultures, situations. The degree
of interactive complexity and coupling, although hard to objectively measure, is consciously and
unconsciously omnipresent, be it in interpersonal relations or conceptual notions. In theory, it is
feasible to determine whether a situation is tightly or loosely coupled, or that the interactions
between system components are linear or complex.
The combination of the dimensions of interactive complexity and degree of coupling has great
potential of explaining (un)reliability. Separately, these dimensions only in part indicate why some
type of organization is more prone to accident. Complex organizations are more than linear
organizations, and tightly coupled organizations are more complex than loosely coupled
organizations. However, some complex organizations seem to be indifferent to calamity whereas
others are not. The same goes for some tightly coupled organizations. Only those organizations in
the complex-tightly coupled quadrant are the most danger-prone.
Another aspect of NAT that is important for the development of the discipline as a whole is that
Perrow used Cohen, March and Olsen’s (1972) provocative `garbage can’ theory to understand the
safety risks in highly hazardous systems (Smart et al., 2003, p. 737). More in particular he drew on
one of its two components, namely the emergence of unclear technology (the other two being
problematic preferences and fluid participation). The high appeal of his Normal Accidents Theory is

42 Two Cases in High Reliability Organizing: a Hermeneutic Reconceptualization
to a large extent due to the popularizing of the Garbage Can metaphor in the 1970s and its
challenging the rational view of organizations as depicted by the classical and early modernist
tradition in organization theory (Smart et al., 2003, p. 737). Thus, indirectly, the tremendous appeal
and face validity of Garbage Can theorizing has laid the foundation for work like ours.
We live in an era where complexity and interconnectedness are part of our daily lives and get a lot of
attention. It is commonly assumed that the evolution of both dimensions proposed by NAT are
positively inclined and fast-paced. The NAT message of being risk-averse where nuclear technology,
nuclear weapons and other potentially dangerous industries are concerned, finds a fertile soil in the
spirit of our times. Therefore, the situations it addresses are easily recognized and what the theory
proposes is eagerly acknowledged.
Despite their appeal, these characteristics in themselves are not sufficient as a validation of NAT’s
hypotheses. A rigorous gathering of data is needed. Unfortunately, there is little empirical evidence
that can be found to validate NAT beyond what we have described above. This becomes clear when
having a closer look at what a NAT authority like Scott Sagan (2004, p. 16) puts forward as part of the
theory’s rationale when referring to scholars having applied or further developed the ideas to a
much wider range of organizational, personal, and national activities. These include (to give just a
partial list), hospital emergency room procedures (Paté-Cornell, Lakats, Murphy, & Gaba, 1997), the
origins of the Franco-Prussian War (Nickles, 1999) and U.S. Air Force friendly fire incidents (Snook,
2002). Apart from the last study, literature only addresses NAT superficially. A more recent thorough
and successful validation of NAT has been provided by Wolf and Berniker (2008) who tested NAT’s
application to petroleum refining by linking the occurrence of incidents and accidents to the
structure of the organization and its technology.
3 High Reliability Theory (HRT) Despite NAT’s prophecy of doom, some organizations seem to cope really well with errors.
Moreover, they do so over a very long time. Researchers from the University of California, at
Berkeley (Rochlin, La Porte, & Roberts, 1987), later followed by their colleagues from Michigan State
University at Ann Arbor (Weick, 1987), started calling this kind of organizations ‘high reliability
organizations’ (HROs). The collection of their work has become known as High Reliability Theory
(HRT). High Reliability Theory is a theory25 on how a high degree of reliability can be achieved. An
organization in which this theory is practiced is called a High Reliability Organization (HRO).26 HROs
are organizations where the risk of calamity is very high, but that yet are successful in their
management. HRT disagrees with NAT in its assertion that a simultaneous centralization and
decentralization is necessary but practically impossible. Research in HROs argues that such is feasible
because of structural and contextual idiosyncrasies, explored in the following subsections. We start
by providing a definition of HRT (3.1), a depiction from the perspective of the two main schools of
thought (3.2) and an overview of research in the HRO field (3.3).
3.1 Definition Despite a considerable amount of publications on HROs, there does not seem to be a generally
accepted definition of what the phenomenon is, which does not add to their study. We therefore
have to rely on derivate definitions and descriptions. The best known27, in this respect, is the
description Karlene Roberts (1990a) gave: “Within the set of hazardous organizations, some
organizations have operated nearly error free for very long periods of time. These organizations are

Literature Review 43
‘high reliability’ organizations (HROs). To identify these organizations one must ask the question,
‘How often could this organization have failed with dramatic consequences?’ If the answer to the
question is many thousands of times the organization is highly reliable. In such organizations,
reliability rivals productivity as a dominant goal” (Roberts, 1990a, p. 101-102). HRO research under
the Berkeley HRO Project28 (as the Berkeley team has come to call it) deals with large, complex
organizations that successfully manage advanced technological activities that meet the three
following criteria (Rochlin, 1993, p. 15):
1. The activities are inherently complex, in that tasks are numerous, differentiated, and
interdependent (Thompson, 1967);
2. The activities meet certain social demands that require reliability at the highest level of
service obtainable within present safety requirements, with a desire for an even higher level
of activity and a penalty (explicit or implicit) if service slackens (La Porte & Consolini, 1991);
3. The activities contain inherent technological hazards in case of error or failure that are
manifold, varied, highly consequential, and relatively time-urgent, requiring constant,
flexible, technology-intrusive management to provide an acceptable level of safety to
operators, other personnel, and/or the public (Rochlin et al., 1987).
However useful, these typifications say only what HROs are, without explaining why and how. In
what follows, we therefore expand this definition by including an answer to the why and how
question.
Essential in the above definitions, is that HROs cannot be easily characterized by static descriptors
(Rochlin, 1993, p. 22-23): “The locus of reliability is in the dynamic of execution and the mobilization
of organizational resources more than in any snapshot of organizational form”. Some of the best-
known examples are nuclear power plants, aircraft carriers and air traffic control29. Indeed, such
organizations continuously face risk because the context in which they operate is high hazard. This is
so because of the nature of their undertaking, the characteristics of their technology or the fear of
the consequences of an error for their socio-economic environment. Elements of such a system can
combine in unforeseen ways and when errors occur, they amplify rapidly. In other words: they face
complexity and tight-coupling in the majority of processes they run (Vogus & Welbourne, 2003a).
3.2 Two schools of thought: Berkeley and Michigan In line with the way HRO research traditionally has been organized, this subsection gives a brief
overview of the way conceptual and theoretical HRO research has developed. We subsequently deal
with the approach taken by the Berkeley and the Michigan school as the most prominent of these
descriptions. We start with the way the Berkeley project (New Challenges to Understanding
Organizations1993) founding fathers (La Porte, Rochlin and Roberts) have described it. Next, we
elaborate on the description of the school of the University of Michigan, Ann Arbor, by Karl Weick
and his colleagues (notably Kathleen Sutcliffe, David Obstfeld and Timothy Vogus).
In general, and at risk of oversimplifying, one could say that the Michigan school of thought pays
more attention to the notion of culture (as contextual dimension) and that the Berkeley group favors
the structural dimensions (e.g. the notion of bureaucracy) (Eisenhardt, 1993, p. 133). In this sense,
the Michigan school takes independent dimensions (causes)30, the Berkeley school with dependent

44 Two Cases in High Reliability Organizing: a Hermeneutic Reconceptualization
dimensions (effects from the independent dimensions) as starting point for understanding the
concept of high reliability.
3.2.1 The Berkeley HRO School
The University of California at Berkeley has become an international focal point for the progression
of high-reliability theory (Smart et al., 2003, p. 736). The roots of this school are in the research of
Morone and Woodhouse (1986) and Wildavsky (1988). It was on their work that the school’s
founders – Karlene Roberts, Todd La Porte and Gene Rochlin (and by extension Paul Schulman and
Paula Consolini) have built to bring HRT to full growth. Their research employs a number of
methodologies (Roberts & Rousseau, 1989) and bears a number of characteristics that make up the
originality of its contribution.
In part thanks to their different background, Todd R. La Porte (political science), Karlene H. Roberts
(psychology) and Gene I. Rochlin (physics - energy and resources) have made an important
contribution to the way organizations are studied. What these scholars have in common and what
differentiated them from their predecessors (and to a certain extent NAT) is the organizational
perspective to organizational reliability. More particularly the merit lies in the combinatorial power
of the elements they take into account to explain organizational reliability and in making these
combinations and their effects explicit. The elements in themselves – the measures listed as
Berkeley HRO apparatus – are part of well-studied organization theory, for instance from human
resources management. For example, the Berkeley school relies on constructs like employee
involvement, job rotation, regular sharing of information, and training, to name just these.31 The
three organizations studied in the initial phase of the project were the Federal Aviation
Administration’s Air Traffic Control System; Pacific Gas and Electric Company’s nuclear power plant
at Diabolo Canyon, California; and the US Navy’s nuclear powered aircraft carriers (Roberts, 1993, p.
2). Cornerstones in the examination of high reliability in work by Berkeley students are (Pidgeon,
1997, p. 8):
1. an occupational danger culture (relating to personal relationships and their relation to self-
protection from harm);
2. a task/security culture (operations through norms of perfectionism and critique of
information); and
3. in times of crisis, typified by a pattern of decentralized decision-making and flexibility of
response.
Their work greatly acknowledged the dynamic nature of/resulting from organizational culture and in
that sense opposes the critique expressed by NAT (Perrow, 1999;Sagan, 1993) that high reliability
cannot be achieved in organizations that are simultaneously interactively complex and tightly-
coupled. It is beyond the scope of this dissertation to provide a full coverage of the Berkeley line of
thought and to particularly address the constructs employed within the context of the Berkeley
research group in the early years of HRT. We refer the interested reader to the literature to that
effect (e.g. La Porte & Rochlin, 1994;La Porte, 1996;La Porte & Consolini, 1991;Roberts, Rousseau, &
La Porte, 1994;Rochlin et al., 1987).
3.2.2 The Michigan HRO School
The Michigan school largely extended on Karl Weick’s notions of SenseMaking (Weick, 1995) which
are discussed at fuller length below. In its turn, SenseMaking is the emanation of theorizing on

Literature Review 45
Loosely Coupled systems (Weick, 1976;Orton & Weick, 1990), which again finds its origin in the
Social Psychology of Organizing (Weick, 1979). Michigan students of high reliability organizations
emphasize “the importance of various people in the organization correctly perceiving the events
before them and artfully tying them together to produce a ‘big picture’ that includes processes
through which error is avoided” (Roberts, 2003). Their major contribution is a paper by Weick,
Sutcliffe and Obstfeld from 1999 (Weick et al., 1999) that has lead HRO research since because it has
introduced/made explicit the notions of Mindfulness and Resilience (Weick et al., 1999). Because of
their high face-validity, these notions have been capable of introducing the reliability theme with
practitioners, as has become manifest with the publication of Managing the Unexpected (Weick &
Sutcliffe, 2001). This book has the merit of revitalizing the discipline at the end of the last, and the
beginning of this century and of offering it a jargon and structural framework. It is our belief that the
Berkeley group, as founding fathers of the HRO got bypassed by that other group of HRO scholars at
the Michigan State University because the ingredients offered by the former were not novel enough,
whereas with their concept of mindfulness and resilience, the latter offered a much more appealing
body of theory.
The central theme in the Michigan scholarship on high reliability is that HROs are so reliable because
they have a certain state of ‘mindfulness’ (Weick & Sutcliffe, 2001 p 42). According to Weick et al.
(1999), mindfulness is less about decision-making, which is the traditional focus of organizational
theory and accident prevention, and more about inquiry and interpretation grounded in capabilities
for action. HROs possess five key qualities to reach their state of mindfulness (Weick et al., 1999).
These qualities enable HROs to compensate for their inherent tight coupling with attributes that
loosen their coupling, hence contributing to a balance between efficiency and reliability. Through
their Preoccupation with Failure, reluctance to accept simplifications, and Sensitivity to Operations,
HROs are able to anticipate and become aware of dangers. HROs are able to contain dangers when
they are spotted because they are committed to resilience and deferred to expertise.
The term Mindfulness was coined by Langer32 (Weick et al., 1999, p. 88) and stands for “[T]he
combination of ongoing scrutiny of existing expectations, continuous refinement and differentiation
of expectations based on newer experiences, willingness and capability to invent new expectations
that make sense of unprecedented events, a more nuanced appreciation of context and ways to deal
with it, and identification of new dimensions of context that improve foresight and current
functioning. Mindfulness is a pre-occupation with updating. Mindful people accept the reality of
ignorance and work hard to smoke it out, knowing that each new answer uncovers a host of new
questions. Mindfulness is exhibited by high reliability organizations through the following five
hallmarks of reliability: (1) Preoccupation with Failure, (2) Reluctance to Simplify interpretations, (3)
Sensitivity to Operations, (4) Commitment to Resilience, and (5) Deference to Expertise”(Weick &
Sutcliffe, 2001, p. 10 & 42-44). Note, in line with Vogus and Welbourne, that when we refer to
mindfulness, we are referring to it at the system or organization level (i.e. collective mindfulness)
contrary to Langer’s work on mindfulness (1989, 1997) which was derived from work on individuals
(Vogus & Welbourne, 2003a, p. 880), stemming from psychology literature (Levinthal & Rerup, 2006,
p. 502).
The three core HRO properties of Mindfulness, namely Preoccupation with Failure, Reluctance to
Simplify, and Sensitivity to Operations, are dealt with next.

46 Two Cases in High Reliability Organizing: a Hermeneutic Reconceptualization
Preoccupation with Failure
Preoccupation with Failure is an important principle that gives HROs a distinctive quality, as this
means that HROs are preoccupied with something they seldom see. Although HROs are successful in
avoiding incidents, they do not boast about their superiority. HROs are wary for the common
failures, caused by restricted search, reduced attention, inertia, risk aversion, and homogeneity.
They treat even the smallest error as a sign that something could be wrong with the system. HROs
regard narrow escapes as a kind of failure that reveals danger, and not, as most other organizations
would do, as evidence of success and their ability to avoid accidents. Members of HROs know that
they cannot foresee everything: they know that they do not know, and they expect to be surprised.
That is why members of HROs are constantly worried that they make analytical errors and that these
errors might be amplified, in combination with limitations to foresight, and lead to accidents
(Muhren, Van Den Eede, & Van de Walle, 2007).
Acting from an assumption that the organization knows enough may represent hubris at best and
bad management at worst (Zack, 1999). Avoidance of hubris is essential in achieving long-term
reliability, because constant awareness of the possibility of failure is a precondition for avoiding it.
Or as Weick and Sutcliffe put it: “Arrogance and hubris breed vulnerability” (Weick & Sutcliffe, 2001,
p. 9). On the other hand, a well-established culture of safety and reliability might still result in
overconfidence and hubris, which is then again the harbinger of calamity. Therefore, HROs put great
emphasis on a culture that takes even the smallest error serious. In this they strongly differ from
non-HROs because they give strong responses to weak signals (Weick & Sutcliffe, 2001, p. 3-4). The
reason for this is twofold: firstly, avoidance of hubris by forcing organization members to remain
alert and secondly, seizing every opportunity to learn from error. Such a culture of resilience (Weick
& Sutcliffe, 2001) is built on strong norms, all-levels management commitment (Weick, 2001c),
willingness and the competence to exchange information (Alavi & Leidner, 2001). “If managers
refuse to examine what happens between heads, they’ll be eternally puzzled by what appears to
happen inside individual heads” (Weick & Sutcliffe, 2001, p. 13-14).
A culture of reliability and avoidance of hubris can be obtained in numerous ways. Grabowski and
Roberts (1997;1999) name some: clear norms in the system about the relationship between failure
and learning, secret ballots about volatile or sensitive issues, anonymous reporting of near misses in
safety critical systems, use of brainstorming where the evaluation of ideas is suspended, a penalty
box where people who commit glaring errors in the system are put for a finite period of time, after
which they rejoin the action. Weick and Sutcliffe point out that the so-called ‘big picture’33 in HROs is
less strategic and more situational than is true of most other organizations (Weick & Sutcliffe, 2001,
p. 13). Culture provides a useful portmanteau concept which bundles up the ‘baggage’ people bring
to action: the different values, beliefs, norms, frames, and cognitive structures which influence sense
making, filter information, and mediate the construction of organizational meaning (Intosh-Murray
& Choo, 2002, p. 239). Despite these apparent advantages, culture poses a double dilemma though.
A first dilemma, is that on the one hand, a strong culture is better for reliability in times of stability
but on the other hand, a weaker culture is better suited to deal with change (Denrell, 2003, p. 237).
The second dilemma is that strong cultures are more difficult to alter than weak cultures. The reason
might be that success breeds confidence and fantasy (Starbuck & Milliken, 1988, p. 329-330). This
reminds of the ‘boiling frog syndrome’ (Starbuck & Milliken, 1988, p. 337) that states that a frog can
be boiled alive if the water is heated slowly enough. It is said that if a frog is placed in boiling water,
it will jump out, but if it is placed in cold water that is slowly heated, it will never jump out. This story

Literature Review 47
refers to the phenomenon of ‘creeping normalcy’ which means that if organizations – and in
particular their management – do not learn to look out for continuous change.
These are all expressions of hubris. A good example is provided by Dörner (1996) in his monograph
on the logic of failure where he reports on the Chernobyl disaster: “The Ukrainian reactor operators
were an experienced team of highly respected experts who had just won an award for keeping their
reactor on the grid for long periods of uninterrupted service. The great self-confidence of this team
was doubtless a contributing factor in the accident. They were no longer operating the reactor
analytically but rather ‘intuitively’. They thought they knew what they were dealing with, and they
probably also thought themselves beyond the ‘ridiculous’ safety rules devised for tyro reactor
operators, not for a team of experienced professionals” (Dörner, 1996, p. 33). When a group exerts
this kind of thinking on the group it conflict is minimized, but at the expense of critically testing,
analyzing, and evaluating situations. During such groupthink (Janis, 1982b) the organization is
vulnerable to risk.
Reluctance to Simplify
Because HROs believe that the world they face is complex, unstable, unknowable, and
unpredictable, they try to notice as much as possible. Simplifications produce blind spots, so HROs
differentiate in order to get a more varied picture of potential consequences and in turn, a richer
and more varied set of precautions and early warning signals. HROs make fewer assumptions,
cultivate requisite variety and socialize people to notice more. The law of requisite variety was
originally proposed by Ashby (1962), and suggests that the larger the variety of actions available to a
system, the larger the variety of perturbations in its environment it can compensate. HROs stimulate
frequent job rotation and hire employees with non-typical prior experience. By these means, HROs
obtain a broader divergence of perspectives, which leads to a broader set of assumptions that
sensitize it to a greater variety of inputs. Although diverse groups have more information available
than more homogeneous groups, communication patterns and cognitive limitations often lead to a
situation where unique information does not get shared (Muhren et al., 2007).
Sensitivity to Operations
Because of the often-devastating physical or socio-economical consequences, HROs are forced to
learn from even the smallest errors they make. During the incubation period of errors, it is important
to look for inconsistencies – like incidents and accidents – that are the harbinger of a much greater
risk. Unless the organization has an attitude of detecting these often insignificant events, these
occurrences will be overlooked or misinterpreted (Grabowski & Roberts, 1997). The consequence is
that when this ‘preventative opportunity’ (Berniker & Wolf, 2001, p. 10) is not seized, continued
reliable operations are not assured. Therefore, HROs try to signal errors when they are still tractable
and can still be isolated by attaining well-developed situational awareness. Situational awareness is
defined by Endsley (1997) as “the perception of the elements in the environment within a volume of
time and space; the comprehension of their meaning and the projection of their status in the near
future”. HROs consistently communicate the big picture of what the organization seeks to do, and
try to get everyone to communicate with each other about how they fit in the big picture (Roberts &
Bea, 2001a). With a situational awareness and a big picture, people in HROs can make continuous
adjustments that prevent errors from accumulating and enlarging. Such Sensitivity to Operations is
achieved through a combination of shared mental representations, collective story building,
situation assessing with continual updates, knowledge of physical interconnections and parameters

48 Two Cases in High Reliability Organizing: a Hermeneutic Reconceptualization
of the organization’s systems, and active diagnosis of the limitations of preplanned procedures.
Organizational awareness is enhanced by the extent to which members of an organization
collectively become skilful perceivers of the business environment (Tsoukas & Shepherd, 2004). “For
an organization to sharpen its collective capacity to perceive is more difficult than for individuals. The
reason is that organizing is the process of generating recurrent behaviors, namely a process for
reducing differences among individuals through institutionalized cognitive representations. This is
what gives organized systems predictability and efficiency; but this is also what gives them rigidity
and crudeness. Organizing induces abstraction and generalization in social activities for coordinated
purposeful action to become possible” (Tsoukas & Shepherd, 2004, p. 6).
Commitment to Resilience
Resilience can be best described as: “The process of being mindful of errors that have already
occurred and correcting them before they worsen or cause more serious harm” (Weick & Sutcliffe,
2001, p. 67). In this respect, the term is related to accident mitigation. “Organizations committed to
resilience develop knowledge and skills to cope with and respond to errors, capability for swift
feedback and swift learning, speed and accuracy in communications, flexible role structures, quick
size-ups, experiential variety, skills at re-combining existing response repertoires, and comfort with
improvisation. Such organizations move decision-making rapidly to those with the necessary
expertise” (Weick & Sutcliffe, 2001, p. 67-68). Resilience is a tendency to return to a former
equilibrium in the face of temporary perturbation or displacement (Longstaff, 2003, p. 16-17). If a
complex system exhibits resilience it will bounce back from changes and is more likely to be stable in
the long term. For this reason, Van Fenema (2005) labels resilience as some extraordinary ‘elasticity’.
Sutcliffe and Vogus (2003), on the other hand, address it as something ‘ordinary’ as they suggest
that it emerges from relatively ordinary adaptive processes that promote competence, restore
efficacy, and encourage growth. They posit that Threat Flexibility is essential in its emergence,
namely when information and resources are plentifully available and control is not tightened in up-
tempo times. In this their notion of Threat Flexibility is an alternative for threat rigidity (Staw,
Sandelands, & Dutton, 1981).
Resilience is a combination of keeping errors small and improvising workarounds to keep the system
functioning (Muhren et al., 2007). People in HROs are so committed to resilience, that they see this
‘firefighting’ as evidence that they are able to contain the unexpected. By contrast, managers in
business may perceive successful firefighting as evidence that they are distracted and therefore
unable to do their normal work (Weick & Sutcliffe, 2001, p. 70). HROs need to have a broad
repertoire of actions they can roll-out when a danger occurs. HROs support improvisation to be able
to recombine the actions in their repertoire into novel combinations. As Wildavsky (1988, p. 70)
describes, “improvement in overall capability, i.e. a generalized capacity to investigate, to learn, and
to act, without knowing in advance what one will be called to act upon, is a vital protection against
unexpected hazards”. Informal networks are a common resource for HROs to respond to dangers
resiliently, because they provide an infrastructure that is needed to handle unanticipated dangers in
a swiftly manner. When events get outside of normal operational boundaries, knowledgeable people
organize themselves into ad hoc networks to provide expert problem solving.

Literature Review 49
Deference to Expertise
What people in HROs have mastered is the ability to alter typical hierarchical patterns of deference
when the tempo of operations changes and unexpected problems arise. People who have the most
expertise, regardless of their rank, then make decisions on the front line. In these situations,
expertise and experience are usually more important than rank, so the decision structure in HROs is
a hybrid of hierarchy and specialization. Decision-making authority therefore is shifted down to the
lowest possible levels and clear lines of responsibility need to be called into existence (Ericksen &
Dyer, 2005, p. 29). This way, the shift to anarchy is a controlled one, and comes from a collective,
cultural belief that the necessary capabilities lie somewhere in the system and that migrating
problems will find them (Muhren et al., 2007).
This argument has been further developed in Bigley and Roberts’ (2001) study of an incident
command system (ICS). “An ICS is highly formalized, characterized by an extensive storehouse of
rules, procedures, policies, and instructions. Jobs within the system are specialized and require
particular training. Although highly bureaucratic, the ICS is also very flexible, because it is able to
rapidly recombine people, resources, and structures to deal with unexpected situations. For example,
the ICS is designed to 'oscillate effectively between various preplanned solutions to the more
predictable aspects of a disaster circumstance and improvised approaches for the unforeseen and
novel complications that often arise in such situations” (Bigley & Roberts, 2001, p. 1282).
3.3 HRO Research The literature on HROs is on organizations that behave “under very trying conditions” (La Porte &
Rochlin, 1994, p. 221), thus the data base available to us for analysis, consists of an eclectic mix of
case studies involving effective action *…+, limited failure *…+, near catastrophes *…+, catastrophic
failures *…+ and successes that should have been failures *…+ (Weick et al., 1999, p. 83). This eclectic
mix of publications has two consequences:
1. The ingredients that compose high reliability are always the same but they tend to be
represented slightly differently. In what follows, we provide an overview of these
representations. The reader will notice the overlapping of these characterizations. We have
not been able to avoid this, since it is inherently part of the eclectic mix of studies in HRO
literature.
2. Whereas these publications are an indication of the popularity and broad applicability of
HRT, one can notice the emergence of what one could call false HROs. The fact that HRT has
gained interest among managers, leads to the danger that this interest and mainstreaming
of what it stands for is going to be to its own detriment. It is good Public Relations to be
labeled ‘HRO’ independent from the fact that one really is HRO or is just paying lip service to
its principles. The following illustrates what we mean: “The employees said the company was
preoccupied with safety slogans, such as the recently created ‘Pantex High Reliability
Organization’, that were masking the stresses in the plant. Senior management is distracted,
losing sight of the overall picture and circumstances,” the letter said, adding that some
managers lacked specific experience in handling nuclear weapons” (Vartabedian, 2006).
Recall that in this study we do not wish to research High Reliability Seeking Organizations (HRSO) in
the way they have been described by Vogus and Welbourne (2003a). HRSOs focus on innovation,

50 Two Cases in High Reliability Organizing: a Hermeneutic Reconceptualization
adaptability to competition, decrease of response times and the like. Their focus is on efficiency. The
HROs in our study have the containment of operational risk as their bottom-line.
For our study of literature on HRO, we have reviewed n=192 publications, ranging from journal
articles, over conference proceedings, scientific reports to more popular contributions in
professional magazines over a 20-year period ranging from 1987 to June 2008 (with two outliers
from 1982 because they are considered the trigger for what would later become HRT and NAT). The
objective of this overview is not exhaustiveness, but to give a fair idea of the wide range of
publications in the field of HRO and its evolution over time.
The spread in publications is shown in Figure 2.2. Note that for reasons of comparison we have
extrapolated the figure for the first semester of 2008. We notice the modest start of HRO
scholarship end of the eighties, beginning of the nineties, followed by a short dip (to practically no
publications) in 1991-1992, to see the publication output expand in 1993. The reason could be that
the publication of New Challenges (edited by Roberts) and the Limits of Safety (Sagan) has triggered
this sudden increase. The period following that, although showing a rate higher than prior years,
witnessed a steady decline in the number of publications. This regression reached a minimum in
1998. From 1999 onwards, the trend is up. We believe the trigger for this evolution can be found in
the publication of Weick, Sutcliffe and Obstfeld’s (Weick et al., 1999) seminal paper in that same
year. This trend seems to have reached a temporary plateau with as much as some 20 publications
per year.
Figure 2.2 - Spread of HRO publications (1981-2008)
0
5
10
15
20
25
19
81
19
82
19
83
19
84
19
85
19
86
19
87
19
88
19
89
19
90
19
91
19
92
19
93
19
94
19
95
19
96
19
97
19
98
19
99
20
00
20
01
20
02
20
03
20
04
20
05
20
06
20
07
20
08
Number of Publications
Year of Publication

Literature Review 51
The most prominent researchers in the HRO field, responsible for one third of the publications in our
study, are listed in Table 2.2. It can be noticed that the most productive HRO author by far is Karlene
Roberts, followed by Karl Weick, Gene Rochlin, Todd La Porte and Paul Schulman (joint).
Author No. Publications Share Cum. %
Roberts,K. 22 11% 11%
Weick,K. 8 4% 16%
La Porte,T. 7 4% 19%
Rochlin,G. 7 4% 23%
Schulman,P. 7 4% 27%
Gaba,D.M. 6 3% 30%
Roe,E. 6 3% 33%
Table 2.2 - HRO authors
We have catalogued the publications in our study along 8 dimensions: (1) the sector they apply to
(e.g. health care, industry, military); (2) their focus on safety and/or reliability; (3) the organizational
process (Design & Development, Information Technology, security, Human Resources Management,
Incident Management); (4) the management activity (Strategic management, Crisis management,
Project management, Command and Control, Decision making, Planning and Risk management; (5)
the management paradigm (Knowledge Management, Organizational Learning, Change
Management, Total Quality Management, Intercultural Management); (6) the research method
(Qualitative, Quantitative); (7) the explicit common ground with other theoretical frameworks
(SenseMaking and Normal Accidents Theory); (8) the nature of the publication (research paper,
conceptual paper, paper on theory building, or a popular paper).
We can see from Table 2.3 that Health Care is the sector that gets most of the publications. This is a
phenomenon especially from recent years (Figure 2.3). Nuclear energy, the military, aviation and
firefighting, being much more traditional HRO sectors, count for much less, although taken together
these five sectors account for 2/3 of total HRO publications (Table 2.3). It is clear that the interest
from the Health care sector for the application of HRT is what has helped the theory survive.
Sector No. Publ. % Cumulative %
Health care 42 26% 26%
NPP 25 15% 41%
Military 20 12% 53%
Aviation 12 7% 61%

52 Two Cases in High Reliability Organizing: a Hermeneutic Reconceptualization
Fire 8 5% 66%
Industry 6 4% 69%
Bank 6 4% 73%
Space 5 3% 76%
Marine 5 3% 79%
Railways 5 3% 82%
Electricity Grid 4 2% 85%
IT firm 4 2% 87%
Education 4 2% 90%
Manufacturing 3 2% 91%
Telecommunication 2 1% 93%
Prison 2 1% 94%
Humanitarian relief 2 1% 95%
Off-shore 2 1% 96%
e-government 1 1% 97%
Water supply 1 1% 98%
Science 1 1% 98%
Architecture 1 1% 99%
Pastoralism 1 1% 99%
Drug rehabilitation center 1 1% 100%
Total: 163
Table 2.3 - HRO publications by sector

Literature Review 53
Figure 2.3 - Top 5 HRO Publications
Recent published data on healthcare organizations and high reliability have largely addressed either
recommendations for improving reliability in individual hospitals’ units that are at high risk of patient
safety errors, or case studies of HRO principles (Dixon & Shofer, 2006). Again, applied at the clinical
unit level, such as perinatal units (Frankel, Leonard, & Denham, 2006), operating rooms (Leonard,
Graham, & Bonacum, 2004), and intensive care units (Pronovost, Berenholtz, Goeschel, Needham,
Sexton, Thompson, Lubomski, Marsteller, Makary, & Hunt, 2006). The bulk of HRO writings are on
safety, not on reliability (Table 2.4).
Safety/Reliability No. Publ. % Cumulative
Safety 113 70% 70%
Reliability 49 30% 100%
Table 2.4 - Safety vs. Reliability
Business Process No. Publ. % Cumulative
IT 13 50% 50%
Design & Development 4 15% 65%
Security 3 12% 77%
HRM 3 12% 88%
Incident Management 3 12% 100%
Table 2.5 - Business Process and HRO
0
1
2
3
4
5
6
7
8
9
1981
1983
1985
1987
1989
1991
1993
1995
1997
1999
2001
2003
2005
2007
Nu
mb
er
of
Pu
blic
atio
ns
Year of Publication
Health Care
NPP
Military
Aviation
Fire

54 Two Cases in High Reliability Organizing: a Hermeneutic Reconceptualization
From Table 2.5 can be derived that, as far as the business processes are concerned, publications
seem to attach a great deal of attention to IT (50%). More remarkable is that only for 26 publications
we have been capable of determining applicability to one or other business process. This definitely is
a shortcoming of this body of literature as a whole. As is shown in Table 2.6, the majority of HRO
literature deals with management activities that are characterized by time-criticality: decision
making, risk management, crisis management and command and control issues constitute 85% of
publications.
Management Activity No. Publ. % Cumulative
Decision making 8 30% 30%
Risk 7 26% 56%
Crisis management 5 19% 74%
Command and Control 3 11% 85%
Project management 2 7% 93%
Planning 1 4% 96%
Strategic management 1 4% 100%
Table 2.6 - Management Activities addressd by HRO literature
From Table 2.7 can be derived that most HRT research in our survey of literature applies qualitative
research techniques.
Research method No. Publ. % Cumulative
Qualitative 45 63% 63%
Quantitative 27 38% 100%
Table 2.7 - Research methods addressed by HRO literature
4 Contrasting NAT and HRT HROs operate in a setting of complexity and tight coupling. Unlike what is suggested by NAT, these
organizations continue their track-record of success by accepting the fact that they “cannot predict
everything and set up systems that alert them to small changes so that they can prevent these small
changes from becoming big problems” (Longstaff, 2003, p. 19). It is their way of dealing with
complexity.
For sake of clarity: we do not intend to favor either of the two theories over the other. Both have
their merits, both have their tenuousness, both have potential. For this reason we agree with Rijpma
(1997a, p. 22).to use insights from both to come to a framework integrating aspects of both frames
of reference:“Therefore, it can be concluded that NAT and HRT may gain much from cross-
fertilization. Not only may theoretical discourse be enriched, but cross-fertilization is also important
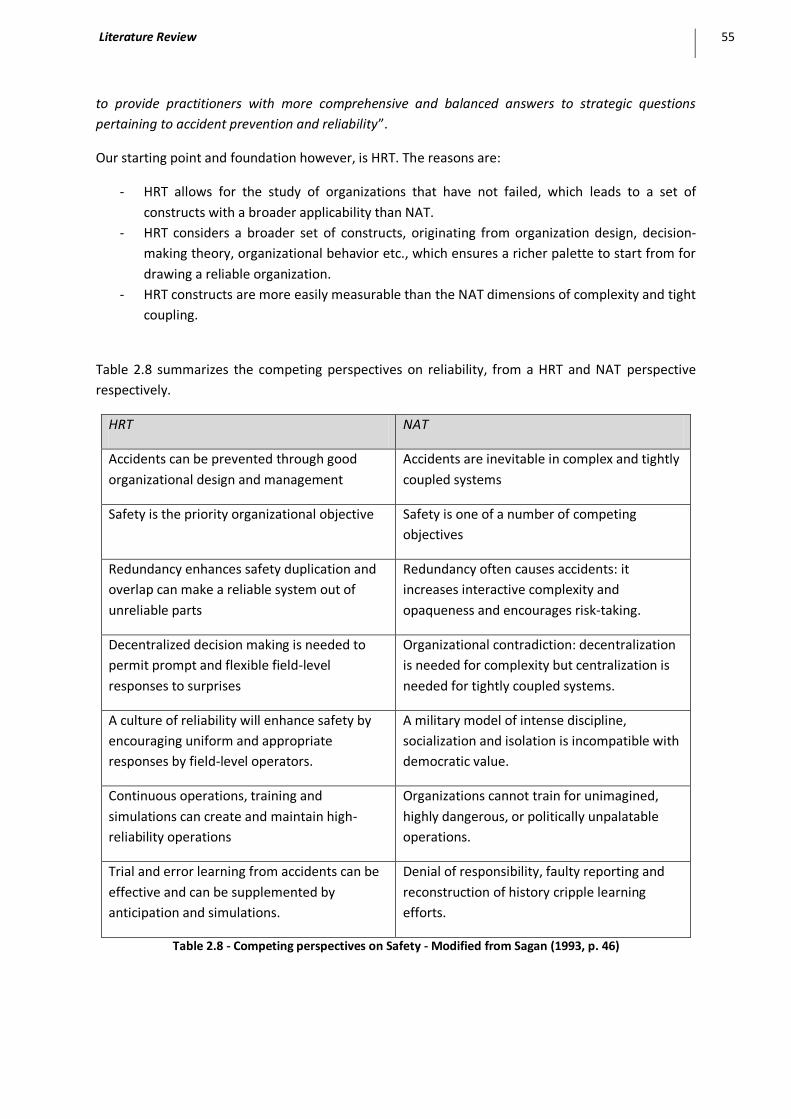
Literature Review 55
to provide practitioners with more comprehensive and balanced answers to strategic questions
pertaining to accident prevention and reliability”.
Our starting point and foundation however, is HRT. The reasons are:
- HRT allows for the study of organizations that have not failed, which leads to a set of
constructs with a broader applicability than NAT.
- HRT considers a broader set of constructs, originating from organization design, decision-
making theory, organizational behavior etc., which ensures a richer palette to start from for
drawing a reliable organization.
- HRT constructs are more easily measurable than the NAT dimensions of complexity and tight
coupling.
Table 2.8 summarizes the competing perspectives on reliability, from a HRT and NAT perspective
respectively.
HRT NAT
Accidents can be prevented through good
organizational design and management
Accidents are inevitable in complex and tightly
coupled systems
Safety is the priority organizational objective Safety is one of a number of competing
objectives
Redundancy enhances safety duplication and
overlap can make a reliable system out of
unreliable parts
Redundancy often causes accidents: it
increases interactive complexity and
opaqueness and encourages risk-taking.
Decentralized decision making is needed to
permit prompt and flexible field-level
responses to surprises
Organizational contradiction: decentralization
is needed for complexity but centralization is
needed for tightly coupled systems.
A culture of reliability will enhance safety by
encouraging uniform and appropriate
responses by field-level operators.
A military model of intense discipline,
socialization and isolation is incompatible with
democratic value.
Continuous operations, training and
simulations can create and maintain high-
reliability operations
Organizations cannot train for unimagined,
highly dangerous, or politically unpalatable
operations.
Trial and error learning from accidents can be
effective and can be supplemented by
anticipation and simulations.
Denial of responsibility, faulty reporting and
reconstruction of history cripple learning
efforts.
Table 2.8 - Competing perspectives on Safety - Modified from Sagan (1993, p. 46)

56 Two Cases in High Reliability Organizing: a Hermeneutic Reconceptualization
Roberts (1990a, p. 111) makes this more specific, by presenting an answer to the challenges set by
NAT. She has enumerated some of the dysfunctional characteristics in hazardous organizations and
has formulated some responses to lessen their effect.
Characteristics of Complexity Responses
- Potential for unexpected
consequences
- Continuous training
- Redundancy
- Complex technologies - Continuous training
- Responsibility and accountability at all
levels
- Potential for systems serving
incompatible functions to interact
- Job design strategies to keep
functions separate
- Training
- Indirect information sources - Many direct information sources
- Baffling interactions - Training of specialized language
- Flexible exercises
Characteristics of Tight Coupling Responses
- Time dependent processes - Redundancy
- Invariant sequences of operations - Job specialization
- System flexibility
- Hierarchical differentiations
- Only one way to reach goal - Redundancy
- System flexibility
- Little slack - Bargaining and negotiation
- System flexibility
Much can be learnt from the mutual criticism and self-criticism of both schools of thought. As we
have stated in the introduction to this section, HRT and NAT have since long been described as
opposing in that sense that they represent an optimistic and pessimistic view respectively. Not in the
least, this duality has been reinforced by the publication of Sagan’s The Limits of Safety, a frontal
attack at the address of HRT. Consequently this book has triggered a strong and well-elaborated
response from HRO founding fathers, especially La Porte and Rochlin (La Porte & Rochlin, 1994;La
Porte, 1994), a response upon which Sagan (2003) in his turn ardently responded to. Nevertheless,
this categorization does not seem to be fruitful because of several reasons, the most important
being that the scholars (from both sides) themselves do not seem to be satisfied with it.
4.1 Critique from HRT on NAT
4.1.1 Misreading
HRT scholarship reproaches their NAT counterparts (namely Perrow and Sagan) to have misread
their work and intentions (La Porte & Rochlin, 1994, p. 221). Working from secondary analysis of
organizational structure, behavior and culture, NAT seeks to estimate from them the relative
likelihood of serious accidents. Then they go on to attribute to these organizations properties that

Literature Review 57
they claim are representative of HROs, and then infer that the Berkeley group would have drawn
contradictory conclusions (p. 221).
4.1.2 Static and univocal
“Most organizations are not frozen into one of the four combinations that are possible in Perrow’s
2*2 of loose/tight coupling and linear/complex interaction. Instead, whole organizations change
character in response to changed demands, some proportions of any organization fit all four
combinations, and all organizations, because of interconnected technologies and interconnected
resource demands, are moving toward an interactively complex tightly coupled state” (Weick et al.,
1999, p. 85). NAT’s static and univocal view on organizations is not realistic. Organizations change
continuously because they are made out of people and together with this continuous change also
their degree of coupling changes.
4.1.3 Unfalsifiable
Another critique is that Perrow’s theory is unfalsifiable (Schulman, 2001). Indeed, an organization
will always remain as reliable as ‘the first catastrophic failure that still lies ahead, not the many
successful operations that lie behind’ (Schulman, 2001, p. 346).
4.1.4 Defeatism
Cooke and Rohleder argue that although accidents may be ‘normal’ – in the sense that ‘accidents
happen’ – disaster is not an inevitable consequence of complex socio-technical systems (Cooke &
Rohleder, 2006): “Since incidents of varying severity are normal, a system must be put in place to
control the frequency and severity of these incidents. Without such a system the incident rate and
severity will not be controlled and only then is a disaster predictable”. They came to this conclusion
after the analysis of the Westray mine disaster (Cooke, 2003) where they found that “the fatal
explosion was not a spontaneous event, but a consequence of a chain of events or precursor incidents
that could have been detected by an effective incident learning system” (Cooke & Rohleder, 2006, p.
234).
A similar argument can be found in those NAT predictions that did not come through. For instance,
while Sagan’s empirical findings (1993) were quite embarrassing for HRO students (Rosa, 2005, p.
232), the same can be said on the Y2K non-event, announced by Perrow in the epilogue of the
second edition of his seminal work on Normal Accidents (Perrow, 1999). Another example pointing
in the same direction is provided by Berniker and Wolf (2001, p. 23), where they report an
unexplainable success for three of the more complex oil refineries in the sample they have studied.34
4.2 Critique from NAT on HRT Cooke and Rohleder (2006) summarize Sagan’s (1993) analysis of high-reliability theory as a
reduction to four essential elements for success: (1) high management priority on safety and
reliability; (2) redundancy and backup for people and equipment; (3) decentralized organization with
a strong culture and commitment to training; and (4) organizational learning through trial and error,
supported by anticipation and simulation. This is the basis for NAT’s critique on HRT.
4.2.1 Restricted organizational learning
Sagan argues that the organizational learning required for the success of high-reliability theory will
be restricted because of (1) ambiguity about incident causation; (2) the politicized environments in
which incident investigation takes place; (3) the human tendency to cover up mistakes; and (4) the

58 Two Cases in High Reliability Organizing: a Hermeneutic Reconceptualization
secrecy both within and between competing organizations (Cooke & Rohleder, 2006, p. 216). This
lack of scrutiny by HRO scholars has also been reported by Clarke (1993): “How is it possible that two
groups of scholars, looking at the same class of phenomena, so fundamentally disagree on what they
see? I am not really sure how to answer this question. But it is clear that HRO theory does not accord
critical scrutiny to official statements and records”. Even an unsuspected source like Weick (Weick et
al., 1999, p. 85) reports the danger of cover-ups of accidents compromising trial and error learning
and of its anticipation of complexity but its failure to stop it from escalating: “Competing interests
seldom align behind safety” (1999, p. 85).
4.2.2 Cognitively impossible
Being an HRO is cognitively impossible. “The evidence presented in validating NAT will show that
with respect to complex systems, this is a cognitively impossible task” (Berniker & Wolf, 2001).
“When issues get too complicated, people can’t keep their minds on the subject. There is a strict limit
to how many things we can keep in our conscious minds at any one time” (Snowden, 2005, p. 24-25).
Even La Porte and Consolini (1991) describe the HRO performance as very unusual, very hard to
maintain and even theoretically unexplainable. “Variations in organizational mindfulness stem, in
part, from differentiated role structures *…+, but also from individuals’ finite capacity for mindfulness.
Every individual and organizational subunit cannot be mindful about all issues, and therefore the
depth and breadth of what they are mindful of is likely to vary”. Most organizations are specialized.
Specialization imposes the need to coordinate, and integrating divergent views requires ongoing
efforts to keep the infrastructure from unraveling’ (Levinthal & Rerup, 2006, p. 506). A similar
conclusion has been drawn by Bigley and Roberts (2001, p. 1290) where they mention that “[a]s a
system becomes larger and more elaborate, fewer and fewer of its emergent properties are likely to
be held in the mental model of any one individual”. As a result, evolving, discrepant, and
disconnected representations can become more and more widely dispersed across the system in a
short time period.
4.2.3 The Cost of mindfulness
HRT writers from the first generation35 seem to take a rather simplified approach to mindfulness
where its costs are concerned. The conclusion therefore is that the sky is the limit: more is better.
Mindfulness comes at a cost though, cognitively and financially. The Michigan school (in later work)
and writers of the second generation have started to pay attention to the undesirability of
mindfulness in less dynamic contexts (Weick & Sutcliffe, 2001, p. 87-88) and the cognitive cost of
mindfulness (Vogus & Welbourne, 2003a;Swanson & Ramiller, 2004;Rerup, 2005).
Thought-provoking and revelatory research by Levinthal and Rerup (2006) has laid the foundations
for the integration of less mindful, routinized behavior with the mindfulness advocated by HRT. They
draw the attention to the opportunity costs associated with mindfulness: “the opportunity costs of
forgoing the use of established procedures as well as the opportunity costs of forgone attention”
(Levinthal & Rerup, 2006, p. 504). Because mindfulness is costly and demanding, mindlessness is a
valuable choice as well (Swanson & Ramiller, 2004, p. 566). The warning therefore is not to fire with
a cannon at a mosquito, since vigilant attention may not always be necessary and may be a waste of
resources. In view of this argument, research is needed to identify when, and under what conditions,
collective mindfulness is most appropriate and valuable.

Literature Review 59
Research is also needed to investigate the relationship between collective mindfulness and overall
productivity. Collective mindfulness requires a commitment to reliability, which can be costly
(Roberts & Libuser, 1993;Weick et al., 1999;Sullivan & Beach, 2003). Indeed, being and becoming an
HRO comes at a cost. Extensive training programs or the maintenance of volumes of detailed
technical documentation for instance can be very costly (Sullivan & Beach, 2003). Therefore, not
every organization can have the ambition to be an HRO. Other measures are less costly. “Measures
to improve the communication between an organization’s management and its workers, and the
empowerment of workers to make decisions in times of crisis” (Sullivan & Beach, 2003) for instance
are more easy and cheaper to implement.
4.2.4 Undesirable side effects
Several of the mechanisms suggested by HRT have unwanted effects elsewhere in the system:
- Redundancy makes the system more opaque and hence more opaque (Weick et al., 1999, p. 85).
- Centralized decision premises can induce blind spots (Weick et al., 1999, p. 85).
- Conceptual slack shatters a common perspective and spread confusion (Weick et al., 1999, p. 85)
- Collective mindfulness might relate to individual-level outcomes, such as stress and burnout.
Ensuring a mindful organization requires heightened vigilance and pro-activity (Weick et al.,
1999). It is possible that consistently operating at such a high level would lead to high levels of
employee stress and even burnout” (Knight, 2004, p. 50-51).
4.3 Self-Criticism
HRT scholars acknowledge that HROs might have trouble to guarantee their high level of reliability in
the long run (at the same time asking the question how long run reliability must be before one
considers a system highly reliable). “How long does a system need to avoid disaster for that
avoidance to count as evidence against the hypothesis of vulnerability to normal accidents” (Weick et
al., 1999, p. 85). On the other hand, NAT scholar Perrow (Afterword of the 1999 edition of Normal
Accidents, p. 372) writes: “A contrast of error-avoiding and error-inducing systems permits an
‘optimistic’ element in what Sagan describes as a basically pessimistic theory. It shows that inevitable
as normal accidents may be, their frequency can be significantly affected by the configuration of the
system because that configuration can discourage, even in an error-inducing system the small errors
that make the unanticipated interaction of errors possible. In my book I argued that the air transport
system managed to reduce tight coupling enough to make collisions extremely rare. In this view, HRT
and NAT are not incompatible, but can inform one another. It requires a detailed examination of
system characteristics, in effect, a contingency theory of system accidents”.
4.4 Beyond contingency: thesis, antithesis and synthesis
The above analysis has shown that the classical distinction between NAT and HRT does not hold. Not
only are there elements that seem to cast doubt on this divide, it is also the potential of both
theories for academia and practice. Therefore, post-Sagan research on high reliability (e.g. Weick et
al., 1999) has moved beyond the extreme positions of NAT vs. HRT. It has changed the way it looks at
the notion of ‘higher reliability’. Older literature tended to see high reliability as a defining
characteristic rather than as a reliability variable. Some researchers (Bain, 1999;Rijpma,
1997a;Rijpma, 2003) have recast the debate between the NAT and HRT perspectives and suggests

60 Two Cases in High Reliability Organizing: a Hermeneutic Reconceptualization
that they should be seen as `complementary, not competing, perspectives’. This is more prominent
from the side of HRT scholarship (e.g. La Porte & Rochlin, 1994), then from the side of NAT
(Afterword to the 1999 edition, Perrow, 1999), were the stance is much more offensive36. HRT
acknowledges the importance of tight-coupling and complexity but although it reaches a different
conclusion, it cannot really be considered the conceptual opposite of NAT. Jarman (2001, p. 101-
102) introduces the concept of lower-level reliability organization (or LRO/LRT) as the opposite of
HRO/HRT, rather than a NAT. From the NAT side, Heimann (2005, p. 115), although critical of high-
reliability organization theory, recognizes it “has hit on some key ideas in successfully managing risky
technologies”. We agree with Smart et al. (2003, p. 737) in their argument that such views engage a
more pluralist and post-modern perspective as a basis for organizational action, and halt the process
by which HRT or NAT become entrenched as singular world views in the minds of managers. The
conclusion of the overview of this mutual and self-criticism hence can be no other than that one
needs to take a contingency approach to high reliability.
NAT is HRT’s antithesis. It is its alternative thesis and the value of its contribution to the emergence
of a reliability synthesis is due to the fact that it starts from failure, which is the strongest scientific
basis possible (Schäfer, 1996, p. 30-31). HRT starts from success which is a much weaker scientific
basis because it is not contributing to falsification. In what follows, we argue why HRT and NAT
cannot explain organizational reliability. Also, why it cannot be explained independently from them.
1. Both schools take unreliability as their starting point, with failure as a dependent variable (La
Porte & Rochlin, 1994). Both schools start from a static view on reliability. NAT univocally
describes organizations in terms of interactive complexity and coupling, deriving from this
status their proneness to failure; HRT univocally describes them in terms of their culture,
structure, behavior, information processing etc. Although HRT seems to take into account
the dynamic nature of these properties and their change over time and the interaction
between structure and behavior (La Porte & Rochlin, 1994, p. 221), it does not make it
transparent and practical.
2. Both schools start from organizations that are characterized by interactive complexity and
tight coupling. They have collected little empirical data on organizations that do not fit this
straitjacket. More cases ceteris paribus. The result of the HRO research approach to study
cases of success and of failure, is that reliability is treated as a binary (success or failure)
concept (Ericksen & Dyer, 2005, p. 9). However useful such an approach may be, the
problem, according to Schulman (2001, p. 347-348) is that: “In research on high reliability in
organizations we are beset by the problem of many variables and few cases. How, without
more failures, can we really be sure which of the many organizational features we see are in
fact adding to reliability? If we do establish a connection between given features of an
organization and its operational reliability, can we assume that these features are necessary,
rather than merely sufficient? *…+ Finally, even if an organization has evolved features that
are necessary to its reliability, can we be sure that its evolutionary adaptation is stable, that
what adds reliability today will also work tomorrow under changes in the character of
technology, the work force, or in the life cycle of the organization?” In other words, too much
reliance on single case studies leads to a danger because there are too many variables and
too few cases.

Literature Review 61
Thus, from a contingency perspective, could it be possible to conclude that the advocates of HRT are
pleased with NAT because it helps them to be themselves even more? From a certain point of view,
NAT is an inclusion of HRT. Without NAT, no HRT. They need one another to form their identity.
Another way of seeing NAT as an inclusion of HRT is that HRT takes the same principles (interactive
complexity and tight coupling) as a starting point, but that they have developed the toolkit to use
them to their advantage. This framework is related to the original optimistic/pessimistic division but
consists of tools allowing for a more nuanced examination of the contingency. The study of this
framework is the subject of the following section.
5 SenseMaking In this section we examine the SenseMaking37 notion because of its potential contribution to a beter
understanding of what constitutes organizational reliability.38 Whereas HRT seems to address
structural and contextual dimensions that explain organization behavior, it does not offer a lens for
better understanding decision making. Sensemaking fills that gap as it describes how people act
upon what is happening and continuously make decisions in order to get grip of the situation.
SenseMaking therefore is a valuable complement to HRT.
SenseMaking literally means making sense of things. Thomas, Clark and Gioia (1993, p. 240) describe
SenseMaking as “the reciprocal interaction of information seeking, meaning ascription, and action”.
The central activities of SenseMaking are information seeking, processing, creating, and using
(Thomas, Clark, & Gioia, 1993), meaning that SenseMaking is not a noun, but a verb; that it is a
process, with sense as its product. It encompasses intuitions, opinions, hunches, effective responses,
evaluations and questions (Savolainen, 1993). SenseMaking is the process of creating a mental
model of a situation, particularly when this situation is ambiguous (Klein, Moon, & Hoffman, 2006). It
is "a motivated, continuous effort to understand connections (which can be among people, places,
and events) in order to anticipate their trajectories and act effectively" (Klein et al., 2006, p. 71). In
this respect, it is different from creativity, comprehension, curiosity, mental modeling, explanation,
or situational awareness, although all these factors or phenomena can be involved in or related to
SenseMaking. SenseMaking is a meta-cognitive framework that can be used to get a grip on the
equivocal external environment and its openness to multiple interpretations. It addresses questions
like: ‘What is happening out there?’, ‘Why is it taking place?’, ‘What does it mean?’ (Klein et al.,
2006, p. 5). Although not correct, we juxtapose SenseMaking and decision making, because in reality
it could be argued that decision making is an inclusion of SenseMaking. However, for reasons of
clarity, the remainder of this dissertation treats them as opposites. We do so because of the much
broader perspective offered by SenseMaking opposed to the rationalistic and mechanistic
characteristics of decision making (Boland, 2008).
Practically speaking, SenseMaking is a cognitive process (Boland & Yoo, 2003) that can be described
through seven properties (Weick, 1995): Identity Constructing, Retrospective, Enacting, Social,
Ongoing, Cue extracting, and Plausibility seeking (Table 2.9). It is the process by which individuals (or
organizations) “create an understanding so that they can act in a principled and informed manner”.

62 Two Cases in High Reliability Organizing: a Hermeneutic Reconceptualization
Identity Constructing. The organization seeks to discover what it ‘thinks’ and ‘knows’ about itself and
its environment. Depending on who the Sensemaker is, the definition of what is happening will also
change. What the situation means is defined by who one becomes while dealing with it or what and
who one represents (Weick, 1995, p. 20).
Retrospective. SenseMaking is an examination of past practices in order to learn/unlearn things about
the current context (Nathan, 2004).
Enacting. There is no objective environment out there separate from one’s interpretation of it. “People
often don’t know what the ‘appropriate action’ is until they take some action, guided by
preconceptions, and see what happens. Action determines the situation: The product of action is an
orderly, material, social construction that is subject to multiple interpretations” (Weick, 1988).
Social. “Other people are integral to our efforts to make sense of things because what we say or think
or do is contingent on what others say and think and do. People learn about events when they compare
what they see with what someone else sees and then negotiate some mutually acceptable version of
what really happened” (Weick, 1985).
Ongoing. SenseMaking takes place in a continuing and dynamic fashion as events unfold and we
continually seek to understand what events mean in relationship to our organizations. SenseMaking
has neither a beginning nor a formal end (Nathan, 2004).
Cue Extracting. We decide what to pay attention to.
Plausibility-driven. Looking for what is plausible is often of more practical help then finding accuracy.
Table 2.9 - SenseMaking properties (Weick, 1995)
In essence, the seven properties boil down to ‘How can I know what I think till I see what I say’. “This
recipe, which is central in organizational SenseMaking, retains several elements of dissonance
theory. The recipe is about justification (my thoughts justify my earlier words), choice (I choose which
words to focus on and which thoughts will explain them), retrospective SenseMaking (I look back at
what I said earlier from a later point in time when the talking has stopped), discrepancies (I feel a
need to see what I say when something doesn’t make sense), social construction of justification (I
invoke thoughts I have been socialized to label as acceptable), and action as the occasion for
SenseMaking (my act of speaking starts the SenseMaking process)” (Weick, 1995, p. 12). The best
synthesis, however, is offered by Weick et al. (2005, p. 419) when they formulate a conclusion on
what the seven SenseMaking properties are all about: “Taken together these properties suggest that
increased skill at SenseMaking should occur when people are socialized to make do, be resilient, treat
constraints as self-imposed, strive for plausibility, keep showing up, use retrospect to get a sense of
direction, and articulate descriptions that energize. These are micro-level actions. They are small
actions. But they are small actions with large consequences”. They summarize SenseMaking’s
distinguishing features as a “genesis in disruptive ambiguity, with beginnings in acts of noticing and
bracketing, founded in a mixture of retrospect and prospect, characterized by a reliance on
presumptions to guide action, embedded in interdependence and a culmination in articulation that
shades into acting thinkingly”.
Research on SenseMaking has been taking place for many years and by a great number of scholars,
but unarguably it has reached full growth under the inspiration of Brenda Dervin (e.g. 1983a) and
Karl E. Weick (e.g. 1995). Although both scholars have taken a different line of approach to the topic

Literature Review 63
and have been conducting their research independently from each other, their work definitely has a
common denominator. For many years – and to a certain extent even today – the SenseMaking
concept has remained undiscovered by mainstream literature but under the impulse of the
Organizational Learning thought, it rightly got a broader interest by scholars in organization theory.
This should not come as a surprise, since the process of improving action through better knowledge
and understanding, is integrally connected to SenseMaking (Nathan, 2004). Organizational
awareness is enhanced by the extent to which members of an organization collectively become
skilful perceivers of the business environment (Tsoukas & Shepherd, 2004). The idea of SenseMaking
has reached full growth under the inspiration of Karl E. Weick (2001). However, despite the
increasing attention, it would not be wise to label SenseMaking a theory: “*…+ SenseMaking is best
described as a developing set of ideas with explanatory possibilities, rather than as a body of
knowledge” (Weick, 1995, p. xi). This is in line with Dervin’s depiction of SenseMaking: “Some people
call it a theory, others a set of methods, others a methodology, others a body of findings. In the most
general sense, it is all of these. It is, first and foremost, a set of metatheoretic assumptions and
propositions about the nature of information, the nature of human use of information, and the
nature of human communicating” (Savolainen, 1993, p. 16).
The classification between individual and organizational SenseMaking is artificial. Individual
SenseMaking is senseless without the collective (i.e. social) dimension, “making ‘individual
SenseMaking’ something of an oxymoron” (Weick, 1995, p. 80). We therefore will not explicitly make
that distinction as we carry on with the elaboration of the SenseMaking construct. What is far more
characterizing is that SenseMaking is all about coping with interruptions. “To understand
*S+ensemaking is also to understand how people cope with interruptions’ (Weick, 1995, p. 5).
“SenseMaking is tested to the extreme when people encounter an event whose occurrence is so
implausible that they hesitate to report it for fear they will not be believed. In essence, these people
think to themselves, it can’t be, therefore, it isn’t” (Weick, 1995, p. 1). SenseMaking deals with
omnipresent discontinuity in constantly changing situations. Dervin (e.g. Dervin, 1999) labeled this
as ‘gappiness’, meaning that people are constantly confronted with dissonance, ill-structured
problems, ambiguity and equivocality.
If one were to name one setting where SenseMaking would be most relevant, it would be situations
where the gappiness is the most evident. The handling of high priority incidents (high impact, high
urgency) is such a setting. In such situations the observation is that discontinuity is the rule,
continuity the exception, while usually management and systems are designed according to the
exception (Turoff, Chumer, Van de Walle, & Xiang, 2004). If the dominant assumption is continuity,
systems are designed to deal with flows, process alignment etc. They are not designed for dealing
with the alternative assumption of discontinuity. The problem is that a system that is designed
according to the worldview of continuity does not help in practice because it conflicts with the
discontinuity of reality. We find ourselves always in the middle of a situation that needs being made
sense of. The purpose of our action therefore is to overcome our thrownness (Heidegger, e.g. in
Inwood, 1997), i.e. the ongoing experience and being in the middle of things.
64 Two Cases in High Reliability Organizing: a Hermeneutic Reconceptualization
6 Information Systems Fit
6.1 Introduction This section deals with the issue of aligning (i.e. fitting) Information Systems, users and tasks. After
an introduction of the problem statement and rationale behind IS Fit (6.1), we analyze the different
components of user-system fit. In that respect we look into the position of information systems as
such (6.2) and aspects related to the ‘user’ notion (6.3). Finally, we examine the role of fit (6.4).
6.1.1 Problem statement
An Information System is more than the hardware and the software. It is as much – or even more –
the structure, procedures and people that make it work. We posit that the degree of flexibility that
emerges from these system aspects is in essence determined by how the organization is coping with
interruptions through its structural dimensions (Pugh et al., 1968;Pugh, 1973) – we have referred to
this as High Reliability Organizing – and through its information processing capacities, referred to as
SenseMaking. To guarantee the dynamics described in the previous sections of this literature review
chapter, we believe that the design of Information Systems that are aimed at supporting
organizational reliability hence should encourage and support a process of Mindfulness and
SenseMaking. In practice however, it can be noticed that IS design does not support these High
Reliability and SenseMaking modes. In fact, it does the opposite because it aims at replacing or
suppressing the possibility to ‘make sense’ of situations. IS are conceived as a ‘repository of best
practice’ model (Boland & Yoo, 2003, p. 390) which puts an emphasis on data storage, instead of on
connecting people and stimulating reflection and building one’s own story line. Likewise, IS are
designed top-down, with an emphasis on rigidly following predefined and static procedures. The
consequence thereof is that IS are not supportive of stability and flexibility and that organizational
reliability is jeopardized.
It should be possible though to design IS in such a way that it combines both virtues (stability and
flexibility), the sine qua non being that a dynamic one replaces the static approach. The key to such
design is finding the right ‘fit’ or alignment between the different IS components. In this section we
specifically address the consequences for the incident support tool and more particularly the way it
is used in view of communication and coordination and the impact thereof on organizational
reliability. We do not believe – as is argued by Bostrom and Heinen (1977, p. 18) that computer-
related technology is essentially neutral and that whether its application succeeds or fails depends
entirely on the decisions that are made on how it shall be used (i.e. procedures, training, etc.).39
Therefore, the fit we are trying to define cannot be seen as a static notion, as a cookbook recipe, but
as a framework that can guide IS designers, analysts and managers in their daily practice of making
collaboration and coordination work. Such an interpretation of IS fit, with working practices and
organizational structures, including those that moderate collaboration between individuals (Payne,
2003), now generally is acknowledged to be essential for the usefulness of a computer system.
6.1.2 Rationale
To account for the rationale of our writings in this section, we draw and juxtapose on Markus (1983)
reporting three theories that have the potential of explaining why users resist to management
information systems (MIS): (1) their own internal factors; (2) poor system design; (3) the interaction
of specific system design features with aspects of the organizational context of system use.
Important in Markus’ work is that he acknowledges that these theories differ in their basic

Literature Review 65
assumptions about systems, organizations, and resistance. Remarkable is Markus gathering of
empirical evidence for the dominance of the interaction theory. Our study, however, demonstrates
the importance of the interaction of all three theories. We do so by means of the conceptual model
depicted in Figure 2.4.
Figure 2.4 - IS Interaction Model
The originality of our contribution lies in the addition of SenseMaking and High Reliability constructs
as lenses that offer the possibility of synthesizing the three presupposed theories. In all three of
these classical theoretical streams, we add aspects of structure and agency. The application of this
set of constructs is novel, because previous studies on the reliability of complex systems that also
applied HRO constructs – for instance Carlo et al. (2004) – have approached HRO literature from an
IT artifact perspective. By this, we mean that when HRO research deals with IT, it is merely in its role
of increasing interactive complexity and tight coupling, not as a potential enabler of mindfulness.
This section makes an original contribution to the Information Systems discipline, by addressing the
link of high reliability theorizing and IS fit. We posit that it has the potential of offering a practical
interpretation of what is meant by flexibility (and hence also stability). This fills a need, for two
reasons: (1) the underdevelopment of Human Computer Interaction (HCI) in the field of coordination
and (2) the under-specification of the flexibility notion. These issues are briefly dealt with next.
Underdevelopment of HCI in the field of co-ordination
Despite the general acknowledgement that systems are the aggregation of hardware, software,
procedures and people, its translation into practice is less self-evident. Their design and
implementation does not take into account the reciprocity that exists between them and moreover
is static and therefore incapable of adjustment to contingency. Therefore it should not come as a
surprise that much of the basic research into Human Computer Interaction (HCI) has not attempted
to provide techniques to understand and help design for these situations, preferring to study and
provide support for solitary and decontextualized activities (Perry, 2003, p. 193). Perry explains that
– despite its tremendous importance – one of the reasons for this is that HCI theoreticians and
modelers have not had a ‘way into’ the problem – cognitive theory tells us little about social
behavior, while the social sciences’ understandings and explanations of social action are hard to
apply directly to design. How process members adapt and make use of tools in their work to support
their cognitive abilities is poorly understood. This is because the theoretical approaches and
User’sinternalfactors
Interactiondesign -
organization
Poorsystemdesign

66 Two Cases in High Reliability Organizing: a Hermeneutic Reconceptualization
experimental methods that have been applied to the area are not, in general, able to investigate
these kinds of behavior (Perry, 2003, p. 193). Therefore (IS) designers need to have a better
understanding of work that goes beyond the individual, to look at how teams coordinate their
behaviors with one another, collaborate, and perform problem-solving tasks (Perry, 2003, p. 193).
Finding out how system users coordinate their action in relation to the structural and contextual
determinants they are guided by is the first objective of this section.
Under-specification of the flexibility notion
Most research does not define what is meant by ‘flexibility’: “What should be flexible: the IT
organization, the people, and the technology? How is flexibility developed, how is it managed?”
(Patten, 2004, p. 4). The question arises how flexibility is achieved. The position taken in this
dissertation is that it cannot be embedded statically in the design of the system but that it is
determined by the degrees of freedom system users have when accomplishing their tasks. These
degrees of freedom in themselves again are bounded by limitations so that stability can be assured.
How this is combination of stability and flexibility is guaranteed with respect to information systems
(in the broadest sense) design (also in the broadest sense) is the second objective of this section and
its underpinning by data (Chapter 6).
6.2 Information Systems (IS) Information technology research (at least in general) acknowledges an IS as an actual system of
physical, social and cognitive elements that are built, used and rebuilt by people in everyday practice
(Griffith & Dougherty, 2001, p. 208). Despite this acknowledgement, everyday practice (and part of
scientific research) sticks to a static IS notion. This shows itself mainly in the disregard towards two
factors mainly: (1) user characteristics and (2) contingency, i.e. the indeterminacy of the context.
Several authors have dealt with this issue. Among them, Orlikowski (1992) who has reported several
occasions where the combination of user characteristics and contingency has lead to users
employing different strategies for using IS. “Rather than positing design and use as disconnected
moments or stages in a technology's lifecycle, the structurational model of technology posits artifacts
as potentially modifiable throughout their existence” (Orlikowski, 1992, p. 408). Such is also clearly
shown in case of electronic mail by Mackay (1988), implying designers should seek flexible solutions
that capture the important dimensions of use and provide flexibility for a wide range of users. Apart
from the work by the authors mentioned above, at least in our view, it is Weick (1985) who has
pinpointed the problem best: “Representations in the electronic world can become chaotic for at
least two reasons; The data in these representations are flawed, and the people who manage those
flawed data have limited processing capacity. These two problems interact in a potentially deadly
vicious circle. The data are flawed because they are incomplete; they contain only what can be
collected and processed through machines. That excludes sensory information, feelings, intuitions,
and context — all of which are necessary for an accurate perception of what is happening. Feelings,
context, and sensory information are not soft-headed luxuries. They are ways of knowing that
preserve properties of events not captured by machine-compatible information. To withhold these
incompatible data is to handicap the observer. And therein lies the problem” (Weick, 1985, p. 51-52).
For these reasons, the technology will be appropriated in diverse ways and has different meanings
and effects for different users. The conclusion therefore is that humans may appear to act within the
constraints of technology and institutions (Rose, 1999). The combined effect of differing user

Literature Review 67
properties and indeterminacy means that information technology is not always used in ways
envisioned by designers or intended by implementers (Orlikowski & Robey, 1991, p. 157). This
combined effect at the same time means that “Information technology does not simply determine
behavior, but is actively invoked and appropriated by human actors” (Orlikowski & Robey, 1991, p.
157). “Examining selected relationships (e.g., studying how information technology influences users,
without understanding how users appropriate the information technology, or the conditions within
which the mediation occurs) can only result in a partial understanding of how information technology
interacts with organizations” (Orlikowski & Robey, 1991, p. 154).
The difficulty however, often is that most designers and engineers of such systems are comfortable
identifying a problem and improving or fixing it. “They prefer to deal with absolutes rather than
probabilities, and do not consider the stochastic nature of these systems and their associated
subsystems” (Azadeh, 2000, p. 210). Designers and engineers tend to believe that reality can be
modeled, but unfortunately, complex systems cannot be simplified and hence do not fit into a
model. The reason is that due to the nonlinear nature of the interactions in a complex system,
complexity is incomprehensible and therefore incompressible. This means that there is no accurate
representation of the system that is simpler than the system itself (Cilliers, 2000, p. 9). In building
representations of open systems, we are forced to leave things out, and since the effects of these
omissions are nonlinear, we cannot predict their magnitude. This is not an argument claiming that
reasonable representations should not be constructed, but rather one that the unavoidable
limitations of the representations should be acknowledged (Cilliers, 2000, p. 9).
6.3 IS Users The previous discussion has shown that user characteristics are essential in the way an Information
System is used. What follows takes this discussion one step further by decomposing the notion of
user characteristics. It does so by addressing cognitive profile (subsection 1), underlying worldview,
assumptions and values (subsection 2), and the reverse designer perspective (subsection 3).
6.3.1 Cognitive profile
An individual’s psychological attributes (i.e. cognitive profile) influence his/her decision making
behavior (and information processing behavior) (MacCrimmon & Taylor, 1976, p. 1439):
1. Perceptual ability (The way in which a decision maker perceives a problem is a major
determinant of the degree of uncertainty, complexity, and conflict. *…+ His perceptions
depend upon the premises he holds about the decision situation.)
2. Information capacity with the distinction between abstractness and concreteness as a most
important feature. Concreteness is characterized by the use of few dimensions of
information and simple integrating schemata; Abstractness is the tendency to process many
dimensions of information and to use complex integrative schemata.
3. Risk taking propensity
4. Aspiration level
6.3.2 Worldview, prior experiences, assumptions and values
Apart from the cognitive profile outlined above, each individual interprets and internalizes
knowledge differently depending on personality traits, prior experiences, expectations (Storck &
Henderson, 2003, p. 513) (referring to Weick (1995)) and worldview. A range of social and

68 Two Cases in High Reliability Organizing: a Hermeneutic Reconceptualization
organizational factors are embodied in the values of various IS stakeholders (Tan & Hunter, 2002).
Therefore, any explicit presentation of social and organizational factors is a discussion of people’s
underlying assumptions and values (Orlikowski & Gash, 1994). Values are the basis on which
objectives can be created. As noted by Keeney (1992, p. 24), “bringing . . . values to consciousness
allows you to uncover hidden objectives, objectives you didn’t realize you had”. Examples of these
values are mental models and schemes. Dhillon and Torzadeh (2006, p. 295-296) report that
although values have been considered important and various authors have used a variety of
techniques to undertake their research, no specific methodology has taken hold. Our explicit
formulation of what we understand as SenseMaking or High Reliability proneness therefore is a
valuable candidate for labeling the values and assumptions underlying organizational behavior.
6.3.3 Systems designer's implicit theories
Independent from the worldview and cognitive profile of the user, it will be clear that a system – any
system – will be designed according to one particular dominant worldview (or combinations
thereof). In other words, the design will greatly depend on the designer’s worldview as well. This
means that the fit between the system user and the system is heavily depending on chance. The fact
that still at so many occasions the fit is realized despite of this chance element is not surprising since
the designers and users very often share the same worldview.40 Nevertheless, systems designers
clearly though implicitly make assumptions: (1) about people, e.g., ‘people are poor information
processors’, (2) about organizations, e.g., ‘information flow downward must be controlled’, and (3)
about the change process, e.g., ‘we must get users to participate or they will not accept the system’
(Bostrom & Heinen, 1977, p. 19-20). This corresponds to the Theory X, traditional or machine theory,
and Theory Y, human resource theory. Theory X assumes a person is one who likes order, wishes to
work within tightly specified boundaries, and does not want to have a great deal of personal control
over one's activities. Theory Y assumes a person is a responsible, self achieving individual who can
take full control of one's work environment (Bostrom & Heinen, 1977, p. 19-20).
6.4 IS Fit This brings us to the topic of how fit is accomplished. Depending on the adherence to either theory X
or theory Y, the way ‘fit’ is assured can differ substantially. The different approaches are dealt with
next.
6.4.1 Task/System Fit (TSF)
If one is to consider how an incident handling tool (like Peregrine) is used – or not used – in view of
process reliability, two theoretical concepts come to mind: Task/System Fit (TSF), also known as Task
Technology Fit (TTF) (Goodhue & Thompson, 1995). The concept of task/system fit focuses on the
alignment between capabilities or functionalities provided by a given information system and the
information processing requirements of the task in which the system may be used (Nance, 2005).
The idea behind this concept is that the better the fit, the better a task will be accomplished by a
system user and therefore represents a contingency perspective on organizing (Goodhue &
Thompson, 1995). As such, the quality of the task outcome is determined by the information
processing requirements of a given task on the one hand and information processing functionalities
in an information system on the other hand. This constitutes a mere ‘objective’ engineering
perspective (Nance, 2005) on task/system fit. In that sense, it corresponds to Theory X (supra).

Literature Review 69
6.4.2 Congruent Fit
The view underlying the static IS design outlined above is built on a resource based view on
organizing (Wernerfelt, 1984) and more particularly since the nineties on a competence based view
(Hamel & Prahalad, 1994;Conner & Prahalad, 1996). This school of thought posits the importance of
a focus on core elements. This evolution is at odds with a systems perspective on organizing (see e.g.
Lawrence & Lorsch, 1967) and like it has been articulated by Galbraith (1973) as congruent fit. Porter
(1996) formulates his critique on the resource based view and his plea in favor of congruent fit as
follows: “The importance of fit among functional policies is one of the oldest ideas in strategy.
Gradually, however, it has been supplanted on the management agenda. Rather than seeing the
company as a whole, managers have turned to ‘core’ competencies, ‘critical’ resources, and ‘key’
success factors. In fact, fit is far more central component of competitive advantage than most
realize”. In the words of Starbuck and Nystrom: “A well-designed organization is not a stable solution
to achieve, but a developmental process to keep active” (Starbuck & Nystrom, 1981, p. 14). In that
respect, congruent fit is a far more powerful notion for driving stability and flexibility than the static
image of fit propagated by static business alignment frameworks like TTF. In our research we
explicitly want to include the cognitive information processing style and underlying worldview of the
individual completing as a third component (Nance, 2005).
Our critique on TTF models – and herein lies the intended value of our contribution – is that
contingency is overlooked in that sense that a one-dimensional perspective is taken towards TTF.
The interaction between (1) task, (2) user characteristics and (3) system characteristics and
capabilities remains underdeveloped and under-researched. The idea of a static notion of fit stems
from a mechanistic worldview where context is stable and can be kept under control. Tasks and
technology – like structure and strategy for that matter – can be aligned for an undetermined
period, resulting in an optimal reliability. Adjustments to this fit are relatively infrequent and occur
in a discrete way (as opposed to continuously) after a formal initiative and decision of system
designers. The idea of a dynamic notion of fit finds its origin in systems- and complexity thinking
where context is instable and the objective should not be to control it, but to go with it in order to
yield the best (not the optimal) reliability achievable. Fit thus is continuously on the move. It cannot
exclusively be caught in fixed procedures, best practices, structures and strategies. This kind of fit
emerges from the day-to-day behavior of people trying to make sense out of the situations they run
into. Therefore, adjustments to this fit are made incrementally and continuously. In that sense, the
schism between the world of the system and the world of the organization can be bridged and
combined changes can solve problems that any change on only one side (technology or organization)
cannot resolve (Schwabe & Krcmar, 2000).
Also important in this respect is that we adhere to Dervin’s (1983b) viewpoint that human use of
information should be studied from the perspective of the actor, not the intermediating system,
such as an incident management support tool. The mere system view looks at structural variables
such as age, sex, education, team membership, life style, or task description (Savolainen, 1993, p.
19) and derives from this system characteristics that should be met. The user view starts from the
given that that the user is the essential order, and the system bends to it rather than the other way
around (Savolainen, 1993, p. 19).


Research Methodology 71
Chapter 3 Research Methodology
If we knew what we were doing,
it wouldn’t be called research, would it.
Albert Einstein
1 Introduction
To effectively study a topic as complex as the incident management process reliability, it is
difficult relying on one single or two measurement tools only (Sullivan & Beach, 2002, p. 1424).
Early in our research, we realized we were studying quite an extra-ordinary process – the
Incident Management Process – for which existing theory did not appear to be useful, showed
drawbacks or did not exist. The absence of a well-established body of literature forced us to dig
as deep as possible into the tissue of the matter, in search of something to go by. This called for
another approach than the a priori royal road to scientific research, for which one kind of data
gathering would suffice. In literature on research methodology this approach is known as
triangulation and can – in brief – be best described as a combination of several data gathering
techniques (and of theory). Triangulation – by permitting multiple instances for interaction
between theory and data – offers multiple perspectives. The deeper, science-philosophical
foundation of this approach is hermeneutics, which is the thread throughout our research and
which has proved to be a very useful guide.
This chapter describes the research methods and their science-philosophical foundations we
have used throughout this dissertation. It shows why and how we triangulated between
qualitative and quantitative research methods and – within these broad categories – between
the different techniques. In that respect, the term ‘research methodology’ goes deeper than
what is meant by ‘research technique’. Methodology is the overall process guiding the entire
research project; technique on the other hand, is the primary evidence generation mechanism
(Palvia, Mao, Salam, & Soliman, 2003, p. 3). After a description of both our case studies (Section
2), we first elaborate on the conceptual and science-philosophical underpinning of our approach
that has its roots in hermeneutics (Section 3). Next, we translate these remarks into HRO
research taxonomies (Section 4). Subsequently, we describe the research build-up in more detail
(Section 5). Special attention goes to the survey as our main data collection technique (Section
6). We conclude this methodology chapter with a build-up of the hermeneutic circle of
understanding (Section 7).
2 HRO Case Studies
2.1 Bank Case41 This section and the next one provide an overview of the organizations at which this study has
been conducted, the financial institution (hereafter referred to as the ‘Bank’) and the nuclear
72 Two Cases in High Reliability Organizing: a Hermeneutic Reconceptualization
power plant (hereafter referred to as the ‘NPP’). A nuclear power plant, any nuclear power plant
for that matter, is an archetypical HRO, as discussed above. A financial institution is an archetype
of a mainstream organization. However, we posit that the incident management process under
study bears the hallmarks of an HRO. A part of our research wants to find out whether this
assertion holds. Therefore, it is essential to have a description of the organizations under study
in mind. Subsection 2.1 describes the Bank and the Incident Management Process whereas
subsection 2.2 portrays the NPP and the Maintenance & Repair Process.
2.1.1 The company
The Bank under study is a large European financial services provider in the field of Banking and
insurance. It has branches in 30 different countries and offers a full range of financial services to
retail and corporate customers. It holds a key position in several European countries. The
holding was created in the late nineties through the merger of two Banking groups and one
insurance company and now serves some 12 million customers and employs about 50.000
people. It holds a Euro zone top-20 ranking in terms of market capitalization.
2.1.2 The IT department
The financial institution’s centralized IT department employs over 2000 people and has a budget
of on average 400 million euro. It has an IT Governance program in place consisting of (De Haes
& Van Grembergen, 2005): clear structures (roles and responsibilities, IT organization structure,
IT strategy committee, IT steering committees), well-defined processes (Strategic Information
Systems Planning, Balanced (IT) scorecards, Information Economics, Service Level Agreements
(SLAs), Control Objectives for Information and related Technology (COBIT) and Information
Technology Infrastructure Library (ITIL), IT alignment, and governance maturity models), well-
described relational mechanisms (e.g. account management roles, and an IT governance internal
magazine and intranet (De Haes & Van Grembergen, 2006), active participation and
collaboration between principle stakeholders, partnership rewards and incentives, business/IT
co-location, cross-functional business/IT training and rotation). This research particularly
addressed two (out of 27) IT processes that were deemed to be vital to the Bank’s survival. The
first process is a cross-border payment service that provides back-office processing services to
financial institutions for all international payments. The second process is an integrated solution
that enables businesses customers and a number of government departments to carry out all of
their Banking transactions and allows document handling (e.g. signing contracts, sending and
receiving invoices).
From this company and process description, we derive the resemblance with an HRO setting.
The interactive complexity, tight coupling and high impact of failure make the Bank context
comparable to an archetypical HRO like a NPP. The means and methods by which the
organization ensures reliability – under continuous pressure to increase efficiency and decrease
the potential for human error – are very costly in personal and economic terms. It can be argued
that the handling of incidents in such a setting calls for working under particularly demanding
conditions as nearly all critical business processes are relying on their services for their reliability.

Research Methodology 73
2.1.3 The Incident management process
The IT incident management process bears considerable resemblance with any incident
management process, be it the IM of a mainstream organization or an emergency/high hazard
organization (Wolf, 2004). The process is described in detail next.
IT Service Management and Information Technology Infrastructure Library
For the management of the exploitation of its services and Information and Communication
Technology (ICT) an organization like the one in our case study can build on IT Service
Management (ITSM). ITSM is the discipline that strives to better the alignment of IT efforts to
business needs and to manage the efficient providing of IT services with guaranteed quality
(Brenner, 2006). Its de facto standard methodology is the IT Infrastructure Library (ITIL) which
has been published in the UK by the Central Computer and Telecommunications Agency (CCTA)
(2000) since the late 1980’s (Brenner, 2006) where it emerged when the public sector started
privatizing the exploitation of ICT and the principal wanted to have a grip on the services
provided by these privatized ICT departments. This called for the gaining of insight in the tasks to
be dealt with by an ICT organization. Not only the description of tasks viewed apart is important,
but also the relationship between various tasks and the course of the processes within the
various tasks must be clear (Van Den Eede & Van de Walle, 2005). Implementation of ITIL must
lead towards implementation of process management supplying services meeting a certain
service level (Thiadens & Spanjersberg, 2000). ITIL can be best labeled a ‘Best-Practices-
Framework’ (Sewera, 2005) and is at this point in time the only comprehensive, non-proprietary,
publicly available guideline for IT Service Management (Potgieter, Lew, & Botha, 2005). Although
ITIL covers a number of areas, its main focus is on Service Support and Service Delivery (Janssen,
2003). The process under study, incident management, comes under Service Support, together
with four other processes, as depicted in Figure 3.1. Their further discussion remains outside the
scope of this dissertation. For the purposes of our research, we can restrict ourselves to a
discussion of the Incident Management Process.
Figure 3.1 - ITIL Service Support Module (Adapted from van Bon, Kemmerling, Pondman, & van der Veen,
2004)
Incident Management
ProblemManagement
ChangeManagement
ConfigurationManagement
Release Management
Service Desk

74 Two Cases in High Reliability Organizing: a Hermeneutic Reconceptualization
Incident management
Under ITIL, an incident is defined as a deviation from the (expected) standard operation of a
system or a service that causes, or may cause an interruption to, or a reduction in, the quality of
the service. It refers to “any event which is not part of the standard operation of a service and
which causes, or may cause, an interruption to, or a reduction in, the quality of that service”
(CCTA 2000, p.71). Example of incidents may be degradation in the quality of the service
according to some measure of quality of service, the unavailability of a service, a hardware
failure, or the detection of a virus. Users are the people who use the IT services in the business
domain of the organization. The objective of Incident Management is to provide continuity by
restoring the service in the quickest way possible by whatever means necessary (temporary fixes
or workarounds) (Bartolini & Sallé, 2004). In this respect, Figure 3.2 illustrates the parameters
that time to repair or downtime is composed of.
Figure 3.2 - Parameters influencing downtime (Brenner, 2006)
The detection time, i.e. the time until an incident is registered, can be shortened by technical
measures like the use of monitoring tools (although in practice many incidents are still first
reported by users to the service desk). The activities for the incident resolution however, mostly
involve human intervention and their durations have a direct relation to typical Key Performance
Indicators (KPIs) of Incident Management (response time, repair time) and Change Management
(recovery time) (Brenner, 2006). Quintessential for a successful implementation of incident
management is the presence of a Service Level Management ensuring continual identification,
monitoring and reviewing of the optimally agreed levels of IT services as required by the
business. Most targets set in a Service Level Agreement (SLA) are subject to direct financial
penalties or indirect financial repercussions if not met. It is therefore critical for this
management process to flag when service levels are projected to be violated in order for an IT
organization to take proactive actions to address the issue (Bartolini & Sallé, 2004, p. 65). This
means that tracking response, repair and recovery times is essential to achieving service level
compliance. Incident priorities and escalation procedures are defined as part of the Service Level
Management process and are key to ensure that the most important incident are addressed
appropriately. (Bartolini & Sallé, 2004, p. 66). In the incident management process it is of
fundamental importance to classify, prioritize and escalate incidents (Central Computer &
Telecommunications Agency, 2000). Priority of an incident is usually calculated through

Research Methodology 75
evaluation of impact and urgency (Bartolini & Sallé, 2004, p. 66). For this purpose, the collection
of sound statistical data from tracking Incident Management instances, is crucial (Brenner,
2006).
To understand the Incident Management process at the financial institution, we first discuss
their organization of the Incident Management process, whereupon we explain how incidents
are handled.
Organization of the incident management process
The financial institution has a special Service Management division that coordinates the ITIL
processes throughout the organization. One of the Service Management division’s staff
members is the Incident Management process owner, in ITIL referred to as the Incident Manager
(CCTA (Central Computer & Telecommunications Agency), 2000, p. 87). The Incident Manager is
responsible for the efficiency and effectiveness of the Incident Management process. The
Incident Manager monitors the Incident Management process, maintains the Incident
Management information system, and makes recommendations for improvement. The financial
institution uses a special IT Service Management application suite, Peregrine Systems’ Service
Center, which is designed to support ITIL’s best practices.
Financial institution
IT DepartmentBusiness
Department
DivisionDivisionDivision
Incidenthandling team
Incidenthandling team
Incidenthandling team
Incidenthandler
Incidenthandler
Incidenthandler
Incidenthandler
Organizer
Incident Manager
Service DeliveryOwner (SDO)
IncidentCoordinator (IC)
Team leader
Incident Management Hierarchy
=
=
=
=
Figure 3.3 - Organization of the Incident Management process (Muhren, 2006)
ITIL’s main tool to monitor a process is to set KPIs. KPIs are defined as “clearly defined objectives
with measurable targets to judge process reliability” (CCTA (Central Computer &
Telecommunications Agency), 2000, p. 88). Every month the Service Management division issues

76 Two Cases in High Reliability Organizing: a Hermeneutic Reconceptualization
a report on the reliability of the various ITIL Service Support processes, making use of the
prescribed KPIs.
The financial institution offers many services to their customers, for example asset management
activities, financial transactions, and online Banking. To support all these services, many internal
services have to be in place. The financial institution has split up all her activities into service
domains, and each of the over 70 service domains maintains one internal or external service.
Every service domain has a Service Delivery Owner (SDO) in place, which is responsible for
supporting the service domain by the IT department. The SDO has a good overview of all
activities within a service domain, from the IT department to the users in the business divisions,
and is therefore an important contact person when incidents occur in a service domain. In
literature on organization theory this role is known as ‘boundary spanner’ as it enables
transgressing the departmental boundaries (Williams, 2002).
Each division of the IT department has its own Incident Coordinator (IC), who is responsible for
the Incident Management activities within his division. The IC coordinates the Incident
Management activities of the teams in his division and communicates directly with the SDO
when a higher priority incident occurs. ICs provide the Incident Manager of recommendations
for improvement of the Incident Management process. Within each incident handling team
there is a team leader, who functions as the contact person for the team.
Incident management process
Incident detectionand recording
Classification andassignment
Investigation anddiagnosis
Resolution andrecovery
Incident closure
Ow
ners
hip
monitoring, tr
ackin
g a
nd c
om
munic
ation
Figure 3.4 - The Incident life cycle (adapted from CCTA (Central Computer & Telecommunications
Agency), 2000)

Research Methodology 77
Now that we have seen how the Incident Management process is organized, we can continue
with examining how incidents are actually handled at the financial institution. As the maturity of
the Incident Management process of the financial institution is very high compared to ITIL’s best
practices and the same process at other companies, we discuss ITIL’s Incident Management
process according to the implementation at the financial institution where we have conducted
the research. Figure 3.4 gives a brief overview of the different steps in the Incident life cycle. A
more extensive process layout is provided in Table 3.1. The process flow diagram can be found in
Figure 0.1, under Appendix K.
It is important to note that an incident is constantly monitored by the owner of an incident, who
makes sure the agreed resolution time is not exceeded and who communicates the status of the
incident to the user.
Phase Role Proc Step Status
Reg
istr
ati
on
REG 1 Register the incident
Open
REG 2
Classify the incident and assign it to a team
Open
Ch
eck t
he a
ssig
nm
en
t
SOLT 3 Check the assignment of the incident
Inbox: Incidents assigned to my team(s),
with status’open’ and ‘accepted’
SOLT 4 If the incident is assigned to the right team and you
cannot start immediately with solving the incident, accept
the incident.
Accepted
SOLT 5 If you can start immediately with solving the incident,
assign it to a solver.
(fill-in ‘assigned to user’)
Work in progress
Dia
gn
osis
& S
olu
tio
n
SOL 6 Analysis
Inbox: Incidents assigned to me,
with status ‘Work in progress’
SOL 7 Work out (a part of) the solution
SOL 9 Implement temporary solution (solution with aftercare) Flag ‘Temporarily
bypassed’
SOL 8 Implement permanent solution Resolved
Veri
ficati
on
&
Clo
sin
g
COO 10 Check the solution of the incident
Inbox: Incidents registered by me,
with status ‘Resolved’
COO 11 Close the incident Closed
COO 12 Reopen the incident Open
REG = Registered by SOLT = Team Solver SOL = Solver COO = Coordinator
Table 3.1 - Description of the Incident Management process

78 Two Cases in High Reliability Organizing: a Hermeneutic Reconceptualization
Incident detection and recording
When a user encounters difficulties in continuing his work, he calls the Service Desk, the first-
line support for incident handling in the organization. If the phone call is just a request for
information, or the service desk employee can solve the difficulty immediately, it is registered in
Peregrine as a ‘call’. No further actions are required and the user can continue his/her work. If
the difficulty cannot be solved immediately, the Service Desk registers it as an incident. An
incident ticket is then created in Peregrine and all possible incident details are entered in the
ticket. From this point onwards, the Service Desk is the owner of the incident and is responsible
for the timely handling of the incident and the communication to the user. The user needs to be
updated regularly on the status of the incident.
An incident can also be detected by operational personnel. Operational personnel could either
be the cause of the incident, or they were just able to detect the incident in their day-to-day
activities before any service disruption was noticed by a user. It is a common procedure for them
to register the incident themselves in Peregrine. In this case, they are the owners of the incident
and coordinate the incident until it is solved. In the remainder of the thesis, we focus on the
normal procedure that the Service Desk coordinates incidents.
Classification and assignment
By asking targeted questions, the Call Desk can estimate the priority of the incident. The priority
is set by determining the impact and urgency of the incident. The impact of the incident must be
determined from the company’s perspective and indicates the (potential) financial loss the
incident can cause. There are four different degrees of impact (Table 3.2) and three different
levels of urgency (Table 3.3) an incident can have.
Impact level Impact qualification
1 Very many users are impacted (e.g. the entire head office)
2 Many users are impacted (e.g. a few branches or several divisions)
3 Few users are impacted (e.g. one branch or one division)
4 One user is impacted
Table 3.2 - Incident Impact Level (Bank)
Urgency level Level qualification
1 Very urgent
2 Urgent
3 Not urgent
Table 3.3 - Incident Urgency Level (Bank)
The priority is set by adding the impact and urgency degree and decreasing it by one. So the
highest possible priority is 1, the lowest is 6. The timeframe within which the incident must be
solved is formulated in Service Level Agreements and can be found in Table 3.4.

Research Methodology 79
Impact
1 2 3 4
Urg
ency
1 2 hours
1
2 hours
2
4 working hours
3
4 working hours
4
4
2 4 hours
2
4 hours
3
12 working hours
4
12 working hours
5
3 10 days
3
10 days
4
10 days
5
10 days
6
Table 3.4 - SLA Time frames
It is possible that the Service Desk is able to handle the incident, but cannot do this immediately.
The incident is then assigned to the Service Desk. In most cases the Service Desk does not know
what is causing the incident or how to solve it, so they must make an appeal to people with
more expertise: second-line support groups, having more specialist skills, time or other
resources to solve incidents (CCTA (Central Computer & Telecommunications Agency), 2000, p.
74). Because the Service Desk inquired the user about the incident, they will have an idea on
what could be causing the incident or at least in what area to start investigating it. In Peregrine,
a list of teams appears that could be consulted for this kind of incident. The Service Desk assigns
the perceived most suitable team to handle the incident.
People from the IT department are split up into teams that each has their own specialization.
These are virtual teams, because they could comprise people who work in different divisions
and/or at different locations. They all have access to Peregrine, and when an incident is assigned
to a team, it appears in the mailbox of the specific team and each team member can assign the
incident to himself or herself. The team member that assigns the incident to himself/herself is
called the incident handler. When the incident appears is assigned to the wrong team, it is sent
back to the sender.
Investigation and diagnosis
The incident handler will investigate the incident and try to find a solution or a workaround. It is
possible that a solution can only be implemented after some time, e.g. at a new release. A
workaround could be suggested that will help the user until the real solution is implemented.
When a team member cannot identify the underlying cause of the incident and propose a
solution or workaround to it, the incident can be further rerouted to a higher-line support team,
even an external vendor, until a solution to the incident is found.
Resolution and recovery
The incident handler implements the solution or the workaround, takes all necessary recovery
actions and updates the documentation of the incident in Peregrine by describing how he/she
solved the incident.
Incident closure
The Service Desk contacts the user to make sure the proposed solution is satisfactory. If this is
not the case, the incident is sent back to the incident handler. The Service Desk closes the
incident when the user is satisfied with the proposed solution.
80 Two Cases in High Reliability Organizing: a Hermeneutic Reconceptualization
Security incident handling
Not all incidents are handled in this manner. Incidents that are a (potential) threat to the
confidentiality or integrity of the information or even the organization, or incidents that have
impact on the availability of the systems or networks and are suspected to be caused by criminal
intent, are handled in a special process. This security incident handling process is not the scope
of this thesis.
Incident briefing
Every morning the incidents with a priority code one or two that occurred the day before or still
have an open status are discussed at a ‘morning briefing’. Employees who solved the incident or
know more about it, explain the cause of the incident and the (proposed) solution to a public
comprising general managers, incident process coordinators, service delivery owners, and other
IT staff that is involved in Incident Management or just is interested. A staff member of the
Service Management division serves as the chair of the meeting. Half an hour before the
briefing, potentially interested employees to attend the briefing can read a document on the
intranet that describes the incidents that will be discussed. The briefing can be attended ‘live’ at
the head office of the financial institution or at another office via videoconference.
2.2 NPP Case42
2.2.1 The company
The NPP under research is part of a European energy company which core businesses are (1)
sales of electricity, natural gas and energy products and services; (2) electricity generation; (3)
electricity and natural gas trading; and (4) management of electricity and natural gas networks,
on behalf of distribution system operators. The company43 employs over 15.000 staff and
realizes a turnover of over 12 billion Euros. It operates seven nuclear reactors and has numerous
thermal plants as well with which it generates over 130 000 Giga Watt Hour (GWh) electrical
power44. According to recent national legislation, nuclear power should be phased out, starting
in 2015, which puts a large amount of stress on the organization. Equally noteworthy is that
large scale commercialization of power production in Europe has unleashed a series of mergers
and acquisitions that probably will continue for a while stressing the volatility of the European
energy market.
2.2.2 The Nuclear Power Plant
Reactors
The site houses four reactors, all of the Pressurized Water Reactor type. The two older reactors
share various systems, among which a control room with separate consoles for each reactor,
which makes them virtually unique. Their tight association accounts for the fact that these
reactors are referred to within the plant as ‘twin-reactors’. They have a generating power of
about 400MW. The other two reactors are of a more modern breed and although identical, they
are separate entities, both generating some 1000MW. The reactors themselves and closely
connected machinery such as steam generators and tools for fuel manipulations are housed in
circular containment buildings, as is usual for reactors of this type. The turbines and other
machinery are housed in adjacent machine halls. The control rooms and offices of staff that are
closely involved in operation of the installations are in buildings that are connected to the

Research Methodology 81
machine halls and reactor buildings. Separate buildings house administrative staff, workshops
used by maintenance personnel, a restaurant and a wastewater facility. This facility deals with all
the water that is used and discarded on the site, also by the actual nuclear installations, and it
therefore fulfills an important function by taking care that no contamination leaks from the site
into the environment. The two gigantic cooling towers and the eternal clouds of water vapor
rising up from them can be seen from many miles. The site itself is dominated by a vast network
of power lines crisscrossing the site and their continuous buzzing.
Maintenance regime
Both Maintenance & Repair work constitute a major part of the activity that takes place on the
site of the power plant. Repair work is usually incidental of nature; whenever a defect is found, a
notification is issued and the repair of the device is scheduled (a more detailed description of
this process can be found below). Repairing defects is an activity that cannot be foreseen and
planned a long time in advance in most cases. Maintenance work differs in that respect:
maintenance work is planned for very long periods, some activities are dictated by
(inter)national legislation or the plant’s designer and are planned for five or ten years. The
complexity of a nuclear power plant, the sheer numbers of machines and devices and the
narrow tolerances some parts and devices must function within, lead to elaborate maintenance
plans. Information technology forms a vital aid in managing these maintenance plans. Periodic
maintenance is automatically planned and interdependencies between parts that play a role in
the maintenance planning are automatically monitored.
In order to achieve an efficient maintenance regime that requires as little downtime of the
reactors as possible, many maintenance activities are bundled per reactor and are executed
within a time span of three to six weeks, during which the involved reactor is brought to a halt.
These intensive maintenance periods are called ‘revisions’. They are not only used for
maintenance, they also offer the opportunity to install new or updated instruments in places
that cannot be accessed when the reactor and connected machinery (such as steam generators
and turbines) are operational. Every reactor is subjected to one revision each year, with one
major revision every four years. During revisions, maintenance crews are active 24/7 on the site
and a single shift for a team can last up to fourteen hours. Not surprisingly, revisions are
experienced by the NPP personnel as very intensive and stressful periods offering little
opportunity for rest or time to spend with families. This is compensated for during the periods
between revisions, when employees can go on leave. A major reorganization in 2001 has had an
important influence on the organizational ‘tides’ that are dictated by the revisions. Before the
reorganization, each reactor had its own maintenance team. This implied that each maintenance
team had one revision on hand each year. Currently, each maintenance team works on a limited
set of components all over the site. This means that each maintenance team now faces four
yearly revisions. This imposes a much larger amount of stress on the maintenance crew and
makes it more difficult for workers to take up leave and follow job-related courses.
Organizational Structure
In this section, a general overview on the organizational structure of the power plant will be
provided. Please note that this overview only concerns this particular plant; it does not reflect
any part outside the plant itself. The overview in this chapter is predominantly assembled from
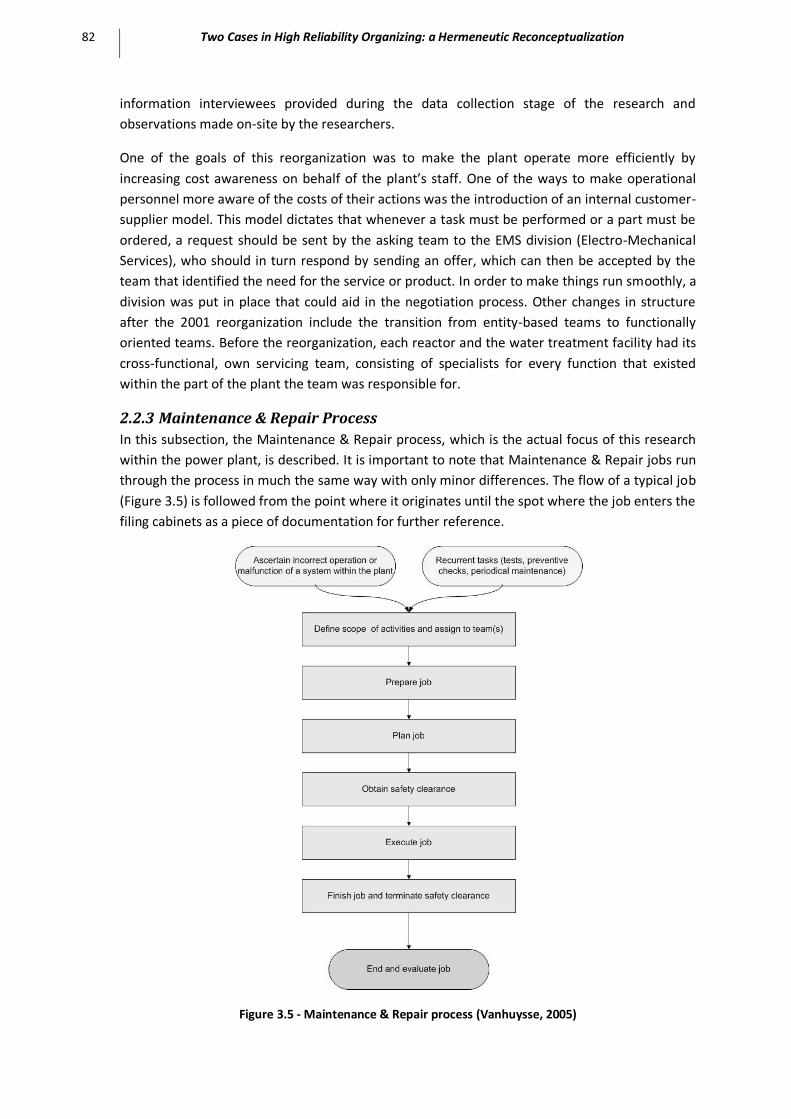
82 Two Cases in High Reliability Organizing: a Hermeneutic Reconceptualization
information interviewees provided during the data collection stage of the research and
observations made on-site by the researchers.
One of the goals of this reorganization was to make the plant operate more efficiently by
increasing cost awareness on behalf of the plant’s staff. One of the ways to make operational
personnel more aware of the costs of their actions was the introduction of an internal customer-
supplier model. This model dictates that whenever a task must be performed or a part must be
ordered, a request should be sent by the asking team to the EMS division (Electro-Mechanical
Services), who should in turn respond by sending an offer, which can then be accepted by the
team that identified the need for the service or product. In order to make things run smoothly, a
division was put in place that could aid in the negotiation process. Other changes in structure
after the 2001 reorganization include the transition from entity-based teams to functionally
oriented teams. Before the reorganization, each reactor and the water treatment facility had its
cross-functional, own servicing team, consisting of specialists for every function that existed
within the part of the plant the team was responsible for.
2.2.3 Maintenance & Repair Process
In this subsection, the Maintenance & Repair process, which is the actual focus of this research
within the power plant, is described. It is important to note that Maintenance & Repair jobs run
through the process in much the same way with only minor differences. The flow of a typical job
(Figure 3.5) is followed from the point where it originates until the spot where the job enters the
filing cabinets as a piece of documentation for further reference.
Figure 3.5 - Maintenance & Repair process (Vanhuysse, 2005)

Research Methodology 83
For a comprehension of the Maintenance & Repair process, it is important to realize that there
are three important types of administrative entities that play a role in the process: notifications,
work orders and work clearance applications.
Notifications
Any employee that observes a malfunction can create a notification or deviance in the plant and
it includes information like the description of the anomaly, a priority index estimated by the
reporter of the problem and a required end date. The priority index is a number varying from 0
(zero) to 3, 0 indicating a severe problem that must be dealt with immediately and 3 indicating a
problem that needs to be solved, but that does not necessarily needs to be dealt with in the
short term. The ultimate execution date is an additional piece of information that provides
insight into the relationship between the priority (which should be regarded as a measure of
importance rather than actual priority) and the haste that is involved in the issue. For example, a
notification can have a priority level of 1, which denotes a fairly urgent/important job, but an
ultimate execution date that lies several months in the future. This means that the issue is very
important indeed, but that there is no necessity to immediately take action. This might seem
contradictory, but in practice it does not need to be, for instance if the notification involves an
additional safety requirement that is imposed by law, but does not need to be implemented
before a specified date. If a specific device is involved in the notification, the reporter of the
notification is required to put a paper tag in place on the device to indicate that a malfunction or
deviance has been noted and reported. In the remainder of this dissertation, for the purpose of
our research, the terms ‘notification’ and ‘incident’ are use interchangeably.
To give an impression of the scale of operations: in 2004, more than 36,000 notifications were
created.
Priority level Description
0 Critical; must be dealt with on very short term
1 Crucial, but can be planned
2 Important
3 Required
Table 3.5 - Priority levels in the M&R process (NPP) (Vanhuysse, 2005)
Work orders
The second important entity is the work order. A work order contains a description of the
activities that are part of the actual job. A work order can either be the result of a maintenance
request (entered manually or automatically planned by the information system), a malfunction
report (in this case, a notification precedes the work order), a modification request (a request
for modifying the plant in some way) or it can be generated by a work preparator as part of a
higher level job. During the work preparation phase (see section ‘Work preparation’), the global
information in the order is expanded and details are added that are necessary for the execution
phase of the job. This information includes a short description of the work to be performed, a
cost estimate and the device in the plant that is involved in the job. Workers must be able to
present a printed version of the work order of the job they are currently working on (work

84 Two Cases in High Reliability Organizing: a Hermeneutic Reconceptualization
permit). That way, they can prove that the job has been prepared properly and that the workers
have been instructed on the particularities of the job. The total number of work orders created
in 2004 gives an impression of the scope of the Maintenance & Repair process: in that year,
more than 73,000 work orders were processed.
Work orders vs. notifications
The apparent discrepancy between the number of notification (36,000) and the number of work
orders (73,000) requires some explanation. In fact, even though the numbers may seem
contradictory, they indicate the nature of the relationship between both entities, which is
essential to the understanding of the Maintenance & Repair process. As explained earlier, the
start of most Maintenance & Repair tasks is the creation of a new notification. If deemed
necessary, such a single notification is forwarded to a servicing team. The servicing team will
then further investigate the scope of work that needs to be done and creates the required work
orders to be executed by the team’s workers. Additionally, a job may require auxiliary activities
performed by other teams, such as decoupling a device and testing machinery after a repair job
has been completed. A servicing team can create work orders and directly assign them to other
teams without a notification preceding those work orders. In short, this means that a single
notification can theoretically lead to any number of work orders, which accounts for the
difference in the number of notification and the number of work orders.
Work clearance applications
The third entity that exists in the Maintenance & Repair process is the work clearance
application. In Chapter 1, the concept of tight coupling was introduced. This tightness of
coupling has a direct effect on Maintenance & Repair jobs that constitute a major portion of the
work that takes place on the site. Along with the fact that building a nuclear power plant is an
immensely cost-intensive endeavor, which implies that once the project is realized, the plant is
expected to be operational most of the time45, the interconnectedness of the plant’s systems
implies that most maintenance work will be performed on ‘live’ parts of the installation or
systems that are directly connected to working parts of the plant. In order to ensure safe
working conditions, the circuits and devices that are subject to maintenance or repair activities,
must be shut down or de-coupled before actual work takes place. Therefore, EMS teams must
file a request for consignation of the systems they are planning to work on (the so-called ‘work
clearance application’) in order for Operations to decouple and inactivate these systems at the
right time insofar as the operating and testing schedules as well as other ongoing work on the
plant allow it. Consignation requests are involved in nearly every job in the plant and form an
important part of the communications between Operations and EMS. The work clearance
applications are created and processed in parallel to the creation and processing of the work
orders they accompany. Once clearance is granted by Operations, a printed version of the work
clearance application is used on the work floor as a permit to start work. Together with the work
order itself that is provided by a work preparator from EMS, the printed work clearance
application provided by Operations constitutes a worker’s permission to perform a specific task.
Daily Committee Meeting (DCE)
The first step all corrective jobs in the plant go through is an evaluation of all new notifications.
New notifications are assessed on a daily basis by a committee (‘DCE’; Daily Committee meeting
per Entity), including expert members from both Operations and EMS. Along with work in
Research Methodology 85
progress, these new notifications are reviewed one by one and decisions are made whether a
notification requires action to be undertaken, the assigned priority is correct, what kind of work
must actually been done, which servicing team(s) would be most suited to handle the job and
whether the job requires any particular safety measures. For example, jobs that involve work on
the reactor building penetrations (through which control lines, steam pipes and cables for
measurement devices run) are always treated with special care as they can possibly cause
disturbances in the containment of the reactor and therefore constitute a serious risk. Also, new
notifications are related by the committee to work in progress and the operating and testing
schedules of the plant to ensure that no conflicts will arise when a job is started. Therefore, the
multi-disciplinary nature of the DCE committee, induced by the presence of expert members
from different divisions, is vital.
Planning
After the scope of the work has been determined and any conflicts with other activities on the
site are avoided or resolved, the notification is forwarded to the EMS team the job has been
assigned to. The sub chief of this team collects the jobs forwarded to him and assigns them to
his work preparators. These work preparators in turn communicate their job portfolios to the
planners, along with a proposed execution date for each job. The planners create a planning,
which incorporates all the jobs that are assigned to the teams, but at the same time takes into
account the available work force and other activities at the site in order to avoid conflicts as well
as to benefit from advantages that result from grouping specific orders. For example, two work
orders on the same electromotor can be scheduled adjacently so that the motor need only be
decommissioned once for both jobs to take place. It is essential that the planners are constantly
communicating with both EMS and Operations to remain updated on the current Maintenance
& Repair situation as well as the current operation and testing situation of the plant. One way to
achieve that is through weekly recurring planning meetings that are attended by the work
preparators and the planners. The planning scope for day-to-day work is three weeks. For
revisions, specific schedules are created that span the entire period of the revision.
Work preparation
As soon as a job is assigned to a team, the preparation of the work can take place. Typical
activities in the preparation stage include an on-site inspection of the problem of the device to
be serviced, the ordering of replacement parts, finding any repair procedures that exist within
the organization for this particular job or creating a new procedure if no existing method can be
found, creating a risk analysis for the job, adding information to the work order and creating a
work clearance application for each job. If a job involves activities that fall beyond the scope of
the team the job is assigned to, the job preparator can issue additional notifications (sub-jobs)
directly to teams that have the necessary competencies. The work preparators who are
responsible for these tasks are mostly employees that started out at the plant as workers
(welders, mechanics) and were promoted to work preparator level. Their work floor experience
provides them the necessary insight to perform their job. Moreover, work floor employees from
EMS teams indicated during the interviews conducted in this research that practical experience
grants work preparators the credibility they sometimes need to convince the workers that the
proposed working methods are the optimal compromise between efficiency and safety.

86 Two Cases in High Reliability Organizing: a Hermeneutic Reconceptualization
Job execution
As soon as a job is prepared and safety clearance is provided by Operations, a team of workers
receives a printed work order and the job can be executed on the scheduled time. Activities that
are regarded part of the job execution phase include the actual work itself, as well as safety
measurements (performed by both Classical Safety and Radiation Protection officials), testing of
the involved devices, followed by a canceling of the safety clearance and debriefing of the
involved team(s). Of prime importance during work execution is the STAR principle, which stands
for Stop Think Act Review. This principle is employed to make workers aware of their actions and
to ensure that they go about their work in a conscious way. Forms are being used on which the
workers are required to record, for example, that they are aware of the safety measures that
apply to the job and that their job site is safe. As soon as a job has been completed, its status is
set to ‘WOCO’ (‘Work Order COmpleted’) in the information system. Any tags that were put in
place on devices when the notification was issued (in case of course a notification was involved)
are being removed by the workers in order to make it clearly visible that the work has been
completed.
Documentation
The final phase a job runs through is the documentation phase. Documentation of the work
essentially takes place on two different levels: first, the team that has performed the work
documents any particularities of the work in the central documentation of the plant and/or in
the team’s own documentation set. On an evaluation form, the team can indicate whether all
post-maintenance/repair tests have been passed and also whether the procedures that have
been used in the maintenance/repair activity should be revised. Routine jobs do not receive
much attention from the teams that have executed them as a specialized documentation
department (‘Work Settlement’) takes care of documenting every piece of information that is
available after a job has been performed and there is no need for the servicing teams to spend
time on this routine documentation work. The Work Settlement department receives all work
orders that have been used by the workers to perform their activities and all information on
these orders is entered into the plant’s documentation. This way for example, information on
spare parts used for repairs can be located by servicing teams in future occurrences of identical
or similar jobs and historical data can be used to spot recurring problems and discover trends in
defects. When a work order has passed through this final phase of its existence, it is marked
‘teco’ (‘TEchnically COmpleted’) and it is filed away for future reference.
3 Hermeneutics
3.1 The origins of hermeutics Madison (1988) has proposed a list of criteria that act as methods for hermeneutic
interpretation. The criteria included properties to be found in interpretations such as coherence,
comprehensiveness, penetration, thoroughness, appropriateness, contextuality, suggestiveness,
agreement and potential. They are explained in more detail in Table 3.6. It should ensure that
the judgments or conclusions arrived at are not gratuitous or the result of subjective whim
(Madison, 1988, p. 28). This is in line with a concern expressed by Walsham (1995) where he
states that interpretive researchers should have a view of their own role in the complex process
of “accessing other people’s interpretations, filtering them through their own conceptual

Research Methodology 87
apparatus, and feeding a version of events back to others” (Walsham, 1995, p. 77). These
principles challenge researchers to question their interpretation, especially given that the
collection of data involves the researcher’s own subjectivity (Butler, 1998, p. 292-293). These
principles were employed throughout the interpretive process in both our case studies as an aid
in arriving at a deeper interpretation of the phenomenon and is component parts. Together with
a knowledge and familiarity with the hermeneutic circle of understanding as the core concept of
hermeneutic thought and of the central role of the dialectic is vital for the hermeneutic
researcher (Butler, 1998, p. 293).
Coherence The interpretation must be coherent in itself; it must present a unified picture and not contradict itself. This holds true even if the work being interpreted has contradictions of its own. The ‘interpretor’ must make coherent sense of all the contradictions.
Comprehensive This concerns the relation of the interpretation in itself to the work as a whole. In interpreting texts, one must take into account the author’s thoughts as a whole and not ignore works, which bear on the issue.
Penetration It should bring out a guiding or underlying intention in the text i.e. recognizing the author’s attempts to resolve a central problematic.
Thoroughness A good interpretation should attempt to deal with all the questions it poses to the interpreted texts.
Appropriate Interpretations must be ones that the text itself raises and not an occasion for dealing with one’s questions.
Contextuality The author’s work must be seen in its historical and cultural context.
Suggestiveness A good understanding will be fertile in that it will raise questions that stimulate further research and questions.
Agreement The interpretation must agree with what the author actually says. This is in contrast to reductive hermeneutics characteristic of Marxism or Freudlanism.
Potential The interpretation is capable of being extended and continues to unfold harmoniously.
Table 3.6 - Methodological principles for the interpretive process (Madison, 1988;Uysal, 2009, p. 7)
In the positivist view on science, experience is thought to be the only source of meaning and the
only source of knowledge. This is known as the Verification Principle: only assertions that are in
principle verifiable by observation or experience can convey factual information (Gregor, 2006).
The purpose is to explain (Das Erklären) the complex world. Generally speaking Organization
Science research can be classified as positivist if there is evidence of formal propositions,
quantifiable measures of variables, hypothesis testing, and the drawing of inferences about a
phenomenon from a representative sample to a stated population (Orlikowski & Baroudi, 1991)
(Klein & Myers, 1999, p. 69). The interpretive tradition on the other hand, steers researchers
towards a different outlook, where the primary goal is not to develop theory that is testable in a
narrow sense (although its validity or credibility may still be assessed), but in understanding (Das
Verstehen) the complex world. “*…+ interpretive researchers insist that any observable
organizational patterns are constantly changing because, as Parmenides observed, ‘you cannot
swim in the same river twice’” lnterpretivists argue that organizations are not static and that the

88 Two Cases in High Reliability Organizing: a Hermeneutic Reconceptualization
relationships between people, organizations, and technology are not fixed but constantly
changing. Therefore, interpretive research seeks to understand a moving target. In so far as each
instance is treated as a unique historical occurrence, interpretive research is idiographic” (Klein &
Myers, 1999, p. 73).
Several interpretative approaches are possible, of which phenomenological hermeneutics is one
(Butler, 1998, p. 285). It is elaborated on under the next section. Hermeneutics is defined as the
theory or philosophy of the interpretation of meaning (Butler, 1998, p. 286). Several types of
hermeneutic research approaches exist (For an overview, see: Butler, 1998, p. 286) but we
adhere to the pragmatic-constructivist approach where interpretation involves entering into the
interpretative norms of a community and where meaning operates and is to be found within the
historical contexts of the interpreter and interpreted. This approach is based on Martin
Heidegger and has amongst its proponents Hans Georg Gadamer and Ludwig Wittgenstein. We
take a Gadamerian approach to our research, since it is characterized, not by a pure attempt to
apply any pre-existing theory to the domain in question, but rather by the attempt to think from
within that domain, and in a way that is attentive to it. In that sense, application of theory ‘is
neither a subsequent nor merely an occasional part of the phenomenon of understanding, but
co-determines it as a whole from the beginning’ (Malpas, 2009, citing Gadamer in: Truth and
Method, 1989, p. 324) Theory and application do not occur in separation from one another, but
are part of a single hermeneutical practice (Gadamer, Weinsheimer, & Marshall, 2004).
3.2 Hermeneutic circle Perhaps the most fundamental tenet of hermeneutics is that understanding has a circular
structure. Understanding works in broadening concentric circles, hence Heidegger’s labeling it
the hermeneutic ‘circle of understanding’ or in short hermeneutic circle. The unity of understood
meaning expands in concentric circles, for instance from A through E, like in Figure 3.6.
Important in this respect is that in understanding phenomena one remains permanently
determined by the anticipatory movement of ‘for-understanding’ (i.e. pre-understanding’ or
prejudice) (Butler, 1998, p. 291). The interpretation of a phenomenon (the hermeneutic whole)
begins by the examination of its component phenomena (the parts). However, understanding the
component phenomena can only begin when their relationships to the whole have been
determined – the determination of these contextual relationships is itself guided by an
expectation of meaning arising from the preceding context (e.g. derived from one’s tradition-
influenced prejudice). Through a dialectic process he will identify its parts. Operating from a
holistic perspective and relationship to the whole consolidated into an emergent understanding
of the phenomenon. In cycling through the circle of understanding, each part will be
consolidated, and in so doing different perspectives will emerge – the horizons of interpreter and
phenomenon will gradually fuse. This cycling through the ‘circle of understanding’ continues until
the ‘breakdown’ has been repaired and the phenomenon achieves the status of a ‘ready-to-hand’
(i.e. understood, obvious). (Butler, 1998, p. 291). Thus, as Gadamer (1988, p. 68) points out: “The
movement of understanding always runs from the whole to part and back to the whole. The task
is to expand in concentric circles the unity of the understood meaning. Harmonizing all the
particulars with the whole is at each stage the criterion of correct understanding. Its absence is
failure to understand” (Butler, 1998, p. 291).
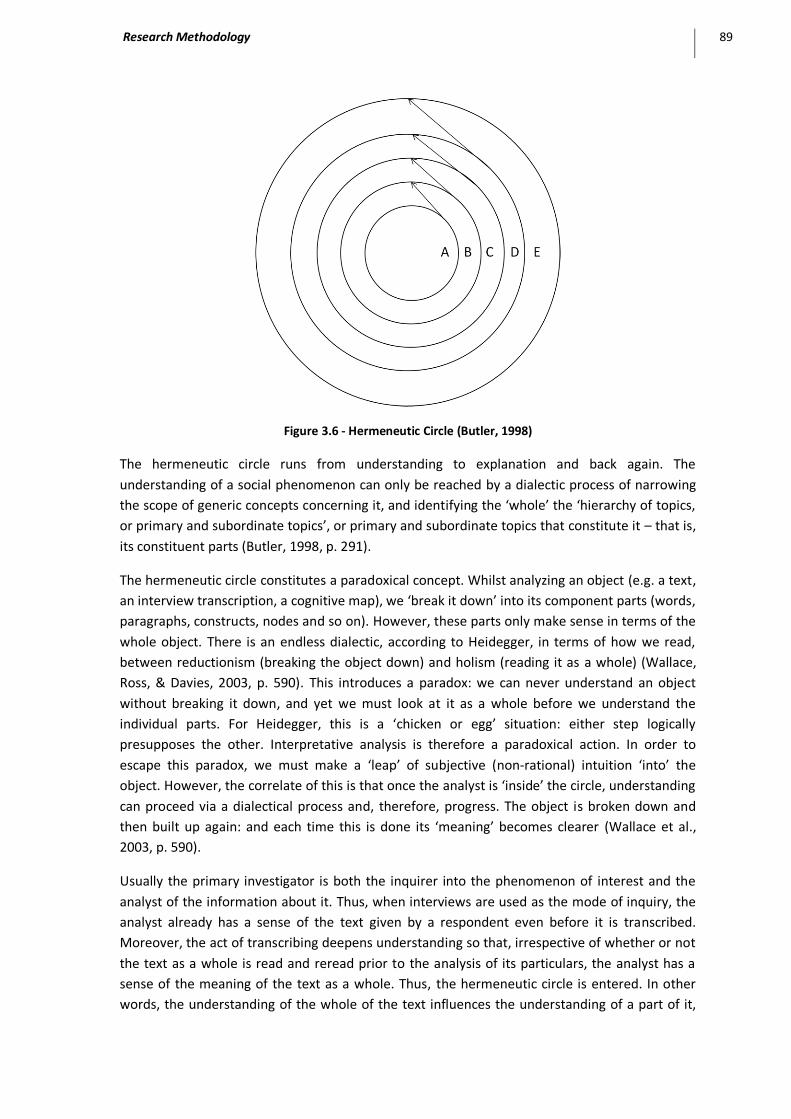
Research Methodology 89
Figure 3.6 - Hermeneutic Circle (Butler, 1998)
The hermeneutic circle runs from understanding to explanation and back again. The
understanding of a social phenomenon can only be reached by a dialectic process of narrowing
the scope of generic concepts concerning it, and identifying the ‘whole’ the ‘hierarchy of topics,
or primary and subordinate topics’, or primary and subordinate topics that constitute it – that is,
its constituent parts (Butler, 1998, p. 291).
The hermeneutic circle constitutes a paradoxical concept. Whilst analyzing an object (e.g. a text,
an interview transcription, a cognitive map), we ‘break it down’ into its component parts (words,
paragraphs, constructs, nodes and so on). However, these parts only make sense in terms of the
whole object. There is an endless dialectic, according to Heidegger, in terms of how we read,
between reductionism (breaking the object down) and holism (reading it as a whole) (Wallace,
Ross, & Davies, 2003, p. 590). This introduces a paradox: we can never understand an object
without breaking it down, and yet we must look at it as a whole before we understand the
individual parts. For Heidegger, this is a ‘chicken or egg’ situation: either step logically
presupposes the other. Interpretative analysis is therefore a paradoxical action. In order to
escape this paradox, we must make a ‘leap’ of subjective (non-rational) intuition ‘into’ the
object. However, the correlate of this is that once the analyst is ‘inside’ the circle, understanding
can proceed via a dialectical process and, therefore, progress. The object is broken down and
then built up again: and each time this is done its ‘meaning’ becomes clearer (Wallace et al.,
2003, p. 590).
Usually the primary investigator is both the inquirer into the phenomenon of interest and the
analyst of the information about it. Thus, when interviews are used as the mode of inquiry, the
analyst already has a sense of the text given by a respondent even before it is transcribed.
Moreover, the act of transcribing deepens understanding so that, irrespective of whether or not
the text as a whole is read and reread prior to the analysis of its particulars, the analyst has a
sense of the meaning of the text as a whole. Thus, the hermeneutic circle is entered. In other
words, the understanding of the whole of the text influences the understanding of a part of it,

90 Two Cases in High Reliability Organizing: a Hermeneutic Reconceptualization
and the understanding of each part in turn influences the understanding of the whole. This
circling of part to whole and back again results in progressive understanding that, in principle, is
non-ending, although, hopefully, it reaches a kind of stability (Rennie, 2000, p. 484).
3.3 Relevance of hermeneutics for our research In our research, we make the step to verification by taking the positivist strand of quantitative
analysis of hypotheses. Our research methodology is one that tries to reconcile conventional
theory-based design and hermeneutics. The essence of this approach is to view data not through
the filter of an isolated theoretical abstraction nor as an unbounded collection of
idiosyncratically interpreted, specific instances, but to recognize and analyze the multiple,
simultaneous theories embodied by the data (Carroll & Kellogg, 1989, p. 13).
The most fundamental principle of hermeneutics is that of the hermeneutic circle (Klein &
Myers, 1999, p. 71). It is a notion that implies that one can come to understand a complex whole
from preconceptions about the meanings of its parts and their interrelationships. This is what
our research aims at. The hermeneutic circle helps in figuring out contradictions between theory
and data. Moreover, since our thesis is about paradox, there are plenty of contradictions that do
not necessarily mean that the underpinning theory is wrong or that the research is wrongly
designed leading to faulty data. Data-Theory is dealt with at the level of the part, whereas a
theoretical conceptualization independent from data could lead us to understand why data does
fit theory after all. In other words, what we suggest here is triangulation. Not only a triangulation
of data, not only a triangulation of theory, but also a triangulation on the level of the research
perspective, meaning an alternation of induction and deduction, of interpretative approaches
and positivism. This calls for high-level conceptualization and very down to earth research. This
starting point explains the eclectic research mix we applied in this thesis. In this subsection we
point out why we attach great importance to hermeneutics through a triangulation approach of
our research by taking a (1) conceptual, (2) methodical and (3) construct/theory perspective.
3.4 Triangulation The research paradigm of triangulation requires that qualitative methods be combined with
quantitative methods to allow for assessment of the general validity of research findings (Koch,
1993, p. 76). In addition, theory building was enhanced by insights gained from published
research in related areas so that a triangulation of data and theory could be accomplished.
Obviously, method, data collection, analysis, and theory stand in close relationship to one
another.
We propose here a combination of methods that will approach the data from multiple
perspectives, each designed to provide a specific insight into the topic, a triangulation of
qualitative and quantitative methods. Sullivan and Beach (2002, p. 1424) define triangulation of
data as the “use of more than one form of data collection to test the same hypothesis within a
unified research plan *…+ To minimize the degree of specificity of certain methods to particular
bodies of knowledge, a researcher can use two or more methods of data collection to test
hypotheses and measure variables; this is the essence of triangulation". In our research design,
this means that interviews will be supplemented by other forms of field data – in casu meeting
attendances, the study of internal documents, direct observation or participant observation of
action, and surveys (Walsham, 2006, p. 323).

Research Methodology 91
The theories/set of constructs is another component of the instrument. Even though a
researcher does not begin a project with a fully preconceived and uncompromising theory in
mind, we are convinced that taking a promising theoretical lens as a starting point for research is
indispensable. Contrary to what is suggested by Grounded Theory (Strauss & Corbin, 1998, p.
12), we do not believe that research begins just with an area of study and without a theory,
allowing the theory to emerge solely from the data. Making the right choice regarding theory
therefore here is quintessential in order to reach valuable research outcomes. The theoretical
constructs we rely on have been described in detail in Chapters 2 and 3, but in the following
section, we point-out their methodological appropriateness.
4 HRO Research Taxonomies
After the science-philosophical background of hermeneutic research described above, we now
take the discussion to the level of what it all means for research in the field of HROs and make a
plea for taking a holistic, integrative and comprehensive approach to research on HRT and SeMa.
The field of reliability studies could benefit from adding other taxonomies to gain additional
insight into the merits of the theories involved. For this reason, we have chosen taxonomies that
help in juxtaposing our two main theories but not without stressing the necessary nuance and
dynamics between them. We subsequently use the Positivist vs. Interpretive (4.1), the
Normative vs. Descriptive (4.2), the Quantitative vs. Qualitative (4.3) and the Inductive vs.
Deductive (4.3) taxonomy. The presence of ‘versus’ in these descriptions generally implies that
the researcher must choose between one or the other. However, typical of hermeneutics is that
a middle way does exist.
4.1 Positivist vs. interpretive Orlikowski and Baroudi (1991, p. 5) posit that positivist studies are premised on the existence of
a priori fixed relationships within phenomena and that they serve primarily to test theory, in an
attempt to increase predictive understanding of phenomena. This would not serve us well
because a pure positivist research tends to ignore that people shape their context. Thus, in this
research we take a positivist position but one that has an interpretive aspect as well because of
the instrument (i.e. HRT and SeMa) it uses46. This is in line with our theorizing on reliability from
a systems thinking perspective, and more particularly from the perspective of dynamics and
emergence (See: Swiss Cheese Model). This choice has three consequences for the nature of the
conclusions that can be drawn upon the validation of the hypotheses put to the test. A first
consequence applies to those hypotheses that are validated or falsified. A caveat is in place for
their broader applicability than the cases. Because of the nature of the instrument, it cannot be
guaranteed that the observations can be explained by the constructs we have relied on. In our
survey of literature, we have found no evidence that constructs figuring under the HRT and
SenseMaking label are exhaustive or limitative. A second consequence applies to those
hypotheses that could not be validated or falsified. Our assertion is that the data underlying
these non-validated hypotheses can contribute to a better understanding (das Verstehen) of
organizational reliability, despite their inappropriateness for explaining (das Erklären). As a third
consequence should be mentioned that whereas positivist research repulses bias, interpretative
science (hermeneutics) acknowledges prejudice as an initial lens, as the necessary starting point
of our understanding (Klein & Myers, 1999, p. 76). During the research however, this lens has to

92 Two Cases in High Reliability Organizing: a Hermeneutic Reconceptualization
be adjusted to be in line with the research findings. However, it is important for the author to
make this bias explicit because it helps in understanding the design.
4.2 Normative vs. descriptive Traditionally organization theory distinguishes between normative (i.e. for making prescriptions)
and descriptive (i.e. purely explanatory) approaches to organizations (Fucks, 2004;Donaldson,
1990, p. 373). This especially with respect to organizational culture, but – to a lesser extent –
also to an organization’s structure and coordination mechanisms. The normative approach is
being identified with an Anglo-Saxon vision on organizing whereas the descriptive approach
represents the continental European school of thought. We can use this opposing approach to
learn about NAT and HRT. Both NAT and HRT can be considered normative theories. NAT, on the
one hand, strongly recommends avoiding circumstances in which organizations/systems
simultaneously tightly coupled and interactively complex. Therefore, Normal Accidents theorists
(e.g. Perrow and Sagan) strongly recommend excluding nuclear energy production and nuclear
warfare technology. High Reliability theorists on the other hand, clearly put forward solutions to
solve the coupling/complexity dilemma. Although they stress there is no such thing as a unique
recipe for reliability (de Bruijne, 2006, p. 63). This can clearly be seen in the formulation of their
advices where they (e.g. Weick & Sutcliffe, 2001) use substantives that have the look-and-feel of
imperatives (cf. Commitment to Resilience, Reluctance to Simplify, Sensitivity to Operations,
Deference to Expertise and Preoccupation with Failure).
It is necessary to solve the normative-descriptive dichotomy before continuing our research. In
fact, we believe it is not a dichotomy. The distinction between normative and descriptive is a
theoretical one. Describing the situation as it is (descriptive) is a necessary condition for
changing the organization (normative). Our research ambition is to be descriptive. More and
broader research is needed for it to have the ambition to be normative. For instance, more
research is needed on the set of constructs itself in order to make them more holistic. In
addition, a larger set of case studies and/or a larger set of research units within the cases are
needed as to reach conclusions that are more generalizable.
4.3 Quantitative vs. qualitative Among the criticisms often leveled against recent research in HROs has been its heavy reliance
on qualitative observation, the relative absence of testable hypotheses, the apparent lack of
generalization to other kinds of organizations, and perhaps most seriously, the absence of an
explicit theoretical foundation for this stream of inquiry (Creed et al., 1993, p. 56). Research on
high reliability has been mainly qualitative, as well by NAT students (e.g. Sagan, 1993) as by their
HRT counterparts (e.g. Rochlin et al., 1987). Whenever quantitative research methods are
applied it is in the field of validating HRO in the field of safety, not reliability (Gary, 2003;Fratus,
2008). The same applies a fortiori to the study of NAT with only Wolf and Berniker addressing
the issue quantitatively (Wolf, 2001). In their application of HRT in the field of reliability that
goes beyond safety, Vogus and Welbourne (2003a) provided a notable exception. This limited
application of quantitative methods should not come as a surprise since the general belief is that
this research type is not suited to gain a thorough understanding of what constitutes
(un)reliability (Weick, 1995).This is remarkable, because quantitative research can contribute to
a better understanding of High Reliability.

Research Methodology 93
Also on SenseMaking, the same critique of absence of quantitative research could be uttered. To
the best of our knowledge we do not know of any published research that not only formulates
hypotheses but that in addition puts them to the test. This observation is quite remarkable since
SenseMaking lends itself perfectly for quantitative analysis as well: “In the argument between
qualitative and quantitative approaches to research, sense-making likewise refuses to choose a
side. It is explicitly both qualitative and quantitative. *…+ Sense-making, *…+ assumes there is
something systematic about individual behavior to be found by pursuing process orientations. In
this way, then, sense-making casts itself as systematic qualitative research -- an approach with
qualitative sensitivity which is amenable to the systematic power of quantitative analysis”
(Dervin, 1992, p. 81).
Our approach tries to remediate this shortcoming in the field of HRO and SenseMaking research.
We strongly believe that in essence there is a false dichotomy between quantitative and
qualitative research methodologies. Instead of being dichotomous, quantitative and qualitative
research strategies are lying on an interactive continuum, with theory as the driving force (Basch
& Gold, 1986). That way, our research has the potential of ‘Erklären’ whereas in its quantitative
aspects it has the potential of ‘Verstehen’.
4.4 Induction vs. deduction HRT scholars from the first hour (notably La Porte, Rochlin and Roberts) have started their
school of thought by observing high velocity organizations and systems (nuclear submarines and
aircraft carriers). They collected individual ideas about what constituted reliability under tiring
circumstances and derived from this a framework that could provide a coherent approach to
safety and reliability (induction). Perrow on the other hand took a theoretical approach when he
focused on the explanation of (near-) disasters (deduction) (de Bruijne, 2006, p. 62). Our
approach is to combine both: we have started from observations by means of a risk analysis
(induction) and went to HRT and SeMa constructs (deduction), which we have used for the
construction of our survey (positivist), but have noticed that they were unable of explaining the
data (deduction) so that we had to rely again on observations by means of an exploratory factor
analysis (induction). The constructs derived thereof served for a positivist testing of hypotheses;
the discussion of their analysis in its turn drew on theory. This is in line with Roberts and Creed
(1993, p. 255) who state that “*…+ HRO research is moving apace from its earliest stages of
primarily inductive and descriptive work to hypothico-deductive and prescriptive work”.

94 Two Cases in High Reliability Organizing: a Hermeneutic Reconceptualization
5 Research Approach
5.1 HRO Research guidelines For our research on high reliability in high-velocity organizations, we have taken the guidelines
by Roberts and Rousseau (Table 3.7) at heart.
Spend time in the system and engage in active discussions with members at all levels.
Build bridges and networks among research team and system members.
Consider the attributes researchers bring to the organization that may influence the research enterprise
(for example, maturity, and gender).
Be concerned with messages conveyed nonverbally, as in dress and personal style, as well as those conveyed verbally.
Summarize information to protect anonymity before conveying it onward.
Learn and use organizational lingo.
Carefully avoid going native (for example, by rotating team members)
Use data from multiple sources and methods.
Employ comparison units within the organization (such as operational and support units) to identify
distinctive characteristics of extremely complex organizations.
Maintain an organizational view by continually asking how a particular piece fits into the whole.
Preserve impartiality. Do not become the organization’s advocate, nor its attacker.
Table 3.7 - Prescriptions for the Research Team (Roberts & Rousseau, 1989)
Not only the mind-set of the HRO researcher is of importance, also the attitude of the HRO
manager, who acts as his sparring partner. For their part, managers of HROs ought to (Roberts &
Rousseau, 1989) to co-operate as listed in Table 3.8.
1. Develop a questioning stance vis-à-vis researchers to clarify the focus and scope of the
research.
2. Be ready to discuss and tackle problems important to the research.
3. Engage in activities that use researcher skills in ways beneficial to the organization or its
constituencies (e.g. identification of trouble spots).
4. Listen and react to research results and feedback; check out and reality test conclusions.
Table 3.8 - Prescription for HRO Managers (Roberts & Rousseau, 1989)
While these recommendations may be good ones to make for any organizational research
(Roberts & Rousseau, 1989), they are deemed essential in HRO research. Our research has taken
into account all of them and this section describes the research mélange we have used to
answer our research questions. In line with Moray (2000, p. 861) we posit that if one reflects on
the findings of the HRT Founding Fathers, one can see not just that ethnographic and
sociological methods must be added to the armamentarium of ergonomics research, but that an
even wider approach is needed. For this reason, we collected data through a broad spectrum of
techniques. First we explain how the case studies were prepared for (5.2). Next, we describe the
different techniques used throughout the research (5.3 to 6) and finally we point out how this
build-up fits the hermeneutic circle of understanding (7).
5.2 Case study preparation
5.2.1 Case study preparation
In a first phase, several meetings were scheduled to fully prepare for the research project. These
included meetings with General Management and Operational Management. During these
sessions the scope, interdependences, timing, budget and approach were fine-tuned between
Research Methodology 95
the two case organizations and its academic partners. Coordinating meetings were organized
during which all participants were informed on the project and given the possibility to ask
questions or provide feedback and additional remarks. These initial meetings formed the basis of
further coordination of the research. Besides, we were granted full access to both the
organization’s company intranet so that we could consult all incident management related
documents, including tutorials, process descriptions, legacy data etc. Besides, we had at our
disposal all necessary resources (desk, PC, internet connection, print and Xerox facilities, access
badge etc).
5.2.2 Researcher – subject interaction
Action research
If we want to do as we preach, our research had to reflect the characteristics of dynamics and
emergence. At the same time, it had to be conducted in narrow collaboration with the
organizations in which and for which it had been done. As we have argued above, this did not
call for a mere quantitative or empiricist approach, but for a qualitative, ethnographic one
(Woodward, 2001, p. 294). Therefore, asking people in a straightforward manner how they see
things is not the right approach. Building an understanding of how they see things – in concert
with them – is. This approach is generally described as action research, a technique involving
researchers and practitioners in iterations of problem diagnosis, action intervention, and
reflective learning. Action research combines theory and practice, researchers and practitioners
(Avison, Lau, Myers, & Nielsen, 1999, p. 94). The particular approach we have taken in our study
is a derivative form of this general action research tradition, with an emphasis on the fact that
the researcher interacts with the research participants. We are convinced that “data are not just
sitting there waiting to be gathered, like rocks on the seashore” (Klein & Myers, 1999, p. 74).
Instead, data are produced in a social interaction (Klein et al., 1999, p. 74) (Klein et al., 1999, p.
74)of the researchers with the participants. Since action research is “continuously refining
methods, data, and interpretation in subsequent cycles, in the light of the understanding
developed in the earlier cycles” (Kasunic, 2005, p. 112), this approach suits the hermeneutic
research style well. Worth mentioning is that on many occasions, two researchers collaborated
on these cases. This constellation of working as a team offered broader opportunity to capture
greater richness of data and to rely more confidently its accuracy (Benbasat, Goldstein, & Mead,
1987).
Ethnographic field study
No research remains free from simplification because researchers tend to bring in line their
findings with their theory. It could be assumed (hopefully) that this is mainly due to the need to
fit the research data in the research framework. This simplification is normal since in many cases
research-opportunity does not offer the possibility to spend a lot of time in the ‘bowel’ of the
organization. Some of the reasons for this are listed below:
- The time window often might be too small to get the occasion to spend a lot of time at
the place the research is about. This especially is the case when investigating several
organizations at the same time.

96 Two Cases in High Reliability Organizing: a Hermeneutic Reconceptualization
- The level of confidence to do research is sufficient to get full co-operation, but most
organizations probably will feel they can do without someone looking over their
shoulder, certainly, when this occurs at unexpected moments.
Unfortunately, it is only by talking to organization members about how things really are, what
gives sense to what people do, by asking questions and dialoguing with others, that the ‘as-is’
(IST) can be distinguished from the ‘to-be’ (SOLL). The only way of getting to know whether
there is a deviation between the way procedures are used (IST) and how they are supposed to
be used (SOLL) is by ‘sacrificing’ valuable research time in order to gain enough confidence and
finding the right tone of speech. It is only when researchers are at the same wavelength – of
course still keeping the necessary independence – with the object of their study that the danger
of simplification can be limited. “Learning to feel the organization’s pulse comes only through
close attention, listening, experience and reflection. Trial-and-error and living with the
organization over time can develop a deep knowledge and understanding of how the
organization functions and what it takes to correct problems” (Bennet & Bennet, 2004, p. 299)
(Geyer & van der Zouwen, 2001, p. 299).
Therefore, based upon the purpose of understanding the incident management process in the
context of the organization in which it is embedded, part of the data collection was conducted
along the principles of an ethnographic field study. To this end field observations were done in
the two organizations over a two year period (each), overlapping one year, so a period of in total
three years. They were gathered on the perspectives of several organizational levels, going from
senior management to people on the floor. In addition, this study includes both real-time
observations and retrospective data (Brown & Eisenhardt, 1997, p. 3). For this observation, we
got help from a team of master students47. At the Bank, these ethnographic field study activities
included amongst others our presence at meetings, incident briefings and debriefings and
project discussions of progress, but also – and at least as important – informal observations
made and impressions gathered during lunches and coffee breaks. The same kinds of activities
were conducted at the NPP. In addition, however, two idiosyncratic activities are worth
mentioning and have resulted from the mutual trust between our research team and the NPPs
senior management and staff. A first activity in that respect is that we were an observer at a
training session at the plant’s simulator training center. Second, a particular mention is our
experience as an in person and in real-time witness of a severe incident at the plant’s premises.
This included our observation from the incident command procedure rollout, the decision
making process and the incident debriefing. At all times, we kept daily records of these activities,
providing real-time data (Brown & Eisenhardt, 1997, p. 5).
Previous research in HRO settings builds on ethnography as well. Gauthereau & Hollnagel (2005)
for instance, in their effort of trying to understand a series of NPP incidents related to
operational readiness verification, felt a clear need to understand work practice in its natural
setting, i.e. the plant and thus the need for observations to be one of the sources of empirical
materials (Gauthereau & Hollnagel, 2005, p. 121). Roberts and Rousseau (1989) called the need
not only to focus on the activity of interest, but on the broader context “to have the bubble”.
Like Gauthereau & Hollnagel (2005, p. 121) we experienced nonetheless that it was not possible
to separate the specificity of the process under research from its specific environment.
Therefore, we had to combine direct, reactive and non-obtrusive observations of selected staff
with in-depth interviews.

Research Methodology 97
5.3 Interviews
5.3.1 Objective
In a next phase, a substantial part of the research data was collected using semi-structured
interviews with individual organization members as primary evidence generation mechanism
(Palvia et al., 2003). The purpose of these time-consuming interviews was to gain a deeper
insight into the potential risks and to avoid Groupthink. Janis (1982b) originally defined
Groupthink as "a mode of thinking that people engage in when they are deeply involved in a
cohesive in-group, when the members’ strivings for unanimity override their motivation to
realistically appraise alternative courses of action”. According to this definition, Groupthink
occurs only when cohesiveness is high. It requires that members share a strong ‘we-feeling’ of
solidarity and desire to maintain relationships within the team at all costs. When colleagues
operate in a Groupthink mode, they automatically apply the ‘preserve group harmony’ test to
every decision they face (Janis, 1982b;1989). Findings by Eisenhardt and coworkers (Pelled,
Eisenhardt, & Xin, 1999) show that this is counterproductive because constructive criticism can
facilitate vigilant problem solving. On the other hand, it needs mentioning that when individual
values are shared within a group, there are implications for commonality in values that a group
or organization might share. Together with Dhillon and Torkzadeh (2006) and following Weick
(1995) we believe that by assessing individual constructs it is possible to understand group and
organizational value systems (Dhillon & Torkzadeh, 2006, p. 296). We argue that this is a fortiori
so when combined with aggregation techniques on the level of interview analysis like cognitive
mapping (5.4.1) or with data gathering tools like GSS (5.5).
5.3.2 Interview organization
We conducted interviews during several-day site visits (Table 3.9). The 51 interviews we
conducted were taped and processed via cognitive mapping (42) or transcribed (9). Interviews
typically lasted 90 minutes, although a few ran as long as 120 minutes.
Case Total number of interviews
Bank 22 (19+348)
NPP 29 (23+649
)
Table 3.9 - Number of interviews conducted in both case studies
We used an interview guide to conduct the semi-structured interviews (Appendix A and
Appendix B). In both cases, we asked respondents open-ended questions that let them relate
their stories of how the incident management process (in particular and in general) had evolved.
We asked probing questions to establish details e.g., when a particular incident occurred (Brown
& Eisenhardt, 1997, p. 5). Both our interview guides had five sections, addressing the contextual
and structural factors (Pugh et al., 1968) we presupposed to be of relevance when explaining the
reliability of the incident management. It began with the background of the respondent and the
domain he/she worked in. The second part of the interview focused on HR related issues (HR,
Knowledge Management, Training, and Culture), the third part concentrated on the incident
management process (Incident, Procedure, and Meta), the fourth part on the role of technology
and a final section addressed the influence of other contextual and structural factors. The order
in which these categories were addressed during an interview was not necessarily the order
presented here. Quite on the contrary even, since the interviewer followed the pace and story
lines of his/her interviewee in order to obtain the most genuine data possible. The approach
98 Two Cases in High Reliability Organizing: a Hermeneutic Reconceptualization
taken in these interviews was one of risk identification (layer 1), but the deeper layer was a
search for high reliability through the application of HRO and SeMa constructs. The outcome of
this analysis constituted the basis for the development of the questionnaire developed in a later
phase of the research.
5.3.3 Protocol development
It is not the answer, it is the question that matters. Questions therefore should be nuanced
enough to allow for a nuanced answer. Straightforward questions like the ones we have asked in
form of our research question are good as a start, but it is highly doubtful whether they are
capable of delivering the desired results. If we ask shortsighted questions it should not come as a
surprise that also the answer is shortsighted (Bellinger, 2008a), not useful otherwise than ad-
hoc, on a wider scale or under different circumstances. Wisdom is the result of an
integration/connection of problems. This can only be accomplished when the questions are
asked that reflect this connectedness, which calls for a thorough preparation.
For this purpose – and starting from an interview protocol used in a similar research setting
(Rutkowski, Van de Walle, Van Groenendaal, & PoL, 2005) – a generic questionnaire was
developed that could be adapted to the specificity of the context of a Bank (Appendix A) and a
NPP (Appendix B). The Bank Interview guide was tested by means of a pilot interview with the
process owner and slightly adjusted as a result thereof.
After a short introduction on the subject and methodology of the research, as much autonomy
as possible was granted to the interviewees to define the direction the conversation followed,
thereby allowing them to put emphasis on subjects that seemed of importance to them within
this context. On moments where the interview strayed too far away from the subject or
whenever a theme appeared to be exhausted, the interviewers would redirect the conversation
using a new question chosen from the previously prepared interview protocol. The questions
were divided into a few categories that proved useful in earlier research, allowing the
researchers to provide a little structure to the conversations (Smals, 2006, p. 50).
5.3.4 Interview organization and selection of interviewees
Interviews were scheduled with various participants/stakeholders of the Incident Management
process and the Maintenance & Repair process of the Bank and the NPP respectively. The
purpose of these interviews was to gather a broad view on possible risks concerning the
processes under study. For this purpose at the Bank, two business domains have been selected
that together provide a rich and varied context, leading to nineteen interviews in total (n=19).
The participants in these interviews are staff from both business domains, ICT domains, ICT
audit, Operational Risk department, management and the ICT security department. At the NPP,
staff from all of the Plant’s departments: Operations (3), Maintenance (13), Assets (4) and Care
(2). Additionally, one contractor was interviewed as well (1), bringing the total number of
interviews to twenty-three (n=23). Interviewees were selected based on their involvement in the
Maintenance & Repair process. In selecting the interviewees, the organizations have been very
helpful by proposing employees from all hierarchical layers of the organization and every
discipline that somehow related to the processes. This of course raises the question whether the
research data have not been biased by a deliberate selection of interviewees, based on a certain
mindset or conformance to the organization’s policy. Although this risk cannot be completely
excluded, the researchers believe that no purposeful bias has been introduced by the method of

Research Methodology 99
selection. One of the strongest indications supporting this belief is the observation that during
the interviews the interviewees appeared to very open about their work and in some cases were
very critical about certain aspects of it (Smals, 2006, p. 50-51).
All interviews were recorded by means of an electronic tape-recorder with explicit consent from
all the interviewees in our sample. This allowed the researchers to fully concentrate on and
participate in the interviews themselves. Taking notes during an interview can severely slow
down the pace of the conversation, ultimately leading to stagnation of the conversation and
thus negating the benefits of a semi-structured interview.
5.3.5 Interviewing style
The interviewing style could be described as colorful and provocative. We adjusted our style to
the respondent’s language, worldview, professional experience, personality etc. We used
statements, dichotomies, metaphors, relied heavily on examples and anecdotes, called on the
interviewee’s imagination to find out the bottom-line. In this sense we also used a combination
of the value focused thinking (Keeney, 1992;1996) and laddering (Rugg, Eva, Mahmood,
Rehman, Andrews, & Davies, 2002) technique by asking ‘why-why-why’ instead of ‘what-why-
how’ (Muhren et al., 2008a;Muhren, Van Den Eede, & Van de Walle, 2009;Muhren et al.,
2009;Muhren et al., 2009). Reference literature (Saunders, Lewis, & Thornhill, 2000) warns for
two types of bias: interviewer bias and respondent bias. The former bias emerges when the
interviewer influences the respondent through verbal and non-verbal behavior or through the
way of asking questions. For instance, by imposing his/her own frame of reference upon the
respondent, the interview outcome is colored. The latter bias emerges when the information
provided by the respondent is distorted by his/her ideas on the interviewer, by sensitivities
regarding some aspects of the interview items or by a lack of willingness to participate in a time-
consuming interview. These are caveats we have taken at heart during our interview sessions.
5.4 Interview analysis Our research attempts to combine two main approaches in the social sciences. The first of these
is to analyze interview data as qualitative data; that is, a transcription of the actual words used
by the interviewee, through the technique of cognitive mapping. This verisimilitude is the key
attraction of qualitative analysis (Wallace et al., 2003, p. 589). However, this advantage could
also be seen as a disadvantage, in that the (comparatively) unstructured data produced are so
resistant to procedural, ordered analysis. The quantitative approach, on the other hand, has the
overwhelming advantage of producing data that are amenable to statistical analysis, something
that is particularly important in a safety context (Wallace et al., 2003, p. 589). Therefore, we take
a double approach to interview analysis. We first describe cognitive mapping (5.4.1),
subsequently we depict what we have come to call the ‘diabolo’ technique (5.4.2).
5.4.1 Cognitive mapping
The recorded interviews were transcribed in the form of cognitive maps. Eden (2004) defines a
cognitive map as: *…+ the representation of thinking about a problem that follows from the
process of mapping. The maps are a network of nodes and arrows as links [...]. Cognitive maps
form a tool for researchers to visualize how humans within organizations make sense of their
environment and thus are helpful in the process of problem structuring in general (Montazemi &
Conrath, 1986). Cognitive mapping is a set of techniques for studying and recording people’s

100 Two Cases in High Reliability Organizing: a Hermeneutic Reconceptualization
perceptions about their environment. These perceptions were recorded graphically in the form
of a mental map that shows concepts and relationships between concepts. Each individual
interview has been transformed in an individual cognitive map, and if desirable all individual
cognitive maps could be combined into one aggregated cognitive map representing the way
operational risk concerning Incident Management is perceived. Such structuring of data is
essential in the process of gaining understanding of the incident management (Bank) and the
Maintenance & Repair (NPP) process within its complex environment (Eden, 2004). This general
methodology was previously used in similar research (Rutkowski et al., 2005).
Working with cognitive mapping has the advantage that it can bridge the perception of the
individual interviewee and the perception of the unit of analysis as a whole. The appropriate
composition model for organizational culture is the referent-shift consensus model (Glisson &
James, 2002, p. 771). It uses individual responses to measure culture in work-units (e.g. in teams,
divisions, departments or organizations). The respondents are asked to describe the behavioral
expectations and normative beliefs of people in the respondent’s organizational work unit
(Glisson & James, 2002, p. 771). Noteworthy is that “the focus is on what the individual believes
are the expectations and norms for the people in the respondent’s work unit rather than on what
the individual respondent thinks is expected of him or her personally. Within-group consensus is
then required to justify the aggregation of the individuals’ beliefs about the behavioral
expectations and norms within the work unit as a representation of the unit-level construct, i.e.,
culture. In the absence of within-group consensus, the individual responses cannot be ‘composed’
to the unit-level construct because a lack of consensus suggests that common expectations and
norms have not been identified” (Glisson & James, 2002, p. 771). Whenever in this dissertation
we are interested in finding out how the culture or structure of the organizations under study is
contributing to high reliability – and even though we are examining the perception of individuals
– we should not focus on the appreciation of the individuals personally, but on their idea about
what their team members might think. Therefore, this calls for the application of the referent
shift consensus model (Knight, 2004, p. 9).
In order to create the cognitive maps, the interviews with the employees were tape-recorded, to
be transformed into cognitive maps afterwards, using Decision Explorer™ from Banxia™
(www.banxia.com). This approach allowed the researchers to capture the interviews in full detail
without the disadvantage of having to take notes during the actual interviews.

Research Methodology 101
Figure 3.7 - Example excerpt of a cognitive map with categorized nodes
The nodes in the cognitive maps were categorized by coloring them in order to allow for easier
analysis of the information stored in them (Figure 3.7). An important category is that of threats
to the Maintenance & Repair process or the entire organization that can be recognized in the
maps. Nodes directly indicating such a threat were colored red. All the ‘red nodes’ from the
maps were then assembled into an extensive list, from which double entries were removed,
while the remaining threats were categorized in order to create an orderly list.
Once completed, the cognitive maps were sent back to the interviewees, giving each of them the
opportunity to comment on their personal map and to indicate if they thought the map reflected
the conversation as it had taken place. In about eight cases, minor changes to the maps were
proposed, adding nuance to certain points. None of the interviewees suggested major changes
in the structure of their map. It can therefore be concluded that the cognitive maps accurately
represented the course of the interviews.
5.4.2 Diabolo technique
The systems view we take in this dissertation is an alternative for analysis. The accompanying
risk is that by breaking things down into smaller pieces to simplify the study, the researcher
might lose the oversight and will be developing a less than complete understanding (Bellinger,
2008b). However, we believe that ‘anasynthesis’, the combination of both techniques, i.e.
analysis and systems thinking, is useful. This is exactly what we have tried to do in our research.
To this end, this first research phase wished to determine how HRT – through the characteristics
of HROs – could be applied in the particular organizational context of an important economic
sector like Banking. Based on the outcomes of semi-structured interviews and workshops with
process stakeholders/participants, the researchers gathered a list of operational risks concerning
the IM process (Van Den Eede & Van de Walle, 2005). This outcome had to be formulated as an
advice – for which there is a shared ownership – to senior management on how to manage risks

102 Two Cases in High Reliability Organizing: a Hermeneutic Reconceptualization
concerning Incident Management. The approach is not to do this on an operational one-by-one
basis, but from a tactical or strategic management, more high-level perspective. Worthwhile
mentioning is that it was the Bank’s management itself that chose to use HRT as a framework of
analysis. Their interest for HRT was inspired by presentations and proposals the authors
provided and – more importantly – by accepting the importance of culture, communication,
structure, decision making and leadership as a complement to their IT governance frameworks
and procedures (De Haes & Van Grembergen, 2005;De Haes & Van Grembergen, 2006).
The analysis is based on a systematic approach that aims at drawing qualitative conclusions from
the data. By regrouping and looking for relevance, recommendations for the management of the
risks could be formulated. Also has been possible to formulate questions for future research.
In a first phase we have been diverging (risk identification), followed by converging (complexity
& tight coupling) to end up again with diverging (tools). We have labeled this the ‘Diabolo‘
technique (Figure 3.8) and distinguish between the Converging and Diverging capacity.
The diabolo model starts from the assumption that interactive complexity (C in Figure 3.8)
(complex vs. linear) and tight-coupling (T in Figure 3.8) (tight vs. loose coupling) constitute the
two major determinants of reliability. For the underpinning thereof, we refer to Chapter 1 –
Introduction). In the converging (left hand) part of the diabolo, all the individually identified risks
(from the individual interviews) are first aggregated and categorized. With the collaboration of
the IM process owner the data have been cleaned (removal of double entries, irrelevant
information) and categorized. From the original list of 384 entries, a list of 219 remained. The
categorization helped the researchers to gain a better insight into the data and to see the
threads in the results. Next, this categorization was used to regroup the 219 records into 42
summarized risks in a meaningful way. Notably these 42 aggregated risks form the basis of the
present investigation, which consisted in mapping them on the HRT framework.
Figure 3.8 - Diabolo Technique

Research Methodology 103
In the diverging (right hand) part of the diabolo, the exercise was performed to come up with
tools that are typical of an HRO’s pursuit of reliability. As a next step, we therefore have mapped
the issues to the HRT principles. Subsequently, we have transposed these findings to HRT
techniques that are suggested by HRO literature to be proficient in managing risk.
5.5 GSS Workshop50 Socio-technical systems such as these are characterized by interactive complexity and tight
coupling of risks, and therefore become systemic. Since the source of systemic risks often
resides in the unpredictable interactions amongst different parts or components, it is not
sufficient to control or mitigate the ‘top ten’ risks by periodical review meetings based on group
consensus (Carlo et al., 2004). In order to improve the management decision process of systemic
risks, a shared consensus based on an exhaustive set of potential risks and their interrelations
has to be socially constructed (Rutkowski, Van de Walle, & Van Den Eede, 2006). Moreover, we
assume that the parallelism, anonymity and the voting provided by a Group Support System
(GSS) environment would efficiently support such a task.
In past laboratory and field research, GSS have proven to efficiently facilitate preference and
intellective tasks via anonymous exchange of information supported by an electronic
brainstorming system (EBS) and to reduce process losses inherent to face-to-face meetings (van
Genuchten, van Dijk, Scholten, & Vogel, 2001;Nunamaker, Vogel, & Konsynsky, 1989). The
workshop used GroupSystems™, a software from GroupSupport.com, was used to support the
exchange of information among staff. GroupSystems™ is a facilitator driven group decision
support system (GDSS) that can be used to carry out a variety of strategic management and
decision-making processes effectively and with high levels of group participation, ownership and
commitment. The individual participants were able to anonymously enter their ideas on their
personal computers, which were all connected by means of a local area network to a central
computer, from which the output was projected on a publicly visible space using a data
projector. A key benefit of using this GDSS can be a more efficient use of meeting time, through
the ability to surface and ‘parallel process’ more contributions from a greater number of
participants than is possible using manual facilitation techniques alone. At the Bank 19 staff and
at the NPP 12 staff that were involved with the incident management process were invited to
join a GroupSystems workshop (February 2005 and April 2006 respectively), for which the
author has acted as facilitator. The purpose of the workshop was to decide on the risk
identification, risk assessment and risk control measures. The result was an advice – for which
there is a shared ownership – to senior management on how to manage risks concerning
Incident Management.
The advantage of anonymous data entry by the individual group members is that sensitive issues
can be more easily brought into the open and discussed objectively without fear of reprisal.
Each of the workshops was organized as follows:
Phase I Brainstorming phase (Electronic Brainstorming Risks or EBS): The outcome of the
previous research phases (interviews and aggregated cognitive maps)
constituted the input for the GSS workshop. The categorized threats were
presented to the participants (of which some were interviewed previously), who

104 Two Cases in High Reliability Organizing: a Hermeneutic Reconceptualization
were asked to anonymously add comments and add threats they felt were
missing in the presented list. Based on idea exchange and free association, the
participants were proposed to generate an exhaustive set of risks based on and
departing from the compiled list of risks.
Phase II Intellective phase: Individual selection of the most relevant top risks following
‘truth supported wins’ schemes of decision.
Phase III Preferential phase: Assessment of the selected risks during phase II in term of
Expected Utility. To this end, the participants were asked to rate each threat on
two scales: impact and likelihood. The most relevant risks have been discussed
to build scenarios that can be activated through the formation of a group
memory when the risks actually materialize.
Special attention was given to the efficiency of the GSS on the preference and selection of three
type of risks: Common Risks (CR) and Unique risks (UR) presented under the form of a list based
on individual interviews on the one hand, and socially constructed risks generated during the
brainstorming phase on the other hand. The fact that the participants of the GSS workshop
provided information that was already present in the data gathered from the interviews
illustrates the use of GSS as a tool to confirm the validity of previously gathered research data.
An additional benefit of the use of GSS was the possibility provided to the participants to
elaborate on specific problem areas (Smals, 2006).
We believe the management of the decision process of systemic risks can be improved by co-
evaluation and an objective measure such as Expected Utility. Shared consensus based on an
exhaustive set of potential risks and their interrelations have to be socially constructed and –
when relevant – the unique information of the minority surfaces the collective iceberg. The
results of the research demonstrate that the parallelism, anonymity and the voting provided by
the GSS environment efficiently supports the task of risk management decision process in a spirit
of socially shared consensus.
GroupSystems increased overall the level of awareness amongst the participants on the
importance of addressing risks in the organization. The large number of risks that were
generated using the system gave a better understanding to the participants about the situation.
The anonymity and the interview phase were two critical success factors. First, anonymity
supported participants to express freely their private opinion about very sensitive information in
the organization. Second, the risks of lists being a mixed of unique, common and EBS risks, the
expression of the participants’ preference gave to the group of the participants a higher feeling
of control and appropriation of the decision taken toward the scenario to be built.
In the sense that this GSS workshops are a type of focus group, its outcome co-formed the basis
for the development of a questionnaire (Yule, 2003).
The resulting rankings showed two particularities: firstly, there was little scatter in the ranking of
the top-rated threats; on a scale from zero to seven (zero representing a high likelihood
respectively high impact), most assessments of both impact and likelihood were between three
and five. The limited spread resulted in a rather flat distribution, delivering a quite large portion

Research Methodology 105
of top-rated threats: 32 out of about 230 threats were deemed of special importance, although
these top-rated items were not on a large distance of the less relevant threats in terms of impact
and likelihood. Secondly, 10 out of the 32 top-rated threats were not present in the list that was
extracted from the cognitive maps.
The issues added to the list of threats during the session were subjects that were implicitly
present in the cognitive maps and had been recognized by the researchers, but only those
threats that were explicitly mentioned during the interviews and categorized as such were
included in the list. For example, the highest-ranking threat was labeled ‘workload increases
while the number of qualified employees decreases’. This threat was not in the list of threats
extracted from the cognitive maps, but was added by the participants during the group work
session. Although no node with the exactly matching content was present in the cognitive maps,
several nodes conveyed parts of the same problem. For example, in the cognitive maps,
constructs were present describing the increase of work pressure, the retirement of the current
generation of experienced workers and the difficulty of attracting highly qualified workers to
replace the older generation of employees.
5.6 System dynamics modeling
5.6.1 Application
The outcome of the previous research phases formed the input for a system dynamics modeling
exercise we undertook to model the reliability of the organization’s Incident Management
process as determined by the capability of its supporting emergency response information
system (Van Den Eede, Muhren, Smals, & Van de Walle, 2006). This work is based on the
Capability Trap model by Repenning & Sterman (2001) and draws from the many insights on
emergency response information systems design as described in the DERMIS (Dynamic
Emergency Response Management Information System) framework established by Turoff et al.
(2004). Whereas the latter authors describe the premises that underlie an Information System
(IS) that is capable of ensuring a reliable and flexible emergency response, our model contributes
to the research field by looking at the interrelations of the aforementioned premises. We take a
System Dynamics approach and gain insights in the key determinants of IS Capability by
highlighting the mutual interdependences grouped around the concepts of adaptability, control,
implicit knowledge and explicit knowledge. The following sections subsequently explain the
technique (5.6.2) and the need of system dynamics for studying HROs (5.6.3).
5.6.2 System dynamics
System Dynamics was developed by Jay W. Forrester (1961) during the mid-1950s at the
Massachusetts Institute of Technology (MIT). It is a method to gain insight – i.e. identifying,
explaining, and eliminating problem behavior (Marais & Leveson, 2003) – into the behavior of
(especially socio-economic) complex systems over time and enhances learning from these
complex systems (Sterman, 2000, p. 4). Principally by identifying feedback loops in the system, it
provides a framework for dealing with dynamic complexity, where cause and effect are not
obviously related. System dynamics is grounded in the theory of non-linear dynamics and
feedback control, but also draws on cognitive and social psychology, organization theory,
economics, and other social sciences (Marais & Leveson, 2003). It does so by representing the

106 Two Cases in High Reliability Organizing: a Hermeneutic Reconceptualization
processes, structure, strategies and information flows of systems (Wolstenholme, Henderson, &
Gavine, 1993).
Forrester (1993) states that all decisions are made in an on-going circular environment in which
each action is based on information that is the result of earlier actions. System dynamics is based
on the idea that people cannot oversee the consequences of these feedback mechanisms in
complex systems. There is a bias of looking for problem causes in convenient places (Moberg,
2001). “[There] is a fundamental characteristic of complex human systems: ‘cause’ and ‘effect’
are not close in time and space. *…+ Why is this a problem? Because most of us assume, that
cause and effect, most of the time are close in time and space” (Senge, 1990, p. 63). Therefore,
much of the art of system dynamics modeling is discovering and representing the different
feedback processes in a system (Sterman, 2000, p. 12). A System dynamics model is meant to
give people a more effective understanding about an important system that could have
controversial behavior. Influential system dynamics models are those that change the way
people think about a system (Forrester, 1993). Wolstenholme (2004) distinguishes five
components of system ‘structure’ in the concept of system dynamics: (1) processes, created
using stock-flow chains; (2) information feedback; (3) policy; (4) time delays; and (5) boundaries.
5.6.3 The need of system dynamics for studying HROs
System Dynamics has been applied in all kinds of domains and for all kinds of problems, like the
cold war arms race, the human immune system, the aircraft industry, and business and strategy
issues (Sterman, 2000, p. 41-42) but the technique can play an equally important part in the
study of High Reliability. We posit that HRO literature can do with more system dynamics
exercises. In our case, for instance, by building an explicit representation of the incident
management process, it should/might be possible to predict, simulate, and/or explain the
resultant behavior of the system form the structure causality, functional and behavior of its
components (Lewis, 2004). “If we do establish a connection between given features of an
organization and its operational reliability, can we assume that these features are necessary,
rather than merely sufficient? That is, are there alternative strategies possible for the production
of the same outcome, or do the requirements for organizational reliability impose an inevitable
solution on an organization? Finally, even if an organization has evolved features that are
necessary to its reliability, can we be sure that its evolutionary adaptation is stable, that what
adds reliability today will also work tomorrow under changes in the character of technology, the
work force, or in the life cycle of the organization?” (Schulman, 2001, p. 347-348). Hence, this is a
useful approach to deal with non-linear problems in a non-linear way (contrary to a classical risk
management approach). While it is tempting to attribute the kind of reliability described in this
dissertation to organizational culture and values (Little, 2005, p. 5) it is not sufficient. What we
need is a laboratory setting that permits to verify independently the different building blocks51.
System dynamics modeling is a relevant technique for our research because of the complex
nature of the emerging interactions (i.e. complexity), the choice of our model is vital.
Efforts to model HRO characteristics so far have mainly concentrated on unreliability, in studies
of calamities and mishaps: for instance, the 1992 Westray mine disaster (Cooke, 2003), the 1986
Chernobyl nuclear disaster (Salge & Milling, 2006). In part this is due to the prescription that
system dynamics should model problems, not systems (Sterman, 2000), but such can be
remedied by formulating high reliability as a problem, e.g. by modeling the absence of HRO

Research Methodology 107
characteristics and investigating the consequences thereof on organizational reliability.
Examples of application of system dynamics in HRO contexts include (for instance) outage
planning and plant improvement efforts and maintenance (Caroll, Perin, & Marcus, 1993);
patient safety (Cook & Rasmussen, 2005); security incident management (Gonzalez, 2005) and
railways safety (Hale et al., 2003). Notable studies building on system dynamics for
conceptualizing on HRO and NAT include the analyses by Cooke & Rohleder (2006) and Rudolph
& Repenning (2002).
The latter type of studies is interesting because they have the potential of combining system and
culture, as “the two great tropes of the 20th century *…+. Whereas systems thinking holds out
hope for the precise mapping and managing of complexity, cultural approaches are less focused
on outcomes and more on understanding and appreciating the meanings people ascribe to
collective behavior, and how these meanings help constitute communities and societies”
(Eisenberg, 2006, p. 1697). For instance, Romme and van Witteloostuijn’s (1999) notion of
‘circular design’ combines (1) insights from Organizational Learning Theory with (2) insights from
Systems Theory. More specifically, they combine the concept of triple loop learning, manifesting
itself in the form of ‘collective mindfulness’ with three important notions of system dynamics:
(a) the pervasive influence of the deeper structure of a system on the behavior of its constituent
elements; (b) the difference between static and dynamic systems; and (c) the dilemma between
global patterns (e.g., corporate patterns and synergies) and local behavior (e.g., creative actions
and findings at the unit or team level). The analysis of circular designs relates strongly to the HRT
concepts as it also examines the relationship between structure and behavior. More in
particular, circular design, like HRT, stresses the importance of the opportunity to switch
between the circular and the hierarchical mode of organizing, as a pivotal element (Romme &
van Witteloostuijn, 1999).
6 Survey Without prejudice to the relevance of the previously described research techniques (5.3 to 5.6),
this research’s main data collection technique is a self-administered survey. For this reason this
separate section is dedicated to its description. The survey questions respondents in our case
study organizations on those elements that have become apparent in the previous research
phases. In this subsection we first point out why we have chosen for the survey technique (6.1).
Next, we explain the way the conceptual model is operationalized (6.2) and how the survey is
administered (6.3). We conclude this section with a description of the data analysis process
(6.4).
6.1 Rationale In an era where ‘what cannot be measured, is not true’, a particularly difficult task emerges to
translate constructs like mindfulness and resilience into workable indicators (Le-Coze, 2006, p.
8). As we have experienced ourselves, this exercise is necessary in order to get stakeholder’s –
and especially management’s – commitment to cooperate. The buy-in 52 is obtained more easily
with figures. The survey we have designed hence is a mixture of trying to measure the
immeasurable and returning value for money. We have tried to find our way out of this dilemma
by gaining trust of the organization by doing ‘consultancy’ jobs of a smaller order.

108 Two Cases in High Reliability Organizing: a Hermeneutic Reconceptualization
The use of quantitative research techniques in the field of organizational behavior is not very
common (Balthazard & Cooke, 2004, p. 240). Qualitative and quantitative methods nevertheless
are complementary approaches to the study and assessment of organizational processes and
attributes. The advantages of qualitative methods can lead to intensive and in-depth
information, especially useful in research on issues and processes about which little information
exists (Balthazard & Cooke, 2004, p. 240). Quantitative methods on the other hand have the
advantage of cross-sectional assessments and comparisons (across individuals, organizations, or
sub-units). It is this last characteristic we have relied on since we deal with the phenomenon of
an organization’s reliability through its subunits as level of analysis. A greater understanding of
the factors and values that affect intra-organizational contextual and structural variations can
only provide an even richer picture of how to optimize organizational systems to promote
reliability (Balthazard & Cooke, 2004, p. 240).
Quantitative methods facilitate asking large numbers of people their opinions in a relatively
time- and cost-effective manner (Child & McGrath, 2001). It should not come as a surprise
therefore that over the years, the survey method was extensively used and is still in
predominant use. While the method can attain high levels of external validity, it is known to
suffer from lack of control and internal validity (Palvia et al., 2003). Another critique on surveys
in the field of reliability is that they are used merely to refine the question sets in order to
improve face validity, and in some cases to conduct factor analyses and internal consistency
checks (Child & McGrath, 2001). Yet, quantitative research that goes beyond this type of analysis
is necessary in order to bring the discipline of reliability studies to reach a higher level of
maturity.
6.2 Operationalizing the conceptual model A conceptual model of variables and their relationships leads to the formulation of hypotheses.
It relates dependent and independent variables and identifies the moderator variables that are
likely to affect the outcomes. Essential in conducting research in organizations is assuring the
accuracy of measurement of the constructs (Hinkin, 1998, p. 104).
6.2.1 Item generation
Although literature is readily available, quite rare are the practical translations of theoretical
concepts into straightforward guidelines for measuring the degree of high reliability or
SenseMaking. Moreover, when publications do get practical, they are concerned with safety, not
reliability. The only notable exception being Weick and Sutcliffe with their ‘Managing the
Unexpected’ (2001). These authors offer ways to materialize theory by means of High Reliability
audit check-lists (Weick & Sutcliffe, 2001, p. 90-110). We have gratefully used this material to
build our own questionnaire. For SenseMaking the job was even harder. Probably because of the
opaque nature of this set of notions, to the best of our knowledge, no practical translation could
be found. For these reasons, we had to rely on interpretation of literature and above all, on the
outcomes of the analysis of the interviews. These formed a cornerstone for the development of
the ‘High Reliability Questionnaire’ (as we have come to call this survey) for the Bank (Appendix
D) and for the NPP Case (Appendix E). The interviews were essential in customizing the
constructs for the setting of the Bank as well as the NPP. Both questionnaires are identical apart
from an adjustment to comply with specific process attributes and jargon.

Research Methodology 109
The items were generated in such a way that they adequately represent the constructs (Hinkin,
1998). We have taken a deductive scale development approach since the theoretical foundation
provided enough information to generate the initial set of items, founded on a thorough review
of the literature (Hinkin, 1998, p. 106). Items were developed according to the following
guidelines: (1) Statements that are as short as possible, (2) Language as simple as possible, (3)
Addressing one single issue per item, and (4) No reverse-scoring. At least four items per scale are
needed to test the homogeneity of items within each latent construct, yet adequate internal
consistency reliabilities can be obtained with as few as three items (Hinkin, 1998, p. 109). Scales
with many items may have high internal consistency reliabilities even if the item inter-
correlations are low, an argument in favor of shorter scales with high internal consistency. The
retention of four to six items for most constructs therefore is advisable (Hinkin, 1998, p. 109). It
is also good practice to foresee twice as many items in the survey questionnaire.
The survey consisted of 57 variables. As we had the data on the Incident Management reliability
on team level, we had to aggregate the data of the individual respondents on team level as well.
In order to correct for teams with an insufficient number of members participating in the survey,
we put a double filter on the data. We selected teams that met one of the following criteria: at
least 5 participants in the survey or at least a participation rate of 50%. This double criterion
could only be maintained for the Bank Case. The NPP Case consisted of too few respondents to
do so. In case of the NPP Case a preference was given to having a sufficient number of teams.
All items were measured on a 5 point Likert scale and with respondents being asked to indicate
whether they fully agreed (5), agreed (4), agreed, nor disagreed (3), disagreed (4) or fully
disagreed (1) with the statements presented to them. The choice for a 5 point Likert scale is
inspired by the fact that coefficient alpha reliability has been shown to increase up to the use of
five points Likert scales, after which it levels off (Hinkin, 1998, p. 110).
6.2.2 Constructs
A construct is a representation of something that does not exist as an observable dimension of
behavior, and the more abstract the construct, the more difficult it is to measure. A construct
should meet the following criteria in order to assure construct validity (Hinkin, 1998, p. 105):
(1) Content validity, i.e. specifying the domain of the construct;
(2) Criterion validity, i.e. empirically determining the extent to which items measure the
domain;
(3) Internal consistency, i.e. examining the extent to which the measure produces results
that are predictable from theoretical hypotheses.
These requirements have been taken into account when developing our items (statements and
questions that form the constructs). The constructs usually employed in research on
organizational culture are of no immediate use for the study of High Reliability because they are
too general and too distant from the functional imperatives of reliability enhancing
organizations (Klein, Bigley, & Roberts, 1995, p. 773). Chapter 4 shows that the variables
employed in our study therefore are somehow different from traditional studies on
organizations.

110 Two Cases in High Reliability Organizing: a Hermeneutic Reconceptualization
The independent variables in the (reconceptualized) model relate to the constructs of (1) HRT
propensity and (2) SenseMaking propensity. By propensity, we mean the natural tendency to
behave in a certain way. In the case of HRO propensity, it therefore is the natural tendency to
behave and to be structured like an HRO. As such, it is a tendency towards HRO-like behavior
and HRO-like structure. It is the degree to which an individual, a team, or an organization fits the
HRO ideal such as it is described in literature. SenseMaking and efficiency propensity can be
defined in the same way (mutatis mutandis). All constructs are examined in relation to the
incident handling process. In the a priori conceptual model, there is one moderator variable,
namely the alignment of information systems to user characteristics (ISFit) (3) In the
reconceptualized model, two additional mediator variables are introduced, namely Requisite
Variety (4) and Structure (5). The dependent variables are the reliability in the handling of urgent
and non-urgent incidents respectively (6). They are calculated values retrieved from the
organization’s incident management databases.
6.3 Survey administration
6.3.1 Pilot
In view of content validity assessment, we have subjected our items to an assessment in two
phases. In a first phase, we have pretested them with a group of experts (from academia and
practice) and have asked them individually to attribute the items to the constructs in question
and to eliminate those items that in their opinion did not cover the constructs. In a second
phase, we have pretested the remaining items with two pilot groups of respondents from our
population (Pilot Bank Case and Pilot NPP Case). The outcomes of this pretest were on the level
of language clarity, jargon utilization, team identification, the practicality of the questionnaire
design (e.g. the use of drop-down boxes) and seven items that were dropped because of their
inappropriateness.
In the Bank Case, the first pilot survey consisted of six Information Security Officers (ISO) at the
Bank. This survey has been administered as an MS-Excel file. The second pilot (Table 3.10)
consisted of four incident management teams, selected from our population based on their
representative character. This second pilot survey has been administered via CheckMarket™, the
platform that has been used for the final survey.
Descriptors
Average fill-out time 15 min. 33 sec Panel size 35 Number of respondents (completed) 27 Number of teams 4 Reminders 14 (40%) Resminder response 7 (50%)
Table 3.10 - Pilot descriptors for the Bank Case
The full questionnaire was administered electronically: online through the company intranet in
the Bank Case and via e-mail in the case of the NPP. In each case study, a pilot survey was
conducted to test the questionnaire prior to the administration. Electronic surveys have
distinctive technological, demographic, and response characteristics that affect their design, use
and implementation (Smith, 1996). Although it is advisable to compensate by 30% the number

Research Methodology 111
of respondents for non-response so that the power of the survey (i.e., precision and confidence
level) is not compromised (Kasunic, 2005, p. 27), we were only able to do so in the Bank Case.
6.3.2 Distribution
Running a survey is taking a snapshot of an organization at a certain point in time. In the Bank
Case the period during which the survey was applied was June 21st - 30th 2006. The survey was
announced by a personalized e-mail invitation, addressed to the organization mail account of
the team members, containing a click-through link to an external server, hosted by
CheckMarket™ (http://www.checkmarket.be), an online platform that provides tools to securely
create and distribute online surveys. Anonymity has been guaranteed. In the Bank Case this
could be done because no track was held of a the respondents who actually filled-in the survey.
In the NPP Case, we relied on a self-administered questionnaire in the period Sept 17th - 30th
2007. The survey was announced by a general e-mail invitation, addressed to the account of the
team members, containing an attachment with an excel survey form. This form contained some
Visual Basic Coding in view of ease of use for the respondent and the research analyst. The
respondent was asked to return the attachment to the researcher. Note that unlike with the
Bank Case, the survey in case of the NPP was not administered through a professional platform
like CheckMarket™, but through a self-developed data collection tool. As a result some of the
benefits of the former system could not be seized in case of the Bank. For instance on the level
of quality control it was impossible to control on the time a respondent spent on filling out the
questionnaire. More important is that for the same reason anonymity could only be guaranteed
partially: The anonymity from the respondent to their organization could be guaranteed, but not
towards the researcher.
6.3.3 Population and sample
In the Bank Case the research population consists of all the teams (and their members) that have
been involved during the period January to December 2005 in incident handling (in whatever
role or function) and that had a minimal average of 1 urgent incident (urgency 1 or 2) per month.
This threshold has been built-in to guarantee that it reasonably can be assumed that the teams
are familiar with the handling of urgent incidents. We wanted to avoid that urgent incidents
would have the status of ‘exceptional’ because that would mean that they are not
representative for the work of incident handling. In the Bank Case, because we have chosen to
study five critical business domains (Assets, Payments, Accounting, Trading, and Markets) and
their corresponding IT processes, the vast majority of teams are in the situation of being familiar
with the handling with urgent incidents. This yielded a list of 69 teams consisting of 602
theoretically corresponding e-mail addresses, representing an equal number of team-members.
Of the 602 invitation e-mails 41 bounced back indicating that these addresses were fictive or did
not longer exist. Two respondents declined the invitation to open the e-mail. The number of
people that were reminded (after 7 days, so June 28th) to fill out the survey was 243, of which 84
responded to the reminder. In total, a 477 people read the e-mail, from which 404 clicked
through the questionnaire. A total of 399 persons answered the questionnaire, of which 356
answered the questionnaire from beginning to end (except for an occasional blank question).
From this cleaned dataset 53 of 356 respondents, those respondents filling in a management
position were left out of the analysis because it was presupposed that they would be not

112 Two Cases in High Reliability Organizing: a Hermeneutic Reconceptualization
representative for a team’s HRO profile. This impacted the final sample size (n= 320) only
moderately.
Similarly, in the NPP Case, the research population consists of all the teams that have been
involved during the period September 2006 to August 2007 (included) in the Maintenance &
Repair Process and that had a minimal average of 1 incident of urgent notifications and orders
(priority 0, i.e. urgent notification). This in order to guarantee that the teams under study are
familiar with urgency (cf. Bank Case). The number of staff that has been selected (at random)
was 213.
6.4 Data analysis In the Bank case the number of respondents was 320. In the NPP case the number of valid
responses was 124. These sets formed the basis for further data analysis, which was performed
primarily by means of SPSS 15.0 for Windows.
6.4.1 Data reduction
To reduce the dataset into a set of less and more meaningful constructs, we conducted an
exploratory factor analysis and measured the internal consistency of the emerging factors.
Factor analysis allows the reduction of a set of observed variables to a smaller set of variables so
that a more parsimonious representation of the original set of variables is obtained. The
objective is to identify those items that most clearly represent the content domain of the
underlying construct (Hinkin, 1998, p. 112-113). This approach has the one advantage over a
pure inductive item generation that it builds on existing theory where possible, so that the factor
analysis better guarantees construct reliability: The inherent risk of the inductive method that
although items may load on the same factor without necessarily measuring the same theoretical
construct therefore is mitigated (Hinkin, 1998, p. 107). We used a principle components analysis
with a varimax rotation to examine their underlying structure. A .40 criterion level was used in
judging factor loadings as meaningful (Koch, 1993) and a 60 % level of the total item variance
that is explained by the factors (Hinkin, 1998).
In our choice of the factors we have selected for building our conceptual model(Table 5.1), we
have been lead by those factors that had a sufficient internal consistency (Cronbach’s alpha ≥
0.60).
6.4.2 Scale validation
As described in the previous chapter, many of the hypotheses in our conceptual model are
based on composite variables (scales) comprised of different items (questions). Before testing
hypotheses, each of these composite variables or scales should be validated, to assess their level
of internal consistency of reliability. Two important types of validity in survey research are
(Kasunic, 2005, p. 12): (1) construct validity: Are we measuring what we think we are measuring?
and (2) external validity: Can the results be generalized to other people, places, or times?
We use Cronbach’s Alpha for the estimation of the former validity, the internal consistency
reliability. Internal consistency reliability is the degree to which an instrument again and again
measures an attribute. A large coefficient alpha suggests that the sampling domain has been
captured adequately (Hinkin, 1998). In this research, a scale will be considered reliable only if a
Cronbach’s Alpha Coefficient of 0.60 or greater is found. In those cases, the item scores used to

Research Methodology 113
create the scale can be aggregated and analyzed for statistical significance to test the
corresponding hypothesis. In order to improve the Cronbach’s alpha coefficient, and in those
cases where the number of retained items was sufficiently large, those items were eliminated
that that will improve or not negatively affect the reliability of the scales (Hinkin, 1998).
6.4.3 Analysis of Variance
In a first approach we followed Klein et al. (1995) and performed F-tests, one way analyses of
variance and regression analyses to test differences and similarities across and within
organizations. This approach however did not yield any significant results and this way of
analyzing was abandoned and omitted in this dissertation. To test the hypotheses put forth in
the previous chapter, General Linear Model (GLM) Repeated Measures Analyses of Variance are
performed, which is an extension of the analysis of variance technique (ANOVA). More
particularly for the purpose of our research, we performed Tests of Between-Subjects Effects.
The leading idea behind this technique is the assumption that there are systematic differences
between groups, in that sense that these groups show averages in the population that differ.
These differences are to be discovered on the basis of a sample of observations (van den
Bercken & Voeten, 2002). The term ‘repeated measures’ refers to multiple observations of
either exposure or outcome on the same sampling unit, in our case a team. Often these
observations within the same subject will be correlated and this has to be taken into account
when analyzing such data. Whereas this is reported as a problem inherent to the use of the
repeated measures technique, in our research this constitutes an advantage. Reliability can be
defined in several ways, one of them being the reduction of variance in reliability outcomes, and
therefore it is useful to see the pattern between reliability observations within a time interval.
For the purpose of the analysis of variance, categorical variables needed to be created from
continuous scale variables. By means of Visual Binning, we created new variables based on
grouping values of existing variables into a two distinct categories. The median was used as a
cut-point with border values included in the lower category.
As we have the data on the IM reliability on team level, we had to aggregate the data of the
individual respondents on team level as well. In order to correct for teams with an insufficient
number of members participating in the survey, we put a double filter on the data: we selected
teams that had (1) at least 5 participants in the survey or (2) at least a participation rate of 50%.
The application of these selection criteria resulted in 37 teams for the Bank Case and 24 teams
for the NPP. Even though the original data set yielded 320 valid and selected respondents in case
of the Bank and 128 in the case of the NPP, the small sample sizes on the aggregated level (37
(Bank) and 24 (NPP) teams) has the disadvantage of a lower probability of showing significance
in an ANOVA. Therefore, we are convinced that the lack of a bigger sample requires a more
flexible statistical significance level for our analysis. Instead of the common statistically
significant p value ≤ 0.05, we worked with the practical significance of p ≤ 0.10. In line with
Ferguson and Ketchen (1999, p. 387) we have chosen to include in our analysis levels of analysis
of up to 0.10 because HRT is still not developed enough to allow for a more precise test, in
contrast to theories that can build on much wider established body of quantitative research
where a level of 0.01 would be more appropriate.

114 Two Cases in High Reliability Organizing: a Hermeneutic Reconceptualization
7 Conclusion: Build-up and Hermeneutic Circle of
Understanding Throughout the research, we have made an attempt at connecting data and theory while relying
on the research taxonomies enlisted above and while relying on a wide range of techniques.
Their development is depicted in Table 3.11. The research methodology alternates between
positivist and interpretive, between normative and descriptive, between deductive and
inductive, between quantitative and qualitative. Individually, these lenses are valuable for
analysis (deduction) but their true value lies in their combination in form of new constructs
(induction). In the first case, the observations will be starting point, in the second they will come
enhanced out of the process. In this model, observations are alpha and omega, but with the
intermediary role of a theory that emerges from these observations. That way, the divide
between empiricism and rationalism can be remedied.
Following Butler (1998, p. 293), the concept of the hermeneutic circle of understanding was
applied throughout the case studies on the incident management process reliability. Table 3.12
provides a graphical representation of the hermeneutic research process in terms of the
hermeneutic circle of understanding. Recall Figure 3.6 showing Gadamer’s argument that the
unity of understood meaning expands in concentric circles with the letters A to (in our case) I
representing the stages of understanding. Note however, that the actual hermeneutic process is
much messier: less concentric, more fanciful and characterized by interruptions.54 Noteworthy is
also that the outer circle most certainly will not be the final outer circle as our understanding will
always remain incomplete and challenged by new circumstances.
The apex stone of the hermeneutics underpinning this research is its multiple-case character.
Because of the identical research build-up in both our cases, we were capable not only of data-
theory triangulating within-cases, but also in between them. This ‘twin’ approach is quite rare in
HRO research since much of it is still based on individual case studies. Together with Schulman
(2001), we deem this inflicts a danger to the discipline: “in danger of falling victim to a kind of
evolutionary optimism that infers that because features have evolved in an organization that is
surviving in a high-reliability niche, these features must all contribute to its overall reliability. In
research on high reliability in organizations, we are beset by the problem of many variables and
few cases. How, without more failures, can we really be sure which of the many organizational
features we see are in fact adding to reliability?” (2001, p. 347). In themselves, these cases
provide little evidence that the presence of certain HRO parameters will lead to high reliability. It
might even very well be that they have a negative effect on it and that reliability is there despite
of them. The twin case study approach hence offers an opportunity of enhancing insights in the
nature of High Reliability. A warning is in place however. Formally, the research design is
multiple-case but because of the number of cases limited to two, the replication logic, in which
the cases are treated as a series of independent experiments that confirm or disconfirm
emerging conceptual insights, does not fully apply. The purpose we had with the design of our
research has been to compare both cases from the standpoint that the NPP Case should
represent what is described in HRO literature, and that we would check whether our findings in
the Bank Case would confirm this. For feasibility reasons however, the Bank Case was conducted
prior to the NPP Case. This data are analyzed in Chapter 6.
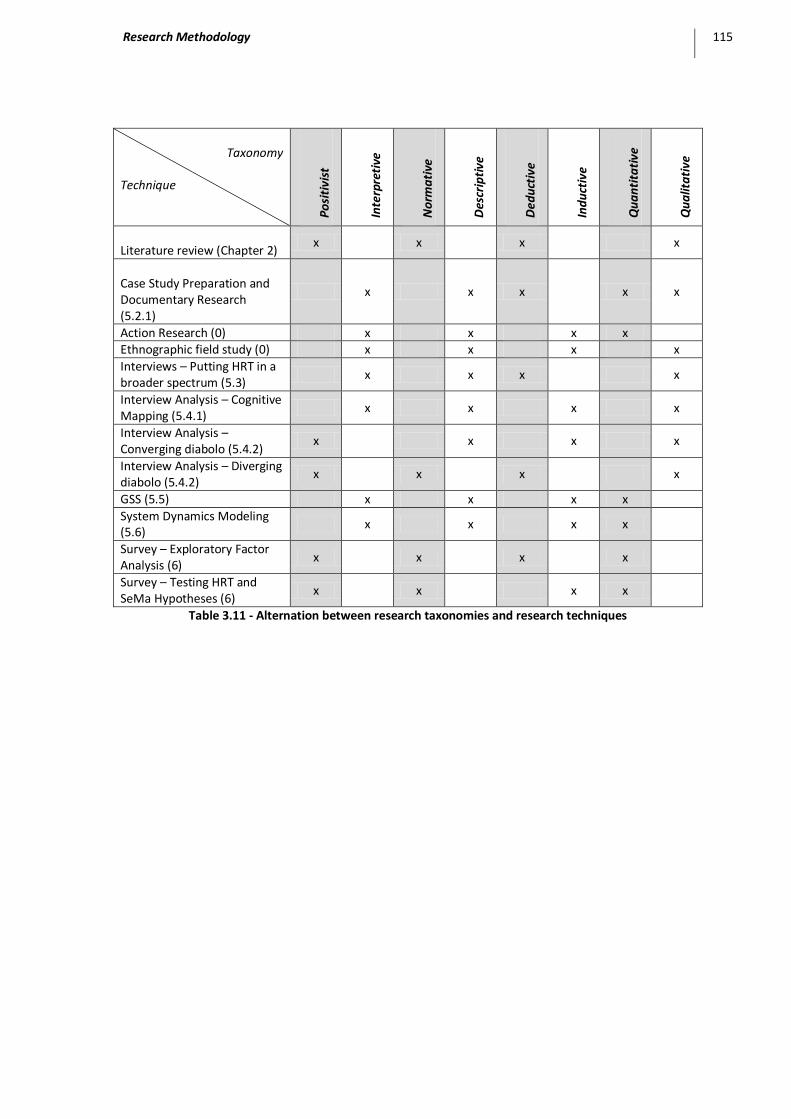
Research Methodology 115
Taxonomy
Technique
Po
siti
vist
Inte
rpre
tive
No
rma
tive
Des
crip
tive
Ded
uct
ive
Ind
uct
ive
Qu
an
tita
tive
Qu
alit
ati
ve
Literature review (Chapter 2) x x x x
Case Study Preparation and Documentary Research (5.2.1)
x x x x x
Action Research (0) x x x x Ethnographic field study (0) x x x x
Interviews – Putting HRT in a broader spectrum (5.3)
x x x x
Interview Analysis – Cognitive Mapping (5.4.1)
x x x x
Interview Analysis – Converging diabolo (5.4.2)
x x x x
Interview Analysis – Diverging diabolo (5.4.2)
x x x x
GSS (5.5) x x x x
System Dynamics Modeling (5.6)
x x x x
Survey – Exploratory Factor Analysis (6)
x x x x
Survey – Testing HRT and SeMa Hypotheses (6)
x x x x
Table 3.11 - Alternation between research taxonomies and research techniques

116 Two Cases in High Reliability Organizing: a Hermeneutic Reconceptualization
Cir
cle
Researcher’s Horizon Phenomenon’s Horizon Research Technique
Whole Parts
A
Pre-understanding of high reliability mechanisms: the more the better
Incident management process Reliability
HRT constructs SeMa properties
Literature review (Chapter 2) Case Study Preparation and Documentary Research (5.2.1)
B
Crystallizing of the research question: Can Mainstream organizations be HROs?
Incident management process
Individual tasks Action Research (0) Ethnographic field study (0)
C
Re-confirmation: Mainstream organizations can be HROs.
Aggregated risk identification and process reliability
Individual respondents view on incident process reliability
Interviews – HRT in a broader spectrum (5.3) Interview Analysis – Cognitive Mapping (5.4.1)
D
Complexity and Tight Coupling are essential insights: Predominance of NAT over HRT
Identification of instances of complexity and tight coupling at the organizational level
Identification of instances of organizational complexity and tight coupling at the individual level
Interview Analysis – Converging Diabolo (5.4.2) Interview Analysis – Diverging Diabolo (5.4.2)
E
Validation of the insights from the previous step.
A preferenced, collection of risks seen by the organ-ization as a whole
Individual process view on process reliability
GSS (5.5)
F
Reliability has its price A nuanced view on becoming a HRO
Separate observations of the nuances in high reliability.
System Dynamics Modeling (5.6)
G
The poison makes the dose Aggregattion of HRO en SeMa propensity on team level
Individual respondent’s HRO en SeMa propensity
Survey – Exploratory Factor Analysis (6)
H
HRO and SeMa constructs do exist, but differ from theory as described in literature
Two-dimensional testing of the HRO and SeMa constructs and team performance
One-dimensional testing of the HRO and SeMa constructs and reliability
Survey – Testing of HRT and SeMa Hypotheses (6)
I
Moderators have a tremendous impact The mutual
impact of tight or loosely coupled constructs
Categorization of a coupling’s Type, Cause, Direct Effect or Compen-sation
Loose coupling – Discussion of research findings (Chapter 7)
Table 3.12 - Hermeneutic research build-up (In analogy with Butler, 1998, p. 296)
Reconceptualization 117
Chapter 4 Reconceptualization
We all agree that your theory is crazy,
but is it crazy enough?
Niels Bohr
This chapter presents a reconceptualization of HRT. In Section 1, we first address the initial
conceptual model derived from the literature reviewed in Chapter 2. As the exploratory factor
analysis run on this model did not yield the results that were expected and were in line with
what is suggested in literature, we had to (re)introduce (new) constructs into the research
design. The outcome of this process is an extension of extant literature on HRT, notably with
regard to the Michigan HRO School, and suggests the need for further theory building. For this,
we fall back on writings by scholars from the Berkeley School (Section 2). These constructs are
discussed in detail throughout the next five sections (Sections 3 through 8). Consequently, we
are compelled to reconceptualize our a priori model (Section 1) and to formulate a new set of
propositions and hypotheses (Section 2).
1 A Priori Conceptual Model Construct Validation A conceptual model defines the elationships between constructs and variables through the
explicitation of propositions and hypotheses (Bacharach, 1989). By analogy with what we have
described in the methodology chapter, the basis for our initial conceptual model – henceforth
referred to as the ‘a priori conceptual model’ – is formed by a double assumption. A first
assumption is that the literature on high reliability theory – and more in particular the Michigan
School – offers a set of constructs that captures the high reliability character of an organization.
A second assumption is that this set is exclusive in a sense that the items that are suggested by
literature univocally converge into one of the proposed items. These assumptions refer to
hermeneutic circle of understanding G from Table 3.12. The corresponding conceptual model is
shown in Figure 4.1. It regroups three propositions:
P1: A higher HRO propensity results in a higher reliability than a lower HRO propensity.
P2: A higher SenseMaking propensity results in a higher reliability than a lower SenseMaking
propensity.
P3: The more the dedicated IS is used for the registration of incidents and the more it is used
for the communication during the incident handling, the higher the reliability.
P4: The fit of a team’s HRO propensity and the use of the IS determines reliability.
P5: The fit of a team’s SeMa propensity and the use of the IS determines reliability.

118 Two Cases in High Reliability Organizing: a Hermeneutic Reconceptualization
Figure 4.1 - The A Priori Conceptual Model
Based on our literature review from Chapter 2, we regroup the items per HRO construct as
proposed in Table 0.1 through Table 0.5 in Appendix C. Apart from meeting validity
requirements, the characteristics of the factors do not meet the expectations as expressed in
Table 0.1 through Table 0.5. Appendix C further learns that KMO parameters and explanation of
variance can be considered acceptable. Our conclusion hence is that our first attempt to
structure and interprete the high reliability issue in our case studies, relying on literature in the
field of HRT and SeMa does not yield the expected results. A comparison of the derived factors
with the factors first reported by Weick, Sutcliffe and Obstfeld (1999) does not hold. We recall
that these factors are: (1) Sensitivity to Operations, (2) Reluctance to Simplify, (3) Commitment
to Resilience, (4) Preoccupation with Failure and (5) Deference to Expertise (See Chapter 2:
Literature Review). These constructs were not supported by internally consistent factors in the
data. Several factor analyses were carried out in order to fit theory to empiric observations, but
the responses to the different items were not the way they had been conceived beforehand.
Therefore, sticking to the theoretical constructs as provided by literature on HRT and SeMa is
not leading to a workable conceptual model, at least not within the context of our research
design and data.55 For this reason, we decided to let loose the original constructs and start
searching for new ones that may be better supported by data.
2 Reconceptualizing the A Priori Model Instigated by the hermeneutic approach described in the previous chapter, we posit that the
theorizing on High Reliability Organizing has come to a turning point. Our review of literature
HRT
1. Sensitivity to Operations
2. Reluctance to Simplify
3. Preoccupation with Failure
4. Commitment to Resilience
5. Deference to Expertise
SenseMaking
1. Identity constructing
2. Plausibility
3. Enacting
4. Social
5. Retrospective
6. Ongoing
7. Cue extracting
Reliability
P1
P2
IS Fit
1. Registration
2. Communication
P4
P5
P3
Independent Variables Dependent VariablesModerator Variables

Reconceptualization 119
(Chapter 2) has learned that the evolution of theorizing on High Reliability Organizations so far is
one from the Berkeley school project’s focus to the Michigan approach. Our argument that it is
time for a new phase is that the two previous phases have replaced one black box by another.
We have not gained real insight in the why and how high reliability is achieved, neither on what
role situational circumstances play in its emergence. We provide the following arguments for
this statement:
1. The reliability theme has not sufficiently taken into account the tension between
effectiveness and efficiency. Even though it has been discussed by HRT and NAT
theorists, it has not been formally integrated into their framework. Since reliability–
especially today when pressure to be efficient is high – is one of the competing
organizational objectives, any sound theory development cannot happen when the
duality effectiveness/efficiency is not genuinely acknowledged as an endogenous factor.
2. The reliability theme has not sufficiently stressed the dynamic nature of organizing.
Although it has described reliability as ‘a dynamic non-event’, it has univocally described
its constituting parts in a static way: a culture of mindfulness, a structure of resilience,
without pointing out how these contextual and structural dimensions contribute to
reliability. Knight (2004, p. 49): “Thus, while Weick et al.’s (1999) theory proposes that
the five processes lead to collective mindfulness, it is plausible that collective mindfulness
leads to these five processes. *…+ Future research is needed to determine the causal
relationship between collective mindfulness and the five processes and evaluate Weick et
al.’s (1999) conceptualization”.
Just as the Michigan framework has built on the Berkeley research, we argue that we need to
take the Michigan research as a starting point. What is needed is a re-appreciation of the
Berkeley findings and a rereading of work that has lead the Michigan scholars to their theorizing.
With this we mean that one should do a backward reading of Weick’s work: from (1) HRO (Weick
et al., 1999), over (2) SenseMaking (Weick, 1995) and (3) Loose Coupling (Orton & Weick, 1990),
to (4) The Social Psychology of Organizing (Weick, 1979).
In what follows, we start the elaboration of what could become a third phase in the
development of High Reliability Organizing, after the pre-1999 Berkeley and the post-1999
Michigan approach. We do so by drawing on the insights and notions described above, by
organizing them around five ‘building blocsk’ which originally come from Roberts and Bea
(2001b)56: (1) Flexible Organizational Structuring; (2) Attention to Reliability as a Rival to
Efficiency; (3) Avoiding Core Competencies Becoming Incompetencies; (4) Adequate SenseMaking
and (5) Group Performance and Heedful Interaction. This calls for a nuanced and encompassing
instrument. For this reason, we have explicitly and deliberately chosen for an analysis based on a
comprehensive framework.
The factors that – according to literature – constitute the essence of High Reliability
Organizations are not systematically grouped, other than around the constructs of Mindfulness
and Resilience. This is the same observation as the one made by Knight (2004) in his study on the
HRO traits in the management of public swimming pools. Knight found no evidence of Weick et
al.’s (1999) conceptualization of five antecedents to be accurate either. Instead, he found
indications that the use of three variables would be more appropriate. Therefore, what is
120 Two Cases in High Reliability Organizing: a Hermeneutic Reconceptualization
needed is a framework that does allow regrouping them in a way that makes sense to the reader
and that respects their essence, i.e. without reducing them to mere concepts from organization
theory. It is our conviction that the choice for a relevant framework that meets these exigencies
is paramount in view of a thorough understanding of the complexity of the fundamental nature
of high reliability thinking.
The end of this journey will be a return to the Berkeley starting point, but complemented with
insights of some quarter of a century of literature on organizational (un)reliability and insights
stemming from our own field experience. In the remainder of this chapter we center this
reconceptualization exercise around the variables in our model. On the level of the independent
variables, we first discuss the expansion of the HRT framework (Section 3) and Sensemaking
(Section 4). On the level of the moderator variables, we address Requisite Variety (Section 4.4),
Structure (Section 5) and IS Fit (Section 5). On the level of the dependent variables we describe
the way reliability is measured (Section 8).
3 HRT Our proposed reconceptualization of HRT consists of six constructs: Team Orientation (3.1),
Threat Flexibility (3.2), Efficiency (3.3), Sensitivity to Operations (3.4), Preoccupation with Failure
(3.5), and Deference to Expertise (3.6). The three first constructs are novel to HRT, the last three
have been discussed at length in HRT literature. The focus in this section therefore is on the
discussion of the former constructs.
3.1 Team Orientation Roberts and Bea (2001b, p. 182) state that reliable organizations are characterized by social
conduct and collective mental processes that are more fully developed than they are in
organizations that are less reliable. People in these organizations create the social forces of
groups by acting as if those forces exist. When people believe these forces are present in the
group, they construct actions to contribute to the group while envisaging a social system of joint
action, representing the system in their minds, and interrelating their actions with the envisaged
system. Roberts and Bea argue that people in such organizations act heedfully, i.e. more
carefully, critically, consistently, purposefully, attentively, studiously, vigilantly, and
conscientiously (Roberts & Bea, 2001b, p. 182). Likewise, Campion et al. (1996, p. 450) suggest
to monitor and encourage positive team processes: communication, workload sharing, social
support, team self-efficacy or team spirit. Therefore this subsection focuses on the role of team
behavior and the interaction that takes place between team members. To this end, we first
provide a definition of team and Team Orientation. Next, we elaborate on how mindfulness
occurs through interaction between people.
A team is an entity made up of at least two individuals who see themselves and who are seen by
others as a social entity because they have been assigned specific roles or tasks to perform, who
are interdependent in their work as they work towards a common goal, who are embedded in
one or more larger social system(s) (e.g. a business unit or an organization), and who perform
tasks that affect others (e.g. colleagues, customers, suppliers) (Bernard, 2006;Rasker, 2002). .
Team members have usually been recruited for their qualifications, experience, and skills with
the objective of accomplishing a common team goal. Teams have a boundary, which is more or
less permeable. Depending on the context, members can move in and out of a team over time

Reconceptualization 121
(Bernard, 2006, p. 2). Team Orientation then is the degree to which team members rely on each
other for the coordination of their action. Essential in this is the notion ‘shared mental model’
and the role of implicit coordination. Rasker (2002) describes the shared mental model as
organized knowledge structures that allow team members to describe, explain, and predict the
teamwork demands. It comprises team knowledge such as knowledge about the tasks,
responsibilities, and informational needs of the team members and situation knowledge such as
knowledge of the ongoing developments in the external situation. Implicit coordination stands
for team members adapting to contingency, e.g. by providing each other the necessary
information in advance of requests. Hence, team members anticipate on each other's
informational needs. Rasker (2002) provides the example of the blind pass in basketball, where a
player passes the ball over his or her shoulder to another player without looking and talking.
Groups that perform well are likely to have higher levels of cohesiveness (Riddle, Anderson, &
Martin, 2000), and members are likely to feel more involvement and connection with one
another (Myers & McPhee, 2006, p. 442).
Most assimilating interaction occurs not at the organizational level but at the level of the team
and therefore team communication plays a much larger role than organizational influences
(Myers & McPhee, 2006, p. 441). This particularly true for HROs since they are characterized by
teams whose members must learn to coordinate their activities, develop trust, and rely on each
other in order to perform essential aspects of their jobs. Changes in the group’s goals,
membership, or context bring unceasingly new demands for learning and mutual adjustment
(Myers & McPhee, 2006, p. 441).
3.2 Threat Flexibility Research has shown that when faced with a threat, organizations, groups, and individuals often
react with well-learned behaviors or habitual responses (Staw et al., 1981;D'Aunno & Sutton,
1992). For familiar threats, responding in a rigid, habitual way may be effective at reducing the
threat (Staw et al., 1981). However, if the threat is new, habitual responses may be maladaptive
and may exacerbate the situation (Plotnick, Turoff, & Van Den Eede, 2009). This response rigidity
has been observed under many different kinds of threats, from financial threats to emergencies
that threaten to cause loss of life. Threat Rigidity theory is discussed by several authors: D’Aunno
and Sutton (1992) on the response of Drug Abuse Treatment Organizations to financial
restriction, Gladstein and Reilly (1985) in the context of a threat simulation experiment, D’Aveni
and MacMillan (1990) in relation to behavior of CEO’s financial crisis behavior.
3.2.1 Threat Rigidity
The threat rigidity thesis proposed by Staw et al. (1981) attempts to explain and model this
particular response to threat, to understand the mechanisms that underlie it, and to explore the
consequences of this proclivity towards rigid, maladaptive responses in the face of adversity
(Plotnick et al., 2009). In this model, environmental change is seen to lead to a threat; the threat
then results in a restriction of information and constriction of control in an attempt to focus
limited resources on dealing with the threat and to make certain there is centralized decision-
making. This in turn leads to rigidity in response (Staw et al., 1981) (Figure 4.2).

122 Two Cases in High Reliability Organizing: a Hermeneutic Reconceptualization
Figure 4.2 - Threat Rigidity (Sutcliffe & Vogus, 2003)
Rather than reducing the stress that precipitates the perception of threat, stress can increase to
a point that it is counterproductive. Some stress is needed to focus attention and achieve
cognitive absorption. However, there is a point at which too much stress will degrade reliability
if the task difficulty and arousal in response to the situational demands are also high (Bea &
Moore, 1993). The rigid response, when maladaptive, is ineffective and intensifies the threat.
Incremental small environmental changes will produce threats for which learned behavior
responses can be effective. But, radical changes will create threats that require new flexible
responses. It is this flexible responsiveness that the threat rigidity thesis is lacking (Staw et al.,
1981).
3.2.2 Threat Flexibility
Sutcliffe and Vogus’ Threat Flexibility model (2003;2007) as shown in Figure 4.3 challenges the
Threat Rigidity View
Figure 4.3 - Threat Flexibility (Sutcliffe & Vogus, 2003)
Several researchers have found indications for the existence of the Threat Flexibility model.
Smith-Crowe and colleagues (2003), for instance, using training history data and supervisory
ratings of 133 hazardous waste workers' safety reliability collected within two organizations in
the U.S. nuclear waste industry, examined organizational climate for the transfer of safety
training as a moderator of relationships between safety knowledge and safety reliability. Their
results supported the proposition that these relationships are stronger in the less restrictive
(more supportive) organizational climate (Smith-Crowe, Burke, & Landis, 2003).

Reconceptualization 123
HROs are said to be archetypes of resilient response. They achieve this through the plethora of
actions and tools that are available to them and that have been discussed throughout Chapters 2
and 4. Yet one particular way of doing so that has not been linked to HRT is suggested by Barnett
and Pratt (2000). Their notion of ‘autogenic crisis’ complements the Threat Rigidity thesis by
suggesting that future crises could be pre-adapted by initiating latent threat (instead of real
threat) to generate organizational flexibility, learning and renewal. By inducing such autogenic
crises into the organization, top-management causes internal fragmentation (Orton & Weick,
1990). The generation of a (be it controllable) crisis induces an uncertainty and ambiguity that
has the potential of challenging what has been taken for granted for too long a period of time. In
line with Orton and Weick’s (1990) reconceptualization of the Loose Coupling metaphor, this
boils down to loosening the coupling of (structural and contextual) organizational ties, as such
allowing for (tangible and mental) flexibility.
Another hallmark of HROs, is that a lot of what contributes to the leadership style of HROs has to
do with the fact that in general managers “know their problems aren’t simple and they know
there are many forces at work that can throw their plans out the window” (Longstaff, 2003, p.
13-14). In non-HROs managers know this also, but there they tend to believe they “have no
choice but to play the game by rules that everybody can at least understand”. If things turn out
differently, and damage is caused, a scapegoat is looked for – and found – who will be blamed
for the error. HROs ban these practices and this creates a climate of well-being and feeling safe.
3.3 Efficiency A paradox common to many – if not all – organizations, is the duality between the drive toward
efficiency and the drive toward reliability (Roberts & Bea, 2001b, p. 180). Originally stemming
from the automobile industry, the efficiency paradigm has penetrated the thinking of managers
in both public and private sectors. The business world’s obsession with efficiency is a heritage of
the Japanese management philosophy of lean thinking. The bottom-line of the lean paradigm is
that production time and process time are reduced and that resources are cut: idle time,
redundant resources, etc. We treat ‘slack’, ‘leanness’, ‘lean thinking’, and ‘efficiency’ as
synonyms for which we adhere to Lawson’s definition: “Organizational slack is that cushion of
actual or potential resources which allows an organization to adapt successfully to internal
pressures for adjustment or to external pressures for change in policy as well as to initiate
changes in strategy with respect to the external environment” (Lawson, 2001, p. 126).
In theory, it does not matter whether slack is constantly available or that it is a potential that can
be called upon in time of need. It has the connotation of ‘weak’, ‘loose’, ‘lazy’ or even waste (cf.
pit coal), all of which are rather pejorative. This negative connotation has been reinforced by
management literature (Harrison, 1997). Even though the blind acceptance of the efficiency
model and its alleged suitability, regardless of the context, has been criticized (e.g. Green, 1999),
its popularity has hardly diminished. The reason is simply that a striving for efficiency does yield
observable benefits. On the other hand, it has become obvious that the fascination for leanness
has caused the removal of vital adaptive and responsive capacity or 'organizational slack',
necessary for organizations that need to contend with complex and dynamic environments
(Smart et al., 2003, p. 733)57. “[E]ngineers are mainly concerned with effectiveness issues;
economists with efficiency” (Jarman, 2001, p. 100). This paradox has been expressed by Roberts
and Bea like this: “One paradox in many organizations is that between the drive toward

124 Two Cases in High Reliability Organizing: a Hermeneutic Reconceptualization
efficiency and the drive toward reliability. By its very nature, efficiency calls for reaching goals in
as cost-effective and time-efficient a manner as possible. Most organizations try to do this by
downsizing, outsourcing and cutting costs wherever they can. On the other hand, reliability
requires constant attention to processes such as intra-group behavior, intergroup behavior, and
communications; riveting attention to detail; cross training; paying attention to
interdependencies of people, their organizations and outside constituents; and time-consuming
vigilance. Efficiency is obtained through rational decision making; reliability is often achieved
through trained intuition and in-depth analyses” (Roberts & Bea, 2001b, p. 180-181).
The challenge is to determine where the critical point of too much leanness lies. This
subsection’s objective is to shed some light on the determination of this balance between a
striving for efficiency and a preoccupation with effectiveness. It builds largely on work by Smart
et al. (2003) who argue that “integrating `lean’ thinking with `high-reliability’ thinking, presents a
significant future challenge for managers reared almost exclusively on a diet of efficiency gain
and shareholder value” (Smart et al., 2003, p. 735-736). In line with this position, we adhere to
the general belief that HROs trade off efficiency for reliability because short-term efficiency may
significantly undermine long-term viability by causing an organization to make potentially fatal
errors of omission (Vogus & Welbourne, 2003a, p. 885). In what follows we address this paradox
in more detail. First, we provide an overview of the different slack types (3.3.1), after which a
reminder of the classical HRO paradigm that warns against fine-tuning is presented (3.3.2).
Finally, a balanced view on this paradigm is developed (3.3.3).
3.3.1 Slack
The slack and redundancy topic has strong relevance for the study of organizational reliability
and more particularly to the HRO notion, as high-reliability theorists emphasize redundancy as
one of the most prominent design features of unusually successful organizations (Roberts,
1990b;La Porte & Consolini, 1991). Schulman posits that important conclusions can be drawn by
“managers everywhere, especially those concerned about upgrading reliability in the face of
diminished reservoirs of organizational slack” (Schulman, 1993b). He distinguishes between
resource slack, control slack (Schulman, 1993b, p. 353-354) and conceptual slack (Schulman,
1993b, p. 364).
Slack types
Resource slack is the surplus in terms of time, personnel, money and so on. It can be viewed
negatively as nonproductive inefficiency in the organization, as a suboptimal allocation of
resources. Two particular types of resource slack are (1) Technical redundancy and (2) Social
redundancy. Technical redundancy is slack that is embedded in the form of duplication and
backups – redundant computer and communications systems, backup power supplies, and
multiple safety devices (Ericksen & Dyer, 2005, p. 29). Social redundancy is much less mentioned
in HRO literature (Snook, 2002, p. 210). Control slack implies individual degrees of freedom in
organizational activity, some range of individual action unconstrained by formal structures of
coordination or command (Schulman, 1993b, p. 353-354). Conceptual Slack (1993b, p. 364)
refers to a divergence in organizational member’s analytical perspectives about the
organization’s technology or production processes, a willingness to question what is happening,
rather than feign understanding, and greater usage of respectful interaction to accelerate and
enrich the exchange of information (Weick & Sutcliffe, 2001, p. 70-71). It is “a divergence in

Reconceptualization 125
analytical perspectives among members of an organization over theories, models, or causal
assumptions pertaining to its technology or production processes” (Schulman, 1993b, p. 364).
Although it can be assessed negatively, as ambiguity or confusion in an organization’s knowledge
base, conceptual slack forces an organization to take less for granted and to remain vigilant. In
this sense, conceptual slack relates to Mindfulness.
Redundancy absorption
The distinction between actual and potential slack is important from the perspective of
efficiency. The continuous search of striking a balance between an urge to be effective and one
to do so with the least resources possible (efficiency) tends to lead to a victory of the
proponents of efficiency. Singh (1986) distinguished between unabsorbed slack, which is easy to
recover, and absorbed slack which is not easy to recover. If slack is absorbed, it means that slack
is interwoven in the organizational tissue, structurally and inextricably. It are resources of any
kind that can be recovered to influence reliability over a typical temporal cycle to which
managers' activities are entrained. Underlying these aspects of slack typology is the time frame
over which resources can be redeployed (Nohria & Gulati, 1996, p. 1246-1247). In a study on
reliability in high-velocity environments, one would expect that slack is seen in a short-run time
dimension, which comes down to absorbed slack: The decision sequences have to occur in such
a limited time-interval that slack simply has to be ‘innate’ to be effective. Often, there simply is
no time to free-up the ‘unabsorbed’ capacity. An important exception, however, is that if the
mechanisms to draw on them are innate themselves, a choice for unabsorbed slack would be a
way to combine effectiveness and efficiency. Unabsorbed slack is more efficient than slack that
is not: not only can it be cut away with a next budget round – which is a negative interpretation
of our statement, but which applies – but also, using a football term, it can play a sweeper (or
libero) position in the organization’s defense. The form this unabsorbed capacity can take can
vary from a ‘flying brigade’ (human resources), back-up infrastructure (e.g. computer rooms,
offices), unbound experts, etc... Key to the success of unabsorbed slack is to be sure it can be
triggered at the right time, in the right way so that it becomes quasi ‘on the fly’ innate to the
organizational components it is reinforcing. Therefore, the advice we could formulate to find a
balance between effectiveness and efficiency is to make the slack itself unabsorbed, but the
mechanisms that trigger them innate to the organization.
The drawback of slack
A caveat on the side-effect of the slack treatment, however, is that some of the approaches
typically used to reduce component failure accidents, such as redundancy, may actually increase
the likelihood of system accidents because it increases interactive complexity, which is one of
the basic causal factors of unreliability—(Leveson, 2002, p. 32). Apart from this increase of
inherent complexity, redundancy can increase the chances of an accident by encouraging
operators to push safety limits well beyond where they would have, had such redundancies not
been in place (Snook, 2002, p. 210). Snook further reports that redundancy in form of multiple
overlapping components “dramatically increase system complexity, automatically compensate
for hidden weaknesses, effectively stymie attempts to locate root causes and generally frustrate
learning” (Snook, 2002, p. 210).
A final observation Snook makes is that the components of redundant systems are quite often
much less independent than we think (Snook, 2002, p. 211). While often no more than an

126 Two Cases in High Reliability Organizing: a Hermeneutic Reconceptualization
irritating design challenge in purely technical systems, meeting the demand for independence in
a social system is next to impossible. “Everyone was responsible, hence no one was” (Snook,
2002, p. 211).
3.3.2 Classical HRO paradigm on efficiency: the danger of fine-tuning
HROs seem to strike a balance between rewarding efficiency and rewarding reliability. Firms that
have reduced numbers of accidents are fully aware of the simple truth that what gets measured
gets managed (Roberts & Bea, 2001a, p. 74). They seek to establish reward and incentive
systems that balance the costs of potentially unsafe but short-run profitable strategies with the
benefits of safe and long-run profitable strategies (Roberts & Bea, 2001a, p. 74). They genuinely
acknowledge the complexity they are dealing with in the sense that they believe there are no
simple and stable answers. They trade off efficiency for reliability because short-term efficiency
may significantly undermine long-term viability by causing an organization to make potentially
fatal errors of omission (Vogus & Welbourne, 2003a, p. 885). They focus on the notion of
creating an HRO that privileges integrity in the achievement of medium- and long-term goals
over short-term efficiency gains.
Although apparently opposed to each other, there is a relationship between both concepts,
which is explained below.
1. Long-run reliability will affect financial reliability, which in its turn is a precondition for
innovation, e.g. Research & Development, leading to innovative products or services.
2. In a world of uncertainty, an organization’s stakeholders will value reliability. Flexibility
(e.g. innovations) is an important signal of reliability and future reliability. In this way,
flexibility contributes to reliability.
3. An organization that has committed itself to be highly reliable by applying HRT principles
has an organizational model that is built on trust and mindfulness. Such an organization
has to explore and maintain more ideas and has to refresh its picture of the
environment more frequently (Vogus & Welbourne, 2003a), all preconditions for
flexibility. “The tendency to seek confirmation and avoid disconfirmation is a well-honed,
well-practiced human tendency. That is why HROs have to work so hard and so
continuously to override this tendency and to remain alert. And that is why you may have
to work just as hard. All of us face an ongoing struggle for alertness because we face an
ongoing preference for information that confirms” (Weick & Sutcliffe, 2001, p. 35).
Cognitive dissonance kills mindfulness, kills reliability.
4. Long-run flexibility in its turn will make sure the organization is resilient in the way it
copes with incidents.
Reliability often can only be realized at the expense of short-term efficiency. When shareholders
are taking a short-term perspective (profit taking or aiming at dividend increase), this would
mean that there is no support for a policy of high reliability. Reliability comes at a cost and, in
the short run, such a reliability policy will have a negative impact on share prices. The same
scenario occurs, when the organization is operating in a dynamic environment – e.g. urging on
innovation – there will be insufficient resources and/or management commitment to focus on
the issue of reliability (Vogus & Welbourne, 2003a). HRT has some suggestions on the way this
long-term reliability can be achieved.

Reconceptualization 127
3.3.3 A balanced view on efficiency
Although prior research on HROs has noted that HROs pursue reliability at the expense of
efficiency (Creed et al., 1993) we have found indications that such might not univocally be the
case. Therefore, we believe that the trade-off between efficiency and effectiveness is more
subtle than that. Schulman (1993a) has typified reliability in HROs a ‘non-marginalizable’
property, meaning that they confront the economic rule of rationality. Non-HROs, when
organizational resources reach the point of diminishing marginal returns, their consumption is
likely to be reduced or rationed. (Schulman, 1993a, p. 34). In line with Amalberti et al. (2005)
however, we do not agree, and would argue that non-marginalizability would be a characteristic
of an ultra-reliable organization (URO), and not of a highly reliable organization. UROs are ruled
by the primacy of safety instead of the holistic notion of reliability we have described in the
introduction (Chapter 1). Another argument is that where Corporate Governance models
propagate the importance of openness and transparency, HRO literature however seems to
indicate that openness and reliability is not always compatible. Heimann (2005) argues that for
instance for NPPs, there is an obscurity and opaqueness that surrounds the sector of nuclear
energy, the so-called Nuclear black box. Nuclear incidents or safety problems at nuclear sites
rarely get the news, with a few notable exceptions (e.g. Vartabedian, 2006).
The task for the non-URO – and they constitute the vast majority of all organizations – is to
integrate both 'lean thinking' and 'high-reliability' principles (Smart et al., 2003, p. 733). Our own
research therefore starts from the bidirectional nature of this relationship between a striving for
effectiveness and a continuous concern to be efficient. We do so by taking into account the (1)
time horizon, (2) adaptive capacity, (3) system wide perspective, (4) curvilinearity, and (5) risk
appetite.
Time horizon
HROs pursue efficiency at the expense of short-term effectiveness, at least at the cost of an
increase in its probability. In other words, it is not wrong to strive for efficiency by cutting on
costs, time and resources. On the other hand, a strategy of striving for efficiency can be
advisable to a certain extent. On the other hand, a remark that also has to be made is the risk of
tautology: high performing companies over the years tend to generate slack. In other words,
slack is associated to reliability which precisely generated it (Durand, 2004), which constitutes a
system dynamics dimension in thinking about slack.
System-wide
HROs embrace lean thinking as a system-wide organizational philosophy, not as an isolated
initiative (Smart et al., 2003, p. 735). They focus on their value-streams rather than on their cost-
streams. Non-HROs pursue lean thinking in extensive attempts to cut transactional costs,
threatening an organization’s medium-term sustainability.
Adaptive capacity
The conventional approach to management is reactive and adaptationist (Staber & Sydow,
2002). Organizations following this approach tend to adopt a ‘lean and mean’ strategy, focusing
on their core competencies, streamlining routines, and tightening resource belts (Harrison,
1997). They view organizational flexibility in terms of cost cutting, rationalizing, and routinizing
and “behave as if complex, dynamic and interrelated environments are in fact simple, static and

128 Two Cases in High Reliability Organizing: a Hermeneutic Reconceptualization
unrelated” (Bozeman & Slusher, 1979, p. 346). The adaptationist approach considers
organizational slack a form of inefficiency and frowns on experimentation with unproven
structures and procedures, if such experimentation is seen as conflicting with activities that have
clear and immediate payoffs. An alternative strategy is to develop adaptive capacity (Staber &
Sydow, 2002, p. 408). HROs are archetypes organizations that go for adaptive capacity instead of
adaption. The distinction between adaption and adaptive capacity is crucial in explaining HRO
success and has the potential of distinguishing between the real HRO and the organization that
is highly reliable by chance or because it is an Ultra Reliable Organization (URO).
Curvilinearity
Durand (2004) argues that too much slack, like too much organizational knowledge, is bad
though. Too much knowledge can be a hindrance in developing responses to complexity. The
organization will develop negative organizational slack, which will lead to some form of inertia
and rigidities. Nohria and Gulati (1996), for instance, report a similar effect of slack on
innovation. They point out the curvilinear nature of the relationship by arguing that too little
slack inhibits innovation because it discourages any kind of experimentation whose success is
uncertain, but that at the same time complacency and lack of discipline might occur as the
consequence of too much slack (Nohria & Gulati, 1996, p. 1245) 58. An inverse U-shaped
relationship like this, suggests that, taken together, an intermediate level of slack is optimal for
innovation. We hypothesize that the same mechanisms that apply to the relationship between
innovation and slack equally can be found in the relationship between slack and other aspects of
flexibility (innovation being one of them) and reliability.
Therefore, you have positive or ‘good’ organizational slack and you have negative or ‘bad’
organizational slack. The question remains however, what makes the difference between these
two. We have the feeling that HROs seem to have found a recipe for developing the positive
variant.
Risk appetite
In her review of Sagan’s ‘The Limits of Safety’ (1993), Rousseau (1996) comments on the nature
of the debate between HRT and NAT: “Since each acknowledges the catastrophic potential for
failure, what they disagree on is whether the risks are worth it. Such a question is not amenable
to scientific test” (Rousseau, 1996, p. 201). This observation can be depicted by a Taylor-Russell
diagram where the trade-off between Type I and Type II errors is described (Heimann, 2005).
Type I and Type II errors can be described as follows 59:
- A Type I error (Neyman and Pearson, 1933/1967), also known as an error of the first kind,
occurs whenever the solution turns out to be inadequate, given the problem has been
correctly identified and analyzed. Such an error relates to rejecting a null hypothesis when it
is actually true.
- A Type II error (Neyman and Pearson, 1933/1967), also known as an error of the second kind,
occurs whenever the solution turns out to be inadequate because of a wrong analysis given
the problem possibly has been incorrectly identified. It is the error of not rejecting a null
hypothesis when the alternative hypothesis is the true state of nature.
The following is an example: “Moreover, the actors seemed to take into account the cost of
making a mistake through action (shooting down an unarmed plane) along with the cost of

Reconceptualization 129
making a mistake through inaction (not shooting down an armed plane)” (Heimann, 2005, p. 8).
Typical of HRT research is that the organizations it studies have to cope with ‘hazardous yet
high-reliability technical systems’ and that in such systems failure is not an option because that
would/could potentially radically jeopardize its survival. Schulman continues that in such
organizations reliability is not considered a probabilistic property ‘that can be traded off at the
margins with other organizational values’, but has to be considered a dichotomous
organizational variable (Schulman, 2001, p. 346).
From a reliability standpoint, an organizational structure that is effective for preventing one type
of error may not be equally effective at preventing the other (Little, 2005, p. 2). The message
that can be derived from the diagram is that an implicit choice for efficiency (avoiding a Type I
error) unavoidably leads to an increase in the risk of a Type II error. Van der Pijl and de Wild
(2007, p. 10) call this degree/amount of risk an organization is willing to accept in pursuit of
value risk appetite. As the acceptance of risk is conditional on the pursuit of value, it is clear that
risk cannot be seen in isolation. The balance inherent to the Taylor-Russell diagram (Figure 4.4)
shows this, but at the same time it is our assertion that HROs are capable striking a balance that
minimizes Type I errors (catastrophic failure) while at the same time keeps Type II errors
(excessive and costly conservatism) at acceptable levels (Little, 2005, p. 5).
(a) Minimizing alpha (b) Minimizing beta
Figure 4.4 - Taylor-Russell diagram
A crucial factor in the determination of the risk appetite is what Heimann (2005, p. 115-116) calls
‘the bottom-line question about reliability’, namely whether risky technologies can be managed
so as to achieve error-free operations for extended periods of time when the commitment by
political and organizational leaders is missing. He posits that HRO principles of redundancy,
culture, and learning will have no or much less effect when the steadfast motivation to pursue a
course of action is missing. Although this bottom-line question is quintessential in HRO thinking,
it might be taken for granted too easily. When asked about commitment in general terms, and
independent from the specificity of a situation, people (and especially management) are inclined
to answer truthfully affirmatively.
3.4 Sensitivity to Operations The Sensitivity to Operations constuct has been elaborated at length in our review of literature
(Chapter 2). We refer the reader in this respect to Chapter 2, subsection 3.2.2.
ß
Type II errorMissed opportunity
Wasted resources
Correct
decisionH0
Correct
Decision
a
Type I errorincident with
severe loss
H1
Decision
H1H0
State of Nature
ß
Type II errorMissed opportunity
Wasted resources
Correct
decisionH0
Correct
Decision
a
Type I errorincident with
severe loss
H1
Decision
H1H0
State of Nature
ß
Type II errorMissed opportunity
Wasted resources
Correct decisionH0
Correct
Decision
a
Type I errorincident with severe loss
H1
Decision
H1H0
State of Nature
ß
Type II errorMissed opportunity
Wasted resources
Correct decisionH0
Correct
Decision
a
Type I errorincident with severe loss
H1
Decision
H1H0
State of Nature
130 Two Cases in High Reliability Organizing: a Hermeneutic Reconceptualization
3.5 Preoccupation with Failure The Preoccupation constuct has been elaborated at length in our review of literature (Chapter
2). We refer the reader in this respect to Chapter 2, subsection 3.2.2.
3.6 Deference to Expertise Like the two previous constructs, Deference to Expertise stems from insights in High Reliability
Organizing gained by the Michigan School (Weick et al., 1999).
The Deference to Expertise construct bridges the divide between HRO literature and common
organization theory. Mendelson (2000, p. 517), for instance, posits that information age decision
architecture is embedded in the research of both organizational theorists (Lawrence & Lorsch,
1967;Thompson, 1967;Galbraith, 1973) and economists (Hayek, 1945) as they show that moving
decision rights closer to the point of information reduces information-processing requirements.
In HRO jargon, this is called ‘Deference to Expertise’.
The Deference to Expertise construct is also at the heart of explaining high reliability. In this
section we address mainly the dilemma of the need of simultaneous centralization and
decentralization that is at the core of NAT (See: Chapter 2 – Literature Review). It connects to
the Roberts and Bea Building Block of ‘Flexible Organizational Structuring’ (Roberts & Bea,
2001b). We recall that, from a NAT perspective, tightly coupled and interactively complex
systems are doomed to fail because of their impossibility to be centralized and decentralized at
the same time. HRO researchers – Weick (1987) and Rochlin (1989) – propose a solution to this
dilemma, namely the HRO capability to maintain both. HRO research explains this phenomenon
as “a successful management of the two opposites: central planning on the one hand providing
coordination between individuals, and local improvisation of individuals’ actions on the other
hand. Yet for the people involved the situation was not one of carefully balancing the two
opposites, but rather one of going through a quite unproblematic process of ‘planning’ and
‘performing’” (Gauthereau & Hollnagel, 2005, p. 128). In essence, this dilemma can be solved by
integrating the design principles of stability and flexibility, rather than merely substitute the one
for the other (Smart et al., 2003, p. 734). In this lies the challenge HROs are facing on a daily
basis. Noteworthy is Gauthereau’s and Hollnagel’s (2005) argument that this is quite a natural
process as people in HROs usually do not concern themselves with this centralization-
decentralization conflict (Rochlin, 1999). In part, this observation equally counters the critique
from NAT that HROs are cognitively impossible.
In the remainder of this section, we deal with the essence of Deference to Expertise and its
preconditions: Trust (3.6.1), (Control slack (3.6.2), Hierarchy vs. bureaucracy (3.6.3),
DecisionMaking styles (3.6.4), Training (3.6.5), Boundary spanners (3.6.6), and Layered
architecture (3.6.7).
3.6.1 Trust
Schulman has described trust as the ‘lubricant of the organization’ (Schulman, 1993a, p. 46).
Because of its perishable nature, it has to be continually nurtured and renewed if it is to survive.
Trust never gets institutionalized. It is one party's willingness to be vulnerable to another party
based on the belief that the latter party is competent, open, concerned, and reliable (Mishra,
1996). In that sense, trust must be distinguished from related behaviors such as cooperation or

Reconceptualization 131
delegation. These behaviors follow from one’s trust in another (Mishra, 1996). Therefore, when
HROs defer to expertise, it is because they meet the trust precondition.
Despite its importance, research on HROs has shown little attention for the role of trust as a
prerequisite for high reliability. One notable exception is the work of Cox et al. (2006) who have
studied – for two types of high reliability settings, the nuclear and offshore industries – the
importance of high trust relations and their associated impact on safety culture. However, this
study has not gone into the HRO mechanisms themselves, but has merely referred to HROs as a
type of safety-critical organizations “that have not just avoided failure through good fortune or
the vagaries of probability, but that have actively managed to control and reduce the risks of
technical operations whose inherent hazards make them prone to catastrophic failure”(Cox,
Jones, & Collinson, 2006, p. 1125). Although the Cox et al. study describes trust as a precondition
for high reliability in terms of safety, it does not address the link between the trust construct and
the Berkeley or Michigan HRO constructs. This observation can be made for HRO research in
general, as it deals with the trust construct only distantly (e.g. Myers & McPhee, 2006;Baker,
Day, & Salas, 2006). More frequent are HRO studies that take an implicit approach to the trust
theme.
3.6.2 Control slack
Control slack implies individual degrees of freedom in organizational activity, some range of
individual action unconstrained by formal structures of coordination or command (Schulman,
1993b, p. 353-354). Weick (1995) suggests that organizations operate with three forms of
control: “First-order control by direct supervision, second-order control by programs and
routines, and third-order control consisting of assumptions and definitions that are taken as
given. Third-order controls are called ‘premise controls’ because they influence the premises
people use when they diagnose situations and make decisions. Premise controls were the
‘professional blind spots’ *…+ They are the deep assumptions that are the foundations of culture
[..]” (Weick, 1995, p. 113-114). Together these control types, determine an organization
member’s degree of self-efficacy, which is a prerequisite for a successful Deference to Expertise.
3.6.3 Hierarchy vs. bureaucracy
A mistake easily made when studying organizations and the reasons for their success or failure is
to confuse hierarchy with bureaucracy. This distinction is pointed out by Hirschhorn (1993). He
argues that “working in hierarchies, people can respond flexibly to their task demands. But when
organizational leaders cannot or will not manage the inherent risks of the enterprise they
paradoxically undermine the hierarchy and create a dysfunctional bureaucracy in its place.
Diffusing responsibility and reducing the leader’s apparent accountability, the bureaucracy
burdens employees while making it difficult for them to work. Bureaucracies, in effect, deform
the hierarchical structure. We need to construct hierarchies in which authority is widely
delegated, while the chain of command is preserved and secured” (Hirschhorn, 1993, p. 138).
This distinction between hierarchy and bureaucracy helps to explain the Deference to Expertise
property. By blending a hierarchical decision structure with a specialist decision structure, HROs
recognize – and operationalize – a principle that often escapes decision makers at critical
moments: Expertise and experience are usually more important than rank (Weick & Sutcliffe,
2001, p. 74). Ruchlin et al. (2004), in their review of literature on leadership and safety rely both
on HRT and NAT. They reach a similar conclusion: “However, there is also recognition of the

132 Two Cases in High Reliability Organizing: a Hermeneutic Reconceptualization
importance of human agency in shaping directions and being innovative. Furthermore, an
important role of organizations becomes to experiment, learn and adapt. This leads to the
emergence of strategy. But contrary to the top-down design approach, this autonomous strategy
is less anchored in strong leadership but rather grows from bottom-up actions and middle
management engagement. This view challenges the previous role understanding of top
management. Competences take time to evolve, knowledge cannot be designed” (IBM Business
Consulting Services, 2004, p. 31).
3.6.4 Decision-making styles
Typical of HROs is that they know many diverse decision-making styles, all based on the principle
that it is natural to change from a bureaucratic style to a collegial style in situations where this is
more convenient (Grabowski & Roberts, 1997). The precondition is the existence of ‘slack’ and
‘safe areas’: decision makers can consider, off-line, the potential impact of their decisions
(Grabowski & Roberts, 1997, p. 9).
Another characteristic is that HROs are reluctant to simplify (Weick & Sutcliffe, 2001, p. 11-12).
Traditional management approaches favor working with simplifications (e.g. Key Reliability
Indicators, KPIs), meaning a reduction of complexity through aggregated indicators. This is in
contrast to HRO's continually redefining of their organizational structures, their decision-making
styles, and their communication patterns in response to the needs of their environment
Just as HROs know different decision-making styles, they also feature multiple authority
structures. Grabowski and Roberts (1997) distinguish between ‘Rapid tempo for the build-up
stage’, ‘Structural reporting for the maturation stage’ and ‘Bureaucracy for the maintenance and
resolution phase’. In emergencies, in order to avoid the inconveniences and even dangers of
rigid hierarchies “*…+ HROs push decision making down—and around. Decisions are made on the
front line, and authority migrates to the people with the most expertise, regardless of their rank”
(Weick & Sutcliffe, 2001, p. 16). A different approach for each different situation is a good
principle on the condition that it can be implemented in the organization in a natural/automatic
way. This is subject to the premise of simultaneous tight and loose-coupling, for which flexibility
and redundancy (slack) are the necessary constituents (Grabowski & Roberts, 1997).
In general, HRO decision making is carried out in settings where (Grabowski & Roberts, 1997, p.
156-157):
organization members are in close physical proximity to each other.
there is consistency among beliefs, actions and decisions
there is avoidance of public, irrevocable, escalating decisions
there are limitations of leadership uncertainties
there are collegial authority and decision making patterns which overlay bureaucratic
patterns
3.6.5 Training
A remedy for the non-linearity of the number of states is found in constant training with the aim
of presenting possible scenarios organization members could face (Roberts, 1990a). An emphasis
on training has two advantages, both leading to the same result of increased reliability. The first
benefit obviously is that routines are exercised. It has been reported on several occasions (e.g.

Reconceptualization 133
Tarn et al. (1998)) that lack of training is a reason why even small incidents activate a domino
effect and lead to disaster. The better people are trained, the bigger is their frame of reference.
This frame of reference serves as stepping stones to find a solution for crucial situations. We call
this ‘Training as a Product’. From the perspective of ‘Training as a Process’, we argue that the
mere fact of providing training to organization members on itself is a signal for them to remain
aware of the brittleness of reliability. This comes down to training as an antidote for
organizational hubris, the overconfidence which is the harbinger of calamity (Matthews, 2004).
Like all effective forms of learning – and according to a social-constructivist vision on learning –
training should be based on active participation, action learning or other participatory forms of
training, e.g. in communities of practice (Aase & Nybø, 2002).
3.6.6 Boundary spanners
We stress the importance of ‘boundary spanners’ (Boland & Yoo, 2003) in connecting people and
processes, as such making rich and varied information available to decision makers throughout
the organization. They are bridge builders because of their inter-functional and inter-disciplinary
background. These boundary spanners should have “diverse experience, skepticism toward
received wisdom, and negotiating tactics that reconcile differences of opinion without destroying
the nuances that diverse people detect”(Weick & Sutcliffe, 2001, p. 11-12). Boundary spanners
think end-to-end and as such, they not only help the organization in its attempt of becoming
more reliable, but also in becoming more flexible and customer-oriented.
3.6.7 Layered architecture
HROs have been described as having a layered organizational structure (Lawson, 2001, p. 127).
By this, Lawson means that HROs can operate according to at least three very different models
on an as-needed basis: (1) hierarchical, (2) completely collegial and team-based and (3) acting as
a disciplined machine during emergencies. The presence of such layers represents a challenge
for communication. Yet, HROs foster varied communication. Effective and varied communication
is one of the hallmarks of HROs, which provide a means of understanding roles, responsibilities,
and relationships and is as such developing shared mental models among members of the
organization (Grabowski & Roberts, 1997, p. 156). As a result, autonomy and interdependence
between system members is made explicit and more understandable, thus providing
opportunities for SenseMaking and discussion of improvements in the system (Grabowski &
Roberts, 1997). This can be obtained by means of frequent briefings, multiple instances and
opportunities for shared information (discussions), and acknowledgement of the necessity of
talk at the individual, team, organizational and system level. The explicitation of an individual’s
uncertainty through communication is also essential as uncertainty increases risk (Grabowski &
Roberts, 1997). In this perspective, Aase and Nybø (2002) advocate so-called ‘spaces of non-
punishability’ where failures and near failures could be analyzed and discussed.
4 SenseMaking From Chapter 2, Section 5, we have learned that it is not easy to define SenseMaking. Weick
(1995;2005), for instance, refuses to describe SenseMaking as an exhaustive, limitative and
exclusive enumeration of properties. Instead he clarifies that the seven properties (See Chapter
2, Section 5) “*…+ serve as a rough guideline for inquiry into SenseMaking in the sense that they
suggest what SenseMaking is, how it works, and where it can fail…This listing is more like an

134 Two Cases in High Reliability Organizing: a Hermeneutic Reconceptualization
observer’s manual or a set of raw materials for disciplined imagination than it is a tacit set of
propositions to be refined and tested. The listing might eventually serve the latter purpose”. We
have taken Weick’s advice at heart and have taken these properties as the starting point, but we
have reorganized them into a new categorization of SenseMaking components and processes as
(1) Self, (2) Other and (3) Scheme (Figure 4.5).
Although the seven original properties might not be fully exhaustive or exclusive in the scientific
sense, they still are a grand attempt to render the way people deal with interruptions more
tangible. Therefore, they continue to act as constructs that underlie our research. For their
elaboration, we refer to the Chapter 2, Section 5. From the first section of this chapter and
Appendix C we recall that our a priori belief was that the factors would relate to the seven
SenseMaking properties, the exploratory factor analysis has shown that the items regrouped
along three new constructs, which were labeled:
1. Making sense through team: The role of ‘Other’ for SenseMaking
2. Making sense through identity: The role of ‘Self’ for SenseMaking
3. Making sense through heuristics, rules, etc.: The role of ‘Scheme’ for SenseMaking
The original SenseMaking properties have been attributed to one of these three newly labeled
constructs (Table 4.1).
Self Scheme Other
Identity Constructing Retrospective Social
Enacting
Cue Extracting
Plausibility
Table 4.1 - Self, Scheme and Other
This attribution makes – at least to us and for our purposes – more sense than the original
constructs. Because of their higher degree of mutual exclusiveness, these constructs can be
applied more easily. Moreover, we posit that they form a more exhaustive set than the
underlying SenseMaking properties because it acknowledges the non-limitativeness of the list.
Figure 4.5 - Self, Scheme and Other
OtherSelf
Scheme
Ongoing

Reconceptualization 135
4.1 Self
Identity Constructing
Depending on who the SenseMaker is, the definition of what is happening will also change. What
the situation means is defined by who one becomes while dealing with it or what and who one
represents. “The Sensemaker is himself or herself an ongoing puzzle undergoing continual
redefinition, coincident with presenting some self to others and trying to decide which self is
appropriate” (Weick, 1995, p. 20). The organization seeks to discover what it thinks and knows
about itself and its environment. This identity construction is the basis for imparting meaning to
information inside an organization, and, eventually, determining what problems must be solved.
Identity can be seen on the level of the individual or on the level of an aggregation of individuals
(a team, an organization, a society, a people). Organizational identity, like individual identity for
that matter, is not stable over time. It is liable to intense emotional reactions that can redefine
organizational identity drastically (Weick, 1995, p. 94). Organizational identity can be described
as “an organization’s members’ collective understanding of the features presumed to be central
and relatively permanent, and that distinguish the organization from other organizations”60
(Gioia, Schultz, & Corley, 2000, p. 64).
Identity construction is seen by many to be one of the two basic properties that differentiate
SenseMaking from basic cognitive psychology.61 We create our reality by making decisions based
on what we observe and what we are. From the perspective of SenseMaking, who we think we
are (identity) as organizational actors lies primarily in the hands of others: “How can I know who
we are becoming until I see what they say and do with our actions?” (Weick et al., 2005, p. 416).
In that respect, this image of self is not static: “Even if we delve to the ‘deep’ level of
organizational identity, we discover that, contrary to lay conceptions of identity as that which is
fundamentally stable and enduring over time, organizational identity is actually fluid and
susceptible to prevailing interpretive currents. Identity amounts to a present way of
understanding ‘who we are as an organization’, and although identity might have continuity with
past conceptions, it is not bound by them. Only via retrospective interpretation can organization
members articulate their identity” (Gioia, Corley, & Fabbri, 2002, p. 623).
4.2 Other
Social
“People learn about events when they compare what they see with what someone else sees and
then negotiate some mutually acceptable version of what really happened” (Weick, 1985).
Cognitive and social aspects of SenseMaking are inextricably linked. Other people are integral to
our efforts to make sense of things because what we say or think or do is contingent on what
others say and think and do. Even if we are alone, we imagine the response of others to our
actions or thoughts, and adjust our thinking and behavior accordingly. SenseMaking requires
talking, interaction, conversation, argument, and dialogue with others. Links or bonds are
created through social interaction.
Whenever this section addresses SenseMaking, it does so on the level of the individual. In that
respect SenseMaking corresponds to the ‘largely cognitive activity of constructing a hypothetical

136 Two Cases in High Reliability Organizing: a Hermeneutic Reconceptualization
mental model of the current situation and how it might evolve over time, what threats and
opportunities for each action are likely to emerge from this evolution, what potential actions can
be taken in response, what the projected outcomes of those responses are, and what values drive
the choice of future action’. Brenda Dervin is the protagonist of individual SenseMaking. The
SenseMaking construct can also be applied on the level of the organization, but then it relates to
‘a collaborative process of creating shared awareness and understanding out of different
individuals' perspectives and varied interests’. In that way, collective SenseMaking is what has
been described above as mindfulness. When Weick addresses SenseMaking, he addresses it at
the organizational level. “Organization is an attempt to order the intrinsic flux of human action,
to channel it towards certain ends, to give it a particular shape, through generalizing and
institutionalizing particular meanings and rules” (Tsoukas and Chia 2002, p. 570). “We need to
grasp each to understand the other. The operative image of organization is one in which
organization emerges through SenseMaking, not one in which organization precedes
SenseMaking or one in which SenseMaking is produced by organization” (Weick et al., 2005, p.
410).
4.3 Scheme A cognitive scheme is a mental structure people rely on to organize information they come
across, based on previous experiences and suitable for present and future SenseMaking (Ericson,
2001, p. 117;Graesser, Gordon, & Sawyer, 1979). It represents one’s understanding of the world
by filling in white spots where information is missing (Gioia & Poole, 1984). The collection of
cognitive schemes of people in a team or an organization is what is called its ‘cognitive profile’
(Ericson, 2001, p. 118).
Several schemes are available. We categorize them as (1) DecisionMaking and (2) SenseMaking.
The following quote makes clear what difference exists between both scheme-building
strategies: “The Westerner and the Japanese man mean something different when they talk of
‘making a decision’. In the West, all the emphasis is on the answer to the question. Indeed, our
books on decision making try to develop systematic approaches to giving an answer. To the
Japanese, however, the important element in decision making is defining the question. The
important and crucial steps are to decide whether there is a need for a decision and what the
decision is about. And it is in that step that the Japanese aim at attaining consensus. Indeed, it is
in this step that, to the Japanese, is the essence of decision. The answer to the question (what the
West considers the decision) follows from its definition. During the process that precedes the
decision, no mention is made of what the answer might be. … Thus the whole process focused on
finding out what the decision is really about, not what the decision should be” (Weick, 1995, p.
15 (after Drucker 1974, pp. 466-467)). Decision analysis is the scheme fitting a rationalistic and
predictable worldview. Interruptions of normal processes can be dealt with by applying the
appropriate procedures, well thought-out and well tested. SenseMaking, on the other hand, is
the scheme fitting a more complex and less-predictable worldview. Interruptions then call for a
more intuitive and novel approach like improvisation to cope with the unexpected.
Retrospective
“SenseMaking is an examination of past practices in order to learn (and unlearn) things about
the current context” (Nathan, 2004). Weick, Sutcliffe and Obstfeld (2005, p. 413) point out that
answers to the question “What’s the story?” emerge from retrospect, connections with past
Reconceptualization 137
experience, and dialogue among people who act on behalf of larger social units. Answers to the
question ‘now what?’ emerge from presumptions about the future, articulation concurrent with
action, and projects that become increasingly clear as they unfold.
Weick et al. (2005) synthesize it as follows: “To focus on SenseMaking is to portray organizing as
the experience of being thrown into an ongoing, unknowable, unpredictable streaming of
experience in search of answers to the question, “what’s the story?” Plausible stories animate
and gain their validity from subsequent activity. The language of SenseMaking captures the
realities of agency, flow, equivocality, transience, reaccomplishment, unfolding, and emergence,
realities that are often obscured by the language of variables, nouns, quantities, and structures.
Students of SenseMaking understand that the order in organizational life comes just as much
from the subtle, the small, the relational, the oral, the particular, and the momentary as it does
from the conspicuous, the large, the substantive, the written, the general, and the sustained. To
work with the idea of SenseMaking is to appreciate that smallness does not equate with
insignificance. Small structures and short moments can have large consequences” (Weick et al.,
2005, p. 410).
Many a theory exists about strategy. Without any doubt, strategy (formulation, implementation,
etc.) has been one of the most popular themes for scholars in management. In the majority of
these writings and research, strategy is seen as a plan. Mintzberg calls this ‘intended strategy’, a
set of a priori guidelines for future actions). He confronts this intended strategy with what he
calls an ‘emergent strategy’, a strategy that emerges despite a lack of planning. The a posteriori
result of intended and emergent strategy is the realized strategy (Houthoofd, 2001, p. 27-28).
Because of the complexity of the organizational context, intended consequences might not
come true whereas unintended consequences resulting from strategy might be much stronger
than imaginable. Mintzberg (1978) has described emergent strategy as a stream of decisions (or
even merely of issues) decoupled from action. “*…+ the strategy-maker perceived an unintended
pattern in a stream of decisions and made that pattern the intended one for the future. An
emergent strategy, once recognized, became a deliberate strategy” (Mintzberg, 1978, p. 946).
Clearly, this is a case of the application of the retrospection SenseMaking property (Schneider,
1997, p. 95).
“We are conscious of what we have done, never of doing it. We are always conscious directly
only of sensory processes, never of motor processes; hence we are conscious of motor processes
only through sensory processes which are their resultants *…+ Actions are known only after they
have been completed, which means we are always a little behind or our actions are always a bit
ahead of us. To anticipate a later point, if hindsight is a bias *…+, then everyone is biased all the
time. The nature of time and sensing guarantee that outcome” (Weick, 1995, p. 26).
Cue Extracting
SenseMaking is focused on and by extracted cues. We notice some things and not others. We
pay attention and extract a particular cue, then link it with some other idea that clarifies the
meaning of the cue, which then alters the more general idea to which we linked the cue, and on
and on. The cues we extract from situations tend to be simple and familiar and are crucial for
their ability to get us moving. While moving, we keep noticing other areas and we stop to update
our understanding as we go along. These extracted cues enable us to act, which increases our
138 Two Cases in High Reliability Organizing: a Hermeneutic Reconceptualization
confidence and confirms our faith in earlier cues. In essence, we decide what to pay attention to
(Nathan, 2004).
Weick (Weick, 1995, p. 50) describes cues as simple, familiar structures that are seeds from
which develop a larger sense of what may be occurring. Cue extracting is different from noticing.
Starbuck an Milliken (1988, p. 60) refer to noticing as the activities of filtering, classifying, and
comparing, and distinguish it from SenseMaking which refers more to interpretation and the
activity of determining what the noticed cues mean.
Plausibility
Together with Identity construction, plausibility is seen by many as a pillar of SenseMaking that
make it fundamentally different from basic cognitive psychology (Weick et al., 2005, p. 416). 62
Looking for what is plausible is often of more practical help then finding accuracy (Nathan,
2004). Totally accurate perception is not needed, which is good because what is needed is that
which is plausible and reasonable. Plausibility helps us explore what we see and energizes us to
act. The search for accuracy on the other hand, can de-energize us as the search drags on and
on.
Enactment
Enactment – sometimes called recursion – starts from the belief that the context is not an
unchanging environment. It states that organisms (systems, organizations …) are “like rivers
carving their way across a landscape and changing its geography, then being guided by the new
topography” (Boisot & Cohen, 2000, p. 119). “People often don’t know what the ‘appropriate
action’ is until they take some action, guided by preconceptions, and see what happens. Action
determines the situation: The product of action is an orderly, material, social construction that is
subject to multiple interpretations” (Weick, 1988). The starting point is that there is no objective
environment out there separate from one’s interpretation of it. Thus, the organization creates or
enacts parts of its environment through selective attention and interpretation. Interpretation
can shape the environment more than the environment shapes the interpretation. We act and
actions become part of the environment that then constrains future actions. The subsequent
action tends to confirm preconceptions. “*…+ people receive stimuli as a result of their own
activity, which is suggested by the word enactment. *…+ we are neither the master nor the slave
of our environment. We cannot command and the environment obey, but also we cannot, if we
would speak with greatest accuracy, say that the organism adjusts itself to environment, because
it is only part of a larger truth” (Weick, 1995, p. 32). Weick further distinguishes between
SenseMaking and interpretation. He posits that SenseMaking is about invention, whereas
interpretation is about discovery. “The act of interpreting implies that something is there, a text
in the world, waiting to be discovered or approximated. SenseMaking, however, is less about
discovery than it is about invention. To engage in SenseMaking is to construct, filter, frame,
create facticity (Turner, 1987), and render the subjective into something more tangible” (Weick,
1995, p. 13-14).
Several authors (Heimann, 2005;Choo, 2001;Jennings & Greenwood, 2003) have built on Weick
(1979) and his Enactment-Selection-Retention (ESR) model of SenseMaking. This ESR model
treats SenseMaking as reciprocal exchanges between actors (Enactment) and their

Reconceptualization 139
environments (Ecological Change) that are made meaningful (Selection) and preserved
(Retention) (Weick et al., 2005). “SenseMaking is an active two-way process of fitting data into a
frame (mental model) and fitting a frame around the data. Neither data nor frame comes first;
data evoke frames and frames select and connect data. When there is no adequate fit, the data
may be reconsidered or an existing frame may be revised” (Klein, Phillips, Rall, & Peluso, 2003).
4.4 Ongoing SenseMaking has neither a beginning nor a formal end. Instead, it “takes place in a continuing
and dynamic fashion as events unfold and we continually seek to understand what events mean
in relationship to our organizations” (Nathan, 2004). Most of us at any given time find ourselves
‘in the middle of something’. As we move from one situation to another, we make and revise
assumptions and beliefs along the way. Our SenseMaking is ongoing. We work at making sense
of past events to develop a story that we understand, and as future events unfold, we revise our
story. SenseMaking takes place in a continuing and dynamic fashion as events unfold and we
continually seek to understand what events mean in relationship to our story. “SenseMaking
never starts. The reason it never starts is that pure duration never stops. People are always in the
middle of things, which become things only when those same people focus on the past from
some point beyond it. *…+ To understand SenseMaking is to be sensitive to the ways in which
people chop moments out of continuous flows and extract cues from those moments. There is
widespread recognition that people are always in the middle of things. What is less developed
are the implications of that insight for SenseMaking” (Weick, 1995, p. 43).
5 IS Fit The IS Fit theme has already been addressed in Chapter 2 where we looked in general into the
issue of aligning Information Systems, users and tasks. Here, we shift the focus further to the
way IS could/should support the Incident Management process. More particularly, we do so by
studying the way IS are used for the incident registration (5.1) and communication (5.2) and how
this relates to the HRT and SenseMaking constructs.
5.1 Registration Little has been written on IS and Mindfulness, except for a recent publication by Butler and Gray
(Butler & Gray, 2006). These authors argue that there are two strategies for achieving high
reliability, i.e. routine-based reliability and mindfulness-based reliability and that IS research has
typically focused on one of these strategies at a time, not at their individual and cumulative
benefits in achieving reliability.
5.1.1 Routine-based reliability
“Routine-based approaches to reliability are fundamentally Taylorist. Procedures and processes
are designed in advance, usually by managers or analysts, and applied in the moment by
operators. Information systems are created and training programs are prepared to lead users
step-by-step through the proper routine. Procedures, routines, training, and systems are
designed to decrease the need for creative human involvement in the moment, in an effort to
reduce errors, unwanted variation, and waste”(Butler & Gray, 2006, p. 214). “Routine-based
reliability implicitly assumes that systems and routines are themselves rationally constructed,
stable, repeatable, and reliable. If this is untrue, as suggested by recent studies of organizational

140 Two Cases in High Reliability Organizing: a Hermeneutic Reconceptualization
rules, processes, and systems rather than solving the reliability problem, routines may aggravate
it by adding greater complexity and more unreliable components” (Butler & Gray, 2006, p. 214).
5.1.2 Mindfulness-based reliability
While routine-based approaches focus on reducing or eliminating situated human cognition as
the cause of errors, mindfulness-based approaches focus on promoting highly situated human
cognition as the solution to individual and organizational reliability problems (Weick & Sutcliffe,
2001). A mindful response ‘to a particular situation is not an attempt to make the best choice
from among available options but to create options’ (Langer 1997, p. 114). Mindfulness-based
approaches hold that an individual’s and organization’s ability to achieve reliable reliability in
changing environments depends on how they think: how they gather information, how they
perceive the world around them, and whether they are able to change their perspective to
reflect the situation at hand (Langer 1989). From this perspective, routines are a double-edged
sword. They are helpful when they provide options, but detrimental when they hinder detection
of changes in the task or environment. “Whether describing individuals or organizations,
mindfulness-based approaches posit that—more than just consistency of action—properly
situated cognition is ultimately the basis for reliable reliability” (Butler & Gray, 2006, p. 214).
5.2 Communication
5.2.1 IS and SenseMaking
SenseMaking is important enough a process to deserve more attention than it usually gets.
Especially in the field of IS, its design and use, the way SenseMaking is supported is decisive for
success or failure. Computerized information systems force people to give up the powerful tools
that they use to make sense of the world away from terminals. If people are to retain meaning in
computer-mediated contexts, managers need to restore the techniques for SenseMaking that
machines exclude (Weick, 1985). Weick and Meader (1993) put it like this: “We assume that
people who are confused by equivocal events gain more understanding of these events as they
use more SenseMaking activities. Interaction helps alleviate confusion, but more so when action
is taken, multiple sources of data are compared, the results are pondered, and the confusion
event is placed in a context. It is the contemporary nature of these five activities that seems most
threatened when confused people are expected to define and resolve their confusion in front of
computer screens. The magnitude of this task is artificially reduced when the task is described as
one of problem identification rather than SenseMaking. It is our intention to convey an
appreciation of this larger, messier process of SenseMaking, so that designers are made more
comfortable when they constrain and exercise some of its features”.
Therefore, in this section, we study those SenseMaking aspects that bear promises for IS design.
We continue by discussing current IS design building blocks and their hindrance of SenseMaking
activities. We conclude this section by making a plea for a more open IS type with the
SenseMaking theorem as an underpinning.
5.2.1.1 Relevance
The study of SenseMaking in connection to Information Systems is not new. Apart from the
obvious link with information, several researchers have linked SenseMaking theory more
particularly to the design of Information Systems. Weick (1985) laid a basis for later work on

Reconceptualization 141
thinking about SenseMaking in connection to computerized IS by developing a framework
capturing SenseMaking procedures like (1) effectuation, (2) triangulation, (3) affiliation, (4)
deliberation, and (5) consolidation. More particularly, he argued that the ways in which
procedures and systems are designed and implemented do not support these SenseMaking
mechanisms. For instance, IS are not designed – either by system designers or managers – for
social comparison through personal affiliation, to allow deliberation before taking action, nor to
consolidate cumulative learning (Rice & Contractor, 1990). Weick and Meader (1993) have
applied an updated version of Weick’s 1985 framework to the design of Group Support Systems;
Gephart (2004) examined SenseMaking in computer-mediated communications; Landgren
(2005) relied on it for deriving design criteria for IS used in emergency response systems.
5.2.1.2 IS Support for SenseMaking
Building on Weick and Meader (1993) and their observations in connection to Group Support
Systems (GSS) research, we posit that the study of the process of group problem should pay
attention to the stage of SenseMaking of the problem itself. This crucial stage is often – but
wrongfully – taken for granted and in an overambitious attempt of avoiding Type I and Type II
errors, a Type III error will occur. Therefore we build on the idea developed by Weick (1985) that
data processing capacity can be fully operational only when the IS user is capable of
SenseMaking, able to “connect the details and see what they might mean” (Weick, 1985, p. 52).
However, we want to take Weick’s conclusion one step further by placing the source of this
SenseMaking within the IS and not in its environment: metaphors, corporate culture,
archetypes, myths, history.
For this reason we argue that systems are needed that are designed in line with users’ mental
model. We believe that the design of such an IS should encourage and support the SenseMaking
process. In practice, however, it can be noticed that IS design does the opposite because it aims
at replacing or suppressing the possibility to ‘make sense’ of situations. IS are designed
according to three leitmotifs (Muhren et al., 2008a):
- A first building block is that IS research and practice, heavily inspired by Herbert Simon’s
work, use structured data as a substitute for information (Boland 1987). However,
information is not a commodity; it is a skilled human accomplishment. Information is
meaning resulting from a person’s engagement with data (e.g. Davenport & Prusak
1998). In line with SenseMaking, IS should thus be designed to take dialogue,
interpretation and an individual’s search for meaning as sacred (Boland 1987).
- Another stronghold of IS design is the traditional hierarchy of information processing:
the progression of data into information, information into knowledge, and knowledge
into wisdom (Ackoff 1989). However, SenseMaking theory provides insights that this is
not correct. There is neither a clear beginning nor end to the SenseMaking process (Klein
et al. 2006). In the traditional hierarchy, data is perceived to be the starting point, but
there is no data unless someone has created it using his or her knowledge (Tuomi 1999).
- A third worn model is that of IS as a ‘repository of best practice’ (Boland & Yoo 2003)
which puts an emphasis on data storage. However, more information does not
automatically lead to better SenseMaking (Klein et al. 2006). SenseMaking should not be
viewed as a setting in which people need more information. The central problem
requiring SenseMaking is mostly that there are too many potential meanings, not too

142 Two Cases in High Reliability Organizing: a Hermeneutic Reconceptualization
few (Weick 1995). What becomes important in the SenseMaking view is the issue how
systems (in the largest sense) allow their users (again, in the largest sense) to “access
information, to conduct exchange, and to communicate in ways that foster mutual-
personal relations” (Woodward, 2001, p. 283). We can learn from this for the way future
IS could be designed.
The conclusion can be no other than that the current leitmotif in IS design lacks a reflection on
the nature of information technology (Orlikowski & Robey, 1991) and could do with a strong
antidote against a tendency towards oversimplification.
5.2.1.3 Fitting is Enactment
Orlikowski and Robey (1991, p. 151) have pointed out that users often continually shape and
reshape applications, so that technology ceases to be a fixed, tangible constraint. It is enactment
in the purest sense. Information technology, by providing a means of representing reality
through its set of concepts and symbols, provides a set of interpretive schemes through which
people make sense of situation. IS institutionalize those interpretive schemes—those stocks of
knowledge—by formalizing and encoding them, making them standardized, shared and taken
for granted. Information technology contributes to the signification order by objectifying and
reifying human actors' knowledge and assumptions, reinforcing them over time. “When a person
is able to connect the details and see what they might mean, processing capacity is restored.
Meanings that can impose some sense on detail typically come from sources outside the
electronic cosmos — sources such as metaphors, corporate culture, archetypes, myths, history.
The electronic world makes sense only when people are able to reach outside that world for
qualitatively different images that can flesh out cryptic representations. Managers who fail to
cultivate and respect these added sources of meaning, and bring them to terminals, will make it
impossible for people who work at screens to accurately diagnose the problems they are
expected to solve” (Weick, 1985, p. 52).
6 Structure This section deals with some of the structural dimensions of organizing. 63 We subsequently deal
with the alleged duality between procedure and improvisation (6.1) and the physical
organization (6.2).
One of the most important structural dimensions of organizing is the way work is organized
physically. Three aspects thereof come to mind: physical proximity (6.2.1), team size (6.2.2) and
work load and time allocation (6.2.3). Although HRO literature so far has not dealt with these
aspects, we posit that incorporating them into the research framework may be adding value to
HRO research by putting HRO properties in a new perspective.
6.1 Procedure Organizations spend a great deal of time and effort in developing, implementing and complying
to procedures. Nevertheless, it seems an ironclad rule that procedures are deviated from. In this
section we make a start with studying the mechanisms behind the compliance to and deviation
from procedure. First, we describe what Standard Operating Procedures are (6.1.1). Next, we
examine what is meant by improvisation (6.1.2). We conclude with looking into why and how
people deviate from procedure (6.1.3).

Reconceptualization 143
6.1.1 Standard Operating Procedure
Under the Total Quality Paradigm, Standard Operating Procedures (SOPs) are generally
considered good practice and a core competence of the quality enhancing organization:
straightforward and well programmed. The only decision is which SOP to apply, meaning that
there is only routine decision making. This view is in line with organizations “coming close to
meeting the conditions of closed rational systems, i.e., a well-buffered, well-understood technical
core requiring consistency and stability for effective, failure-free operations” (La Porte &
Consolini, 1991, p. 24). An important advantage of such stable routine action is the reduced
cognitive demands that such behavior entails (Cohen, Dosi, Egidi, Marengo, & Warglien, 1996).
The underlying assumption is that of bounded rationality, namely that attention is scarce and
thus costly and that the more things an organization can do routinely and in the absence of
mindfulness, the more it can conserve attention for what really matters (Levinthal & Rerup,
2006, p. 509). In this respect, mindlessness can be an option too. Nevertheless, despite the
benefits of a linear application of a priori well-designed procedures, there is an inherent danger
in too strong a confidence in procedures: “When an organization succeeds, its managers usually
attribute success to themselves or at least to their organization, rather than to luck. The
organization’s members grow more confident of their own abilities, of their manager’s skills, and
of their organization’s existing programs and procedures. They trust the procedures to keep them
appraised of developing problems, in the belief that these procedures focus on the most
important events and ignore the least significant ones” (Starbuck & Milliken, 1988, p. 329-330).
In this lies a warning against hubris and overlying simplification and reduction of reality, a
warning that HROs take seriously. In that sense, HROs take a more nuanced stance towards the
application of procedures. The following quote from Schulman makes clear how HROs
differentiate from non-HROs in this respect: “Consider briefly two theories of reliability that
could be applied to the reliability of complex, hazardous operations *…+ Under one theory,
reliability would stem from a constant, certain, predictable set of performances. All system
conditions would be fully specified and anticipated. Term this the ‘anticipatory model’ of
reliability – an approach that equates reliability to invariance. Here an organization ought to
determine its functions, or at least strive to determine them, unambiguously and completely.
Once ‘correct’ job reliability is specified, it should be ‘locked in’ once and for all through formal
procedures, unvaryingly applied. A unified chain of command guarantees swift action and
preserves the ‘perfect’ model. But a second approach to reliability is possible. Here reliability
would be equated not with invariance but with resilience. Being responsive, rather than trying to
weed out, the unexpected would be the ultimate safeguard of stable reliability. Despite the
knowledge and elaborate procedures of an organization, its technology, it would be believed, is
still capable of surprises. This expectation of surprise would not only be a state of mind, it would
be recognized as an important organizational resource. Under this model of reliability, an
organization would value its capacity for real-time discovery as much as its ability to control by
anticipation” (Schulman, 1993b, p. 368). This quote nicely depicts this subsection’s contribution:
what is the balance between procedure and improvisation?
6.1.2 Improvisation
It is generally assumed that organizations operate either according to procedures and routines
(Adler & Borys, 1996) or in a more creative, improvised way (Barrett, 1998;Weick, 1998;Zack,
2000). This dichotomy however, is merely a hypothetical one as organizations do not operate in

144 Two Cases in High Reliability Organizing: a Hermeneutic Reconceptualization
either of these ideal modes (Zack, 2000). In Chapter 2, we discussed the impossibility for an HRO
to learn by trial and error, making it necessary to develop proactive abilities in managing risk.
Thinking in advance and ‘thinking the unthinkable’ is one way of describing what is meant by
being proactive. Such an attitude calls for imagination and improvisation. Learning and feedback
from small errors, incidents and near misses, simulations and emergency preparedness are
examples of reliability activities based on imagination (Aase & Nybø, 2002). Improvisation can be
defined in several ways: “bringing one's personal awareness ‘into the moment’, and on
developing a profound understanding for the action one is doing. This fusion of ‘awareness’ and
‘understanding’ brings the practitioner to the point where he or she can act with a range of
options that best fit the situation, even if he or she has never experienced a similar situation”
(Mirvis, 1998). A noteworthy definition of improvisation is ‘planning as action unfolds’ (Weick
cited in: Clegg et al., 2002). Improvisation is a kind of synthesis between the expected and
unexpected circumstances, however without replacing either of them. Improvisation is enacted
in the relationship between them but it does not replace the bi-directional relationship between
poles (Figure 4.6).
Figure 4.6 - Planning, Action and their Improvisation Synthesis (Clegg et al., 2002, p. 489)
Improvisation takes at least two things: experience and creativity (Levinthal & Rerup, 2006, p.
506). For this reason it is a false dichotomy however to state that organizations choose to
behave either through improvisation or routine-based. In practice, they operate under both
modes, depending on the situation (Brown & Eisenhardt, 1997). This is particularly true in case
of HROs where experiential learning prior to action provides the necessary experience or
building blocks, whereas mindfulness in action brings together experience and creativity
(Levinthal & Rerup, 2006, p. 506). “When encountering new problems, old ideas embedded in
existing prototypes are often rediscovered as useful because they remind brokers of specific
solutions embedded in particular designs” (Levinthal & Rerup, 2006, p. 505).
6.1.3 Deviation from procedure
Throughout the debate, the question remains in which circumstances SOP or improvisation
yields the best result. And to which degree, and how it should be administered.
In Chapter 1 we have already introduced several issues that are related to the study of
Complexity. In the following paragraphs we go into these questions, since the complexity notion
is essential for answering the Procedure vs. Improvisation question. We do so by relying on a set
of frameworks: (1) the distinction between complex and complicated (Bennet & Bennet, 2004),
Planning ActingImprovisation

Reconceptualization 145
(2) the distinction between foreseeable and not foreseeable, and (3) the distinction between
decision making and sense making. However, since they also constitute ‘tools’ that serve us well
to gain insight in other issues than the application of procedures, we have chosen to present
them as separate sections, on the same level as the SOP level they are capable of explaining.
Organizations are most of the time loosely coupled, and only become tightly coupled at
particular moments of time. Nevertheless, they are designed in an all-purpose tightly coupled
way. This is not workable in the loosely coupled time-periods and therefore organizational units
will start developing alternative procedures. That works fine: the floor is happy and
management is happy because success is visible. Then the system gets tightly coupled (domino
effect) and fails. This mechanism is called Practical Drift: the slow, steady uncoupling of local
practice from written procedure (Snook, 2002, p. 194). “It is this structural tendency for subunits
to drift away from globally synchronized rule-based Logics of Action toward locally determined
task-based procedures that places complex organizations at risk” (Snook, 2002, note 2, at p. 24).
Globally untoward action is justified by locally acceptable procedure (Leveson, 2002, p. 182). “…
locally efficient procedures acquired through practice gain legitimacy through unremarkable
repetition. If such emergent actions survive long enough without interfering with global interests,
and if local procedures are successfully repeated consequence, they stand a good chance of
becoming accepted practice” (Leveson, 2002, p. 182).
6.2 Physical organization
6.2.1 Proximity
From an HRO perspective, physical proximity is an important component of reliability. Both the
literature and common observation seem to suggest that individuals are most likely to interact
and communicate with others when the physical characteristics of buildings or settings
encourage them to do so (Pinto, Pinto, & Prescott, 1993, p. 1285). Although research on
propinquity among team members is not totally conclusive, it is assumed that it is useful for
enhancing communication flows among team members and can be an effective tool in creating
supportive group relationships and improved communication flows (Pinto et al., 1993, p. 1285-
1286). Kraut et al. (2002) have illustrated how collocation and face-to-face communication,
make collaboration easier to accomplish among people who are collocated than among those
who are apart: communication will be more social, less focused on the topic at hand, less
planned, more ambiguous, and less likely to contain misunderstandings than communication
conducted from a distance. The reason that comes to mind is the role of eye contact, which
serves a number of different functions in encounters, one of which is gathering feedback on the
other person’s reactions. Eye contact is also linked to affiliative motivation, and that approach
and avoidance forces produce an equilibrium level of physical proximity, eye contact and other
aspects of intimacy. If one of these is disturbed, compensatory changes may occur along the
other dimensions (Argyle & Dean, 1965, p. 289).
Olson and Olson, for instance, have reported that groups with high common ground and loosely
coupled work, with readiness both for collaboration and collaboration technology, have a
chance at succeeding with remote work but that deviations from each of these create strain on
the relationships among team members and require changes in the work or processes of

146 Two Cases in High Reliability Organizing: a Hermeneutic Reconceptualization
collaboration to succeed. When they do not succeed, it is because distance often still matters
(Olson & Olson, 2000).
For these reasons the efficacy of imitating face-to-face communication is an unquestioned
presupposition of most current work on supporting communications in electronic media, an
assumption challenged however by Hollan and Stornetta (1992) and Turoff et al (Turoff, Hiltz,
Bahgat, & Rana, 1993). Research suggests that frequency of dispersion and/or geographic
distance (1) negatively affect communication intensity and coordination effectiveness; (2)
contribute to a perception of people as being less trustworthy and dependable; (3) negatively
impact reliability effectiveness (van Fenema, 2002, p. 126-127); (4) increase stress; and (5)
reduce job satisfaction (Monge, Rothman, Eisenberg, Miller, & Kirste, 1985). Traditional HROs
have the advantage of physical proximity (Grabowski & Roberts, 1999), something virtual
organizations have not. Workload
6.2.2 Team size
Research has long considered size as an important issue in research on teams (Campion, Papper,
& Medsker, 1996) since team size and composition affect the team processes and outcomes. The
optimal size (and composition) of teams is debated and will vary depending on the task.
Research in the automotive industry for instance has been able to demonstrate only a small-to-
negligible influence of team size on reliability (Pearce & Herbik, 2004), whereas other settings do
indicate a substantial influence. Members of larger teams seem to be less satisfied, participate
less, and cooperate less than members of smaller teams. With increases in team size, the
psychological distance between individuals can increase.
6.2.3 Workload and time allocation
Workload is the relationship between a group or individual human operator and task demands.
It is the amount of work or of working time expected or assigned. It is the perceived relationship
between the amount of mental processing capability or resources and the amount required by
the task (Hart & Staveland, 1988). The relationship between workload and reliability is not
univocal. As workload increases, reliability does not necessarily decrease. Nachreiner (1995)
reports that permanent low workload (underload) can lead to boredom, loss of situation
awareness and reduced alertness. In addition, as workload increases reliability may not decrease
as the operator may have a strategy for handling task demands.
These observations have their relevance from a HRO perspective that takes a nuanced view.
HRO literature has for instance reported on the role of workload in relation to the property of
Commitment to Resilience (Wilson, Burke, Priest, & Salas, 2005), adaptability (Xiao & Moss,
2001) and the system dynamic nature of the relationship between slack/loose coupling and
workload (Cook & Rasmussen, 2005).
7 Requisite Variety Organizations tend to simplify the complexity of their environment to the extreme. There are
two reasons for this. A first reason is that organizations seem to be caught in a seeing
homogeneity as a magic formula for success. Therefore, they strive for management dashboards
and cockpits, fed by Key Reliability Indicators (KPIs) that are a synthesized reduction of reality;
they consider team homogeneity as a management ideal; they strive for a total quality

Reconceptualization 147
management that thrives on standardization and procedures; they design systems architectures
that are transparent. These are all manifestations of an organization’s drift to simplify to the
extreme. A second reason for so much simplification is – contradictory enough – in the
organization’s success. Miller (1993) pointed out that success leads to simplification, i.e. a
reduction of variety. This is because successful systems steadily become less sensitive to
complex changes around them. This simplification concerns both the way reality is observed and
the way an organization tends to homogenize its constituent parts, included its people. Nelson
(2003), for instance, found by means of verbal network analysis that groups inter-
organizationally hardly differ (in his case study between hospitals), but that there exist
considerable intra-organizational differences between them. As a result, Nelson (2003, p. 5)
rightly warns for an overambitious conclusion in terms of a globalization of organization
structure and culture. Superficial similarities may hide deep differences.
The conclusion is that organizations could do with an antidote for so much reduction of reality.
The principle of requisite variety could be a solution for this problem. Weick has elaborated this
principle at length at several occasions but traces back to Ashby’s Law of Requisite Variety
(Ashby, 1958). In essence, the principle says that one needs variety to counter complexity. If one
wants to construct a system able to deal with a high level of environmental variety, one has to
provide a sufficiently high level of system variety (Ahlemeyer 2001). Bennet and Bennet (2004)
are even more explicit when they state that for a complex system to survive in a complex
environment, it must have greater variety than the environment (in areas that are relevant to
the organization’s health). On the other hand, they warn that too much variety can waste
resources and lead to chaos and incoherence, but that too little variety may mean an inability to
respond to complex situations. Optimize complexity of the present and deal with the anticipated
future level (Bennet & Bennet 2005, p. 303).
7.1 Experience It is logical to assume that the average number of years (experience) in the job, has an effect on
a team’s HRO and SeMa propensity. Also that it has an effect on its reliability. The experience
that is needed for dealing with the unexpected shows itself when an individual starts improvising
(Levinthal & Rerup, 2006). This is particularly true in case of HROs where experiential learning
prior to action provides the necessary experience or building blocks, whereas mindfulness in
action brings together experience and creativity (Levinthal & Rerup, 2006, p. 506). Also, it is the
empiric experience that triggers learning. Together with the number of years, comes the
witnessing of (near)misses and hence a higher level of Preoccupation with Failure.
7.2 Temporary staff In a HRO context, requisite variety shows itself in more than way, for example in the choice for
temporary staff. Vogus and Welbourne (2003a), drawing on Nemeth (1986) and Langer (1989),
have reported skilled temporary employees stimulating divergence through processes of
minority influence. The reason for this is that they stimulate the majority to exert more cognitive
effort and think in more divergent ways. Vogus and Welbourne (2003a, p. 882-883) point out
that from a HRO perspective, the use of temporary employees as a reliability-enhancing strategy
is counterintuitive since it has been reported that inexperienced and untrained temporary
workers have played a significant role in organizational accidents in several industries (Rousseau

148 Two Cases in High Reliability Organizing: a Hermeneutic Reconceptualization
& Libuser, 1997). However, the temporary employees and contractors in high-technology
industries, like a Bank and a NPP, are highly trained and skilled.
7.3 Various Variances The ‘Various Variances’ notion is an umbrella term we have called into existence to label
possible variety in all other constructs in our conceptual model. It is measured as the standard
deviation, as opposed to the average scale on which all constructs primarily are measured. As
such, Various Variances it is not a proper construct, but the antipole of all other constructs in the
design. More particularly – but not solely – regarding the variance in in a team’s HRO and SeMa
propensity, we believe that the effect on reliability should be studied. Under contingency theory,
team heterogeneity as well as team homogeneity have their value. Waterman (1990), for
instance, argues that when team membership is too homogeneous, reliability usually suffers.
The effect of such team heterogeneity or homogeneity is contingent on the circumstances.
However, typical of contingency theory is that it remains unclear what, how and when this effect
plays. Therefore we take an interest in studying the tension between and the combined effect of
averages (homogeneity) and standard deviations (heterogeneity). Our findings have some
relevance for practice as they may have the potential of fine-tuning the dosing of team
homogeneity/heterogeneity composition. It can avoid a blind all saisons approach of making
sure styles are diverse and complementary. On the one hand, such style diversity ensures that all
perspectives on a problem are covered and different skills are brought to bear at stages of
problem solving. On the other hand, greater diversity requires more time to be spent on
acquaintance, team building, and conflict resolution, which all comes at considerable cost.
(Waterman, 1990).
8 Reliability As this study is about reliability, our independent variable is measured in terms of organizational
reliability. Literature suggests a few sub-variables of reliability such as accuracy, effectiveness
and efficiency (Lin & Carley, 2001). These may be interesting and theoretically different
concepts, but in many cases, accuracy, effectiveness, and efficiency are indistinguishable (Lin &
Carley, 2001). A second problem is that the measure of such reliability is a concept that “in the
real world is in many cases difficult to obtain, due to both the lack of information and the lack of
consensus on this measure” (Lin & Carley, 2001). We have chosen indicators of time to measure
this organizational reliability: deadline alerts, closing time and their derivation, the relative
number of incidents closed on time (expressed as a percentage). We believe that there should
be other measures, but also that the ones we have chosen were practically the only ones that
could be measured with the necessary scientific rigor. We are aware of the subjectivity of this
choice. On the other hand, it is argued that “[c]riteria for evaluating organizational effectiveness
cannot be produced by some objective *…+ process. They are always normative and often
controversial, and they are as varied as the theoretical models used to describe organizations
and the constituencies that have some interest in their functioning *…+ We should not seek
explanations for organizational effectiveness in general, since such general criteria are not
available”(Rochlin, 1993, p. 30).
These are measures of effectiveness, which is “*…+ both apex and abyss in organization behavior
research. It is an apex in the sense that all conceptualizations and theories of organizations are

Reconceptualization 149
aimed, ultimately, at identifying effective reliability. It is the fundamental dependent variable in
organizational investigations, judgments of effectiveness and ineffectiveness are an inherent part
of the activities of theoreticians, researchers, and practitioners in organizations. It is an abyss in
the sense that no valid theories of organizational effectiveness exist in organizational behavior,
and no list of criteria has ever been formulated that is either necessary or sufficient for
evaluating the construct” (Creed et al., 1993, p. 57). Creed et al. describe reliability as a subset of
effectiveness (Creed et al., 1993, p. 60) and state that “[T]o date, the link between reliability and
effectiveness has not been adequately explored in the HRO research. Had it been, the possible
position of HROs and reliability in a broader ranging contingent behavioral theory of the sort
foreseen by Lewin and Minton (1986) could have been truly thought provoking”. As one of our
objectives is to drive HRO research into mainstream management studies, we believe that the
choice for a strong measurable and strongly measured operationalization of effectiveness may
be indispensable. This is what has been lacking in the HRO research today.
The dependent variables as a proxy forreliability are a team’s performance in the handling of
urgent, respectively non-urgent incidents in time, i.e., according to what has been stipulated in
the respective Service Level Agreements (SLA) (Table 3.4). These variables have been chosen
because they meet the requirements of Measures of Reliability, i.e. quantities that describe
system properties or mission requirements (Cothier & Levis, 1986). This choice is contestable,
like any reliability measure would be contestable since there is no objective measure of
organizational effectiveness (Creed et al., 1993, p. 58). The scores on the independent variables
are assumed to reflect either directly or indirectly the cognitive activity of the participant (Smith,
1996, p. 262).
For this purpose we have examined the database of Incident Management module of
Peregrine™ the Bank in which the incident management process is logged. we came up with the
following reliability indicators:
PU12: Team performance regarding the handling of incidents of Urgency level 1 and 2
(urgent incidents)
PU3: Team performance regarding the handling of incidents of Urgency level 3
(non-urgent incidents)
PUA: Team performance of the handling of All incidents regardless of their Urgency level.
Also at the NPP, legacy data provided the numbers for team performance, as main dependant
variable. For this purpose we have interrogated the Maintenance & Repair Process module of
the SAP™ database regarding their reliability of teams in handling the notifications. This exercise
lead to the following reliability indicators:
PU0: Team performance regarding the handling of incidents of Urgency level 0
(urgent incidents). These are notifications that cannot be planned because of too short a
time horizon – less than 3 weeks – the normal time it takes to get the work done
according to the procedures. In the context of a NPP this time horizon is considered
urgent.

150 Two Cases in High Reliability Organizing: a Hermeneutic Reconceptualization
PU123: Team performance regarding the handling of incidents of Urgency level 1, 2 and 3
(non-urgent incidents) These are notifications that can and should be fully planned and
dealt with through the incident registration system.
PUA: Team performance of the handling of All incidents regardless of their Urgency level.
PU123: Team performance regarding the handling of notifications of priority/Urgency 1, 2 and 3.
Noteworhty is that the organization is steering its members and unit towards these reliability
measures that function as Key Reliability Indicators (KPI’s). For instance, the Bank labels them as
‘deadline alert’. For the purpose of defining our dependent variable we have transposed them
into an indicator (for urgent (PU12) and non-urgent (PU3) incidents respectively) that expresses
the ratio of the number of incidents that is not in deadline alert over the total number of
incidents a team has to handle. The Bank has set the norm for this deadline alert ratio to 95%, a
norm that it does not manage to comply to in all its aspects. At the NPP, there is an implicit
target ratio of 100%.

Conceptual Model 151
Chapter 5 Conceptual Model
A theory is something nobody believes,
except the person who made it.
An experiment is something everybody believes,
except the person who made it
– Unknown
1 Revised Conceptual Model In line with the hermeneutics underlying our research, the testing of the a priori conceptual
model and the theorizing described in the previous chapter has lead to the development of the
reconceptualized model as shown in Figure 5.1.
Figure 5.1 - Reconceptualized Model
HRT
1. Team Orientation
2. Threat Flexibility
3. Efficiency
4. Sensitivity to Operations
5. Preoccupation with Failure
6. Deference to Expertise
SenseMaking
1. Self
2. Other
3. Scheme
4. Ongoing
Reliability
1. urgent incidents
2. non-urgent incidents
IS Fit
1. Registration
2. Communication
Independent Variables Dependent VariablesModerator Variables
Requisite Variety
1. Experience
2. Temporary staff
3. Various Variances
Structure
1. Procedure
2. Phys. Organization
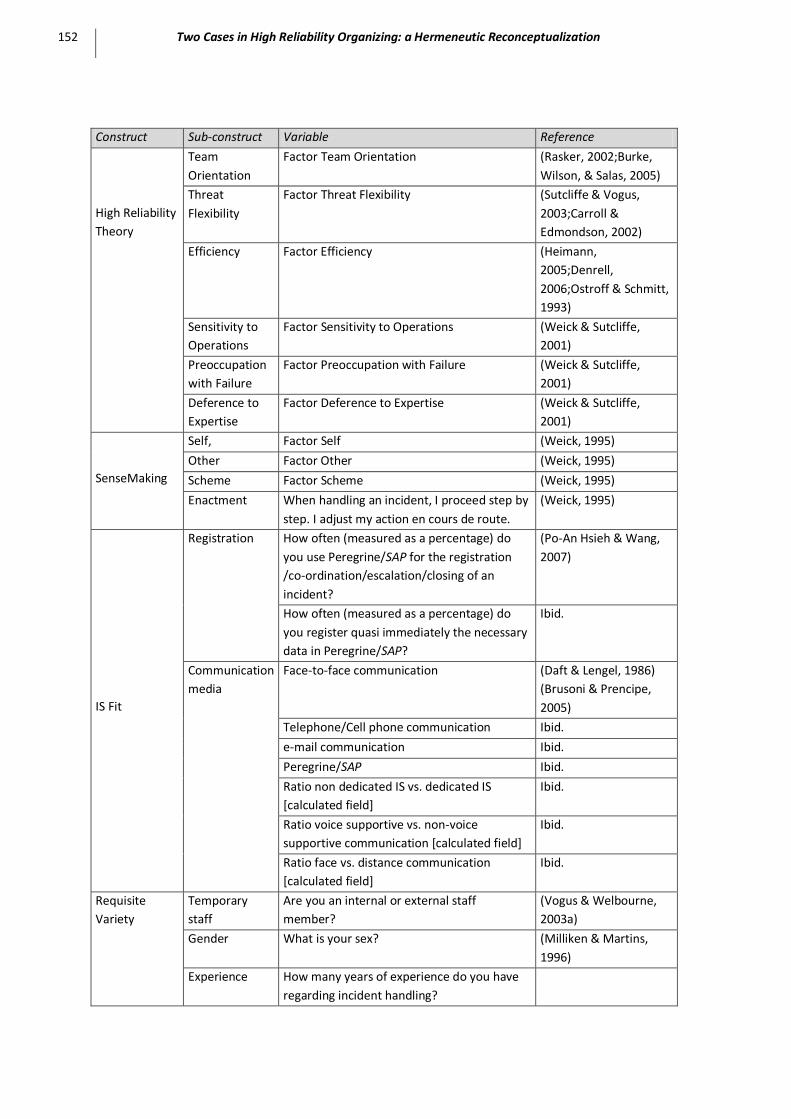
152 Two Cases in High Reliability Organizing: a Hermeneutic Reconceptualization
Construct Sub-construct Variable Reference
High Reliability
Theory
Team
Orientation
Factor Team Orientation (Rasker, 2002;Burke,
Wilson, & Salas, 2005)
Threat
Flexibility
Factor Threat Flexibility (Sutcliffe & Vogus,
2003;Carroll &
Edmondson, 2002)
Efficiency Factor Efficiency (Heimann,
2005;Denrell,
2006;Ostroff & Schmitt,
1993)
Sensitivity to
Operations
Factor Sensitivity to Operations (Weick & Sutcliffe,
2001)
Preoccupation
with Failure
Factor Preoccupation with Failure (Weick & Sutcliffe,
2001)
Deference to
Expertise
Factor Deference to Expertise (Weick & Sutcliffe,
2001)
SenseMaking
Self, Factor Self (Weick, 1995)
Other Factor Other (Weick, 1995)
Scheme Factor Scheme (Weick, 1995)
Enactment When handling an incident, I proceed step by
step. I adjust my action en cours de route.
(Weick, 1995)
IS Fit
Registration How often (measured as a percentage) do
you use Peregrine/SAP for the registration
/co-ordination/escalation/closing of an
incident?
(Po-An Hsieh & Wang,
2007)
How often (measured as a percentage) do
you register quasi immediately the necessary
data in Peregrine/SAP?
Ibid.
Communication
media
Face-to-face communication (Daft & Lengel, 1986)
(Brusoni & Prencipe,
2005)
Telephone/Cell phone communication Ibid.
e-mail communication Ibid.
Peregrine/SAP Ibid.
Ratio non dedicated IS vs. dedicated IS
[calculated field]
Ibid.
Ratio voice supportive vs. non-voice
supportive communication [calculated field]
Ibid.
Ratio face vs. distance communication
[calculated field]
Ibid.
Requisite
Variety
Temporary
staff
Are you an internal or external staff
member?
(Vogus & Welbourne,
2003a)
Gender What is your sex? (Milliken & Martins,
1996)
Experience How many years of experience do you have
regarding incident handling?

Conceptual Model 153
Construct Sub-construct Variable Reference
Structure Physical
location
Where is your work spot? (Grabowski & Roberts,
1997)
Size Team Size (Rasker, 2002)
Time allocation How much of your time (percentage) do you
spend on incident handling?
Mean number of urgent incidents per team
member
Mean number of non-urgent incidents per
team member
Mean number of incidents per team member
Table 5.1 - Operationalizing the constructs
2 Propositions and Hypotheses Contingency theory differs from other theories in the specific form of the propositions (Drazin &
van de Ven, 1985). “In a congruent proposition a simple unconditional association is
hypothesized to exist among variables in the model; for example, the greater the task
uncertainty, the more complex the structure. A contingent proposition is more complex, because
a conditional association of two or more independent variables with a dependent outcome is
hypothesized and directly subjected to an empirical test; for example, task uncertainty interacts
with structural complexity to affect reliability. Central to a structural contingency theory is the
proposition that the structure and process of an organization must fit its context (characteristics
of the organization's culture, environment, technology, size, or task), if it is to survive or be
effective. In a contingency theory, organizational reliability depends on the fit between
organization context and structure and process – given that normal assumptions hold about the
premises, boundaries, and system states derived from the theory” (Drazin & van de Ven, 1985, p.
514-515). This hallmark of contingency theory forms the basis for the conceptual model
underlying our research and explains in part its complexity and stratification. Based on the
reconceptualization presented in the previous chapter, we defined possible gaps –
contradictions and paradoxes – for which an in-depth study holds promising contributions to the
HRO discipline. We describe these gaps as research issues in form of propositions, and this
regarding the two aforementioned research questions.
2.1 Research Question 1 A proposition expressed by high reliability theorists, is the implicit supposition that not all
organization types exhibit High Reliability characteristics to the same extent, with HRO
archetypes (like nuclear power plants) at one end of the spectrum. The undefined other end of
the spectrum however is more worrisome because as long as there is no research on what could
be labeled non-HRO’s, research into high reliability is difficult and only partial. Therefore, we
identify blind spots of this continuum by comparing a nuclear power plant – as an HRO
archetype – to the IT department of a financial institution, as a so-called garden variety (Roberts,
1993) or high reliability seeking (Vogus & Welbourne, 2003a) organization. This choice is not
arbitrarily since the IT department of a Bank has many characteristics in common with a Nuclear
Power Plant (Table 5.2). The risk of failure is very real since IT is operating under conditions of
tight-coupling and interactive complexity (Perrow, 1999) and that the impact of such failure is
very high.

154 Two Cases in High Reliability Organizing: a Hermeneutic Reconceptualization
1. Both represent important economic sectors where stakes are high in terms of investment and expected return (shareholder value)
2. Both are characterized by a spillover effect in case of a calamity: Effects do not stop at the boundaries of the respective organizations, neither at the frontiers of the countries in which the calamity occurs. Radioactive elements will be dispersed on an international scale and a major Bank failure might/will result in a domino effect that takes other institutions down too. The laws of physics (nuclear) and the laws of psychology (Banking) are universal. Moreover, because of a globalization tendency, both nuclear and financial incidents also have a considerable impact on the economic tissue of the world. Reasons are both tangible and intangible.
3. Both have the same reliance on technology resulting in the same weaknesses and threats: (a) aging of the technology (reactors or mainframe) (b) aging of employees (retirements) (c) a (blind) overreliance on technology might lead to catastrophe (d) a remarkable track record in terms of reliability and reliability might lead to hubris (overconfidence)
4. A body of national (e.g. Nuclear Control Agencies/ Commissions for Banking and Finance) and international organizations (Bank for International Settlements (finance)/International Atomic Energy Agency (nuclear)) is in place.
Table 5.2 - Resemblance between the Nuclear and the Financial sector
A NPP and a Bank are what would be labeled by Schulman a form of holistic high reliability
organization (as opposed to a decomposable HRO) (Schulman, 1993a). The following quote by
Schulman makes this clear: “The technology of a nuclear power in existing plant designs does not
readily allow itself to be simplified for safety. An air traffic control network as we have seen can
be decomposed to reach safety, was when traffic is kept out of a sector, separations are
increased, or planes are denied clearance to take off. An automatic reactor shut down or ‘trip’,
however, is in many respects a riskier mode than is continuous operation of the reactor. The full
operational integrity of a variety of valve and pumping systems is necessary to relieve pressures
and carry off heat from the core” (Schulman, 1993a, p. 42-43). In the same way, the systems of a
financial institution cannot be simplified accept if one is willing to accept an excessive loss in
usability, efficiency and even effectiveness. The power of the Information System is based on its
potential of integrating processes. The upside risk and downside risk are definitely out of
balance.
No organization is a pure type (Schulman, 1993a, p. 52): “Even in a highly decomposable64
organization there are structures of integrating authority and examples of overarching analysis
that come into play in the solution of critical problems. Even in the most highly integrated,
holistic organization, there will be examples of individualized initiative and action taken to save
the day” (Schulman, 1993a, p. 52).
One way of finding an answer to the resemblance of a NPP and the IT process of a Bank is by
looking for a similar HRO propensity between both. Can we find the same constructs in both
organizations? And also: Can we find them to the same degree?
We posit that the HRO properties will be present in both organization types as they are generally
recognizable because of their high face validity. HRO properties are a translation and
interpretation of contextual and structural dimensions (Pugh et al., 1968) of organizations and
therefore will be distinguishable as such.

Conceptual Model 155
Therefore, our first proposition becomes:
Proposition 1-1: HRO properties are not unique, but HRO propensity levels are
H1-1: HRO properties will be discernible in the archetypical HRO (NPP) as well as in the
mainstream High Reliability Seeking organization (Bank).
However, what makes HRO unique is the degree to which they score on these properties.
Therefore, we posit that the archetypical HRO exhibits a higher score on these properties than
will the non-archetypical HRO.
Hence, the following research proposition:
Proposition 1-2: The non-archetypical HRO the Bank) exhibits the same HRO
characteristics as the archetypical HRO (like the NPP) but to a lesser
extent.
The corresponding hypotheses become:
H1-2a: The average HRO propensity at the Bank is lower than at the NPP
H1-2b: The average Team Orientation at the Bank is lower than at the NPP
H1-2c: The average Threat Flexibility at the Bank is lower than at the NPP
H1-2d: The average Preoccupation with Failure at the Bank is lower than at the NPP
H1-2e: The average Sensitivity to Operations at the Bank is lower than at the NPP
H1-2f: The average Deference to Expertise at the Bank is lower than at the NPP
In line with HRO literature (Roberts, 1990b;Klein et al., 1995) we see that HROs value requisite
variety regarding several aspects (experience, gender, skills, prior professional career …).
Therefore, we propose that this should be reflected in their HRO propensity. Hence, the next
two proposition become:
Proposition 1-3: The higher the requisite variety of a team, the higher its HRO propensity
This results in the following hypotheses:
H1-3a: Teams using richer media exhibit a higher HRO propensity.
H1-3b: More experienced teams exhibit a higher HRO propensity.
Propostion 1-4: The higher the requisite variety of a team, the higher its SeMa
propensity
H1-4a: Teams using richer media exhibit a higher SeMa propensity.
H1-4b: More experienced teams exhibit a higher SeMa propensity

156 Two Cases in High Reliability Organizing: a Hermeneutic Reconceptualization
Remarkably enough, this variety is not requisite in the domain of HRO propensity itself. There
the implicit rule of thumb is: the more staff shares these same values, the more reliable they will
be as a team or organization. Put differently: the smaller the variance in HRO propensity, the
higher the reliability. This leads us to the following research proposition:
Proposition 1-5: The non-archetypical HRO (the Bank) exhibits the same HRO
characteristics as the archetypical HRO (the NPP) but exhibits a lower
variance.
As we have argued at the beginning of this chapter, the general belief is that for an organization
(or subunit) homogeneity in terms of HRO propensity is better than heterogeneity. For instance,
teams that exhibit a low variance in the degree of orientation towards Reluctance to Simplify are
supposed to be better than teams exhibiting a higher variance. This is remarkable the more so
because it opposes the notion of requisite variety.
The argument we develop is that for high reliability (synthesis) to emerge, HRO propensity
(thesis) needs to be challenged by a critical, diverging HRO propensity and behavior (antithesis).
This is a plea for not pursuing a strategy of univocal HRO propensity but for pursuing a strategy,
that fosters deviant behavior vis-à-vis HRO propensity. Such deviance is the antidote that
provides the HRO potion with its therapeutic effect. A monolithic HRO therefore would go solid.
To avoid this from happening, an organization must continuously and simultaneously step on the
gas and brake. To put it metaphorically: in the same way as a tank – despite its unwieldiness –
can make a U-turn at a spectacular speed by stepping on the gas for one caterpillar track while
slamming on the brakes of the other caterpillar track, an organization derives it robustness – the
combination of stability and flexibility – from a balanced heterogeneity.
With the NPP as an HRO archetype and the Bank as an example of a garden variety HRO, we
posit therefore that the NPP exhibits a higher degree of heterogeneity in terms of HRO
propensity. Taking the standard deviation as a measure of this variance (spread), we come to the
following hypotheses:
H1-5a: The variance in HRO propensity at the Bank is lower than at the NPP
H1-5b: The variance in Team Orientation at the Bank is lower than at the NPP
H1-5c: The variance in Threat Flexibility at the Bank is lower than at the NPP
H1-5d: The variance in Preoccupation with Failure at the Bank is lower than at the NPP
H1-5e: The variance Sensitivity to Operations at the Bank is lower than at the NPP
H1-5f: The variance Deference to Expertise at the Bank is lower than at the NPP
In line with the argumentation built above, the same proposition (mutatis mutandis) can be
formulated regarding the SenseMaking propensity. The next propostion therefore becomes:

Conceptual Model 157
Proposition 1-6: The non-archetypical HRO the Bank) exhibits the same SeMa
characteristics as the archetypical HRO (the NPP) but exhibits a lower
variance.
H1-6a: The variance in SenseMaking propensity at the Bank is lower than at the NPP
H1-6b: The variance in Self propensity at the Bank is lower than at the NPP
H1-6c: The variance in Other propensity at the Bank is lower than at the NPP
H1-6d: The variance in Scheme propensity at the Bank is lower than at the NPP
In the same philosophy of acknowledging paradox, we formulate the next proposition:
Proposition 1-7: The constructs of Mindfulness and Resilience interrelate
HRO literature seems to presupose there is no multicollinearity between the HRO properties. It
is our assertion that this is not univocally so, since from a previous research phase we have
learned that the constructs are highly correlated.65 Especially regarding the mutual influence
between the constructs of Preoccupation with Failure and Deference to expertise, we
hypothesize a strong negative correlation. In other words: Mindfulness (i.e. pars pro toto
Preoccupation with Failure) is the enemy of Resiience (i.e. pars pro toto Deference to Expertise).
An organization that tries to be mindful has a good (better) chance of being stable in the short
run because it avoids intrusions on its processes. The organization is not endangered and can
continue to operate as it is used to, ‘business as usual’. An organization that tries to be resilient,
on the other hand, has a better chance of being stable in the end because it has learnt how to
deal with intrusions in its processes. The relationship between Mindfulness and Resilience is not
univocal. Hence, it is also more interesting and useful Mindfulness and resilience cannot live
with each other, but neither can they live without each other.
The hypothesis hence becomes:
H1-7a: The higher a team’s Preoccupation with Failure, the lower its Deference to Expertise.
In the same line of thought, another hypothesis relates to the conditions that are necessary for
mindfulness and resilience to take effect. The question arises how one can be resilient without
being mindful. We posit that it is very unlikely that someone (or a team) can be resilient without
being mindful. Therefore, we hypothesize that:
H1-7b: Being mindful is a prerequisite for being resilient.
Faithful to our assumption that a NPP is an example of an HRO archetype, whereas a Bank is an
example of a mainstream organization, we come to the following proposition and hypothesis:
Proposition 1-8: The NPP is more reliable than the Bank
H1-8: The NPP is more reliable than the Bank.
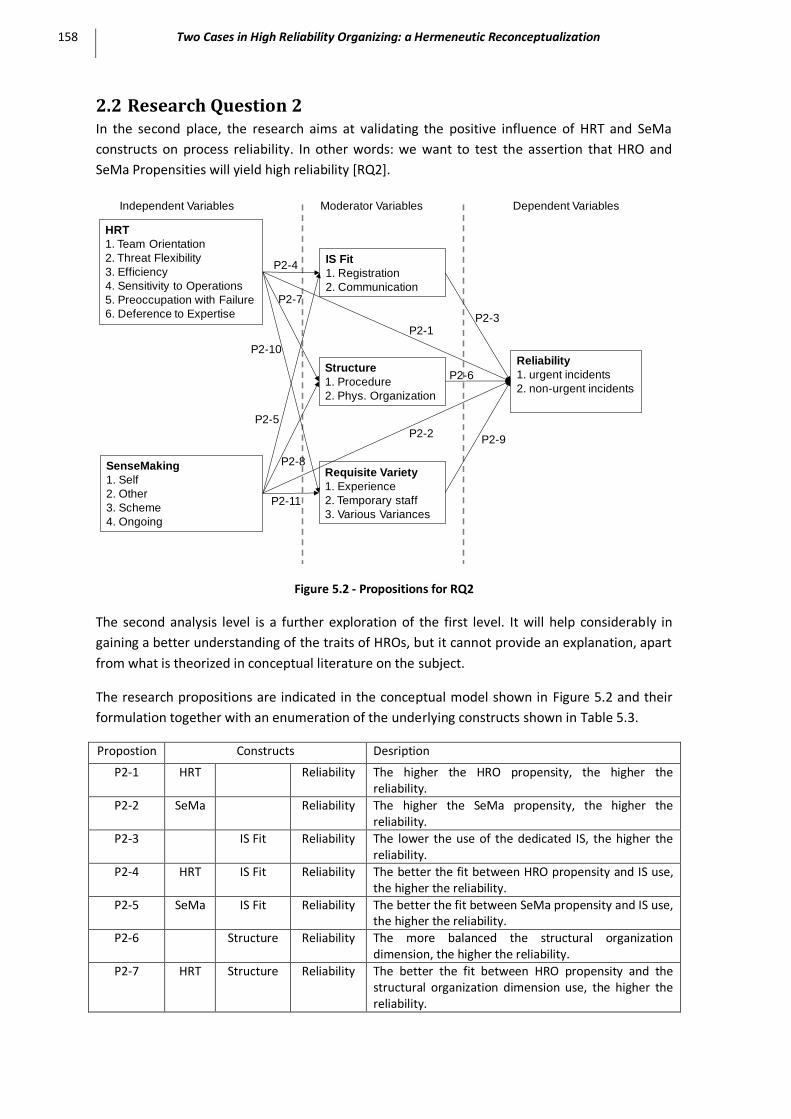
158 Two Cases in High Reliability Organizing: a Hermeneutic Reconceptualization
2.2 Research Question 2 In the second place, the research aims at validating the positive influence of HRT and SeMa
constructs on process reliability. In other words: we want to test the assertion that HRO and
SeMa Propensities will yield high reliability [RQ2].
Figure 5.2 - Propositions for RQ2
The second analysis level is a further exploration of the first level. It will help considerably in
gaining a better understanding of the traits of HROs, but it cannot provide an explanation, apart
from what is theorized in conceptual literature on the subject.
The research propositions are indicated in the conceptual model shown in Figure 5.2 and their
formulation together with an enumeration of the underlying constructs shown in Table 5.3.
Propostion Constructs Desription
P2-1 HRT Reliability The higher the HRO propensity, the higher the reliability.
P2-2 SeMa Reliability The higher the SeMa propensity, the higher the reliability.
P2-3 IS Fit Reliability The lower the use of the dedicated IS, the higher the reliability.
P2-4 HRT IS Fit Reliability The better the fit between HRO propensity and IS use, the higher the reliability.
P2-5 SeMa IS Fit Reliability The better the fit between SeMa propensity and IS use, the higher the reliability.
P2-6 Structure Reliability The more balanced the structural organization dimension, the higher the reliability.
P2-7 HRT Structure Reliability The better the fit between HRO propensity and the structural organization dimension use, the higher the reliability.
HRT
1. Team Orientation
2. Threat Flexibility
3. Efficiency
4. Sensitivity to Operations
5. Preoccupation with Failure
6. Deference to Expertise
SenseMaking
1. Self
2. Other
3. Scheme
4. Ongoing
Reliability
1. urgent incidents
2. non-urgent incidents
IS Fit
1. Registration
2. Communication
Independent Variables Dependent VariablesModerator Variables
Requisite Variety
1. Experience
2. Temporary staff
3. Various Variances
Structure
1. Procedure
2. Phys. Organization
P2-4
P2-1
P2-2
P2-3
P2-5
P2-6
P2-7
P2-8
P2-9
P2-10
P2-11

Conceptual Model 159
P2-8 SeMa Structure Reliability The better the fit between SeMa propensity and the structural organization dimension use, the higher the reliability.
P2-9 Req. Variety
Reliability The more balanced the variety, the higher the reliability.
P2-10 HRT Req. Variety
Reliability The better the fit between HRO propensity and variety, the higher the reliability.
P2-11 SeMa Req. Variety
Reliability The better the fit between SeMa propensity and variety, the higher the reliability.
Table 5.3 - Propositions and underlying constructs (RQ2)
Proposition 2-1 The higher the HRO propensity, the higher the reliability.
A shared mental model between team members (Rasker, 2002) increases team performance.
This shared mental model corresponds to what we have labeled ‘Team Orientation’. Rasker
(2002) found that training team members in each others’ tasks or positional rotation did not
improve reliability. The reason put forward by Rasker is that such does not enhance thorough
knowledge. However, teams have other characteristics contributing to high reliability. For
instance, they serve as redundant systems to help trap and mitigate the consequences of errors
(Burke et al., 2005). It has been argued that a team-based strategy towards reliability is the best
way to transform a garden variety organization into an HRO (Burke et al., 2005). For this reason,
we posit that an orientation on the team favors reliability because it is a prerequisite
determinant of collective mindfulness and resilience. Therefore, we come to this hypothesis:
H2-1a: Teams exhibiting a higher propensity towards Team Orientation yield higher reliability in
the handling of urgent incidents, whereas this is counterproductive for the handling of
non-urgent incidents.
A caveat is in place: concerning the interrelation between dependent and independent
variables: Despite the unproblematic and univocal character of the relationship between HRO
propensity (as an independent variable) and team performance (as a dependent variable), it can
be hypothesized that the sense of this relation is bidirectional. In line with findings from Myers
and McPhee (2006) in their multilevel analysis of the influences on team member assimilation in
a municipal fire department, we are aware of the possibility of a team’s reliability influencing its
HRO propensity66. The reason is that teams that perform well are likely to have higher levels of
cohesiveness (Riddle, Anderson, & Martin, 2000), and members are likely to feel more
involvement and connection with one another.
We argue that the provision of team information positively influences organizational reliability.
In our study, such team information corresponds to the construct of Sensitivity to Operations.
Therefore, the hypothesis we deduct from this can be expressed as follows:
H2-1b: Teams exhibiting a high propensity towards Team Orientation and exhibiting a high
degree of Sensitivity to Operations yield a higher reliability than teams than the same
teams exhibiting a low degree of Sensitivity to Operations.
Management tends to expand their control over the organization. The organization hence
becomes more bureaucratic. What is suggested by literature on HROs is that the reflex of this
kind of organization does not fit the conclusions from Threat Rigidity (Staw et al., 1981). Instead

160 Two Cases in High Reliability Organizing: a Hermeneutic Reconceptualization
of becoming more bureaucratic, adhocratic and organic mechanisms seem to take over from
mechanist ones. The organizational authority structure shifts in the sense that people in HROs
increase their reliance on connections to other people (people-to-people links) and depend less
on procedures (sensu stricto). They also have a wider access to resources (people-to-resources
links).67 68 This characteristic has been described by Sutcliffe and Vogus (2003) as Threat
Flexibility. The hypotheses hence become:
H2-1c: The higher the average Threat Flexibility, the higher the reliability.
H2-1d: Teams that operate in a less restrictive (more supportive) organizational climate perform
better than teams that do not (Smith-Crowe, Burke, & Landis 2003).
H2-1e: Teams that operate in a less efficiency-driven (more slack) organizational climate
perform better than teams that do not.
Proposition 2-2 The higher the SeMa propensity, the higher the reliability.
The same logic from above applies to the SeMa propensity. However, we examine not as much
the average value of SeMa propensity (on the level of the root construct, Scheme and Ongoing,
but the spread in observation SeMa propensity. We believe that the more diversity (i.e.
variance) is present, the more reliable a team will be. The hypotheses hence become:
H2-2a: The higher the variance in SeMa propensity, the higher the reliability.
H2-2b: The higher the variance in Scheme, the higher the reliability.
H2-2c: The higher the variance in Ongoing, the higher the reliability.
Proposition 2-3 The lower the use of dedicated IS, the higher the reliability.
We posit that dedicated IS are not suited for reaching high reliability, unless there is a fit with
user and environment characteristics. Therefore relying on more richer tools for incident
handling (especially communication) is a better strategy. The hypothesis hence becomes:
H2-3: Teams using richer media are more reliable.
The next proposition elaborates on this insight.
Proposition 2-4 The better the fit between HRO propensity and IS use, the higher the
reliability.
An essential requirement for the effective support of a process in natural and artificial systems is
the structural and dynamic compatibility between the information processing system and the
process it supports (Kampfner, 1998, p. 154). One way to guarantee this is by putting the user
and his characteristics central. An adaptable IS is built with and from people. Human beings
should be the bricks; the technology should be the mortar.
Which leads us to the following hypotheses:

Conceptual Model 161
H2-4a: Teams exhibiting a high propensity towards Team Orientation, relying on richer media
yield a higher reliability.
H2-4b: Teams relying little on the dedicated IS and exhibiting a higher HRO propensity perform
better than when they rely more on dedicated IS.
Proposition 2-5 The better the fit between SeMa propensity and IS use, the higher the
reliability.
This proposition is in line with what we have hypothesized under Propostion 2-4.
H2-5: Teams relying little on the dedicated IS and exhibiting a higher SeMa propensity perform
better than when they rely more on dedicated IS.
This hypothesis cannot be validated at an acceptable level of significance.
Proposition 2-6 The more balanced the structural organization dimension, the higher the
reliability.
Working closer to each other, should be advantageous for reliability. SenseMaking and
Mindfulness will be easier to achieve when distances are low. It can also be hypothesized that
smaller teams will be more reliable than larger teams. From our interviews we have learned that
also a higher workload is advantageous for reliability because scale will permit a more structured
organization of the work-follow-up. The same applies to teams that are capable of spending
more of their time to indicent handling (instead, e.g. on project work). The hypotheses hence
become:
H2-6a: Teams that work under close physical proximity perform better than teams that
do not.
H2-6b: Larger teams are more reliable than smaller teams.
H2-6c: Teams with higher incident workload are more reliable than teams with a lower
workload.
H2-6d: Teams with a greater deal of their time allocated to incident management are
more reliable than teams with smaller time allocation.
Proposition 2-7 The better the fit between HRO propensity and the structural
organization dimension use, the higher the reliability.
It can be assumed that a higher HRO propensity will even increase reliability when the conditions
regarding the physical work organization (Proposition 2-6) are met. The hypothesis hence
becomes:
H2-7a: A high HRO propensity enhances the effect on reliability of teams working under
close physical proximity
H2-7b: A high HRO propensity enhances the effect on reliability of larger teams

162 Two Cases in High Reliability Organizing: a Hermeneutic Reconceptualization
H2-7c: A high HRO propensity enhances the effect on reliability of teams with higher
incident workload.
Proposition 2-8 The better the fit between SeMa propensity and the structural
organization dimension use, the higher the reliability.
In the same way, the hypothesis regarding this propostion become:
H2-8a: A high SeMa propensity enhances the effect on reliability of teams working
under close physical proximity
H2-8b: A high SeMa propensity enhances the effect on reliability of larger teams
Proposition 2-9 The more balanced the variety, the higher the reliability.
One obvious hypothesis is:
H2-9a: More experienced teams are more reliable.
More important however, is the requisite variety that exists within teams regarding all
constructs in our model. It is this kind of requisite variety, our research wishes to focus on.
Like in all cases where paradox arises, it is good to come to realize that paradox is essential and
good in keeping “the organization on its toes, in a state of continuous awareness of its own
contradictions”. However important, this is not sufficient when decisions have to be made and
actions taken. Juxtaposing opposites may help people in becoming aware of the tensions and
tradeoffs that go along with making choices (Clegg et al., 2002, p. 487).
We argue this is so because successful organizations tend to become simpler over time, not
more complex (Miller, 1993). There are numerous factors that account for this, such as past
success, overconfidence, and the way past experiences are viewed (Miller, 1993).
Another paradox is introduced by the notion of Hyper vigilance. Janis (1982b) describes this
phenomenon as an excessive alertness to signs of threat or pressure. It is triggered by the time
pressure and other stressful situations (Amabile, Mueller, Simpson, Hadley, Kramer, & Fleming,
2002, p. 4). In this respect, we hypothesize that it is conflicting with the need to be mindful. Two
consequences can be drawn from this. It is a plea to take into account the time factor in any
research on mindfulness. (Something that is reflected in our research by making a distinction
between urgent incidents and non-urgent incidents.) Under time pressure, the access to tried-
and-tested decision-making best practices seems to be mentally or physically obstructed.
Problem definition, alternative generating, alternative analysis and deciding do not take place in
depth or even not at all. The most conspicuous observation being that Hypervigilance leads to
restricted information gathering and processing. Janis warns that this “leads to ill-considered
decisions that are frequently followed by post-decisional conflict and frustration" (Janis, 1982b,
p. 81). This same logic, applies to the other HRT constructs as well. We therefore become the
following hypotheses:
H2-9b: The higher the variance in HRO propensity, the higher the reliability.

Conceptual Model 163
H2-9c: The higher the variance in Team Orientation, the higher the reliability.
H2-9d: The higher the variance in Threat Flexibility, the higher the reliability.
H2-9e: The higher the variance in Preoccupation with Failure, the higher the reliability.
H2-9f: The higher the variance in Sensitivity to Operations, the higher the reliability.
H2-9g: The higher the variance in Deference to Expertise, the higher the reliability.
Proposition 2-10 The better the fit between HRO propensity and variety, the higher the
reliability.
Because of the strong consistency of these constructs of Threat Flexibility and Efficiency in the
exploratory factor analysis we have performed, and therefore contrary to the previous
proposition, we hypothesize:
H2-10a: Teams that perceive Threat Flexibility more homogenously perform better than teams
that do not.
H2-10b: Teams that perceive efficiency drivenness more homogenously perform better
than teams that do not.
Proposition 2-11 The better the fit between SeMa propensity and variety, the higher the
reliability.
The hypothesis here becomes:
H2-11: More Eperienced teams, relying more on SeMa propensity, are more reliable.
2.3 Summary of propositions and hypotheses
Research Question 1
Proposition 1-1: HRO properties are not unique, but HRO propensity levels are
H1-1: HRO properties will be discernible in the archetypical HRO (NPP) as well
as in the mainstream High Reliability Seeking organization (Bank).
Proposition 1-2: The non-archetypical HRO the Bank) exhibits the same HRO
characteristics as the archetypical HRO (like the NPP) but to a lesser
extent.
H1-2a: The average HRO propensity at the Bank is lower than at the NPP
H1-2b: The average Team Orientation at the Bank is lower than at the NPP
H1-2c: The average Threat Flexibility at the Bank is lower than at the NPP

164 Two Cases in High Reliability Organizing: a Hermeneutic Reconceptualization
H1-2d: The average Preoccupation with Failure at the Bank is lower than at the
NPP
H1-2e: The average Sensitivity to Operations at the Bank is lower than at the
NPP
H1-2f: The average Deference to Expertise at the Bank is lower than at the NPP
Proposition 1-3: The higher the requisite variety of a team, the higher its HRO propensity
H1-3a: Teams using richer media exhibit a higher HRO propensity.
H1-3b: More experienced teams exhibit a higher HRO propensity.
Propostion 1-4: The higher the requisite variety of a team, the higher its SeMa
propensity
H1-4a: Teams using richer media exhibit a higher SeMa propensity.
H1-4b: More experienced teams exhibit a higher SeMa propensity
Proposition 1-5: The non-archetypical HRO the Bank) exhibits the same HRO
characteristics as the archetypical HRO (the NPP) but exhibits a lower
variance.
H1-5a: The variance in HRO propensity at the Bank is lower than at the NPP
H1-5b: The variance in Team Orientation at the Bank is lower than at the NPP
H1-5c: The variance in Threat Flexibility at the Bank is lower than at the NPP
H1-5d: The variance in Preoccupation with Failure at the Bank is lower than at
the NPP
H1-5e: The variance Sensitivity to Operations at the Bank is lower than at the
NPP
H1-5f: The variance Deference to Expertise at the Bank is lower than at the NPP
Proposition 1-6: The non-archetypical HRO the Bank) exhibits the same SeMa
characteristics as the archetypical HRO (the NPP) but exhibits a lower
variance.
H1-6a: The variance in SenseMaking propensity at the Bank is lower than at the
NPP
H1-6b: The variance in Self propensity at the Bank is lower than at the NPP
H1-6c: The variance in Other propensity at the Bank is lower than at the NPP
H1-6d: The variance in Scheme propensity at the Bank is lower than at the NPP

Conceptual Model 165
Proposition 1-7: The constructs of Mindfulness and Resilience interrelate
H1-7a: The higher a team’s Preoccupation with Failure, the lower its Deference
to Expertise.
H1-7b: Being mindful is a prerequisite for being resilient.
Proposition 1-8: The NPP is more reliable than the Bank
H1-8: The NPP is more reliable than the Bank.
Table 5.4 - Summary of research propositions and hypotheses regarding Research Question 1
Research Question 2
Proposition 2-1 : The higher the HRO propensity, the higher the reliability.
H2-1a: Teams exhibiting a higher propensity towards Team Orientation yield higher reliability in
the handling of urgent incidents, whereas this is counterproductive for the handling of
non-urgent incidents.
H2-1b: Teams exhibiting a high propensity towards Team Orientation and exhibiting a high
degree of Sensitivity to Operations yield a higher reliability than teams than the same
teams exhibiting a low degree of Sensitivity to Operations.
H2-1c: The higher the average Threat Flexibility, the higher the reliability.
H2-1d: Teams that operate in a less restrictive (more supportive) organizational climate perform
better than teams that do not (Smith-Crowe, Burke, & Landis 2003).
H2-1e: Teams that operate in a less efficiency-driven (more slack) organizational climate
perform better than teams that do not.
Proposition 2-2 : The higher the SeMa propensity, the higher the reliability.
H2-2a: The higher the variance in SeMa propensity, the higher the reliability.
H2-2b: The higher the variance in Scheme, the higher the reliability.
H2-2c: The higher the variance in Ongoing, the higher the reliability.
Proposition 2-3 : The lower the use of dedicated IS, the higher the reliability.
H2-3: Teams using richer media are more reliable.
Proposition 2-4: The better the fit between HRO propensity and IS use, the higher the
reliability.
H2-4a: Teams exhibiting a high propensity towards Team Orientation, relying on richer
media yield a higher reliability.

166 Two Cases in High Reliability Organizing: a Hermeneutic Reconceptualization
H2-4b: Teams relying little on the dedicated IS and exhibiting a higher HRO propensity
perform better than when they rely more on dedicated IS.
Proposition 2-5: The better the fit between SeMa propensity and IS use, the higher the
reliability.
H2-5: Teams relying little on the dedicated IS and exhibiting a higher SeMa propensity perform
better than when they rely more on dedicated IS.
Proposition 2-6: The more balanced the structural organization dimension, the higher the
reliability.
H2-6a: Teams that work under close physical proximity perform better than teams that
do not.
H2-6b: Larger teams are more reliable than smaller teams.
H2-6c: Teams with higher incident workload are more reliable than teams with a lower
workload.
H2-6d: Teams with a greater deal of their time allocated to incident management are
more reliable than teams with smaller time allocation.
Proposition 2-7: The better the fit between HRO propensity and the structural
organization dimension use, the higher the reliability.
H2-7a: A high HRO propensity enhances the effect on reliability of teams working under
close physical proximity
H2-7b: A high HRO propensity enhances the effect on reliability of larger teams
H2-7c: A high HRO propensity enhances the effect on reliability of teams with higher
incident workload.
Proposition 2-8: The better the fit between SeMa propensity and the structural
organization dimension use, the higher the reliability.
H2-8a: A high SeMa propensity enhances the effect on reliability of teams working
under close physical proximity
H2-8b: A high SeMa propensity enhances the effect on reliability of larger teams
Proposition 2-9 : The more balanced the variety, the higher the reliability.
H2-9a: More experienced teams are more reliable.
H2-9b: The higher the variance in HRO propensity, the higher the reliability.
H2-9c: The higher the variance in Team Orientation, the higher the reliability.
H2-9d: The higher the variance in Threat Flexibility, the higher the reliability.

Conceptual Model 167
H2-9e: The higher the variance in Preoccupation with Failure, the higher the reliability.
H2-9f: The higher the variance in Sensitivity to Operations, the higher the reliability.
H2-9g: The higher the variance in Deference to Expertise, the higher the reliability.
Proposition 2-10: The better the fit between HRO propensity and variety, the higher the
reliability.
H2-10a: Teams that perceive Threat Flexibility more homogenously perform better than
teams that do not.
H2-10b: Teams that perceive efficiency drivenness more homogenously perform better
than teams that do not.
Proposition 2-11: The better the fit between SeMa propensity and variety, the higher the
reliability.
H2-11: More Eperienced teams, relying more on SeMa propensity, are more reliable.
Table 5.5 - Summary of research propositions and hypotheses regarding Research Question 2


Data Analysis 169
Chapter 6 Data Analysis
In the knowledge-based economy,
the role of the statistician is
to help people tell great stories.
Geoff Carss
In this chapter, we assess the conceptual mdoel developed in Chapter 5 and answer the two
research questions raised in the Introduction (Chapter 1). First, we validate the reconceptualized
model constructs as presented in chapter 4 (Section 1). Next, we address the question whether
the organizations we study are HROs [RQ1]. We do so by comparing our two case studies
(Section 2). Finally, we examine what constitutes high reliability [RQ2]. We do so by measuring
the (high) reliability of our two case studies (Section 3).
1 Reconceptualized Model Construct Validation The purpose of this section is to test the reconceptualized research model developed in this
dissertation. To this end, we validate the constructs that are at the basis of our reconceptualized
research model by subjecting the data to an exploratory factor analysis (1.1) and by testing the
resulting factors to an internal consistency test (1.2).
1.1 Data reduction We have used factor analysis to reduce various sets of items into a smaller number of compound
factors. A full description of the factor analyses we conducted can be found under Appendix H
(Bank Case) and Appendix I (NPP Case). All factors are extracted by Principal Component Analysis
with Varimax rotation with Kaiser Normalization. We only performed such an analysis if the
necessary conditions are met: KMO measure higher than 0.50 and a significant value of the
Bartlett test (Poelmans, 2002, p. 135). The factors emerging from our analysis meet the exigency
that they should explain for 60% of total Variance.
Our approach is in line with Koch’s (1993) modus operandus. As a factor analysis with all the
variables grouped did not give a desirable outcome, we first isolated the moderator items from
the items relating to theory and we performed a factor analysis on the first set. Next, we chose
to split the items in two sets: a set of items relating to theory (HRT and SeMa), and another set
relating to the moderator variables. Some constructs could be labeled according to theoretical
constructs and sub-constructs. For the factors relating to HRT, we refer to Weick et al. (1999).
For the factors relating to Scheme, Self and Other, we specifically refer to our relabeling of
SenseMaking in Chapter 4 (Reconceptualized model). Other constructs could not be labeled
according to theoretical constructs and sub-constructs. For these factors we have chosen a new,
best-fitting, label (e.g. Team Orientation). The factors with a sufficiently high internal consistency
(Cronbach’s alpha ≥.60) were aggregated in a compounded indicator. Next, the procedure was
repeated for the items relating to SenseMaking.
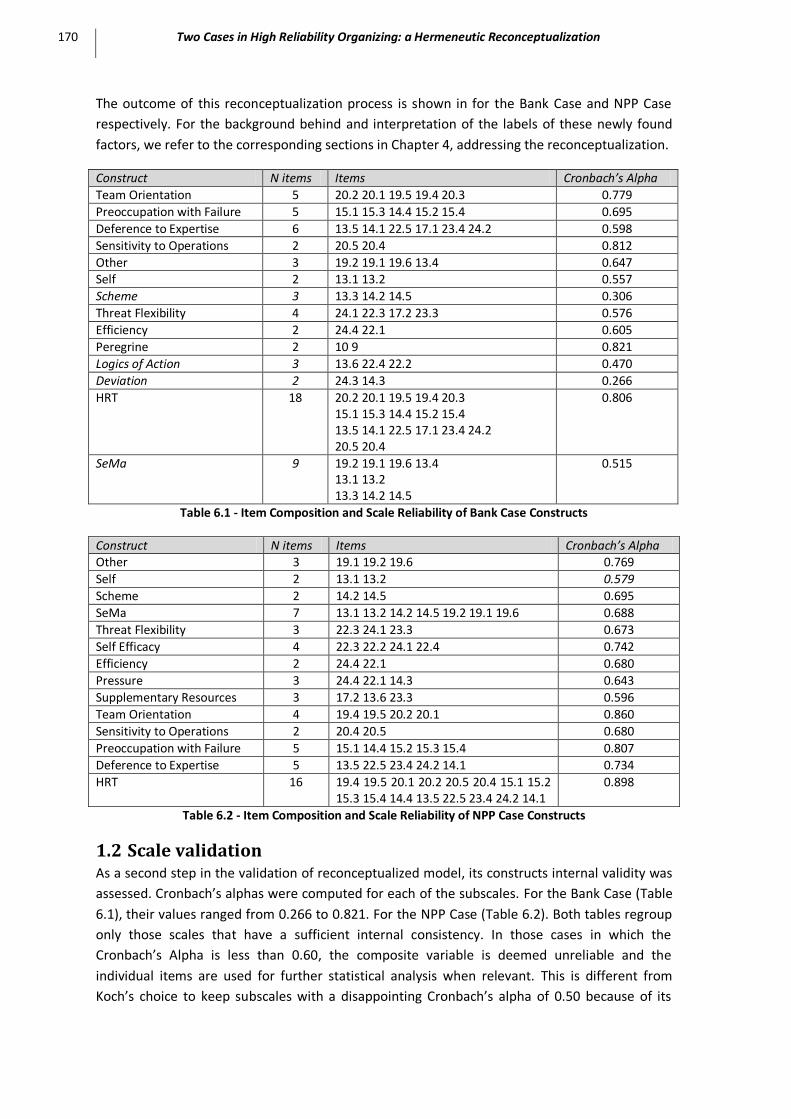
170 Two Cases in High Reliability Organizing: a Hermeneutic Reconceptualization
The outcome of this reconceptualization process is shown in for the Bank Case and NPP Case
respectively. For the background behind and interpretation of the labels of these newly found
factors, we refer to the corresponding sections in Chapter 4, addressing the reconceptualization.
Construct N items Items Cronbach’s Alpha
Team Orientation 5 20.2 20.1 19.5 19.4 20.3 0.779
Preoccupation with Failure 5 15.1 15.3 14.4 15.2 15.4 0.695
Deference to Expertise 6 13.5 14.1 22.5 17.1 23.4 24.2 0.598
Sensitivity to Operations 2 20.5 20.4 0.812
Other 3 19.2 19.1 19.6 13.4 0.647 Self 2 13.1 13.2 0.557
Scheme 3 13.3 14.2 14.5 0.306
Threat Flexibility 4 24.1 22.3 17.2 23.3 0.576
Efficiency 2 24.4 22.1 0.605
Peregrine 2 10 9 0.821
Logics of Action 3 13.6 22.4 22.2 0.470
Deviation 2 24.3 14.3 0.266
HRT 18 20.2 20.1 19.5 19.4 20.3 15.1 15.3 14.4 15.2 15.4 13.5 14.1 22.5 17.1 23.4 24.2 20.5 20.4
0.806
SeMa 9 19.2 19.1 19.6 13.4 13.1 13.2 13.3 14.2 14.5
0.515
Table 6.1 - Item Composition and Scale Reliability of Bank Case Constructs
Construct N items Items Cronbach’s Alpha Other 3 19.1 19.2 19.6 0.769
Self 2 13.1 13.2 0.579
Scheme 2 14.2 14.5 0.695
SeMa 7 13.1 13.2 14.2 14.5 19.2 19.1 19.6 0.688
Threat Flexibility 3 22.3 24.1 23.3 0.673
Self Efficacy 4 22.3 22.2 24.1 22.4 0.742
Efficiency 2 24.4 22.1 0.680
Pressure 3 24.4 22.1 14.3 0.643
Supplementary Resources 3 17.2 13.6 23.3 0.596
Team Orientation 4 19.4 19.5 20.2 20.1 0.860
Sensitivity to Operations 2 20.4 20.5 0.680
Preoccupation with Failure 5 15.1 14.4 15.2 15.3 15.4 0.807
Deference to Expertise 5 13.5 22.5 23.4 24.2 14.1 0.734
HRT 16 19.4 19.5 20.1 20.2 20.5 20.4 15.1 15.2 15.3 15.4 14.4 13.5 22.5 23.4 24.2 14.1
0.898
Table 6.2 - Item Composition and Scale Reliability of NPP Case Constructs
1.2 Scale validation As a second step in the validation of reconceptualized model, its constructs internal validity was
assessed. Cronbach’s alphas were computed for each of the subscales. For the Bank Case (Table
6.1), their values ranged from 0.266 to 0.821. For the NPP Case (Table 6.2). Both tables regroup
only those scales that have a sufficient internal consistency. In those cases in which the
Cronbach’s Alpha is less than 0.60, the composite variable is deemed unreliable and the
individual items are used for further statistical analysis when relevant. This is different from
Koch’s choice to keep subscales with a disappointing Cronbach’s alpha of 0.50 because of its
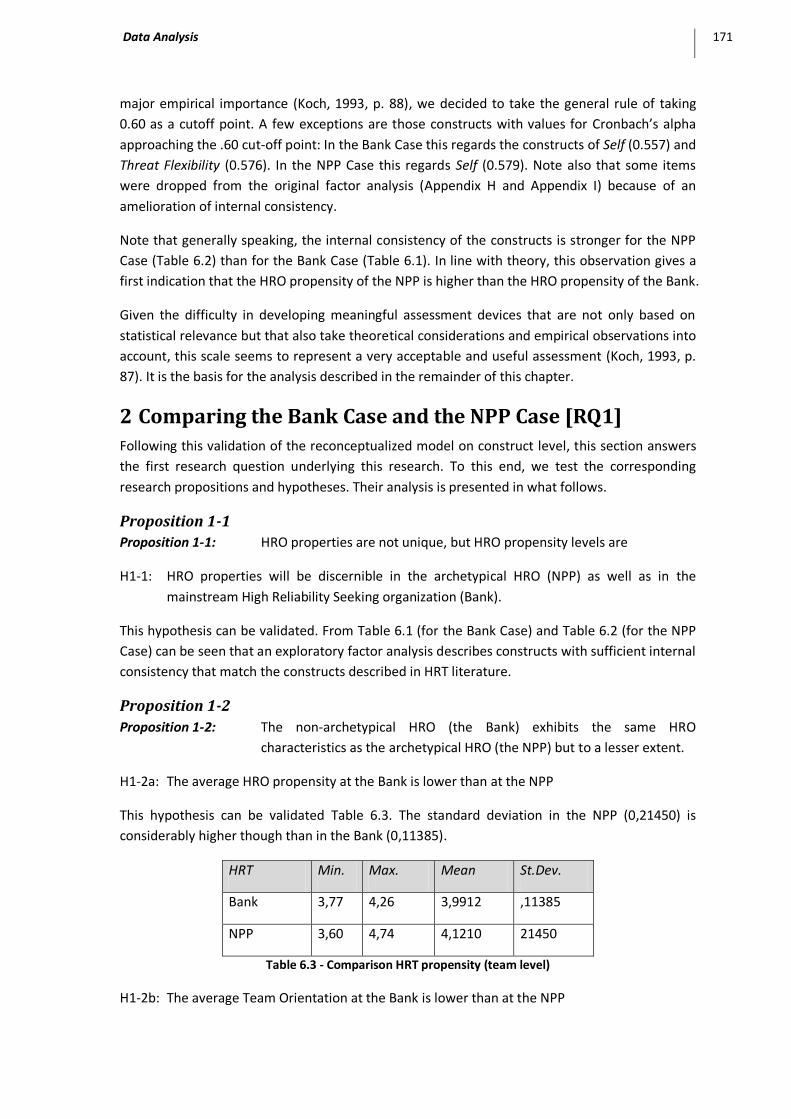
Data Analysis 171
major empirical importance (Koch, 1993, p. 88), we decided to take the general rule of taking
0.60 as a cutoff point. A few exceptions are those constructs with values for Cronbach’s alpha
approaching the .60 cut-off point: In the Bank Case this regards the constructs of Self (0.557) and
Threat Flexibility (0.576). In the NPP Case this regards Self (0.579). Note also that some items
were dropped from the original factor analysis (Appendix H and Appendix I) because of an
amelioration of internal consistency.
Note that generally speaking, the internal consistency of the constructs is stronger for the NPP
Case (Table 6.2) than for the Bank Case (Table 6.1). In line with theory, this observation gives a
first indication that the HRO propensity of the NPP is higher than the HRO propensity of the Bank.
Given the difficulty in developing meaningful assessment devices that are not only based on
statistical relevance but that also take theoretical considerations and empirical observations into
account, this scale seems to represent a very acceptable and useful assessment (Koch, 1993, p.
87). It is the basis for the analysis described in the remainder of this chapter.
2 Comparing the Bank Case and the NPP Case [RQ1]
Following this validation of the reconceptualized model on construct level, this section answers
the first research question underlying this research. To this end, we test the corresponding
research propositions and hypotheses. Their analysis is presented in what follows.
Proposition 1-1
Proposition 1-1: HRO properties are not unique, but HRO propensity levels are
H1-1: HRO properties will be discernible in the archetypical HRO (NPP) as well as in the
mainstream High Reliability Seeking organization (Bank).
This hypothesis can be validated. From Table 6.1 (for the Bank Case) and Table 6.2 (for the NPP
Case) can be seen that an exploratory factor analysis describes constructs with sufficient internal
consistency that match the constructs described in HRT literature.
Proposition 1-2
Proposition 1-2: The non-archetypical HRO (the Bank) exhibits the same HRO
characteristics as the archetypical HRO (the NPP) but to a lesser extent.
H1-2a: The average HRO propensity at the Bank is lower than at the NPP
This hypothesis can be validated Table 6.3. The standard deviation in the NPP (0,21450) is
considerably higher though than in the Bank (0,11385).
HRT Min. Max. Mean St.Dev.
Bank 3,77 4,26 3,9912 ,11385
NPP 3,60 4,74 4,1210 21450
Table 6.3 - Comparison HRT propensity (team level)
H1-2b: The average Team Orientation at the Bank is lower than at the NPP

172 Two Cases in High Reliability Organizing: a Hermeneutic Reconceptualization
This hypothesis could be validated (Table 6.4).
Case Min. Max. Mean Std. Deviation
HRT Bank 3,77 4,26 3,9912 ,11385
NPP 3,60 4,74 4,1210 ,21450
Team Orientation Bank 3,55 4,60 4,1633 ,22298
NPP 3,75 5,00 4,2506 ,32341
Preoccupation with Failure Bank 3,75 4,47 4,1451 ,14693
NPP 3,60 4,90 4,2879 ,28058
Deference to Expertise Bank 3,36 4,20 3,7556 ,19547
NPP 3,47 4,60 3,8375 ,25530
Sensitivity to Operations Bank 3,50 4,40 3,8832 ,22418
NPP 3,67 5,00 4,1704 ,32131
SenseMaking NPP 3,24 4,07 3,6543 ,22483
Bank 3,32 4,05 3,7293 ,17447
Other Bank 3,19 4,25 3,8414 ,27070
NPP 3,44 4,50 4,0374 ,33292
Self Bank 3,00 4,50 3,8453 ,30591
NPP 3,50 4,50 4,1237 ,28036
Scheme Bank 2,78 4,13 3,5025 ,27394
NPP 1,25 3,50 2,5824 ,52405
Moderator variables
Deviation Bank 2,50 3,60 3,0685 ,24605
NPP 3,00 4,33 3,7222 ,38616
Efficiency Bank 3,00 4,18 3,5978 ,33402
NPP 2,60 3,86 3,2112 ,33684
Threat Flexibility Bank 3,29 4,20 3,6941 ,21486
NPP 3,22 4,50 3,6671 ,30368
Table 6.4 - Comparison between cases on team construct level

Data Analysis 173
H1-2c: The average Threat Flexibility at the Bank is lower than at the NPP
This hypothesis could not be validated (Table 6.4), but the difference is only marginal (Bank:
3,6941 vs. NPP: 3,6671).
H1-2d: The average Preoccupation with Failure at the Bank is lower than at the NPP
This hypothesis could be validated (Table 6.4) (Bank: 4,1451 vs. NPP: 4,2879).
H1-2e: The average Sensitivity to Operations at the Bank is lower than at the NPP
This hypothesis could be validated (Table 6.4 ) (Bank: 3,8832 vs. NPP: 4,1704).
H1-2f: The average Deference to Expertise at the Bank is lower than at the NPP
This hypothesis could be validated (Table 6.4) (Bank: 3,7556 vs. NPP: 3,8375)
Proposition 1-3
Proposition 1-3: The higher the requisite variety of a team, the higher its HRO propensity
H1-3a: Teams using richer media exhibit a higher HRO propensity.
For the Bank Case, this hypothesis can be validated at an acceptable level of significance (0.034)
(Table 6.6) where teams that rely more on face-to-face communication exhibit a higher HRO
propensity (3,9530 vs. 4,0315) (Table 6.5). Drilling down to the level of the HRT sub-constructs,
we see that especially Deference to Expertise (p = 0.031 with means: 3,6889 vs. 3,8261) and
Sensitivity to Operations (p = 0,008) with means: 3,7906 vs. 3,9809) are accountable for this
observation.
N Mean Std. Deviation Std. Error
95% Confidence Interval for Mean Min. Max.
Lower Bound
Upper Bound
Team Orientation L 19 4,1275 ,21358 ,04900 4,0246 4,2305 3,55 4,53
H 18 4,2011 ,23248 ,05480 4,0855 4,3167 3,80 4,60
Total 37 4,1633 ,22298 ,03666 4,0890 4,2376 3,55 4,60
Preoccupation with Failure L 19 4,1605 ,14445 ,03314 4,0909 4,2302 3,87 4,47
H 18 4,1287 ,15189 ,03580 4,0532 4,2042 3,75 4,40
Total 37 4,1451 ,14693 ,02415 4,0961 4,1940 3,75 4,47
Deference to Expertise L 19 3,6889 ,18149 ,04164 3,6014 3,7764 3,36 4,06
H 18 3,8261 ,18919 ,04459 3,7320 3,9202 3,50 4,20
Total 37 3,7556 ,19547 ,03213 3,6905 3,8208 3,36 4,20
SO L 19 3,7906 ,18226 ,04181 3,7028 3,8785 3,50 4,10

174 Two Cases in High Reliability Organizing: a Hermeneutic Reconceptualization
H 18 3,9809 ,22711 ,05353 3,8679 4,0938 3,63 4,40
Total 37 3,8832 ,22418 ,03686 3,8084 3,9579 3,50 4,40
SeMa L 19 3,7499 ,17364 ,03984 3,6662 3,8336 3,32 3,96
H 18 3,7075 ,17765 ,04187 3,6191 3,7958 3,37 4,05
Total 37 3,7293 ,17447 ,02868 3,6711 3,7874 3,32 4,05
Other L 19 3,8855 ,22635 ,05193 3,7764 3,9946 3,19 4,25
H 18 3,7948 ,31056 ,07320 3,6403 3,9492 3,20 4,25
Total 37 3,8414 ,27070 ,04450 3,7511 3,9316 3,19 4,25
Self L 19 3,9422 ,26196 ,06010 3,8160 4,0685 3,50 4,50
H 18 3,7429 ,32234 ,07598 3,5826 3,9032 3,00 4,13
Total 37 3,8453 ,30591 ,05029 3,7433 3,9473 3,00 4,50
Scheme L 19 3,4409 ,27764 ,06369 3,3071 3,5747 2,78 3,92
H 18 3,5675 ,26188 ,06173 3,4373 3,6977 3,06 4,13
Total 37 3,5025 ,27394 ,04504 3,4111 3,5938 2,78 4,13
Threat Flexibility L 19 3,6543 ,20314 ,04660 3,5564 3,7522 3,29 4,08
H 18 3,7362 ,22457 ,05293 3,6245 3,8478 3,38 4,20
Total 37 3,6941 ,21486 ,03532 3,6225 3,7658 3,29 4,20
Efficiency L 19 3,5230 ,26889 ,06169 3,3934 3,6526 3,00 4,08
H 18 3,6766 ,38324 ,09033 3,4861 3,8672 3,06 4,18
Total 37 3,5978 ,33402 ,05491 3,4864 3,7091 3,00 4,18
Logics of Action L 19 3,8116 ,21911 ,05027 3,7060 3,9172 3,33 4,22
H 18 3,8181 ,26344 ,06209 3,6871 3,9491 3,25 4,44
Total 37 3,8147 ,23830 ,03918 3,7353 3,8942 3,25 4,44
Deviation L 19 2,9814 ,26027 ,05971 2,8560 3,1069 2,50 3,40
H 18 3,1603 ,19767 ,04659 3,0620 3,2586 2,92 3,60
Total 37 3,0685 ,24605 ,04045 2,9864 3,1505 2,50 3,60
HRT L 19 3,9530 ,08256 ,01894 3,9133 3,9928 3,78 4,15
H 18 4,0315 ,12993 ,03062 3,9669 4,0961 3,77 4,26
Total 37 3,9912 ,11385 ,01872 3,9533 4,0292 3,77 4,26
Table 6.5 - ANOVA Descriptives for Face-to-face Communication (Bank)

Data Analysis 175
Sum of
Squares df
Mean
Square F Sig.
Team Orientation Between Groups ,050 1 ,050 1,006 ,323
Within Groups 1,740 35 ,050
Total 1,790 36
Preoccupation with Failure Between Groups ,009 1 ,009 ,427 ,518
Within Groups ,768 35 ,022
Total ,777 36
Deference to Expertise Between Groups ,174 1 ,174 5,071 ,031
Within Groups 1,201 35 ,034
Total 1,375 36
SO Between Groups ,335 1 ,335 7,939 ,008
Within Groups 1,475 35 ,042
Total 1,809 36
SeMa Between Groups ,017 1 ,017 ,540 ,467
Within Groups 1,079 35 ,031
Total 1,096 36
Other Between Groups ,076 1 ,076 1,040 ,315
Within Groups 2,562 35 ,073
Total 2,638 36
Self Between Groups ,367 1 ,367 4,283 ,046
Within Groups 3,002 35 ,086
Total 3,369 36
Scheme Between Groups ,148 1 ,148 2,031 ,163
Within Groups 2,553 35 ,073
Total 2,702 36
Threat Flexibility Between Groups ,062 1 ,062 1,354 ,252
Within Groups 1,600 35 ,046
Total 1,662 36
Efficiency Between Groups ,218 1 ,218 2,010 ,165

176 Two Cases in High Reliability Organizing: a Hermeneutic Reconceptualization
Within Groups 3,798 35 ,109
Total 4,016 36
Logics of Action Between Groups ,000 1 ,000 ,007 ,935
Within Groups 2,044 35 ,058
Total 2,044 36
Deviation Between Groups ,296 1 ,296 5,497 ,025
Within Groups 1,884 35 ,054
Total 2,179 36
HRT Between Groups ,057 1 ,057 4,863 ,034
Within Groups ,410 35 ,012
Total ,467 36
Table 6.6 - ANOVA for Face-to-face Communication (Bank)
For the NPP Case, this hypothesis can be validated at an acceptable level of significance ( 0.031)
(Table 6.16) for the NPP Case where teams that rely more on face-to-face communication
exhibit a higher HRO propensity (4,0283 vs. 4,2136). Drilling down to the level of the HRT sub-
constructs, we see that especially Team Orientation (p = 0.012 with means: 4,0909 vs. 4,4104)
and Sensitivity to Operations (p = 0.061 with means: 4,0485 vs. 4,2924) are accountable for this
observation.
H1-3b: More experienced teams exhibit a higher HRO propensity.
This hypothesis cannot be validated at an acceptable level of significance (Table 6.7).
Sum of
Squares df
Mean
Square F Sig.
Team Orientation Between Groups ,000 1 ,000 ,002 ,968
Within Groups 2,406 22 ,109
Total 2,406 23
Sensitivity to Operations Between Groups ,071 1 ,071 ,680 ,419
Within Groups 2,303 22 ,105
Total 2,375 23
Preoccupation with Failure Between Groups ,001 1 ,001 ,016 ,900
Within Groups 1,809 22 ,082
Total 1,811 23

Data Analysis 177
Deference to Expertise Between Groups ,000 1 ,000 ,000 1,000
Within Groups 1,499 22 ,068
Total 1,499 23
HRT Between Groups ,004 1 ,004 ,076 ,785
Within Groups 1,055 22 ,048
Total 1,058 23
Other Between Groups ,020 1 ,020 ,173 ,681
Within Groups 2,529 22 ,115
Total 2,549 23
Self Between Groups ,009 1 ,009 ,110 ,743
Within Groups 1,799 22 ,082
Total 1,808 23
Scheme Between Groups ,295 1 ,295 1,079 ,310
Within Groups 6,021 22 ,274
Total 6,317 23
SeMa Between Groups ,001 1 ,001 ,010 ,923
Within Groups 1,162 22 ,053
Total 1,163 23
Threat Flexibility Between Groups ,024 1 ,024 ,250 ,622
Within Groups 2,097 22 ,095
Total 2,121 23
Efficiency Between Groups ,224 1 ,224 2,066 ,165
Within Groups 2,386 22 ,108
Total 2,610 23
Pressure Between Groups ,109 1 ,109 1,163 ,292
Within Groups 2,061 22 ,094
Total 2,170 23
SupRes Between Groups ,120 1 ,120 1,185 ,288
Within Groups 2,231 22 ,101

178 Two Cases in High Reliability Organizing: a Hermeneutic Reconceptualization
Total 2,352 23
Deviation Between Groups ,111 1 ,111 ,736 ,400
Within Groups 3,319 22 ,151
Total 3,430 23
Table 6.7 - ANOVA for Experience (NPP)
Proposition 1-4
Propostion 1-4: The higher the requisite variety of a team, the higher its SeMa
propensity
H1-4a: Teams using richer media will exhibit a higher SeMa propensity.
H1-4b: More experienced teams exhibit a higher SeMa propensity.
In the Bank Case, we found no proof for this assertion at an acceptable significance for the SeMa
root construct, but when drilling down to the level of the sub-constructs, at a significance of
0.032 (Table 6.8), a falsification for the hypothesis could be provided. Table 6.9 shows that
teams a lower score on Scheme, are more experienced on average than teams exhibiting a
higher score on Scheme (8,8755 vs. 6,0127). In the NPP Case, no acceptable level of significance
allowed for a reliable interpretation, or regarding the SeMa root, nor the SeMa sub-constructs.
Sum of
Squares df Mean Square F Sig.
Between Groups 75,753 1 75,753 5,014 ,032
Within Groups 528,742 35 15,107
Total 604,495 36
Table 6.8 - ANOVA for Experience vs. SeMa Scheme (Bank)
N Mean
Std.
Deviation Std. Error
95% Confidence Interval for
Mean
Minimum Maximum Lower Bound Upper Bound
L 19 8,8755 4,90581 1,12547 6,5109 11,2400 3,00 23,33
H 18 6,0127 2,37061 ,55876 4,8338 7,1916 3,41 11,33
Total 37 7,4828 4,09775 ,67367 6,1165 8,8490 3,00 23,33
Table 6.9 - ANOVA Descriptive Statistics for Experience vs. SeMa Scheme (Bank)
Proposition 1-5
Proposition 1-5: The non-archetypical HRO (the Bank) exhibits the same HRO
characteristics as the archetypical HRO (the NPP) but exhibits a lower
variance.
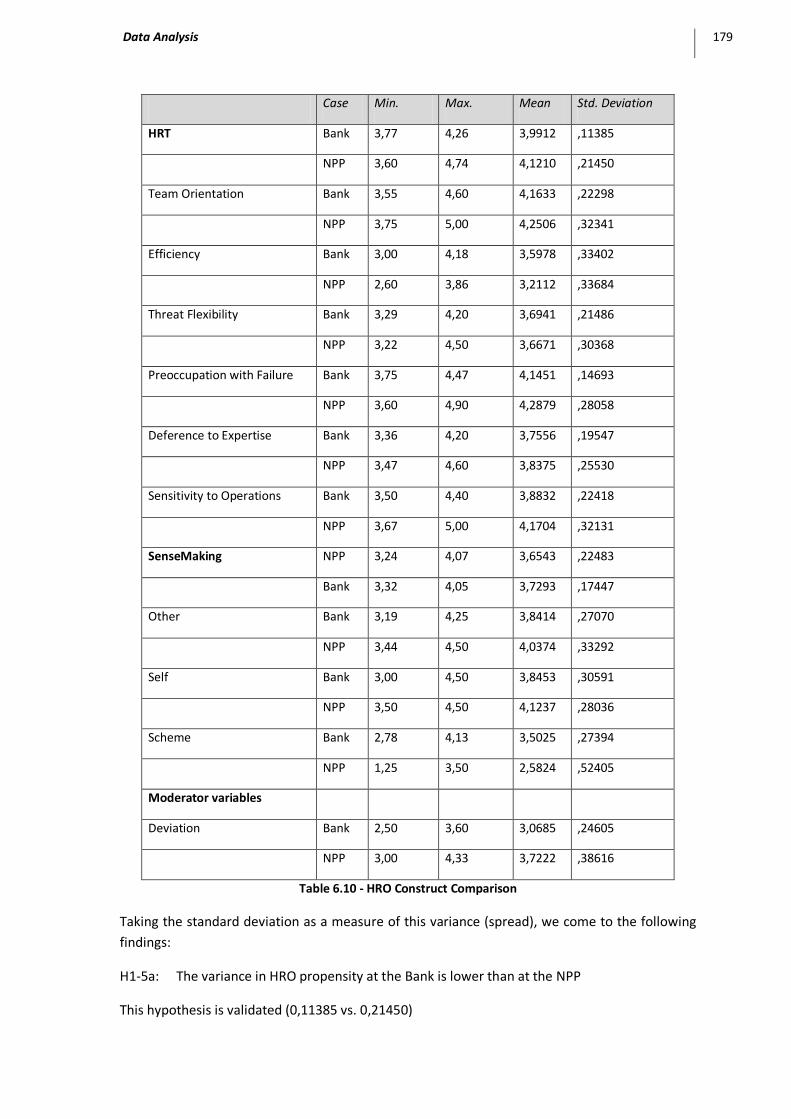
Data Analysis 179
Case Min. Max. Mean Std. Deviation
HRT Bank 3,77 4,26 3,9912 ,11385
NPP 3,60 4,74 4,1210 ,21450
Team Orientation Bank 3,55 4,60 4,1633 ,22298
NPP 3,75 5,00 4,2506 ,32341
Efficiency Bank 3,00 4,18 3,5978 ,33402
NPP 2,60 3,86 3,2112 ,33684
Threat Flexibility Bank 3,29 4,20 3,6941 ,21486
NPP 3,22 4,50 3,6671 ,30368
Preoccupation with Failure Bank 3,75 4,47 4,1451 ,14693
NPP 3,60 4,90 4,2879 ,28058
Deference to Expertise Bank 3,36 4,20 3,7556 ,19547
NPP 3,47 4,60 3,8375 ,25530
Sensitivity to Operations Bank 3,50 4,40 3,8832 ,22418
NPP 3,67 5,00 4,1704 ,32131
SenseMaking NPP 3,24 4,07 3,6543 ,22483
Bank 3,32 4,05 3,7293 ,17447
Other Bank 3,19 4,25 3,8414 ,27070
NPP 3,44 4,50 4,0374 ,33292
Self Bank 3,00 4,50 3,8453 ,30591
NPP 3,50 4,50 4,1237 ,28036
Scheme Bank 2,78 4,13 3,5025 ,27394
NPP 1,25 3,50 2,5824 ,52405
Moderator variables
Deviation Bank 2,50 3,60 3,0685 ,24605
NPP 3,00 4,33 3,7222 ,38616
Table 6.10 - HRO Construct Comparison
Taking the standard deviation as a measure of this variance (spread), we come to the following
findings:
H1-5a: The variance in HRO propensity at the Bank is lower than at the NPP
This hypothesis is validated (0,11385 vs. 0,21450)

180 Two Cases in High Reliability Organizing: a Hermeneutic Reconceptualization
H1-5b: The variance in Team Orientation at the Bank is lower than at the NPP
This hypothesis is validated (0,22298 vs. 0,32341)
H1-5c: The variance in Threat Flexibility at the Bank is lower than at the NPP
This hypothesis is validated (0,21486 vs. 0,30368)
H1-5d: The variance in Preoccupation with Failure at the Bank is lower than at the NPP
This hypothesis is validated (0,14693 vs. 0,28058)
H1-1-5e: The variance in Sensitivity to Operations at the Bank is lower than at the NPP
This hypothesis is validated (0,22418 vs. 0,32131)
H1-5f: The variance in Deference to Expertise at the Bank is lower than at the NPP
This hypothesis is validated (0,19547 vs. 0,25530)
Proposition 1-6
Proposition 1-6: The non-archetypical HRO (the Bank) exhibits the same SeMa
characteristics as the archetypical HRO (the NPP) but exhibits a lower
variance.
H1-6a: The variance in SenseMaking propensity at the Bank is lower than at the NPP
This hypothesis is falsified (0,22483 vs. 0,17447)
At the level of the root SeMa construct, this hypothesis is falsified. However, two out of three of
its underlying sub-constructs can be validated.
H1-6b: The variance in Self propensity at the Bank is lower than at the NPP
This hypothesis is falsified (0,30591 vs. 0,28036)
H1-6c: The variance in Other propensity at the Bank is lower than at the NPP
This hypothesis is validated (0,27070 vs. 0,33292)
H1-6d: The variance in Scheme propensity at the Bank is lower than at the NPP
This hypothesis is validated (0,27394 vs. 0,52405)
Proposition 1-7
Proposition 1-7: The constructs of Mindfulness and Resilience interrelate
Another presumption seems to be that the different constituting HRO factors are independent
from each other in the sense that they do not conflict. Being preoccupied with failure in
combination with being reluctant to simplify poses no problem. This is in conflict with what has
been suggested by NAT, namely that since HROs operate in a setting of complexity and tight-
coupling, it is cognitively impossible to “predict everything and set up systems that alert them to

Data Analysis 181
small changes so that they can prevent these small changes from becoming big
problems”(Longstaff, 2003, p. 19).
H1-7a: The higher a team’s Preoccupation with Failure, the lower its Deference to Expertise.
We have not been able to validate this hypothesis in the Bank Case at an acceptable level of
significance (Table 6.13). In the NPP Case, we see that at an acceptable significance (p 0.029)
(Table 6.14) the hypothesis could be falsified. A low degree of Deference to Expertise matches a
low degree of Preoccupation with Failure and vice versa (4,1652 vs. 4,4105).
H1-7b: Being mindful is a prerequisite for being resilient.
We have been able to validate this hypothesis (p 0.047) (See: Table 6.11) for the Bank Case as
teams with a low degree of Deference to Expertise exhibit a low score on Sensitivity to
Operations (3,8123 vs. 3,9580) (Table 6.12). It has been impossible to validate the hypothesis for
the NPP Case at an acceptable level of significance (Table 6.14).
Sum of
Squares df Mean Square F Sig.
Team Orientation Between Groups ,034 1 ,034 ,675 ,417
Within Groups 1,756 35 ,050
Total 1,790 36
Preoccupation with
Failure
Between Groups ,000 1 ,000 ,015 ,902
Within Groups ,777 35 ,022
Total ,777 36
Deference to Expertise Between Groups ,746 1 ,746 41,470 ,000
Within Groups ,630 35 ,018
Total 1,375 36
SO Between Groups ,196 1 ,196 4,256 ,047
Within Groups 1,613 35 ,046
Total 1,809 36
SeMa Between Groups ,104 1 ,104 3,655 ,064
Within Groups ,992 35 ,028
Total 1,096 36
Other Between Groups ,093 1 ,093 1,278 ,266
Within Groups 2,545 35 ,073
Total 2,638 36

182 Two Cases in High Reliability Organizing: a Hermeneutic Reconceptualization
Self Between Groups ,003 1 ,003 ,033 ,857
Within Groups 3,366 35 ,096
Total 3,369 36
Scheme Between Groups ,272 1 ,272 3,920 ,056
Within Groups 2,429 35 ,069
Total 2,702 36
Threat Flexibility Between Groups ,306 1 ,306 7,895 ,008
Within Groups 1,356 35 ,039
Total 1,662 36
Efficiency Between Groups ,736 1 ,736 7,854 ,008
Within Groups 3,280 35 ,094
Total 4,016 36
Logics of Action Between Groups ,081 1 ,081 1,437 ,239
Within Groups 1,964 35 ,056
Total 2,044 36
Deviation Between Groups ,000 1 ,000 ,000 ,986
Within Groups 2,179 35 ,062
Total 2,179 36
HRT Between Groups ,155 1 ,155 17,369 ,000
Within Groups ,312 35 ,009
Total ,467 36
Table 6.11 - ANOVA for Deference to expertise (Bank)

Data Analysis 183
N Mean
Std.
Dev.
Std.
Error
95% Confidence
Interval for Mean
Min. Max.
Lower
Bound
Upper
Bound
Team Orientation L 19 4,1338 ,22123 ,05075 4,0272 4,2405 3,55 4,53
H 18 4,1944 ,22688 ,05348 4,0816 4,3072 3,80 4,60
Total 37 4,1633 ,22298 ,03666 4,0890 4,2376 3,55 4,60
Preoccupation with
Failure
L 19 4,1421 ,16223 ,03722 4,0639 4,2203 3,75 4,47
H 18 4,1482 ,13352 ,03147 4,0818 4,2146 3,87 4,40
Total 37 4,1451 ,14693 ,02415 4,0961 4,1940 3,75 4,47
Deference to
Expertise
L 19 3,6174 ,13083 ,03001 3,5544 3,6805 3,36 3,75
H 18 3,9015 ,13750 ,03241 3,8331 3,9699 3,76 4,20
Total 37 3,7556 ,19547 ,03213 3,6905 3,8208 3,36 4,20
SO L 19 3,8123 ,19367 ,04443 3,7190 3,9057 3,60 4,29
H 18 3,9580 ,23490 ,05537 3,8412 4,0748 3,50 4,40
Total 37 3,8832 ,22418 ,03686 3,8084 3,9579 3,50 4,40
SeMa L 19 3,6778 ,17752 ,04073 3,5922 3,7633 3,32 3,93
H 18 3,7836 ,15811 ,03727 3,7050 3,8623 3,47 4,05
Total 37 3,7293 ,17447 ,02868 3,6711 3,7874 3,32 4,05
Other L 19 3,7926 ,30261 ,06942 3,6467 3,9385 3,19 4,25
H 18 3,8929 ,22967 ,05413 3,7786 4,0071 3,36 4,25
Total 37 3,8414 ,27070 ,04450 3,7511 3,9316 3,19 4,25
Self L 19 3,8362 ,26877 ,06166 3,7067 3,9658 3,33 4,17
H 18 3,8548 ,34856 ,08216 3,6815 4,0281 3,00 4,50
Total 37 3,8453 ,30591 ,05029 3,7433 3,9473 3,00 4,50
Scheme L 19 3,4190 ,27388 ,06283 3,2870 3,5510 2,78 3,74
H 18 3,5906 ,25196 ,05939 3,4653 3,7159 3,03 4,13
Total 37 3,5025 ,27394 ,04504 3,4111 3,5938 2,78 4,13
Threat Flexibility L 19 3,6056 ,16531 ,03792 3,5260 3,6853 3,29 3,88

184 Two Cases in High Reliability Organizing: a Hermeneutic Reconceptualization
H 18 3,7876 ,22547 ,05314 3,6754 3,8997 3,35 4,20
Total 37 3,6941 ,21486 ,03532 3,6225 3,7658 3,29 4,20
Efficiency L 19 3,4605 ,29690 ,06811 3,3174 3,6036 3,00 4,11
H 18 3,7427 ,31564 ,07440 3,5857 3,8996 3,10 4,18
Total 37 3,5978 ,33402 ,05491 3,4864 3,7091 3,00 4,18
Logics of Action L 19 3,7693 ,21399 ,04909 3,6662 3,8725 3,25 4,22
H 18 3,8627 ,25890 ,06102 3,7340 3,9915 3,33 4,44
Total 37 3,8147 ,23830 ,03918 3,7353 3,8942 3,25 4,44
Deviation L 19 3,0677 ,24524 ,05626 2,9495 3,1859 2,67 3,40
H 18 3,0692 ,25401 ,05987 2,9429 3,1955 2,50 3,60
Total 37 3,0685 ,24605 ,04045 2,9864 3,1505 2,50 3,60
HRT L 19 3,9283 ,08186 ,01878 3,8888 3,9677 3,77 4,10
H 18 4,0577 ,10605 ,02500 4,0049 4,1104 3,88 4,26
Total 37 3,9912 ,11385 ,01872 3,9533 4,0292 3,77 4,26
Table 6.12 - Descriptives for ANOVA for Deference to Expertise (Bank)
We have been able to validate this hypothesis (p 0.029) (See: Table 6.14) for the NPP Case as
teams with a lower Deference to Expertise exhibit a lower degree of Preoccupation with Failure
(4,1652 vs. 4,4105).
Sum of
Squares df Mean Square F Sig.
Team Orientation Between Groups ,053 1 ,053 1,059 ,310
Within Groups 1,737 35 ,050
Total 1,790 36
Deference to Expertise Between Groups ,007 1 ,007 ,170 ,683
Within Groups 1,369 35 ,039
Total 1,375 36
Sensitivity to Operations Between Groups ,013 1 ,013 ,259 ,614
Within Groups 1,796 35 ,051
Table 6.13 - ANOVA for Preoccupaton with failure vs. Deference to Expertise (Bank)

Data Analysis 185
Sum of
Squares df Mean Square F Sig.
Threat Flexibility Between Groups ,872 1 ,872 15,347 ,001
Within Groups 1,249 22 ,057
Total 2,121 23
Efficiency Between Groups ,510 1 ,510 5,341 ,031
Within Groups 2,100 22 ,095
Total 2,610 23
Pressure Between Groups ,257 1 ,257 2,954 ,100
Within Groups 1,913 22 ,087
Total 2,170 23
SupRes Between Groups ,269 1 ,269 2,842 ,106
Within Groups 2,083 22 ,095
Total 2,352 23
Deviation Between Groups ,204 1 ,204 1,392 ,251
Within Groups 3,226 22 ,147
Total 3,430 23
Team Orientation Between Groups ,051 1 ,051 ,480 ,495
Within Groups 2,354 22 ,107
Total 2,406 23
SO Between Groups ,090 1 ,090 ,871 ,361
Within Groups 2,284 22 ,104
Total 2,375 23
Preoccupation with
Failure
Between Groups ,361 1 ,361 5,478 ,029
Within Groups 1,450 22 ,066
Total 1,811 23
Deference to Expertise Between Groups ,766 1 ,766 22,982 ,000
Within Groups ,733 22 ,033
Total 1,499 23
HRT Between Groups ,309 1 ,309 9,054 ,006

186 Two Cases in High Reliability Organizing: a Hermeneutic Reconceptualization
Within Groups ,750 22 ,034
Total 1,058 23
Other Between Groups ,039 1 ,039 ,344 ,564
Within Groups 2,510 22 ,114
Total 2,549 23
Self Between Groups ,215 1 ,215 2,962 ,099
Within Groups 1,593 22 ,072
Total 1,808 23
Scheme Between Groups ,245 1 ,245 ,889 ,356
Within Groups 6,071 22 ,276
Total 6,317 23
SeMa Between Groups ,017 1 ,017 ,324 ,575
Within Groups 1,146 22 ,052
Total 1,163 23
Table 6.14 - ANOVA for Deference to Expertise vs. Preoccupation with failure (NPP)
N Mean Std. Dev.
Std. Error
95% Confidence Interval for Mean Min.
Max. Lower Bound
Upper Bound
Threat Flexibility L 12 3,4765 ,18616 ,05374 3,3582 3,5948 3,22 3,72
H 12 3,8577 ,28095 ,08110 3,6792 4,0362 3,44 4,50
Total 24 3,6671 ,30368 ,06199 3,5389 3,7953 3,22 4,50
Efficiency L 12 3,3569 ,29291 ,08456 3,1708 3,5431 2,67 3,86
H 12 3,0655 ,32419 ,09359 2,8595 3,2715 2,60 3,50
Total 24 3,2112 ,33684 ,06876 3,0690 3,3534 2,60 3,86
Pressure L 12 3,2778 ,26924 ,07772 3,1067 3,4488 2,78 3,76
H 12 3,0709 ,31847 ,09193 2,8685 3,2732 2,60 3,56
Total 24 3,1743 ,30715 ,06270 3,0446 3,3040 2,60 3,76
SupRes L 12 3,3701 ,32037 ,09248 3,1666 3,5737 2,76 3,75
H 12 3,5819 ,29443 ,08500 3,3948 3,7689 3,03 4,00
Total 24 3,4760 ,31976 ,06527 3,3410 3,6110 2,76 4,00
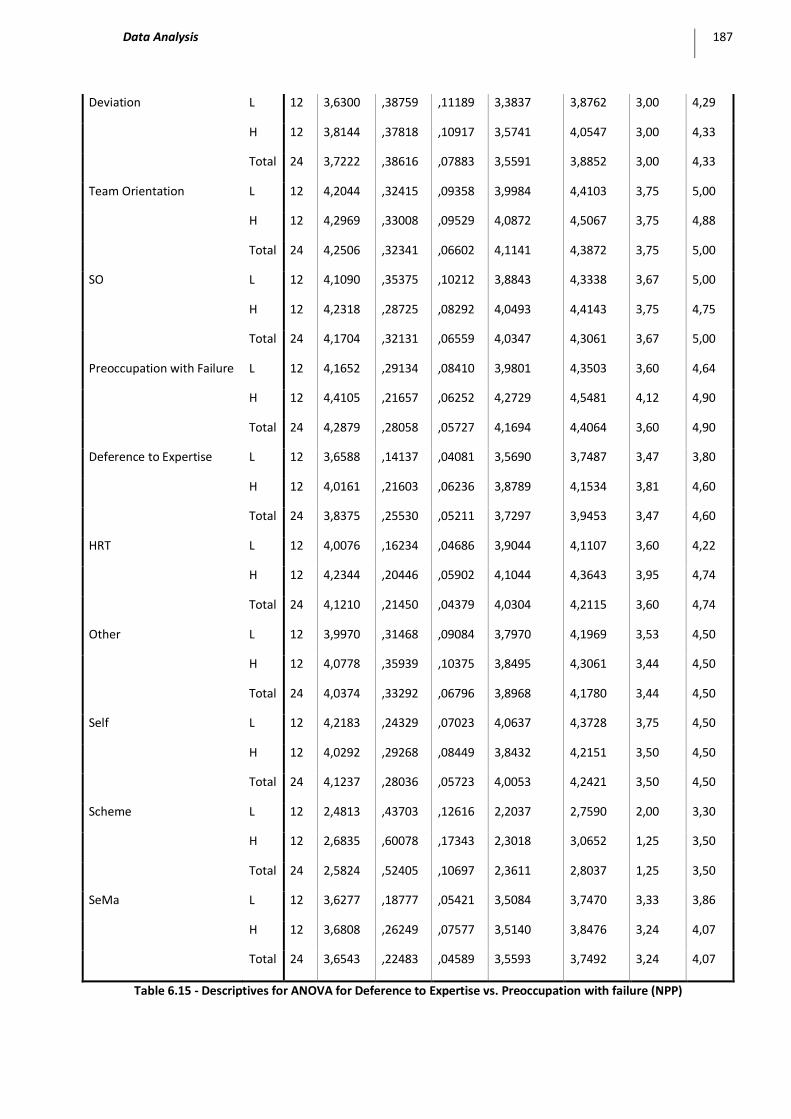
Data Analysis 187
Deviation L 12 3,6300 ,38759 ,11189 3,3837 3,8762 3,00 4,29
H 12 3,8144 ,37818 ,10917 3,5741 4,0547 3,00 4,33
Total 24 3,7222 ,38616 ,07883 3,5591 3,8852 3,00 4,33
Team Orientation L 12 4,2044 ,32415 ,09358 3,9984 4,4103 3,75 5,00
H 12 4,2969 ,33008 ,09529 4,0872 4,5067 3,75 4,88
Total 24 4,2506 ,32341 ,06602 4,1141 4,3872 3,75 5,00
SO L 12 4,1090 ,35375 ,10212 3,8843 4,3338 3,67 5,00
H 12 4,2318 ,28725 ,08292 4,0493 4,4143 3,75 4,75
Total 24 4,1704 ,32131 ,06559 4,0347 4,3061 3,67 5,00
Preoccupation with Failure L 12 4,1652 ,29134 ,08410 3,9801 4,3503 3,60 4,64
H 12 4,4105 ,21657 ,06252 4,2729 4,5481 4,12 4,90
Total 24 4,2879 ,28058 ,05727 4,1694 4,4064 3,60 4,90
Deference to Expertise L 12 3,6588 ,14137 ,04081 3,5690 3,7487 3,47 3,80
H 12 4,0161 ,21603 ,06236 3,8789 4,1534 3,81 4,60
Total 24 3,8375 ,25530 ,05211 3,7297 3,9453 3,47 4,60
HRT L 12 4,0076 ,16234 ,04686 3,9044 4,1107 3,60 4,22
H 12 4,2344 ,20446 ,05902 4,1044 4,3643 3,95 4,74
Total 24 4,1210 ,21450 ,04379 4,0304 4,2115 3,60 4,74
Other L 12 3,9970 ,31468 ,09084 3,7970 4,1969 3,53 4,50
H 12 4,0778 ,35939 ,10375 3,8495 4,3061 3,44 4,50
Total 24 4,0374 ,33292 ,06796 3,8968 4,1780 3,44 4,50
Self L 12 4,2183 ,24329 ,07023 4,0637 4,3728 3,75 4,50
H 12 4,0292 ,29268 ,08449 3,8432 4,2151 3,50 4,50
Total 24 4,1237 ,28036 ,05723 4,0053 4,2421 3,50 4,50
Scheme L 12 2,4813 ,43703 ,12616 2,2037 2,7590 2,00 3,30
H 12 2,6835 ,60078 ,17343 2,3018 3,0652 1,25 3,50
Total 24 2,5824 ,52405 ,10697 2,3611 2,8037 1,25 3,50
SeMa L 12 3,6277 ,18777 ,05421 3,5084 3,7470 3,33 3,86
H 12 3,6808 ,26249 ,07577 3,5140 3,8476 3,24 4,07
Total 24 3,6543 ,22483 ,04589 3,5593 3,7492 3,24 4,07
Table 6.15 - Descriptives for ANOVA for Deference to Expertise vs. Preoccupation with failure (NPP)

188 Two Cases in High Reliability Organizing: a Hermeneutic Reconceptualization
Proposition 1-8
Proposition 1-8: The NPP is more reliable than the Bank
H1-8: The NPP is more reliable than the Bank
It would be relevant if we were able to compare organizational reliability between cases.
Unfortunately, it is not achievable to compare the reliability of both organizations as the
processes under study – however similar – are not identical69. What we can compare however is
the range in of standardized reliability (ZScore). This range is a proxy of reliability as it
corresponds to availability of the incident management/maintenance process as a service. An
overview of this range is provided in Appendix J as Table 0.34, for the reliability of the Bank’s
Incident Management process and in Table 0.35, for the reliability of the NPP’s Maintenance &
Repair process. The conclusion is that the range at the Bank is 3,72076; 5,03739 and 4,39108 for
the handling of urgent, non-urgent and all incidents respectively. For the NPP the corresponding
ranges are 4,88034; 4,64523 and 4,86319. The conclusion therefore is that – based on this
criterion for inter-case comparison of process reliability – the Bank is more reliable than the NPP
with respect to the urgent incidents, less reliable than the NPP in the handling of non-urgent
incidents and again more reliable than the NPP regarding the overall handling of incidents.
Sum of
Squares df
Mean
Square F Sig.
Team Orientation Between Groups ,613 1 ,613 7,516 ,012
Within Groups 1,793 22 ,082
Total 2,406 23
SO Between Groups ,357 1 ,357 3,891 ,061
Within Groups 2,018 22 ,092
Total 2,375 23
Preoccupation with Failure Between Groups ,123 1 ,123 1,609 ,218
Within Groups 1,687 22 ,077
Total 1,811 23
Deference to Expertise Between Groups ,064 1 ,064 ,982 ,332
Within Groups 1,435 22 ,065
Total 1,499 23
HRT Between Groups ,206 1 ,206 5,317 ,031
Within Groups ,852 22 ,039
Total 1,058 23

Data Analysis 189
Other Between Groups ,582 1 ,582 6,503 ,018
Within Groups 1,968 22 ,089
Total 2,549 23
Self Between Groups ,006 1 ,006 ,067 ,797
Within Groups 1,802 22 ,082
Total 1,808 23
Scheme Between Groups ,002 1 ,002 ,008 ,931
Within Groups 6,314 22 ,287
Total 6,317 23
SeMa Between Groups ,081 1 ,081 1,637 ,214
Within Groups 1,082 22 ,049
Total 1,163 23
Threat Flexibility Between Groups ,375 1 ,375 4,728 ,041
Within Groups 1,746 22 ,079
Total 2,121 23
Efficiency Between Groups ,114 1 ,114 1,003 ,328
Within Groups 2,496 22 ,113
Total 2,610 23
Pressure Between Groups ,181 1 ,181 2,001 ,171
Within Groups 1,989 22 ,090
Total 2,170 23
SupRes Between Groups ,692 1 ,692 9,180 ,006
Within Groups 1,659 22 ,075
Total 2,352 23
Deviation Between Groups ,510 1 ,510 3,844 ,063
Within Groups 2,920 22 ,133
Total 3,430 23
Table 6.16 - ANOVA for Face-to-face Communication (NPP)
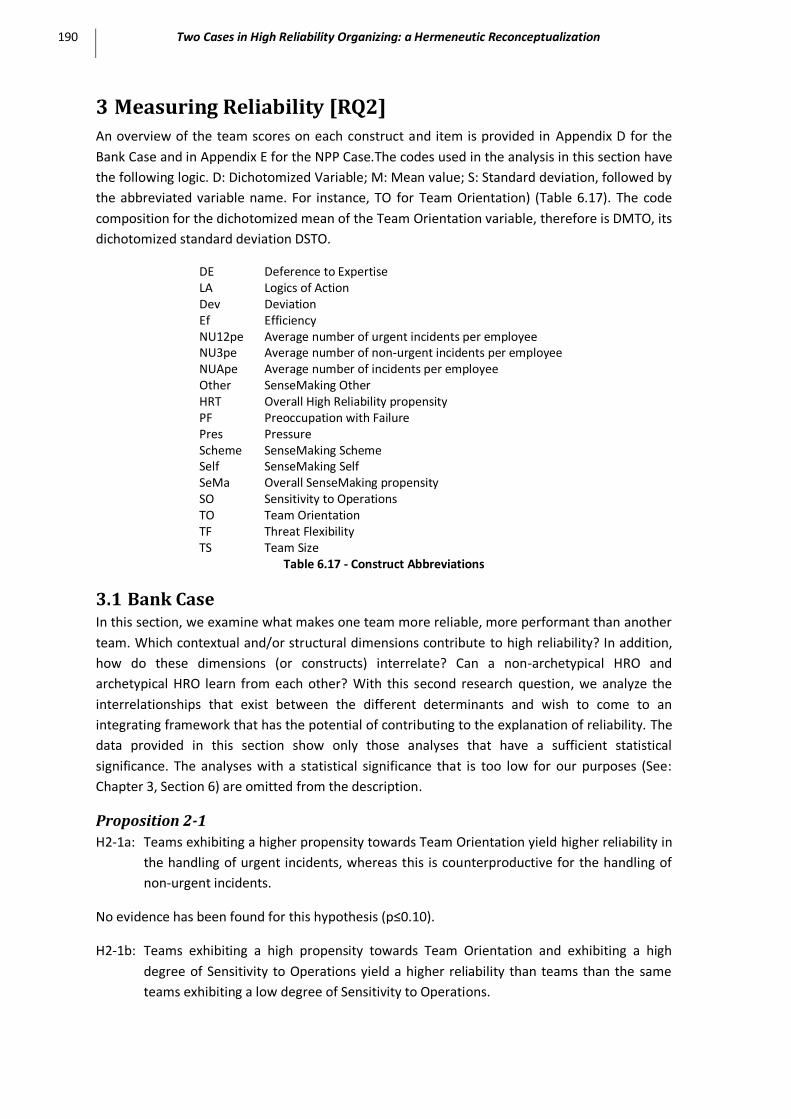
190 Two Cases in High Reliability Organizing: a Hermeneutic Reconceptualization
3 Measuring Reliability [RQ2]
An overview of the team scores on each construct and item is provided in Appendix D for the
Bank Case and in Appendix E for the NPP Case.The codes used in the analysis in this section have
the following logic. D: Dichotomized Variable; M: Mean value; S: Standard deviation, followed by
the abbreviated variable name. For instance, TO for Team Orientation) (Table 6.17). The code
composition for the dichotomized mean of the Team Orientation variable, therefore is DMTO, its
dichotomized standard deviation DSTO.
DE Deference to Expertise LA Logics of Action Dev Deviation Ef Efficiency NU12pe Average number of urgent incidents per employee NU3pe Average number of non-urgent incidents per employee NUApe Average number of incidents per employee Other SenseMaking Other HRT Overall High Reliability propensity PF Preoccupation with Failure Pres Pressure Scheme SenseMaking Scheme Self SenseMaking Self SeMa Overall SenseMaking propensity SO Sensitivity to Operations TO Team Orientation TF Threat Flexibility TS Team Size
Table 6.17 - Construct Abbreviations
3.1 Bank Case In this section, we examine what makes one team more reliable, more performant than another
team. Which contextual and/or structural dimensions contribute to high reliability? In addition,
how do these dimensions (or constructs) interrelate? Can a non-archetypical HRO and
archetypical HRO learn from each other? With this second research question, we analyze the
interrelationships that exist between the different determinants and wish to come to an
integrating framework that has the potential of contributing to the explanation of reliability. The
data provided in this section show only those analyses that have a sufficient statistical
significance. The analyses with a statistical significance that is too low for our purposes (See:
Chapter 3, Section 6) are omitted from the description.
Proposition 2-1
H2-1a: Teams exhibiting a higher propensity towards Team Orientation yield higher reliability in
the handling of urgent incidents, whereas this is counterproductive for the handling of
non-urgent incidents.
No evidence has been found for this hypothesis (p≤0.10).
H2-1b: Teams exhibiting a high propensity towards Team Orientation and exhibiting a high
degree of Sensitivity to Operations yield a higher reliability than teams than the same
teams exhibiting a low degree of Sensitivity to Operations.

Data Analysis 191
We have found no evidence for this hypothesis at p≤0.10.
Case Type Fact1 Fact2 Sig. LL LH HL HH Max Min Spread
Bank PU12 DMTO DM137 0,04 0,57 0,68 0,75 0,47 0,75 0,47 0,28
Bank PU3 DMTO DM137 0,08 0,90 0,96 0,98 0,88 0,98 0,88 0,11
Bank PU3 DMTO DMDE 0,11 0,94 0,89 0,87 0,97 0,97 0,87 0,10
Table 6.18 - Two-way ANOVA for Team Orientation
Case Type Fact1 Fact2 Sig. LL LH HL HH Max Min Spread
Bank PU12 DSTO DM137 0,01 0,76 0,43 0,53 0,64 0,76 0,43 0,33
Bank PU12 DSTO DM10 0,05 0,78 0,47 0,56 0,59 0,78 0,47 0,31
Bank PU12 DSTO DS10 0,06 0,50 0,80 0,59 0,56 0,80 0,50 0,30
Bank PU12 DSTO DSDE 0,04 0,57 0,68 0,73 0,47 0,73 0,47 0,25
Bank PU3 DSTO DSDE 0,06 0,90 0,98 0,96 0,87 0,98 0,87 0,11
Bank PU3 DSTO DM137 0,10 0,98 0,87 0,90 0,94 0,98 0,87 0,11
Table 6.19 - Two-way ANOVA for Spread of Team Orientation
H2-1c: The higher the average Threat Flexibility, the higher the reliability.
Falsification of this hypothesis: For urgent incidents, a low average score on Threat Flexibility
results in the highest reliability (0.67 at p≤0.05).
Case Type Fact1 Fact2 Sig. LL LH HL HH Max Min Spread
Bank PU12 DMTF DMNU12pe 0,10 0,59 0,70 0,30 0,65 0,70 0,30 0,40
Bank PU12 DMTF DMEff 0,03 0,64 0,70 0,32 0,68 0,70 0,32 0,39
Bank PU12 DMTF DM1 0,02 0,61 0,70 0,64 0,36 0,70 0,36 0,34
Bank PU3 DMTF DM1 0,04 0,96 0,95 0,96 0,78 0,96 0,78 0,18
Bank PU3 DMTF DMPF 0,06 0,94 0,96 0,94 0,79 0,96 0,79 0,17
Bank PU3 DMTF DMNU12pe 0,08 0,97 0,94 0,83 0,96 0,97 0,83 0,14
Bank PU12 DMTF
0,05 0,67 0,50
0,67 0,50 0,17
Table 6.20 - Two-way ANOVA for Threat Flexibility
H2-1d: Teams that operate in a less restrictive (more supportive) organizational climate perform
better than teams that do not (Smith-Crowe, Burke, & Landis 2003).

192 Two Cases in High Reliability Organizing: a Hermeneutic Reconceptualization
The construct covering the degree of supportiveness is Threat Flexibility.
We have found evidence (p≤0.05) for the falsification of this hypothesis, namely that where the
handling of urgent incidents (threat) is concerned, a more restrictive (less supportive) degree of
Threat Flexibility, is positively influencing reliability, regardless of any mediating variable. The
one-way ANOVA is shown in Table 6.21. We notice however that the spread between the
highest and lowest expected average reliability is a little lower (0.17) than the average spread
(0.22) (based on the p≤0.10 significance level).
Case Type Fact1 Sig. LL LH Spread
Bank PU12 DMTF 0,05 0,67 0,50 0,17
Table 6.21 - One-way ANOVA for Threat Flexibility
At this one-way ANOVA level, we have found no sufficient significance for non-urgent incidents.
H2-1e: Teams that operate in a less efficiency-driven (more slack) organizational climate
perform better than teams that do not.
The construct covering the degree of supportiveness is Efficiency. We have found evidence
(p≤0.05) for the falsification of this hypothesis, as well concerning the handling of urgent
incidents as the non-urgent incidents. A higher focus on efficiency is positively influencing
reliability, regardless of any mediating variable. The one-way ANOVA is shown in Table 6.22. We
notice however that the spread between the highest and lowest expected average reliability is a
little lower (0.19) than the average spread (0.22) (based on the p≤0.10 significance level) but
substantially lower (0.10) for the non-urgent incidents.
Case Type Fact1 Sig. LL LH Max Min Spread
Bank PU12 DMEff 0,02 0,50 0,69 0,69 0,50 0,19
Bank PU3 DMEff 0,03 0,88 0,97 0,97 0,88 0,10
Table 6.22 - One-way ANOVA for Efficiency
Proposition 2-2
H2-2a: The higher the variance in SeMa propensity, the higher the reliability
We have found no significance to support this hypothesis at the one-way ANOVA level, but at
the two-way ANOVA level a low spread in SenseMaking yields the highest reliability (Table 6.23).
Case Type Fact1 Fact2 Sig. LL LH HL HH Spread
Bank Urgent DSSeMa DS2 0,02 0,76 0,50 0,47 0,59 0,30
Bank Urgent DSSeMa DM2 0,05 0,76 0,54 0,47 0,59 0,29
Bank Urgent DSSeMa DS6 0,05 0,76 0,54 0,47 0,59 0,29
Bank Non-Urgent DSSeMa DS4 0,01 0,95 0,98 0,97 0,77 0,21
Bank Non-Urgent DSSeMa DMEff 0,09 0,94 0,97 0,79 0,97 0,18
Bank Non-Urgent DSSeMa DMNU3pe 0,10 0,94 0,97 0,80 0,97 0,17

Data Analysis 193
Bank Non-Urgent DSSeMa DS1 0,08 0,96 0,95 0,97 0,81 0,16
Bank Non-Urgent DSSeMa DMNU12pe 0,08 0,98 0,94 0,84 0,96 0,14
Bank Non-Urgent DSSeMa DS114 0,10 0,97 0,94 0,84 0,96 0,13
Table 6.23 - Two-way ANOVA Analysis for Spread in SenseMaking Propensity
H2-2b: The higher the variance in Scheme, the higher the reliability
We have found no significance to support this hypothesis at the one-way ANOVA level, but at
the two-way ANOVA level, a low spread in SenseMaking propensity yields the highest reliability
(Table 6.24).
Case Type Fact1 Fact2 Sig. LL LH HL HH Spread
Bank Urgent DSScheme DMNU12pe 0,00 0,59 0,62 0,29 0,77 0,48
Bank Urgent DSScheme DS4 0,07 0,60 0,67 0,71 0,43 0,28
Bank Urgent DSScheme DS2 0,08 0,71 0,50 0,49 0,59 0,23
Bank Urgent DSScheme DM137 0,10 0,71 0,51 0,52 0,62 0,20
Bank Non-Urgent DSScheme DMEff 0,08 0,94 0,97 0,79 0,97 0,18
Bank Non-Urgent DSScheme DS4 0,04 0,95 0,97 0,97 0,80 0,17
Bank Non-Urgent DSScheme DM8 0,07 0,96 0,95 0,79 0,95 0,16
Bank Non-Urgent DSScheme DMNU12pe 0,08 0,98 0,94 0,84 0,96 0,14
Bank Non-Urgent DSPF DSScheme 0,05 0,95 0,74 0,96 0,93 0,22
Bank Non-Urgent DSTF DSScheme 0,04 0,98 0,97 0,94 0,77 0,21
Table 6.24 - Two-way ANOVA for Spread in Scheme
H2-2c: The higher the variance in Ongoing, the higher the reliability
We have found no significance to support this hypothesis at the one-way ANOVA level, but at
the two-way ANOVA level a low spread in Enactment yields the highest reliability (Table 6.25).
Case Type Fact1 Fact2 Sig. LL LH HL HH Spread
Bank Urgent DS137 DS4 0,01 0,59 0,68 0,70 0,37 0,33
Bank Urgent DS137 DS1 0,05 0,60 0,63 0,77 0,46 0,31
Bank Urgent DS137 DM113 0,01 0,71 0,52 0,45 0,71 0,26
Bank Non-Urgent DS137 DS10 0,00 0,97 0,89 0,77 0,96 0,20

194 Two Cases in High Reliability Organizing: a Hermeneutic Reconceptualization
Bank Non-Urgent DS137 DM9 0,01 0,89 0,97 0,94 0,77 0,20
Bank Non-Urgent DS137 DM10 0,01 0,90 0,97 0,96 0,77 0,19
Bank Non-Urgent DS137 DS9 0,04 0,97 0,89 0,82 0,94 0,15
Bank Non-Urgent DS137 DM5 0,07 0,96 0,92 0,85 0,99 0,14
Bank Non-Urgent DS137 DM113 0,10 0,97 0,91 0,86 0,95 0,11
Bank Non-urgent DSPer DS137 0,01 0,96 0,77 0,90 0,96 0,20
Table 6.25 - Two-way ANOVA for Spread in Enactment
Proposition 2-3
H2-3: Teams using richer media are more reliable.
No proof found for validation/falsification of this hypothesis neither at the one-dimensional
level, nor for the urgent, or for the non-urgent incidents.
Proposition 2-4
H2-4a: Teams exhibiting a high propensity towards Team Orientation, relying on richer media
yield a higher reliability.
H2-4b: Teams relying little on the dedicated IS and exhibiting a higher HRO propensity perform
better than when they rely more on the dedicated IS.
Higher immediate registration in combination with a high homogeneity in HRO propensity
results in the lowest reliability in the handling of urgent incidents (0.45 at p≤0.05). On the other
hand, lower immediate registration in combination with a high homogeneity in HRO propensity
results in the highest reliability (0.75 at p≤0.05), more particularly, the property of Deference to
Expertise (0.52 vs. 0.78) and of Preoccupation with Failure (0.46 vs. 0.71). Remarkable is that in
case of non-urgent incidents, the same observation can be made regarding the Preoccupation
with Failure, but that a likewise high reliability (0.97) is obtained for the combination of a high
degree of variance with a high degree of immediate registration (p≤0.08).
Case Type Fact1 Fact2 Sig. LL LH HL HH Max Min Spread
Bank PU12 DSHRT DM10 0,05 0,75 0,45 0,58 0,61 0,75 0,45 0,30
Bank PU12 DSDE DM10 0,08 0,78 0,52 0,52 0,56 0,78 0,52 0,26
Bank PU12 DSPF DM10 0,07 0,71 0,46 0,59 0,66 0,71 0,46 0,25
Bank PU3 DSPF DM10 0,08 0,96 0,85 0,91 0,97 0,97 0,85 0,12
Table 6.26 - Two-way ANOVA for timeliness of incident registration
For urgent as well as non-urgent incidents, teams with a high homogeneity in incident
management focus and a low reliance on Peregrine for their communication yield the best

Data Analysis 195
reliability whereas they yield the worst reliability when they do. For non-urgent incidents, a low
proportion of time devoted to the handling of incidents in combination with a high degree of use
of Peregrine yields the worst reliability, whereas in combination with a low reliance on Peregrine
yields the best reliability.
Case Type Fact1 Fact2 Sig. LL LH HL HH Max Min Spread
Bank PU12 DS8 DMDed 0,00 0,40 0,69 0,67 0,46 0,69 0,40 0,29
Bank PU3 DS8 DMDed 0,03 0,78 0,97 0,94 0,94 0,97 0,78 0,19
Bank PU3 DM8 DMDed 0,08 0,81 0,96 0,95 0,95 0,96 0,81 0,15
Table 6.27 - Two-Way ANOVA for the use of dedicated IS and incident management focus
Case Type Fact1 Fact2 Sig. LL LH HL HH Max Min Spread
Bank PU12 DSEff DM10 0,02 0,79 0,51 0,47 0,55 0,79 0,47 0,32
Bank PU12 DSTO DM10 0,05 0,78 0,47 0,56 0,59 0,78 0,47 0,31
Bank PU3 DS137 DM10 0,01 0,90 0,97 0,96 0,77 0,97 0,77 0,19
H2-4c: More experienced teams exhibiting a higher level of use of dedicated IS for their
communication are more reliable
This hypothesis can be falsified. From Table 6.28 can be derived that teams with a high level of
experience relying stronger on the dedicated IS (survey item 114, Peregrine) achieve a lower
reliability (0.47) in the handling of urgent incidents. When they rely less on the dedicated IS their
reliability is the highest (0.71). When less experienced teams rely heavily to face-to-face the
yield the lowest reliability (0.48 for urgent incidents; 0.85 for non-urgent incidents).
Table 6.28 also shows that teams with more experience relying stronger on richer media,
achieve a higher reliability: telephone (0.78); face-to-face (0.77); voice-based systems (0.76).
Case Type Fact1 Fact2 Sig. LL LH HL HH Spread
Bank Urgent DM5 DM112 0,01 0,61 0,52 0,42 0,78 0,37
Bank Urgent DM5 DM111 0,02 0,70 0,48 0,58 0,77 0,30
Bank Urgent DM5 DMVoic 0,02 0,64 0,49 0,51 0,76 0,27
Bank Urgent DM5 DM114 0,06 0,51 0,63 0,71 0,47 0,24
Bank Urgent DM5 DMFac 0,06 0,67 0,48 0,56 0,71 0,23

196 Two Cases in High Reliability Organizing: a Hermeneutic Reconceptualization
Bank Non-Urgent DM5 DMFac 0,07 0,96 0,85 0,92 0,98 0,13
Bank Non-Urgent DM5 DMVoic 0,08 0,94 0,86 0,91 0,98 0,13
Table 6.28 - Two-way ANOVA for Experience (DM5) and use of communication tools (DM112)
Proposition 2-5
Proposition 2-5: The better the fit between SeMa propensity and IS use, the higher the
reliability.
H2-5: Teams relying little on the dedicated IS and exhibiting a higher SeMa propensity perform
better than when they rely more on dedicated IS.
We have found no significance to support this hypothesis at any ANOVA level.
Proposition 2-6
H2-6a: Teams that work under close physical proximity perform better than teams that do not.
We have tested this variable by ranking the answer possibilities from little physical proximity to
the IT headquarters, to high proximity. We have found evidence for the hypothesis on two
levels: (1) proximity to the Bank’s IT headquarters (DM4) and (2) team dispersion (DS4).
1. Teams that (on average) are more based in the Bank’s IT headquarters are performing better
than teams that aren’t (DM4) (Table 6.29). These observations apply to the handling of urgent as
well as non-urgent incidents.
Case Type Fact1 Sig. LL LH Spread
Bank Non-Urgent DM4 0,07 0,89 0,97 0,08
Bank Urgent DM4 0,04 0,54 0,73 0,19
Table 6.29 - One-way ANOVA for vicinity to IT headquarters
Despite its level of significance that strictly speaking is not acceptable for further analysis (p =
0.11) we do want to point out the link with the Preoccupation with Failure construct, notably for
urgent incidents. From Table 6.30 we derive that teams with a high degree of Preoccupation
with Failure that are working in vicinity to the company headquarters are the most reliable. On
the other hand, this high degree of Preoccupation with Failure yields the lowest process
reliability when they are not working in vicinity to the IT headquarters.
Case Type Fact1 Fact2 Sig. LL LH HL HH Spread
Bank Urgent DMPF DM4 0,11 0,58 0,59 0,45 0,79 0,34
Table 6.30 - Two-way ANOVA for vicinity to IT headquarters

Data Analysis 197
2. A low spread in physical proximity is better for process reliability (DS4) (Table 6.31).
Case Type Fact1 Sig. LL LH Spread
Bank Non-Urgent DS4 0,03 0,96 0,85 0,10
Table 6.31 - One-way ANOVA for spread in Physical Proximity
Also at the two-way ANOVA level, the results are interesting (Table 6.32 and Table 6.33) because
of the general observation that low spread in physical location – i.e. a low team dispersion –
yields the highest reliability. This is particularly true for the non-urgent incidents. We also notice
that reliability is the lowest when team dispersion is high. For the urgent incidents this effect of
team dispersion is countered by the impact of workload.
Case Type Fact1 Fact2 Sig. LL LH HL HH Spread
Bank Urgent DS4 DMNU12pe 0,01 0,57 0,66 0,24 0,72 0,48
Bank Urgent DS4 DM113 0,10 0,69 0,58 0,44 0,64 0,25
Bank Non-Urgent DS4 DMEff 0,02 0,94 0,97 0,74 0,97 0,23
Bank Non-Urgent DS4 DMNU3pe 0,01 0,94 0,97 0,74 0,97 0,23
Bank Non-Urgent DS4 DMNUApe 0,01 0,94 0,97 0,74 0,97 0,23
Bank Non-Urgent DS4 DS111 0,06 0,97 0,94 0,77 0,92 0,20
Bank Non-Urgent DS4 DSFac 0,06 0,96 0,95 0,77 0,92 0,20
Bank Non-Urgent DS4 DMNU12pe 0,02 0,97 0,94 0,78 0,96 0,20
Bank Non-Urgent DS4 DS8 0,08 0,96 0,95 0,77 0,92 0,19
Bank Non-Urgent DS4 DS114 0,05 0,97 0,95 0,79 0,95 0,18
Bank Non-Urgent DS4
0,03 0,96 0,85
0,10
Table 6.32 - Two-way ANOVA for spread in Physical Proximity
Case Type Fact1 Fact2 Sig. LL LH HL HH Spread
Bank Urgent DSTF DS4 0,02 0,71 0,83 0,57 0,35 0,48
Bank Urgent DS137 DS4 0,01 0,59 0,68 0,70 0,37 0,33
Bank Urgent DSScheme DS4 0,07 0,60 0,67 0,71 0,43 0,28

198 Two Cases in High Reliability Organizing: a Hermeneutic Reconceptualization
Bank Non-Urgent DSSeMa DS4 0,01 0,95 0,98 0,97 0,77 0,21
Bank Non-Urgent DSTF DS4 0,04 0,97 0,98 0,94 0,77 0,21
Bank Non-Urgent DSScheme DS4 0,04 0,95 0,97 0,97 0,80 0,17
Table 6.33 - Two-way ANOVA for spread in Physical Proximity
H2-6b: Larger teams are more reliable than smaller teams.
We have found no evidence for this hypothesis at the one-way ANOVA level. At the two-way
level, Table 6.34 shows an interaction with time allocated to incident handling work. This
observation is dealt with next.
Case Type Fact1 Fact2 Sig. LL LH HL HH Spread
Bank Urgent DM6 DM8 0,05 0,50 0,73 0,66 0,54 0,23
Table 6.34 - Two-way ANOVA for Team Size
H2-6c: Teams with higher incident workload are more reliable than teams with a lower
workload.
This hypothesis can be validated from Table 6.35, as well concerning the workload regarding the
handling of urgent incidents (0.68) as non-urgent incidents (0.97). Results from the two-way
ANOVA support this finding with the exception of the combination with a high heterogeneity in
the use of Peregrine for communication where a low workload shows the highest reliability
(Table 6.36).
Case Type Fact1 Sig. LL LH Spread
Bank Urgent DMNU12pe 0,00 0,43 0,68 0,25
Bank Non-Urgent DMNU3pe 0,02 0,87 0,97 0,10
Bank Non-Urgent DMNUApe 0,03 0,87 0,97 0,10
Table 6.35 - One-way ANOVA of Workload
Case Type Fact1 Fact2 Sig. LL LH HL HH Spread
Bank Urgent DS4 DMNU12pe 0,01 0,57 0,66 0,24 0,72 0,48
Bank Urgent DSScheme DMNU12pe 0,00 0,59 0,62 0,29 0,77 0,48
Bank Urgent DS114 DMNU12pe 0,02 0,28 0,71 0,55 0,62 0,43
Bank Urgent DM111 DMNU12pe 0,09 0,55 0,69 0,27 0,67 0,42
Bank Urgent DS112 DMNU12pe 0,08 0,31 0,71 0,49 0,60 0,40

Data Analysis 199
Bank Urgent DMTF DMNU12pe 0,10 0,59 0,70 0,30 0,65 0,40
Bank Urgent DMSeMa DMNU12pe 0,07 0,34 0,72 0,54 0,64 0,38
Bank Urgent DM1 DMNU12pe 0,10 0,56 0,66 0,32 0,69 0,36
Bank Urgent DS1 DMNU12pe 0,06 0,62 0,68 0,33 0,68 0,35
Bank Non-Urgent DM1 DMNU12pe 0,01 0,97 0,94 0,76 0,95 0,21
Bank Non-Urgent DS112 DMNU12pe 0,02 0,76 0,96 0,95 0,92 0,20
Bank Non-Urgent DS4 DMNU12pe 0,02 0,97 0,94 0,78 0,96 0,20
Bank Non-Urgent DS1 DMNU12pe 0,04 0,98 0,95 0,80 0,95 0,18
Bank Non-Urgent DS114 DMNU12pe 0,04 0,81 0,96 0,97 0,92 0,15
Bank Non-Urgent DMTF DMNU12pe 0,08 0,97 0,94 0,83 0,96 0,14
Bank Non-Urgent DSMSA DMNU12pe 0,08 0,98 0,94 0,84 0,96 0,14
Bank Non-Urgent DSSeMa DMNU12pe 0,08 0,98 0,94 0,84 0,96 0,14
Table 6.36 - Two-way ANOVA of Workload concerning the handling of urgent incidents
H2-6d: Teams with a greater deal of their time allocated to incident management are more
reliable than teams with smaller time allocation.
We have found no evidence for this assertion at the one-way ANOVA level. At the two-way
ANOVA level (Table 6.37) there is sufficient evidence that a low degree of time allocation leads
to low reliability.
Case Type Fact1 Fact2 Sig. LL LH HL HH Spread
Bank Urgent DM8 DM6 0,05 0,50 0,66 0,73 0,54 0,23
Bank Non-Urgent DM8 DMNU3pe 0,10 0,80 0,97 0,93 0,97 0,17
Bank Non-Urgent DM8 DMDed 0,08 0,81 0,96 0,95 0,95 0,15
Bank Non-Urgent DM8 DSMSA 0,07 0,96 0,79 0,95 0,95 0,16
Bank Non-Urgent DM8 DM1 0,08 0,96 0,81 0,95 0,95 0,16
Table 6.37 - Two-way ANOVA of Time Allocation

200 Two Cases in High Reliability Organizing: a Hermeneutic Reconceptualization
Proposition 2-7
Proposition 2-7: The better the fit between HRO propensity and the structural
organization dimension use, the higher the reliability.
H2-7a: A high HRO propensity enhances the effect on reliability of teams working under
close physical proximity
H2-7b: A high HRO propensity enhances the effect on reliability of larger teams
H2-7c: A high HRO propensity enhances the effect on reliability of teams with higher
incident workload.
H2-7a: A high HRO propensity enhances the effect on reliability of teams working under
close physical proximity
Case Type Fact1 Sig. LL LH
Bank Non-Urgent DM4 0,07 0,89 0,97
Bank Urgent DM4 0,04 0,54 0,73
Bank Non-urgent DS4 0.03 0.96 0.85
Table 6.38 - One-way ANOVA for Proximity
This hypothesis can be validated at an acceptable level of significance for urgent incidents. A low
value for spread in vicinity (i.e. close proximity) results in the highest performance (Table 6.38).
We notice also that the more a team is based in the vicinity of headquarters, themore reliable it
is.
H2-7b: A high HRO propensity enhances the effect on reliability of larger teams
This hypothesis cannot be validated at an acceptable level of significance.
H2-7c: A high HRO propensity enhances the effect on reliability of teams with higher incident
workload.
Case Type Fact1 Sig. LL LH
Bank Urgent DMNU12pe 0,00 0,43 0,68
Bank Non-Urgent DMNU3pe 0,02 0,87 0,97
Bank Non-Urgent DMNUApe 0,03 0,87 0,97
Table 6.39 - Workload
This hypothesis can be validated. We see from Table 6.39 that a high workload has a strong
effect on high reliability, as well for the handling of urgent as non-urgent incidents.

Data Analysis 201
Proposition 2-8
Proposition 2-8: The better the fit between SeMa propensity and the structural
organization dimension use, the higher the reliability.
H2-8a: A high SeMa propensity enhances the effect on reliability of teams working
under close physical proximity.
No validation possible at an acceptable level of significance.
H2-8b: A high SeMa propensity enhances the effect on reliability of larger teams.
No validation possible at an acceptable level of significance
Proposition 2-9
H2-9a: More experienced teams are more reliable.
No validation of this effect at acceptable levels of significance can be observed.
H2-9b: The higher the variance in HRO propensity, the higher the reliability
We have found no support for this hypothesis at a sufficient level of significance on the one-way
analysis level. On the two-way ANOVA level (Table 6.40) we notice that the highest reliability is
achieved low spread in HRO propensity in combination with highly experienced teams (0.72 for
urgent, and 0.98 for non-urgent incidents), high use of e-mail (0.66 for urgent incidents and 0.97
for non-urgent incidents). The lowest reliability is achieved for low spread in HRO propensity in
combination with a less experienced teams (0.43 for urgent incidents and 0.85 for non-urgent
incidents) and little use of e-mail (0.45 for urgent incidents and 0.88 for non-urgent incidents).
Case Type Fact1 Fact2 Sig. LL LH HL HH Spread
Bank Urgent DSHRT DM10 0,05 0,75 0,45 0,58 0,61 0,30
Bank Urgent DSHRT DM5 0,03 0,43 0,72 0,62 0,51 0,29
Bank Urgent DSHRT DS10 0,07 0,48 0,77 0,61 0,57 0,28
Bank Urgent DSHRT DM9 0,05 0,69 0,50 0,53 0,71 0,21
Bank Urgent DSHRT DS9 0,05 0,50 0,69 0,71 0,53 0,21
Bank Urgent DSHRT DM113 0,08 0,45 0,66 0,63 0,51 0,21
Bank Non-Urgent DSHRT DM5 0,07 0,85 0,98 0,93 0,88 0,13
Bank Non-Urgent DSHRT DM113 0,08 0,88 0,97 0,94 0,86 0,11
Table 6.40 - Two-way ANOVA for Spread in HRO propensity

202 Two Cases in High Reliability Organizing: a Hermeneutic Reconceptualization
Case Type Fact1 Fact2 Sig. LL LH HL HH Spread
Bank Urgent DSDE DSHRT 0,03 0,55 0,78 0,67 0,50 0,28
Bank Urgent DSPer DSHRT 0,06 0,48 0,62 0,77 0,57 0,28
Bank Non-Urgent DSSO DSHRT 0,10 0,98 0,88 0,86 0,92 0,12
Table 6.41 - Two-way ANOVA for Spread in HRT
H2-9c: The higher the variance in Team Orientation, the higher the reliability
This hypothesis cannot be validated at the one-way ANOVA level. On the two-dimensional level
(Table 6.42), the highest reliability can be found for urgent incidents for low spread in Team
Orientation in combination with low score on Enactment (0.76), on registration in Peregrine
(0.78)and for non-urgent incidents for low spread in enactment as well (0.98). A low score on
spread in Team Orientation in combination with a high spread in registration in Peregrine (0.80).
Case Type Fact1 Fact2 Sig. LL LH HL HH Spread
Bank Urgent DSTO DM137 0,01 0,76 0,43 0,53 0,64 0,33
Bank Urgent DSTO DM10 0,05 0,78 0,47 0,56 0,59 0,31
Bank Urgent DSTO DS10 0,06 0,50 0,80 0,59 0,56 0,30
Bank Urgent DSTO DSDE 0,04 0,57 0,68 0,73 0,47 0,25
Bank Non-Urgent DSTO DSDE 0,06 0,90 0,98 0,96 0,87 0,11
Bank Non-Urgent DSTO DM137 0,10 0,98 0,87 0,90 0,94 0,11
Bank Non-Urgent DSTO DM113 0,11 0,88 0,97 0,94 0,87 0,10
Table 6.42 - Two-way ANOVA for spread in Team Orientation
H2-9d: The higher the variance in Threat Flexibility, the higher the reliability.
Case Type Fact1 Sig. LL LH Spread
Bank Non-Urgent DSTF 0,02 0,97 0,87 0,10
Bank Urgent DSTF 0,00 0,74 0,48 0,26
Table 6.43 - One-way ANOVA for Threat Flexibility
This hypothesis is falsified. As well for urgent as for non-urgent incidents, the lowest variance
yields the highest reliability (Table 6.43).
H2-9e: The higher the variance in Preoccupation with Failure, the higher the reliability

Data Analysis 203
This hypothesis could not be validated at the one-way ANOVA level. At the two-dimensional
level, a low spread in Preoccupation with Failure generally yields the lowest reliability (Table
6.44).
Case Type Fact1 Fact2 Sig. LL LH HL HH Spread
Bank Urgent DSPF DS10 0,01 0,41 0,72 0,69 0,53 0,30
Bank Urgent DSPF DSSO 0,02 0,69 0,39 0,56 0,65 0,30
Bank Urgent DSPF DM10 0,07 0,71 0,46 0,59 0,66 0,25
Bank Urgent DSPF DM5 0,10 0,46 0,67 0,64 0,55 0,22
Bank Non-Urgent DSPF DSScheme 0,05 0,95 0,74 0,96 0,93 0,22
Bank Urgent DSPF DM113 0,07 0,46 0,64 0,67 0,52 0,21
Bank Non-Urgent DSPF DS10 0,04 0,83 0,96 0,97 0,91 0,14
Bank Non-Urgent DSPF DM113 0,07 0,84 0,95 0,96 0,90 0,12
Bank Non-Urgent DSPF DS9 0,10 0,85 0,94 0,97 0,90 0,12
Bank Non-Urgent DSPF DM10 0,08 0,96 0,85 0,91 0,97 0,12
Table 6.44 - Two-way ANOVA for Preoccupation with Failure
Case Type Fact1 Fact2 Sig. LL LH HL HH Spread
Bank Urgent DSPer DSPF 0,03 0,46 0,69 0,71 0,57 0,25
Bank Non-Urgent DSPer DSPF 0,09 0,85 0,96 0,96 0,92 0,12
Table 6.45 - Two-way ANOVA for Spread in Preoccupation with Failure
H2-9f: The higher the variance in Sensitivity to Operations, the higher the reliability
This hypothesis cannot be validated at the one-way ANOVA level. For urgent incidents, a
combination of low spread in Sensitivity to Operations and a low spread in Preoccupation with
Failure yields the highest reliability (0.69) (Table 6.46).
Case Type Fact1 Fact2 Sig. LL LH HL HH Spread
Bank Non-Urgent DSSO DSHRT 0,10 0,98 0,88 0,86 0,92 0,12
Bank Urgent DSPF DSSO 0,02 0,69 0,39 0,56 0,65 0,30
Table 6.46 - Two-way ANOVA for spread in Sensitivity to Operations
H2-9g: The higher the variance in Deference to Expertise, the higher the reliability

204 Two Cases in High Reliability Organizing: a Hermeneutic Reconceptualization
This hypothesis could not be validated at the one-way ANOVA level. On the two-dimensional
interpretation, we notice that the highest reliability is achieved for the combinations of low
spread in Deference to Expertise and other factors, especially for urgent incidents (Table 6.47).
Case Type Fact1 Fact2 Sig. LL LH HL HH Spread
Bank Urgent DSDE DMScheme 0,01 0,77 0,56 0,43 0,66 0,34
Bank Urgent DSDE DMSeMa 0,01 0,72 0,55 0,41 0,65 0,31
Bank Urgent DSDE DSHRT 0,03 0,55 0,78 0,67 0,50 0,28
Bank Urgent DSDE DS10 0,09 0,54 0,80 0,56 0,52 0,27
Bank Urgent DSDE DM10 0,08 0,78 0,52 0,52 0,56 0,26
Bank Urgent DSDE DMSO 0,03 0,71 0,59 0,44 0,69 0,26
Bank Urgent DSDE DM137 0,05 0,73 0,49 0,49 0,59 0,24
Bank Non-Urgent DSDE DMHRT 0,02 0,97 0,87 0,84 0,96 0,13
Bank Non-Urgent DSDE DMSO 0,04 0,97 0,89 0,86 0,98 0,12
Bank Non-Urgent DSDE DS113 0,08 0,97 0,87 0,87 0,94 0,10
Bank Urgent DSTO DSDE 0,04 0,57 0,68 0,73 0,47 0,25
Bank Non-Urgent DSTO DSDE 0,06 0,90 0,98 0,96 0,87 0,11
Table 6.47 - Two-way ANOVA for Spread in Deference to Expertise
Proposition 2-10
H2-10a: Teams that perceive Threat Flexibility more homogenously perform better than teams
that do not.
At the same time we notice (Table 6.48) that a high homogeneity (i.e. low spread/variance) in
the perception of the Threat Flexibility construct yields the highest reliability, as well for the
handling of urgent (0.74 at p≤0.05) as of the non-urgent incidents (0.97 at p≤0.01).
Case Type Fact1 Sig. LL LH Spread
Bank PU3 DSTF 0,02 0,97 0,87 0,10
Bank PU12 DSTF 0,00 0,74 0,48 0,26
Table 6.48 - One-way ANOVA for spread of Threat Flexibility
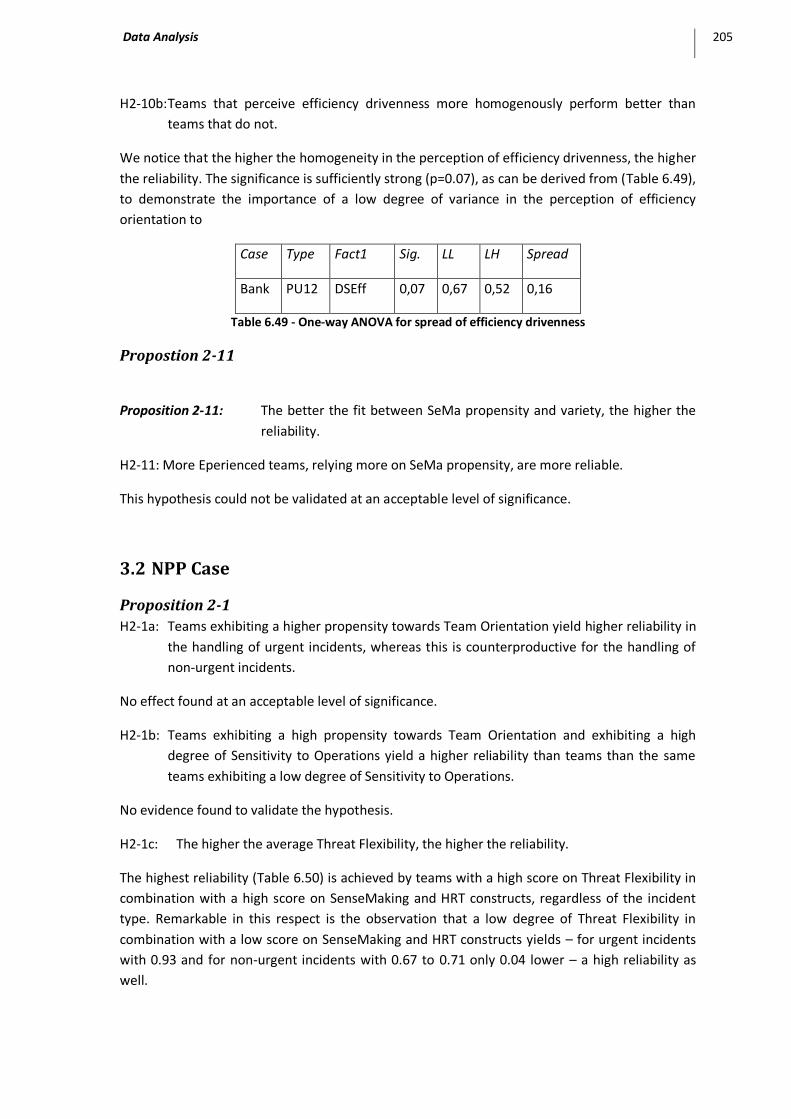
Data Analysis 205
H2-10b: Teams that perceive efficiency drivenness more homogenously perform better than
teams that do not.
We notice that the higher the homogeneity in the perception of efficiency drivenness, the higher
the reliability. The significance is sufficiently strong (p=0.07), as can be derived from (Table 6.49),
to demonstrate the importance of a low degree of variance in the perception of efficiency
orientation to
Case Type Fact1 Sig. LL LH Spread
Bank PU12 DSEff 0,07 0,67 0,52 0,16
Table 6.49 - One-way ANOVA for spread of efficiency drivenness
Propostion 2-11
Proposition 2-11: The better the fit between SeMa propensity and variety, the higher the
reliability.
H2-11: More Eperienced teams, relying more on SeMa propensity, are more reliable.
This hypothesis could not be validated at an acceptable level of significance.
3.2 NPP Case
Proposition 2-1
H2-1a: Teams exhibiting a higher propensity towards Team Orientation yield higher reliability in
the handling of urgent incidents, whereas this is counterproductive for the handling of
non-urgent incidents.
No effect found at an acceptable level of significance.
H2-1b: Teams exhibiting a high propensity towards Team Orientation and exhibiting a high
degree of Sensitivity to Operations yield a higher reliability than teams than the same
teams exhibiting a low degree of Sensitivity to Operations.
No evidence found to validate the hypothesis.
H2-1c: The higher the average Threat Flexibility, the higher the reliability.
The highest reliability (Table 6.50) is achieved by teams with a high score on Threat Flexibility in
combination with a high score on SenseMaking and HRT constructs, regardless of the incident
type. Remarkable in this respect is the observation that a low degree of Threat Flexibility in
combination with a low score on SenseMaking and HRT constructs yields – for urgent incidents
with 0.93 and for non-urgent incidents with 0.67 to 0.71 only 0.04 lower – a high reliability as
well.

206 Two Cases in High Reliability Organizing: a Hermeneutic Reconceptualization
Case Type Fact1 Fact2 Sig. LL LH HL HH Spread
NPP Urgent DMTF DMSeMa 0,10 0,93 0,56 0,83 0,97 0,42
NPP Urgent DMTF DMSO 0,07 0,93 0,48 0,84 0,97 0,49
NPP Urgent DMTF DMOther 0,06 0,93 0,48 0,77 0,97 0,49
NPP Non-Urgent DMTF DMHRT 0,08 0,67 -0,21 0,25 0,76 0,97
NPP Non-Urgent DMTF DMTO 0,10 0,69 -0,25 0,46 0,74 0,99
NPP Non-Urgent DMTF DMSO 0,07 0,71 -0,29 0,42 0,76 1,05
Table 6.50 - Two-way ANOVA for Threat Flexibility
H2-1d: Teams that operate in a less restrictive (more supportive) organizational climate perform
better than teams that do not.
We have found no significant proof for this hypothesis since the construct covering the degree of
supportiveness namely Threat Flexibility. Nor for the urgent incidents, nor for the non-urgent
incidents is it so that the degree of restrictiveness/supportiveness of Threat Flexibility is
positively influencing reliability, regardless of any mediating variable.
Proposition 2-2
H2-2a: The higher the variance in SeMa propensity, the higher the reliability
Case Type Fact1 Fact2 Sig. LL LH HL HH Spread
NPP Urgent DM32 DSSeMa 0,07 0,92 0,94 0,96 0,45 0,51
NPP Urgent DMSeMa DSSeMa 0,02 0,87 0,92 0,97 0,36 0,61
NPP Urgent DS9 DSSeMa 0,02 0,91 0,94 0,96 0,33 0,63
NPP Urgent DS8 DSSeMa 0,04 0,92 0,32 0,96 0,97 0,65
NPP Urgent DS10 DSSeMa 0,10 0,99 0,84 0,91 0,12 0,87
NPP Non-Urgent DMTeamSize DSSeMa 0,08 0,60 0,69 0,78 -0,29 1,08
NPP Non-Urgent DM32 DSSeMa 0,07 0,58 0,69 0,81 -0,30 1,11
NPP Non-Urgent DS4 DSSeMa 0,10 0,74 0,69 0,59 -0,54 1,28
Table 6.51 - Two-way ANOVA for SenseMaking
We have found no evidence for this assumption at the one-way ANOVA level. At the two way
level ANOVA however, this hypothesis can be falsified. In general, it can be derived from Table
6.51 that the higher the spread in SenseMaking, the lower the incident management reliability.
More particularly, in the case of the handling of urgent incidents, a high homogenous degree of
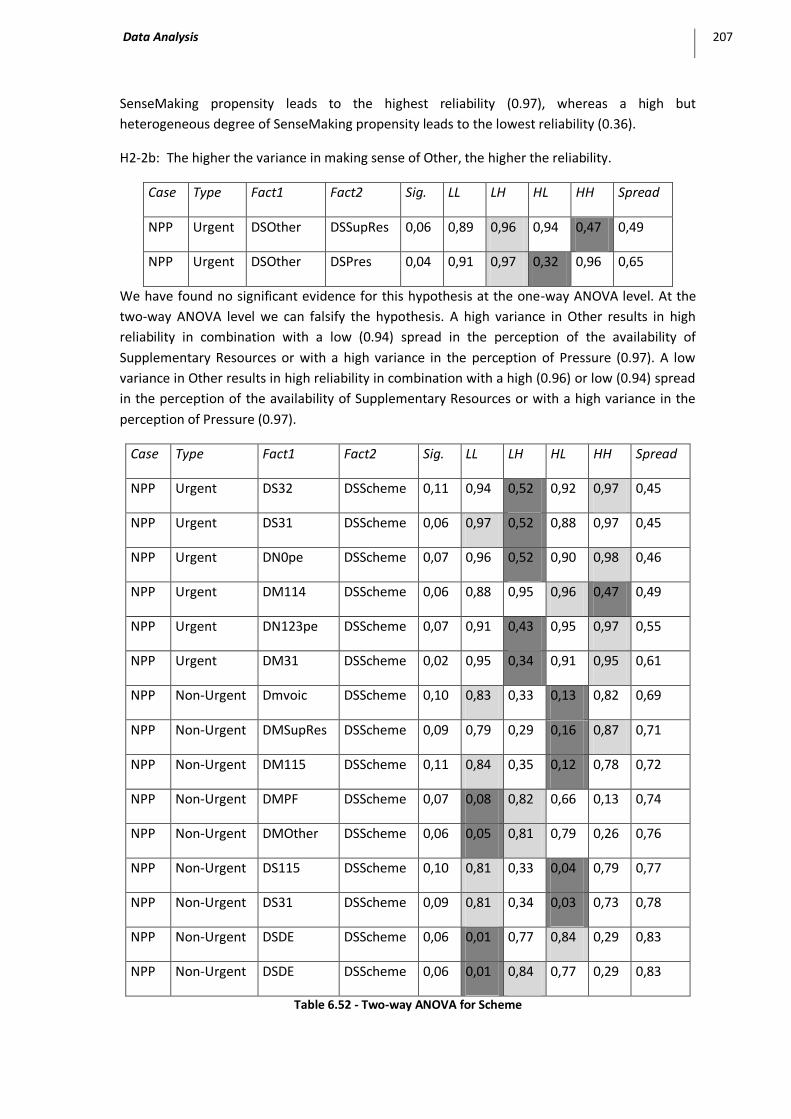
Data Analysis 207
SenseMaking propensity leads to the highest reliability (0.97), whereas a high but
heterogeneous degree of SenseMaking propensity leads to the lowest reliability (0.36).
H2-2b: The higher the variance in making sense of Other, the higher the reliability.
Case Type Fact1 Fact2 Sig. LL LH HL HH Spread
NPP Urgent DSOther DSSupRes 0,06 0,89 0,96 0,94 0,47 0,49
NPP Urgent DSOther DSPres 0,04 0,91 0,97 0,32 0,96 0,65
We have found no significant evidence for this hypothesis at the one-way ANOVA level. At the
two-way ANOVA level we can falsify the hypothesis. A high variance in Other results in high
reliability in combination with a low (0.94) spread in the perception of the availability of
Supplementary Resources or with a high variance in the perception of Pressure (0.97). A low
variance in Other results in high reliability in combination with a high (0.96) or low (0.94) spread
in the perception of the availability of Supplementary Resources or with a high variance in the
perception of Pressure (0.97).
Case Type Fact1 Fact2 Sig. LL LH HL HH Spread
NPP Urgent DS32 DSScheme 0,11 0,94 0,52 0,92 0,97 0,45
NPP Urgent DS31 DSScheme 0,06 0,97 0,52 0,88 0,97 0,45
NPP Urgent DN0pe DSScheme 0,07 0,96 0,52 0,90 0,98 0,46
NPP Urgent DM114 DSScheme 0,06 0,88 0,95 0,96 0,47 0,49
NPP Urgent DN123pe DSScheme 0,07 0,91 0,43 0,95 0,97 0,55
NPP Urgent DM31 DSScheme 0,02 0,95 0,34 0,91 0,95 0,61
NPP Non-Urgent Dmvoic DSScheme 0,10 0,83 0,33 0,13 0,82 0,69
NPP Non-Urgent DMSupRes DSScheme 0,09 0,79 0,29 0,16 0,87 0,71
NPP Non-Urgent DM115 DSScheme 0,11 0,84 0,35 0,12 0,78 0,72
NPP Non-Urgent DMPF DSScheme 0,07 0,08 0,82 0,66 0,13 0,74
NPP Non-Urgent DMOther DSScheme 0,06 0,05 0,81 0,79 0,26 0,76
NPP Non-Urgent DS115 DSScheme 0,10 0,81 0,33 0,04 0,79 0,77
NPP Non-Urgent DS31 DSScheme 0,09 0,81 0,34 0,03 0,73 0,78
NPP Non-Urgent DSDE DSScheme 0,06 0,01 0,77 0,84 0,29 0,83
NPP Non-Urgent DSDE DSScheme 0,06 0,01 0,84 0,77 0,29 0,83
Table 6.52 - Two-way ANOVA for Scheme
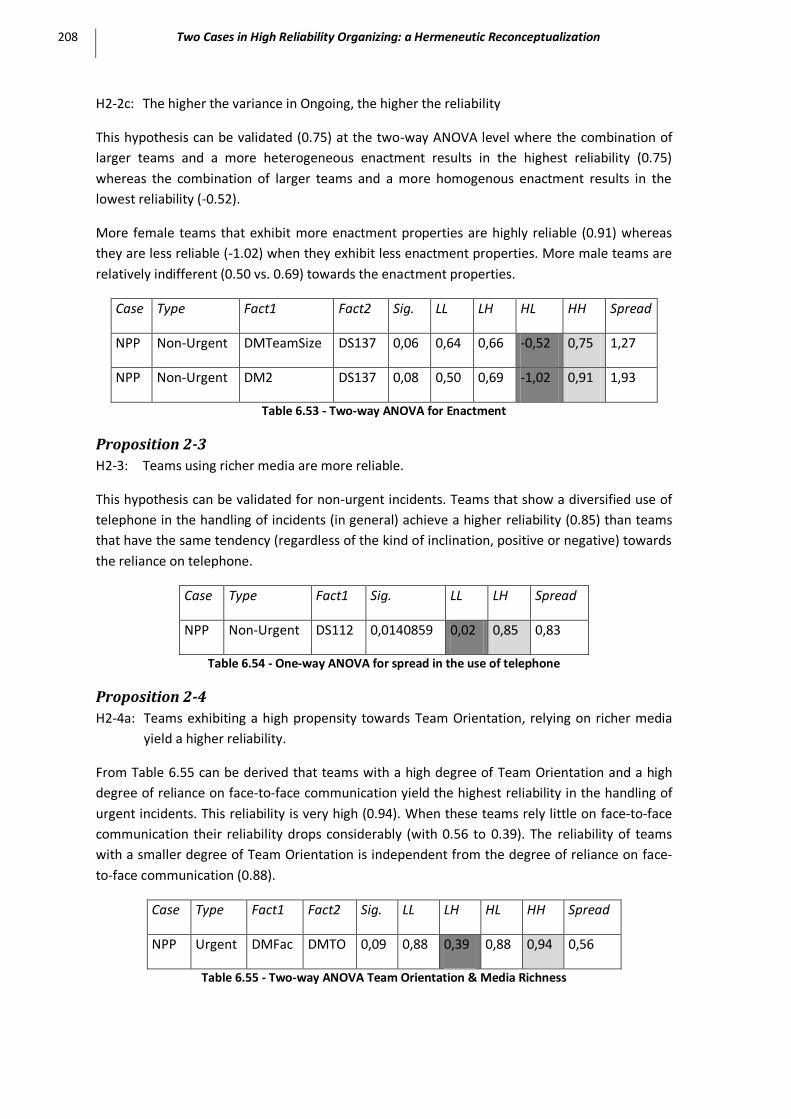
208 Two Cases in High Reliability Organizing: a Hermeneutic Reconceptualization
H2-2c: The higher the variance in Ongoing, the higher the reliability
This hypothesis can be validated (0.75) at the two-way ANOVA level where the combination of
larger teams and a more heterogeneous enactment results in the highest reliability (0.75)
whereas the combination of larger teams and a more homogenous enactment results in the
lowest reliability (-0.52).
More female teams that exhibit more enactment properties are highly reliable (0.91) whereas
they are less reliable (-1.02) when they exhibit less enactment properties. More male teams are
relatively indifferent (0.50 vs. 0.69) towards the enactment properties.
Case Type Fact1 Fact2 Sig. LL LH HL HH Spread
NPP Non-Urgent DMTeamSize DS137 0,06 0,64 0,66 -0,52 0,75 1,27
NPP Non-Urgent DM2 DS137 0,08 0,50 0,69 -1,02 0,91 1,93
Table 6.53 - Two-way ANOVA for Enactment
Proposition 2-3
H2-3: Teams using richer media are more reliable.
This hypothesis can be validated for non-urgent incidents. Teams that show a diversified use of
telephone in the handling of incidents (in general) achieve a higher reliability (0.85) than teams
that have the same tendency (regardless of the kind of inclination, positive or negative) towards
the reliance on telephone.
Case Type Fact1 Sig. LL LH Spread
NPP Non-Urgent DS112 0,0140859 0,02 0,85 0,83
Table 6.54 - One-way ANOVA for spread in the use of telephone
Proposition 2-4
H2-4a: Teams exhibiting a high propensity towards Team Orientation, relying on richer media
yield a higher reliability.
From Table 6.55 can be derived that teams with a high degree of Team Orientation and a high
degree of reliance on face-to-face communication yield the highest reliability in the handling of
urgent incidents. This reliability is very high (0.94). When these teams rely little on face-to-face
communication their reliability drops considerably (with 0.56 to 0.39). The reliability of teams
with a smaller degree of Team Orientation is independent from the degree of reliance on face-
to-face communication (0.88).
Case Type Fact1 Fact2 Sig. LL LH HL HH Spread
NPP Urgent DMFac DMTO 0,09 0,88 0,39 0,88 0,94 0,56
Table 6.55 - Two-way ANOVA Team Orientation & Media Richness

Data Analysis 209
H2-4b: Teams relying little on the dedicated IS and exhibiting a higher HRO propensity perform
better than when they rely more on the dedicated IS.
Teams whose management expects they rigorously stick to procedures (low score on 243INV)
and that homogenously rely on dedicated IS in the handling of incidents score the highest
reliability in the handling of urgent incidents (0.96, which is very high) (Table 6.56). When these
teams are less homogenous in the way they rely on dedicated IS, their reliability drops
considerably (0.40). This underlines the relevance of the hypothesis as a guideline for the design
of information systems (in its broadest sense of hardware, software and procedures). Teams
whose management allows team members to deviate more from procedure and that exhibit a
high variance in the way they make use of dedicated IS (0.93, also very high).
Case Type Fact1 Fact2 Sig. LL LH HL HH Spread
NPP Urgent DM243INV DSDed 0,07 0,96 0,40 0,87 0,93 0,56
Table 6.56 - Deviation from procedure & Tool dedication
H2-4c: More experienced teams exhibiting a higher level of use of dedicated IS for their
communication are more reliable.
No evidence can be found for this assertion at an acceptable level of significance.
Proposition 2-5
Proposition 2-5: The better the fit between SeMa propensity and IS use, the higher the
reliability.
H2-5: Teams relying little on the dedicated IS and exhibiting a higher SeMa propensity perform
better than when they rely more on dedicated IS.
Case Type Fact1 Fact2 Sig. LL LH HL HH
NPP Non-Urgent Dmvoic DSScheme 0,10 0,83 0,33 0,13 0,82
NPP Non-Urgent Dmvoic DSSelf 0,10 0,82 0,33 0,18 0,91
NPP Urgent Dmvoic DSDed 0,01 0,97 0,23 0,85 0,93
NPP Non-Urgent Dmvoic DSDed 0,06 0,85 -0,29 0,09 0,53
NPP Urgent Dmvoic DSVoic 0,00 0,91 -0,74 0,93 0,89
NPP Non-Urgent Dmvoic DS2 0,03 0,50 0,91 0,71 -1,02
NPP Non-Urgent Dmvoic DS1 0,03 0,50 0,91 0,60 -1,55
NPP Non-Urgent Dmvoic DSVoic 0,00 0,81 -2,26 0,04 0,44 Table 6.57 - Two-way Anova for SeMa and Is Use
We see from Table 6.57 that this hypothesis cannot be validated. However, we notice that a high
spread in the SeMa propensity Scheme (DSScheme), i.e. a high homogeneity in combination with
a high reliance on voice-based communication tools yields the lowest performance.

210 Two Cases in High Reliability Organizing: a Hermeneutic Reconceptualization
Proposition 2-6
H2-6a: Teams that work under close physical proximity perform better than teams that do not.
In the NPP Case, no data are available to test this hypothesis. Testing would be senseless
because all team-members are housed in the same physical location.
H2-6b: Larger teams are more reliable than smaller teams.
We have found no proof for the validation of this hypothesis at the one-way ANOVA level.
Case Type Fact1 Fact2 Sig. LL LH HL HH Spread
NPP Urgent DMPres DMTeamSize 0,10 0,89 0,96 0,97 0,54 0,43
NPP Urgent DMFac DMTeamSize 0,06 0,96 0,47 0,89 0,96 0,49
NPP Urgent DMSupRes DMTeamSize 0,04 0,96 0,46 0,89 0,97 0,51
NPP Urgent DM114 DMTeamSize 0,01 0,88 0,96 0,96 0,34 0,62
NPP Non-Urgent DMSO DMTeamSize 0,05 0,54 0,87 0,84 -0,18 1,05
NPP Non-Urgent DMHRT DMTeamSize 0,03 0,46 0,79 0,83 -0,30 1,13
NPP Non-Urgent DSSupRes DMTeamSize 0,09 0,54 0,79 0,83 -0,12 0,95
NPP Non-Urgent DSOther DMTeamSize 0,09 0,77 -0,15 0,55 0,83 0,97
NPP Non-Urgent DSSO DMTeamSize 0,06 0,48 0,80 0,86 -0,12 0,98
NPP Non-Urgent DSSeMa DMTeamSize 0,08 0,60 0,78 0,69 -0,29 1,08
NPP Non-Urgent DMEff DMTeamSize 0,10 0,65 -0,30 0,64 0,79 1,09
NPP Non-Urgent DM112 DMTeamSize 0,09 0,64 -0,33 0,65 0,81 1,14
NPP Non-Urgent DMTO DMTeamSize 0,02 0,50 0,84 0,83 -0,35 1,19
NPP Non-Urgent DS137 DMTeamSize 0,06 0,64 -0,52 0,66 0,75 1,27
Table 6.58 - Two-way ANOVA for Team Size
At the two-way ANOVA analysis level, it can be derived from Table 6.58 that in the majority of
cases where team size moderates the effect of the independent variable on the dependent
variable, large teams yield a lower reliability than small teams.
For urgent incidents, the highest reliability (0.97) is obtained by small teams that perceive high
pressure, whereas small teams that perceive little pressure still yield a high reliability score
(0.89). Large teams perceiving high pressure yield the lowest reliability (0.54), and large teams
perceiving low pressure manage to be very reliable (0.96).

Data Analysis 211
Small teams relying little on face-to-face communication are the most reliable (0.96); large
teams the least (0.47) in the handling of urgent incidents. Large teams, for that matter, can
consistently increase their reliability when they (contrary to small teams), rely on face-to-face
communication for the handling of urgent incidents.
Case Type Fact1 Fact2 Sig. LL LH HL HH Spread
NPP Urgent DM114 DMTeamSize 0,01 0,88 0,96 0,96 0,34 0,62
Table 6.59 - Two-way ANOVA for TeamSize (ctd)
Big teams communicating considerably through the dedicated system, yield the lowest reliability
(0.34), whereas big teams that do not do so, see their reliability increase spectacularly (to 0.96).
Small teams relying heavily on the dedicated system are the most reliable.
H2-6c: Teams with higher incident workload are more reliable than teams with a lower
workload.
We have been able to validate this hypothesis. Interestingly, Table 6.60 shows that the number
of non-urgent notifications per employee is explaining the high reliability in the handling of
urgent incidents.
Case Type Fact1 Sig. LL LH Spread
NPP Urgent DN123pe 0,09 0,71 0,96 0,26
Table 6.60 - One-way ANOVA for Workload (NPP)
H2-6d: Teams with a greater deal of their time allocated to incident management are more
reliable than teams with smaller time allocation.
In the NPP Case, no data are available to test this hypothesis. Testing would be senseless
because the large majority of teams in the survey are part of the Maintenance department,
meaning that their time allocation would approach 100 percent.
Proposition 2-7
Proposition 2-7: The better the fit between HRO propensity and the structural
organization dimension use, the higher the reliability.
H2-7a: A high HRO propensity enhances the effect on reliability of teams working under
close physical proximity
H2-7b: A high HRO propensity enhances the effect on reliability of larger teams
H2-7c: A high HRO propensity enhances the effect on reliability of teams with higher
incident workload.
H2-7a: A high HRO propensity enhances the effect on reliability of teams working under close
physical proximity
This hypothesis cannot be tested in the NPP, since physical proximity is a given.

212 Two Cases in High Reliability Organizing: a Hermeneutic Reconceptualization
H2-7b: A high HRO propensity enhances the effect on reliability of larger teams
No validation possible at an acceptable level of significance.
H2-7c: A high HRO propensity enhances the effect on reliability of teams with higher incident
workload.
Case Type Fact1 Sig. LL LH
NPP Urgent DN123pe 0,09 0,71 0,96
Table 6.61 - Workload (NPP)
This hypothesis can be validated (Table 6.61).
Proposition 2-8
Proposition 2-8: The better the fit between SeMa propensity and the structural
organization dimension use, the higher the reliability.
H2-8a: A high SeMa propensity enhances the effect on reliability of teams working
under close physical proximity.
No data available to test this hypothesis.
H2-8b: A high SeMa propensity enhances the effect on reliability of larger teams
No data available to test this hypothesis.
Proposition 2-9
H2-9a: More experienced teams are more reliable.
This hypothesis can be falsified at an acceptable level of significance (p ≤ 0.08). From Table 6.62
can be seen that teams with a lower level of experience perform better in the handling of urgent
incidents. A side remark is that the difference between the average reliability of on average less
experienced and more experienced teams is small (0.26 as compared to a minimum of 0.25 and
a maximum of 0.29).
Case Type Fact1 Sig. LL LH Spread
NPP Urgent DM5 0,08 0,97 0,70 0,26
Table 6.62 - One-way ANOVA of Experience
H2-9b: The higher the variance in HRO propensity, the higher the reliability
There is no evidence at an acceptable level of significance for this assertion at the one-
dimensional level. However, on the two-way ANOVA level, there is evidence for the hypothesis
(Table 6.63).
Regarding the handling of urgent incidents, the combination of a high variance in the spread of
HRT propensity and a high spread in the degree to which team members adjust procedures leads

Data Analysis 213
to the lowest reliability (0.45). Other combinations are less pronounced since they range only
0.07 (0.89 to 0.96). Nevertheless, the lowest of these reliabilities (0.89) can be observed for the
combination of a low variance in the spread of HRT propensity and a low spread in the degree to
which team members adjust procedures.
Case Type Fact1 Fact2 Sig. LL LH HL HH Spread
NPP Non-Urgent DSHRT DSTF 0,09 0,40 0,80 0,86 0,05 0,81
NPP Non-Urgent DSHRT DSOther 0,06 0,72 0,42 -0,10 0,87 0,97
NPP Urgent DSHRT DS9 0,06 0,89 0,96 0,95 0,45 0,51
NPP Non-Urgent DSHRT DMHRT 0,08 0,39 0,75 0,81 -0,04 0,86
NPP Non-Urgent DSHRT DMTO 0,10 0,46 0,72 0,83 -0,06 0,89
NPP Non-Urgent DSHRT DMSO 0,09 0,47 0,71 0,84 -0,07 0,92
NPP Non-Urgent DSHRT DM32 0,04 0,44 0,83 0,90 -0,13 1,03
NPP Non-Urgent DSHRT DMEff 0,04 0,62 0,32 -0,47 0,81 1,28
Table 6.63 - Two-way ANOVA for spread in HRO propensity
Regarding the handling of non-urgent incidents, the combination of a high spread in HRO
propensity and a high spread in Threat Flexibility results in the lowest reliability (0.05). The
highest reliability (0.86) is obtained by teams with a low score on spread in Threat Flexibility and
a high spread in HRO propensity.
H2-9c: The higher the variance in Team Orientation, the higher the reliability
The hypothesis cannot be validated significantly at the one-way ANOVA level. On the level of
two-way ANOVA however, some conclusions can be drawn. For instance, the combination of a
high variance in Team Orientation and a high degree of Sensitivity to Operations yields the worst
reliability (-0.20). A low spread in Team Orientation combined with a high degree of Sensitivity
to Operations yields the best reliability (0.86).
A high variance in Team Orientation and a high degree of Team Orientation yields the lowest
reliability (-0.37) and the highest reliability (0.85) for the combination of a high degree of Team
Orientation and a low spread in Team Orientation.
Case Type Fact1 Fact2 Sig. LL LH HL HH Spread
NPP Urgent DSSupRes DSTO 0,09 0,89 0,96 0,97 0,54 0,44
NPP Non-Urgent DN0pe DSTO 0,08 0,77 -0,26 0,65 0,75 1,03
NPP Non-Urgent DMSO DSTO 0,08 0,60 0,69 0,86 -0,20 1,06

214 Two Cases in High Reliability Organizing: a Hermeneutic Reconceptualization
NPP Non-Urgent DMTO DSTO 0,04 0,57 0,68 0,85 -0,37 1,22
NPP Non-Urgent DS71 DSTO 0,05 0,63 -0,53 0,82 0,80 1,35
NPP Non-Urgent DM1 DSTO 0,06 0,69 0,41 0,91 -1,55 2,47
NPP Non-Urgent DS1 DSTO 0,06 0,69 0,41 0,91 -1,55 2,47
Table 6.64 - Variance in Two-way ANOVA for Team Orientation
H2-9d: The higher the variance in Threat Flexibility, the higher the reliability
On the one-way ANOVA level we have found no evidence for this hypothesis at an acceptable
significant. At the two-way ANOVA level we have found support for this hypothesis in
combination with a high degree for the number of urgent incidents per employee. A low spread
in Threat Flexibility in combination with a low average number of urgent incidents per employ
yields a high reliability as well (0.96).
For the handling of urgent incidents a low spread in Threat Flexibility yields the highest results
when seen in combination with a low degree of several constructs (average number of urgent
incidents per employee 0.96; degree of face-to-face communication 0.96 and spread in face-to-
face communication 0.96; degree of supplementary resources 0.96)
Case Type Fact1 Fact2 Sig. LL LH HL HH Spread
NPP Urgent DN0pe DSTF 0,08 0,96 0,51 0,90 0,97 0,46
NPP Urgent DMFac DSTF 0,07 0,96 0,47 0,89 0,94 0,49
NPP Urgent DMSupRes DSTF 0,06 0,96 0,46 0,89 0,94 0,49
NPP Urgent DSFac DSTF 0,08 0,96 0,42 0,89 0,92 0,54
NPP Non-Urgent DSHRT DSTF 0,09 0,40 0,80 0,86 0,05 0,81
NPP Non-Urgent DSSO DSTF 0,06 0,39 0,86 0,87 0,01 0,86
NPP Non-Urgent DSOther DSTF 0,07 0,73 -0,11 0,45 0,84 0,95
NPP Non-Urgent DMTO DSTF 0,06 0,45 0,84 0,78 -0,11 0,96
NPP Non-Urgent DSDed DSTF 0,08 0,44 0,92 0,89 -0,12 1,04
Table 6.65 - Two-way ANOVA for Spread in Threat Flexibility
H2-9e: The higher the variance in Preoccupation with Failure, the higher the reliability
This hypothesis could not be validated at an acceptable level of significance at the one-way
ANOVA level. For urgent incidents, a high variance in Preoccupation with Failure only yields a
high reliability (0.93) when combined with a high variance in the way teams deviate from
procedure. The way teams deviate from procedure is much more homogeneous, reliability is the

Data Analysis 215
lowest (0.64). The highest reliability (0.96) is obtained with a combination of a low variance in
Preoccupation with Failure and a low variance in the way teams deviate from procedure.
In combination with Team Orientation, the highest reliability (0.93) is obtained with low Team
Orientation and a high variance in Preoccupation with Failure. The lowest reliability (0.03) with a
high degree of Team Orientation and a high variance in Preoccupation with Failure.
Case Type Fact1 Fact2 Sig. LL LH HL HH Spread
NPP Urgent DSPF DS243INV 0,11 0,96 0,73 0,64 0,93 0,32
NPP Non-Urgent DSPF DSSO 0,07 0,37 0,81 0,90 0,05 0,85
NPP Non-Urgent DMTO DSPF 0,09 0,45 0,93 0,76 0,03 0,90
NPP Non-Urgent DSOther DSPF 0,06 0,74 0,00 0,42 0,96 0,96
NPP Non-Urgent DM112 DSPF 0,11 0,58 -0,11 0,52 0,92 1,03
Table 6.66 - Two-way ANOVA for combinations of Preoccupation with Failure
H2-9f: The higher the variance in Sensitivity to Operations, the higher the reliability
The lowest reliability is obtained with a combination of high variance in the degree of Sensitivity
to Operations and a high variance in Threat Flexibility.
Case Type Fact1 Fact2 Sig. LL LH HL HH Spread
NPP Non-Urgent DSSO DSTF 0,06 0,39 0,86 0,87 0,01 0,86
NPP Non-Urgent DMHRT DSSO 0,10 0,45 0,90 0,86 0,10 0,79
NPP Non-Urgent DSPF DSSO 0,07 0,37 0,81 0,90 0,05 0,85
NPP Non-Urgent DSOther DSSO 0,10 0,74 0,00 0,48 0,88 0,88
NPP Non-Urgent DMTeamSize DSSO 0,06 0,48 0,86 0,80 -0,12 0,98
NPP Non-Urgent DN123pe DSSO 0,10 0,64 -0,23 0,52 0,79 1,02
NPP Non-Urgent DM32 DSSO 0,02 0,43 0,85 0,81 -0,31 1,15
NPP Non-Urgent DS32 DSSO 0,01 0,80 -0,50 0,38 0,80 1,30
NPP Non-Urgent DNApe DSSO 0,05 0,60 -0,51 0,57 0,81 1,31
NPP Non-Urgent DN0pe DSSO 0,03 0,63 -0,51 0,50 0,81 1,31
Table 6.67 - Two-way ANOVA for variance in Sensitivity to Operations
H2-9g: The higher the variance in Deference to Expertise, the higher the reliability.
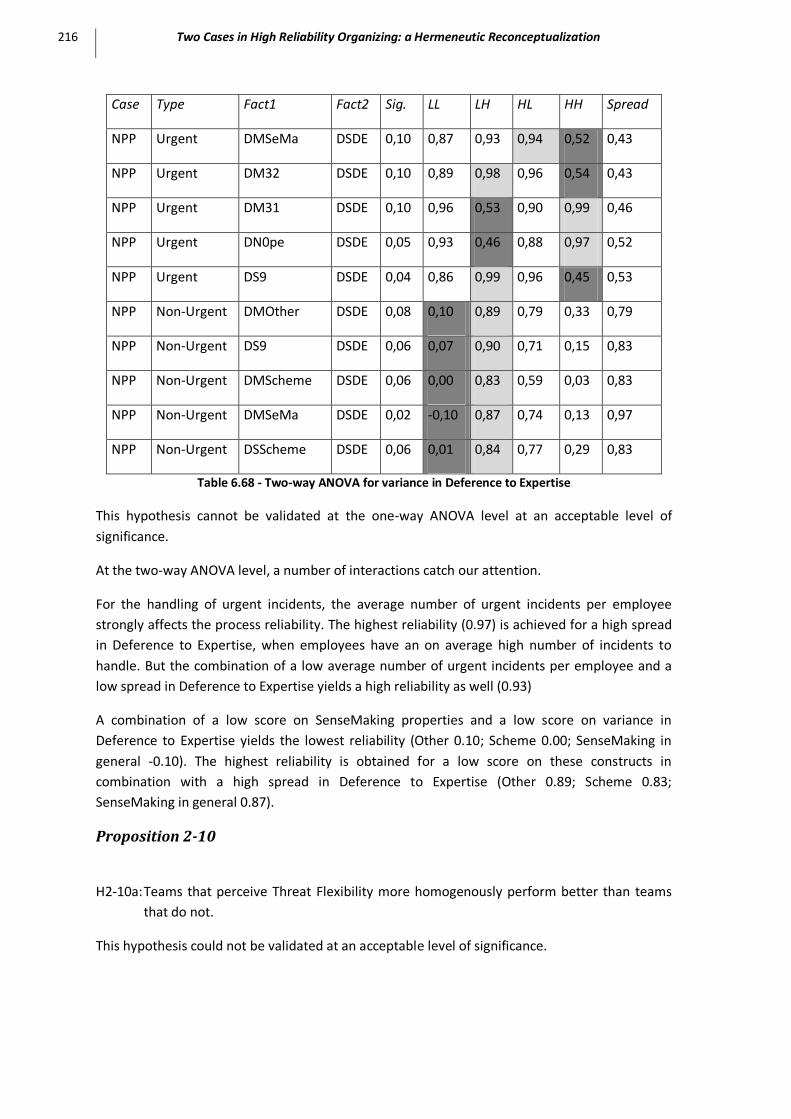
216 Two Cases in High Reliability Organizing: a Hermeneutic Reconceptualization
Case Type Fact1 Fact2 Sig. LL LH HL HH Spread
NPP Urgent DMSeMa DSDE 0,10 0,87 0,93 0,94 0,52 0,43
NPP Urgent DM32 DSDE 0,10 0,89 0,98 0,96 0,54 0,43
NPP Urgent DM31 DSDE 0,10 0,96 0,53 0,90 0,99 0,46
NPP Urgent DN0pe DSDE 0,05 0,93 0,46 0,88 0,97 0,52
NPP Urgent DS9 DSDE 0,04 0,86 0,99 0,96 0,45 0,53
NPP Non-Urgent DMOther DSDE 0,08 0,10 0,89 0,79 0,33 0,79
NPP Non-Urgent DS9 DSDE 0,06 0,07 0,90 0,71 0,15 0,83
NPP Non-Urgent DMScheme DSDE 0,06 0,00 0,83 0,59 0,03 0,83
NPP Non-Urgent DMSeMa DSDE 0,02 -0,10 0,87 0,74 0,13 0,97
NPP Non-Urgent DSScheme DSDE 0,06 0,01 0,84 0,77 0,29 0,83
Table 6.68 - Two-way ANOVA for variance in Deference to Expertise
This hypothesis cannot be validated at the one-way ANOVA level at an acceptable level of
significance.
At the two-way ANOVA level, a number of interactions catch our attention.
For the handling of urgent incidents, the average number of urgent incidents per employee
strongly affects the process reliability. The highest reliability (0.97) is achieved for a high spread
in Deference to Expertise, when employees have an on average high number of incidents to
handle. But the combination of a low average number of urgent incidents per employee and a
low spread in Deference to Expertise yields a high reliability as well (0.93)
A combination of a low score on SenseMaking properties and a low score on variance in
Deference to Expertise yields the lowest reliability (Other 0.10; Scheme 0.00; SenseMaking in
general -0.10). The highest reliability is obtained for a low score on these constructs in
combination with a high spread in Deference to Expertise (Other 0.89; Scheme 0.83;
SenseMaking in general 0.87).
Proposition 2-10
H2-10a: Teams that perceive Threat Flexibility more homogenously perform better than teams
that do not.
This hypothesis could not be validated at an acceptable level of significance.

Data Analysis 217
H2-10b: Teams that perceive efficiency drivenness more homogenously perform better than
teams that do not.
This hypothesis could not be validated at an acceptable level of significance.
Propostion 2-11
Proposition 2-11: The better the fit between SeMa propensity and variety, the higher the
reliability.
H2-11: More Eperienced teams, relying more on SeMa propensity, are more reliable.
This hypothesis could not be validated at an acceptable level of significance.


Discussion 219
Chapter 7 Discussion
The dose makes the poison
Paracelsus (1493-1541)
This chapter discusses the research findings presented in the previous chapter. It successively
addresses the findings from the inter-case comparison (Section 1) and the intra-case evaluation
(Section 2).
1 Comparison of the Bank Case and the NPP Case [RQ1]
In this Section, we discuss how the HRO and SeMa characteristics of the two cases relate to each
other. As we build on the findings from the data analysis, this chapter has an analogous outline
as the previous chapter.
Proposition 1-1
Proposition 1-1: HRO properties are not unique, but HRO propensity levels are.
H1-1: HRO properties will be discernible in the archetypical HRO (NPP) as well as in the
mainstream High Reliability Seeking organization (Bank).
This proposition can be supported for both cases since an exploratory factor analysis describes
constructs with sufficient internal consistency that match the constructs described in HRT
literature from 1999 onwards. That date is important because of the seminal paper by Weick,
Sutcliffe and Obstfeld’s (1999) in which they set the pace for future research on high reliability
by introducing the five HRO constructs described in Chapter 2. Data show that of these five
constructs, three constructs are discernable with sufficient internal validity: Preoccupation with
Failure, Sensitivity to Operations and Deference to Expertise. Only the constructs of Reluctance
to Simplify and Commitment to Resilience cannot be supported. However, with the three
constructs, the Mindfulness criterion proposed by Weick et al. (1999) is covered, as can be seen
from Figure 7.1 (Muhren et al., 2007, p. 579).
The fact that we have found the constructs in itself merely means that our questionnaire
managed to measure the constructs under study. It not necessarily indicates that the
organization under study is an HRO. However, since an exploratory factor analysis has found the
same factors (constructs) in both cases, we can conclude that HRO constructs indeed are present
in both cases.

220 Two Cases in High Reliability Organizing: a Hermeneutic Reconceptualization
Figure 7.1 - Mindfulness (Adapted from Muhren, Van Den Eede, & Van de Walle 2007, p. 579)
Our research findings challenge, the construct taxonomy and description adopted in HRO
research since 1999. Their high face-validity has added greatly to the popularity of the HRO
domain as a discipline, both in academia and in practice. It has tremendous merit in stimulating
thinking on what constitutes high reliability and through Managing the Unexpected (Weick &
Sutcliffe, 2001) it has caught the attention of practitioners in the broader field of High Reliability
Seeking Organizations (Vogus & Sutcliffe, 2007) as well. However, based on our findings we feel
that a reconceptualization of the five classic high reliability constructs is imperative. We refer to
our review of literature (Chapter 2) and posit that after the phase of diverging theorizing on High
Reliability prior to 1999 and the phase of converging theorizing post 1999, time has come for
research to formulate a synthesis of the two schools of thought. In accordance with our research
methodology (Chapter 3) we bridge the characteristics of the Berkeley School (and its long-
established constructs stemming from organization science) and the Michigan School (and its
high face-valid constructs stemming from an accumulated insight into the high reliability
domain).
The constructs that have emerged from our research seem to be capable of bridging the two
schools of thought. Notably, Team Orientation, Threat Flexibility and Efficiency have that
potential because they are capable of explaining what makes teams (or organizations) highly
reliable and because they join in with constructs and research lines from mainstream
organization science, as described in the reconceptualization exercise (Chapter 4).
Complemented with constructs from the Michigan School, namely Preoccupation with Failure,
Sensitivity to Operations and Deference to Expertise, this provides an interesting way of studying
reliability. In both cases the presupposed construct of Commitment to Resilience and Reluctance
to Simplify are not distinguished by a factor analysis. We feel this is not surprising because of the
lack of univocality of these constructs. Reluctance to Simplify stands midway between Sensitivity
to Operations and Preoccupation with Failure (Figure 7.1). With the former the construct shares
its inherent modesty ‘to know that they do not know’ paving the way for seeing the unseeable
HROpropensity
Preoccupationwith Failure
Reluctance to Simplify
Sensitivity toOperations
Commitmentto Resilience
Deference to Expertise
Mindfulness
Resilience
High Reliability

Discussion 221
and its focus on even the smallest error as a sign that something could be wrong with the
system. With the latter it shares its focus on keeping an overview of the ‘Swiss Cheese’ (Reason,
1997). At the bottom end of the HRO construct spectrum, Commitment to Resilience stands
midway between Sensitivity to Operations and Deference to Expertise. With the former the
constructs shares its willingness to look and operate beyond the boundaries of one’s own job
description and management commitment to free up resources whenever necessary in order to
cope with the unexpected. For the latter it paves the way for decision-making authority to be
shifted down to the lowest possible levels. The mutual exclusiveness therefore cannot be
guaranteed70.
Hence, our conclusion that the Michigan school constructs are valuable but that their mutual
exclusiveness does not hold. These constructs have proven to be advantageous for the prima
facie development of HRT as a discipline, but can be considered detrimental in view of reaching
maturity.
Proposition 1-2
Proposition 1-2: The non-archetypical HRO (the Bank) exhibits the same HRO
characteristics as the archetypical HRO (the NPP) but to a lesser extent.
Recall from Chapter 5 that this implies the following hypotheses.
H1-2a: The average HRO propensity at the Bank is lower than at the NPP
H1-2b: The average Team Orientation at the Bank is lower than at the NPP
H1-2c: The average Threat Flexibility at the Bank is lower than at the NPP
H1-2d: The average Preoccupation with Failure at the Bank is lower than at the NPP
H1-2e: The average Sensitivity to Operations at the Bank is lower than at the NPP
H1-2f: The average Deference to Expertise at the Bank is lower than at the NPP
H1-2a: The average HRO propensity at the Bank is lower than at the NPP
This hypothesis is validated. The standard deviation in the NPP is considerably higher though
than in the Bank. This observation is in line with what is suggested by theory, namely that an
archetype like the NPP is more reliable than the Bank as a HRSO. However, the difference is
relatively small. This leads us to comment on this finding in the event of a generalization. Based
on this relatively small difference between the two organization types, and based on our action
research, we feel that the HRO character of a HRSO is manifest. Notably from the interviews, we
recall that the HRO propensity of the Bank was even more obvious than the HRO-likeness of the
NPP. One explanation could be that we suffered from a researcher bias, instigated by the
surprise of finding clear indications of genuine HRO traits. Another explanation could be that the
items used in the survey were unalloyed HRO characteristics, stemming from a HRO jargon. This
set of principles and jargon is more familiar to NPP staff than it is the incident handlers at the
Bank. The HRO likeness of the Bank is much more difficult to seize in the known HRO jargon.

222 Two Cases in High Reliability Organizing: a Hermeneutic Reconceptualization
Apart from being less focused on safety, it is much more novel and revealing. Also in the Bank,
“although the human mortality rate is low, the risk of small failures amplifying into
organizational mortality is high” (Vogus & Welbourne, 2003a, p. 877).
H1-2b: The average Team Orientation at the Bank is lower than at the NPP
This hypothesis is validated. This could be explained by the structural effect revisions have on
teams. Revisions are the yearly scheduled periods where a reactor is completely dismantled for
maintenance purposes (For an elaboration see the NPP Case Description section in Chapter 3).
The rhythm of the revisions is a pace that is felt throughout the plant’s organization (Smals,
2006, p. 36). Apart from the stress during revisions and the relative periods of calm between
them and the implications they have for the employees, this tidal system also has a very direct
effect on team cohesion, interrelation and interaction. During revisions, maintenance teams
work long hours and have crammed schedules for the entire length of the revision, which can
last up to about six weeks. In these periods, workers are continuously in very close contact with
each other, especially within individual teams. This strengthens the bonds between team
members and builds very strong social structures. As one executive noted during an interview:
“*…+ these men go through war four times a year”. This comparison may seem a bit exaggerated,
but indeed, the loyalty that team members have for each other and the strong cohesion within
teams may not be very different in nature from the social structures found in army battalions
(Smals, 2006, p. 36). This observation was felt to a lesser extent only during our field
observations in the Bank. The absence of activities that are comparable to the NPP’s revisions
can be seen as an explanation. The moments of tight-coupling are much rarer in the Bank
context than in a NPP setting (Perrow, 1999).
H1-2c: The average Threat Flexibility at the Bank is lower than at the NPP
This hypothesis could not be validated, but the difference is only marginal. This is surprising in
one way, because we had an a priori belief that a NPP, as an HRO archetype, would show a
higher score on this exponent of resilience. The development of knowledge and skills to cope
with and respond to errors, capability for swift feedback and swift learning, speed and accuracy
in communications, flexible role structures, quick size-ups, experiential variety, skills at re-
combining existing response repertoires, and comfort with improvisation (Weick & Sutcliffe,
2001, p. 67-68), are in line with the elasticity (van Fenema, 2005) associated with Threat
Flexibility. Since Sutcliffe and Vogus (2003) suggest that resilience emerges from Threat
Flexibility, and that resilience is omnipresent in a NPP, Threat Flexibility should be clearly
observable as well. On the other hand, this observation may not come as a surprise. We point
out three reasons: First, a NPP is also an archetype of an organization that is driven by procedure
and where deviation from procedure is considered a capital error. This characteristic overrides
Threat Flexibility traits because it leaves no room for degrees of freedom. Second, Threat
Flexibility presupposes that information and resources are plenty available and that control is
not tightened in up-tempo times. The NPP we have studied does the opposite. Thirdly and
finally, it can be argued that a NPP is not a genuine HRO archetype but a URO (Chapter 4). Like
the plants senior manager and several other interviewees repeatedly said to us: ‘in case of
doubt, there is no doubt’, meaning that they adopt an ultraconservative position towards the
plant’s safety. The position that NPPs are not HROs is a bit provoking maybe, but we feel

Discussion 223
Amalberti et al. (2005) are right when they put NPPs outside of the set of HROs and position
them under the set of ultra-safe organizations. Drawing on Amalberti and colleagues (2005) and
their research in the context of safety in health care as a starting point, we label this
organization typology a URO, an Ultra Reliable Organization. Keeping in mind what we have said
on the relation between safety and reliability (Chapter 1), we can translate this framework into a
new framework that changes the angle of safety for the angle of reliability. The result is the
characterization of a new type of reliable organization, which we label ‘Ultra Reliable
Organization’, or under its acronym URO.
The arguments for the discrimination between HRO and URO are important and are
concentrated around the premise of safety first, with the quality of work preserved against
unacceptable pressure (URO) instead of production first, with the degree of safety as high as
possible for the imposed level of reliability (HRO). Regarding the stability of the process, a URO is
determined by a well-codified and delineated area of expertise and ultra-dominant, rule-based
behavior. A HRO on the other hand, is determined by a broad area of expertise and frequent
knowledge-based behavior. The process reliability, in terms of risk per exposure, is better than 1
x 10-5, possibly 1 x 10⁻⁶ for the URO and better than 1 x 10⁻⁴ for an HRO (Amalberti et al., 2005, p.
762).
In our view, however, the above categorization does not mean that High Reliability
Organizations are inferior to Ultra Reliable Organizations. In fact, we argue the opposite: HROs
are better than UROs. The context in which HROs have to perform is much more tiring than is
the case of the UROs. But then again, also being Ultra Reliable is not an achievement either. It is
only that the measures that have to be taken to guarantee this level of reliability are different as
regards scope, intensity and level of application.
H1-2d: The average Preoccupation with Failure at the Bank is lower than at the NPP
This hypothesis is validated. Before the installment of a culture of collective mindfulness, the
odds are that staff and management will deny the possibility of an unexpected event with
disastrous consequences, or at least they will rationalize away the potential consequences
(Weick & Sutcliffe, 2001, p. 92). As people implicitly become more conscious about the ways in
which the system can be disrupted, what might go wrong, and who these disruptions are likely
to harm, mindfulness increases (Weick & Sutcliffe, 2001, p. 92). Because of this increase in
mindfulness, organization members now will explicitly accept that the unexpected can happen,
or even that it will happen. In addition, such explicitism will reinforce consciousness
considerably. From the qualitative part of our research (Chapter 3), we have learned that such
an attitude was more manifest in the NPP than in the Bank. The NPP expects bad things to
happen, whereas the Bank expects a normal course of events. The system dynamics effect just
described therefore is reinforced in the NPP, more than it does in the Bank, and the result is a
strong awareness that they are dealing with something out of the ordinary. In several interviews
with NPP staff, we heard the same saying repeatedly: ‘We are not a cookie factory’.
The NPP has several mechanisms in place to safeguard this Preoccupation with Failure. One of
them being the extensive training sessions on the simulator for teams from the operations
department or improvised incident handling for teams from the maintenance department. From
a social-constructionist perspective on learning (Kolb, 1976), it is not necessarily the empiric

224 Two Cases in High Reliability Organizing: a Hermeneutic Reconceptualization
experience that triggers the learning, but somewhere in the process it is activated (Figure 7.2). A
specific experience is needed for learning. The remarkable thing in HROs is that there is not
necessarily such an experience and that – still – learning does take place. The organization
(members) learn(s) from the non-event and give(s) it the status of an event. At best, it are small
incidents or near misses, at worst, it are merely hypothetical ones, like in a simulation exercise.71
HRO staff have developed multiple learning styles, hence their capacity to start learning at
nearly every phase of the learning cycle depicted in Figure 7.2. Anyway, it will be clear that this is
not an automatism and that a long-term continuing of such an effort should not be taken for
granted. Paradoxically, in this respect an HRO’s success becomes its major enemy (Miller, 1993).
Figure 7.2 - Learning Cycle (Kolb 1976)
H1-2e: The average Sensitivity to Operations at the Bank is lower than at the NPP
This hypothesis is validated. Staff at the NPP, more than at the Bank, were constantly wondering
when, where, what and why something was happening. They constantly were developing and
adjusting their ‘big picture’. The system of ex-ante incident reporting is far more developed than
at the Bank, so that this well-developed situational awareness manages to deal with errors when
they are still tractable and can still be isolated. When confronted with the Swiss Cheese model
(Reason, 1997) interviewees recognized and appreciated this framework more than their Bank
counterparts. The activity of constantly trying to find out where the holes are located in the
cheese is more manifest in the NPP than in the Bank. Quoting Weick et al. (1999, p. 92-93): “One
byproduct of this increased attentiveness to all failures is that in contrast to their inconsequential
role in traditional organizations, maintenance departments in HROs become central locations for
organizational learning *…+. Maintenance people come into contact with the largest number of
failures, at earlier stages of development, and have an ongoing sense of vulnerabilities in the
technology, sloppiness in the operations, gaps in the procedures, and sequences by which one
error triggers another. These observations enlarge the database for learning and are given
detailed attention”. This is what gives the NPP predictability and efficiency, but this also what
gives it its rigidity and crudeness.
Specific
experience
Generalization
& Creation of
abstract
concepts
Observation
& Reflection
Testing of the
concepts in
new situations
Specific
experience
Generalization
& Creation of
abstract
concepts
Observation
& Reflection
Testing of the
concepts in
new situations

Discussion 225
H1-2f: The average Deference to Expertise at the Bank is lower than at the NPP
This hypothesis is validated. Deference to Expertise is reported as a NPP hallmark (Bourrier,
1996). The flexibility and adaptability of a NPP assures that any problem can rapidly receive the
attention it requires at all levels of the organization (Bourrier, 1996, p. 109). What we have
learned in the field from our (in-real time and in person) witnessing a quite serious incident, is
that errors are inevitable. The main characteristic of HROs is not that they are error-free, but
that errors do not disable them (Bellamy et al., 2005;Weick & Sutcliffe, 2001). Deference to
Expertise is an alternative formulation of the capacity of behavioral discretion, which is one of
the causes of coupling (Orton & Weick, 1990). Behavioral discretion relates to the capacity for
autonomous action (Orton & Weick, 1990, p. 210). This behavioral discretion is not observable
during the NPP’s normal operation, but becomes manifest during up-tempo events like the
incident we have witnessed.
What people in HROs have mastered is the ability to alter typical hierarchical patterns of
deference when the tempo of operations changes and unexpected problems arise. Decisions are
then made on the front line by people who have the most expertise, regardless of their rank. In
these situations, expertise and experience are usually more important than rank, so the decision
structure in HROs is a hybrid of hierarchy and specialization. Decision-making authority
therefore is shifted down to the lowest possible levels and clear lines of responsibility need to be
called into existence (Ericksen & Dyer, 2005, p. 29). This way, the shift to anarchy is a controlled
one, and comes from a collective, cultural belief that the necessary capabilities lie somewhere in
the system and that migrating problems will find them (Muhren et al., 2007). The system is
designed “to oscillate effectively between various preplanned solutions to the more predictable
aspects of a disaster circumstance and improvised approaches for the unforeseen and novel
complications that often arise in such situations” (Bigley & Roberts, 2001, p. 1282).
Proposition 1-3
Proposition 1-3: The higher the requisite variety of a team, the higher its HRO propensity
H1-3a: Teams using richer media exhibit a higher HRO propensity.
In the Bank Case, no proof found for validation/falsification of this hypothesis neither at the one-
dimensional level, nor for the urgent, or for the non-urgent incidents. In the NPP Case, this
hypothesis can be validated for non-urgent incidents only. Teams that show a diverse use of
telephone in the handling of incidents (in general) achieve a higher reliability than teams that
have the same tendency (regardless of the kind of inclination, positive or negative) towards the
reliance on telephone. This finding challenges the hypothesis put forward by research on media
richness (Daft & Lengel, 1986;Dennis, Fuller, & Valacich, 2008) and is in line with our findings
from a case study in ongoing crisis situations (Muhren et al., 2009) that adds more nuance to the
debate. H1-3a: Teams using richer media exhibit a higher HRO propensity. For instance, teams
that rely more on face-to-face communication exhibit a higher HRO propensity. Drilling down to
the level of the HRT sub-constructs, we see that especially Deference to Expertise and Sensitivity
to Operations are accountable for this observation. Richer media offer more occasions for
discovering subtle clues that might lead to a solution for the incident.

226 Two Cases in High Reliability Organizing: a Hermeneutic Reconceptualization
Waterman (1990) reports on team composition as an area often overlooked. He argues that
membership of teams is crucial in their success: when membership is too homogeneous,
reliability usually suffers. Studies in which very bright experts comprise a team, have been
shown to underperform due to competition, abstractness, and individual rather than Team
Orientation by members. Some of the considerations offered by Waterman are (1) to make sure
styles are diverse and complementary. Diverse styles ensure that all perspectives on a problem
are covered and different skills are brought to bear at stages of problem solving. However,
greater diversity requires more time to be spent on acquaintance, team building, and conflict
resolution; (2) that members should have relevant and diverse skills; (3) to get experienced team
players or develop them.72
H1-3b: More experienced teams exhibit a higher HRO propensity.
For the Bank Case, this hypothesis cannot be validated for the HRT construct as a whole but,
data show allow for conclusions at an acceptable level of significance for four constructs:
Preoccupation with Failure and Deference to Expertise and for Threat Flexibility and Logics of
Action. Regarding Preoccupation with Failure, it can be derived that more experienced teams are
showing a higher score in this construct than less experienced ones. This might be because these
teams have experienced more things going wrong than teams with less experience in the field.
On the other hand, less experienced teams show a higher degree of Deference to Expertise than
more experienced ones. This observation that less experienced teams exhibit a higher score on
Deference to Expertise constructs, could be explained by a drive among younger staff members
and a higher intrinsic motivation to achieve and to conform to the image of the ideal employee.
It can be presupposed that the need to be self-efficacious is greater among less experienced,
and on balance younger, staff. The same goes for the construct Logics of Action. Recalling the
underlying items, more particularly regarding the perception of being sufficiently trained and
experienced (survey item 22.4) and having a sufficient degree of freedom for doing the job
(survey item 22.2), we can argue that that same drive accounts for this observation. A plausible
explanation for the fact that less experienced teams exhibit a high score on the construct of
Logic of action regarding the third construct item, namely the number of informal contacts
within the organization to solve problems (13.6) could be that teams with little experience value
an informal network more than people with more experience. Together with the gaining of
experience, the need for developing an informal network decreases. The effect thereof is faded
by the two other items. These findings seem to indicate that being HRO-like is a lifetime
achievement and that there must be moderating variables that come into play.
For the NPP Case, this hypothesis cannot be validated at an acceptable level of significance. This
suggests that experience has no statistically significant impact on HRO propensity. This can be
explained through a homogenizing effect of working at a NPP, which is driven by this one
common interest of ‘safety first’ (Smals, 2006). Not a single occasion to emphasize the necessity
for sufficient attention to the safety aspects of one’s work is missed. In situations where a choice
must be made between giving priority to production or avoiding any unnecessary risks, safety
aspects always put more weight in the scale (Schulman, 1993a;1993b;La Porte & Consolini,
1991;Creed et al., 1993). Decisions on lower hierarchical levels that place safety above efficiency
of operations are never disputed by higher management or peers of the decision maker. Indeed,
the demand to work in the securest possible way is perhaps one of the most apparent aspects of

Discussion 227
the plant’s organizational culture and it permeates through the entire organization. When
planning jobs that involve exposure of personnel to radiation, a principle is applied that urges
planners to keep doses as low as possible: ALARA, which stands for As Low As Reasonably
Achievable (Prasad, Cole, & Haase, 2004), a principle that is well-known in every industry where
people come into (indirect) contact with radioactive substances (Smals, 2006, p. 35).
Proposition 1-4
Proposition 1-4: The higher the requisite variety of a team, the higher its SenseMaking
propensity
H1-4a: Teams using richer media exhibit a higher SenseMaking propensity.
In the Bank Case, this hypothesis cannot be validated overall. Yet it is validated for the SeMa
sub-construct Self. A similar observation can be made in the NPP Case where although the
hypothesis cannot be validated at an acceptable level of significance, drilling down to the level of
the SeMa sub-construct Other is validating the hypothesis. The different observation in the Bank
and in the NPP is interesting. First, the correlation between Self and media richness in the Bank
Case is revelatory because it suggests the importance of the way people construct identity for
the design and use of communication systems. From the perspective of SenseMaking, who we
think we are (identity) as organizational actors lies primarily in the hands of others: “How can I
know who we are becoming until I see what they say and do with our actions?” (Weick et al.,
2005, p. 416). Notably the degree of emotional involvement with the job and the sense of honor
in doing the job right is an important factor with respect to media richness. People create their
reality by making decisions based on what they observe and who they are. Teams that have a
higher propensity to Identity Constructing do rely more on rich media for their communication.
Second, the correlation between Other and media richness in the NPP Case is quite startling as
well because it suggests the importance of the way people work together towards a common
goal. Other people are integral to our efforts to make sense of things because what we say,
think, or do is contingent on what others say, think, and do. People learn about events when
they compare what they see with what someone else sees and then negotiate some mutually
acceptable version of what really happened (Weick, 1985). Our data show that staff at the NPP
has a preference towards using rich media for this aspect of SenseMaking. The interpretation we
give to this finding is that it is a consequence of the NPP’s strong score on Team Orientation.
They are two sides of the same coin.
These findings have implications for the way communication systems are designed and
implemented at the Bank and the NPP. The question arises in which way this correlation induces
causality. If there is causality, is it that the SeMa propensity influences the media preference, or
is it that the preference for a certain type of media leads to a certain degree of SeMa
propensity? The design of this study does not permit us to pronounce upon this question.
However, we can refer to a field survey we have conducted in the Democratic Republic of Congo
(Muhren et al., 2009), studying the relevance of SenseMaking for communication. Analyzing
communication and SenseMaking data obtained from in-depth interviews shows that
humanitarian actors in the DRC engage in eight different SenseMaking communication activities:
noticing, updating, inquiring, triangulating, verifying, reflecting, enacting, and interpreting.
Throughout our analysis, we have studied SenseMaking at the level where the goal of

228 Two Cases in High Reliability Organizing: a Hermeneutic Reconceptualization
communication is to reach individual understanding rather than shared understanding. We have
also observed that the communication process does not start with the sending of a message, but
incorporates making sense of the situation. Studying communication processes from a
SenseMaking angle therefore provides a more holistic view of the communication process. Our
findings also show that social interaction and enactment are vital for actors in the DRC to reach
individual understanding, and that low synchronicity media will not provide for the best support
in achieving this. Instead, actors will rather need high synchronicity media for these conveyance
processes. Because of the continuous needs of building a SenseMaking communication
infrastructure, designers of Information and Communication Systems (ICS) should allow users to
connect. In contrast to how most of the ICS are designed and developed, they should not solely
focus on institutional information and communication exchanges, but support exchanges in
these mostly informal, personal based networks. The scanning media example of social
networking software will for instance enable humanitarian actors to create and maintain their
important network of contacts.
H1-4b: More experienced teams exhibit a higher SeMa propensity.
In the Bank Case, we found no proof for this assertion for the SeMa root construct, but when
drilling down to the level of the sub-constructs a falsification for the hypothesis could be
provided. Teams with a lower score on Scheme, are more experienced on average than teams
exhibiting a higher score on Scheme. We recall from the reconceptualization chapter (Chapter
4), that a Scheme is a mental structure people rely on to organize information they come across,
based on previous experiences and suitable for present and future SenseMaking (Ericson, 2001,
p. 117;Graesser et al., 1979). The construct refers to the Retrospective, Enacting, Cue Extracting
and Plausibility SenseMaking property. It represents one’s understanding of the world by filling
in white spots where information is missing (Gioia & Poole, 1984). The collection of cognitive
schemes of people in a team or an organization is what is called its ‘cognitive profile’ (Ericson,
2001, p. 118). Several scheme-building methods are available. We categorize them as (1)
decision making and (2) SenseMaking. The falsification of the hypothesis is remarkable and calls
for further theorizing. It suggests that the more experienced a team is, the less it relies on what
is plausible, but that they are more driven by accuracy and ratio. Prima facie, we have found this
conclusion hard to explain, because we assumed that the higher the level of experience, the
smaller the importance of ratio and accuracy, the smaller the reliance on DecisionMaking, the
more intuitive work would become. However, more experienced teams have gained a much
higher degree of confidence in their work that they rely on a sound set of heuristics, scenarios
and short-cuts that have proved their value in the past. It can be assumed that such a set is
gradually developed at a lower level of maturity – basically through SenseMaking – but that after
its emergence this set has started to live a life on its own as on-the-shelf solutions for the
majority of situations. The fact that less experienced teams exhibit more orientation towards
SeMa is in line with this induction. Because of their lack of experience, they are confronted more
with gappiness (Dervin, 1999) and need to make sense of situations. From the moment ‘sense is
made’, maturity is gained but time will have gone by so that their experience (expressed and
measured as the number of years of experience in the job) will have increased as well. At the
same time gaps are filled and replaced with (for instance) rules of thumb that have an aura of
ratio and accuracy.

Discussion 229
In the NPP Case, this hypothesis can be falsified. Teams with a lower level of experience perform
better in the handling of urgent incidents. The fact that lower experience can lead to a higher
level of reliability for urgent incidents possibly could be explained by a mental or physical
fatigue. As an explanation, we refer to the notion of Hypervigilance (Janis, 1982a), addressed
earlier in this discussion. This calls for urgent special action on the side of the NPP’s
management.
The above theorizing is done ceteris paribus, under stable conditions. However, when
circumstances would change, the SenseMaking function would not necessarily be decreasing
linearly. For instance, if the situation changes dramatically with ‘the unexpected’ happening,
with ambiguity regarding cause and effect, a new phase of ambiguity (gappiness) would emerge.
This increase in complexity would lead to a rather sudden increase of the SenseMaking
propensity (and function) to the detriment of the DecisionMaking propensity. This is shown in
Figure 7.3, with the explosion icons representing an unexpected event with a possible severe
impact.
This sheds some light on the SenseMaking mechanism and makes the construct more nuanced.
It would mean that SenseMaking propensity is not a static property, but evolves over time.
Figure 7.3 - The Evolution of SenseMaking Propensity
Time
Propensity
SenseMaking
DecisionMaking
Complexity

230 Two Cases in High Reliability Organizing: a Hermeneutic Reconceptualization
Proposition 1-5
Proposition 1-5: The non-archetypical HRO (the Bank) exhibits the same HRO
characteristics as the archetypical HRO (the NPP) but with a lower
variance.
Taking the standard deviation as a measure of this variance (spread), we come to the validation
of the following hypotheses:
H1-5a: The variance in HRO propensity at the Bank is lower than at the NPP
H1-5b: The variance in Team Orientation at the Bank is lower than at the NPP
H1-5c: The variance in Threat Flexibility at the Bank is lower than at the NPP
H1-5d: The variance in Preoccupation with Failure at the Bank is lower than at the NPP
H1-5e: The variance in Sensitivity to Operations at the Bank is lower than at the NPP
These hypotheses are validated. Burke et al. (2005) notice that it is very unlikely that everyone in
the HRO sees the big picture, because of the system’s complexity. In line with what is suggested
by NAT on the interactive complexity of the nuclear energy sector, this explains why the spread
in Sensitivity to Operations in a NPP is higher than in a Bank.
H1-5f: The variance in Deference to Expertise at the Bank is lower than at the NPP
This hypothesis is validated. The higher variance for the NPP teams is not in line with what we
would have expected at the start of our research, were literature review – at least implicitly –
seemed to suggest that a homogenous HRO propensity was a characteristic of the archetypical
HRO. However, from our field observations, interviews and system dynamics modeling exercises
(See Chapter 3), we came to challenge this belief and questioned the HRO homogeneity of the
NPP. The variance in HRO propensity can be seen as following the principle of requisite variety.
As we have described in the Introduction chapter, organizations tend to simplify the complexity
of their environment to the extreme and therefore seem to be caught in seeing homogeneity as
a magic formula for success and consider team homogeneity as a management ideal. In order to
cope with complexity, some requisite variety is necessary. Therefore, more divergence in an
organization’s HRO propensity, paradoxically enough, is stronger an indication of HRO
propensity than less divergence. This is where HRO propensity and SenseMaking propensity
meet. Indeed, also the need for SenseMaking is the consequence of the drift to simplify to the
extreme. This simplification concerns both the way reality is observed and the way an
organization tends to homogenize its constituent parts, including its people.

Discussion 231
Proposition 1-6
Proposition 1-6: The non-archetypical HRO (the Bank) exhibits the same SeMa
characteristics as the archetypical HRO (the NPP) but with a lower
variance.
H1-6a: The variance in SenseMaking propensity at the Bank is lower than at the NPP
H1-6b: The variance in Self-propensity at the Bank is lower than at the NPP
H1-6c: The variance in Other propensity at the Bank is lower than at the NPP
H1-6d: The variance in Scheme propensity at the Bank is lower than at the NPP
H1- 6a: The variance in SenseMaking propensity at the Bank is lower than at the NPP
The hypothesis regarding the aggregated (root) SeMa construct is falsified. However, two out of
three of its underlying sub-constructs can be validated.
H1-6b: The variance in Self propensity at the Bank is lower than at the NPP
This hypothesis is falsified.
H1-6c: The variance in Other propensity at the Bank is lower than at the NPP
This hypothesis is validated.
H1-6d: The variance in Scheme propensity at the Bank is lower than at the NPP
This hypothesis is validated.
The idea behind the proposition is that a low variance, i.e. a high degree of homogeneity is
counter-indicative for high reliability, as well for the HRO propensity as for the SeMa propensity.
In general, the findings for H1-1-6c and H1-1-6d therefore are in line with this supposition. The
falsification regarding the Self construct (H1-1-6b) is also responsible for the falsification of the
SeMa root construct (H1-1-6a). It can be explained as a NPP idiosyncrasy of taking an extreme
pride in one’s job. For instance, the imposing technical plant facility, the direct link between the
job and the education and training received, the macho culture (almost a 100% male working
environment), the intensive training sessions or the employee of the month contest, are
plausible explanations.
Proposition 1-7
Proposition 1-7: The constructs of Mindfulness and Resilience interrelate
H1-7a: The higher a team’s Preoccupation with Failure, the lower its Deference to Expertise.
We have not been able to validate this hypothesis in the Bank Case, whereas in the NPP Case it is
falsified. This finding is in line with what is – at least implicitly – suggested by HRO scholars,
namely that it is possible to be resilient and mindful at the same time. It is in line with the ex
posteriori interpretation of the qualitative part of the research, where nor the outcomes of the

232 Two Cases in High Reliability Organizing: a Hermeneutic Reconceptualization
interviews, nor the outcomes of the GSS workshops indicated that such combination would be
impossible.
H1-7b: Mindfulness is a prerequisite for Resilience.
We have been able to validate this hypothesis for the Bank Case as teams with a low degree of
Deference to Expertise exhibit a low score on Sensitivity to Operations. It has been impossible to
validate the hypothesis for the NPP Case at an acceptable level of significance.
This indicates that it is possible to be simultaneously mindful and resilient. Interesting is the
difference in observation between the constructs ‘Sensitivity to Operations’ – which is as we
have shown in Figure 7.1 and as developed earlier in this discussion chapter an exponent of
Resilience – and ‘Preoccupation with Failure’, as an exponent of Mindfulness. The notions of
Mindfulness and Resilience introduce a paradox: Mindfulness is the enemy of resilience. An
organization that tries to be mindful has a better chance of being stable in the long short
because it avoids intrusions on its processes. The organization is not endangered and can
continue to operate as it is used to; business as usual. An organization that tries to be resilient,
on the other hand, has a better chance of being stable in the end because it has learnt how to
deal with intrusions in its processes. We refer to the result of the interview with a head of a
mainframe department in the Bank who pointed out the danger in becoming very successful in
operating their mainframe infrastructure. The same story could be heard while interviewing
personnel from the NPP who argued that younger staff did not have the experience the older
staff has on dealing with the teething troubles of nuclear installations: “The machinery is running
smoothly, too smoothly”.
The relationship between Mindfulness and Resilience (Figure 7.1) is not univocal. It is fuzzy, but
hence also more interesting and useful. Both constructs are like Siamese Twins: They cannot live
with each other, but neither can they live without each other. Like in all cases where paradox
arises, it is good to realize that paradox is essential in keeping “the organization on its toes, in a
state of continuous awareness of its own contradictions”.
Proposition 1-8
Proposition 1-8: The NPP is more reliable than the Bank
H1-8: The NPP is more reliable than the Bank
Based on the criterion of range (minimum vs. maximum value) for inter-case comparison of
process reliability, we have found that the Bank is more reliable than the NPP regarding the
overall handling of incidents, more reliable than the NPP with respect to the urgent incidents
and less reliable than the NPP in the handling of non-urgent incidents.
The Bank’s higher reliability is a remarkable observation. A priori, we would not have expected
that a garden variety HRO would exhibit higher reliability, than an archetypical HRO like a NPP.
We believe this situation can be explained in three ways. The first two reasons are technical, the
last reason provides a more fundamental explanation.
First, the technique we have used is far from perfect because it uses range as a measure. Even
though we have smoothed the extreme effect of range by calculating the average range, it still is
not ideal as a measure for reliability. Second, the definition of what is urgent and non-urgent is

Discussion 233
quite different between our two cases. Time-horizons are much longer in the NPP compared to
the Bank, whereas the level of complexity in the NPP is much greater than in the Bank (number
of actors involved, safety issues, external regulations, etc.). This might explain in part this
unexpected observation. Third, the observation that the Bank is more reliable (than the NPP) for
the urgent incidents, does not come as a complete surprise. The Bank pays particular attention
to the timely handling of urgent incidents. In order to meet deadlines, it has in place numerous
procedures, roles, communication lines. Amongst others: (1) the morning briefings where all
urgent incident of the past 24 hours are discussed; (2) the Service Delivery Owner who as a
boundary spanner takes ownership of the incident and whose job it is to resolve the incident in
the quickest possible time-frame; (3) publication of the incident status on the company intranet,
creating a considerable visibility throughout the organization; (4) intense senior management
commitment and personal follow-up to name just these. We refer to the case descriptions
(Chapter 3, Section 2) for an elaboration of these measures. From interviews can be learned that
the NPP, at the time we were studying it, had pointed out that the timely handling of its urgent
(i.e. non-planable) Maintenance & Repair work was a major concern, whereas this was not
reported upon as a problem with respect to the non-urgent work.
2 Measuring Reliability [RQ2]
In this Section, we discuss how organizational characteristics influence reliability. We do so for
each proposition separately.
Proposition 2-1
Proposition 2-1 : The higher the HRO propensity, the higher the reliability.
H2-1a: Teams exhibiting a higher propensity towards Team Orientation yield better reliability in
the handling of urgent incidents, whereas this is counterproductive for the handling of non-
urgent incidents.
H2-1b: Teams exhibiting a high propensity towards Team Orientation and exhibiting a high
degree of Sensitivity to Operations yield a higher reliability than teams than the same teams
exhibiting a low degree of Sensitivity to Operations.
H2-1c: The higher the average Threat Flexibility, the higher the reliability.
H2-1d: Teams that operate in a less restrictive (more supportive) organizational climate perform
better than teams that do not (Smith-Crowe, Burke, & Landis 2003).
H2-1e: Teams that operate in a less efficiency-driven (more slack) organizational climate
perform better than teams that do not.
H2-1a: Teams exhibiting a higher propensity towards Team Orientation yield higher reliability in
the handling of urgent incidents, whereas this is counterproductive for the handling of
non-urgent incidents.
Neither for the Bank nor for the NPP Case, evidence can be been found for this hypothesis. Such
could indicate that there is no one-dimensional effect of Team Orientation on reliability

234 Two Cases in High Reliability Organizing: a Hermeneutic Reconceptualization
(positively nor negatively inclined). Other effects might play a role, as is shown by the two-way
ANOVA that do lead to significant observations. In view of the all-in-all small number of units of
analysis (n=37) this observation is remarkable, because if one were to expect significance it
definitely would be for the one-way ANOVA and not for the two-way ANOVA. This is a strong
indication for the thesis that based on existing literature there is no univocal formula for HRO
success, but that contingency theory applies.
H2-1b: Teams with a high propensity towards Team Orientation and exhibiting a high degree of
Sensitivity to Operations yield a higher reliability than the same teams exhibiting a low
degree of Sensitivity to Operations.
Neither for the Bank nor for the Bank Case, have we found evidence for this hypothesis at an
acceptable level of significance.
2-1c: The higher the average Threat Flexibility, the higher the reliability.
In the Bank Case we have falsified this hypothesis. For urgent incidents, a low average score on
Threat Flexibility results in the highest reliability. At the NPP, the highest reliability is achieved by
teams with a high score on Threat Flexibility in combination with a high score on SeMa and HRT
constructs, regardless of the incident type. Remarkable in this respect is the observation that a
low degree of Threat Flexibility in combination with a low score on SenseMaking and HRT
constructs yields a high reliability as well. Combinations of a high degree on the constructs under
study yield the highest reliability when they are directly proportional. Therefore, the conclusion
should be that two strategies are worth considering: (1) high Threat Flexibility in combination
with a high degree of SenseMaking propensity and with a high degree of HRO propensity.
H2-1d: Teams that operate in a less restrictive (more supportive) organizational climate perform
better than teams that do not.
The construct covering the degree of supportiveness is Threat Flexibility.
For the Bank Case, we have found evidence for the falsification of this hypothesis, namely that
where the handling of urgent incidents (threat) is concerned, a more restrictive (less supportive)
degree of Threat Flexibility is positively influencing reliability, regardless of any mediating
variable. We notice however that the spread between the highest and lowest expected average
reliability is a little lower than the average spread. At this one-way ANOVA level, we have found
no sufficient significance for the non-urgent incidents. For the NPP Case, we have found no
significant proof for this hypothesis. Nor for the urgent incidents, nor for the non-urgent
incidents, the degree of restrictiveness/supportiveness of Threat Flexibility is positively
influencing reliability, regardless of any mediating variable.
This may indicate that Threat Rigidity is not necessarily a bad strategy after all, meaning that
restriction of information, tightening of control, squeezing on the resources favors reliability in
case of critical circumstances. This is challenging work by Sandelands et al (1981) and
complements the Vogus and Welbourne (2003a) study on Threat Flexibility. A rationale behind
this observation could be that the urgency of the incidents does not correspond to the
characteristics of a threat: uncertainty, complexity, ambiguity, etc., and therefore, the
mechanisms behind threat rigidity/Threat Flexibility would not apply. When the incident
Discussion 235
represents a situation that is known or knowable, then heuristics, algorithms and procedures will
provide a valuable assistance in resolving them. In most urgent incidents this is the case. A
restricted leadership style suits such situations better than one that is oriented towards Threat
Flexibility. This puts the Threat Flexibility theme in a new light by making the necessary
differentiations.
Especially in the archetypical context of an NPP where processes are procedure driven par
excellence the Threat Flexibility construct is particularly interesting. During our interviews and
observations, we were confronted at several occasions with the ambiguous attitude towards the
degree of restrictiveness/supportiveness of Threat Flexibility. On the one hand, it could be heard
that sticking to procedures is the conditio sine qua non, especially in situations under stress. On
the other hand, it became obvious that the difference in Threat Flexibility in terms of
restrictiveness/supportiveness has the potential of explaining organizational reliability as well.
Supposedly, this ambiguous and equivocal position of the Threat Flexibility constructs explains
why it shows no significant one-dimensional effect on organizational reliability. This suggests
that a two-dimensional effect bears more promises for explaining the dependent variable.
Our findings are in line with Carley and Zhiang’s (1995) findings that no coordination scheme –
hierarchy or team, or put differently threat rigidity or Threat Flexibility – dominated. Their
research outcome shows that teams outperform hierarchies when the task is unbiased but that
hierarchies can outperform teams when the task is biased if they have the right information
access structure and right level turnover. This strengthens our assertion that work in the NPP
most of the time is not complex, but merely complicated (Bennet & Bennet, 2004), which is
challenging Perrow’s (1999) assertion that a NPP as a whole is an interactively complex
enterprise. The conclusion therefore is that different coordination schemes are optimal for
different tasks.
H2-1e: Teams that operate in a less efficiency-driven organizational climate perform better than
teams that do not.
For the Bank as well as for the NPP, we have found evidence for the falsification of this
hypothesis, concerning the handling of urgent incidents as well as the non-urgent incidents. Both
for the Bank and for the NPP, a higher focus on efficiency is positively influencing reliability,
regardless of any mediating variable. We notice however that the spread between the highest
and lowest expected average reliability is a little lower than the average spread (but
substantially lower for the non-urgent incidents.
This can be explained through the notion of ambidextrous organization (Tushman & O'Reilly,
1997). A so-called ambidextrous organization can operate in multiple modes simultaneously,
managing for short-term efficiency by emphasizing stability and control, and for long-term
innovation by taking risks and learning by doing (Tushman & O'Reilly, 1999). They are
ambidextrous, hosting multiple, internally inconsistent architectures, competencies and
cultures, with built-in capabilities for efficiency, consistency and reliability on the one hand, and
experimentation, improvisation and luck on the other. “They exhibit relatively formalized roles
and responsibilities, centralized procedures, functional structures, efficiency-oriented cultures,
highly engineered work processes, strong manufacturing and sales capabilities and relatively
homogeneous, older and experienced human resources” (Tushman & O'Reilly, 1999). These

236 Two Cases in High Reliability Organizing: a Hermeneutic Reconceptualization
efficiency-oriented units have relatively short time frames and are often relatively large and old
with highly ingrained, taken-for-granted assumptions and knowledge systems. Their cultures
emphasize efficiency, teamwork and continuous improvement. From our findings, it can be
supposed that the Bank’s incident management is a process that bears all the hallmarks of one
side of the ambidextrous organization.
For the NPP Case, we have found no evidence for any of the HRO constructs, meaning that we
have not been able to validate this hypothesis. This is in line with the analysis for the Bank Case
where there was no one-dimensional effect of HRO propensity on reliability (positively nor
negatively inclined). Other effects might play a role. In view of the all-in-all small number of units
of analysis (n=24) this observation is remarkable, because if one were to expect significance it
definitely would be for the one-way ANOVA and not for the two-way ANOVA. This is a strong
indication for the thesis that based on existing literature there is no univocal formula for HRO
success, but that contingency theory applies. One of the objectives of this research is to shed
some light on this contingency black box. We do so by examining the balance between
effectiveness and efficiency. We deal with this issue next.
The triangulation between qualitative and quantitative techniques has yielded substantial
additional insights into the nature of HROs. More particularly the insight that:
- the dose makes the poison;
- moderators have a tremendous impact;
- the effect of factors over time can alter;
- the composition of HRO constructs differs from what is suggested in literature;
- some constructs are incompatible;
- there is an undeniable relation between efficiency and effectiveness.
The economic dimension is essential in our approach of High Reliability Theorizing. In that sense,
our view contrasts sharply with dominant HRO literature (Weick et al., 1999) which seems to
suggest that mindfulness is ‘costless’ (Vogus & Welbourne, 2003a, p. 881). However, as pointed
out by HRO researchers like La Porte (1996), Levinthal and Rerup (2006), and Rerup (2005),
ongoing mindfulness comes at a cost. Among these scholars, Rerup (2005) has been the most
vigorous in making the cost and benefit structure of Mindfulness explicit. In that sense he warns
that too much Preoccupation with Failure paints too dark a picture of the situation. Besides, in
pursuit of a blind attempt to minimize the chance of failure, unnecessary and costly adjustments
to routines and practices that worked in the past can be the consequence. A Reluctance to
Simplify interpretation (e.g. the diversity of opinion and multiple perspectives) may similarly
generate too much discussion and too little action, as well as provoking unnecessary skepticism,
preventing the business venture/economic exploitation of good ideas. Sensitivity to Operations
can lead to cognitive overload. Commitment to Resilience can cause a hyper-response triggered
by almost any one clue. If all events are seen as unexpected and important, in the end, nothing
is. Therefore, it is wise to heed as well as to ignore some events and signals. Deference to
Expertise, finally, may also generate ‘noise,’ creating cognitive overload (Rerup, 2005, p. 462).
Theoretically, the ideal degree of mindfulness can be determined and – if one would succeed in
quantifying all the underlying variables and constants – one could determine it mathematically.
This would be an exercise to be dealt with by means of quantitative system dynamics (see:

Discussion 237
future research). We posit however, that regardless of a precise calculation of the optimal
degree of mindfulness, successful HROs explicitly do take into account – if not all, then still most
of – the constants and variable contributing to mindfulness. We refer to a workshop and
conversation with the High Reliability Officers from British Petrolium (Colin Reid) and Shell (Ian
Crawford) at the previous HRO conference (Stewart, 2000).
Proposition 2-2
Proposition 2-2 : The higher the SeMa propensity, the higher the reliability.
H2-2a: The higher the variance in SeMa propensity, the higher the reliability.
H2-2b: The higher the variance in Scheme, the higher the reliability.
H2-2c: The higher the variance in Ongoing, the higher the reliability.
H2-2a: The higher the variance in SeMa propensity, the higher the reliability
In the Bank Case, we have found no significance to support this hypothesis at the one-way
ANOVA level, but at the two-way ANOVA level, a low spread in SenseMaking propensity yields
the highest reliability. In the NPP Case, we have found no evidence for this assumption at the
one-way ANOVA level. At the two-way level ANOVA however, this hypothesis can be falsified. In
general, the higher the spread in SenseMaking, the lower the incident management reliability.
More particularly, in the case of the handling of urgent incidents, a high homogenous degree of
SenseMaking propensity leads to the highest reliability, whereas a high but heterogeneous
degree of SenseMaking propensity leads to the lowest reliability. Univocal SenseMaking
propensity seems to have a clear relevance for the composition of incident response teams
H2-2b: The higher the variance in Scheme, the higher the reliability
At the Bank, we have found no significance to support this hypothesis at the one-way ANOVA
level, but at the two-way ANOVA level, a low spread in SenseMaking propensity yields the
highest reliability. In the NPP, we have found no significant evidence for this hypothesis at the
one-way ANOVA level. At the two-way ANOVA level we can falsify the hypothesis. A high
variance in Scheme results in high reliability in combination with a low spread in the perception
of the availability of Supplementary Resources or with a high variance in the perception of
Pressure.
A low variance in Scheme results in high reliability in combination with a high or low spread in
the perception of the availability of Supplementary Resources or with a high variance in the
perception of Pressure.
H2-2c: The higher the variance in Ongoing, the higher the reliability
In the Bank Case, we have found no significance to support this hypothesis at the one-way
ANOVA level, but at the two-way ANOVA level, a low spread in Enactment yields the highest
reliability. In the NPP Case, this hypothesis can be validated at the two-way ANOVA level where
the combination of larger teams and a more heterogeneous enactment results in the highest
238 Two Cases in High Reliability Organizing: a Hermeneutic Reconceptualization
reliability whereas the combination of larger teams and a more homogenous enactment results
in the lowest reliability.
Teams with more female members that exhibit more enactment properties are highly reliable
whereas they are less reliable when they exhibit less enactment properties. More male teams
are relatively indifferent towards the enactment properties.
Proposition 2-3
Proposition 2-3 : The lower the use of dedicated IS, the higher the reliability.
H2-3: Teams using richer media are more reliable.
Proposition 2-4
Proposition 2-4: The better the fit between HRO propensity and IS use, the higher the
reliability.
H2-4a: Teams exhibiting a high propensity towards Team Orientation, relying on richer media
will yield a better reliability.
H2-4b: Teams relying little on the dedicated IS and exhibiting a higher HRO propensity perform
better than when they rely more on dedicated IS.
H2-4a: Teams exhibiting a high propensity towards Team Orientation, relying on richer media
yield a higher reliability.
In the NPP Case, teams with a high degree of Team Orientation and a high degree of reliance on
face-to-face communication yield the highest reliability in the handling of urgent incidents. This
reliability is very high. When these teams rely little on face-to-face communication their
reliability drops considerably. The reliability of teams with a smaller degree of Team Orientation
is independent from the degree of reliance on face-to-face communication. That the hypothesis
can be validated for urgent incidents can be explained by the fact that teams with a strong Team
Orientation discuss situations on a frequent level. One might suppose that there is a mutual
influence between both constructs. It can be assumed that teams with less orientation on the
team have team members that may be close to each other, thus favoring face-to-face
communication.
H2-4b: Teams relying little on the dedicated IS and exhibiting a higher HRO propensity perform
better than when they rely more on the dedicated IS.
In the Bank Case, higher immediate incident registration in combination with a high
homogeneity in HRO propensity results in the lowest reliability in the handling of urgent
incidents. Lower immediate registration, in combination with a high homogeneity in HRO
propensity, results in the highest reliability, more particularly regarding the homogeneity of the
Deference to Expertise and Preoccupation with Failure constructs. Remarkable is that in case of
non-urgent incidents, the same observation can be made regarding the Preoccupation with

Discussion 239
Failure, but that at the same time also a high reliability is obtained for the combination of a high
degree of variance with a high degree of immediate registration.
Also in the Bank, for urgent as well as non-urgent incidents, teams with a high homogeneity in
incident management focus and a low reliance on the dedicated system for their communication
yield the best reliability whereas they yield the worst reliability when they do rely more. For
non-urgent incidents, a low proportion of time devoted to the handling of incidents in
combination with a high degree of use of Peregrine yields the worst reliability, whereas in
combination with a low reliance on Peregrine yields the best reliability.
At the NPP, teams whose management expects they rigorously stick to procedures and that
homogenously rely on dedicated IS in the handling of incidents score the highest reliability in the
handling of urgent incidents. When these teams are less homogenous in the way they rely on
dedicated IS, their reliability drops considerably. This underlines the relevance of the hypothesis
as a guideline for the design of information systems. Teams whose management allows team
members to deviate more from procedure and that exhibit a high variance in the way they make
use of dedicated IS perform better. The general lesson that can be derived from this evidence is
that user characteristics should be compatible with the procedures that apply to them.
Proposition 2-5
Proposition 2-5: The better the fit between SeMa propensity and IS use, the higher the
reliability.
We have seen that this proposition could not be validated in both our case studies. However, for
the NPP Table 6.57 shows that a high spread in the SeMa propensity Scheme (DSScheme), i.e. a
high homogeneity in combination with a high reliance on voice-based communication tools
yields the lowest performance. This provides an indication that teams in the context of a NPP,
that are homogeneously making sense out of a situation have no advantage in relying on rich
media (voice-based). For them, a uniform dedicated system may be suitable since such systems
allow for much less richness and diversity in communication channels. This does not come at a
surprise in view of the highly standardized nature of the M&R work.
Proposition 2-6
Proposition 2-6: The more balanced the structural organization dimension, the higher the
reliability.
H2-6a: Teams that work under close physical proximity perform better than teams that do not.
H2-6b: Larger teams are more reliable than smaller teams.
H2-6c: Teams with higher incident workload are more reliable than teams with a lower
workload.
H2-6d: Teams with a greater deal of their time allocated to incident management are more
reliable than teams with smaller time allocation.

240 Two Cases in High Reliability Organizing: a Hermeneutic Reconceptualization
H2-6a: Teams that work under close physical proximity perform better than teams that do not.
We have tested this variable by ranking the answer possibilities from little physical proximity to
the IT headquarters, to high proximity. We have found evidence for the hypothesis on two
levels: (1) proximity to the Bank’s IT headquarters (DM4) and (2) team dispersion (DS4). Teams
that (on average) are more based in the Bank’s IT headquarters are performing better than
teams that are not (DM4). In addition, a low spread in physical proximity is better for process
reliability.
Also at the two-way ANOVA level, the results are interesting because of the general observation
that low spread in physical location – i.e. low team dispersion – yields the highest reliability. This
is particularly true for the non-urgent incidents. We also notice that reliability is the lowest when
team dispersion is high. For the urgent incidents, this effect of team dispersion is countered by
the impact of workload.
This finding indicates a strong influence of physical proximity on process reliability. Especially
when seen in combination with the impact of Preoccupation with Failure the conclusions are
important since dispersing a team from the headquarters can seriously negatively moderate the
positive effect of HRO propensity. From the analysis of spread in physical location, we derive
that team dispersion does not seem to be a good strategy either. In general, team dispersion
results in low reliability. These conclusions can have important consequences for work
organization and potentially constitute a modest addition to the large body of research on team
effectiveness.
H2-6b: Larger teams are more reliable than smaller teams.
In the Bank Case, we have found no evidence for this hypothesis at the one-way ANOVA level. At
the two-way level, there is an interaction with time allocated to incident handling work. Team
size in itself does not seem to be a valuable explanation for the Bank’s success. The other
hypotheses under this proposition indicate that the measures that are derived from it do have a
potential of explaining process reliability. In the NPP Case, we have found no proof for the
validation of this hypothesis at the one-way ANOVA level. At the two-way ANOVA analysis level,
it can be derived that in the majority of cases where team size moderates the effect of the
independent variable on the dependent variable, large teams yield a lower reliability than small
teams.
For urgent incidents, the highest reliability is obtained by small teams that perceive high
pressure. On the other hand, small teams that perceive little pressure still yield a high reliability
score. Large teams perceiving high pressure yield the lowest reliability and large teams
perceiving low pressure manage are very reliable. Both Pressure and Team Size are strongly
influencing a team’s reliability, but their combined effect often is counterproductive. The highest
reliability is obtained when their effect is mutually compensating. This can be explained through
Loose Coupling Theory. Small team size (tight coupling) and low pressure (loose coupling), or
vice versa are compensating each other. Judging from the data, when compensation should not
be possible, a low value for both parameters is advisable. This cannot be explained by means of
Loose Coupling Theory, but it could be assumed that the sole impact of operating as a small
team is causing this relatively high reliability.

Discussion 241
Small teams relying little on face-to-face communication are the most reliable, large teams the
least in the handling of urgent incidents. Large teams, for that matter, can consistently increase
their reliability when they (contrary to small teams), rely on face-to-face communication for the
handling of urgent incidents. The first observation can be explained in the same way as above,
namely that the impact of operating as a small team is causing this high reliability. The
combination of large teams (loosely coupled) communicating face-to-face (tightly coupled) can
be explained by Loose Coupling Theory.
Big teams communicating considerably through the dedicated system, yield the lowest
reliability, whereas big teams that do not do so, see their reliability increase spectacularly. Small
teams relying heavily on the dedicated system are the most reliable.
Again, it is shown that the influence of being a small team is important, but remarkable is the
positive impact communication through a dedicated system can have, even with larger teams.
The positive result of the combination of little use of dedicated systems for the communication
(loose coupling) and bigger teams.
H2-6c: Teams with higher incident workload are more reliable than teams with a lower
workload.
In the Bank Case, this hypothesis is validated, as well concerning the workload regarding the
handling of urgent incidents as non-urgent incidents. Results from the two-way ANOVA support
this finding with the exception of the combination with a high heterogeneity in the use of
Peregrine for communication where a low workload shows the highest reliability.
In the NPP Case, we have been able to validate this hypothesis. Interestingly, the number of non-
urgent notifications per employee is explaining the high reliability in the handling of urgent
incidents.
This finding is remarkable at first sight, but can be explained quite easily. The fact that the
incident pipeline is full causes a team to develop mindfulness in terms of attitude, procedures
and mechanisms for dealing with non-urgent incidents. This mindfulness is bearing fruit for the
handling of incidents. That data do not show an effect on the handling of non-urgent incidents
as well does not necessarily mean there is no such effect. However, it just means that we have
failed to reject the null hypothesis.
H2-6d: Teams with a greater deal of their time allocated to incident management are more
reliable than teams with smaller time allocation.
We have found no evidence for this assertion at the one-way ANOVA level. At the two-way
ANOVA level there is sufficient evidence that a low degree of time allocation leads to low
reliability.
This is in line with our field observation and team reporting that the concentration on the
incident handling is key in explaining a team’s reliability. If a team is handling incidents as a
sideline, with project work (e.g. software engineering) as primary activity, then the risk exist that
a more sloppy incident handling job is done. We can think of three reasons for this. First, it can
be considered normal since teams get no credit for handling the incidents correctly. Second,

242 Two Cases in High Reliability Organizing: a Hermeneutic Reconceptualization
they are mentally much more preoccupied and interested by working on something new, than
on fixing something old. Third, often the incident is a result from a bug or sloppy work done by a
predecessor so team members feel little enthusiasm to clean-up somebody else’s mess.
Proposition 2-7
Proposition 2-7: The better the fit between HRO propensity and the structural
organization dimension use, the higher the reliability.
H2-7a: A high HRO propensity enhances the effect on reliability of teams working under close
physical proximity.
H2-7b: A high HRO propensity enhances the effect on reliability of larger teams.
H2-7c: A high HRO propensity enhances the effect on reliability of teams with higher incident
workload.
These hypothesis can be validated in the Bank Case (no data available for the NPP). This
indicates the importance of the structural dimension for explaining high reliability. For instance,
notice from Table 6.38 that the more a team is based in the vicinity of IT headquarters, the more
reliable it is. This can be explained by the fact that IM is at the heart of the activity over there,
whereas this is less the case in other places of the organization.
Proposition 2-8
Proposition 2-8: The better the fit between SeMa propensity and the structural
organization dimension use, the higher the reliability.
H2-8a: A high SeMa propensity enhances the effect on reliability of teams working under close
physical proximity
H2-8b: A high SeMa propensity enhances the effect on reliability of larger teams
We have not been able to validate these hypotheses at an acceptable level of significance.
Regarding the strong indication provided by the previous propostion regarding HRO propensity
and structure, this may indicate that SeMa propensity is much less affected by the structural
dimension. Future research should determine the validity of this statement.
Proposition 2-9
Proposition 2-9 : The more balanced the variety, the higher the reliability.
H2-9a: More experienced teams are more reliable.
H2-9b: The higher the variance in HRO propensity, the higher the reliability.
H2-9c: The higher the variance in Team Orientation, the higher the reliability.
H2-9d: The higher the variance in Threat Flexibility, the higher the reliability.
H2-9e: The higher the variance in Preoccupation with Failure, the higher the reliability.

Discussion 243
H2-9f: The higher the variance in Sensitivity to Operations, the higher the reliability.
H2-9g: The higher the variance in Deference to Expertise, the higher the reliability.
H2-9b: The higher the variance in HRO propensity, the higher the reliability
At the Bank, we have found no support for this hypothesis at a sufficient level of significance on
the one-way analysis level. On the two-way ANOVA level, we notice that the highest reliability is
achieved for low spread in HRO propensity in combination with highly experienced teams, high
use of e-mail. The lowest reliability is achieved for low spread in HRO propensity in combination
with a less experienced teams and little use of e-mail.
At the NPP, there is no evidence at an acceptable level of significance for this assertion at the
one-dimensional level. However, on the two-way ANOVA level, there is evidence for the
hypothesis.
With respect to the handling of urgent incidents, the combination of a high variance in the
spread of HRT propensity and a high spread in the degree to which team members adjust
procedures leads to the lowest reliability. Other combinations are less pronounced since they
range much less. Nevertheless, the lowest reliability can be observed for the combination of a
low variance in the spread of HRT propensity and a low spread in the degree to which team
members adjust procedures. A high spread in HRO propensity should be compensated by a low
spread in the degree to which team members adjust procedures or vice versa (Orton & Weick,
1990).
Also at the NPP, regarding the handling of non-urgent incidents, the combination of a high
spread in HRO propensity and a high spread in Threat Flexibility results in the lowest reliability.
The highest reliability is obtained by teams with a low score on spread in Threat Flexibility and a
high spread in HRO propensity. A high spread in HRO propensity should be compensated by a
low spread in the degree of Threat Flexibility or vice versa (Orton & Weick, 1990).
As discussed in the Reconceptualization chapter (Chapter 4), this is in line with earlier findings by
Waterman (1990) reporting on team composition. When membership is too homogeneous,
reliability usually suffers. The reason is that such is goes at the expense of Team Orientation. The
paradox however is, that too much Team Orientation in itself (as a result, a product) is bad for
reliability. This conclusion is pushing the consequences of the need for requisite variety to the
extreme: too much sugar wastes the taste. Therefore, once again, the dose makes the poison.
Such leads to paradoxical situations, notably at the Bank, where this finding is reflected in
double policy regarding team composition. On the one hand the Bank values heterogeneity
among its staff and recruits people from a very diverse range of disciplines and backgrounds. It
also deliberately breaks with too strong a team homogeneity by strongly stimulating – some
would say, forcing – job rotation. On the other hand, it fosters homogeneity where it has been
reported at several instances, that the Bank does not stimulate opposed views. This is mainly
reflected in a deliberate recruiting policy of preferring school-leavers, bearing no marks of a past
organizational culture or experiences. This duality cannot be observed in the NPP where
homogeneity is the dominant leitmotiv and opposes the notion of requisite variety. This

244 Two Cases in High Reliability Organizing: a Hermeneutic Reconceptualization
observation is in line with a general finding that high-risk industries, such as the nuclear industry,
are characterized by homogeneity or low requisite variety (Aase & Nybø, 2002, p. 17). It is
obvious that in systems that are as complex as our case organizations, a continuous balance
needs to be strived for between team heterogeneity and homogeneity (Baker et al., 2006). On
the one hand, team composition must be such that the compound effect of team members
reaches a higher level of variance than is present in the system the team operates (Weick,
1987;Burke et al., 2005). On the other hand, effective interaction and communication still has to
be feasible (Shea & Guzzo, 1987). In that respect, in HROs, a special role is reserved for the
emergence of trust. A low degree of mutual trust between team members leads to a lack of
cooperation and communication (Cox et al., 2006).
H2-9c: The higher the variance in Team Orientation, the higher the reliability
In the Bank Case, this hypothesis cannot be validated. The highest reliability can be found for
urgent incidents for low spread in Team Orientation in combination with low score on
Enactment, on registration in the dedicated IS and for non-urgent incidents for low spread in
enactment as well. In the NPP Case, the hypothesis cannot be validated significantly at the one-
way ANOVA level. On the level of two-way ANOVA however, some conclusions can be drawn.
For instance, the combination of a high variance in Team Orientation and a high degree of
Sensitivity to Operations yields the worst reliability. A low spread in Team Orientation combined
with a high degree of Sensitivity to Operations yields the best reliability. A high degree of one
property should be altered by a low degree of the other property (Orton & Weick, 1990). Also in
the NPP Case, a high variance in Team Orientation and a high degree of Team Orientation yields
the lowest reliability and a high degree of Team Orientation and a low spread in Team
Orientation. This is a strong indication for the relevance of Team Orientation as a construct.
H2-9d: The higher the variance in Threat Flexibility, the higher the reliability.
At the Bank, this hypothesis is falsified. As well for urgent as for non-urgent incidents, the lowest
variance yields the highest reliability. At the NPP, on the one-way ANOVA level, we have found
no evidence for this hypothesis at an acceptable significance. At the two-way ANOVA level we
have found support for this hypothesis in combination with a high degree for the number of
urgent incidents per employee. A low spread in Threat Flexibility in combination with a low
average number of urgent incidents per employee yields a high reliability as well. It is obvious
however, that the number of urgent incidents per employee on itself is a strong explanation for
organizational reliability. Remarkable however is the compensating influence of a high spread in
Threat Flexibility on reliability when combined with a low average number of urgent incidents
per employee. Reliability drops considerably. However, when this low number of urgent
incidents per employee is studied in combination with a low spread of Threat Flexibility
reliability increases. In terms of coupling this is an example of loose – tight, thus explaining high
reliability (Orton & Weick, 1990).
Also at the NPP, for the handling of urgent incidents a low spread in Threat Flexibility yields the
highest results when seen in combination with a low degree of several constructs. Based on
these findings, for face-to-face communication it becomes obvious that a desirable combination
would be a low degree of face-to-face communication and a low spread in Threat Flexibility.

Discussion 245
H2-9e: The higher the variance in Preoccupation with Failure, the higher the reliability
In the Bank Case, this hypothesis could not be validated at the one-way ANOVA level. At the
two-dimensional level, a low spread in Preoccupation with Failure generally yields the lowest
reliability. In the NPP Case, this hypothesis could not be validated at an acceptable level of
significance at the one-way ANOVA level. For urgent incidents, a high variance in Preoccupation
with Failure only yields a high reliability when combined with a high variance in the way teams
deviate from procedure. Where teams deviate from procedure is more homogeneous, reliability
is the lowest. The highest reliability is obtained with a combination of a low variance in
Preoccupation with Failure and a low variance in the way teams deviate from procedure. This is
in line with what is suggested by HRT literature. A high homogeneity of Preoccupation with
Failure is good, independent whether this score should be high or level in order to obtain high
reliability. In combination with Team Orientation, the highest reliability is obtained with low
Team Orientation and a high variance in Preoccupation with Failure; the lowest reliability is
obtained with a high degree of Team Orientation and a high variance in Preoccupation with
Failure.
H2-9f: The higher the variance in Sensitivity to Operations, the higher the reliability
At the Bank, this hypothesis cannot be validated at the one-way ANOVA level. For urgent
incidents, a combination of low spread in Sensitivity to Operations and a low spread in
Preoccupation with Failure yields the highest reliability. The lowest reliability is obtained with a
combination of high variance in the degree of Sensitivity to Operations and a high variance in
Threat Flexibility. This might indicate that the homogeneity of a team at this point is essential for
its reliability. On the other hand, the highest reliability is obtained for a high variation in the
Sensitivity to Operations construct if combined with a low degree of variance in the Threat
Flexibility construct or for the inverse, i.e. for a low variation in the Sensitivity to Operations
construct if combined with a high degree of variance in the Threat Flexibility construct. This
observation could be explained through the Loose Coupling paradigm.
H2-9g: The higher the variance in Deference to Expertise, the higher the reliability
In the Bank Case, this hypothesis could not be validated at the one-way ANOVA level. On the
two-dimensional interpretation, we notice that the highest reliability is achieved for the
combinations of low spread in Deference to Expertise and other factors, especially for urgent
incidents. In the NPP Case, this hypothesis cannot be validated at the one-way ANOVA level at
an acceptable level of significance. This stresses the complexity of the phenomenon since it
cannot be explained unidimensionally. For the handling of urgent incidents, the average number
of urgent incidents per employee strongly affects the process reliability. The highest reliability is
achieved for a high spread in Deference to Expertise, when employees have an on average high
number of incidents to handle. However, the combination of a low average number of urgent
incidents per employee and a low spread in Deference to Expertise yields a high reliability as
well. Such is a remarkable conclusion, because we have seen at the one-way ANOVA level that
the Deference to Expertise construct has a convincing influence on organizational reliability. Our
reading of these data is that low pressure/efficiency drivenness is an expression of loose
coupling, which is compensated by a low spread in the degree of Deference to Expertise, which
is an expression of tight coupling.

246 Two Cases in High Reliability Organizing: a Hermeneutic Reconceptualization
A combination of a low score on SenseMaking properties and a low score on variance in
Deference to Expertise yields the lowest reliability. The highest reliability is obtained for a low
score on these constructs in combination with a high spread in Deference to Expertise. The high
scores can be explained through Loose Coupling Theory. Despite a high score on SenseMaking
propensity (loose coupling), the overall reliability is low, because of reinforcement by a high
spread in Deference to Expertise (i.e. loose coupling).
Proposition 2-10
Proposition 2-10: The better the fit between HRO propensity and variety, the higher the
reliability.
H2-10a: Teams that perceive Threat Flexibility more homogenously perform better than
teams that do not.
H2-10b: Teams that perceive efficiency drivenness more homogenously perform better
than teams that do not.
H2-10a: Teams that perceive Threat Flexibility more homogenously perform better than
teams that do not.
A high homogeneity (i.e. low spread/variance) in the perception of the Threat Flexibility
construct yields the highest reliability, as well for the handling of urgent as of the non-urgent
incidents. When a team has about the same perception of Threat Flexibility it means that there
is little ambiguity in the direction pointed out by management. This straightforwardness and
univocality might very well be contributing to the team’s reliability because it simultaneously
reduces complexity and allows for the necessary degrees of freedom to cope with the
unexpected. We argue that Threat Flexibility, as a newly distinguished HRO construct, is
univocally positive: it has no side effects, there are no caveats, and there is no catch. This has
considerable consequences for management and the practice of organization design. Because of
the observed straightforwardness of the construct, it can be administered quite easily in settings
that are comparable to the organizations and processes we have studied.
H2-10b: Teams that perceive efficiency drivenness more homogenously perform better
than teams that do not.
Both for the Bank and the NPP, we remark that the higher the homogeneity in the perception of
efficiency drivenness, the higher the reliability. This demonstrates the importance of a low
degree of variance in the perception of efficiency orientation to achieve high reliability. At this
level, a team’s shared interpretation of the orientation towards efficiency is determining for a
team’s reliability. Despite what we have argued regarding the necessity of requisite variety, this
determinant clearly indicates the necessity of a policy that aims at a clear communication and
consequent management.

Discussion 247
Proposition 2-11
Proposition 2-11: The better the fit between SeMa propensity and variety, the higher the
reliability.
H2-11: More experienced teams, relying more on SeMa propensity, are more reliable.
We have not been able to validate this hypothesis at an acceptable level of significance. Since
experience did not seem to matter in general throughout our data analysis. We are inclined to
conclude that experience is not relevant for explaing high reliability, nor is it providing any
information on the HRO or SeMa propensity a team has.


Conclusions 249
Chapter 8 Conclusions
Science becomes dangerous
only when it imagines
that it has reached its goal
George Bernard Shaw
This chapter draws conclusions from the research presented in the previous chapters. First, the
answers to the research questions raised at the beginning of this dissertation are summarized
(Section 1). Subsequently, this thesis’ main contributions are presented (Section 1.3) and its
limitations acknowledged (Section 3). The chapter concludes with an identification of directions
for future research (Section 4).
1 Answering the Research Questions and Main Findings
1.1 RQ1 – Are the organizations HROs? Both our case studies can be called HROs since HRO characteristics, as the ones described in
HRO literature are observable in both organizations [RQ1-1]. In addition, our data have shown
that it are the same constructs that are observable [RQ1-2]. In general, the NPP (as an
archetypical HRO) has the highest values on HRO properties [RQ1-3]. The first research question
therefore can be answered affirmatively. However, our research has also pointed out that a NPP,
although theoretically an archetypical HRO, in fact is not really a HRO, but an Ultra Reliable
Organization (URO). The Bank on the other hand, is much more a HRO than originally
hypothesized because of the day-to-day exercise of seeking equilibrium between effectiveness
and efficiency.
1.2 RQ2 – What constitutes high reliability? The answer to this research question is much less univocal than the answer to the first research
question. In general, we can conclude that HRO and SeMa constructs do not necessarily
positively influence process reliability [RQ2-1], but that the dose makes the poison. Starting from
a reconceptualized theoretical framework, we have observed that newly introduced factors such
as Team Orientation, Threat Flexibility and Efficiency, univocally contribute to reliability. Despite
the fact that there is not something like an ideal ‘reliability cocktail’ fully explaining reliability
[RQ2-2], there are strong indications that a reconceptualized HRT offers valuable advice for the
design of processes that are needed to be highly reliable. The same conclusion can be reached
when comparing the composition of the reliability cocktail from one team to another [RQ2-3].
Indeed, we have found that contextual and structural dimensions (e.g. team size, workload and
time allocation) have an important moderating impact on high reliability parameters influencing
a team’s reliability.

250 Two Cases in High Reliability Organizing: a Hermeneutic Reconceptualization
1.3 Main Findings: HRO paradoxes Bourrier (1996), in her study of French and US Nuclear Power Plants, found out that two NPPs
that were organized in a totally different way, yet both demonstrated impressive records of
safety and productivity. “One French NPP showed little common socialization among workers.
Worker skills were only tacitly acknowledged by management, for example by implicit gaps in
procedures. For workers on the other hand, filling in these procedural gaps as they performed
their task was the only acceptable/reasonable strategy if they wanted to be seen as competent,
and, therefore worthy of retaining some measure of autonomy and power” (Bourrier, 1996, p.
105). Bourrier’s observation goes to the heart of what we label the ‘HRO paradox’: an ardent
acknowledgement of the blessings of mechanistic organizing, without losing sight of common
sense. Essential in this respect is not to exaggerate so that core competencies never turn into
incompetencies. Rochlin captures this innate HRO paradox as follows: “In short, these
organizations seek an ideal of perfection but never expect to achieve it. They demand complete
safety but never expect it. They dread surprise but always anticipate it. They deliver reliability but
never take it for granted. They live by the book but are unwilling to die by it. If these beliefs seem
wonderfully contradictory, those who express them are under no particular pressure to
rationalize their paradoxes; indeed, they seem actively to resist such rationalization. We often
hear the whole spectrum expressed by a single individual over the course of an interview or series
of discussions” (Rochlin, 1993, p. 24).
The remainder of this section deals with the background of this paradox: What is the relevance
(advantages and disadvantage)? How can it be explained? How does it show itself in everyday
organizing?
1.3.1 The dose makes the poison
Roberts and Bea (2001b, p. 181) warn that organizations can develop core competencies that
later turn into incompetencies. Core competencies are sets of skills, complementary assets and
routines that provide the basis for an organization’s survival and prosperity. In this section, we
emphasize that what can be considered as core competences of HROs can become
incompetencies. This is a paradox in the sense that ‘much can be too much and little too little’.
HROs capable of finding the balance between both extremes can truly call themselves High
Reliability Organizations. The others can do so maybe just in name. In our view, this balancing is
most characteristic for HROs. To make our point, we first dwell on the paradoxical nature of
HROs. We subsequently deal with the duality between procedure and improvisation (Subsection
2), standardization and requisite variety (Subsection 3), hubris and confidence of self and the
other (i.e. trust) (Subsection 4).
1.3.2 Working smarter
A first argument can be found in the complexity of reality. Today’s organizational setting has
nothing to do with the linear environment of a few decades ago (e.g., what you produce will be
sold). In business and academic journals, in the rhetoric of consultants, in public relations talk,
on websites, etcetera, lip service is paid to the dynamics of the environment and the strategies
that emerge from it. In practice however, organizations do not tend to do what they preach:
instead of embracing complexity, they reduce (i.e. try to destroy) it by means of key reliability
indicators (KPIs), balanced scorecards, and the like. If what we state is true, we should see
organizations fail in large numbers, but remarkably, they do not. What happens is that

Conclusions 251
organizations cope with this reality in their own way, a way that is familiar to them and where
they are good at: by working hard. Reorganizing, rescheduling, re-engineering, hiring more staff,
new projects, new technologies, implementing new strategies … are part of this ‘working hard’
approach. Therefore, stress levels are high, communication becomes difficult or equivocal and
budgets are used at the speed of light. HROs though are organizations that have found a way
around this working harder strategy; instead of working harder, they work smarter. By this is
meant that instead of putting more effort in operations, they invest this energy in the build-up
of organizational capability: by training, by smart design, by working on a culture of flexibility
and reliability. Organizations that invest in improvement will experience increasing capability
and find that they have more time to allocate to working smarter and less need for heroic efforts
to solve problems by working harder (Repenning & Sterman, 2001). No matter how appealingly
straightforward this idea might be, non-HRO managers do not apply it in their everyday practice.
This is not only because they might not be aware of this inherent dynamics, but also because it is
simply not rewarding to invest in capability:
(1) The effect is not noticeable until after a long time whereas the effect of working harder
is quasi immediate.
(2) The means that are needed for a working smarter approach are esteemed to be more
needed elsewhere in the organization (working harder).
This idea has been developed by Repenning and Sterman (2001) when coining the term
Capability Trap. In the short run, there is nothing that urges the organization to do things
differently and on the condition that enough resources become available to continue to put the
necessary effort in the working harder approach, even in the longer run the failure will not
materialize. The opportunity cost however is high.
1.3.3 Stability in cognition, variance in design
Early work on HROs characterized high reliability in terms of the role of repeatability and
routines in avoiding adverse consequences (Roberts, 1990b). However, more recent work
portrays reliable outcomes as the result of stable processes of cognition, such as vigilance or
monitoring, directed at variations in work activities (Weick et al., 1999). HROs show variation in
activity, but that what makes a HRO typical is stability in the cognitive processes that make sense
of this activity. HROs seem to have stopped treating stable patterns of activity as the source of
reliable outcomes. Ramanujam and Goodman (2003, p. 816) point out that this represents a shift
in focus from processes that aid repeatability of operations to the role of stable cognitive
processes in managing the variability inherent in HRO work activities, but that the focus remains
reliable outcomes (i.e., avoidance of adverse consequences). Of all HRO scholars, Schulman
probably has phrased this best (Schulman, 1993b, p. 369) in his analysis of Diabolo Canyon: “The
proposition that emerges from analyzing Diabolo Canyon is that reliability is not the outcome of
organizational invariance, but, quite the contrary, results from a continuous management of
fluctuation both in job reliability and in overall department interaction”. Put differently: it is not
that HROs do not experience failures or deviations from the expected, but these events do not
disable them. They deal with them.
For a comprehension of the cognitive mechanism behind this characteristic behavior we refer to
Weick et al (1999, p. 87): “[To be] opportunistic and flexible in order to detect and to adapt to
events which require revision of situation assessment and plans … problem solvers need to revise

252 Two Cases in High Reliability Organizing: a Hermeneutic Reconceptualization
their understanding of the situation, the evidence collection and evaluation tactics, or their
response strategy when new events are detected and evaluated. Failures to revise in any of these
ways produce what are seen as fixation failures”. By separating the variation and stability folded
into design and routines, and assigning the variation to routines and the stability to processes of
cognition, stable patterns of activity are no longer treated as the source of reliable outcomes
(Weick et al., 1999, p. 87).
1.3.4 Dynamic adaptation
Therefore, good design in essence is not about rigidly preventing incidents, accidents and crises,
but about a design for a reliable management of them. This is confirmed by Lin & Carley (Lin &
Carley, 2001) when they write: “If crises are indeed inevitable, then the more important question
is not about how to design the organization to avoid crisis, but how to design the organization
for high reliability during a crisis. Re-framing the question in this way gives rise to an entire new
set of concerns. Is the organizational design that exhibits high reliability during a crisis also
optimal under non-crisis conditions? Is it reasonable for organizations to design for crisis, or
should organizations alter their designs when faced with a crisis? In other words, is dynamic
adaptation called for? Further, if organizations do restructure, what will be the most effective
new structure?” An onset to the answer to this pertinent design question is provided by Weick et
al. (2005): “If one looks to see what constitutes this reliability, it cannot be found in any single
element of the system. It is certainly not to be found in the equipment….for a period of several
months during our field work it was failing regularly….Nor is it to be found in the rules and
procedures, which are a resource for safe operation but which can never cover every
circumstance and condition. Nor is it to be found in the personnel who, though very highly skilled,
motivated and dedicated, are as prone as people are everywhere to human error. Rather we
believe it is to be found in the cooperative activities of controllers across the ‘totality’ of the
system, and in particular in the way that it enforces the active engagement of controllers, chiefs,
and assistants with the material they are using and with each other” (Weick et al., 2005, p. 418).
2 Main Contributions However modest in the light of an eminent research track as HRT, this study claims to have
made some relevant contributions. Despite its high relevance for society, ‘Reliability’ has not
always been given appropriate research consideration, resulting in some notable shortcomings.
Our research has attempted to remedy these shortcomings. To clarify this, we decompose this
dissertation’s title – Two cases in High Reliability Organizing: a Hermeneutic Reconceptualization
– since every word has its meaning. In that respect we first explain the relevance of the double
case study approach (2.1). Subsequently we summarize the relevance of our findings for the field
of HRT (2.2), paying special attention to the distinction between organization and organizing
(2.3). Next, the hermeneutic research methodology is dealt with (2.4) and the major conclusions
concerning the Reconceptualization are presented (2.5). Finally, as a form of synthesis of the
above, the question is addressed whether the theorizing on HROs can be labeled a theory (2.6).
It should be noted that categorizing this research’s contributions under these labels should not
be seen as completely exclusive, or as limitative. Many of the contributions are the result of a
combination of theory, method and data, fully in line with our hermeneutic approach. When
they are discussed as presented below, it is for analytical reasons.

Conclusions 253
2.1 Two cases ‘A Bank can learn from a Nuclear Power Plant and vice versa’. That statement has been the
starting point of our research, now five years ago, and as is shown in the previous section, it
more or less has remained intact. We are convinced that we thank this to the research design
and research ambition. More particularly, we feel we have empirically broadened the HRT field
in three ways that are novel in HRO research and find their origin in the double case study
approach underlying our study:
- The application of HRT to the Incident Management Process;
- By applying HRT in the context of a mainstream highly reliable (garden variety)
organization;
- The comparison of a mainstream highly reliable organization to an archetypical HRO;
Many aspects of these contributions have been presented in detail in this dissertation and need
no further elaboration, so that in the remainder of this subsection, we can suffice with a
discussion of those contributions that might need further elaboration. We subsequently deal
with the extension of HRO research to the context of Incident Management (2.1.1), the question
whether garden variety organizations can learn from archetypical HROs (2.1.2) and vice versa
(2.1.3).
2.1.1 Incident management process
As we have shown in our review of literature, the field of application of HRT, although
substantial, still is focused on a limited number of processes and contexts. By expanding this
scope with a case study on the high reliability of the (IT) incident management process, we are
convinced that we have made a double contribution: First, we have brought within reach the
HRO community’s ambition to expand its natural habitat. Second, we have accepted the
invitation to study the usefulness of HRO concepts in the IS domain (Butler & Gray, 2006). We
therefore hope that our study has created an opening towards more HRO case studies in the
field of IS.
2.1.2 Can ‘garden variety’ organizations learn from archetypical HROs?
Can mainstream organizations – or ‘garden variety’ organizations (Roberts, 1993, p. 2) – learn
from archetypical HROs? We believe the a posteriori answer is double: yes and no. The answer is
no, because archetypical HROs in fact are not HROs but UROs, so that a comparison without
nuance is not relevant. The answer is also yes, because there are hallmarks from NPPs that can
be applied to other contexts (e.g. introducing time-outs, non-punishability, decoupling process
design, etc.), as discussed in the body of this dissertation.
2.1.3 Can archetypical HROs learn from garden variety organizations?
Furthermore, we have learned that an archetypical HRO can learn from a non-archetypical as
well. We take the advice of Creed et al. seriously when they posit that: “Only by finding variance
in what is claimed to be the outstanding feature of these organizations – their overreaching
concern for reliability – can we begin to examine just how the politics of technology and the
culture of reliability develop differently over time. By searching for neighbors, we may find that
HROs are oriented toward avoiding ineffectiveness to the near conclusion of trying to reach
effectiveness. As we move down to the reliability continuum, we may find a more balanced

254 Two Cases in High Reliability Organizing: a Hermeneutic Reconceptualization
addressing of both effectiveness and ineffectiveness criteria. By studying these phenomena we
can begin to untangle criteria for both” (Creed et al., 1993, p. 71-72). HROs as described in
literature are of limited relevance for mainstream context because of their exclusive focus on
effectiveness. In reality, organizations do not have this luxury and must constantly balance
between a striving for effectiveness and the economic imperative to use resources efficiently.
2.2 High Reliability This study has contributed to the fine-tuning of what constitutes high reliability. More
particularly, we feel we have empirically broadened the HRT field in four ways that are novel in
HRO research and that find their origin in the explication of the high reliability concept:
- By applying HRT to the study of organizational reliability, instead of the more common
issue of safety;
- By explicitly and empirically testing the impact of HRO properties (independent variable)
on reliability (dependent variable);
- By incorporating in this conceptual model structural and contextual dimensions that are
potentially moderating the impact of HRO properties on reliability;
- By measuring HRO properties not solely in terms of averages, but also as spread.
First, we explain in what way this study has accomplished reaching an encompassing definition
of reliability (2.2.1). Next, we explicate the relevance for HRO research of taking reliability as a
dependent variable (2.2.2). Then we point out the relevance of incorporating moderator
variables in the research design (2.3.3). We conclude with pointing out the relevance of working
with spread in HRO properties, next to working with mean observations.
2.2.1 A definition of reliability
A shortcoming in research on reliability is that, at least from an academic point of view, the
concept of reliability itself has not been defined univocally and holistically. Even though many
scholars have given an accurate description of this concept, most of their research takes a
particular viewpoint. As such reliability studies deal with manufacturing reliability, organizational
reliability or safety, but not with an all-compassing reliability that takes a systems perspective
and acknowledges social, human, economic or technological aspects. Besides, few studies exist
on the interrelation between task environment and organization design on how this influences
organizational reliability (Lin & Carley, 2001;Pearson & Mitroff, 1993). We have addressed this
shortcoming by taking a systems perspective to reliability.
2.2.2 Reliability as dependent variable
Another contribution of our work is that it does not take a dependent variable as a starting point
for the selection of our cases, an approach typical of NAT and HRT research (Rosa, 2005, p. 232).
We have taken the systems interactive complexity and tight coupling as a start, not their
assumed well-oiled functioning or their past of dramatic incidents or accidents. The starting
point are two organizations/processes that can be characterized as interactively complex and
tightly coupled without categorizing the organization of the case as a whole as highly reliable.
Since we are not working back from empirical evidence, we believe in the generalizability (or
transferability) of our findings even though we have merely studied two cases in depth.
Noteworthy in this respect is also that our study of process reliability through the technique of

Conclusions 255
Repeated Measures Analysis of Variance since it has permitted us to have a more nuanced view
on reliability by taking into account the spread in the data. We argue that this is a far more
realistic picture of reliability than taking a snapshot or than taking a mean observation as
dependent variable.
2.2.3 HRO properties as mean and as variance
To the best of our knowledge, literature up to now has not operationalized the nuanced
character of High Reliability thinking. Our research claims it has done so by incorporating in its
design the spread in observations between team members. In line with the Requisite Variety
idea (Various Variances), we have shown that examining a team’s standard deviation on
particular variable can be revealing for explaining reliability.
2.3 Organizing We are convinced that ‘HRO’ is the right acronym for the type of organization studied by HRT.
However, based on our findings, we argue that it should not be used for ‘High Reliability
Organization’ but rather for ‘High Reliability Organizing’ (Berniker & Wolf, 2001, p. 26). There is a
double rationale for this: being highly reliable is dynamic (2.3.1) and it makes the joining in with
mainstream organization science more feasible (2.3.2).
2.3.1 Reliability is dynamic
We believe that the HRO concept has value as a verb, not as a noun. By this we imply that the
nature of HROs is dynamic, not static. Indeed, reliability is a dynamic non-event (Weick, 1987),
and a continuous effort is necessary for finding an equilibrium that is perishable and will be
replaced by a new equilibrium. We have investigated the mechanisms and interferences that
play a role in achieving high reliability and demonstrated the impact of contextual and structural
dimensions other than those proposed by HRT literature on organizational reliability.
2.3.2 HRT as guide for organization science
We are convinced of the potential of HRT as a guide for organization science. The problem with
past and contemporary HRO research is that its practical application still is very much
underdeveloped or unrevealed. For this reason, HRT seems incapable of joining in with
mainstream organization theory. In a recent contribution to The Blackwell Encyclopedia of
Management, Karlene Roberts puts it like this: “Today, the research [on reliability] flourishes,
although it has not been well tied to mainstream organizational theory” (Roberts, 2005, p. 157).
This is the fundamental objective we had with our work: tying insights from high reliability
thinking into mainstream organization theory and mainstream organizational learning (Van Den
Eede et al., 2004). Our research has addressed this by investigating whether and how HROs can
learn from garden-variety organizations. We posit that the study of HROs, using similar
approaches as described in this dissertation, can offer additional guidance in the study of
organizations of all types.
We believe this dissertation has made a modest contribution to the study of organizations in
closing what could be called the Weick Circle. By this we mean the process of reading Weick’s
oeuvre backwards by studying Loose Coupling (Weick, 1976; later reconceptualized in Orton &
Weick, 1990), The Social Psychology of Organizing (Weick, 1979), SenseMaking (Weick, 1995);
High Reliability Organizations (Weick et al., 1999), back to organizing, coupling and SenseMaking.

256 Two Cases in High Reliability Organizing: a Hermeneutic Reconceptualization
2.3.3 Moderator variables
In line with Drazin and van de Ven (1985), our research has examined the effects of multiple
contextual or structural factors on reliability. Multiple factors like team size, experience, physical
location etc., have shown to be important in explaining reliability. We have found adopting a
systems approach is uniquely valuable in addressing research questions as the ones we have
raised in this study.
2.4 Hermeneutic We have taken Drazin and van de Ven’s (1985) advice at heart and have combined research
approaches for the study of contingency. Following a Systems Approach to organizational
reliability, we have not sufficed with a mere focus on how single contextual factors and single
structural characteristics affect each other and how these pairs of context and structure factors
interact to explain reliability. Nevertheless, this kind of reductionism is important in our
research. The reason is that it “treats the anatomy of an organization as being decomposable
into elements that can be examined independently. The knowledge gained from each element
can then be aggregated to understand the whole organizational system” (Drazin & van de Ven,
1985, p. 529). However, the systems perspective added to the holism that resulted from the
combination of an intra- and inter-case analysis, from a triangulation of theory and method. The
combination of reductionism and holism offers potential for general contingency-theory
research. With Drazin and van de Ven (1985), we posit “that contingency studies should be
designed to permit comparative evaluation of several forms of fit. The resulting complementary
information can lead to more comprehensive descriptions of context structure- reliability
relationships than a single approach to fit alone. By examining multiple approaches to fit in
contingency studies and relating these findings to unique sample characteristics, one can develop
mid-range theories of fit”.
HRT seems to favor the empirical or case approach. Management is studied by analyzing
experience, usually through cases. “It is based on the premise that students and practitioners will
understand the field of management and somehow come to know how to manage effectively by
studying managerial successes and failures in various individual cases”(Koontz, 1980, p. 177).
HRT acknowledges the contingency or situational approach to management theory. NAT
obviously makes the distinction between situations depending on the degree of coupling and
complexity. HRT scholars place themselves in the same framework by adopting this same
terminology. On the other hand, they are not contingency-driven where they leave their
descriptive role and take a normative tone when proposing treatments. In this sense they seem
to ignore that there is no “one best way” and are “often overlooking the fact that intelligent
practicing managers have always tailored their practice to the actual situation” (Koontz, 1980, p.
177).
The cornerstone of the hermeneutic approach underpinning our research is its multiple-case
character. Because of the identical research build-up in both our cases, we were capable not
only of data-theory triangulating within-cases, but also in between them. This ‘twin’ approach is
quite exceptional in HRO research, where theory development is based on individual case
studies, leading to a “danger of falling victim to a kind of evolutionary optimism that infers that
because features have evolved in an organization that is surviving in a high-reliability niche,
these features must all contribute to its overall reliability. In research on high reliability in

Conclusions 257
organizations, we are beset by the problem of many variables and few cases. How, without more
failures, can we really be sure which of the many organizational features we see are in fact
adding to reliability?” (Schulman, 2001, p. 347).
Another contribution this research makes is in the way it combines scientific and practical
relevance. Scientific research and consulting, especially in environments like the ones we have
studied, are separated most of the time. It is rare that scientists are involved in decision-making
and that they are in a position to share their expertise with the highest level of the organization
(Bourrier, 2005, p. 99). In this, our research differentiates itself, because it has been
commissioned by the organization’s senior management. Our research findings, for this reason,
have the potential of being translated and implemented into organizational practices and
design.
Another significant contribution of this research is that it adds to the body of quantitative
research in this field. As for HRT, prior empirical data was gathered only in the following cases,
to the best of our knowledge:
Vogus and Welbourne (2003b) provided an indirect, partial test of the connection
between collective mindfulness and innovation activity in new (IPO) software firms,
suggesting that human resources practices are the mechanisms by which three of these
processes develop and lead to mindfulness (Knight, 2004, p. 13);
Schulman (1993a;1993b) examined the Diabolo Canyon NPP on its high reliability;
Rochlin, La Porte & Roberts (1987) and Roberts, Rousseau & La Porte (1994) on Nuclear
Power Aircraft Carriers ;
Knight (2004) provided a test for the relationship between collective mindfulness and
safety in public swimming pools.
As for as NAT, even fewer empirical studies are available:
Berniker and Wolf (1999;2001;2007) provided evidence for NAT in the oil refinery sector.
Sagan (1993) did the same in the field of nuclear warfare technology.
All in all, this constitutes a limited body of empirical research. Our research as such is one of the
few studies that systematically examines the direct effect of both high reliability and
Sensemaking properties on organizational reliability.

258 Two Cases in High Reliability Organizing: a Hermeneutic Reconceptualization
2.5 Reconceptualization
2.5.1 Towards a balanced theory on High Reliability by including Efficiency
If mindfulness is defined only in terms of favorable outcomes, then it is always a positive thing
(Rerup, 2005). “Because theory needs to specify circumstances under which the positive
consequences outweigh the negative, and vice versa, it follows that a ‘balanced’ theory of
mindfulness will have to specify both the costs and benefits incurred by being mindful. As
theorizing about mindfulness continues, I expect the literature to develop an appreciation for
both the costs and the benefits of mindfulness” (Rerup, 2005, p. 467-468).
The factor analysis we conducted was relevant in this regard, as it (re-)produced a majority of
the major themes in the conceptual framework. This occurred despite the fact that the items
were not strictly grouped by theme in the questionnaire. This provides empirical support for the
clustering of characteristics into a set of themes that is a combination of the two schools of
thought in the HRO discipline.
The purpose of our research was to propose a process ‘theory’ of the relationship between
constructs and insights stemming from different theoretical perspectives on organizational
reliability. Therefore, the elements of our work by themselves are not novel; throughout the
dissertation, we have indeed extensively acknowledged our debt to the groundbreaking
theoretical work of the authors we build upon. What we do claim as novel, however, is our
selection, reinterpretation and rearrangement of these elements. This combination of analysis
and synthesis bears the promise of shedding a broader and more precise light on what
constitutes organizational reliability. The systemic blend of analysis and synthesis we have
developed here has the potential of explaining conflicting empirical results and of suggesting
guidelines for future research (Soh & Markus, 1995, p. 30).
The concepts, used in this reconceptualization process, are not things we see in reality, but
constructs that emerge from our insight in order to help us understand reality (Singer, 1983, p.
85). Understanding how reliability, flexibility, coupling and other organizational constructs relate
to each other is a necessary step in building construct validity (Hinkin, 1998;Knight, 2004, p. 16).
Furthermore, understanding how they interrelate is vital when the purpose is to link our findings
to the broader organizational theory domain (Weick et al., 1999;Knight, 2004, p. 16-17).
2.5.2 Bridging the dichotomy between the Berkeley and the Michigan School
As we have argued in Chapter 2, the Michigan school of thought pays more attention to the
notion of culture (as contextual dimension) whereas the Berkeley group favors the structural
dimensions (e.g. the notion of bureaucracy) (Eisenhardt, 1993, p. 133). In this sense, the
Michigan school takes independent dimensions (causes)73, the Berkeley school dependent
dimensions (effects from the independent dimensions) as starting point for understanding the
concept of high reliability. Our reconceptualization has tried to strike a balance between both
views as it combines constructs originating from both schools, by adding the causality that is
missing in the Berkeley school. For instance, we added the constructs of Team Orientation and
Threat Flexibility as the cause of the cultural dimension.

Conclusions 259
2.5.3 Bridging the dichotomy between HRT and NAT
Another limitation addressed by our research regards the two dominant bodies of literature:
High Reliability Theory (HRT) and Normal Accidents Theory (NAT). “While the notion of high(er)
reliability is theoretically justifiable, to the best of our knowledge, HRT and NAT have undergone
only limited empirical testing. This might be due to the acute problem in reliability research that
mainly consists of case studies examining the background of effective action or catastrophic
failure (e.g., Perrow, 1984; Shrivastava, 1987; Vaughan, 1996; Weick, 1990, 1993) in reliability
seeking organizations” (Ericksen & Dyer, 2005, p. 8). Our research takes the advice of Erickson
and Dyer (2005, p. 10) at heart, and has aimed at a merging in thinking across the case studies
and empirical testing, hence making a contribution to Reliability literature. We believe we have
succeeded in doing so by developing a nuanced view on the notions both theories have in
common – those of complexity and coupling. Snook (2002, p. 204) gives three reasons for the
origin of conflicting insights between HRT and NAT with regard to how reliability should be
guaranteed: “Part of the answer lies in our inherent limitations as information processors. Part of
the answer lies in our linear deterministic approach to causality. And, part of the answer lies in
the inherent unpredictability of events in complex organizations”. The nuance we brought into
the debate relates to the (re-)introduction of paradigms regarding efficiency vs. effectiveness;
reliability vs. flexibility; sense making vs. decision making; tight vs. loose coupling; improvisation
vs. procedure; stability vs. instability, etc. One of the objectives of our study was to make these
approaches less conflicting. We did so by taking the discussion a bit further than the traditional
conclusions from contingency theory. We address the question whether there are design and
behavioral characteristics that are robust – in the sense of reliable and flexible enough – to allow
for an ‘all-seasons’ approach to organizational reliability.74 This kind of studies seems to be rare.
Lin & Carley (2001) report that there are few studies that compare organizational designs with
an eye to reliability and that there is no research that compares actual behavior with a formal
model. In more dynamic environments – such as in our case studies – flexibility is a stronger
predictor for reliability than stability (Anand & Ward, 2004).
2.6 Theory Kurt Lewin said: “Nothing is as practical as a good theory”(Lewin, 1945, p. 129). Popper asked:
‘What is a theory?’ and Weick showed us that even a bad ‘theory’ can be practical.75 Therefore,
theories provide a lever to see more than there is to see without the application of a theoretical
framework. However, theory must be explaining reality and not just be ‘theoretically’ correct.
Science outside of societal problems is at best nothing more than intellectual ‘Spielerei’ (Behnke
& Behnke, 2006). Hence, the question arises whether HRT genuinely is a theory. We could
suffice here to prove the importance of High Reliability Theorizing, for the study of reliability –
which is after all what the HRO discipline has proved over the years to be capable of – but we dig
a little deeper into its essence as a theory, in the hope of finding clues that could better specify
its value. We clarify how our research has answered the question whether HRT genuinely is a
theory. To this end, we ask the question whether HRT is a theory in the scientific sense (2.6.1)
and what type of theory HRT is (2.6.2).
2.6.1 Is HRT a theory?
The question what theory is and is not has practical implications for the quality of organization
science. This is discussed in an issue of the Academy of Management Review (1989, Vol. 14,

260 Two Cases in High Reliability Organizing: a Hermeneutic Reconceptualization
Issue 4, e.g. Eisenhardt, 1989;Weick, 1989), which focused specifically on theory and theory
development. Similarly an issue of Administrative Science Quarterly (1995, Vol. 40, Issue. 3, e.g.
Sutton & Staw) contained articles about what theory is, what theory is not and how theorizing
occurs. However, multiple views of theory exist. Differences in these views depend to some
degree on philosophical and disciplinary orientations, yet there are also commonalities (Gregor,
2006), centered around abstraction and generalization about phenomenon, interactions and
causation.
Table 8.1 shows the components of theories (Gregor, 2006), allowing us to identify what
components HRT is composed of.
Theory component Definition HRT (in this
dissertation)
Means of representation The theory must be represented physically in
some way: in words, mathematical terms,
symbolic logic, diagrams, tables or
graphically.
Chapter 5
Constructs These refer to the phenomena of interest in
the theory. All the primary constructs in the
theory should be well defined.
Chapter 4
Statements of relationship These show relationships among the
constructs. Again, these may be of many
types: associative, compositional,
unidirectional, bi-directional, conditional, or
causal.
Chapter 5
Scope The scope is specified by the degree of
generality of the statements of relationships
Chapter 5
Causal explanations The theory gives statements of relationships
among phenomena that show causal
reasoning
Chapter 5
Testable propositions
(hypotheses)
Statements of relationships between
constructs are stated in such a form that they
can be tested empirically.
Chapter 6
Prescriptive statements Statements in the theory specify how people
can accomplish something in practice, e.g.,
construct an artifact or develop a strategy.
Chapter 7
Table 8.1 - Structural components of theory (Gregor, 2006)
The conclusion from the overview presented in Table 8.1 is that there is sufficient reason to
state that the theorizing on High Reliability genuinely can be called a theory since the structural
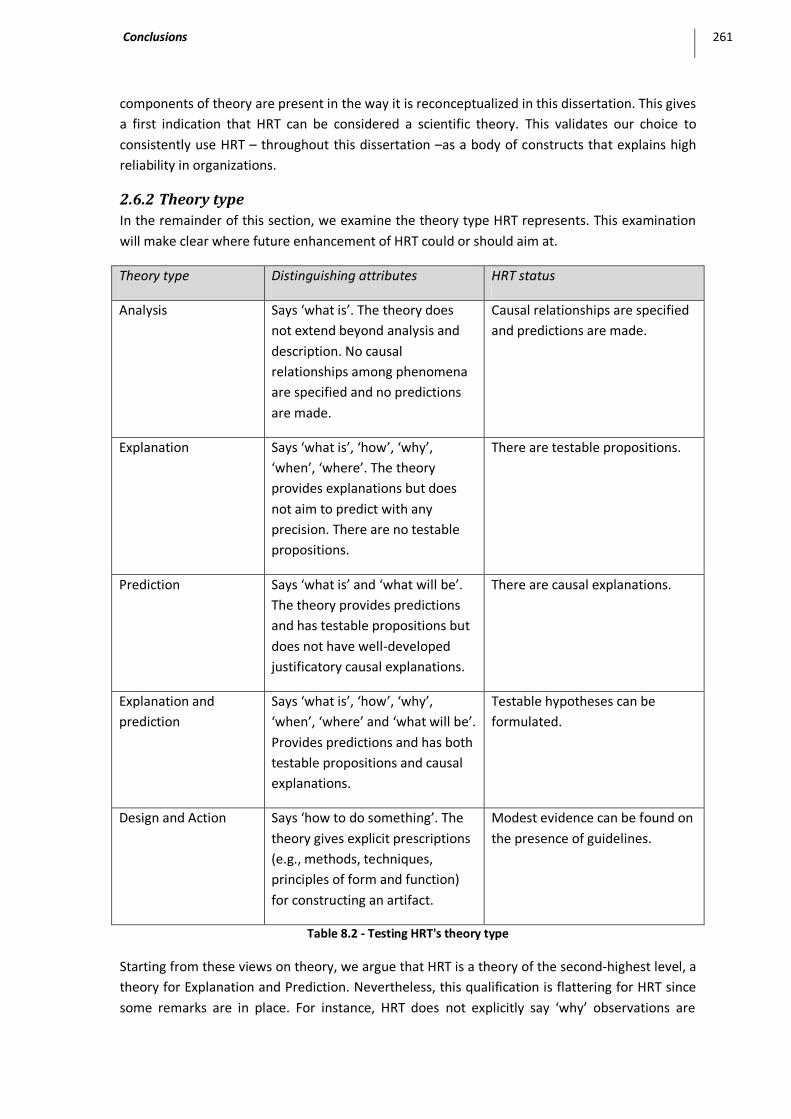
Conclusions 261
components of theory are present in the way it is reconceptualized in this dissertation. This gives
a first indication that HRT can be considered a scientific theory. This validates our choice to
consistently use HRT – throughout this dissertation –as a body of constructs that explains high
reliability in organizations.
2.6.2 Theory type
In the remainder of this section, we examine the theory type HRT represents. This examination
will make clear where future enhancement of HRT could or should aim at.
Theory type Distinguishing attributes HRT status
Analysis Says ‘what is’. The theory does
not extend beyond analysis and
description. No causal
relationships among phenomena
are specified and no predictions
are made.
Causal relationships are specified
and predictions are made.
Explanation Says ‘what is’, ‘how’, ‘why’,
‘when’, ‘where’. The theory
provides explanations but does
not aim to predict with any
precision. There are no testable
propositions.
There are testable propositions.
Prediction Says ‘what is’ and ‘what will be’.
The theory provides predictions
and has testable propositions but
does not have well-developed
justificatory causal explanations.
There are causal explanations.
Explanation and
prediction
Says ‘what is’, ‘how’, ‘why’,
‘when’, ‘where’ and ‘what will be’.
Provides predictions and has both
testable propositions and causal
explanations.
Testable hypotheses can be
formulated.
Design and Action Says ‘how to do something’. The
theory gives explicit prescriptions
(e.g., methods, techniques,
principles of form and function)
for constructing an artifact.
Modest evidence can be found on
the presence of guidelines.
Table 8.2 - Testing HRT's theory type
Starting from these views on theory, we argue that HRT is a theory of the second-highest level, a
theory for Explanation and Prediction. Nevertheless, this qualification is flattering for HRT since
some remarks are in place. For instance, HRT does not explicitly say ‘why’ observations are

262 Two Cases in High Reliability Organizing: a Hermeneutic Reconceptualization
made, which is a necessary condition for being capable of explaining. However, this shortcoming
is compensated by its capacity to put forward testable propositions and causal explanations. We
are strongly convinced that for answering this ‘why’ question an additional theoretical
framework must be brought in, namely Loose Coupling Theory (Orton & Weick, 1990).
We assert that our research has contributed to the determination of HRT as a scientific theory.
However, much more research must be done to perfect this determination and to provide it
with an enhanced validity. In that respect, several questions arise. They can be grouped as
follows (Gregor, 2006):
(1) Domain questions. What phenomena are of interest in the discipline? What are
the core problems or topics of interest? What are the boundaries of the
discipline?
(2) Structural or ontological questions. What is theory? How is this term understood
in the discipline? Of what is theory composed? What forms do contributions to
knowledge take? How is theory expressed? What types of claims or statements
can be made? What types of questions are addressed?
(3) Epistemological questions. How is theory constructed? How can scientific
knowledge be acquired? How is theory tested? What research methods can be
used? What criteria are applied to judge the soundness and rigor of research
methods?
(4) Socio-political questions. How is the disciplinary knowledge understood by
stakeholders against the backdrop of human affairs? Where and by whom has
theory been developed? What are the history and sociology of theory evolution?
Are scholars in the discipline in general agreement about current theories or do
profound differences of opinion exist? How is knowledge applied? Is the
knowledge expected to be relevant and useful in a practical sense? Are there
social, ethical or political issues associated with the use of the disciplinary
knowledge?
3 Limitations of this Study The research reported in this dissertation has four limitations that can serve as additional
directions for future research. They are addressed next.
The results obtained in this thesis, using the ANOVA approach, are in themselves relatively
discouraging since little significance is found when testing the hypotheses. This is especially so
on the level of the one-way ANOVA testing. There are two explanations for this observation.
First, little variance exists in the observations of the dependent and independent variables.
Therefore, the probability of detecting significant interactions of independent variables,
moderators and dependent variables using ANOVA is substantially reduced (Drazin & van de
Ven, 1985, p. 535). Second, effects could not be easily tested due to the small sample size on the
aggregated team level (Campion et al., 1996, p. 448). Despite the significant number of
respondents in both cases (n=320 for the Bank, and n=124 for the NPP), once aggregated on
team level, this was reduced to a considerably smaller number of teams in view of analysis of

Conclusions 263
variance. Thus future research, aimed at replicating this research’s findings, should strive to
increase the number of teams under study so that the impact of mediating variables can be
better studied. Obviously, the cost of such extensive study will likely be a critical factor.
Above we have argued that the fact that only two cases were studied is no impediment for the
value of this thesis’ conclusions. The internal validity is sufficiently covered for our purposes by
the double case study approach. However, in view of ameliorating the external validity of our
reconceptualized model, an extension to more cases is clearly beneficial.
A third limitation regards the fact that our survey needed to measure too much at the same
time, which has lead to a relatively limited number of items per construct under study. Although
we argue that this is necessary because of the exploratory and holistic vocation of our research,
future research should consider remediating ths problem.
A last shortcoming of this research is the relative underexposure of SenseMaking. Although
clearly present in our design and analysis, it has not been elaborated inf full. Future research
could make an attempt of remediating this.
4 Future Research Directions It is clear that a good deal of work lies ahead. Apart from the limitations and shortcomings in this
study that should be remediated in future research, some additional directions become
apparent.
4.1 Stronger research collaboration HRO research is characterized by a tradition of collaboration. The interdisciplinarity of the
Berkeley group for instance is characteristic in that respect (e.g. Rochlin et al., 1987). Although
less prominent, also the collaboration between the Berkeley and Michigan scholars is in line with
this observation (e.g. Weick & Roberts, 1993). What is lacking however is a structured inter-case
analysis. This study has made a step in this direction, but the hope is real that by documenting
such results and accumulating knowledge across and between organizational levels and
populations, researchers can make significant advances in mid-range theory (Drazin & van de
Ven, 1985, p. 536). If a series of studies at an industry level of analysis or for professional rather
than bureaucratic subunits shows a different pattern of findings, then some systematic
relationships between types (or levels) of organizations may become evident (Drazin & van de
Ven, 1985, p. 536).
4.2 Loose Coupling Theory During our research, we noted the following paradox: In spite of the fact that literature does not
seem to mention something like a reliability equation or a recipe for reliability (stating what
‘ingredients’ and in which portions should be added to the organization’s setting to ensure
reliability), after the occurrence of a mishap, people seem to be always capable of “pinpointing
the exact moment when the balance tipped towards disaster” (Sullivan & Beach, 2003).
Therefore the question emerges whether it would not be possible to pre-determine the cut-off
point at which an organization transfers from a reliable environment to one headed for disaster
(Sullivan & Beach, 2003). Our research has not managed to find this recipe, it merely has found
some of the ingredients and some indication on how the reliability cocktail could be created. We

264 Two Cases in High Reliability Organizing: a Hermeneutic Reconceptualization
posit that Loose Coupling Theory, as reconceptualized by Orton and Weick (1990), is a proper
framework for studying reliability. It offers an additional lens to better understand the reliability
cocktail through the interrelation of dimensions like type, cause, effect, compensation and
outcome of coupling. LCT may answer the ‘why’ question that cannot be answered by HRT
alone.
A relevant question in that respect is then how HRT strategies influence the degree and shape of
coupling and complexity. Therefore an examination into how one theory's independent variables
affect the other theory's dependent variable (Rijpma, 1997a), and vice versa, is needed. In other
words: What are the effects of complexity and tight-coupling on overall reliability? Or in Rijpma’s
words: “And how do HROs' reliability-promoting strategies impinge on complexity and tight-
coupling and, hence, on normal-accident proneness? How prone to normal accidents are
organizations applying the reliability-enhancing strategies discerned by HRT?” (Rijpma, 1997a, p.
16).
4.3 System Dynamics Besides a more suitable theoretical framework in form of Loose Coupling Theory, also a stronger
technique is needed to finetune what we have found in this study in order to determine more
precisely the contextual and structural dimensions that have to be administered for reliability.
System Dynamics is such a technique, and its further application in the domain looks promising.
For instance, System Dynamics can help in challenging the Threat Rigidity thesis (Staw et al.,
1981). Our findings indicate that there is reason to doubt this theory in its entirety. On the other
hand, we have found evidence that Threat Rigidity sometimes is a valuable altenative for Threat
Flexibility. System Dynamics is a suitable technique for dealing with such paradox.
4.4 Networked Reliability76 Another line of research would be the inter-organizational aspects of HRO. Inter-organizational
high reliability is increasingly gaining importance, especially in the field of networked
organizations like utility services (de Bruijne, 2006). Indeed, the particularity of this organization
type magnifies the questions already raised in non-networked settings: can high reliability be
accomplished by a network of organizations? What would this mean for the way they are
coupled? What about the balance between efficiency and effectiveness? These questions are
important because the transformation into network organizations means that traditional HROs
tend to exchange their monolithic nature for one that is built out of many relations.
Both the sector of energy and finance are an excellent example of this tendency. The electricity
market, for instance, is characterized by a liberalization of the composing parts (de Bruijne,
2006). Whereas a few years ago the production, distribution, transport and marketing of
electricity was managed by one and the same firm, legislators under impulse of neo-liberalism
have (artificially) split the industrial column and attributed the responsibility to different players.
The business model was not the only aspect the ‘electricians’ had to change more or less over-
night. The existing procedures, co-ordination and information processing mechanisms also had
to be adapted to fit the new paradigm. It cannot be taken for granted that this is done in a way
that can guarantee reliability in the longer run. It cannot be excluded that under the pressure of
legislation and reasons of efficiency and shareholder-value creation merely lip service has been
paid to reliability. Insight in complexity science however, learns that these changes do have

Conclusions 265
consequences. The couplings between the ‘anythings’ (Weick, 1976, p. 5) have changed, and
because it has not been mapped how and at what levels they have changed, the historic
evidence of reliability cannot be extrapolated to the years to come.
The same logic and course of action applies to the sector of banking, where the search of
economies of scale, market value and market share have lead to a conglomeration, nationally
and internationally. The inter-organizational dimension becomes prevalent, especially when
different (organization and/or national) cultures are in play or that processes and their quality
show a different degree of maturity when comparing elements from the conglomeration. At
best, this difference in speed will lead to some friction with loss of efficiency as a consequence.
At worst, organizational reliability cannot be guaranteed conform the standards of the more
mature processes. The potential result is not a leveling down of reliability, but its sheer
destruction.
The key to solving the issue of inter-organizational high reliability might be a thorough
elaboration of the concept of trust. Trust is an umbrella term for reliability for what links the
constructs underlying HRT. It is a requisite for properties like Deference to Expertise,
commitment ro resilience or Reluctance to Simplify. It is the lubricant for cross-boundary high
reliability. In that respect, special attention should be paid to the design of information systems
that can support the emergence and maintenance of trust between organizations (Ibrahim &
Ribbers, 2006).


Authored Publications 267
Authored Publications
1. Van de Walle,B., G.Van Den Eede, & W.Muhren (2009). Humanitarian Information
Management and Systems. Lecture Notes in Computer Science, 5424, 12-21.
2. Muhren,W., G.Van Den Eede, & B.Van de Walle (2009). Making Sense of Media Synchronicity
in Humanitarian Crises. IEEE Transactions on Professional Communication, 52(4),1-21.
3. Plotnick,L., M.Turoff, & G.Van Den Eede (2009). Reexamining Threat Rigidity: Implications for
Design. Proceedings of the 42nd Annual Hawaii International Conference on System Sciences, 1-
10.
4. Muhren,W., G.Van Den Eede, & B.Van de Walle (2008). Sensemaking as a Methodology for
ISCRAM Research: Information Processing in an Ongoing Crisis. Proceedings of the 5th
International ISCRAM Conference, 315-323.
5. Berghmans,P., G.Van Den Eede, & B.Van de Walle (2008). A Systems Perspective on Security
Risk Identification: Methodology and Illustrations from City Councils. Proceedings of the 5th
International ISCRAM Conference, 266-275.
6. Muhren,W., G.Van Den Eede, & B.Van de Walle (2008). Sensemaking and Implications for
Information Systems Design: Findings from The Democratic Republic of Congo's Ongoing Crisis.
Journal of Information Technology for Development, 14(3), 197-212.
7. Van Den Eede,G., W.Muhren, & B.Van de Walle (2008). Design for Complexity: Information
System Reliability seen from an Error Perspective. Proceedings of the Thrid ISCRAM China
workshop, 1-13.
8. Van Den Eede,G., W.Muhren, & B.Van de Walle (2008). Organizational Learning for the
Incident Management Process: Lessons from High Reliability Organizations. Journal of
Information System Security, 4(3), 3-22.
9. Stouthuysen,K. & G.Van Den Eede (2007). Ziende Blind: Over het Waarom van Crises en Hoe
Ze te Vermijden. Tijdschrift voor Economie en Management, 52(4), 589-616.
10. Muhren,W., G.Van Den Eede, & B.Van de Walle (2007). Organizational Learning for the
Incident Management Process: Lessons from High Reliability Organizations. Proceedings of the
European Conference on Information Systems, (15), 576-587.
11. Van Den Eede,G. & B.Van de Walle (2006). When Failure is not an Option. VITE Bulletin
International, 32, 22-23. Tilburg University.
12. Van Den Eede,G. & B.Van de Walle (2006). Reliability: Taxonomy and Indicators. Proceedings
of the Third International Symposium on Systems & Human Science, 1-14.

268 Two Cases in High Reliability Organizing: a Hermeneutic Reconceptualization
13. Van Den Eede,G., W.Muhren, R.Smals, & B.Van de Walle (2006). IS Capability for Incident
Management and the DERMIS Design Premises: The role of the DERMIS design principles.
Proceedings of the 3rd International Conference on Information Systems for Crisis Response and
Management, 251-261.
14. Van Den Eede,G., B.Van de Walle, & A.F.Rutkowski (2006). Dealing with Risk in Incident
Management: an Application of High Reliability Theory. Proceedings of the 39th Hawaii
International Conference on System Sciences, 1-10. IEEE.
15. Van Den Eede,G. & B.Van de Walle (2006). Four Perspectives - Three Dimensions: Risk
Management as a Cognitive Object. Proceedings of the Third International Symposium on
Systems & Human Science, 1-16.
16. Rutkowski,A.F., B.Van de Walle, & G.Van Den Eede (2006). The effect of Group Support
Systems on the Emergence of Unique Information in a Risk Management Process: a Field Study.
Proceedings of the 39th Hawaii International Conference on System Sciences, 1-9. IEEE.
17. Van Den Eede,G. & B.Van de Walle (2005). Operational Risk in Incident Management: a
Crossfertilisation between ISCRAM and IT Governance. Proceedings of the Second International
Conference on Information Systems for Crisis Response and Management, 53-60.
18. Carlé,B., G.Van Den Eede, A.F.Rutkowski, & B.Van de Walle (2005). Post-Tsunami Crisis
Response and Disaster Recovery in Sri Lanka: Experiences from Tilburg University Student
Projects. Proceedings of the Second International Conference on Information Systems for Crisis
Response and Management, 281-282.
19. Van Den Eede,G., D.Kenis, & B.Van de Walle (2004). Combining Flexibility and Reliability for
Mainstream Organisational Learning. Proceedings of the 5th European Conference on Knowledge
Management, 851-860. Academic Conferences International.
References 269
References
1. Aase,K. & G.Nybø (2002). Organizational knowledge in high-risk industries: What are the alternatives to model based learning approaches? European Conference on Organizational Knowledge, Learning, and Capabilities, 1-27.
2. Adler,P.S. & B.Borys (1996). Two Types of Bureaucracy: Enabling and Coercive. Administrative Science Quarterly, 41(1), 61-89.
3. Aerts,W. (2008). Exploring the relationships between problem-solving style and climates in best and worst-case work experiences. 1-135. Brussel, Vlekho Business School.
4. Ahlemeyer,H.W. (2001). Management by Complexity: Redundancy and Variety in Organizations. In: Geyer, F. & Johannes van der Zouwen, (Eds.), Sociocybernetics. Complexity, Autopoiesis, and Observation of Social Systems, 59-71. Greenwood Press, Westport, London.
5. Alavi,M. & D.E.Leidner (2001). Knowledge management and Knowledge Management Systems: Conceptual Foundations and Research Issues. MIS Quarterly, 25(1), 107-136.
6. Alter,S. (2004). Desperately Seeking Systems Thinking in the Information Systems Discipline. Proceedings of the International Conference on Information Systems, (25), 757-769.
7. Amabile,T.M., J.S.Mueller, W.B.Simpson, C.N.Hadley, S.J.Kramer, & L.Fleming (2002). Time Pressure and Creativity in Organizations: A Longitudinal Field Study. Harvard Business School Working Paper, Paper 02-073, 1-27.
8. Amalberti,R., Y.Auroy, D.Berwick, & P.Barach (2005). Five System Barriers to Achieving Ultrasafe Health Care. Annals of Internal Medicine, 142(9), 756-764.
9. Anand,G. & P.T.Ward (2004). Fit, Flexibility and Performance in Manufacturing. Production & Operations Management, 13(4), 369-385.
10. Arblaster,B., D.Griffith, S.Hochmuth, G.Howells, & S.Reeves (2005). Requirements Specification. 1-52. SEG.
11. Argyle,M. & J.Dean (1965). Eye contact, distance and affiliation. Sociometry, 28(3), 289-304.
12. Ash,J.S. & C.Smallman (2008). Rescue Missions and Risk Management: Highly Reliable or Over Committed? Journal of Contingencies and Crisis Management, 16(1), 37-52.
13. Ashby,W.R. (1958). Requisite variety and its implications for the control of complex systems. Cybernetica, 1(2), 83-99.
14. Ashby,W.R. (1962). Principles of the self-organizing system. Principles of Self-Organization:Transactions of the University of Illinois Symposium, (London), 255-278. H. Von Foerster - G. W. Zopf, Jr. (eds.).
15. Ashmos,D.P., D.Duchon, & R.R.McDaniel, Jr. (2000). Organizational responses to complexity: The effect on organizational performance. Journal of Organizational Change Management, 13(6), 577-594.
16. Avison,D., F.Lau, M.Myers, & P.A.Nielsen (1999). Action Research. Communications of the ACM, 42(1), 94-97.
17. Azadeh,M.A. (2000). Creating Highly Reliable Manufacturing Systems: An Integrated Approach. International Journal of Reliability, Quality & Safety Engineering, 7(3), 205-223.

270 Two Cases in High Reliability Organizing: a Hermeneutic Reconceptualization
18. Babb,J. & R.Ammons (1996). BOP inmate transport: A high reliability organization. Corrections Today, 58(4), 108.
19. Bacharach,S.B. (1989). Organizational Theories: Some Criteria for Evaluation. The Academy of Management Review, 14(4), 496-515.
20. Bain,W.A. (1999). Application of Theory of Action to Safety Management: Recasting the NAT/HRT Debate. Journal of Contingencies & Crisis Management, 7(3), 129-141.
21. Baker,D.P., R.Day, & E.Salas (2006). Teamwork as an essential component of high-reliability organizations. Health Services Research, 41(4, Part II), 1576-1598.
22. Baker,K.S., S.J.Jackson, & J.R.Wanetick (2005). Strategies Supporting Heterogeneous Data and Interdisciplinary Collaboration. Proceedings of the 38th Hawaii International Conference on System Sciences, 1-10.
23. Balthazard,P.A. & R.A.Cooke (2004). Organizational culture and knowledge management success: assessing the behavior-performance continuum. Proceedings of the 37th Hawaii International Conference on System Sciences, 239-248.
24. Barnard,C. (1938). The Functions of the Executive. Harvard University Press, Cambridge, MA.
25. Barnett,C.K. & M.G.Pratt (2000). From threat-rigidity to flexibility: Toward a learning model of autogenic crisis in organizations. Journal of Organizational Change Management, 13(1), 74-88.
26. Barrett,F.J. (1998). Creativity and Improvisation in Jazz and Organizations. Organization Science, 9(5), 605-622.
27. Bartolini,C. & M.Sallé (2004). Business driven prioritization of service incidents. Lecture Notes in Computer Science, 3278 64-75.
28. Basch,C.E. & R.S.Gold (1986). The dubious effects of type V errors in hypothesis testing on health education practice and theory. Health Education Research, 1(4), 299-305.
29. Baskerville,R.L. (2005). Best Practices in IT Risk Management: Buying Safeguards, Designing Security Architecture, or Managing Information Risk? Cutter Benchmark Review, 5(12), 5-12.
30. Bea,R.G. & W.H.Moore (1993). Operational Reliability and Marine Systems. In: Roberts, K. H., (Ed.), New Challenges to Understanding Organizations, 199-229. Macmillan, New York.
31. Beard,D.W. (1978). The Effects of Organizational Size and Complexity on Managerial Role Structure: An Exploratory Analysis. Academy of Management Proceedings, 170-174.
32. Beekun,R.I. & W.H.Glick (2001a). Organization structure from a loose coupling perspective: a Multidimensional Approach. Decision Sciences, 32(2), 227-250.
33. Beekun,R.I. & W.H.Glick (2001b). Organization structure from a loose coupling perspective. Decision Sciences, 32 227-250.
34. Behnke,J. & N.Behnke (2006). Poppers Theorie der Bewährung von wissenschaftlichen Theorien.Grundlagen der Statistischen Datenanalyse: Eine Einführung für Politikwissenschaftler, 88-93. Springer.
35. Bellamy,G.T., L.Crawford, L.H.Marshall, & G.A.Coulter (2005). The Fail-Safe Schools Challenge: Leadership Possibilities From High Reliability Organizations. Educational Administration Quarterly, 41(3), 383-412.
36. Bellinger,G. (2008a). Formulating Questions. http://www.systems-thinking.org/formq/fq.htm. [Accessed on 13/12/2008]
37. Bellinger,G. (2008b). Systems. http://www.systems-thinking.org/systems/systems.htm. [Accessed on 13/12/2008]
38. Benbasat,I., D.K.Goldstein, & M.Mead (1987). The Case Research Strategy in Studies of Information Systems. MIS Quarterly, 11(3), 368.
References 271
39. Bennet,A. & D.Bennet (2004). Organizational Survival in the New World: The Intelligent Complex Adaptive System. Elsevier Butterworth Heinemann, Burlington, MA (USA).
40. Berghmans,P., G.Van Den Eede, & B.Van de Walle (2008). A Systems Perspective on Security Risk Identification: Methodology and Illustrations from City Councils. Proceedings of the 5th International ISCRAM Conference, 266-275.
41. Bernard,J.-G. (2006). A Typology of Knowledge Management System Use by Teams. Proceedings of the 39th Hawaii International Conference on System Sciences, 7.
42. Berniker,E. & F.Wolf (1999). The Thermodynamics of Organizing: Information and Noise in Terms of the Second Law. 43rd Meeting of The International Society for Systems Science, 1-15.
43. Berniker,E. & F.Wolf (2001). Managing Complex Technical Systems: Working on a Bridge of Uncertainty. Proceedings of the Seventh International Association for the Management of Technology, 1-33.
44. Bierly III,P.E. & J.C.Spencer (1995). Culture and High Reliability Organizations: The Case of the Nuclear Submarine. Journal of Management, 21(4), 639-656.
45. Bigley,G.A. & K.H.Roberts (2001). The Incident Command System: High Reliability Organizing for Complex and Volatile Task Environments. Academy of Management Journal, 44(6), 1281-1299.
46. Boisot,M. & J.Child (1999). Organizations as Adaptive Systems in Complex Environments: The Case of China. Organization Science, 10(3), 237-252.
47. Boisot,M. & J.Cohen (2000). Shall I Compare Thee to … an Organization? Emergence, 2(4), 113-135.
48. Boland,R.J.Jr. & Y.Yoo (2003). Sensemaking and Knowledge Management. In: Holsapple, C. W., (Ed.), Handbook on Knowledge Management, Vol. 1 Knowledge Matters, 381-392. Springer Verlag, Berlin, Heidelberg, New York.
49. Boland,R.J.Jr. (2008). Decision Making and Sensemaking. In: Burstein, F. & Clyde W. Holsapple, (Eds.), Handbook on Decision Support Systems 1: Basic Themes, 55-63. Springer, Berlin.
50. Boone,C. & A.van Witteloostuijn (1995). Industrial Organization and Organizational Ecology: The Potentials for Cross-fertilization. Organization Studies, 16(2), 265-298.
51. Bostrom,R.P. & J.S.Heinen (1977). MIS Problems and Failures: A Socio-Technical Perspective. Part I: The Causes. MIS Quarterly, 1(3), 17-32.
52. Bourrier,M. (1996). Organizing Maintenance Work At Two American Nuclear Power Plants. Journal of Contingencies & Crisis Management, 4(2), 104-112.
53. Bourrier,M. (2005). The Contribution of Organizational Design to Safety. European Management Journal, 23(1), 98-104.
54. Bozeman,B. & E.A.Slusher (1979). Scarcity and Environmental Stress in Public organizations: A Conjectural Essay. Administration & Society, 11(3), 335-355.
55. Brenner,M. (2006). Classifying ITIL Processes: A Taxonomy under Tool Support Aspects. Proceedings of the First IEEE/IFIP International Workshop on Business Driven IT Management, 19-28.
56. Brown,S.L. & K.M.Eisenhardt (1997). The Art of Continuous Change: Linking Complexity Theory and Time-paced Evolution in Relentlessly Shifting Organizations. Administrative Science Quarterly, 42(1), 1-34.
57. Brusoni,S. & A.Prencipe (2005). A Dialectical Model of Organizational Loose Coupling: modularity, systems integration, and innovation. Paper presented at the DRUID Tenth Anniversary Summer Conference 2005, (Copenhagen, Denmark), 28.
58. BT (2005). Compliance and risk mitigation: Effective management of operational risks in financial services institutions. 1-10.

272 Two Cases in High Reliability Organizing: a Hermeneutic Reconceptualization
59. Burke,C.S., K.A.Wilson, & E.Salas (2005). The use of a team-based strategy for organizational transformation: guidance for moving toward a high reliability organization. Theoretical Issues in Ergonomics Science, 6(6), 509-530.
60. Busby,J.S. (2006). Failure to Mobilize in Reliability-Seeking Organizations: Two Cases from the UK Railway*. Journal of Management Studies, 43(6), 1375-1393.
61. Butler,B.S. & P.Gray (2006). Reliability, Mindfulness, and Information Systems. MIS Quarterly, 30(2), 211-224.
62. Butler,T. (1998). Towards a hermeneutic method for interpretive research in information systems. Journal of Information Technology, 13(4), 285.
63. Campion,M.A., E.M.Papper, & G.J.Medsker (1996). Relations Between Work Team Characteristics and Effectiveness: A Replication and Extension. Personnel Psychology, 49(2), 429-452.
64. Cannon,H.M. (1995). Dealing with the complexity paradox in business simulation. Developments In Business Simulation & Experiential Exercises, 25 96-102.
65. Capra,F. (1996). The Web of Life: A New Synthesis of Mind and Matter. HarperCollins.
66. Carley,K.M. & L.Zhiang (1995). Organizational designs suited to high performance under stress. International Conference on Systems, Man and Cybernetics, 25(2), 221-230.
67. Carley,K.M. (1990). Coordinating for success: trading information redundancy for task simplicity. Proceedings of the Twenty-Third Annual Hawaii International Conference on Systems Sciences, iv, 261-270.
68. Carlo,J.L., K.Lyytinen, & R.J.Boland, Jr. (2004). Systemic Risk, IT Artifacts, and High Reliability Organizations: A Case of Constructing a Radical Architecture. Sprouts: Working Papers on Information Environments, Systems and Organizations, 4(Article 4), 1-17.
69. Caroll,J.S., C.Perin, & A.A.Marcus (1993). Management Research on Outages and Maintenance. 28. https://hpds1.mit.edu/retrieve/2095/SWP-3580-45849204.pdf.
70. Carroll,J.M. & W.A.Kellogg (1989). Artifact as theory-nexus: hermeneutics meets theory-based design. ACM SIGCHI Bulletin, 20 7-14.
71. Carroll,J.S. & A.C.Edmondson (2002). Leading organisational learning in health care. Quality and Safety in Health Care, 11(1), 51-56.
72. CCTA (Central Computer & Telecommunications Agency) (2000). Best Practice for Service Support. The Stationery Office, Norwich, UK.
73. Central Computer & Telecommunications Agency,C. (2000). Best Practice for Service Support. ITIL, The key to Managing IT Services. The Stationery Office, Norwich, UK.
74. Child,J. & R.G.McGrath (2001). Organizations Unfettered: Organizational Form in an Information-Intensive Economy. Academy of Management Journal, 44(6), 1135-1148.
75. Choo,C.W. (2001). The knowing organization as learning organization. Education + Training, 43(4), 197-205.
76. Cilliers,P. (2000). Knowledge, Complexity, and Understanding. Emergence, 2(4), 7-13.
77. Clarke,L. (1993). Drs. Pangloss and Strangelove Meet Organizational Theory: High reliability Organizations and Nuclear Weapons Accidents. Sociological Forum, 8(4), 675-689.
78. Clegg,S.R., J.V.da Cunha, & M.P.Cunha (2002). Management paradoxes: A relational view. Human Relations, 55(5), 483-503.
79. Cohen,M.D., G.Dosi, M.Egidi, L.Marengo, & S.Warglien (1996). Routines and other recurrent action patterns of organizations: Contemporary research issues. Industrial and Corporate Change, 5 653-698.

References 273
80. Cohen,M.D., J.G.March, & J.P.Olsen (1972). A Garbage Can Model of Organizational Choice. Administrative Science Quarterly, 17(1), 1-25.
81. Conner,K.R. & C.K.Prahalad (1996). A Resource-based Theory of the Firm. Organization Science, 7(5), 477-501.
82. Cook,R. & J.Rasmussen (2005). "Going solid": a model of system dynamics and consequences for patient safety. Quality and Safety in Health Care, 14 130-134.
83. Cooke,D.L. & T.R.Rohleder (2006). Learning from incidents: from normal accidents to high reliability. System Dynamics Review, 22(3), 213-239.
84. Cooke,D.L. (2003). A System Dynamics Analysis of the Westray Mine Disaster. System Dynamics Review, 19(2), 139-166.
85. Cooren,F. (2004). The Communicative Achievement of Collective Minding: Analysis of Board Meeting Excerpts. Management Communication Quarterly, 17(4), 517-551.
86. Cothier,P. & A.H.Levis (1986). Timeliness and Measures of Effectiveness in Command and Control. IEEE Transactions on Systems, Man and Cybernetics, 16(4), 844-853.
87. Cox,S., B.Jones, & D.Collinson (2006). Trust Relations in High-Reliability Organizations. Risk Analysis: An International Journal, 26(5), 1123-1138.
88. Creed,W.E.D., S.K.Stout, & K.H.Roberts (1993). Organizational Effectiveness as a Theoretical Foundation for Research on Reliability-Enhancing Organizations. In: Roberts, K. H., (Ed.), New Challenges to Understanding Organizations, 55-73. Macmillan, New York.
89. Crichton,M.T., R.Flin, & W.A.R.Rattray (2000). Training Decision Makers - Tactical Decision Games. Journal of Contingencies & Crisis Management, 8(4), 208-217.
90. Cyert,R.M. & J.G.March (1963). A Behavioral Theory of the Firm. Prentice-Hall, Englewood Cliffs,NJ.
91. Daft,R.L. & R.H.Lengel (1986). Organizational information requirements, media richness and structural design. Management Science, 32(5), 554-571.
92. Das,T.K. & S.-B.Teng (2000). Instabilities of Strategic Alliances: An Internal Tensions Perspective. Organization Science, 11(1), 77.
93. D'Aunno,T. & R.I.Sutton (1992). The Responses of Drug Abuse Treatment Organizations to Financial Adversity: A Partial Test of the Threat-Rigidity Thesis. Journal of Management, 18(1), 117.
94. D'aveni,R.A. & I.C.MacMillan (1990). Crisis and the Content of Managerial Communications: A Study of the Focus of Attention of Top Managers in Surviving and Failing Firms. Administrative Science Quarterly, 35(4), 634-657.
95. de Bruijne,M. & M.van Eeten (2007). Systems that Should Have Failed: Critical Infrastructure Protection in an Institutionally Fragmented Environment. Journal of Contingencies and Crisis Management, 15(1), 18-29.
96. de Bruijne,M. (2006). Networked reliability. Doctoral thesis, Delft Technical University, the Netherlands, xii-472.
97. de Bruijne,M., M.van Eeten, E.Roe, & P.R.Schulman (2006). Assuring high reliability of service provision in critical infrastructures. International Journal of Critical Infrastructures, 2(2/3), 231-246.
98. De Haes,S. & W.Van Grembergen (2005). IT Governance Structures, Processes and Relational Mechanisms: Achieving IT/Business Alignment in a Major Belgian Financial Group. Proceedings of the 38th Hawaii International Conference on System Sciences, 1-10.
99. De Haes,S. & W.Van Grembergen (2006). Information Technology Governance Best Practices in Belgian Organisations. Proceedings of the 39th Hawaii International Conference on System Sciences, 1-9.
100. De Leeuw,A.C.J. (1982). Organisaties. Van Gorcum, Assen.

274 Two Cases in High Reliability Organizing: a Hermeneutic Reconceptualization
101. de Wild, A.F. & G.J. van der Pijl (2007). Explaining Risk Appetite Setting and Risk Evaluation Using Decision Theory. Workshop at the 1st European Risk Conference, 1-41.
102. Dennis,A.R., R.M.Fuller, & J.S.Valacich (2008). Media, Tasks, and Communication Processes: A Theory of Media Synchronicity. MIS Quarterly, 32(3), 575-600.
103. Denrell,J. (2003). Vicarious Learning, Undersampling of Failure, and the Myths of Management. Organization Science, 14(3), 227-243.
104. Denrell,J. (2006). Organizational Adaptation and Loose Coupling. http://www.sse.edu/NR/rdonlyres/efdubr4bh63owpuoajhvbpynyfke5sem7ft6rcwkovxtumuo54aypedkygaio4dpjfowwma33uwmjwhfnjfwvq37hca/110Denrell.pdf [Accessed on 12/11/2007].
105. Dervin,B. (1983a). An overview of sense-making research: Concepts, methods, and results to date. International Communication Association Annual Meeting, Dallas, TX.
106. Dervin,B. (1983b). Information as user construct: The relevance of perceived information needs to synthesis and interpretation. In: Ward, S. A. & L. J. Reed, (Eds.), Knowledge structure and use: Implications for synthesis and interpretation, 153-183. Temple University Press, Philadelphia.
107. Dervin,B. (1992). From the mind's eye of the user: The sense-making qualitative-quantitative methodology. In: Glazier, J. D. & Ronald R. Powell, (Eds.), Qualitative research in information management, 61-84. Libraries Unlimited, Englewood,Colorado (USA).
108. Dervin,B. (1999). On studying information seeking methodologically: the implications of connecting metatheory to method. Information Processing and Management, 35(6), 727-750.
109. Dhillon,G. & G.Torkzadeh (2006). Value-focused assessment of information system security in organizations. Information Systems Journal, 16(3), 293-314.
110. Dixon,N.M. & M.Shofer (2006). Struggling to Invent High-Reliability Organizations in Health Care Settings: Insights from the Field. Health Services Research, 41(4p2), 1618-1632.
111. Donaldson,L. (1990). The Ethereal Hand: Organizational Economics and Management Theory. Academy of Management Review, 15(3), 369-381.
112. Dörner,D. (1996). The Logic of Failure: Recognizing and Avoiding Error in Complex Situations. Metropolitan Books, New York, NY (USA).
113. Dougall,E.K., J.S.Horsley, & C.McLisky (2008). Disaster Communication: Lessons from Indonesia. International Journal of Strategic Communication, 2(2), 75-99.
114. Dov,Z. & L.Gil (2003). Organizational meta-scripts as a source of high reliability: The case of an army armored brigade. Journal of Organizational Behavior, 24(7), 837-859.
115. Drazin,R. & A.H.van de Ven (1985). Alternative Forms of Fit in Contingency Theory. Administrative Science Quarterly, 30(4), 514-539.
116. Drogoul,F., S.Kinnersly, A.Roelen, & B.Kirwan (2007). Safety in design - Can one industry learn from another? Safety Science, 45(1/2), 129-153.
117. Drucker,P.E. (1974). Management: tasks, responsibilites, and practices. Harper & Row, New York.
118. Durand,T. (2004). Organizational Knowledge When Needed: Between Threshold and Inertia, the Persistence & Renewal Challenge. Proceedings of the Fifth European Conference on Organisational Knowledge, Learning and Capabilities, 1-16.
119. Eden,C. (2004). Analyzing cognitive maps to help structure issues or problems. European Journal of Operational Research, 159(3), 673-686.

References 275
120. Eisenberg,E.M. (2006). Karl Weick and the Aesthetics of Contingency. Organization Studies, 27(11), 1693-1707.
121. Eisenhardt,K.M. (1989). Building Theories from Case Study Research. Academy of Management Review, 14(4), 532-550.
122. Eisenhardt,K.M. (1993). High Reliability Organizations Meet High Velocity Environments: Common Dilemmas in Nuclear Power Plants, Aircraft Carriers, and Microcomputers Firms. In: Roberts, K. H., (Ed.), New Challenges to Understanding Organizations, 117-135. Macmillan, New York.
123. Endsley,M.R. (1997). The role of situational awareness in naturalistic decision making. In: Zsambok, C. E. & Gary Klein, (Eds.), Naturalistic decision making , 269-284. Erlbaum, Mahwah, NJ.
124. Ericksen,J. & L.Dyer (2005). Toward a Strategic Human Resource Management Model of High Reliability Organization Performance. International Journal of Human Resource Management, 16(6), 907-928.
125. Ericson,T. (2001). Sensemaking in organisations -- towards a conceptual framework for understanding strategic change. Scandinavian Journal of Management, 17(1), 109-131.
126. Fayol,H. (1916). Administration Industrielle et Générale. Dunod, Paris. 127. Ferguson,T.D. & D.J.Ketchen, Jr. (1999). Organizational Configurations and
Performance: The Role of Statistical Power in Extant Research. Strategic Management Journal, 20(4), 385-395.
128. Fiol,C.M. & E.J.O'Connor (2003). Waking Up! Mindfulness in the Face of Bandwagons. Academy of Management Review, 28(1), 54-70.
129. Forrester,J.W. (1961). Industrial Dynamics. MIT Press, Cambridge, MA. 130. Forrester,J.W. (1993). System Dynamics and the Lessons of 35 Years. In: De Greene,
K. B., (Ed.), A Systems-Based Approach to Policymaking, Vol. Google, 199-240. Kluwer Academic Publishers, Boston.
131. Fox,A. & D.Patterson (2002). When does fast recovery trump high reliability? Proceedings of the.2nd Workshop on Evaluating and Architecting System Dependability, 1-9.
132. Frankel,A.S., M.W.Leonard, & C.R.Denham (2006). Fair and Just Culture, Team Behavior, and Leadership Engagement: The Tools to Achieve High Reliability. Health Services Research, 41(4p2), 1690-1709.
133. Fratus,J.M. (2008). High Reliability Organization Theory and the San Bernardino City, CA Fire Department. 1-68. San Bernardino, CA, San Bernardino City Fire Department.
134. Fucks,I. (2004). La culture de sûreté selon une démarche compréhensive: Une contribution à la gouvernance des risques dans des systèmes complexes. PhD thesis, 375. Université de Liège (Belgium).
135. Gadamer,H.G. (1988). On the circle of understanding. Hermeneutics versus science? Three German views, 68-78.
136. Gadamer,H.-G., J.Weinsheimer, & D.G.Marshall (2004). Truth and method. Continuum International Publishing Group.
137. Galbraith,J.R. (1973). Designing Complex Organizations. Addison-Wesley, Reading, MA.
138. Gary,L. (2003). Tested by Fire. Harvard Management Update, 8(12), 3-5. 139. Gauthereau,V. & E.Hollnagel (2005). Planning, Control, and Adaptation. European
Management Journal, 23(1), 118-131. 140. Gazendam,H.W.M. & R.J.Jorna (1998). Theories about architecture and
performance of multi-agent systems. SOM Research Report 98A02.

276 Two Cases in High Reliability Organizing: a Hermeneutic Reconceptualization
141. Gephart,R.P., Jr. (2004). Sensemaking and New Media at Work. American Behavioral Scientist, 48(4), 479-495.
142. Geyer,F. & J.van der Zouwen (2001). Introduction to the Main Themes in Sociocybernetics. In: Geyer, F. & Johannes van der Zouwen, (Eds.), Sociocybernetics: Complexity, Autopoiesis, and Observation of Social Systems, Vol. Tanguy-Bib VUB-kopie GVD, 1-14. Greenwood Press, Westport, Connecticut - London.
143. Gioia,D., K.G.Corley, & T.Fabbri (2002). Revising the past (while thinking in the future perfect tense) thinking in the future perfect tense). Journal of Organizational Change Management, 15(6), 622-634.
144. Gioia,D.A. & P.P.Poole (1984). Scripts in Organizational Behavior. Academy of Management Review, 9(3), 449-459.
145. Gioia,D.A., M.Schultz, & K.G.Corley (2000). Organizational Identity, Image, and Adaptive Instability. Academy of Management Review, 25(1), 63-81.
146. Gladstein,D.L. & N.P.Reilly (1985). Group Decision Making under Threat: The Tycoon Game. Academy of Management Journal, 28(3), 613-627.
147. Glassman,R.B. (1973). Persistence and Loose Coupling in Living Systems. Behavioral Science, 18 83-98.
148. Glisson,C. & L.R.James (2002). The cross-level effects of culture and climate in human service teams. Journal of Organizational Behavior, 23 767-794.
149. Gonzalez,J. (2005). Towards a Cyber Security Reporting System: A Quality Improvement Process. Proceedings of the 24th International Conference on Computer Safety, Reliability and Security, 24, 368-380. Berlin, Heidelberg, Springer-Verlag.
150. Goodhue,D.L. & R.L.Thompson (1995). Task-Technology Fit and Individual Performance. MIS Quarterly, 19(2), 213-236.
151. Grabowski,M. & K.H.Roberts (1997). Risk Mitigation in Large Scale Systems: Lessons from High Reliability Organizations. California Management Review, 39(4), 152-162.
152. Grabowski,M. & K.H.Roberts (1999). Risk Mitigation in Virtual Organizations. Organization Science, 10(6), 704-721.
153. Graesser,A.C., S.E.Gordon, & J.D.Sawyer (1979). Recognition memory for typical and atypical actions in scripted activities: Tests of a script pointer + tag hypothesis. Journal of Verbal Learning and Verbal Behavior, 18(3), 319-332.
154. Graves,S.B. & S.A.Waddock (2000). Beyond Built to Last ... Stakeholder Relations in "Built-to-Last" Companies. Business and Society Review, 105(4), 393-418.
155. Green,S.D. (1999). The missing arguments of lean construction. Construction Management & Economics, 17(2), 133-137.
156. Gregor,S. (2006). The Nature of Theory in Information Systems. MIS Quarterly, 30(2), 611-642.
157. Greiner,L.E. (1972). Evolution and Revolution as Organizations Grow. Harvard Business Review, 76(3), 55-68.
158. Griffith,T.L. & D.J.Dougherty (2001). Beyond socio-technical systems: introduction to the special issue. Journal of Engineering and Technology Management, 18(3/4), 207-218.
159. Hale,A.R., T.Heijer, & F.Koornneef (2003). Management of Safety Rules: The Case of Railways. Safety Science Monitor, 7(1), 11.
160. Hamel,G. & C.K.Prahalad (1994). Competing for the Future. Harvard Business School Press.
161. Hannan,M.T. & J.Freeman (1984). Structural Inertia and Organizational Change. American Sociological Review, 49(2), 149-164.
162. Harrison,B. (1997). Lean and Mean: Why Large Corporations Will Continue to Dominate the Global Economy. Guilford Publications.

References 277
163. Hart,S.G. & L.E.Staveland (1988). Development of NASA-TLX (Task Load Index): Results of empirical and theoretical research. In: Hancock, P. A. & N. Meshkati, (Eds.), Human Mental Workload, 239-250. North Holland Press, Amsterdam.
164. Hayek,F.A. (1945). The Use of Knowledge in Society. American Economic Review, 35(4), 519-530.
165. Heimann,L. (2005). Repeated Failures in the Management of High Risk Technologies. European Management Journal, 23(1), 105-117.
166. Hinkin,T.R. (1998). A Brief Tutorial on the Development of Measures for Use in Survey Questionnaires. Organizational Research Methods, 1(1), 104-121.
167. Hirschhorn,L. (1993). Hierarchy Versus Bureaucracy: The Case of a Nuclear Reactor. In: Roberts, K. H., (Ed.), New Challenges to Understanding Organizations, 137-149. Macmillan, New York.
168. Hollan,J. & S.Stornetta (1992). Beyond Being There. Proceedings of the Conference on Human Factors in Computing Systems, 119-125.
169. Houthoofd,N. (2001). Bedrijfsmanagement. Academia Press. 170. Hoy,W.K., C.Q.Gage III, & C.J.Tarter (2007). School Mindfulness and Faculty Trust. In:
Hoy, W. K. & MIchael DiPaola, (Eds.), Essential Ideas for the Reform of American Schools, 315-336. Information Age Publishing, Charlotte, North Carolina.
171. Hughes,J.A., D.Randall, & D.Shapiro (1992). Faltering from ethnography to design. Proceedings of the 1992 ACM conference on Computer-supported cooperative work, 115-122.
172. IAEA (2002a). Safety culture in nuclear installations: Guidance for use in the enhancement of safety culture. IAEA-TECDOC-1329, viii-90.
173. IAEA (2002b). Self-Assessment of Safety Culture in Nuclear Installations. IAEA, v-29. 174. IBM Business Consulting Services (2004). Business Knowledge Management. 1-190. 175. Ibrahim,M. & P.Ribbers (2006). Trust, Dependence and Global Interorganizational
Systems. Proceedings of the 39th Annual Hawaii International Conference on System Sciences, 8, 1-8.
176. Ichniowski,C., K.Shaw, & G.Prennushi (1997). The Effects of Human Resource Management Practices on Productivity: A Study of Steel Finishing Lines. American Economic Review, 87(3), 291-313.
177. Intosh-Murray,A. & C.W.Choo (2002). Information failures and catastrophes: What can we learn by linking Information Studies and disaster research? Proceedings of the American Society for Information Science and Technology, 39(64), 239-249.
178. Inwood,M. (1997). Heidegger. Oxford University Press, Oxford. 179. Janis,I. (1982a). Decision making under stress. In: Goldberger, L. & S. Breznitz, (Eds.),
Handbook of stress: Theoretical and clinical aspects, 69-87. The Free Press, New York.
180. Janis,I. (1982b). Groupthink: Psychological Studies of Policy Decisions and Fiascoes. Houghton Mifflin, Boston, MA.
181. Janis,I. (1989). Crucial Decisions: Leadership in policymaking and Crisis Management. The Free Press, New York.
182. Janssen,P. (2003). IT-Service Management volgens ITIL. Addison Wesley, Amsterdam.
183. Jarman,A. (2001). 'Reliability' Reconsidered: A Critique of the HRO-NAT Debate. Journal of Contingencies & Crisis Management, 9(2), 98-107.
184. Jennings,P.D. & R.Greenwood (2003). Constructing the Iron Cage: Institutional Theory and Enactment. In: Westwood, R. I. & Stewart Clegg, (Eds.), Debating Organization: Point-counterpoint in Organization Studies, 195-207. Blackwell Publishers, Malden, MA (USA).

278 Two Cases in High Reliability Organizing: a Hermeneutic Reconceptualization
185. Jensen,M.C. (1993). The Modern Industrial Revolution, Exit, and the Failure of Internal Control Systems. The Journal of Finance, 48(3), 831-880.
186. Jervis,R. (1997). Complexity and the analysis of political and social life. Political Science Quarterly, 112(4), 569.
187. Kampfner,R.R. (1998). Dynamics and information processing in adaptive systems. Biosystems, 46(1/2), 153-162.
188. Karvalics,L.Z. (2002). The Security Aspect of Information Society as a Global Biocultural System. Proceedings of the 17th World Computer Congress, 1-16.
189. Kasunic,M. (2005). Designing an Effective Survey. Carnegie Mellon, Pittsburgh, PA (USA).
190. Katz,D. & R.L.Kahn (1978). The social psychology of organizations. Wiley, New York. 191. Keeney,R.L. (1992). Value-focused Thinking: A Path to Creative Decisionmaking.
Harvard University Press, Cambridge,MA. 192. Keeney,R.L. (1996). Value-focused thinking: Identifying decision opportunities and
creating alternatives. European Journal of Operational Research, 92(3), 537-549. 193. Klatzky,S.R. (1970). Relationship to Organizational Size to Complexity and
Coordination. Administrative Science Quarterly, 15(4), 428-438. 194. Klein,G., B.Moon, & R.R.Hoffman (2006). Making Sense of Sensemaking 1:
Alternative Perspectives. IEEE Intelligent Systems, 21(4), 71-73. 195. Klein,G., J.K.Phillips, E.L.Rall, & D.A.Peluso (2003). A Data-Frame Theory of
Sensemaking. In: Hoffman, R. R., (Ed.), Expertise Out of Context: Proc.6th Internat.Conf.Naturalistic Decision Making, Vol. Pensacola, 113-155. Lawrence Erlbaum Associates, Mahwah,NJ.
196. Klein,H.K. & M.D.Myers (1999). A Set of Principles for Conducting and Evaluating Interpretive Field Studies in Information Systems. MIS Quarterly, 23(1), 67-93.
197. Klein,R.L., G.A.Bigley, & K.H.Roberts (1995). Organizational Culture in High Reliability Organizations: An Extension. Human Relations, 48(7), 771-793.
198. Knight,A.P. (2004). Measuring Collective Mindfulness and Exploring Its Nomological Network. Master thesis, University of Maryland, 1-102.
199. Koch,B.A. (1993). Differentiating Reliability Seeking Organizations from Other Organizations: Development and Validation of an Assessment Device. In: Roberts, K. H., (Ed.), New Challenges to Understanding Organizations, 75-97. Macmillan, New York.
200. Kolb,D.A. (1976). Management and the Learning Process. California Management Review, 18(3), 21-31.
201. Koontz,H. (1980). The Management Theory Jungle Revisited. Academy of Management Review, 5(2), 175-188.
202. Kraut,R.E., S.R.Fussell, S.E.Brennan, & J.Siegel (2002). Understanding effects of proximity on collaboration: Implications for technologies to support remote collaborative work. In: Hinds, P. & Sara B. Kiesler, (Eds.), Distributed Work, 137-162. MIT Press, Boston.
203. Kurtz,C.F. & D.J.Snowden (2003). The new dynamics of strategy. IBM Systems Journal, 42(3), 462-483.
204. Kuusisto,R. (2006). Flowing of Information in Decision Systems. Proceedings of the 39th Hawaii International Conference on System Sciences, 7.
205. La Porte,T.R. & G.I.Rochlin (1994). A Rejoinder to Perrow. Journal of Contingencies & Crisis Management, 2(4), 221-227.
206. La Porte,T.R. & P.M.Consolini (1991). Working in Practice but Not in Theory: Theoretical Challenges of "High-Reliability Organizations". Journal of Public Administration Research & Theory, 1(1), 19-48.

References 279
207. La Porte,T.R. (1994). A Strawman Speaks Up: Comments on The Limits of Safety. Journal of Contingencies & Crisis Management, 2(4), 207-211.
208. La Porte,T.R. (1996). High Reliability Organizations: Unlikely, Demanding, and at Risk. Journal of Contingencies & Crisis Management, 4(2), 60-71.
209. Landgren,J. (2005). Supporting fire crew sensemaking enroute to incidents. International Journal of Emergency Management, 2(3), 176-188.
210. Langer,E.J. & M.Moldoveanu (2000). The Construct of Mindfulness. Journal of Social Issues, 56(1), 1-9.
211. Langer,E.J. (1989). Mindfulness. Da Capo Press. 212. Lawrence,P.R. & J.W.Lorsch (1967). Organization and Environment. Richard D. Irwin,
Homewood, IL. 213. Lawson,M.B. (2001). In praise of slack: Time is of the Essence. Academy of
Management Executive, 15(3), 125-135. 214. Le-Coze,J.-C. (2006). Safety and security in the light of complexity. Proceedings of
the Third International Symposium on Systems & Human Science, 1-12. 215. Leonard,M., S.Graham, & D.Bonacum (2004). The human factor: the critical
importance of effective teamwork and communication in providing safe care. Quality and Safety in Health Care, 13(Supplement 1), 85-90.
216. Leveson,N.G. (2002). A New Approach To System Safety Engineering. MIT, Boston, MA.
217. Levinthal,D. & C.Rerup (2006). Crossing an Apparent Chasm: Bridging Mindful and Less-Mindful Perspectives on Organizational Learning. Organization Science, 17(4), 502-513.
218. Lewin,A.Y. & J.W.Minton (1986). Determining Organizational Effectiveness: Another Look, and an Agenda for Research. Management Science, 32(5), 514-538.
219. Lewin,K. (1945). The Research Center for Group Dynamics at Massachusetts Institute of Technology. Sociometry, 8(2), 126-136.
220. Lewis,A. (2004). RIMSAT DSS Project: Integrating Model-Based and Case-Based Reasoning. http://dssresources.com/. The RIMSAT Consortium. [Accessed on 5/5/2005].
221. Lin,Z. & K.M.Carley (2001). Organizational Design and Adaptation in Response to Crises: Theory and Practice. Academy of Management Best Papers Proceedings, 56. Washington DC (USA).
222. Linstone,H.A. & M.Turoff (1975). Philosophy. In: Linstone, H. A. & Murray Turoff, (Eds.), The Delphi Method: Techniques and Applications, 1-16. Addison-Wesley Publishing, Boston, MA (USA).
223. Little,R.G. (2005). Organizational Culture and the Performance of Critical Infrastructure: Modeling and Simulation in Socio-technological Systems. Proceedings of the 38th Hawaii International Conference on System Sciences, 1-8.
224. Longstaff,P.H. (2003). The Puzzle of Competition in the Communications Sector: Can Complex Systems be Regulated or Managed? Report PPLONGSTAFF-PUZZLE, Harvard University, Center for Information Policy Research, 1-47.
225. Lubatkin,M., J.Florin, & P.Lane (2001). Learning together and apart: A model of reciprocal interfirm learning. Human Relations, 54(10), 1353-1382.
226. MacCrimmon,K.R. & R.N.Taylor (1976). Decision making and problem solving. In: Dunnette, M. D., (Ed.), Handbook of industrial and organizational psychology, 1397-1453. Rand McNalley, Chicago.
227. Mackay,W.E. (1988). Diversity in the use of electronic mail: a preliminary inquiry. ACM Transactions on Information Systems, 6(4), 380-397.
228. Madison,G.B. (1988). The hermeneutics of postmodernity: Figures and themes. Indiana University Press, Bloomfield, IN.

280 Two Cases in High Reliability Organizing: a Hermeneutic Reconceptualization
229. Malpas,J. (2009). Hans-Georg Gadamer. Stanford Encyclopedia of Philosophy. 230. Marais,K. & N.Leveson (2003). Archetypes for Organisational Safety. Proceedings of
the Workshop on Investigation and Reporting of Incidents and Accidents. http://sunnyday.mit.edu/papers/iria-marais.pdf. [Accessed 16/6/2006].
231. Markus,M.L. (1983). Power, politics, and MIS implementation. Communications of the ACM, 26(6), 430-444.
232. Mascini,P. (1998). Risky Information. Journal of Contingencies & Crisis Management, 6(1), 35-44.
233. Matthews,R.B. (2004). Safety Management of Complex, High-Hazard Organizations. Defense Nuclear Facilities Safety Board, 1-67.
234. McBride,T. (2008). A Model for Investigating Software Accidents. JOURNAL OF RESEARCH AND PRACTICE IN INFORMATION TECHNOLOGY, 40(1), 19.
235. McLucas,A.C. (2003). Decision Making: Risk Management, Systems Thinking and Situation Awareness. Argos Press, Canberra.
236. Mendelson,H. (2000). Organizational Architecture and Success in the Information Technology Industry. Management Science, 46(4), 513.
237. Meyer,J.B. & H.M.Trice (1979). A Reexamination of the Relations Between Size and Various Components of Organizational Complexity. Administrative Science Quarterly, 24(1), 48-66.
238. Miller,D. (1993). The Architecture of Simplicity. Academy of Management Review, 18(1), 116-138.
239. Milliken,F.J. & L.L.Martins (1996). Searching for Common Threads: Understanding the Multiple Effects of Diversity in Organizational Groups. Academy of Management Review, 21(2), 402-433.
240. Mintzberg,H. (1978). Patterns in Strategy Formation. Management Science, 24(9), 934-948.
241. Mirvis,P.H. (1998). Practice Improvisation. Organization Science, 9(5), 586-592. 242. Mishra,A.K. (1996). Organizational responses to crisis: The centrality of trust. In:
Kramer, R. M. & Thomas Tyler, (Eds.), Trust in Organizations: Frontiers of Theory and Research, 261-287. Sage Publications, London.
243. Moberg,D.J. (2001). Diagnosing System States: Beyond Senge's Archetypes. Emergence, 3(2), 19-36.
244. Monge,P.R., L.W.Rothman, E.M.Eisenberg, K.I.Miller, & K.K.Kirste (1985). The Dynamics of Organizational Proximity. Management Science, 31(9), 1129-1141.
245. Montazemi,A.R. & D.W.Conrath (1986). The Use of Cognitive Mapping for Information Requirements Analysis. MIS Quarterly, 10(1), 44-56.
246. Montefusco,A. & S.Pesapane (2006). Affidabilità organizzativa: un approccio sistemico alla qualità in una banca "private". Working paper, 1-29.
247. Moray,N. (2000). Culture, politics and ergonomics. Ergonomics, 43(7), 858-868. 248. Morone,J.G. & E.J.Woodhouse (1986). Averting catastrophe: strategies for
regulating risky technologies. University of California Press, Berkeley. 249. Moss,M. (2001). Sensemaking, Complexity and Organisational Knowledge. The
Journal of Knowledge and Process Management, 8(4), 217-232. 250. Moynihan,D.P. (2004). Building Secure Elections: E-Voting, Security, and Systems
Theory. Public Administration Review, 64(5), 515-528. 251. Muhren,W. (2006). Towards High Reliability: A System Dynamics Analysis of a
Financial Institution's Incident Management Process. 1-60. Tilburg, Tilburg Univerisity.
252. Muhren,W., G.Van Den Eede, & B.Van de Walle (2007). Organizational Learning for the Incident Management Process: Lessons from High Reliability Organizations. Proceedings of the European Conference on Information Systems, (15), 576-587.

References 281
253. Muhren,W., G.Van Den Eede, & B.Van de Walle (2008a). Sensemaking and Implications for Information Systems Design: Findings from The Democratic Republic of Congo's Ongoing Crisis. Journal of Information Technology for Development, 14(3), 197-212.
254. Muhren,W., G.Van Den Eede, & B.Van de Walle (2008b). Sensemaking as a Methodology for ISCRAM Research: Information Processing in an Ongoing Crisis. Proceedings of the 5th International ISCRAM Conference, 315-323.
255. Muhren,W., G.Van Den Eede, & B.Van de Walle (2009). Making Sense of Media Synchronicity in Humanitarian Crises. IEEE Transactions on Professional Communication, 52(4), 1-21.
256. Myers,K.K. & R.D.McPhee (2006). Influences on Member Assimilation in Workgroups in High-Reliability Organizations: A Multilevel Analysis. Human Communication Research, 32(4), 440-468.
257. Nachreiner,F. (1995). Standards for ergonomics principles relating to the design of work systems and to mental workload. Applied Ergonomics, 26(4), 259-263.
258. Nance,W.D. (2005). Task/system fit. In: Davis, G. B., (Ed.), The Blackwell Encyclopedia of Management: Management Information Systems, Vol. 7, 324. Blackwell Publishing, Malden,MA.
259. Nathan,M.L. (2004). How past becomes prologue: a sensemaking interpretation of the hindsight-foresight relationship given the circumstances of crisis. Futures, 36 181-199.
260. Nelson,R.E. (2003). On the Nonhierarchical Nature of Managerial Hierarchies. Proceedings of the Third Conference of the Iberoamerican Academy of Management.
261. Nemeth,C.J. (1986). Differential contributions of majority and minority influence. Psychological review, 93(1), 23-32.
262. Nickles,D.P. (1999). Telegraph Diplomats: The United States' Relations with France in 1848 and 1870. Technology and Culture, 40(1), 1-25.
263. Nohria,N. & R.Gulati (1996). Is Slack Good or Bad for Innovation. Academy of Management Journal, 39(5), 1245-1264.
264. Nunamaker,J.F.J., D.R.Vogel, & B.Konsynsky (1989). Interaction of Task and Technology to Support Large Groups. Decision Support Systems, 9(5), 139-152.
265. Olson,G.M. & J.S.Olson (2000). Distance Matters. Human-Computer Interaction, 15(2/3), 139-178.
266. Orlikowski,W. & D.Robey (1991). Information Technology and the Structuring of Organizations. Information Systems Research, 2(2), 143-169.
267. Orlikowski,W.J. & D.C.Gash (1994). Technological Frames: Making Sense of Information Technology in Organizations. ACM Transactions on Information Systems, 12(2), 174-207.
268. Orlikowski,W.J. & J.J.Baroudi (1991). Studying Information Technology in Organizations: Research Approaches and Assumptions. Information Systems Research, 2(1).
269. Orlikowski,W.J. (1992). The Duality of Technology: Rethinking the Concept of Technology in Organizations. Organization Science, 3(3), 398-427.
270. Orton,J.D. & K.E.Weick (1990). Loosely Coupled Systems: A Reconceptualization. Academy of Management Review, 15(2), 203-223.
271. Oscarson,P. (2007). Actual and Perceived Information Systems Security. Linköping University, Department of Management and Engineering.
272. Ostroff,C. & N.Schmitt (1993). Configurations of Organizational Effectiveness and Efficiency. Academy of Management Journal, 36(6), 1345-1361.

282 Two Cases in High Reliability Organizing: a Hermeneutic Reconceptualization
273. Palvia,P.C., E.Mao, A.F.Salam, & K.S.Soliman (2003). Management Information Systems Research: What's There in a Methodology? Communications of the Association for Information Systems, 11(16), 289-308.
274. Paté-Cornell,E., L.M.Lakats, D.M.Murphy, & D.M.Gaba (1997). Anesthesia Patient Risk: A Quantitative Approach to Organizational Factors and Risk Management Options. Risk Analysis, 17(4), 511-523.
275. Patten,K. (2004). How CIOs Balance Flexibility and Reliability in Uncertain Business Environments. International Journal of Computers, Systems and Signals, 5(1), 3-15.
276. Payne,S.J. (2003). Users' Mental Models: The Very Ideas. In: Carroll, J., (Ed.), HCI Models, Theories, and Frameworks: Toward a Multidisciplinary Science, 135-156. Morgan Kaufmann Publishers, New York.
277. Pearce,C.L. & P.A.Herbik (2004). Citizenship Behavior at the Team Level of Analysis: The Effects of Team Leadership, Team Commitment, Perceived Team Support, and Team Size. Journal of Social Psychology, 144(3), 293-310.
278. Pearson,C.M. & I.I.Mitroff (1993). From crisis prone to crisis prepared: A framework for crisis management. Academy of Management Executive, 7(1), 48-59.
279. Pearson,C.M. & J.A.Clair (1998). Reframing Crisis Management. The Academy of Management Review, 23(1), 59-76.
280. Pelled,L.H., K.M.Eisenhardt, & K.R.Xin (1999). Exploring the Black Box: An Analysis of Work Group Diversity, Conflict, and Performance. Administrative Science Quarterly, 44(1), 1-28.
281. Perrow,C. (1994). The Limits of Safety. Journal of Contingencies & Crisis Management, 2(4), 212-220.
282. Perrow,C. (1999). Normal accidents: Living with High-Risk Technology. Basic Books, Princeton, NJ.
283. Perry,M. (2003). Distributed Cognition. In: Carroll, J., (Ed.), HCI Models, Theories, and Frameworks: Toward a Multidisciplinary Science, 193-223. Morgan Kaufmann Publishers, New York.
284. Peters,T. & R.H.Waterman (1982). In Search of Excellence. Harper and Row, New York, NY (USA).
285. Pidgeon,N. (1997). The Limits to Safety? Culture, Politics, Learning and ManMade Disasters. Journal of Contingencies & Crisis Management, 5(1), 1-13.
286. Pinto,M.B., J.K.Pinto, & J.E.Prescott (1993). Antecedents and Consequences of Project Team Cross-functional Cooperation. Management Science, 39(10), 1281-1297.
287. Plotnick,L., M.Turoff, & G.Van Den Eede (2009). Reexamining Threat Rigidity: Implications for Design. Proceedings of the 42nd Annual Hawaii International Conference on System Sciences, 1-10.
288. Po-An Hsieh,J.J. & W.Wang (2007). Explaining employees' Extended Use of complex information systems. European Journal of Information Systems, 16(3), 216-227.
289. Poelmans,S. (2002). Making Workflow Systems Work: An Investigation into the Importance of Task-appropriation Fit, End-user Support and other Technological Characteristics. (Leuven), viii-237. Katholieke Universiteit Leuven.
290. Poole,M.S. & A.H.van de Ven (1989). Using Paradox to Build Management and Organization Theories. The Academy of Management Review, 14(4), 562-578.
291. Porter,M. (1996). What is Strategy? Harvard Business Review, 74(6), 61-78. 292. Potgieter,B.C., C.Lew, & J.H.Botha (2005). Evidence that use of the ITIL framework is
effective. Paper presented at the 18th Annual Conference of the National Advisory Committee on Computing Qualifications, Tauranga, NZ., 160-167.

References 283
293. Prasad,K.N., W.C.Cole, & G.M.Haase (2004). Radiation protection in humans: extending the concept of as low as reasonably achievable (ALARA) from dose to biological damage. The British Journal of Radiology, 77(914), 97-99.
294. Prasad,V.J.R., H.C.Hwang, W.Kuo, & F.A.Tillman (2001). Optimal Reliability Design. Cambridge University Press, Cambridge, UK.
295. Pronovost,P.J., S.M.Berenholtz, C.A.Goeschel, D.M.Needham, J.B.Sexton, D.A.Thompson, L.H.Lubomski, J.A.Marsteller, M.A.Makary, & E.Hunt (2006). Creating High Reliability in Health Care Organizations. Health Services Research, 41(4), 1599-1617.
296. Pugh,D.S. (1973). The measurement of organization structures: Does context determine form? Organizational Dynamics, 1(4), 19-34.
297. Pugh,D.S., D.J.Hickson, C.R.Hinings, & C.Turner (1968). Dimensions of Organization Structure. Administrative Science Quarterly, 13(1), 65-105.
298. Quinn,R.E. & J.Rohrbaugh (1983). A Spatial Model of Effectiveness Criteria: Towards a Competing Values Approach to Organizational Analysis. Management Science, 29(3), 363-377.
299. Quinn,R.E. & K.S.Cameron (1988). Paradox and Transformation: Toward a Theory of Change in Organization and Management. Ballinger Pub Co.
300. Qureshi,Z.H., M.A.Ashraf, & Y.Amer (2007). Modeling industrial safety: A sociotechnical systems perspective. Industrial Engineering and Engineering Management, 2007 IEEE International Conference on, 1883-1887.
301. Ramanujam,R. & P.S.Goodman (2003). Latent errors and adverse organizational consequences: A conceptualization. Journal of Organizational Behavior, 24(7), 815-836.
302. Ramanujam,R. (2003). The Effects of Discontinuous Change on Latent Errors in Organizations: The Moderating Role of Risk. Academy of Management Journal, 46(5), 608-617.
303. Rasker,P. (2002). Communication and Performance in teams. Doctoral thesis, Universiteit van Amsterdam, Amsterdam, The Netherlands, iii-219.
304. Reason,J. (1990). Human Error. Cambridge University Press, Cambridge, UK. 305. Reason,J.T. (1997). Managing the Risks of Organizational Accidents. Ashgate,
Burlington. 306. Renn,O. (1998). Three decades of risk research: accomplishments and new
challenges. Journal of Risk Research, 1(1), 49-71. 307. Rennie,D.L. (2000). Grounded Theory Methodology as Methodical Hermeneutics:
Reconciling Realism and Relativism. Theory & Psychology, 10(4), 481-502. 308. Repenning,N.P. & J.D.Sterman (2001). Nobody Ever Gets Credit for Fixing Problems
that Never Happened. California Management Review, 43(4), 64-88. 309. Rerup,C. (2005). Learning from past experience: Footnotes on mindfulness and
habitual entrepreneurship. Scandinavian Journal of Management, 21(4), 451-472. 310. Reynolds,D., S.C.Stringfield, & E.Schaffer (2006). The High Reliability Schools project:
Some preliminary results and analyses. Improving schools and educational systems: International perspectives, 56-76.
311. Rice,R.E. & N.S.Contractor (1990). Conceptualizing effects of office information systems: A methodology and application for the study of alpha, beta, and gamma changes. Decision Sciences, 21(1), 301-317.
312. Riddle,B.L., C.M.Anderson, & M.M.Martin (2000). Small Group Socialization Scale: Development and Validity. Small Group Research, 31(5), 554-572.
313. Rijpma,J.A. (1997a). Complexity, Tight-Coupling and Reliability: Connecting Normal Accidents Theory and High Reliability Theory. Journal of Contingencies & Crisis Management, 5(1), 15-23.

284 Two Cases in High Reliability Organizing: a Hermeneutic Reconceptualization
314. Rijpma,J.A. (1997b). Complexity, Tight-Coupling and Reliability. Journal of Contingencies & Crisis Management, 5(1), 15-23.
315. Rijpma,J.A. (2003). From Deadlock to Dead End: The Normal Accidents-High Reliability Debate Revisited. Journal of Contingencies & Crisis Management, 11(1), 37-46.
316. Roberts, K. (Ed.)(1993). New Challenges to Understanding Organizations. Macmillan, New York.
317. Roberts,K.H. & C.Libuser (1993). From Bhopal to Banking: Organizational Design Can Mitigate Risk. Organizational Dynamics, 21(4), 15-26.
318. Roberts,K.H. & D.M.Rousseau (1989). Research in nearly failure-free, high-reliability organizations: having the bubble. IEEE Transactions on Engineering management, 36(2), 132-139.
319. Roberts,K.H. & R.Bea (2001a). Must Accidents Happen? Lessons from High Reliability Organizations. Academy of Management Executive, 15(3), 70-79.
320. Roberts,K.H. & R.G.Bea (2001b). When Systems Fail. Organizational Dynamics, 29(3), 179-191.
321. Roberts,K.H. & W.E.D.Creed (1993). Epilogue. In: Roberts, K. H., (Ed.), New Challenges to Understanding Organizations, 249-256. Macmillan, New York.
322. Roberts,K.H. (1990a). Managing High Reliability Organizations. California Management Review,(Summer), 101-113.
323. Roberts,K.H. (1990b). Some Characteristics of One Type of High Reliability Organization. Organization Science, 1(2), 160-176.
324. Roberts,K.H. (1993). Introduction. In: Roberts, K. H., (Ed.), New Challenges to Understanding Organizations, 1-10. Macmillan, New York.
325. Roberts,K.H. (2003). HRO Has Prominent History. Anesthesia Patient Safety Foundation Newsletter, 18(1).
326. Roberts,K.H. (2005). High Reliability Organizations., Vol. Vlekho Bib, 157-158. Blackwell Publishing.
327. Roberts,K.H., D.M.Rousseau, & T.R.La Porte (1994). The culture of high reliability: Quantitative and Qualitative Assessment Aboard Nuclear Power Aircraft Carriers. The Journal of High Technology Management Research, 5(1), 141-161.
328. Roberts,K.H., S.K.Stout, & J.J.Halpern (1994). Decision Dynamics in Two High Reliability Military Organizations. Management Science, 40(4), 614-624.
329. Rochlin,G.I. (1989). Informal organizational networking as a crisis- avoidance strategy: US naval flight operations as a case study. Organization & Environment, 3(2), 159-176.
330. Rochlin,G.I. (1993). Defining "High Reliability" Organizations in Practice: A Taxonomic Prologue. In: Roberts, K. H., (Ed.), New Challenges to Understanding Organizations, 11-32. Macmillan, New York.
331. Rochlin,G.I. (1999). Safe operation as a social construct. Ergonomics, 42(11), 1549-1560.
332. Rochlin,G.I., T.R.La Porte, & K.H.Roberts (1987). The Self-Designing High-Reliability Organization: Aircraft Carrier Flight Operations at Sea. Naval War College Review, 40(4), 76-90.
333. Roe,E., L.Huntsinger, & K.Labnow (1998). High reliability pastoralism. Journal of Arid Environments, 39(1), 39-55.
334. Roe,E., P.R.Schulman, M.van Eeten, & M.de Bruijne (2005). High-Reliability Bandwidth Management in Large Technical Systems. Journal of Public Administration Research & Theory, 15(2), 263-280.
335. Romme,G.L. & A.van Witteloostuijn (1999). Circular organizing and triple loop learning. Journal of Organizational Change Management, 12(5), 439-453.

References 285
336. Rosa,E.A. (2005). Celebrating a Citation Classic - And More. Organization & Environment, 18(2), 229.
337. Rose,J. (1999). Structurational Theory of IS-Theory Development and Case Study Illustrations. Proceedings of the European Conference on Information Systems.
338. Rosness,R., G.Guttormsen, T.Steiro, R.K.Tinmannsvik, & I.A.Herrera (2004). Organisational Accidents and Resilient Organisations: Five Perspectives. STF38 A 04403, 1-78. Trondheim, Norway, SINTEF.
339. Rossi,R.J. & S.C.Stringfield (1995). What we must do for students placed at risk. Phi Delta Kappan, 77(1), 73-76.
340. Rousseau,D.M. & C.Libuser (1997). Contingent Workers in High Risk Environments. California Management Review, 39(2), 103-123.
341. Rousseau,D.M. (1996). The Limits of Safety: Organizations, Accidents, and Nuclear Weapons. Administrative Science Quarterly, 41(1), 200-203.
342. Ruchlin,H.S., N.L.Dubbs, & M.A.Callahan (2004). The Role of Leadership in Instilling a Culture of Safety: Lessons from the Literature. Journal of Healthcare Management, 49(1), 47-58.
343. Rudolph,J.W. & N.P.Repenning (2002). Disaster Dynamics: Understanding the Role of Quantity in Organizational Collapse. Administrative Science Quarterly, 47 1-30.
344. Rugg,G., M.Eva, A.Mahmood, N.Rehman, S.Andrews, & S.Davies (2002). Eliciting information about organizational culture via laddering. Information Systems Journal, 12(3), 215-229.
345. Rutkowski,A.F., B.Van de Walle, & G.Van Den Eede (2006). The effect of Group Support Systems on the Emergence of Unique Information in a Risk Management Process: a Field Study. Proceedings of the 39th Hawaii International Conference on System Sciences, 1-9. IEEE.
346. Rutkowski,A.F., B.Van de Walle, W.Van Groenendaal, & J.PoL (2005). When Stakeholders Perceive Threats and Risks Differently: the Use of Group Support Systems to Develop a Common Understanding and a Shared Response. Journal of Homeland Security and Emergency Management, 2(1), 1-15.
347. Sagan,S.D. (1993). The Limits of Safety: Organizations, Accidents, and Nuclear Weapons. Princeton University Press, Princeton, NJ.
348. Sagan,S.D. (2003). Toward a Political Theory of Organizational Reliability. Journal of Contingencies & Crisis Management, 2(4), 228-240.
349. Sagan,S.D. (2004). Learning from Normal Accidents. Organization & Environment, 17(1), 15-19.
350. Salge,M. & P.M.Milling (2006). Who is to blame, the operator or the designer? Two stages of human failure in the Chernobyl accident. System Dynamics Review, 22(2), 89-112.
351. Sammarco,J.J. (2002). A Complexity Assessment Methodology for Programmable Electronic Mining Systems. Proceedings of the 20th International Systems Safety Conference, 177-186.
352. Saunders,M., P.Lewis, & A.Thornhill (2000). Research Methods for Business Students. Prentice Hall, Harlow, Essex.
353. Savolainen,R. (1993). The sense-making theory: Reviewing the interests of a user-centered approach to information seeking and use. Information Processing & Management, 29(1), 13-28.
354. Schäfer,L. (1996). Karl R. Popper. Verlag C.H. Beck oHG, München. 355. Schneider,S.C. (1997). Interpretation in Organizations: Sensemaking and Strategy.
European Journal of Work and Organizational Psychology, 6(1), 93-101.

286 Two Cases in High Reliability Organizing: a Hermeneutic Reconceptualization
356. Schulman,P.R. (1993a). The Analysis of High Reliability Organizations: A Comparative Framework. In: Roberts, K. H., (Ed.), New Challenges to Understanding Organizations, 33-53. Macmillan, New York.
357. Schulman,P.R. (1993b). The Negotiated Order of Organizational Reliability. Administration & Society, 25(3), 353-372.
358. Schulman,P.R. (2001). Review of J.M. Sanne, Creating safety in air traffic control. Administrative Science Quarterly, 46(2), 345-348.
359. Schulman,P.R., E.Roe, M.van Eeten, & M.de Bruijne (2004). High Reliability and the Management of Critical Infrastructures. Journal of Contingencies & Crisis Management, 12(1), 14-28.
360. Schwabe,G. & H.Krcmar (2000). Piloting a Socio-technical Innovation. Proceedings of the 8th European Conference on Information Systems, (8), 132-139.
361. Senge,P.M. (1990). The Fifth Discipline: The Art and Science of the Learning Organization. Doubleday, New York, NY (USA).
362. Sewera,S. (2005). Referenzmodelle im Rahmen von IT-Governance. 1-63. http://wwwai.wu-wien.ac.at/~koch/lehre/inf-sem-ss-05/referenzmodelle.pdf. [Accessed 15/6/2009].
363. Shea,G.P. & R.A.Guzzo (1987). Group Effectiveness: What Really Matters? Sloan Management Review, 28(3), 25-31.
364. Sills,D.L., C.P. Wolf & V.B. Shelanski (Eds.) (1982). Accident at Three Mile Island: The Human Dimensions. Westview Press, Boulder, CO.
365. Simon,H.A. (1962). The Architecture of Complexity. Proceedings of the American Philosophical Society, 106(6), 467-482.
366. Singer,P. (1983). Hegel. Oxford University Press, Oxford, UK. 367. Singh,J.V. (1986). Performance, Slack, and Risk Taking in Organizational Decision
Making. Academy of Management Journal, 29(3), 562-585. 368. Smals,R. (2006). Reliability of the Maintenance and Repair Process of a Nuclear
Power Plant. 1-80. Tilburg, The Netherlands, Tilburg University. 369. Smart,P.K., D.Tranfield, P.Deasley, R.Levene, A.Rowe, & J.Corley (2003). Integrating
'lean' and 'high reliability' thinking. Proceedings of the Institution of Mechanical Engineers, 217(5), 733-739.
370. Smith,A. (1776). An Inquiry into the Nature and Causes of the Wealth of Nations. Modern Library, New York.
371. Smith,J.A. (1996). Beyond the divide between cognition and discourse: Using interpretative phenomenological analysis in health psychology. Psychology and Health, 11(2), 261-271.
372. Smith-Crowe,K., M.J.Burke, & R.S.Landis (2003). Organizational climate as a moderator of safety knowledge–safety performance relationships. Journal of Organizational Behavior, 24(7 (Special Issue)), 861-876.
373. Snook,S.A. (2002). Friendly Fire: The Accidental Shootdown of US Black Hawks over Northern Iraq. Princeton University Press, Princeton-Oxford.
374. Snowden,D. (2005). Striking the Right Balance with KM and Risk. Knowledge Management Review, 8(1), 24-27.
375. Soh,C. & M.L.Markus (1995). How IT Creates Business Value: A Process Theory Synthesis. Proceedings of the Sixteenth International Conference on Information Systems, 29-41.
376. Staber,U. & J.Sydow (2002). Organizational Adaptive Capacity: A Structuration Perspective. Journal of Management Inquiry, 11(4), 408-424.
377. Stacey,R. (1996). Management and the Science of Complexity. Research Technology Management, 39(3), 8-10.

References 287
378. Starbuck,W.H. & F.J.Milliken (1988). Challenger: Fine-tuning the odds until something breaks. Journal of Management Studies, 25(4), 319-340.
379. Starbuck,W.H. & P.C.Nystrom (1981). Designing and understanding organizations. Oxford University Press, Oxford.
380. Staw,B.M., L.E.Sandelands, & J.E.Dutton (1981). Threat-Rigidity Effects in Organizational Behavior. Administrative Science Quarterly, 26(4), 501-524.
381. Stengers,I. (2004). The challenge of complexity. Emergence, 6(1/2), 92-99. 382. Sterman,J.D. (1989). Modeling Managerial Behavior: Misperceptions of Feedback in
a Dynamic Decision Making Experiment. Management Science, 35(3), 321-339. 383. Sterman,J.D. (2000). Business Dynamics: Systems Thinking and Modeling for a
Complex World. McGrawHill, Boston. 384. Stewart,T.R. (2000). Uncertainty, Judgment, and Error in Prediction. In: Sarewitz, D.,
R. A. Pielke, & R. Byerly, (Eds.), Prediction: Science, Decision Making, and the Future of Nature, 41-57. Island Press, Washington, DC.
385. Storck,J.S. & J.C.Henderson (2003). Alternative Strategies for Leveraging the Knowledge Asset: A Framework for Managerial Decision Making. In: Holsapple, C. W., (Ed.), Handbook on Knowledge Management, Vol. 1 Knowledge Matters, 507-521. Springer Verlag, Berlin, Heidelberg, New York.
386. Straub,D.W. & R.J.Welke (1998). Coping with Systems Risk: Security Planning Models for Management Decision Making. MIS Quarterly, 22(4), 441-469.
387. Strauss,A. & J.Corbin (1998). Basics of Qualitative Research. Sage Publications, Thousand Oaks.
388. Sullivan,J. & R.Beach (2002). Learning from High Reliability Organizations in the Development of ERP Systems: A Proposed Research Design. Americas Conference on Information Systems, 1417-1427.
389. Sullivan,J. & R.Beach (2003). Understanding System Development and Operation in High Reliability Organizations: A Conceptual Model. Proceedings of the First Security Conference, 1-21.
390. Sutcliffe,K.M. & T.J.Vogus (2003). Organizing For Resilience. In: Cameron, K. S., Jane Dutton, & Robert E. Quinn, (Eds.), Positive Organizational Scholarship, 94-110. Berrett-Koehler, San Francisco, CA (USA).
391. Sutton,R.I. & B.M.Staw (1995). What Theory is Not. Administrative Science Quarterly, 40(3), 371-384.
392. Swanson,E.B. & N.C.Ramiller (2004). Innovating Mindfully with Information Technology. MIS Quarterly, 28(4), 553-583.
393. Tan,F.B. & M.G.Hunter (2002). The repertory grid technique: A method for the study of cognition in information systems. MIS Quarterly, 26(1), 39.
394. Tarn,J.H., M.S.David, & H.J.Wen (1998). Managing Manmade System Disasters with Advanced Cybernetics. Human Systems Management, 17(4), 231-244.
395. Taylor,F.W. (1911). The Principles of Scientific Management. Harper Bros, New York. 396. Thiadens,T. & H.Spanjersberg (2000). Beheerst beheren: Beheer van ICT
voorzieningen uit managementoptiek. Stichting Het Expertise Centrum, Den Haag, 1-100.
397. Thite,M. (2004). Managing People in the New Economy. International Journal of Knowledge, Culture and Change Management, 4 139-143.
398. Thomas,J.B., S.M.Clark, & D.A.Gioia (1993). Strategic Sensemaking and Organizational Performance. Linkages among Scanning, Interpretation, Action, and Outcomes. Academy of Management Journal, 36(2), 239-270.
399. Thompson,J.D. (1967). Organizations in action. MacGraw-Hill, New York, NY (USA).

288 Two Cases in High Reliability Organizing: a Hermeneutic Reconceptualization
400. Tsoukas,H. & J.Shepherd (2004). Organisations and the Future: From Forecasting to Foresight. In: Tsoukas, H. & Jill Shepherd, (Eds.), Managing the Future: Foresight in the Knowledge Economy, Vol. Vlekho BIB, 1-17. Blackwell Publishing, Oxford, UK.
401. Tsoukas,H. & M.J.Hatch (2001). Complex thinking, complex practice: The case for a narrative approach to organizational complexity. Human Relations, 54(8), 979-1013.
402. Tsoukas,H. (2000). Knowledge as Action, Organization as Theory: Reflections on Organizational Knowledge. Emergence, 2(4), 104-112.
403. Turoff,M., M.Chumer, B.Van de Walle, & Y.Xiang (2004). The Design of a Dynamic Emergency Response Management Information Systems. Journal of Information Technology Theory and Application, 5(4), 1-35.
404. Turoff,M., S.R.Hiltz, A.N.F.Bahgat, & A.R.Rana (1993). Distributed Group Support Systems. MIS Quarterly, 17(4), 399-417.
405. Tushman,M.L. & C.A.O'Reilly (1997). Winning through innovation: A practical guide to leading organizational change and renewal. Harvard Business School Press, Boston,MA.
406. Tushman,M.L. & C.A.O'Reilly (1999). Building Ambidextrous Organizations. Health Forum Journal, 42(2), 20-23.
407. Uysal,Z.C. (2009). Two Theoretical Perspectives on Architectural History and Theory: Hermeneutics and Structuralism on Cultural Studies in Architecture. DDN 702 - Research Paradigms: Analytical Essay. http://ncsudesign.org/content/baran/ddn702/uysal_ddn702_analyticalessay.pdf [Accessed 21/7/2009]
408. van Bon,J., G.Kemmerling, D.Pondman, & A.van der Veen (2004). IT Service Management: een introductie op basis van ITIL. Van Haren Publishing, Zaltbommel, The Netherlands.
409. van den Bercken,J.H.L. & M.J.M.Voeten (2002). Variantieanalyse: de GLM-benadering. Stenfert Kroese, Groningen, The Netherlands.
410. Van Den Eede,G. & B.Van de Walle (2005). Operational Risk in Incident Management: a Crossfertilisation between ISCRAM and IT Governance. Proceedings of the Second International Conference on Information Systems for Crisis Response and Management, 53-60.
411. Van Den Eede,G., B.Van de Walle, & A.F.Rutkowski (2006). Dealing with Risk in Incident Management: an Application of High Reliability Theory. Proceedings of the 39th Hawaii International Conference on System Sciences, 1-10. IEEE.
412. Van Den Eede,G., D.Kenis, & B.Van de Walle (2004). Combining Flexibility and Reliability for Mainstream Organisational Learning. Proceedings of the 5th European Conference on Knowledge Management, 851-860. Academic Conferences International.
413. Van Den Eede,G., W.Muhren, R.Smals, & B.Van de Walle (2006). IS Capability for Incident Management and the DERMIS Design Premises: The role of the DERMIS design principles. Proceedings of the 3rd International Conference on Information Systems for Crisis Response and Management, 251-261.
414. van Fenema,P.C. (2002). Coordination and Control of Globally Distributed Software Projects. 1-574. Rotterdam, The Netherlands, Erasmus Universiteit.
415. van Fenema,P.C. (2005). Collaborative elasticity and breakdowns in high reliability organizations: contributions from distributed cognition and collective mind theory. Cognition, Technology & Work, 7(2), 134.
416. van Genuchten,M.J.I.M., C.van Dijk, H.Scholten, & D.R.Vogel (2001). Using Group Support Systems for software inspections. IEEE Software, 18(3), 60-65.
417. Van Uden,J. (2005). Using complexity science in organization studies. Emergence: Complexity & Organization, 7(1), 60-66.

References 289
418. Vanhuysse,J. (2005). Werkafhandelingsproces. [Internal Document]. 419. Vartabedian,R. (2006). Safety issues probed at Texas nuclear plant. Los Angeles
Times. 420. Vogus,T.J. & K.M.Sutcliffe (2007). Organizational resilience: Towards a theory and
research agenda. IEEE International Conference on Systems, Man, and Cybernetics, 3418-3422.
421. Vogus,T.J. & T.M.Welbourne (2003a). Structuring for high reliability: HR Practices and Mindful Process in Reliability-Seeking Organizations. Journal of Organizational Behavior, 24(7), 877-903.
422. Vogus,T.J. & T.M.Welbourne (2003b). Structuring for high reliability. Journal of Organizational Behavior, 24 877-903.
423. Wallace,B., A.Ross, & J.B.Davies (2003). Applied hermeneutics and qualitative safety data: the CIRAS project. Human Relations, 56(5), 587-607.
424. Walsham,G. (1995). Interpretive case studies in IS research: nature and method. European Journal of Information Systems, 4(2), 74-81.
425. Walsham,G. (2006). Doing interpretive research. European Journal of Information Systems, 15 320-330.
426. Waterman,R.H. (1990). Adhocracy: The Power to Change. Whittle Direct Books, Knoxville, TN (USA).
427. Weber,M. (1968). Economy and Society. University of California Press, Berkeley, CA (USA).
428. Weick,K.E. & D.K.Meader (1993). Sensemaking and Group Support Systems. In: Jessup, L. M. & Joseph S. Valacich, (Eds.), Group Support Systems: New Perspectives, 230-252. Macmillan Publishing Company, New York.
429. Weick,K.E. & K.H.Roberts (1993). Collective Mind in Organizations: Heedful Interrelating on Flight Decks. Administrative Science Quarterly, 38(3), 357-381.
430. Weick,K.E. & K.M.Sutcliffe (2001). Managing the Unexpected: Assuring High Performance in an Age of Complexity. Jossey-Bass (Wiley), San Francisco, CA.
431. Weick,K.E. (1976). Educational Organizations as Loosely Coupled Systems. Administrative Science Quarterly, 21(1), 1-19.
432. Weick,K.E. (1979). The Social Psychology of Organizing. Mc-Graw-Hill Publishing Co, New York, N.Y. (USA).
433. Weick,K.E. (1983). Misconceptions about managerial productivity. Business Horizons, 26(4), 47-52.
434. Weick,K.E. (1985). Cosmos vs. chaos: Sense and nonsense in electronic contexts. Organizational Dynamics, 14(2), 51-64.
435. Weick,K.E. (1987). Organizational Culture as a Source of High Reliability. California Management Review, 29(2), 112-127.
436. Weick,K.E. (1988). Enacted Sensemaking in Crisis Situations. Journal of Management Studies, 25(4), 305-317.
437. Weick,K.E. (1989). Theory Construction as Disciplined Imagination. Academy of Management Review, 14(4), 516-531.
438. Weick,K.E. (1995). Sensemaking in Organizations. Sage Publications, Thousand Oaks, CA.
439. Weick,K.E. (1998). Improvisation as a Mindset for Organizational Analysis. Organization Science, 9(5), 543-555.
440. Weick,K.E. (2001a). Book Review Weick. Administrative Science Quarterly, 46(1), 147-151.
441. Weick,K.E. (2001b). The Attitude of Wisdom. Blackwell Publishers, Oxford, UK. 442. Weick,K.E. (2004). Normal Accident Theory as Frame, Link, and Provocation.
Organization & Environment, 17(1), 27-31.

290 Two Cases in High Reliability Organizing: a Hermeneutic Reconceptualization
443. Weick,K.E., K.M.Sutcliffe, & D.Obstfeld (1999). Organizing for high reliability: Processes of Collective Mindfulness. Research in Organizational Behavior, 21 81-123.
444. Weick,K.E., K.M.Sutcliffe, & D.Obstfeld (2005). Organizing and the Process of Sensemaking. Organization Science, 16(4), 409-421.
445. Wernerfelt,B. (1984). A Resource-Based View of the Firm. Strategic Management Journal, 5(2), 171-180.
446. Whetten,D.A. & K.S.Cameron (1994). Organizational effectiveness: Old models and new constructs. In: Greenberg, J., (Ed.), Organizational Behavior: The State of the Science, 135-153. Lawrence Erlbaum Associates, Hillsdale, NJ.
447. Whitman,M.E. & H.J.Mattord (2008). Principles of information security. Thomson Course Technology.
448. Wijnen,K., W.Janssens, P.De Pelsmacker, & P.Van Kenhove (2002). Marktonderzoek met SPSS. Statistische verwerking en interpretatie. Garant, Antwerpen-Apeldoorn.
449. Wildavsky,A. (1988). Searching for Safety. Transaction Publishers, New Brunswick. 450. Williams,P. (2002). The Competent Boundary Spanner. Public Administration, 80(1),
103-124. 451. Wilson,K.A., C.S.Burke, H.A.Priest, & E.Salas (2005). Promoting health care safety
through training high reliability teams. Quality and Safety in Health Care, 14(4), 303-309.
452. Wolf,F. & E.Berniker (2008). Validating Normal Accident Theory. http://www.plu.edu/~bernike/index.htm, 1- 6. [Accessed 18/07/2009].
453. Wolf,F. & P.Sampson (2007). Evidence of an Interaction Involving Complexity and Coupling as Predicted by Normal Accident Theory. Journal of Contingencies and Crisis Management, 15(3), 123-133.
454. Wolf,F. (2001). Operationalizing and testing normal accidents in petrochemical plants and refineries. Production & Operations Management, 10(3), 292-305.
455. Wolf,L.J. (2004). Can You Handle the Headaches? Analyzing and Optimizing the Effectiveness of the Incident Management Process? Information Systems Security, 13(5), 9-20.
456. Wolstenholme,E. (2003). Towards the definition and use of a core set of archetypal structures in system dynamics. System Dynamics Review, 19(1), 7-26.
457. Wolstenholme,E. (2004). Using generic system archetypes to support thinking and modelling. System Dynamics Review, 20(4), 341-356.
458. Wolstenholme,E., S.Henderson, & A.Gavine (1993). The Evaluation of Management Information Systems: A Dynamic and Holistic Approach. Wiley, Chichester.
459. Woodward,W. (2001). Triadic Exchange as Design Practice. The Communication Review, 4(2), 279-304.
460. Xiao,Y. & J.Moss (2001). Practices of High Reliability Teams: Observations in Trauma Resuscitation. Human Factors and Ergonomics Society Annual Meeting Proceedings, 395-399.
461. Yule,S. (2003). Senior Management Influence on Safety Performance in the UK and US Energy Sectors. Aberdeen, UK, University of Aberdeen.
462. Zack,M.H. (1999). Managing Organizational Ignorance. Knowledge Directions, 1(Summer), 36-49.
463. Zack,M.H. (2000). Jazz Improvisation and Organizing. Organization Science, 11(2), 227-234.

Appendices 291
Appendices
Appendix A. Interview Protocol (Bank Case)
Z. Meta data
Context Are you familiar with the ITIL methodology? Do you know what Incident
Management is? In what respect? How did you find out about it?
Context In what way do you consider yourself related to continuous IT services? Since
how long are you working as….? Current job-function?
A. People
HR Are there sometimes tensions between first, second and third line
collaborators/services? Can these tensions cause sub optimality, danger even? Is
there a divergence of goals between the stakeholders in the IM process?
HR Is it easy to motivate personnel? Are collaborators complimented when they
have successfully managed an incident? How is morale amongst IM service
members?
HR How is the promotion of collaborators of the process dealt with? How are
collaborators rewarded? On what criteria is he/she judged? For working quickly
or for working thoroughly?
HR Is succession of key players guaranteed? Is there redundancy in people?
KM Are collaborators stimulated to share information on solving problems/problems
solved? Do we teach each other on IM?
KM Is it possible to use competences of other specialists in the Bank if possible?
Training Are people in the service sufficiently experienced for their job? Are all staff
sufficiently trained? Why not? Do you know IM procedures are trained?
Training To what extent do you think IM organization members are committed to
resilience (ability to bounce back from errors and cope with unexpected events
via improvisation) (HRT)?
Culture Is there a shared mental model amongst the organization members on what it is
all about (HRT)?
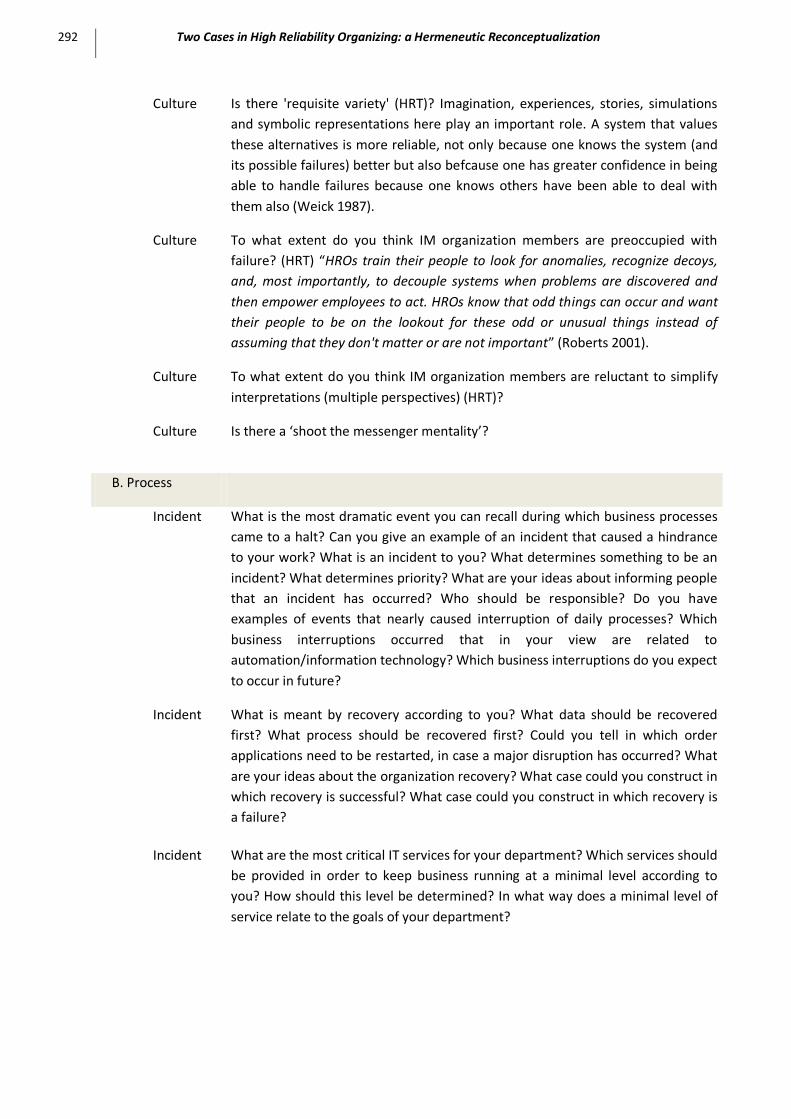
292 Two Cases in High Reliability Organizing: a Hermeneutic Reconceptualization
Culture Is there 'requisite variety' (HRT)? Imagination, experiences, stories, simulations
and symbolic representations here play an important role. A system that values
these alternatives is more reliable, not only because one knows the system (and
its possible failures) better but also befcause one has greater confidence in being
able to handle failures because one knows others have been able to deal with
them also (Weick 1987).
Culture To what extent do you think IM organization members are preoccupied with
failure? (HRT) “HROs train their people to look for anomalies, recognize decoys,
and, most importantly, to decouple systems when problems are discovered and
then empower employees to act. HROs know that odd things can occur and want
their people to be on the lookout for these odd or unusual things instead of
assuming that they don't matter or are not important” (Roberts 2001).
Culture To what extent do you think IM organization members are reluctant to simplify
interpretations (multiple perspectives) (HRT)?
Culture Is there a ‘shoot the messenger mentality’?
B. Process
Incident What is the most dramatic event you can recall during which business processes
came to a halt? Can you give an example of an incident that caused a hindrance
to your work? What is an incident to you? What determines something to be an
incident? What determines priority? What are your ideas about informing people
that an incident has occurred? Who should be responsible? Do you have
examples of events that nearly caused interruption of daily processes? Which
business interruptions occurred that in your view are related to
automation/information technology? Which business interruptions do you expect
to occur in future?
Incident What is meant by recovery according to you? What data should be recovered
first? What process should be recovered first? Could you tell in which order
applications need to be restarted, in case a major disruption has occurred? What
are your ideas about the organization recovery? What case could you construct in
which recovery is successful? What case could you construct in which recovery is
a failure?
Incident What are the most critical IT services for your department? Which services should
be provided in order to keep business running at a minimal level according to
you? How should this level be determined? In what way does a minimal level of
service relate to the goals of your department?

Appendices 293
Incident What is your opinion about how the continuity of IT services is managed? What
aspects is a limitation in providing continuous IT service? What could be done
according to you to improve continuity of IT services? On what criteria would you
evaluate continuous service? What should IT know from the business units in
order to improve the delivery of continuous service?
Incident What is the impact to the business processes in case IT services come to a halt?
How do you assess the importance of IT applications to function continuously?
How do you assess the impact of business processes that are disrupted?
How do you assess the financial impact of business processes that are disrupted?
Which applications can automatically not function anymore due to the
unavailability of other applications? In what way the point of time (within a 24h
day) of an IT service disruption influences the organization? How would you
determine the impact of a failure?
Incident In what way your department is affected if other departments face discontinuity
of IT services? What interdependencies between departments do you observe if
the application of one department fails to function? For how long can you
continue your business operations in case the processes in all other departments
would have discontinued?
Incident Can you give examples of a domino effect that culminated in a disaster?
Procedure Are there procedures for IM? Are they known to you? Does everybody in the
business know who to contact in case of an incident? Are they giving satisfaction?
Are they always followed? Why not? Is it sometimes good that they are not
followed?
Procedure Are there procedures to alert for a threatening escalation of an incident? Is it
possible that these procedures are ignored if they might disgrace a (group of)
collaborator(s)? What happens if an incident seems to indicate that a
mistake/failure/abuse/improper use has occurred? Is there the risk for a cover-
up? Are all procedures always followed or are there by-passes possible? Is this
always/sometimes/never good?
Procedure Does IM provide in registration of incidents? Are these incidents traceable
afterwards? Do they really get investigated or is it just an idle database? Is there a
post-incident registration of the definitive incident category, impact code and
cause (causing component). How do you get track of the incident management
failures? Do you yourself register the failures concerning the IM process?
Procedure How does the IM deal with waiting-lists for the registering of the calls/incidents?
What happens to a no-answer (the user gave up trying to 'get in')? Is this a shared
responsibility of the IM and user of just of the user alone? How is overburdening
dealt with? How is it resolved ad-hoc? How is resolved on a longer term basis?

294 Two Cases in High Reliability Organizing: a Hermeneutic Reconceptualization
Procedure If it seems during the handling of the incident that the number of impacted users
is higher, how is this dealt with? Does the priority change?
Procedure Is there a feedback mechanism to the user who reported the incident (on the
projected time frame needed to solve the incident? Is there a feedback
mechanism from the user to IM on the appreciation of the time frame?
Procedure What kind of Key Reliability Indicators are in place in connection to the IM
process?
Procedure Has it happened that an incident was dealt with by an expert (elsewhere) in the
organization, instead of the proper domain expert in the IM process? Were there
conflicting solutions suggested? Which measures have been taken to avoid this?
Procedure Do you know of situations were IM has worsened the situation? Was there
something fundamentally wrong or was it just a coincidence? Do you know of
situations where risk migrates when the introduction of a risk mitigation measure
to address one problem in the system introduces other, unintended
consequences in another part of the system.
Procedure Are there aspects of the current procedures that are somewhat bureaucratic?
Procedure Is there 'slack' built in the IM process (HRT)?
Procedure Does the process of prioritizing incidents take into account SLAs? (quint.nl)
Procedure Does Incident Management do a good job in identifying the priority of incidents?
Did they get the impact right? Did they get the priority right? Is there a better
way to get impact and/or priority right?
Procedure Communication. What platforms are in place for briefing? What platforms are
used for debriefing? How/Do you communicate changes in desired service levels
and availability levels. When they increase? When they decrease? Has it ever
happened that a service was restored conveniently but that you were not aware
of this until you discovered by accident? Did you lose valuable time in the mean
while? Do you have an opportunity to express your view on the incident? Did it
occur that the solution which had been found was known to you/could have been
suggested by you?
Meta Are the stakeholders of IM questioned on a regular basis? How are the outcomes
of these inquiries dealt with? Are they used for improving the IM process? Is
there a double-loop learning mechanism, even when the incident does not lead
to a 'problem'? Is there a double loop learning concerning IM. Are the procedures
reviewed? Or is just the incident fixed?
Meta If trends are spotted (by the Incident Managers), how are they implemented in
the IT service management process?

Appendices 295
Meta Does the Incident Management Process Owners analyze the reliability of their
service on a cost/benefit basis?
Meta In a distributed system with limited physical oversight, the normal antidotes to
human and organizational error—checks and balances, redundancy, and
training—may be defeated by the size and scope of the system, or by subcultures
which can develop in the system. How is internal control done? How can one be
sure that procedures are followed? Are there sufficient checks and balances? Is
there an equilibrium between responsibility and accountability?
Meta Are there people in the IM process who still see the 'big picture'? How is the
Sensitivity to Operations (seeing the big picture of operation in the moment)How
is this big-picture composed (HRT)? The ultimate objective is the development of
a culture of trust, which is so typical of HROs. HROs consistently communicate the
big picture of what the organization seeks to do, and try to get everyone to
communicate with each other about how they fit in the big picture (Roberts
2001). This is also called transactive memory (van Fenema 2003) and means that
people know who does what in their (temporary) group, which in turn brings
about stability.
Meta Is the internal audit procedure effective in discovering risks? Are the
recommendations of audit followed-up?
Meta Is the best person always dealing with the problem? Or is there a mechanism to
migrate the incident to the best-suited person? (migrating decision-making)
Meta Is there a knowledge transfer from first line to second line collaborators in such a
way that there is an increase in the success rate of solving incidents (quint.nl)?
Meta How is Incident Management embedded in the other ITIL processes? How are the
bridges between IM en Problem management? What about the information
exchange?
C. Technology
Technology Is the technology currently in use sufficient?
Technology Is the technology compatible with other IS?
Technology Is there redundancy in hardware and software?
Technology Is the technology supportive of mindfulness (HRT)?
Procedure Does the IM-tool simultaneously provide an adaptation of the Configuration
Management Database (CMDB)?
Technology Does the tool report adequate Management Information? Is this regularly
checked with the management?

296 Two Cases in High Reliability Organizing: a Hermeneutic Reconceptualization
D. Environment
Meta What mechanisms are there to assure that the IM process is in line with external
norms and legislation?
Structure Are there elements in the IT organization, or the whole organization that are a
hindrance to the way IM is operating?
Structure On what basis are decisions for supplementary funding made? Have you had a
restructuring of your services (downsizing, loss of personnel, cost-cutting)?
Structure How would you describe the vision of management: long-term or short term? Do
you have enough support from management or are they just pay lip service to
you and your team (i.e. they are only happy when nothing happens but are not
willing to do a preventive effort?) Have you tried to pull their attention to your
problems?
Structure Is there an under-specification of structures (organized anarchy via fluid decision-
making) (HRT)?
Structure Looking at crisis situations, Perrow (1999) recommends to put limits to the size of
the parts of systems that could be stand-alone parts. He furthermore advises to
“link them through 'buses' – in the electrical sense – designed to buffer the
disturbances in each”. The ‘glue’ between these components must be such that
components still can range in diversity. This is with regard to management-styles,
technologies, structures and decision processes. What is your opinion?
Culture Does your organization have a safety culture? Would you describe the
organization’s culture as one fostering risk awareness/ Are there incentives for
reporting on risk? Do you think the safety culture will still stand regardless of the
leadership’s personality and their concern with risk. Do you know who you should
address in case you want to report a risk? Are you rewarded for a pro-active
reporting on possible risks?
Culture Hierarchies must allow for a broad and real delegation (Bigley 2001), with real
delegation meaning the transfer of task, responsibility and authority.
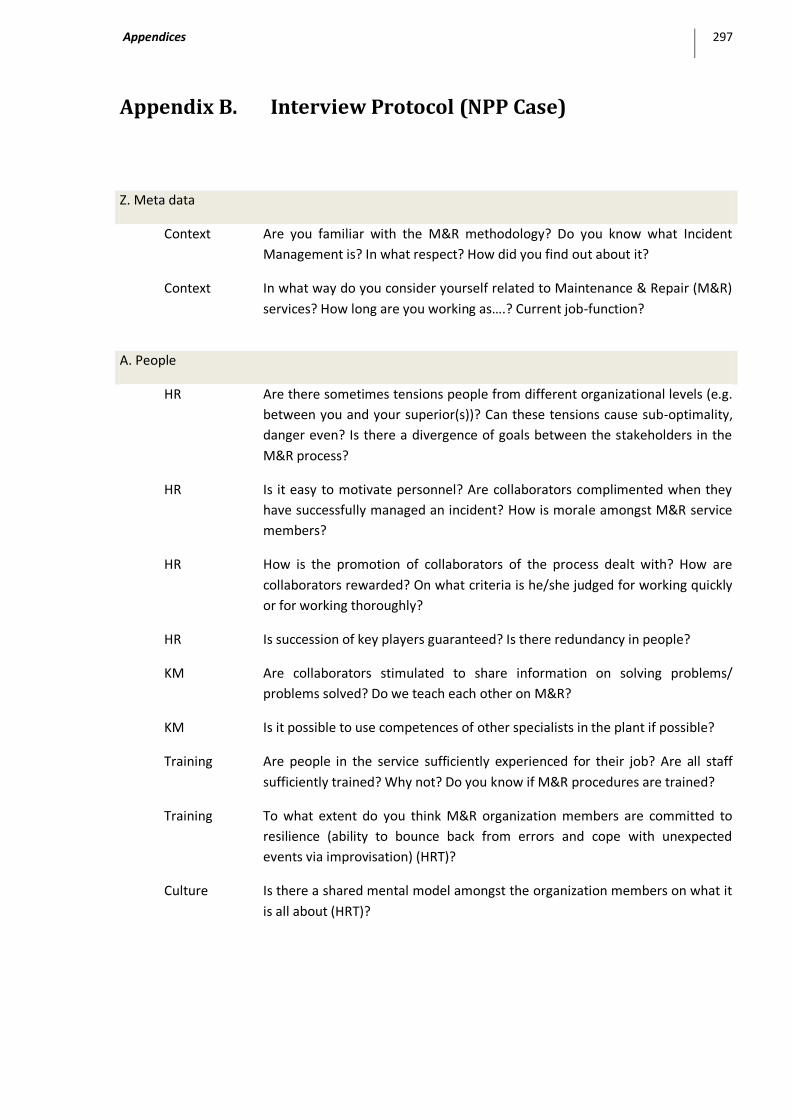
Appendices 297
Appendix B. Interview Protocol (NPP Case)
Z. Meta data
Context Are you familiar with the M&R methodology? Do you know what Incident
Management is? In what respect? How did you find out about it?
Context In what way do you consider yourself related to Maintenance & Repair (M&R)
services? How long are you working as….? Current job-function?
A. People
HR Are there sometimes tensions people from different organizational levels (e.g.
between you and your superior(s))? Can these tensions cause sub-optimality,
danger even? Is there a divergence of goals between the stakeholders in the
M&R process?
HR Is it easy to motivate personnel? Are collaborators complimented when they
have successfully managed an incident? How is morale amongst M&R service
members?
HR How is the promotion of collaborators of the process dealt with? How are
collaborators rewarded? On what criteria is he/she judged for working quickly
or for working thoroughly?
HR Is succession of key players guaranteed? Is there redundancy in people?
KM Are collaborators stimulated to share information on solving problems/
problems solved? Do we teach each other on M&R?
KM Is it possible to use competences of other specialists in the plant if possible?
Training Are people in the service sufficiently experienced for their job? Are all staff
sufficiently trained? Why not? Do you know if M&R procedures are trained?
Training To what extent do you think M&R organization members are committed to
resilience (ability to bounce back from errors and cope with unexpected
events via improvisation) (HRT)?
Culture Is there a shared mental model amongst the organization members on what it
is all about (HRT)?

298 Two Cases in High Reliability Organizing: a Hermeneutic Reconceptualization
Culture Is there 'requisite variety' (HRT)? Imagination, experiences, stories, simulations
and symbolic representations here play an important role. A system that
values these alternatives is more reliable, not only because one knows the
system (and its possible failures) better but also because one has greater
confidence in being able to handle failures because one knows others have
been able to deal with them also (Weick 1987).
Culture To what extent do you think M&R organization members are preoccupied with
failure? (HRT) “HROs train their people to look for anomalies, recognize decoys,
and, most importantly, to decouple systems when problems are discovered and
then empower employees to act. HROs know that odd things can occur and
want their people to be on the lookout for these odd or unusual things instead
of assuming that they don't matter or are not important” (Roberts 2001).
Culture To what extent do you think M&R organization members are reluctant to
simplify interpretations (multiple perspectives) (HRT)?
Culture Is there a ‘shoot the messenger mentality’?
B. Process
Incident What is the most dramatic event you can recall during which business
processes came to a halt? Can you give an example of an incident that caused
a hindrance to your work? What is an incident to you? What determines
something to be an incident? What determines priority? What are your ideas
about informing people that an incident has occurred? Who should be
responsible? Do you have examples of events that nearly caused interruption
of daily processes? Which business interruptions occurred that in your view
are related to automation/information technology? Which business
interruptions do you expect to occur in future?
Incident What is meant by recovery according to you? What process should be
recovered first? Could you tell how to act in order to let the plant resume its
operations, in case a major disruption has occurred? What are your ideas
about the organization recovery? What case could you construct in which
recovery is successful? What case could you construct in which recovery is a
failure?
Incident What are the most critical (production) services for your department? Which
services should be provided in order to keep business running at a minimal
level according to you? How should this level be determined?
In what way does a minimal level of service relate to the goals of your
department?

Appendices 299
Incident What is your opinion about how the continuity of plant operation is managed?
What aspect is a limitation in providing continuous plant operation? What
could be done according to you to improve continuity of plant operation? On
what criteria would you evaluate continuous service?
Incident What is the impact to the business processes in case (production) services
come to a halt? How do you assess the importance of production applications
to function continuously? How do you assess the impact of business processes
that are disrupted? How do you assess the financial impact of business
processes that are disrupted? Which applications can automatically not
function anymore due to the unavailability of other applications? In what way
the point of time (within a 24h day) of an service disruption influences the
organization? How would you determine the impact of a failure?
Incident In what way your department is affected if other departments face
discontinuity of services? What interdependencies between departments do
you observe if the application of one department fails to function?
For how long can you continue your business operations in case the processes
in all other departments would have discontinued?
Incident Can you give examples of a domino effect that culminated in an incident?
Procedure Are there procedures for M&R? Are they known to you? Does everybody in
the business know who to contact in case of an incident? Are they giving
satisfaction? Are they always followed? Why not? Is it sometimes good that
they are not followed?
Procedure Are there procedures to alert for a threatening escalation of an incident? Is it
possible that these procedures are ignored if they might disgrace a (group of)
collaborator(s)? What happens if an incident seems to indicate that a
mistake/failure/abuse/improper use has occurred? Is there the risk for a
cover-up? Are all procedures always followed or are there by-passes possible?
Is this always/sometimes/never good?
Procedure Does M&R provide in registration of incidents? Are these incidents traceable
afterwards? Do they really get investigated or is it just an idle database? Is
there a post-incident registration of the definitive incident category, impact
code and cause (causing component). How do you get track of the incident
management failures? Do you yourself register the failures concerning the
M&R process?
Procedure How does the M&R deal with waiting-lists for the registering of the
calls/incidents? What happens to a no-answer (the user gave up trying to 'get
in')? Is this a shared responsibility of the M&R and user of just of the user
alone? How is overburdening dealt with? How is it resolved ad-hoc? How is
resolved on a longer term basis?

300 Two Cases in High Reliability Organizing: a Hermeneutic Reconceptualization
Procedure If it seems during the handling of the incident that the impact on operations or
plant/personnel safety changes? Does the priority change?
Procedure Is there a feedback mechanism to the user who reported the incident (on the
projected time frame needed to solve the incident? Is there a feedback
mechanism from the user to M&R on the appreciation of the time frame?
Procedure What kind of Key Reliability Indicators are in place in connection to the M&R
process?
Procedure Has it happened that an incident was dealt with by an expert (elsewhere) in
the organization, instead of the proper domain expert in the M&R process?
Were there conflicting solutions suggested? Which measures have been taken
to avoid this?
Procedure Do you know of situations where M&R has worsened the situation? Was there
something fundamentally wrong or was it just a coincidence? Do you know of
situations where risk migrates when the introduction of a risk mitigation
measure to address one problem in the system introduces other, unintended
consequences in another part of the system?
Procedure Are there aspects of the current procedures that are somewhat bureaucratic?
Procedure Is there 'slack' built in the M&R process (HRT)?
Procedure Does the process of prioritizing incidents take into account SLAs? (quint.nl)
Procedure Does Incident Management do a good job in identifying the priority of
incidents? Did they get the impact right? Did they get the priority right? Is
there a better way to get impact and/or priority right?
Procedure Communication. What platforms are in place for briefing? What platforms are
used for debriefing? (How/Do you communicate changes in desired service
levels and availability levels. When they increase? When they decrease?) Has it
ever happened that a service was restored conveniently but that you were not
aware of this until you discovered by accident? Did you lose valuable time in
the meanwhile? Do you have an opportunity to express your view on the
incident? Did it occur that the solution which had been found was known to
you/could have been suggested by you?
Meta Are the stakeholders of M&R questioned on a regular basis? How are the
outcomes of these inquiries dealt with? Are they used for improving the M&R
process? Is there a double-loop learning mechanism, even when the incident
does not lead to a 'problem'? Is there a double loop learning concerning M&R.
Are the procedures reviewed? Or is just the incident fixed?
Meta If trends are spotted (by the M&R Managers), how are they implemented in
the M&R process?

Appendices 301
Meta Does the Incident Management Process Owners analyze the reliability of their
service on a cost/benefit basis?
Meta In a distributed system with limited physical oversight, the normal antidotes to
human and organizational error—checks and balances, redundancy, and
training—may be defeated by the size and scope of the system, or by
subcultures which can develop in the system. How is internal control done?
How can one be sure that procedures are followed? Are there sufficient checks
and balances? Is there an equilibrium between responsibility and
accountability?
Meta Are there people in the M&R process who still see the 'big picture'? How is the
Sensitivity to Operations (seeing the big picture of operation in the
moment)How is this big-picture composed (HRT)? The ultimate objective is the
development of a culture of trust, which is so typical of HROs. HROs
consistently communicate the big picture of what the organization seeks to do,
and try to get everyone to communicate with each other about how they fit in
the big picture (Roberts 2001). This is also called transactive memory (van
Fenema 2003) and means that people know who does what in their
(temporary) group, which in turn brings about stability.
Meta Is the internal audit procedure effective in discovering risks? Are the
recommendations of audit followed-up?
Meta Is the best person always dealing with the problem? Or is there a mechanism
to migrate the incident to the best-suited person? (migrating decision-making)
Meta Is there a knowledge transfer from first line to second line collaborators in
such a way that there is an increase in the success rate of solving incidents
(quint.nl)?
Meta How is Incident Management embedded in the other NPP processes
(raakpunten)? How are the bridges between M&R en Problem management?
What about the information exchange?
C. Technology
Technology Is the technology currently in use sufficient?
Technology Is the technology compatible with other IS?
Technology Is there redundancy in hardware and software?
Technology Is the technology supportive of mindfulness (HRT)?
Procedure Does the M&R-tool simultaneously provide an adaptation of the Configuration
Management Database (CMDB)?
Technology Does the tool report adequate Management Information? Is this regularly

302 Two Cases in High Reliability Organizing: a Hermeneutic Reconceptualization
checked with the management?
D. Environment
Meta What mechanisms are there to assure that the M&R process is in line with
external norms and legislation?
Structure Are there elements in the NPP organization, or the whole mother holding that
are a hindrance to the way M&R is operating?
Structure On what basis are decisions for supplementary funding made? Have you had a
restructuring of your services (downsizing, loss of personnel, cost-cutting)?
Structure How would you describe the vision of management: long-term or short term?
Do you have enough support from management or are they just there to pay
lip service to you and your team (i.e. they are only happy when nothing
happens but are not willing to do a preventive effort?) Have you tried to pull
their attention to your problems?
Structure Is there an under-specification of structures (organized anarchy via fluid
decision-making) (HRT)?
Structure Looking at crisis situations, Perrow (1999) recommends to put limits to the size
of the parts of systems that could be stand-alone parts. He furthermore
advises to “link them through 'buses' – in the electrical sense – designed to
buffer the disturbances in each”. The ‘glue’ between these components must
be such that components still can range in diversity. This is with regard to
management-styles, technologies, structures and decision processes. What is
your opinion?
Culture Does your organization have a safety culture? Would you describe the
organization’s culture as one fostering risk awareness/ Are there incentives for
reporting on risk? Do you think the safety culture will still stand regardless of
the leadership’s personality and their concern with risk. Do you know who you
should address in case you want to report a risk? Are you rewarded for a pro-
active reporting on possible risks?
Culture Hierarchies must allow for a broad and real delegation (Bigley 2001), with real
delegation meaning the transfer of task, responsibility and authority.

Appendices 303
Appendix C. Testing the A Priori Conceptual Model
13.5 When problems arise, I know where/how I can reach a decision-
maker.
14.4 When handling an incident I take into account the consequences for
the organization as a whole.
20.5 There is consensus amongst the members of our team on HOW
things could go wrong with crucial systems.
24.2 I am familiar with processes (business or IT) that are strictly
speaking outside the scope of my job.
Table 0.1 - A Priori Survey Items for Sensitivity to Operations
15.4 When the unexpected happens, I investigate why things did not go
as expected.
19.5 In our team we take into account each other’s opinion regarding the
handling of incidents.
19.6 In our team we spend a lot of time on incident analysis in order to
better understand future incidents.
20.1 In our team we listen carefully to each other; it is exceptional that
an opinion is not listened to.
20.2 In our team people demonstrate trust for each other.
24.1 I am encouraged to ask questions.
Table 0.2 - A Priori Survey Items for Reluctance to Simplify
13.6 I dispose of a number of informal contacts that I use to deal with
problems.
17.2 When handling an incident of priority 1 or 2 it is easy to get access
to supplementary resources.
19.2 In our team we learn from our mistakes.
22.4 I have sufficient training and experience to handle incidents.
23.2 My management mobilizes supplementary people whenever the
workload of our teams becomes excessive.
Table 0.3 - A Priori Survey Items for Commitment to Resilience
15.1 I consider near-misses as an indication of potential danger.
15.2 I handle near-misses and mistakes as information on the reliability
of our system.
15.3 I tend to report mistakes that could have important consequences,
even when no-one has noticed them.
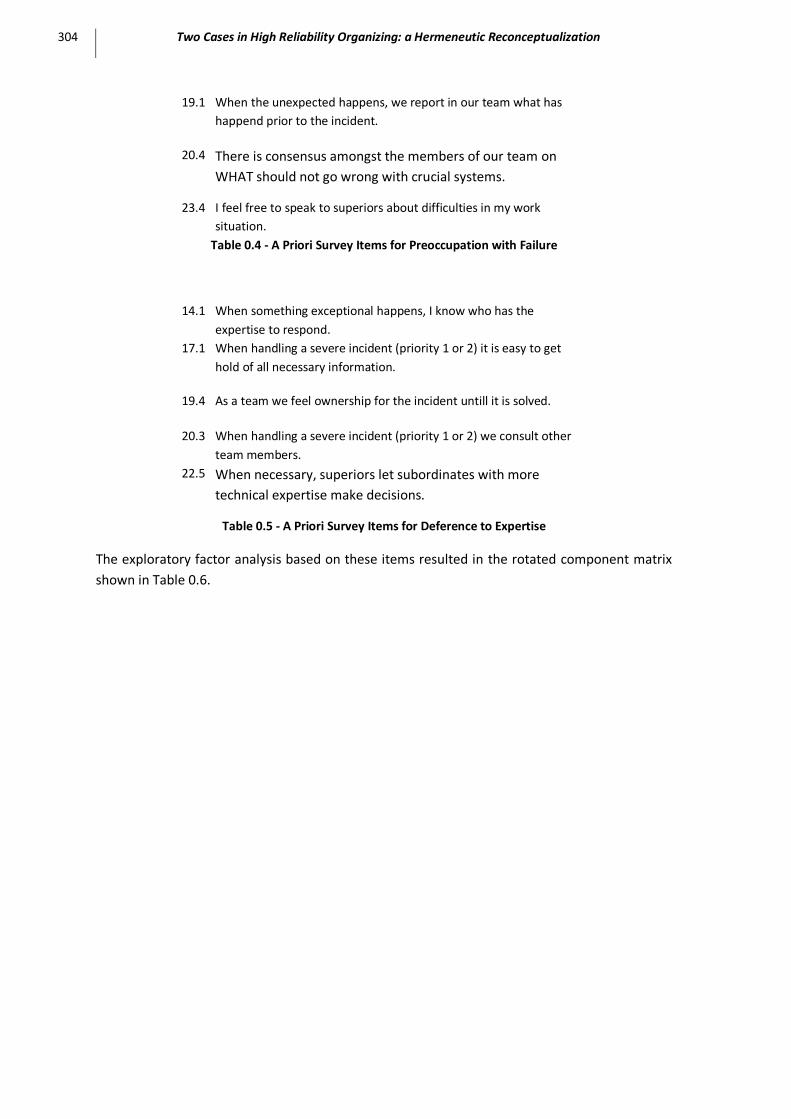
304 Two Cases in High Reliability Organizing: a Hermeneutic Reconceptualization
19.1 When the unexpected happens, we report in our team what has
happend prior to the incident.
20.4 There is consensus amongst the members of our team on
WHAT should not go wrong with crucial systems.
23.4 I feel free to speak to superiors about difficulties in my work
situation.
Table 0.4 - A Priori Survey Items for Preoccupation with Failure
14.1 When something exceptional happens, I know who has the
expertise to respond.
17.1 When handling a severe incident (priority 1 or 2) it is easy to get
hold of all necessary information.
19.4 As a team we feel ownership for the incident untill it is solved.
20.3 When handling a severe incident (priority 1 or 2) we consult other
team members.
22.5 When necessary, superiors let subordinates with more
technical expertise make decisions.
Table 0.5 - A Priori Survey Items for Deference to Expertise
The exploratory factor analysis based on these items resulted in the rotated component matrix
shown in Table 0.6.
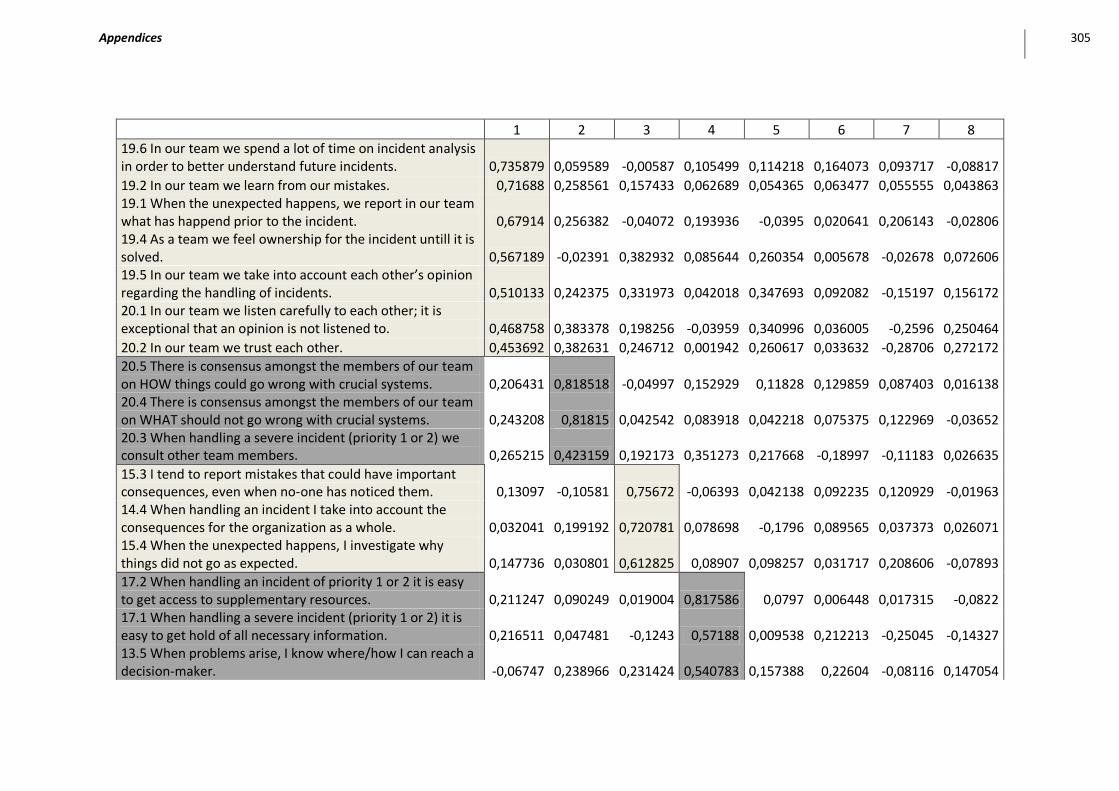
Appendices 305
1 2 3 4 5 6 7 8
19.6 In our team we spend a lot of time on incident analysis in order to better understand future incidents. 0,735879 0,059589 -0,00587 0,105499 0,114218 0,164073 0,093717 -0,08817
19.2 In our team we learn from our mistakes. 0,71688 0,258561 0,157433 0,062689 0,054365 0,063477 0,055555 0,043863 19.1 When the unexpected happens, we report in our team what has happend prior to the incident. 0,67914 0,256382 -0,04072 0,193936 -0,0395 0,020641 0,206143 -0,02806 19.4 As a team we feel ownership for the incident untill it is solved. 0,567189 -0,02391 0,382932 0,085644 0,260354 0,005678 -0,02678 0,072606 19.5 In our team we take into account each other’s opinion regarding the handling of incidents. 0,510133 0,242375 0,331973 0,042018 0,347693 0,092082 -0,15197 0,156172 20.1 In our team we listen carefully to each other; it is exceptional that an opinion is not listened to. 0,468758 0,383378 0,198256 -0,03959 0,340996 0,036005 -0,2596 0,250464
20.2 In our team we trust each other. 0,453692 0,382631 0,246712 0,001942 0,260617 0,033632 -0,28706 0,272172
20.5 There is consensus amongst the members of our team on HOW things could go wrong with crucial systems. 0,206431 0,818518 -0,04997 0,152929 0,11828 0,129859 0,087403 0,016138 20.4 There is consensus amongst the members of our team on WHAT should not go wrong with crucial systems. 0,243208 0,81815 0,042542 0,083918 0,042218 0,075375 0,122969 -0,03652 20.3 When handling a severe incident (priority 1 or 2) we consult other team members. 0,265215 0,423159 0,192173 0,351273 0,217668 -0,18997 -0,11183 0,026635
15.3 I tend to report mistakes that could have important consequences, even when no-one has noticed them. 0,13097 -0,10581 0,75672 -0,06393 0,042138 0,092235 0,120929 -0,01963 14.4 When handling an incident I take into account the consequences for the organization as a whole. 0,032041 0,199192 0,720781 0,078698 -0,1796 0,089565 0,037373 0,026071 15.4 When the unexpected happens, I investigate why things did not go as expected. 0,147736 0,030801 0,612825 0,08907 0,098257 0,031717 0,208606 -0,07893
17.2 When handling an incident of priority 1 or 2 it is easy to get access to supplementary resources. 0,211247 0,090249 0,019004 0,817586 0,0797 0,006448 0,017315 -0,0822 17.1 When handling a severe incident (priority 1 or 2) it is easy to get hold of all necessary information. 0,216511 0,047481 -0,1243 0,57188 0,009538 0,212213 -0,25045 -0,14327 13.5 When problems arise, I know where/how I can reach a decision-maker. -0,06747 0,238966 0,231424 0,540783 0,157388 0,22604 -0,08116 0,147054

306 Two Cases in High Reliability Organizing: a Hermeneutic Reconceptualization
22.5 When necessary, superiors let subordinates with more technical expertise make decisions. 0,064237 0,07354 -0,02696 0,531077 0,385313 -0,07909 0,237974 0,283001 14.1 When something exceptional happens, I know who has the expertise to respond. -0,04967 -0,0161 0,149353 0,509214 0,040088 0,453774 0,227097 0,161641
23.2 My management mobilizes supplementary people whenever the workload of our teams becomes excessive. 0,078556 -0,07326 -0,11229 0,205183 0,731951 -0,00243 -0,06049 -0,07275 23.4 I feel free to speak to superiors about difficulties in my work situation. 0,151568 0,203155 0,129797 0,072934 0,659 0,285572 0,012822 0,111777
24.1 I am encouraged to ask questions. 0,23007 0,348075 0,044337 0,045238 0,631223 0,125209 0,088679 -0,26067
24.2 I am familiar with processes (business or IT) that are strictly speaking outside the scope of my job. 0,119371 0,12575 0,041226 0,024054 0,104514 0,752709 0,013768 -0,06857 22.4 I have sufficient training and experience to handle incidents. 0,116823 0,010907 0,114498 0,193012 0,102237 0,711112 0,005702 0,235024
15.2 I handle near-misses and mistakes as information on the reliability of our system. 0,158236 0,186734 0,187531 -0,05455 -0,11068 0,157592 0,738563 0,039766 15.1 I consider near-misses as an indication of potential danger. 0,025914 -0,03546 0,420013 0,011217 0,154931 -0,0922 0,614604 0,161293
13.6 I dispose of a number of informal contacts that I use to deal with problems. 0,045614 6,63E-05 -0,06127 0,030525 -0,08739 0,146334 0,122894 0,847598
Extraction Method: Principal Component Analysis. Rotation Method: Varimax with Kaiser Normalization. Rotation converged in 8 iterations. Table 0.6 - Rotated Component Matrix of HRT items from Literature
Kaiser-Meyer-Olkin Measure of Sampling Adequacy. ,828
Bartlett's Test of Sphericity Approx. Chi-Square 1889,098
Df 325
Sig. ,000
Table 0.7 - KMO and Bartlett's Test for a priori HRT Variables (Bank)

Appendices 307
Table 0.8 shows that the total variance explanation criterion of 60% is met.
Component Initial Eigenvalues Extraction Sums of Squared Loadings Rotation Sums of Squared Loadings
Total % of
Variance Cumulative % Total % of
Variance Cumulative % Total % of
Variance Cumulative %
1 6,202 23,853 23,853 6,202 23,853 23,853 2,977 11,449 11,449
2 2,205 8,482 32,335 2,205 8,482 32,335 2,352 9,047 20,495
3 1,917 7,372 39,707 1,917 7,372 39,707 2,246 8,640 29,135
4 1,410 5,422 45,129 1,410 5,422 45,129 2,156 8,292 37,428
5 1,256 4,832 49,961 1,256 4,832 49,961 2,112 8,124 45,552
6 1,113 4,280 54,241 1,113 4,280 54,241 1,651 6,350 51,902
7 1,061 4,079 58,320 1,061 4,079 58,320 1,451 5,580 57,482
8 1,015 3,906 62,226 1,015 3,906 62,226 1,233 4,744 62,226
9 ,865 3,326 65,552
10 ,850 3,268 68,820
11 ,834 3,209 72,029
12 ,762 2,930 74,959
13 ,708 2,722 77,680
14 ,637 2,448 80,129
15 ,611 2,348 82,477
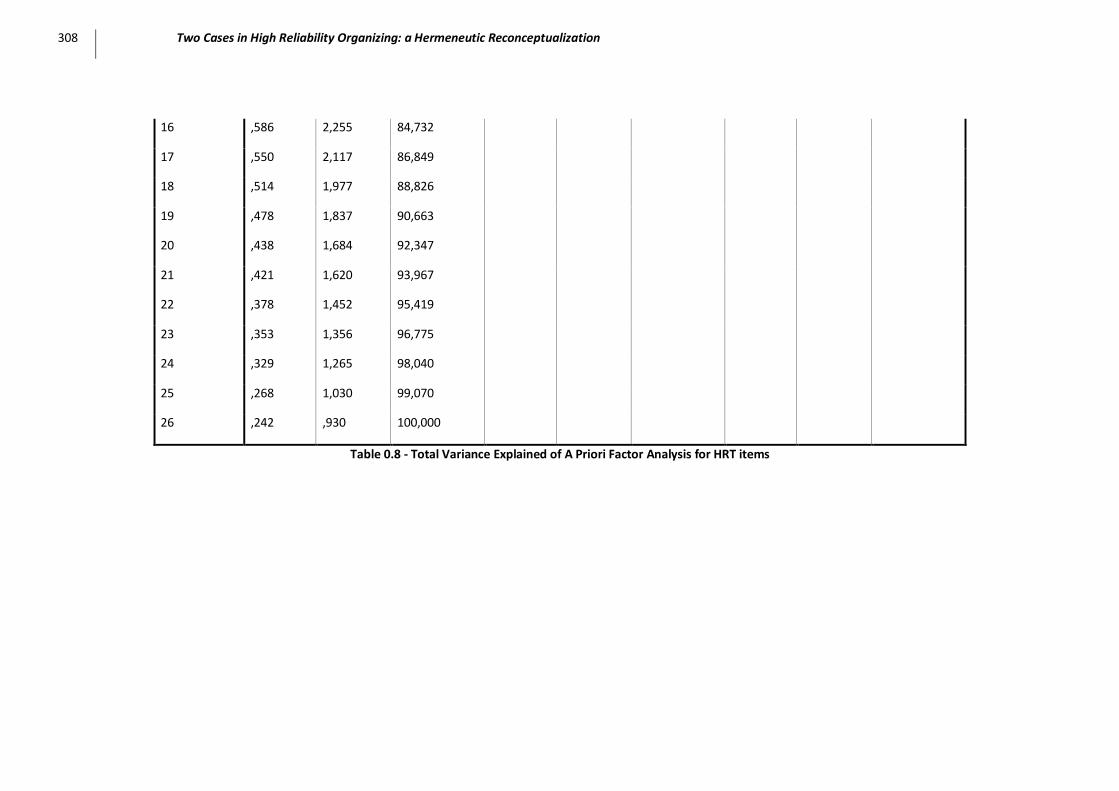
308 Two Cases in High Reliability Organizing: a Hermeneutic Reconceptualization
16 ,586 2,255 84,732
17 ,550 2,117 86,849
18 ,514 1,977 88,826
19 ,478 1,837 90,663
20 ,438 1,684 92,347
21 ,421 1,620 93,967
22 ,378 1,452 95,419
23 ,353 1,356 96,775
24 ,329 1,265 98,040
25 ,268 1,030 99,070
26 ,242 ,930 100,000
Table 0.8 - Total Variance Explained of A Priori Factor Analysis for HRT items

Appendices 309
Appendix D. Descriptive Respondent Statistics (Bank
Case) N Min. Max. Mean Std. Dev
1. Are you an internal or external employee? 320 1 2 1,26 ,439
2. What is your gender? 318 1 2 1,22 ,417
4. At what physical location do you work? 311 1 10 4,03 2,646
5. How many years of experience with incident handling
do you have?
294 ,0 30,0 6,901 5,6118
6. What team are you a member of? In case you are a
member of more than one team, indicate that team
where you feel most part of.
315 2 69 34,79 20,972
Team Size 296 3 36 13,86 7,369
Number of team members 320 1 19 8,22 4,687
7. What department are you a member of? 316 2 29 10,00 6,530
8. How much of your time (%) do you spend in handling
incidents?
309 0 100 21,22 19,907
9. How much (%) do you rely on Peregrine for the
registration/coordination/escalation/closing of an
incident?
311 0 100 83,15 26,441
10. How much (%) do you register allmost immediately
the necessary data in Peregrine?
306 0 100 69,27 28,464
11.1 face-to-face communication 246 1 80 16,65 14,818
11.2 telephone/cell phone 314 3 95 31,82 18,316
11.3 e-mail 300 1 75 21,29 12,885
11.4 Peregrine 309 1 100 35,42 24,220
11.5 Other means of communication 59 1 20 6,46 3,914
Ratio nondedicated vs dedicated 232 ,18 99,00 5,6850 10,34781
Ratio voice vs nonvoice 232 ,05 13,29 1,4302 1,68983
13.1 I feel emotionally involved when handling
incidents. The work does not let go.
306 1 5 3,46 1,043
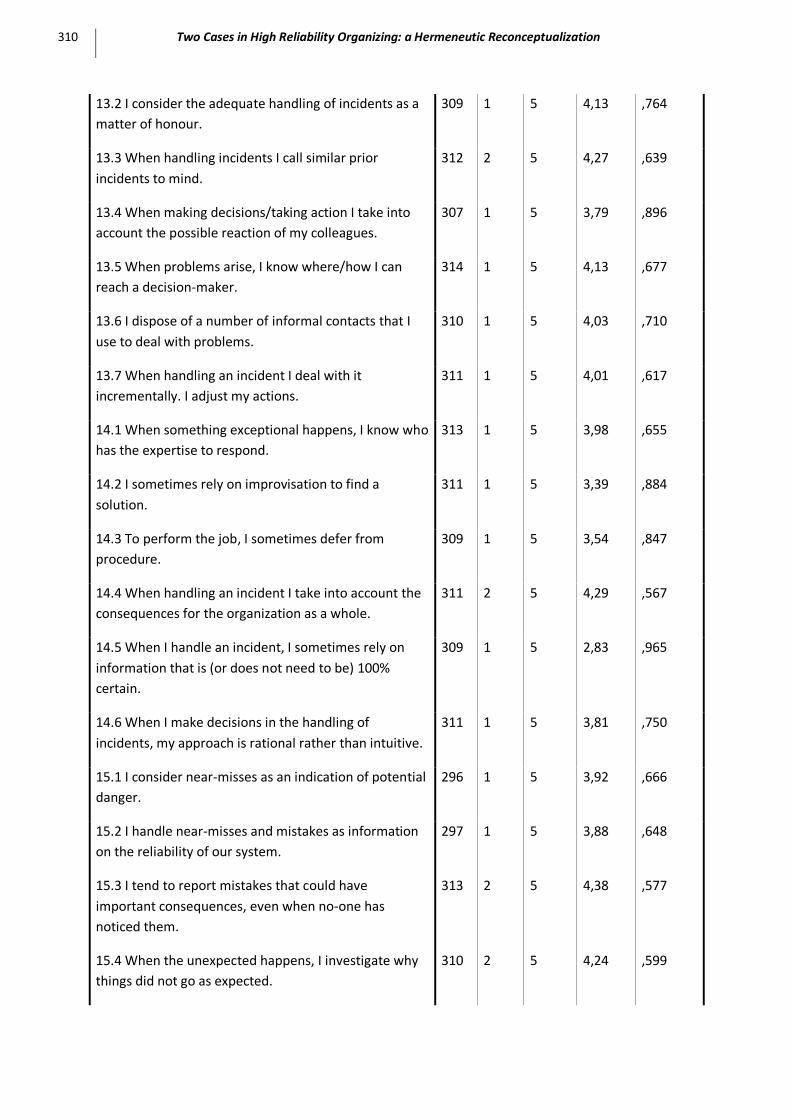
310 Two Cases in High Reliability Organizing: a Hermeneutic Reconceptualization
13.2 I consider the adequate handling of incidents as a
matter of honour.
309 1 5 4,13 ,764
13.3 When handling incidents I call similar prior
incidents to mind.
312 2 5 4,27 ,639
13.4 When making decisions/taking action I take into
account the possible reaction of my colleagues.
307 1 5 3,79 ,896
13.5 When problems arise, I know where/how I can
reach a decision-maker.
314 1 5 4,13 ,677
13.6 I dispose of a number of informal contacts that I
use to deal with problems.
310 1 5 4,03 ,710
13.7 When handling an incident I deal with it
incrementally. I adjust my actions.
311 1 5 4,01 ,617
14.1 When something exceptional happens, I know who
has the expertise to respond.
313 1 5 3,98 ,655
14.2 I sometimes rely on improvisation to find a
solution.
311 1 5 3,39 ,884
14.3 To perform the job, I sometimes defer from
procedure.
309 1 5 3,54 ,847
14.4 When handling an incident I take into account the
consequences for the organization as a whole.
311 2 5 4,29 ,567
14.5 When I handle an incident, I sometimes rely on
information that is (or does not need to be) 100%
certain.
309 1 5 2,83 ,965
14.6 When I make decisions in the handling of
incidents, my approach is rational rather than intuitive.
311 1 5 3,81 ,750
15.1 I consider near-misses as an indication of potential
danger.
296 1 5 3,92 ,666
15.2 I handle near-misses and mistakes as information
on the reliability of our system.
297 1 5 3,88 ,648
15.3 I tend to report mistakes that could have
important consequences, even when no-one has
noticed them.
313 2 5 4,38 ,577
15.4 When the unexpected happens, I investigate why
things did not go as expected.
310 2 5 4,24 ,599

Appendices 311
17.1 When handling a severe incident (priority 1 or 2) it
is easy to get hold of all necessary information.
290 1 5 3,26 ,853
17.2 When handling an incident of priority 1 or 2 it is
easy to get access to supplementary resources.
289 1 5 3,79 ,742
19.1 When the unexpected happens, we report in our
team what has happend prior to the incident.
311 1 5 3,85 ,773
19.2 In our team we learn from our mistakes. 314 2 5 4,17 ,577
19.3 I feel good in our team. 316 1 5 4,22 ,760
19.4 As a team we feel ownership for the incident untill
it is solved.
313 2 5 4,14 ,653
19.5 In our team we take into account each other’s
opinion regarding the handling of incidents.
313 2 5 4,12 ,587
19.6 In our team we spend a lot of time on incident
analysis in order to better understand future incidents.
309 1 5 3,51 ,896
20.1 In our team we listen carefully to each other; it is
exceptional that an opinion is not listened to.
312 2 5 4,05 ,657
20.2 In our team we trust each other. 313 2 5 4,11 ,631
20.3 When handling a severe incident (priority 1 or 2)
we consult other team members.
296 2 5 4,20 ,676
20.4 There is consensus amongst the members of our
team on WHAT should not go wrong with crucial
systems.
300 2 5 3,96 ,640
20.5 There is consensus amongst the members of our
team on HOW things could go wrong with crucial
systems.
297 2 5 3,76 ,638
20.6 Because of pressure (time-pressure or other) our
team often deviates from procedure.
308 1 5 2,92 ,924
22.1 I feel a lot of pressure to save on costs and time. 313 1 5 3,58 ,910
22.2 I have a lot of freedom when handling incidents. 307 1 5 3,55 ,851
22.3 I feel I receive challenging assingments. 312 1 5 3,46 ,777
22.4 I have sufficient training and experience to handle
incidents.
308 1 5 3,82 ,792

312 Two Cases in High Reliability Organizing: a Hermeneutic Reconceptualization
22.5 When necessary, superiors let subordinates with
more technical expertise make decisions.
300 1 5 3,79 ,750
23.1 [COMPANY]-ICT is exposed to many
dangers/threats.
309 2 5 3,17 ,784
23.2 My management mobilizes supplementary people
whenever the workload of our teams becomes
excessive.
308 1 5 3,20 ,899
23.3 In [COMPANY]-ICT it is easy to ask for help. 314 1 5 3,63 ,667
23.4 I feel free to speak to superiors about difficulties in
my work situation.
313 1 5 3,85 ,732
24.1 I am encouraged to ask questions. 317 1 5 3,62 ,699
24.2 I am familiar with processes (business or IT) that
are strictly speaking outside the scope of my job.
312 1 5 3,31 ,823
24.3 I am expected to do my job in a certain manner
without deviating from procedure.
315 1 5 3,34 ,792
24.4 I often work under high productivity pressure
(time, costs).
314 1 5 3,57 ,829

Appendices 313
Appendix E. Descriptive Respondent Statistics (NPP
Case)
N Min. Max Mean
Std.
Dev
0. ID 124 1 128 63,36 37,045
1. Are you an internal or external employee? 124 1 2 1,02 ,154
2. What is your gender? 124 1 2 1,03 ,177
3.1. Are you a manager? 124 1 2 1,27 ,444
3.2. Which personnel category do you belong to? 124 1 3 1,73 ,515
4. What is your physical work location? 124 1 6 2,60 1,715
5. How many years of experience do you have in
handling incidents? 122 0 36 10,98 8,956
Team ID 124 1
9999
9 827,08
8978,3
12
N BREAK 124 1 11 5,18 3,001
Team Size 119 2 70 23,54 22,711
Participation 119 ,11 1,00 ,3500 ,21632
7.1. How much (%) do you use SAP history for the work
preparation? 108 0 100 35,77 30,501
7.2. From how many different people do you get input
(conversation, telephone, e-mail, notifications)? 97 0 1000 183,97
276,38
7
Q72LIKERT 97 1 5 2,86 1,436
8. How many of the cases (%) do you notice a
procedure needs to be adjusted? 111 0 80 14,69 16,591
9. In how many of the cases (%) do you take action to
change the procedure? 114 0 100 77,57 33,624
10. In how many of the cases (%) do you timely register
the necessary data in SAP? 87 0 100 66,33 33,329
11.1 face-to-face communication 120 ,00 1,00 ,2787 ,25701
11.2 telephone/cell phone 120 ,00 ,75 ,1972 ,14638
11.3 e-mail 120 ,00 ,80 ,2045 ,16822
11.4 SAP 120 ,00 1,00 ,3004 ,27084
11.5 Other means of communication 120 ,00 ,30 ,0192 ,05422

314 Two Cases in High Reliability Organizing: a Hermeneutic Reconceptualization
Ratio nondedicated vs dedicated 104 ,00 24,00 4,8262
5,6427
0
Ratio voice vs nonvoice 113 ,00 9,00 1,4269
1,8278
0
Ratio face vs distance 114 ,00 4,00 ,5241 ,84234
13.1 I feel emotionally involved with my work. The work
does not let go. 123 1 5 3,77 ,885
13.2 I consider the adequate handling of incidents as a
matter of honour. 124 3 5 4,44 ,615
13.3 When handling incidents I call similar prior
incidents to mind. 122 1 5 4,11 ,695
13.4 When making decisions/taking action I take into
account the possible reaction of my colleagues. 124 1 5 3,75 ,823
13.5 When problems arise, I know where/how I can
reach a decision-maker. 121 1 5 4,10 ,735
13.6 I dispose of a number of informal contacts that I
use to deal with problems. 120 1 5 3,51 ,935
13.7 When handling an incident I deal with it
incrementally. I adjust my actions. 124 2 5 4,01 ,591
14.1 When something exceptional happens, I know who
has the expertise to respond. 124 1 5 3,90 ,748
14.2 I sometimes rely on improvisation to find a
solution. 121 1 5 2,84 1,103
14.3 To perform the job, I sometimes defer from
procedure. 121 1 5 3,08 ,988
14.4 When handling an incident I take into account the
consequences for the organization as a whole. 123 3 5 4,11 ,603
14.5 When I handle an incident, I sometimes rely on
information that is (or does not need to be) 100%
certain.
121 1 5 2,44 ,999
14.6 When I make decisions in the handling of
incidents, my approach is rational rather than intuitive. 124 2 5 3,86 ,702
Q146INV 124 1 4 2,14 ,702
15.1 I consider near-misses as an indication of potential
danger. 122 2 5 4,30 ,628
15.2 I handle near-misses and mistakes as information
on the reliability of our system. 123 1 5 4,24 ,669
15.3 I tend to report mistakes that could have important 123 3 5 4,48 ,548

Appendices 315
consequences, even when no-one has noticed them.
15.4 When the unexpected happens, I investigate why
things did not go as expected. 121 3 5 4,32 ,520
17.1 When handling a severe incident (priority 0) it is
easy to get hold of all necessary information. 100 1 5 3,23 ,930
17.2 When handling an incident of priority 1 or 2 it is
easy to get access to supplementary resources. 98 1 5 3,24 ,975
19.1 When the unexpected happens, we report in our
team what has happend prior to the incident. 116 2 5 4,08 ,592
19.2 In our team we learn from our mistakes. 119 3 5 4,30 ,545
19.3 I feel good in our team. 120 2 5 4,32 ,661
19.4 As a team we feel ownership for the incident untill
it is solved. 119 2 5 4,22 ,666
19.5 In our team we take into account each other’s
opinion regarding the handling of incidents. 119 3 5 4,23 ,559
19.6 In our team we spend a lot of time on incident
analysis in order to better understand future incidents. 119 1 5 3,66 ,906
20.1 In our team we listen carefully to each other; it is
exceptional that an opinion is not listened to. 119 3 5 4,13 ,566
20.2 In our team we trust each other. 119 2 5 4,19 ,601
20.3 When handling an urgent incident (priority 0) we
consult other team members. 98 2 5 3,62 ,767
20.4 I know which assignments are crucial. 119 2 5 4,19 ,492
20.5 There is consensus amongst the members of our
team on HOW things could go wrong with crucial
systems.
115 3 5 4,13 ,522
20.6 There is consensus amongst the members of our
team on WHAT could go wrong with crucial systems. 115 1 5 3,92 ,677
20.7 Because of pressure (time-pressure or other) our
team often deviates from procedure. 117 1 5 2,08 ,892
22.1 I feel a lot of pressure to save on costs and time. 121 1 5 2,96 ,934
22.2 I have a lot of freedom when handling incidents. 124 1 5 3,62 ,907
22.3 I feel I receive challenging assingments. 124 2 5 3,64 ,725
22.4 I have sufficient training and experience to handle
incidents. 123 2 5 3,88 ,696
22.5 When necessary, superiors let subordinates with
more technical expertise make decisions. 121 1 5 3,63 ,776

316 Two Cases in High Reliability Organizing: a Hermeneutic Reconceptualization
23.1 [COMPANY] is exposed to many dangers/threats. 123 1 5 3,03 ,999
23.2 My management mobilizes supplementary people
whenever the workload of our teams becomes
excessive.
119 1 5 2,87 ,962
23.3 In [COMPANY] it is easy to ask for help. 124 2 5 3,56 ,735
23.4 I feel free to speak to superiors about difficulties in
my work situation. 124 2 5 4,08 ,645
24.1 I am encouraged to ask questions. 124 2 5 3,65 ,735
24.2 I am familiar with processes that are strictly
speaking outside the scope of my job. 123 1 5 3,37 ,716
24.3 I am expected to do my job in a certain manner
without deviating from procedure. 124 2 5 3,76 ,820
Q243INV 124 1 4 2,24 ,820
24.4 I often work under high productivity pressure (time,
costs). 124 2 5 3,56 ,735
Q244INV 124 1 4 2,44 ,735
25. When we do not dispose of a particular type of
knowledge/information, we know who in our
organization can help us.
123 1 5 3,72 ,659
26. I feel free to contact people outside of our team
about difficulties in my work. 122 2 5 3,87 ,692
27. The interaction between the different steps in the
maintenance & repair process runs smoothly. 116 1 5 3,26 ,825
28. The order in which you perform tasks that are
necessary to solve a problem can vary. 123 1 5 3,67 ,719
29. The Maintenance & Repair process has built-in
buffers/security in case something goes wrong or
makes a mistake.
118 1 5 3,32 ,738
Q29INV 118 1 5 2,68 ,738
30. The systems and processes I am responsible for,
have no secrets for me. 122 1 5 3,07 ,864
Q30INV 122 1 5 2,93 ,864
31. The systems and processes in our work, can lead to
unpredictable reactions. 122 1 5 3,02 ,848
32. The systems and processes in our work are tightly
coupled. 123 2 5 3,84 ,751
Q32INV 123 1 4 2,16 ,751
33. The information that is needed for my work can 120 3 5 4,14 ,612

Appendices 317
come from many different sources.
1. Are you an internal or external employee? 124 1,00 1,50 1,0242 ,09065
2. What is your gender? 124 1,00 1,50 1,0323 ,09687
3.1. Are you a manager? 124 1,00 2,00 1,2661 ,31009
3.2. What personnel category do you belong to? 124 1,00 3,00 1,7258 ,35369
4. What is your physical work location? 124 1,00 6,00 2,5968
1,4567
0
5. How many years of experience do you have
regarding the Maintenance & Repair process? 124 ,53 26,00
10,947
2
5,9606
2
7.1. How much (%) do you use SAP history for the work
preparation? 122 1,00 90,00
34,139
3
20,630
94
7.2. From how many different people do you get input
(conversation, telephone, e-mail, notifications)? 120 4,00
800,0
0
163,64
72
173,56
193
Q72LIKERT 120 1,00 5,00 2,7789 ,91344
8. How many of the cases (%) do you notice a
procedure needs to be adjusted? 122 2,00 51,00
13,892
6
9,1495
9
9. In how many of the cases (%) do you take action to
change the procedure? 123 5,00
100,0
0
76,693
5
22,044
07
10. In how many of the cases (%) do you timely register
the necessary data in SAP? 121 5,00
100,0
0
66,352
5
19,080
23
11.1 face-to-face communication 124 ,00 82,50
40,273
1
20,287
22
11.2 telephone/cell phone 124 3,37 90,00
29,672
7
15,189
75
11.3 e-mail 124 ,00 80,00
30,965
9
16,084
17
11.4 SAP 124 5,00
100,0
0
39,014
7
14,973
12
11.5 Other means of communication 124 ,00 52,50 3,7132
8,7258
6
Ratio nondedicated vs dedicated 124 ,00 24,00 5,0142
3,9411
5
Ratio voice vs nonvoice 124 ,00 5,67 1,4073
1,0459
4
Ratio face vs distance 124 ,00 3,00 ,5245 ,42945
13.1 I feel emotionally involved with my work. The work
does not let go. 124 2,00 4,50 3,7742 ,43845

318 Two Cases in High Reliability Organizing: a Hermeneutic Reconceptualization
13.2 I consider the adequate handling of incidents as a
matter of honour. 124 3,00 5,00 4,4355 ,35816
13.3 When handling incidents I call similar prior
incidents to mind. 124 3,00 5,00 4,1169 ,33956
13.4 When making decisions/taking action I take into
account the possible reaction of my colleagues. 124 1,00 5,00 3,7500 ,44921
13.5 When problems arise, I know where/how I can
reach a decision-maker. 124 2,00 5,00 4,1109 ,36546
13.6 I dispose of a number of informal contacts that I
use to deal with problems. 123 2,57 5,00 3,5158 ,60604
13.7 When handling an incident I deal with it
incrementally. I adjust my actions. 124 3,00 5,00 4,0081 ,30932
14.1 When something exceptional happens, I know who
has the expertise to respond. 124 3,00 5,00 3,9032 ,36633
14.2 I sometimes rely on improvisation to find a
solution. 124 1,00 5,00 2,8293 ,58849
14.3 To perform the job, I sometimes defer from
procedure. 124 1,00 4,00 3,0789 ,51652
14.4 When handling an incident I take into account the
consequences for the organization as a whole. 124 3,00 5,00 4,1129 ,28176
14.5 When I handle an incident, I sometimes rely on
information that is (or does not need to be) 100%
certain.
123 1,00 4,00 2,4295 ,59763
14.6 When I make decisions in the handling of
incidents, my approach is rational rather than intuitive. 124 2,75 5,00 3,8629 ,42229
Q146INV 124 1,00 3,25 2,1371 ,42229
15.1 I consider near-misses as an indication of potential
danger. 124 3,33 5,00 4,2979 ,41311
15.2 I handle near-misses and mistakes as information
on the reliability of our system. 124 3,00 5,00 4,2460 ,37242
15.3 I tend to report mistakes that could have important
consequences, even when no-one has noticed them. 123 3,67 5,00 4,4797 ,29139
15.4 When the unexpected happens, I investigate why
things did not go as expected. 124 3,67 5,00 4,3246 ,29137
17.1 When handling a severe incident (priority 0) it is
easy to get hold of all necessary information. 122 2,00 5,00 3,2447 ,60304
17.2 When handling an incident of priority 1 or 2 it is
easy to get access to supplementary resources. 121 2,00 5,00 3,2544 ,53644
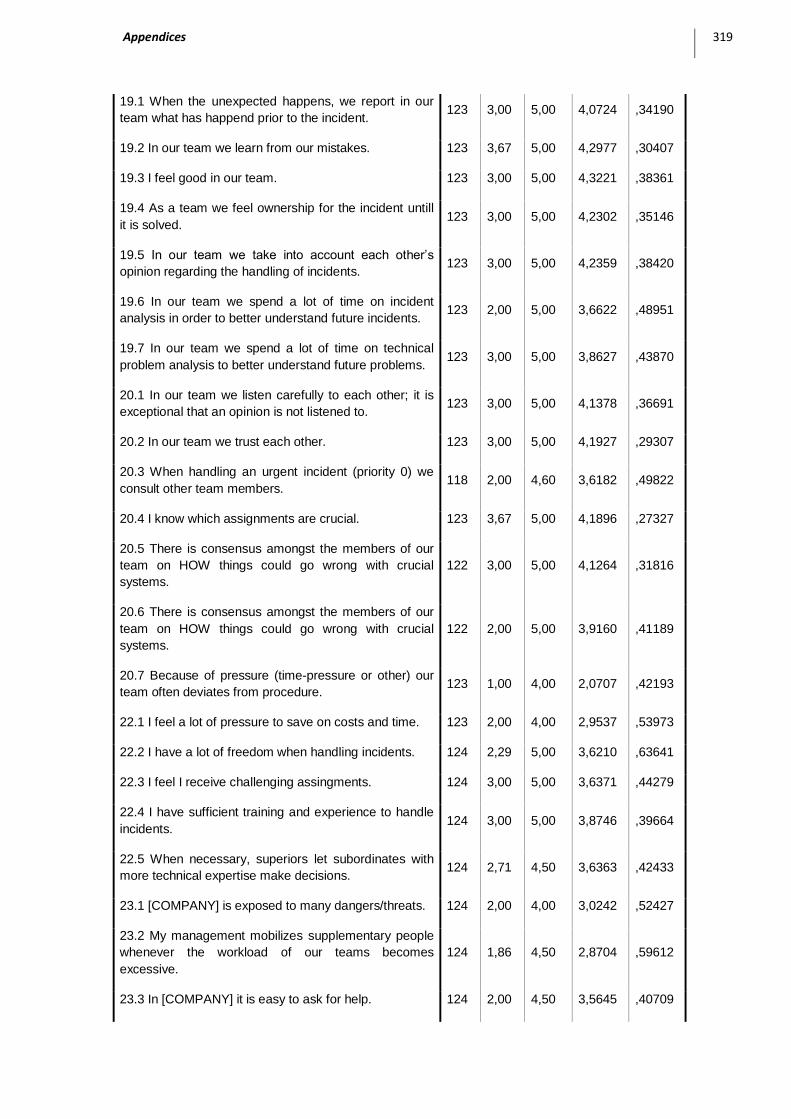
Appendices 319
19.1 When the unexpected happens, we report in our
team what has happend prior to the incident. 123 3,00 5,00 4,0724 ,34190
19.2 In our team we learn from our mistakes. 123 3,67 5,00 4,2977 ,30407
19.3 I feel good in our team. 123 3,00 5,00 4,3221 ,38361
19.4 As a team we feel ownership for the incident untill
it is solved. 123 3,00 5,00 4,2302 ,35146
19.5 In our team we take into account each other’s
opinion regarding the handling of incidents. 123 3,00 5,00 4,2359 ,38420
19.6 In our team we spend a lot of time on incident
analysis in order to better understand future incidents. 123 2,00 5,00 3,6622 ,48951
19.7 In our team we spend a lot of time on technical
problem analysis to better understand future problems. 123 3,00 5,00 3,8627 ,43870
20.1 In our team we listen carefully to each other; it is
exceptional that an opinion is not listened to. 123 3,00 5,00 4,1378 ,36691
20.2 In our team we trust each other. 123 3,00 5,00 4,1927 ,29307
20.3 When handling an urgent incident (priority 0) we
consult other team members. 118 2,00 4,60 3,6182 ,49822
20.4 I know which assignments are crucial. 123 3,67 5,00 4,1896 ,27327
20.5 There is consensus amongst the members of our
team on HOW things could go wrong with crucial
systems.
122 3,00 5,00 4,1264 ,31816
20.6 There is consensus amongst the members of our
team on HOW things could go wrong with crucial
systems.
122 2,00 5,00 3,9160 ,41189
20.7 Because of pressure (time-pressure or other) our
team often deviates from procedure. 123 1,00 4,00 2,0707 ,42193
22.1 I feel a lot of pressure to save on costs and time. 123 2,00 4,00 2,9537 ,53973
22.2 I have a lot of freedom when handling incidents. 124 2,29 5,00 3,6210 ,63641
22.3 I feel I receive challenging assingments. 124 3,00 5,00 3,6371 ,44279
22.4 I have sufficient training and experience to handle
incidents. 124 3,00 5,00 3,8746 ,39664
22.5 When necessary, superiors let subordinates with
more technical expertise make decisions. 124 2,71 4,50 3,6363 ,42433
23.1 [COMPANY] is exposed to many dangers/threats. 124 2,00 4,00 3,0242 ,52427
23.2 My management mobilizes supplementary people
whenever the workload of our teams becomes
excessive.
124 1,86 4,50 2,8704 ,59612
23.3 In [COMPANY] it is easy to ask for help. 124 2,00 4,50 3,5645 ,40709

320 Two Cases in High Reliability Organizing: a Hermeneutic Reconceptualization
23.4 I feel free to speak to superiors about difficulties in
my work situation. 124 3,00 5,00 4,0806 ,36986
24.1 I am encouraged to ask questions. 124 2,80 5,00 3,6452 ,40698
24.2 I am familiar with processes that are strictly
speaking outside the scope of my job. 124 2,00 4,50 3,3656 ,39063
24.3 I am expected to do my job in a certain manner
without deviating from procedure. 124 2,00 5,00 3,7581 ,46729
Q243INV 124 1,00 4,00 2,2419 ,46729
24.4 I often work under high productivity pressure (time,
costs). 124 2,80 5,00 3,5645 ,39648
Q244INV 124 1,00 3,20 2,4355 ,39648
25. When we do not dispose of a particular type of
knowledge/information, we know who in our
organization can help us.
124 2,60 5,00 3,7177 ,41215
26. I feel free to contact people outside of our team
about difficulties in my work. 124 3,00 5,00 3,8669 ,30166
27. The interaction between the different steps in the
maintenance & repair process runs smoothly. 123 2,00 4,33 3,2766 ,51447
28. The order in which you perform tasks that are
necessary to solve a problem can vary. 124 2,00 5,00 3,6774 ,39123
29. The Maintenance & Repair process has built-in
buffers/security in case something goes wrong or
makes a mistake.
124 2,00 4,00 3,3230 ,37852
Q29INV 124 2,00 4,00 2,6770 ,37852
30. The systems and processes I am responsible for,
have no secrets for me. 124 1,00 5,00 3,0645 ,48845
Q30INV 124 1,00 5,00 2,9355 ,48845
31. The systems and processes in our work, can lead to
unpredictable reactions. 124 1,00 4,00 3,0339 ,50741
32. The systems and processes in our work are tightly
coupled. 124 3,00 4,67 3,8367 ,34980
Q32INV 124 1,33 3,00 2,1633 ,34980
33. The information that is needed for my work can
come from many different sources. 123 3,50 5,00 4,1450 ,31530
Efficiency 124 1,50 5,00 3,2742 ,70525
SupRes 124 1,67 4,67 3,4718 ,64592
Deviation 124 2,00 5,00 3,7581 ,82018

Appendices 321
Team Orientation 120 2,67 5,00 4,1889 ,46964
Sensitivity to Operations 120 3,00 5,00 4,1542 ,43384
Preoccupation with Failure 124 3,00 5,00 4,2931 ,41620
Deference to Expertise 124 2,40 5,00 3,8177 ,44118
HRT 124 3,00 4,94 4,1003 ,33223
Other 120 2,50 5,00 4,0014 ,54938
Self 124 2,00 5,00 4,1089 ,61671
Scheme 123 1,00 5,00 2,6504 ,88228
SeMa 124 2,71 4,43 3,6443 ,38365
Threat Flexibility 124 3,17 4,50 3,6156 ,26381
Efficiency 124 2,50 4,50 3,2742 ,38662
Pressure 124 2,33 4,33 3,2124 ,36325
SupRes 124 2,76 4,67 3,4718 ,35956
Deviation 124 2,00 5,00 3,7581 ,46729
TO 123 3,50 5,00 4,1912 ,27868
SO 123 3,50 5,00 4,1497 ,25005
Preoccupation with Failure 124 3,60 4,90 4,2931 ,24626
DE 124 3,20 4,60 3,8177 ,24413
HRT 124 3,60 4,74 4,1003 ,18064
Other 123 3,33 4,50 4,0037 ,30691
Self 124 3,00 4,50 4,1089 ,28803
Scheme 124 1,00 4,50 2,6391 ,53912
SeMa 124 3,24 4,29 3,6443 ,20749
Valid N (listwise) 30

322 Two Cases in High Reliability Organizing: a Hermeneutic Reconceptualization
Appendix F. Descriptive Team Statistics (Bank Case)
N Min. Max. Mean Std.
Deviation
6. What team are you a member of? In case you are a
member of more than one team, indicate that team where
you feel most part of.
37 2 65 33,95 19,449
1. Are you an internal or external employee? 37 1,00 2,00 1,2366 ,21524
2. What is your gender? 37 1,00 2,00 1,2216 ,23919
4. At what physical location do you work? 37 1,00 9,00 4,1881 2,43490
5. How many years of experience with incident handling do
you have?
37 3,00 23,33 7,4828 4,09775
Team Size 37 4,00 36,00 11,8378 6,51287
7. What department are you a member of? 37 2,00 21,00 8,9221 5,61222
8. How much of your time (%) do you spend in handling
incidents?
37 4,33 78,75 20,2337 14,19904
Q9 37 56,11 100,00 85,4289 12,27276
10. How much (%) do you register allmost immediately the
necessary data in Peregrine?
37 37,00 92,25 69,2769 15,17100
11.1 face-to-face communication 37 6,67 25,00 15,6305 5,33051
11.2 telephone/cell phone 37 7,50 60,00 30,6649 9,71278
11.3 e-mail 37 5,27 60,00 21,3738 9,44950
11.4 Peregrine 37 12,50 73,75 37,7853 13,57361
11.5 Other means of communication 24 1,00 11,67 6,0645 3,15934
Ratio non dedicated vs dedicated 37 ,42 33,81 5,5101 6,41696
Ratio voice vs non voice 37 ,22 3,57 1,2327 ,84678
Ratio face vs distance 37 ,06 ,65 ,1758 ,12507
13.1 I feel emotionally involved when handling incidents.
The work does not let go.
37 2,00 4,25 3,4964 ,46545
13.2 I consider the adequate handling of incidents as a
matter of honour.
37 3,17 5,00 4,1941 ,36927
13.3 When handling incidents I call similar prior incidents to
mind.
37 3,67 4,83 4,2645 ,24039
13.4 When making decisions/taking action I take into
account the possible reaction of my colleagues.
37 3,00 4,40 3,7230 ,38674

Appendices 323
13.5 When problems arise, I know where/how I can reach a
decision-maker.
37 3,17 4,67 4,1719 ,32094
13.6 I dispose of a number of informal contacts that I use to
deal with problems.
37 3,33 4,67 3,9878 ,32124
13.7 When handling an incident I deal with it incrementally. I
adjust my actions.
37 3,20 4,67 4,0468 ,28193
14.1 When something exceptional happens, I know who
has the expertise to respond.
37 3,50 4,67 4,0270 ,27998
14.2 I sometimes rely on improvisation to find a solution. 37 2,00 4,40 3,3457 ,49504
14.3 To perform the job, I sometimes defer from procedure. 37 2,33 4,20 3,4881 ,39416
14.4 When handling an incident I take into account the
consequences for the organization as a whole.
37 3,75 4,67 4,2989 ,21463
14.5 When I handle an incident, I sometimes rely on
information that is (or does not need to be) 100% certain.
37 2,17 3,67 2,8972 ,42289
IntuitiefipvRationeel 37 1,50 2,86 2,1739 ,27914
15.1 I consider near-misses as an indication of potential
danger.
37 3,25 4,67 3,9358 ,31257
15.2 I consider near-misses and mistakes as information on
the performance of our system.
37 3,33 4,33 3,8830 ,23491
15.3 I tend to report mistakes that could have important
consequences, even when no-one has noticed them.
37 3,80 4,83 4,3753 ,25237
15.4 When the unexpected happens, I investigate why
things did not go as expected.
37 3,80 4,67 4,2323 ,20060
17.1 When handling a severe incident (priority 1 or 2) it is
easy to get hold of all necessary information.
37 2,17 4,00 3,3129 ,41247
17.2 When handling an incident of priority 1 or 2 it is easy to
get access to supplementary resources.
37 3,17 4,50 3,8818 ,34482
19.1 When the unexpected happens, we report in our team
what has happend prior to the incident.
37 2,75 4,50 3,8951 ,36538
19.2 In our team we learn from our mistakes. 37 3,67 4,75 4,1797 ,25747
19.3 I feel good in our team. 37 3,67 4,83 4,2699 ,31904
19.4 As a team we feel ownership for the incident untill it is
solved.
37 3,50 4,67 4,2044 ,30013
19.5 In our team we take into account each other’s opinion
regarding the handling of incidents.
37 3,63 4,75 4,1510 ,27366
19.6 In our team we spend a lot of time on incident analysis
in order to better understand future incidents.
37 2,40 4,67 3,5677 ,46039
20.1 In our team we listen carefully to each other; it is 37 3,20 4,80 4,0793 ,31276

324 Two Cases in High Reliability Organizing: a Hermeneutic Reconceptualization
exceptional that an opinion is not listened to.
20.2 In our team we trust each other. 37 3,29 4,80 4,1293 ,32385
20.3 When handling a severe incident (priority 1 or 2) we
consult other team members.
37 3,50 4,67 4,2525 ,32972
20.4 There is consensus amongst the members of our team
on WHAT should not go wrong with crucial systems.
37 3,33 4,40 3,9638 ,24273
20.5 There is consensus amongst the members of our team
on HOW crucial systems can go wrong.
37 3,29 4,40 3,8026 ,26170
20.6 Because of pressure (time-pressure or other) our team
often deviates from procedure.
37 2,00 3,50 2,7960 ,41121
22.1 I feel a lot of pressure to save on costs and time. 37 2,83 4,67 3,6262 ,45986
22.2 I have a lot of freedom when handling incidents. 37 2,50 5,00 3,5865 ,44847
22.3 I feel I receive challenging assingments. 37 2,67 4,00 3,4934 ,37134
22.4 I have sufficient training and experience to handle
incidents.
37 3,22 5,00 3,8699 ,33938
22.5 When necessary, superiors let subordinates with more
technical expertise make decisions.
37 2,67 4,67 3,8173 ,35448
23.1 [COMPANY]-ICT is exposed to many dangers/threats. 37 2,33 3,50 3,1336 ,26093
23.2 My management mobilizes supplementary people
whenever the workload of our teams becomes excessive.
37 2,25 4,25 3,2422 ,46042
23.3 In [COMPANY]-ICT it is easy to ask for help. 37 3,18 4,33 3,6940 ,27266
23.4 I feel free to speak to superiors about difficulties in my
work situation.
37 3,25 4,67 3,9199 ,29545
24.1 I am encouraged to ask questions. 37 2,83 4,50 3,7073 ,37941
24.2 I am familiar with processes (business or IT) that are
strictly speaking outside the scope of my job.
37 2,50 4,40 3,2848 ,38183
Deviation 37 2,00 3,17 2,6488 ,29698
24.4 I often work under high productivity pressure (time,
costs).
37 3,00 4,42 3,5693 ,37156
NU12 deadline alert 37 1,00 357,00 59,8378 80,03628
NU12 closed 37 2,00 2248,00 194,6757 391,97754
PU12 resolved on time 37 ,00 87,32 55,6210 23,46889
NU3 deadline alert 37 ,00 96,00 29,0270 25,83009
NU3 closed 37 11,00 69749,00 2942,3514 11394,7998
5

Appendices 325
PU3 resolved on time 37 41,89 100,00 93,6303 11,53535
NUA deadline alert 37 1,00 417,00 88,8649 98,47593
NUA closed 37 14,00 69785,00 3137,0270 11372,2734
4
PUA resolved on time 37 32,73 99,91 87,1434 15,29910
Mean NU12 per employee 37 ,22 132,24 14,7402 24,19485
Mean NU3 per employee 37 2,75 3321,38 208,0978 558,94713
Mean NUA per employee 37 3,50 3323,10 222,8380 555,99184
Team Orientation 37 3,55 4,60 4,1633 ,22298
Preoccupation with Failure 37 3,75 4,47 4,1451 ,14693
Deference to Expertise 37 3,36 4,20 3,7556 ,19547
Sensitivity to Operations 37 3,50 4,40 3,8832 ,22418
HRT 37 3,77 4,26 3,9912 ,11385
SenseMaking 37 3,32 4,05 3,7293 ,17447
Other 37 3,19 4,25 3,8414 ,27070
Self 37 3,00 4,50 3,8453 ,30591
Scheme 37 2,78 4,13 3,5025 ,27394
Threat Flexibility 37 3,29 4,20 3,6941 ,21486
Efficiency 37 3,00 4,18 3,5978 ,33402
Logics of Action 37 3,25 4,44 3,8147 ,23830
Deviation 37 2,50 3,60 3,0685 ,24605
Team Size 37 4 36 11,84 6,513
Valid N (listwise) 24

326 Two Cases in High Reliability Organizing: a Hermeneutic Reconceptualization
Appendix G. Descriptive Team Statistics (NPP Case)
N Min. Max. Mean Std.
Deviation
Deference to Expertise (DE) 24 3,47 4,60 3,8375 ,25530
Deviation 24 3,00 4,33 3,7222 ,38616
Efficiency (Eff) 24 2,60 3,86 3,2112 ,33684
High Reliability Theory (HRT) 24 3,60 4,74 4,1210 ,21450
Other 24 3,44 4,50 4,0374 ,33292
Preoccupations with Failure (PF) 24 3,60 4,90 4,2879 ,28058
Pressure 24 2,60 3,76 3,1743 ,30715
Scheme 24 1,25 3,50 2,5824 ,52405
Self 24 3,50 4,50 4,1237 ,28036
SenseMaking (SeMa) 24 3,24 4,07 3,6543 ,22483
Sensitivity to Operations (SO) 24 3,67 5,00 4,1704 ,32131
Supplementary Resources (SupRes) 24 2,76 4,00 3,4760 ,31976
Team Orientation (TO) 24 3,75 5,00 4,2506 ,32341
Threat Flexibility (TF) 24 3,22 4,50 3,6671 ,30368
Number of team members (TM) 24 2 11 4,46 2,467
Number of urgent notifications per employee (N0pe)
24 ,20 292,45 46,8322 62,14910
Number of non-urgent notifications per employee (N123pe)
24 ,33 436,91 53,1870 90,61430
Number of notifications per employee (NApe)
24 ,53 729,36 100,0191 151,92554
Team Participation (TP) 24 ,11 1,00 ,3493 ,19698
1. Ben je [company] personeel of contractor?
24 1,00 1,50 1,0313 ,11211
10. In how many of the cases (%) do you timely register the necessary data in SAP?
24 5,00 100,00 65,5115 21,14723
11.1 face-to-face communication 24 15,00 82,50 42,5240 21,35135
11.2 telephone/cell phone 24 3,37 80,00 30,1366 15,15244
11.3 e-mail 24 ,00 80,00 29,9078 16,75122

Appendices 327
11.4 SAP 24 10,00 63,50 39,0600 13,18074
11.5 Other means of communication 24 ,00 52,50 4,8007 11,14991
13.7 When handling an incident I deal with it incrementally. I adjust my actions.
24 3,00 4,50 3,9498 ,33317
2. What is your gender? 24 1,00 1,50 1,0396 ,11701
3.1. Are you a manager? 24 1,00 2,00 1,3948 ,33351
3.2. What personnel category do you belong to?
24 1,00 2,25 1,5871 ,33162
4. What is your physical work location? 24 1,00 6,00 2,4146 1,37378
5. How many years of experience do you have regarding the Maintenance & Repair process?
24 ,53 23,29 9,2827 5,36222
7.1. How much (%) do you use SAP history for the work preparation?
24 7,50 90,00 36,0900 20,69900
7.2. From how many different people do you get input (conversation, telephone, e-mail, notifications)?
23 12,50 733,33 211,1306 203,62842
Q72LIKERT 23 1,50 5,00 3,0391 ,99496
8. How many of the cases (%) do you notice a procedure needs to be adjusted?
24 2,00 37,50 14,7288 8,95689
9. In how many of the cases (%) do you take action to change the procedure?
24 5,00 100,00 76,8371 23,14973
Ratio face vs distance 24 ,10 1,76 ,5642 ,42393
Ratio nondedicated vs dedicated 24 ,00 24,00 5,4369 5,06875
Ratio voice vs nonvoice 24 ,00 4,67 1,4851 1,07004
Team Size 24 4 70 18,04 18,700

328 Two Cases in High Reliability Organizing: a Hermeneutic Reconceptualization
Appendix H. Data Reduction (Bank Case)
Control variables
An overview of all variables is shown in Appendix D (Bank Case) and Appendix E (NPP Case). It
was the basis for our further analysis. We have used factor analysis to reduce various sets of
items into a smaller number of compound factors. All factors are extracted by Principal
Component Analysis with Varimax rotation with Kaiser Normalization. First, we isolated the
moderator items () from the items relating to theory and we performed a factor analysis on the
first set. We only performed such an analysis if the necessary conditions are met: KMO measure
higher than 0.50 and a significant value of the Bartlett test (Poelmans, 2002, p. 135) (Table 0.10).
The factors emerging from our analysis meet the exigency that they should explain for 60% of
total Variance (Table 0.11). Our approach is in line with Koch’s (1993) modus operandus and has
lead to the results shown in Table 6.1 and Table 6.2, for the Bank Case and the NPP Case
respectively.
Mean Std.
Deviation Analysis N Missing N
24.1 I am encouraged to ask questions. 3,62 0,699 317 3
22.3 I feel I receive challenging assingments. 3,46 0,777 312 8
23.3 In [COMPANY]-ICT it is easy to ask for help.
3,63 0,667 314 6
17.2 When handling an incident of priority 1 or 2 it is easy to get access to supplementary resources.
3,79 0,742 289 31
24.4 I often work under high productivity pressure (time, costs).
3,57 0,829 314 6
22.1 I feel a lot of pressure to save on costs and time.
3,58 0,910 313 7
13.6 I dispose of a number of informal contacts that I use to deal with problems.
4,03 0,710 310 10
22.4 I have sufficient training and experience to handle incidents.
3,82 0,792 308 12
22.2 I have a lot of freedom when handling incidents.
3,55 0,851 307 13
24.3 I am expected to do my job in a certain manner without deviating from procedure.
3,34 0,792 315 5
14.3 To perform the job, I sometimes defer from procedure.
3,54 0,847 309 11
Table 0.9 - Items relating to Control Variables (Bank)

Appendices 329
Kaiser-Meyer-Olkin Measure of Sampling Adequacy. ,618
Bartlett's Test of Sphericity Approx. Chi-Square 359,479
df 55
Sig. ,000
Table 0.10 - KMO and Bartlett's Test for Control Variables (Bank)
Com-
ponent
Total % Var. Cum.% Total % of Var. Cum.% Total % Var. Cum.%
1 2,174 19,760 19,760 2,174 19,760 19,760 1,869 16,988 16,988
2 1,704 15,492 35,252 1,704 15,492 35,252 1,706 15,513 32,501
3 1,350 12,272 47,524 1,350 12,272 47,524 1,492 13,560 46,061
4 1,111 10,095 57,619 1,111 10,095 57,619 1,271 11,558 57,619
5 ,890 8,087 65,707
6 ,819 7,446 73,153
7 ,702 6,378 79,531
8 ,627 5,701 85,232
9 ,602 5,468 90,700
10 ,580 5,276 95,976
11 ,443 4,024 100,000
Table 0.11 - Total Variance Explained by the Factors for the Control Variables (Bank)
Component
1 2 3 4
24.1 I am encouraged to ask questions. 0,674912 -0,07482 -0,03762 0,128155
22.3 I feel I receive challenging assingments. 0,658099 -0,06776 0,12968 0,150919
17.2 When handling an incident of priority 1 or 2 it is easy to get
access to supplementary resources. 0,629954 0,279555 0,004025 -0,20017
23.3 In [COMPANY]-ICT it is easy to ask for help. 0,610508 -0,17318 0,130691 -0,04616
24.4 I often work under high productivity pressure (time, costs). -0,00729 0,824612 0,12017 -0,16194

330 Two Cases in High Reliability Organizing: a Hermeneutic Reconceptualization
22.1 I feel a lot of pressure to save on costs and time. -0,07863 0,777188 -0,10134 0,123354
13.6 I dispose of a number of informal contacts that I use to deal
with problems. -0,14782 0,167159 0,724447 0,138339
22.4 I have sufficient training and experience to handle
incidents. 0,274569 0,019724 0,702002 -0,26601
22.2 I have a lot of freedom when handling incidents. 0,220746 -0,24842 0,599949 0,240725
24.3 I am expected to do my job in a certain manner without
deviating from procedure. -0,21081 0,279237 0,057654 -0,71778
14.3 To perform the job, I sometimes defer from procedure. -0,11767 0,368895 0,225107 0,696784
Table 0.12 - Rotated Component Matrix for Control Variables
Threat Flexibility 24.1 I am encouraged to ask questions.
22.3 I feel I receive challenging assingments.
23.3 In [COMPANY]-ICT it is easy to ask for help.
23.2 My management mobilizes supplementary people whenever the workload of our
teams becomes excessive.
17.2 When handling an incident of priority 1 or 2 it is easy to get access to supplementary
resources.
Efficiency 24.4 I often work under high productivity pressure (time, costs).
22.1 I feel a lot of pressure to save on costs and time.
Peregrine 10. How much (%) do you register allmost immediately the necessary data in Peregrine?
9. How much (%) do you rely on Peregrine for the registration/coordination
/escalation/closing of an incident?
Logics of Action 13.6 I dispose of a number of informal contacts that I use to deal with problems.
22.4 I have sufficient training and experience to handle incidents.
22.2 I have a lot of freedom when handling incidents.
Deviation 24.3INV

Appendices 331
14.3 To perform the job, I sometimes defer from procedure.
IntuitiefipvRationeel
20.6 Because of pressure (time-pressure or other) our team often deviates from
procedure.
Table 0.13 - Labeling of the factors based on moderator variables
HRT and SeMa
Next, we chose to split the items in two sets: a set of items relating to theory (HRT and SeMa),
and another set relating to the moderator variables. By doing so we obtained the result shown in
Table 0.14.
Some constructs could be labeled according to theoretical constructs and sub-constructs. For the
factors relating to HRT, we refer to Weick et al. (1999). For the factors relating to Scheme and
making sense of uncertainty, we specifically refer to our relabeling of SenseMaking in Chapter 4
(Conceptual Model). Other constructs could not be labeled according to theoretical constructs
and sub-constructs. For these factors we have chosen a new, best-fitting, label (e.g. Team
Orientation). The factors in bold (Table 0.18) have a sufficiently high internal consistency
(Cronbach’s alpha ≥.60) to allow for aggregating them in a compounded indicator.
Mean
Std.
Deviation
Analysis
N
Missing
N
13.5 When problems arise, I know where/how I
can reach a decision-maker. 4,13 ,677 314 6
14.1 When something exceptional happens, I
know who has the expertise to respond. 3,98 ,655 313 7
14.4 When handling an incident I take into
account the consequences for the organization
as a whole.
4,29 ,567 311 9
15.1 I consider near-misses as an indication of
potential danger. 3,92 ,666 296 24
15.2 I consider near-misses and mistakes as
information on the performance of our system. 3,88 ,648 297 23
15.3 I tend to report mistakes that could have
important consequences, even when no-one
has noticed them.
4,38 ,577 313 7
15.4 When the unexpected happens, I
investigate why things did not go as expected. 4,24 ,599 310 10
17.1 When handling a severe incident (priority 1
or 2) it is easy to get hold of all necessary
information.
3,26 ,853 290 30
19.4 As a team we feel ownership for the 4,14 ,653 313 7

332 Two Cases in High Reliability Organizing: a Hermeneutic Reconceptualization
incident untill it is solved.
19.5 In our team we take into account each
other’s opinion regarding the handling of
incidents.
4,12 ,587 313 7
20.1 In our team we listen carefully to each
other; it is exceptional that an opinion is not
listened to.
4,05 ,657 312 8
20.2 In our team we trust each other. 4,11 ,631 313 7
20.3 When handling a severe incident (priority 1
or 2) we consult other team members. 4,20 ,676 296 24
20.4 There is consensus amongst the members
of our team on WHAT should not go wrong with
crucial systems.
3,96 ,640 300 20
20.5 There is consensus amongst the members
of our team on HOW things could go wrong with
crucial systems.
3,76 ,638 297 23
22.5 When necessary, superiors let
subordinates with more technical expertise
make decisions.
3,79 ,750 300 20
23.4 I feel free to speak to superiors about
difficulties in my work situation. 3,85 ,732 313 7
24.2 I am familiar with processes (business or
IT) that are strictly speaking outside the scope
of my job.
3,31 ,823 312 8
Table 0.14 - Descriptive Statistics for items relating to HRT
The KMO analysis (Table 0.15) results in a value of 0.795 which can be considered meritorious
(Poelmans, 2002) and the Bartlett’s Test of Sphericity is significant (p ≤ 0.001).
Kaiser-Meyer-Olkin Measure of Sampling
Adequacy. ,795
Bartlett's Test of
Sphericity
Approx. Chi-Square 1190,447
df 153
Sig. ,000
Table 0.15 - KMO and Bartlett's Test for HRT Factor Analysis
Subsequently a factor analysis was run on these items, resulting in the Rotation Component
Matrix shown in Table 0.17 from which four factors can be derived, cumulatively explaining
50.43% of total variance (Table 0.16). From Table 0.17 can be derived the items underlying the
factors relating to the HRT constructs. As the factor composition matched the factor
composition of the Bank Case, they got labeled accordingly (Table 0.18).

Appendices 333
Compon
ent Initial Eigenvalues
Extraction Sums of Squared
Loadings
Rotation Sums of Squared
Loadings
Total
% of
Variance
Cumulati
ve % Total
% of
Variance
Cumula
tive % Total
% of
Variance
Cumulative
%
1 4,338 24,098 24,098 4,338 24,098 24,098 2,944 16,356 16,356
2 2,012 11,176 35,274 2,012 11,176 35,274 2,342 13,009 29,366
3 1,459 8,105 43,379 1,459 8,105 43,379 2,016 11,201 40,566
4 1,269 7,048 50,427 1,269 7,048 50,427 1,775 9,860 50,427
5 ,977 5,427 55,854
6 ,934 5,189 61,043
7 ,859 4,772 65,815
8 ,832 4,623 70,438
9 ,771 4,286 74,723
10 ,739 4,104 78,827
11 ,664 3,690 82,517
12 ,607 3,374 85,890
13 ,573 3,184 89,074
14 ,536 2,978 92,052
15 ,437 2,426 94,477
16 ,396 2,201 96,678
17 ,323 1,795 98,474
18 ,275 1,526 100,000
Table 0.16 - Total Variance Explained by the HRT Factors (Bank)

334 Two Cases in High Reliability Organizing: a Hermeneutic Reconceptualization
Component
1 2 3 4
20.2 In our team we trust each other. 0,779539 0,037776 0,101271 0,147273
20.1 In our team we listen carefully to each other; it is
exceptional that an opinion is not listened to. 0,779074 0,006255 0,076774 0,193751
19.5 In our team we take into account each other’s opinion
regarding the handling of incidents. 0,728231 0,133892 0,155673 0,126674
19.4 As a team we feel ownership for the incident untill it is
solved. 0,584455 0,292655 0,055097 0,009185
20.3 When handling a severe incident (priority 1 or 2) we
consult other team members. 0,486741 0,039816 0,173282 0,31757
15.1 I consider near-misses as an indication of potential
danger. -0,02712 0,686307 0,03997 0,091803
15.3 I tend to report mistakes that could have important
consequences, even when no-one has noticed them. 0,291055 0,669452 0,028237 -0,2635
14.4 When handling an incident I take into account the
consequences for the organization as a whole. 0,107064 0,638492 0,019427 0,134006
15.2 I consider near-misses and mistakes as information on
the performance of our system. -0,10705 0,631128 0,002229 0,447503
15.4 When the unexpected happens, I investigate why things
did not go as expected. 0,229484 0,615763 0,138503 -0,10685
13.5 When problems arise, I know where/how I can reach a
decision-maker. 0,090566 0,059052 0,695075 0,0867
14.1 When something exceptional happens, I know who has
the expertise to respond. -0,04398 0,258817 0,690137 -0,04908
22.5 When necessary, superiors let subordinates with more
technical expertise make decisions. 0,220019 -0,01888 0,524863 0,040273
17.1 When handling a severe incident (priority 1 or 2) it is
easy to get hold of all necessary information. 0,12746 -0,18948 0,503384 0,077087
23.4 I feel free to speak to superiors about difficulties in my
work situation. 0,427503 0,054195 0,446155 0,007562
24.2 I am familiar with processes (business or IT) that are
strictly speaking outside the scope of my job. 0,018834 0,117848 0,423331 0,188404

Appendices 335
20.5 There is consensus amongst the members of our team
on HOW things could go wrong with crucial systems. 0,3024 -0,00321 0,200798 0,788595
20.4 There is consensus amongst the members of our team
on WHAT should not go wrong with crucial systems. 0,332119 0,084327 0,117706 0,784991
Table 0.17 - Rotation Matrix for HRT constructs
Team Orientation
20.1 In our team we listen carefully to each other; it is exceptional
that an opinion is not listened to.
20.2 In our team we trust each other.
19.5 In our team we take into account each other’s opinion
regarding the handling of incidents.
19.4 As a team we feel ownership for the incident untill it is solved.
20.3 When handling a severe incident (priority 1 or 2) we consult
other team members.
23.4 I feel free to speak to superiors about difficulties in my work
situation.
Preoccupation with
Failure
15.1 I consider near-misses as an indication of potential danger.
15.3 I tend to report mistakes that could have important
consequences, even when no-one has noticed them.
14.4 When handling an incident I take into account the
consequences for the organization as a whole.
15.4 When the unexpected happens, I investigate why things did not
go as expected.
15.2 I handle near-misses and mistakes as information on the
reliability of our system.
Deference to Expertise
14.1 When something exceptional happens, I know who has the
expertise to respond.
13.5 When problems arise, I know where/how I can reach a
decision-maker.
24.2 I am familiar with processes (business or IT) that are strictly
speaking outside the scope of my job.
22.5 When necessary, superiors let subordinates with more
technical expertise make decisions.
17.1 When handling a severe incident (priority 1 or 2) it is easy to
get hold of all necessary information.

336 Two Cases in High Reliability Organizing: a Hermeneutic Reconceptualization
Sensitivity to Operations
20.5 There is consensus amongst the members of our team on
HOW crucial systems can go wrong.
20.4 There is consensus amongst the members of our team on
WHAT should not go wrong with crucial systems.
Making sense of Other
19.1 When the unexpected happens, we report in our team what
has happend prior to the incident.
19.2 In our team we learn from our mistakes.
19.6 In our team we spend a lot of time on incident analysis in order
to better understand future incidents.
13.4 When making decisions/taking action I take into account the
possible reaction of my colleagues.
Making sense of Self
13.1 I feel emotionally involved when handling incidents. The work
does not let go.
13.2 I consider the adequate handling of incidents as a matter of
honour..
Scheme
14.5 When I handle an incident, I sometimes rely on information that
is (or does not need to be) 100% certain.
14.2 I sometimes rely on improvisation to find a solution.
13.3 When handling incidents I call similar prior incidents to mind.
Table 0.18 - Labeling of HRT constructs based on the research data
Next, the procedure was repeated for the items relating to SenseMaking (Table 0.19). These
items were factor analyzed.

Appendices 337
Mean
Std.
Deviation
Analysis
N
Missing
N
19.2 In our team we learn from our mistakes. 4,17 ,577 314 6
19.6 In our team we spend a lot of time on
incident analysis in order to better understand
future incidents. 3,51 ,896 309 11
19.1 When the unexpected happens, we report
in our team what has happend prior to the
incident. 3,85 ,773 311 9
13.1 I feel emotionally involved when handling
incidents. The work does not let go. 3,46 1,043 306 14
13.3 When handling incidents I call similar prior
incidents to mind. 4,27 ,639 312 8
13.2 I consider the adequate handling of
incidents as a matter of honour.. 4,13 ,764 309 11
14.2 I sometimes rely on improvisation to find a
solution. 3,39 ,884 311 9
14.5 When I handle an incident, I sometimes
rely on information that is (or does not need to
be) 100% certain. 2,83 ,965 309 11
13.4 When making decisions/taking action I take
into account the possible reaction of my
colleagues. 3,79 ,896 307 13
Table 0.19 - Descriptive Statistics for SenseMaking related items
The KMO analysis (Table 0.20) results in a value of 0.651 which can be considered mediocre and
the Bartlett’s Test of Sphericity is significant (p ≤ 0.001) (Poelmans, 2002). The three factors
explain 55.84% of total variance of the eigenvalues (Table 0.21).
Kaiser-Meyer-Olkin Measure of Sampling
Adequacy. ,651
Bartlett's Test of
Sphericity
Approx. Chi-Square 359,671
df 36
Sig. ,000

338 Two Cases in High Reliability Organizing: a Hermeneutic Reconceptualization
Table 0.20 - KMO and Bartlett's Test for SenseMaking Factors (Bank)
Component
Initial Eigenvalues Extraction Sums of Squared Loadings
Rotation Sums of Squared Loadings
Total % Var Cum.% Total % of Var Cum. % Total % of Var. Cum.%
1 2,251 25,008 25,008 2,251 25,008 25,008 2,095 23,277 23,277
2 1,494 16,603 41,611 1,494 16,603 41,611 1,648 18,311 41,588
3 1,281 14,232 55,843 1,281 14,232 55,843 1,283 14,256 55,843
4 ,845 9,387 65,230
5 ,827 9,193 74,423
6 ,774 8,596 83,019
7 ,568 6,313 89,332
8 ,564 6,268 95,600
9 ,396 4,400 100,000
Table 0.21 - Total Variance Explained by the SenseMaking Factors (Bank)
From Table 6.2 can be derived the items underlying the factors relating to the SeMa constructs.
As the factor composition matched the onoe of the Bank Case, they got labeled accordingly
(Table 6.1).
Component
1 2 3
19.2 In our team we learn from our mistakes. 0,82791 -0,04916 0,072066
19.1 When the unexpected happens, we report in our team what has happend prior to the incident. 0,825758 -0,06752 0,101278
19.6 In our team we spend a lot of time on incident analysis in order to better understand future incidents. 0,66467 0,198809 -0,17084
13.4 When making decisions/taking action I take into account the possible reaction of my colleagues. 0,489268 0,205248 -0,06493
13.1 I feel emotionally involved when handling incidents. The work does not let go. 0,016869 0,789055 -0,14554
13.2 I consider the adequate handling of incidents as a matter of honour.. 0,087022 0,777071 -0,04115
13.3 When handling incidents I call similar prior incidents to mind. 0,150058 0,575723 0,388872
14.2 I sometimes rely on improvisation to find a solution. 0,054505 -0,01671 0,768505
14.5 When I handle an incident, I sometimes rely on information that is (or does not need to be) 100% certain. -0,11451 -0,03377 0,685168
Extraction Method: Principal Component Analysis. Rotation Method: Varimax with Kaiser Normalization. Rotation converged in 4 iterations.
Table 0.22 - Rotation Matrix for SenseMaking (Bank)

Appendices 339
Appendix I. Data Reduction (NPP Case)
We proceeded by analogy with the Bank Case as follows:
Control Variables
First, we isolated the moderator items from the items relating to theory and we performed a
factor analysis on the first set (Table 0.23). We only performed such an analysis if the necessary
conditions are met: KMO measure higher than 0.5 and a significant value of the Bartlett test
(Table 0.24) (Poelmans, 2002, p. 135).
Mean
Std. Deviation
Analysis N
Missing N
24.1 I am encouraged to ask questions. 3,72 ,832 128 0
22.3 I feel I receive challenging assingments. 3,71 ,824 128 0
23.3 In [COMPANY] it is easy to ask for help. 3,64 ,839 128 0
17.2 When handling an incident of priority 0 it is easy to get access to supplementary resources. 3,89 1,449 128 0
24.4 I often work under high productivity pressure (time, costs).
3,64 ,839 128 0
22.1 I feel a lot of pressure to save on costs and time. 3,13 1,143 128 0
13.6 I dispose of a number of informal contacts that I use to deal with problems.
3,66 1,089 128 0
22.4 I have sufficient training and experience to handle incidents. 3,96 ,798 128 0
22.2 I have a lot of freedom when handling incidents.
3,70 ,985 128 0
24.3 I am expected to do my job in a certain manner without deviating from procedure. 3,83 ,897 128 0
14.3 To perform the job, I sometimes defer from procedure. 3,24 1,169 128 0
Table 0.23 - Descriptive Statistics for items related to moderator items (NPP)

340 Two Cases in High Reliability Organizing: a Hermeneutic Reconceptualization
Kaiser-Meyer-Olkin Measure of Sampling
Adequacy. ,703
Bartlett's Test of
Sphericity
Approx. Chi-Square 366,740
df 55
Sig. ,000
Table 0.24 - KMO and Bartlett's Test for Factor Analysis on Control Variable Items (NPP)
The total variance that can be explained by the factors resulting from this rotation is sufficient
(66.17%) (Table 0.25).
Compo
nent
Initial Eigenvalues
Extraction Sums of Squared
Loadings
Rotation Sums of Squared
Loadings
Total
% of
Variance
Cumulati
ve % Total
% of
Variance
Cumula
tive % Total
% of
Varianc
e
Cumulati
ve %
1 3,448 31,343 31,343 3,448 31,343 31,343 2,582 23,471 23,471
2 1,715 15,592 46,936 1,715 15,592 46,936 1,852 16,833 40,304
3 1,115 10,137 57,073 1,115 10,137 57,073 1,602 14,564 54,868
4 1,001 9,100 66,174 1,001 9,100 66,174 1,244 11,306 66,174
5 ,801 7,279 73,453
6 ,721 6,556 80,009
7 ,617 5,611 85,620
8 ,489 4,445 90,065
9 ,474 4,312 94,377
10 ,371 3,375 97,751
11 ,247 2,249 100,000
Table 0.25 - Total Variance Explained by Control Factors (NPP)

Appendices 341
By doing so we obtained the result shown in Table 0.26.
Component
1 2 3 4
22.3 I feel I receive challenging assingments. 0,793042 0,265743 0,012742 0,005526
22.2 I have a lot of freedom when handling incidents. 0,689263 0,075591 0,312801 -0,43032
24.1 I am encouraged to ask questions. 0,674437 0,107802 0,237991 0,231671
22.4 I have sufficient training and experience to handle incidents. 0,66928 0,042443 0,022402 0,277159
24.4 I often work under high productivity pressure (time, costs). 0,130925 0,802759 0,082538 0,123202
22.1 I feel a lot of pressure to save on costs and time. -0,04732 0,786163 0,105917 0,329976
14.3 To perform the job, I sometimes defer from procedure. 0,233215 0,679231 -0,11599 -0,21383
17.2 When handling an incident of priority 0 it is easy to get access to
supplementary resources. -0,00235 0,070339 0,90128 0,055043
13.6 I dispose of a number of informal contacts that I use to deal with
problems.
0,455056 0,00422 0,589496 -0,15026
23.3 In [COMPANY] it is easy to ask for help. 0,485522 -0,04516 0,503062 0,281174
24.3 I am expected to do my job in a certain manner without deviating
from procedure.
0,241771 0,176149 0,05002 0,808389
Extraction Method: Principal Component Analysis. Rotation Method: Varimax with Kaiser Normalization. Rotation
converged in 6 iterations.
Table 0.26 - Rotated Component Matrix for Control Variables (NPP Case)

342 Two Cases in High Reliability Organizing: a Hermeneutic Reconceptualization
HRT and SeMa
The same procedure was applied to those items relating to HRT (Table 0.27).
Mean
Std.
Deviation
Analysis
N
Missing
N
13.5 When problems arise, I know
where/how I can reach a decision-
maker. 4,20 ,836 128 0
14.1 When something exceptional
happens, I know who has the
expertise to respond. 3,97 ,822 128 0
14.4 When handling an incident I take
into account the consequences for
the organization as a whole. 4,19 ,696 128 0
15.1 I consider near-misses as an
indication of potential danger. 4,38 ,711 128 0
15.2 I handle near-misses and
mistakes as information on the
reliability of our system. 4,31 ,740 128 0
15.3 I tend to report mistakes that
could have important consequences,
even when no-one has noticed them. 4,54 ,614 128 0
15.4 When the unexpected happens,
I investigate why things did not go as
expected. 4,41 ,634 128 0
17.1 When handling a severe incident
(priority 0) it is easy to get hold of all
necessary information. 3,82 1,405 127 1
19.4 As a team we feel ownership for
the incident untill it is solved. 4,34 ,788 128 0
19.5 In our team we take into account
each other’s opinion regarding the
handling of incidents. 4,35 ,705 128 0

Appendices 343
20.1 In our team we listen carefully to
each other; it is exceptional that an
opinion is not listened to. 4,27 ,726 128 0
20.2 In our team we trust each other. 4,32 ,742 128 0
20.3 When handling an urgent
incident (priority 0) we consult other
team members. 4,18 1,213 128 0
20.4 I know which assignments are
crucial. 4,32 ,663 128 0
20.5 There is consensus amongst the
members of our team on HOW things
could go wrong with crucial systems.. 4,32 ,752 128 0
22.5 When necessary, superiors let
subordinates with more technical
expertise make decisions. 3,76 ,929 128 0
23.4 I feel free to speak to superiors
about difficulties in my work situation. 4,14 ,718 128 0
24.2 I am familiar with processes that
are strictly speaking outside the
scope of my job.
3,47 ,869 128 0
Table 0.27 - Items related to HRT
The KMO analysis (Table 0.28) results in a value of 0.887 which can be considered meritorious
(Poelmans, 2002) and the Bartlett’s Test of Sphericity is significant (p ≤ 0.001).
Kaiser-Meyer-Olkin Measure of Sampling Adequacy. ,887
Bartlett's Test of Sphericity Approx. Chi-Square 965,206
df 153
Sig. ,000
Table 0.28 - KMO and Bartlett's Test for Factor Analysis on HRT items
Subsequently a factor analysis was run on these items, resulting in the Rotation Component
Matrix shown in Table 0.30 from which four factors can be derived, cumulatively explaining
61.32% of total variance (Table 0.29). From Table 0.30 can be derived the items underlying the

344 Two Cases in High Reliability Organizing: a Hermeneutic Reconceptualization
factors relating to the HRT constructs. As the factor composition matched the factor
composition of the Bank Case, they got labeled accordingly.
Compo
-nent
Initial Eigenvalues Extraction Sums of Squared
Loadings
Rotation Sums of Squared
Loadings
Total % of
Variance
Cum. % Total % of
Variance
Cum. % Total % of
Variance
Cum. %
1 6,762 37,567 37,567 6,762 37,567 37,567 3,907 21,706 21,706
2 1,953 10,851 48,418 1,953 10,851 48,418 3,238 17,990 39,696
3 1,286 7,146 55,563 1,286 7,146 55,563 2,302 12,787 52,483
4 1,037 5,759 61,322 1,037 5,759 61,322 1,591 8,839 61,322
5 ,904 5,021 66,343
6 ,853 4,737 71,080
7 ,715 3,974 75,054
8 ,633 3,518 78,572
9 ,593 3,293 81,866
10 ,517 2,873 84,739
11 ,441 2,449 87,188
12 ,402 2,235 89,424
13 ,387 2,148 91,572
14 ,357 1,981 93,553
15 ,351 1,948 95,500
16 ,307 1,708 97,208
17 ,296 1,645 98,853
18 ,206 1,147 100,000
Table 0.29 - Total Variance Explained HRT constructs (NPP Case)

Appendices 345
Component
1 2 3 4
19.4 As a team we feel ownership for the incident untill it is solved. 0,805917 0,225291 0,17263 -0,06453
19.5 In our team we take into account each other’s opinion regarding the handling of incidents. 0,798533 0,072209 0,309148 0,030481
20.2 In our team we trust each other. 0,769187 0,223861 0,018252 0,169564
20.1 In our team we listen carefully to each other; it is exceptional that an opinion is not listened to. 0,732879 0,119266 0,21503 0,245246
20.4 I know which assignments are crucial. 0,686456 0,208878 0,35489 0,049751
20.5 There is consensus amongst the members of our team on HOW things could go wrong with
crucial systems.
0,663605 0,240695 0,023317 0,327856
15.1 I consider near-misses as an indication of potential danger. 0,211704 0,726828 -0,00383 0,248599
14.4 When handling an incident I take into account the consequences for the organization as a whole. 0,26487 0,710737 0,100608 0,000151
15.2 I handle near-misses and mistakes as information on the reliability of our system. 0,08264 0,701886 0,281949 0,114067
15.3 I tend to report mistakes that could have important consequences, even when no-one has
noticed them.
0,061786 0,69845 0,167185 0,044508
15.4 When the unexpected happens, I investigate why things did not go as expected. 0,25702 0,658074 0,279043 -0,04206
13.5 When problems arise, I know where/how I can reach a decision-maker. 0,236786 0,497769 0,472131 -0,23803
22.5 When necessary, superiors let subordinates with more technical expertise make decisions. 0,148353 0,15957 0,628949 0,171374
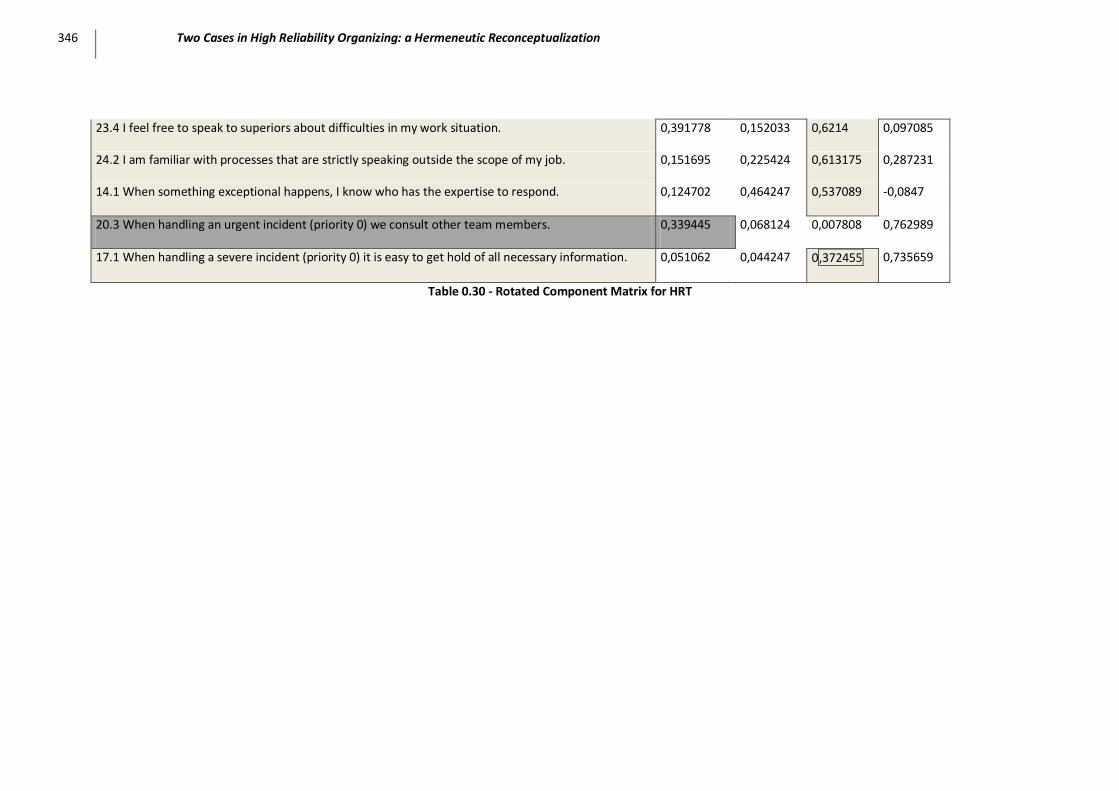
346 Two Cases in High Reliability Organizing: a Hermeneutic Reconceptualization
23.4 I feel free to speak to superiors about difficulties in my work situation. 0,391778 0,152033 0,6214 0,097085
24.2 I am familiar with processes that are strictly speaking outside the scope of my job. 0,151695 0,225424 0,613175 0,287231
14.1 When something exceptional happens, I know who has the expertise to respond. 0,124702 0,464247 0,537089 -0,0847
20.3 When handling an urgent incident (priority 0) we consult other team members. 0,339445 0,068124 0,007808 0,762989
17.1 When handling a severe incident (priority 0) it is easy to get hold of all necessary information. 0,051062 0,044247 0,372455 0,735659
Table 0.30 - Rotated Component Matrix for HRT

Appendices 347
Next, the procedure was repeated for the items relating to SenseMaking. The items that were
supposedly related to SenseMaking were grouped (Table 0.31) and factor analyzed.
Mean
Std.
Deviation
Analysis
N
Missing
N
19.2 In our team we learn from our mistakes. 4,42 ,683 128 0
19.6 In our team we spend a lot of time on
incident analysis in order to better understand
future incidents. 3,82 1,061 128 0
19.1 When the unexpected happens, we report in
our team what has happend prior to the incident. 4,26 ,796 128 0
13.1 I feel emotionally involved with my work. The
work does not let go. 3,86 ,970 128 0
13.3 When handling incidents I call similar prior
incidents to mind. 4,20 ,787 128 0
13.2 I consider the adequate handling of incidents
as a matter of honour. 4,48 ,664 128 0
14.2 I sometimes rely on improvisation to find a
solution. 3,02 1,292 128 0
14.5 When I handle an incident, I sometimes
rely on information that is (or does not need
to be) 100% certain. 2,63 1,267 128 0
13.4 When making decisions/taking action I take
into account the possible reaction of my
colleagues. 3,82 ,900 128 0
Table 0.31 - Items Related to SenseMaking
The KMO analysis (Table 0.32) results in a value of 0.752 which can be considered middling and
the Bartlett’s Test of Sphericity is significant (p ≤ 0.001) (Poelmans, 2002).

348 Two Cases in High Reliability Organizing: a Hermeneutic Reconceptualization
Kaiser-Meyer-Olkin Measure of Sampling Adequacy. ,752
Bartlett's Test of Sphericity Aprox. Chi-Square 310,119
df 36
Sig. ,000
Table 0.32 - KMO and Bartlett's Test for Factor Analysis on SenseMaking items
From Table 0.33 can be derived the items underlying the factors relating to the SeMa constructs.
As the factor composition matched the factor composition of the Bank Case, they got labeled
accordingly.
Component
1 2 3
19.2 In our team we learn from our mistakes. 0,834937 0,162808 0,151281
19.1 When the unexpected happens, we report in our team what has happend prior
to the incident.
0,808836 0,163605 0,080555
19.6 In our team we spend a lot of time on incident analysis in order to better
understand future incidents.
0,787484 0,1094 0,189624
13.1 I feel emotionally involved with my work. The work does not let go. 0,027415 0,85125 0,023237
13.3 When handling incidents I call similar prior incidents to mind. 0,145967 0,757837 0,225462
13.2 I consider the adequate handling of incidents as a matter of honour. 0,33816 0,663014 -0,17009
13.4 When making decisions/taking action I take into account the possible reaction
of my colleagues.
0,16369 0,491224 0,453343
14.2 I sometimes rely on improvisation to find a solution. 0,123443 0,049064 0,864034
14.5 When I handle an incident, I sometimes rely on information that is (or does not
need to be) 100% certain.
0,151918 0,027915 0,794955
Extraction Method: Principal Component Analysis. Rotation Method: Varimax with Kaiser Normalization.
Table 0.33 - Rotated Component Matrix for SenseMaking (NPP Case)

Appendices 349
Appendix J. Normalized Process Reliability
N Range Minimum Maximum
Zscore: PU12Year 37 3,72076 -2,36999 1,35077
Zscore: PU3Year 37 5,03739 -4,48520 ,55219
Zscore: PUAYear 37 4,39108 -3,55682 ,83426
Zscore: PU12Jan 23 3,07840 -1,87752 1,20088
Zscore: PU12Feb 24 3,51438 -1,78266 1,73172
Zscore: PU12Mrt 22 2,81663 -1,34533 1,47131
Zscore: PU12Apr 30 3,24782 -1,83309 1,41473
Zscore: PU12May 29 3,43007 -2,02372 1,40635
Zscore: PU12Jun 30 3,55642 -2,02148 1,53494
Zscore: PU12Jul 29 3,26228 -1,91728 1,34501
Zscore: PU12Aug 29 2,68551 -1,40794 1,27757
Zscore: PU12Sep 31 3,30188 -1,99040 1,31148
Zscore: PU12Oct 31 3,41166 -2,34082 1,07084
Zscore: PU12Nov 32 3,44995 -1,99183 1,45811
Zscore: PU12Dec 28 2,84375 -1,40146 1,44229
Zscore: PU3Jan 27 3,96238 -3,33641 ,62597
Zscore: PU3Feb 28 4,62945 -4,06401 ,56543
Zscore: PU3Mrt 28 4,24944 -3,73046 ,51898
Zscore: PU3Apr 35 4,29728 -3,62560 ,67168
Zscore: PU3May 36 4,71747 -4,19621 ,52126
Zscore: PU3Jun 35 5,73936 -5,21862 ,52074
Zscore: PU3Jul 36 5,47266 -5,05227 ,42039
Zscore: PU3Aug 35 4,79958 -4,14012 ,65946
Zscore: PU3Sep 37 4,35678 -3,98692 ,36986
Zscore: PU3Oct 37 4,61972 -4,12664 ,49308
Zscore: PU3Nov 36 5,33167 -4,81682 ,51486

350 Two Cases in High Reliability Organizing: a Hermeneutic Reconceptualization
Zscore: PU3Dec 36 5,19247 -4,69573 ,49673
Zscore: PUAJan 28 5,22378 -4,72210 ,50167
Zscore: PUAFeb 28 3,74268 -2,87864 ,86405
Zscore: PUAMrt 28 3,55559 -2,73827 ,81732
Zscore: PUAApr 35 4,02718 -3,16700 ,86019
Zscore: PUAMay 36 4,14928 -3,41943 ,72984
Zscore: PUAJun 35 4,81781 -3,88840 ,92941
Zscore: PUAJul 36 4,82024 -4,18222 ,63802
Zscore: PUAAug 35 4,18379 -3,38935 ,79445
Zscore: PUASep 37 4,67746 -4,08140 ,59606
Zscore: PUAOct 37 4,40914 -3,73210 ,67704
Zscore: PUANov 37 4,90871 -4,13243 ,77628
Zscore: PUADec 37 4,42816 -3,74315 ,68502
Valid N (listwise) 14
Table 0.34 - Descriptive Statistics for Normalized Reliability (Bank)
N Range Minimum Maximum
Zscore: PU0Year 24 4,88034 -4,47932 ,40101
Zscore: PU123Year 24 4,64523 -4,10073 ,54450
Zscore: PAUYear 24 4,86319 -4,38086 ,48232
Zscore: PU0Sep 21 3,08333 -2,58828 ,49505
Zscore: PU0Oct 22 4,38224 -3,92281 ,45943
Zscore: PU0Nov 21 4,15628 -3,76692 ,38936
Zscore: PU0Dec 22 4,01329 -3,37757 ,63571
Zscore: PU0Jan 20 4,52649 -4,12816 ,39833
Zscore: PU0Feb 23 3,96763 -3,41906 ,54857
Zscore: PU0Mrt 23 4,75177 -4,43154 ,32023
Zscore: PU0Apr 23 4,13402 -3,68107 ,45294
Zscore: PU0May 21 3,51009 -2,85264 ,65745
Zscore: PU0Jun 22 4,50153 -4,06979 ,43174

Appendices 351
Zscore: PU0Jul 20 4,52894 -4,20285 ,32608
Zscore: PU0Aug 22 4,13832 -3,81177 ,32655
Zscore: PU123Sep 18 3,39753 -2,69348 ,70404
Zscore: PU123Oct 20 3,88119 -3,23855 ,64264
Zscore: PU123Nov 22 3,68808 -3,09649 ,59159
Zscore: PU123Dec 23 3,53178 -2,86935 ,66242
Zscore: PU123Jan 22 4,03969 -3,39461 ,64509
Zscore: PU123Feb 23 3,97340 -3,44645 ,52695
Zscore: PU123Mrt 24 4,25985 -3,74701 ,51284
Zscore: PU123Apr 23 4,74845 -4,38152 ,36693
Zscore: PU123May 23 4,88451 -4,56209 ,32242
Zscore: PU123Jun 23 4,82065 -4,46075 ,35990
Zscore: PU123Jul 23 4,74773 -4,31826 ,42947
Zscore: PU123Aug 22 4,55869 -4,03981 ,51888
Zscore: PUASep 21 3,57641 -3,03245 ,54395
Zscore: PUAOct 22 3,88619 -3,24994 ,63625
Zscore: PUANov 23 3,71465 -3,04689 ,66776
Zscore: PUADec 23 4,62036 -4,12752 ,49284
Zscore: PUAJan 22 4,48929 -3,84268 ,64661
Zscore: PUAFeb 23 4,65562 -3,99182 ,66380
Zscore: PUAMrt 24 4,00746 -3,48936 ,51811
Zscore: PUAApr 23 4,29313 -3,77966 ,51347
Zscore: PUAMay 23 4,84519 -4,58307 ,26212
Zscore: PUAJun 23 4,89441 -4,52366 ,37075
Zscore: PUAJul 23 4,86141 -4,53609 ,32532
Zscore: PUAAug 23 4,15063 -3,75422 ,39642
Valid N (listwise) 17
Table 0.35 - Descriptive Statistics for Normalized Reliability (NPP)
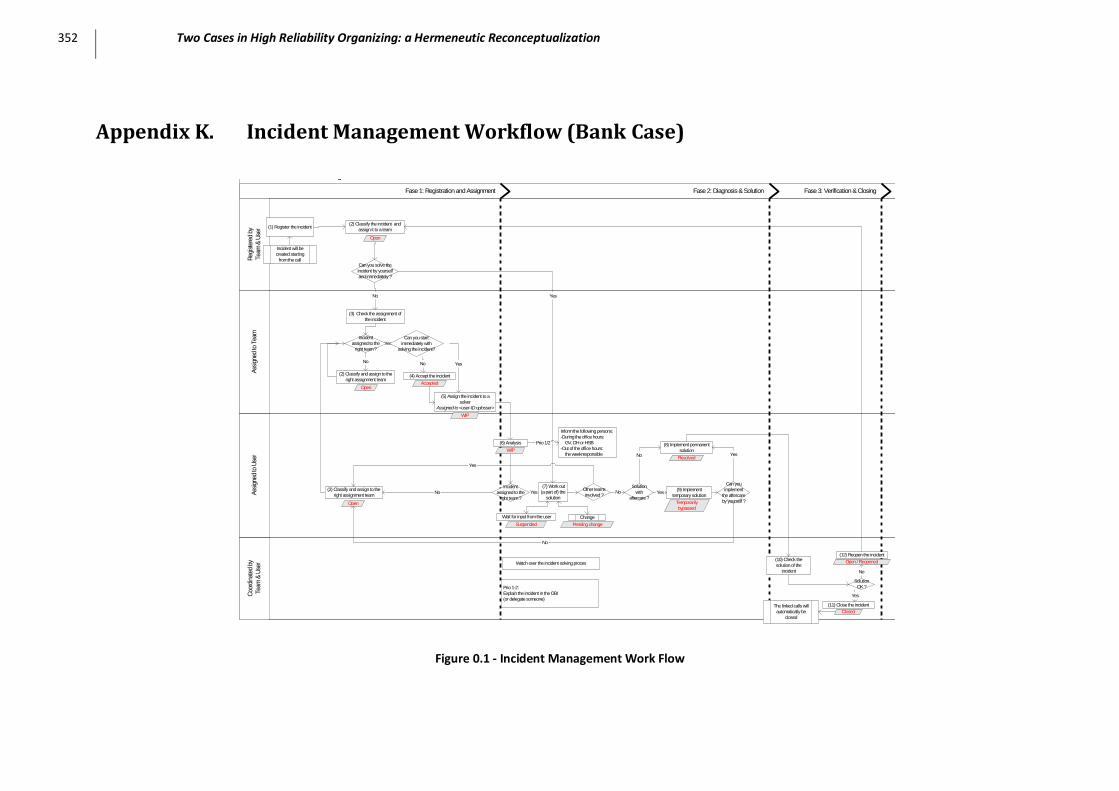
352 Two Cases in High Reliability Organizing: a Hermeneutic Reconceptualization
Appendix K. Incident Management Workflow (Bank Case)
Incident management VERSION 2.0
Fase 3: Verification & ClosingFase 2: Diagnosis & SolutionFase 1: Registration and Assignment
Coo
rdin
ated
by
Tea
m &
Use
rAss
igne
d to
Use
rAss
igne
d to
Tea
mR
egis
tere
d by
Tea
m &
Use
r
Yes
Yes
No Yes
Incident will be
created starting
from the call
(2) Classify the incident and
assign it to a team
WIP
(5) Assign the incident to a
solver
Assigned to <user-ID oplosser>
Change
Can you start
immediately with
solving the incident?
(4) Accept the incident
Incident
assigned to the
right team ?
No
No
Accepted
Incident
assigned to the
right team ?Temporarily
bypassed
Can you
implement
the aftercare
by yourself ?
No
(6) Analysis
No
Can you solve the
incident by yourself
and immediately ?
Yes
Open
Open
Open
(1) Register the incident
Inform the following persons:
-During the office hours:
GV, DH or HSB
-Out of the office hours:
the weekresponsible
Prio 1/2
Watch over the incident solving proces
No
Yes
(10) Check the
solution of the
incident
Solution
OK ?
Open / Reopened
Prio 1-2:
Explain the incident in the OBI
(or delegate someone)
Closed
Pending change
(7) Work out
(a part of) the
solution
Solution
with
aftercare ?
Yes
ResolvedNo
WIP
Wait for input from the user
Suspended
(8) Implement permanent
solution
The linked calls will
automatically be
closed
Yes
(11) Close the incident
(12) Reopen the incident
(9) Implement
temporary solution
(3) Check the assignment of
the incident
(2) Classify and assign to the
right assignment team
(2) Classify and assign to the
right assignment team
Other teams
involved ?No
Yes
Figure 0.1 - Incident Management Work Flow

Samenvatting (Dutch Summary) 353
Samenvatting (Dutch Summary)
Organizationele betrouwbaarheid is een belangrijk thema binnen elke organisatie. In deze thesis
hebben we trachten na te gaan welke contextuele en structurele organisatiedimensies bijdragen
tot een hoge betrouwbaarheid van het incident management proces van het IT departement van
een financiële instelling en dat van een kerncentrale. We deden dit aan hand van constructen en
inzichten die hun oorsprong vinden in onderzoek naar zogenaamde Hoge Betrouwbaarheid
Organisaties (HROs) en Sensemaking (SeMa) met de bedoeling een antwoord te vinden op
volgende onderzoeksvragen: (1) zijn beide organisaties HROs? en (2) welke factoren dragen bij
tot een hoge organizationele betrouwbaarheid? Middels een hermeneutische
onderzoeksmethodologie, bouwend op zowel kwalitatieve als kwantitatieve methoden, en na
een studie van de belangrijkste literatuur inzake High Reliability Theory (HRT), Normal Accidents
Theory, Sensemaking en IS Fit, kwamen we tot een reconceptualisatie van HRT. Het is deze
reconceptualizatie die het mogelijk maakt de onderzoeksvragen te beantwoorden zoals
hieronder weergegeven.
1. Zijn beide gevalsstudies HROs? Beide organisaties kunnen terecht HRO genoemd worden
aangezien de constructen zoals beschreven in onze HRT reconceptualisatie er waargenomen
kunnen worden. In het algemeen scoort de kerncentrale (als archetypische HRO) het hoogst op
de HRO karakteristieken.
2. Welke factoren dragen bij tot een hoge organizationele betrouwbaarheid? Het antwoord op
deze tweede onderzoeksvraag is veel minder eenduidig. In het algemeen stellen we vast dat een
hoge score op HRO en SeMa constructen niet noodzakelijkerwijze positief bijdraagt tot
betrouwbaarheid, maar dat het vergif in de dosis zit. Vertrekkend van het gereconceptualiseerde
theoretische kader konden we vaststellen dat de nieuw geïntroduceerde factoren als Team
Orientation, Threat Flexibility en Efficiency, eenduidig bijdragen tot betrouwbaarheid. Ondanks
het feit dat er niet zoiets is als een ideale betrouwbaarheidscocktail zijn er sterke aanwijzingen
dat een gereconceptualiseerde HRT waardevol advies kan verlenen voor het ontwerp van
processen die nood hebben aan hoge betrouwbaarheid. Dezelfde conclusie kan getrokken
worden wanneer de vergelijking gemaakt wordt tussen teams. Contextuele en structurele
dimensies (bv. teamgrootte, werklast en tijdsbesteding) blijken immers een belangrijke
modererende invloed te hebben op de betrouwbaarheid van een team.


Endnotes 355
Endnotes
1 In this thesis, more than once we rely on metaphors to gain insights in the objects of our study. “The dangers of metaphorical
reasoning are well known. They provide tools for explanation, giving us insights rather than understanding, and insights can often
prove illusory. They must be considered points of departure for the reasoning process rather than points of arrival” (Boisot & Cohen,
2000, p. 123). Philosophy of Science has since long been studying the duality between empiricism and rationalism. We refer to the
Heraclitus-Parmenides debate elsewhere in this thesis. Also Charles S. Peirce attributed to this debate by introducing the notion of
abduction. He called this “borrowing of metaphors from other disciplines” and described “how it can be used creatively to form a new
explanatory hypothesis” (Longstaff, 2003, p. 9).
2 “These days, the business of Banking is risk management“ Dennis Westherstone, Retired JP Morgan chairman (BT, 2005).
3 A general denominator for reliability could be system effectiveness. This system effectiveness consists of different properties like:
(1) Reliability; (2) Availability; (3) Reparability; (4) Maintainability; (5) Serviceability; (6) Design adequacy; (7) Capabi lity; (8)
Dependability; (9) Human reliability and (10) Environmental effect (Prasad, Hwang, Kuo, & Tillman, 2001, p. 7-8).
4 A FIT is equivalent to one failure per billion device hours.
5 Also from a practitioner’s perspective, this nuance can be important. In the US Military, for instance, failure is defined in terms of a
Class A mishap or failure, where there is loss of life, or property damages exceeding one million dollars. This is what in other context
hardly would be called a failure, but more a disaster(Sullivan & Beach, 2003).
6 One of the first findings in this general area was that front line operators are not usually the perpetrators of catastrophes because
catastrophes require the resources no single individual has at his or her demand (Roberts, 2005, p. 157).
7 Translated from French : ‘la fiabilité se distingue de la sûreté nucléaire car elle désigne la capacité d’un matériel ou d’une
installation d’assurer sa fonction prévue sans défaillance. Elle est, pour une partie du système ou pour le système, la proba bilité de
non-panne’.
8 A model in which the combined effect of several factors is the sum of the effects that would be produced by each of the factors in
the absence of the others (http://www.biology-online.org/dictionary/Additive model).
9 For example, the rate of production of new guidance materials and rules by the European Joint Aviation Regulat ors is substantially
increasing. More than 200 new policies, guidance documents, and rules are created each year even though the safety of global
commercial aviation has been at a plateau of 1 x 10⁻⁶ for years. Because little is known about which rules or new guidelines are truly
linked to safety levels, the system is purely additive: Old rules and guidance material are never discarded or removed (Amalberti et
al., 2005, p. 760).
10 Holes are not static for several reasons. They may represent individual human actions - so a human error will be represented as a
hole in this model. They may represent procedural failings that may only arise under certain environmental circumstances (e.g . when
the team of people involved in carrying out a procedure is under-strength). They may represent transient software faults that are
corrected automatically when the system state is re-computed.
11 Citation retrieved from Weick et al. (Weick, Sutcliffe, & Obstfeld, 2005, p. 418) but checked against original.
12 With this ‘all-seasons’ denomination, we mean an organizational Gestalt that is capable of dealing with changing conditions in an
automatic or semi-automatic manner. One should compare such a design and behavior to an experienced mountain-hiker and his
gear. He/She is someone who has the situational awareness to sense what weather it is now and who – by taking into account the
weather it has been in the past (an hour ago, last week, same time last year, …) – will be able to develop a kind of feeling for the
weather he is facing in the (near) future. The design of his clothes should be such that without changing his outfit should allow him to
cope with hot and cold, dry or wet weather. The material should be GORE-TEX®-like, since that fabric allows sweating (warmth
release) but also protects for cold (warmth collecting); it is also impermeable enough to protect for the rain, but still it is light enough
not to hinder free movement. Besides, featuring all these qualities it still is fashionable and appealing. Bringing this Gore-Tex
metaphor to the field of reliability studies and organizational reliability, we state that organizations should be more Gore-Tex-like in
their design and more mountain hiker-like in their behavior.

356 Two Cases in High Reliability Organizing: a Hermeneutic Reconceptualization
13 “The ideas about complex systems were not developed by any one field and were not accepted overnight. Indeed, they remain
controversial in some disciplines and in their application to some issues. These new ideas are all slightly different and there are no
bright lines between them. They include: complexity theory, chaos theory, complex adaptive systems, general systems theory,
nonlinear systems, self-organizing systems, and far-from-equilibrium systems” (Longstaff, 2003, p. 14).
14 For the record: the Information Technology Infrastructure Library (ITIL) which will be dealt with in the description on the Incident
Management Process, might be considered an example of such best-practices, although ITIL is more about a process-oriented
framework than a stress of good practices themselves.
15 Therefore it might be wiser to talk about ‘Lessons Observed’ instead of ‘Lessons Learned’.
16 It is quite interesting to see the parallel between absorbing downside complexity via requisite variety and Barnett and Pratt’s
(2000) autogenic crisis induction.
17 The key finding is that members of the organization deal with the problem of requisite variety by reducing a large number of
combat missions to a limited number of basic-action categories (i.e., 15 meta-scripts), with missions configured as particular
combinations of meta-scripts. Subsequently, each mission is accompanied by reliability feedback, also construed in terms of the
same metascripts, thus stimulating ongoing learning and resulting in continued development of available variety in operators. Jointly,
therefore, this strategy reduces inequalities of requisite vs. available variety by adjusting at both ends (Dov & Gil, 2003, p. 853).
18 We argue that variety tends to increase unless there is a dedicated policy to prevent this. Examples of such policies can be found
in big five consultant firms and other international high potential hiring companies who systematically are engaging the same
applicant profiles.
19 Boisot and Child refer to ‘organisms’ whereas we have narrowed this scope to ‘organizations’. We feel we are entitled to do so
because of these authors deal with organizations in the remainder of their article.
20 In case of the NPP the more accurate term is ‘Maintenance & Repair Process’. Although it fully corresponds with the notion of
incident management, it is not used because of the typicality of the term ‘incident’ in the nuclear energy industry where it has a
negative connotation. In Banking the term incident has a far more neutral meaning.
21 We use the label High Reliability Theory for sake of convenience. At this point we do not wish to make a statement in the
discussion on whether HRT is a theory or merely a metaphor or a school of thought - or like critics say: class(es) of thought.
22 Examples of complex systems include the weather and the spread of disease in a population (Longstaff, 2003, p. 15).
23 ‘The effect of adding something to the system (an infected person or the air disturbed by a butterfly flapping its wings) may
diffuse unevenly throughout the system because the other components of the system are not evenly distributed, or the force doing
the distribution is not equally strong throughout the system” (Longstaff, 2003, p. 15).
24 For a comparison: Simon (1962, p. 468) roughly describes system complexity as one made up of a large number of parts that
interact in a non-simple way.
25 Elsewhere we deal with the question whether HRT really is a theory in the scientific sense.
26 Plural High Reliability Organizations (HROs).
27 Another working definition can be found in Sullivan & Beach (2003): “A state that an organization seeks to achieve whereby the
attainment of specified requirements are consistently achieved through the expeditious use of its resources over time. These
organizations have a mean time between failure approaching infinity”.
28 The faculty members of the project team are T. R. LaPorte, K. H. Roberts, and G. I. Rochlin, University of California, Berkeley; D. M.
Rousseau, Northwestern University; and Karl Weick, University of Texas.(at that time) (Roberts & Rousseau 1989, p. 139).
29 We call them HRO archetypes.
30 This is in line with other but related research from the Weick branch on Loose Coupling. We refer to the Loose Coupling
Framework by Orton and Weick (Orton & Weick, 1990) and the voice of causation.
31 For example, Ichniowski, Shaw, and Prennushi (1997), in their study of the influence of HR practices (like) have found a positive
impact of these same constructs on organizational reliability.

Endnotes 357
32 Worth noting is that the mindfulness concept was first brought to maturity by Langer (Langer, 1989), something which is
acknowledged by the Michigan school (Weick et al., 1999).Remarkably, Langer, in her later writings (Langer & Moldoveanu, 2000),
does not refer to Weick.
33 Having the bubble. The bubble is U.S. Navy lingo for maintaining a big picture view of operations (Roberts & Rousseau 1989, p.
135).
34 “The data suggests there is some evidence for improving reliability, perhaps through organizational means. Three of the refineries
classified “more complex” experienced no RQs during the period 1993-97.All were operated by the same corporation. We do not
know if this is the result of some systematic and deliberate effort to under-report such accidents, or if other factors, possibly
organizational in nature are involved. Additional work is planned to determine if organizational factors were involved in the atypical
reliability of the three refineries” (p. 23). On my request for information (an e-mail to Eli Berniker), no answer has come.
35 We make a distinction between first generation authors like Rochlin, La Porte, Roberts, Schulman, Consolini and Weick; second
generation writers like Sutcliffe and Vogus, and third generation writers, like De Bruijne. Among this last category we put ourselves.
The first generation initiated HRO research, either at Berkeley or Michigan; the second generation still has direct and strong links
with the first generation – for instance because they are their former PhD students. The third generation has followed a trail
independent from the original thinkers, even though some have been brought in contact with them in a later stage of their ini tial
HRO research. The idiosyncrasy of the third generation is that they have the freedom to build on the work of their predecessors
without being intellectually tributary. Today, the three generations continue to publish simultaneously, not only resulting in an
eclectic mix of styles, approaches, domains and cases, but also in a cross-fertilization between them. This offers interesting
perspectives for an original and fundamental development of the discipline.
36 We do not imply that HRT scholars do not offensively defend the position the take when challenged by NAT scholars, but they
clearly have chosen a not-juxtaposing perspective to both approaches.
37 In this dissertation we use ‘SenseMaking’ in that spelling to discern it from the colloquial ‘sense making’.
38 In this respect, it should be mentioned that this thesis’ core is HRT, not SenseMaking. The limited elaboration of theory on
SenseMaking should be seen from that perspective.
39 This basic premise applied to all technologies is one of the basic building blocks of the Socio-Technical Systems (STS) approach
(Bostrom & Heinen, 1977, p. 18).
40 A common background in education, training, hiring policies and (organizational) culture will have something to do with this.
41 Substantial parts of this section are borrowed with permission from Muhren (2006).
42 Substantial parts of this section are borrowed with permission from Smals (2006).
43 These figures are based on the year 2004.
44 To put these numbers into perspective: in 2001, the average American household used about 10,000 kWh (0.01 GWh) in a year
[EIA, 2005].
45 The operational factor for the reactors over the period 1985-2005 averaged about 88%
46 For an elaboration of SenseMaking as an interpretive research methodology, we refer to research we have conducted in the
Democratic Republic of Congo (DRC). In the DRC, Development-aid organizations often face situations characterized by complexity
and uncertainty, with crises occurring anytime. These networked organizations need to make sense of their crisis environment inter-
and intra-organizationally. In a first paper (Muhren, Van Den Eede, & Van de Walle, 2008b) we attempt to reveal the "black box" of
information processing activities by relying on SenseMaking as a methodology and as the object of research. In particular, this
research aims at studying intuitive information processing activities in ongoing crisis situations, one of the most extreme c ontexts in
which discontinuity is the rule and continuity the exception. The authors argue that this SenseMaking approach offers valuable
insights for the design of information systems for crisis response and management (ISCRAM). This paper describes an interpret ive
case study methodology as it was applied to discover SenseMaking episodes in the daily work of humanitarian relief actors in the
ongoing crisis of the Democratic Republic of the Congo. In a second paper (Muhren, Van Den Eede, & Van de Walle, 2008a) we
addresses three research issues: Firstly, we use the theory of SenseMaking as a lens to study how organizations process information
inter-organizationally and intra-organizationally. Secondly, we identify the need of more sensible information systems to support
SenseMaking in crisis environments. Thirdly, we argue why the inverse of the journal title – i.e. Development for IT – bears some
promising perspectives for the expansion of the IS research discipline in the developed world as well. For this triple resear ch
objective, we take the extreme conditions under which humanitarian and development actions take place as a starting point. We

358 Two Cases in High Reliability Organizing: a Hermeneutic Reconceptualization
have used an interpretive approach to this research by interviewing senior managers of organizations for humanitarian aid and
development in the Democratic Republic of the Congo.
47 At the Bank we were assisted by Joris Hens, Geert Thoelen and Thomas Huyghe from Vlekho Business School and Willem Muhren
from Tilburg University. At the NPP we got the help from Koen Ceuppens (Vlekho Business School) and Raphaël Smals (Tilburg
University). All of them were master students preparing their master thesis in the HRT field under our primary (Vlekho Business
School) or secondary (Tilburg University) supervision.
48 In addition to the 19 and 23 interviews, respectively at the Bank and at the NPP, in total 9 more interviews were conducted with
the objective to study the degree and way of coupling in both organizations. This data is analyzed and discussed in the Epilogue to
this dissertation. As such these interviews are no inherent part of the research thread.
49 Idem.
50 For an elaboration of the use of GSS in this research/the Bank Case study, we refer to Rutkowski, Van de Walle and Van Den Ee de
(2006) in which we presented results from a field study at our Bank Case on the use of Group Support Systems (GSS) as a novel
approach to identify operational risks in the Bank’s Incident Management Process. Our research has lead to two important find ings.
First, we found that the use of GSS enables unique risks to reach a short-list of crucial risks to be managed by the Bank. Second, the
use of GSS allowed an isolated minority of senior managers to implicitly influence the decision of the group on the risk management
decision process. Parts from this title is taken from the same source.
51 The name ‘building blocks ‘ originated from the methodological approach we took to the writing of this thesis but was afterwa rds
confirmed by an article by Roberts and Bea (2001) where these authors also use the term ‘building blocks’ to denote what composes
the typicality of HROs
52 The necessity to get a ‘buy-in’ from the organizations in question was a constant preoccupation. Senior management continuously
asked for their ‘Return on Investment’: what will it cost them (especially in time) and what will they get back for it. The organizations
under study were triggered by the prospect of being presented a ‘photo of who they are’.
53 The complete data preparation logbook is available from the author upon simple request.
54 In this it resembles SenseMaking properties of retrospection, enactment etc.
55 This conclusion is supported by confirmatory factor analysis through Structural Equation Modeling (SEM) (Wijnen, Janssens, De
Pelsmacker, & Van Kenhove, 2002, p. 247), which results yielded no support for the theoretical underpinning of High Reliability
Theory or SenseMaking. Confirmatory factor demonstrated that the multidimensionality of High Reliability theory does not hold.
Data shows that a multidimensional theory, consisting out of five sub-constructs yield no better results than a single-construct one. A
testing of the constructs shows that multicollinearity between the items is extremely high. Confirmatory factor analysis
demonstrates that the construct of Deference to Expertise does not attribute to the model. Hence our choice not to totally rely on
the constructs as they are described in literature and not to build on confirmatory factor analysis, but to rely on exploratory factor
analysis in order to find those constructs that are best/better suited for use in our analysis.
56 Other researchers have built on these categories as well. Sullivan & Beach (2003), for instance, in their study on a conceptual
model to balance risk by HRO Success Factors stemming from these five categories.
57 Smart et al. (2003) illustrated how recent tragedies have been shown to be threatening to the medium-term sustainability of
organizations designed and developed solely on the basis of short-term efficiency gain.
58 The resulting hypothesized curvilinear relationship was supported by comprehensive worldwide data on 264 functional
departments of two multinational corporations.
59 For sake of completeness: A Type III error occurs whenever the right solution is given to the wrong problem. A Type IV error is
defined as "the incorrect interpretation of a correctly rejected hypothesis", comparable to "a physician's correct diagnosis of an
ailment followed by the prescription of a wrong medicine".
60 Original definition from Albert, S. & Whetten, D. (1985). Organizational Identity. In: Research in organizational behavior, V ol. 7,
pp. 263-295.
61 The other property is the use of plausibility as the fundamental criterion of SenseMaking (Weick et al. 2005).
Endnotes 359
62 Originally In: Gililand, S. W. & Day, D. V. (2000) Business management. F. T. Durso, ed. Handbook of Applied Cognition. Wiley, New
York, pp. 315–342. Mezias, J. M., W. H. Starbuck. 2003. Managers and their inaccurate perceptions: Good, bad or inconsequential?
British J. Management.
63 The other relevant elements of the structural dimension are discussed under the Deference to Expertise issue.
64 Note that this relates to Simon’s notion of nearly decomposable systems (1962).
65 One such experience was gained from an exercise for the Bank Case to build a multiple regression model capable of explaining
reliability. The outcome of this regression analysis is beyond the scope of this dissertation. It has been reported upon in a separate
internal memo.
66 Myers and McPHee found that one crew-level variable—crew reliability—affected and modified the influence of tenure,
proactivity, involvement, acculturation, and trust on members’ commitment.
67 Lin and Carley have observed more of an increase in resource-to-people links than in people-to-people links; whereas, most
researchers have focused on change in people-to-people links (Krackhardt and Stern 1988; La Porte and Consolini 1991) (Lin &
Carley, 2001).
68 In the same research, Lin and Carley also found that this kind of organizations “switched their designs toward more complex
designs, not necessarily more rigid designs. The number of restructurings in resource access structure is eight times as large as the
number of restructurings in organizational authority structure. This suggests that organizations are more likely to maintain existent
lines of communication and authority during crises but are more likely to restructure who has access to what and responsibility for
what. Of all the 69 organizations, only 31 did not alter either their organizational authority or resource access structures.” (Lin &
Carley, 2001)(p. 26-27).
69 What should be feasible however, is to compare the relative reliability of both processes, e.g. by normalizing the values for
reliability. But then again, this allows intra-case comparison, but no inter-case assessment.
70 We have reached a similar conclusion while conducting a linear regression analysis on the Bank data. Multicollinearity diagnostics
revealed that several independent variables were a linear function of other independent variables, in casu Commitment to Resilience
vis-à-vis the other HRT constructs.
71 In the NPP incidents are so rare that there is hardly something to learn from. The community of international nuclear product ion
facilities has found a way of sharing their experiences amongst each other. Another way of compensating for the lack of learning is
exercising by means of incident scenarios in a simulator setting.
72 http://www.css.edu/users/dswenson/web/TWAssoc/adhocracy.html
73 This is in line with other but related research from the Weick branch on Loose Coupling. We refer to the Loose Coupling
Framework by Orton and Weick (Orton & Weick, 1990) and the voice of causation.
74 With this ‘all-seasons’ denomination, we mean an organizational Gestalt that is capable of dealing with changing conditions in an
automatic or semi-automatic manner. One should compare such a design and behavior to an experienced mountain-hiker and his
gear. He/She is someone who has the situational awareness to sense what weather it is now and who – by taking into account the
weather it has been in the past (an hour ago, last week, same time last year, …) – will be able to develop a kind of feeling for the
weather he is facing in the (near) future. The design of his clothes should be such that without changing his outfit should allow him to
cope with hot and cold, dry or wet weather. The material should be GORE-TEX®-like, since that fabric allows sweating (warmth
release) but also protects for cold (warmth collecting); it is also impermeable enough to protect for the rain, but still it i s light enough
not to hinder free movement. Besides, featuring all these qualities it still is fashionable and appealing. Bringing this Gore-Tex
metaphor to the field of reliability studies and organizational reliability, we state that organizations should be more Gore-Tex-like in
their design and more mountain hiker-like in their behavior.
75 Weick recounting an incident that happened to a small Hungarian detachment on military maneuvers in the Alps (Weick, 1983, p.
48-49): “Their young lieutenant sent a reconnaissance unit out into the icy wilderness just as it began to snow. It snowed for two
days, and the unit did not return. The lieutenant feared that he had dispatched his people to their deaths, but the third day the unit
came back. Where had they been? How had they made their way? Yes, they said, we considered ourselves lost and waited for the
end, but then one of us found a map in his pocket. That calmed us down. We pitched camp, lasted out the snowstorm, and then with
the map we found our bearings. And here we are. The lieutenant took a good look at this map and discovered to his astonishment
that it was not a map of the Alps, but of the Pyrenees.”
76 For an elaboration on the concept of networked reliability see De Bruijne (de Bruijne, 2006)