Embed Size (px)
Citation preview
Coppedge, Alvarez, and Maldonado 1
Two Persistent Dimensions of Democracy: Contestation and Inclusiveness
Michael Coppedge,* Associate Professor, Department of Political Science,
University of Notre Dame, Notre Dame, IN 46556, [email protected]
Angel Alvarez, Director, Instituto de Estudios Políticos, Universidad Central de
Venezuela, Av. 1 Ed. RIGEL 52B Los Samanes, Caracas, 1081, Venezuela,
Claudia Maldonado, Coordinadora de la Maestría en Administración y Políticas
Públicas, Centro de Investigación y Docencia Económicas, A.C., Carretera
México-Toluca 3655, Col. Lomas de Santa Fe, 01210 México, D.F., México.
*contact author
The authors are grateful to the Helen Kellogg Institute for International Studies at
the University of Notre Dame for funding research assistantships; and to Robert
Dahl, Kenneth Bollen, Jan Teorell, Axel Hadenius, Pippa Norris, Carlos
Gervasoni, Mario Borelli; Arthur Banks, Freedom House, the Polity team, and the
other creators of the indicators we analyze; and our anonymous open-minded
referees.
Final copy of ms. 053006B, submitted to the Journal of Politics, March 6, 2008.
Coppedge, Alvarez, and Maldonado 1
Abstract Because democracy is central to much comparative and international political research, it
is crucial for political scientists to measure it validly. We challenge the common
assumption that most existing indicators of democracy measure the same single
dimension. We present eleven different streams of evidence to show that about three-
quarters of what Polity, Freedom House, and other indicators of democracy have been
measuring consists of variation on the two dimensions of democracy that Robert Dahl
proposed in Polyarchy – contestation and inclusiveness. These two dimensions were
consistently fundamental to the most commonly used indicators of democracy from 1950
to 2000. Our analysis produces new indicators of contestations and inclusiveness for most
countries from 1950 to 2000.
Two Persistent Dimensions of Democracy: Contestation and Inclusiveness There has been increasing quantitative research on the causes of democratization
(Boix 2003; Geddes 2003; Huntington 1991; Lipset, Seong, and Torres 1993;
Mainwaring and Pérez-Liñán 2005; Muller 1995; O'Loughlin et al. 1998; Przeworski et
al. 1996) and on its consequences, from economic outcomes (Boix 2003; Przeworski et
al. 2000) to the democratic peace (Enterline and Greig 2005; Maoz and Russett 1992).
All of this research requires quantitative indicators of democracy that measure democracy
validly (Munck and Verkuilen 2002). Part of valid measurement is the proper alignment
of the theoretical dimensions of democracy with its empirical dimensions. Democracy is
almost certainly multidimensional, and existing indicators almost certainly focus
attention only on selected aspects of the whole concept while neglecting others
(Coppedge 2002). But which dimensions have been measured, and which indicators
measure which ones? We demonstrate that three-quarters of what the most commonly
used indicators of democracy have been measuring is variation on Robert Dahl’s two
dimensions of polyarchy – contestation and inclusiveness (Dahl 1971 4).
Aligning theoretical and empirical dimensions is important for sound
measurement, and therefore for empirical research employing those measurements. If a
researcher assumes that a phenomenon varies along just one dimension but then
constructs a single indicator of it by adding together some indicators of one dimension
and some indicators from another dimension, she increases measurement error, which
makes the phenomenon appear to be harder to explain than it should be and makes it
appear to have less of an impact on other outcomes than it actually does. And because the
extra empirical dimensions in the data create systematic measurement error, they bias the
Coppedge, Alvarez, and Maldonado 2
interpretation of any findings that may emerge. Such measurement error has been shown
to contaminate the Polity index (Gleditsch and Ward 1997). On the other hand, if a
researcher supposes the phenomenon to be multidimensional and creates a separate
indicator for each dimension, yet empirically those indicators are unidimensional, then
collinearity will make it practically impossible to distinguish one from another (Bollen
and Grandjean 1981). This problem applies to Freedom House, which annually publishes
separate indices of “political rights” and “civil liberties” that are always correlated at
upwards of 0.90. The same situation prevailed in Bollen’s indicators of “popular
sovereignty” and “political liberty” (Bollen 1980): in the most rigorous examination of
dimensions of democracy to date, Bollen and Grandjean demonstrated that these two
indicators were unidimensional, and were therefore better combined into a single
indicator of “liberal democracy” (Bollen and Grandjean 1981). Here, using a larger set of
variables, we identify two dimensions of democracy as Dahl’s contestation and
inclusiveness.
The identification of these two dimensions grounds them firmly in democratic
theory. “Polyarchy” was Dahl’s term for real-world approximations of true democracy,
which he considered an unattainable ideal-type regime in which governments would be
completely responsive to the will of their citizens (Dahl and Lindblom 1953). Although
“polyarchy” has not displaced “democracy” in the political science lexicon, it has become
one of the most familiar standards for democracy. Dahl defined polyarchy as the
existence of eight institutional guarantees: freedom of organization, freedom of
expression, the right to vote, broad eligibility for public office, the right to compete for
Coppedge, Alvarez, and Maldonado 3
support and votes, the availability of alternative sources of information, free and fair
elections, and the dependence of public policies on citizens’ preferences.
However, he also argued that these eight guarantees corresponded to two
underlying dimensions -- contestation and inclusiveness. There is contestation when
citizens “have unimpaired opportunities. . . 1. To formulate their preferences, 2. To
signify their preferences to their fellow citizens and the government by individual and
collective action, 3. To have their preferences weighed equally in the conduct of the
government…” (Dahl 1971 2). Inclusiveness is variation “in the proportion of the
population entitled to participate on a more or less equal plane in controlling and
contesting the conduct of the government. . .” (Dahl 1971 4). His identification of these
two dimensions was both a conceptual and an empirical claim. Conceptually, it was a
claim that there is a logical or definitional correspondence between the eight institutional
guarantees and either, or both, of these two dimensions. For example, freedom of
expression logically corresponds primarily to the aspects of contestation that involve
unimpaired opportunities to formulate and signify preferences; the right to vote logically
corresponds to the proportion of the population entitled to participate, or inclusiveness.
Some guarantees correspond to both. For example, holding elections both allows
contestation to occur and includes more of the population in important decisions. What
matters is that these guarantees can be understood as reflections of these two dimensions,
rather than dimensions that are not part of polyarchy, such as economic efficiency.
Dahl’s empirical claim was that the defining components of polyarchy reflect
these dimensions not only conceptually, but also empirically. That is, indicators of
democracy that primarily measure inclusiveness should vary together, indicators that
Coppedge, Alvarez, and Maldonado 4
primarily measure contestation should vary together, and some indicators of democracy
may vary with both kinds, but the indicators of inclusiveness should covary less with
indicators of contestation than they do with one anothe r, and vice versa. It is useful to
reduce polyarchy to these two dimensions only if these expected patterns of empirical
association are correct. For example, it makes sense to combine indicators of the right to
vote and broad eligibility for public office into the dimension of inclusiveness only if
countries that have extensive suffrage also allow most adult citizens to run for public
office, and if countries that restrict eligibility for public office also tend to restrict the
suffrage. If this empirical relationship is strong, these two institutional guarantees are
empirically unidimensional; otherwise, they are more usefully treated as lying on separate
dimensions. Similarly, many other indicators should be primarily associated with
contestation. For example, countries that guarantee freedom of organization would also
hold competitive elections; those that censor the media would also ban political parties;
and so on. But Dahl speculated that “contestation and inclusiveness vary somewhat
independently” (Dahl 1971 4), and therefore contestation and inclusiveness are best
treated as two separate dimensions.
Also implicit in Dahl’s claim was the assumption that these two dimensions are
generally fundamental, i.e., not artifacts of a particular year or world region, and not
disturbed when particular countries change, becoming more democratic or less so. This
claim is implied by his references to variation in contestation and inclusiveness “both
historically and at the present time” (Dahl 1971 4) and in “the 140 nominally independent
countries existing in 1969” (Dahl 1971 11), and his use of examples from the eighteenth
century to the 1960s.
Coppedge, Alvarez, and Maldonado 5
If it is useful to speak of dimensions of contestation and inclusiveness, the
dimensions must make conceptual sense and be empirically sound. The truth of one does
not imply the truth of the other. Conceptual distinctions and similarities that seem to be
perfectly logical can turn out to be hard to reconcile with empirical evidence, and robust
empirical associations sometimes have no defensible conceptual interpretation.
Dahl made influential arguments for his theoretical dimensions that need not be
repeated here (Dahl 1971; Dahl 1989); this article tests the claims about empirical
dimensions. For Dahl’s empirical conjecture to be true, three interrelated empirical
claims must hold: that some aspects of democracy covary along a dimension of
contestation, that other aspects covary along a relatively independent dimension of
inclusiveness, and that these relationships are extensive in time and space and robust to
the fluctuations of individual countries. Thus, it is easy to imagine hypothetical situations
that would falsify them. For example, all of Dahl’s institutional guarantees could vary
independently, or they could be more usefully grouped into three dimensions (such as
inclusiveness, political rights, and civil liberties) rather than two, into one dimension of
democracy, or into alternative dimensions, such as decentralization and individualism,
that have nothing to do with regimes. In any dimensional analysis of democracy
indicators that contain measurement error, it is also hypothetically possible to identify
dimensions that are not related to democracy, such as state capacity, geographic
proximity, cultural affinity, or ideological orientations. It is also conceivable that any of
these patterns of covariation could turn out to be a statistical fluke due to a temporary
alignment of certain countries at a certain point in time.
Coppedge, Alvarez, and Maldonado 6
Data requirements have made rigorous testing of these empirical implications
difficult. A test of the number and nature of dimensions in democracy (or polyarchy)
requires many different indicators of democracy that capture different aspects of
democracy, measured for many countries, ideally over a long period of time. One project
that partially tested this relationship was Coppedge and Reinicke’s Guttman scalogram
analysis of polyarchy, which confirmed that four indicators of contestation – fair
elections, freedom of organization, freedom of expression, and media pluralism – were
unidimensional and lay on a different dimension from the breadth of the suffrage
(Coppedge and Reinicke 1990). However, their suffrage indicator was a single variable,
which was insufficient to confirm the unidimensionality of various aspects of
inclusiveness. Also, although this study used a large sample, it used data from 1985 only
and therefore could not establish that the unidimensionality of contestation was consistent
over time. A study by Bollen and Grandjean found that six indicators of democracy circa
1960 were unidimensional (Bollen and Grandjean 1981). They were more likely to detect
only one dimension because their set of indicators was not as comprehensive as ours. Our
analysis includes 13-15 indicators of democracy, compared to their six, which makes
multiple dimensions more likely. Our study also covers the world more comprehensively:
we analyze up to 191 countries rather than Bollen and Grandjean’s 113, and we cover
1950-2000 rather than just 1960.
This exercise was made possible by valuable data compilations by Kenneth
Bollen, Pippa Norris, and the Quality of Government Institute (Bollen 1998; Norris 2005;
Teorell, Holmberg, and Rothstein 2006). These comprehensive databases are in most
ways ideal for our inquiry on democracy’s dimensionality. 1 Because not all variables
Coppedge, Alvarez, and Maldonado 7
have measurements for most countries and all of the years represented in the dataset, we
confine our analysis to three overlapping subsets taken from these compilations. The first
is a set of 13 variables for the period 1950-1971; the second set includes 15 variables for
1972-1988; and the third includes 14 variables covering 1981-2000. The variables and
their sources are listed in the appendix and their coding criteria are described below.
Methodology
If Dahl’s conjecture that there are two dimensions of polyarchy is correct, and if
some of the best existing indicators do a good job of capturing some aspects of both
dimensions of polyarchy, then exploratory factor analysis should identify these two
underlying dimensions. This is true even if some or all of the indicators also measure
some other aspects of democracy and even if they contain some random error. Factor
analysis seeks to define the latent variables that could most efficiently predic t a set of
actual variables. Exploratory factor analysis is often regarded as more of an art than a
science for two reasons. The first is that it does not identify a unique factor: any linear
transformation of a factor (a “rotation”) would be associated with the variables equally
well. The factor analyst therefore exercises discretion in choosing a rotation. The second
reason for considering this process an art is that the underlying dimension is latent, and is
therefore subject to interpretation by the analyst.
The standard solution to the problem of subjective interpretation is to use
confirmatory, rather than exploratory, factor analysis. Confirmatory factor analysis
(CFA) defines a priori the nature of the latent dimensions to be measured and proposes a
hypothesis about which variables will be most useful for measuring each dimension. This
hypothesis is then tested, and it can be tested against alternative hypotheses. This
Coppedge, Alvarez, and Maldonado 8
procedure makes the most of strong conceptual guidance, which is a good practice as
long as the concepts are valid and useful. But sometimes conceptualizations are
misleading. Researchers can have misguided notions about what their variables measure
and how they may be most efficiently and naturally combined into indicators of an
underlying dimension. When researchers question their pre-conceived notions and guess
the correct alternative, they can use CFA to test for the error empirically. But CFA does
not require the researcher to question initial assumptions and certainly does not guarantee
that a superior alternative, rather than a straw man, will be tested.
In such situations, it can be more fruitful to use exploratory factor analysis, which
has complementary strengths and weaknesses (DeVellis 2003 132-33). An exploratory
analysis offers only weak guidance about how to interpret the dimensions that it
produces, but it wears no conceptual blinders that might prevent the researcher from
detecting the empirically most natural dimensions contained in the data. In fact, it is a test
of one particular grouping of variables into dimensions against all other possible
groupings. If any unidimensional hypothesis were superior, the Eigenvalue of the second
dimension would be less than one; if a third or more dimensions were justified, their
Eigenvalues would be greater than one. And although variables could be grouped
differently on the same number of dimensions, any such solution would be less efficient.
For some purposes, therefore, it is more useful to explore than to confirm, provided that
one has the means to interpret what one discovers during the exploration.
The kind of factor analysis we used is principal components analysis, so we will
refer to the dimensions as “components” and the factor loadings as “component weights.”
We chose an oblique rotation, which allows the two dimensions to be correlated while
Coppedge, Alvarez, and Maldonado 9
helping align the component weights of the input variables to vertical and horizontal axes
and therefore makes it more likely that a natural interpretation for the dimensions can be
found.2 Our preliminary analyses used as many variables as possible that had some
observations in over ninety percent of the years in the period of observation. Our final
analyses, however, include only those variables that consistently loaded on a component
with several other variables, enabling us to interpret the dimension with confidence. The
results were very comparable either way. After trimming the list of variables and
countries in this way, our analysis identified more than two components only in 1953,
1954, and 1993; two and only two components were present in exploratory analyses for
the other 48 years.3 The replacement of missing values with means did not alter the
results. To be certain of this, we replicated our analysis using listwise deletion. The
correlations between the two sets of estimates were at least .98 for each year.
Interpreting the Dimensions: An Example for 1985
The next two sections report eleven different streams of evidence that confirm
Dahl’s conjecture. In this section we present evidence that is best illustrated by focusing
on a typical year. In the subsequent section, we use evidence from the whole 1950-2000
period. Although no single piece of evidence is definitive proof that we have measured
Dahl’s two dimensions, it is difficult to imagine any alternative interpretation of these
dimensions that would be consistent with all of this varied evidence.
We performed a separate principal components analysis for each year in our three
periods. In this section we first present results for a typical year, 1985, so that the
meaning and basic parameters of our estimates become familiar to readers. Our
illustration using the 1985 data shows that five streams of evidence converge on our
Coppedge, Alvarez, and Maldonado 10
interpretation: 1) exploratory principal components analysis identifies two components,
2) the indicators loading on each component are easily interpreted as indicators of
contestation and inclusiveness, 3) countries known to have one of the three classic
regimes (democratic, totalitarian, or authoritarian) also have the mix of contestation and
inclusiveness that corresponds to those regime types, 4) our component scores are highly
correlated with the best existing indicators of contestation and inclusiveness, and 5) per
capita GDP predicts our contestation component scores the same way it predicts other
democracy indicators that primarily reflect contestation.
1. There are two components.
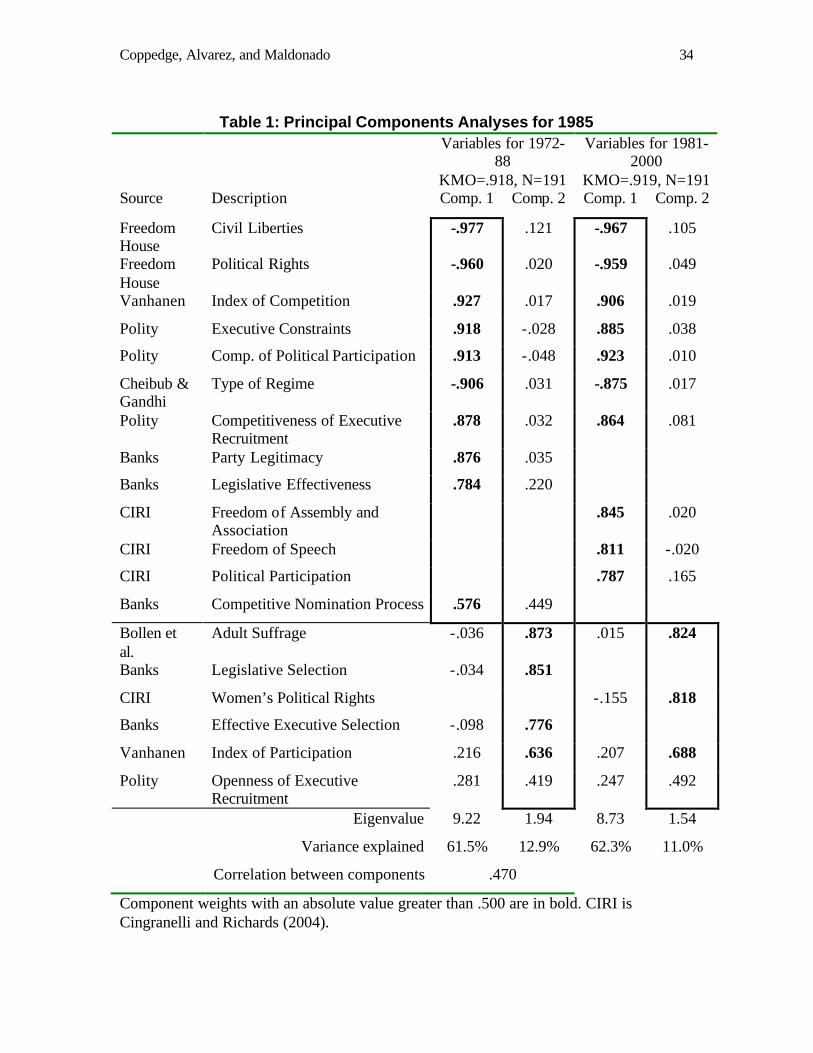
Table 1 displays the component weights associated with each of the indicators
used in the analysis of 191 countries for 1985 and some other statistics evaluating the
analysis. Two sets of analysis are reported because 1985 was included in both the second
and third periods. The KMO measure of sampling adequacy is .917 or better, well above
the conventional threshold of .800, indicating that there is a healthy ratio of the number
of indicators to the number of components extracted. The first component accounts for 62
percent of the covariance among the indicators and the second component accounts for
another 11-13 percent of the covariance. Only two components have an Eigenvalue
greater than one when these variables are analyzed, with very few exceptions.
[Table 1 about here]
2. The components are contestation and inclusiveness.
The component weights in Table 1 are analogous to the multiple regression
coefficients that would be obtained if each indicator were regressed on both of the latent
components listed in the table. The greater the absolute value of the component weight,
Coppedge, Alvarez, and Maldonado 11
the greater the contribution of the component to the indicator in question. For example,
Component 1 contributes a great deal to Party Legitimacy but Component 2 contributes
very little; Component 2 contributes much to Legislative Selection but Component 1 does
not; and both components contribute to Competitive Nomination Process. Table 1
therefore shows that, in each analysis, ten indicators are primarily associated with
Component 1 and four or five are associated primarily with Component 2.
By examining the grouping of indicators closely to see what they have in
common, we can make inferences about the nature of the dimensions that the components
represent. We interpret the first component as an indicator of Dahl’s contestation
dimension, All of the indicators that loaded heavily on the first component are indicators
of one or more of the institutional guarantees involving contestation. Freedom House’s
indices of Civil Liberties and Political Rights reflect the individual and collective
freedoms that are necessary for formulating and signifying preferences and having them
count equally via elections. Freedom House Civil Liberties ostensibly takes into
consideration media pluralism, judicial protection of the freedoms of speech and the
press, repression of government critics, and violations of civil rights.4 Freedom House
Political Rights ostensibly takes into account the existence of elections and competing
parties, the protection of the right to compete in elections, structural unfairness in
elections, and disruptions of elections by coups or fraud. Vanhanen’s Index of
Competition is the percentage of the vote won by opposition parties, which signify
preferences and give them weight in the legislative process. Gurr’s Executive Constraints
measures presidential powers ranging from unlimited authority to full separation of
powers, an independent judiciary, and strong checks and balances. It therefore reflects the
Coppedge, Alvarez, and Maldonado 12
multiplicity of institutional actors that could check an otherwise monolithic executive.
Gurr’s Competitiveness of Political Participation reflects degrees of electoral
competition, from suppressed competition to inter-party competition. Cheibub and
Gandhi’s Type of Regime is an update of the Alvarez et al. dictatorship-democracy
dichotomy. The latter authors wrote that “We focus on contestation. Our purpose is to
distinguish regimes that allow some, even if limited, regularized competition among
conflicting visions and interests from those in which some values or interests enjoy a
monopoly buttressed by a threat or the actual use of force” (Alvarez et al. 1996 4). Gurr’s
Competitiveness of Executive Recruitment is a trichotomous variable that indicates
whether executives are competitively elected rather than appointed. Party Legitimacy
contrasts situations in which all parties are allowed to compete from situations in which
some or all opposition parties are banned. Legislative Effectiveness is a scale of the
legislature’s ability to check the executive.
The next three variables were all coded by Cingranelli and Richards from the
State Department’s Country Reports on Human Rights Practices. Freedom of Assembly
and Association reflects citizens’ actual, rather than formal, right “to assemble freely and
to associate with other persons in political parties, trade unions, cultural organizations, or
other special- interest groups” (Cingranelli and Richards 2004 21). Freedom of Speech
“indicates the extent to which freedoms of speech and press are affected by government
censorship, including ownership of media outlets” (Cingranelli and Richards 2004 16).
Despite its name, Political Participation is a quintessential contestation variable. It
reflects the extent to which “citizens enjoy freedom of political choice and the legal right
and ability in practice to change the laws and officials that govern them” (Cingranelli and
Coppedge, Alvarez, and Maldonado 13
Richards 2004 3). Banks’s Competitive Nomination Process reflects both dimensions
about equally. It explicitly refers to competition, yet it has necessary implications for
inclusiveness, because the selectorate must be small where nominations are not
competitive and larger where they are. The fact that these indicators all load more
heavily on Component 1 suggests that it measures the ability of citizens to gather
independent information, band together in groups such as parties, compete in elections
free of government interference, influence the selection of the executive, and have their
interests and rights protected by courts and legislative representatives. It would be hard to
ask for a better definition of contestation.
We interpret the second component as an indicator of Dahl’s inclusiveness
dimension. The variable that loads most heavily on this dimension is also the most literal
interpretation of inclusiveness: Adult Suffrage measures the percentage of adult
population over 20 years of age that has the right to vote in national elections. But our
broader concept of inclusiveness also captures the size of the group – the selectorate –
that chooses the executive or the legislature and holds them accountable (Bueno de
Mesquita et al. 2003). Much of the variation in this dimension reflects whether or not
elections are held. This makes sense because holding elections is a necessary condition
for having an extensive suffrage: even when elections are held with restricted suffrage,
the selectorate is more inclusive than any non-electoral selectorate, such as a royal family
or a military junta. As Dahl theorized, “The right to vote in free and fair elections, for
example, partakes of both dimensions. When a regime grants this right to some of its
citizens, it moves toward greater public contestation. But the larger the proportion of
citizens who enjoy the right, the more inclusive the regime” (Dahl 1971 4). For this
Coppedge, Alvarez, and Maldonado 14
reason, the best theoretical guidance suggests that the inclusiveness and contestation
dimensions should be correlated rather than completely independent. Legislative
Selection applies this principle to legislatures by ranging from no legislature to indirectly
elected legislatures with a limited selectorate, to directly elected legislatures with the
largest selectorate. Next in line is Cingranelli and Richards’s Women’s Political Rights,
which reflects the inclusion of women in the rights to vote, run for office, hold
government positions, join political parties, and submit petitions. Banks’s Effective
Executive Selection can be seen as capturing the inclusiveness of the electorate for chief
executives, i.e., whether the selectorate is one person, a body of political elites, or a large
number of voters. Vanhanen’s Index of Participation is simply the percentage of the total
population that voted in the last election. Finally, Gurr’s Openness of Executive
Recruitment reflects the size of the selectorate for public offices, from hereditary
succession, to designation by an elite body, to competitive election.
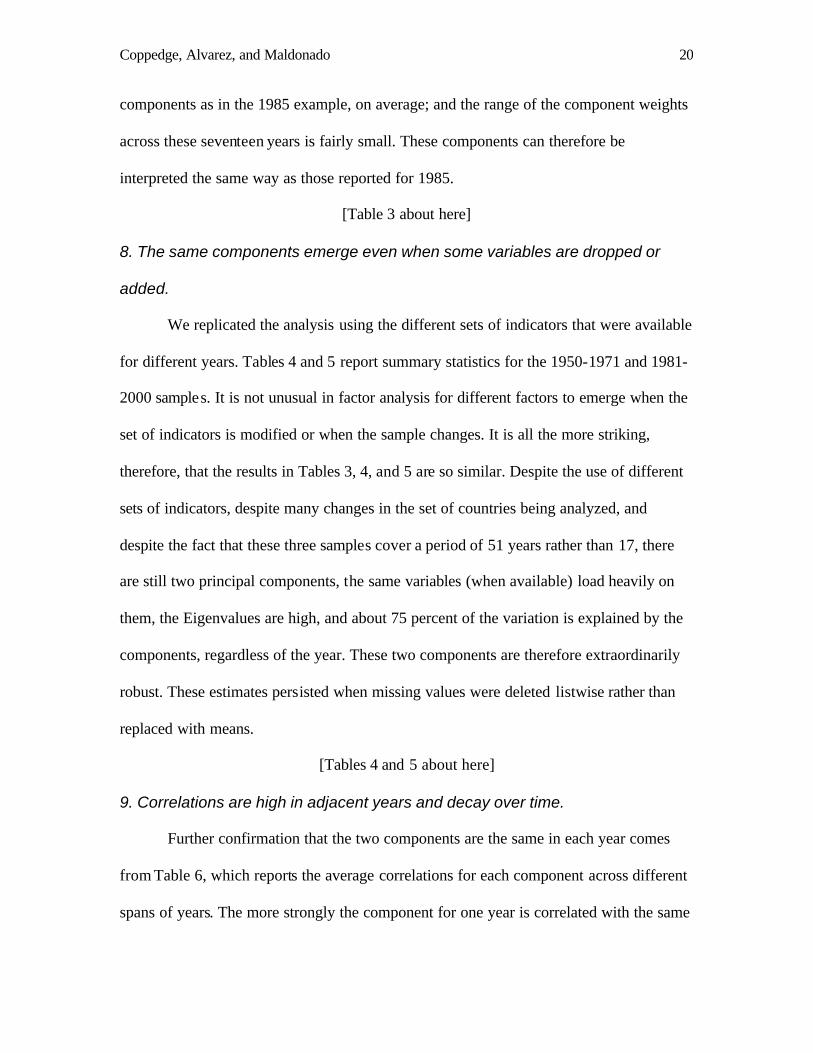
3. Known regimes are in appropriate locations.
Further evidence for the identification of these two components with Dahl’s dimensions
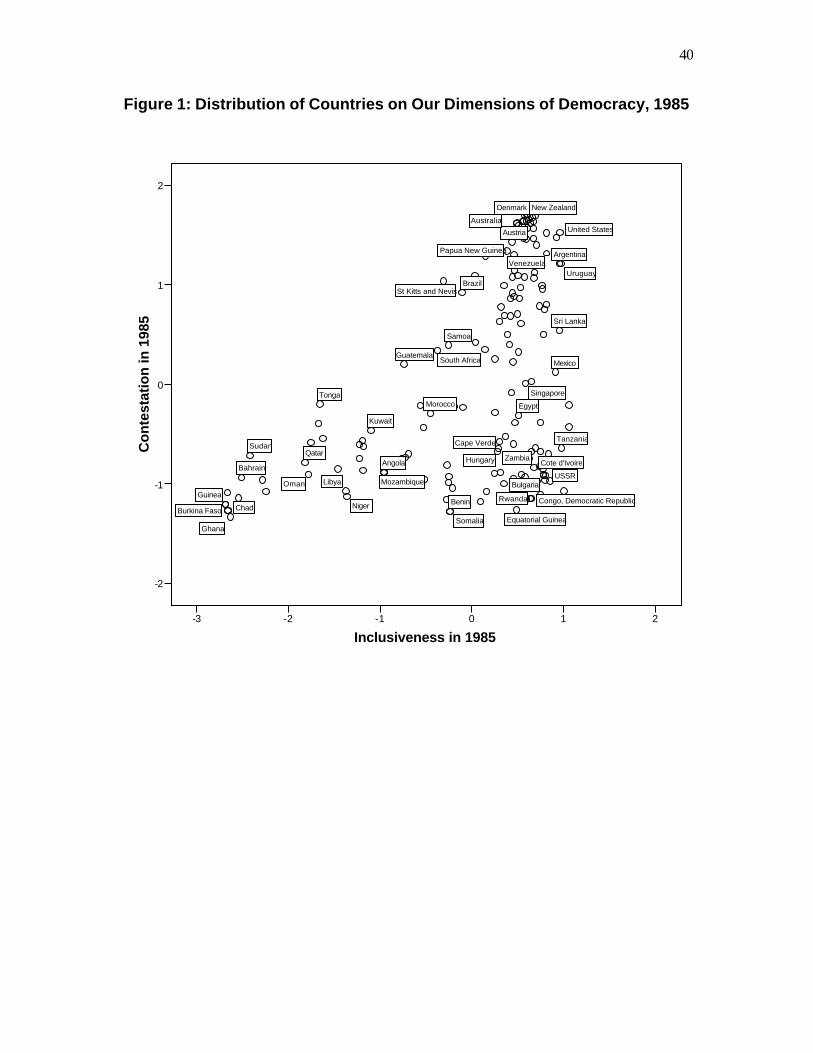
comes from a bivariate scatterplot of the component scores.5 The positions of countries as
of 1985 in this two-dimensional space reinforce our interpretation of the dimensions
measured by the components. The upper-right corner of the scatterplot contains nothing
but polyarchies. The fifteen countries closest to this pole (in order of increasing Euclidian
distance from the maximum values on both dimensions) are the United States, France,
Costa Rica, Italy, Sweden, Denmark, Finland, Austria, Norway, Venezuela, West
Germany, Belgium, Greece, Switzerland, and New Zealand. These countries are located
on different continents, have both parliamentary and presidential constitutions, two-party
Coppedge, Alvarez, and Maldonado 15
and multiparty systems, and vary in levels of economic development. What they have in
common is polyarchy. Polyarchies should be located in a corner corresponding to a high
degree of inclusiveness and a high degree of contestation. If the vertical axis is
contestation and the horizontal axis is inclusiveness, then these polyarchies are where we
would expect them to be.
[Figure 1 about here]
In the lower left of Figure 1 there are two types of cases – authoritarian regimes
without elections (as of 1985) and traditional monarchies. The fifteen countries closest to
this pole are Chad, Burkina Faso, Ghana, Central African Republic, Guinea, Nigeria,
Saudi Arabia, Bangladesh, Bahrain, Ethiopia, Mauritania, Sudan, Oman, Qatar, and the
United Arab Emirates. If our two dimensions are contestation and inclusiveness, the
lower left is exactly where one would expect to find such authoritarian regimes. These
regimes are low on inclusiveness, as they exclude most of the population from
participation in political life. In fact, some have argued that one of the raisons d'etre of
bureaucratic-authoritarian regimes was to exclude the popular sector from politics
(O'Donnell 1973). Another defining characteristic of authoritarian regimes is their limited
pluralism (Linz 1964; Linz 1975). So it is clear that nonelectoral authoritarian regimes
should be rated as non- inclusive and non-competitive. The lower left of Figure 1 is
therefore the appropriate zone for them. (Authoritarian regimes with elections tend to be
found in the center and center-right of the figure, reflecting considerably greater
inclusiveness and a bit more contestation.) The presence of traditional monarchies in this
same zone makes good sense because such regimes are indeed exclusionary (monarchs
and their advisors are unelected) and have limited pluralism: some organizations, even at
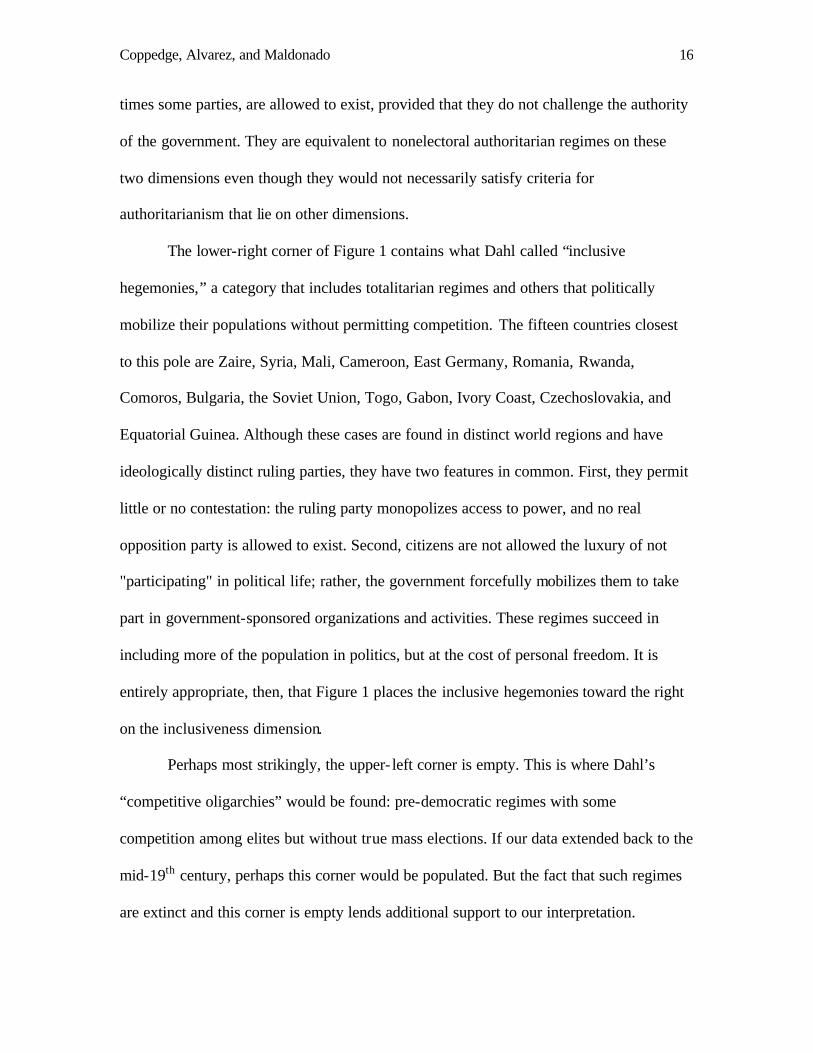
Coppedge, Alvarez, and Maldonado 16
times some parties, are allowed to exist, provided that they do not challenge the authority
of the government. They are equivalent to nonelectoral authoritarian regimes on these
two dimensions even though they would not necessarily satisfy criteria for
authoritarianism that lie on other dimensions.
The lower-right corner of Figure 1 contains what Dahl called “inclusive
hegemonies,” a category that includes totalitarian regimes and others that politically
mobilize their populations without permitting competition. The fifteen countries closest
to this pole are Zaire, Syria, Mali, Cameroon, East Germany, Romania, Rwanda,
Comoros, Bulgaria, the Soviet Union, Togo, Gabon, Ivory Coast, Czechoslovakia, and
Equatorial Guinea. Although these cases are found in distinct world regions and have
ideologically distinct ruling parties, they have two features in common. First, they permit
little or no contestation: the ruling party monopolizes access to power, and no real
opposition party is allowed to exist. Second, citizens are not allowed the luxury of not
"participating" in political life; rather, the government forcefully mobilizes them to take
part in government-sponsored organizations and activities. These regimes succeed in
including more of the population in politics, but at the cost of personal freedom. It is
entirely appropriate, then, that Figure 1 places the inclusive hegemonies toward the right
on the inclusiveness dimension.
Perhaps most strikingly, the upper- left corner is empty. This is where Dahl’s
“competitive oligarchies” would be found: pre-democratic regimes with some
competition among elites but without true mass elections. If our data extended back to the
mid-19th century, perhaps this corner would be populated. But the fact that such regimes
are extinct and this corner is empty lends additional support to our interpretation.
Coppedge, Alvarez, and Maldonado 17
In short, Figure 1 provides one kind of confirmation of the validity of our
interpretation of the dimensions of democracy measured by the two principal
components. If Component 1 reflects contestation and Component 2 reflects
inclusiveness, then we would expect to see democracies in the upper right, inclusive
hegemonies in the lower right, and the most authoritarian regimes at the lower left. And
we do. It is difficult to imagine any alternative interpretation of the components that
would match this distribution of cases.
4. Our component scores correlate appropriately with the best measures of the
corresponding dimensions.
Another stream of evidence that confirms the validity of our interpretation of
these dimensions is their association with known indicators of contestation and
inclusiveness. The Coppedge-Reinicke Polyarchy Scale is the best indicator of
contestation for 1985 in two ways (Coppedge and Reinicke 1990). First, it was designed
to operationalize Dahl's concept of polyarchy; in fact, Dahl himself initiated the project
and hired Coppedge and Reinicke to carry it out for this express purpose. Their coding
criteria self-consciously used Dahl's eight institutional guarantees as the point of
departure. Second, the Polyarchy Scale confirmed the unidimensionality of the items that
went into its construction. As noted above, this analysis confirmed that four of the
component items combine to measure contestation and that a fifth item – the extent of the
suffrage – lies on a different dimension, which would most likely be inclusiveness.
Therefore, if our first component for 1985 correlates more strongly with the Polyarchy
Scale (which measures only contestation) than with the suffrage item, it is probably
capturing the contestation dimension of polyarchy; and if the second component fo r 1985
Coppedge, Alvarez, and Maldonado 18
correlates more strongly with the Coppedge-Reinicke Suffrage item, then it is probably
capturing the inclusiveness dimension of polyarchy. This turns out to be the case. The
Polyarchy Scale correlates with our two estimates of contestation at .921 and .911, but
only at .376 and .330 with the estimates of inclusiveness; and the Coppedge-Reinicke
suffrage indicator correlates more strongly with our estimates of inclusiveness (.660 and
.576) than with our estimates of contestation (.318 and .316).
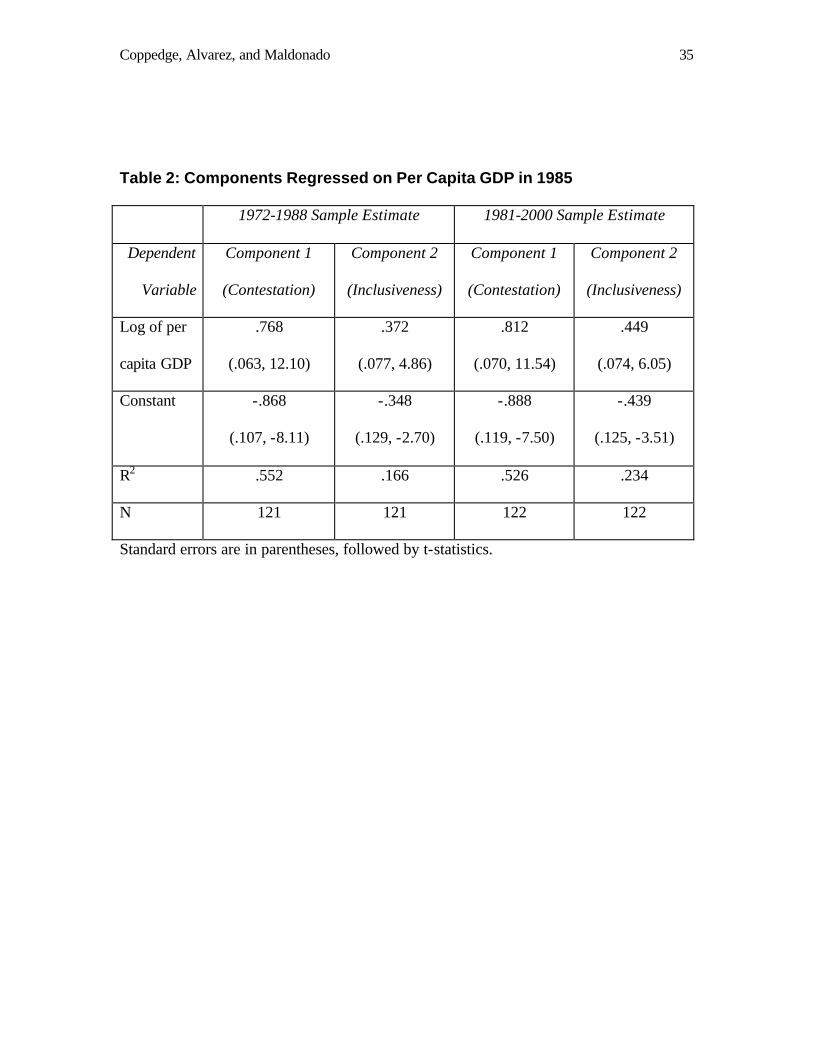
5. Income predicts Component 1 like it predicts known indicators of contestation.
Nomological/construct validation can be accomplished by examining the
relationship of these components with per capita GDP (Adcock and Collier 2001 542).
The logic of this test is that if the same things that explain other indicators of democracy
also explain these components, then they probably measure a very similar concept. It has
been well established that, in cross-national samples, democracy is associated with the
log of per capita GDP. (Debate and research are still ongoing about the reasons for this
association; our analysis requires only an empirical association.) But which dimension of
democracy is expected to be associated with per capita GDP: contestation or
inclusiveness? Expectations have not been precisely defined because a separate indicator
of inclusiveness has not existed. However, we believe that the strongest association
should be between per capita GDP and contestation, simply because the analyses that
gave rise to the generalization in the first place almost always employed indicators that
capture contestation more than inclusiveness. As Table 2 shows, this expectation is
correct: in our 1985 sample, logged per capita GDP is a significant predictor of
Component 1, which ostensibly measures contestation, and it is a less significant or
powerful predictor of our inclusiveness variable, component 2. (This opens up a new
Coppedge, Alvarez, and Maldonado 19
research agenda: What does explain inclusiveness well?) As with other democracy
indicators, ln(per capita GDP) explains more than unlogged per capita GDP.
[Table 2 about here]
Persistence over Time
All of the evidence so far has used data from a single year. Although we are
convinced that we can safely infer the existence of Dahl’s two dimensions for 1985, we
are more interested in the more general possibility that these same two dimensions
existed consistently over a period of decades. In this section we provide evidence that
contestation and inclusiveness were the two principal components of democracy every
year from 1950 to 2000. We offer six additional kinds of evidence: that 6) exploratory
principal components analysis returns two dimensions almost every year; 7) the same
indicators load most heavily on the same dimensions in each year; 8) the same two
components are extracted even when some indicators are dropped; 9) correlations are
high in adjacent years and decay over time; 10) in all years we observe the same tripolar
distribution of cases between the democratic, authoritarian, and inclusive-hegemony
poles; and 11) the same overall distribution prevails even when individual countries
change position within the distribution.
6 and 7. There are two dimensions in each year and the same variables load on
them consistently.
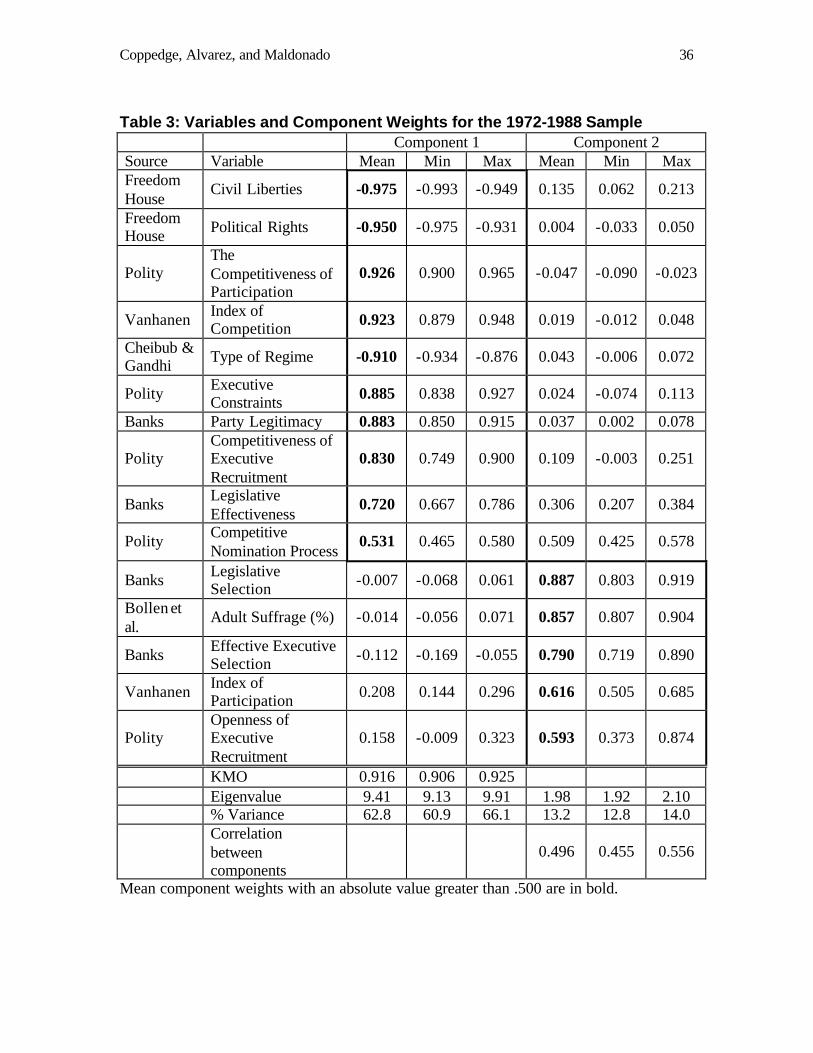
Table 3 reports the replications of the same principal components analysis
described for 1985, using data for the whole 1972-1988 period. In this period, the two
components together account for 76 percent of the variance, on average, and all the
Eigenvalues are 1.92 or greater. The same indicators load heavily on the same
Coppedge, Alvarez, and Maldonado 20
components as in the 1985 example, on average; and the range of the component weights
across these seventeen years is fairly small. These components can therefore be
interpreted the same way as those reported for 1985.
[Table 3 about here]
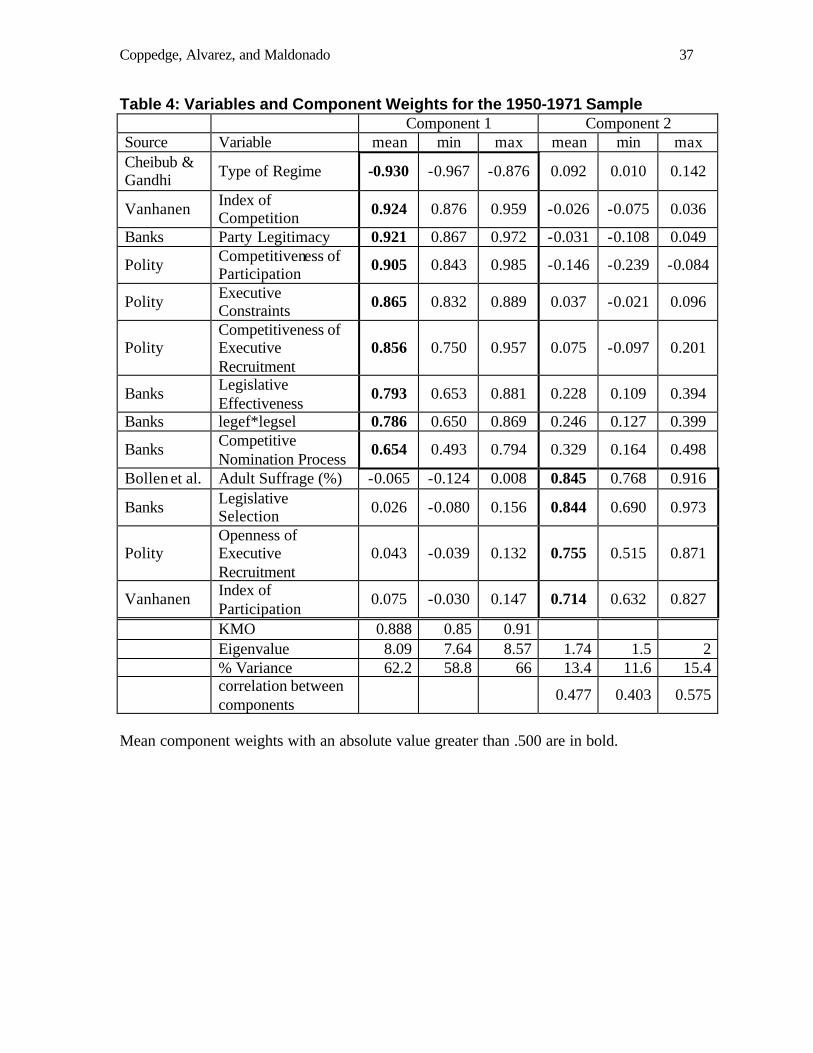
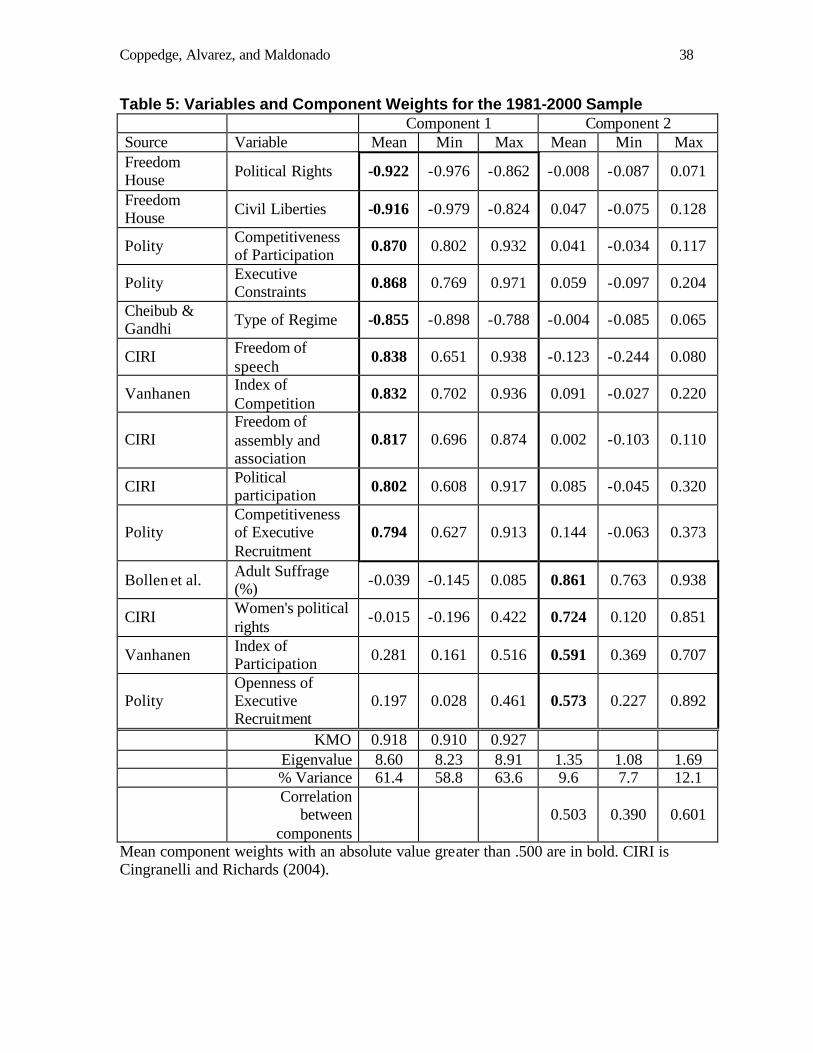
8. The same components emerge even when some variables are dropped or
added.
We replicated the analysis using the different sets of indicators that were available
for different years. Tables 4 and 5 report summary statistics for the 1950-1971 and 1981-
2000 samples. It is not unusual in factor analysis for different factors to emerge when the
set of indicators is modified or when the sample changes. It is all the more striking,
therefore, that the results in Tables 3, 4, and 5 are so similar. Despite the use of different
sets of indicators, despite many changes in the set of countries being analyzed, and
despite the fact that these three samples cover a period of 51 years rather than 17, there
are still two principal components, the same variables (when available) load heavily on
them, the Eigenvalues are high, and about 75 percent of the variation is explained by the
components, regardless of the year. These two components are therefore extraordinarily
robust. These estimates persisted when missing values were deleted listwise rather than
replaced with means.
[Tables 4 and 5 about here]
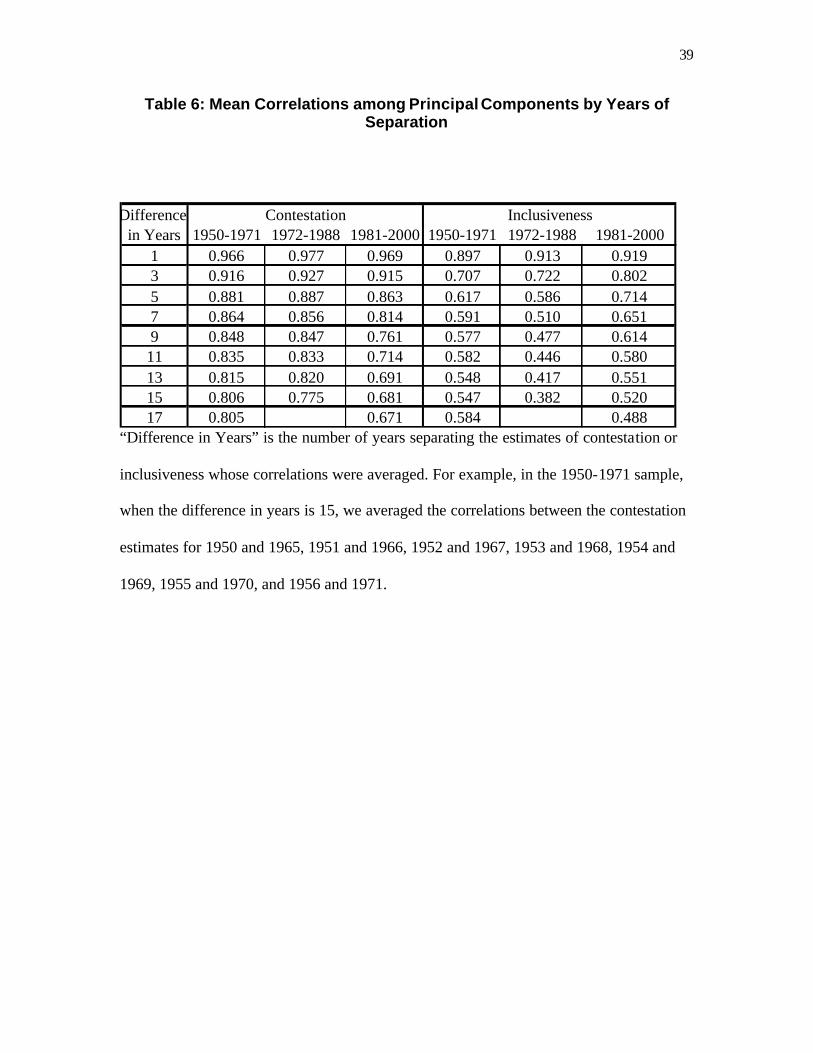
9. Correlations are high in adjacent years and decay over time.
Further confirmation that the two components are the same in each year comes
from Table 6, which reports the average correlations for each component across different
spans of years. The more strongly the component for one year is correlated with the same
Coppedge, Alvarez, and Maldonado 21
component for a different year, the more likely it is that the two components are
measuring the same dimension. One should not expect perfect correlations because many
countries change their degree of democracy from one year to the next. But if the
components are measuring the same dimension of democracy, then we would expect to
find very strong correlations in proximate years and weaker correlations in more distant
years. This is exactly the pattern found in Table 6: for each component, correlations in
adjacent years are always highest (albeit lower for Inclusiveness due to its greater
measurement error), and they diminish as time passes and countries change. It is doubtful
that anything but the close similarity of the dimensions being measured could produce
such high adjacent correlations and their gradual diminution over time.6
[Table 6 about here]
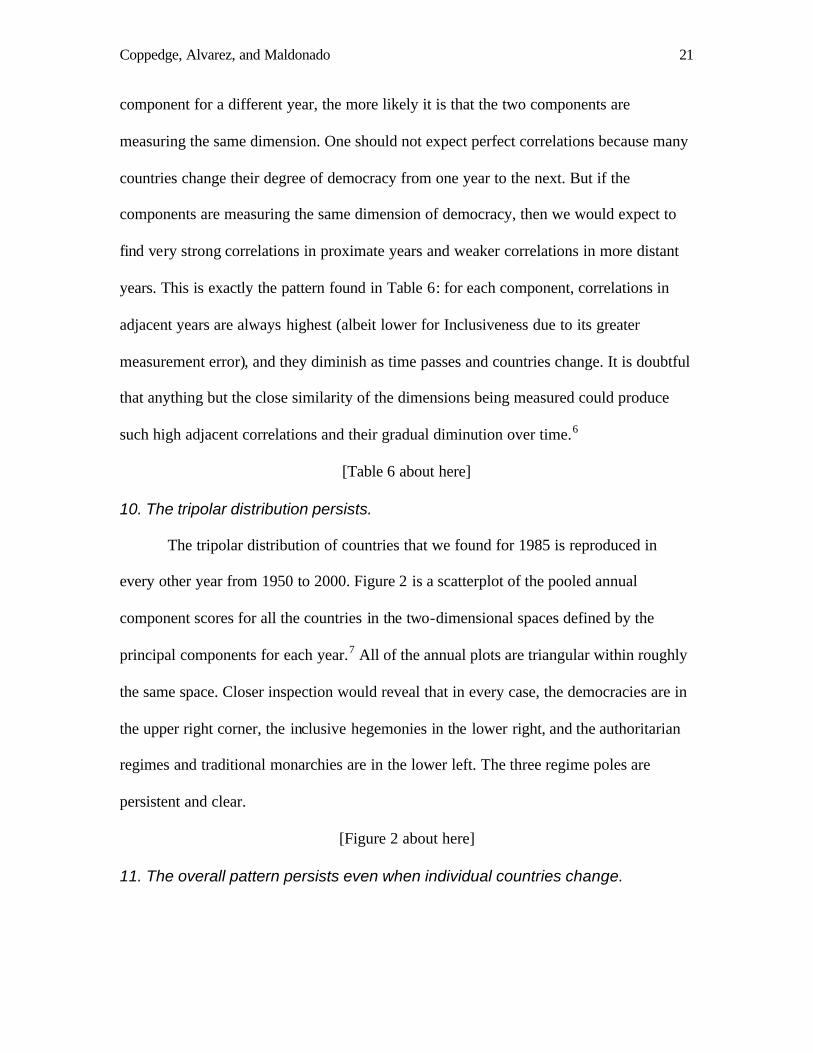
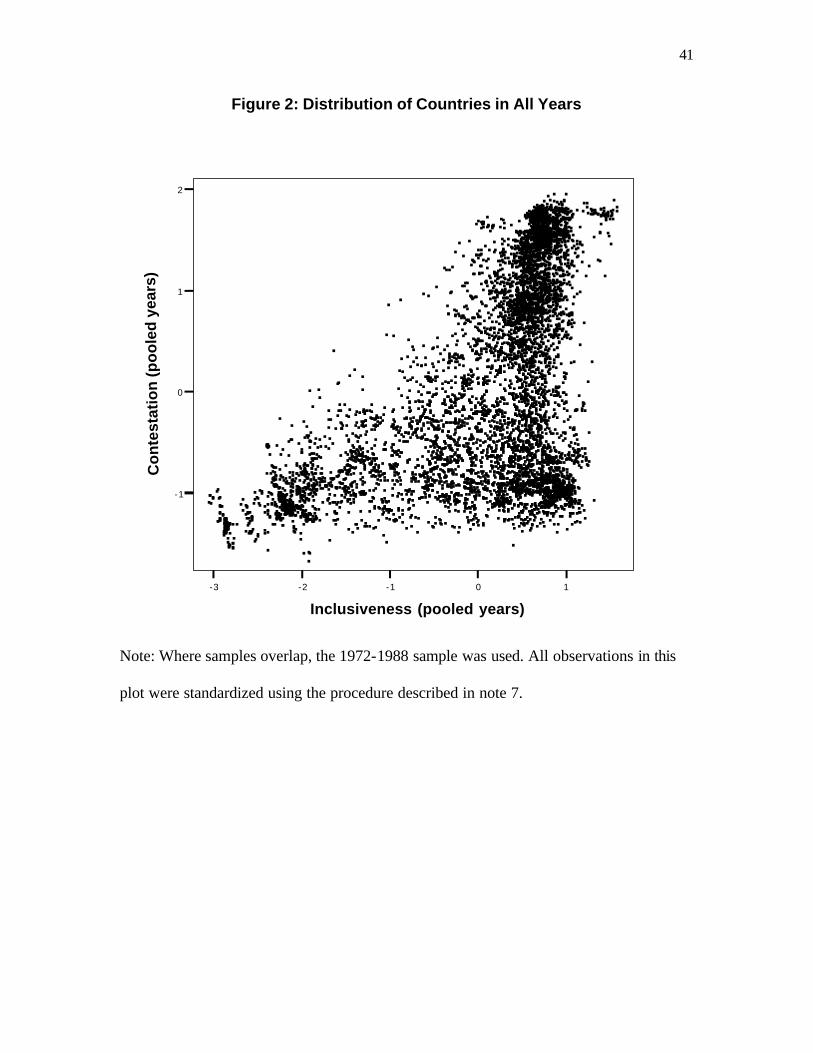
10. The tripolar distribution persists.
The tripolar distribution of countries that we found for 1985 is reproduced in
every other year from 1950 to 2000. Figure 2 is a scatterplot of the pooled annual
component scores for all the countries in the two-dimensional spaces defined by the
principal components for each year.7 All of the annual plots are triangular within roughly
the same space. Closer inspection would reveal that in every case, the democracies are in
the upper right corner, the inclusive hegemonies in the lower right, and the authoritarian
regimes and traditional monarchies are in the lower left. The three regime poles are
persistent and clear.
[Figure 2 about here]
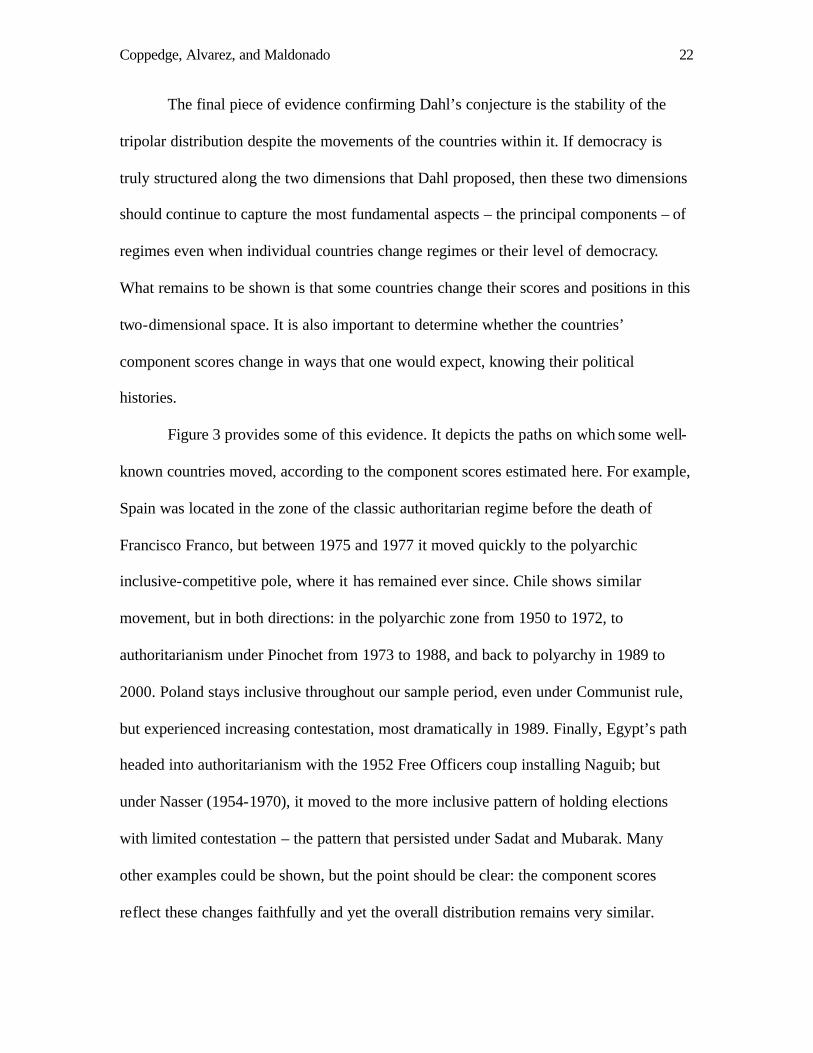
11. The overall pattern persists even when individual countries change.
Coppedge, Alvarez, and Maldonado 22
The final piece of evidence confirming Dahl’s conjecture is the stability of the
tripolar distribution despite the movements of the countries within it. If democracy is
truly structured along the two dimensions that Dahl proposed, then these two dimensions
should continue to capture the most fundamental aspects – the principal components – of
regimes even when individual countries change regimes or their level of democracy.
What remains to be shown is that some countries change their scores and positions in this
two-dimensional space. It is also important to determine whether the countries’
component scores change in ways that one would expect, knowing their political
histories.
Figure 3 provides some of this evidence. It depicts the paths on which some well-
known countries moved, according to the component scores estimated here. For example,
Spain was located in the zone of the classic authoritarian regime before the death of
Francisco Franco, but between 1975 and 1977 it moved quickly to the polyarchic
inclusive-competitive pole, where it has remained ever since. Chile shows similar
movement, but in both directions: in the polyarchic zone from 1950 to 1972, to
authoritarianism under Pinochet from 1973 to 1988, and back to polyarchy in 1989 to
2000. Poland stays inclusive throughout our sample period, even under Communist rule,
but experienced increasing contestation, most dramatically in 1989. Finally, Egypt’s path
headed into authoritarianism with the 1952 Free Officers coup installing Naguib; but
under Nasser (1954-1970), it moved to the more inclusive pattern of holding elections
with limited contestation – the pattern that persisted under Sadat and Mubarak. Many
other examples could be shown, but the point should be clear: the component scores
reflect these changes faithfully and yet the overall distribution remains very similar.
Coppedge, Alvarez, and Maldonado 23
[Figure 3 about here]
Conclusions
Democracy is a complex, multifaceted concept: so complex that it has to be
simplified before it can be measured and subjected to empirical analysis. Dahl proposed
one simplification: a focus on certain aspects of democracy that he called polyarchy,
which he claimed had two dimensions. Our analysis gives an empirical foundation to
Dahl’s two theoretical dimensions of democracy. There are two dimensions, they are the
same dimensions about which Dahl theorized, and they have been remarkably persistent
for a large number of countries for several decades. On both theoretical and empirical
grounds, therefore, there is a strong presumption in favor of the heuristic and empirical
value of treating democracy as possessing these two dimensions, at least for the latter half
of the 20th century.
Some of our eleven tests are less rigorous than others, i.e., they admit different
interpretations. However, the tests reinforce one another and are collectively more
rigorous than any one test in isolation. The logic is the same as that of the familiar “duck”
analogy: a puffin can walk like a duck, a hunter’s call can quack like a duck, and a decoy
can look like a duck; but if a creature walks, talks, and looks like a duck, it is a duck.
After passing eleven tests, the evidence that these are Dahl’s two dimensions is solid.
One caveat is that our findings necessarily reflect the aspects of democracy
measured by the indicators included in our analysis, which are in turn limited to the
aspects that other scholars have chosen to measure. An exploratory analysis of a more
diverse set of variables could well reveal three or more dimensions. We do not claim that
contestation and inclusiveness capture everything there is to know about democracy. In
Coppedge, Alvarez, and Maldonado 24
fact, we are persuaded that it would be useful to define and measure its other dimensions
if this becomes possible. Based on the evidence at hand, however, the only two robust
dimensions in the available indicators are Dahl’s dimensions of contestation and
inclusiveness, and these two dimensions account for about three-quarters of the variation
captured by the indicators that have been produced by those who have measured aspects
of democracy most extensively – Banks, Gurr et al., Freedom House, Vanhanen, and
Przeworski et al.
Our analysis provides criteria for evaluating some existing indicators of
democracy. According to our findings, Gurr’s Openness of Executive Recruitment
measures a different dimension than the other Polity variables. This suggests that
combining these indicators into a summary Polity score results in an index with greater
measurement error, and reinforces the conclusion of Gleditsch and Ward that the
aggregated Polity Index is less useful than the separate variables that compose it
(Gleditsch and Ward 1997). The opposite problem faces Freedom House, which has
always produced separate indices for “political rights” and “civil liberties” even though,
as our analysis shows, these are both indicators of contestation. This is therefore a
conceptual distinction without an empirical difference. No researcher should use them as
indicators of distinc t aspects of democracy.
A final implication of our study is that most quantitative research on
democratization has actually concerned contestation. This can be seen in the fact that the
most commonly used indicators of democracy -- most of the Polity Index and both
Freedom House indices – load on the contestation dimension. Therefore, the
inclusiveness dimension has been neglected. One of the limitations of studying
Coppedge, Alvarez, and Maldonado 25
inclusiveness is that it has been operationalized very narrowly, almost always being
reduced to the breadth of the suffrage. Our inclusiveness component is based on several
indicators in addition to the extent of the suffrage. The fact that there continued to be
significant variations in this component as recently as 2000 suggests that inclusiveness
continues to be a relevant dimension of democracy despite the near-universal adoption of
universal adult suffrage in countries that hold elections. There is practically no research
on the causes of inclusiveness; our indicators will make this new avenue of research
possible.8
Coppedge, Alvarez, and Maldonado 26
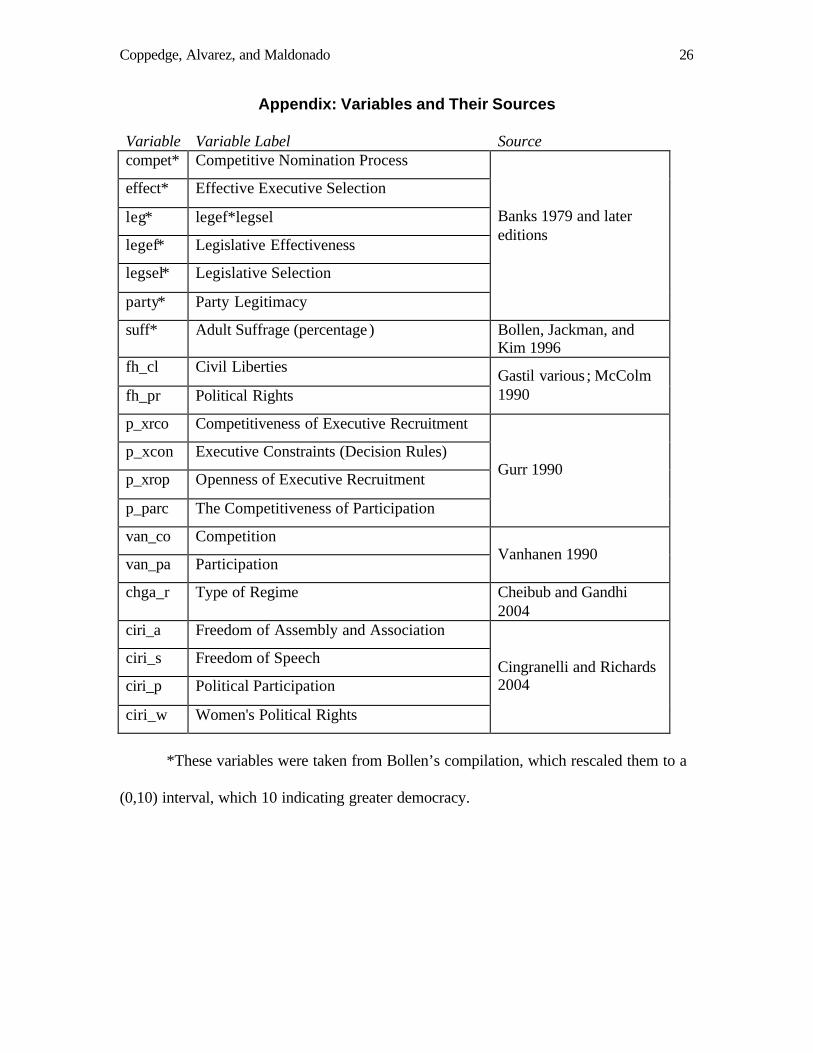
Appendix: Variables and Their Sources
Variable Variable Label Source compet* Competitive Nomination Process
effect* Effective Executive Selection
leg* legef*legsel
legef* Legislative Effectiveness
legsel* Legislative Selection
party* Party Legitimacy
Banks 1979 and later editions
suff* Adult Suffrage (percentage ) Bollen, Jackman, and Kim 1996
fh_cl Civil Liberties
fh_pr Political Rights Gastil various ; McColm 1990
p_xrco Competitiveness of Executive Recruitment
p_xcon Executive Constraints (Decision Rules)
p_xrop Openness of Executive Recruitment
p_parc The Competitiveness of Participation
Gurr 1990
van_co Competition
van_pa Participation Vanhanen 1990
chga_r Type of Regime Cheibub and Gandhi 2004
ciri_a Freedom of Assembly and Association
ciri_s Freedom of Speech
ciri_p Political Participation
ciri_w Women's Political Rights
Cingranelli and Richards 2004
*These variables were taken from Bollen’s compilation, which rescaled them to a
(0,10) interval, which 10 indicating greater democracy.
Coppedge, Alvarez, and Maldonado 27
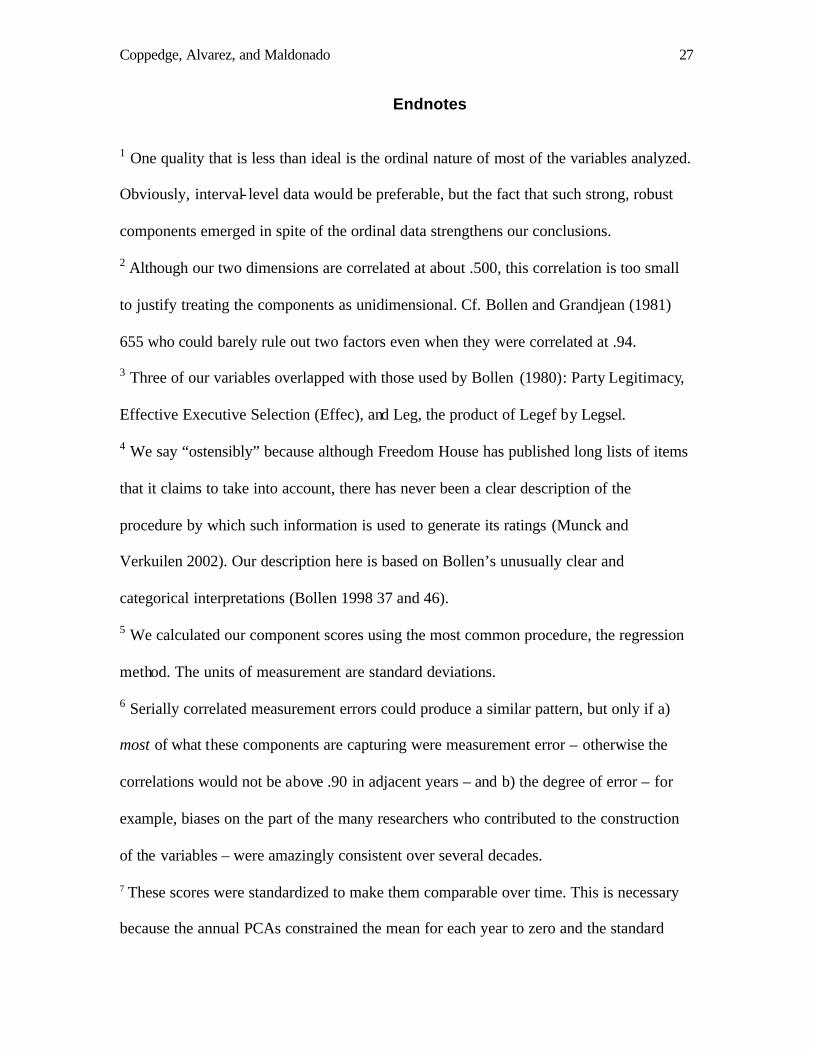
Endnotes
1 One quality that is less than ideal is the ordinal nature of most of the variables analyzed.
Obviously, interval- level data would be preferable, but the fact that such strong, robust
components emerged in spite of the ordinal data strengthens our conclusions.
2 Although our two dimensions are correlated at about .500, this correlation is too small
to justify treating the components as unidimensional. Cf. Bollen and Grandjean (1981)
655 who could barely rule out two factors even when they were correlated at .94.
3 Three of our variables overlapped with those used by Bollen (1980): Party Legitimacy,
Effective Executive Selection (Effec), and Leg, the product of Legef by Legsel.
4 We say “ostensibly” because although Freedom House has published long lists of items
that it claims to take into account, there has never been a clear description of the
procedure by which such information is used to generate its ratings (Munck and
Verkuilen 2002). Our description here is based on Bollen’s unusually clear and
categorical interpretations (Bollen 1998 37 and 46).
5 We calculated our component scores using the most common procedure, the regression
method. The units of measurement are standard deviations.
6 Serially correlated measurement errors could produce a similar pattern, but only if a)
most of what these components are capturing were measurement error – otherwise the
correlations would not be above .90 in adjacent years – and b) the degree of error – for
example, biases on the part of the many researchers who contributed to the construction
of the variables – were amazingly consistent over several decades.
7 These scores were standardized to make them comparable over time. This is necessary
because the annual PCAs constrained the mean for each year to zero and the standard
Coppedge, Alvarez, and Maldonado 28
deviation for each to one, which obscured year-to-year variation in mean scores and their
dispersion. We thank Carlos Gervasoni for pointing this out and suggesting part of the
solution that we adopted. To correct for this problem, we repeated the PCA in each of the
three pooled samples and calculated the means and standard deviations for contestation
and inclusiveness by year. These means track the waves of authoritarianism and
democratization in the 1960s and 1970s well. The standardized score on each dimension
is then the original score multiplied by the annual standard deviation, plus the annual
mean score. For the years with overlapping samples (1981-1988), the means and standard
deviations were chained forward from the 1981 scores based on the average changes in
both samples, and from the 1988 scores based on the changes in the most recent sample.
The correlations between original and standardized scores are at least .96 for both
dimensions. Figure 2 looks very similar using either set of scores.
8 Our component scores are available for other scholars to use at
http://www.nd.edu/~mcoppedg/crd/.
References
Adcock, Robert and David Collier. 2001. “Measurement Validity: A Shared Standard for
Qualitative and Quantitative Research. ” American Political Science Review 95
(3): 529-46.
Alvarez, Michael, José Antonio Cheibub, Fernando Limongi, and Adam Przeworski.
1996. “Classifying Political Regimes.” Studies in Comparative International
Development 31(2): 3-36.
Banks, Arthur. 1979. Cross-National Time-Series Data Archive Users' Manual.
Binghamton, NY: Center for Social Analysis, State University of New York.
Boix, Carles. 2003. Democracy and Redistribution. New York: Cambridge University
Press.
Bollen, Kenneth A. 1980. “Issues in the Comparative Measurement of Political
Democracy.” American Sociological Review 45(3): 370-90.
Bollen, Kenneth A. 1998. “Cross-National Indicators of Liberal Democracy, 1950-1990”
[computer file]. 2nd ICPSR version. Chapel Hill, NC: University of North
Carolina (producer); Ann Arbor, Michigan: ICPSR (distributor).
Bollen, Kenneth A., and Burke D. Grandjean. 1981. “The Dimension(s) of Democracy:
Further Issues in the Measurement and Effects of Political Democracy. ” American
Sociological Review 46(5): 651-59.
Bollen, Kenneth A., Robert W. Jackman, and Hyojoung Kim. 1996. “Suffrage,
Registration, and Turnout: A Comparative Analysis.” Typescript. Department of
Sociology, University of North Carolina at Chapel Hill.
Coppedge, Alvarez, and Maldonado 30
Bueno de Mesquita, Bruce, Alastair Smith, Randolph M. Siverson, and James D.
Morrow. 2003. The Logic of Political Survival. Cambridge, MA: MIT Press.
Cheibub, José Antonio and Jennifer Gandhi. 2004. “A Six-Fold Measure of Democracies
and Dictatorships.” Presented at the Annual Meeting of the American Political
Science Association, Chicago.
Cingranelli, David and David Richards. 2004. “The Cingranelli-Richards (CIRI) Human
Rights Database Coding Manual.”
http://ciri.binghamton.edu/documentaiton/web_version_7_31_04_ciri_coding_gui
de.pdf (January 9, 2007).
Coppedge, Michael. 2002. “Democracy and Dimensions: Comments on Munck and
Verkuilen.” Comparative Political Studies 35(1): 35-39.
Coppedge, Michael and Wolfgang Reinicke. 1990. “Measuring Polyarchy.” Studies in
Comparative International Development 25(1): 51-72.
Dahl, Robert A. 1971. Polyarchy: Participation and Opposition. New Haven: Yale
University Press.
Dahl, Robert A. 1989. Democracy and Its Critics. New Haven: Yale University Press.
Dahl, Robert A. and Charles Lindblom. 1953. Politics, Economics, and Welfare:
Planning and Politico-economic Systems Resolved into Basic Social Processes.
New York: Harper and Row.
DeVellis, Robert F. 2003. Scale Development: Theory and Applications. 2nd edition.
Vol. 26, Applied Social Research Methods Series. Newbury Park, CA: Sage.
Coppedge, Alvarez, and Maldonado 31
Enterline, Andrew J. and J. Michael Greig. 2005. “Beacons of Hope? The Impact of
Imposed Democracy on Regional Peace, Democracy, and Prosperity. ” Journal of
Politics 67(4): 1075-98.
Gastil, Raymond, D., ed. various. Freedom in the World: Political Rights and Civil
Liberties. New York: Freedom House.
Geddes, Barbara. 2003. Paradigms and Sand Castles: Theory Building and Research
Design in Comparative Politics. Ann Arbor, MI: University of Michigan Press.
Gleditsch, Kristian and Michael D. Ward. 1997. “Double Take: A Reexamination of
Democracy and Autocracy in Modern Polities.” Journal of Conflict Resolution
41(3): 361-83.
Gurr, Ted Robert. 1997. Polity II: Political Structures and Regime Change, 1800-1986.
Boulder, CO: Center for Comparative Politics [producer]. Ann Arbor, MI: Inter-
university Consortium for Political and Social Research [distributor].
Huntington, Samuel. 1991. The Third Wave: Democratization in the Late Twentieth
Century. Norman, OK: University of Oklahoma Press.
Linz, Juan J. 1964. “An Authoritarian Regime: The Case of Spain.” In Cleavages,
Ideology and Party Systems, eds. E. Allardt and Yrjo Littunen. Helsinki:
Transactions of the Westermack.
Linz, Juan J. 1975. “Totalitarian and Authoritarian Regimes.” In Handbook of Political
Science, eds. F. I. Greenstein and Nelson W. Polsby. Reading, Mass: Addison-
Wesley.
Coppedge, Alvarez, and Maldonado 32
Lipset, Seymour Martin, Kyoung-Ryung Seong, and John Charles Torres. 1993. “A
Comparative Analysis of the Social Requisites of Democracy. ” International
Social Science Journal 45(2): 154-75.
Mainwaring, Scott and Aníbal Pérez-Liñán. 2005. “Regional Effects and Region-Wide
Diffusion of Democracy: Why Regions of the World are Important in
Comparative Politics.” Typescript. Notre Dame, IN.
Maoz, Zeev and Bruce Russett. 1992. “Alliance, Contiguity, Wealth, and Political
Stability: Is the Lack of Conflict among Democracies a Statistical Artifact?”
International Interactions 17(4): 245-67.
McColm, R. Bruce. 1990. Freedom in the World: Political Rights and Civil Liberties,
1989-1990. New York: Freedom House.
Muller, Edward N. 1995. “Economic Determinants of Democracy.” American
Sociological Review 60(4): 966-82.
Munck, Gerardo L., and Jay Verkuilen. 2002. “Conceptualizing and Measuring
Democracy: Evaluating Alternative Indices.” Comparative Political Studies
35(1): 5-34.
Norris, Pippa. 2005. “Democracy Indicators Cross-national Time-Series Dataset” Release
1.0. <http://ksghome.harvard.edu/~pnorris/Data/Data.htm> (September 2005).
O'Donnell, Guillermo. 1973. Modernization and Bureaucratic-Authoritarianism: Studies
in South American Politics. Berkeley: Institute of International Studies,
University of California.
O'Loughlin, John, Michael D. Ward, Corey L. Lofdahl, Jordin S. Cohen, David S.
Brown, David Reilly, Kristian S. Gleditsch, and Michael Shin. 1998. “The
Coppedge, Alvarez, and Maldonado 33
Diffusion of Democracy, 1946-1994.” The Annals of the Association of American
Geographers 88(4): 545-74.
Przeworski, Adam, Michael E. Alvarez, José Antonio Cheibub, and Fernando Limongi.
1996. “What Makes Democracies Endure?” Journal of Democracy 7(1): 39-55.
Przeworski, Adam, Michael E. Alvarez, José Antonio Cheibub, and Fernando Limongi.
2000. Democracy and Development: Political Institutions and Well-Being in the
World, 1950-1990. Cambridge: Cambridge University Press.
Teorell, Jan, Sören Holmberg, and Bo Rothstein. 2006. “The Quality of Government
Dataset.” Göteborg University: The Quality of Government Institute.
http://www.qog.pol.gu.se (November 15, 2006).
Vanhanen, Tatu. 1990. The Process of Democratization. New York: Crane Russak.
Coppedge, Alvarez, and Maldonado 34
Table 1: Principal Components Analyses for 1985
Variables for 1972-88
KMO=.918, N=191
Variables for 1981-2000
KMO=.919, N=191 Source Description Comp. 1 Comp. 2 Comp. 1 Comp. 2
Freedom House
Civil Liberties -.977 .121 -.967 .105
Freedom House
Political Rights -.960 .020 -.959 .049
Vanhanen Index of Competition .927 .017 .906 .019
Polity Executive Constraints .918 -.028 .885 .038
Polity Comp. of Political Participation .913 -.048 .923 .010
Cheibub & Gandhi
Type of Regime -.906 .031 -.875 .017
Polity Competitiveness of Executive Recruitment
.878 .032 .864 .081
Banks Party Legitimacy .876 .035
Banks Legislative Effectiveness .784 .220
CIRI Freedom of Assembly and Association
.845 .020
CIRI Freedom of Speech .811 -.020
CIRI Political Participation .787 .165
Banks Competitive Nomination Process .576 .449
Bollen et al.
Adult Suffrage -.036 .873 .015 .824
Banks Legislative Selection -.034 .851
CIRI Women’s Political Rights -.155 .818
Banks Effective Executive Selection -.098 .776
Vanhanen Index of Participation .216 .636 .207 .688
Polity Openness of Executive Recruitment
.281 .419 .247 .492
Eigenvalue 9.22 1.94 8.73 1.54
Variance explained 61.5% 12.9% 62.3% 11.0%
Correlation between components .470
Component weights with an absolute value greater than .500 are in bold. CIRI is Cingranelli and Richards (2004).
Coppedge, Alvarez, and Maldonado 35
Table 2: Components Regressed on Per Capita GDP in 1985 1972-1988 Sample Estimate 1981-2000 Sample Estimate
Dependent
Variable
Component 1
(Contestation)
Component 2
(Inclusiveness)
Component 1
(Contestation)
Component 2
(Inclusiveness)
Log of per
capita GDP
.768
(.063, 12.10)
.372
(.077, 4.86)
.812
(.070, 11.54)
.449
(.074, 6.05)
Constant -.868
(.107, -8.11)
-.348
(.129, -2.70)
-.888
(.119, -7.50)
-.439
(.125, -3.51)
R2 .552 .166 .526 .234
N 121 121 122 122
Standard errors are in parentheses, followed by t-statistics.
Coppedge, Alvarez, and Maldonado 36
Table 3: Variables and Component Weights for the 1972-1988 Sample
Component 1 Component 2 Source Variable Mean Min Max Mean Min Max Freedom House
Civil Liberties -0.975 -0.993 -0.949 0.135 0.062 0.213
Freedom House Political Rights -0.950 -0.975 -0.931 0.004 -0.033 0.050
Polity The Competitiveness of Participation
0.926 0.900 0.965 -0.047 -0.090 -0.023
Vanhanen Index of Competition 0.923 0.879 0.948 0.019 -0.012 0.048
Cheibub & Gandhi Type of Regime -0.910 -0.934 -0.876 0.043 -0.006 0.072
Polity Executive Constraints 0.885 0.838 0.927 0.024 -0.074 0.113
Banks Party Legitimacy 0.883 0.850 0.915 0.037 0.002 0.078
Polity Competitiveness of Executive Recruitment
0.830 0.749 0.900 0.109 -0.003 0.251
Banks Legislative Effectiveness
0.720 0.667 0.786 0.306 0.207 0.384
Polity Competitive Nomination Process
0.531 0.465 0.580 0.509 0.425 0.578
Banks Legislative Selection -0.007 -0.068 0.061 0.887 0.803 0.919
Bollen et al.
Adult Suffrage (%) -0.014 -0.056 0.071 0.857 0.807 0.904
Banks Effective Executive Selection -0.112 -0.169 -0.055 0.790 0.719 0.890
Vanhanen Index of Participation 0.208 0.144 0.296 0.616 0.505 0.685
Polity Openness of Executive Recruitment
0.158 -0.009 0.323 0.593 0.373 0.874
KMO 0.916 0.906 0.925 Eigenvalue 9.41 9.13 9.91 1.98 1.92 2.10 % Variance 62.8 60.9 66.1 13.2 12.8 14.0
Correlation between components
0.496 0.455 0.556
Mean component weights with an absolute value greater than .500 are in bold.
Coppedge, Alvarez, and Maldonado 37
Table 4: Variables and Component Weights for the 1950-1971 Sample Component 1 Component 2
Source Variable mean min max mean min max Cheibub & Gandhi Type of Regime -0.930 -0.967 -0.876 0.092 0.010 0.142
Vanhanen Index of Competition 0.924 0.876 0.959 -0.026 -0.075 0.036
Banks Party Legitimacy 0.921 0.867 0.972 -0.031 -0.108 0.049
Polity Competitiveness of Participation 0.905 0.843 0.985 -0.146 -0.239 -0.084
Polity Executive Constraints 0.865 0.832 0.889 0.037 -0.021 0.096
Polity Competitiveness of Executive Recruitment
0.856 0.750 0.957 0.075 -0.097 0.201
Banks Legislative Effectiveness
0.793 0.653 0.881 0.228 0.109 0.394
Banks legef*legsel 0.786 0.650 0.869 0.246 0.127 0.399
Banks Competitive Nomination Process
0.654 0.493 0.794 0.329 0.164 0.498
Bollen et al. Adult Suffrage (%) -0.065 -0.124 0.008 0.845 0.768 0.916
Banks Legislative Selection 0.026 -0.080 0.156 0.844 0.690 0.973
Polity Openness of Executive Recruitment
0.043 -0.039 0.132 0.755 0.515 0.871
Vanhanen Index of Participation
0.075 -0.030 0.147 0.714 0.632 0.827
KMO 0.888 0.85 0.91 Eigenvalue 8.09 7.64 8.57 1.74 1.5 2 % Variance 62.2 58.8 66 13.4 11.6 15.4
correlation between components
0.477 0.403 0.575
Mean component weights with an absolute value greater than .500 are in bold.
Coppedge, Alvarez, and Maldonado 38
Table 5: Variables and Component Weights for the 1981-2000 Sample Component 1 Component 2
Source Variable Mean Min Max Mean Min Max Freedom House Political Rights -0.922 -0.976 -0.862 -0.008 -0.087 0.071
Freedom House Civil Liberties -0.916 -0.979 -0.824 0.047 -0.075 0.128
Polity Competitiveness of Participation 0.870 0.802 0.932 0.041 -0.034 0.117
Polity Executive Constraints 0.868 0.769 0.971 0.059 -0.097 0.204
Cheibub & Gandhi Type of Regime -0.855 -0.898 -0.788 -0.004 -0.085 0.065
CIRI Freedom of speech
0.838 0.651 0.938 -0.123 -0.244 0.080
Vanhanen Index of Competition
0.832 0.702 0.936 0.091 -0.027 0.220
CIRI Freedom of assembly and association
0.817 0.696 0.874 0.002 -0.103 0.110
CIRI Political participation 0.802 0.608 0.917 0.085 -0.045 0.320
Polity Competitiveness of Executive Recruitment
0.794 0.627 0.913 0.144 -0.063 0.373
Bollen et al. Adult Suffrage (%) -0.039 -0.145 0.085 0.861 0.763 0.938
CIRI Women's political rights
-0.015 -0.196 0.422 0.724 0.120 0.851
Vanhanen Index of Participation 0.281 0.161 0.516 0.591 0.369 0.707
Polity Openness of Executive Recruitment
0.197 0.028 0.461 0.573 0.227 0.892
KMO 0.918 0.910 0.927 Eigenvalue 8.60 8.23 8.91 1.35 1.08 1.69 % Variance 61.4 58.8 63.6 9.6 7.7 12.1
Correlation
between components
0.503 0.390 0.601
Mean component weights with an absolute value greater than .500 are in bold. CIRI is Cingranelli and Richards (2004).
39
Table 6: Mean Correlations among Principal Components by Years of Separation
Difference in Years 1950-1971 1972-1988 1981-2000 1950-1971 1972-1988 1981-2000
1 0.966 0.977 0.969 0.897 0.913 0.9193 0.916 0.927 0.915 0.707 0.722 0.8025 0.881 0.887 0.863 0.617 0.586 0.7147 0.864 0.856 0.814 0.591 0.510 0.6519 0.848 0.847 0.761 0.577 0.477 0.614
11 0.835 0.833 0.714 0.582 0.446 0.58013 0.815 0.820 0.691 0.548 0.417 0.55115 0.806 0.775 0.681 0.547 0.382 0.52017 0.805 0.671 0.584 0.488
Contestation Inclusiveness
“Difference in Years” is the number of years separating the estimates of contestation or
inclusiveness whose correlations were averaged. For example, in the 1950-1971 sample,
when the difference in years is 15, we averaged the correlations between the contestation
estimates for 1950 and 1965, 1951 and 1966, 1952 and 1967, 1953 and 1968, 1954 and
1969, 1955 and 1970, and 1956 and 1971.
40
Figure 1: Distribution of Countries on Our Dimensions of Democracy, 1985
Inclusiveness in 1985210-1-2-3
Co
nte
stat
ion
in 1
985
2
1
0
-1
-2
Zambia
Venezuela
USSR
Uruguay
United States
Tonga
TanzaniaSudan
St Kitts and Nevis
Sri Lanka
South Africa
Somalia
Singapore
Samoa
Rwanda
Qatar
Papua New Guinea
Oman
Niger
New Zealand
Mozambique
Morocco
Mexico
Libya
Kuwait
Hungary
Guinea
Guatemala
GhanaEquatorial Guinea
Egypt
Denmark
Cote d'Ivoire
Congo, Democratic RepublicChad
Cape Verde
Burkina Faso
Bulgaria
Brazil
Benin
Bahrain
Austria
Australia
Argentina
Angola
41
Figure 2: Distribution of Countries in All Years
-3 -2 -1 0 1
Inclusiveness (pooled years)
-1
0
1
2
Co
nte
stat
ion
(po
ole
d y
ears
)
VVV VVVVVVVVVVVV
VVVVVVV
V
VVVVV
VVVVVVV
VVV V
VV
V
VVV
VVV
VV
VVVVVVVVVVVVVVVVVVVVVV
VVVVVVVVVVVVVVVVV
V
V
VV
VV
V
V
VV
V
VVV
VVVVVVV
VVVV VVVVVVVVVVVVV
V
V
V
V
V
V
VV
V
V
V
VVVVVVVVVVVVVVVVVVVVVV
VVV
VVVV
VV
V
VVVVVVV
VVV
VVVVVVVV
VVVVV
V VVVVVV VV V
VV
V
VVVVVV
V
V
V
VVVVVVVVVVVV
VVV VV
V VVVV
VVV
VVVV
V
VVV
VVVVVV
V
VVV
VVVVV
V
V
V VVVVVVV
VV
V
V
VVVV
V
V
V
VVV
VVV
VV
V
VVVVVVVVVVVVVVVVV VVVVV
VVVVVVVVVVVVVVVVVVVV
VV
VVVVVV
VVVVV
VVVVVVVVVVVVVVVVVVVVVVVVVVVVVVVVVV V
VVVV
VVVVV V
V
VV
VVVV
VV
V
V
VVVVVVVVVVVVVVVV
VVV VVVVVV
VV
V
V
VV
VVVVVVVVVVVVVVV V
V
V
VVVVV
VV
VV
V
VVV
V
VV
V
VVV V
VV
V
V
V
V
VVV
VVV V
V
VVVVVV
VVVVVV VVVVVVVVVVV
VVV VVVVVVVV
VVV
VV
V
V VV
VV
VVVVVVVVVVVVVVVVVVVVVV
VVVVVVVVVVVVVVVVV
VVV VV
VVVVVV
VVVVVVVV
VV
V
V
V
VVVVVV
VVV
V
V
VVVV V
VV
VVVVVVV
VVVVVVVVVV
V
V
VV
VV VVV
V
V
VVVVVVVVVVVVV VVVVVV
VV
V
VVVVVVVVVV
VVVVVVV
V
VV
V
V
VVVVVV
V
V
V VVV
VVVVVVVV
VV
V
VV
VVV
VVVVVV
V
V
V
V
V VVVVVV
VVVVVVV
VV VV
V
V
VVVV
VVVVV
VVV
VVVVVVVVVV
VVVVVVVVV
V
V
VV VV
VVVVVV
VVVVVVVVVVVVV
V
V
V
VV
VV
VV
VV
VVVV
V
VVV
VVV
VV VV
V
V
V
V
VV
VVVVV
VVVVVVVVVVVVV
VVVVVV
V
VV
VV
VV
V
V
V
VVVVVVVVVVVVVVVVVVVVVVVVVVVVVVVVVVVVVVV
V
VV
V
V
VVVV
V
V
VVVVV V
VVVV
V V
VV
VVV
V
VV
VVVVVVVVV
V
V
VVV
VV
VV
VV
VVV V
VVVVVV
VVVVVVVVVV
VV VVV
VV VV
V
VVV
V
V
VVVVV V
VV VVVV VVVVVVVV
VV
VVV
V
VVV
VVVVVVV
VVVV
V
V
V V
V
V
V
V
V
V VVV
VVVVVVVV
VV
VVVVVVVVV
VVVVVVV
V
V
VVV
V
VV
VVV
VVVVVVVVVVVVVVVVVVVVVV
VVVVVVVVVVVVVVVVV
VVVV
V
VV VVVV
VVVV
V VVVVVV
VVV
V
VV VVVVVVVV
VVVV
VV
VVVVVV
VVVVVVVVVVVVVV V
VVV
VV
V
VV
V
VVVV
V
VV VVVVVV VVV
VVVVVV
VVVVVVV
VVVV
V
VV VVV
V
VVVV
VV VVV
VVVVV
V
VVVVVVVVVVV V
VVVVVVVV
VVVVVVV
V
VV
V VVV
VV
V
VV
VV
VV
VVVVVVVVVVVVVVVVVVVVVVV
V VVVVVVVVVVV
V VVVVVVVV
VV
VVVV
VVV
V
VVVVVVVVVVVV
VVVVVVVVVVVVVVVVVVV
V
VV
VV
VVVVV
V
V
V V
VVV
VVVV
VVVV
V
VVVV
V
VVV
VV
VVV
VVVVV
VVVV
V
VVVV
VV V VVVVVVVVVV
V
V
V
VV
V
VV
V
V V VV
VV
VVVVV
V VVVVVVV
VVVVVV V
VVVV
VV
VVV
VVVV VV
VVVVVVVVVVVVVVVVVVVVVV
VVVVVVVVVVVVVVVVV
VV
V
VV
VVVVVV
VVVVVVVVVVVVVVV
VVVVVVVVVVVVVV
VVVVVVV
V
V
V
V
VV
V
VV
VVV
V
V
V
VV
VVV
VVV
V
VV
VVVVVVVVVVV
VVVVV VV VVVVVVVVV
V
V
VV
VVVV VVVV
VVV
VVVVV
VVVV
VVVVVVV
VV
VV
VVVVVV
V
VV VVV
VVVVV
VVV
V
VVVVV
VV
VVVVVV
V
VVVVVV
V
VVVV
V
VVV VVV VVVVVVV
V
VVVVVV
VV
V
VVVVVVVV
VVV VVVVVV VV VVVVVVVVVVV
VVVVVVVVVVVVVVVVV
VV
VVVVVVVVV
VVVV
V
VVVVVVV
VVVVV
VVVV
VV
VVVV
V
VVVVVVVVV VVVVVVVV
VVVVVVVVVVV
V
V
VVV
VVVVVV
VV
VVVV
VVVVVVVVVVVV
VV
V
V
V
VVV
V
V
VVVVVVVVVVV
VV
VVVVV
VV
VVVVVV
VVV
VVVVVVVVVVV
VV
V
VVVV
V
V
V
V
V
V
VVV
V
V
VVV
V
VVVVVVVVVV
VVVV
VVVVVVVVVVVVVV
VVVV
VVV
V
V
V
VV
VVV
VVVVV
V
V
VV
VVV
VVVVV
VVVVV
VV
VVV
VV
VVVV
V
V
VV
VVVVVVV
V
V
VVV
VVVVVVVVVV V VVVVVV
V
V
VV VV V
VVVV
VVV
VV
V
VV
V
VV
V
V
VV
VVV
VVVV
VVVVV VV
VVVVVVVVVVVVVVV
VV
V
VVVVVVVVVVVV
VVV
V
VVV
V
VVV
VV
VVVVVVVVV
VVVVVVVV
VV
V
V
VV VV
V
VV
V
V
VVVVVVVVVVVVVVVVVVVVVVV
VVVVV VVVVVVVVVVV
VVV
VVVVVVVV
VVVVVVVV
VVVVVVVVVVVVVV VV
VVVVVVVVVVVVVVVV
VVVVVVVVVV
V
VVV
VVV
V
VVVVVVVVVVVVVVVVVVVVV
V
VV
VV
VV
VVVV
VVVVVVVVVVVVVVVV
V VVVVVVV
V
VV
V
VV
V V
VVV
VV
V
V
V
VVVVV
V
VVVVVVVV VVV
VVVVVV
V
VVVVVV
V
VVVVVVVVVVVV VV
VVVV
V
VVVVVV
VVVVVVVVVVV
VVVVVVVVVVVVVVVVVVVVVV
VVVVVVVVVV
V
VVVVVV
VVV
VVVVVV
VV
V
V
VV
VVVVVV
V
V
V
VVVVVVVV
V
V
V
VVV
V
VVV
V
VV V
VVV VVVVVVVVVVV
VVVVV
VV
V
VVVVVVVVVVVVVVV VV
VVV
VV
V
V
V
VVVVV
VVVVV
VVVVV
VVVVVVVVVVV
VVVV
VVV
V
VVVVV
VVV
VVVVVV
VV
VVVVVV
VV
VV
V
V
VVVV
VV
VVV
VVV
V
V
VV V VVVVVVV VVVVVV
V
VV
VVV
V
V
V
V
VVV VVVVVVVVVVV VVVVVVVVVVVVVVVVV
V
V
VV
VV V
VV
V
V
VVVVVV
V
V
V
VVV
VV
VVVVVVVVV
VV
V
V
V
V
VVV
V
V
V
VVVV
VV
V
VVV
VVVVVVVVVVV
VVVVVVVVVVVVVV
VV
V
V
VV V
V
V
VVV
VV
VVVV
VV
V
V
VVVVV
VV
VVVVVV
V
VVVVVVV
V
V
V
VVVVVVV
VV
V
V
VVVVVV
V
VVVVVV
V
VVVVVVVVVVVVVVV
VVVVVVVVVVVVVVVV
V
VVV
V
VVVVV
V
V
VVVVVVVVVVVVVVVVVVVVVV
VVVVVV VVVVVVVVVVV
VVV
VVVVVV VV
VV
VVVVVVVVVVVVVVVVVVVVVVV
VV
VVVVVVVVVVVV
V
VVV
VV
VV
VVV
VV
VVV
VV
VV
V
VVVVVV
VVVVV
VVVVVVVVVVVVVVVVVV
V
VVV
VVVVV
V
V
VV
V V
V
VVVVVV
VV
V VVVVVVVVVVVVVVV
VVVVVVVVVVV
V VVVVV
VVVV
V
VV
V
VVV
V
VVVVVVVVVVVVVV
VVVVVVV V
VVVVVVVVVV
VVVV VV
VVVV
VV
VVVVVVVVVVVVVVVVVVVV
VVVVVVVVVVVVVVVVV V
VV
VV
V
VV
V
V
V
VVVVVVVVVVVVVVVVVVVVVVVVVVV
VVVVVVVVVVVV V
VVVVV
VVVVV
VVVVVVVVVVVVVVVVVVVVVVVVVVVVVV
VVVVVVVVV V
VV VVVVVVVV
VV V
VVVVVVVVVVVVVVVVVVVVV
VVVVVV
VVV
VVVVV
VVV
VV
VVVVVVVVVVVVVVVVVVVV
VVVVVVVVVVVVVVVVV
VVVVVVVVVVV
V
VVV
VV
V
V
VVVVVVVV
V
VVVVVVV
VVVVVVVVVV
VVVVV
VV
V
VVV
V
VVVV
V
VV V
VV
VV
V
V
V
V
V
VVVV
VVVVVV
VVVVVVVV
VVVVVV
V V
VV
VV
V
V
V
VV
VVV
VVVVVVVVVV
VVVVVVVV
VVV
VVVVVVVVVVVVVVVVVVV
VVVVVVVVVVVVVVVVVV
VVVVVVVVVV
VVVVVV
VV
VV
V
VV
VVVVVVVVV
V
VVVVVVV V
VVVV
VV
V
V
V VV
VVV
VVV V V
VVVV VVVVV
VVVV
VVVVV
VVVVV
VVV
V
V V
VVV
VV
V VV
V
V
V
VVV
VV
VV
V
VVVV
V
V
V
VVVVV
V
VVVVV
VVV
VVVV
VVVVVVVVVV
VVV
VVVVVVV
V
V
V
VVVVVVVVV
VVV
VVVVVVVV
VVVVVVVVVVV
VVV
VVVVVVVV
VVVVV
V
V
V VVVV
VVVVV
VVVV
VV
V
VVVVVVVVV
VVV
V
VVV
V
V
V
V
VV
VV
VVV
V VVVVVVVV VVVVVVVVVVVVV
VV
VVVVVV
VV
VV
V
V
VVV
V
VV
VVV
V
VVVVV
VVVVVVVVVVVVV VVVV
VVV
VVVVV VVVVVVVVVVVV
VV VV VVV
VVVV
VVVVVVVVVVVVVVVVVVVVVV
VVV
VV
VVVVVVVVV VVV
VV
V VVVVVVVV
V
V
V
V
VV
VVVVV
VVVVVVVVVVVVVVVVVVVVVVVVVVVV VVVVVVVVVV
V
VVV VVVVVV
VV
V
V V
VVVVV V
VV
VVVVVVVVVVVV
V VVV
V
VVVVVVVVVVVV
V
V
V
VV
V
VVV
VV
VV
VVVVVV
VVVVVV VVVVVVVVVVVV
VVV
VVVVVVV
VVV
VVVVVVVVV
VV
V
VVVVVVVVVVVV
VVVVVVVVVV
VVVVVV
VVVVVVV
VVV
VVVVVVVVVVVVVV
VVVVVVVVVVV
VVVVVVVV
VVVV
VVVVVVV
VVVV VVVVVV
V
V
V
VVV
V
VVV
V
VVVVVVVV
VVVVVVV
VVVVVVVV
VVV VV VVVVVVVV
V
VV VVVVVVVV
VVVVVVVVVVVV
VVVVVVVVVVVVVVV
VV VV
VV
V
V
VV
V
V
V
VVVVVVVV
V VVVVVVVVVVVV
V
V VV
V
V
V
VVVV
VVVVV VVVVVVVVVVVVVVVVV
VVVV
VVVVVV
VVVVVV
VVV
VV
V
VVVVV
V
V
VV VV VVVVVV
V VVV
V
VVV
V
V
V
VVVVVVVVVVVVVVVVVVVVVV
VVV
VV
VVVVVVVVVVVV
VVV
VVVVVVVV
VV
VVVVVVVVVVVVVVVVVVVVVV VVVVVVVVVVVVVVV
V
V
VV
VV VVVVV
VVVV
VVV
VV
VVVVV
V V
VVVVV
VVVVVVVVVVVVV
V VVVV
V
V
V
V
V
VV
V VVVVVVVVV
VVV
VV V
VV
V
VVVV
V
VV
VVV VV
VV
VV
VVVVVVVVVV
VVVVVVV
V
VVVVVVVVVV
VV
V
VVVV V VV
V
VV
V
VV
VVVV
V
VVVV
VVVV
VV VV
VVVVVVV
VV
VVV VVVVVVVV
V
VVVV
VV
VV
V
VVV
VVVVVVVVV
VVVVVVVV
V
VVVVVVVV V
V
VVVVVVV
VV
VVVVVVVVVVVVVVVVVVVVVV
VVVVVVVVVVVVVVVVVVVV VVVVVVVV
VVVVVVVVVVVVVVVVVVVVVV
VVVVVVVVVVVVVVVVV
VVV VV VVVVVV
VVVVVVVVVVVVV
VVVVVVVV
V
VV VV
VVVVV
VVV
V VV
VV
VV
VVV
VVVV VV
VVVVV VVVVVV VVV
VVVVVVVVV
VVVV
VV
V
VV
VVV
V
VV
V
V
VVVV
VV
VVVVVV
VVVVVV
V
V VVV
V
VVVV
VV
V
V
VVVV
V
V
VV
VVVVVVVVVVVVVVVVVVVVVV
VVVVVVVVVVVVVVVVV V
VV
V
VVVVVVV
V
VVVVV
VVVVVVV VVVVVVV
VVVVVV
VVVVVV VVVVVVV
VV VVV
V
VVVVV
VVVV
V
VV
V
VV VV
VVV
VV
VV
V
VV
V
V VVV
VVVVV
VVV
VVV
V
VV
V
VVVVV
V
VV
VVVV
VVVVVVV
V
V
VVV
VVVVVVVVVVVVV
VVVV VVVVV
V
V VVVVV
VVV
V
V
VV
VV
V
VVVVVVVVVVVVVVVVVVVVVV VVVVVV
VVV
VVVV
VVVV
VVVVV
VVVVV
VVVVVVVVVVVVVVVVVVVVV
VV
VV
V
VVV
VV
V
V VVVVV
VVVVVV
V
VVVVV
VVVV
VVVVVV
V
V
VVVVVVVVV
V V
V
V
VV
VVVV
V
VVVVVVVVVVVVVVV
VVVV
VV
V
VVV VVV
VVVVVVVV
V
VVV
VV
V
V V
VVVV
V
VVVVVVVVVVVVVVVVVVVVVV
VVVVVVVV
V
VVVVVVVV
V
VVVV VVV
V
VV
VVVVVVVVVVVVVVV
V VVVV VV
VV
V
V
VVVVVVVVVVVVVV
V
V
VVVVVVVV
V
VVVVVVVVVVVVVVVVV V
VV VVV VVV
VV
VV VVVVVVVVVVVVVVVVVVVVVV
V VVVVVVVVVVVVVV
V
V
V
V
VV
V
V
V
VV
V
VVV
VVV
V
V
V
VVVVVVVV VV V
VVVVV
VVV
VV VVVVVVV
V
V
V
V
VV
VV
V
V
VVVVVVV VVVVVVV
VVV
VVVVVVVVVVV VV VVVVVV
VV
VVVVVVVVVVVVVVVVVVVVVV
VVV
VV
VVVVVVVVVVVV
VV
V VVVVVVVV
VVVVVVV
VVVV VVV
V
VVVVVVVVVV
VVVVVVVVVVVVVVVVVVVVVV
VVVVVVVVVVVVVVVVV
VV
V
V
VVVVV
VV
VVV
V
VVVVVVVVVV
VVVV
VVVVVVVVVVVV
VV
VV
VVVVV
V
V
VVV
VV
VV
V
V
VV
VVVVVVVVVV
VV
V
VVVVVVVV
VVVVVV
V
V
VVVV
VVVV
V
VVVVVVV VVVV
VV
V VVV
V
V
VVV VVVV
VV
VVV
VVVVVVVVVVVVV
VVVVVVVV
V
VV
V
VVVVV
VV
VVV
VVVVV
VVV
V
V
VVVVV
VVVV
VVVVVVVVVVVV VV
VVVVVV V
VV VVV VVVVV
VVV
VVVVVVV VVVVVVV VVV
V
V
V
VVVV
VVVV
VVVVVVVVVVVVV VVV
VVVVVVVVVVV
VVVVVVV
VVV VV
VVV
V
V
V VV
VVV
VVVVVVVVVVVVVVVVVVVVVV
VVV
VV
V
VVVVVVVVVVVV
VV VVVVVVVV
VVV
VVVVVVVVVVVVVVVVV
VVVVVV
V
V
VVVV
V
VVVVVVVVVV
VV
V
VV
VV
VVVVVV
V VVV
VVVVVVVVVVVVVVVVV
V VV VVVVVVVVVVVVVVVVVV
VVVVVVVVVVV
VV
VV
VVVVVV
V
VVV
V
VV
V
VVVVVV
VVVVVVV
V
VVV
VV
VVVV V VVVV
VVV VV
VVVVV
VV
V
V
V
VVVVV
VVVVV
VVVV
V
VVVVV VVVVVVVVVVV
VV
V
VVVVVVVV
VVVVVVVVVVVVVVVVVVVVVV
VVVVVVVVVVVVVVVVV
VVV
VVVVVVVVVV VVVVVVVVV VVVVVVVVV VV VVVVVVVVVVVVVVVVV
VVV VVVVVVVV
V
VV
V
VV
VVVVV
V
VVVVVVV
V V V VVVVVV
VVVVVVVVVVVV
VVVVVVVVVV
VVVVVVVVVVVVV VVVVVVVVV VVV
VVVVVV
VVVVVV
VV
V
V
VVVV
VVVV
V
VV
V
VVV
VV
V
V
VV
VVVVVVVVVV VVVVV
VVVVVVVVVVVVV
VV
VV
VVVV
VV
VVVVVVV
V
V
VVVVVVVVV
V
VV
V
V
V
V
V
V
V
V
VVVV
VVVVVVV
V
V
VVV
V
VVV
V
VVVVVVVVVVV
VVVVVVVVV
VV
V
VVVVVV
VVVVV
VVVVVVV VVVVVVVVVV
V
V
V
V
VVV V
VV
V
VV
VVVVVVV
VVVVVVVVVV
VVVVVVVVVVV
VVVVVVVVV
VVVVV
VVVVVVVVVVVVV VV
VVVV
V
VVVV
VVV
VVVVVVVVVVVVVVVVVVVVVVVVVVVV
VV
VVV
V
VVVVV
V
V
VVVV
VVVVVV
V
VVVVVVVVVV
VV
VVVVVVV
VV
V
VVVVVVV
V
VVVV V
VVV
V
V
V
VV
VVVVVVV
VVVVVVVVVVV
VVV VVVVVVVV
VVVV
V
VVV
V
VVVVVVVV
V
VVVVV
V
VVVVV
VVVV V
VVV
V
V
V
V
V
V
VVVV VV
VVVVVVVVVVVVVVVVVV
V VV
VV
VV
V
VV
V
VVVVVVVVVVVVVVVVVVVVVV
VVVVVVVVVVVVVVVVV VVVVVVVVVVVVVVVVVVVVVVVVVVVVV
VVVV VVVVVVVVVVVVVVVVVVVV VVVVVVVV
VV
VVVVVVVVVV VVVVVVVVV
VV
VVVVV
VVV
VVV
V
VVVV
V
VVV
VV
VVVV
V
VVVVVVVVVVVVVVVVVVVVVV
VVVVV VVVVV
V
VVVVV
V
VV
V
V
VV
V
VV
V
VVV
VVVVVVVVV
VVVVVVVVVVV
VV
VVVVV
V
V
VVVVVVVVVVVVV V
VVVVVVVVVVVVVVVVVV
VVVV
VV
V
VV
VVVVVV
V
VVVVVV
V VVV
V
VVVVVV
VVVVVV VVVV VVVVVVV VVVVV
VVVV
V
VVVVVV VV
VVVV
VVVV
VVVV
V
VVVVVVVVVVV
V
VV
V
VV V
VV
V
V
VVVVVVVVVVVV
VVVVVVV
VV
V
VVV
VVV V VVV
VV
VVV V V
V
VVVVVVVVVV
VVVV
V VVVVVV VVVV
V
VVVVVV
V
VVVVVVVVVV
V
VV VVVVVVVVVVVVVVVVVVVVVVVVV
VVVVVVVVVVVV
V
VVVVVVVV
V
VVVVVVVVVVVVVVVV
V
VV
VVV
VVVVVVVVVV
VV
VVVVVVV
V
VVV
VVVV
VV
VVVVVVVV
V
VV
Note: Where samples overlap, the 1972-1988 sample was used. All observations in this
plot were standardized using the procedure described in note 7.
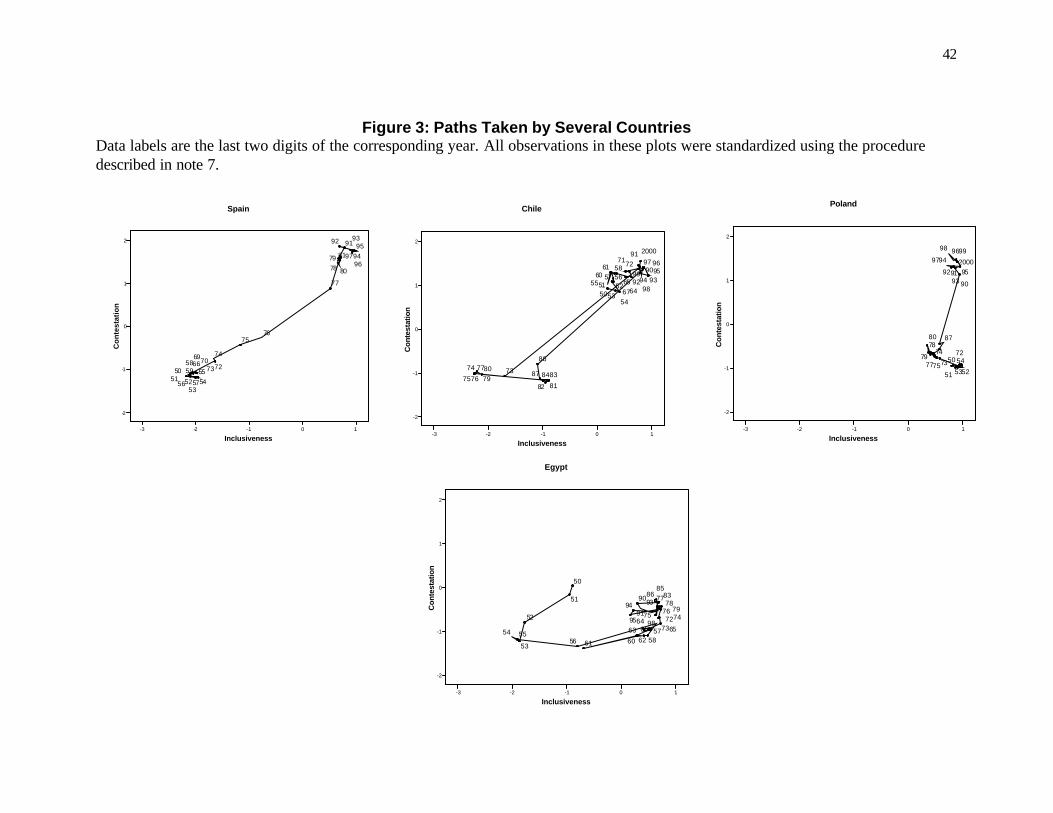
42
Figure 3: Paths Taken by Several Countries Data labels are the last two digits of the corresponding year. All observations in these plots were standardized using the procedure described in note 7.
Inclusiveness10-1-2-3
Co
nte
stat
ion
2
1
0
-1
-2
9796
9594
9392 91
81
80
7978
77
7675
74
73727069
665958
5756
5554
535251
50
Spain
Inclusiveness
10-1-2-3
Con
test
atio
n
2
1
0
-1
-2
2000
9998
9796
95
94
939291
90
8780
79
78
7775
74
737254
535251
50
Poland
Inclusiveness10-1-2-3
Con
test
atio
n
2
1
0
-1
-2
9895
94 93
91
908685
83
7978
77
7675 74
7372
66 6564
636261 60 58
5756
5554
53
52
51
50
Egypt
Inclusiveness10-1-2-3
Con
test
atio
n
2
1
0
-1
-2
2000
99
98
97 9695
94 9392
91
90
88
87 8483
82 81
8079
77
7675
74 73
7271
6765
64
6160
5857 56
55
5453
525150
Chile