Embed Size (px)
Citation preview
Two-phase equilibrium in binary and ternary systems II. The system methane-ethylene
II I . The system methane-ethane-ethylene
B y M. Gu t e r , D. M. N e w it t a n d M. R u h e m a n n
Dept, of Chemical Technology, Imperial College, South Kensington
(Communicated by A . C. Egerton, — Received 6 M ay 1940)
The liquid-vapour equilibrium of the system methane-ethylene has been determined at 0, —42, —78, —88 and —104° C over a wide range of pressures and the results are shown on a pressure-composition-temperature diagram and by a series of pressure -composition curves. The hquid-vapour equilibrium of the ternary system methane-ethane-ethylene has been determined at — 104, —78 and 0° C. Values for the two binary systems methane-ethane and methane-ethylene and for the ternary system methane- ethane-ethylene are shown on a composite pressure-composition diagram.
In Part I of this series (Ruhemann 1939), the results of a determination of the liquid-vapour equilibrium of the system methane-ethane a t five temperatures (0, —42, —78, —88 and —104° C) over a wide range of pressures were described; it was shown, inter alia, tha t a t pressures up to 15 atm. the system does not differ markedly in behaviour from tha t of a solution conforming to Raoult’s law. The system methane-ethylene has now been investigated at the same five temperatures and over a similar range of pressures, and the two sets of data have been compared with those of a ternary system containing all three gases.
II. T h e sy st e m m e t h a n e -e t h y l e n e
The apparatus and method of determining the compositions of the co-existing phases of a binary mixture in equilibrium have already been described (1939). The methane and ethylene were either prepared in the laboratory or were purchased in cylinders. They were subsequently purified by liquefaction and fractional distillation, compressed in a water-lubricated compressor and stored in cylinders; their purity was checked at intervals by determining the ratio of carbon dioxide to steam formed on exploding samples with excess of oxygen in a constant volume apparatus. Mixtures of the required composition were prepared by condensing each component separately, a t atmospheric pressure, into a thick-walled copper cylinder cooled in liquid air.
[ 140 ]
on July 13, 2018http://rspa.royalsocietypublishing.org/Downloaded from
Two-phase equilibrium in binary and ternary systems 141
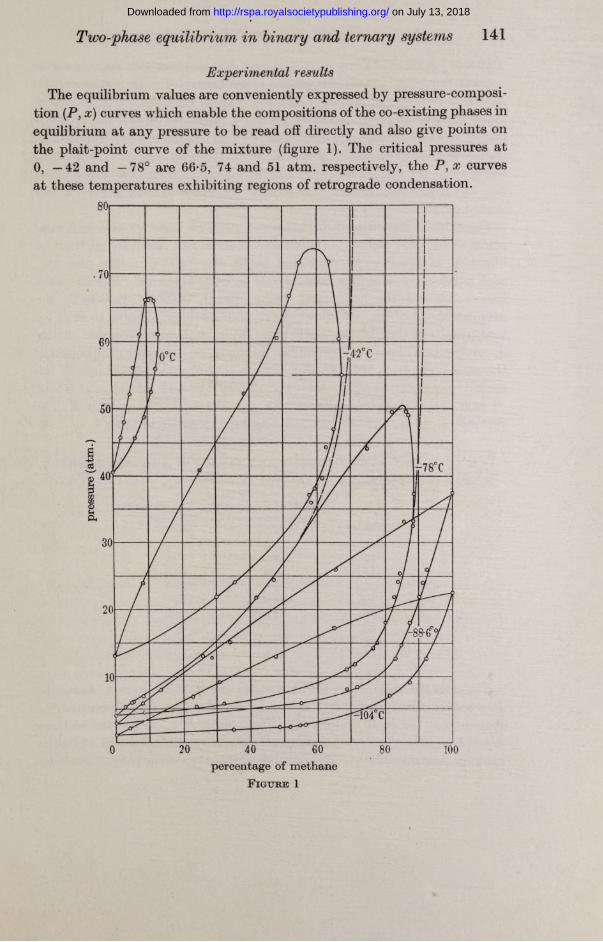
Experimental resultsThe equilibrium values are conveniently expressed by pressure-composi
tion (P, x) curves which enable the compositions of the co-existing phases in equilibrium at any pressure to be read off directly and also give points on the plait-point curve of the mixture (figure 1). The critical pressures at 0, -4 2 and -7 8 ° are 66-5, 74 and 51 atm. respectively, the P , x curves at these temperatures exhibiting regions of retrograde condensation.
percentage of methane F igure 1
on July 13, 2018http://rspa.royalsocietypublishing.org/Downloaded from
142 M. Guter, D. M. Newitt and M. Ruhemann
I t will be recalled tha t in the case of the methane-ethane system at — 78° C (about 4° above the critical temperature of pure methane), the saturated vapour and boiling-point branches of the P , x curve, as determined at progressively increasing pressures, appeared to become approximately parallel a t high pressures; neither curve indicated any appreciable change in composition with pressure above about 60 atm. and even up to 200 atm. there was no tendency for the curves to close. The same effect was noted a t — 78° C with the methane-ethylene system (figure 1, the dotted curve).
The critical pressures of methane and ethylene are 45*8 and 50*6 atm. respectively, and although the critical pressures of mixtures of the two might be expected to be somewhat higher than tha t of either pure gas, such a difference as is here noted would be quite abnormal. Further work has shown that the liquid and vapour phases of both systems in the neighbourhood of the critical temperature of methane are able to exist for long periods of time in a metastable condition without measurable change in composition. True equilibrium can, however, be reached by approaching the plait-point from the direction of high pressure, the appearance of the second phase occurring in the case of methane and ethylene at about 51 atm., and in the case of methane and ethane at about 60 atm. The revised values a t —78° for the latter system are given in table 1.
T a b l e 1. Co m po sitio n op l iq u id a n d v a po u r of a m e t h a n e -e t h a n e
SYSTEM IN EQUILIBRIUM AT VARIOUS PRESSURES; AT - 78° C (REVISED)
Percentages of methane by volume in
Pressure Liquid Vapour5 5-5 600
10 16-0 79015 29-0 •1 87-020 42-5 90-030 620 93040 73-5 94-050 80-0 92-555 82-0 90-560 86-0 86-0
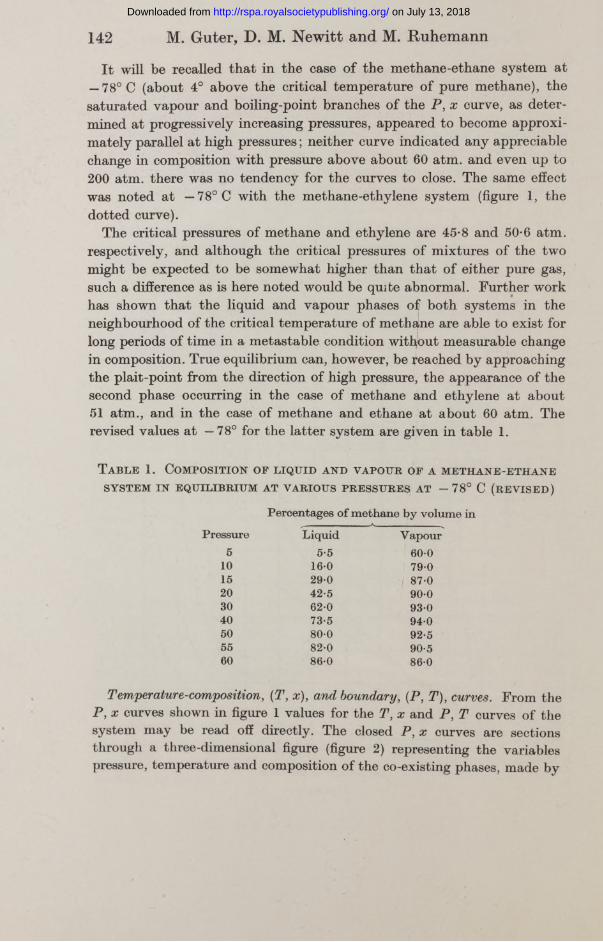
Temperature-composition, ( T, x), and boundary, (P, T), curves. From the P, x curves shown in figure 1 values for the T, x and P, T curves of the system may be read off directly. The closed P, x curves are sections through a three-dimensional figure (figure 2) representing the variables pressure, temperature and composition of the co-existing phases, made by
on July 13, 2018http://rspa.royalsocietypublishing.org/Downloaded from
planes a t right angles to the temperature axis. In the figure A B and CD are the vapour-pressure curves for pure methane and ethylene, respectively, BFC being the plait-point curve for the system terminating at the critical points B (for methane) and C (for ethylene). Sections through the solid by planes a t right angles to the composition axis give the corresponding boundary curves (e.g. EFC is the boundary curve for a mixture containing 60 % of methane), whilst sections made by planes at right angles to the pressure axis give the T, x curves for the system (e.g. NEPQN is the T, x curve a t 20 atm.). I t will be seen tha t retrograde vaporization and condensation are associated with the convexity of the solid figure with respect to two planes at right angles to one another.
Two-phase equilibrium in binary and ternary systems 143
The composition of the two phases in equilibrium. The composition of the co-existing liquid and vapour phases in equilibrium are given by the points of intersection of lines parallel to the composition axis with the saturated vapour and boiling-point curves on the x diagram. The ratio of the concentration of either component in the vapour phase to its concentration in the liquid phase is known as the equilibrium constant, or more correctly as the equilibrium ratio ; a knowledge of its value as a function of pressure or temperature is required in dealing with problems of distillation and rectification.
In the case of a mixture obeying Raoult’s law if xa, xb and za, zb are the concentrations of components A and B in the liquid and vapour phase
on July 13, 2018http://rspa.royalsocietypublishing.org/Downloaded from
respectively, and na and nb their vapour pressures a t the given tem perature, then if pis the to tal pressure of the system
— Zb = Tfb ( 1 )*a P ’ xb P ’
and a t temperatures below the critical the equilibrium ratio for one component will be independent of the nature and properties of the other.
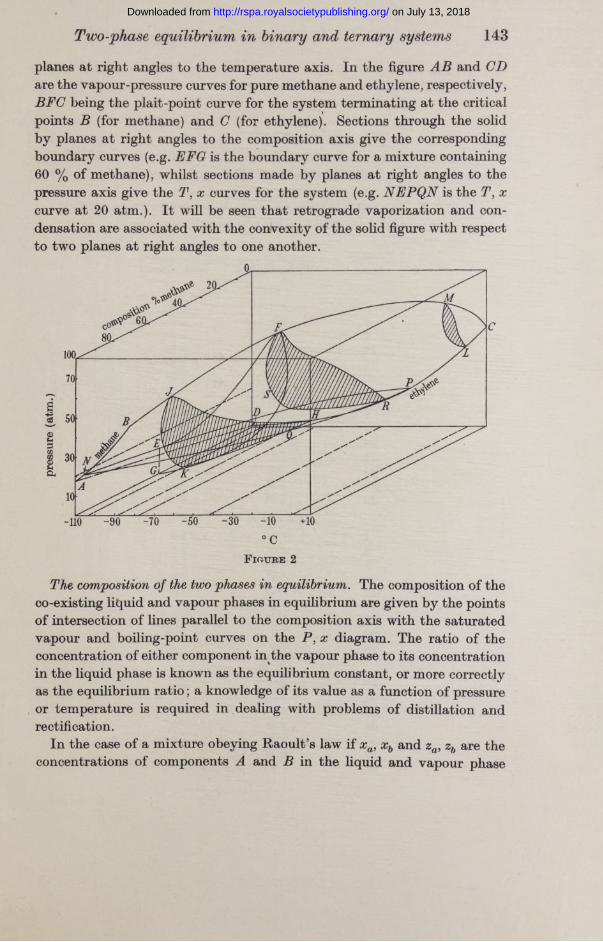
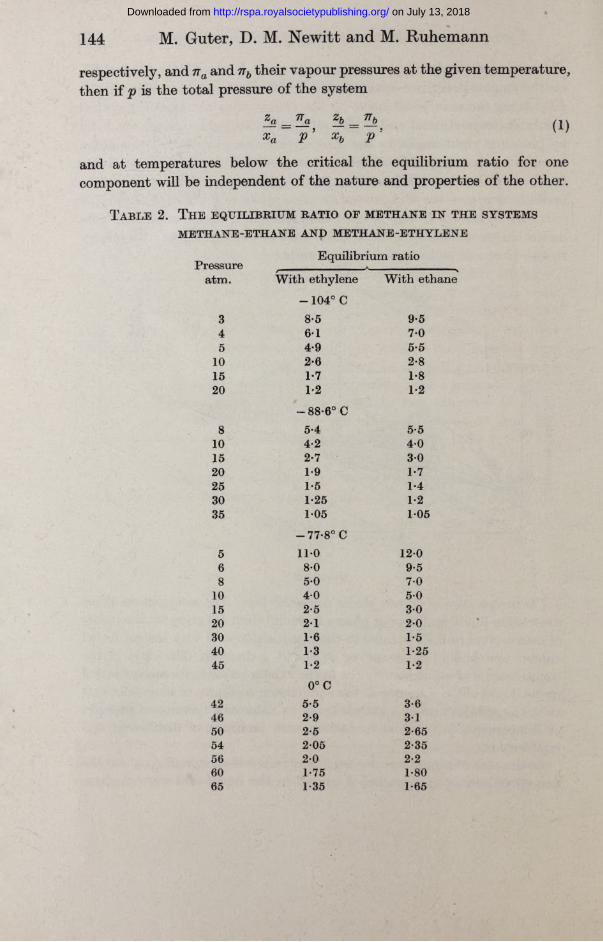
T a b l e 2. T h e e q u il ib r iu m r a t io o f m e t h a n e i n t h e s y s t e m s
METHANE-ETHANE ANP METHANE-ETHYLENE
144 M. Guter, D. M. Newitt and M. Ruhemann
PressureEquilibrium ratio
atm. W ith ethylene W ith ethane
-1 0 4 ° C3 8-5 9-54 6 1 7-05 4-9 5-5
10 2-6 2-815 1-7 1*820 1*2 1-2
— 88*6° C8 5*4 5-5
10 4-2 4 015 2-7 3 020 1-9 1-725 1-5 1*430 1*25 1*235 105 1*05
— 77*8° C5 110 12 06 8-0 9*58 5 0 7-0
10 4-0 5 015 2-5 3 020 2 1 2*030 1*6 1*540 1-3 1-2545 1-2 1*2
0°C42 5-5 3-646 2*9 3 150 2-5 2-6554 2 0 5 2-3556 2-0 2-260 1-75 1*8065 1-35 1*65
on July 13, 2018http://rspa.royalsocietypublishing.org/Downloaded from
ene
met
hane
Two-phase equilibrium in binary and ternary systems 145
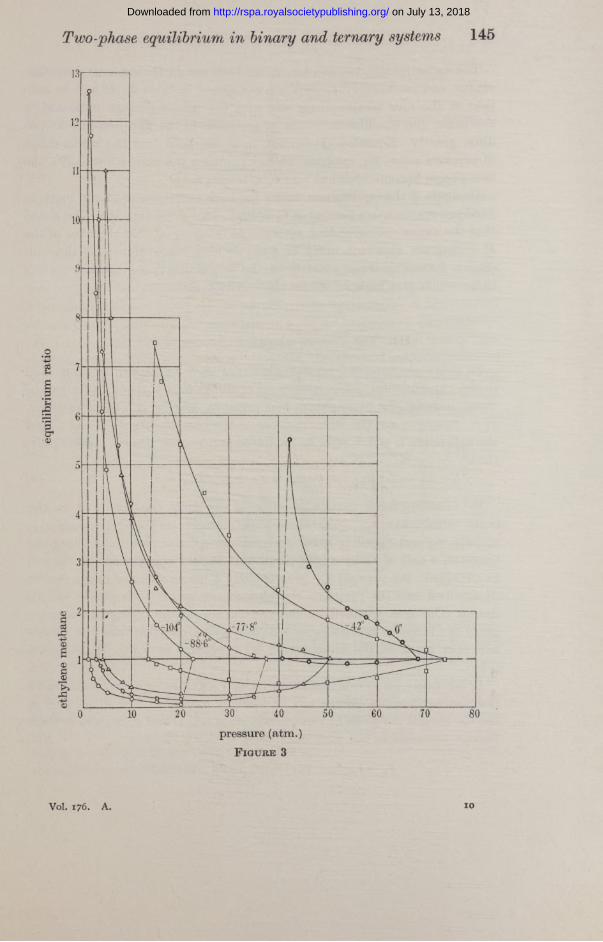
pressure (atm.) F igure 3
Vol. 176. A. 10
on July 13, 2018http://rspa.royalsocietypublishing.org/Downloaded from
146 M. Guter, D. M. Newitt and M. Ruhemann
The experimental values of z j x a for methane in the systems methane- ethane and methane-ethylene are summarized in table 2. I t will be seen tha t a t the four temperatures and over the pressure range indicated in the table, the equilibrium ratios of methane in the two systems do not differ greatly. Equation (1) cannot, however, hold over the whole range of pressure since, for example, a t any point on the plait-point curve the two phases become identical and z j x a = zbjxb = 1.
In figure 3 the equilibrium ratios for both components of the mixture methane-ethylene are plotted as functions of the pressure. I t will be noted tha t the ratios corresponding with points lying on or near the axes of the P, x diagram approach unity or some limiting high value; also the conditions favouring the separation of the mixture into its components are those which give high values for the methane ratio.
III. T h e sy st e m m e t h a n e -e t h a n e -e t h y l e n e
In a two-phase ternary system there are three degrees of freedom, and in the experimental determination of equilibrium it is usual to fix two of them, namely, the temperature and pressure, leaving one to be satisfied. I f xa, xb and xc are the mole fractions of the components and C and the subscripts L and V refer to the liquid and vapour phases, respectively, then
x aL + x bL + x cL ~ x aV + x bV + x cV ~ (2 )By selecting some particular value of the mole fraction of A in the
liquid phase, say x'aL, then at constant temperature and pressure xbL, x'cL, x'aV, xbv and x'cVwill be fixed; and employing the conventional triangular diagram, a pair of nodes on the liquid and vapour equilibrium curves will be obtained. By varying x'aL progressively a whole series of nodes can be determined and the complete equilibrium curves for both phases can be drawn. The area enclosed by the two curves on the triangular diagram gives the range of compositions within which separation into two phases can take place at the temperature and pressure to which the diagram refers.
I t can easily be shown that if the ternary mixture conforms to Raoult’s law the equilibrium curves will be straight lines. Thus, if p b and p c are the partial pressures of components A , B and G and na, nb and ttc their vapour pressures in the pure state, then
Pa = x aL7Ta > Pb = xbjAb a n d P c = Xc I 7Tc.
on July 13, 2018http://rspa.royalsocietypublishing.org/Downloaded from
Two-phase equilibrium in binary and ternary systems 147
The total pressure of the system is
Pa+Pb+Pc = P-Let the mole fraction of component A in the liquid phase be fixed; it follows tha t
a = P ~ n c V a L ^ a -V c ) bL TTb-Vc K b-K c ’
and xbL is a linear function of xaL. Similar relations can be derived for xcL and for the mole fractions of all the components in the vapour phase.
Experimental methodThe procedure for arriving at equilibrium in the two phases and for
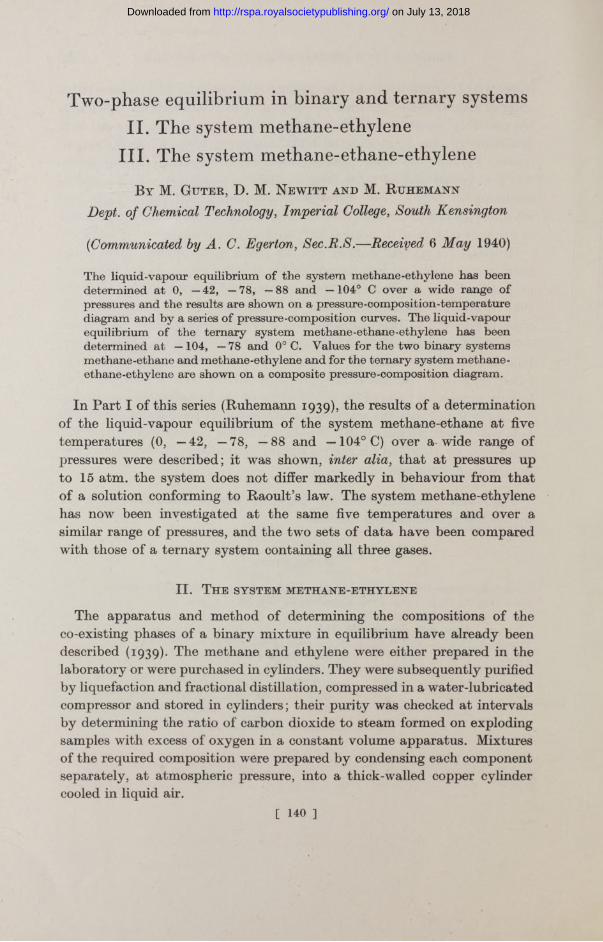
determining the composition of the liquid and vapour is similar to that described for binary mixtures (1939), save for a modification in the method of analysis required by the presence of a third component. The catharo- metric method of analysis determines the composition of binary gas mixtures accurately and rapidly, provided the thermal conductivities of the components differ appreciably, but it is not easily adapted for the analysis of ternary mixtures. In the present instance, however, it was found possible to remove chemically and estimate one of the gases, namely,
vapour
to catharometer
scrubbersF igure 4
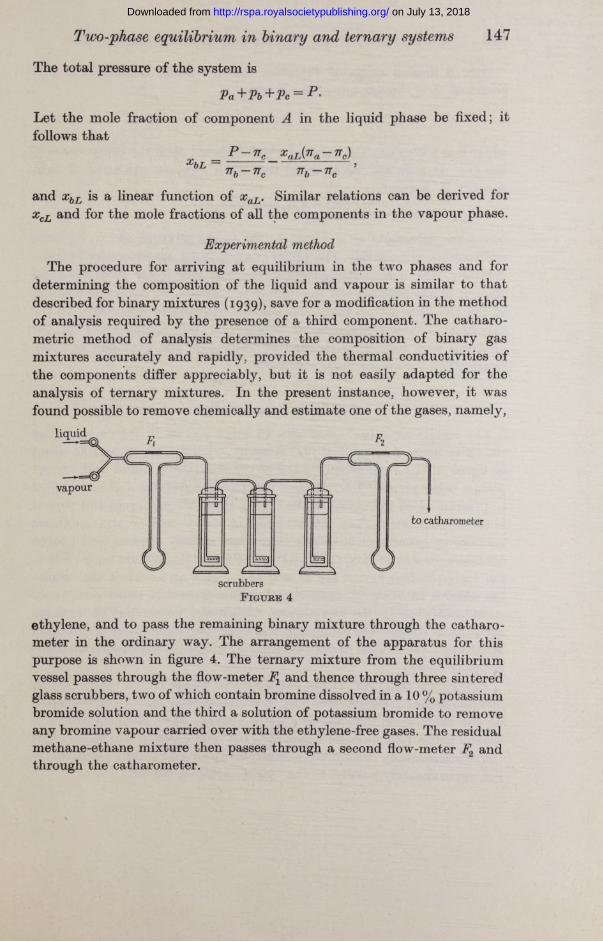
ethylene, and to pass the remaining binary mixture through the catharometer in the ordinary way. The arrangement of the apparatus for this purpose is shown in figure 4. The ternary mixture from the equilibrium vessel passes through the flow-meter and thence through three sintered glass scrubbers, two of which contain bromine dissolved in a 10 % potassium bromide solution and the third a solution of potassium bromide to remove any bromine vapour carried over with the ethylene-free gases. The residual methane-ethane mixture then passes through a second flow-meter and through the catharometer.
on July 13, 2018http://rspa.royalsocietypublishing.org/Downloaded from
148 M. Guter, D. M. Newitt and M. Ruhemann
Over a limited range of velocities the flow-meter reading is proportional to v, the amount of gas passing,
R — av,
where a is a constant the value of which depends upon the composition of the gas. I t may also be assumed th a t for a mixture consisting of components A, B and G
am = xaaa + xbab + xcac,
where the subscripts m, a, b and c refer to the mixture and to its three components, respectively. The values of and are determined experimentally. The corrected readings of the first flow-meter gives the total amount of gas passing, and the difference between the corrected readings of the two flow-meters gives the amount of ethylene absorbed. In the experimental determinations of equilibrium the compositions of the mixtures were frequently checked by absorption and explosion analysis, satisfactory agreement being obtained.
Experimental results
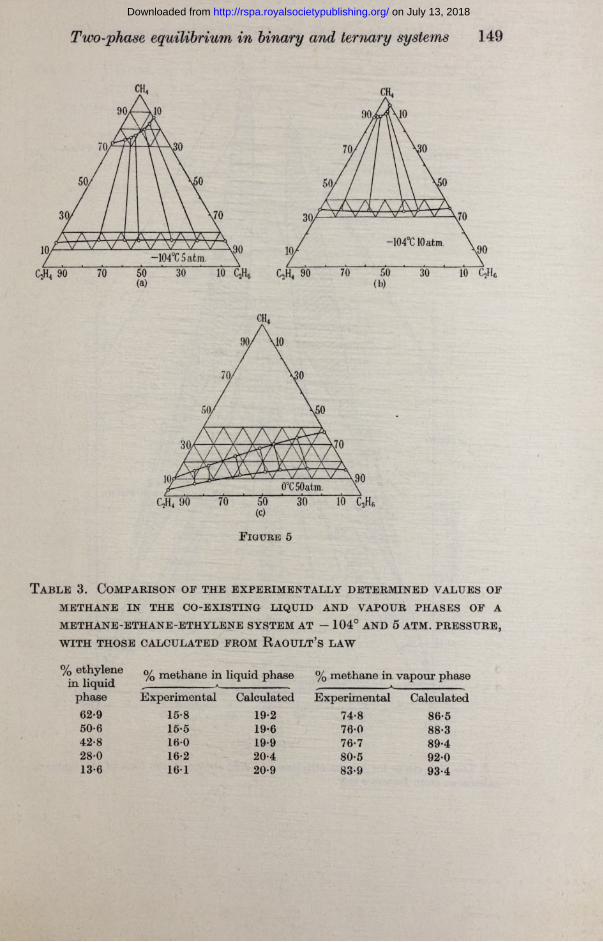
The results a t —104° (at 5 and 10 atm.) and at 0° (at 50 atm.) are shown in figure 5 a, b and c, and those at —78° (at 10, 20 and 35 atm.) in figure 6, the equilibrium points of the co-existing liquid and vapour phases being joined by connodals. Comparing figure 5 a and b the effect of pressure upon the extent of the region of co-existing liquid and vapour is clearly indicated; thus, for example, a t —104° and 10 atm. mixtures containing upwards of 88% of methane are entirely gaseous whilst those containing less than 34% are liquid; a t the same temperature but a t 5 atm. the corresponding figures are 72 and 14%. I t is also evident th a t whilst the relative amounts of ethylene and ethane present in either phase vary considerably along the equilibrium curves the proportion of methane shows little change; the connodals, therefore, give the relative distribution of ethylene and ethane in the two phases for slightly fluctuating methane concentrations.
Employing equation (3) the experimental values of the concentration of a component of the mixture may be compared with the values calculated on the assumption that Raoult’s law is obeyed. Thus, from the values in table 3 which refer to equilibrium at —104° and 5 atm. it will be seen that the experimentally determined saturated vapour and boiling-point curves run approximately parallel to the “ ideal” solution curves.
on July 13, 2018http://rspa.royalsocietypublishing.org/Downloaded from
Two-phase equilibrium in binary and ternary systems 149
\ 7 \ 7 \ r v
10 c2h,
F igure 5
T a b l e 3. Com pariso n of th e e x pe r im e n t a l l y d e t e r m in e d v a l u e s of
METHANE IN THE CO-EXISTING LIQUID AND VAPOUR PHASES OF A METHANE-ETHANE-ETHYLENE SYSTEM AT — 104° AND 5 ATM. PRESSURE, WITH THOSE CALCULATED FROM RAOULT’S LAW
% ethylene in liquid
phase
% methane in liquid phase *<
Experimental Calculated
% methane in vapour phase ** .................-
Experimental Calculated62-9 15-850-6 15-542-8 16028-0 16-213-6 161
19-2 74-819-6 76-019-9 76-720-4 80-620-9 83-9
86-588- 389- 492- 093- 4
on July 13, 2018http://rspa.royalsocietypublishing.org/Downloaded from
pres
sure
(a
150 M. Guter, D. M. Newitt and M. RuhemannH
35atm;
20atm
lOatm
^curvefor ethane-ethylene K
F ig u r e 6*
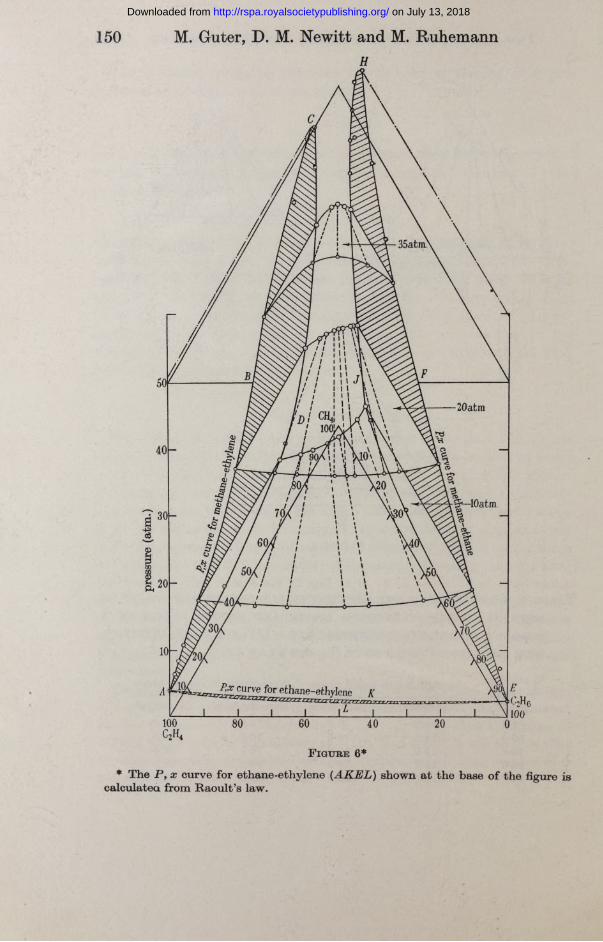
* The P, x curve for ethane-ethylene ( AKshown at the base of the figure is calculated from Raoult’s law.
on July 13, 2018http://rspa.royalsocietypublishing.org/Downloaded from
Two-phase equilibrium in binary and ternary systems 151
T a ble 4. V a l u e s op th e ratios concentratio n of e t h y l e n e : co n c en tr a tio n OP ETHANE IN THE CO-EXISTING VAPOUR AND LIQUID PHASES OP THE SYSTEM METHANE-ETHANE-ETHYLENE
Vapour phase Liquid phase. , *■ ............ ^ x
Ratio Ratio Ratioethylene/ethane ethylene/ethane (xb/xe)v
% methane {%blxc)r % methane
— 104° C and 5 atm.
(xb/xe)L (V«c)x
74-8 3-94 15-8 2-95 1-3476-0 2-33 15-5 1-50 1-5676-7 1-74 16-0 1-05 1-6680-5 0*76 16-2 0-50 1-5183-9 0-34 16-1
— 104° C and 10 atm.
0-19 1-77
88-9 6-00 34-1 5-28 1-1489-0 2-76 33-6 1-63 1-6490-7 1-07 33-0 0-535 2-0091-6 0-714 33-5
— 78° C and 10 atm.
0-33 2-16
67-9 5-17 14-9 3-65 1-4269*1 2-92 14-4 2-05 1-4371-3 1-577 15-1 0-956 1-6478-7 0-625 15-5 0-673 0-9379-5 0-322 17-7
— 78° C and 20 atm.
0-237 1-36
84-6 4-92 37-2 3-94 1-2586-5 3-35 37-5 2-38 1-4187-4 1-33 37-1 1-07 1-2488-3 0-95 37-3 0-855 11188-4 0-66 37-8 0-73 0-89688-5 0-24 38-2 . 0-40 0-59588-9 0-12 38-8
— 78° C and 35 atm.
0-27 0-44
94-3 3-07 75-2 4-63 0-663950 0-723 77-9 0-99 0-7393-9 0-22 73-2
0° C and 50 atm.
0-218 1-01
14-3 9-75 7-4 7-12 1-3317-1 4-67 9-0 3-79 1-2322-8 1-98 12-3 1-73 11427-5 1-07 14-3 0-94 11330-1 0-73 15-5 0-66 1-0933-4 0-32 16-1 0-33 0-975
on July 13, 2018http://rspa.royalsocietypublishing.org/Downloaded from
152 M. Guter, D. M. Newitt and M. Ruhemann
The relation between the two binary systems and the ternary system may be represented graphically as in figure 6 which refers to data a t — 78°. The equilibrium curves and their connodals a t 10, 20 and 35 atm. are shown on the triangular prism the vertical axis of which refers to pressure. The P, x curves for the binary systems ( and E F H J) will passthrough the extremities of the equilibrium curves along the appropriate axis. I t will be observed th a t they are distorted in such a way th a t the connodals make an angle of 60° with the horizontal.
With increase of pressure the area of the region of co-existing liquid and vapour gradually diminishes until a t a pressure corresponding with the point C (50*8 atm.), which lies on the plait-point curve of the binary methane-ethylene system, the saturated vapour and boiling-point curves of the ternary mixture m eet; a critical state may then be defined a t the unique point a t which a connodal is tangential to the curve. On progressively increasing the pressure from 50*8 atm. the region of co-existing liquid and vapour continues to diminish, and at the point H (59*9 atm.), which lies on the plait-point curve of the methane-ethane system, only one phase remains.
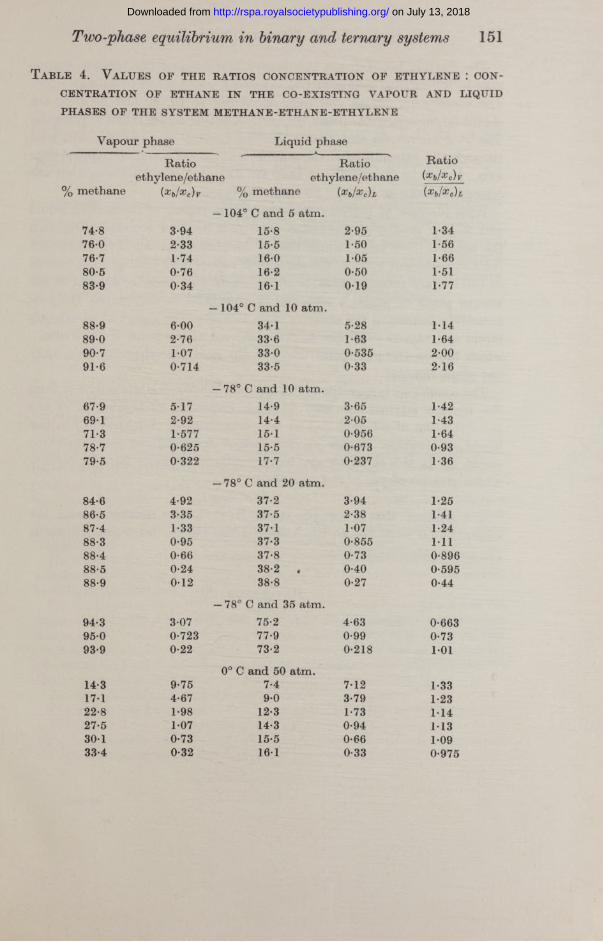
The conditions favourable to the separation of ethane and ethylene from the ternary mixture are seen from an inspection of the ratios of the concentration of ethylene ( xb)to the concentration of ethane (xc) in the liquid and vapour phases a t the various temperatures and pressures (table 4). In this table are also listed values of the ratio (xb/xc)v : (xb/xc)L which give the slopes of the connodals.
The authors’ thanks are due to Mr H. C. Lu for assistance with the experimental work and to the Anglo-Iranian Oil Co. for a grant towards the cost of the investigation.
R e f e r e n c e
Ruhemann, M. 1939 Proc. Roy. Soc. A, 171, 121.
on July 13, 2018http://rspa.royalsocietypublishing.org/Downloaded from