Embed Size (px)
Citation preview
RESEARCH ARTICLE Open Access
Type of tea consumption and depressivesymptoms in Chinese older adultsYao Yao1,2†, Huashuai Chen2†, Lele Chen3, Sang-Yhun Ju4, Huazhen Yang5, Yi Zeng1,2*, Danan Gu6* andTze Pin Ng7*
Abstract
Background: Existing research indicates that tea drinking may exert beneficiary effects on mental health. However,associations between different types of tea intake and mental health such as depression have not been fullyexamined. The purpose of this study was to examine the associations of green tea, fermented tea, and floral teaconsumption with depressive symptoms.
Methods: We used data from the 2018 wave of the Chinese Longitudinal Healthy Longevity Survey, a nationwidesurvey on older adults in mainland China. A total of 13,115 participants (mean age 83.7 years, 54.2% were women)with valid responses were included in the analysis. The type (green, fermented [black, Oolong, white, yellow, dark,and compressed teas], and floral) and the frequency of tea consumption were recorded, and depressive symptomswere assessed using 10-item of the Center for Epidemiologic Studies Depression Scale (CES-D-10). We examinedthe associations between the type and the frequency of tea intake and depression, controlling for a set ofdemographic, socioeconomic, psychosocial, behavioral, and health-related variables.
Results: Overall, intakes of green tea, fermented tea, and floral tea were all significantly associated with lower prevalenceof depressive symptoms, independent of other risk factors. Compared with the group of no tea intake, the adjusted ORsof depressive symptoms for daily green tea, fermented tea, and floral tea intake were 0.85 (95% CI: 0.76–0.95), 0.87 (95%CI: 0.76–0.99), and 0.70 (95% CI: 0.59–0.82), respectively. Linear associations were observed between the frequencies of allthree types of tea intake and depressive symptoms (P < 0.05 for trends for all three types). The associations of the typeand the frequency of tea intake and depressive symptoms were robust in several sensitivity analyses.
Conclusions: Among Chinese older adults, regularly consumed any type of tea (green, fermented, or floral) were less likelyto show depressive symptoms, the associations seemed more pronounced among floral tea and green tea drinkers.
Keywords: Type of tea intake, Mental health, Depressive symptoms, Older adults, CLHLS
© The Author(s). 2021 Open Access This article is licensed under a Creative Commons Attribution 4.0 International License,which permits use, sharing, adaptation, distribution and reproduction in any medium or format, as long as you giveappropriate credit to the original author(s) and the source, provide a link to the Creative Commons licence, and indicate ifchanges were made. The images or other third party material in this article are included in the article's Creative Commonslicence, unless indicated otherwise in a credit line to the material. If material is not included in the article's Creative Commonslicence and your intended use is not permitted by statutory regulation or exceeds the permitted use, you will need to obtainpermission directly from the copyright holder. To view a copy of this licence, visit http://creativecommons.org/licenses/by/4.0/.The Creative Commons Public Domain Dedication waiver (http://creativecommons.org/publicdomain/zero/1.0/) applies to thedata made available in this article, unless otherwise stated in a credit line to the data.
* Correspondence: [email protected]; [email protected];[email protected]†Yao Yao and Huashuai Chen contributed equally to this work.1Center for Healthy Aging and Development Studies, Raissun Institute forAdvanced Studies, National School of Development, Peking University,Beijing 100871, China6Independent Researcher, New York, NY 10017, USA7Department of Psychological Medicine, Yong Loo Lin School of Medicine,National University of Singapore, Singapore, SingaporeFull list of author information is available at the end of the article
Yao et al. BMC Geriatrics (2021) 21:331 https://doi.org/10.1186/s12877-021-02203-z
BackgroundDepression is a serious mental and public health prob-lem among older adults [1, 2]. Depression is the leadingcause of disability worldwide, accounting for 5.7% ofyears lived with disability among the older adults [2].Depression is underdiagnosed and undertreated [1], es-pecially for those who were undergoing adverse eventssuch as COVID-19 pandemic [3]. Given the increasedrisk of disability and mortality associated with depres-sion [4, 5], it is vitally important to consider preventiveinterventions that improve the health and quality of lifeof older adults and reduce the burden on families andsocieties. Potentially useful interventions that preventdepression include cognitive and behavioral interven-tions, such as mindfulness-based therapy and lifestyle in-terventions [6, 7]. Recent research has also drawnattention to the potential anti-depressant effect of regu-lar tea consumption [8].Human trials, mouse models, and in vitro experiments
have explored the underlying mechanisms for the neuro-protective effect and invigorating quality of tea. In micemodels, green tea polyphenols exert antidepressant-likeeffects by inhibition of the hypothalamic–pituitary–ad-renal axis [9]. Green tea catechins, such as epigallocate-chin gallate (ECCG), also exert anti-inflammatory andneuroprotective actions in laboratory experiments [10].Anti-inflammatory properties of flavonoids from greentea are also found to be associated with a lower risk ofdepression [11, 12]. Clinical trials show that L-theanine,a unique component in green tea, can ameliorate thestress-related symptoms and depressive disorders [13].Evidence from human electroencephalograph (EEG)studies shows that L-theanine significantly increases ac-tivity in the alpha frequency band which indicates men-tal relaxation [14]. In sum, these observations supportthe argument that tea consumption has benefits in relax-ing mood and preventing depression.However, to date, epidemiological evidence for the
beneficial effect of tea consumption in reducing the riskand the severity of depression in humans is inconclusive.Mixed findings are reported from less than a dozencross-sectional and prospective cohort studies [15–18]and two meta-analyses [19, 20] published in 2015 and2016 have summarized the heterogeneous associationbetween tea drinking and depression with divergent con-clusions. Since then, there have been several more cross-sectional studies that support an inverse association oftea consumption with depression [21–26]. However,there remains a paucity of studies that examine thedose-response effect for different types of tea. Bioactivecomponents, which vary in different types of tea throughdiverse processing methods in the markets, may accountfor the heterogeneity of findings [27, 28]. Green tea hasa higher content of catechins than fermented teas (such
as Oolong and black teas). The fermentation processduring tea manufacturing reduces the levels of catechinsbut elevates levels of gallic acid, theaflavins and thearu-bigins [29]. There is a great heterogeneity of types of teaproduced that are available and consumed around theworld and particularly in China where tea drinkingoriginated.In this study, we analyzed nationwide data of a large
nationally representative sample of older adults whichidentified several different types of tea consumption(green tea, fermented tea, and floral tea) widely distrib-uted geographically across China among the teadrinkers. We aimed to examine the associations betweenthe types and the frequencies of tea consumption anddepressive symptoms among older population, we add-itionally conducted stratified analyses by sex, age, andgeographic regions to examine the heterogeneity of theassociations.
MethodsStudy populationThe eighth wave of the Chinese Longitudinal HealthyLongevity Survey (CLHLS) in 2018/2019 (briefly as2018) was used to fulfill our research goals. The CLHLSwas conducted in more than 630 counties/cities in 22provinces of 31 provinces in mainland China plus oncounty in Hainan Province. The study sampled prov-inces roughly represents about 85% of the Chinesepopulation in 2020. Given its research focus on longev-ity, the CLHLS oversampled long-lived populations. Forexample, in the sampled counties, for every 3 centenar-ians, 4 participants aged 80–89, 4 participants aged 90–99, and 5 participants aged 65–79 were recruited basedon predesignated age and sex. If there was no suchmatched person, a person will be recruited in neighbor-ing county with same predesignated age and sex. Inother words, the CLHLS oversampled centenarians andthe oldest-old (aged 80 years or older). Detailed informa-tion of the CLHLS can be found elsewhere [30, 31].The 2018 wave of the CLHLS collected the self-
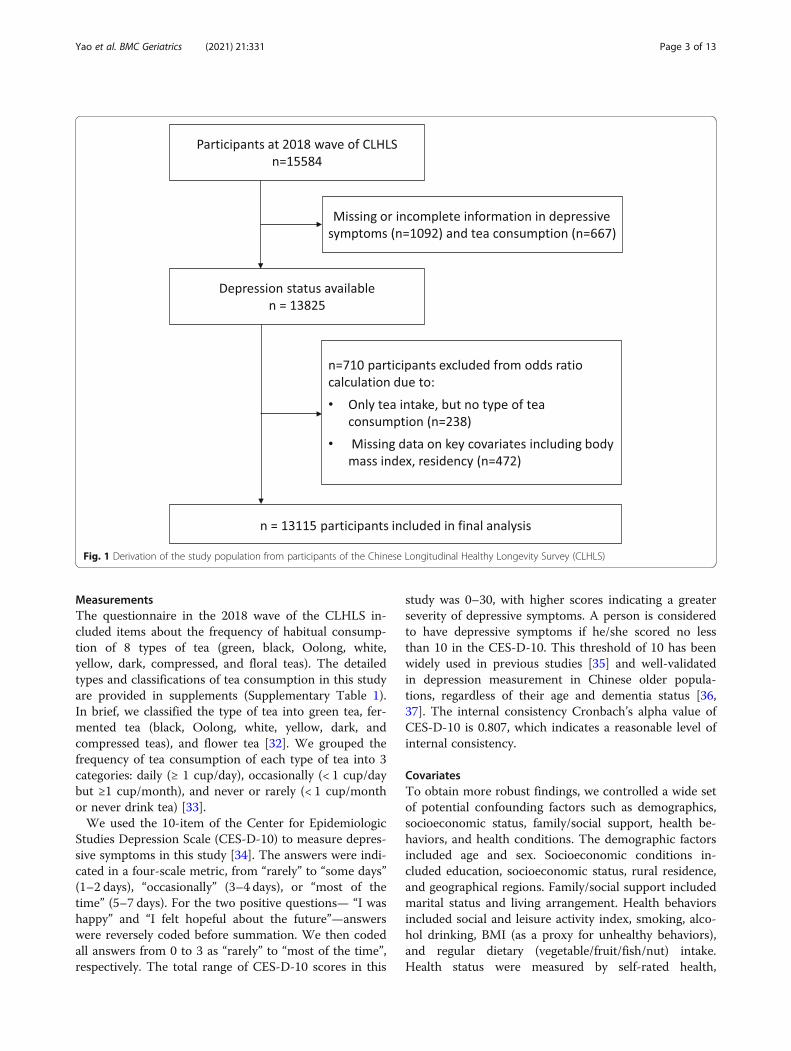
reported types and frequencies of tea intake and assesseddepressive symptoms by the Center for EpidemiologicStudies Depression Scale. After excluding 2469 partici-pants with missing data on depressive symptoms, self-reported types of tea consumption, key covariables, thefinal analytical sample used in this study included 13,115adults aged 65 years or older (5121 were aged 65–79,6301 were aged 80–99, and 1693 were aged 100 years orolder) (Fig. 1).The Biomedical Ethics Committee, Peking University
(IRB00001052–13074) approved the CLHLS. All partici-pants or their legal representatives signed written con-sent forms to participate in the baseline and follow-upsurveys.
Yao et al. BMC Geriatrics (2021) 21:331 Page 2 of 13
MeasurementsThe questionnaire in the 2018 wave of the CLHLS in-cluded items about the frequency of habitual consump-tion of 8 types of tea (green, black, Oolong, white,yellow, dark, compressed, and floral teas). The detailedtypes and classifications of tea consumption in this studyare provided in supplements (Supplementary Table 1).In brief, we classified the type of tea into green tea, fer-mented tea (black, Oolong, white, yellow, dark, andcompressed teas), and flower tea [32]. We grouped thefrequency of tea consumption of each type of tea into 3categories: daily (≥ 1 cup/day), occasionally (< 1 cup/daybut ≥1 cup/month), and never or rarely (< 1 cup/monthor never drink tea) [33].We used the 10-item of the Center for Epidemiologic
Studies Depression Scale (CES-D-10) to measure depres-sive symptoms in this study [34]. The answers were indi-cated in a four-scale metric, from “rarely” to “some days”(1–2 days), “occasionally” (3–4 days), or “most of thetime” (5–7 days). For the two positive questions— “I washappy” and “I felt hopeful about the future”—answerswere reversely coded before summation. We then codedall answers from 0 to 3 as “rarely” to “most of the time”,respectively. The total range of CES-D-10 scores in this
study was 0–30, with higher scores indicating a greaterseverity of depressive symptoms. A person is consideredto have depressive symptoms if he/she scored no lessthan 10 in the CES-D-10. This threshold of 10 has beenwidely used in previous studies [35] and well-validatedin depression measurement in Chinese older popula-tions, regardless of their age and dementia status [36,37]. The internal consistency Cronbach’s alpha value ofCES-D-10 is 0.807, which indicates a reasonable level ofinternal consistency.
CovariatesTo obtain more robust findings, we controlled a wide setof potential confounding factors such as demographics,socioeconomic status, family/social support, health be-haviors, and health conditions. The demographic factorsincluded age and sex. Socioeconomic conditions in-cluded education, socioeconomic status, rural residence,and geographical regions. Family/social support includedmarital status and living arrangement. Health behaviorsincluded social and leisure activity index, smoking, alco-hol drinking, BMI (as a proxy for unhealthy behaviors),and regular dietary (vegetable/fruit/fish/nut) intake.Health status were measured by self-rated health,
Fig. 1 Derivation of the study population from participants of the Chinese Longitudinal Healthy Longevity Survey (CLHLS)
Yao et al. BMC Geriatrics (2021) 21:331 Page 3 of 13
cognitive impairment, medical illness, comorbidity, anddisability in activities of daily living (ADL). All data weregathered by well-trained research teams through face-to-face home interviews. The sampled older adults were en-couraged to answer as many questions as possible askedby the research team member. If the sampled older adultwas not able to answer a question or do not the answer,the next-of-kin, the primary caregiver or other infor-mants would be called to serve as proxy to provide theanswer [38].Age was calculated according to self-reported date of
birth with validations from various sources such ashousehold registration record (hukou), personal identifi-cation card, genealogical records, ages of family mem-bers, and so forth. Dates were converted into Georgiancalendar dates if they were based on Chinese lunar cal-endar dates. Levels of educational attainment weregrouped into three categories according to years ofschooling (0, 1–6, and ≥ 7 years). Current residence wasdichotomized as “urban residence” or “rural residence”.Given its multidimensionality and complex of socioeco-nomic status and unavailability of an overall index in theCLHLS, we generated an overall socioeconomic statusindex by using a principal component analysis (PCA)based on four questions (primary occupation before re-tirement [white collar vs. others], family economic con-dition [a Likert scale with five points], retirementearnings, and living expenditure). Following some previ-ous practice [35, 39], a compositional score based on thefirst component generated from PCA has been suggestedto be a qualified measure of socioeconomic status andhas been widely employed in previous studies. Maritalstatus was divided as “currently married and living withspouse” or others (widowed, separated, divorced, ornever married). Living arrangement was grouped into 3categories: living with family members or others, livingalone, and living in an institution. Social and leisure ac-tivity score was calculated by eight types of activities(whether a respondent did gardening, practiced Tai Chi,participated in square dance, raised poultry or pets,reading, playing Mahjong or cards, listening to the radioor watching TV, and participating in community socialactivities) and we scored each activity 1 for ‘never’, 2 for‘sometimes’ 3 for ‘almost every day’; The score rangedfrom 8 to 24 with a higher score indicating more leisureactivities, and the low social and leisure activity level wasdefined by the score less than 14. Smoking status was di-chotomized as “non-current smoker or never-smoker”vs. “current smoker”, a similar approach was taken todefine alcohol consumption and physical activity. Dietaryintake, including vegetables, fruit, fish, and nut, were di-chotomized as “regular intake” or “occasional or seldomintake”. The body mass index (BMI) was calculated asweight in kilograms divided by height in meters squared.
Cognitive function was tested by using the Chinese ver-sion of the 30-point Mini-Mental State Examination(MMSE), and cognitive impairment was defined by anMMSE total score of < 24 [31]. The index of activity ofdaily living (ADL) was assessed by the Katz index [40],and we defined ADL disability as needing personal as-sistance in performing one or more of the five essentialactivities (bathing, transferring, dressing, eating, and toi-leting) or being incontinent [41]. We ascertained 14 self-reported medical illnesses, including hypertension, dia-betes, dyslipidemia, heart disease, stroke, pneumonia(asthma/COPD), cataract or glaucoma, cancer, gastritis,arthritis, cholecystitis, rheumatism, nephritis, and hepa-titis; we grouped the medical illness into 3 categoriessimilar to some previous studies [34]: “chronic inflam-matory disorders (heart disease, stroke, diabetes, pneu-monia, gastritis, arthritis, cholecystitis, rheumatism,nephritis, and hepatitis)”, “other disorders”, and “none”.Comorbidity was defined as having 5 or more medicalillnesses. Self-rated health was defined as “excellent orgood” or “average or poor”. We considered geographicalregion on the basis of residential address to account fortypes of tea production areas [42] as well as differencesin regional economic developments and social culturesin China: Northern China (Beijing, Tianjin, Hebei,Shanxi, Shaanxi, Shandong, Liaoning, Jilin, and Heilong-jiang provinces), Eastern China (Shanghai, Jiangsu, Zhe-jiang, and Fujian provinces), Central China (Henan,Hubei, Jiangxi, Anhui, and Hunan provinces), South-western China (Guangdong, Guangxi, Chongqing, Si-chuan, and Hainan provinces) (Supplementary Figure 1).
Statistical analysesThe subjects’ characteristics according to categories oftype of tea consumption were compared by using ana-lysis of variance or chi-square test, as appropriate. Weused multivariate logistic regression analysis to calculateodds ratios (ORs) of depressive symptoms for the type oftea consumption, including green tea, fermented tea,and floral tea, with no habitual tea intake treated as thereference group. The base model (Model 1) includedtypes of tea consumption plus demographic variables;Model 2 further controlled for socioeconomic variables:education, socioeconomic status, rural residence, andgeographical regions; Model 3 additionally controllingfor psychosocial and behavioral variables: marital status,living arrangement, social and leisure activity index,smoking, alcohol drinking, BMI, regular dietary (vege-table/fruit/fish/nut) intake; Model 4 added health vari-ables in Model 3: self-rated health, cognitiveimpairment, medical illness, comorbidity, and ADL dis-ability. In detailed analyses examining the dose-effect re-lation between the intake of green tea or fermented teaor floral tea with depressive symptoms, we classified the
Yao et al. BMC Geriatrics (2021) 21:331 Page 4 of 13
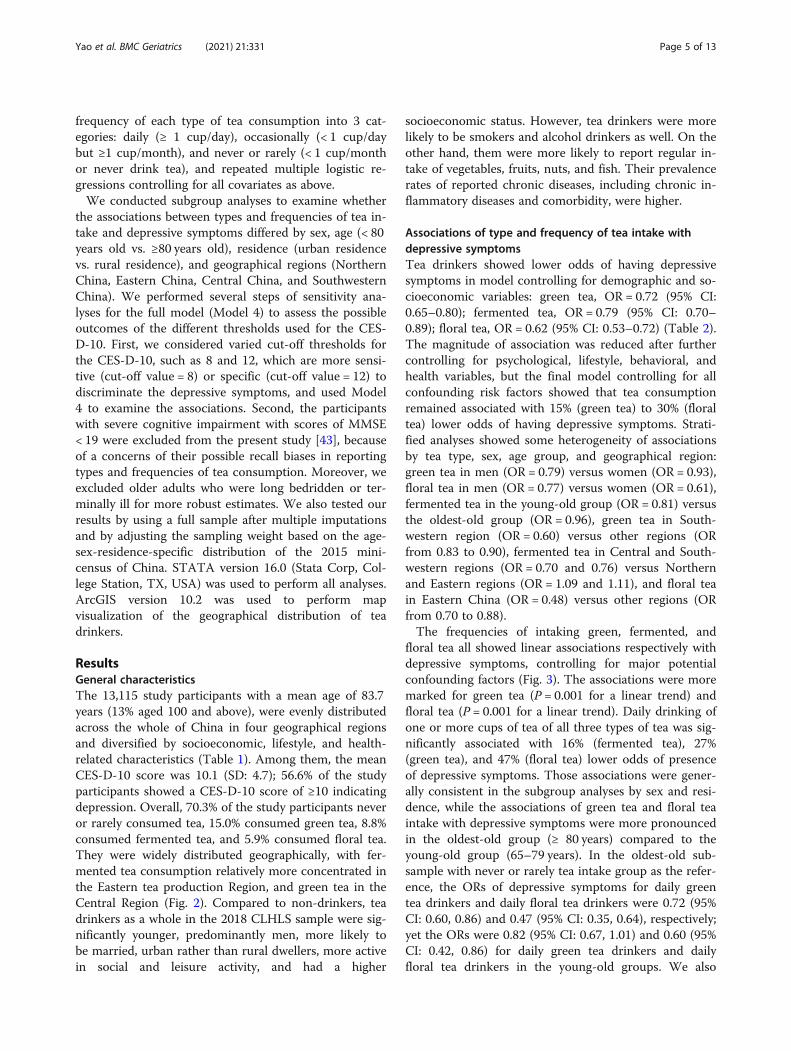
frequency of each type of tea consumption into 3 cat-egories: daily (≥ 1 cup/day), occasionally (< 1 cup/daybut ≥1 cup/month), and never or rarely (< 1 cup/monthor never drink tea), and repeated multiple logistic re-gressions controlling for all covariates as above.We conducted subgroup analyses to examine whether
the associations between types and frequencies of tea in-take and depressive symptoms differed by sex, age (< 80years old vs. ≥80 years old), residence (urban residencevs. rural residence), and geographical regions (NorthernChina, Eastern China, Central China, and SouthwesternChina). We performed several steps of sensitivity ana-lyses for the full model (Model 4) to assess the possibleoutcomes of the different thresholds used for the CES-D-10. First, we considered varied cut-off thresholds forthe CES-D-10, such as 8 and 12, which are more sensi-tive (cut-off value = 8) or specific (cut-off value = 12) todiscriminate the depressive symptoms, and used Model4 to examine the associations. Second, the participantswith severe cognitive impairment with scores of MMSE< 19 were excluded from the present study [43], becauseof a concerns of their possible recall biases in reportingtypes and frequencies of tea consumption. Moreover, weexcluded older adults who were long bedridden or ter-minally ill for more robust estimates. We also tested ourresults by using a full sample after multiple imputationsand by adjusting the sampling weight based on the age-sex-residence-specific distribution of the 2015 mini-census of China. STATA version 16.0 (Stata Corp, Col-lege Station, TX, USA) was used to perform all analyses.ArcGIS version 10.2 was used to perform mapvisualization of the geographical distribution of teadrinkers.
ResultsGeneral characteristicsThe 13,115 study participants with a mean age of 83.7years (13% aged 100 and above), were evenly distributedacross the whole of China in four geographical regionsand diversified by socioeconomic, lifestyle, and health-related characteristics (Table 1). Among them, the meanCES-D-10 score was 10.1 (SD: 4.7); 56.6% of the studyparticipants showed a CES-D-10 score of ≥10 indicatingdepression. Overall, 70.3% of the study participants neveror rarely consumed tea, 15.0% consumed green tea, 8.8%consumed fermented tea, and 5.9% consumed floral tea.They were widely distributed geographically, with fer-mented tea consumption relatively more concentrated inthe Eastern tea production Region, and green tea in theCentral Region (Fig. 2). Compared to non-drinkers, teadrinkers as a whole in the 2018 CLHLS sample were sig-nificantly younger, predominantly men, more likely tobe married, urban rather than rural dwellers, more activein social and leisure activity, and had a higher
socioeconomic status. However, tea drinkers were morelikely to be smokers and alcohol drinkers as well. On theother hand, them were more likely to report regular in-take of vegetables, fruits, nuts, and fish. Their prevalencerates of reported chronic diseases, including chronic in-flammatory diseases and comorbidity, were higher.
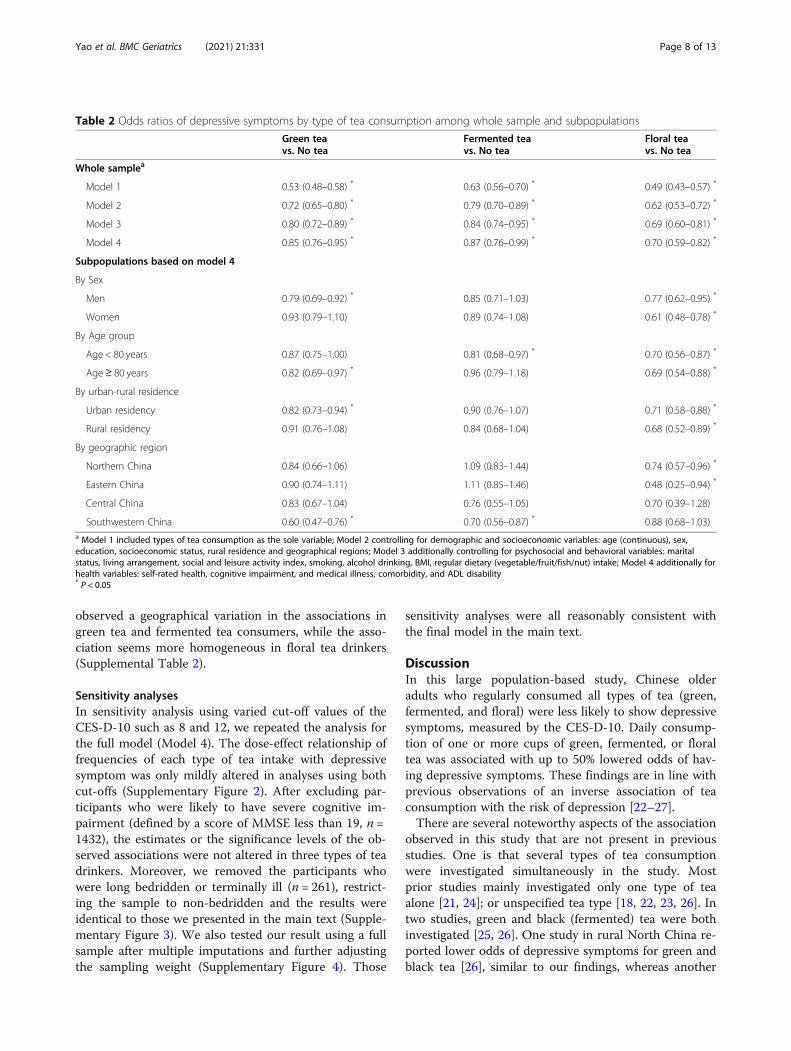
Associations of type and frequency of tea intake withdepressive symptomsTea drinkers showed lower odds of having depressivesymptoms in model controlling for demographic and so-cioeconomic variables: green tea, OR = 0.72 (95% CI:0.65–0.80); fermented tea, OR = 0.79 (95% CI: 0.70–0.89); floral tea, OR = 0.62 (95% CI: 0.53–0.72) (Table 2).The magnitude of association was reduced after furthercontrolling for psychological, lifestyle, behavioral, andhealth variables, but the final model controlling for allconfounding risk factors showed that tea consumptionremained associated with 15% (green tea) to 30% (floraltea) lower odds of having depressive symptoms. Strati-fied analyses showed some heterogeneity of associationsby tea type, sex, age group, and geographical region:green tea in men (OR = 0.79) versus women (OR = 0.93),floral tea in men (OR = 0.77) versus women (OR = 0.61),fermented tea in the young-old group (OR = 0.81) versusthe oldest-old group (OR = 0.96), green tea in South-western region (OR = 0.60) versus other regions (ORfrom 0.83 to 0.90), fermented tea in Central and South-western regions (OR = 0.70 and 0.76) versus Northernand Eastern regions (OR = 1.09 and 1.11), and floral teain Eastern China (OR = 0.48) versus other regions (ORfrom 0.70 to 0.88).The frequencies of intaking green, fermented, and
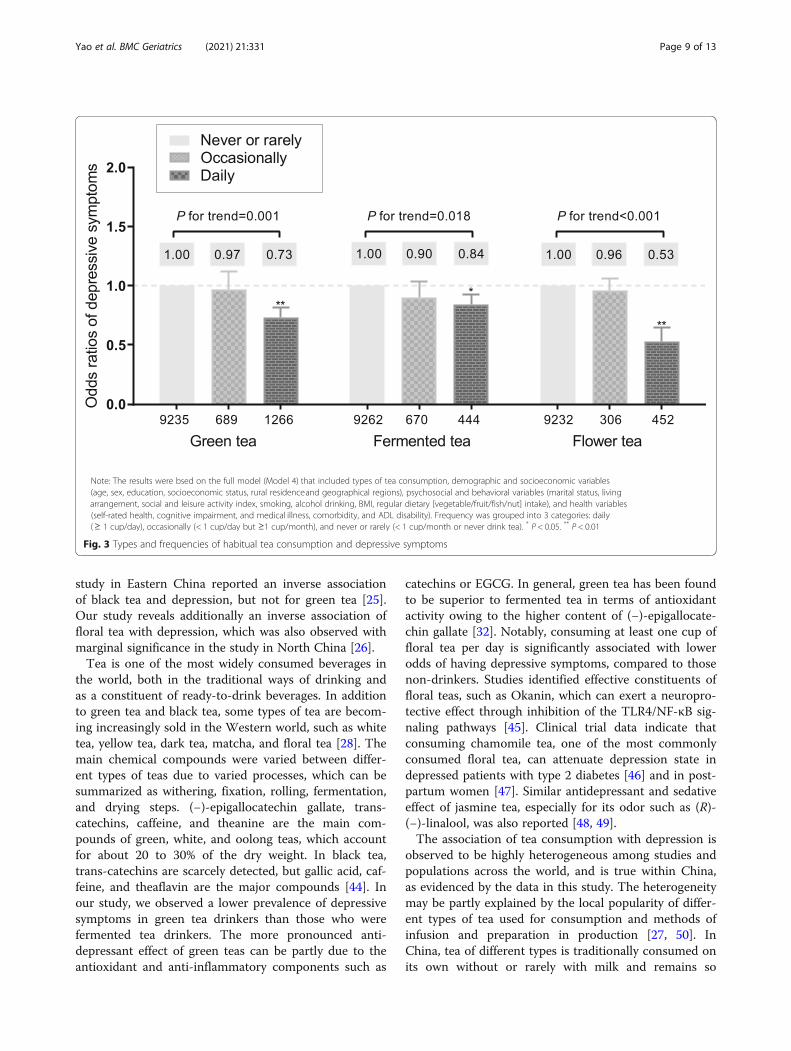
floral tea all showed linear associations respectively withdepressive symptoms, controlling for major potentialconfounding factors (Fig. 3). The associations were moremarked for green tea (P = 0.001 for a linear trend) andfloral tea (P = 0.001 for a linear trend). Daily drinking ofone or more cups of tea of all three types of tea was sig-nificantly associated with 16% (fermented tea), 27%(green tea), and 47% (floral tea) lower odds of presenceof depressive symptoms. Those associations were gener-ally consistent in the subgroup analyses by sex and resi-dence, while the associations of green tea and floral teaintake with depressive symptoms were more pronouncedin the oldest-old group (≥ 80 years) compared to theyoung-old group (65–79 years). In the oldest-old sub-sample with never or rarely tea intake group as the refer-ence, the ORs of depressive symptoms for daily greentea drinkers and daily floral tea drinkers were 0.72 (95%CI: 0.60, 0.86) and 0.47 (95% CI: 0.35, 0.64), respectively;yet the ORs were 0.82 (95% CI: 0.67, 1.01) and 0.60 (95%CI: 0.42, 0.86) for daily green tea drinkers and dailyfloral tea drinkers in the young-old groups. We also
Yao et al. BMC Geriatrics (2021) 21:331 Page 5 of 13

Table 1 Main characteristics of the whole study population and its subgroups by type of tea consumptiona
Variable/subgroups Total sample No tea Green tea Fermented tea Floral tea P valueb
Total sample, n 13,115 9220 1970 1156 769
% 100.0 70.3 15.0 8.8 5.9
CES-D-10
Total score 10.1 ± 4.7 10.4 ± 4.6 9.6 ± 4.8 9.5 ± 4.8 9.1 ± 4.8 < 0.001
≥ 10 7419 (56.6) 5454 (59.2) 1010 (51.3) 590 (51.0) 365 (47.5) < 0.001
Age, years 83.7 ± 11.2 84.5 ± 11.3 81.4 ± 10.7 81.9 ± 11.0 82.6 ± 11.1 < 0.001
Age group, years < 0.001
65–79 5121 (39.1) 3319 (36.0) 924 (46.9) 537 (46.5) 341 (44.3)
80–99 6301 (48.0) 4577 (49.6) 868 (44.1) 514 (44.5) 342 (44.5)
≥ 100 1693 (12.9) 1324 (14.4) 178 (9.0) 105 (9.1) 86 (11.2)
Women (%) 7102 (54.2) 5574 (60.5) 689 (35.0) 521 (45.1) 451 (41.4) < 0.001
Education level, years < 0.001
0 7003 (53.4) 5487 (59.5) 686 (34.8) 511 (44.2) 319 (41.5)
1–6 2643 (20.2) 1798 (19.5) 421 (21.4) 238 (20.6) 186 (24.2)
7+ 3469 (26.5) 1935 (21.0) 863 (43.8) 407 (35.2) 364 (34.3)
Rural residence, % 5782 (44.1) 4335 (47.0) 726 (36.9) 446 (38.6) 275 (35.8) < 0.001
Socioeconomic status c −0.17 ± 1.00 0.08 ± 0.87 −0.31 ± 1.35 − 0.16 ± 1.01 −0.24 ± 1.10 < 0.001
Married and living with a spouse, % 5676 (43.3) 3604 (39.1) 1092 (55.4) 597 (51.6) 386 (49.8) < 0.001
Living arrangement % < 0.001
With household members 10,504 (80.1) 7287 (79.0) 1647 (83.6) 926 (80.1) 644 (83.8)
Alone 2178 (16.6) 1620 (17.6) 268 (13.6) 191 (16.5) 99 (12.9)
Institution 433 (3.3) 313 (3.4) 55 (2.8) 39 (3.4) 26 (3.4)
Social and leisure activity index 3.90 ± 2.76 3.53 ± 2.63 4.91 ± 2.90 4.64 ± 2.82 4.55 ± 2.86 < 0.001
Self-rated health excellent or good, % 6317 (48.2) 4307 (46.7) 1019 (51.7) 596 (51.6) 395 (51.4) < 0.001
Current or former Smoker, % 4045 (30.8) 2312 (25.1) 922 (46.8) 470 (40.7) 341 (44.3) < 0.001
Current alcohol drinker, % 1985 (15.1) 1124 (12.2) 482 (24.5) 944 (18.3) 167 (21.7) < 0.001
BMI 22.4 ± 4.2 22.2 ± 4.2 22.8 ± 3.9 22.8 ± 4.2 23.4 ± 4.3 0.108
Regular vegetable consumption, % 11,827 (90.2) 8245 (89.4) 1819 (92.3) 1069 (92.5) 694 (90.2) < 0.001
Regular fruit consumption, % 6104 (46.5) 4041 (43.8) 1038 (52.7) 620 (53.6) 405 (52.7) < 0.001
Regular fish intake, % 6301 (48.6) 4064 (44.6) 1197 (61.5) 665 (57.8) 375 (49.4) < 0.001
Regular nut intake, % 2539 (19.6) 1510 (16.6) 521 (26.8) 252 (21.9) 256 (33.8) < 0.001
Regularly physical activity, % 9651 (73.6) 6945 (75.3) 1336 (67.8) 842 (72.8) 528 (68.7) < 0.001
Cognitive impairment, % 3300 (25.2) 2556 (27.7) 338 (17.2) 269 (23.3) 137 (17.8) < 0.001
ADL functional disability, % 2974 (22.7) 2214 (24.0) 346 (17.6) 210 (18.2) 204 (26.5)
Medical illness, % < 0.001
Chronic inflammatory disorders d 5714 (43.6) 3900 (42.3) 915 (46.5) 528 (45.7) 371 (48.2)
Other disorders 4607 (35.1) 3295 (35.7) 650 (33.0) 408 (35.3) 254 (33.0)
None 2794 (21.3) 2025 (22.0) 405 (20.6) 220 (19.0) 144 (18.7)
Comorbidity e, % < 0.001
Yes 606 (4.6) 376 (4.1) 124 (6.3) 49 (4.2) 57 (7.4)
No 12,509 (95.4) 8844 (95.9) 1846 (93.7) 1107 (95.8) 712 (92.6)
Geographical region f, % < 0.001
Northern China 3157 1969 (62.4) 506 (16.0) 301 (9.5) 381 (12.1)
Eastern China 2842 1933 (68.0) 607 (21.4) 258 (9.1) 44 (1.5)
Yao et al. BMC Geriatrics (2021) 21:331 Page 6 of 13
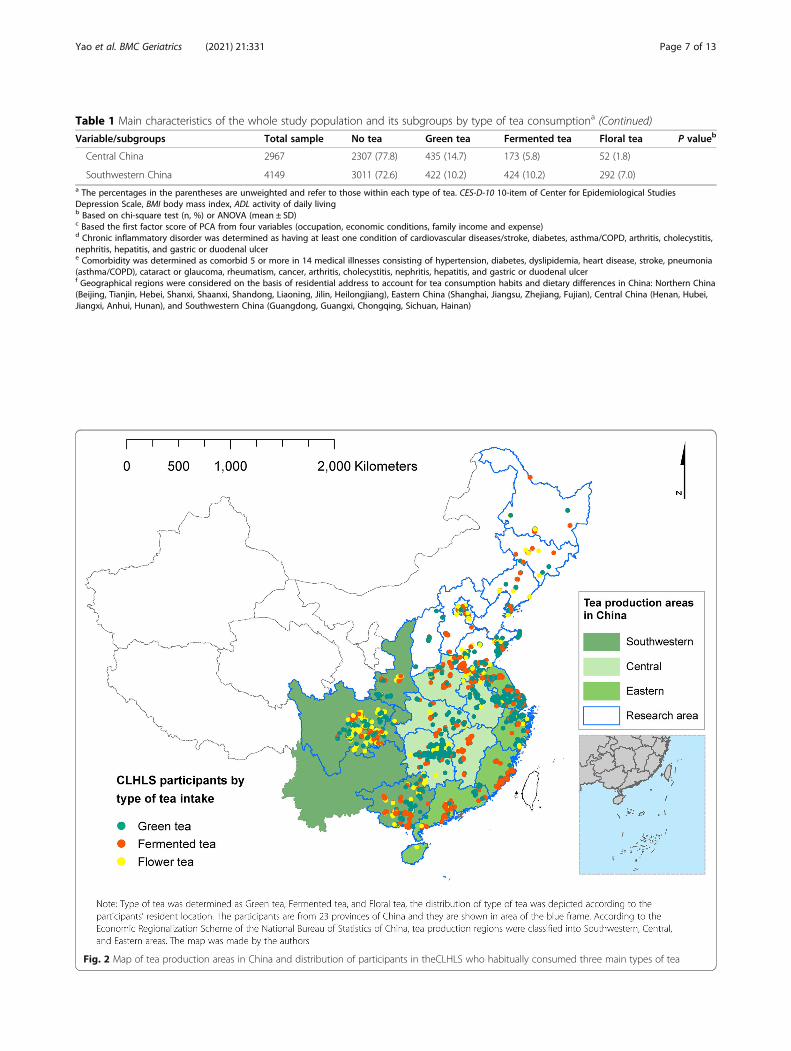
Table 1 Main characteristics of the whole study population and its subgroups by type of tea consumptiona (Continued)
Variable/subgroups Total sample No tea Green tea Fermented tea Floral tea P valueb
Central China 2967 2307 (77.8) 435 (14.7) 173 (5.8) 52 (1.8)
Southwestern China 4149 3011 (72.6) 422 (10.2) 424 (10.2) 292 (7.0)a The percentages in the parentheses are unweighted and refer to those within each type of tea. CES-D-10 10-item of Center for Epidemiological StudiesDepression Scale, BMI body mass index, ADL activity of daily livingb Based on chi-square test (n, %) or ANOVA (mean ± SD)c Based the first factor score of PCA from four variables (occupation, economic conditions, family income and expense)d Chronic inflammatory disorder was determined as having at least one condition of cardiovascular diseases/stroke, diabetes, asthma/COPD, arthritis, cholecystitis,nephritis, hepatitis, and gastric or duodenal ulcere Comorbidity was determined as comorbid 5 or more in 14 medical illnesses consisting of hypertension, diabetes, dyslipidemia, heart disease, stroke, pneumonia(asthma/COPD), cataract or glaucoma, rheumatism, cancer, arthritis, cholecystitis, nephritis, hepatitis, and gastric or duodenal ulcerf Geographical regions were considered on the basis of residential address to account for tea consumption habits and dietary differences in China: Northern China(Beijing, Tianjin, Hebei, Shanxi, Shaanxi, Shandong, Liaoning, Jilin, Heilongjiang), Eastern China (Shanghai, Jiangsu, Zhejiang, Fujian), Central China (Henan, Hubei,Jiangxi, Anhui, Hunan), and Southwestern China (Guangdong, Guangxi, Chongqing, Sichuan, Hainan)
Fig. 2 Map of tea production areas in China and distribution of participants in theCLHLS who habitually consumed three main types of tea
Yao et al. BMC Geriatrics (2021) 21:331 Page 7 of 13
observed a geographical variation in the associations ingreen tea and fermented tea consumers, while the asso-ciation seems more homogeneous in floral tea drinkers(Supplemental Table 2).
Sensitivity analysesIn sensitivity analysis using varied cut-off values of theCES-D-10 such as 8 and 12, we repeated the analysis forthe full model (Model 4). The dose-effect relationship offrequencies of each type of tea intake with depressivesymptom was only mildly altered in analyses using bothcut-offs (Supplementary Figure 2). After excluding par-ticipants who were likely to have severe cognitive im-pairment (defined by a score of MMSE less than 19, n =1432), the estimates or the significance levels of the ob-served associations were not altered in three types of teadrinkers. Moreover, we removed the participants whowere long bedridden or terminally ill (n = 261), restrict-ing the sample to non-bedridden and the results wereidentical to those we presented in the main text (Supple-mentary Figure 3). We also tested our result using a fullsample after multiple imputations and further adjustingthe sampling weight (Supplementary Figure 4). Those
sensitivity analyses were all reasonably consistent withthe final model in the main text.
DiscussionIn this large population-based study, Chinese olderadults who regularly consumed all types of tea (green,fermented, and floral) were less likely to show depressivesymptoms, measured by the CES-D-10. Daily consump-tion of one or more cups of green, fermented, or floraltea was associated with up to 50% lowered odds of hav-ing depressive symptoms. These findings are in line withprevious observations of an inverse association of teaconsumption with the risk of depression [22–27].There are several noteworthy aspects of the association
observed in this study that are not present in previousstudies. One is that several types of tea consumptionwere investigated simultaneously in the study. Mostprior studies mainly investigated only one type of teaalone [21, 24]; or unspecified tea type [18, 22, 23, 26]. Intwo studies, green and black (fermented) tea were bothinvestigated [25, 26]. One study in rural North China re-ported lower odds of depressive symptoms for green andblack tea [26], similar to our findings, whereas another
Table 2 Odds ratios of depressive symptoms by type of tea consumption among whole sample and subpopulations
Green teavs. No tea
Fermented teavs. No tea
Floral teavs. No tea
Whole samplea
Model 1 0.53 (0.48–0.58) * 0.63 (0.56–0.70) * 0.49 (0.43–0.57) *
Model 2 0.72 (0.65–0.80) * 0.79 (0.70–0.89) * 0.62 (0.53–0.72) *
Model 3 0.80 (0.72–0.89) * 0.84 (0.74–0.95) * 0.69 (0.60–0.81) *
Model 4 0.85 (0.76–0.95) * 0.87 (0.76–0.99) * 0.70 (0.59–0.82) *
Subpopulations based on model 4
By Sex
Men 0.79 (0.69–0.92) * 0.85 (0.71–1.03) 0.77 (0.62–0.95) *
Women 0.93 (0.79–1.10) 0.89 (0.74–1.08) 0.61 (0.48–0.78) *
By Age group
Age < 80 years 0.87 (0.75–1.00) 0.81 (0.68–0.97) * 0.70 (0.56–0.87) *
Age≥ 80 years 0.82 (0.69–0.97) * 0.96 (0.79–1.18) 0.69 (0.54–0.88) *
By urban-rural residence
Urban residency 0.82 (0.73–0.94) * 0.90 (0.76–1.07) 0.71 (0.58–0.88) *
Rural residency 0.91 (0.76–1.08) 0.84 (0.68–1.04) 0.68 (0.52–0.89) *
By geographic region
Northern China 0.84 (0.66–1.06) 1.09 (0.83–1.44) 0.74 (0.57–0.96) *
Eastern China 0.90 (0.74–1.11) 1.11 (0.85–1.46) 0.48 (0.25–0.94) *
Central China 0.83 (0.67–1.04) 0.76 (0.55–1.05) 0.70 (0.39–1.28)
Southwestern China 0.60 (0.47–0.76) * 0.70 (0.56–0.87) * 0.88 (0.68–1.03)a Model 1 included types of tea consumption as the sole variable; Model 2 controlling for demographic and socioeconomic variables: age (continuous), sex,education, socioeconomic status, rural residence and geographical regions; Model 3 additionally controlling for psychosocial and behavioral variables: maritalstatus, living arrangement, social and leisure activity index, smoking, alcohol drinking, BMI, regular dietary (vegetable/fruit/fish/nut) intake; Model 4 additionally forhealth variables: self-rated health, cognitive impairment, and medical illness, comorbidity, and ADL disability* P < 0.05
Yao et al. BMC Geriatrics (2021) 21:331 Page 8 of 13
study in Eastern China reported an inverse associationof black tea and depression, but not for green tea [25].Our study reveals additionally an inverse association offloral tea with depression, which was also observed withmarginal significance in the study in North China [26].Tea is one of the most widely consumed beverages in
the world, both in the traditional ways of drinking andas a constituent of ready-to-drink beverages. In additionto green tea and black tea, some types of tea are becom-ing increasingly sold in the Western world, such as whitetea, yellow tea, dark tea, matcha, and floral tea [28]. Themain chemical compounds were varied between differ-ent types of teas due to varied processes, which can besummarized as withering, fixation, rolling, fermentation,and drying steps. (−)-epigallocatechin gallate, trans-catechins, caffeine, and theanine are the main com-pounds of green, white, and oolong teas, which accountfor about 20 to 30% of the dry weight. In black tea,trans-catechins are scarcely detected, but gallic acid, caf-feine, and theaflavin are the major compounds [44]. Inour study, we observed a lower prevalence of depressivesymptoms in green tea drinkers than those who werefermented tea drinkers. The more pronounced anti-depressant effect of green teas can be partly due to theantioxidant and anti-inflammatory components such as
catechins or EGCG. In general, green tea has been foundto be superior to fermented tea in terms of antioxidantactivity owing to the higher content of (−)-epigallocate-chin gallate [32]. Notably, consuming at least one cup offloral tea per day is significantly associated with lowerodds of having depressive symptoms, compared to thosenon-drinkers. Studies identified effective constituents offloral teas, such as Okanin, which can exert a neuropro-tective effect through inhibition of the TLR4/NF-κB sig-naling pathways [45]. Clinical trial data indicate thatconsuming chamomile tea, one of the most commonlyconsumed floral tea, can attenuate depression state indepressed patients with type 2 diabetes [46] and in post-partum women [47]. Similar antidepressant and sedativeeffect of jasmine tea, especially for its odor such as (R)-(−)-linalool, was also reported [48, 49].The association of tea consumption with depression is
observed to be highly heterogeneous among studies andpopulations across the world, and is true within China,as evidenced by the data in this study. The heterogeneitymay be partly explained by the local popularity of differ-ent types of tea used for consumption and methods ofinfusion and preparation in production [27, 50]. InChina, tea of different types is traditionally consumed onits own without or rarely with milk and remains so
Fig. 3 Types and frequencies of habitual tea consumption and depressive symptoms
Yao et al. BMC Geriatrics (2021) 21:331 Page 9 of 13

today, whereas tea, mostly of mixed blends of black fer-mented tea, is popularly consumed with milk in theWest [51]. Some evidence suggests that the addition ofmilk may reduce the antioxidant activity of tea, due tothe interaction between tea polyphenols and milk pro-teins, such as between catechins and caseins, amongother factors [52, 53]. However, more research is war-ranted to shed light on this.We also observed some variations of the associations
by age and sex. The association of green tea intake anddepressive symptoms seems more marked in older men,while the association of floral tea and depressive symp-toms was more pronounced in older women. The associ-ations of green tea and floral tea intakes with depressivesymptoms were generally consistent in the young-oldgroup (Age < 80 years) and in the oldest-old group(Age ≥ 80 years), while the association was more markedin the young-old group regarding the fermented teaintaking. As we did not find significant interaction be-tween the groups by sex and age, we decided to interpretour results in a more cautious way. Further studies arewarranted to examine the associations of varied types oftea intake and depressive symptoms regarding the sexdifferences and heterogeneity by age.Our study had several strengths. To our knowledge,
this is the first study that has investigated the associationof different types and frequencies of tea intake with de-pressive symptoms among a nationally representativesample of older adults in China. We also did subgroupinvestigations, especially among the oldest-old partici-pants and participants with varied geographical regions.Besides, we considered a wide range of covariates thatallowed us to include and adjust for major potential con-founders that were measured in the study population.Moreover, our study had a large sample size, whichallowed us to test the associations between varied typesand frequencies of tea consumption and various gradesof depressive symptoms (using different cut-offs of CES-D-10 from 8, 10, and 12).Several methodologic limitations should be considered
in the interpretation of our results. First, our study had across-sectional design, which prevented us from firmlyestablishing a causal relationship between the consump-tion of each type of tea and depressive symptoms. Sec-ond, different from some previous studies using moredetailed data on tea consumption, the present study usedvery basic patterns of frequency of tea consumptionamong older Chinese, which may bias the findings. Stud-ies with accurate amount of tea consumption would bemore informative. Third, the estimated inverse odds ra-tio of the association between tea consumption and de-pressive symptoms were substantially attenuated by theadditional inclusion of multiple covariates in the model,suggesting that the effect of tea consumption on
depressive symptoms was explained in large parts by itsassociation with socioeconomic, psychosocial, lifestylebehavioral, and health-related factors. For example,healthier and socially active individuals with higher so-cioeconomic status tended to have more opportunitiesto consume varied types of teas [54]. Among the Chin-ese, tea is often consumed as a social or leisure activity[55], and such a social or leisure activity itself, as well asthe process of preparing and drinking tea, may contrib-ute to maintaining better mental health [56, 57]. It isalso likely that such attenuation was due to the presenceof associations between depression symptoms and socio-economics, psychosocial, and other behavioral factors asevidenced by previous research [58]. In addition, teaconsumption has also been shown to be associated withlower risks of cardio-metabolic risks [58, 59], which inturn have also been demonstrated to be associated withdepression [60]. It is also likely that such attenuationwas due to the presence of associations between depres-sion symptoms and socioeconomics, psychosocial, andother behavioral factors as evidenced by previous re-search. Furthermore, inflammation may be a commonunderlying factor in this relationship, as it is associatedwith many chronic diseases and depression [61]. Al-though we were able to control for chronic inflamma-tory disorders and many other potential confounders,and the findings were generally robust to adjustments,we may not be able to fully exclude the possibility of re-sidual confounding by unmeasured factors. Finally, al-though the CES-D-10 is well validated in assessingdepression in Chinese older populations [36], there waslack of clinical assessment of depression in thecommunity-based survey [62], hence we were not ableto diagnose the presence of clinical depression or thesubtype of depression. More interventional studies andclinical trials among general healthy populations as wellas clinically depressed patients are warranted to assessthe generalizability of the present findings.
ConclusionsIn conclusion, this large Chinese population-based studydemonstrated that a higher consumption of tea, includ-ing green, fermented, floral tea, was inversely associatedwith the prevalence of depressive symptoms, while theassociation was particularly pronounced among floraltea drinkers. These findings suggest that the consump-tion of various types of tea may be potentially beneficialfor the prevention of depressive symptoms. Prospectivestudies or randomized trials are required to clarify thecausality, taking into account the types of tea.
AbbreviationsADL: Activity of daily living; CLHLS: Chinese Longitudinal Healthy LongevitySurvey; CED-S-10: 10-item Center for Epidemiologic Studies Depression Scale;ECCG: Epigallocatechin gallate; MMSE: Mini-Mental State Examination
Yao et al. BMC Geriatrics (2021) 21:331 Page 10 of 13
Supplementary InformationThe online version contains supplementary material available at https://doi.org/10.1186/s12877-021-02203-z.
Additional file 1: Supplementary Table 1. Types and frequencies ofconsumption of teas in the study population. Supplementary Table 2.Subgroup analyses on levels and types of tea consumption anddepressive symptoms. Supplementary Figure 1. Map of tea productionareas in China and distribution of participants of CLHLS by type of teaintake . Supplementary Figure 2. Sensitivity analysis of type andfrequency of tea intake with depressive symptoms by (a) using differentcut-off value of CES-D-10 = 12 and (b) using different cut-off value ofCES-D-10 = 8 as the definition of depressive symptoms. Main model in-cluded types of tea consumption as the sole variable and controlling fordemographic and socioeconomic variables (age, gender, education, so-cioeconomic status, rural residence and geographical regions), psycho-social and behavioral variables (marital status, living arrangement, socialand leisure activity index, smoking, alcohol drinking, BMI, regular dietary[vegetable/fruit/fish/nut] intake), and health variables (self-rated health,cognitive impairment, and medical illness, comorbidity, and ADL disabil-ity). Supplementary Figure 3. Sensitivity analysis of type and frequencyof tea intake with depressive symptoms by (a) removing participants withsevere cognitive impairment (MMSE< 19; n = 1432) and (b) removing par-ticipants who were bedridden or terminally ill (n = 261). Main model in-cluded types of tea consumption as the sole variable and controlling fordemographic and socioeconomic variables (age, gender, education, so-cioeconomic status, rural residence and geographical regions), psycho-social and behavioral variables (marital status, living arrangement, socialand leisure activity index, smoking, alcohol drinking, BMI, regular dietary[vegetable/fruit/fish/nut] intake), and health variables (self-rated health,cognitive impairment, and medical illness, comorbidity, and ADL disabil-ity). Supplementary Figure 4. Sensitivity analysis of type and frequencyof tea intake with depressive symptoms by (a) using full sample aftermultiple imputation (n = 13,825) and (b) by adjusting sampling weightbased on age-sex-residence-specific distribution of 2015 mini-census ofChina. Main model included types of tea consumption as the sole vari-able and controlling for demographic and socioeconomic variables (age,gender, education, socioeconomic status, rural residence and geograph-ical regions), psychosocial and behavioral variables (marital status, livingarrangement, social and leisure activity index, smoking, alcohol drinking,BMI, regular dietary [vegetable/fruit/fish/nut] intake), and health variables(self-rated health, cognitive impairment, and medical illness, comorbidity,and ADL disability).
AcknowledgementsWe are grateful to the CLHLS study, which provided the data in thisresearch. We also thank for the support from the Healthy Aging Consortiumof the China Cohort Consortium (see http://chinacohort.bjmu.edu.cn/).
Authors’ contributionsYY, HC, DG, and TN: conceived and designed the research; YY and HC:performed the statistical analyses and drafted the manuscript; LC, SJ, HY andDG: contributed to interpretation of the results, reviewed the manuscript. YZ,DG and TN: supervised the conduct of the research and had primaryresponsibility for the final content; and all authors: read and approved thefinal manuscript. The authors report no conflicts of interest.
FundingThe work of YY, HC, and YZ was supported by the National Institute ofHealth of the United States (2P01AG031719), National Key R&D Program ofChina (2018YFC2000400), National Natural Sciences Foundation of China(72061137004, 81903392, 81941021), China Postdoctoral Science Foundationfunded project (2019 M650359), and the Data for Better Health Project ofPeking University-Master Kong. The funders had no role in the design andconduct of the study; collection, management, analysis, and interpretation ofthe data; preparation, review, and approval of the manuscript; or the decisionto submit the manuscript for publication.
Availability of data and materialsThe data that support the findings of this study are available in https://opendata.pku.edu.cn/dataverse/CHADS, per the reasonable request.
Declarations
Ethics approval and consent to participateThe 2018 wave of CLHLS study was approved by the Biomedical EthicsCommittee of Peking University (IRB00001052–13074). All participants or theirlegal representatives signed written consent forms in the baseline andfollow-up surveys.
Consent for publicationNot Applicable.
Competing interestsYY is an editorial board member of BMC Geriatrics. DG is a senior editorialboard member of BMC Geriatrics.
Author details1Center for Healthy Aging and Development Studies, Raissun Institute forAdvanced Studies, National School of Development, Peking University,Beijing 100871, China. 2Center for the Study of Aging and HumanDevelopment and Geriatrics Division, Medical School of Duke University,Durham, NC 27705, USA. 3School of Social and Behavioral Sciences, NanjingUniversity, Nanjing 100191, China. 4Department of Family Medicine, St. Mary’sHospital, College of Medicine, The Catholic University of Korea, Gyeonggi-do11765, Republic of Korea. 5West China Biomedical Big Data Center, WestChina Hospital, Sichuan University, Chengdu 610041, China. 6IndependentResearcher, New York, NY 10017, USA. 7Department of PsychologicalMedicine, Yong Loo Lin School of Medicine, National University of Singapore,Singapore, Singapore.
Received: 1 October 2020 Accepted: 7 April 2021
References1. Allan C, Valkanova V, Ebmeier K. Depression in older people is
underdiagnosed. Practitioner. 2014;258:19–22 2-3.2. Friedrich M. Depression is the leading cause of disability around the world.
JAMA. 2017;317:1517.3. Holmes EA, O'Connor RC, Perry VH, Tracey I, Wessely S, Arseneault L, et al.
Multidisciplinary research priorities for the COVID-19 pandemic: a call foraction for mental health science. Lancet Psychiatry. 2020;7(6):547–60.https://doi.org/10.1016/S2215-0366(20)30168-1.
4. Murphy RA, Hagaman AK, Reinders I, Steeves JA, Newman AB, Rubin SM,et al. Depressive trajectories and risk of disability and mortality in olderadults: longitudinal findings from the health, aging, and body compositionstudy. J Gerontol A Biomed Sci Med Sci. 2016;71(2):228–35. https://doi.org/10.1093/gerona/glv139.
5. Brandão DJ, Fontenelle LF, da Silva SA, et al. Depression and excessmortality in the elderly living in low-and middle-income countries:systematic review and meta-analysis. Int J Geriatr Psychiatry. 2019;34(1):22–30. https://doi.org/10.1002/gps.5008.
6. Currier D, Lindner R, Spittal MJ, Cvetkovski S, Pirkis J, English DR. Physicalactivity and depression in men: increased activity duration and intensityassociated with lower likelihood of current depression. J Affect Disord. 2020;260:426–31. https://doi.org/10.1016/j.jad.2019.09.061.
7. Bruin MC, Comijs HC, Kok RM, van der Mast RC, van den Berg JF. Lifestylefactors and the course of depression in older adults: a NESDO study. Int JGeriatr Psychiatry. 2018;33(7):1000–8. https://doi.org/10.1002/gps.4889.
8. Rothenberg DO, Zhang L. Mechanisms underlying the anti-depressiveeffects of regular tea consumption. Nutrients. 2019;11(6):1361. https://doi.org/10.3390/nu11061361.
9. Zhu WL, Shi HS, Wei YM, Wang SJ, Sun CY, Ding ZB, et al. Green teapolyphenols produce antidepressant-like effects in adult mice. PharmacolRes. 2012;65(1):74–80. https://doi.org/10.1016/j.phrs.2011.09.007.
10. Pervin M, Unno K, Ohishi T, Tanabe H, Miyoshi N, Nakamura Y. Beneficialeffects of green tea catechins on neurodegenerative diseases. Molecules.2018;23(6):1297. https://doi.org/10.3390/molecules23061297.
Yao et al. BMC Geriatrics (2021) 21:331 Page 11 of 13
11. Chang SC, Cassidy A, Willett WC, Rimm EB, O’Reilly EJ, Okereke OI. Dietaryflavonoid intake and risk of incident depression in midlife and olderwomen. Am J Clin Nutr. 2016;104(3):704–14. https://doi.org/10.3945/ajcn.115.124545.
12. de la Garza AL, Garza-Cuellar MA, Silva-Hernandez IA, et al. Maternalflavonoids intake reverts depression-like behaviour in rat female offspring.Nutrients. 2019;11:572.
13. Hidese S, Ogawa S, Ota M, Ishida I, Yasukawa Z, Ozeki M, et al. Effects of L-Theanine administration on stress-related symptoms and cognitivefunctions in healthy adults: a randomized controlled trial. Nutrients. 2019;11(10):2362. https://doi.org/10.3390/nu11102362.
14. Nobre AC, Rao A, Owen GN. L-theanine, a natural constituent in tea, and itseffect on mental state. Asia Pac J Clin Nutr. 2008;17:167–8.
15. Niu K, Hozawa A, Kuriyama S, Ebihara S, Guo H, Nakaya N, et al. Green teaconsumption is associated with depressive symptoms in the elderly. Am JClin Nutr. 2009;90(6):1615–22. https://doi.org/10.3945/ajcn.2009.28216.
16. Feng L, Li J, Kua EH, Lee TS, Yap KB, John Rush A, et al. Association betweentea consumption and depressive symptoms in older Chinese adults. J AmGeriatr Soc. 2012;60(12):2358–60. https://doi.org/10.1111/jgs.12011.
17. Ruusunen A, Lehto SM, Tolmunen T, Mursu J, Kaplan GA, Voutilainen S.Coffee, tea and caffeine intake and the risk of severe depression in middle-aged Finnish men: the Kuopio Ischaemic heart disease risk factor study.Public Health Nutr. 2010;13(8):1215–20. https://doi.org/10.1017/S1368980010000509.
18. Guo X, Park Y, Freedman ND, Sinha R, Hollenbeck AR, Blair A, et al.Sweetened beverages, coffee, and tea and depression risk among older USadults. PLoS One. 2014;9(4):e94715. https://doi.org/10.1371/journal.pone.0094715.
19. Dong X, Yang C, Cao S, Gan Y, Sun H, Gong Y, et al. Tea consumption andthe risk of depression: a meta-analysis of observational studies. Aust N Z JPsychiatry. 2015;49(4):334–45. https://doi.org/10.1177/0004867414567759.
20. Grosso G, Micek A, Castellano S, Pajak A, Galvano F. Coffee, tea, caffeine andrisk of depression: a systematic review and dose-response meta-analysis ofobservational studies. Mol Nutr Food Res. 2016;60(1):223–34. https://doi.org/10.1002/mnfr.201500620.
21. Kim J, Kim J. Green tea, coffee, and caffeine consumption are inverselyassociated with self-report lifetime depression in the Korean population.Nutrients. 2018;10:1201.
22. Chan SP, Yong PZ, Sun Y, Mahendran R, Wong JCM, Qiu C, et al.Associations of long-term tea consumption with depressive and anxietysymptoms in community-living elderly: findings from the diet and healthyaging study. J Prev Alzheimers Dis. 2018;5(1):21–5. https://doi.org/10.14283/jpad.2017.20.
23. Shen K, Zhang B, Feng Q. Association between tea consumption anddepressive symptom among Chinese older adults. BMC Geriatr. 2019;19(1):246. https://doi.org/10.1186/s12877-019-1259-z.
24. Pham NM, Nanri A, Kurotani K, Kuwahara K, Kume A, Sato M, et al. Green teaand coffee consumption is inversely associated with depressive symptomsin a Japanese working population. Public Health Nutr. 2014;17(3):625–33.https://doi.org/10.1017/S1368980013000360.
25. Li FD, He F, Ye XJ, Shen W, Wu YP, Zhai YJ, et al. Tea consumption isinversely associated with depressive symptoms in the elderly: a cross-sectional study in eastern China. J Affect Disord. 2016;199:157–62. https://doi.org/10.1016/j.jad.2016.04.005.
26. Feng L, Yan Z, Sun B, Cai C, Jiang H, Kua EH, et al. Tea consumption anddepressive symptoms in older people in rural China. J Am Geriatr Soc. 2013;61(11):1943–7. https://doi.org/10.1111/jgs.12496.
27. Winkler A, Rauwolf M, Sterba JH, Wobrauschek P, Streli C, Turyanskaya A.Total reflection X-ray fluorescence analysis of elemental composition ofherbal infusions and teas. J Sci Food Agric. 2020;100(11):4226–36. https://doi.org/10.1002/jsfa.10463.
28. Engelhardt UH. Tea chemistry - what do and what don’t we know? - amicro review. Food Res Int. 2020;132:109120. https://doi.org/10.1016/j.foodres.2020.109120.
29. Cabrera C, Gimenez R, Lopez C. Determination of antioxidant activity of teacomponents. J Agric Food Chem. 2003;31:4427–35.
30. Zeng Y, Feng Q, Gu D, Vaupel JW. Demographics, phenotypic healthcharacteristics and genetic analysis of centenarians in China. Mech AgeingDev. 2017;165(Pt B):86–97. https://doi.org/10.1016/j.mad.2016.12.010.
31. Zeng Y, Feng Q, Hesketh T, Christensen K, Vaupel JW. Survival, disabilities inactivities of daily living, and physical and cognitive functioning among the
oldest-old in China: a cohort study. Lancet. 2017;389(10079):1619–29.https://doi.org/10.1016/S0140-6736(17)30548-2.
32. Cheng TO. All teas are not created equal: the Chinese green tea andcardiovascular health. Int J Cardiol. 2006;108(3):301–8. https://doi.org/10.1016/j.ijcard.2005.05.038.
33. Ng TP, Feng L, Niti M, Kua EH, Yap KB. Tea consumption and cognitiveimpairment and decline in older Chinese adults. Am J Clin Nutr. 2008;88(1):224–31. https://doi.org/10.1093/ajcn/88.1.224.
34. Andresen EM, Malmgren JA, Carter WB, Patrick DL. Screening for depressionin well older adults: evaluation of a short form of the CES-D (Center forEpidemiologic Studies Depression Scale). Am J Prev Med. 1994;10(2):77–84.https://doi.org/10.1016/S0749-3797(18)30622-6.
35. Liu Y, Chen X, Yan Z. Depression in the house: the effects of household airpollution from solid fuel use among the middle-aged and older populationin China. Sci Total Environ. 2020;703:134706. https://doi.org/10.1016/j.scitotenv.2019.134706.
36. Cheng ST, Chan AC. The center for epidemiologic studies depression scalein older Chinese: thresholds for long and short forms. Int J GeriatrPsychiatry. 2005;20(5):465–70. https://doi.org/10.1002/gps.1314.
37. Cheng ST, Chan AC. Detecting depression in Chinese adults with milddementia: findings with two versions of the center for epidemiologicstudies depression scale. Psychiatry Res. 2008;159(1-2):44–9. https://doi.org/10.1016/j.psychres.2007.06.023.
38. Zeng Y. Towards deeper research and better policy for healthy aging --usingthe unique data of Chinese longitudinal healthy longevity survey. China EconJ. 2012;5(2-3):131–49. https://doi.org/10.1080/17538963.2013.764677.
39. Vyas S, Kumaranayake L. Constructing socio-economic status indices: howto use principal components analysis. Health Policy Plan. 2006;21(6):459–68.https://doi.org/10.1093/heapol/czl029.
40. Katz S, Ford AB, Moskowitz RW, et al. Studies of illness in the aged. Theindex of Adl: a standardized measure of biological and psychosocialfunction. JAMA. 1963;185(12):914–9. https://doi.org/10.1001/jama.1963.03060120024016.
41. Gu X, Liu Q, Deng F, Wang X, Lin H, Guo X, et al. Association betweenparticulate matter air pollution and risk of depression and suicide:systematic review and meta-analysis. Br J Psychiatry. 2019;215(2):456–67.https://doi.org/10.1192/bjp.2018.295.
42. Xiao Z, Huang X, Zang Z, et al. Spatio-temporal variation and the drivingforces of tea production in China over the last 30 years. J Geogr Sci. 2018;28:275–90.
43. Tombaugh TN, McIntyre NJ. The mini-mental state examination: acomprehensive review. J Am Geriatr Soc. 1992;40(9):922–35. https://doi.org/10.1111/j.1532-5415.1992.tb01992.x.
44. Zhang L, Ho CT, Zhou J, et al. Chemistry and biological activities ofprocessed Camellia sinensis teas: a comprehensive review. Compr Rev FoodSci Food Saf. 2019;18:1474–95.
45. Hou Y, Li G, Wang J, Pan Y, Jiao K, du J, et al. Okanin, effective constituentof the flower tea Coreopsis tinctoria, attenuates LPS-induced microglialactivation through inhibition of the TLR4/NF-kappaB signaling pathways. SciRep. 2017;7(1):45705. https://doi.org/10.1038/srep45705.
46. Kermanian S, Mozaffari-Khosravi H, Dastgerdi G, et al. The effect ofchamomile tea versus black tea on glycemic control and blood lipid profilesin depressed patients with type 2 diabetes: a randomized clinical trial. JNutr Food Secur. 2018;3:157–66.
47. Chang SM, Chen CH. Effects of an intervention with drinking chamomile teaon sleep quality and depression in sleep disturbed postnatal women: arandomized controlled trial. J Adv Nurs. 2016;72(2):306–15. https://doi.org/10.1111/jan.12836.
48. Inoue N, Kuroda K, Sugimoto A, et al. Autonomic nervous responsesaccording to preference for the odor of jasmine tea. Biosci BiotechnolBiochem. 2003;67:1206–14.
49. Kuroda K, Inoue N, Ito Y, et al. Sedative effects of the jasmine tea odor and(R)-(−)-linalool, one of its major odor components, on autonomic nerveactivity and mood states. Eur J Appl Physiol. 2005;95:107–14.
50. Szymczycha-Madeja A, Welna M, Pohl PJTtiac. Elemental analysis of teas andtheir infusions by spectrometric methods. TrAC Trends Anal Chem. 2012;35:165–81.
51. Cheng TO. Antioxidants in wine and tea. J R Soc Med. 1999;92(3):157.https://doi.org/10.1177/014107689909200332.
52. Rashidinejad A, Birch EJ, Sun-Waterhouse D, Everett DW. Addition of milk totea infusions: helpful or harmful? Evidence from in vitro and in vivo studies
Yao et al. BMC Geriatrics (2021) 21:331 Page 12 of 13
on antioxidant properties. Crit Rev Food Sci Nutr. 2017;57(15):3188–96.https://doi.org/10.1080/10408398.2015.1099515.
53. Ryan L, Petit S. Addition of whole, semiskimmed, and skimmed bovine milkreduces the total antioxidant capacity of black tea. Nutr Res. 2010;30(1):14–20. https://doi.org/10.1016/j.nutres.2009.11.005.
54. Roth R. Tea drinking in 18th-century America: its etiquette and equipage:Good Press; 2020.
55. Horng J-S, Hong J-C, Lin Y-CJSB, et al. Innovation strategies fororganizational change in a tea restaurant culture: a social behaviorperspective. Soc Behav Personal Int J. 2011;39:265–73.
56. Allen J, Balfour R, Bell R, Marmot M. Social determinants of mental health.Int Rev Psychiatry. 2014;26(4):392–407. https://doi.org/10.3109/09540261.2014.928270.
57. Gilbert N. The science of tea’s mood-altering magic. Nature. 2019;566(7742):S8–9. https://doi.org/10.1038/d41586-019-00398-1.
58. Kokubo Y, Iso H, Saito I, Yamagishi K, Yatsuya H, Ishihara J, et al. The impactof green tea and coffee consumption on the reduced risk of strokeincidence in Japanese population: the Japan public health center-basedstudy cohort. Stroke. 2013;44(5):1369–74. https://doi.org/10.1161/STROKEAHA.111.677500.
59. Zhang C, Qin YY, Wei X, Yu FF, Zhou YH, He J. Tea consumption and risk ofcardiovascular outcomes and total mortality: a systematic review and meta-analysis of prospective observational studies. Eur J Epidemiol. 2015;30(2):103–13. https://doi.org/10.1007/s10654-014-9960-x.
60. Richards SH, Anderson L, Jenkinson CE, et al. Psychological interventions forcoronary heart disease. Cochrane Database Syst Rev. 2017;4:CD002902.
61. Ferrucci L, Fabbri E. Inflammageing: chronic inflammation in ageing,cardiovascular disease, and frailty. Nat Rev Cardiol. 2018;15(9):505–22.https://doi.org/10.1038/s41569-018-0064-2.
62. Yao Y, Fu S, Zhang H, Li N, Zhu Q, Zhang F, et al. The prevalence ofdepressive symptoms in Chinese longevous persons and its correlation withvitamin D status. BMC Geriatr. 2018;18(1):198. https://doi.org/10.1186/s12877-018-0886-0.
Publisher’s NoteSpringer Nature remains neutral with regard to jurisdictional claims inpublished maps and institutional affiliations.
Yao et al. BMC Geriatrics (2021) 21:331 Page 13 of 13