Embed Size (px)
Citation preview

1 | March 10, 2016 http://redlightrobber.com
Typical Red Light Camera Before/After Safety Studies – Deceit & Pseudoscience
Scientific Method Step Red Light Camera Safety Study
1 Formulation of Question
Never asks the question why drivers run red lights. Instead asserts conclusion up front. Implicit in a study of an enforcement tactic is the conclusion that drivers are at fault.
2 Discovery and Observations
No discovery. Presumes bad driving is only causality of crashing contrary to prior knowledge that engineering failures play the dominant role.
3 Hypothesis
Biased and misdirected hypothesis: Red light cameras will decrease crashes because cameras make drivers behave better. Hypothesis misdirects cause of crashes and purpose of red light cameras (RLCs). RLCs tally red light violations (RLVs); they do not intervene in crashes.
4 Prediction
Biased prediction with unsubstantiated premise: Once an intersection is treated with red light cameras, there
will be fewer crashes. RLVs do not always imply crashes.
5 Experiment
Observes wrong data set, crashes not RLVs--a result of the misdirected RLC purpose.
6 Analysis
Analysis of wrong data set. When results do not favor bias, researcher cherry picks data set. Lack of scientific controls (e.g., no measurements of traffic flow or other intersection variables). Researcher omits RLV analysis showing the effects of traffic signal timing changes.
7 Conclusion
Inconsistent results. In the scientific method, inconsistent results conclude a false hypothesis. The hypothesis that “drivers are the cause of red light running and crashes” is false according to the scientific method. Despite that, the Red Light Camera Safety Study still concludes that drivers are guilty.
8 External Reviews
Debunk prediction, persist conclusion of inconsistent results and expose biases.
RED LIGHT CAMERA STUDIES USE STATISTICS TO JUSTIFY USE OF RED LIGHT CAMERAS. THE CONDEMNING FACTOR AMONG THE STUDIES IS THAT THEY AVOID THE SCIENTIFIC
METHOD. STATISTICS WITHOUT THE SCIENTIFIC METHOD DEMONSTRATES THAT, “ANYONE CAN PROVE ANYTHING WITH STATISTICS.”
THESE STUDIES AVOID THE SCIENTIFIC METHOD IN TWO MAJOR WAYS: 1) THE STUDIES START WITH A CONCLUSION: DRIVERS ARE GUILTY. THE STUDIES DO NOT ENTERTAIN
THE QUESTION, “ARE TRAFFIC ENGINEERS FORCING DRIVERS TO RUN RED LIGHTS?” THE CONCLUSION IS CONVENIENT THOUGH. TRAFFIC ENGINEERS OR POLICE WRITING THE
REPORT GET THEMSELVES AND THEIR GOVERNMENT PATRON OFF THE HOOK. 2) THE STUDIES PRESUME THAT THE PURPOSE OF THE CAMERA IS TO PREVENT CRASHES. BUT
THERE IS NOTHING IN A CAMERA, LIKE A BIG NET, THAT PREVENTS CRASHES. A CAMERA’S PURPOSE IS NOT EVEN TO MEASURE CRASHES. THE CAMERAS’ DESIGNED PURPOSE
IS TO PHOTOGRAPH RED LIGHT RUNNING EVENTS AND MAKE MONEY BY ISSUING TICKETS. OTHER PRESUMPTIONS: THE AVERAGE PERSON PRESUMES THAT CRASHES AND RED
LIGHT RUNNING ARE TIED TOGETHER. THEY ARE NOT. TRAFFIC ENGINEERS CONSIDER FLOW, SAFETY AND THE LEGAL MOTION OF TRAFFIC AS 3 SEPARATE ISSUES AND
PRIORITIZE THEM IN THAT ORDER. ENGINEERS INTENTIONALLY DESIGN INTERSECTIONS TO MAKE PEOPLE RUN RED LIGHTS FOR THE SAKE OF FLOW. AN ENGINEER WILL CAUSE
MORE AND MORE DRIVERS TO RUN RED LIGHTS UNTIL THE CRASH RATE STARTS INCREASING.

2 | March 10, 2016 http://redlightrobber.com
Details
# Step in Scientific
Method
Proper Improper – The Before/After Study
1 Formulation of a
Question
“Why do people run red lights?”
The red light camera safety study never asks a question.
Instead it immediately asserts the conclusion, “Drivers are
guilty.” The conclusion makes a presumption of guilt which is
not only bad science but also bad law. Even if the conclusion
that drivers are guilty is true, the scientific method invalidates
the study for making that assertion up front.
The premature conclusion contains a two-fold lie:
1) The study misdirects readers to the cause of red light
running. By confining its investigation to an enforcement
tactic, the study implicitly faults the driver.
2) The study misdirects the reader as to the purpose of the
red light camera. The study diverts the reader’s attention
toward crashes but red light cameras do not prevent
crashes. Cameras are not gigantic foam cushions which
descend into an intersection when they see two cars
about to crash. Cameras are only devices which detect
and tally red light incursions.
This misdirection of purpose falsely implies that red light
running always means crashes. But traffic engineers
already know this implication is false. Engineers can
design a safe intersection yet force thousands of drivers a
day to run its red lights. Engineers even design
intersections knowingly making people run red lights so
that the roadway can attain traffic efficiency goals.

3 | March 10, 2016 http://redlightrobber.com
Unknown to the reader, traffic flow, safety and the legality
of motion are disparate goals, one obtained while
sacrificing the others.
This two-fold lie establishes a hindsight bias. A bias is a
blatant violation of the scientific method. The bias
immediately invalidates the study. The conclusions of such a
study are called specious. It may be pleasing to the eye but it
is deceptive.
2 Discovery and
Observations
In a proper step 2, the researcher would discover
different causes as to why people run red lights.
On the top of this list are engineering failures.
Engineering failures are short yellow lights, line-
of-sight issues, traffic capacity issues, light cycle
length, absence of detection plates, absence of
signal head back-plates, etc. These are well-
known problems existing at all intersections.
Errant driver behavior can be a cause but it can
only be considered after engineering failures are
removed from the equation. In the presence of
engineering failures, the driver may have to run
red lights. To an observer watching a driver, what
looks like bad driving can really be the outcome of
bad engineering. Only a trained eye knows what
to look for.
Also in a proper step 2, the researcher would
examine the federal guidelines. Are the
guidelines correct? A researcher would not
assume they are. The case in point is a math
formula that models vehicle motion when a driver
sees a light turn yellow. The formula is called the
ITE yellow change interval formula. Does the
The study never discovers, observes or acknowledges
engineering causes of red light running.
The before/after study never performs step 2. The study
misses the observation that the yellow change interval
formula is wrong.
The missing observation is exactly where the red light running
problem becomes known. A researcher who knows
introductory physics would immediately spot the error in the
formula. There is a wild “2” in the denominator. The
relationship between velocity, time and acceleration has no
“2”. Therefore the model for vehicle motion subjected to the
yellow light duration opposes the laws of physics. That would
certainly make drivers run red lights.

4 | March 10, 2016 http://redlightrobber.com
physics of this ITE formula model motion
correctly?
The answer is, “No! The physics of the ITE
formula does not model the motion correctly for all
valid traffic movements.” By the laws of physics
this formula makes people run red lights.
The observation “No” changes the direction of the
entire investigation. It changes the hypothesis. If
one was considering the hypothesis, “Red light
cameras change driver behavior so that drivers
run red light runs less often,” that hypothesis
changes here.
Before one can assign blame to the driver, one
must first remove the engineering failures. The
ITE formula is a physics formula. Engineering is
the “application of the mathematical and physical
sciences.” Where there is a physics failure, there
is an engineering failure. One must first address
the ITE formula problem, then one can move on to
other causes like bad driving.
The scientific method is often a set of iterative
investigations. The first would be to investigate
the ITE formula; then after that, the next iteration
would perhaps investigate bad driving.
3 Hypothesis “The failure of ITE yellow change interval formula
to describe vehicular motion for all types of traffic
motion is the reason why drivers run red lights.”
This hypothesis is a beautiful thing because the
laws of motion have been well-established since
1687. A prediction is easily forthcoming.
“Red light cameras will decrease crashes because red light
camera make drivers behave better.”
The two-fold lie is present. Hindsight bias invalidates the
hypothesis.

5 | March 10, 2016 http://redlightrobber.com
4 Prediction The ITE formula only provides enough yellow time
when the driver maintains a constant speed of vo
through the critical distance. Depending on the
driver’s distance from the intersection when the
light turns yellow, the ITE formula may not provide
enough time if he must decelerate through the
critical distance into the intersection; for example,
turning. The most time a driver needs is when
his need to decelerate almost makes him come to
a stop; for example, a U-turn.
Therefore, the prediction is,
“The ITE yellow change interval formula causes
drivers to run red lights up to the amount of time
the yellow duration falls short of the time to stop
as computed by Newton’s Laws of Motion.
“We predict the amount of time that the vast
majority of drivers will run red lights will be up to
{vo/2a} seconds.
“The stopping time is tp + vo/a.”
“Once an intersection is “treated” with red light cameras, there
will be fewer crashes.”
The two-fold lie is present. Hindsight bias invalidates the
prediction.
5 Experimentation
For any researcher, this
step can never be
perfect. One cannot
carry out a pure scientific
experiment because of
the operational practices
of the DOT. DOTs do
what they want and when
they want (often too late),
The test equipment measuring the red light
running is the red light camera itself. So the
presence of the red light cameras is tainting the
data. Does this matter?
The presence of the red light cameras does not
invalidate the prediction, because driver behavior
cannot change the laws of physics. Drivers may
change their behavior. They may be opting to
slam on their brakes more out of fear of getting a
ticket. But in the end the laws of physics trump
human behavior. The effects of physics
outweigh any reasonable aberrations of human
There are more problems with data-collecting in a typical red
light camera before/study experiment than the ones listed to
the left in the blue column.
1. Many researchers are aware of pre-existing engineering
problems (like Cunningham and Hummer). But because
“it is not feasible” for the DOT to fix the problems, they
bury the engineering problems under the rug, push blame
upon the driver and hope no one catches them doing it.

6 | March 10, 2016 http://redlightrobber.com
and will not allow a
researcher to research
for the sake of
researching.
Even if the DOT was
willing to experiment with
an intersection, it is
nearly impossible to
assure that other
contributing factors to red
light incursions are kept
constant. The “controls”
of the experiment are
always out of control.
behavior. This is a reasonable assertion yet
must still be kept in mind.
When traffic engineers change an intersection’s
yellow duration, they often change other things
too. It is hard to collect data due to a single
change. Does this matter?
Depending on what other changes have been
made, it does matter. For instance, if the traffic
engineer increased the signal cycle length from 2
minutes to 3 minutes, drivers would see red lights
33% less during the course of a day. That would
mean a 33% decrease in red light incursions.
2. Before/After studies divert the reader’s attention away
from red light violation data to crash data. There are two
reasons researchers do this:
A. Subterfuge. If a reader becomes aware of what RLV
data looks like, then he will immediately notice that
the vast majority (nearly 100%) of red light running is
caused by traffic engineers. All the reader has to do
is compare one intersection’s RLV rates with another.
Because drivers drive the same regardless of location
in the city, the gaping disparity of RLVs points to
engineering differences.
For a single approach to a single intersection, a
reader only has to see the RLV rate dramatically
spike to a higher level to know that a traffic engineer
caused it. DOTs change intersection yellow
durations every 2 to 5 years. There is a good chance
the reader will see such changes implemented during
the experiment period. The very day the engineer
shortens the yellow light duration, the reader will see
the RLV rate dramatically spike to a new higher
permanent level. The reverse is also true. The very
day the engineer lengthens the yellow light duration,
the reader sees the RLV rate dramatically dip to a
new permanent low.
B. The numerical magnitude of crash rates is not
significant. The rates fluctuate widely from year to
year, season to season, with or without cameras. It
is easy to find a period of time in the “before” phase
where the crashes are more than in the “after” phase.
Pro-camera researchers jump on this data like a cat
to a bird. But because the magnitude of the crashes
is insignificant, the researcher will report percentage
decreases instead of actual numbers. For example,
the crash rate goes from 3 crashes/year to 2. The
researcher will announce, “There has been a 33%
7 | March 10, 2016 http://redlightrobber.com
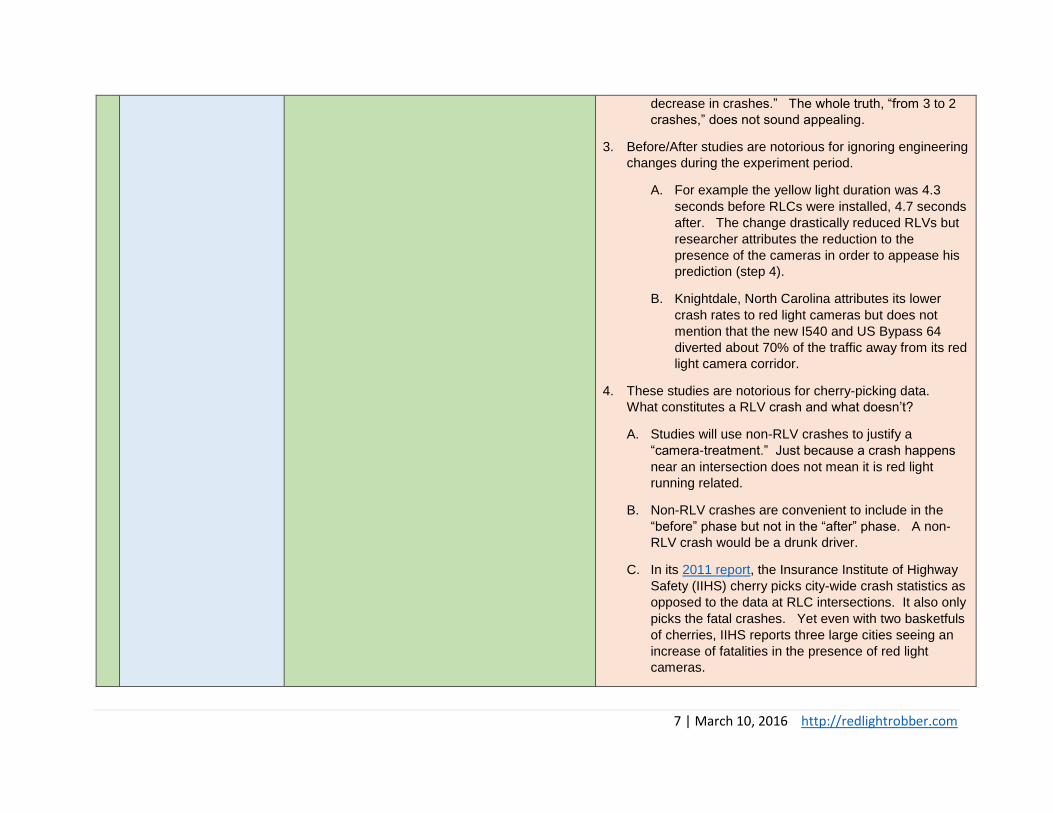
decrease in crashes.” The whole truth, “from 3 to 2
crashes,” does not sound appealing.
3. Before/After studies are notorious for ignoring engineering
changes during the experiment period.
A. For example the yellow light duration was 4.3
seconds before RLCs were installed, 4.7 seconds
after. The change drastically reduced RLVs but
researcher attributes the reduction to the
presence of the cameras in order to appease his
prediction (step 4).
B. Knightdale, North Carolina attributes its lower
crash rates to red light cameras but does not
mention that the new I540 and US Bypass 64
diverted about 70% of the traffic away from its red
light camera corridor.
4. These studies are notorious for cherry-picking data.
What constitutes a RLV crash and what doesn’t?
A. Studies will use non-RLV crashes to justify a
“camera-treatment.” Just because a crash happens
near an intersection does not mean it is red light
running related.
B. Non-RLV crashes are convenient to include in the
“before” phase but not in the “after” phase. A non-
RLV crash would be a drunk driver.
C. In its 2011 report, the Insurance Institute of Highway
Safety (IIHS) cherry picks city-wide crash statistics as
opposed to the data at RLC intersections. It also only
picks the fatal crashes. Yet even with two basketfuls
of cherries, IIHS reports three large cities seeing an
increase of fatalities in the presence of red light
cameras.

8 | March 10, 2016 http://redlightrobber.com
(IIHS’s hindsight bias is based on its financial goal.
IIHS represents car insurance companies whose goal
is to increase insurance premiums justified by the red
light running counts.)
D. Suffolk County considers only right-angle crashes.
Red light cameras are notorious for making drivers
slam on the brakes causing rear-end crashes.
E. Suffolk County considers only crashes involving
injuries. Red light cameras, notorious for creating
fender benders, are conveniently ignored.
F. Tampa, Florida and Tucson, Arizona change the
definition of an intersection.
G. Arnold, Missouri plays a distance game counting only
RLV crashes within 50 feet instead of the federal
standard 133 feet. The federal standard is also
incorrect. According to the laws of physics, RLV
crashes can occur within the critical distance on both
sides of intersection. For a 45 mph road, the critical
distance is about 300 feet.
H. Winnipeg, Manitoba takes Missouri’s distance game
to its extreme. Winnipeg counts only crashes inside
the intersection. That removes evidence of increased
rear-end crashes--a known consequence of red light
cameras.
I. Illinois cities play a dollar game skewing data based
on costs of crashes.
J. Philadelphia, Pennsylvania chooses “reportable”
crashes. Reportable crashes exclude crashes which
do not need a tow.

9 | March 10, 2016 http://redlightrobber.com
6 Analysis Given the red light camera data which contains
“time into red” for every lane of traffic, graph the
red light violation rate versus time-into-red.
The resulting curve indicates that a law of physics
is at play. The curve is not random. That is to
say the curve is not Gaussian, Poisson or any
random distribution which would imply the cause
is human behavior.
Instead the curve follows a law of physics.
The curve of red light runners starts high just after
the light turns red. The curve drops to zero at
vo/2a into the red phase. Time vo/2 into red is the
time a driver needs to stop according to the laws
of physics. Drivers need the full to stop to obey
the traffic signal. The curve definitely hits RLV
rate = 0 at t = vo/2a into the red. After vo/2a,
where physics is no longer at play, then we see a
uniform random distribution of red light running.
Example. When tp + vo/a requires the driver to
have 7.4 seconds of yellow but the yellow is 3
seconds, the curve of RLV rate drops to zero at
4.4 seconds into the red. If the yellow is 4.5
seconds, the curve of the RLV rate drops to zero
at 2.9 seconds into the red phase.
The two-fold lie is still present. Hindsight bias invalidates the
prediction.
Most before/after studies do not analyze much. Usually a
policeman will sum up the crashes at one intersection in one
year, then sum the crashes up in another year. If he doesn’t
get the results he wants, he excludes the intersection from his
analysis or he sums up the crashes from all intersections to
come up with a “net benefit.”
Other companies like AECOM will spent a lot of time
analyzing the crash data for their city client. AECOM
performs a full-blown statistical analysis complete with naïve
and an empirical Bayes analyses. The analyses look
impressive but AECOM’s analysis is just as invalidate as the
policeman’s. Without using the scientific method, both
analyses are specious.
7 Communicating
Conclusions
1. Drivers always require the stopping time, tp +
vo/a, to react to a yellow. This is what
Newton’s Laws predict for the traffic
movements discussed in the prediction. The
yellow should be this long to allow valid traffic
motions to enter the intersection legally.
2. From step 6, 92% of drivers run the red light
under the “curve” from the analysis. These
“Red light cameras are good for the city. They increase
safety.”
The conclusion is the premise for the study and the
conclusion still contains the two-fold suppositions neither
supported nor mentioned. Therefore the conclusion, whether
good or bad from the point of view of the city, is fiction.
In spite of the fallacious methods, most red light camera
studies show an increase in rear-end collisions. When the

10 | March 10, 2016 http://redlightrobber.com
are the drivers which can be caused to run
red lights unintentionally by the ITE yellow
light formula. The remaining 8% of drivers
run the red lights for other reasons.
3. The length of the yellow does not significantly
change the driver’s behavior. Physics is
dictating the time requirement, not a driver’s
prior knowledge (if any) of the length of the
yellow change interval. Once the light turns
yellow, a driver does what he needs to.
researcher observes this, the researcher has a choice. Does
he continue the research because cameras did not do as he
predicted? Or does he redefine “safety” to appease his
patron?
Remember the researcher’s prediction:
“Red light cameras will decrease crashes because red light
camera make drivers behave better.”
Yet the analysis shows that some drivers do not behave
better but worse! Therefore his prediction is false. That
invalidates his hypothesis. The researcher must now revise
his hypothesis. He may need to go back to step 1 and
actually formulate a question. Will he do this?
No. The researcher does not do the right thing. Instead he
redefines safety to appease his patron. His motive is either
ignorance (he does not know what to do with the results he
sees), money (gets paid for writing these reports) or needs to
save face (a city councilman who if admits a problem makes
the city look like it stole millions of dollars from the innocent).
So the researcher redefines “safety”:
“Safety is the increase of rear-end crashes.”
Of course the researcher does not redefine safety quite like
that. He wants to emphasize the decrease of right-angle
collisions without mentioning the increase of rear-end
collisions.
“Safety is the increase of rear-end crashes as long as right-
angle crashes decrease.”
This twist is perverted but it is exactly how the camera
advocate researcher skews his conclusion. In logic-speak the
redefinition is a fallacy.

11 | March 10, 2016 http://redlightrobber.com
The true definition of safety is the decrease of rear-end
crashes and right-angle crashes in both number and type.
James Walker of the National Motorists Association
expresses the rebuttal to the researcher’s redefinition:
“If it were possible to interview the victims of the ‘extra’ rear-end crashes caused by the presence of red light cameras and to ask the victims if the trade-off was OK, I think you would get a very strong ‘No!’ “
Even if the analysis shows both rear-end and right-angle
crashes decrease, the conclusion of such a before/after study
is still fictitious. A study without the scientific method is
deceptive. One must address causality and not presume it.
There are engineering factors known to be at work.
8 Replication, External
Review
The conclusion is verified with physics in Dr. Chui
Liu peer-reviewed paper in American Society of
Civil Engineers Journal of Transportation
Engineering.
The conclusion is verified by Dr. Alexei
Maradudin, the inventor of the root formula which
the Institute of Transportation Engineers (ITE) has
been using since 1965.
The partial conclusion that any increase in yellow light duration decreases RLVs is verified in Effect of Yellow Interval Timing on Red-Light Violation Frequency at Urban Intersections by Bonneson and Zimmerman.
And verified by every city that lengthens the
yellow light duration. There are no exceptions.
Red light violations always and immediately
plummet dramatically to a new lower level. Here
is a sampling of cities:
Albuquerque, New Mexico
Never once has a Before/After study been verified. On the
contrary, every Before/After have been debunked.
When red light camera before/after studies are considered in
one big lump, the results are always mixed. There is always
inconsistency. Some studies show more rear-end crashes.
Some show less. Some studies show more right-angle
crashes, some show less. Some show an increase in
everything. Some show a decrease in everything.
Inconsistency is the synonym for a bad hypothesis.
Acknowledging inconsistency normally results in redoing the
investigation with a new question and with a new hypothesis:
“Why do drivers run red lights?”
But such a question leads to the verifiable, externally
affirmable conclusion that the ITE formula makes the vast
majority of drivers run red lights. That means government
and traffic engineer are to blame. That is an inconvenient
truth. In spite that the scientific method requires a new

12 | March 10, 2016 http://redlightrobber.com
Cary, North Carolina Chandler, Arizona Fairfax County, Virginia Libern, Georgia Loma Linda, California
iteration with a revised hypothesis, the government and the
traffic engineers choose to stop the study.