Embed Size (px)
Citation preview

Y. Liu, X. Lai and G.L. Chang 1
A CELL-BASED NETWORK OPTIMIZATION MODEL FOR STAGED EVACUATION PLANNING UNDER EMERGENCIES
Ying LiuDepartment of Civil Engineering
The University of Maryland, College Park, MD 20742lyng @wam.umd.edu
Xiaorong LaiDepartment of Civil Engineering
The University of Maryland, College Park, MD 20742xrlai @wam.umd.edu
Gang-Len ChangDepartment of Civil Engineering
The University of Maryland, College Park, MD [email protected]
Word Count: 4546+250*10=7046

Y. Liu, X. Lai and G.L. Chang 2
A Cell-Based Network Optimization Model for Staged Evacuation Planning Under Emergencies
Ying Liu, Xiaorong Lai and Gang-Len Chang
Abstract. Staged evacuation is widely used under emergency situations where different parts of the target network may suffer different levels of severity over different time windows. By evacuating those populations in the network via an optimized sequence, the staged evacuation strategy can best utilize the available roadway capacity, optimally distribute the total demand over the evacuation time horizon, and thus minimize the network congestion level. This study has proposed a cell-based network model to capture critical characteristics associated with the staged evacuation operations. The proposed model features its capability in reflecting incident impacts and arrival patterns of evacuees in computing the optimal starting time and routes for each evacuation zone. The preliminary numerical results have demonstrated the potential for applying the proposed staged evacuation model in real-world emergency management and planning.
1. INTRODUCTION
Contending with various types of emergencies has emerged as one of the priority tasks for responsible government agencies. Depending on the nature of attacks or the emergency event, different parts of the impacted network may suffer different levels of severity over different time windows. Thus, to minimize the impacts on those under more urgent conditions and also to prevent the surge of traffic demand due to the concurrent evacuation, it is essential to issue the evacuation order for different zones in an optimized sequence. By doing so, one can best utilize the capacity of the available evacuation network, minimize the potential bottlenecks due to surges in some local demands, and efficiently evacuate all evacuees based on their safety time windows.
The staged evacuation concept has been proposed and applied extensively in high-rise building evacuations (1,2) and other regional evacuations (3,4). Figure 1 illustrates a typical staged evacuation process. The entire network is first divided into several zones, based on the predicted evolution of the emergency impacts. A zone closer to the incident location generally has a shorter safety time window (i.e., the period during which traveling within the zone is deemed to be safe) and suffers more severe impacts. With these concerns in mind, the staged evacuation strategy is used to determine the time to issue an evacuation order, namely Ti in Figure 1, in each zone and the designated evacuation routes.
Note that most studies in the evacuation scheduling literature (5) assume that traffic operators can control the demand generated in each time interval. However, in modeling the staged evacuation, we believe that only the starting time of evacuation for each zone is actually under control by the responsible operators. Once an evacuation order being issued, the demand generation patterns at each origin will vary with the response of evacuees, and is beyond the control of any system operator or enforcement agency. This assumption seems more in consistency with those patterns observed in real-world emergency evacuation operations.
A properly designed staged evacuation strategy will significantly reduce congestion on the evacuation network via a more uniform demand distribution over the allowable safety time

Y. Liu, X. Lai and G.L. Chang 3
window. It also allows responsible agencies to prioritize their limited resources in those areas that have or will suffer the most severe damage. Notably, the most critical issue that may affect the effectiveness of such a strategy is how to determine the evacuation starting time for each zone, which unfortunately has not been adequately addressed yet in the literature. Thus, this study will focus on formulating the complex interrelations between critical factors in the staged evacuation process, aiming to identify the most viable evacuation sequence and routes. A special network enhancement approach is proposed to model the starting time of the evacuation demand at each origin zone and the dynamic loading pattern after the evacuation order is activated.
This paper is organized as follows. Next section will list the assumptions for formulating the staged evacuation problem into a network optimization model. To capture the dynamic nature of traffic evolution, Section 3 provides a concise review of the underlying network flow model employed in this study. With these preparation efforts, Section 4 describes the formulation of the network optimization model for staged evacuation process, which is tested with a case study in Section 5. Concluding comments along with key findings are reported in the last section.
2. MODEL ASSUMPTION
To ensure that the proposed formulations for the staged evacuation are trackable and also realistically reflect the real-world constraints, this study has employed the following two assumptions in the model development.
Assumptions 1: The Available Time Window for Each Evacuation Zone Is PredeterminedMore specifically, this study assumes that the study network can be divided into different evacuation zones based on the estimated impact area and its expansion rate. Various factors may affect this expansion process, including the nature of the incident, the environmental conditions, geographic features of the surrounding area, and etc (6). Several commercial software packages are available for taking into account these factors in estimating the evolution of the impact area over time (7-9). Note that the assumption of a progressively expanded impact area in this study implies a higher-urgency zone being surrounded by a lower-urgency zone.
To reflect the differences in the urgency level among all target evacuation zones, this study will assume that the knowledge of the following two parameters is available as it defines the available time window for each evacuation zone.
The maximal tolerable delay from the onset of an emergency event to activation of an evacuation order for each evacuation zone;
The acceptable latest time to evacuate all populations for each evacuation zone.
Assumptions 2: The Total Demand and Its Dynamic Loading Pattern at Each Origin Is Known Once an Evacuation Order Is Issued A variety of approaches have been proposed in the emergency management literature for estimating the total evacuation demand and its dynamic loading pattern, i.e., how many evacuees are generated in each time interval after the activation of an evacuation order. Based on the nature of the employed methodology, one can classify most of these existing studies into the following three categories. The first category uses dynamic loading curves that are predefined by the information dispersion process (10) or by survey data (11,12). The second category defines the demand generation process with the response time distributions (13), while the last category

Y. Liu, X. Lai and G.L. Chang 4
develops regression models to relate household evacuation decisions to time and other key behavioral factors (14,15).
This study aims to develop a generic approach in modeling the staged evacuation operations for various demand patterns. The research focus is not on behavioral analysis but on the operational aspect. Thus, for convenience of model illustration, this study employs the following assumptions on evacuation demand generation:
Evacuees will depart from some pre-selected origin nodes on the network and the total evacuation demand from each origin has been estimated in advance.
Each origin node, once receiving an evacuation order, will load its demand onto the evacuation network in accordance with the S-shaped logit-based function (10):
(1)
Here P(t) is the cumulative percentage of the total demand loaded by time after the evacuation order, while th and a are behavioral factors to define the half-loading time and response rate respectively.
3. UNDERLYING NETWORK FLOW MODEL
To be effective in staged evacuation planning, the proposed network optimization model shall have the following features:
An efficient mathematical model to realistically represent the temporal and spatial interactions among network flows.
A set of formulations to approximate the evacuation demand generation pattern at those origin nodes after an evacuation order being activated.
A set of formulations to capture the complex interactions among the severity of incident impacts on evacuation zones, their tolerable time window for evacuation, the time to initiate evacuation orders, and the congestion level on the evacuation network.
This study has chosen the Cell Transmission formulation as the underlying network flow model due to its unique strengths in addressing the following three concerns:
The model should be able to capture the non-stationary network conditions due to the varying demand loading rate and also due to the congestion that often incurs during an evacuation;
The model shall provide a reliable approximation of network traffic with a relatively high computing efficiency.
The model shall offer the flexibility for concurrently modeling the starting time and designated routes for each demand generation set.
The key idea of the Cell Transmission Model, first proposed by Daganzo as a finite difference solution scheme of the classic LWR model (16,17), is to divide road network into homogeneous sub-segments (or called cells), and move vehicles among connected cells based on a set of rules. Two types of relations are the cornerstones of the Cell Transmission formulation.
Flow propagation relations that decide flows running between neighboring cells based on their traffic conditions. As shown below, yij is the flow from upstream cell i to downstream cell j, Si is the sending capacity of cell i and Rj is the receiving capacity of cell j.
(2-1)

Y. Liu, X. Lai and G.L. Chang 5
Flow conservation equations that depict the evolution of the vehicles in each cell as shown below, where is the number of vehicles on cell and is the number of vehicles generated from cell i.
(2-2)Although the original Cell Transmission Model was for simulation-based operations, it
has later been transformed and utilized in various optimization contexts. Ziliaskopoulos, et al. (18,19) have applied this modeling methodology in dynamic traffic assignment by relaxing some of the constraints. The relaxation may introduce the holding phenomenon, where traffic will not necessarily exit a cell even if it can do so under the prevailing network situation. Lo (20) made up those lost relations by adding a set of binary variables and corresponding constraints in his study of dynamic signal timing plans. The holding problem is prevented, however, at the cost of an increased formulation size and computational challenges.
The underlying network flow model in this study will follow the practice of Ziliaskopoulos, et al. (18,19), which allows holding if it can improve the performance of the entire evacuation process. With this concern in mind, next section will detail the proposed network formulations for capturing the critical characteristics associated with the staged evacuation operations.
4. MODEL FORMULATION
To facilitate the following illustration, all definitions and notations used hereafter are summarized below. Note that this study employs the classic concept of one-size cells, i.e., all sub-segments will have the same free flow travel time. This travel time is named a unit time interval, while all other time parameters are converted to the number of unit intervals to facilitate the discrete formulation. The emergency occurrence time is set as the initial point, or time zero.
Parameters and Sets:: Evacuation time horizon: Set of evacuation zones.
: Index of each evacuation zone.LSz : The latest time to initiate an evacuation order for evacuation zone
after the emergency occurrence (unit: intervals).LCz : The latest time to clear an evacuation zone after the emergency
occurrence (unit: intervals).wz : Weighting factor to reflect the level of urgency in zone .
: Set of origin nodes (source cells) in evacuation zone . : Index of each origin node.
: Total evacuation demand generated in origin (unit: veh).: Evacuation demand released from origin during interval after the evacuation
initiation time (unit: veh).: Set of pseudo segments (auxiliary cells) for modeling the delay in ordering
evacuation for origin . : Index of each auxiliary cell, .
cwr : The pseudo segment (waiting cell) to model the waiting of vehicles from origin before they can enter the actual network.

Y. Liu, X. Lai and G.L. Chang 6
Cs : Set of destinations (sink cells).: Index of each destination.
Cz : Set of road segments (general cells) in evacuation zone . : Set of downstream cells to cell .
: Set of upstream cells to cell .: Number of vehicles that can flow into/out of cell during interval .
: Number of vehicles that can present in cell during interval .: Capacity constraint on connector flows from cell to cell during interval .: Index of intersections.
PhI : Set of conflict phases at intersection ;: Index of each conflict phase at intersection
Model Variables:: Number of vehicles in cell at the beginning of interval .: Connector flows from cell to cell during interval .: A binary variable indicating the time to initiate an evacuation order for
evacuation zone . , if an evacuation order is activated at the beginning of interval ; , otherwise.
Objective FunctionThe primary objective of the proposed optimization model is to improve the efficiency of the entire evacuation process while minimizing the total potential emergency impacts, or in other words, to minimize the sum of the following two time-related indices:
The weighted sum of the times for all evacuees to exit an evacuation zone, which reflects the estimated emergency impacts and congestion level on the evacuation network. The special structure of the underlying network flow model implies that a vehicle in a cell will either wait for one interval or take one interval to reach the downstream cell. Thus the weighted total time can be represented as below.
(3) The weighted waiting time of those vehicles that are ready to load on the actual
network but are delayed because of congestion. This is to reflect the congestion at entry points to the evacuation network. Since all vehicles from an origin enter the actual network through the waiting cell cwr, where the waiting takes place, this index can be computed as the total delay in cwr.
(4)
Constraints Type 1: Simulating the Staged Evacuation Operations at Each Origin In the staged evacuation planning, an origin is assumed to release its demand according to predetermined dynamic loading patterns as soon as an evacuation order is issued. In other words, the demand generation process is controlled with a trigger mechanism. However, the time to issue an evacuation order for each evacuation zone is a decision variable to be determined via the proposed optimization model. Thus, without knowing its evacuation starting time (note: time

Y. Liu, X. Lai and G.L. Chang 7
zero in the model formulation refers to the emergency occurrence time) the demand at each origin cannot be loaded onto the network in a straightforward way.
To cope with this problem, this study proposes a Network Enhancement Approach to convert the combined temporal/spatial optimization problem into a pure spatial network optimization formulation. For each origin in evacuation zone , the approach employs three types of cells to model the trip generation process, which are connected as shown in Figure 2.
One source cell with , , , Set of auxiliary cells with , , , One waiting cell cwr with , , , Then a set of binary variables is used in the flow propagation
equations to restrict the flows between the source cell and the auxiliary cells and the waiting cell.
(5)
, (6) (7) (8) (9)
(10)By definition, if evacuation order is activated at the beginning of interval for
evacuation zone . Equation 5 guarantees that for each evacuation zone, the evacuation order is initiated once and only once before the pre-specified latest time LSz. Equations 6 and 7 indicate that there will be no flow directly between the origin and an auxiliary/waiting cell if the evacuation order is not at the corresponding interval. Otherwise, evacuation demand will flow from the origin to the auxiliary/waiting cell according to the fixed loading pattern as in Equation 1. Equations 8 and 9 guarantee the arrival of evacuees at the waiting cell following the same loading pattern.
Then the flow conservation equations for this enhanced network at origins can be stated as follows.
(11)
(12) (13) (14)
(15)The above Equations 5-15 model the demand generation in a staged evacuation planning
for each origin node . For example, if the evacuation order is given at interval , demand will go directly to the auxiliary cell from interval according to the loading pattern. Since traveling through the chain of downstream auxiliary cells requires intervals, the demand will arrive at the waiting cell from interval , exactly the time when evacuation order is activated.

Y. Liu, X. Lai and G.L. Chang 8
Constraints Type 2: Modeling Evacuation Flows on a Real-World Network This paper employs the methodology by Ziliaskopoulos, et al. (18,19) to formulate the flow over the actual network as an LP model.
For those general cells, the flow conservation equations are shown in Equation 16, while the flow propagation equations in Equation 2-2 are substituted with a set of more relaxed less-than type constraints as shown in Equations 17-21.
(16)
(17)
(18)
(19)
(20) (21)
This study models those sink cells, which represent evacuation destinations, as a special type of general cells without downstream connections. Thus, in formulating the related flow conservation and flow propagation equations, one can also use the aforementioned Equations 16-21 with a specially designed storage capacity and the flow capacity . Here may be the restricted space of a safety shelter, while may be the limited capacity of the safety shelter entrance, or the capacity of downstream routes if the destination is a dummy node to indicate safe area.
Note that Equation 21 only defines the restriction on a single connector flow, which is for conditions when flows between two interchanged highway segments are restricted by the ramp capacity. The modeling for intersections is more complex because different connector flows may conflict with each other and need to share the intersection capacity. Since signal design is not the focus of this study, a set of simplified relations as shown in Equation 22 is employed in this study. The equation implies that if one selects a movement arbitrarily from each conflicting phase at an intersection, the sum of the v/c ratios on these movements will not exceed one (i.e., the intersection capacity is satisfied during each interval).
(22)
Constraints Type 3: Clearance of Evacuation Zones The third set of constraints is related to LCz, the latest time to clear all populations from an evacuation zone z so as to avoid the hazard impacts. The approach is to control the flow in/out of this evacuation zone by time LCz, as in Equation 23, where and are respectively the neighboring zone of zone with lower/upper levels of urgency.
(23)
Constraints Type 4: Completeness of the Evacuation ProcessAnother set of constraints is to guarantee that all evacuation demands have reached destinations at the end of the evacuation period, as in Equation 24. The first term in this equation is the total number of vehicles that have arrived at destinations after evacuation time horizon T and the second term is the total demand.
(24)

Y. Liu, X. Lai and G.L. Chang 9
Constraints Type 5: Other ConstraintsOther constraints include nonnegative constraints, initial value of cell state variables , and initial value of connector flow . In most cases, (excluding source cells) and are set to zero, although users can specify to simulate the background traffic.
5. NUMERICAL TESTS
Study NetworkTo illustrate the staged evacuation strategy and the applicability of the proposed model, this study uses a small network in Figure 3 for numerical tests.
Surrounding the incident location, there are three evacuation zones indicated with dashed ovals. Table 1 shows the pre-determined properties of each evacuation zone.
There are four origin points on the study network, indicated with small black cycles. Among those, origin 1 is in zone I, origin 2 and 3 are in zone II, while origin 4 is in zone III. To test the proposed optimization model under different demand patterns, this study designed five demand scenarios. For each origin, the total demands may vary in different scenarios, but the half-loading time is assumed to be identical across all five scenarios (see Table 2).
There are two destinations immediately outside of zone III, indicated with grey rectangles. The road network includes two freeway corridors shown with double solid line and three arterials shown with single solid line. Table 3 lists the traffic characteristics of different road types.
Based on these traffic characteristics and segment length, the actual road network can be converted into a cell-connected diagram as shown in Figure 4, with a unit time interval of 1 minute. Figure 5 presents the enhanced network formulation at each origin. Note that for illustration purpose, this section assumes that evacuation orders can only be initiated at an interval of 5 minutes after the onset of an incident (i.e., 5 min, 10 min, …). Thus, the demand from each origin cell can only enter the auxiliary cells that correspond to these time points. Table 4 lists the properties associated with each cell.
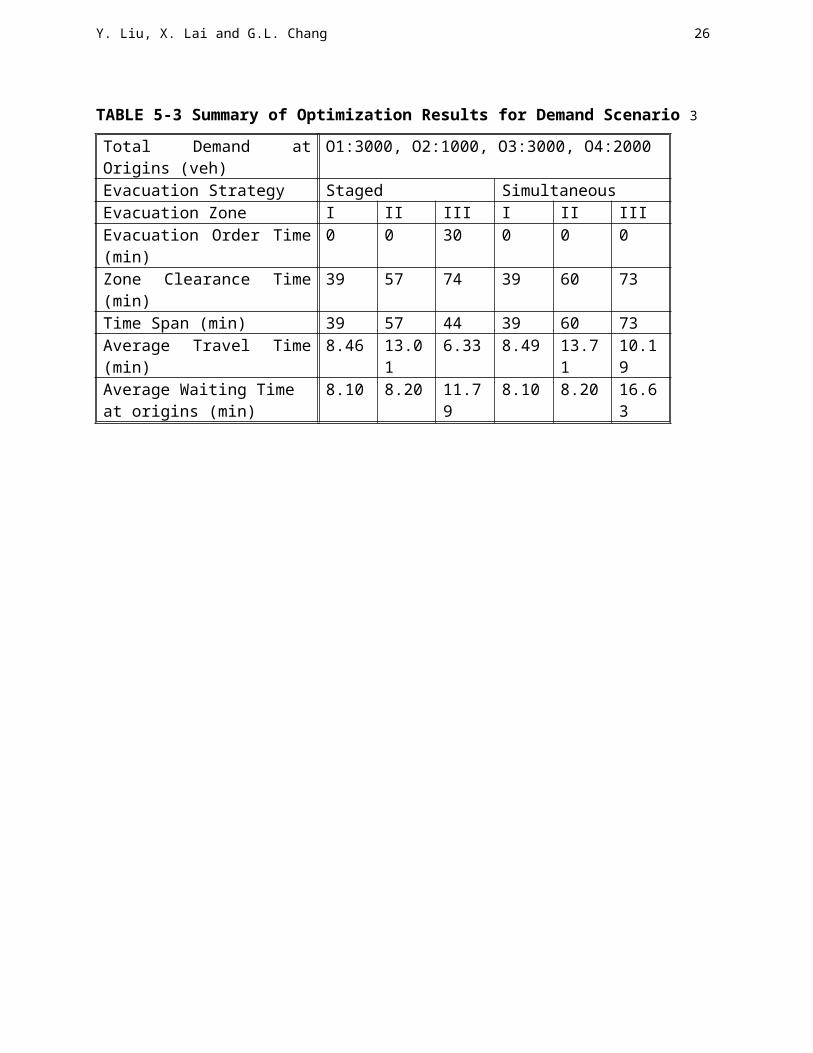
Optimization Results and AnalysisTables 5-1 to 5-5 show the optimization results for both staged evacuation and simultaneous (concurrent) evacuation under different demand patterns defined in Table 2. The following five indicators are used to characterize different strategies for each evacuation zone.
Evacuation order time: the time to initiate an evacuation order in an evacuation zone; Zone clearance time: the time for all evacuees to exit an evacuation zone; Evacuation Time span: the difference between the above two parameters; Average travel time: the total travel time spent on the actual network within an
evacuation zone divided by the total demand going through this zone; Average waiting time at origins: the total time spent in waiting after vehicles have
been generated divided by the total demand generated from this evacuation zone.Based on these preliminary numerical results, one can reach the following conclusions by
comparing the performance measures of these two different evacuation strategies under different demand scenarios.

Y. Liu, X. Lai and G.L. Chang 10
The optimized staged evacuation strategy can effectively mitigate network congestion under various demand patterns, which is reflected in a shorter average travel time for evacuees to go through the evacuation network;
The optimized staged evacuation strategy can effectively mitigate the congestion at the entry points to the evacuation network under various demand patterns, which is evidenced with the lower average waiting time at all origins (i.e., in waiting cells). Note that the proposed formulation may force vehicles to be held temporarily at the entry points so as to facilitate the flow of evacuees from the high urgency level. This kind of enforced traffic control strategies may induce stress or even noncompliance, since evacuees are forced to wait even after they have received the order to evacuate. Thus, a lower waiting time will indicate less stress and thus less manpower for enforcement.
Staged evacuation strategy is decided not only by the level of urgency in the evacuation zone, but also by the evacuation demand patterns at different origins in each evacuation zone.
Note that in Table 5-1 and Table 5-5, zone III has a higher clearance time and time span under the staged evacuation than those under simultaneous evacuation, but with a lower average travel time and waiting time. This is due to the fact that there does not exist a direct relation between these time indices. Average travel time and waiting time are computed with the total trips of all evacuees in the entire evacuation process, while evacuation clearance time and time span are defined only from the latest evacuee(s). Thus, a lower average travel time and waiting time do not necessarily lead to lower clearance time or time span. The demand distribution across origins, the time to issue evacuation order in each zone and the resultant difference in the routing plan will all affect these MOEs.
5. CONCLUSIONS
This study has presented a cell-based network optimization model for staged evacuation planning. With the objective of mitigating the network congestion under limited safety time window and roadway capacity, the proposed model intends not only to move evacuees more effectively through the target network, but also to decide the optimal sequence for starting the evacuation of different impacted zones. To capture the critical start time related issues during the generation of evacuation demands, this study has proposed a network enhancement approach to model the pre-determined dynamic loading patterns at all origins after the initiation of an evacuation order. The preliminary numerical results have confirmed the applicability of the proposed model in the staged evacuation planning.
Note that this paper has presented the preliminary research results in the current phase. More extensive numerical experiments will be conducted to assess the effectiveness of the proposed model under diversified demand patterns and other associated factors, such as network structures or behavioral parameters (e.g., half-loading time). Also note that although the current modeling system assumes a predetermined dynamic loading pattern for each origin, it can be conveniently revised to include a variable dynamic loading pattern that changes with the evacuation starting time (e.g., a later initiation leading to a shorter half-loading time).

Y. Liu, X. Lai and G.L. Chang 11
REFERENCES
1. Teo, A. Validation of an Evacuation Model Currently under Development. Fire Engineering Research Report 2001/7, School of Engineering, University of Canterbury, New Zealand, 2001
2. Harrington, G. Emergency preparedness: path to safety. Building Operating Management, Apr. 2005, http://www.findarticles.com/p/articles/mi_qa3922/is_200504/ai_n13634763. Accessed May 2005.
3. Chen, X., and F.B., Zhan. Agent-Based Modeling and Simulation of Urban Evacuation: Relative Effectiveness of Simultaneous and Staged Evacuation Strategies. Presented at 83rd Annual Meeting of the Transportation Research Board, Washington, D.C., 2004
4. Snyder D. Regional Emergency Evacuation Transportation Coordination Annex of the Regional Emergency Coordination Plan. http://www.mwcog.org/uploads/committee d ocuments/ v15ZWVw20040420130517.ppt. Accessed May 2005
5. Chiu, Y.C. Traffic Scheduling Simulation and Assignment for Area-Wide Evacuation. Presented at the 2004 IEEE Intelligent Transportation Systems Conference, Washington, D.C., 2004
6. Sorensen, J., B., Shumpert, and B., Vogt. Planning protective action decision-making: evacuate or shelter-in-place? ORNL Report ORNL/TM-2002/144, Oak Ridge National Lab, 2002
7. EmerGeo, EmerGeo Solutions, Inc. http://www.directionsmag.com/press.releases/index.php? duty=Show&id=10652. Accessed May 2005
8. EPIcode - a chemical disperson modeling software product, http://www.epicode.com. Accessed May 2005
9. Computer-Aided Management of Emergency Operations (CAMEO), http://www. scitechresources. gov/Results/show_result.php?rec=1961. Accessed May 2005
10. Sheffi, Y. Urban Transportation Networks. Englewood Cliffs, NJ: Prentice-Hall, 1985.11. Tweedie, S., J., Rowland, S., Walsh, R., Rhoten, and P., Hagle. A methodology for
estimating emergency evacuation times. The Social Science Journal, vol. 23, 1986, pp. 189-204
12. US Army Corps of Engineers. Alabama Hurricane Evacuation Study Technical Data Report: Behavioral Analysis. Final Report, 2000, http://www.sam.usace.army.mil/hesdata/Alabama/ alabamareportpage.htm. Accessed May 2005
13. Cova, T.J., and J.P., Johnson. Microsimulation of neighborhood evacuations in the urban-wildland interface. Environment and Planning A, vol.34, 2002, pp. 2211-2229
14. Fu, H., and C.G., Wilmot. A sequential logit dynamic travel demand model for hurricane evacuation. Presented at 83rd Annual Meeting of the Transportation Research Board, Washington, D.C., 2004
15. Alsnih, R., J., Rose, and P., Stopher. Understanding Household Evacuation Decisions Using A Stated Choice Survey – Case Study Of Bush Fires. Presented at 84th Annual Meeting of the Transportation Research Board, Washington, D.C., 2005
16. Daganzo, F.C. The Cell Transmission Model: A Dynamic Representation of Highway Traffic Consistent With the Hydrodynamic Theory. Transportation Research Part B, Vol. 28B, No. 4, 1994, pp. 269-287
17. Daganzo, F.C. The Cell Transmission Model. II. Network Traffic. Transportation Research Part B, Vol. 29, 1995, pp. 79-93

Y. Liu, X. Lai and G.L. Chang 12
18. Li, Y., A.K. Ziliaskopoulos and S. T. Waller. Linear Programming Formulations for System Optimum Dynamic Traffic Assignment with Arrival Time-based and Departure time-based Demands. In Transportation Research Record: Journal of the Transportation Research Board, No. 1667, TRB, National Research Council, Washington, D.C. , 1999, pp. 52-59
19. Ziliaskopoulos, A.K. A Linear Programming Model for the Single Destination System Optimum Dynamic Traffic Assignment Problem. Transportation Science, Vol. 34, No. 1, 2000, pp. 37-49
20. Lo, H.K. A cell-based traffic control formulation: strategies and benefits of dynamic timing plans. Transportation Science, Vol. 35, No. 2, 2001, pp. 148-154

Y. Liu, X. Lai and G.L. Chang 13
LIST OF TABLES
TABLE 1 Property of Evacuation ZonesTABLE 2 Five Different Demand ScenariosTABLE 3 Traffic Characteristics of Different Road TypesTABLE 4 Property of Cells in Cell Connection DiagramTABLE 5-1 Summary of Optimization Results for Demand Scenario 1TABLE 5-2 Summary of Optimization Results for Demand Scenario 2TABLE 5-3 Summary of Optimization Results for Demand Scenario 3TABLE 5-4 Summary of Optimization Results for Demand Scenario 4TABLE 5-5 Summary of Optimization Results for Demand Scenario 5
LIST OF FIGURES
FIGURE 1 Illustration of the staged evacuation conceptFIGURE 2 Network enhancement for originsFIGURE 3 Study network for numerical testsFIGURE 4 Cell connection diagram for the study networkFIGURE 5 Enhanced cell connection diagram at origins

Y. Liu, X. Lai and G.L. Chang 14
TABLE 1 Property of Evacuation Zones
Index Zone I Zone II Zone III
Latest Time forEvacuation Order Initiation LSz
(min)
Staged Evacuation 0 60 90
Simultaneous Evacuation 0 0 0
Latest Time for Evacuation Zone Clearance LCz
(min) 40 80 120
Weighting Factor wz 3 2 1

Y. Liu, X. Lai and G.L. Chang 15
TABLE 2 Five Different Demand Scenarios
Origin Origin 1 Origin 2 Origin 3 Origin 4Half loading time
(min) 5 5 8 10
Total demand
(veh)
Scenario 1 3000 4000 0 4000Scenario 2 3000 1000 3000 4000Scenario 3 3000 1000 3000 2000Scenario 4 2000 2000 3000 4000Scenario 5 3000 3000 3000 3000

Y. Liu, X. Lai and G.L. Chang 16
TABLE 3 Traffic Characteristics of Different Road Types
Index Free-flow speed (mph)
Saturated flow rate (vphpl)
Jam density (vpmpl)
Freeway 60 2160 150Arterial 30 1800 150

Y. Liu, X. Lai and G.L. Chang 17
TABLE 4 Property of Cells in Cell Connection Diagram
Cell Type Cell ID Link located
Physical length
No. of lanes
Flow capacity Q
Storage capacity N
Source 101-104 - - - Auxiliary 4001-4210 - - - Waiting 301-304 - - -
General
1 1
1 mi
4 144veh/min 600veh
2-5 2 2
72veh/min 300veh
6-8 3 29-10 4 211 5 212-14 6 215-17 7 218-20 8 221-22 9
0.5 mi
2
60veh/min 150veh23-26 10 227-30 11 231 12 2
Destination 201-202 - - 2

Y. Liu, X. Lai and G.L. Chang 18
TABLE 5-1 Summary of Optimization Results for Demand Scenario 1
Total Demand at Origins (veh) O1:3000, O2:4000, O3: 0, O4:4000Evacuation Strategy Staged SimultaneousEvacuation Zone I II III I II IIIEvacuation Order Time (min) 0 10 0 0 0 0Zone Clearance Time (min) 37 78 88 39 75 87Time Span (min) 37 68 88 39 75 87Average Travel Time (min) 5.15 8.74 10.22 7.15 10.18 10.68Average Waiting Time at origins (min)
8.40 24.78 27.63 8.96 26.87 28.98
Y. Liu, X. Lai and G.L. Chang 19
TABLE 5-2 Summary of Optimization Results for Demand Scenario 2
Total Demand at Origins (veh) O1:3000, O2:1000, O3:3000, O4:4000Evacuation Strategy Staged SimultaneousEvacuation Zone I II III I II IIIEvacuation Order Time (min) 0 0 20 0 0 0Zone Clearance Time (min) 39 64 96 39 73 86Time Span (min) 39 64 76 39 73 86Average Travel Time (min) 8.46 13.86 8.02 8.46 17.39 10.54Average Waiting Timeat origins (min)
8.10 8.20 27.63 8.10 8.20 29.40

Y. Liu, X. Lai and G.L. Chang 20
TABLE 5-3 Summary of Optimization Results for Demand Scenario 3
Total Demand at Origins (veh) O1:3000, O2:1000, O3:3000, O4:2000Evacuation Strategy Staged SimultaneousEvacuation Zone I II III I II IIIEvacuation Order Time (min) 0 0 30 0 0 0Zone Clearance Time (min) 39 57 74 39 60 73Time Span (min) 39 57 44 39 60 73Average Travel Time (min) 8.46 13.01 6.33 8.49 13.71 10.19Average Waiting Time at origins (min)
8.10 8.20 11.79 8.10 8.20 16.63

Y. Liu, X. Lai and G.L. Chang 21
TABLE 5-4 Summary of Optimization Results for Demand Scenario 4
Total Demand at Origins (veh) O1:2000, O2:2000, O3:3000, O4:4000Evacuation Strategy Staged SimultaneousEvacuation Zone I II III I II IIIEvacuation Order Time (min) 0 0 20 0 0 0Zone Clearance Time (min) 39 64 96 39 74 86Time Span (min) 39 64 76 39 74 86Average Travel Time (min) 10.18 13.80 8.02 10.24 17.32 10.54Average Waiting Time at Origins (min)
4.73 10.61 27.63 4.73 10.61 29.41

Y. Liu, X. Lai and G.L. Chang 22
TABLE 5-5 Summary of Optimization Results for Demand Scenario 5
Total Demand at Origins (veh) O1:3000, O2:3000, O3:3000, O4:3000Evacuation Strategy Staged SimultaneousEvacuation Zone I II III I II IIIEvacuation Order Time (min) 0 20 0 0 0 0Zone Clearance Time (min) 33 79 95 39 79 93Time Span (min) 33 59 95 39 79 93Average Travel Time (min) 4.0 9.94 10.32 8.59 14.70 10.73Average Waiting Time at Origins (min)
8.04 14.03 31.40 8.18 19.42 33.67

Y. Liu, X. Lai and G.L. Chang 23
FIGURE 1 Illustration of the staged evacuation concept

Y. Liu, X. Lai and G.L. Chang 24
FIGURE 2 Network enhancement for origins
r zLSa 1 zLSa 1a rcw

Y. Liu, X. Lai and G.L. Chang 25
FIGURE 3 Study network for numerical tests
Y. Liu, X. Lai and G.L. Chang 26
FIGURE 4 Cell connection diagram for the study network

Y. Liu, X. Lai and G.L. Chang 27
FIGURE 5 Enhanced cell connection diagram at origins