Embed Size (px)
Citation preview
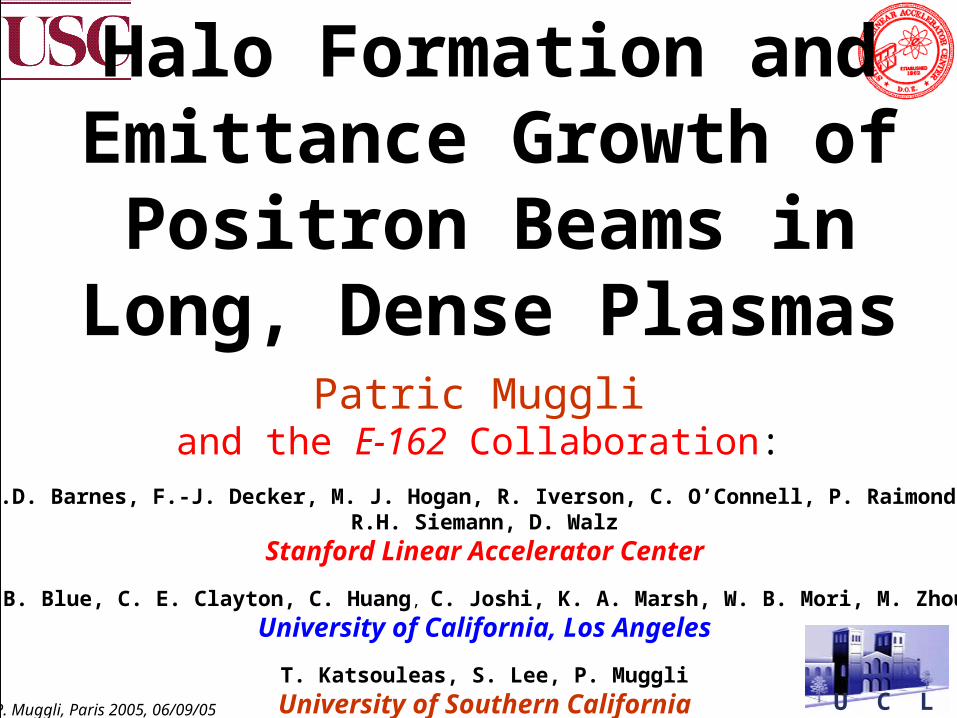
U C L AP. Muggli, Paris 2005, 06/09/05
Halo Formation and Emittance Growth of Positron Beams in
Long, Dense PlasmasPatric Muggli
and the E-162 Collaboration:C.D. Barnes, F.-J. Decker, M. J. Hogan, R. Iverson, C. O’Connell, P. Raimondi,
R.H. Siemann, D. Walz
Stanford Linear Accelerator Center
B. Blue, C. E. Clayton, C. Huang, C. Joshi, K. A. Marsh, W. B. Mori, M. Zhou
University of California, Los Angeles
T. Katsouleas, S. Lee, P. Muggli
University of Southern California
U C L AP. Muggli, Paris 2005, 06/09/05
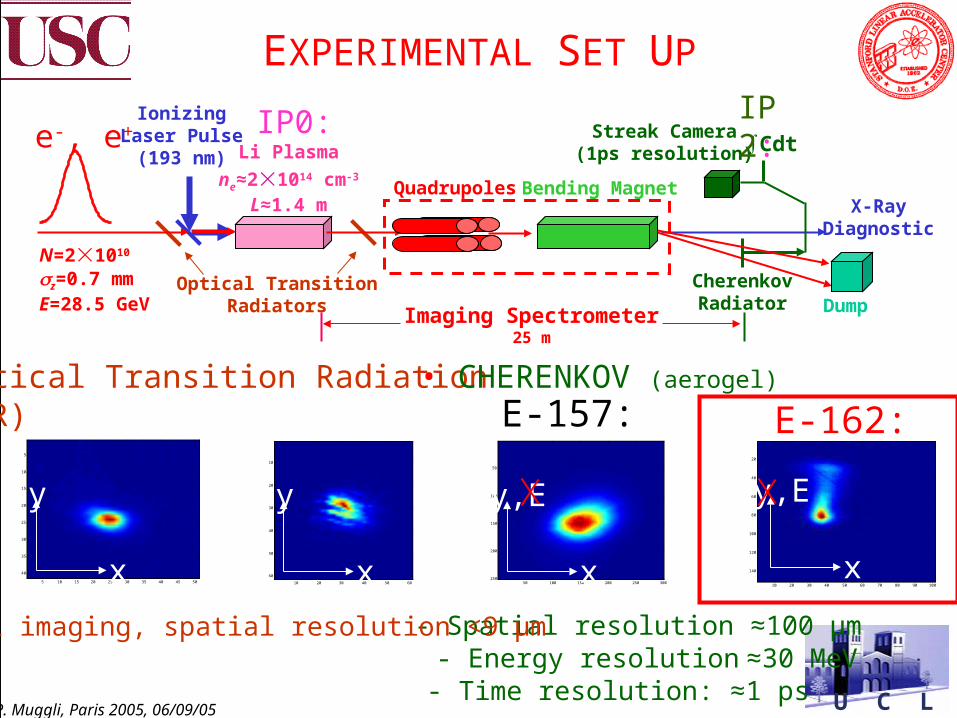
• Optical Transition Radiation(OTR)
• CHERENKOV (aerogel)
- Spatial resolution ≈100 µm - Energy resolution ≈30 MeV- Time resolution: ≈1 ps
5 10 15 20 25 30 35 40 45 50
5
10
15
20
25
30
35
40
y
x10 20 30 40 50 60
10
20
30
40
50
60
y
x
EXPERIMENTAL SET UP
E-157:
50 100 150 200 250 300
50
100
150
200
250
y,E
x10 20 30 40 50 60 70 80 90 100
20
40
60
80
100
120
140
y,E
x
E-162:
- 1:1 imaging, spatial resolution <9 µm
e-, e+
N=21010
z=0.7 mmE=28.5 GeV
IonizingLaser Pulse
(193 nm) Li Plasma
ne≈21014 cm-3
L≈1.4 m
CherenkovRadiator
Streak Camera(1ps resolution)
Bending MagnetX-Ray
Diagnostic
Optical TransitionRadiators Dump
∫Cdt
Quadrupoles
Imaging Spectrometer25 m
IP0: IP2:
U C L AP. Muggli, Paris 2005, 06/09/05
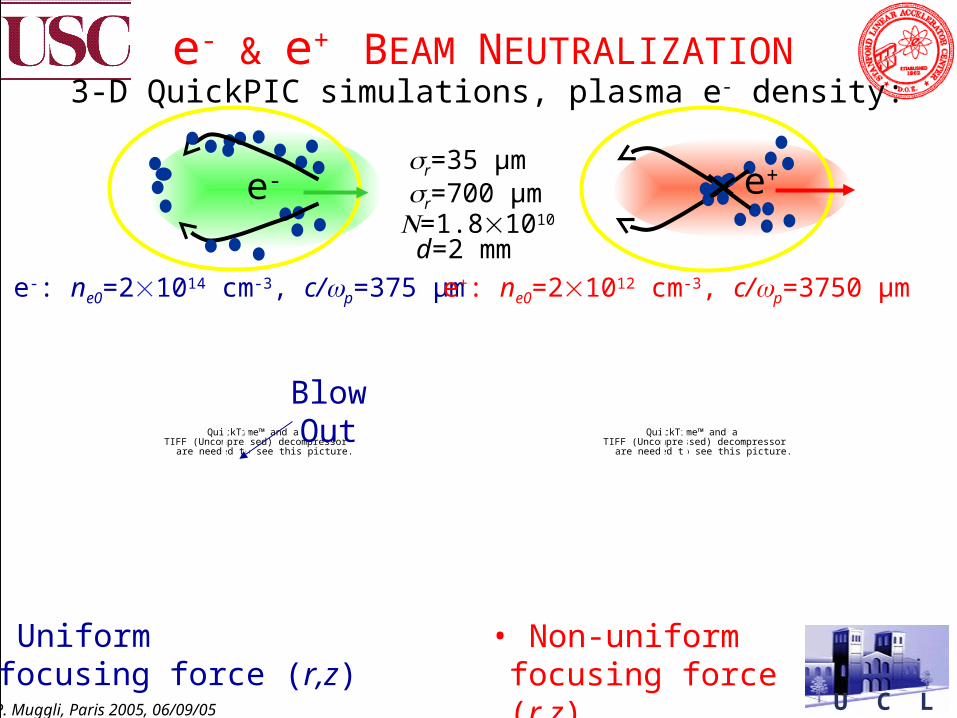
e-: ne0=21014 cm-3, c/p=375 µm e+: ne0=21012 cm-3, c/p=3750 µm
r=35 µmr=700 µm
• Uniformfocusing force (r,z)
=1.81010
• Non-uniformfocusing force (r,z)
d=2 mm
QuickTime™ and aTIFF (Uncompressed) decompressor
are needed to see this picture.
BlowOut
3 beamFront
Back
QuickTime™ and aTIFF (Uncompressed) decompressor
are needed to see this picture.
30 beamFront
Back
3-D QuickPIC simulations, plasma e- density:e- & e+ BEAM NEUTRALIZATION
e- e+
U C L AP. Muggli, Paris 2005, 06/09/05
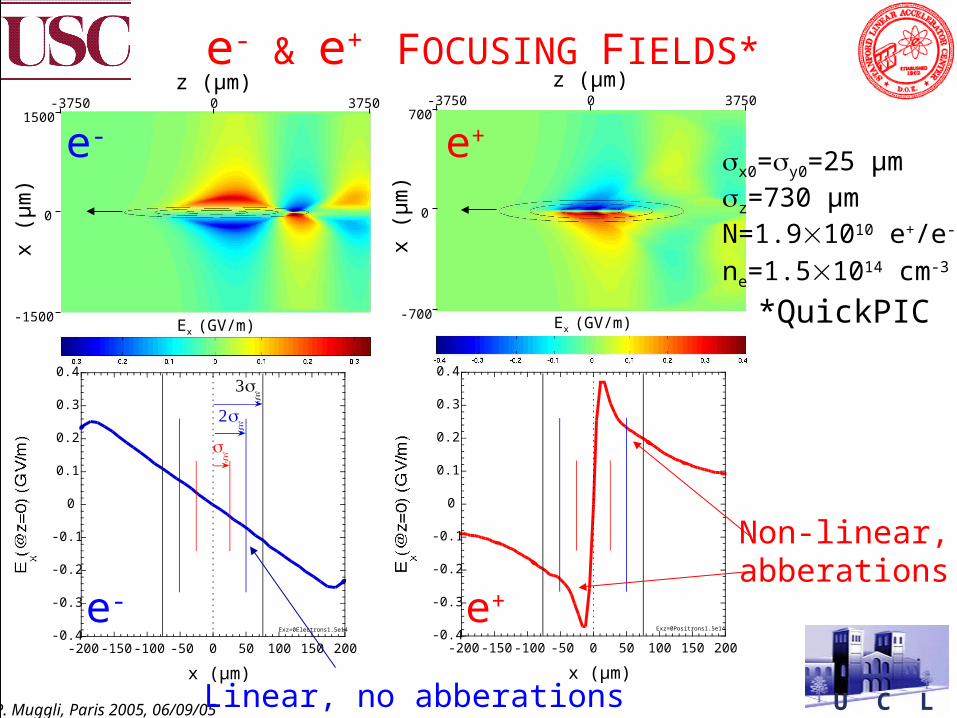
e- & e+ FOCUSING FIELDS*
Ex (GV/m)
0
1500
-1500
0-3750 3750
x (µ
m)
z (µm)
e-
Ex (GV/m)
0
700
-700
0-3750 3750
x (µ
m)
z (µm)
e+
-0.4
-0.3
-0.2
-0.1
0
0.1
0.2
0.3
0.4
-200 -150 -100 -50 0 50 100 150 200
Exz=0Electrons1.5e14
x (µm)
x
2x
3x
e--0.4
-0.3
-0.2
-0.1
0
0.1
0.2
0.3
0.4
-200 -150 -100 -50 0 50 100 150 200
Exz=0Positrons1.5e14
x (µm)
e+
x0=y0=25 µmz=730 µmN=1.91010 e+/e-
ne=1.51014 cm-3 *QuickPIC
Linear, no abberations
Non-linear,abberations
U C L AP. Muggli, Paris 2005, 06/09/05
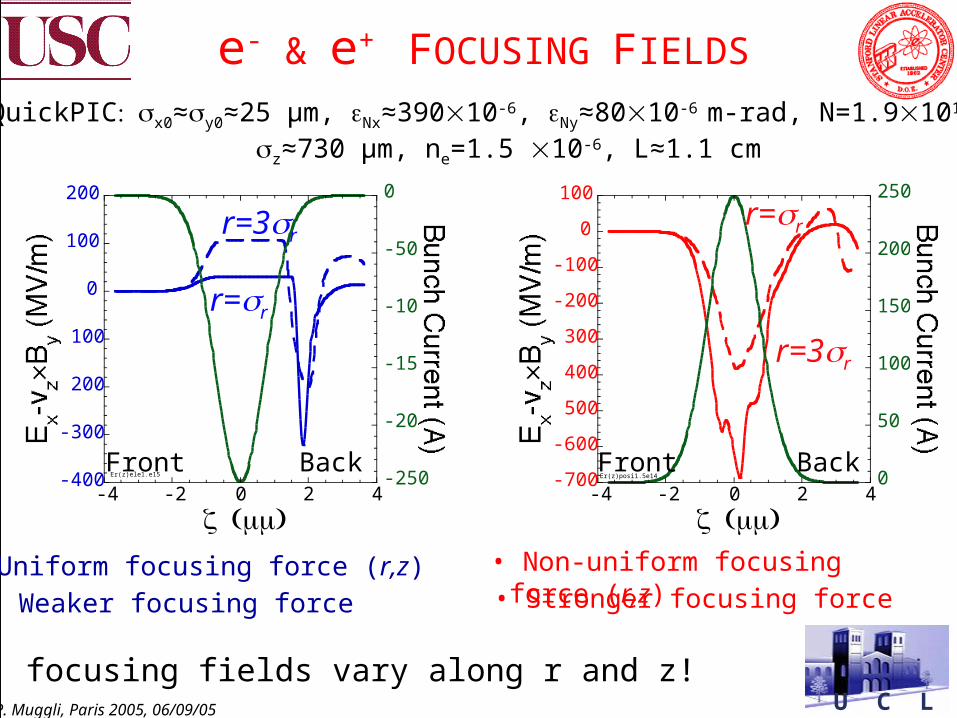
e- & e+ FOCUSING FIELDS
-400
-300
-200
-100
0
100
200
-250
-200
-150
-100
-50
0
-4 -2 0 2 4Er(z)ele1.e15
( )z mm
r=r
r=3r
-700
-600
-500
-400
-300
-200
-100
0
100
0
50
100
150
200
250
-4 -2 0 2 4Er(z)posi1.5e14
( )z mm
r=r
r=3r
QuickPIC x0≈y0≈25 µm, Nx≈39010-6, Ny≈8010-6 m-rad, N=1.91010 e+,
z≈730 µm, ne=1.5 10-6, L≈1.1 cm
• Uniform focusing force (r,z) • Non-uniform focusing force (r,z)
• Weaker focusing force • Stronger focusing force
Front Back Front Back
• e+: focusing fields vary along r and z!
U C L AP. Muggli, Paris 2005, 06/09/05
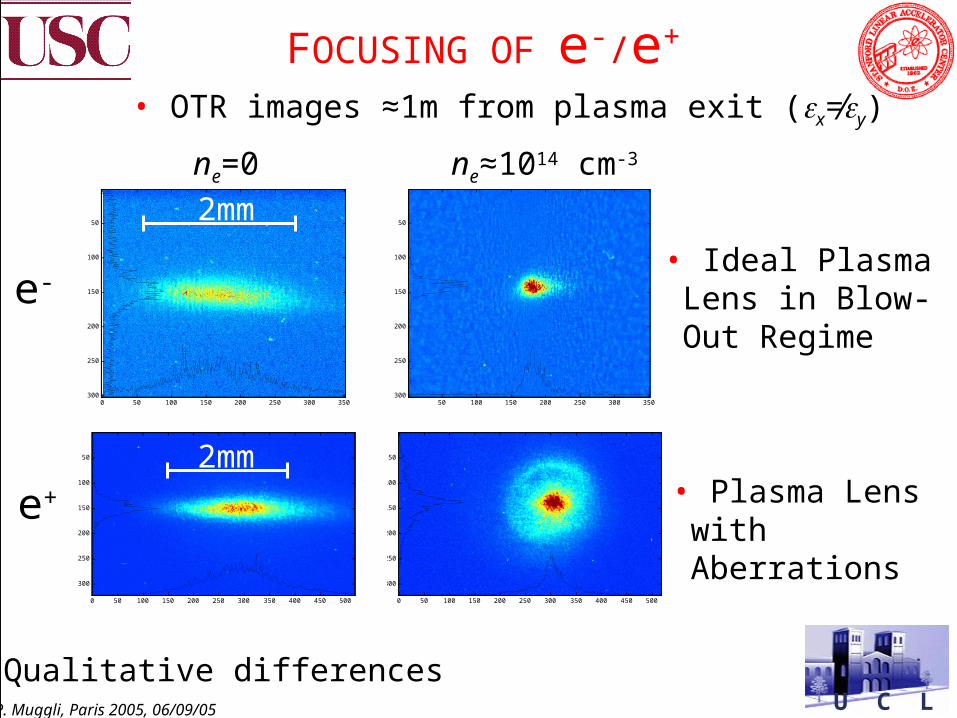
FOCUSING OF e-/e+
0 50 100 150 200 250 300 350 400 450 500
50
100
150
200
250
300
0 50 100 150 200 250 300 350 400 450 500
50
100
150
200
250
300
0 50 100 150 200 250 300 350
50
100
150
200
250
30050 100 150 200 250 300 350
50
100
150
200
250
300
e-
e+
ne=0 ne≈1014 cm-3
2mm
2mm
• Ideal Plasma Lens in Blow-Out Regime
• Plasma Lens with Aberrations
• OTR images ≈1m from plasma exit (x≠y)
• Qualitative differences
U C L AP. Muggli, Paris 2005, 06/09/05
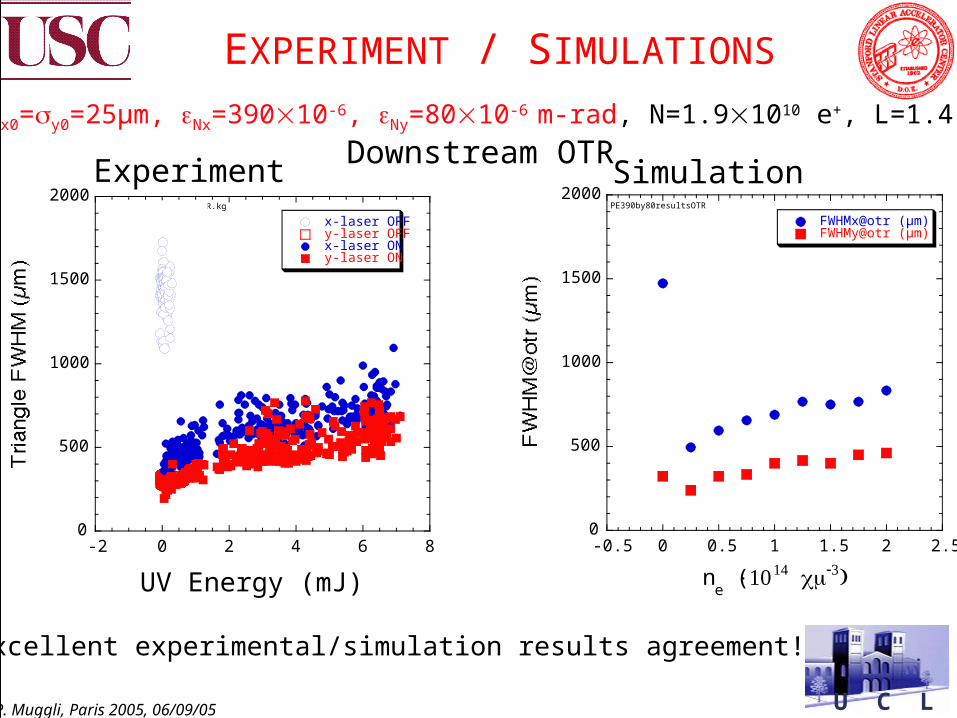
EXPERIMENT / SIMULATIONS
x0=y0=25µm, Nx=39010-6, Ny=8010-6 m-rad, N=1.91010 e+, L=1.4 m
Downstream OTR
0
500
1000
1500
2000
-0.5 0 0.5 1 1.5 2 2.5
PE390by80resultsOTR
FWHMx@otr (µm)FWHMy@otr (µm)
ne (×114 cm-3)
• Excellent experimental/simulation results agreement!
SimulationExperiment
0
500
1000
1500
2000
-2 0 2 4 6 8
12230cl-n-md4TriangOTR.kg
x-laser OFFy-laser OFFx-laser ONy-laser ON
UV (mJ) OFFUV Energy (mJ)
U C L AP. Muggli, Paris 2005, 06/09/05
0
100
200
300
400
500
600
700
800
-1 0 1 2 3 4 5
12220ce-f-gd4TriangOTR
x-laser OFFy-laser OFFx-laser ONy-laser ON
UV (mJ) OFF
0
100
200
300
400
500
600
700
800
-0.5 0 0.5 1 1.5 2 2.5
PE115by184largeresults
FWHMx@otr (µm)FWHMy@otr (µm)
ne (×114 cm-3)
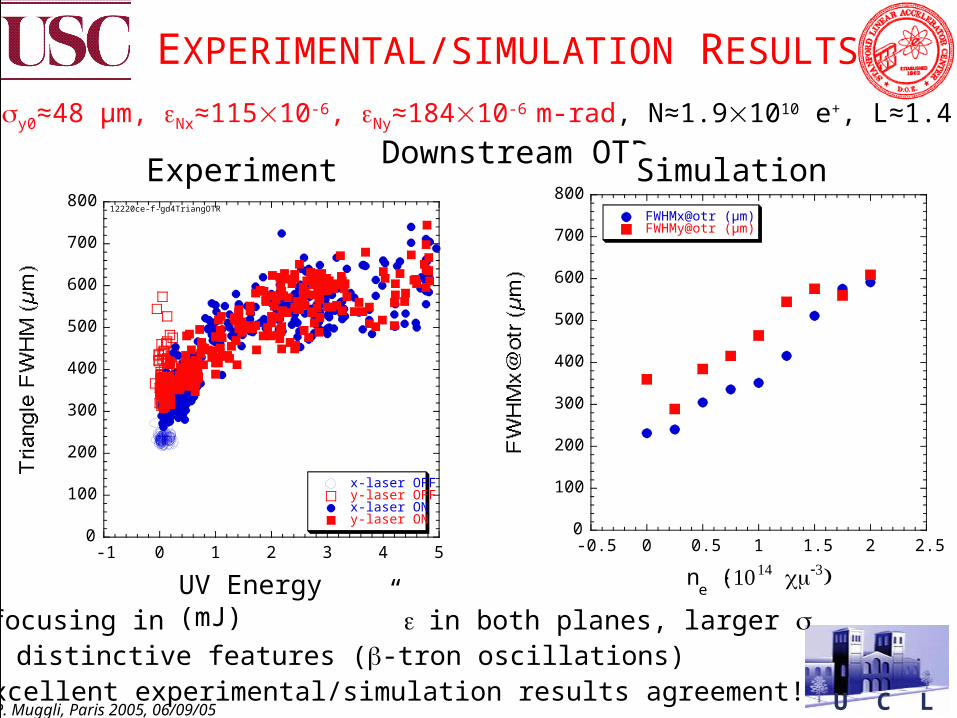
Downstream OTR
• Defocusing in x and y “low” in both planes, larger • No distinctive features (-tron oscillations)• Excellent experimental/simulation results agreement!
x0≈65 y0≈48 µm, Nx≈11510-6, Ny≈18410-6 m-rad, N≈1.91010 e+, L≈1.4 m
EXPERIMENTAL/SIMULATION RESULTS
Experiment Simulation
UV Energy (mJ)
U C L AP. Muggli, Paris 2005, 06/09/05
0
200
400
600
800
1000
-0.5 0 0.5 1 1.5 2 2.5
PE390by80results
FWHMx@PlEx (µm)FWHMy@PlEx (µm)
ne (×114 cm-3)
10 20 30 40 50 60 70 80 90 100
20
40
60
80
100
120
140
y,E
x
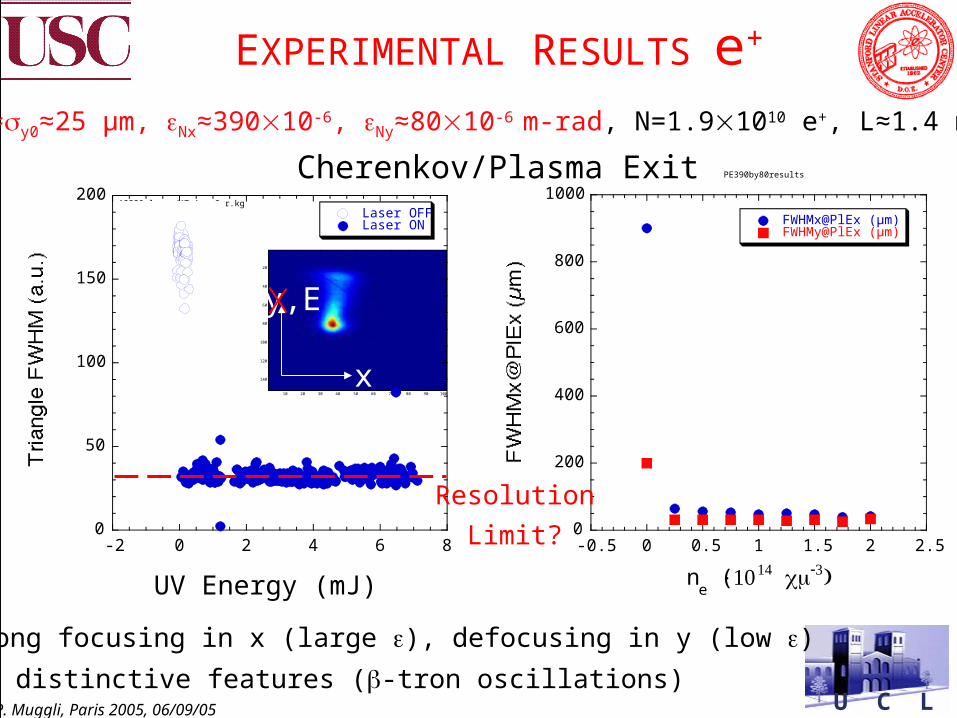
EXPERIMENTAL RESULTS e+
x0≈y0≈25 µm, Nx≈39010-6, Ny≈8010-6 m-rad, N=1.91010 e+, L≈1.4 m
Cherenkov/Plasma Exit
0
50
100
150
200
-2 0 2 4 6 8
12230cl-n-md4TriangCer.kgLaser OFFLaser ON
UV (mJ) OFFUV Energy (mJ)
• Strong focusing in x (large ), defocusing in y (low ) • No distinctive features (-tron oscillations)
Resolution
Limit?
U C L AP. Muggli, Paris 2005, 06/09/05
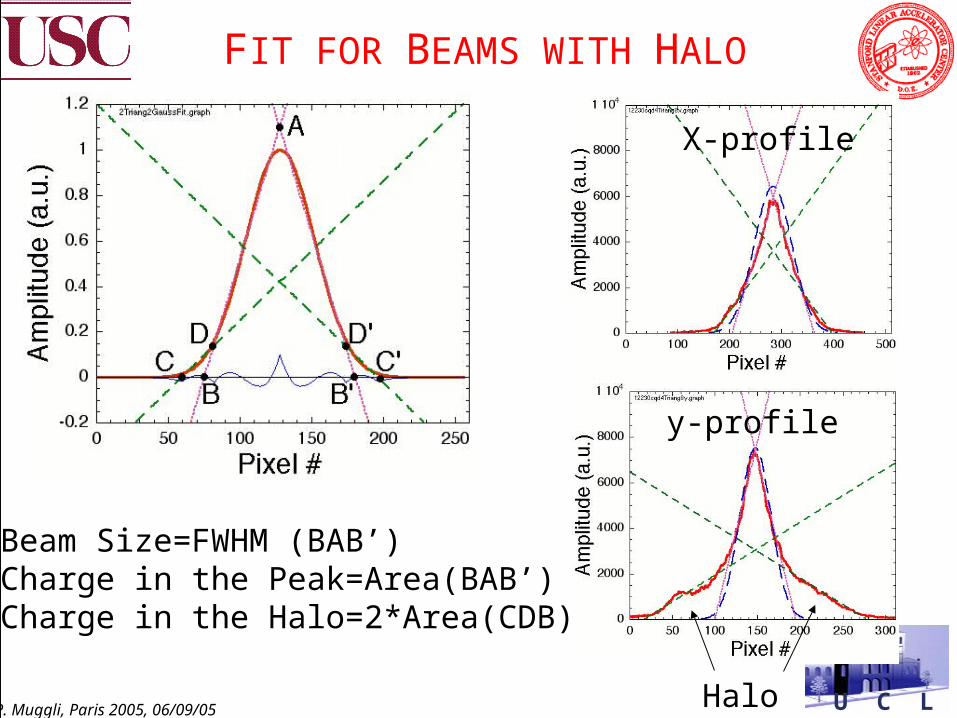
Beam Size=FWHM (BAB’)Charge in the Peak=Area(BAB’)Charge in the Halo=2*Area(CDB)
FIT FOR BEAMS WITH HALO
X-profile
y-profile
Halo
U C L AP. Muggli, Paris 2005, 06/09/05
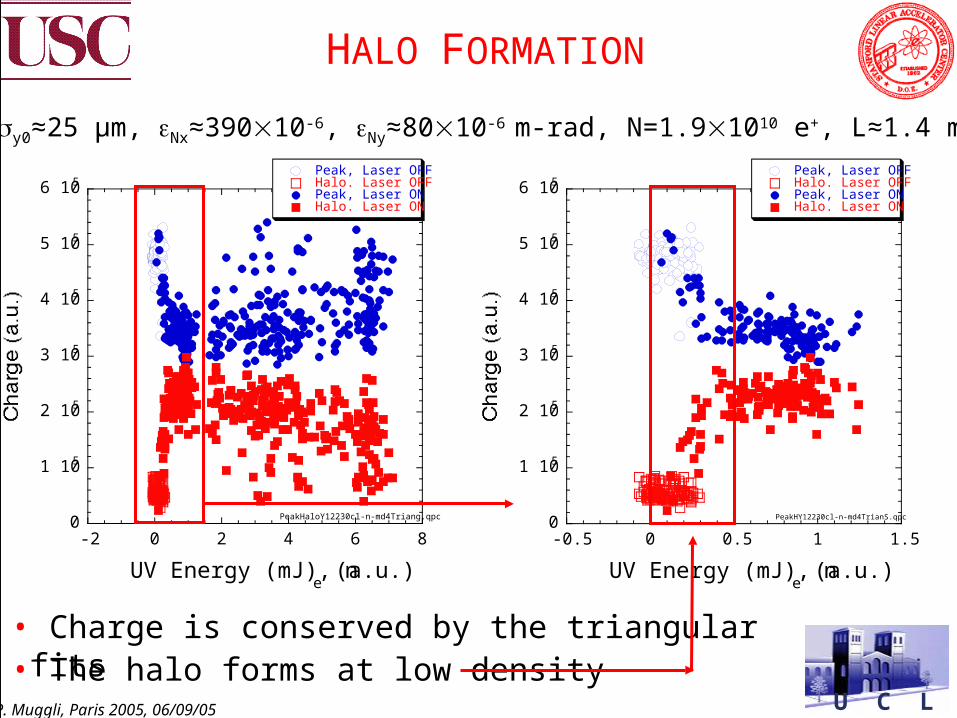
0
1 105
2 105
3 105
4 105
5 105
6 105
-2 0 2 4 6 8
PeakHaloY12230cl-n-md4Triang.qpc
Peak, Laser OFFHalo. Laser OFFPeak, Laser ONHalo. Laser ON
UV Energy (mJ), ne (a.u.)
0
1 105
2 105
3 105
4 105
5 105
6 105
-0.5 0 0.5 1 1.5
PeakHY12230cl-n-md4TrianS.qpc
Peak, Laser OFFHalo. Laser OFFPeak, Laser ONHalo. Laser ON
UV Energy (mJ), ne (a.u.)
HALO FORMATION
x0≈y0≈25 µm, Nx≈39010-6, Ny≈8010-6 m-rad, N=1.91010 e+, L≈1.4 m
• Charge is conserved by the triangular fits• The halo forms at low density
U C L AP. Muggli, Paris 2005, 06/09/05
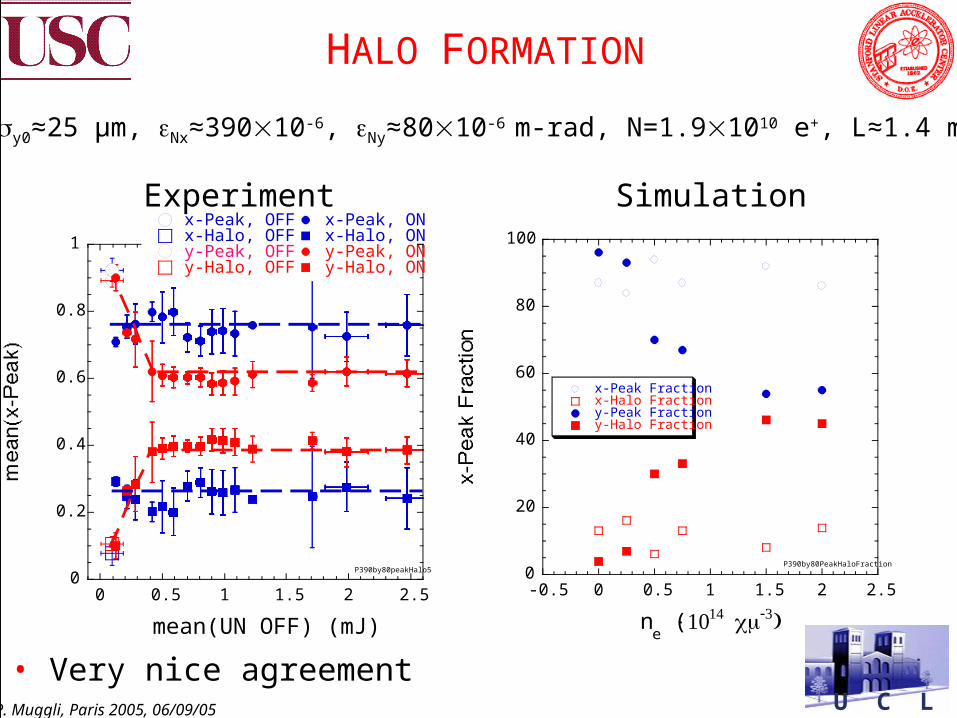
HALO FORMATION
x0≈y0≈25 µm, Nx≈39010-6, Ny≈8010-6 m-rad, N=1.91010 e+, L≈1.4 m
• Very nice agreement
0
20
40
60
80
100
-0.5 0 0.5 1 1.5 2 2.5
P390by80PeakHaloFraction
x-Peak Fractionx-Halo Fractiony-Peak Fractiony-Halo Fraction
ne (×114 cm-3)
0
0.2
0.4
0.6
0.8
1
0 0.5 1 1.5 2 2.5
P390by80peakHalo5
x-Peak, OFFx-Halo, OFFy-Peak, OFFy-Halo, OFF
x-Peak, ONx-Halo, ONy-Peak, ONy-Halo, ON
mean(UN OFF) (mJ)
Experiment Simulation
U C L AP. Muggli, Paris 2005, 06/09/05
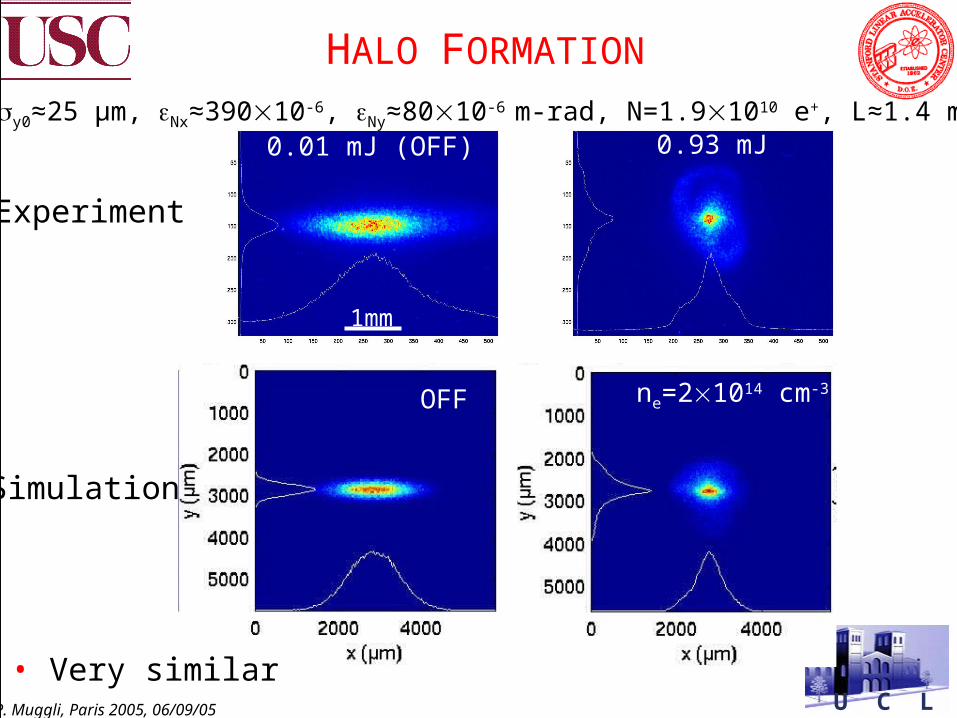
0.93 mJ0.01 mJ (OFF)
1mm
OFF ne=21014 cm-3
HALO FORMATION
x0≈y0≈25 µm, Nx≈39010-6, Ny≈8010-6 m-rad, N=1.91010 e+, L≈1.4 m
Experiment
Simulation
• Very similar
U C L AP. Muggli, Paris 2005, 06/09/05
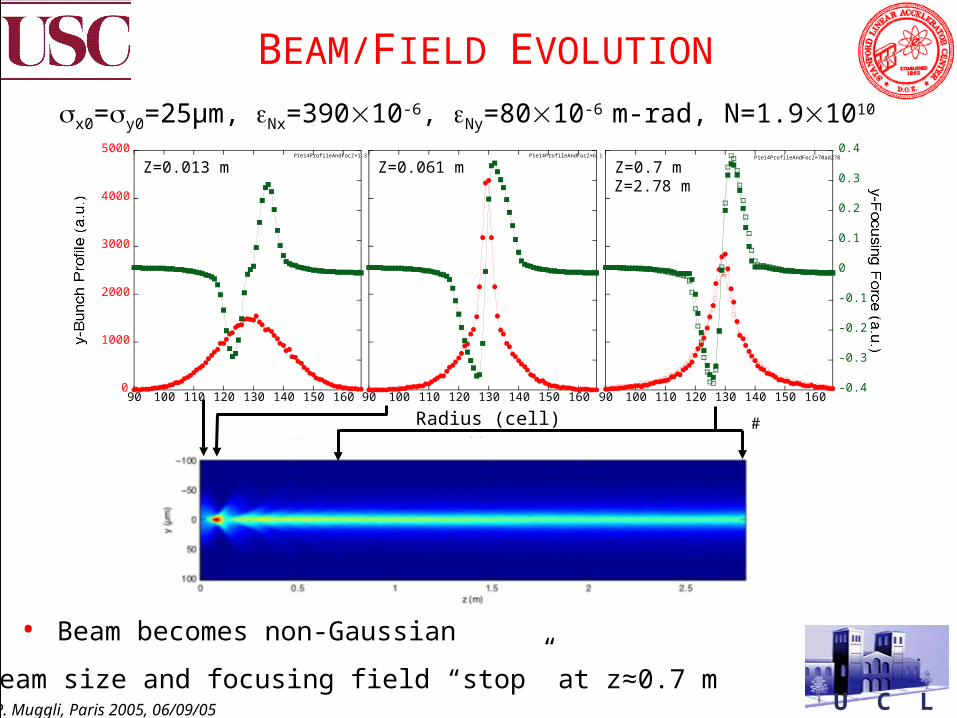
BEAM/FIELD EVOLUTION
90 100 110 120 130 140 150 160
P1e14ProfileAndFocZ=6.1
Cell #
Z=0.061 m
-0.4
-0.3
-0.2
-0.1
0
0.1
0.2
0.3
0.4
90 100 110 120 130 140 150 160
P1e14ProfileAndFocZ=70ad278
Cell #
Z=0.7 mZ=2.78 m
0
1000
2000
3000
4000
5000
90 100 110 120 130 140 150 160
P1e14ProfileAndFocZ=1.3
Cell #
Z=0.013 m
Radius (cell)
x0=y0=25µm, Nx=39010-6, Ny=8010-6 m-rad, N=1.91010
• Beam becomes non-Gaussian
• Beam size and focusing field “stop” at z≈0.7 m
U C L AP. Muggli, Paris 2005, 06/09/05
0
10
20
30
40
50
60
0 0.5 1 1.5
Electrons1.5e142SlicesSize.graph
Slce #1
Slce #2
Slce #3
Slce #4
Slce #5
( ) z m
0
10
20
30
40
50
60
0 0.5 1 1.5
Positrons1.5e142SlicesSize.graph
1x ( ) µm
2x ( ) µm
3x ( ) µm
4x ( ) µm
5x ( )µm
( ) z m
0 2 4 6 8 10 12 14 16-1.5
-1
-0.5
0
0.5
1
1.5x 10⁻¹²
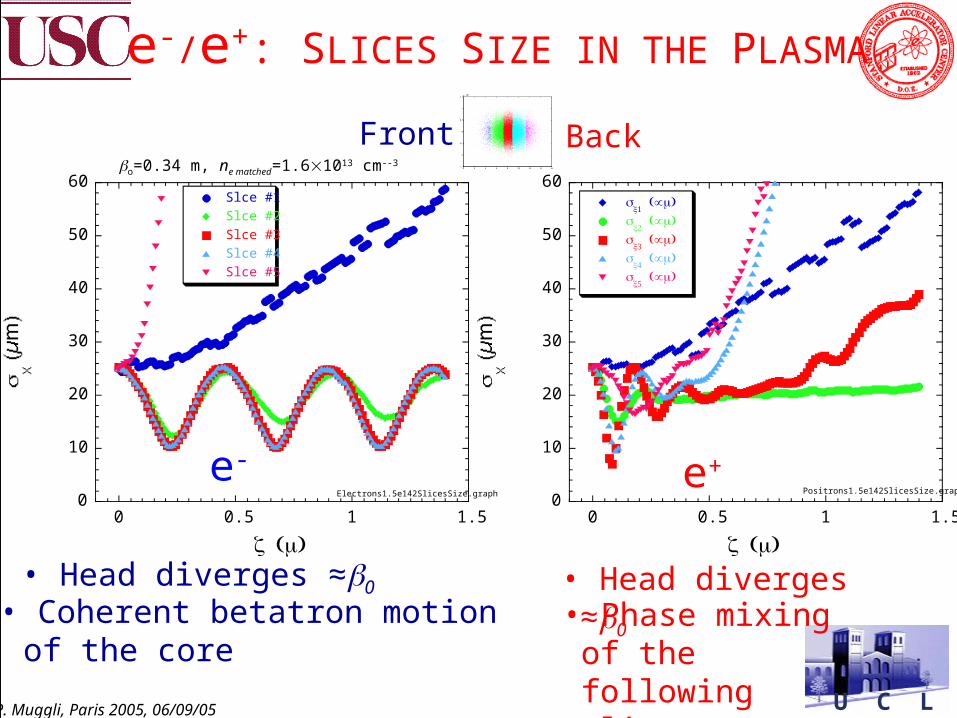
e-/e+: SLICES SIZE IN THE PLASMA
Front Back
e- e+
o=0.34 m, ne matched=1.61013 cm--3
• Head diverges ≈0 • Head diverges ≈0• Coherent betatron motion
of the core• Phase mixing of the
following slices
U C L AP. Muggli, Paris 2005, 06/09/05
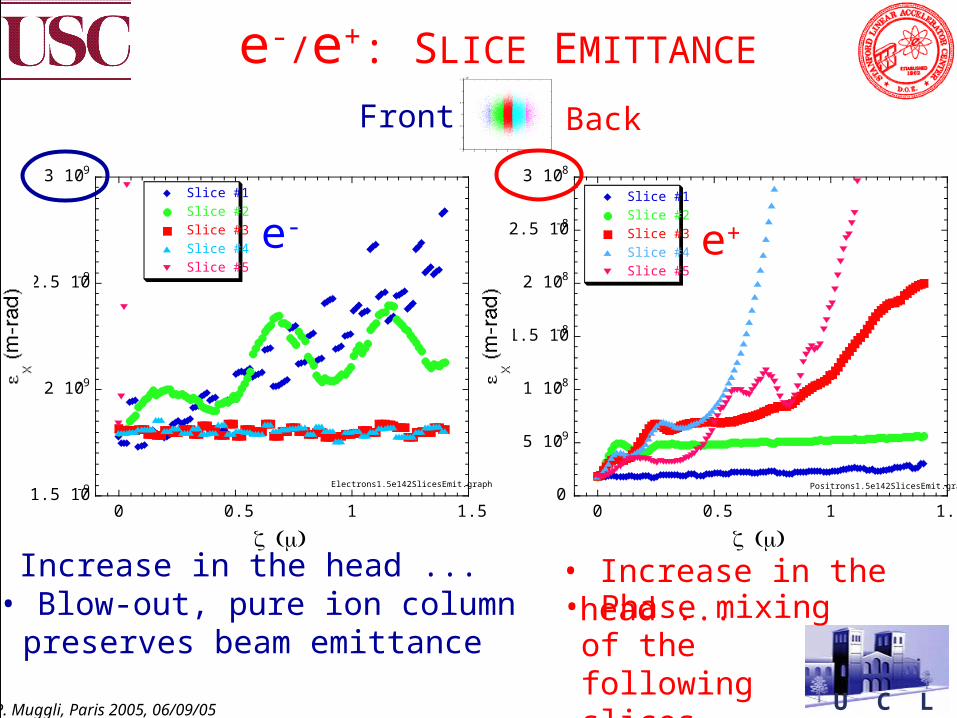
e-/e+: SLICE EMITTANCE
0 2 4 6 8 10 12 14 16-1.5
-1
-0.5
0
0.5
1
1.5x 10⁻¹²
Front Back
e- e+
1.5 10-9
2 10-9
2.5 10-9
3 10-9
0 0.5 1 1.5
Electrons1.5e142SlicesEmit.graph
Slice #1
Slice #2
Slice #3
Slice #4
Slice #5
( ) z m
0
5 10-9
1 10-8
1.5 10-8
2 10-8
2.5 10-8
3 10-8
0 0.5 1 1.5
Positrons1.5e142SlicesEmit.graph
Slice #1
Slice #2
Slice #3
Slice #4
Slice #5
( ) z m• Increase in the head ... • Increase in the head ...• Blow-out, pure ion column
preserves beam emittance• Phase mixing of the
following slices
U C L AP. Muggli, Paris 2005, 06/09/05
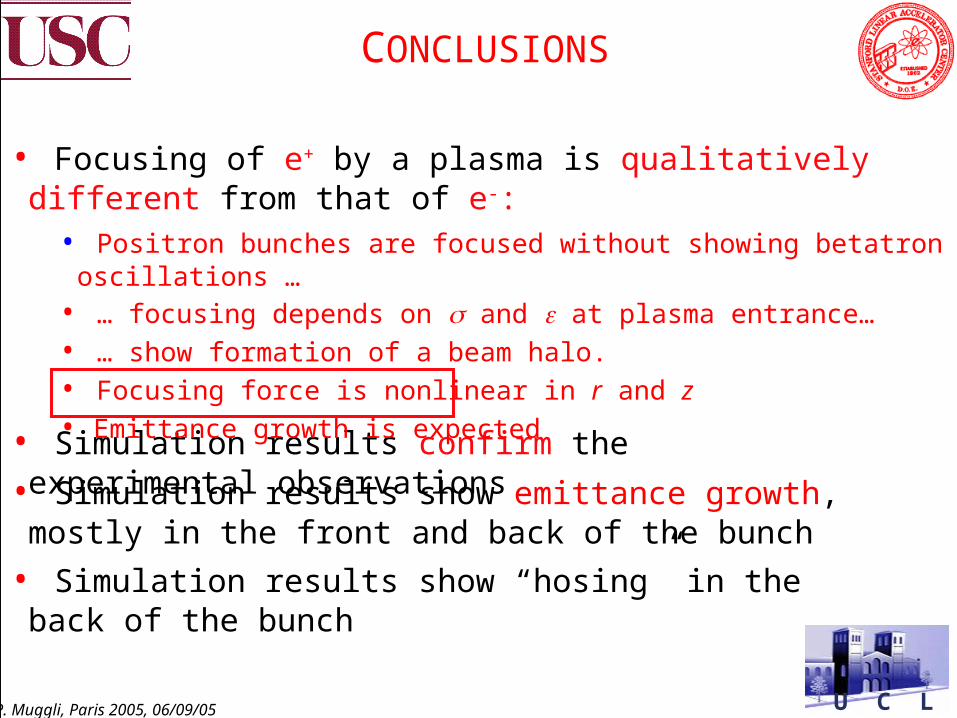
CONCLUSIONS
• Simulation results show emittance growth, mostly in the front and back of the bunch
• Simulation results confirm the experimental observations
• Simulation results show “hosing” in the back of the bunch
• Focusing of e+ by a plasma is qualitatively different from that of e-:
• Positron bunches are focused without showing betatron oscillations …
• … focusing depends on and at plasma entrance…
• … show formation of a beam halo.
• Focusing force is nonlinear in r and z
• Emittance growth is expected
U C L AP. Muggli, Paris 2005, 06/09/05
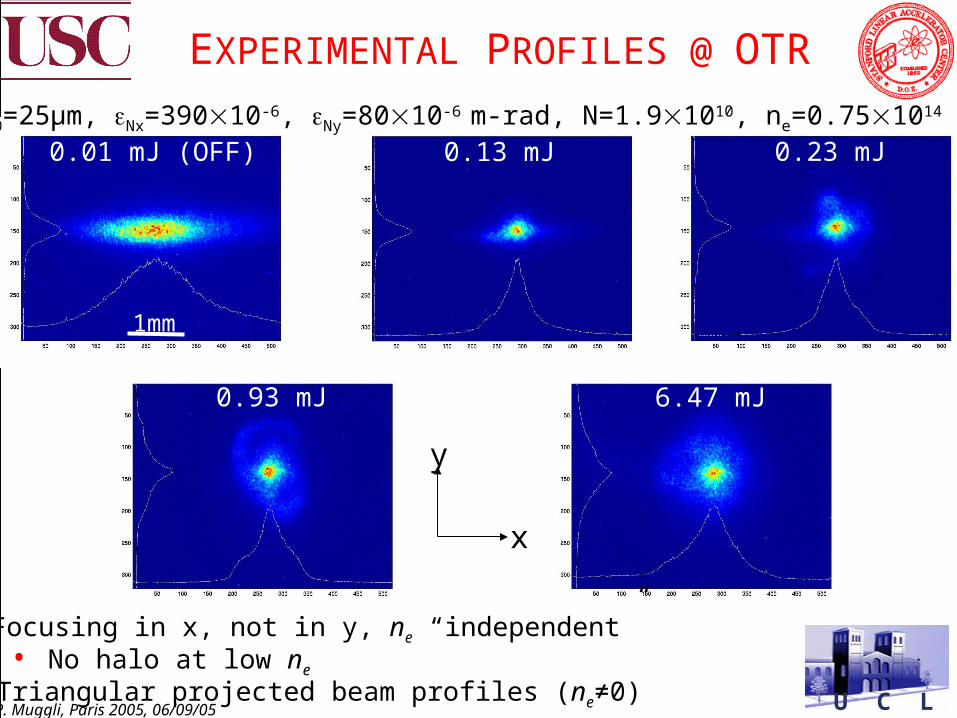
0.13 mJ 0.23 mJ
0.93 mJ 6.47 mJ
0.01 mJ (OFF)
1mm
EXPERIMENTAL PROFILES @ OTR
y
x
x0=y0=25µm, Nx=39010-6, Ny=8010-6 m-rad, N=1.91010, ne=0.751014 cm-3
• Focusing in x, not in y, ne “independent”• No halo at low ne
• Triangular projected beam profiles (ne≠0)
U C L AP. Muggli, Paris 2005, 06/09/05
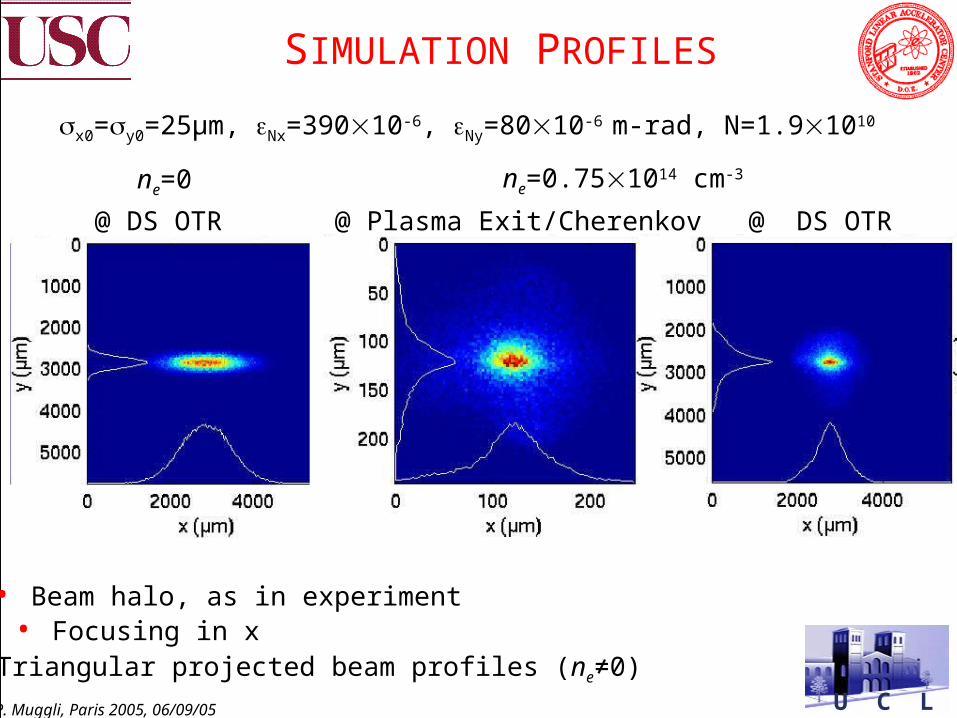
SIMULATION PROFILES
x0=y0=25µm, Nx=39010-6, Ny=8010-6 m-rad, N=1.91010
• Beam halo, as in experiment• Focusing in x
@ DS OTR
ne=0.751014 cm-3 @ Plasma Exit/Cherenkov @ DS OTR
ne=0
• Triangular projected beam profiles (ne≠0)
U C L AP. Muggli, Paris 2005, 06/09/05
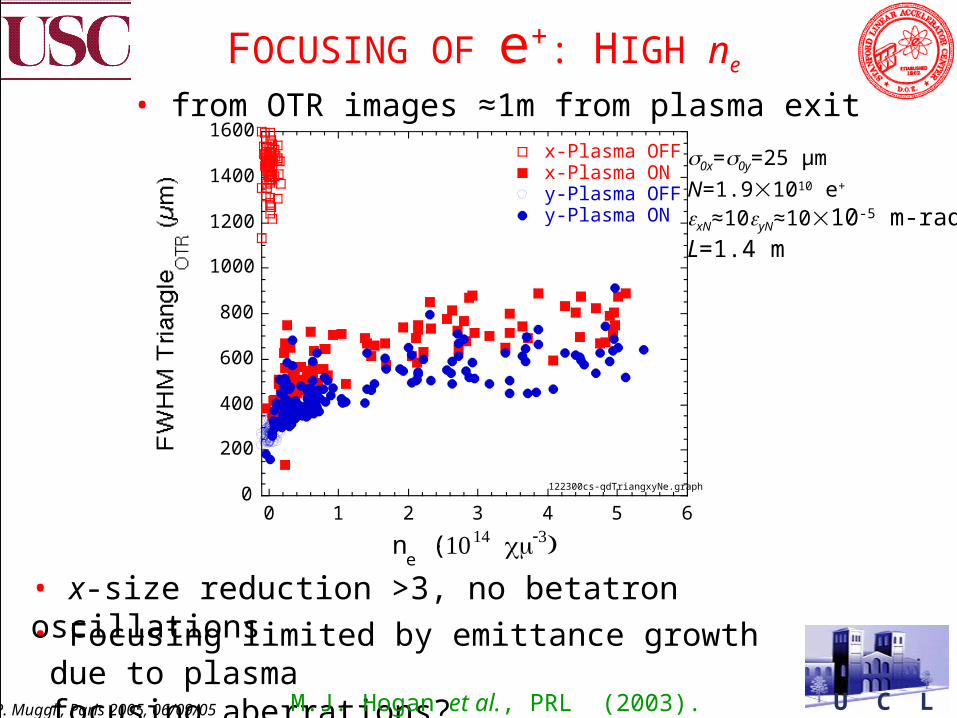
0
200
400
600
800
1000
1200
1400
1600
0 1 2 3 4 5 6
122300cs-qdTriangxyNe.graph
x-Plasma OFFx-Plasma ONy-Plasma OFFy-Plasma ON
ne (×114 cm-3)
FOCUSING OF e+: HIGH ne
• from OTR images ≈1m from plasma exit
• Focusing limited by emittance growth due to plasmafocusing aberrations?
M.J. Hogan et al., PRL (2003).
• x-size reduction >3, no betatron oscillations
0x=0y=25 µm
N=1.91010 e+
xN≈10yN≈1010-5 m-radL=1.4 m