Embed Size (px)
Citation preview
AD-A170 685 WAIER GAEAIJ CMI ? TER 0N~?W RDlL 1/3
U NCLAS S I FIED F/G 6/26 MIL
111.0 LA~W 1202T
1 .11 25 11111 1.4 1 6
'CROCOPY RESOLUTION TEST CHART
NArIONAL BUREAU Of STAN
DARDS
-I
J63A
ADSuh IORNL-6180urni
9
OAK RIDGENATIONALLABORATORY Water Quality Criteria
for Nitroglycerin
I) FINAL REPORT00
oJohn G. Smith
TAM
JULY 1986
SUPPORTED BY
U.S. ARMY MEDICAL RESEARCH ANDDEVELOPMENT COMMAND
Fort Detrick, Frederick, MD 21701-5012Interagency Agreement No. 84PP4845
Oak Ridge National LaboratoryOak Ridge, TN 37831
AUG 0 7 986 Project Officer•Major David L. Parmer
Health Effects Research DivisionA U.S. ARMY MEDICAL BIOENGINEERING
RESEARCH AND DEVELOPMENT LABORATORY
Fort Detrick, Frederick, MD 21701-5010
____i Approved for public release;SSIAM I SSW distribution unlimited
m868 ill0N W986 8 7 102
Printed in the United States of America. Available fromNational Technical Information Service
U.S Department of Commerce5285 Port Royal Road. Springfield, Virginia 22161
NTIS price codes-Printed Copy: A06 Microfiche A01
This report was prepared as an account of work sponsored by an agency of theUnited States Government Neither the United StatesGovernment nor any agencythereof nor any of their employees, makes any warranty. express or implied, orassumes any legal liability or responsibility for the accuracy, completeness, orusefulness of any information, apparatus, product, or process disclosed, orrepresents that its use would not infringe privately owned rights Reference hereinto any specific commercial product, process, or service by trade name, trademark,manufacturer, or otherwise, does not necessarily constitute or imply itsendorsement, recommendation, or favoring by the United States Government orany agency thereof The views and opinions of authors expressed herein do notnecessarily state or reflect those of the United States Government or any agencythereof
SEC..LRItv CLASSIF 'ATION OF THIS PAGE '"9n Data Entered)REPORT DOCUMENTATION PAGE READ INSTRUCTIONS
BEFORE COMPLETNG FORMI. REPORT 4UMSER 2. GOVT ACCESSION NO 1 3. ECIiIPENT*S CA-A ,G NUsMaR
4. TITLE /'ad Subttle) .'
rYPEOF %REPORT I ;SWIO0 CC€ EqE,
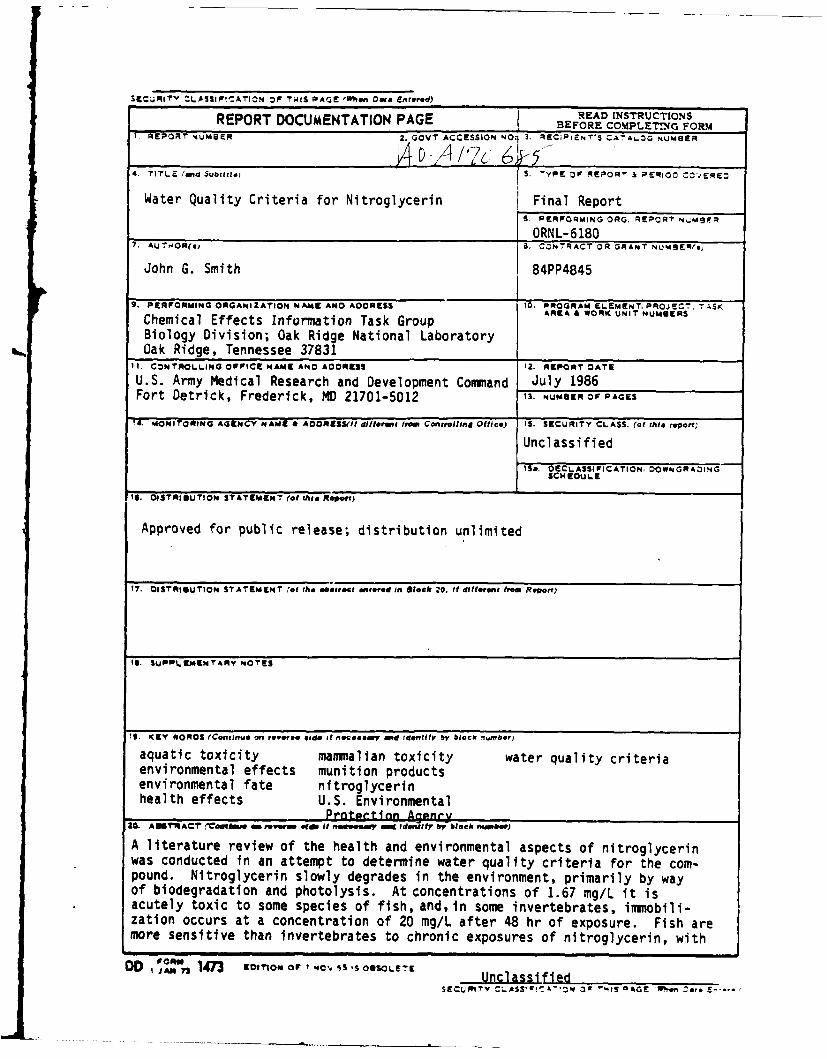
Water Quality Criteria for Nitroglycerin Final Report6. PERFORMING ORG. REPORT N.MSmFqORNL-6180
7. AUTNOR(f) a. CONTRACT OR GRANT NUmaEl(S)
John G. Smith 84PP4845
9. PERFORMING ORGANIZATION NAME NM AOORESS 10. PROGRAM ELEMENT. PROJECT, T-ASK
Chemical Effects Information Task Group AREA & WORK UNIT NUMUERS
Biology Division; Oak Ridge National LaboratoryOak Ridge, Tennessee 37831
I . CONTROL.LING OFFICE NAMC ANO AOORCSS 12. REPORT DATE
U.S. Army Medical Research and Development Command July 1986Fort Detrick, Frederick, MD 21701-5012 13. NUMOER FPAGES
14. MONITOMNO AGIENCY NAME & AOORESS(Il dillortt trai Controlilan Office) IS. SECURITY CLASS. (of thl report,
Unclassified
IS*. OECLASSIFICATION, DOWNGRAOINGSCM EDULE
16. DIST IUTION STATEMENT (I hlde Rport)
Approved for public release; distribution unlimited
17. OISTRI§UTION STATEMENT 'at rho abstract entered In Block *. Itf different from Report)
l6. SUPPI.EMENTARY NOTES
9. MOR r O S (Continue on Peerse bad if neoceeoly and idtifty by block number)
aquatic toxicity mammalian toxicity water quality criteriaenvironmental effects munition productsenvironmental fate nitroglycerinhealth effects U.S. Environmental
Prantrtinn Agpnrv16. ABIMrt'ACT ? o a reverse, side It net m mot Ideulf
r bblock numbe)
A literature review of the health and environmental aspects of nitroglycerinwas conducted fn an attempt to determine water quality criteria for the com-pound. Nitroglycerin slowly degrades in the environment, primarily by wayof biodegradation and photolysis. At concentrations of 1.67 mg/L it isacutely toxic to some species of fish, and, in some invertebrates, immobili-zation occurs at a concentration of 20 mg/L after 48 hr of exposure. Fish aremore sensitive than invertebrates to chronic exposures of nitroglycerin, with
'O 1473 EDCOma. OF' 'Oc'. i s S SOLET,-S00PT 1473O torno orS
DAGE Whmi. 5Se IUnclassified
3CCURITY CL.ASSIVICATION OF THIS PAGOCCWE Data goesad)
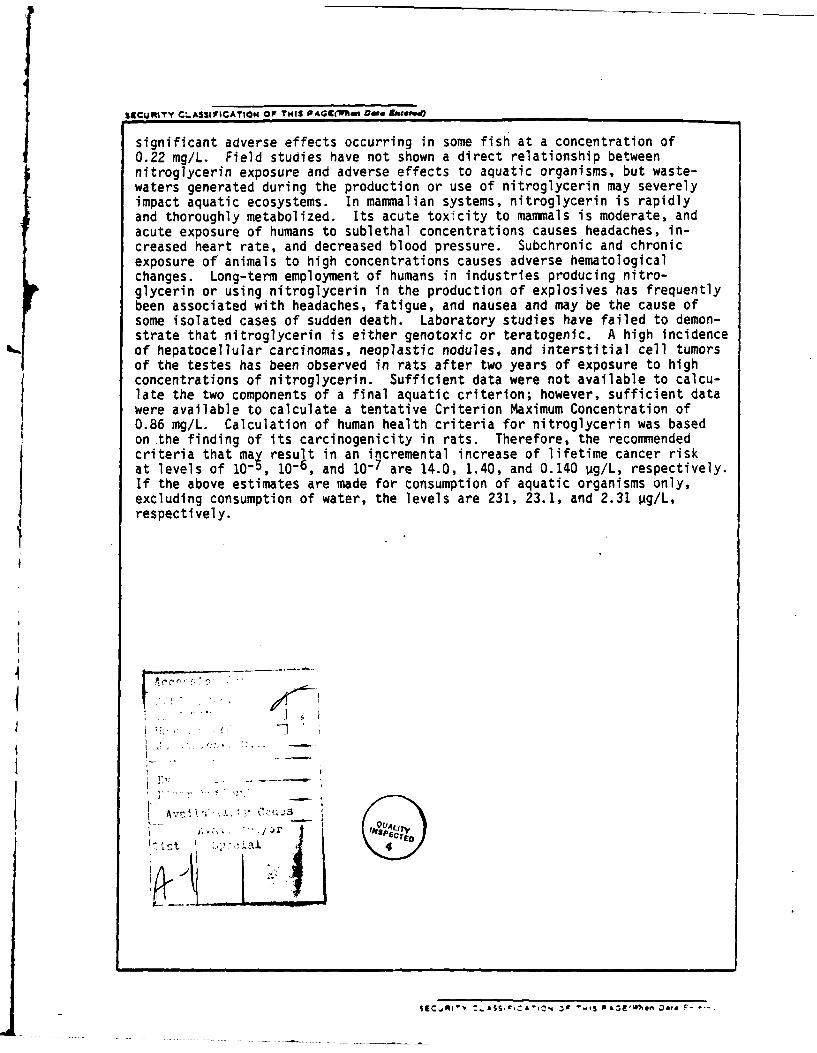
significant adverse effects occurring in some fish at a concentration of0.22 mg/L. Field studies have not shown a direct relationship betweennitroglycerin exposure and adverse effects to aquatic organisms, but waste-waters generated during the production or use of nitroglycerin may severelyimpact aquatic ecosystems. In mammalian systems, nitroglycerin is rapidlyand thoroughly metabolized. Its acute toxicity to mammals is moderate, andacute exposure of humans to sublethal concentrations causes headaches, in-creased heart rate, and decreased blood pressure. Subchronic and chronicexposure of animals to high concentrations causes adverse hematologicalchanges. Long-term employment of humans in industries producing nitro-glycerin or using nitroglycerin in the production of explosives has frequentlybeen associated with headaches, fatigue, and nausea and may be the cause ofsome isolated cases of sudden death. Laboratory studies have failed to demon-strate that nitroglycerin is either genotoxic or teratogenic. A high incidenceof hepatocellular carcinomas, neoplastic nodules, and interstitial cell tumorsof the testes has been observed in rats after two years of exposure to highconcentrations of nitroglycerin. Sufficient data were not available to calcu-late the two components of a final aquatic criterion; however, sufficient datawere available to calculate a tentative Criterion Maximum Concentration of0.86 mg/L. Calculation of human health criteria for nitroglycerin was basedon .the finding of its carcinogenicity in rats. Therefore, the recommendedcriteria that ma result in an incremental increase of lifetime cancer riskat levels of 10- , 10-6, and 10-7 are 14.0, 1.40, and 0.140 pg/L, respectively.If the above estimates are made for consumption of aquatic organisms only,excluding consumption of water, the levels are 231, 23.1, and 2.31 Vg/L,respectively.
Avc I
i . , ,o
[,.. r . .,
ADORNL-6 ISO
WATER QUALITY CRITERIA FOR NITROGLYCERIN
FINAL REPORT
John G. Smith
Chemical Effects Information Task GroupInformation Research and Analysis
Biology Division
JULY 1986
SUPPORTED BY
U.S. ARMY MEDICAL RESEARCHAND DEVELOPMENT COMMAND
Fort Decrick. Frederick. bMD 21701-5012Interagency Agreement No. 84PP4845
Project OfficerMajor David L. Parmer
Health Effects Research Division
U.S. ARMY MEDICAL BIOENGINEERING RESEARCHAND DEVELOPMENT LABORATORY
Fort Detrick, Frederick, MD 21701-5010
Approved for public release;distribution unlimited
The findings of this report are not to be construedas an official Department of the Army positionunless so designated by other auhorized documents.
OAK RIDGE NATIONAL LABORATORYOak Ridge, Tennessee 37831
operated byMARTIN MARIETTA ENERGY SYSTEMS, INC.
for theU.S. DEPARTMENT OF ENERGY
Under Contract No. DE-ACOS-840M21400
Nitroglycerin is a nitrate easter used primarily in explosives andin medical applications as a vasodilator. It is not very soluble inwater but is completely miscible in most organic solvents. Physicaldecomposition occurs from exposure to increasing temperatures, andexplosion may occur from continuous exposure to high temperatures.Under acidic and alkaline conditions, nitroglycerin goes throughstepwise denitration to yield glycerol, but under alkaline conditionsthe glycerol is further hydrolyzed. Nitroglycerin is produced by eithera batch or continuous process by adding glycerol to a cooled mixture ofnitric and sulfuric acids. The most popular methods of quantitativelyanalyzing nitroglycerin are those using gas chromatography.
Release of wastewaters from the production and/or use of nitrogly-cerin can alter habitat by degrading the quality of the receivingwaters. Once in the environment, degradation of nitroglycerin is slowand occurs primarily through biodegradation and photolysis.
Nitroglycerin is quite toxic to aquatic organisms. Limited dataindicate that some algae may be more sensitive than fish or invertebra-tes to acute exposures of nitroglycerin. Ninety-six hour LCSO valuesfor fish range from 1.67 to 3.2 mg/L, and 48-hr ECSO values for inver-tebrates, based on immobilization, range from 20 to 55 mg/L. The lowestreported concentrations causing significant adverse effects in fish andinvertebrates from chronic exposures are 0.22 and 3.1 mg/L, respec-tively. Seven- to 30-day-old fry appear to be the most sensitive stageof fish. Based on an 8-day bioaccumulation study with fish, bioconcen-tration factors of 8X to 151 have been calculated) however, because ofthe short length of this study, these values may not be an accurateindication of this chemical's potential for bioooncentration.
A direct relationship between nitroglycerin and adverse effects toaquatic organisms has not been shown by field studies but wastewatersgenerated during the production or use of nitroglycerin may severelyimpact aquatic ecosystems.
Nitroglycerin is rapidly and widely distributed and rapidly absor-bed, metabolized, and eliminated in both laboratory animals and humans.Metabolism occurs in both hepatic and extrahepatic tissues via stepwisedenitrificationi elimination is primarily in the urine and expired air.
The acute toxicity of nitroglycerin to mammals is moderate; it ismost toxic when given intravenously and least toxic when given orally.There appear to be minor or no sex and species differences in the acutetoxicity. Acute exposure of humans to sublethal concentrations ofnitroglycerin causes headache, increased heart rate, and decreased bloodpressure.
Subchronic exposure to high concentrations of nitroglycerin causesadverse hematological changes in animals. Chronic exposure of labor&-tory animals to high concentrations of nitroglycerin also causes
-- ...-- )II I mm iimii
significant adverse hematological changes, as well as adverse changes inthe liver and reduction in weight gain. Long-term employment of humansin industries producing nitroglycerin or using nitroglycerin in the pro-duction of explosives has frequently been associated with headaches,fatigue, and nausea. There is evidence that long-term exposure tonitroglycerin and/or nitroglycol in the explosives industry may be thecause of some isolated cases of sudden death.
In vivo and in vitro studies have not shown nitroglycerin to begenotoxic. Studies with laboratory animals on developmental toxicityand reproductive effects have failed to demonstrate that nitroglycerinis a teratogen but have shown that exposures to high concentrationscause male infertility and delayed development in offspring, as judgedby incomplete ossification of the hyoid bone.
A high incidence of hepatocellular carcinomas, or neoplastic nodu-les, and interstitial cell tumors of the testes have been observed inrats after two years of exposure to high concentrations of nitrogly-cerin. Also, an increased incidence in pituitary tumors has been obser-ved in mice exposed for one year to moderate amounts of nitroglycerin.
The final aquatic criterion consists of two concentrations: a Cri-terion Maximum Concentration and a Criterion Continuous Concentration.A Criterion Maximum Concentration of 0.86 mg/L may be calculated fromavailable data; however, this value is considered tentative becauseacute toxicity data did not meet all requirements of the USEPA Guidel-ines. The minimum data base required by the USEPA in calculating a Cri-terion Continuous Concentration was not available. Calculation of humanhealth criteria for nitroglycerin was based on the finding of its carci-nogenicity in rats. Therefore, the recommended criteria which mayresult in an incremental increase of lifetime cancer risk at levels of10O5, 10-6. and 10-7 are 14.0, 1.40, and 0.140 g&g/L, respectively. Ifthe above estimates are made for consumption of aquatic organisms only,excluding consumption of water, the levels are 231, 23.1, and 2.31 gg/L.respectively.
-2-
CONTENTS
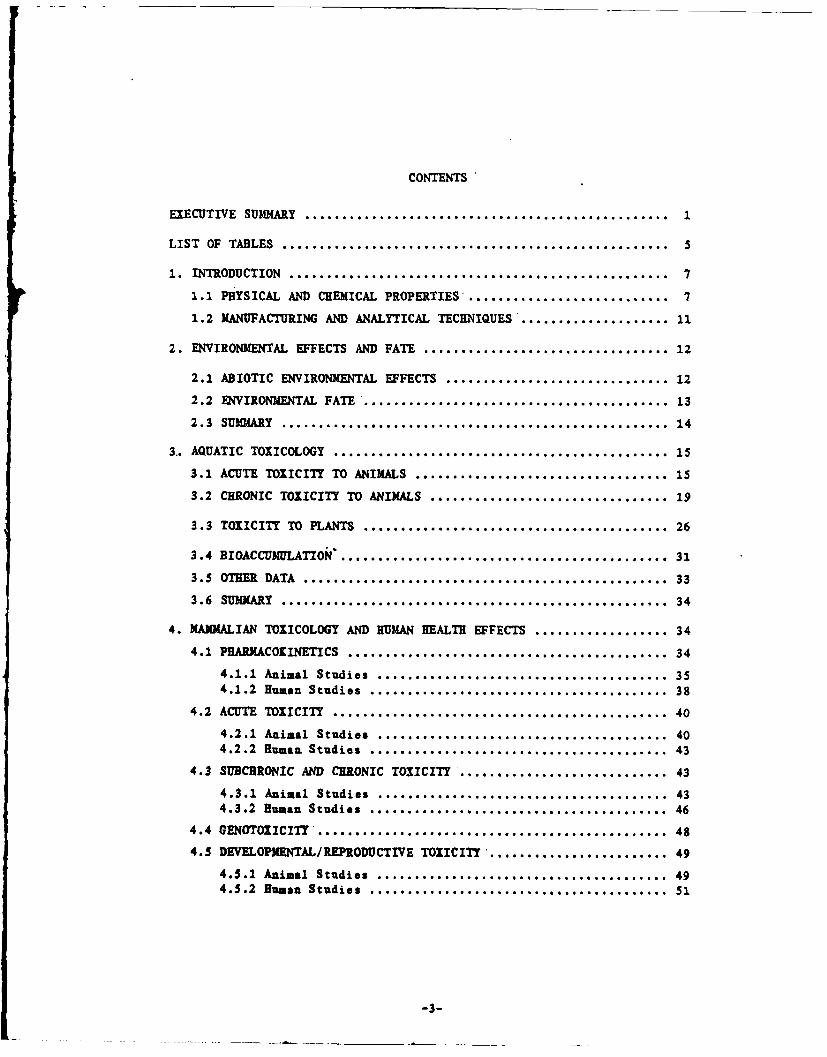
EXECUTIVE SUMMARY ................................................ 1
LIST OF TABLES .................................................... 5
1. INTRODUCTION .-.................................................. 7
1.1 PHYSICAL AND CHEMICAL PROPERTIES'........................... 7
1.2 MANUFACTURING AND ANALYTICAL TECHNIQUES.................... 11
2. ENVIRONMENTAL EFFECTS AND FATE .................................. 12
2.1 ABIOTIC ENVIRONMENTAL EFFECTS ............................... 12
2.2 ENVIRONMENTAL FATE ........................................ 13
2.3 SUMMARY .................................................... 14
3.. AQUATIC TOXICOLOGY ............................................. 15
3.1 ACUTE TOXICITY TO ANIMALS ................................... 15
3.2 CHRONIC TOXICITY TO ANIMALS ................................ .19
3.3 TOXICITY TO PLANTS ......................................... 26
3.4 BIOACCUMULATION............................................ 31
3.5 OTHER DATA ................................................. 33
3.6 SUM MARY .............. .... ................................ 34
4. MAMALIAN TOXICOLOGY AND HUMAN HEALTH EFFECTS .................. 34
4.1 PHARJACOKINETICS ........................................... 34
4.1.1 Animal Studios .. ................................... 354.1.2 Human Studies ........................................ 38
4.2 ACUTE TOXICITY ............................................. 40
4.2.1 Animal Studies ....................................... 404.2.2 Human Studies ........................................ 43
4.3 SUBCHRONIC AND CHRONIC TOXICITY ............................ 43
4.3.1 Animal Studies ....................................... 434.3.2 Human Studies ........................................ 46
4.4 GENOTOXICITY .............................................. 48
4.5 DEVELOPMENTAL/REPRODUCTIVE TOXICITY ......................... 49
4.5.1 Animal Studies......................................494.5.2 Human Studies ........................................ 4
-3-
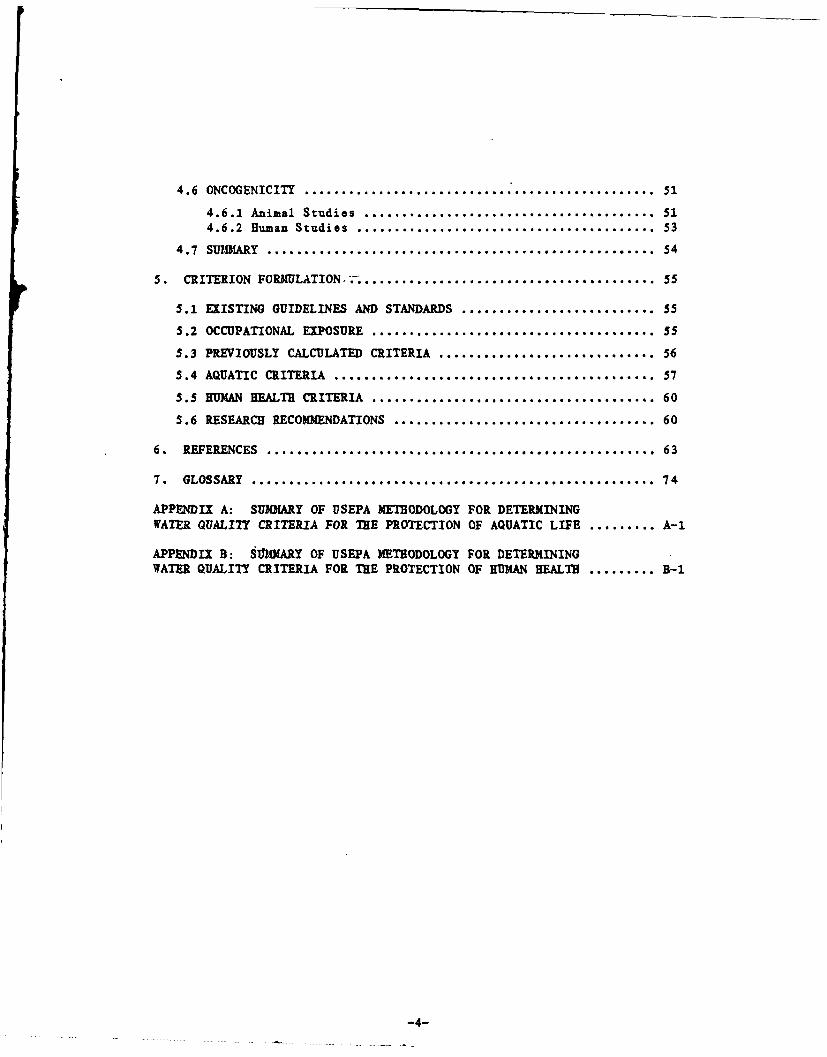
4.6 ONCOGENICITY ......................... 51
4.6.1 Animal Studies .................... 514.6.2 Human Studies..........................................53
4.7 SUM1MARY..................................................... 54
5. CRITERION FORMfULATION .......................................... 55
5.1 EXISTING GUIDELINES AND STANDARDS............................55
5.2 OCCUPATIONAL EXPOSURE........................................55
3.3 PREVIOUSLY CALCULATED CRITERIA ...............................56
5.4 AQUATIC CRITERIA ............................................57
5.5 HUM4AN HEAL.TH CRITERIA .......................................60
5.6 RESEARCH RECOMMENDATIONS.....................................60
6. REFERENCES......................................................63
7. GLOSSARY ....................................................... 74
APPENDIX A: SUMMARY OF USEPA METHODOLOGY FOR DETERMINING
WATER QUALITY CRITERIA FOR TEE PROTECTION OF AQUATIC LIFE...........A-1
APPENDIX B: S1MARY OF USEPA METHODOLOGY FOR DETERMINING
WATER QUALITY CRITERIA FOR TEE PROTECTION OF HUMAN HEALTH...........B-i
-.4-
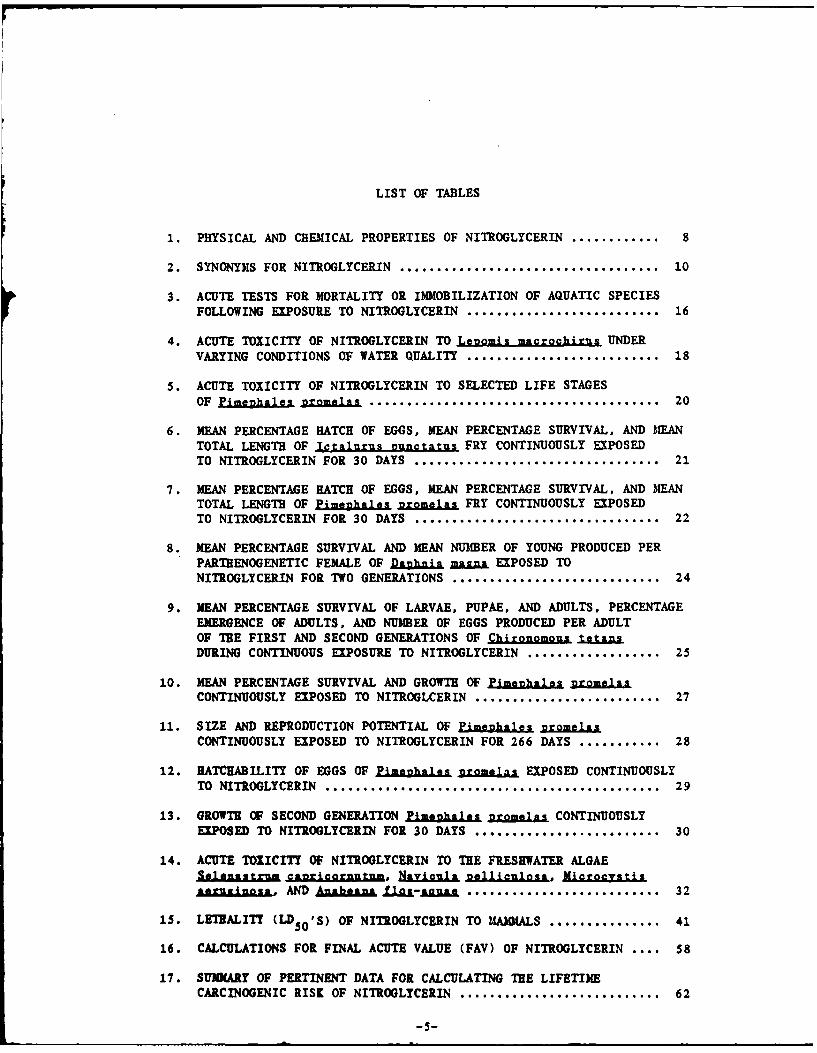
LIST OF TABLES
1. PHYSICAL AND CHEMICAL PROPERTIES OF NITROGLYCERIN ............ 8
2. SYNONYMS FOR NITROGLYCERIN ................................... 10
3. ACUTE TESTS FOR MORTALITY OR IMMOBILIZATION OF AQUATIC SPECIES
FOLLOWING EXPOSURE TO NITROGLYCERIN .......................... 16
4. ACUTE TOXICITY OF NITROGLYCERIN TO Lenomis macrochirus UNDER
VARYING CONDITIONS OF WATER QUALITY .......................... 18
5. ACUTE TOXICITY OF NITROGLYCERIN TO SELECTED LIFE STAGESOF Pim a la J gro .1..n ....................................... 20
6. MEAN PERCENTAGE HATCH OF EGGS, MEAN PERCENTAGE SURVIVAL, AND IEANTOTAL LENGTH OF Ictalurus nunctatns FRY CONTINUOUSLY EXPOSEDTO NITROGLYCERIN FOR 30 DAYS ................................. 21
7. MEAN PERCENTAGE HATCH OF EGGS, MEAN PERCENTAGE SURVIVAL, AND MEANTOTAL LENGTH OF Pimukpals n uromelas FRY CONTINUOUSLY EXPOSEDTO NITROGLYCERIN FOR 30 DAYS ................................. 22
8. MEAN PERCENTAGE SURVIVAL AND MEAN NUMBER OF YOUNG PRODUCED PER
PARTHENOGENETIC FEMALE OF Danhmia =A EXPOSED TONITROGLYCERIN FOR TWO GENERATIONS ............................ 24
9. MEAN PERCENTAGE SURVIVAL OF LARVAE, PUPAE, AND ADULTS, PERCENTAGEEMERGENCE OF ADULTS, AND NUMBER OF EGGS PRODUCED PER ADULTOF T IE FIRST AND SECOND GENERATIONS OF Chironomous uaJA&DURING CONTINUOUS EXPOSURE TO NITROGLYCERIN .................. 25
10. MEAN PERCENTAGE SURVIVAL AND GROWTH OF Pijales pz.mza.CONTINUOUSLY EXPOSED TO NITROGLCERIN ......................... 27
11. SIZE AND REPRODUCTION POTENTIAL OF ±al gromelas
CONTINUOUSLY EXPOSED TO NITROGLYCERIN FOR 266 DAYS ........... 28
12. HATCHABILITY OF EGGS OF Ziaa phaias g.oxas EXPOSED CONTINUOUSLYTO NITROGLYCERIN ............................................. 29
13. GROWTH OF SECOND GENERATION Pimenhales n.omelas CONTINUOUSLYEXPOSED TO NITROGLYCERIN FOR 30 DAYS ........................ 30
14. ACUTE TOXICITY OF NITROGLYCERIN TO THE FRESHWATER ALGAEZ astmui I ncorn, Havionla nRllijaA., MicroZatis
a~ans±a~~s*. AND AakIAh LLg I.nus-.Agu. ......................... 32
15. LETHALITY (LD 5'S) OF NITROGLYCERIN TO MiAMMALS .............. 41
16. CALCULATIONS FOR FINAL ACUTE VALUE (FAV) OF NITROGLYCERIN .... 58
17. SUMMARY OF PERTINENT DATA FOR CALCULATING THE LIFETIMECARCINOGENIC RISK OF NITROGLYCERIN ........................... 62
---
ACKNOWLEDGMENTS
The author would like to thank Tim Ensminger, head of the Informa-tion Research and Analysis Section (IR#A) of the Biology Division, OakRidge National Laboratory (ORNL) for his support during the preparationof this document. Thanks are due to Major David L. Parmer, Jr., Con-tracting Officer, U.S. Army Medical Bioenginering Research and Develop-ment Laboratory, Fort Detrick, Frederick, Maryland, for his advice andtechnical review. Further review by Glen Suter of Environmental Scien-ces Division (ORNL), Dr. Lawton Smith of Biology Divison (ORNL), Dr.James Holleman IRmA (ORNL), Elizabeth Etnier IR4A (ORNL), and MichaelRyon IRVA (ORNL) is also appreciated. The author is greatly indebted toLois Thurston, Carolyn Seaborn, Joe Rich, and Jan Pruett for theirassistance in document preparation and collection and organization ofreference materials.
-6-
Nitroglycerin is a nitrate ester that is used as an explosive and,more frequently, with other materials (e.g., nitroglycol) to make explo-sives such as dynamite, smokeless gunpowders, and blasting gels (ACGIB1980; Hawley 1981; Stokinger 1982). Nitroglycerin is also used inrocket propellants (ACGIH 1980), as a vasodilator for temporary relaxa-tion of the gastrointestinal and urinary tracts (International LabourOffice 1983). and in the treatment of angina pectoris (Ellis et al.1984). The objectives of this report are to review the available dataon the aquatic and human health effects of nitroglycerin and, using thelatest USEPA guidelines, to generate water quality criteria values.Appendix A is a summary of the USEPA Guidelines for generating waterquality criteria for the protection of aquatic life and its uses(Stephan et al. 1985). Appendix B is a summary of the USEPA Guidelinesfor generating water quality criteria for the protection of human health(USEPA 1980).
1.1 PHYSICAL AND CHEMICAL PROPERTIES
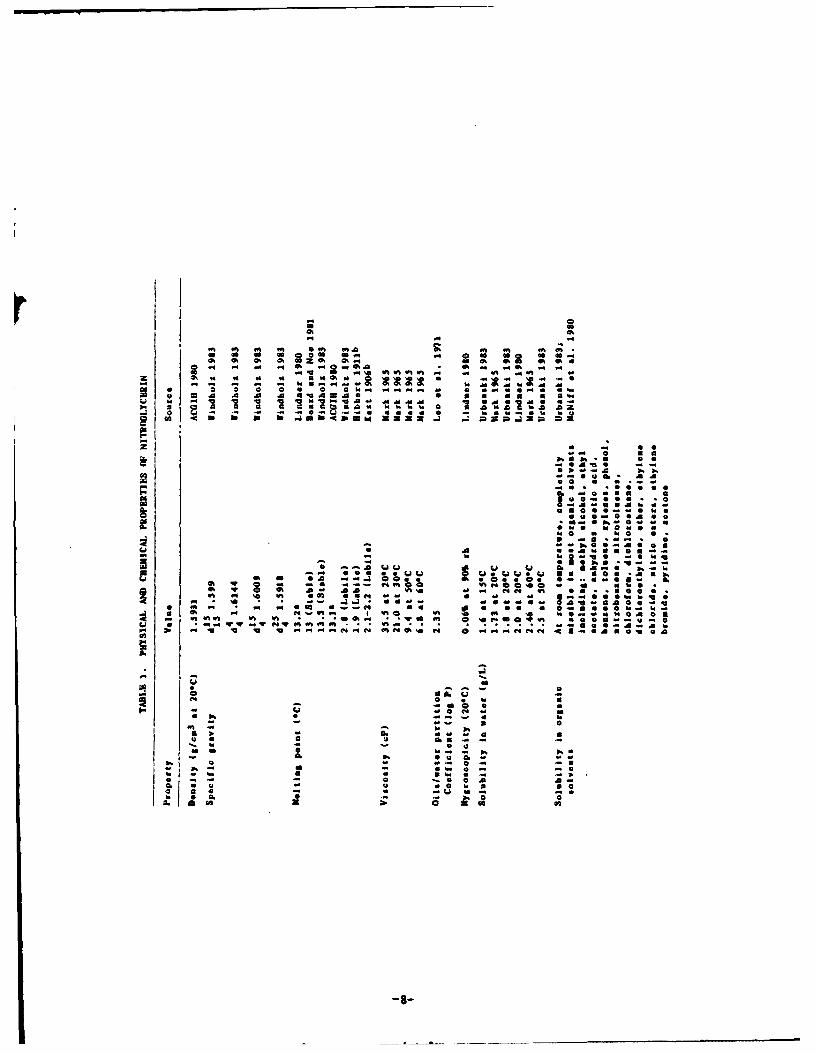
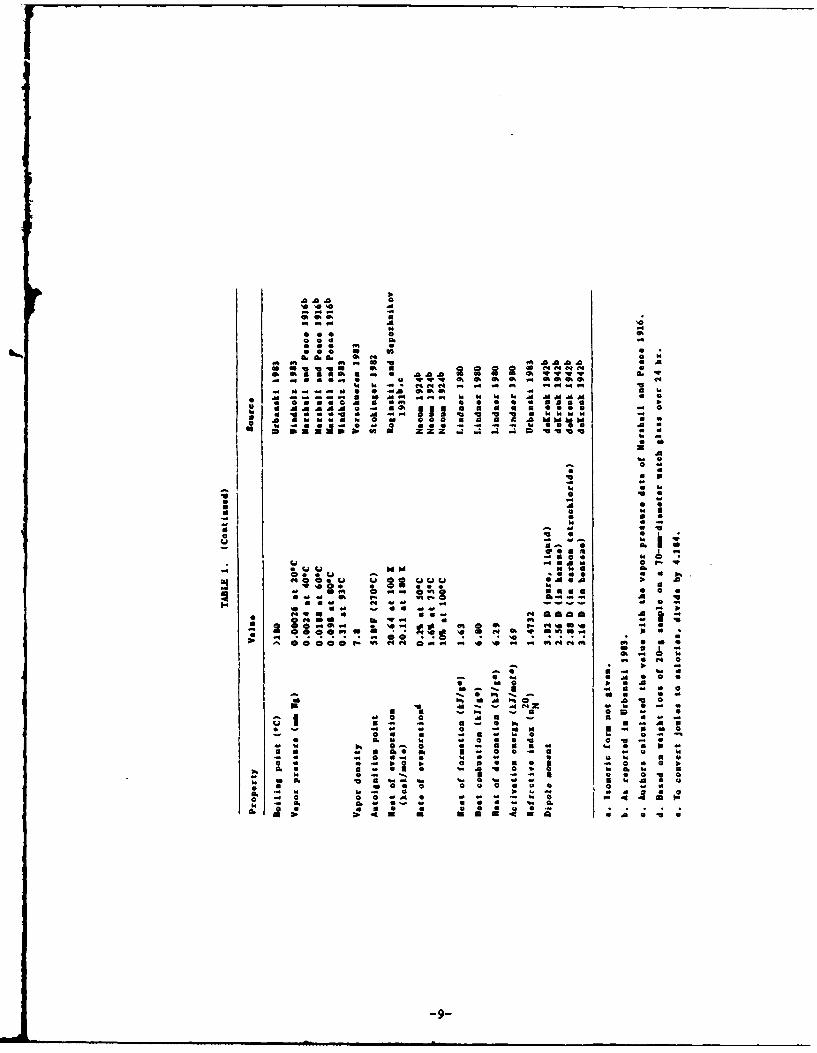
A summary of some of the physical and chemical properties of nitro-glycerin is presented in Table 1, and a list of synonyms is presented inTable 2. Nitroglycerin has a molecular weight of 227.09 and its struc-tural formula is CH2NO3CBNO3CB2NO3 (ACGIH 1980). In its pure formnitroglycerin is a colorless, transparent, oily liquid, and in its com-mercial form it is yellowish or pale brown (Urbanski 1983). The com-pound exists in two isomeric forms which differ in freezing point andcrystalline structure (Urbanski 1983). The labile form has a lowerfreezing point, between 1.9 to 2.80C (Kast 1906; Hackel 1933, both asreported in Urbanski 1983; Windholz 1983). Estimates of the freezingpoint for the stable form range from 12.4 to 13.5 0 C (Nauckhoff 1905, asreported in Urbanski 1983, DiCarlo 1975).
Nitroglycerin is not very soluble in water; at 200C, estimatesrange from 1.73 to 2.0 g/L of water (Table 1) (Mark 1965; Lindner 1980).However, nitroglycerin is completely miscible with most organic solventsat room temperature (Table 1) (Urbanski 1983). The solubility of nitro-glycerin in ethyl alcohol depends to a large extent on the temperatureand the water content of the alcohol. For example, at 200C about 43,31.6, and 0.7 g of nitroglycerin will dissolve in 100 cm3 of 100, 96,and 25 percent ethanol, respectively. At about 500C nitroglycerin mixeswith absolute or 96 percent ethanol in all proportions (Urbanski 1983).The solubility of nitroglycerin in other monohydroxy alcohols such aspropyl, isopropyl, and amyl is similar to that of ethanol while beingeven less soluble in polyhydroxy alcohols (Urbanski 1983). Nitrogly-cerin is readily soluble in 65 percent acetic acid and concentrated sul-furic acid, but is only slightly soluble in carbon disulfide and inaliphatic hydrocarbons (Urbanski 1983).
At temperatures of 500C, nitroglycerin begins to decompose (DiCarlo1975). When heated to 750C, the compound apparently decomposes withinthree to four days and is characterized by the generation of acid
-7-
a. 4m10a a
Sm 0 .0 .fb .a0m
6 a "
.0 C4 m 0b a 0 0 h N 0 a a afa,~=an aC4aa a~ a a a a. a 2
%' -. Un "1 44 a A 0M a A~rb f. b V% -t 0 a 0 a ai .U W
.,~ U U W ~ .i U Z. .. ~~w ~
oft C4 0%,G tsoaa.-
CIAa - ,aa -
'A.. A
tA '
*4 4
to8 0.9 1
' ow m r'a. C4 C4 O
mm~ ~~~~ *. 44ma a* ~ a o e Q .4 4e4..4
* ** ** U- U AAA - -a.
- If. .- t... 0. aD .
0 -0.. A a e a 0 * a m m
o6 No .. ~S 0 00 a ac 0 M MS. a6 @ 0 0 -WO S 60
TABLE 2. SYNONYMS FOR NITROGLYCERINa
Synonym
Angibid; Anginine; Angiolingual; Angorin; Blasting Gelatin (DOT); Blas-ting Oil; Cardamist; Gilucor nitro; Glonoin; Glycerin trinitrate; Gly-cerintrinitrate; Glycerol. nitric acid triesters Glycerol trinitrate;Glycerol (trinitrate de); Glyceroltrintraat; Glyceryl nitrate; Glyceryltrinitratei GTN; Ilavikordal; Lenitrals Myoglycerin; NO; NK 843; NTG;Niglini Niglycon; Nitora; Nitric Acid; Nitrin; Nitrines Nitrino-TDC;Nitro-Dur; Nitroglicerina; Nitrogliceryna; Nitroglycerine; Nitrogly-carol; Nitroglyn; Nitrol: Nitrol (pharmaceutical); Nitrolan; Nitro-lentiNitrolettenj Nitrolinhual. Nitrolove; Nitzromel; Nitrong; Nitrorectal;Nitroretard; Nitro-Span. Nitroetabilin; Nitrostat; Nitrozell retard;Nysconitrine; Porglottal; Propanetriol trinitrate; 1.2,3-Propanetriol,trinitrate; l,2.3,-Propanetriyl nitrate; S.N.G.; Soup; Temponitrin;Triester of glycerol; Trinalgon; Trinitrin; Trinitroglycerin; Trinitro-glycerol; Trinitrol; Vasoglyn
a. MEDLARS (CELINE) 1984; MEDLARS (RTECS) 1984;, and MEDLARS (ThE)1984.
-10-
products (Urbanski 1983). When heated to 1006C, measurable volatiliza-tion occurs; at temperatures of 135 to 1450C, the compound becomes areddish color and gives off yellow vapors; at 1650C, considerable deni-tration occurs and nitric acid and glycerol nitrates are given off; near
1850C, it becomes highly viscous; and near 2180C, detonation occurs
(DiCarlo 1975; Snelling and Storm 1913, as reported in Urbanski 1983).
Andreev and Bespalov (1963) studied the effects of varied concen-
trations of water on the thermal decomposition of nitroglycerin. Attemperatures ranging from 100 to 1200C, the rate of decomposition ofnitroglycerin decreased as the concentration of water increased. Theauthors concluded that decomposition of nitroglycerin at elevated tem-peratures and in the presence of water is initially by hydrolysis, whichproceeds slowly in neutral solutions, but is accelerated by acidicdecomposition products and their subsequent hydrolysis.
In the presence of neutral solutions, nitroglycerin is relativelystable (DiCarlo 1975; McNiff et al. 1980). Nitroglycerin will degradeunder both acidic and alkaline conditions, but the rate of degradation
is much more rapid under the latter (Crew and DiCarlo 1968; Fraser 1968,MoNiff et al. 1980). Under acidic conditions, nitroglycerin goesthrough stepwise denitration to yield glycerol (Farmer 1920; Crew and
DiCarlo 1968; DiCarlo 1975). Under alkaline conditions, glycerol is notan end product but is further hydrolyzed to mesoxalic acid, oxalic acid,carbon dioxide, and aldehyde resins, and the nitrate is reduced to
ammonia (Berl and Delpy 1910; Silberrad and Farmer 1906. Vignon 1903,all as reported in DiCarlo 1975). In the presence of a readily oxidiza-ble compound such as phenylmercaptan, glycerol has been found to be a
hydrolysis product of nitroglycerin (Mlason and Carlson 1906, as repor-
ted in DiCarlo 1975).
1.2 MANUFACTURING AND ANALYTICAL TECHNIQUES
The traditional means of producing nitroglycerin has been by thebatch process, but because of the hazards involved in handling largequantities, continuous processes are now more widely used (Lindner 1980;Urbanski 1983). In both processes, very pure glycerol (qv) and mixedacid (90% nitric acid and 25 to 30% oleum) are used. Theoretically, theyield of nitroglycerin from glycerol is 2.467:1, while the actual yieldusing concentrated acid is about 2.36:1; the yield is slightly higher inthe continuous processes than in the batch process. The final purity ofnitroglycerin depends on its final use; smokeless powders and highexplosives require a compound of higher purity than do mining explosives(Urbenski 1983). Impurities in nitroglycerin include the spent acids
and wash fluids (e.g., sodium carbonate) (Urbanski 1983).
Several methods have been developed and utilized to quantitativelymeasure the concentration of nitroglycerin and its degradation productsin biological media and the environment. The most popular method formeasuring nitroglycerin has been gas chromatography (Wu et al. 1982),
and, according McNiff et al. (1980), this method is particularly suita-ble for determination of the compound in biological fluids. A number of
variations exist in this assay which differ primarily in the type of
-11-
detector used (e.g., DiCarlo 1975). Use of an electron capture detectoris reportedly 1000 times more sensitive than a flame ionization detector(Camera and Pravisani 1964, as reported in DiCarlo 1975); their sensi-tivities have been reported to be in the nanogram and microgram range,respectively (Rosseel and Bogaert 1972).
A number of spectrophotometric methods have been developed foranalysis of single dosage units (McNiff et al. 1980; Yacobi et al.1983). Two commonly used speotrophotometric methods are the Bell (Bell1964, as reported in Yacobi at al. 1983) and kinetic methods (Fung etal. 1973; Yap et al. 1975, both as reported in Yacobi et al. 1983); bothmethods are based on alkaline hydrolysis of the nitroglycerin (Yacobi atal. 1983). A spectrophotometric method adapted by the United StatesPharmacopeia (1980) involves the separation of nitroglycerin from itsdegradation products followed by acid hydrolysis to nitrate ion.
Quantitation of nitroglycerin and its degradation products is pos-sible with thin-layer chromatography (DiCarlo 1975. Wu et al. 1982).This method involves the use of 1 4C-nitroglycerin.
Several high-performance liquid chromatographic (RPLC) procedureshave been described (DiCarlo 19'75; McNiff et al. 1980). The HPLC methodalong with ultraviolet detection of the nitrate ester groups has beenused for analysis of wastewaters from ammunition plants (Walsh 1976, asreported in Sullivan et al. 1979; Weitzel et al. 1976).
Polarographic methods have been used by Flann (1969, as reported inMoNiff et al. 1980) and Woodson and Alber (1969, as reported in McNiffat al. 1980) for analyzing nitroglycerin. This method is based on thereduction of nitrate at the dropping mercury electrode.
In their review of nitroglycerin, Sullivan at al. (1979) listed sixmethods that they considered not suitable for use in measuring the con-centration of this chemical in the environment due to their lack of sen-sitivity: "(1) the Du Pont nitrometer method which measures nitric oxidegas liberated from the ester by mercury; (2) hydrolysis of the esterfollowed by reduction of N03- and analysis of N02-; (3) reduction bytitanous chloride and back titration of the excess reagent with ferricalum; (4) reduction with ferrous chloride and titration of the ferric
iron with titanous chloride; (5) infrared detection of nitrate groups;and (6) the ferrous sulfate-sulfuric acid colorimetric method."
2. EIRONEITAL =E=TZ AND EAE
2.1 ABIOTIC ENVIRONtMTAL EFFECTS
Studies ooncorning the direct abiotic effects of nitroglycerin werenot found; however, studies were available concerning the effects ofwastewaters generated from nitroglycerin production and use on thereceiving bodies of water. These studies showed that habitat alterationmay occur through degradation of water quality. Weitzel et al. (1976)
-12-
observed high concentrations of total organic carbon, nitrogen, andchromium in the river receiving wastewater from Radford Army AmmunitionPlant (Radford AAP). However, the aithors felt that only the elevatedlevels of nitrogen could be attributed to the waste discharge fromnitroglycerin production. In a pond receiving wastes from nitroglycerinproduction at Badger AAP, Stilwell et al. (1976) observed a high concen-tration of dissolved solids and low pB values, and, in a pond receivingwastes from the manufacture of rocket paste, they found low oxygen con-centrations and anaerobic sediments that had a high chemical oxygen
demand and a high Kjeldahl nitrogen concentration.
2.2 ENVIRONMENTAL FATE
Environmental exposure to nitroglycerin occurs following the lossof the chemical into the wastewaters during its production or use. In aU.S. Army Environmental Hygiene Report (1971, as reported in Carnahanand Smith 1977), it was estimated that 21.3 kg/day of nitroglycerin werereleased into the wastewaters of Radford AAP when the daily productionrate of nitroglycerin was 7711.1 kS and the volume of wastewater was136.3 kL/day. During their 1975 water quality survey of the New River,receiving wastes from Radford AAP nitroglycerin production facility,Weitzel et al. (1976) estimated that a total of about 29.5 g/min ofnitroglycerin was discharged in the wastewaters from four dischargesites. They found that the concentration of nitroglycerin in the watergenerally ranged from 0.01 to 0.02 mg/L. Nitroglycerin was found inonly three of 32 sediment cores the average concentration was slightlygreater than 1 mg/kg dry wt.
In a pond receiving nitroglycerin production wastes at Badger AAP,Stilwell et al. (1976) found nitroglycerin in concentrations rangingfrom <0.6 to 3.4 mg/L in the water, and in the sediment they found theconcentration to be 37.5 mg/kg dry wt. In a pond receiving rocket pastewastes at this same plant, Stilwell et al. found nitroglycerin in con-
centrations ranging from <0.6 to 3.9 mg/L in the water, and in the sedi-ment they found the concentration to be <1.73 mg/kg dry wt.
Once nitroglycerin is in the environment, both abiotic and biotic
factors influence its final fate. Physical and chemical degradation ofnitroglycerin appears to be slow. The photolytic half-life of nitrogly-cerin has been estimated to be five days in pure water, thus indicating
relatively slow photodegradation (Spanggord et al. 1980a). Spanggord etal. (1980b) estimated that the volatilization half-life of nitroglycerinfrom water would be about 3000 days. SpanggoLd et al. (1980b) estimateda sorption coefficient of between 20 and 32 (the lower value was repor-ted in their text and the higher value in a table) and indicated thatadsorption of nitroglycerin on sediments may not be a significantenvironmental fate. The hydrolysis half-life of nitroglycerin at 800Chas been estimated to be 134 days (Svetlov et al. 1976, as reported inSpangsord et al. 1980b); based on this estimate, Spanggord et al.(1980b) concluded that the hydrolysis half-life of nitroglycerin, attemperatures normally observed in the environment. would be in the orderof years. This was substantiated by Spanggord et al. (1980b) after theyused some alkaline hydrolysis data from Capellos et al. (1978) and
-13-
estimated that at 250C the hydrolysis half-life would be greater than
one year at a pH of 3 to 8, less than one year at a pH above 8, and 37
days at a pH of 9.
Nitroglycerin has been reported to be resistant to biodegradation
(American Defense Preparedness Association 1975; Smith and Dickinson
1972, both as reported in Wendt et al. 1978). At concentrations of 600
to 900 mg/L the compound has been found to exert toxic effects on mixed
microbial populations (American Defense Preparedness Association 1975;
U.S. Army Natick Research and Development Command 1973; U.S. Army Natick
Research and Development Command 1974, all as reported in Wendt et al.
1978). In contrast, Wendt et al. (1978) observed a 53.6 percent
decrease in nitroglycerin after five days in batch shake-flasks con-
taining 67 to 68 mg/L of nitroglycerin plus glucose, mineral salts, and
activated sludge. In the absence of glucose, the authors observed only
a 3.1 percent decrease in nitroglycerin over the same time period. From
this and some unreported data, they concluded that nitroglycerin does
not serve as a suitable sole source of carbon or nitrogen for microbial
populations. Using a continuous-culture apparatus inoculated with
activated sludge, Wendt et al. (1978) detected no nitroglycerin (initial
concentration of 30 mg/L) after a residence time of 8 to 15 hr. Exam-
ination of the growth media used in their experiments revealed the
presence of 1,3- and 1,2-dinitroglycerins and mononitroglycerins. Based
on their results, they concluded that under suitable conditions, nitro-
glycerin may be readily biodegradable and that the pathways of microbial
degradation are similar to those observed in mammalian systems (see
Figure 1 in Section 4.1).
Spanggord et al. (1980a) studied the biotransformation of nitrogly-
cerin in water and sediment obtained from the New River. They found
that 10 ppm of nitroglycerin was biotransformed within 13 days in either
the water alone, with sediment added, or with 50 ppm yeast extract,
under both aerobic and microacrophilic conditions. Nitroglycerin (10
ppm) was also biotransformed by nitroglycerin-acclimated microogranisms
that had been obtained from the aerobic bottle and placed in shaker
flasks containing a basal-salts medium. In contrast to Wendt et al.
(1978), the authors concluded that nitroglycerin could be used by these
organisms as the sole source of carbon. When the concentration ofnitroglycerin in the basal-salts medium was increased to 120 ppm, theauthors found that the culture could grow. Spanggord et al. (1980a)analyzed the broth from the biotransformation experiments and foundnitrite to be the major productl they were unable to detect any dinitro-or mononitroglycols.
2.3 SUNMARY
Nitroglycerin is released into the environment from wastewatersgenerated during its production and use. Habitat alteration in aquaticsystems by nitroglycerin may occur through degradation of water quality.Laboratory data indicate that degradation of nitroglycerin in theenvironment may be slow, but, under favorable treatment conditions,degradation may be rapid. Environmental degradation of nitroglycerinoccurs primarily by biodegradation and photolysis.
-14-
3.1 ACUTE TOXICITY TO ANIMALS
Bentley et al. (1978) conducted a series of acute toxicity studiesof nitroglycerin with freshwater fish and invertebrates. The acute tox-icity was determined under static bioassay conditions with four speciesof fish (Le~omis macrochirus, Salmo SAjSAAX j, TIt luxus 2UAg.tL, and!±mana2n zeaAltajL.) and four species of invertebrates (Daphnia AAL.,famaL.js jiA =, Asellus militaris, and C .tentans); theacute toxicity was also determined under flow-throush assay conditionswith three species of fish (L. marochtirus, .1.. l , and E.21ggI.uL) and two species of invertebrates (Q.. marsA and Q. .Anu.Ls).The authors followed the procedures of USEPA (1975, as reported inBentley et al. 1978). Groups of 30 fish were exposed to each testedconcentration (nominal) in both static and flow-through tests, andgroups of 15 and 20 invertebrates were used in the static and flow-through tests, respectively. With the exception of Z. armea, allorganisms were somewhat more sensitive to the compound under flow-through conditions than under static conditions (Table 3). In the sta-tic assays, the 96-hr LCS0 values for fish ranged from 2.5 to 3.2 mg/L,and the 48-hr ECSO values (based on immobilization) for invertebratesranged from 46 to 55 mg/L. In the flow-through issays, the 96-hr LC50values for fish ranged from 1.67 to 3,0 mg/L, and the 48-hr ECSO valuesfor invertebrates ranged from 20 to 32 mg/L. The most sensitive fishand invertebrate in the static assays were Z. ni~jmas (96-hr LCS0 of2.5 mg/L) and D.. jm&aa (48-hr EC50 of 46 mg/L), respectively; in theflow-through assays, the most sensitive fish was L. macrochirus (96-hrLCS0 of 1.67 mg/L) and the most sensitive invertebrate was .. ItIAAS.(48-hr EC50 of 20 mg/L).
To determine the effects of water quality on the acute toxicity ofnitroglycerin to fish, Bentley et al. (1978) exposed groups of 30 L.soqa&kj. to the compound under various conditions of temperature,hardness, and pg. Using a static assay, fish were exposed to nitrogly-cerin under the following conditions: (1) temperatures of 15, 20, or259C at a pB of 7.1 and hardness of 35 mg/L as CaC03) (2) hardnessvalues of 35, 100, or 250 mg/L as CaC03 at a temperature of 200C and pBof 7.1 (3) pB values of 6.0, 7.0, or 8.0 at a temperature of 20°C andhardness of 35 mg/L as CaCO3. Variations in hardness and pB had noinfluence on the toxicity, and temperature had ony a slight influence,with the compound being less toxic at the lowest temperature ((96-hr
LC50 values of 3.55, 1.92, and 1.99 mg/L at 15, 20, and 25*C, respec-tively (Table 4)]. Under all conditions, the 96-hr LCSO values rangedfrom 1.38 to 3.55 mg/L.
To further characterize the toxicity of nitroglycerin to fish,Bentley et al. (1978) conducted an acute toxicity study with . n.rua2under static bioassay conditions during various stages of development,including eggs, 1-hr-old newly hatched fry, 7-day-old fry, 30-day-oldfry, and 60-day-old fry. LC50 values were determined for each stage at24, 48, and 96 hx) a 144-hr LC5O was also determined for eggs.
-15-
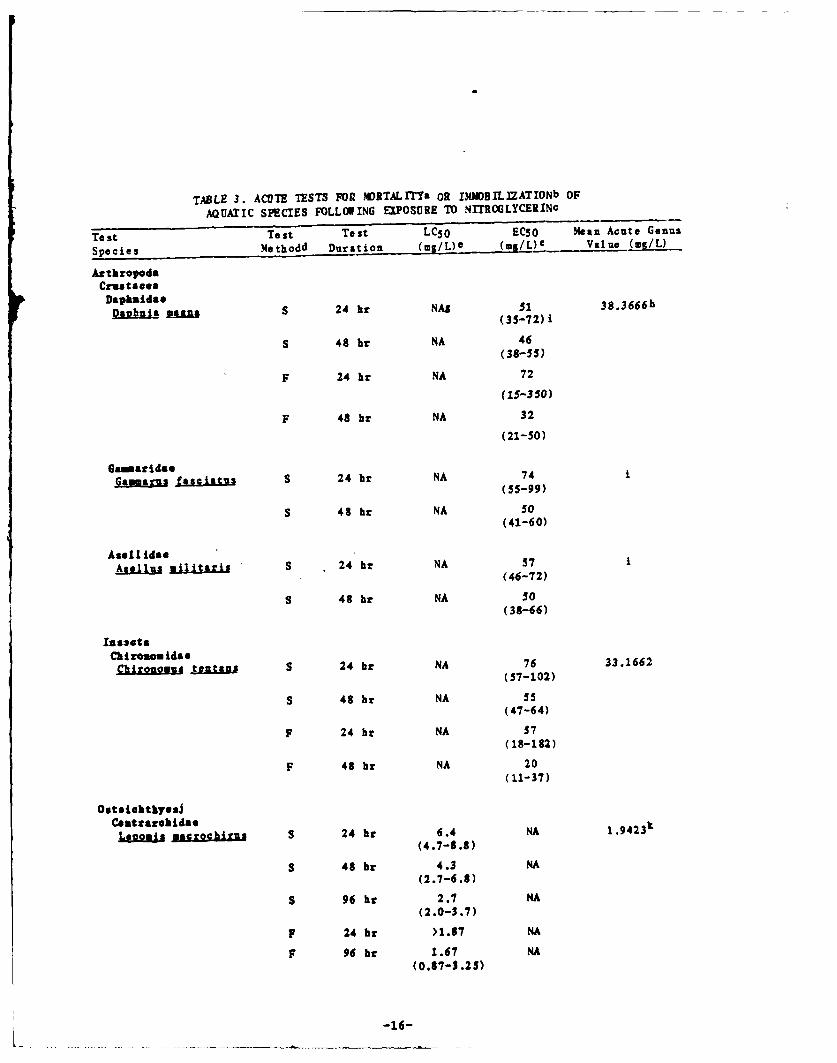
TABLE 3. ACUTE TESTS FO MORTALITYa OR IMMOBILIZATIONb OF
AQUATIC SPECIES FOLLOWING EXPOSURE TO NITROGLYCERINC
Test Test Test LC5O0 ECSO Mean Acute Genus
Species Methodd Duration (mg/L)O (mg/L)e Value (ms/L)
ArthropodsCrustaoes
DaphaidseDuybui gpgIa S 24 hr NAS 51 38.3666h
(35-72) i
S 48 hz NA 46(38-55)
F 24 hr NA 72
(15-350)
F 48 br NA 32
(21-50)
GaarldseGamaal fascitis S 24 hz NA 74
- (55-99)
S 48 hr NA s0(41-60)
AsellidaeAWIIU wilitaris S 24 hr NA 57
(46-72)
S 48 hr NA so(38-66)
InsertsChironouidseC.lronqM ten.sz S 24 hr NA 76 33.1662
(57-102)
S 48 hr NA 55(47-64)
F 24 hr NA 57(18-182)
F 48 hr NA 20(11-37)
OsteighthyeuiCottasehidsLcomis ahidsochign S 24 b 6.4 NA 1.9423 k
(4.7-8.8)
S 48 hr 4.3 NA(2.7-6.8)
S 96 hr 2.7 NA(2.0-3.7)
F 24 br )1.87 NA
F 96 hr 1.67 NA(0.87-3.25)
-16-
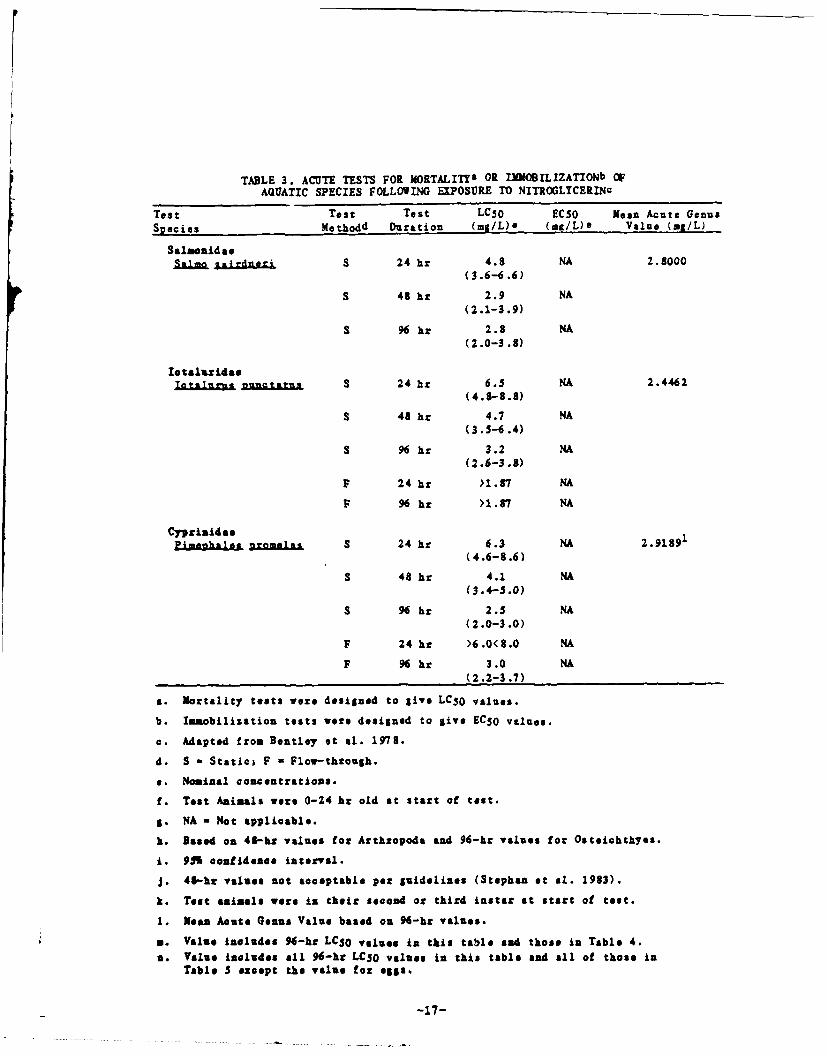
TABLE 3. ACUTE TESTS FOR MORTALITY5 OR IXMOSILIZATIONb OF
AQUATIC SPECIES FOLLOWING EXPOSURE TO NITROGLYCERINc
Test Test Test LC50 EC50 Mean Acute GenusSpecies Methodd Duration (mg/L)o (mn/L)e Value (ml/L)
SalmosidassAiSAAi S 24 hr 4.8 NA 2.8000
(3.6-6.6)
S 48 hr 2.9 NA(2.1-3.9)
S 96 hz 2.8 NA(2.0-3.8)
Io taluridno1at&lS 24 hr 6.5 HA 2.4462
(4.8-8.8)
S 48 hr 4.7 NA(3.5-6.4)
S 96 hr 3.2 HA(2.6-3.3)
F 24 hz >1.67 NA
F 96 hr >1.87 NA
CyprizidsePEmakatfis S 24 hr 6.3 NA 2.91891
(4.6-8.6)
S 48 hr 4.1 NA(3.4-5.0)
S 96 h 2.5 NA(2.0-3.0)
F 24 hr >6.0<8.0 NA
F 96 hz 3.0 NA(2.2-3.7)
a. Mortality tests were designed to give LCS0 values.
b. Immobilization tests vere designed to give ECSO values.
a. Adapted from Bentley et al. 1978.
d. S - Static; F - Flow-through.
e. Nominal concentrations.
f. Test Animals voe 0-24 hr old at start of test.
S. NA Not applicable.
h. Based on 48-hr values for Arthropoda and 96-hz values for Osteichthyes.
i. 911 confidence interval.
J. 43--hr values not acceptable per guidelines (Stephan et .l. 1983).
k. Test animals were in their second or third instar at start of test.
1. Mea Acute Genus Value based on 96-hz values.
a. Value includes %-hr LC$O values in this table and those in Table 4.
a. Value includes all 96-hr LC5o values in this table and all of those inTable S except the value for eggs.
-17-
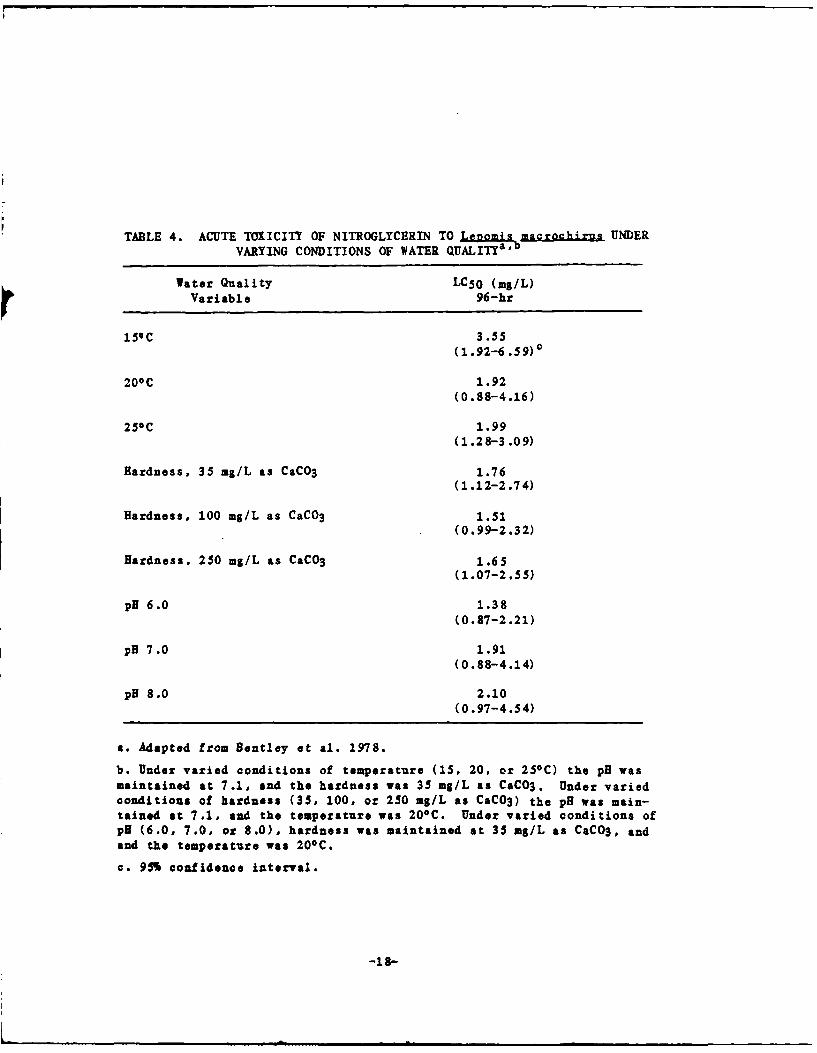
TABLE 4. ACUTE TOXICITY OF NITROGLYCERIN TO LeoJfmismacrachir . UNDERVARYING CONDITIONS OF WATER QUALITYa , °
Water Quality LC50 (mg/L)Variable 96-hr
159C 3.55(1.92-6.59)0
20'C 1.92(0.88-4.16)
250C 1.99(1.28-3.09)
Hardness, 35 mg/L as CaCO3 1.76(1.12-2.74)
Hardness, 100 mg/L as CaCO 3 1.51(0.99-2.32)
Hardness, 250 mg/L as CaCO3 1.65(1.07-2.55)
pH 6.0 1.38(0.87-2.21)
pH 7.0 1.91(0.88-4.14)
pH 8.0 2.10(0.97-4.54)
a. Adapted from Bentley et &1. 1978.
b. Under varied conditions of temperature (15, 20, or 250C) the pH wasmaintained at 7.1, and the hardness was 35 mg/L as CaC03. Under variedconditions of hardness (35, 100, or 250 mg/L as CaCO3) the pH was main-tained at 7.1, and the temperature was 200C. Under varied conditions ofpH (6.0, 7.0, or 8.0), hardness was maintained at 35 m$/L as CaC03, andand the temperature was 200C.
c. 95% confidence interval.
-18-
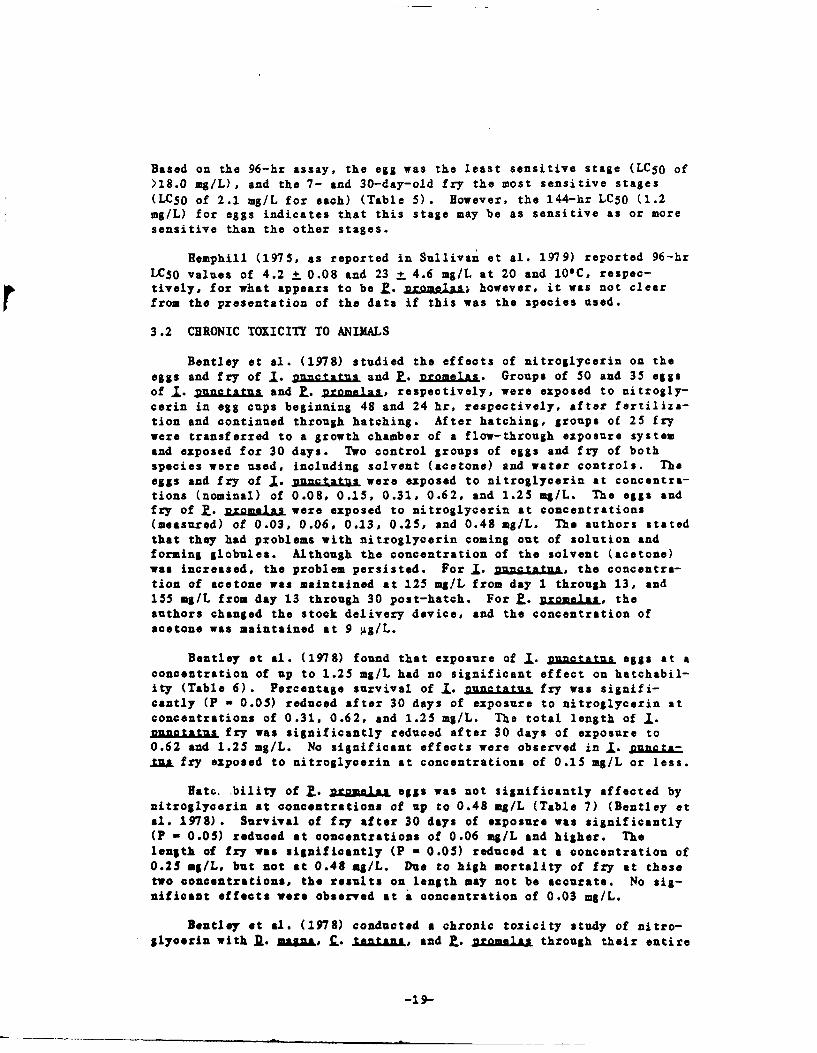
Based on the 96-hr assay, the egg was the least sensitive stage (LCS0 of>18.0 mg/L), and the 7- and 30-day-old fry the most sensitive stages(LC50 of 2.1 mg/L for each) (Table 5). However, the 144-hr LC50 (1.2mg/L) for eggs indicates that this stage may be as sensitive as or moresensitive than the other stages.
Hemphill (1975, as reported in Sullivan et al. 1979) reported 96-hrLC5O values of 4.2 ± 0.08 and 23 + 4.6 mg/L at 20 and 100C, respec-tively, for what appears to be .. loromals; however, it was not clearfrom the presentation of the data if this was the species used.
3.2 CHRONIC TOXICITY TO ANIMALS
Bentley et al. (1978) studied the effects of nitroglycerin on theeggs and fry of L. 2uagjA=± and .. Jloromea.. Groups of 50 and 35 eggsof L. nunctatus and E. zpomelas, respectively, were exposed to nitrogly-cerin in egg cups beginning 48 and 24 hr, respectively, after fertiliza-tion and continued through hatching. After hatching, groups of 25 frywere transferred to a growth chamber of a flow-through exposure systemand exposed for 30 days. Two control groups of eggs and fry of bothspecies were used, including solvent (acetone) and water controls. Theeggs and fry of L. RuE a were exposed to nitroglycerin at concentra-tions (nominal) of 0.08, 0.15, 0.31, 0.62, and 1.25 mg/L. The eggs andfry of P. nromelas were exposed to nitroglycerin at concentrations(measured) of 0.03, 0.06, 0.13, 0.25, and 0.48 mg/L. The authors statedthat they had problems with nitroglycerin coming out of solution andforming globules. Although the concentration of the solvent (acetone)was increased, the problem persisted. For j. asj t1&, the concentra-tion of acetone was maintained at 125 mg/L from day 1 through 13, and155 mg/L from day 13 through 30 post-hatch. For Z. gromelas, theauthors changed the stock delivery device, and the concentration ofacetone was maintained at 9 g/L.
Bentley et al. (1978) found that exposure of .1. 2jLqjA. eggs at aconcentration of up to 1.25 mg/L had no significant effect on hatchabil-ity (Table 6). Percentage survival of l. z fry was signifi-cantly (P - 0.05) reduced after 30 days of exposure to nitroglycerin atconcentrations of 0.31, 0.62, and 1.25 m$/L. The total length of .-naflA.= fry was significantly reduced after 30 days of exposure to0.62 and 1.25 mg/L. No significant effects were observed in L. 2A .tza fry exposed to nitroglycerin at concentrations of 0.15 mg/L or less.
Hate. bility of Z. nz2uaiIA& eggs was not significantly affected bynitroglycerin at concentrations of up to 0.48 mg/L (Table 7) (Bentley etal. 1978). Survival of fry after 30 days of exposure was significantly(P - 0.05) reduced at concentrations of 0.06 mg/L and higher. Thelength of fry was significantly (P - 0.05) reduced at a concentration of0.25 mg/L, but not at 0.48 mg/L. Due to high mortality of fry at thesetwo concentrations, the results on length may not be accurate. No sig-nificant effects were observed at a concentration of 0.03 mg/L.
Bentley et al. (1978) conducted a chronic toxicity study of nitro-glyoetin with A. aUMa&, Q. JAtat , and P.. aXnamuLAiL through their entire
-19-
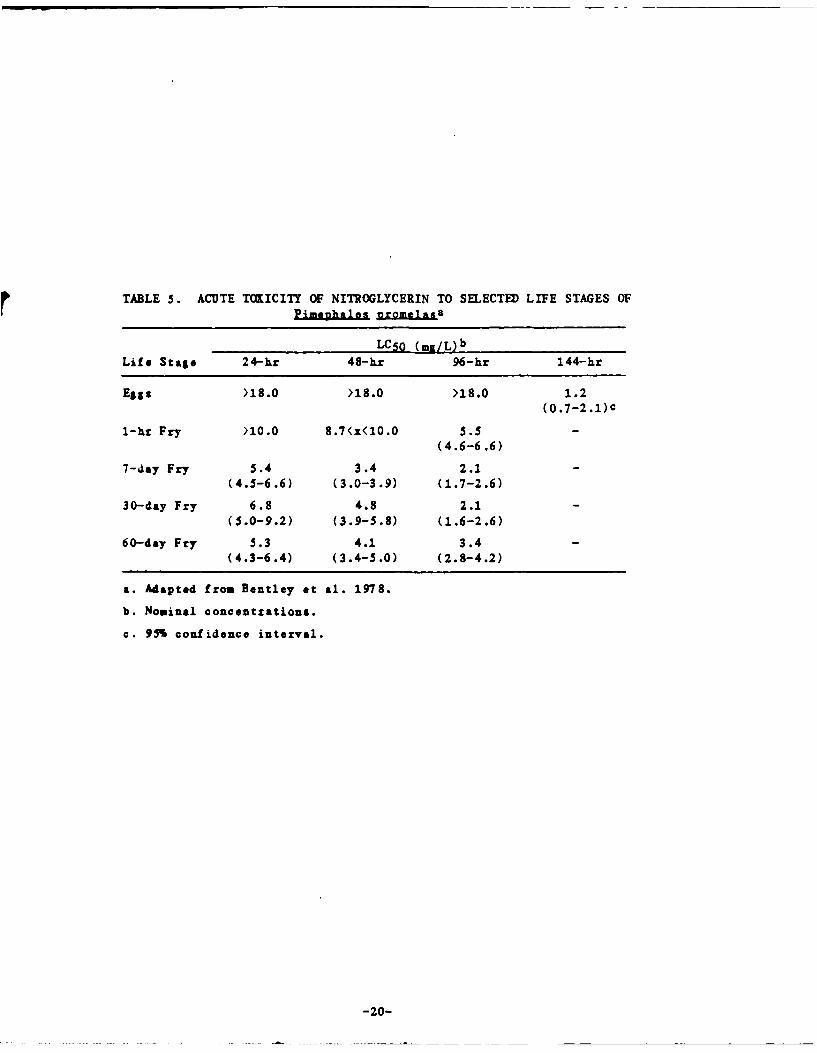
TABLE 5. ACUTE TOIICITY OF NITROGLYCERIN TO SELECTED LIFE STAGES OF
LC50 (ma/L) b
Life Stage 24-hr 48-hr 96-hr 144-hr
Eggs )18.0 >18.0 >18.0 1.2(0.7-2.1)c
1-hr Fry >10.0 8.7<x<10.0 5.5
(4.6-6.6)7-day Fry 5.4 3.4 2.1
(4.5-6.6) (3.0-3.9) (1.7-2.6)
30-day Fry 6.8 4.8 2.1
(5.0-9.2) (3.9-5.8) (1.6-2.6)
60-day Fry 5.3 4.1 3.4
(4.3-6.4) (3.4-5.0) (2.8-4.2)
a. Adapted from Bentley et al. 1978.
b. Nominal concentrations.
c. 95i confidence interval.
-20-
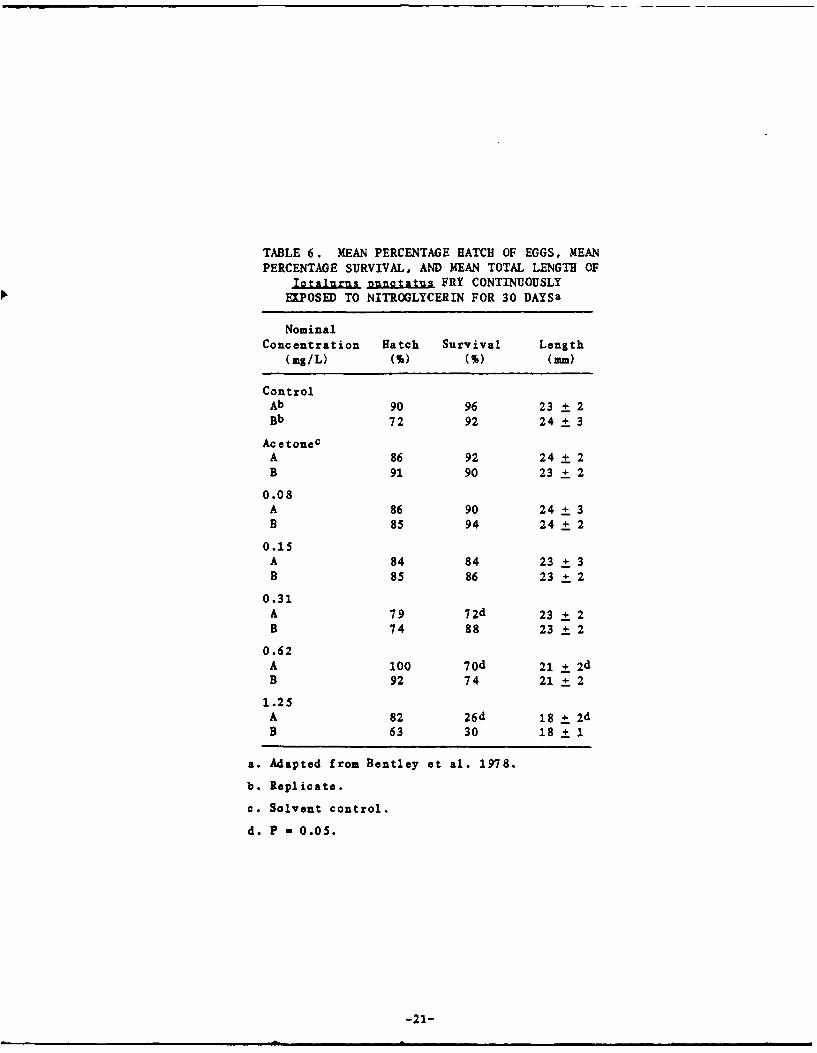
TABLE 6. MEAN PERCENTAGE BATCH OF EGGS, MEANPERCENTAGE SURVIVAL, AND MEAN TOTAL LENGTH OF
T p FRY CONTINUOUSLYEXPOSED TO NITROGLYCERIN FOR 30 DAYSa
NominalConcentration Hatch Survival Length
(mg/L) (W) () (mm)
ControlAb 90 96 23+ 2Bb 72 92 24+ 3
AcetonecA 86 92 24+ 2B 91 90 23+ 2
0.08A 86 90 24+ 3B 85 94 24+ 2
0.15A 84 84 23 + 3B 85 86 23 2
0.31A 79 72d 23 + 2B 74 88 23 2
0.62A 100 70d 21 +2dB 92 74 21+ 2
1.25A 82 26d 18 +2dB 63 30 18 1
a. Adapted from Bentley et al. 1978.
b. Replicate.
c. Solvent control.
d. P - 0.05.
-21-
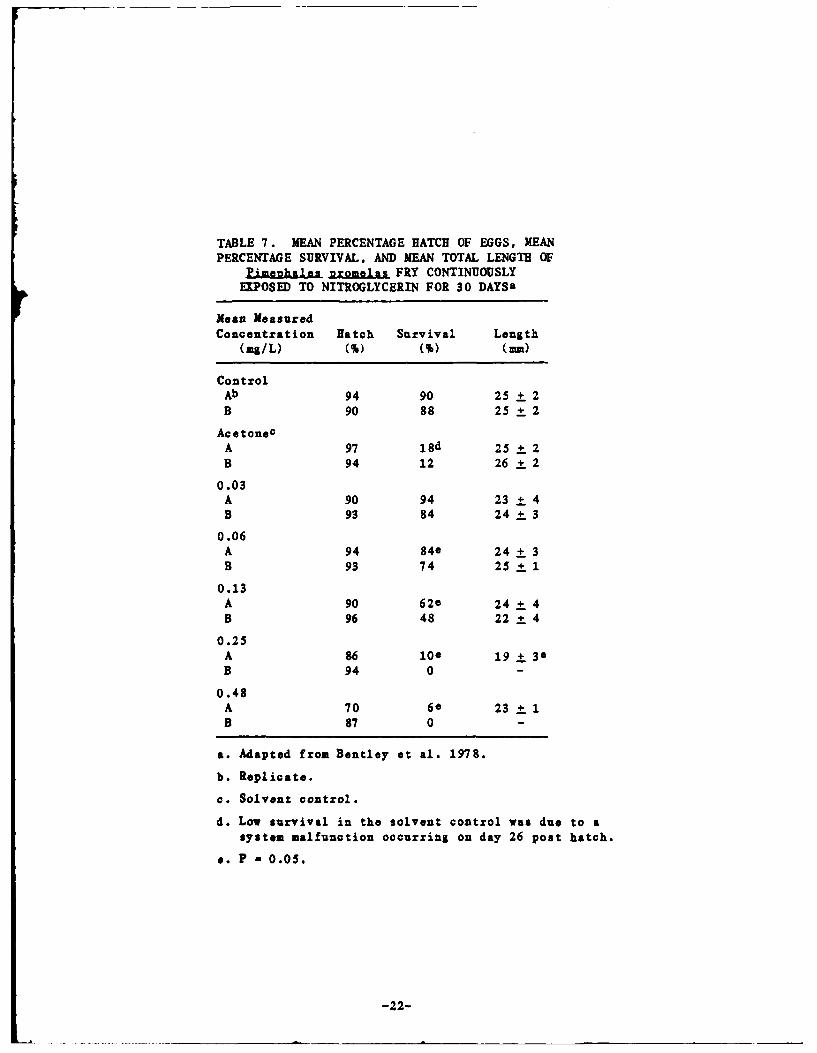
TABLE 7. MEAN PERCENTAGE BATCH OF EGGS, MEANPERCENTAGE SURVIVAL, AND MEAN TOTAL LENGTH OF
Pimeahkals promelas FRY CONTINUOUSLYEXPOSED TO NITROGLYCERIN FOR 30 DAYSa
Mean Measured
Concentration Batch Survival Length(mg/L) (%) %) (mm)
ControlAb 94 90 25_ 2B 90 88 25+ 2
AcetonecA 97 18d 25 +2B 94 12 26+ 2
0.03A 90 94 23 4B 93 84 24 + 3
0.06A 94 84e 24+ 3B 93 74 25+ 1
0.13A 90 62e 24+ 4B 96 48 22+ 4
0.25A 86 lO 19+ 3B 94 0
0.48A 70 60 23+ 1B 87 0
a. Adapted from Bentley et al. 1978.
b. Replicate.
c. Solvent control.
d. Low survival in the solvent control was due to a
system malfunction occurring on day 26 post hatch.
e. P - 0.05.
-22-
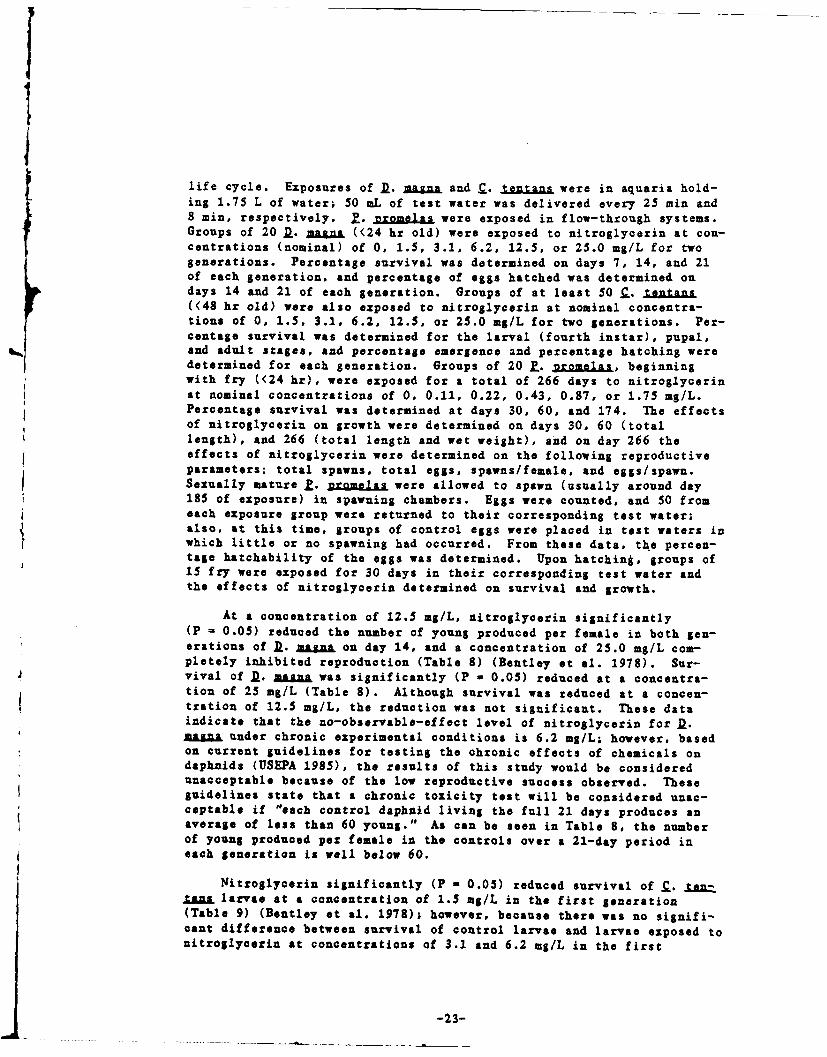
life cycle. Exposures of D. a&41gn and Q. jaa were in aquaria hold-ing 1.75 L of water; 50 mL of test water was delivered every 25 min and8 min, respectively. E. nromelas were exposed in flow-through systems.Groups of 20 D. maZgna ((24 hr old) were exposed to nitroglycerin at con-centrations (nominal) of 0, 1.5, 3.1, 6.2, 12.5, or 25.0 mg/L for twogenerations. Percentage survival was determined on days 7, 14, and 21of each generation, and percentage of eggs hatched was determined ondays 14 and 21 of each generation. Groups of at least 50 .. ItnanA(<48 hr old) were also exposed to nitroglycerin at nominal concentra-tions of 0, 1.5, 3.1, 6.2, 12.5, or 25.0 mg/L for two generations. Per-centage survival was determined for the larval (fourth instar), pupal,and adult stages, and percentage emergence and percentage hatching weredetermined for each generation. Groups of 20 .. 2.aJaz., beginningwith fry ((24 hr), were exposed for a total of 266 days to nitroglycerinat nominal concentrations of 0, 0.11, 0.22, 0.43, 0.87, or 1.75 mg/L.Percentage survival was determined at days 30, 60, and 174. The effectsof nitroglycerin on growth were determined on days 30. 60 (totallength), and 266 (total length and wet weight), and on day 266 theeffects of nitroglycerin were determined on the following reproductiveparameters: total spawns, total eggs, spawns/female, and eggs/spawn.Sexually mature E. promelas were allowed to spawn (usually around day185 of exposure) in spawning chambers. Eggs were counted, and 50 fromeach exposure group were returned to their corresponding test water;also, at this time, groups of control eggs were placed in test waters inwhich little or no spawning had occurred. From these data, the percen-tage hatchability of the eggs was determined. Upon hatching, groups of15 fry were exposed for 30 days in their corresponding test water andthe effects of nitroglycerin determined on survival and growth.
At a concentration of 12.5 mg/L, nitroglycerin significantly(P = 0.05) reduced the number of young produced per female in both gen-erations of D. SAS" on day 14, and a concentration of 25.0 mg/L com-pletely inhibited reproduction (Table 8) (Bentley et al. 1978). Sur-
4 vival of D. sUga& was significantly (P - 0.05) reduced at a concentra-tion of 25 mg/L (Table 8). Although survival was reduced at a concen-tration of 12.5 mg/L, the reduction was not significant. These dataindicate that the no-observable-effect level of nitroglycerin for D.SLgA& under chronic experimental conditions is 6.2 mg/L; however, basedon current guidelines for testing the chronic effects of chemicals ondaphnids (USEPA 1985), the results of this study would be consideredunacceptable because of the low reproductive success observed. Theseguidelines state that a chronic toxicity test will be considered unac-ceptable if "each control daphaid living the full 21 days produces anaverage of less than 60 young." As can be seen in Table 8, the numberof young produced per female in the controls over a 21-day period ineach generation is well below 60.
Nitroglycerin significantly (P - 0.05) reduced survival of .
IAaj* larvae at a concentration of 1.5 mg/L in the first generation(Table 9) (Bentley et al. 1978); however, because there was no signifi-cant difference between survival of control larvae and larvae exposed tonitroglycerin at concentrations of 3.1 and 6.2 mg/L in the first
-23-
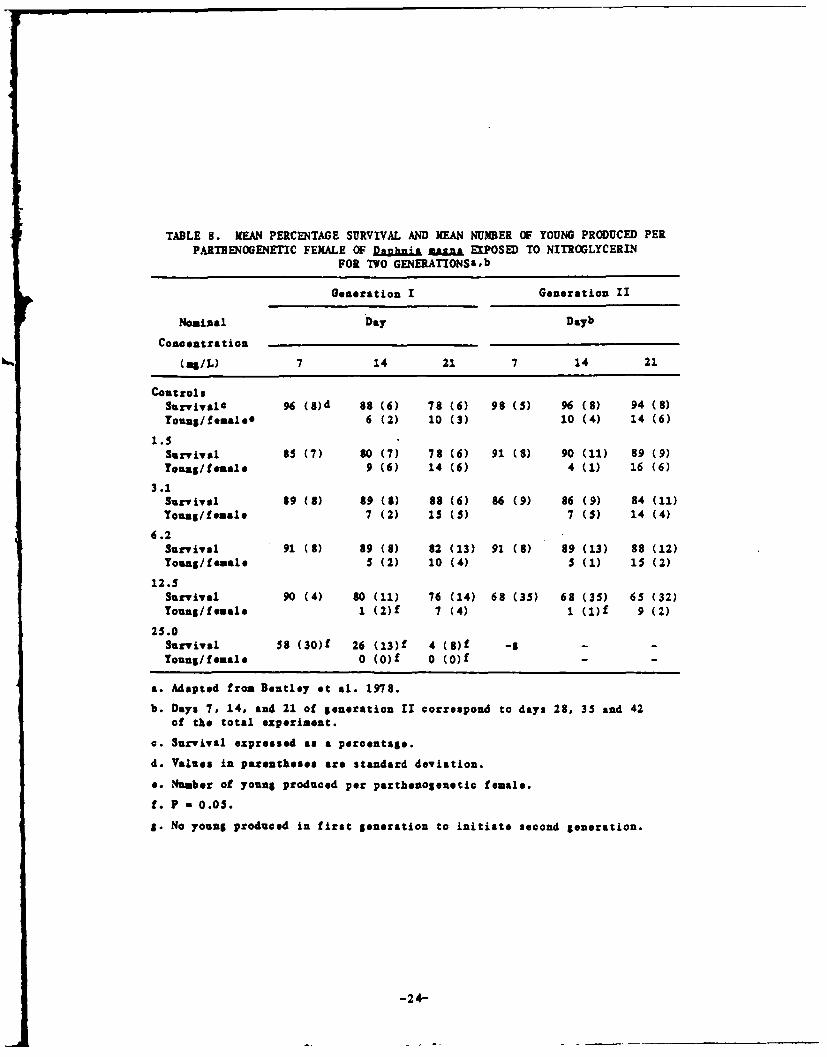
TABLE 8. MEAN PERCENTAGE SURVIVAL AND MEAN NUMBER OF YOUNG PRODUCED PER
PARTHENOGENETIC FEMALE OF Danhi mia xnLa EXPOSED TO NITROGLYCERINFOR TWO GENERATIONSab
Generation I Generation II
Nominal Day Dayb
Concentration
(mg/L) 7 14 21 7 14 21
ControlsSurvivalO 96 (8)d 88 (6) 78 (6) 98 (5) 96 (8) 94 (8)Young/females 6 (2) 10 (3) 10 (4) 14 (6)
1.5Survival 85 (7) 80 (7) 78 (6) 91 (8) 90 (11) 89 (9)Young/female 9 (6) 14 (6) 4 (1) 16 (6)
3.1Survival 89 (8) 89 (8) 88 (6) 86 (9) 86 (9) 84 (11)Young/female 7 (2) is (5) 7 (5) 14 (4)
6.2Survival 91 (8) 89 (8) 82 (13) 91 (8) 89 (13) 88 (12)Young/female 5 (2) 10 (4) S (1) 15 (2)
12..5Survival 90 (4) 80 (11) 76 (14) 68 (35) 68 (35) 65 (32)Young/female 1 (2)f 7 (4) 1 (1)f 9 (2)
25.0Survival 58 (30)f 26 (13)f 4 (8)f - --
Young/female 0 (O)f 0 (O)f -
a. Adapted from Bentley et al. 1978.
b. Days 7, 14, and 21 of generation 11 correspond to days 28, 35 and 42of the total experiment.
a. Survival expressed as a percentage.
d. Values in parentheses are standard deviation.
e. Number of young produced per parthenogenetic female.
f. P - 0.05.
s. No young produced in first generation to initiate second generation.
-24-
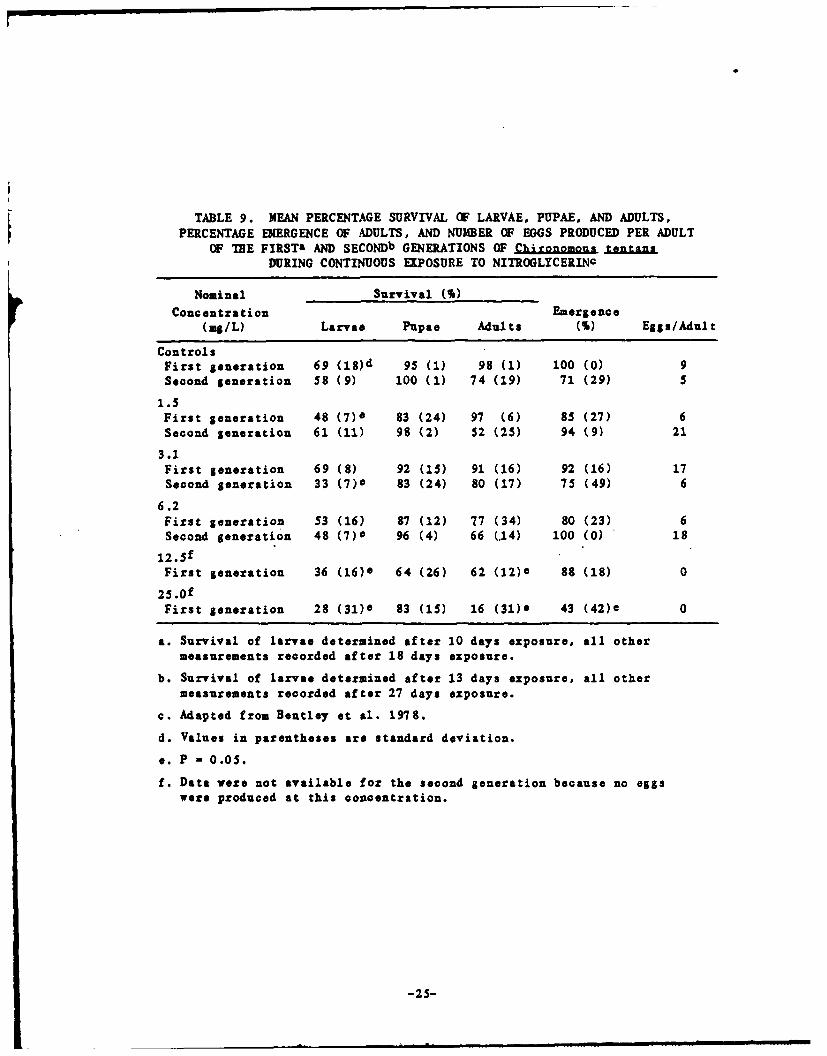
TABLE 9. MEAN PERCENTAGE SURVIVAL OF LARVAE, PUPAE, AND ADULTS,PERCENTAGE EMERGENCE OF ADULTS, AND NUMBER OF EGGS PRODUCED PER ADULT
OF THE FIRST& AND SECONDb GENERATIONS OF .hironomouL jMnja&LDURING CONTINUOUS EXPOSURE TO NITROGLYCERINC
Nominal Survival (W)
Concentration Emergence
(mg/L) Larvae Pupae Adults (%) Eggs/Adult
ControlsFirst generation 69 (1 8)d 95 (1) 98 (1) 100 (0) 9Second generation 58 (9) 100 (1) 74 (19) 71 (29) 5
1.5First generation 48 (7) 83 (24) 97 (6) 85 (27) 6Second generation 61 (11) 98 (2) 52 (25) 94 (9) 21
3.1First generation 69 (8) 92 (15) 91 (16) 92 (16) 17Second generation 33 (7) e 83 (24) 80 (17) 75 (49) 6
6.2First generation 53 (16) 87 (12) 77 (34) 80 (23) 6Second generation 48 (7) 96 (4) 66 (.14) 100 (0) 18
12.5 f
First generation 36 (16)e 64 (26) 62 (12)e 88 (18) 0
25.OfFirst generation 28 (31)e 83 (15) 16 (31)e 43 (42)e 0
a. Survival of larvae determined after 10 days exposure, all othermeasurements recorded after 18 days exposure.
b. Survival of larvae determined after 13 days exposure, all othermeasurements recorded after 27 days exposure.
c. Adapted from Bentley et &1. 1978.
d. Values in parentheses are standard deviation.
e. P - 0.05.
f. Data were not available for the second generation because no eggswere produced at this concentration.
-25-
generation, the authors concluded that the reduction was not nitrogly-
cerin related. Survival of both larvae and adults of the first genera-
tion was significantly (P = 0.05) reduced at concentrations of 12.5 and
25.0 mg/L, and emergence of adults was significantly (P - 0.05) reduced
at a concentration of 25.0 mg/L. (The authors stated in their text that
emergence was significantly reduced at a concentration of 12.5 mg/L, but
their tabular data are not in agreement with this statement.) At concen-
trations of 12.5 and 25.0 mg/L. no eggs were produced by adults in the
first generation (Table 9). In the second generation, survival of lar-
vae was significantly (P = 0.05) reduced at a concentration of 3.1 and
6.2 mg/L (Table 9). Based on their results, the authors concluded that
continuous exposure to 1.5 mg/L does not affect any stage of development
of this organism.
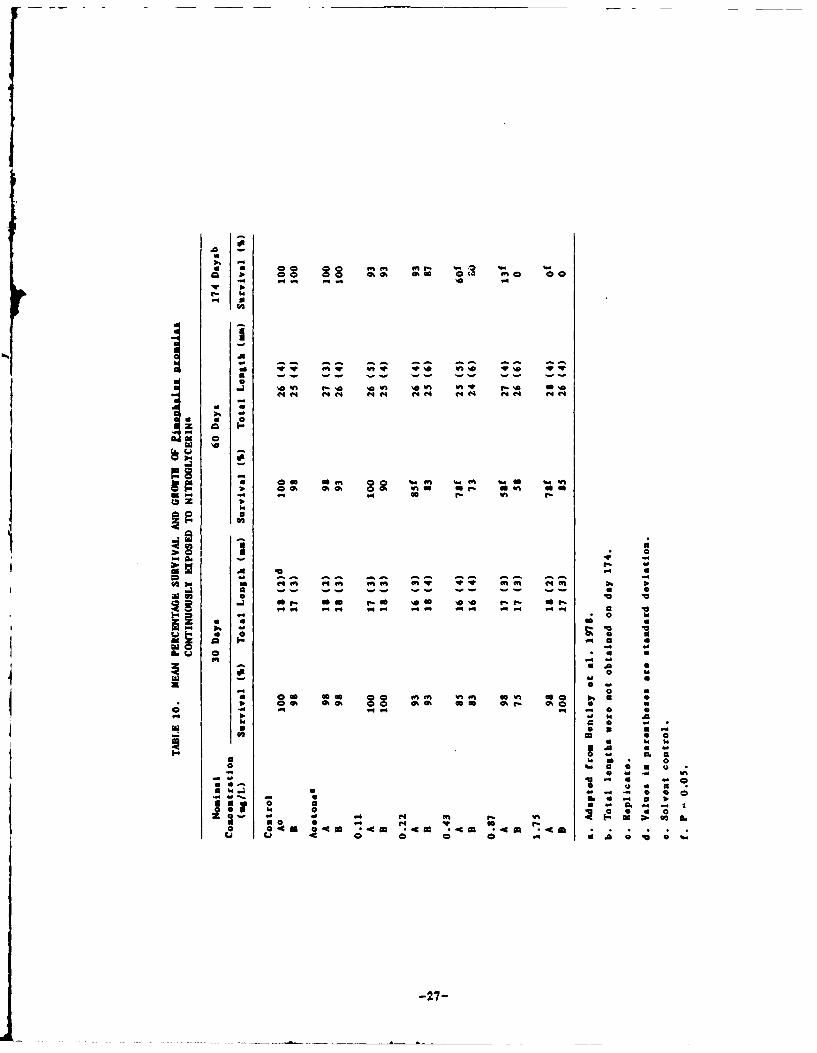
Exposure of 1. Dnomelas to nitroglycerin at concentrations of up to
1.75 mg/L for 30 days had no significant effect on either survival or
total length (Table 10) (Bentley et al. 1978). Exposure for 60 days toconcentrations )_0.22 mg/L significantly (P = 0.05) reduced survival, but
had no significant effect on total length. After 174 days, survival was
significantly (P - 0.05) reduced at concentrations of 0.43 and 0.87mg/L, and at a concentration of 1.75 mg/L there were no survivors.
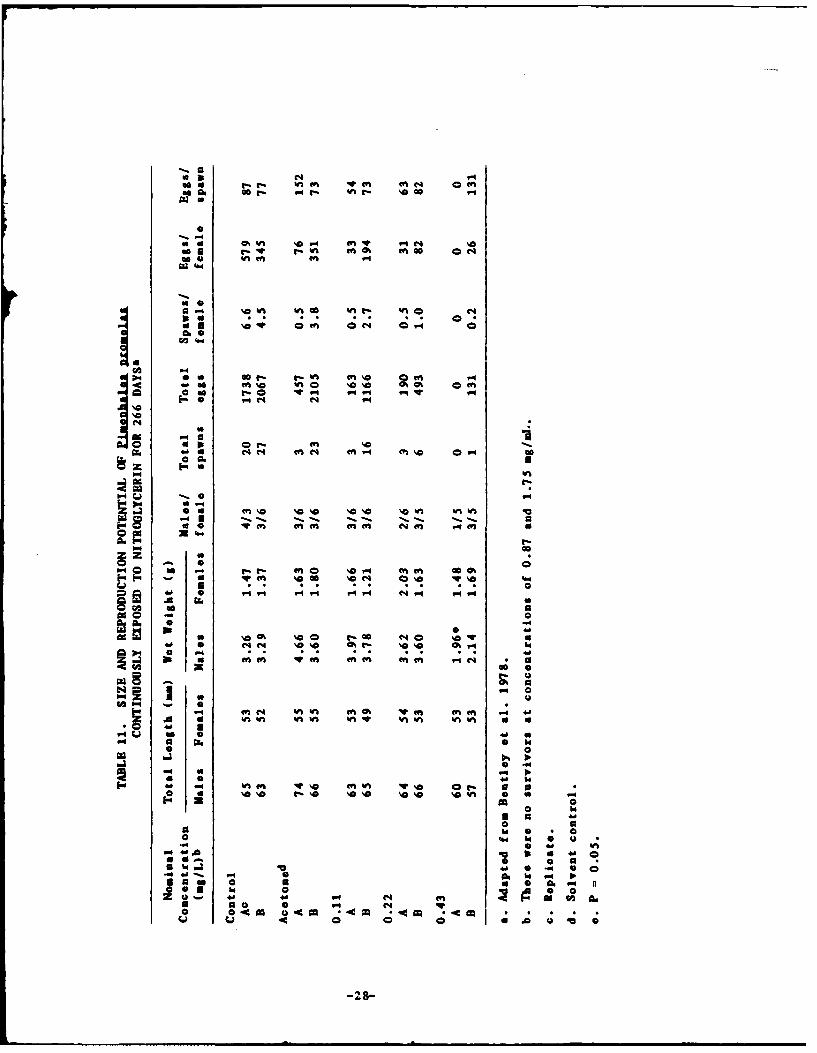
After 266 days of exposure, there were no survivors in the groups
exposed to 0.87 or 1.75 mg/L. There were no significant effects ontotal length or wet weight of females after exposing them for 266 days
to nitroglycerin at concentrations of 0.22 mg/L or less, but at a con-centration of 0.43 mg/L, the wet weight of males was significantly (P0.05) lower than that of the controls (Table 11).. Although not statis-
tically analyzed by the authors, total spawns, total eggs,
spawns/female, and eggs/spawn were lower in all exposed groups (Table
11). The hatchability of eggs produced by parental fish exposed to 0.43mg/L of nitroglycerin and the hatchability of control eggs exposed to
1.75 mg/L nitroglycerin were reduced; however, these data were not sta-
tistically analyzed (Table 12). The results of exposing control eggs to
0.87 mg/L were not clear because, in replicate A, 96 percent of the eggs
hatched, while in replicate B, only three percent hatched; the authors
gave no explanation for this difference. At a concentration of 0.22mg/L, total length and wet weight of fry from the parental group and
control fry exposed to this concentration were significantly (P = 0.05)less after 30 days of exposure (Table 13). Survival of this group was
also reduced, but the authors did not indicate that this reduction was
significant. At concentrations of 0.43, 0.87, and 1.75 mg/L, which con-tained only fry transferred from controls, both total length and meanwet weight were significantly (P - 0.05) less than in control groups.No significant effects were observed at a concentration of 0.11 mg/L
(Table 13).
3.3 TOXICITT TO PLANTS
Bentley et al. (1978) determined the acute toxicity of nitrogly-
cerin to four species of freshwater algae including two blue-greenalgae, M. .fljJ Aerflgft fA and An abaina fla.-a]jiae, one green alga,Seljgjg aganicoc ntum, and one diatom, Navicula Lgl.icujla. Using
static bioassay procedures described by USEPA (1971, as reported in
-26-
40 go
in 14
-" -lq aZ aZ 12 a aa xii~~~ 1.:3~ ~
W4Z
40 0 a%0 o at '
- 0a6 a A 4 *
-900 -cw c
-27-
a C4
o$ - 0C og -
t- 4" 9ff go- 0i 04
ao
CA -4No ww at %af a%,' m
ago t0 'V -4 4 W
C1 a4 fn ~4 " swo 0to
It 0 V-"mm44f
'0 ~ ~ c '.0' 0%C'V ~ t
sa No t.r 'im 'e4 W.0 a
o 0o
C#20 'oN O'
0 14
0
00 -4-boo
.0. -.
- ~ ~ ~ ~ ~ -, 8Ntt 0 Wn m
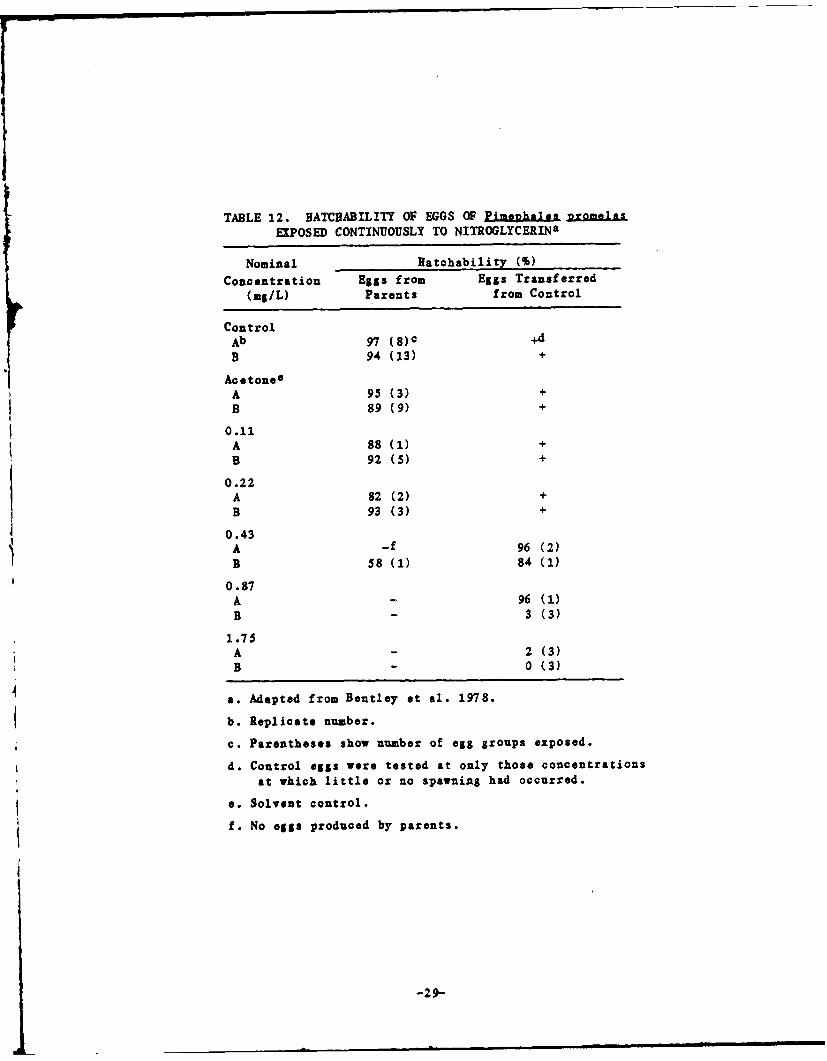
TABLE 12. BATCHABILITY OF EGGS OF PimeahklaipromelaA
EXPOSED CONTINUOUSLY TO NITROGLYCERINa
Nominal Hatchability (M)
Concentration Eggs from Eggs Transferred
(mg/L) Parents from Control
ControlAb 97 (8)c +d
B 94 (13) +
AcetoneeA 95 (3) +
B 89 (9) +
0.11A 88 (1) +
B 92 (5) +
0.22A 82 (2) +
B 93 (3) +
0.43A -f 96 (2)
B 58 (1) 84 (1)
0.87
A - 96 (1)
B 3 (3)
1.75A 2 (3)B 0 (3)
a. Adapted from Bentley et al. 1978.
b. Replicate number.
c. Parentheses show number of egg groups exposed.
d. Control eggs were tested at only those concentrations
at which little or no spawning had occurred.
e. Solvent control.
f. No eggs produced by parents.
-29-
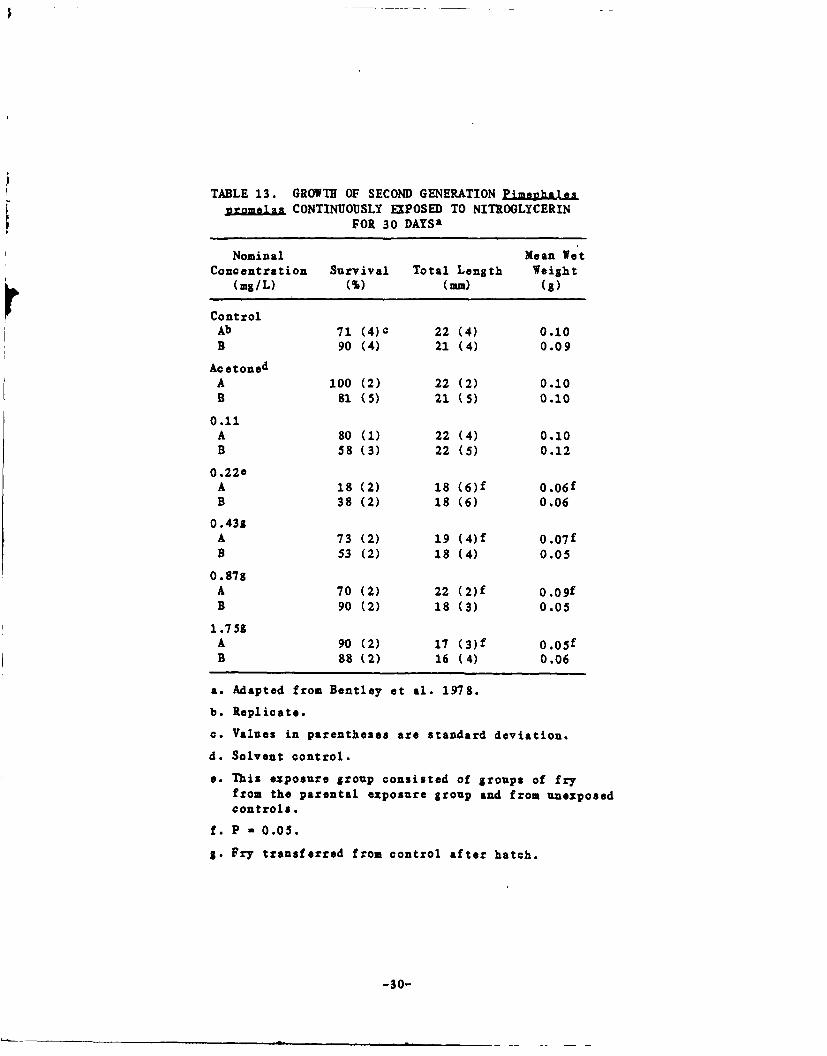
TABLE 13. GROWTH OF SECOND GENERATION Ejag.haIjjgro.mzlas CONTINUOUSLY EXPOSED TO NITROGLYCERIN
FOR 30 DAYS a
Nominal Mean WetConcentration Survival Total Length Weight
(mg/L) (%) (mm) (g)
ControlAb 71 (4) 22 (4) 0.10B 90 (4) 21 (4) 0.09
Ac etonedA 100 (2) 22 (2) 0.10B 81 (5) 21 (5) 0.10
0.11A 80 (1) 22 (4) 0.10B 58 (3) 22 (5) 0.12
0.22eA 18 (2) 18 (6)f 0.06fB 38 (2) 18 (6) 0.06
0.43sA 73 (2) 19 (4)f 0.07fB 53 (2) 18 (4) 0.05
0 .87sA 70 (2) 22 (2)f 0.09fB 90 (2) 18 (3) 0.05
1.759A 90 (2) 17 (3)f 0.05fB 88 (2) 16 (4) 0.06
a. Adapted from Bentley et al. 1978.
b. Replicate.
c. Values in parentheses are standard deviation.
d. Solvent control.
e. This exposure group consisted of groups of fryfrom the parental exposure group and from unexposedcontrols.
f. P - 0.05.
S. Fry transferred from control after hatch.
-30-
Bentley et al. 1978), 24-, 48-, and 96-hr ECsO values were calculatedbased on changes in chlorophyll A concentration (all four species), cellnumbers (all but A- loa-aa Xui), or optical density (only A. L1oA-aauaie). Based on the number of cells per milliliter, 5. canricornutumwas the most sensitive species and was found to have a 96-hr EC50 of 0.4mg/L (Table 14). Based on a decrease in chlorophyll & concentration, .
canricornutu and a. 2ellicuIos& were the most sensitive species, with
both having 96-hr ECSO values of 1.0 mg/L. K. A£xeSrjLun and A. f1JsA-Ajaua were the least sensitive of the species, with both having 96-hr
EC5O values of >10.0 mg/L for both parameters tested.
Sullivan et al. (1979) pointed out that in Bentley et al.'s (1978)algal bioassay with nitroglycerin, the lactose vehicle at a concentra-tion of 10 mg/L caused a 24 percent increase in cell numbers of .j.canricornutum. Although lactose had also been used at concentrations of1 and 100 mg/L, Bentley et al. corrected all cell counts for thisspecies by 24 percent regardless of the lactose concentration; thus theymade no allowance for any lessening of this effect at lower vehicle con-centrations. Furthermore, the effect of the lactose was apparently notconsidered in the determinations of chlorophyll A. Based on this, Sul-livan et al. felt that the EC50 values for chlorophyll i and cell num-bers of J. £- .cnL=tum were questionable.
Sullivan et al. (1979) also criticized the Bentley et al. (1978)study because they had used a probit analysis to analyze growth responsedata of algal cultures relative to a control. Sullivan et al. pointedout that a probit analysis requires that the data be binomially distri-buted, but that percentage growth reduction or amount of growth of aculture are continuous responses and generally normally distributed.They reanalyzed the data and calculated the lowest significant (level ofsignificance not given) response concentrations for the 96-hr cellcounts and chlorophyll A values of 1. 2alliculosa and S. calricornutum.For i. oelliculosa the lowest significant response concentration forboth cell counts and chlorophyll A was 0.32 mg/L, and the respectiveconcentrations for J. canricornutum were 1.0 and 0.1 mg/L.
3.4 BIOACCUNULATION
The potential for bioaccumulation of nitroglycerin in fish was stu-died by Bentley et al. (1978). Twenty each of L. a a .chiu, i.,gromalas, .1. a±Lrneria and 1. D A were exposed to 14C-nitroglycerin at an average concentration of 0.42 mg/L in a modifiedintermittent flow system which delivered the iontrol and test waters ata rate of 5 L/hr. Samples of water and fish were taken on days 1, 2, 4,and 8 from the test aquaria and on day 8 in the control aquarium. Basedon the 8-day exposure period the bioaccumulation factor was estimated tobe about 8X for .. j.g~axL, L. njancatns, and Z. nromeau. and 151 for1. a&=iA1=L. It was not clear from the data if tissue concentrations
had attained steady state.
-31-
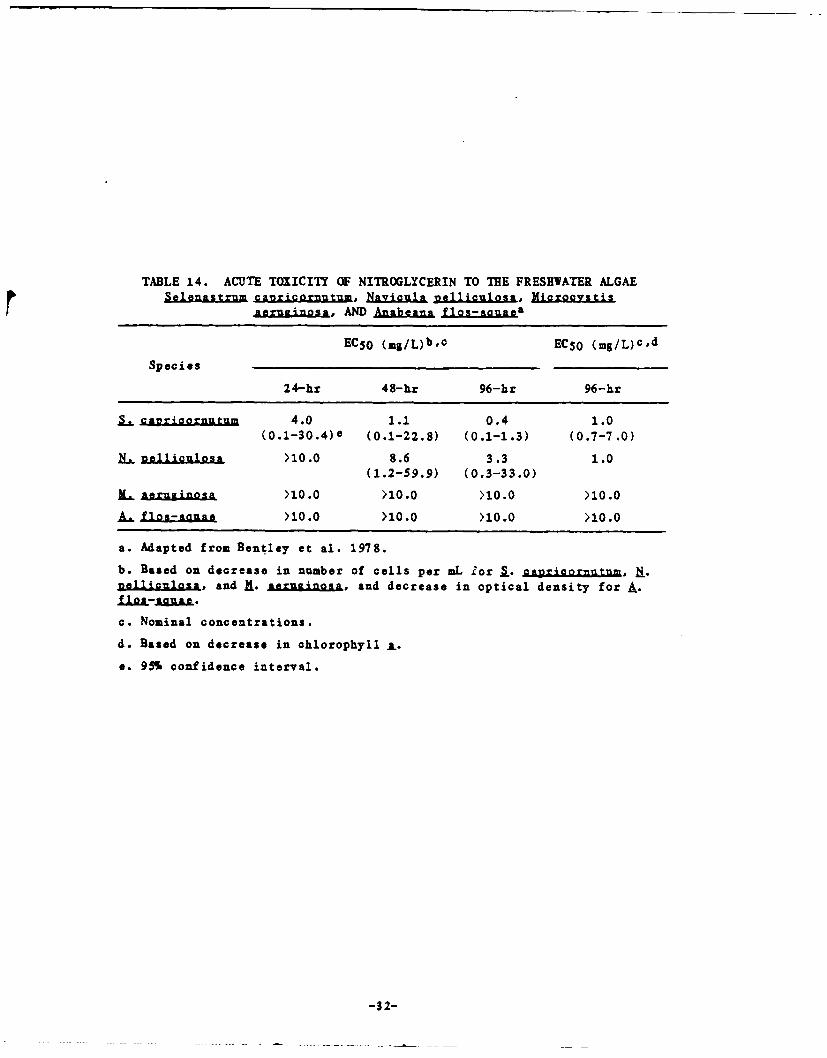
TABLE 14. ACUTE TOXICITY OF NITROGLYCERIN TO THE FRESHWATER ALGAESelenastrum cavri ornutum, jflncjl Dliculoa, Micro~aystis
agruinosa AND Anazng Iisgzu gea
ECS 0 (ms/L)bO ECSO (mB/L)Csd
Species
24-hr 48-hr 96-hr 96-hr
L Panricorn]tu 4.0 1.1 0.4 1.0(0.1-30.4)e (0.1-22.8) (0.1-1.3) (0.7-7.0)
Deluiugan. >10.0 8.6 3.3 1.0
(1.2-59.9) (0.3-33.0)
L. i >10.0 >10.0 >10.0 >10.0
A. Z >10.0 >10.0 >10.0 >10.0
a. Adapted from Bentley et al. 1978.
b. Based on decrease in number of cells per mL Zor S. cagricornutum, ji.eUl..gciaza, and M. ., and decrease in optical density for A.
112L-AA".
c. Nominal concentrations.
d. Based on decrease in chlorophyll a.
e. 95% confidence interval.
-32-
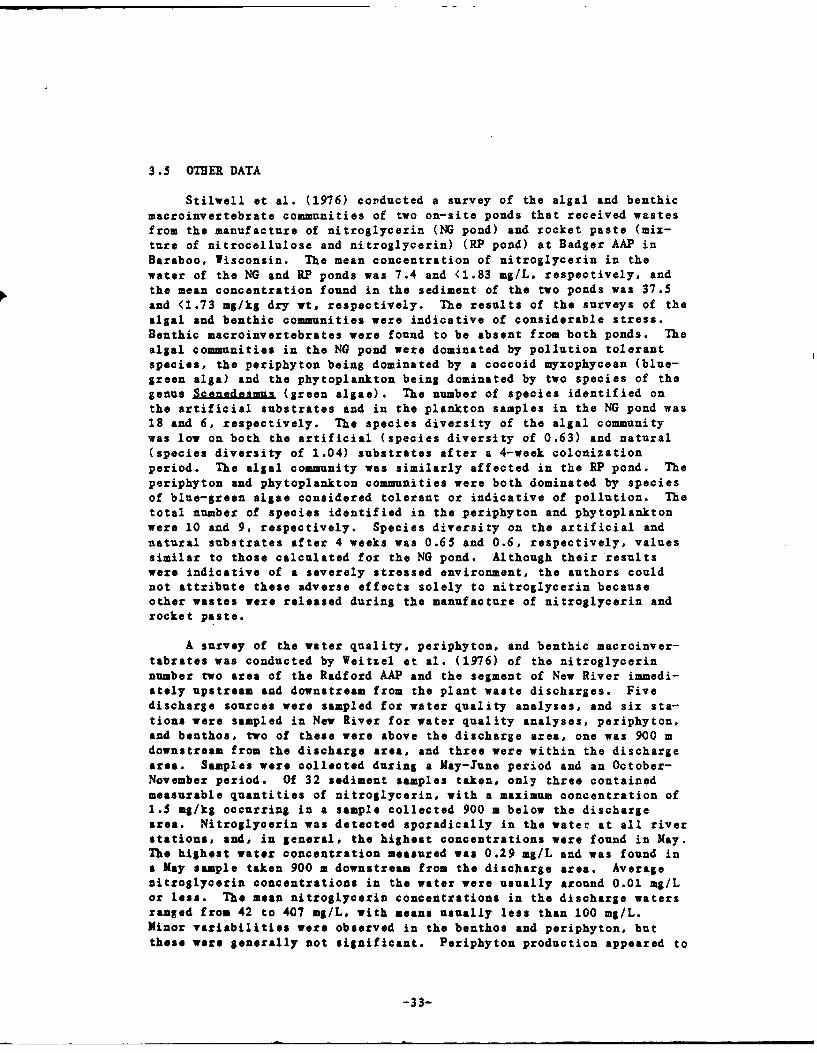
3.5 OTHER DATA
Stilwell ot al. (1976) conducted a survey of the algal and benthicmacroinvertebrate communities of two on-site ponds that received wastesfrom the manufacture of nitroglycerin (NG pond) and rocket paste (mix-ture of nitrocellulose and nitroglycerin) (RP pond) at Badger AAP inBaraboo, Wisconsin. The mean concentration of nitroglycerin in thewater of the NG and RP ponds was 7.4 and <1.83 mg/L, respectively, andthe mean concentration found in the sediment of the two ponds was 37.5and <1.73 mg/kg dry wt, respectively. The results of the surveys of thealgal and benthic communities were indicative of considerable stress.Benthic macroinvertebrates were found to be absent from both ponds. Thealgal communities in the NG pond were dominated by pollution tolerantspecies, the periphyton being dominated by a coccoid myxophycean (blue-green alga) and the phytoplankton being dominated by two species of thegenus Scoedesmu. (green algae). The number of species identified onthe artificial substrates and in the plankton samples in the NG pond was18 and 6, respectively. The species diversity of the algal communitywas low on both the artificial (species diversity of 0.63) and natural(species diversity of 1.04) substrates after a 4-week colonizationperiod. The algal community was similarly affected in the RP pond. Theperiphyton and phytoplakton communities were both dominated by speciesof blue-green algae considered tolerant or indicative of pollution. Thetotal number of species identified in the periphyton and phytoplanktonwere 10 and 9, respectively. Species diversity on the artificial and
natural substrates after 4 weeks was 0.65 and 0.6, respectively, valuessimilar to those calculated for the NG pond. Although their resultswere indicative of a severely stressed environment, the authors couldnot attribute these adverse effects solely to nitroglycerin becauseother wastes were released during the manufacture of nitroglycerin androcket paste.
A survey of the water quality, periphyton, and benthic macroinver-tabrates was conducted by Weitzel et al. (1976) of the nitroglycerinnumber two area of the Radford AAP and the segment of New River immedi-ately upstream and downstream from the plant waste discharges. Fivedischarge sources were sampled for water quality analyses, and six sta-
tions were sampled in New River for water quality analyses, periphyton,and benthos, two of these were above the discharge area, one was 900 mdownstream from the discharge area, and three were within the dischargearea. Samples were collected during a May-June period and an October-November period. Of 32 sediment samples taken, only three contained
measurable quantities of nitroglycerin, with a maximum concentration of1.5 mg/kg occurring in a sample collected 900 m below the dischargearea. Nitroglycerin was detected sporadically in the water at all riverstations, and, in general, the highest concentrations were found in May.The highest water concentration measured was 0.29 mg/L and was found ina May sample taken 900 m downstream from the discharge area. Averagenitroglycerin concentrations in the water were usually around 0.01 mg/Lor less. The mean nitroglycerin concentrations in the discharge watersranged from 42 to 407 mg/L, with means usually less than 100 mg/L.Minor variabilities were observed in the benthos and periphyton, butthese were generally not significant. Periphyton production appeared to
-33-
be inhibited near two discharge areas, but this inhibition could not be
attributed to the waste discharge of the AAP. An increase in periphyton
downstream from one discharge area was thought to be due to an increase
in nitrogen levels. The authors were unable to correlate these varia-
tions with the effluents from the nitroglycerin production areas.
3.6 SUGIRY
Results of acute toxicity studies indicate that nitroglycerin is
quite toxic to aquatic organisms. The toxicity of nitroglycerin toalgae is highly variable among species. Reported 96-hr ECSO values
range from 0.4 to >10 mg/L. Reported 96-hr LCSO values for fish rangefrom 1.67 to 3.2 mg/L, and 48-hr ECS0 values for invertebrates rangefrom 20 to 55 mg/L.
Studies on the effects of nitroglycerin to critical life stages offish (eggs and fry) have shown that the fry stage is the most sensitivestage. Available data indicate that nitroglycerin in concentrations ofup to 1.25 mg/L is not toxic to fish eggs. Fry of Z. gmla have beenfound to be more sensitive to nitroglycerin than fry of J. 2UaijAithe lowest concentrations reported to have significantly affected (basedon survival) these two species are 0.06 and 0.31 mg/L, respectively,after a 30-day exposure period. The validity of these data are ques-tionable because problems with the dilution of nitroglycerin occurredduring the study.
Available data indicate that fish are more sensitive than inver-
tebrates to nitroglycerin under chronic exposure conditions. The lowestconcentration reported to significantly affect fish is 0.22 mg/L; atthis concentration, survival of P. Dromela was reduced after 60 days ofexposure. The lowest concentration reported to significantly affectinvertebrates is 3.1 mg/L; at this concentration, survival of second
generation larvae of Q. &entAnL was reduced.
Limited data on bioaccumulation indicate that nitroglycerin is notappreciably bioaccumulated in the tissues of fish. Estimates for bioac-cumulation factors of nitroglycerin in fish range from 8X to 15X.
A direct relationship between nitroglycerin exposure and adverse
effects to aquatic organisms has not been shown by field studies;however, severe effects on biological communities have been observed in
ponds receiving waste effluents from the production of nitroglycerin androcket paste.
4.1 PBARMACOKINETICS
A tremendous body of literature is available on the physiologicaland pathological effects of nitroglycerin, particularly on cardiovascu-lar and systemic effects. Therefore, discussions on health effects of
-34-
nitroglycerin have been limited to highlights of effects and the expo-sure levels at which these effects were observed, data which could pos-sibly be used in calculating Human Health Criteria. An extensive reviewof the mechanisms of action of nitroglycerin may be found in Needleman(1975).
4.1.1 Animaties
The pharmacokinatics of nitroglycerin in laboratory animals hasbeen studied extensively, particularly in rats; however, because of thelack of sensitive methodologies, many aspects of the pharmacokinetics ofthe compound are unclear. Available data on pharmacokinetics indicatethat nitroglycerin is rapidly and widely distributed and rapidly absor-bed, metabolized, and eliminated (e.g., Fung 1984; McNiff et al. 1980;DiCarlo 1975; DiCarlo et al. 1968; Needleman and Krantz 1965).
DiCarlo et al. (1968) gave rats a single oral dose of 14C-nitroglycerin, and within 30 min radioactivity was observed in theblood, heart, kidneys, liver, lungs, spleen, gastrointestinal (GI)tract, carcass, urine, and feces and in the expired air as carbon diox-ide (C02); a majority of the activity was found in the liver (7.3 per-cent) and carcass (33 percent). Four hours after exposure, radioac-tivity in the liver and carcass had decreased to 2.5 and 16.6 percent,respectively, and the amount of the radioactivity found in the urine andfeces and exhaled as C02 was 20.95, 2.27, and 19.76 percent, respec-tively.
Hodgson and Lee (1975) observed patterns of distribution and elim-ination of nitroglycerin similar to those reported by DiCarlo et al.(1968). Within 4 hr after giving rats 14C-nitroglycerin orally, Hodgsonand Lee found a significant amount of the radioactivity in the liver(4.6 percent); this amount changed little after 24 hr (4.3 percent).Significant amounts of radioactivity were also found in the muscle at 4hr (9.3 percent) and 24 hr (2.8 percent), and from 0.1 to 2.1 percent ofthe radioactivity was found in each of the other tissues examined at 4and 24 hr (whole blood, kidneys, brain, and lungs). After 4 hr, 15.6,7.5, and 3.1 percent of the administered dose was eliminated in theurine, expired air (C02), and feces, respectively, and at the end of 24hr, the amount of radioactivity eliminated via these same routes was39.8, 25.5, and 6.3 percent, respectively.
Lee et al. (1977) studied the pharmacokinetics of orally admin-istered 1,3- 1 4C-nitroglycerin in mice, rats, rabbits, monkeys, and dogs.Within 24 hr after receiving a single oral dose of the compound, about50 to 70 percent had been absorbed by mice, whereas 75 to 90 percent hadbeen absorbed by the other species during the same time period. Duringthe first 24 hr, mice and rats excreted considerable quantities of theradioactivity in urine and expired air (19.2 and 18.8 percent, respec-tively, for mice, and 25.5 and 39.8 percent, respectively, for rats).The other three species excreted a majority of the radioactivity in theurine (45.0 to 72.0 percent) and a much smaller amount in the expiredair (2.5 to 7.8 percent) during the first 24 hr. The highest tissueconcentrations of radioactivity at the end of 24 hr were generally
-35-
observed in the liver of all species (4.3 to 6.8 percent); however,
greater amounts of radioactivity were observed in the skeletal muscles
of dogs and monkeys, with concentrations of 9.5 and 13.0 percent,
respectively, at the end of 24 hr. Small amounts of radioactivity were
also found in the kidneys, spleen, lungs, and brain of all species.
Short et al. (1977) performed an in vitro study on the metabolismof nitroglycerin with tissue samples taken from male and female CD rats,Swiss Webster mice, CD-1 mice, New Zealand albino rabbits, beagle dogs,rhesus monkeys, and humans (at autopsy). A sex difference was notobserved in the metabolism of this compound by liver homogenates of anyspecies. In all species, nitroglycerin was primarily metabolized to1,2- and 1,3-dinitroglycerin by the liver; rats and mice produced more1,3-dinitroglycerin, while rabbits, dogs, monkeys, and humans producedmore 1,2-dinitroglycerin. Rats, rabbits, dogs, and monkeys producedgreater amounts of dinitroglycerins than humans and mice did, whilehumans produced greater amounts than mice. Embryos, fetal livers, andcarcasses of mice were found to have poor ability to metabolize nitro-glycerin. An increased ability to metabolize the compound withincreasing age was observed in rat livers.
The dispositon rate of nitroglycerin is influenced by the route ofadministration (Fung et al. lY84a; Wester et al. 1983; Ioannides et al.1982). Fung et al. (1984a) estimated plasma half-lives of nitroglycerinin rats following oral and intravenous (iv) administrations.Intravenously administered nitroglycerin had a plasma half-life of about15 min. The plasma half-life of orally administered nitroglycerin wasgenerally dependent upon the size of the dose and varied from about 30to 140 min. Tester et al. (1983) estimated a plasma half-life of 18 minfor nitroglycerin given iv to monkeys. Following dermal exposure ofmonkeys to 2 percent nitroglycerin ointment containing 19 mg of 14C-nitroglycerin, a plasma half-life of 4.3 hr was estimated.
loannides et al. (1982) studied several factors that mightinfluence the rate of elimination of nitroglycerin from the plasma,including route of administration, age, sex, and species. In rats, theplasma half-lives for iv, sublingual, and oral routes of administrationwere 6.7, 14.3, and 30.0 min, respectively. The authors indicated thatdifferences in the half-lives were because the estimate of the iv half-life was an elimination half-life, the oral half-life was an absorptionhalf-life, and the sublingual half-life was a mixture of the two. A sexdifference was not observed in the plasma half-life of nitroglycerinadministered iv to rabbits (12.2 min for males and A.5 min forfemales), but a significant sex difference (P < 0.001) was observed inrats (4.4 min for males and 7.7 min for females). A difference in thehalf-life of nitroglycerin given iv was observed in rats at differentages (4.4 min at 8 weeks and 5.5 min at 26 weeks), but there was noindication that this difference was statistically significant. Speciesdifferences were observed in the plasma half-life of nitroglycerin givento male animals iv; an increasing half-life was observed with increasingweight. The estimated plasma half-lives (in minutes) for males givennitroglycerin iv were as follows: hamster, 3.71 rat, 4.41 guinea pig,8.0; ferret, 9.5; and rabbit, 12.2.
-36-
The site of nitroglycerin metabolism has been a controversial issue(Needleman et al. 1971; Lang et al. 1972; Blei et al. 1984; Fung 1984).Based on both in vitro and in viva studies with laboratory animals, ithas been thought for a number of years that nitroglycerin was metabol-ized in the presence of glutathione-organic nitrate reductase in theliver and blood (e.g., Needleman and Hunter 1965; Needleman at al. 1971;Needleman and Harkey 1971; Lang et al. 1972; Lee 1973; Hodgson and Lee1975; Yacobi at al. 1983). More recent studies with rats, however, haveindicated that the liver is not the primary site of metabolism of nitro-glycerin (Blei et al. 1984; Fung et al. 1984a; Fung et al. 1984b). Bleiet al. (1984) infused rats with nitroglycerin iv following portacaval-shunting and found that the systemic clearance of nitroglycerin was nodifferent in these animals than in animals which had been sham operated.They also observed that systemic plasma clearance of nitroglycerin farexceeded hepatic blood flow in sham and shunt groups. Fung et al.(1984b) injected nitroglycerin into various vessels of Sprague-Dawleyrats and found that the highest concentrations of the nitrate were
nearest the site of injection; concentrations decreased progressivelyfurther from the injection site. Thus, these data indicate that vascu-lar tissues can take up and/or metabolize nitroglycerin. Based on hisreview of the literature, Fun& (1984) provided the following briefscenario on the pharmacokinetics of nitroglycerin: "nitroglycerin israpidly taken up and metabolized by extrahepatic tissues, including thevasculature. Little, if any, of the distributed drug emanating from thesystemic circulation returns to it. This extensive tissue distributionand metabolism contribute to the very low, and often fluctuating, con-centration of nitroglycerin observed in the systemic circulation."
Hodgson at al. (1977) studied the metabolic fate and disposition offour radiolabeled metabolites of nitroglycerin in female Charles RiverCD rats including 1,2- and 1,3-dinitroglycerin and 1- and 2-mononitro-
glycerin. Fasted rats were given a single oral dose of one of the meta-
bolites and sacrificed after 4 or 24 hours. A similar pattern ofabsorption was observed for all metabolites except 2-mononitroglycerin;
about 59 percent of the radioactivity was absorbed from the GI tract of
animals exposed to 2-mononitroglycerin, while from 73 to 82 percent of
the radioactivity was absorbed from GI tract of animals exposed to theother metabolites. Most of the 2-mononitroglycerin was excreted in thefeces and urine (32.1 and 48.8 percent), whereas most the other three
metabolites were excreted in the urine and expired air (20 to 30 percentand 27 to 50 percent, respectively), although relatively large quanti-ties were also excreted in the feces (11 to 14 percent). The concentra-tion of each of the metabolites in the liver at 4 and 24 hours was simi-lar, ranging from about 2 to 9 percent of the administered dose. Dis-
tribution of these compounds into other tissues was minor. Analysis ofthe urine of those animals receiving the dinitroglycerins revealed thepresence of mainly free mononitroglycerols. glucuronide conjugates of
dinitro- and mononitroglycerols, glycerol, and other polar metabolites.and only small amounts of dinitroSlycerin. Urinary analysis of the
animals receiving the mononitroglycerins indicated the presence of largeamounts of imchanged compounds as well as glycerol and other polar com-ponents; however, no glucuronides were detected.
-37-
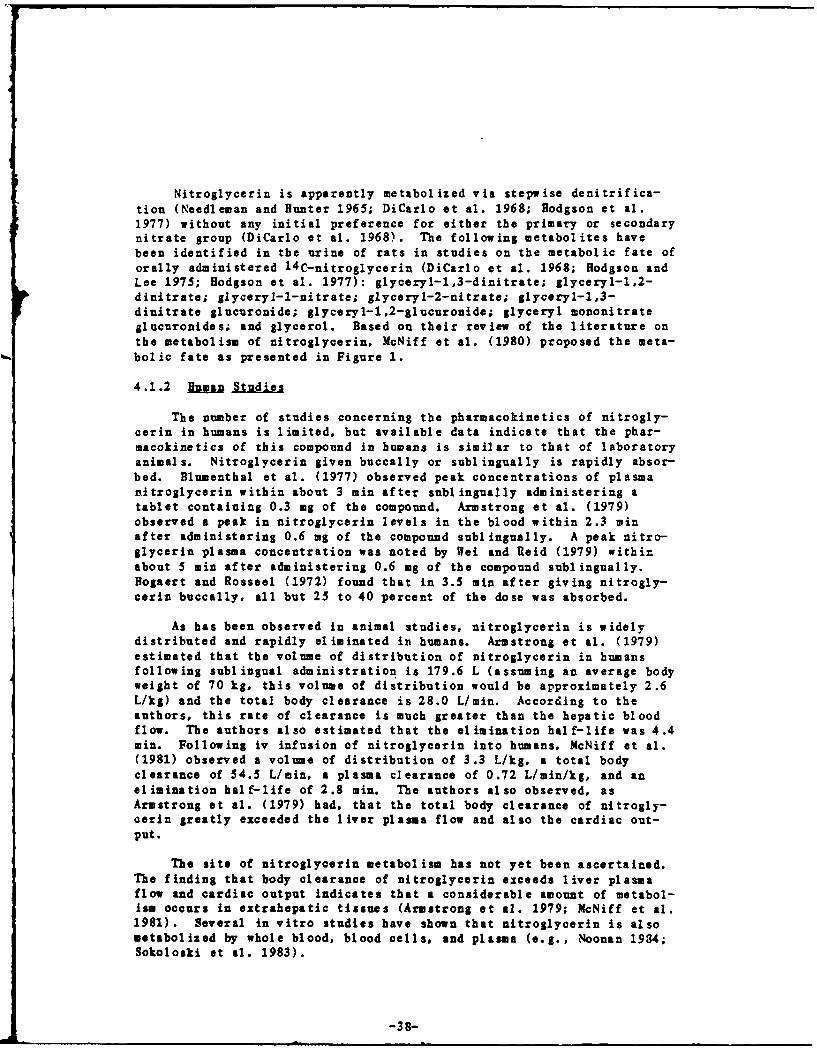
Nitroglycerin is apparently metabolized via stepwise denitrifica-tion (Needleman and Hunter 1965; DiCarlo et al. 1968; Hodgson et al.1977) without any initial preference for either the primary or secondarynitrate group (DiCarlo et al. 1968). The following metabolites havebeen identified in the urine of rats in studies on the metabolic fate oforally administered 1 4 C-nitroglycerin (DiCarlo et al. 1968; Hodgson andLee 1975; Hodgson et al. 1977): glyceryl-1,3-dinitrate; glyceryl-1,2-dinitrate; glyceryl-l-nitrate; glyceryl-2-nitrate; glyceryl-1,3-dinitrate glucuronide; glyceryl-1,2-glucuronide; glyceryl mononitrateglucuronides; and glycerol. Based on their review of the literature onthe metabolism of nitroglycerin, McNiff et al. (1980) proposed the meta-bolic fate as presented in Figure 1.
4.1.2 Buma Studies
The number of studies concerning the pharmacokinetics of nitrogly-cerin in humans is limited, but available data indicate that the phar-macokinetics of this compound in humans is similar to that of laboratoryanimals. Nitroglycerin given buccally or sublingually is rapidly absor-bed. Blumenthal et al. (1977) observed peak concentrations of plasmanitroglycerin within about 3 min after sublingually administering atablet containing 0.3 mg of the compound. Armstrong et al. (1979)observed a peak in nitroglycerin levels in the blood within 2.3 minafter administering 0.6 mg of the compound sublingually. A peak nitro-glycerin plasma concentration was noted by Wei and Reid (1979) withinabout 5 min after administering 0.6 mg of the compound sublingually.Bogaert and Rosseel (1972) found that in 3.5 min after giving nitrogly-cerin buccally, all but 25 to 40 percent of the dose was absorbed.
As has been observed in animal studies, nitroglycerin is widelydistributed and rapidly eliminated in humans. Armstrong et al. (1979)estimated that the volume of distribution of nitroglycerin in humansfollowing sublingual administration is 179.6 L (assuming an average bodyweight of 70 kg, this volume of distribution would be approximately 2.6L/kg) and the total body clearance is 28.0 L/min. According to theauthors, this rate of clearance is much greater than the hepatic bloodflow. The authors also estimated that the elimination half-life was 4.4min. Following iv infusion of nitroglycerin into humans, McNiff et al.(1981) observed a volume of distribution of 3.3 L/kg, a total bodyclearance of 54.5 L/min, a plasma clearance of 0.72 L/min/kg, and anelimination half-life of 2.8 min. The authors also observed, asArmstrong et al. (1979) had, that the total body clearance of nitrogly-cerin greatly exceeded the liver plasma flow and also the cardiac out-put.
The site of nitroglycerin metabolism has not yet been ascertained.The finding that body clearance of nitroglycerin exceeds liver plasmaflow and cardiac output indicates that a considerable amount of metabol-ism occurs in extrahepatic tissues (Armstrong et al. 1979; McNiff et al.1981). Several in vitro studies have shown that nitroglycerin is alsometabolized by whole blood, blood cells, and plasma (e.g., Noonan 1984;Sokoloski et al. 1983).
-38-
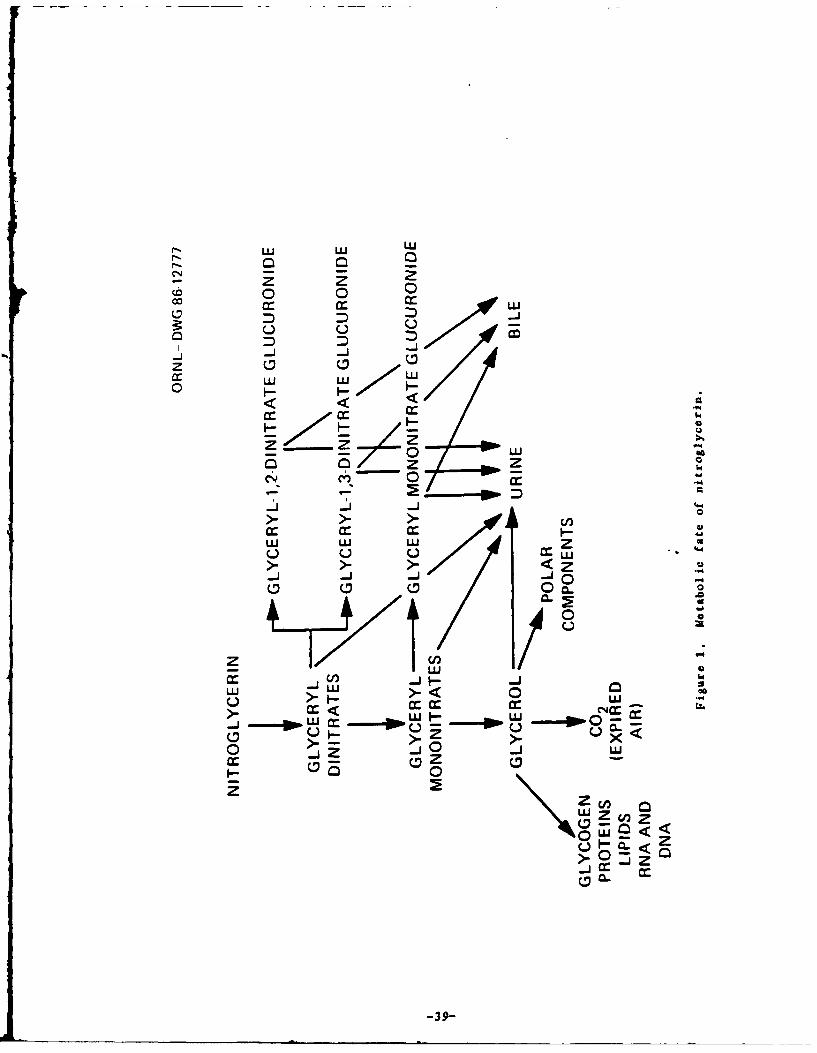
wU w LU
zco C LU
D D
zz
~ z zC- C-0
LU LU LU z
0.
00
LULU 0aLu >**I- >
___LU LjC) C
or U 0I ci LUu- o- >(Z
0 >u _j0
Zz0O.
-39-n
The metabolic fate of nitroglycerin appears to be similar betweenhumans and animals. The dinitrates, 1,2- and 1,3-glyceryl dinitrate,have been observed in the saliva of humans within 3.5 min after beinggiven nitroglycerin sublingually (Bogaert and Rosseel 1972). In addi-
tion to the two dinitrates, two mononitrates (1- and 2-glyceryl mononi-trate) have been identified in vitro in blood and plasma (Noonan and
Benet 1982; Noonan 1984).
4.2 ACUTE TOXICITY
4.2.1 Animal Studio!
A summary of available acute toxicity values for nitroglycerin is
provided in Table 15. These data show that the acute toxicity of nitro-
glycerin is moderate but that the extent of the toxicity varies with
route of exposure; the compound is less toxic when exposure is via oral
or subcutaneous routes and most toxic when exposure is iv. Little or no
difference exists between sexes or among species in the acute toxicityof this chemical. LD5 0 values for iv and orally administered nitrogly-cerin range from 10.6 to 32 mg/kg and 500 to 1188 mg/kg, respectively.
Several studies were found concerning the nonlethal effects ofnitroglycerin given in a single dose to laboratory mammals. A number ofstudies have shown that acute exposure to nitroglycerin results in vaso-dilation. Beinzow and Ziegler (1981) exposed male Sprague-Dawley ratsto a single dose of nitroglycerin via the following routes and concen-trations: jugular vein, 10 pg/kg; portal vein, 100 pg/kg; jejunum, 200pg/kg; sublingual, 100 pg/kg; and intraperitoneal, 100 ;ig/kg. Theauthors observed a reduction in blood pressure following the administra-
tion of nitroglycerin by all routes. The extent of change in bloodpressure from greatest to lowest response was as follows: jugular vein,sublingual, intraperitoneal, portal vein, and jejunum.
Oral administration of a single 100-mg/kg dose of nitroglycerin tofive male Sprague-Dawley rats resulted in a rapid decrease in systolicblood pressure; baseline pressure values were reestablished within about10 win (Maier et al. 1980). Flaim (1982) administered nitroglycerin tomale Sprague-Dawley rats over three subsequent infusion periods 15 minapart. The infusion dosages were as follows: 15-win point, 2 pg/kg;30-win point, 8 pg/kg; and 45-win point, 32 pg/kg. The author observedsignificant changes at all dosage levels in blood flow and vascularresistance. After infusion with 2 iig/kg, significant (P < 0.05) reduc-tions were observed in vascular resistance of the kidneys, ileum, andcerebellum, while a signficant (P < 0.05) increase in blood flow wasobserved in the kidneys. After infusion with 8 pg/kg, vascular resis-tance was significantly reduced in the ileum, jejunum, heart, and brain,and blood flow was increased significantly (P < 0.05) in the heart andbrain. Significant (P < 0.05) decreases were observed in vascularresistance in the kidneys, ileum, jejunum, heart, and brain, and signi-ficant (P < 0.05) increases were observed in blood flow in the kidneys,heart, and brain after infusion with 32 pg/kS. Also observed was a sig-nificant (P < 0.05) decrease in C02 tension (pC02) after infusion with 8and 32 pg/kSg. The author concluded that nitroglycerin was a strongarteriolar vasodilator in rats.
-40-
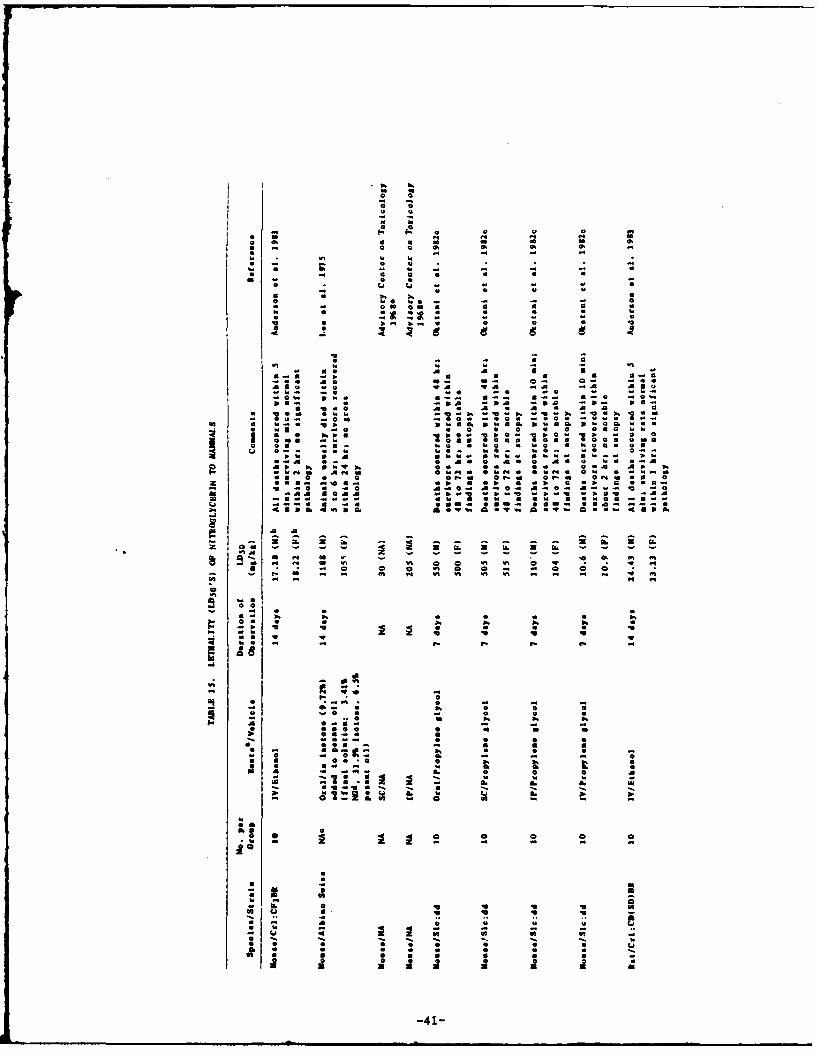
a A
v -I
a A
01 a-I. 0 1 ' 0 0o~~I 0.U o a
a.0 0-.- -. 1 -0
* .014 .4 14
0 93
00 0 - - -Po.
* - a a S 0 5
- - O W - 4 1 - 03
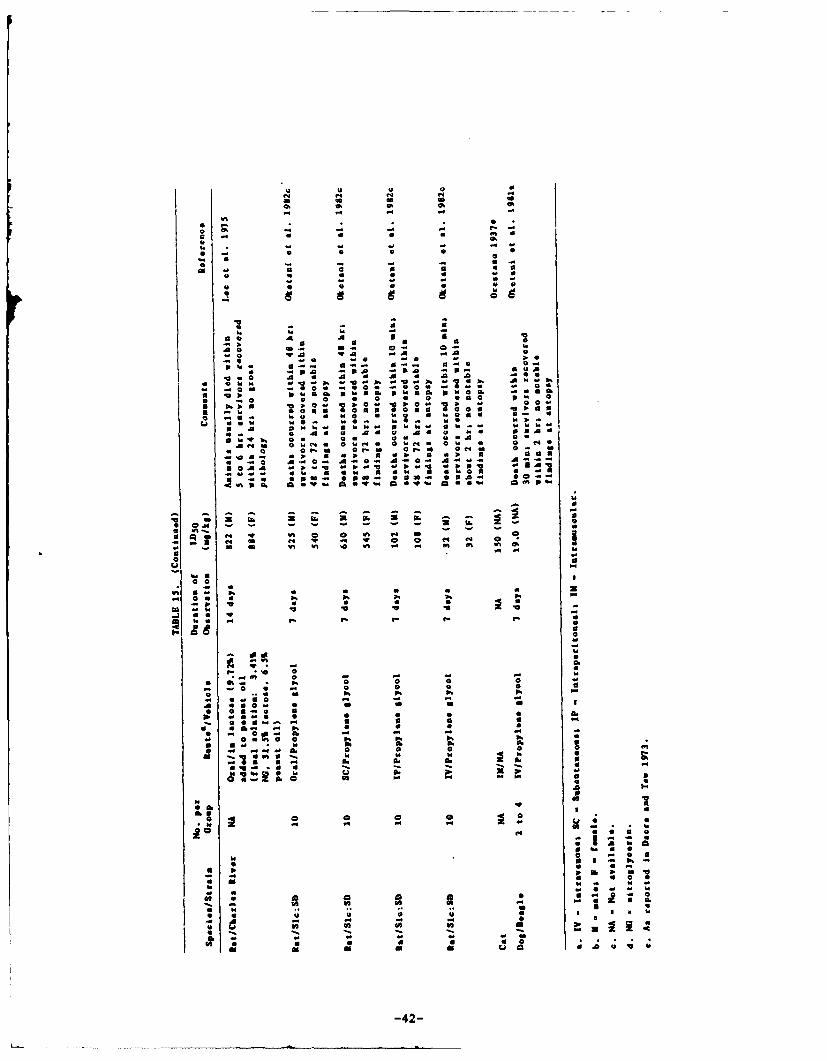
g UUN hN
a Ow -0 - Ow - On
0 A A 0 ka a
I. t- 0 - e4 -
*a a A'N A 0
adU a 1. a0 "d0 a-o0 g a
* 0 -O a0 1" a a a to
a. a A b Uq in ef
-~ a a a a 0
0 s as - a
a. -a 6
a a P. 3 5 U
00 .* a OO 06 e 0
U W N k bp1U 14&.,
a Ak o-1
14 4 ~ 1
a~ ~~~~~ 0 O A o -
-42-
Kypson and Bait (1971) injected groups of seven albino rabbitsintraperitoneally with 0, 40, or 100 gg/kg of nitroglycerin. Adminis-tration of 40 mg/kg caused a significant increase in plasma lactate(P < 0.02), plasma free fatty acids (P < 0.05), and plasma glycerol(P < 0.05). The same parameters, as well as plasma pyruvate, were sig-nificantly increased (P < 0.005) after the administration of 100 .g/kg.Based on their results, the authors suggested that nitroglycerin mayincrease lipolysis and glycolysis.
4.2.2 Huma" Studies
Changes in the cardiovascular system of humans following acuteexposure to nitroglycerin have been reported. As in animal studies,human studies have shown that nitroglycerin is a vasodilator.Blumenthal et al. (1977) observed an increase in the pulse rate and adecrease in the mean arterial pressure after a single administration ofnitroglycerin sublingually (0.3 mg), orally (6.5 mg sustained releasedcapsule), and dermally (2 percent ointment) to a healthy human volun-
teer. The following effects have been observed after a single sub-lingual administration of 0.6 mg of nitroglycerin to healthy humanvolunteers: increased heart rate (Armstrong et al. 1979; Brachfeld etal. 1959; Kikendall and Mellow 1980; Wei and Reid 1979); decreased bloodpressure (Armstrong et al. 1979; Brachfeld et al. 1959; Wei and Reid1979); reduction in esophageal sphincter pressure (Kikendall and Mellow1980); increased myocardial oxygen consumption and increased coronary
blood flow mediated by lower vascular resistance (Brachfeld et al.1959); and fall in myocardial efficiency (Brachfeld et al. 1959).Armstrong et al. (1979) and Wei and Reid (1979) observed falls in sys-tolic blood pressure but not in diastolic blood pressure following sub-
lingual administration of 0.6 mg of nitroglycerin.
Application of 2 percent nitroglycerin to the skin of normal humanvolunteers has been reported to decrease systolic and diastolic bloodpressure and increase heart rate (Magometschnigg et al. 1983) but has noeffect on lower esophageal sphincter pressure (Kikendall and Mellow
1980). Trainor and Jones (1966) reported that exposure to nitroglycerinin the atmosphere at a concentration of 0.5 or 0.7 mg/mS for 25 mincauses headaches and decreases blood pressure.
4.3 SUBCHRONIC AND CHRONIC TOXICITY
4.3.1 ma Studi
Ellis et al. (1984) gave groups of beagle dogs, consisting of twomales and two females each, nitroglycerin in capsules at concentrationsof 25, 50, 100, or 200 mg/kg/day for five days. the authors did not
" .cate that they had used a control group. A dose-response rela-tionship in peak level and duration of methemoglobinemia was observed.In animals given up to 100 mg/kg/day the methemoglobin levels returnedto zero within 24 hr. Adverse clinical effects were not observed at thetwo lowest doses. At the two highest doses, cyanosis was observedwithin 2 to 3 hr after each dose and lasted for several hours. At thehighest concentration the dogs became less active.
-43-
Anderson et al. (1983) studied the effects of two weeks of exposureof Cr1:CD (SD)ER rats and beagle dogs to nitrostat, a stabilized form ofnitroglycerin. [According to the Physicians Dejk Reterence (1983), eachmilliliter of nitrostat consists of 0.8 mg nitroglycerin with citric
acid and sodium citrate as buffers, and 5 percent alcohol in water.]
Groups of ten male and ten female rats were given daily iv injections ofnitrostat at concentrations of 2.5, 5, or 10 mg/kg/day, and groups oftwo male and two female dogs were given 1 or 3 mg/kg/day. Both vehicle(5 percent aqueous ethanol) and untreated control groups were used. Ata concentration of 10 mg/kg two rats died for reasons the authors couldnot determine. A reduction in body weight and food consumption wasobserved in treated and vehicle control groups, but no dose-responserelationship was found. No significant changes were observed in
biochemical, hematological, and urinalysis parameters or organ weightsand organ weight-to-body weight ratios. The authors also observed nogross or microscopic changes in the tissues.
Oketani et al. (1982b) gave groups of ten male and ten femaleSlc:SD rats daily ip injections of nitroglycerin at concentrations of 1,5, 25, or 50 mg/kg for one month. A control group received only the
vehicle, propylene glycol. At 50 mg/kg the authors frequently observedtonic convulsions, Straub tail response, and ataxic gait; two of tenmales died of dyspnea toward the end of the exposure period. Slighttransient convulsions or sedation was observed in some animals exposedto 5 and 25 mg/kg. No adverse effects were observed in animals exposedto 1 mg/kg, and no changes were observed in any group in body weight,food and water consumption, urinalysis, hematology, serum biochemistry,or histopathology.
The subchronic toxicity of nitroglycerin to beagle dogs was studiedby Oketani et al. (1982a). Groups of three male and three female dogswere given nitroglycerin iv in concentrations of 1, 2.5, or 5 mg/kg/day
for one month, and two control groups received either saline or pro-pylene glycol (vehicle). At the highest concentration, the animals fre-quently exhibited tonic convulsions, eye hyperemia, lying down, and uri-nary and rectal incontinence, but these effects lasted no more than 30min. Slight transient convulsions or tremors were observed in the groupthat had received 2.5 mg/kg. Adverse effects were not observed in the1-mg/kg exposure group, and no changes were observed in any group inbody weight, food and water consumption, urinalysis, hematology, serumbiochemistry, or histopathology.
Ellis et al. (1984) studied the subchronic effects of nitroglycerin
to beagle dogs, CD rats, and CD-1 mice. Groups of four male and fourfemale dogs were given nitroglycerin orally at concentrations of 0,0.01, 0.1, or 1 mg/kg/day in capsules for three weeks; then, becausethere were no observable adverse effects, the concentrations of nitro-glycerin were increased to 0.05, 0.5, or 5 mg/kg/day at the start of thefourth week and were continued through the thirteenth week. Groups ofsix male and six female rats were given nitroglycerin in their diets atconcentrations of 0, 0.001, 0.01, or 0.1 percent for four weeks and thenincreased to 0.005, 0.05, or 0.5 percent for the remainder of the 13-
week exposure period due to the absence of adverse effects. Mice were
-44-
treated in the same manner as the rats except that the increased doseswere given at the start of the third week. The estimated daily intake
of nitroglycerin by rats was 0.8, 6, and 59 mg/kg for males and 0.9,6.4, and 59 mg/kg for females exposed to 0.001, 0.01, and 0.1 percent,respectively; for exposures to 0.005, 0.05, and 0.5 percent the estima-ted daily intake was 2.6, 24.5, and 230 mg/kg for males and 3.1, 26.5,and 234 mg/kg for females, respectively. The estimated daily intake ofnitroglycerin by mice given 0.001, 0.01, and 0.1 percent was 1.3, 11.5,and 107 mg/kg for males and 1.3, 10.9, and 95 mg/kg for females, respec-tively; for exposures to 0.005, 0.05, and 0.5 percent the estimateddaily intake was 6.4, 60.2, and 608 mg/kg for males and 6.9, 58.7, and561 mg/kg for females, respectively.
Ellis et al. (1984) observed no adverse effects in dogs at the endof the 13-week exposure period. At the highest concentration, rats werefound to have a lower consumption of food and a lower weight gain.Blood tests, necropsy, and histopathology of rats showed no significantdifference from controls. Some mice exhibited mild to moderateextramedullary hematopoiesis in the liver and/or spleen. but no dose-response relationship was observed.
In an additional subchronic study, Ellis et al. (1984) exposed agroup of three male and three female CD rats to a diet containing 2.5percent nitroglycerin for 13 weeks. A control group consisting of fourmale and four female rats was fed the basal diet. The estimated averagedaily intake of nitroglycerin was 1406 and 1416 mg/kg/day for males andfemales, respectively. At the end of the exposure period, the authors
observed a significant (P < 0.05) increase in erythrocytes, reticulo-cytes, hematocrit, hemoglobin concentration, and alkaline phosphatase,and a decrease in fasting blood glucose of the exposed animals. Histo-pathological examination revealed the presence of pigment deposits inthe liver and spleen and moderate to severe testicular degenerationand/or atrophy with severe to complete aspermatogenesis.
Ellis et al. (1978a, 1984) studied the chronic toxicity of nitro-glycerin to CD rats, CD-1 mice, and beagle dogs. Groups of 38 male and38 female rats and 58 male and 58 female mice were given a diet con-taining 0, 0.01, 0.1, or 1 percent nitroglycerin for two years. Thecalculated daily intake of nitroglycerin by male and female rats was3.04 and 3.99 mg/kg, respectively, for the low dose; 31.5 and 38.1
mg/kg, respectively, for the middle dose; and 363 and 434 mg/kg, respec-tively, for the high dose. The calculated da.ly intake of nitroglycerinby male and female mice was 11.1 and 9.72 mg/kg, respectively, for the
low dose; 114.6 and 96.4 mg/kg, respectively, for the middle dose; and1022 and 1058 mg/kg, respectively, for the high dose. Groups of sixmale and six female beagle dogs were administered nitroglycerin capsulescontaining 0, 1, 5, or 25 mg/kg daily for one year.
The only effect observed in dogs during the 12-month exposureperiod was an occasional dose-related occurrence of methemoglobinemia;the concentration of methemoglobin was usually less than 3 percent(Ellis et al. 1978a, 1984).
-45-
After two years of exposure, body weight of rats exp'sed to 1.0percent nitroglycerin was considerably lower than that of either thecontrols or the 0.01 and 0.1 percent exposure groups; control weightswere about 800 and 500 g for males and females, respectively, andweights of males and females exposed to 1.0 percent nitroglycerin were600 and 300 g, respectively (Ellis et al. 1978a, 1984). After threemonths of exposure to 1.0 percent nitroglycerin, the authors observeddiscoloration of the skin and fur, methemoglobinemia, reticulocytosis,and an increased erythrocyte count, hematocrit, and hemoglobin concen-tration; total hemoglobin typically consisted of 10 to 30 percentmethemoglobin. After 12 months of exposure to 1.0 percent nitrogly-cerin, erythrocyte counts were ncrmal, but hemoglobinemia persisted.Enlarged livers were also observed at this same time and concentration,and all but two of the rats in this group had cholangiofibrosis, proli-feration of bile ducts, and fibrous tissue of the liver. After twoyears of exposure to 1.0 percent nitroglycerin, methemoglobinemia haddisappeared, but elevated levels of serum glutamic-oxaloacetic transam-inase, serum glutamic-pyruvic transaminase, and alkaline phosphataselevels were observed in males. In addition, high-dose females werefound to live considerably longer than controls (about 25 percent offemales treated with 1.0 percent were dead at 24 months versus about 60percent of the controls). No significant hematological effects wereobserved in rats exposed for two years to nitroglycerin at concentra-tions of 0.01 or 0.1 percent.
After 12 months of exposure to 1.0 percent nitroglycerin, mice werefound to have compensated anemia and an elevated reticulocyte countaccompanied by Heinz bodies (Ellis et al. 1979, 1984). Methemoglo-binemia occurred only in males exposed to 1.0 percent nitroglycerin.Also at 12 months, most animals exposed to 1.0 percent and some exposedto 0.1 percent nitroglycerin had intracellular granules in the liverwith lesser amounts in the spleen and/or kidneys. Body weights of miceexposed for two years to 1.0 percent nitroglycerin were considerablylower than those of controls. At the end of the two-year exposureperiod, no significant increases were observed in unscheduled deaths,although a slight increase was observed in the groups exposed to 1.0percent nitroglycerin. Hematological parameters after two years weresimilar to those observed after 12 months.
Suzuki et al. (1975) gave groups of C57BL/61ms mice, consisting ofabout 50 animals of each sex, nitroglycerin in ther drinking water for18 months at concentrations estimated to be 0, 1.5, or 6.2 mg/kg/day,and for 12 months at an estimated concentration of 58.1 mg/kg/day. Atthe end of the exposure periods, body weights of exposure groups did notappear to be substantially different from those of the control group.Nontumorous changes, including inflammations, degenerative changes, andcytological changes in hepatic cells, were similar to those observed incontrol animals.
4.3.2 Hun Stuio
Several studies and reviews have been published concerning thechronic toxic effects of nitroglycerin to humans (e.g. 1. AM. a.
-46-
Assoc. 1898; Munch et al. 1965; Lund et al. 1968; NIOSH 1978). Expo-sures to nitroglycerin in industrial situations are frequently associ-ated with exposures to nitroglycol (e.g., such as during the productionof explosives), therefore, establishment of effects due directly toexposure to nitroglycerin is difficult (Lund et al. 1968; NIOSH 1978).Hleadache and fatigue are frequently observed in long-term employees ofthe explosives industry (Stokinger 1982). Other symptoms observed lessfrequently include nausea, vomiting, dyspnea, alcohol intolerance, heartpalpitation, and angina pectoris (NIOSH 1978; Stokinger 1982). Availa-ble information indicates that continued exposure to nitroglycerin or acombination of nitroglycerin and nitroglycol results in increasingtolerance (Lund et al. 1968; Munch et al. 1965; NIOSH 1978). Initialsymptoms of exposure may include headaches, nausea, dizziness, heartpalpitations, sweating, fatigue, and diffuse pains which tend to eventu-ally become milder or disappear. After several years of exposure, chestpains have been observed within 24 to 72 hr after interruption of expo-sure but disappear after exposure starts again (Lund et al. 1968).Long-term employment in the explosives industry has been associated withnonatheromatous ischemic heart disease (Lange et al. 1972). Suddendeaths of a few employees of the explosives industry have been observedone to three days after cessation of exposure (Carmichael and Lichen1963; Hogstedt and Axelson 1977; NIOSH 1978) and have been attributedprimarily to nitroglycol (Hogstedt and Davidsson 1980).
Reeve et al. (1983) recently presented the results of a mortalitystudy they conducted on nitroglycerin-exposed workers at a munitionsplant in Virginia. They obtained records on 5,668 white male employeeswho had worked at the plant during the period 1949 through 1977; of thisnumber, 13 percent were dead, 83 percent living, and 4 percent lost tofollow-up. Using mortality rates of the general population of the Uni-ted States, they found no significant increases in deaths due todiseases of the nervous, cardiovascular, respiratory, or digestive sys-tems. More in-depth examination of their data revealed that a slightelevation in the number of deaths due to ischemic heart disease hadoccurred, but the increase was not significant. When they further brokethe records down into age categories of ten-year intervals, an increasein deaths due to ischemic heart disease was observed in four of seven ofthe categories, but was significant (P < 0.05) in only the 40 to 49 agegroup. The authors indicated that their results were suggestive of anassociation between nitroglycerin exposure and cardiovascular disease.Additional studies are planned by Stayner et al. (1985) of the same mun-itions plant to test the hypothesis that exposure to nitroglycerin isassociated with an increased risk of dying from ischemic heart diseaseand to determine whether any observed association exists separately fromthe risk of dying from acute withdrawal from nitroglycerin exposure andother known medical risk factors. In addition, they will try to deter-mine if exposure to other nitrated compounds used in the manufacture ofpropellants is associated with an increased risk of ischemic heartdisease and whether there is an interaction between these exposures andnitroglycerin.
-47-
4.4 GENOTOXICITY
In vivo and in vitro studies using mammalian and bacterial cellsystems have failed to show that nitroglycerin is a genotoxin. Lee et
al. (1977) studied the cytogenetic effects of nitroglycerin on somaticcell chromosomes from lymphocyte and kidney tissue cultures obtained
from beagle dogs and CD rats. Groups of three to five male and female
rats were fed an average of 59 to 59.3 mg/kg/day nitroglycerin for 5weeks and then 229.5 to 233.8 mg/kg/day for an additional 8 weeks.Similarly, groups of one to two male and female dogs were fed an averageof 1 mg/kg/day nitroglycerin for 4 weeks and then 5 mg/kg/day for anadditional 9 weeks. For both species, lymphocyte and kidney tissueswere obtained after 4 and 13 weeks and cultured. Examination of cells
from the cultures did not show any apparent changes in the chromosomefrequency distribution, number of tetraploids, chromatid breaks, ortranslocations. Although these results suggest that nitroglycerin isnot genotoxic, the use of greater numbers of animals would have improvedthe validity of the study.
Ellis et al. (1978a) studied the cytogenetic effects of nitrogly-cerin to bone marrow cells and kidney tissue cultures obtained from CDrats. Groups of four to six animals were given nitroglycerin in theirdiet for two years at a concentration of 0 or 1 percent. Tissues andcells for the cultures were obtained at the end of the two-year exposureperiod. The estimated daily intake of nitroglycerin was 363 and 434mg/kg/day for males and females, respectively. No significant differen-ces were found between the control and exposure groups; however, aslight increase in the number of chromatid breaks and gaps was observedin kidney cultures (1.6 breaks and gaps per 50 cells for controls versus2.9 per 50 cells for the exposed group).
Lee et al. (1977) studied the mutagenic effects of nitroglycerin onwild type Chinese Hamster Ovary (CHO-Kl) cells in vitro. The mutageni-city of nitroglycerin was measured relative to ethyl methane sulfonate, aknown mutagen. Nitroglycerin at concentrations of 50 and 144.8 pg/mresulted in a survival rate of 35 and 1 percent, respectively, and amutation frequency of zero at both concentrations. In contrast, expo-sure to ethyl methanesulfonate at a concentration of 124 pg/mL resultedin a survival of 15 percent and a mutation frequency of 28.0 x 10⁻⁶,thus indicating that nitroglycerin was not mutagenic.
Ellis et al. (1978a) also performed a dominant lethal assay withCharles River CD rats. Groups consisting of ten male animals were givennitroglycerin in their food for 13 weeks at concentrations of 0, 0.01,0.1, or 1 percent (estimated intake of 0, 3.04, 31.5, and 363 mg/kg/day,respectively); each male was then mated with two virgin females.Females were sacrificed at mid-term of pregnancy, and the following datawere collected: number of fertile males per number of males treated,number of pregnant females per number of mated females, number of cor-pora lutea per pregnant female, and the number of total implants, deadimplants, and live implants per pregnant female. The authors observedno dominant lethal mutations, no evidence of adverse effects on malefertility, and no preimplantation and postimplantation losses.
-48-
Kononova et al. (1972) studied the mutagenic potential of nitrogly-cerin on the extracellular bacteriophage T4B of * .heichiA coli.Treatment of bacteriophages with a 0.084 M solution of nitroglycerin forup to 6 hr did not increase the frequency of mutations in bacteriophagesas compared to a control but did affect their survival rate (30 and 16percent at 3 and 6 hr, respectively, for nitroglycerin versus 100 per-cent at 3 and 6 hr for the control).
The mutagenic activity of nitroglycerin and several of its metabol-ites (1,3- and 1,2-dinitroglycerin and 1- and 2-mononitroglycerin) wastested by Ellis et al. (1978b) with the Ames assay at concentrations of10, 100, 300, and 1000 gg per plate. The following histidine-requiringSalmnla tj-phimurxiu tester strains were used: TA-1535, TA-1537, TA-1538, TA-98, and TA-100. No mutagenic activity was observed with 1,3-dinitroglycerin or 1-mononitroglycerin. At concentrations of 10 and 30jg per plate, 1,2-dinitroglycerin caused a significant (level of signi-ficance not given) increase in frame-shift mutations without activation.Weak mutagenic activity was exhibited by both nitroglycerin and 2-mononitroglycerin, both requiring concentrations of 1000 jg per plateand metabolic activation; 2-mononitroglycerin caused only base pair sub-stitution mutations, while nitroglycerin caused both base-pair substitu-tion and frame-shift mutations.
Kaplan et al. (1982) also studied the mutagenic potential of 1-mononitroglycerin under the conditions of the Ames assay, and, likeEllis et al. (1978b), they observed no mutagenic activity.
4.5 DEVELOPMENTAL/REPRODUCTIVE TOXICITY
4.5.1 Ani-a Studios
Developmental toxicity studies have failed to show that nitrogly-cerin is a teratogen (e.g., Ellis et al. 1978a; Oketani et al. 1981b;Oketani et. al. 1981c), and reproductive effects have been observedonly at high concentrations (Ellis et al. 1978a, 1984). Ellis et al.(1978a, 1984) fed a group of three male and three female CD rats 2.5percent nitroglycerin for 13 weeks, and a group consisting of four maleand four female rats was fed a standard diet to serve as a control. Theestimated average daily consumption of nitroglycerin by males andfemales was 1406 and 1416 mg/kg, respectively. At the end of the expo-sure period Ellis at al. observed moderate to severe testicular atrophyand/or degeneration, and severe to complete aspermatogenesis. Noeffects to the female reproductive system were reported.
Ellis et al. (1978a) conducted a three-generation reproductivestudy with CD rats. Each generation was given a diet containing 0,0.01, 0.1, or 1 percent nitroglycerin. The parental generation (FO)consisted of 10 male and 20 female animals per group, and the later gen-erations consisted of 10 to 12 pairs per group. Ellis et al. observedno significant effects on reproduction at the low and middle concentra-tions. The highest concentration did not significantly affect fertilityof the Fo generation, but did affect fertility of the succeeding genera-tions; only three litters (F2a) were produced by the Fl generation.
-49-
None of the Fl dams that littered with the first mating produced asecond litter (F2b). Two matings of the F2a litters produced only onelitter (F3). Mating of 14 F2a females with control males resulted in 13pregnancies, thus showing that the F2a males were infertile. Males inthe F2a generation had very small testes, and females exhibited a highincidence of vaginal plugs without sperm. Microscopic examination of
the animals showed severe aspermatogenesis and mildly to moderately
increased interstitial tissue in the testes. Reproductive parameters,
including litter size, live-born index, birth weight, viability and lac-
tation indexes, and weaning weight, were significantly reduced (P <
0.05) in the high dose Fla litters, but sex ratios were not signifi-cantly affected in this group. In the high dose Flb litters, birthweight, viability index, and weight at weaning were significantly (P <0.05) reduced; the lactation index was also reduced but not signifi-cantly. In the high dose F2a litters, litter size and birth weight weresignificantly (P < 0.05) reduced. All other parameters in this groupwere lower than those observed in controls, but the differences were notstatistically significant. The authors thought that the toxic effectsseen in the reproductive parameters of the Fl and F2 litters were par-tially due to the poor nutritional status of the dams. The authorsindicated that the reduction in litter size of the high-dose Fla groupwas suggestive of mutagenic and/or teratogenic effects; however, intheir cytogenetic and dominant lethal mutation studies [see studies byEllis et al (1978a) in Section 4.6], they observed no genotoxic effects.Results of their teratogenicity study (Ellis et al. 1978a), which invol-ved a third mating of the females of the F0 generation, did not show any
significant teratogenic effects. However, they observed diaphragmatichernias in 4 of 19 litters in the high-dose group and none in the othergroups. Although the increase in hernias was not found to be statisti-cally significant, the authors suggested that this could have been thecause of the reduced litter sizes found in the study on reproductiveeffects. Also observed was a significant (P ( 0.05) increase in theincidence of absent or incompletely ossified hyoid bone; however, theauthors pointed out that skeletal anomalies are indicative of delayeddevelopment and not the teratogenic potential of a chemical.
Oketani et al. (1981b) studied the teratogenic and embroytoxiceffects of nitroglycerin to Japanese albino rabbits. Groups consistingof ten female animals were given nitroglycerin iv in doses of 0, 0.5, 1,or 4 mg/kg/day from day 6 to day 18 of gestation. They observed no dif-ference between the exposed and control groups in the incidence of tera-togenic effects based on the incidence of external,visceral. andskeletal abnormalities, nor did they observe any signs of embryotoxicitybased on the number of corpora lutes, implantations, dead or livefetuses, sex ratio, body weight of live fetuses, or placental weight.
In a study on the reproductive and teratogenic effects of nitrogly-cerin to CD-Slc rats, Oketani et al. (1981c) gave groups of 19 to 20pregnant rats nitroglycerin intraperitoneally in doses of 0, 1, 10, or20 mg/kg/day from day 7 to day 17 of gestation. Compared to controls,nitroglycerin had no significant effect on delivery, gestation period,lactation, nursing instinct, fetal and postnatal development, or fertil-ity of offspring. Also, evidence of teratogenicity was not found in anyof the offspring (Fl and F2).
-s0-
In another study on the reproductive effects of nitroglycerin onSD-Slc rats, Oketani et al. (1981d) administered the chemical on day 17of gestation to day 21 of lactation. Gronps of 17 to 20 rats were givennitroglycerin daily in doses of 0, 1, 10, or 20 mg/kg ip. They observedno significant effects on delivery, gestation period, lactation, nursinginstinct, growth, development, or fertility of offspring, nor any evi-dence of teratogenic effects.
In a study primarily on the effects of nitroglycerin on the fertil-ity of SD-Slc rats, Oketani et al. (1981e) administered the compound ivat doses of 0, 1, 10, or 20 mg/kg/day to groups of 20 male animals for63 days prior to mating and to groups of 20 females 14 days prior tomating and up to day 7 of gestation. No significant effects were obser-ved on fertility based on the number of male rats copulating withtreated and untreated females, percentage of pregnant rats, or the dura-tion of pairing until mating. They also observed no significant effectson indexes of teratogenicity and embryotoxicity.
4.5.2 Aiua StI.d.es
Data on the effects of nitroglycerin on human reproduction are lim-ited and essentially anecdotal. A 1898 report described the effects ofnitroglycerin on the wives of employees of a plant manufacturing thecompound (L. A&. Med. Assoc. 1898). These women occupied the samesleeping quarters as their husbands and laundered their husbands"clothes. Symptoms experienced by the'wives were uterine malfunctionsand increased menstrual bleeding. Fewer children were born, and theywere often premature. The surviving children were not as strong asother children, were often cyanotic, and were not as resistant todisease. Laws (1910) described the symptoms experienced by workersengaged in the manufacture of nitroglycerin, including disturbances ofthe genitourinary system. Be attributed marked aphrodisiac effects tothe compound and stated that most "nitroglycerin men" had large fami-lies.
Mudd (1977) used the vasodilating effects of nitroglycerin to diag-
nose and treat atherosclerotic impotence. A 56-year old man with knownpsychogenic impotence was given 0.3 mg of nitroglycerin sublingually andresponded quickly and favorably to treatment with associated changes in
penile volume, temperature, and sensation.
4.6 ONCOGENICITY
4.6.1 AnimalSties
Three studies were found concerning the oncogenic potential ofnitroglycerin in laboratory animals. From the results of their studies,Suzuki et al. (1975) and Takayama (1975) concluded that nitroglycerin isnot an oncogen. Ellis et al. (1978a, 1984) reported an increase in theoccurrence of hepatocellular carcinomas and interstitial cell tumors ofthe testis in rats but not in mice or dogs.
-51-
In their study, Ellis et al. (1978a, 1984) gave groups of 38 male
and 38 female CD rats and 58 male and 58 female CD-1 mice a diet con-taining 0, 0.01, 0.1, or 1 percent nitroglycerin for two years. Groups
of 6 male and 6 female beagle dogs were given capsules orally which con-tained 0, 1, 5, or 25 mg/kg/day nitroglycerin for one year. The calcu-lated daily intake of nitroglycerin by male and female rats was 3.04 and3.99 mg/kg. respectively, for the low dose, 31.5 and 38.1 mg/kg, respec-tively, for the middle dose, and 363 and 434 mg/kg, respectively, forthe high dose. The calculated daily intake of nitroglycerin by male andfemale mice was 11.1 and 9.72 mg/kg, respectively, for the low dose,114.6 and 96.4 mg/kg, respectively, for the middle dose, and 1022 and1058 mg/kg, respectively, for the high dose.
Ellis et al. (1978a, 1984) observed no signs of oncogenicity ineither mice or dogs at the end of the exposure period; however, resultsfrom the one-year exposure study of dogs may not be representative ofresults from lifetime exposures of this species. In rats, after thefirst 12 months of exposure to nitroglycerin, the authors observed whatthey described as progressive signs of hepatocellular carcinomas inclu-ding areas and foci of hepatocellular alteration in all dose groups;neoplastic nodules in one middle-dose male, three high-dose males, andone high-dose female; and the occurrence of an hepatocellular carcinomain one high-dose male. At the end of the two-year exposure period,hepatocellular carcinomas were observed in 13 of 21 males and 11 of 25females of the 1 percent exposure group; 3 of 26 males and 2 of 28females of the 0.1 percent expqsure group; 0 of 28 males and 0 of 32females of the 0.01 percent exposure group; and 0 of 24 males and 0 of29 females of the control group. Also at the end of the two-year expo-sure period, neoplastic nodules were observed in 2 of 21 males and 5 of25 females of the 1 percent exposure group; 1 of 26 males and 1 of 28females of the 0.1 percent exposure group; 0 of 28 males and 0 of 32females of the 0.01 percent exposure group; and 1 of 24 males and 0 of29 females of the control group. In addition, 11 of 21 males exposed to1.0 percent nitroglycerin had interstitial cell tumors in one or bothtestes. The incidence of tumors in the testes of the other two exposuregroups was similar to that of the controls (4 to 11 percent). On theother hand, female rats exposed to 1.0 percent nitroglycerin exhibiteddecreased incidences of mammary gland tumors and pituitary chromophobe
adenomas.
Suzuki et al. (1.95) studied the oncogenic potential of nitrogly-cerin in C57BL/61ms mice exposed to the chemical for ip to 18 months.Groups of mice consisting of at least 54 males and 49 females wereexposed to nitroglycerin in their drinking water at an average concen-tration of 0, 1.5, or 6.2 mg/kg/day for 18 months. Another group ofmice, consisting of 49 males and 45 females was exposed for 12 months tonitroglycerin in their drinking water at an average concentration of58.1 mg/kS/day. Based on their results, the authors concluded that thenumber and incidence of tumor-bearing animals, the number and incidenceof histologically defined tumors, the number of tumors per animal, andthe pattern of the tumors in the dosed groups were comparable with thoseof the control group. However, gross examination of the animalsrevealed that 5 of 34 female mice in the high-dose group had an
-52-
unspecified type of pituitary tumor. Histological examination of allgroups of animals showed what appeared to be a dose-related increase inthe incidence of pituitary adenomas; a total of 6, 3, 1, and 1 pituitaryadenomas was observed in the high, middle, low, and control groups,respectively. Using an exact analysis of a contingency table, Ellis etal. (1984) reanalyzed the results that Suzuki et al. had obtained fromtheir gross examination of the pituitary gland and concluded that therewas a significant (P = 0.006) increase in the incidence of pituitarytumors at the highest concentration.
Takayama (1975) gave a group of Sprague-Dawley rats consisting of
50 males and 48 females a 0.03 percent concentration of nitroglycerin intheir drinking water for 10 months and then gave tap water for an addi-tional 8 months. A control group consisting of 53 male and 49 femalerats was given tap water for 18 months. The estimated daily intake ofnitroglycerin was 31 mg/kg. At the end of the 18-month period, theauthors observed no remarkable histopathological changes and concludedthat under their experimental conditions, nitroglycerin was notoncogenic. However, the exposure period used by these authors is notrepresentative of a lifetime exposure for this species (e.g., Ross et
al. 1980).
4.6.2 uMRZLI S tud ieas
Reeve et al. (1983) conducted a mortality study of workers exposedto. nitroglycerin at a munitions plant in Virginia. They examined healthrecords of 5,668 white males who had worked in the nitroglycerin areaduring some period between 1949 and 1977. They found no increases indeaths due to malignant neoplasms; in fact, they found that the numberof deaths due to malignant neoplasms was significantly lower than theexpected number in the general United States population.
Fogstedt and Andersson (1979) conducted an epidemiological study ofemployees of a Swedish dynamite plant and examined the incidence oftumors as a possible cause for excess mortality in the dynamite indus-try. The primary components of dynamite are nitroglycerin and nitro-glycol, and according to the authors they exist in dynamite in a 1:1ratio. The authors also indicated that between these two chemicals,nitroglycol is the predominant chemical in the air due to its highervolatility. Death certificates were collected on employees who had diedbetween 1951 and 1977, and the official underlying cause of death wasused and classified according to the 1965 version of the InternationalClassification of Diseases. The final group of subjects that they choseconsisted of 143 male employees who had worked at least one year since1927 and who had died since 1951. This group consisted of 88 exposedand 55 unexposed employees. The exposed group consisted of thoseemployees with Jobs that were somehow directly related to the handlingor production of dynamite and/or to the handling of its major com-ponents. The unexposed group consisted of those employees that did nothandle and/or produce dynamite or handle its major components. Thecause of death was broken down into the following categories: alltumors, circulatory diseases, and other causes. The number of observeddeaths was then compared with the national average. In both the exposed
-53-
and unexposed groups, the number of deaths due to tumors was less than
the number expected. The authors also looked at a subgroup of the
exposed group that consisted of those employees with at least 10 years
of exposure. In those employees who died between 1951 and 1964, thenumber of deaths due to tumors was one and the expected number was 1.3,
while the number of observed and expected deaths between 1965 and 1977
was two and 1.7, respectively. Thus, long-term exposure to nitrogly-cerin and/or nitroglycol at the levels occurring in this dynamite plantdoes not appear to significantly increase the incidence of cancer.
4.7 SUMMARY
Studies on the pharmacokinetics of nitroglycerin in laboratoryanimals and humans indicate that it is rapidly and widely distributed,and rapidly absorbed, metabolized, and eliminated. The disposition rateis influenced by the route of administration, with more rapid disposi-tion occurring following iv and sublingual exposures than after oral ordermal exposures. Metabolism of the compound appears to occur in bothhepatic and extrahepatic tissues. Metabolism is via stepwise denitrifi-cation with no preference for the primary or secondary nitrate group.Nitroglycerin is eliminated primarily in the urine and expired air.
Laboratory anaimal data on the acute toxicity of nitroglycerin indi-cate that it is moderately toxic. The toxicity of nitroglycerin dependsupon the route of administration and is most toxic when given iv andleast toxic when given orally. Little or no sex and species differenceshave been observed in the acute toxicity of this compound. Vasodilationand headaches have been observed in humans after sublingual administra-tion.
Short-term exposures (one month) of laboratory animals to nitrogly-cerin (2.5 mg/kg/day) have been found to cause slight transient toxiceffects such as tonic convulsions or tremors. Subohronic exposure (13weeks) to high concentrations of nitroglycerin has been found to reduceweight gain in rats (230 mg/kg/day), increase erythrocytes, reticulo-cytes, hematocrit, hemoglobin, and alkaline phosphatase, and decreasefasting blood glucose (1406 mg/kg/day).
Like subchronic exposure, chronic exposure of laboratory animals tonitroglycerin has been associated with hematological changes and reducedweight increases. Methemoglobinemia and reticulocytosis have beenobserved in mice and rats, increases in erythrocyte counts, hematocrit,and hemoglobin concentrations have been observed in mice, and compensa-ted anemia has been observed in rats after one to two years of dietaryexposure to 1.0 percent nitroglycerin (about 1022 mg/kg/day for mice and363 mg/kg/day in rats). Changes in the liver have also been observed inmice and rats at high concentrations including intracellular granulationin mice and enlarged livers, cholangiofibrosis, proliferation of thebile ducts, and fibrous tissue in the liver of rats. Long-term employ-ment of humans in industries producing nitroglycerin or using nitrogly-cerin in the production of explosives has been frequently associatedwith headaches, fatigue, and nausea. There is some evidence that long-term exposure to nitroglycerin and/or nitroglycol in the explosives
-54-

industry may cause an increase in death due to cardiovascular diseaseand also may be the cause of some isolated cases of sudden death.
In vivo genotoxicity studies have failed to demonstrate that nitro-glycerin is a genotoxin. Nitroglycerin is reportedly weakly mutagenicunder the conditions of the Ames assay. Of the metabolites of nitrogly-cerin studied for mutagenicity with the Ames assay, 1,2-dinitroglycerinhas shown significant mutagenic effects, 2-mononitroglycerin has shownweak mutagenic effects, and 1,3-dinitroglycerin and 1-mononitroglycerinhave shown no mutagenic effects. Developmental toxicity and reproduc-tive effects studies with laboratory animals have failed to demonstratethat nitroglycerin is a teratogen, but have shown that exposures to highconcentrations (360 mg/kg/day) may cause infertility in male rats, anddelayed development, as judged by incomplete ossification of the hyoidbone, in rats exposed prenatally.
A high incidence of hepatocellular carcinomas (52 percent) andinterstitial cell tumors of the testes (52 percent) has been observed inrats exposed to 1.0 percent (363 mg/kg/day) nitroglycerin for two years.An increased incidence of hepatocellular carcinomas (13 percent) hasalso been observed in rats given 0.1 percent nitroglycerin (31.5mg/kg/day) for two years. An increase in pituitary tumors (14 percent)has been observed in female mice exposed for one year to 58.1 mg/kg/day.Long-term exposure of humans employed in the explosives industry has notbeen associated with an increased incidence of cancer.
5. CRITERION FORMULAION
5.1 EXISTING GUIDELINES AND STANDARDS
The current Occupational Safety and Health Administration standardfor occupational exposure (TWA) to nitroglycerin is 2 mg/m 3 (skin) (0.2ppm), which is a ceiling limit (USOSHA 1983). The National Institutefor Occupational Safety and Health recommended an occupational exposurelimit of 0.1 mg/nM3 (0.01 ppm) measured as a ceiling concentration duringany 20-minute sampling period (NIOSH 1978). The American Conference ofGovernmental Industrial Hygenists recommended a threshold limit value(TLV) of 0.5 mg/m 3 (0.05 ppm) and a short-term exposure limit value(STEL) of 1.0 mg/M 3 (0.1 ppm) for skin (ACGIH 1981). An IDLH (concen-tration immediately dangerous to life or health) of 80 ppm (750 mg/ 3 )was given by the International Labour Office (1983).
5.2 OCCUPATIONAL EXPOSURE
Occupational exposure to nitroglycerin has been documented for anumber of years. Some of the early reports were of employees in theexplosives industry who handled nitroglycerin (L. An. ad.. Assoc. 898;Laws 1910). The employees frequently complained of severe headaches,nausea, and weakness. Headaches have been reported to occur in theexplosives industry when air concentrations of nitroglycerin were 0.5mg/= 3 . Long-term employment in the explosives industry, in which
-55-
exposures to nitroglycerin and/or nitroglycol have occurred, has been
associated with chest pains, nonatheromatous ischemic heart disease, and
sudden death two or three days after terminating exposure (Carmichaeland Lieben 1963; Nogstedt and Axelson 1977; Bogstedt and Andersson 1979;Lange et al. 1972; Lund et al. 1968). Bogstedt and Andersson (1979)examined the incidence of deaths occurring in employees of a dynamiteplant in Sweden from 1951 through 1977. They observed a slightly higherthan expected incidence of deaths over the national average, particu-larly from cardiovascular diseases. From 1965 through 1977 theincidence of death due to cardiovascular disease was significantlyhigher (P < 0.05) for men with at least one year of exposure to dynamitethan for the national average. They indicated that exposures in thisplant were due primarily to ni roglycerin and nitroglycol. Bogstedt andDavidsson (1980) performed an in-depth analysis of some short-term airsamples that had been taken from 1958 through 1978 in two dynamiteplants in Sweden. They estimated that the 8-hr time-weighted averageconcentrations for nitrate esters during this time period ranged from0.2 to 1.1 mg/m 3 .
More recently, Reeve et al. (1983) conducted an epidemiologicalstudy on nitroglycerin exposed employees of a munitions plant in Vir-
ginia. Based on records obtained on 5,668 white male employees that hadworked at the plant at some time between 1949 and 1977, and comparedwith the general population of the United States, they found no signifi-cant increase in deaths due to diseases of the nervous, cardiovascular,respiratory, or digestive systems. When they broke the data down intoage groups of ten-year intervals, a significant (P < 0.05) increase inthe incidence of deaths due to ischemic heart disease was found, thussuggesting an association between nitroglycerin exposure and cardiovas-cular disease. Additional studies are being conducted by Stayner et al.(1985) on the health effects of exposure to nitroglycerin and othernitrated compounds at this munitions plant.
5.3 PREVIOUSLY CALCULATED CRITERIA
Bentley et al. (1978) conducted an extensive study on both theacute and long-term toxicity of nitroglycerin to a wide variety offreshwater organisms. From an application factor calculated from
chronic to acute toxicity ratios and the lowest acute toxicity valuefrom their study, they calculated a water quality criterion of 0.01 mg/Lfor aquatic organisms. Sullivan et al. (1979) used the data from thestudy by Bentley et al. (1978) and calculated a water quality criterionfor aquatic organisms of 0.0072 mg/L, based on the procedure proposed bythe Environmental Protection Agency (USEPA) in 1978 (USEPA 1978, asreported in Sullivan et a1. 1979).
Ellis et al. (1978a) conducted a chronic toxicity study of nitro-glycerin with mice, rats, and dogs and found the compound to beoncogenic to rats at a 1 percent concentration. Based on the procedurerecommended by the EPA (USEPA 1979s, as reported in Ellis et al. 1978a)and the results 9f theAr study, llis et al. calculated human healthcriteria for 10- 0, 10-0, and 10- additional lifotime cancer risks of28.9, 2.8. and 0.29 pg/L, respectively. Using an updated version of
-56-
USEPA guidelines (USEPA 1979b, as reported by 3. Barkley, pars. comm.1982) and the data of Ellis at al 3 (1971a), Dacre (1980) recalculatedthe human health criteria for 10-, 10 , and 10- additional lifetimecancer risks and obtained estimates of 22.8, 2.28, and 0.23 gg/L,respectively.
5.4 AQUATIC CRITERIA
A summary of the USEPA's proposed methodology for the estimation ofwater quality criteria suitable for the protection of aquatic life andits uses is presented in Appendix A. The proposed criterion consists oftwo values, a Criterion Maximum Concentration (CMC) and a Criterion Con-tinuous Concentration (CCC) (Stephan at al. 1985). The CXC is equal toone-half the Final Acute Value, while the CCC is equal to the lowest ofthe Final Chronic Value, the Final Plant Value, or the Final ResidueValue.
Sufficient data were not available to calculate an aquatic cri-terion on nitroglycerin based on the USEPA guidelines (Stephen at al.1985); e.g., only six of the required eight families needed in calcula-ting a Final Acute Value were available, and nominal concentrations ofnitroglycerin were used in acute flow-through and chronic toxicity testsinstead of measured concentrations which are required for calculating aFinal Chronic Value. However, because some of the data generated bythese tests are uniform in their assessment of the degree of toxicity ofnitroglycerin, a tentative Final Acute Value was calculated using theUSEPA Guidelines.
A summary of the steps used in calculating the Final Acute Value is
presented in Table 16. As previously stated, only six of the requiredeight families necessary to calculate a Final Acute Value were availa-ble; a family from a phylum other than Arthropoda and Chordata and a
family in any order of insect or phylum not already represented were notavailable. However, acute loxicity data were available for eight fami-lies of aquatic test anima s (see Table 3 in Section 3.1), therefore,
the value for N (number of genera used to calculate a Final Acute Value)was taken to equal eight. A Final Acute Value of 1.7258 mg/L is estima-ted. It is reemphasized that this value is tentative because acute tox-
icity data did not meet all requirements of the USEPA Guidelines
(Stephan at al. 1985).
The Final Chronic Value may be calculate4 either in the same manneras the Final Acute Value or by dividing the Final Acute Value by the
Final Acute-Chronic ratio. In either case, calculation of a Final
Chronic Value requires toxicity values from acute and chronic flow-
through tests using measured concentrations for three species of organ-isms; in the case of chronic tests, if results are not available for
flow-through tests for daphnids, results from renewal tests are accepta-
ble. Results of life cycle or partial life cycle tests are preferred,
but early life stage tests may be used if results of the former tests
are not available. Results of both acute and chronic toxicity testswere available for four species; however, a Final Chronic Value was notcalculated for the following reasons: (1) Concentrations of nitro-
-57-
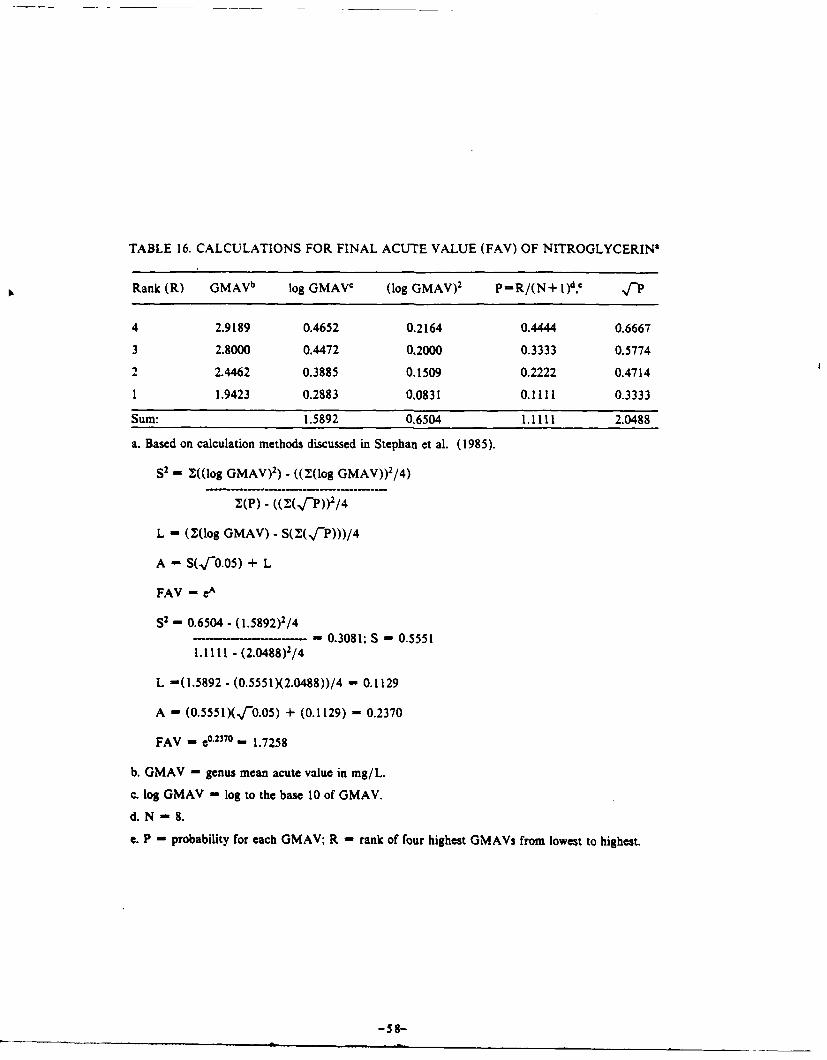
TABLE 16. CALCULATIONS FOR FINAL ACUTE VALUE (FAV) OF NITROGLYCERINa
Rank (R) GMAVb log GMAVc (log GMAV) 2 P=R/(N+ I)d,c ,fP
4 2.9189 0.4652 0.2164 0.4444 0.6667
3 2.8000 0.4472 0.2000 0.3333 0.5774
2 2.4462 0.3885 0.1509 0.2222 0.4714
1 1.9423 0.2883 0.0831 0.1111 0.3333
Sum: 1.5892 0.6504 1.1111 2.0488
a. Based on calculation methods discussed in Stephan et al. (1985).
S2 - Z((Iog GMAV) 2) - ((Z(log GMAV)) 2/4)
jCP)-_ ((,_C "fp))2/4
L - (M(log GMAV) -S(Z(f"P)))/4
A - S(,-0.05) + L
FAV - eA
S2 - 0.6504 - (1.5892)2/4- 0.3081; S - 0.5551
1.1111 - (2.0488)2/4
L -(1.5892 - (0.5551)(2.0488))/4 - 0.1129
A - (0.5551)(,f-0.05) + (0.1129) - 0.2370
FAV - e0 "2370 - 1.7258
b. GMAV - genus mean acute value in mg/L.
c. log GMAV - log to the base 10 of GMAV.
d. N 8.
e. P - probability for each GMAV; R - rank of four highest GMAVs from lowest to highest.
-58-
glycerin used in all tests were nominal, and current guidelines (Stephanet al. 1985) specify that concentrations should be measured; (2) Prob-lems were encountered with nitroglycerin coming out of solution and for-ming globules in the early life stage test for the fish Ictaslu.rxas. 2az.ttum; 3) Flow-through tests are required for all organisms with theexception of those using Dahnia; a renewal test procedure was used inthe chronic toxicity test for hirono Ientans; and (4) For Daphnia,current procedures for chronic toxicity tests (USEPA 1985) state that if"each control daphnid living 21 days produces an average of less than 60young," then the test is unacceptable; data in Table 8 clearly indicate
that young production of controls is extremely low and thus unaccepta-ble.
A Final Plant Value may be obtained from the lowest reported result
of a toxicity test on an important aquatic species; the concentration ofthe test material should be measured, and the end point should be biolo-gically important (Stephan et al. 1985). Based on a decrease in cellnumbers, a 96-hr EC50 of 0.4 mg/L has been estimated for the green alga.ugausaj.r capricornutum (Bentley et al. 1978); however, this value wasbased on nominal concentrations of nitroglycerin and the guidelinesstate that concentrations should be measured. Also, this value is a 50percent effective concentration, and, if the assumption is made that abiologically important end point is that end point at which only 5 per-cent or even 10 percent of the population is affected, the EC50 couldgreatly exceed a biologically important end point. Sullivan et al.(1979) reanalyzed the data of Bentley et al. and calculated lowest sig-nificant response concentrations (level of significance not given) of0.1 mg/L and 1.0 mg/L based on changes in chlorophyll a. concentrationand cell numbers, respectively, for a. canricornutum. Because plantdata were based on nominal concentrations and the validity of the sta-tistical and experimental procedures is questionable, a Final PlantValue cannot be obtained for nitroglycerin.
A Final Residue Value is obtained by dividing maximum permissibletissue concentrations by appropriate bioconcentration factors (Stephanet al. 1985). A maximum permissible tissue concentration is either anFDA action level or a maximum acceptable dietary intake obtained from achronic wildlife feeding study or a long-term wildlife field study.Bioconcentration factors were available for four fish, and ranged from81 to 151; however, it was not clear from the study if tissue concentra-tions had attained steady state. No maximum permissible tissue concen-tration was available; thus no Final Residue Value can be calculated fornitroglycerin.
As stated previously, the final aquatic criterion consists of twoconcentrations: a Criterion Maximum Concentration and a Criterion Con-tinous Concentration (Stephan et al. 1985). A Criterion Maximum Concen-tration of 0.86 mg/L may be calculated from available data, however,this value is considered tentative because acute toxicity data did notmeet all requirements of the USEPA guidelines. Final chronic, plant,and residue values could not be determined for nitroglycerin; thus theminimum data base required by the USEPA in calculating a Criterion Con-tinous Concentration was not available.
-59-
5.5 HUMAN HEALTH CRITERIA
Based on the results of a study conducted by Ellis et al. (1978a,1984), nitroglycerin is suspected of being a human carcinogen. In thisstudy, 14/21 male and 16/25 female CD rats had hepatocellular carcinomas orhepatic neoplastic nodules after two years of oral exposure to nitrogly-cerin at calculated dose levels of 363 and 434 mg/kg/day, respectively.There are currently no suitable methods to determine a threshold for carci-nogenic effects (USEPA 1980); therefore, the recommended concentration formaximum protection of human health is zero. However, because attainment ofthis concentration in some cases may not be feasible, USEPA (1980) haspresented a range of concentrations corresponding to incremental cancerrisks of 10-7 to 10- 5. For example, a risk of 10- 5 indicates that oneadditional case of cancer may occur for every 100,000 people exposed. TheUSEPA (1980) has adopted the model of Crump (1980, as reported in USEPA1980), GLOBAL 79, to estimate the water concentration that would cause alifetime carcinogenic risk of 10-5; this model is a linearized, multistagedmodel. The water concentration of nitroglycerin which is estimated tocause a lifetime carcinogenic risk at 10- 5 , 10-6, and 10- 7 has been calcu-lated with the GLOBAL 79 model using the GLOBAL 82 program of Howe andCrump (1982). A summary of the pertinent data and formulae used in calcu-lating risk for nitroglycerin is presented in Table 17. The correspondingrecommended criteria for nitroglycerin are 14.0, 1.40, and 0.14 jig/L. Ifthe above estimates are made for consumption of aquatic organisms only,excluding consumption of water, the levels are 231, 23.1, and 2.31 jig/L,respectively. Based on the estimated Final Acute Value for aquatic life(1.7258 mg/L), maintainance of concentrations at the levels recommended forthe human health criteria would more than adequately protect aquatic life.
5.6 RESEARCH RECOMMENDATIONS
As has been pointed out, not enough data were available to calculateaquatic criteria for nitroglycerin. The following research recommendationsare given so that sufficient data will be available to meet the USEPAGuideline requirements (USEPA 1980; Stephan et al. 1985) for generatingwater quality criteria.
1. Acute toxicity tests are needed for a genus from a phylum other thanArthropoda and Chordata (e.g., Annelida, Mollusca, Rotifera) and for agenus in any order of insect or phylum not already represented.
2. Chronic flow-through tests using measured concentrations are needed forthree different aquatic genera where at least one is a fish, one is aninvertebrate, and one is a sensitive freshwater species.
3. Acute flow-through tests using measured concentrations are needed forspecies of organisms for which acceptable chronic toxicity tests have beenperformed.
-60-
4. A toxicity test on an important aquatic plant species is needed in
which measured concentrations were used and the end point is biologically
important.
5. A maximum permissible tissue concentration and a definitive steady-
state or 28-day bioaccumulation study for nitroglycerin are needed.
-61-
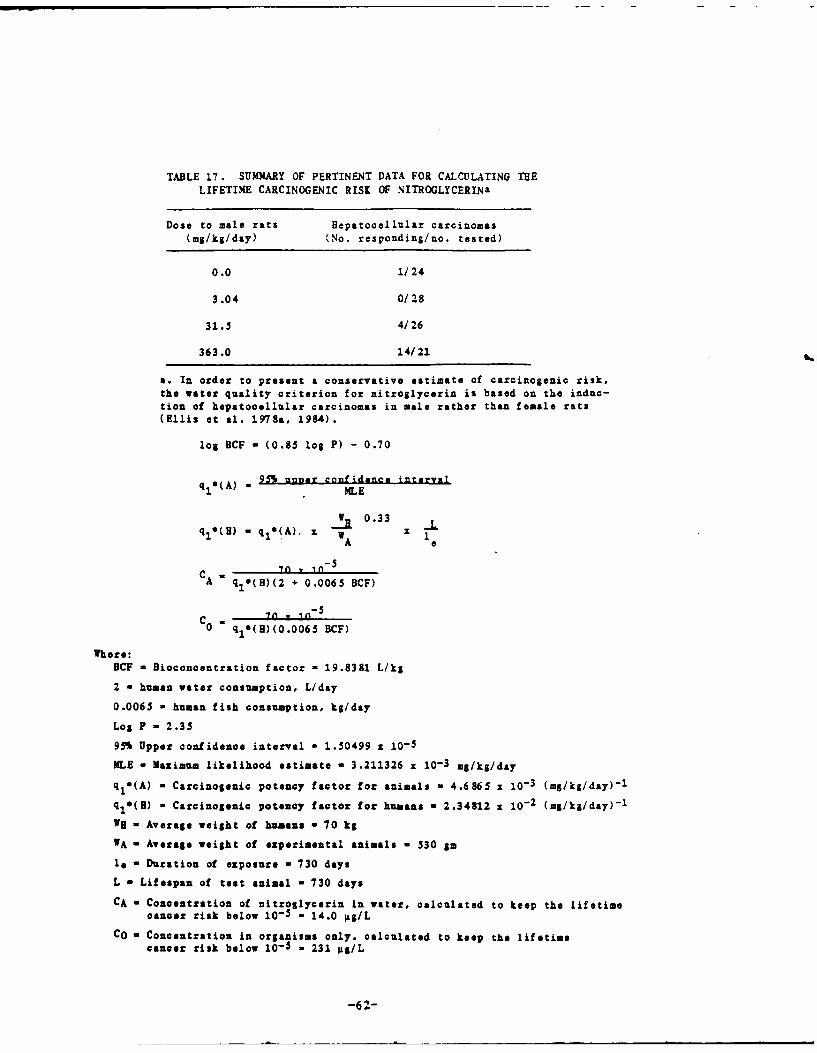
TABLE 17. SUMNARY OF PERTINENT DATA FOR CALCULATING THELIFETIE CARCINOGENIC RISK OF NITROGLYCERINa
Dose to male rats 8epatocellular carcinomas(mg/kg/day) (No. responding/no, tested)
0.0 1/24
3.04 0/28
31.5 4/26
363.0 14/21
a. In order to present a conservative estimate of carcinogenic risk.the water quality criterion for nitroglycerin is based on the induc-tion of hepatocellular carcinomas in male rather than female rats(Ellis et al. 1978a, 1984).
log BCF - (0.85 log P) - 0.70
q*(A) 95. unner confidence interval1 MLE
WR 0.33 Lq1
5 (A) =qeA) Axl
I A
A q 1 (B)(2 + 0.0065 BCF)
C - 0,i=0 q1 *(B)(0.0065 BCF)
Where:
BCF = Bioconcentration factor - 19.8381 L/kg
2 = human water consumption, L/day
0.0065 = human fish consumption, kg/day
Log P = 2.35
95% Upper confidence interval - 1.50499 x 10⁻⁵
XLE - Maximum likelihood estimate - 3.211326 x 10⁻³ mg/kg/day
q1C(A) = Carcinogenic potency factor for animals - 4.6865 x 10- 3 (m/kg/day)-1
q1 0(U) = Carcinogenic potency factor for humans = 2.34812 x 10- 2 (mg/kg/day)-1
Wg = Average weight of humans - 70 kg
WA - Average weight of experimental animals = 530 gm
lo = Duration of exposure = 730 days
L - Lifespan of test animal - 730 days
CA a Concentration of nitroglycerin in water, calculated to keep the lifetimecancer risk below 10- 5 - 14.0 pg/L
CO . Concentration in organisms only, calculated to keep the lifetimecancer risk below 10- 5 - 231 g/L
-62-
6. REFERENCES
ACGIH. 1980. American Conference of Governmental Industrial Hygien-ists. Documentation AL th& Te.hid. Limit Values, 4th ed., pp. 307-308. American Conference of Governmental Industrial Hygienists, Cincin-nati, OH.
ACGIH. 1981. American Conference of Governmental Industrial Hygien-ists. Documentation th Lit Values, 4th ed., pp. 307-308. American Conference of Governmental Industrial Hygienists, Cincin-nati, OH.
Advisory Center on Toxicology. 1968. NAS/NRC, Washington, DC, Toxi-cological Reports (supplied as privileged information), p. 120. (Asreported in Dacre and Tew 1973).
American Defense Preparedness Association. 1975. Wastewater Treatment
in the Military Explosives and Propellants Production Industry, Vol. II.Technical Report. Project No. 802872. U.S. Environmental ProtectionAgency, Office of Research and Development, Washington, DC. (As repor-
ted in Wendt et al. 1978).
Anderson, J.A., E.3. McGuire, J.R. Watkins, J.E. Fitzgerald, and F.A. dela Iglesia. 1983. Toxicology studies with a stable intravenous formu-lation of nitroglycerin. J_. A2Z. Toxicl. 3:161-165.
Andreev, K.K. and G.N. Bespalov. 1963. The effect of water on thenitroglycerin at elevated temperatures. Vzrvvchatkh e shhkstv, 5b.Statei. pp. 131-171. (ghem. Abs. 59:11177b).
Armstrong, P.W., S.A. Armstrong, and G.S. Marks. 1979. Blood levelsafter sublingual nitroglycerin. Circula.tion 59:585-588.
Barkley, J.S., Jr. 1982. Personal communication.
Beard, R.R. and J.T. Noe. 1981. Aromatic nitro and amino compounds.In G.D. Clayton and F.E. Clayton, eds. Vol. 2A. Patty.&nsiHygiee &a&nd Io.iog. pp. 2470-2471. John Wiley I Sons, New York.
Bell, F.K. 1964. Spectrophotometric method for the assay of individualnitroglycerin tablets. L. Pharm. Sc. 53:752-755. (As reported inYacobi et al. 1983).
Bentley, R.E., S.W. Dean, S.3. Ells, G.A. LeBlanc, S. Sauter, K.S. Bux-ton, and B.B. Sleight III. 1978. Laboratory Evaluation of the Toxicityof Nitroglycerine to Aquatic Organisms. Final Report, AD A061739. EGGBionomics, Wareham, MA. DAMD 17-74-C-4101.
Berl, E. and I. Delpy. 1910. (Title not given). Chea. DAt. 43:1421.(As reported in DiCarlo 1975).
-63-
Blei, A.T., 3. Gottstein, and H.-L. Fung. 1984. Role of the liver inthe disposition of intravenous nitroglycerin in the rat. Biochem.Pharm. 33:2631-2686.
Blumenthal, H.P., B.-L. Fung, E.F. McNiff, and S.K. Yap. 1977. Plasmanitroglycerin levels after sublingual, oral and topical administration.DL. J. J1Ai&. P'b.Lrmftcol. 4:241-242.
Bogaert, M.G. and M.-T. Rosseel. 1972. Plasma levels in man of nitro-glycerin after buccal administration. .. Phaxrm. Phaxmacol. 24:737-738.
Brachfeld, N., 3. Bozer, and R. Gorlin. 1959. Action of nitroglycerinon the coronary circulation in normal and in mild cardiac subjects..Cirultion 19:697-704.
Camera, E. and D. Pravisani. 1964. (Title not given). Anal. 91m.36:2108. (As reported DiCarlo 1975).
Capellos, C., W.J. Fisco, C. Ribaudo, V.O. Hogan, 3. Campisi, F.X. Mur-phy, T.C. Castorina, and D.H. Rosenblatt. 1978. Kinetic Studies andProduct Characterization During the Basic Hydrolysis of Glyceryl NitrateEsters. Technical Report ARLCD-TR-79022, AD E400341. Large CaliberWeapon Systems Laboratory, Dover, NJ.
Carmichael, P. and J. Leiben. 1963. Sudden death in explosives work-ers. A.]d. Environ. Health 7:424-439..
Carnahan, R.P. and L. Smith. 1977. Treatment of wastewater containingnitroglycerin and nitrated esters. EXgg.. 32ri LnU. Waste Conf. Lafay-ette, IN, May 10-12, 1977. Ann Arbor Science, Ann Arbor, MI.
Crew, M.C. and F.J. DiCarlo. 1968. Identification and assay of
isomeric 1 4C-glyceryl nitrates. Z.. Chromatgr. 35:506-512.
Crump, K.S. 1980. An improved procedure for low-dose carcinogenic reskassessment from animal data. L. Environ. Eathk. Toxicol. (In press).(As reported in USEPA 1980).
Dacre, 3.C. 1980. Calculation of Interim Environmental Criterion forTrinitroglycerin (TNG). Memorandum for the Record, June 16. (As repor-ted by J. Barkley 1982).
Dacre, 3.C. and R.W. Tew. 1973. Mammalian Toxicology and Toxicity toAquatic Organisms of Nitroglycerin, a Waterborne Munitions Waste Pollu-tant - A Literature Evaluation. AD 777902. Tulane University MedicalSchool, New Orleans, LA. DADA 17-73-C-3152.
delreuk, L.J. 1942. (Title not given). Reo.. IzTA. fhima. 61:819. (Asreported in Urbanski 1983)
DiCarlo, F.J. 1975. Nitroglycerin revisited: Chemistry, biochemistry,interactions. D.=Metab. lem. 4:1-38.
-64-
DiCarlo, F.J., M.C. Crew, L.3. Haynes, M.D. Melgar, and R.L. Gala.1968. The absorption and biotransformation of glyceryl trinitrate-1,-1 4C by rats. Biochem. Ehacol. 17:2179-2183.
Ellis, H.V., J.B. Bagensen, I.R. Hodgson, 3.L. Minor, C.-B. Hong, E.R.Ellis, 3.D. Girvin, D.O. Belton, B.L. Herndon, and C.-C. Lee. 1978a.Mammalian Toxicity of Munitions Compounds. Phase III: Effects ofLife-time Exposure. Part II: Trinitroglycerin. Progress Report No. 8,AD A078746/5. Midwest Research Institute, Kansas City, MO. DAMD-17-74-C-4073.
Ellis, L.V., III, J.R. Hodgson, S.W. Hwang, L.M. Halpap, D.O. Helton,B.S. Andersen, D.L. Van Goethem, and C.-C. Lee. 1978b. Mammalian Toxi-city of Munitions Compounds. Phase I: Acute Oral Toxicity, Primary
Skin and Eye Irritation, Dermal Sensitization, Disposition and Metabol-ism, and Ames Tests of Additional Compounds. Report No. 6. AD A069333.Midwest Research Institute, Kansas City, MO. DAN-17-74-C-4073.
Ellis, L.V., III, C.B. Hong, C.C. Lee, J.C. Dacre, and J.P. Glennon.1984. Subacute and chronic toxicity studies of trinitroglycerin indogs, rats, and mice. F-ndAm. AnIgj. Toicol. 4:248-260.
Farmer, R.C. 1920. The decomposition of nitric esters. 1. Chem. o.
117: 806-818.
Flaim, S.F. 1982. Peripheral vascular effects of nitroglycerin in a
conscious rat model of heart failure. Am. L. PhXsio. 243:E974-H981.
Flann, B.C. 1969. (Title not given). Z. Pharm. Sai. 58:122. (Asreported in McNiff et al. 1980).
Fraser, R.T.M. 1968. Stability of nitrate esters. QheM. Ind. 1117-1118.
Fung, H.-L. 1984. Pharmacokinetic determinants of nitrate action. Am.Z. Mad. 76:22-26.
Fung, H.-L., P. Dalecki, E. Tse, and C.T. Rhodes. 1973. Kinetic assay
of single nitroglycerin tablets. Z. Pbarm. 5.i. 62:696-697. (As repor-
ted in Yacobi at al. 1983).
Fung, B.-L., H. Ogata, A. Kamiya, and G.A. Maier. 1984a. Pharmaco
kinetics of nitroglycerin after parenteral and oral dosing in the rat.
1. Pla. Sak. 73:873-879.
Fung, H.-L, S.3.C. Sutton, and AJ. Kamiya. 1984b. Blood vessel uptake
and metabolism of organic nitrates in the rat. j. Pharmacl. EX.
ah=. 228:334-341.
Backel, 3. 1933. (Title not given). Rzniki Chem. 16:213. (Asreported in Urbanski 1983).
-65-
Hawley, G.G. 1981. ID& 9Dzj&A nmica.1Pi onry. p. 734. VanNostrand Reinhold Co., New York.
Fleinzow, B. and A. Ziegler. 1981. Comparison of the effects of nitro-glycerin administered to rats by different routes. L. Cardiovasc. Phar-macol. 3:573-580.
Hemphill, L. 1975. TLm study of Atlas Powder Company nitroglycerinstorehouse wastes. Unpublished. Joplin, Missouri. 47 pp. (As repor-ted in Sullivan et al. 1979).
Hibbert, H. 1911. U.S. Pat. 994841, 994842; VII Intern. Congress ofAppl. Chemistry, Vol. 4, p. 37, New York, 1912; Z. g&.L. Schiess-L
Sgrangstoffy. 9:126 (1914). (As reported in Urbanski 1983).
Hodgson, J.R. and C.-C. Lee. 1975. Trinitroglycerol metabolism: Deni-tration and glucuronide formation in the rat. Toxicol. AvD. h i.34:449-455.
Hodgson, J.R., J.P. Glennon, J.C. Dacre, and C.-C. Lee. 1977. Metabol-ism and disposition of isomers of dinitro- and mononitroglycerol. Toxi-rol. A2&i. PNazaaacol . 40:65-70.
Bogstedt, C. and K. Andersson. 1979. A cohort study on mortality amongdynamite workers. .. O.. Mak. 21:553-556.
Bogstedt, C. and 0. Axelson. 1977. Nitroglycerine-nitroglycol exposureand the mortality in cardio-cerebrovascular diseases among dynamiteworkers. L. Occun. NSA. 19:675-678.
Hogstedt, C. and B. Davidsson. 1980. Nitroglycol and nitroglycerineexposure in a dynamite industry 1958-1978. Am. Ind. lygL. Assoc. 1.dl: 373-37 5.
Howe, R.B. and K.S. Crump. 1982. GLOBAL 82. A Computer Program toExtrapolate Quantal Animal Toxicity Data to Low Doses. Science ResearchSystems, Ruston, LA. 13 pp.
International Labour Office. 1983. Encyclonaedia 2fLOccupationalHealth anAd Safet. pp. 1459-1461. International Labour Office, Geneva,Switz erl and.
Ioannides, C., D.V. Parke, and I.W. Taylor. 1982. Elimination of gly-ceryl trinitrate: Effects of sex, age, species and route of administra-tion. B. 1. 2AAXZaq_.. 77:83-88.
3. Am. Ned. Assoc. 1898. The effects of nitroglycerin upon those whomanufacture it. L. Am. Xed. Assoc. 31:793-794.
Kaplan, D.L., I.B. Cornell, and A.M. Kaplan. 1982. Biodegradation ofglycidol and glycidyl nitrate. A2&1. Enzi=.n. Microbio. 43:144-150.
-66-
Kast, B. 1906. (Title not given). Z. sa. Scineas-L. Sgn.gstoffy.1:225. (As reported in Urbanski 1983).
Kikendall, 3.W. and M.N. Mellow. 1980. Effect of sublingual nitrogly-
cerin and long-acting nitrate preparations on esophageal motility. a.-
troenterolofy 79:703-706.
Klason, P. and T. Carlson. 1906. (Title not given). Vhem. Btz.
39:2753. (As reported in DiCarlo 1975).
Kononova, S.D., A.M. Korolev, L.T. Eremenko, and L.L. Gumanov. 1972.The mutagenic effect of some esters of nitric acid on bacteriophage T4B.
kiU. Genet. 8:635-640.
Kypson, J. and G. Bait. 1971. Metabolic effects of nitroglycerin and
tranyleypromine in unanesthetized rabbits. PZZe. ocS. Ex.. Biol. Med.
136:285-289.
Lang, S., E.M. Johnson, Jr., and P. Needleman. 1972. Metabolism of andvascular responses to glyceryl trinitrate in the eviscerated rat.
Biochem. P'naagi. 21:422-424.
Lange, R.L., M.S. Reid, D.D. Tresch, M.H. Keelan, V.M. Bernhard, and G.
Coolidge. 1972. Nonatheromatous ischemic heart disease following with-drawal from chronic industrial nitroglycerin exposure. Czclat*
46:666-678.
Laws, C.E. 1910. Nitroglycerin head. L. Am. Xad. Assoc. 54:793.
Lee, C.-C., 3.V. Dilley, 3.R. Hodgson, D.O. Helton, W.I. Wiegand, D.N.Roberts, B.S. Andersen, L.M. Balfpap, L.D. Kurtz, and N. West. 1975.
Mammalian Toxicity of Munition Compounds. Phase I. Acute Oral Toxi-city, Primary Skin and Eye Irritation, Dermal Sensitization, and Dispo-sition and Metabolism. Report No. 1. AD B011150. Midwest ResearchInstitute, Kansas City, MO. DAMD-17-74-C-4073.
Lee, C.-C., B.V. Ellis, III, 3.3. Kowalski, 3.R. Hodgson, S.W. Hwang,
R.D. Short, 3.C. Bhandari, 3.L. Sanyer, T.W. Reddig, 3.L. Minor, andD.O. Belton. 1977. Mammalian Toxicity of Munition Compounds. PhaseII. Effects of Multiple Doses. Part I. Trinitroglycerin. Progress
No. 2. AD A047067. Midwest Research Institute, Kansas City, MO.
DAD17-7 4-C-4073.
Lee, N.H. 1973. The metabolism of glyceryl trinitrate by liver andblood from different species. Binchem. £2mecol. 22:3122-3124.
Leo, A., C. Danach, and D. Elkins. 1971. Partition coefficients and
Their Uses. Q=ea. XLy. 71:525-616.
Lindner V. 1980. Explosives. In Lik-Othba Enelaloloodia & Cfl.miuI.Ia1ngaiij, 3rd ed., Vol. 9, pp. 561-620. John Wiley f Sons, New York.
-67-
Lund, R.P., 3. Haggendal, and G. Johnsson. 1968. Withdrawal symptoms
in workers exposed to nitroglycerin. ix. I. uin. led. 25:136-138.
Magometschnigg, D., H. Horwatitsch, and M. Pichler. 1983. Plasma con-centration of cutaneously applied trinitroglycerin. I=t. I. fLiu.Phamacol. IeX.. Toxicol. 21:178-182.
Yaier, G.A., C. Arena, and H.-L. Fung. 1980. Relationship between invivo organic nitrate reductase activity in rats. Biochem. ha.amci.
29:646-648.
Mark, B.F. 1965. Explosives. In Tirk-Othmer En.c/cD.ipiaA.L Chemical
Iun. nolv, 2nd ed., Vol. 8. pp. 602-604. Interscience Publishers.
Marshall, A. and G. Peace. 1916. (Title not given). L. So... rhe=.Ind. 109:298. (As reported in Urbanski 1983).
McNiff, E.F., A. Yacobi, F.M. Young-Chang, L.H. Golden, A. Goldfarb, andH.-L. Fung. 1981. Nitroglycerin pharmacokinetics after intravenousinfusion in normal subjects. 1. Pharm. 291. 70:1054-1058.
McNiff, E.F., P.S.K. Yap, and H.-L. Fung. 1980. Nitroglycerin. Anal.Profiles DxuL Subst. 9:519-541.
MEDLARS (CHEMLINE). 1984. National Library of Medicine. Computerprintout retrieved October 12.
MEDLARS (RTECS). 1984. National Library of Medicine. Registry ofToxic Substances file. Computer printout retrieved October 12.
MEDLARS (TDB). 1984. National Library of Medicine. Toxicology DataBank file. Computer printout retrieved October 12.
Mudd, 3.W. 1977. Impotence responsive to glyceryl trinitrate. Am. L.PsI7hiatrX 134:922-925.
Yunch, I.C., B. Friedland, and M. Shepard. 1965. Glyceryl trinitrate.II. Chronic toxicity. .Ind. hi. hzz.. 34:940-943.
Naoum, P. 1924. Nitrfo Xclein IL. Nitroallcerinsgreastoffe. Springer,Berlin. (As reported in Urbanski 1983).
Nauckhoff, S. 1905. (Title not given). Z. Angk.. fhe. 11:53. (As
reported in Urbanaki 1983).
Needleman, P., ed. 1975. .Qag£/ni itates. Springer-Verlag, New York.
Needleman, P., D.J. Blehm, A.B. Barkey, E.M. Johnson, It., and S. Lang.
1971. The metabolic pathway in the degradation of glyceryl trinitrate.
.. i. E. T.az. 179:347-353.
-68-
Needleman, P. and A.B. Harkey. 1971. Role of endogenous glutathione in
the metabolism of glyceryl trinitrate by isolated perfused rat liver.
Bic.- P%2racol. 20:1867-1876.
Needleman, P. and F. E. Hunter, Jr. 1965. The transformation of gly-ceryl trinitrate and other nitrates by glutathione-organic nitrate
reductase. I"g. PharmAcol. 1:77-86.
Needleman, P. and J.C. Krantz Jr. 1965. The biotransformation of
nitrolgycerin. Biochem. Eharsgi. 14:1225-1230.
NIOSH. 1978. Occupational Exposure to Nitroglycerin and Ethylene
Glycol Dinitrate. DHEW (NIOSH) Pub. No. 78-167. U.S. Department ofHealth, Education, and Welfare, National Institute for OccupationalSafety and Health, Morgantown, WV.
Noonan, P.K. 1984. Nitroglycerin pharmacokinetics using specific and
sensitive analytical procedures. Diss. Abst.. n.=. D 44:3090.
Noonan. P.K. and L.Z. Benet. 1982. Formation of mono- and dinitrate
metabolites of nitroglycerin following incubation with human blood.
I=t. Z. Pharm. 12:331-340.
Oketani, Y., T. Mitsuzono, K. Ichikawa, Y. Itono, T. Gojo, M. Gofuku,
and N. Konoha. 1981a. Toxicological studies on nitroglycerin (NK-843).4. Acute toxicity in dogs. Ovo XAk.jnx 22:629-632.
Oketani, Y., T. Mitsuzono, K. Ichikawa, Y. Itono, T. Gojo, M. Gofuku,and N. Konoha. 1981b. Toxicological studies on nitroglycerin (NK-843).
6. Teratological study in rabbits. Pharmacometrics 22:633-638.
Oketani, Y., T. Mitsuzono, K. Ichikawa, Y. Itono, T. Gojo, M. Gofuku,and N. Konoha. 1982a. Toxicological studies on nitroglycerin (M-843).
5. Intravenous subacute toxicity in dog. Ij.AkJ&iLaak=i 13:125-144.
Oketani, Y., T. Mitsuzono, K. Ichikawa, Y. Itono, T. Gojo, M. Gofuku,and N. Konoha. 1981c. Toxicological studies on nitroglycerin (NK-843).
8. Teratological study in rats. Pharmacometrics 22:737-751.
Oketani, Y., T. Mitsuzono, K. Ichikawa, Y. Itono, T. Gojo, M. Gofuku, S.Nagayoshi, and N. Konoha. 1982b. Toxicological studies on nitrogly-
cerin (NK-843). 2. Intraperitoneal subacute toxicity in rat. 13tsknkin
Lmnk~m 13:95-108.
Oketani, Y., T. Mitsuzono, K. Ichikawa, Y. Itono T. Gojo, S. Nagayoshi,
and N. Konoha. 1982c. Toxicological studies on nitroglycerin ( W-843).1. Acute toxicity in mouse and rat. y.I.k.a Ljak=u 13:90-94.
Oketani, Y., T. Mitsuzono, K. Ichikawa, Y. Itoo, T. Gojo, C. Tateda, M.
Gofuku, and N. Konoha. 1981d. Toxicological studies on nitroglycerin
(NI-843). 9. Perinatal and postnatal study in rats. Pharmacometrics22:753-763.
-69-
Oketani, Y., T. Mitsuzono, Y. Itono, K. Ichikawa, T. Gojo, M. Gofuku,
and N. Konoha. 1981e. Toxicological studies on nitroglycerin (MC-843).
7. Fertility studies in rats. Pharmacometrics 22:639-648.
Orestano, G. 1937. Pharmacological action of nitroglycerin. I. AXh.LtA.. k. Faryakol. 6:153-172. (As reported in Dacre and Tew 1973).
Physicians' Desk Reference. 1983. Pyicians' Desk Reforegge. MedicalEconomics Co., Oradell, NJ. p. 1518.
Reeve, G., T. Bloom, R. Rinsky, and A. Smith. 1983. Cardiovascular
disease mortality among nitroglycerin workers. Paper presented at the1983 Meeting of the Society of Epidemiologic Research.
Roginskii, S.Z. and L.M. Sapozhnikov. 1931. (Title not given). Zh.
liz. khia. 2:80. (As reported in Urbanski 1983).
Ross, R.B., M.G. Ryon, M.W. Daugherty, J.S. Drury, J.T. Ensminger, andM.V. Cone. 1980. Scientific Rationale for the Selection of ToxicityTesting Methods: Human Health Assessment. Oak Ridge National Labora-tory, Oak Ridge, Tennessee. ORNL/EIS-151.
Rosseel, M.-T. and M.G. Bogaert. 1972. Gas chromatography of thenitrate esters of glycerol, isosorbide and isomannide. .. Chromsjg.64:364.
Short, R.D., 3.C. Dacre, and C.-C. Lee. 1977. A species and develop-mental comparison of trinitroglycerin metabolism in vitro. Biochem.
Plisr-col. 26:162-163.
Silberrad, 0. and R.C. Farmer. 1906. (Title not given). .. LhIm..a. 89:1759. (As reported in DiCarlo 1975).
Smith, L.L. and R.L. Dickinson (eds.). 1972. Propellant Plant Pollu-tion Abatement. Biological and Engineering Investigation to DevelopOptimum Control Measures to Prevent Water Pollution. Final EngineeringReport. Production Project :E-249 (Phase I). Hercules Inc., RadfordArmy Ammunition Plant, Radford, VA. (As reported in Wendt et al. 1978).
Snelling, W. and C. Storm. 1913. (Title not given). Z. GAe. Shhings-I. SgrinetLofr. 8:1. (As reported in Urbanski 1983).
Sokoloski, T.D., C.C. Vu, L.S. Wu, and A.M. Burkman. 1983. Interactionof nitroglycerin with human blood components. . Phar-. Ui. 72:335-338.
Spanggord, R.I., T. Mill, T.-W. Chou, W.R. Mabey. J.B. Smith, and S.Lee. 1980a. Envirnomental Fate Studies on Certain Munition WastewaterConstituents. Final Report, Phase II - Laboratory Studies. AD A099256.SRI International, Menlo Park, CA. DMAD 17-78-C-8081.
-70-
Spanggord, R.J., T. Mill, T.-W. Chou, W.R. Mabey, J.B. Smith, and S.Lee. 1980b. Envirnomental Fate Studies on Certain Munition WastewaterConstituents. Final Report, Phase I - Literature Review. AD A082372.SRI International, Menlo Park, CA. DMAD 17-78-C-8081.
Stayner, L.T., A. Dannenberg, M. Thun, G. Reeve, T. F. Bloom, and W.Halperin. 1985. Cohort and Case-Control Study of Persons Occupa-tionally Exposed to Nitroglycerin. Protocol of a Proposed Study by theNational Institute for Occupational Safety and Health. July 25.
Stephan, C.E., D.I. Mount, D.J. Hansen, J.H. Gentile, G.A. Chapman, andW.A. Brungs. 1985. Guidelines for Deriving Numerical National WaterQuality Criteria for the Protection of Aquatic Organisms and Their Uses.Final Report PB85-227049. US Environmental Protection Agency, Office ofResearch and Development, Washington, DC.
Stilwell, J. M., D.C. Cooper, M.A. Eischen, M.C. Matthews, B.E.Sherwood, and T.B. Stanford. 1976. Aquatic Life Field Studies atBadger Army Ammunition Plant. Final Phase II Report, Volume I. ADA033547. Battelle Columbus Laboratories, Columbus, OH. DAMD 17-74-C-4123.
Stokinger, B.E. 1982. Aliphatic Nitro Compounds, Nitrates, Nitrites.Chapter 53. In G.D. Clayton and F.E. Clayton, ads., PazttX%'IndustrialHygiene AM&ITxicology, Vol. 2C. pp. 4186-4188. John Wiley V Sons, NewYork.
Sullivan, J.B., Jr., H.D. Putnam, M.A. Keirn, B.C. Pruitt, Jr., J.C.Nichols, and J.T. McClave. 1979. A Summary and Evaluation of AquaticEnvironmental Data in Relation to Establishing Water Quality Criteriafor Munitions-Unique Compounds. AD A06067. Water and Air Research,Inc., Gainesville, FL. DAND 17-77-C-7027.
Suzuki, K., K. Sudo, T. Yamamoto, and K. Hashimoto. 1975. The carcino-genicity of N-ethoxycarbonyl-3-morpholinosydnonimine (molsidomine) incomparison with nitroglycerin in C57BL/6Jms mice. Pharmacometrics
9:229-242.
Svetlov, B.S., V.P. Shelaputina, and E.P. Malyntina. 1976. Neutralhydrolysis of polynitrates of polyhydric alcohols. Kinet. Latal.17:508-511. (As reported in Spanggord et al. 1980b).
Takayama, S. 1975. Carcinogenicity of molsidomine and nitroglycerin inrats. j.YaXakus.± 9:217-228.
Trainer, D.C. and R.C. Jones. 1966. Headaches in explosive magazineworkers. Azak. Environ. &laalh 12:231-234.
United States Pharmacopeia. 1980. TU UnitjA AjLh£ o . pp.552-553. United States Pharmacopeial Convention, Inc., Rockville, MD.
Urbanski, T. 1983. ChemstZa aid LohD.Q1f l 1xjLLjzAj. Pergamon
Press, New York.
-71-
U.S. Army Environmental Hygiene Report. 1971. Water Quality Engineer-
ing Special Study No. 24-001-72. October. (As reported in Carnahan and
Smith 1977)
U.S. Army Natick Research and Development Command. 1973. Twenty-second
Conference on Microbiological Deterioration of Military Material. Tech-
nical Report 75-2-FSL. Food Sciences Laboratory, U.S. Army NatickResearch and Development Command, Natick, MA. (As reported in Wendt etal. 1978).
U.S. Army Natick Research and Development Command. 1974. Twenty-thirdConference on Microbiological Deterioration of Military Material. Tech-nical Report 75-87-FSL. Food Sciences Laboratory, U.S. Army NatickResearch and Development Command, Natick, MA. (As reported in Wendt etal. 1978).
USEPA. 1971. U.S. Environmental Protection Agency. Algal Assay Pro-cedure: Bottle Test. National Euthrophication Research Program, PacificNorthwest Water Laboratory, Corvallis, OR. 82 pp. (As reported inBentley et al. 1978).
USEPA. 1978. U.S. Environmental Protection Agency. Guidelines forDeriving later Quality Criteria for the Protection of Aquatic Life.T.C. Jaring, ed. Eja. Reg.. 43:21506-21518. (As reported in Sullivan etal. 1979).
USEPA. 1980. U.S. Environmental Protection Agency. Guidelines andMethodology Used in the Preparation of Health Effects Assessment Chap-ters of the Consent Decree Water Quality Criteria. Ed. lAL. 45:79347-79357.
USEPA. 1975. U.S. Environmental Protection Agency. Methods for AcuteToxicity Tests With Fish, Macroinvertebrates, and Amphibians. Ecologi-cal Research Series, 600/3-75-009. (As reported in Bentley et al.1978).
USEPA. 1979a. U.S. Environmental Protection Agency. Water QualityCriteria. Fed. 1". 44:15926-15981. (15 March 1979) (As reported inEllis et al. 1978a).
USEPA. 1979b. U.S. Environmental Protection Agency. Water Quality
Criteria. jed. ja. 44:43671-43673. (25 July 1979) 'As reported by 3.Barkley pers. comm. 1982).
USEPA. 1985. U.S. Environmental Protection Agency. Toxic SubstancesControl Act Test Guidelines; Final Rules. Part 797-Environmental EffectsTesting Guidelines. PaA. huiAatine. 50(188):39321-39397.
USOSHA. 1983. U.S. Occupational Safety and Health Administration.Toxic and Hazardous Substances. (29 CFR 1910.441).
Verschueren, K. 1983. Iandbnnk IL Enironental 2AtL ±L z raaJi. amJi-ucal. p. 916. Van Nostrand Reinhold Co., Now York.
-72-
Vignon, L. 1903. (Title not given). Buh . Sac. biza. aL. 29:26. (Asreported in DiCarlo 1975).
Walsh, 3.T. 1976. Chemical Characterization of Nitroglycerin Biodegra-dation Products. U.S. Army Natick Research and Development Laboratory.
Unpublished manuscript. Natick, MA. 21 pp. (As reported in Sullivan
et al. 1979)
Wei, J.Y. and P.R. Reid. 1979. Quantitative determination of trinitro-glycerin in human plasma. Circulion 59:588-592.
Weitzel, R.L., R.C. Eisenman, and J.E. Schenk. 1976. Aquatic FieldSurveys at Iowa, Radford and Joliet Army Ammunition Plants. FinalReport. Volume II - Radford Army Ammunition Plant. AD A036777.Environmental Control Technology Corp., Ann Arbor, MI. DAND 17-75-C-
5046.
Wendt, T.M., I.H. Cornell, and A.M. Kaplan. 1978. Microbial degrada-tion of glycerol nitrates. Aaai. Environ. M. 36:693-699.
Wester, R.C., P.I. Noonan, S. Smeach, and L. Kosobud. 1983. Pharmaco-kinetics and bioavailability of intravenous and topical nitroglycerin inthe Rhesus monkey: Estimate of percutaneous first-pass metabolism. 'L.
Pharm. 2i. 72:745-748.
Windholz, M., ed. 1983. 31h Merck Index. p. 948. Merck f Co., Inc.,Rahway, NJ.
Woodson, A.L. and L.C. Allen. 1969. (Title not given). Z.A.D.A.'.52:847. (As reported in McNiff at al. 1980).
Wu, C.C., T.D. Sokoloski, A.M. Burkman, M.F. Blanford, and L.S. Wu.1982. Methods for the quantitation of nitroglycerin and its metabolitesin human plasma. L. Chxiomat. 228:333-339.
Yacobi, A., A.B. Amann, and D.M. Baaske. 1983. Pharmaceutical con-siderations of nitroglycerin. D.L aIn till. fjin. Pharm. 17:255-263.
Yap, S.K., C.T. Rhodes, and B-L. Fung. 1975. Factors affecting thekinetic assay of nitroglycerin in dosage forms. A&. 1. Zg.. Pharm.32:1039-1042. (As reported in Yacobi et al. 1983).
-73-
7. GLOSSARY
AAP Army Ammunition Plant
ACGIB American Conference of Governmental
Industrial Hygienists
ADI Acceptable daily intake
BAF Bioaccumulation factor
CCC Criterion continuous concentration
CEO Chinese hamster ovary
CMC Criterion maximum concentration
EC50 Effective concentration causing 50 percent death(based on immobilization)
FAV Final acute value
FCV Final chronic value
FEL Frank effect level
FPV Final plant value
FRV Final residue value
GMAV Genus mean acute value
GI Gastrointestinal
HPLC High pressure liquid chromatography
LC5 0 Lethal concentration causing 50 percent death
LD5o Lethal dose causing 50 percent death
LOAM. Lowest observed adverse effect level
NOAEL No observed adverse effect level
NOEL No observed effect level
ppm Parts per million
SMAV Species mean acute value
-74-
SMCV Species mean chronic value
STEL Short-term exposure limit
TLV Threshold limit value
USAMBRDL U.S. Army Medical Bioengineering Researchand Development Laboratory
USEPA U.S. Environmental Protection Agency
-75-
APPENDIX A:
SUMMARY OF US EPA M IHODOLOGY FOR DERIVING NUMERICAL WATER QUALITY
CRITERIA FOR THE PROTECTION OF AQUATIC ORGANISMS AND THEIR USES
The following summary is a condensed version of the 1985 final US
Environmental Protection Agency (USEPA) guidelines for calculating a
water quality criteria to protect aquatic life and is slanted towards
the specific regulatory needs of the US Army (e.g., discussion of
saltwater aspects of the criteria calculation are not included). The
guidelines are the most recent document outlining the required pro-
cedures and were written by the following researchers from the USEPA's
regional research laboratories: C.E. Stephan, D.I. Mount, D.3. Hansen,
I.E. Gentile, G.A. Chapman, and W.A. Brungs. For greater detail on
individual points consult Stephan et al. (1985).
1. INTRODUCTION
The Guidelines for Deriving Numerical National Water Quality Cri-
teria for the Protection of Aquatic Organisms and Their Uses describe anobjective, internally consistent, and appropriate way of estimatingnational criteria. Because aquatic life can tolerate some stress and
occasional adverse effects, protection of all species all of the timewas not deemed necessary. If acceptabla'data are available for a large
number of appropriate taxa from a variety of taxonomic and functional
groups, a reasonable level of protection should be provided if allexcept a small fraction are protected, unless a commercially,recreationally, or socially important species was very sensitive. The
small fraction is set at 0.05 because other fractions resulted in cri-
teria that seemed too high or too low in comparison with the sets ofdata from which they were calculated. Use of 0.05 to calculate a FinalAcute Value does not imply that this percentage of adversely affectedtaxa should be used to decide in a field situation whether a criterion
is appropriate.
To be acceptable to the public and useful in field situations, pro-
tection of aquatic organisms and their uses should be defined as preven-tion of unacceptable long-term and short-term effects on (1) commerci-ally, recreationally, and socially important species and (2) (a) fishand benthic invertebrate assemblages in rivers and streams and (b) fish,
benthic invertebrate, and zooplankton assemblages in lakes, reservoirs,estuaries, and oceans. These national guidelines have been developed on
the theory that effects which occur on a species in appropriate labora-
tory tests will generally occur on the same species in comparable fieldsituations.
Numerical aquatic life criteria derived using these nationalguidelines are expressed as two numbers, so that the criteria can moreaccurately reflect toxicological and practical realities. The combina-
tion of a maximum concentration and a continuous concentration is desig-ned to provide adequate protection of aquatic life and its uses fromacute and chronic toxicity to animals, toxicity to plants, and
A-1
bioaccumulation by aquatic organisms without being as restrictive as a
one-number criterion would have to be in order to provide the same
degree of protection.
Criteria produced by these guidelines should be useful for develo-
ping water quality standards, mixing zone standards, and effluent stan-
dards. Development of such standards may have to consider additional
factors such as social, legal, economic, and additional biological data.
It may be desirable to derive site-specific criteria from these national
criteria to reflect local conditions (USEPA 1982). The two factors that
may cause the most difference between the national and site-specific
criteria are the species that will be exposed and the characteristics of
the water.
Criteria should provide reasonable and adequate protection with
only a small possibility of considerable overprotection or underprotec-
tion. It is not enough that a criterion be the best estimate obtainableusing available data; it is equally important that a criterion be
derived only if adequate appropriate data are available to providereasonable confidence that it is a good estimate. Thus, these guidel-ines require that certain data be available if a criterion is to be
derived. If all the required data are not available, usually a cri-terion should not be derived; however, availability of all required datadoes not ensure that a criterion can be derived. The amount of guidance
in these national guidelines is significant. but much of it is neces-sarily qualitative rather than quantitative; much judgement will berequired to derive a water quality criterion for aquatic life. All
necessary decisions should be based on a thorough knowledge of aquatictoxicology and an understanding of these guidelines and should be con-sistent with the spirit of these guidelines - which is to make best use
of all available data to derive the most appropriate criterion.
2. DEFINITION OF MATERIAL OF CONCERN
1. Each separate chemical that does not ionize significantly inmost natural bodies of water should be considered a separatematerial, except possibly for structurally similar organic
compounds that only exist in large quantities as commercialmixtures of the various compounds and apparently have similarbiological, chemical, physical, and toxicological properties.
2. For chemicals that do ionize significantly, all forms that
would be in chemical equilibrium should usually be consideredone material. Each different oxidation state of a metal and
each different nonionizable covalently bonded organometalliccompound should usually be considered a separate material.
3. Definition of the material should include an operational
analytical component. It is also necessary to reference or
A-2
describe analytical methods that the term is intended to
denote. Primary requirements of the operational analyticalcomponent is that it be appropriate for use on samples of
receiving water, that it be compatible with toxicity and
bioaccumulation data without making extrapolations that are
too hypothetical, and that it rarely result in underprotec-
tion of aquatic life and its uses.
NOTE: Analytical chemistry of the material may have to beconsidered when defining the material or when judging accep-tability of some toxicity tests, but a criterion should not
be based on sensitivity of an analytical method. When aqua-
tic organisms are more sensitive than analytical techniques,the proper solution is to develop better analytical methods,not to underprotect aquatic life.
3. COLLECTION OF DATA
1. Collect all available data on the material concerning (a)
toxicity to, and bioaccumulation by, aquatic animals and
plants; (b) FDA action levels (FDA Guidelines Manual); and
(c) chronic feeding studies and long-term field studies with
wildlife that regularly cons-me aquatic organisms.
2. All data used should be available in typed, dated and signedhardcopy with enough supporting information to indicate thatacceptable test procedures were used and the results should
be reliable.
3. Questionable data, whether published or not, should not beused.
4. Data on technical grade materials may be used if appropriate,
but data on formulated mixtures and emulsifiable concentratesof the test material should not be used.
3. For some highly volatile, hydrolyzable, or degradable materi-als it may be appropriate to only use results of flow-through
tests in which concentration of test material in test solu-
tions were measured using acceptable analytical methods.
6. Do not use data obtained using brine shrimp, species that donot have reproducing wild populations in North America, ororganisms that were previously exposed to sigrificant concen-
trations of the test material or other contaminants.
A-3
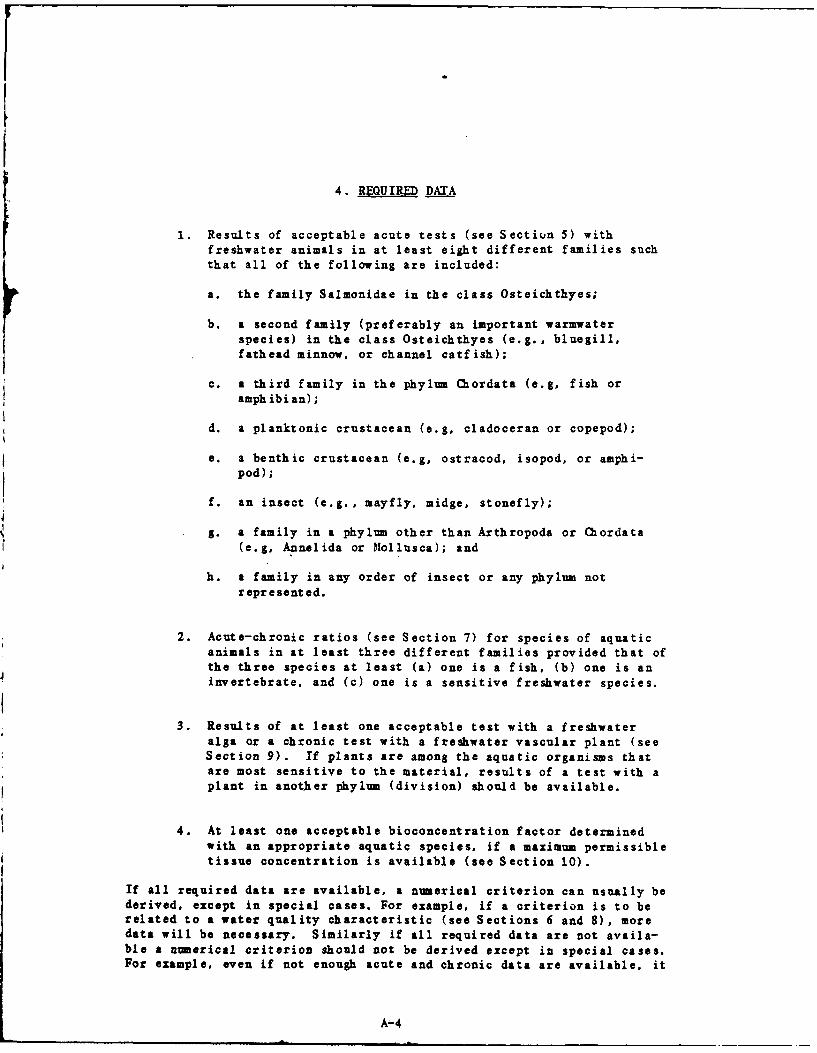
4. REUIRED DATA
1. Results of acceptable acute tests (see Section 5) withfreshwater animals in at least eight different families suchthat all of the following are included:
a. the family Salmonidae in the class Osteichthyes;
b. a second family (preferably an important warmwaterspecies) in the class Osteichthyes (e.g., bluegill.fathead minnow, or channel catfish);
c. a third family in the phylum (lordata (e.g, fish oramphibian);
d. a planktonic crustacean (e.g, cladoceran or copepod);
e. a benthic crustacean (e.g, ostracod, isopod, or amphi-pod);
f. an insect (e.g., mayfly, midge, stonefly);
S. a family in a phylum other than Arthropoda or (lordata(e.g, Annelida or Mollusca); and
h. a family in any order of insect or any phylum notrepresented.
2. Acute-chronic ratios (see Section 7) for species of aquaticanimals in at least three different families provided that ofthe three species at least (a) one is a fish, (b) one is an
invertebrate, and (c) one is a sensitive freshwater species.
3. Results of at least one acceptable test with a freshwateralga or a chronic test with a freshwater vascular plant (seeSection 9). If plants are among the aquatic organisms thatare most sensitive to the material, results of a test with aplant in another phylum (division) should be available.
4. At least one acceptable bioconcentration factor determinedwith an appropriate aquatic species, if a maximum permissibletissue concentration is available (see Section 10).
If all required data are available, a numerical criterion can usually bederived, except in special cases. For example, if a criterion is to berelated to a water quality characteristic (see Sections 6 and 8), moredata will be necessary. Similarly if all required data are not availa-ble a numerical criterion should not be derived except in special cases.For example, even if not enough acute and chronic data are available, it
A-4
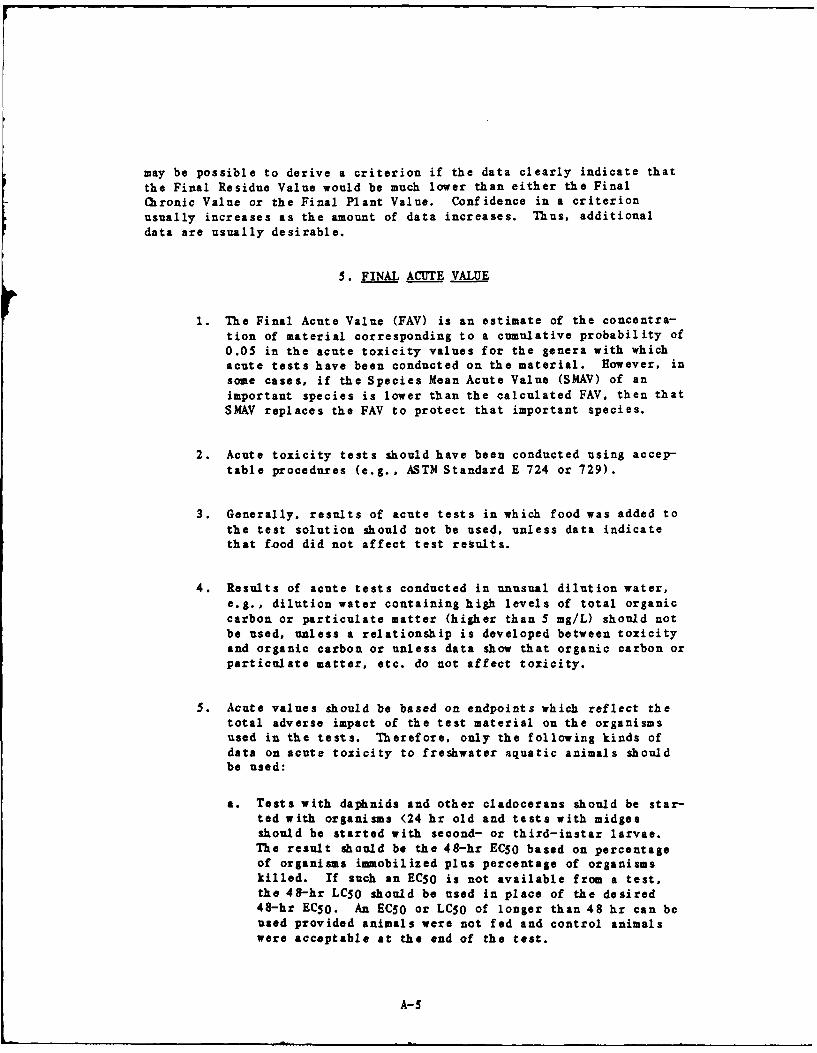
may be possible to derive a criterion if the data clearly indicate thatthe Final Residue Value would be much lower than either the FinalChronic Value or the Final Plant Value. Confidence in a criterionusually increases as the amount of data increases. Thus, additional
data are usually desirable.
5. FINAL ACUTE VALUE
1. The Final Acute Value (FAV) is an estimate of the concentra-tion of material corresponding to a cumulative probability of0.05 in the acute toxicity values for the genera with whichacute tests have been conducted on the material. However, in
some cases, if the Species Mean Acute Value (SMAV) of animportant species is lower than the calculated FAV, then thatSMAV replaces the FAV to protect that important species.
2. Acute toxicity tests should have been conducted using accep-table procedures (e.g., ASTM Standard E 724 or 729).
3. Generally, results of acute tests in which food was added tothe test solution should not be used, unless data indicatethat food did not affect test results.
4. Results of acute tests conducted in unusual dilution water,e.g., dilution water containing high levels of total organiccarbon or particulate matter (higher than 5 mg/L) should notbe used, unless a relationship is developed between toxicityand organic carbon or unless data show that organic carbon orparticulate matter, etc. do not affect toxicity.
5. Acute values should be based on endpoints which reflect thetotal adverse impact of the test material on the organismsused in the tests. Therefore, only the following kinds ofdata on acute toxicity to freshwater aquatic animals shouldbe used:
a. Tests with daphnids and other cladocerans should be star-ted with organisms (24 hr old and tests with midgesshould be started with second- or third-instar larvae.The result should be the 48-hr ECS0 based on percentageof organisms immobilized plus percentage of organismskilled. If such an ECSO is not available from a test,the 48-hr LC5O should be used in place of the desired48-hr ECSO. An ECSO or LCSO of longer than 48 hr can beused provided animals were not fed and control animalswere acceptable at the end of the test.
A-S
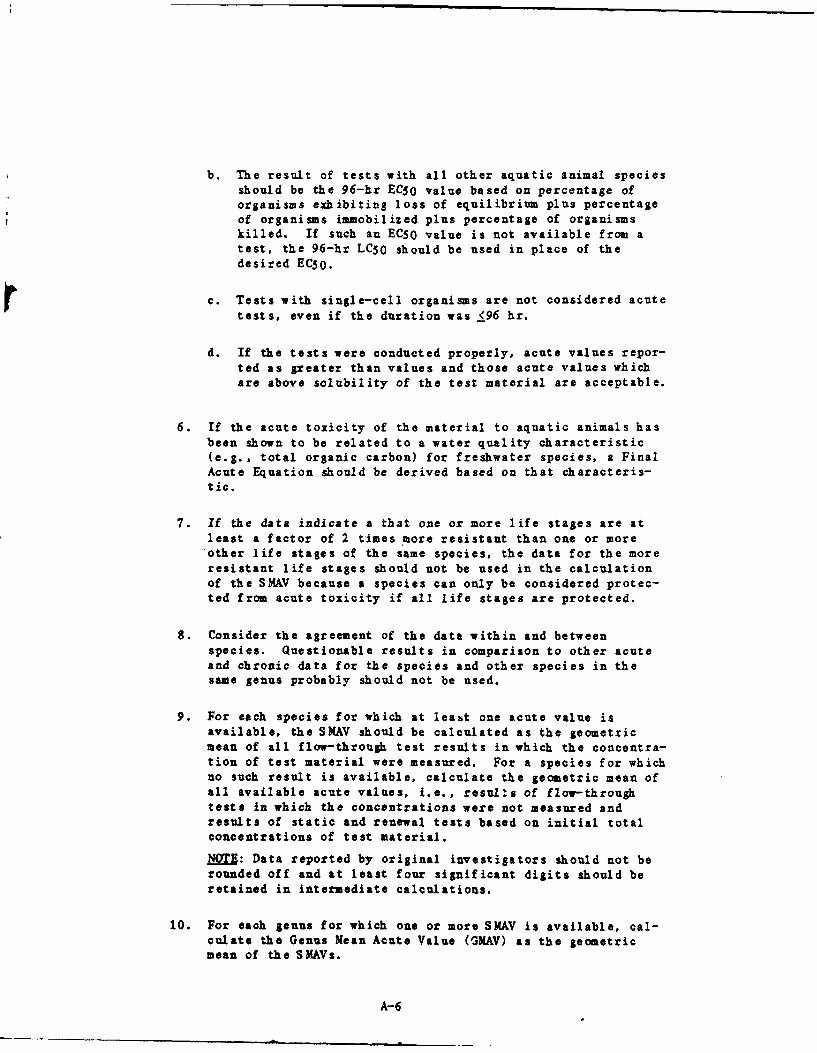
b. The result of tests with all other aquatic animal speciesshould be the 96-hr ECSO value based on percentage oforganisms exhibiting loss of equilibrium plus percentageof organisms immobilized plus percentage of organismskilled. If such an EC5O value is not available from atest, the 96-hr LC5O should be used in place of thedesired EC5O.
c. Tests with single-cell organisms are not considered acutetests, oven if the duration was <96 hr.
d. If the tests were conducted properly, acute values repor-ted as greater than values and those acute values whichare above solubility of the test material are acceptable.
6. If the acute toxicity of the material to aquatic animals hasbeen shown to be related to a water quality characteristic(e.g., total organic carbon) for freshwater species, a FinalAcute Equation should be derived based on that characteris-tic.
7. If the data indicate a that one or more life stages are atleast a factor of 2 times mor~e resistant than one or moreother life stages of the same Species, the data for the moreresistant life stages should not be used in the calculationof the SMAV because a species can only be considered protec-ted from acute toxicity if all life stages are protected.
8. Consider the agreement of the data within and betweenspecies. Questionable results in comparison to other acuteand chronic data for the species and other species in thesame genus probably should not be used.
9. For each species for which at leabt one acute value isavailable, the SMAV should be calculated as the geometricmean of all flow-through test results in which the concentra-tion of test material were measured. For a species for whichno such result is available, calculate the geometric mean ofall available acute values, i.e., results of flow-throughtests in which the concentrations were not measured andresults of static and renewal tests based on initial totalconcentrations of test material.
NOTE: Data reported by original investigators should not berounded off and at least four significant digits should beretained in intermediate calculations.
10. For each genus for which one or more SMAV is available, cal-culate the Genus Mean Acute Value (SMAV) as the geometricmean of the SMAVs.
A-6
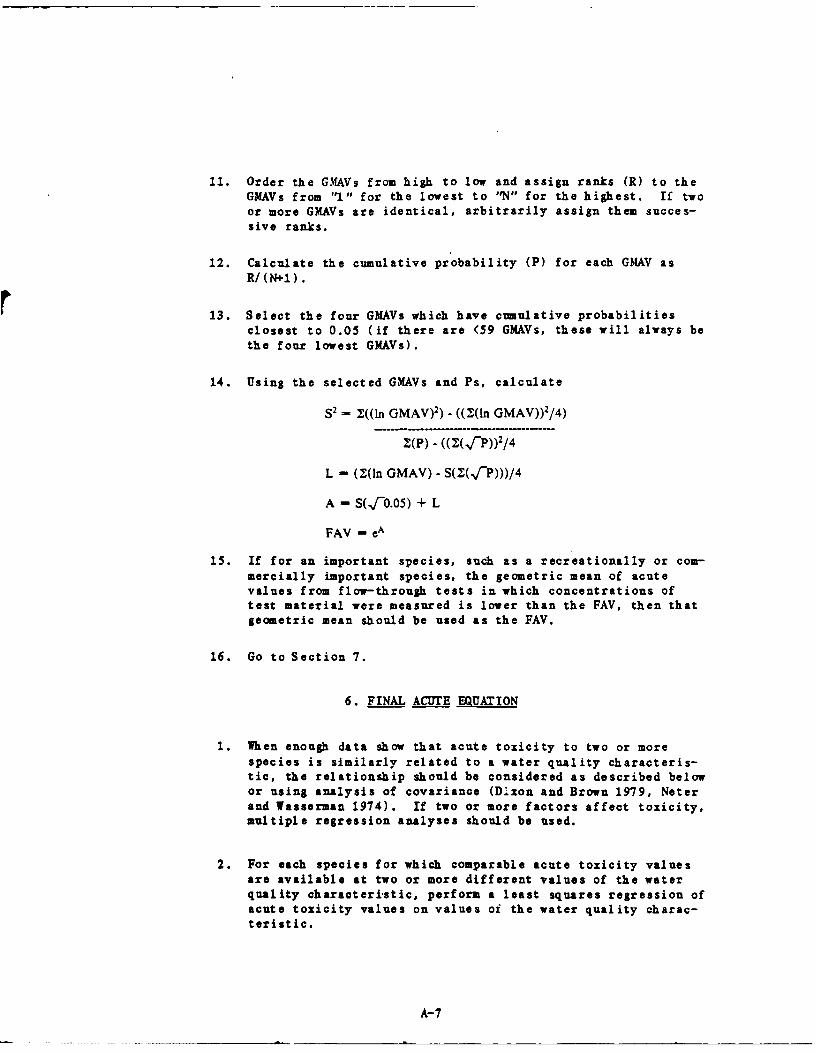
11. Order the G.XAVs from high to low and assign ranks (R) to theGMAVs from "1" for the lowest to "N" for the highest. If twoor more GMAVs are identical, arbitrarily assign them succes-sive ranks.
12. Calculate the cumulative probability (P) for each GMAV asR/(N+1).
13. Select the four GMAVs which have cumulative probabilities
closest to 0.05 (if there are <59 GMAVs, these will always bethe four lowest GMAVs).
14. Using the selected GMAVs and Ps, calculate
S' - Z((ln GMAV)2) - ((ZV(In GMAV)) 2/4)
Z(P) - ((Z(.TP))2 /4
L - (-(In GMAV) - S(Z(v/P)))/4
A - S(,fo.05) + L
FAV - eA
15. If for an important species, such as a recreationally or com-mercially important species, the geometric mean of acutevalues from flow-through tests in which concentrations oftest material were measured is lower than the FAV, then thatgeometric mean should be used as the FAV.
16. Go to Section 7.
6. FINAL ACUTE EQUATION
1. When enough data show that acute toxicity to two or morespecies is similarly related to a water quality characteris-tic, the relationship should be considered as described belowor using analysis of covariance (Dixon and Brown 1979, Neterand Wasserman 1974). If two or more factors affect toxicity,multiple regression analyses should be used.
2. For each species for which comparable acute toxicity valuesare available at two or more different values of the waterquality characteristic, perform a least squares regression ofacute toxicity values on values oi the water quality charac-teristic.
A-7
3. Decide whether the data for each species is useful, consider-ing the range and number of tested values of the water qual-ity characteristic and degree of agreement within and betweenspecies. In addition, question~able results, in comparisonwith other acute and chronic data for the species and otherspecies in the same genus, probably should not be used.
4. Individually for each species calculate the geometric mean ofthe acute values and then divide each of the acute values fora species by the mean for the species. This normalizes theacute values so that the geometric mean of the normalizedvalues for each species individually and for any combinationof species is 1.0
5. Similarly normalize the values of the water quality charac-teristic for each species individually.
6. Individually for each species perform a least squares regres-sion of the normalized acute toxicity values on thecorresponding normalized values of of the water qualitycharacteristic. The resulting slopes and 95 percent confi-dence limits will be identical to those obtained in 2. above.Now, however, if the data are actually plotted, the line ofbest fit for each individual species will go through thepoint 1,1 in the center of the graph.
7. Treat all the normalized data as if they were all for thesame species and perform a least squares regression of allthe normalized acute values on the corresponding normalizedvalues of the water quality characteristic to obtain thepooled acute slope (V and its 95 percent confidence limits.If all the normalized data are actually plotted, the line ofbest fit will go through the point 1,1 in the center of thegraph.
8. For each species calculate the geometric mean (W of theacute toxicity values and the geometric mean MX of the rela-ted values of the water quality characteristic (calculated in4. and 5. above).
9. For each species calculate the logarithmic intercept (Y ofthe SMAV at a selected value MZ of the water quality charac-teristic using the equation: Y =ln W - V(ln X ln Z).
10. For each species calculate the SMAV using: SMAV =ey.
A- 8
11. Obtain the FAV at Z by using the procedure described in Sec-
tion 5. (No. 10-14).
12. If the SMAV for an important species is lower than the FAV atZ, then that SMAV should be used as the FAV at Z.
13. The Final Acute Equation is written as: FAV = e(V[ln(waterquality characteristic) + in A - V[ln Z]), where V = pooled
acute slope and A = FAV at Z. Because V, A, and Z are known,the FAV can be calculated for any selected value of the waterquality characteristic.
7. FINAL CHRONIC VALUE
1. Depending on available data, the Final Chronic Value (FCV)might be calculated in the same manner as the FAV or by divi-ding the FAV by the Final Acute-Chronic Ratio.
NOTE: Acute-chronic ratios and application factors are waysof relating acute and chronic toxicities of a material toaquatic organisms. Safety factors are used to provide anextra margin of safety beyond known or estimated sensitivi-ties of aquatic organisms. Another advantage of the acute-chronic ratio is that it should usually be greater than one;this should avoid confusion as to whether a large applicationfactor is one that is close to unity or one that has a denom-inator that is much greater than the numerator.
2. Chronic values should be based on results of flow-through(except renewal is acceptable for daphnids) chronic tests inwhich concentrations of test material were properly measured
at appropriate times during testing.
3. Results of chronic tests in which survival, growth, or repro-duction in controls was unacceptably low should not be used.Limits of acceptability will depend on the species.
4. Results of chronic tests conducted in unusual dilution watershould not be used, unless a relationship is developedbetween toxicity and the unusual characteristic or unlessdata show the characteristic does not affect toxicity.
S. Caronic values should be based on endpoints and exposuredurations appropriate to the species. Therefore, onlyresults of the following kinds of chronic toxicity tests
should be used:
A-9
a. Life-cycle toxicity tests consisting of exposures of twoor more groups of a species to a different concentrationof test material throughout a life cycle. Tests withfish should begin with embryos or newly hatched young <48hr old, continue through maturation and reproduction, andshould end not <24 days (90 days for salmonids) after thehatching of the next generation. Tests with daphnidsshould begin with young <24 hr old and last for not <21days. For fish, data should be obtained and analyzed onsurvival and growth of adults and young, maturation ofmales and females, eggs spawned per female, embryo via-bility (salmonids only), and hatchability. For daphnids,data should be obtained and analyzed on survival andyoung per female.
b. Partial life-cycle toxicity tests consisting of exposuresof two or more groups of a species to a different concen-tration of test material throughout a life cycle. Par-tial life-cycle tests are allowed with fish species thatrequire more than a year to reach sexual maturity, sothat all major life stages can be exposed to the testmaterial in less than 15 months. Exposure to the testmaterial should begin with juveniles at least 2 monthsprior to active gonadal development, continue throughmaturation and reproduction, and should end not (24 days(90 days for salmonids) after the hatching of the nextgeneration. Data should be obtained and analyzed on sur-vival and growth of adults and young, maturation of malesand females, eggs spawned per female, embryo viability(salmonids only), and hatchability.
c. Early life-stage toxicity tests consisting of 28- to 32-day (60 days posthatch for salmonids) exposures of earlylife stages of a species of fish from shortly after fer-tilization through embryonic, larval, and early juveniledevelopment. Data should be obtained on growth and sur-vival.
NOTE: Results of an early life-stage test are used aspredictors of results of life-cycle and partial life-cycle tests with the same species. Therefore, whenresults of a life-cycle or partial life-cycle test areavailable, results of an early life-stage test with thesame species should not be used. Also, results of earlylife-stage tests in which the incidence of mortalities orabnormalities increased substantially near the end of thetest should not be used because results of such tests maybe poor estimates of results of a comparable life-cycleor partial life-cycle test.
A-10
6. A chronic value may be obtained by calculating the geometricmean of lower and upper chronic limits from a chronic test orby analyzing chronic data using regression analysis. A loverchronic limit is the highest tested concentration (a) in anacceptable chronic test, (b) which did not cause an unaccep-table amount of an adverse effect on any specified biologicalmeasurements, and (c) below which no tested concentrationcaused such an unacceptable effect. An upper chronic limitis the lowest tested concentration (a) in an acceptablechronic test, (b) which did cause an unacceptable amount ofan adverse effect on one or more of specified biologicalmeasurements, and (c) above which all tested concentrationscaused such an effect.
7. If chronic toxicity of material to aquatic animals appears tobe related to a water quality characteristic, a Final ChronicEquation should be derived based on that water qualitycharacteristic. Go to Section 8.
8. If chronic values are available for species in eight familiesas described in Section 4 (No. 1), a Species Mean ChronicValue (SMCV) should be calculated for each species for whichat least one chronic value is available by calculating thegeometric mean of all chronic values for the specie andappropriate Genus Mean Chronic Values should be calculated.The FCV should then be obtained using procedures described inSection 5 (No. 10-14). Then go to Section 7 (No. 13).
9. For each chronic value for which at least one correspondingappropriate acute value is available, calculate an acute-chronic ratio, using for the numerator the geometric mean ofresults of all acceptable flow-through (except static isacceptable for daphnids) acute tests in the same dilutionwater and in which concentrations were measured. For fish,the acute test(s) should have been conducted with juveniles.Acute teat(s) should have been part of the same study as thechronic test. If acute tests were not conducted as part ofthe same study, acute tests conducted in the same laboratoryand dilution water may be used. If aCute tests were not con-ducted as part of the same study, &cute tests conducted inthe same dilution water but a different laboratory may beused. If such acute tests are not available, an acute-chronic ratio should not be calculated.
10. For each species, calculate the species mean acute-chronicratio as the geometric mean of all acute-chronic ratios forthat species.
A-l1
11. For some materials the acute-chronic ratio is about the samefor all species, but for other materials the ratio increasesor decreases as the SMAV increases. Thus. the Final Acute-Chronic Ratio can be obtained in three ways, depending on thedata.
a. If the species mean acute-chronic ratio increases ordecreases as the SMAV increases, the final Acute-ChronicRatio should be calculated as the geometric mean of allspecies whose SMAVs are close to the FAV.
b. If no major trend is apparent and the acute-chronicratios for a number of species are within a factor often, the Final Acute-Chronic Ratio should be calculatedas the geometric mean of all species mean acute-chronicratios for both freshwater and saltwater species.
c. If the most appropriate species mean acute-chronic ratiosare (2.0, and especially if they are <1.0, acclimationhas probably occurred during the chronic test. Becausecontinuous exposure and acclimation cannot be assured toprovide adequate protection in field situations, theFinal Acute-Chronic Ratio should be set at 2.0 so thatthe FCV is equal to the Criterion Maximum Concentration.
If the acute-chronic ratios do not fit one of these cases, aFinal Acute-Chronic Ratio probably cannot be obtained, and aFCV probably cannot be calculated.
12. Calculate the FCV by dividing the FAV by the Final Acute-Chronic Ratio.
13. If the SMAV of an important species is lower than the calcu-lated FCV, then that SMCV should be used as the FCV.
14. Go to Section 9.
8. FINAL CHRONIC EQUATION
1. A Final Chronic Equation can be derived in two ways. Theprocedure described in this section will result in thechronic slope being the same as the acute slope.
a. If acute-chronic ratios for enough species at enoughvalues of the water quality characteristics indicate thatthe acute-chronic ratio is probably the same for allspecies and independent of the water quality
A-12
characteristic, calculate the Final Acute-Chronic Ratioas the geometric mean of the species mean acute-chronicjratios.
b. Calculate the FCV at the selected value Z of the waterquality characteristic by dividing the FAV at Z by theFinal Acute-Chronic Ratio.
c. Use V = pooled acute slope as L = pooled chronic slope.
d. Go to Section 8, No. 2. item m.
2. Thea procedure described in this section will usually resultin the chronic slope being different from the acute slope.
a. When enough data are available to show that chronic toxi-city to at least one species is related to a water qual-ity characteristic, the relationship should be consideredas described below or using analysis of covariance (Dixonand Brown 1979, Neter and Wasserman 1974). If two ormore factors affect toxicity, multiple regressionanalyses should be usedi
b. For each species for which comparable chronic toxici tyvalues are available at two or more different values ofthe water quality characteristic, perform a least squaresregression Of chronic toxicity values on values of thewater quality characteristic.
c. Decide whether data for each species is useful, takinginto account range and number of tested values of thewater quality characteristic and degree of agreementwithin and between species. In addition, questionableresults, in comparison with other acute and chronic datafor the species and other species in the same genus, pro-bably should not be used. If a Useful chronic slope isnot available for at least one species or if the slopesare too dissimilar or if data are inadequate to definethe relationship between chronic toxicity and water qual-ity characteristic, return to Section 7 (No. 8), usingresults of tests conducted under conditions and in watersimilar to those commonly used for toxicity tests withthe species.
d. For each species calculate the geometric mean of theavailable chronic values and then divide each chronicvalue for a species by the mean for the species.
A-1 3
4
This normalizes the chronic values so that the geometricmean of the normalized values for each species and forany combination of species is 1.0.
e. Similarly normalize the values of the water qualitycharacteristic for each species individually.
f. Individually for each species perform a least squaresregression of the normalized chronic toxicity values onthe corresponding normalized values of the water qualitycharacteristic. The resulting slopes and 95 percent con-fidence limits will be identical to those obtained in 1.above. Now, however, if the data are actually plotted,the line of best fit for each individual species will gothrough the point 1,1 in the center of the graph.
g. Treat all the normalized data as if they were all for thesame species and perform a least squares regression ofall the normalized chronic values on the correspondingnormalized values of the water quality characteristic toobtain the pooled chronic slope (L) and its 95 percentconfidence limits. If all the normalized data are actu-ally plotted, the line of best fit will go through thepoint 1,1 in the center of thq graph.
h. For each species calculate the geometric mean (M) of tox-icity values and the geometric mean (P) of related valuesof the water quality characteristic.
i. For each species calculate the logarithm (Q) of the SMCVsat a selected value (Z) of the water quality characteris-tic using the equation: Q = in M - L(ln P - ln Z).
J. For each species calculate a SMCV at Z as the antilog ofQ (SMCV = eQ).
k. Obtain the FCV at Z by using the procedure described inSection 5 (No. 10-14).
1. If the SMCV at Z of an important species is lower thanthe calculated FCV at Z, then that SMCV should be used asthe FCV at Z.
m. The Final (hronic Equation is written as: FCV =e(Lln(water quality characteristic)] i In S - L[ln Z]),where L - mean chronic slope and S - FCV at Z.
A-14
9. FINAL PLANT VALUE
1. Appropriate measures of toxicity of the material to aquaticplants are used to compare relative sensitivities of aquaticplants and animals. Although procedures for conducting andinterpreting results of toxicity tests with plants are notwell developed, results of such tests usually indicate thatcriteria which adequately protect aquatic animals and their
uses also protect aquatic plants and their uses.
2. A plant value is the result of any test conducted with analga or an aquatic vascular plant.
3. Obtain the Final Plant Value by selecting the lowest resultobtained in a test on an important aquatic plant species inwhich concentrations of test material were measured and theendpoint is biologically important.
10. FINAL RESIDUE VALUE
1. The Final Residue Value (FRV) is intended to (a) prevent con-
centrations in commercially or recreationally important aqua-tic species from exceeding applicable FDA action levels and(b) protect wildlife, including fish and birds, that consumeaquatic organisms from demonstrated unacceptable effects.
The FRV is the lowest of residue values that are obtained bydividing maximum permissible tissue concentrations byappropriate bioconcentration or bioaccumulation factors. Amaximum permissible tissue concentration is either (a) a FDAaction level (FDA administrative guidelines) for fish oil orfor the edible portion of fish or shellfish or (b) a maximumacceptable dietary intake (ADI) based on observations on sur-
vival, growth, or reproduction in a chronic wildlife feedingstudy or a long-term wildlife field study. If no maximumpermissible tissue concentration is available, go to Section
11., because a Final Residue Value cannot be derived.
2. Bioconcentration Factors (BCFs) and Bioaccumulation Factors(BAFs) are the quotients of the concentration of a materialin one or more tissues of an aquatic organism divided by theaverage concentration in the solution to which the organismhas been exposed. A BCF is intended to account only for netuptake directly from water, and thus almost has to bemeasured in a laboratory test. A BAF is intended to accountfor net uptake from both food and water in a real-worldsituation, and almost has to be measured in a field situationin which predators accumulate the material directly from
A-15
water and by consuming prey. Because so few acceptable BAFs
are available, only BCFs will be discussed further, but an
acceptable BAF can be used in place of a BCF.
3. If a maximum permissible tissue concentration is availablefor a substance (e.g, parent material or parent material plusmetabolite), the tissue concentration used in BCF calcula-tions should be for the same substance. Otherwise the tissueconcentration used in the BCF calculation should be that ofthe material and its metabolites which are structurally simi-lar and are not much more soluble in water than the parentmaterial.
a. A BCF should be used only if the test was flow-through,the BCF was calculated based on measured concentrationsof test material in tissue and in the test solution, andexposure continued at least until either apparentsteady-state (BCF does not change significantly over aperiod of time, such as two days or 16 percent of expo-sure duration, whichever is longer) or 28 days wasreached. The BCF used from a test should be the highestof (a) the apparent steady-state BCF, if apparentsteady-state was reached; (b) highest BCF obtained, ifapparent steady-state was not reached; and (c) projectedsteady-state BCF, if calculated.
b. Whenever a BCF is determined for a lipophilic material,percentage of lipids should also be determined in thetissue(s) for which the BCF is calculated.
c. A BCF obtained from an exposure that adversely effectedthe test organisms may be used only if it is similar tothat obtained with unaffected individuals at lower con-centrations that did cause effects.
d. Because maximum permissible tissue concentrations arerarely based on dry weights, a BCF calculated using drytissue weights must be converted to a wet tissue weightbasis. If no conversion factor is reported with the BCF,multiply the dry weight by 0.1 for plankton and by 0.2for species of fishes and invertebrates.
e. If more than one acceptable BCF is available for aspecies, the geometric mean of values should be used,unless the BCFs are from different exposure durations,then the BCF for the longest exposure should be used.
A-16
AD-AI79 685 CR~NL IT EM!"NH NI OAK UIDGI 2/2
U14CLASS IFIED~ F/G 6/26 ML
L 32
IIII I 1 -l
'CROCOPY RESOLUTION TEST CHARTNATONAL BUREAU OF STANDARDS- 1963-A
1.2. 1.4 11(1 1.
4. If enough pertinent data exist, several residue values can becalculated by dividing maximum permissible tissue concentra-tions by appropriate BCFs:
a. For each available maximum ADI derived from a feedingstudy or a long-term field study with wildlife, includingbirds and aquatic organisms, the appropriate BCF is basedon the whole body of aquatic species which constitute orrepresent a major portion of the diet of tested wildlifespecies.
b. For an FDA action level for fish or shellfish, theappropriate BCF is the highest geometric mean species BCFfor the edible portion of a consumed species. Thehighest species BCF is used because FDA action levels areapplied on a species-by-species basis.
5. For lipophilic materials, it may be possible to calculateadditional residue values. Because the steady-state BCF fora lipophilic material seems to be proportional to percentageof lipids from one tissue to another and from one species toanother (Hamelink et al. 1971, Lundsford and Blem 1982,Schnoor 1982), extrapolations can be made from tested tissuesor species to untested tissues or species on the basis ofpercentage of lipids.
a. For each BCF for which percentage of lipids is known forthe same tissue for which the BCF was measured, normalizethe BCF to a one percent lipid basis by dividing the BCFby percentage of lipids. This adjustment makes all themeasured BCFs comparable regardless of species or tissue.
b. Calculate the geometric mean normalized BCF.
c. Calculate all possible residue values by dividing availa-ble maximum permissible tissue concentrations by the meannormalized BCF and by the percentage of lipids valuesappropriate to the maximum permissible tissue concentra-tion.
,6 For an FDA action level for fish oil, the appropri-ate percentage of lipids value is 100.
* For an FDA action level for fish, the appropriatepercentage of lipids value is 11 tor freshwater cri-teria, based on the highest levels for importantconsued species (Sidwell 1981).
A-17
* For a maximum ADI derived from a chronic feedingstudy or long-term field study with wildlife, theappropriate percentage of lipids is that of an aqua-tic species or group of aquatic species which con-stitute a major portion of the diet of the wildlifespecies.
6. The FRV is obtained by selecting the lowest of availableresidue values.
11. MRa DT
Pertinent information that could not be used in earlier sectionsmay be available concerning adverse effects on aquatic organisms andtheir uses. The most important of these are data on cumulative anddelayed toxicity, flavor impairment, reduction in survival, growth, orreproduction, or any other biologically important adverse effect.Especially important are data for species for which no other data areavailable.
12. CrIfol
1. A criterion consists of two concentrations: the Criterion
Maximum Concentration and the Criterion Continuous Concentra-tion.
2. The Criterion Maximum Concentration (CMC) is equal to one-half of the FAV.
3. The Criterion Continuous Concentration (CCC) is equal to thelower of the FCV, the Final Plant Value, and the FRV unlessother data show a lower value should be used. If toxicity isrelated to a water quality characteristic, the CCC isobtained from the Final Chronic Equation, the Final PlantValue, and the FRV by selecting the value or concentrationthat results in the lowest concentrations in the usual rangeof the water quality characteristic, unless other data (seeSection 11) show that a lower value should be used.
4. Round both the CCC and CHC to two significant figures.
A-18
5. The criterion is stated as:
The procedures described in the Guidelines for DerivingNumerical National Water Quality Criteria for the Protectionof Aauatic Organisms and Their Uses indicate that (exceptpossibly where a locally important species is very sensitive)(1) aquatic organisms and their uses should not be affectedunacceptably if the four-day average concentration of (2)does not exceed (3) 1g/L more than once every three years onthe average and if the one-hour average concentration doesnot exceed (4) g$/L more than once every three years on theaverage.
Where
(I) = insert freshwater or saltwater,
(2) - name of material,
(3) = insert the Criterion Continuous Concentration, and
(4) = insert the Criterion Maximum Concentration.
A-19
13. REFERENCES
ASTM Standards E 729. Practice for Conducting Acute Toxicity Tests withFishes, Macroinvertebrates, and Amphibians.
ASTM Standards E 724. Practice for Conducting Static Acute ToxicityTests with Larvae of Four Species of Bivalve Molluscs.
Dixon, W.J. and M.B. Brown, eds. 1979. BMDP Biomedical Computer Pro-grams, P-Series. University of California, Berkeley. pp. 521-539.
Erickson, R.3. and C.E. Stephan. In Preparation. Calculation of theFinal Acute Value for Water Quality Criteria for Aquatic Life. USEnvironmental Protection Agency, Duluth, M.
FDA Administrative Guidelines Manual. Food and Drug Administration.
Hamelink, I.L., et al. 1971. A Proposal: Exchange Equilibria Control theDegree Chlorinated Hydrocarbons are Biologically Magnified in LenticEnvironments. Trans. Am. Fish. Soc. 100:207-214.
Ruth, E.J., et al. 1978. Council of Biological Editors Style Manual, 4thed., p. 117.
Lunsford, C.A. and C.R. Blem. 1982. Annual Cycle of Kepone Residue inLipid Content of the Estuarine Clam, Rangia cuneata. Estuaries 5:121-130.
Schnoor, I.L. 1982. Field Validation of Water Quality Criteria forHydrophobic Pollutants. In: Aquatic Toxicology and Hazard Assessment:Fifth Conference, ASTM STP 766, I.G. Pearson, R.B. Foster, and W.E.Bishop, eds., American Society for Testing and Methods, pp. 302-315.Sidwell, V.D. 1981. Cemical and Nutritional Composition of Finfishes,Whales, Crustaceans, Mollusks, and Their Products. NOAA TechnicalMemorandum N= F/SEC-li, National Marine Fisheries Service.
Stephan, C.E., D.I. Mount, D.3. Hansen, I.E. Gentile, G.A. Chapman, andW.A. Brungs. 1985. Guidelines for Deriving Numerical National WaterQuality Criteria for the Protection of Aquatic Organisms and Their Uses.Final Report, PB85-227049. US Envirormental Protection Agency, Office ofResearch and Development, Washington DC. 97 pp.
US Environmental Protection Agency (USEPA). 1982. Fed. lue. 47:49234-49252, October 29, 1982.
A-20
APPENDIX B:SUMMARY OF US EPA METHODOLOGY FOR DETERMINING WATER QUALITY
CRITERIA FOR THE PROTECTION OF HUMAN HEALTH
The following smmry is a condensed version of the 1980 final US
Environmental Protection Agency (USEPA) guidelines for calculating awater quality criteria to protect human health and is slanted towards
the specific regulatory needs of the US Army. The guidelines are the
nest recent document outlining the required procedures and were pub-lished in the Federal Retiste (USEPA 1980). For greater detail onindividual points consult that reference.
1. INTRODUCTION
The EPA's water quality criteria for the protection of human health are
based on one or more of the following properties of a chemical pollu-tant:
a) Carcinogenicity, b) Toxicity, and c) Organoleptic (taste andodor) effects.
The meanings and practical uses of the criteria values are dis-
tinctly different depending on the properties on which they are based.Criteria based solely on organoleptic effects do not necessarilyrepresent approximations of acceptable risk levels for human health. In
all other cases the criteria values represent either estimations of themaximum allowable ambient water concentrations of a pollutant whichwould prevent adverse health effects or, for suspect and proven carcino-gens, estimations of the increased cancer risk associated with incremen-tal changes in the ambient water concentration of the substance. Socialand economic costs and benefits are not considered in determining waterquality criteria. In establishing water quality standards, the choiceof the criterion to be used depends on the designated water use. In thecase of a multiple-use water body, the criterion protecting the mostsensitive use is applied.
2. DATAE FOR U HEL CRITRIA
Criteria documentation requires information on: (1) exposurelevels, (2) pharmacokinetics, and (3) range of toxic effects of a givenwater pollutant.
2.1 EXPOSURE DATA
For an accurate assessment of total exposure to a chemical, con-sideration must be given to all possible exposure routes includingingestion of contaminated water and edible aquatic and nonaquatic organ-isms, as well as exposure through inhalation and dermal contact. Forwater quality criteria the most important exposure routes to be con-sidered are ingestion of water and consumption of fish and shellfish.
B-1
Generally. exposure through inhalation, dermal contact, and non-aquaticdiet is either unknown or so low as to be insignificant; however, whenI such data are available, they must be included in the criteria evalua-tion.
The EPA guidelines for developing water quality criteria are basedon the following assumptions which are designed to be protective of ahealthy adult male who is subject to average exposure conditions:
1. The exposed individual is a 70-kg male person (InternationalCommission on Radiological Protection 1977).
2. The average daily consumption of freshwater and estuarine fishand shellfish products is equal to 6.5 grams.
3. The average daily ingestion of water is equal to 2 liters(Drinking Water and Health, National Research Council 1977).
Because fish and shellfish consumption is an important exposure factor,information on bioconcentration of the pollutant in edible portions ofingested species is necessary to calculate the overall exposure level.The bioconcentration factor (BCF) is equal to the quotient of the con-centration of a substance in all or part of an organism divided by theconcentration in ambient water to which the organism has been exposed.The BCF is a function of lipid solubility of the substance and relativeamount of lipids in edible portions of fish or shellfish. To determinethe weighted average BCF, three different procedures can be used depen-ding upon lipid solubility and availability of bioconcentration data:
(1) For lipid soluble compounds, the average BCF is calculated fromthe weighted average percent lipids in ingested fish and shellfishin the average American diet. The latter factor has been estimatedto be 3 percent (Stephan 1980, as cited in USEPA 1980)
Because steady-state BCFs for lipid soluble compounds are propor-tional to percent lipids, the BCF for the average American diet canbe calculated as follows:
BCF&avg BCFsp x 1.0,PLsp
where BCFsp is the bioconcentration factor for an aquatic speciesand PLsp is the percent lipids in the edible portions of thatspecies.
(2) Where an appropriate bioconcentration factor is not available,the BCF can be estimated from the octanol/water partition coeffi-cient P) of a substance as follows:
log BCF - (0.85 log P) - 0.70
for aquatic organisms containing about 7.6 percent lipids (Veith et
al. 1980, as cited in USEPA 1980). An adjustment for percent
B-2
lipids in the average diet (3 percent versus 7.6 percent) is madeto derive the weighted average bioconcentration factor.
(3) For nonlipid-soluble compounds, the available BCFs for edibleportions of consumed freshwater And estuarine fish and shellfishare weighted according to consumption factors to determine theweighted BCF representative of the average diet.
2.2 PHARMACOKINErIC DATA
Pharmacokinetic data, encompassing information on absorption, dis-tribution, metabolism, and excretion, are needed for determining thebiochemical fate of a substance in human and animal systems. Informa-tion on absorption and excretion in animals, together with a knowledgeof ambient concentrations in water, food, and air, are useful in estima-ting body burdens in humans. Pharmacokinetic data are also essentialfor estimating equivalent oral doses based on data from inhalation orother routes of exposure.
2.3 BIOLOGICAL EFFECTS DATA
Effects data which are evaluated for water quality criteria includeacute, subchronic, and chronic toxicity; synergistic and antagonisticeffects; and genotoxicity, teratogenicity, and carcinogenicity. Thedata are derived primarily from animal studies, but clinical case his-tories and epidemiological studies may also provide useful information.According to the EPA (USEPA 1980), several factors inherent in humanepidemiological studies often preclude their use in generating waterquality criteria (see NM 1977). However, epidemiological data can beuseful in testing the validity of animal-to-man extrapolations.
From an assessment of all the available data, a biological end-point, i.e., carcinogenicity, toxicity, or organoleptic effects isselected for criteria formulation.
3. UNAH HEALTH CTITERIA FOR CARCINOGEIC SUBSTANCES
If sufficient data exist to conclude that a specific substance is apotential human carcinogen (carcinogenic in animal studies, with suppor-tive senotoxicity data, and possibly also supportive epidemiologicaldata) then the position of the EPA is that the water quality criterionfor that substance (recommended ambient water concentration for maximumprotection of human health) is zero. This is because the EPA believesthat no method exists for establishing a threshold level for carcino-genic effects, and, consequently, there is no scientific basis for esta-blishing a "safe" level. To better define the carcinogenic risk associ-ated with a particular water pollutant, the EPA has developed a metho-dology for determining ambient water concentrations of the substancewhich would correspond to incremental lifetime cancer risks of 10- 7 to
B-3
10-5 (one additional case of cancer in populations ranging from ten mil-lion to 100,000, respectively). These risk estimates, however, do notrepresent an EPA judgment as to an "acceptable" risk level.
3.1 NETEODOLOGY FOR DETERMINING CARCINOGENICITY (NONTHRESHOLD) CRITERIA
The ambient water concentration of a substance corresponding to aspecific carcinogenic risk can be calculated as follows:
70 x -PR
C ql* (2 + 0.0065BCF)
where,
C - ambient water concentration;FR f the probable risk (e.g., 10-5; equivalent to one case in 100,000);BCF = the bioconcentration factor; andql= a coefficient (defined below) (USEPA 1980).
By rearranging the terms in this equation, it can be seen that the ambientwater concentration is one of several factors which define the overall exposurelevel:
PR = ql* x C (2 + 0.0065 BCF)
70
or
PR = ql* x 2C + (0,0065 BCF x C),70
where, 2C is the daily exposure resulting from drinking 2 litersof water per day and (0.0065 x BCF x C) is the averagedaily exposure resulting from the consumption of 6.5 mgof fish and shellfish per day. Because the exposure iscalculated for a 70-kg man, it is normalized to a perkilogram basis by the factor of 1/70. In thisparticular case, exposure resulting from inhalation,dermal contact, and nonaquatic diet is consideredto be negligible.
In simplified terms the equation can be rewritten
PR = q.1 X,
where X is the total average daily exposure in mg/kg/dayor
ql e - PR
I
showing that the coefficient ql e is the ratio ofrisk to dose; an indication of the carcinogenic potencyof the compound.
The USEPA guidelines state that for the purpose of developing waterquality criteria, the assumption is made that at low dose levels there
B-4
is a linear relationship between dose and risk (at high doses, however,there may be a rapid increase in risk with dose resulting in a sharplycurved dose/response curve). At low doses then, the ratio of risk todose does not change appreciably and ql* is a constant. At high dosesthe carcinogenic potency can be derived directly from experimental data,but for risk levels of 10-7 to 10-5, which correspond to very low doses,the ql* value must be derived by extrapolation from epidemiological dataor from high dose, short-term animal bioassays.
3.2 CARCINOGEIC POTENCY CALCULATED FROM HUMAN DATA
In human epidemiological studies, carcinogenic effect is expressedin terms of the relative risk [RR(X)] of a cohort of individuals atexposure X compared to the risk in the control group [PR(control)](e.g., if the cancer risk in group A is five times greater than that ofthe control group, then RR(X) = 5) . In such cases the "excess" relativecancer risk is expressed as RR(X) - 1, and the actual numeric, or pro-portional excess risk level [PR(I)J can be calculated:
PRW() - [RR(() - 1] x PR(control).
Using the standard risk/dose equation:
PRW() = b x X
and substituting for PR(1):
[RRM() - 1] x PR(control) - b x X
or
b = [RR(X) - 11 x PR(control),
Iwhere b is equal to the carcinogenic potency or ql*.
3.3 CARCINOGENIC POTENCY CALCULATED FROM ANIMAL DATA
In the case of animal studies where different species, strains, and sexesmay have been tested at different doses, routes of exposure, andexposure durations, any data sets used in calculating thehealth criteria must conform to certain standards:
1. The tumor incidence must be statistically significantly higherthan the control for at least one test dose level and/or thetumor incidence rate must show a statistically significanttrend with respect to dose level.
2. The data set giving the highest estimate of carcinogeniclifetime risk (qo*) should be selected unless the sample sizeis quite mall and another data set with a similar dose-response relationship and larger sample size is available.
B-S
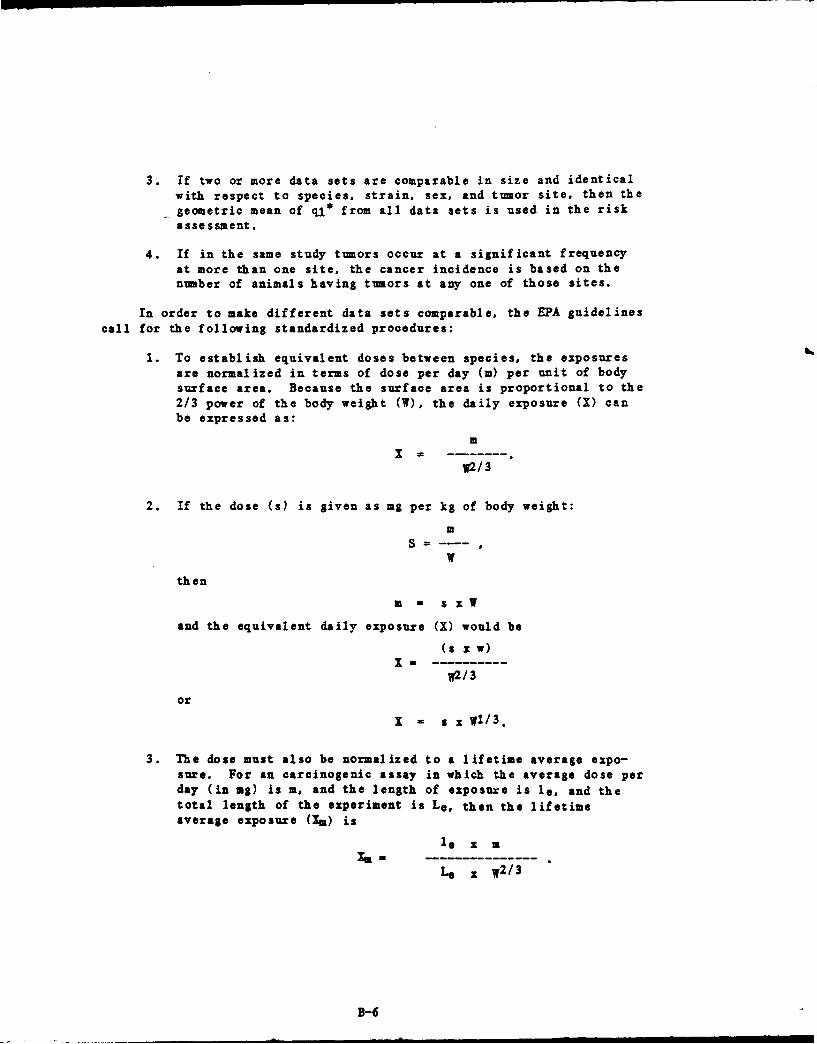
3. If two or more data sets are comparable in size and identicalWith respect to Species, strain. sex, and tumor site, then thegeometric mean of qj* from all data sets is used in the riskassessment.
4. If in the same study tumors occur at a significant frequencyat more than one site, the cancer incidence is based on thenuber of animals having tumors at any one of those sites.
In order to make different data sets comparable, the EPA guidelinescall for the following standardized procedures:
1. To establish equivalent doses between species, the exposuresare normalized in terms of dose per day (in) per unit of bodysurface area. Because the surface area is proportional to the2/3 power of the body weight M1, the daily exposure MI canbe expressed as:
m
W2/3
2. If the dose (s) is given as mg per kg of body weight:
3
then
3 1 sWx
and the equivalent daily exposure (X) would be
(s x W)X-- --------
V2/3
or
X s x x13
3. The dose must also be normalized to a lifetime average expo-sure. For an carcinogenic assay in which the average dose perday (in mg) is an, and the length of exposure is le, and thetotal length of the experiment is L., then the lifetimeaverage exposure (1N) is
Ix a16 -----------
Le x W2/3
B-6
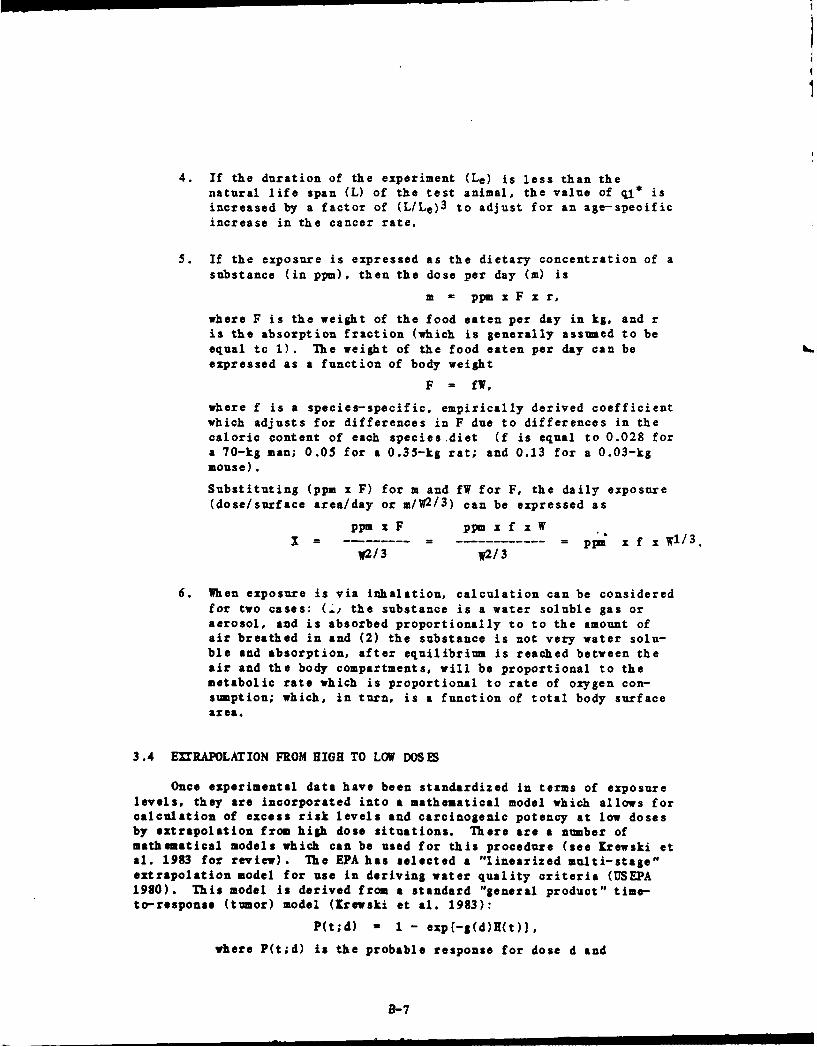
4. If the duration of the experiment (Le) is less than the
natural life span L) of the test animal, the value of ql* is
increased by a factor of (L/Le)3 to adjust for an age-specificincrease in the cancer rate.
5. If the exposure is expressed as the dietary concentration of a
substance (in ppm), then the dose per day (W) is
m = ppm x F x r,
where F is the weight of the food eaten per day in kg, and r
is the absorption fraction (which is generally assumed to beequal to 1). The weight of the food eaten per day can beexpressed as a function of body weight
F = fW,
where f is a species-specific, empirically derived coefficient
which adjusts for differences in F due to differences in thecaloric content of each species.diet (f is equal to 0.028 for
a 70-kg man; 0.05 for a 0.35-kg rat; and 0.13 for a 0.03-kg
mouse).
Substituting (ppm x F) for m and fW for F, the daily exposure
(dose/surface area/day or m/w 2 /3) can be expressed as
ppm x F ppm x f x WX = -------- = ----------- = ppm x f x Wl/ 3 .
w2/3 w2/3
6. When exposure is via inhalation, calculation can be consideredfor two cases: (',i the substance is a water soluble gas or
aerosol, and is absorbed proportionally to to the amount ofair breathed in and (2) the substance is not very water solu-ble and absorption, after equilibrium is reached between theair and the body compartments, will be proportional to themetabolic rate which is proportional to rate of oxygen con-
sumption; which, in turn, is a function of total body surface
area.
3.4 EXTRAPOLATION FROM HIGH TO LOW DOSES
Once experimental data have been standardized in terms of exposurelevels, they are incorporated into a mathematical model which allows forcalculation of excess risk levels and carcinogenic potency at low doses
by extrapolation from high dose situations. There are a number ofmathematical models which can be used for this procedure (see rrewski et
al. 1983 for review). The EPA has selected a "linearized multi-stage"
extrapolation model for use in deriving water quality criteria (USEPA
1980). This model is derived from a standard "general product" time-
to-response (tumor) model (Krewski et al. 1983):
P(t;d) - 1 - exp(-g(d)H(t)),
where P(t;d) is the probable response for dose d and
B-7
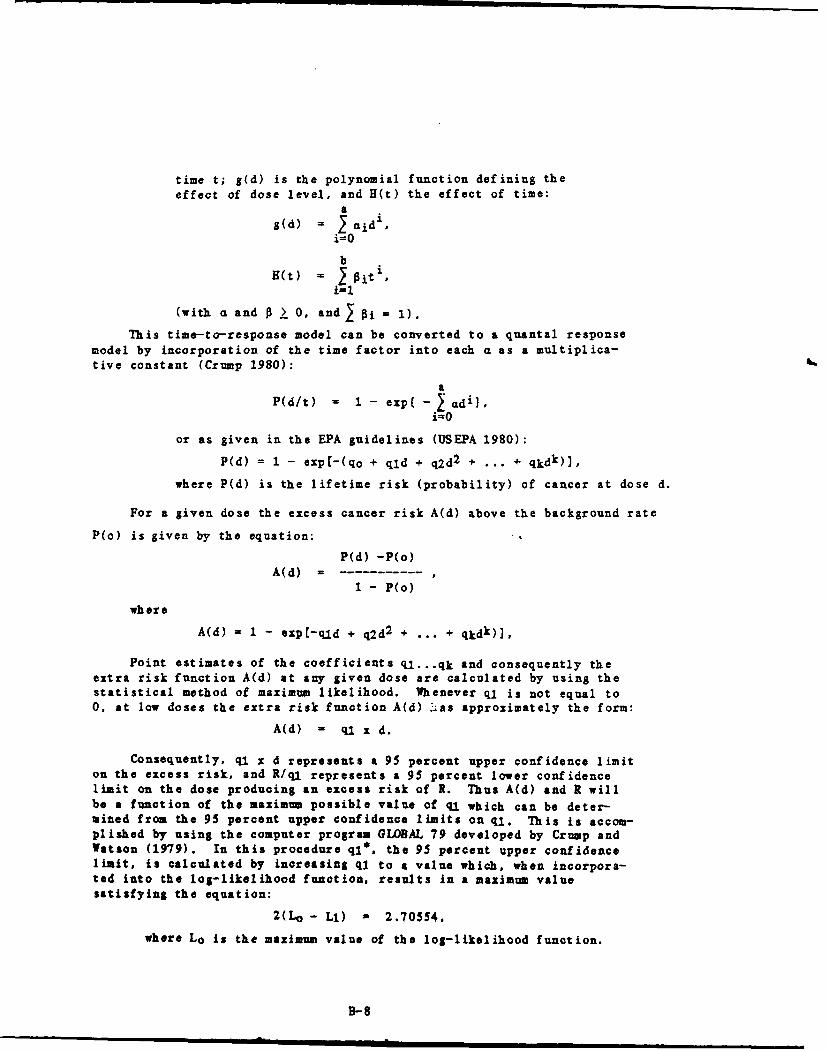
time t; g(d) is the polynomial function defining theeffect of dose level, and H(t) the effect of time:
a
g(d) = i aid i,
i=O
bH(t) = ipit
(with a and p . 0. and Pi = i).
This time-to-response model can be converted to a quantal responsemodel by incorporation of the time factor into each a as a multiplica-tive constant (Crump 1980):
aP(d/t) = 1- exp( 2adi],
i=0
or as given in the EPA guidelines (USEPA 1980):
P(d) = 1 - exp[-(qo + qld + q2d 2 + ... + qkdk)],
where P(d) is the lifetime risk (probability) of cancer at dose d.
For a given dose the excess cancer risk A(d) above the background rate
P(o) is given by the equation:
P(d) -P(o)A(d)
1 - P(o)
where
A(d) = 1 - exp[-qld + q2d 2 + ... + qkdk)l,
Point estimates of the coefficients ql... qk and consequently theextra risk function A(d) at any given dose are calculated by using thestatistical method of maximum likelihood. Whenever ql is not equal to0, at low doses the extra risk function A(d) --as approximately the form:
A(d) = ql x d.
Consequently, ql x d represents a 95 percent upper confidence limiton the excess risk, and R/ql represents a 95 percent lower confidencelimit on the dose producing an excess risk of R. Thus A(d) and R willbe a function of the maximum possible value of q which can be deter-mined from the 95 percent upper confidence limits on qj. This is accom-plished by using the computer program GLOBAL 79 developed by Crump andWatson (1979). In this procedure qlj. the 95 percent upper confidencelimit, is calculated by increasing qi to a value which, when incorpora-ted into the log-likelihood function, results in a maximum valuesatisfying the equation:
2(Lo - LI) - 2.70554,
where Lo is the maximum value of the loS-likelihood function.
B-8
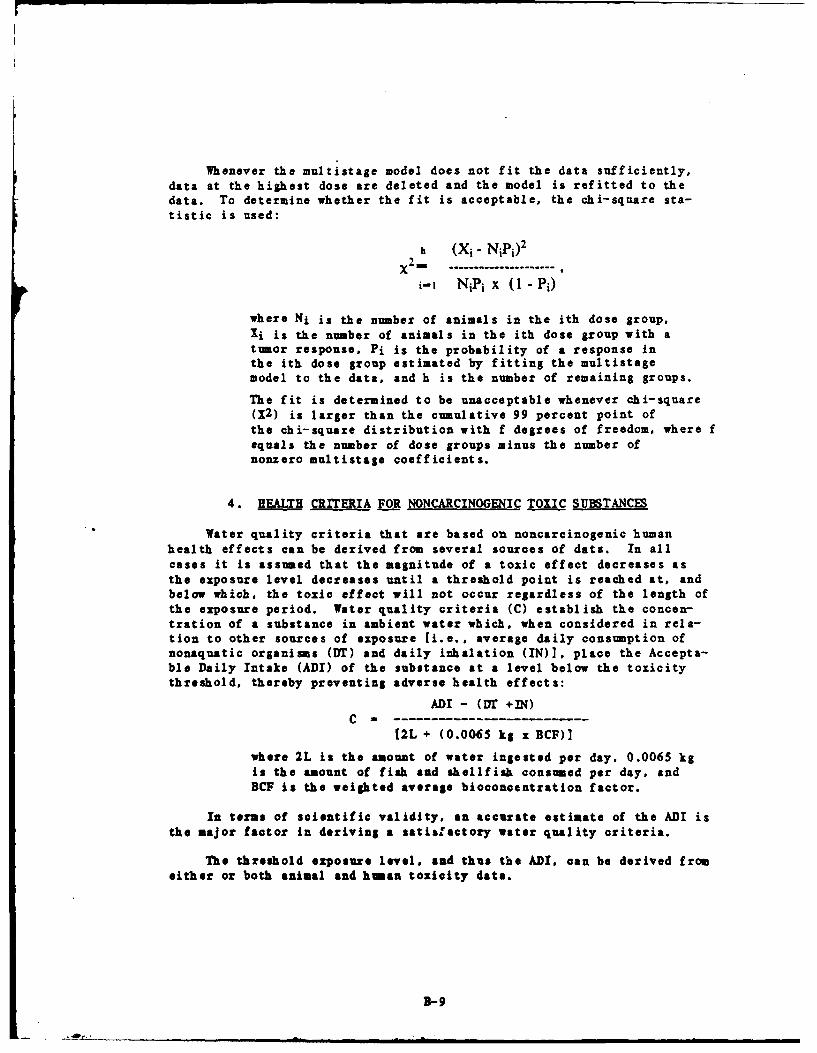
Whenever the multistage model does not fit the data sufficiently,data at the highest dose are deleted and the model is refitted to thedata. To determine whether the fit is acceptable, the chi-square sta-tistic is used:
h (Xi - NiPi)2
X2 . ..................... .i-1 NiPi x (I - Pi)
where Ni is the number of animals in the ith dose group,
Xi is the number of animals in the ith dose group with atumor response, Pi is the probability of a response inthe ith dose group estimated by fitting the multistagemodel to the data, and h is the number of remaining groups.
The fit is determined to be unacceptable whenever chi-square(X2 ) is larger than the cumulative 99 percent point ofthe chi-square distribution with f degrees of freedom, where fequals the number of dose groups minus the number ofnonzero multistage coefficients.
4. HEALTH CRITERIA FOR NONCARCINOGENIC TOXIC SUBSTANCES
Water quality criteria that are based on noncarcinogenic humanhealth effects can be derived from several sources of data. In allcases it is assumed that the magnitude of a toxic effect decreases asthe exposure level decreases until a threshold point is reached at, andbelow which, the toxic effect will not occur regardless of the length ofthe exposure period. Water quality criteria (C) establish the concen-tration of a substance in ambient water which, when considered in rela-tion to other sources of exposure [i.e., average daily consumption ofnonaquatic organisms (Dr) and daily inhalation (IN)], place the Accepta-ble Daily Intake (ADI) of the substance at a level below the toxicitythreshold, thereby preventing adverse health effects:
ADI - (Dr +IN)C -------------------------
[2L + (0.0065 kg x BCF)]
where 2L is the amount of water ingested per day. 0.0065 kg
is the amount of fish and shellfish consumed per day, and
BCF is the weighted average bioconcentration factor.
In terms of scientific validity, an accurate estimate of the ADI is
the major factor in deriving a satisfactory water quality criteria.
The threshold exposure level, and thus the ADI. can be derived from
either or both animal and human toxicity data.
B-9
4.1 NONCARCINOGENIC HEALTH CRITERIA BASED ON ANIMAL TOXICITY DATA (ORAL)
For criteria derivation, toxicity is defined as any adverse effectswhich result in functional impairment and/or pathological lesions whichmay affect the performance of the whole organism, or which reduce anorganism's ability to respond to an additional challenge (USEPA 1980).
A bioassay yielding information as to the highest chronic (90 daysor more) exposure tolerated by the test animal without adverse effects(No-Observed-Adverse-Effect-Level or NOAEL) is equivalent to the toxi-city threshold and can be used directly for criteria derivation. Inaddition to the NOAEL, other data points which can be obtained from tox-icity testing are
(1) NOEL = No-Observed-Effect-Level,(2) LOL = Lowest-Observed-Effect-Level,(3) LOAEL = Lowest-Observed-Adverse-Effect-Level,(4) FEL = Frank-Effect-Level.
According to the EPA guidelines, only certain of these data pointscan be used for criteria derivation:
1. A single FEL value, without information on the other responselevels, should not be used for criteria derivation becausethere is no way of knowing how far above the threshold itoccurs.
2. A single NOEL value is also unsuitable because there is no wayof determining how far below the threshold it occurs. If onlymultiple NOELs are available, the highest value should beused.
3. If a LOEL value alone is available, a judgement must be madeas to whether the value actually corresponds to a NOAEL or anLOAEL.
4. If an LOAEL value is used for criteria derivation, it must beadjusted by a factor of 1 to 10 to make it approximatelyequivalent to the NOAEL and thus the toxicity threshold.
5. If for reasonably closely spaced doses only a NOEL and a LOAELvalue of equal quality are available, thi NOEL is used forcriteria derivation.
The most reliable estimate of the toxicity threshold would be oneobtained from a bioassay in which an NOEL, NOA]L, LOAEL, and clearlydefined FEL were observed in relatively closely spaced doses.
Regardless of which of the above data points is used to estimatethe toxicity threshold, a judgement must be made as to whether theexperimental data are of satisfactory quality and quantity to allow fora valid extrapolation for human exposure situations. Depending onwhether the data are considered to be adequate or inadequate, the
B-10
toxicity threshold is adjusted by a "safety factor" or "uncertainty fac-tor" (NAS 1977). The "uncertainty factor" may range from 10 to 1000according to the following general guidelines:
1. Uncertainty factor 10. Valid experimental results from stu-dies on prolonged ingestion by man, with no indication of car-cinogenicity.
2. Uncertainty factor 100. Data on chronic exposures in humansnot available. Valid results of long-term feeding studies onexperimental animals, or in the absence of humian studies,valid animal studies on one or more species. No indication ofcarcinogenicity.
3. Uncertainty factor 1000. No long-term or acute exposure datafor humans. Scanty results on experimental animals with noindication of carcinogenicity.
Uncertainty factors which fall between the categories describedabove should be selected on the basis of a logarithmic scale (e.g., 33being halfway between 10 and 100).
The phrase "no indication of carcinogenicity" means that carcino-genicity data from animal experimental studies or human epidemiology arenot available. Data from short-term carcinogenicity screening tests maybe reported, but they are not used in criteria derivation or for ru~lingout the uncertainty factor approach.
4.2 CRITERIA BASE ON INHALATION EXPOSURES
In the absence of oral toxicity data, water quality criteria for asubstance can be derived from threshold limit values (TLVs) establishedby the American Conference of Governmental and Industrial Hygienists(ACIH), the Occupational Safety and Health Administration (OSHA), orthe National Institute for Occupational Safety and Health (NIOSH), orfrom laboratory studies evaluating the inhalation toxicity of the sub-stance in experimental animals. TLVs represent 8-hr time-weightedaverages of concentrations in air designed to protect workers fromvarious adverse health effects during a normal working career. To theextent that TLVs are based on sound toxicological evaluations and havebeen protective in the work situation, they provide helpful informationfor deriving water quality criteria. However, eac4i TLV must be examinedto decide if the data it is based on can be used for calculating a waterquality criteria (using the uncertainty factor approach). Also the his-tory of each TLV should be examined to assess the extent to which it hasresulted in worker safety. With each TLV, the types of effects againstwhich It is designed to protect are examined in terms of its relevanceto exposure from water. It must be shown that the chemical is not alocalized irritant and there Is no significant effect at the portal ofentry, regardless of the exposure route.
B-11
The most important factor in using inhalation data is in deter-mining equivalent dose/response relationships for oral exosures.Estimates of equivalent doses can be based upon (1) atailable phar-macokinetic data for oral and inhalation routes, (2) measurements ofabsorption efficiency from ingested or inhaled chemicals, or (3) com-parative excretion data when associated metabolic pathways areequivalent to those following oral ingestion or inhalation. The use ofpharmacokinetic models is the preferred method for converting frominhalation to equivalent oral doses.
In the absence of pharmacokinotic data, TLVs and absorption effi-ciency measurements can be used to calculate an ADI value by means ofthe Stokinger and Woodward (1958) model:
ADI TLV x BR x DE x d x AA/(AO xSF),
where,BR daily air intake (assume 10 m3 ),DE duration of exposure in hours per day,d 5 days/7 days,AA efficiency of absorption from air,AO efficiency of absorption from oral exposure, andSF safety factor.
For deriving an ADI from animal inhalation toxicity data, the equation is:
ADI = CA x DE x d x AA x BR x 70 kg/(BWA x AO x SF).
where,CA - concentration in air (mg/n 3 ),DE duration of exposure (hr/day),d number of days exposed/number of days observed,AA - efficiency of absorption from air,BR - volume of air breathed (m3/day),70 kS - standard human body weight,BWA - body weight of experimental animals (kg),AO - efficiency of absorption from oral exposure, andSF - safety factor.
The safety factors used in the above equations are intended toaccount for species variability. Consequently, the mg/surface area/dayconversion factor is not used in this methodology.
5. ORAMIMIC CRITERA
Oranoleptic criteria define concentrations of substances whichimpart undesirable taste and/or odor to water. Organoleptic criteriaare based on aesthetic qualities alone and not on toxicological data,and therefore have no direct relationship to potential adverse humanhealth effects. However, sufficiently intense organoleptic effects may,
B-12
under some circumstances, result in depressed fluid intake which, inturn, might aggravate a variety of functional diseases (i.e., kidney and
circulatory diseases).
For comparison purposes, both organoleptic criteria and humanhealth effects criteria can be derived for a given water pollutant;however, it should be explicitly stated in the criteria document thatthe organoleptic criteria have no demonstrated relationship to potentialadverse human health effects.
3-l
6. REFERENCES
Crump, K.S. 1979. Dose-response problems in carcinogenesis. Biometrics35: 157.
Crump. K.S., and W.V. Watson. 1979. GLOBAL,79. A FORTRAN program toextrapolate dichotomous animal carcinogenicity data to low dose.National Institute of Health Science Contract No. l-ES-2123.
International Commission on Radiological Protection. 1977. Recommenda-tion of the ICRP, Publication No. 26. Pergammon Press, Oxford, England.
Krewski, D., K.S. Crump, 3. Farmer, D.W. Gaylor, R. Howe, C. Portier, D.Salsburg, R.L. Sielken, and 3. Vanryzin. 1983. A comparison of statisti-cal methods for low-dose extrapolation utilizing time-to-tumor data.Fund. Avol. Toxicol. 3:140-160.
NAS. 1977. Drinking water and health. Safe Drinking Water Committee,Advisory Center on Toxicology, National Research Council, NationalAcademy of Science, Washington, DC. 939 pp.
Stephan, C.E. 1980. Yuly 3 memorandum to 3. Stara, US Environmental Pro-tection Agency. (as cited in USEPA 1980).
Stokinger, M.E. and R.L. Woodward. 1958. Toxicological methods for esta-blishing drinking water standards. 1. An. Water Works Assoc. 50:517.
USEPA. 1980. Water Quality Criteria Documents, Environmental ProtectionAgency. Fed. Resist. 45:79318-79357.
Veith, G.D., et al. 1980. Measuring and estimating the bioconcentrationfactors of chemicals in fish. 1. Eish. Res. Bd. Can. 36:1040. (as citedin USEPA 1980).
3-14
DISTRIBUTION LIST
No. of Copis
25 Commander
US Army Medical BioengineeringResearch and Development Laboratory
ATT: SGRD-UBG-MFort Detrick, Frederick, MD 21701
12 Defense Technical Information Center (DTIC)ATTN: DTIC-DDACameron StationAlexandria, VA 22314
5 US Army Medical Research and Development Command
ATTN: SGRD-RMSFort Detrick, Frederick, MD 21701
Commander
US Army Medical Bioengineering
Research and Development LaboratoryATTN: SGRD-UBZ-ILFort Detrick, Frederick, MD 21701
1 CommandantAcademy of Health Sciences, US ArmyATMl: AHS-CDMFort Sam Houston, TX 76234
1 Chief
USAEHA Regional Division, West
Fitzsimmons AMC
Aurora, CO 80045
1 ChiefUSAEIA Regional Division. NorthFort George G. Meade, MD 20755
1 ChiefUSAEBA Regional Division, SouthBldg. 180Fort McPherson, GA 30330
1 Commander
USA Health Services CommandATTN: BSPA-PFort Sam Houston, TZ 78234
CommandantAcademy of Eealth Sciences
United States ArmyATTN: Chief, Environmental Quzlity BranchPreventive Medicine Division (HSHA-IPM)
Fort Sam Houston, TX 78234
CommanderUS Army Materiel CommandATTN: AMSCG5001 Eisenhower AvenueAlexandria, VA 22333
CommanderUS Army Environmental Hygiene AgencyAMlN: Librarian, HSDH-AD-LAberdeen Proving Ground, MD 21010
DeanSchool of MedicineUniformed Services University of
the Health Sciences4301 Yones Bridge RoadBethesda, ND 20014
CommanderU.S. Army Materiel CommandATIN: AMCEN-A5001 Eisenhower AvenueAlexandria, VA 22333
RODAATTN: DASG-PSP-E5111 Leesburg PikeFalls Church, VA 22041-3258
HODAAT7N: DAEN-RDM20 Massachusetts, NWWashington, D.C. 20314

I)I