Embed Size (px)
Citation preview

U20
0306
BD
GA
Improving Client OutcomesiShares play an important role in efficient portfolios
2
Barclays Global Investors
One of the world's largest institutional asset managers
$2.0 trillion AUM*
3,004 clients in 54 countries*
Managing 2300 funds**
Tracking over 250 indices worldwide**
12 locations, over 3000 staff***
One of the world's largest institutional asset managers
$2.0 trillion AUM*
3,004 clients in 54 countries*
Managing 2300 funds**
Tracking over 250 indices worldwide**
12 locations, over 3000 staff***
iShares, Exchange Traded Funds from Barclays
iShares, Exchange Traded Funds from Barclays
*Source: Barclays Global Investors (BGI), November 2007**Source: Barclays Global Investors (BGI), May 2007***Source: Barclays Global Investors (BGI), September 2007
SN
UG
0606
06Q
2
3
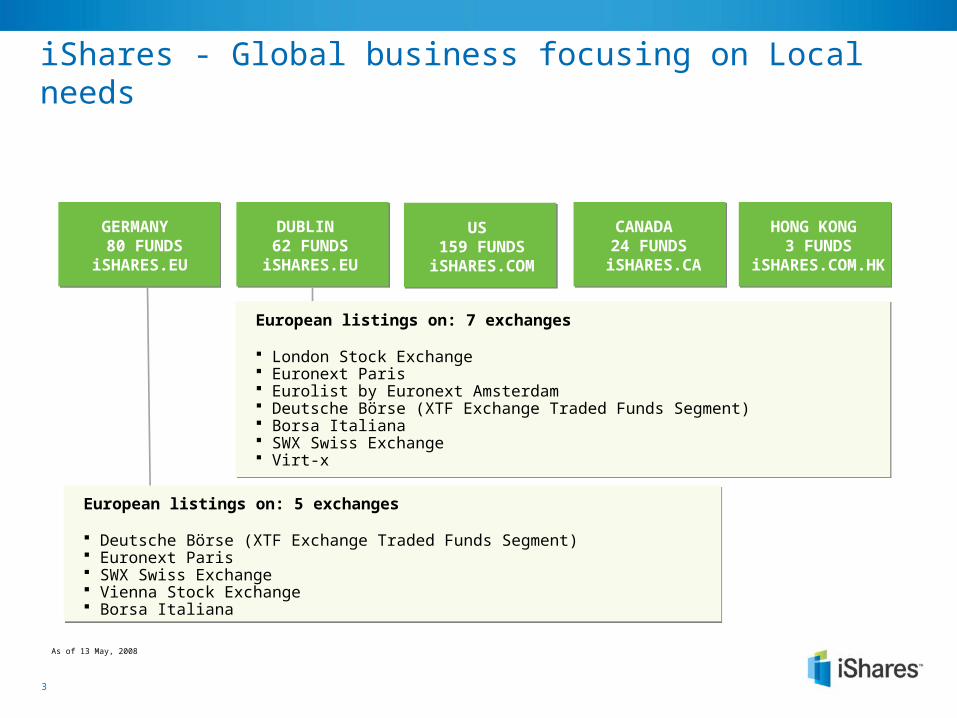
iShares - Global business focusing on Local needs
US 159 FUNDS
iSHARES.COM
DUBLIN 62 FUNDS
iSHARES.EU
HONG KONG 3 FUNDS
iSHARES.COM.HK
CANADA 24 FUNDS
iSHARES.CA
GERMANY 80 FUNDS
iSHARES.EU
European listings on: 7 exchanges
London Stock Exchange Euronext Paris Eurolist by Euronext Amsterdam Deutsche Börse (XTF Exchange Traded Funds Segment) Borsa Italiana SWX Swiss Exchange Virt-x
European listings on: 5 exchanges
Deutsche Börse (XTF Exchange Traded Funds Segment) Euronext Paris SWX Swiss Exchange Vienna Stock Exchange Borsa Italiana
As of 13 May, 2008

4
The Global ETF Market Has Experienced Strong Growth Since 2000 – Both in Terms of AUM & Funds
Source: Morgan Stanley, Exchange Traded Funds – Q1 2008 Global Industry Review, 31 March 2008* Compound annual growth rate
Global ETF AUM Is Forecast to Reach $2trl by 2011Global ETF AUM Is Forecast to Reach $2trl by 2011
Global ETF Market Growth (AUM & No. of Funds)
US CAGR (2000-2007) = 37%
Europe CAGR (2000- 2007) = 114%
Global CAGR* (2000-2007) = 40%
0
100
200
300
400
500
600
700
800
900
2000 2001 2002 2003 2004 2005 2006 2007 Q1 2008
AUM$B
0
100
200
300
400
500
600
700
#ETFs
US AUM Europe AUM Rest of World AUM
US #ETFs European #ETFs Rest of World #ETFs
5
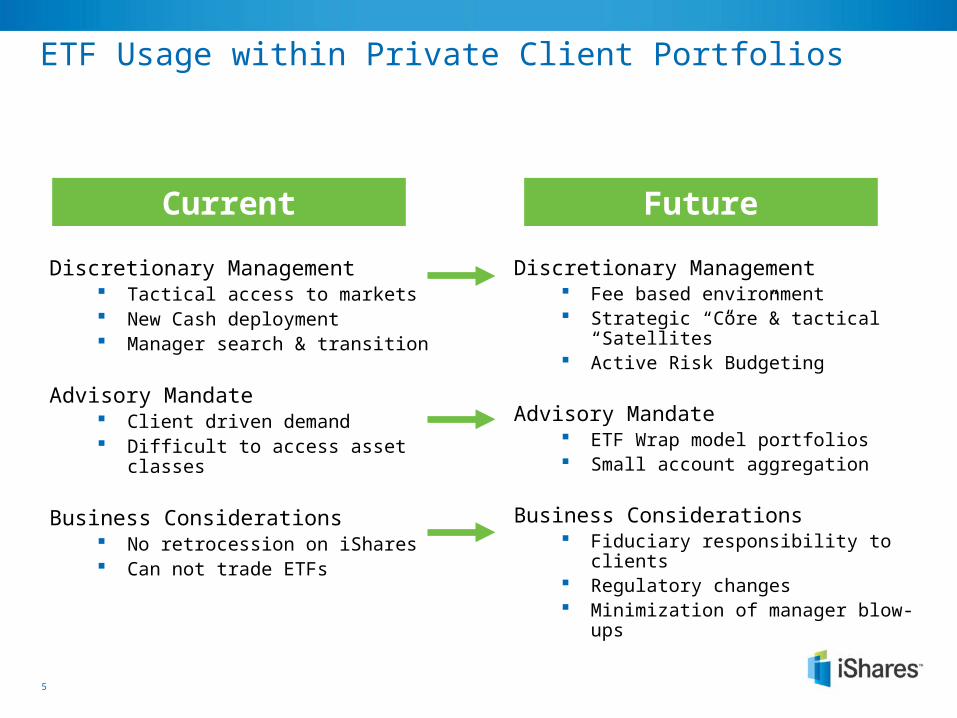
ETF Usage within Private Client Portfolios
Discretionary Management Fee based environment Strategic “Core”& tactical “Satellites” Active Risk Budgeting
Advisory Mandate ETF Wrap model portfolios Small account aggregation
Business Considerations Fiduciary responsibility to clients Regulatory changes Minimization of manager blow-ups
Discretionary Management Tactical access to markets New Cash deployment Manager search & transition
Advisory Mandate Client driven demand Difficult to access asset classes
Business Considerations No retrocession on iShares Can not trade ETFs
FutureCurrent

6
Quick review of Modern Portfolio Theory
Blending uncorrelated assets creates Efficient FrontierBlending uncorrelated assets creates Efficient Frontier
Cash
Fixed Income
Developed Equity
Commodities
Alternatives
Optimal mix of asset class benchmarks
Po
ten
tia
l re
turn
(%
)
Potential risk (%)
Source: Markowitz, “Portfolio Selection”, The Journal of Finance, March 1952
7
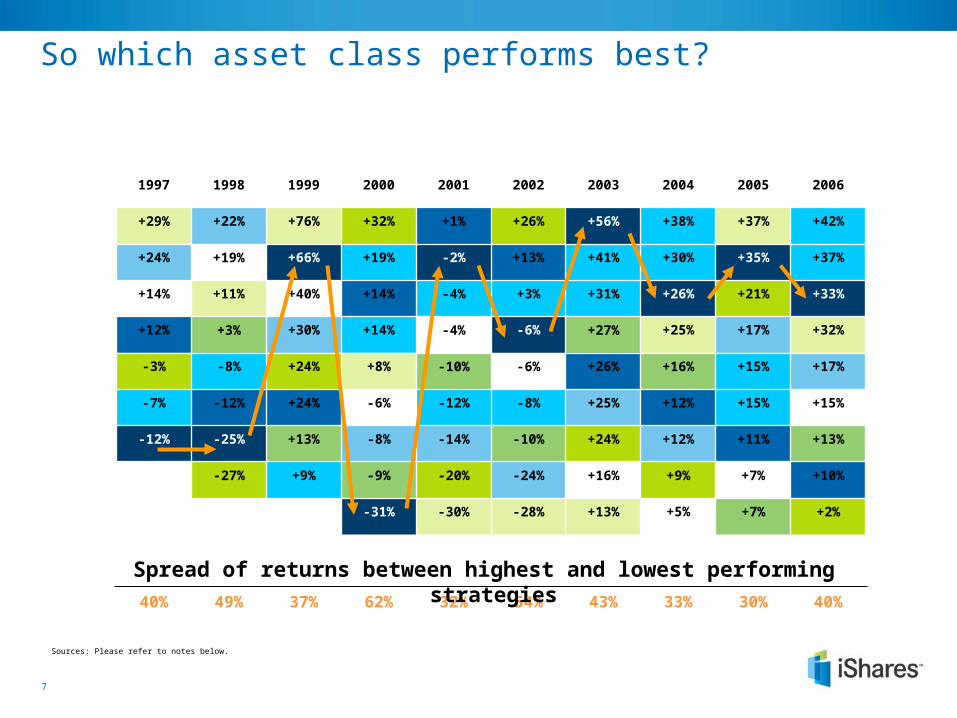
So which asset class performs best?
Sources: Please refer to notes below.
40%30%33%43%54%32%62%37%49%40%
-9%
+7%
+13%-10%+13%
+16%-10%
+27%+3%
+15%-8%-12%
+31%
+37%+30%+19%
+7%+16%
+5%
+15%-6%
-6%
-4%
+40%+14%
+19%
+9%
-7%
+15%-8%
+14%
+3%-4%
+41%
+42%+38%
-31%
-25%-12%
-6%
+33%+26%
+35%-2%+66%
+56%
+10%
+11%
+12%+24%-12%
+26%
+12%
+14%
+13%
+1%
+9%-20%-27%
+2%
+24%
+24%-3%
+21%
+26%+32%
-24%
+12%-14%-8%
+25%
+17%
+17%+30%
+24%
+22%
+13%-28%-30%
+8%
+32%+25%
+11%
+37%+76%+29%
2006200520042003200220012000199919981997
Spread of returns between highest and lowest performing strategies

8
Asset Allocation plays largest role in portfolio performance
Academic research: Asset mix determines around 90%
of variation in fund returns¹ But, not a one-off decision – must
be revisited regularly²
Investors today have access to many more asset classes and financial instruments Implementation easier today than yesteryear –
more asset classes, better products
Time to revisit client’s strategic asset allocation
Determinants of Portfolio Performance
0%
20%
40%
60%
80%
100%
AssetAllocation
SecuritySelection
Timing
ß α
“Determinants of Portfolio Performance”, Brinson, Hood & Beebower, 1986; "Asset Allocation Dynamics and Pension Fund Performance“, Blake et al, 1999“Strategic Asset Allocation: Portfolio Choice for Long-Term Investors”, Campbell & Viciera, 2002

9
How do active managers add value?
Beta
PositiveAlpha
Total Return
Negative Alpha
Participating in the asset class
Skill or luck
0%
U20
0306
BD
GA
Managing your active manager risk

11
Ingredients of investment management
Managing Client Emotions(Fear, greed, tax aversion)
Managing Client Emotions(Fear, greed, tax aversion)
Science(Modern Portfolio Theory)
Science(Modern Portfolio Theory)
Art(Implementation – strategic and tactical)
Art(Implementation – strategic and tactical)
+
+

12
Why index a portion of a client portfolio?
Consistency and reliability of long term returns relative to the market
Low Cost Diversification: buy the market no active manager risk no surprises
More time for your business Client facing activity Overall business strategy To research & implement an asset allocation Low supervisory burden
Control Active Manager Risk
Index funds provide margin of safetyIndex funds provide margin of safety

13
Active portfolio management presents “active manager risk”
Active manager return The over- or under-return earned by an active manager relative to a benchmark
Active manager risk The annualized standard deviation of a manager’s active return (usually calculated as tracking
error)
14
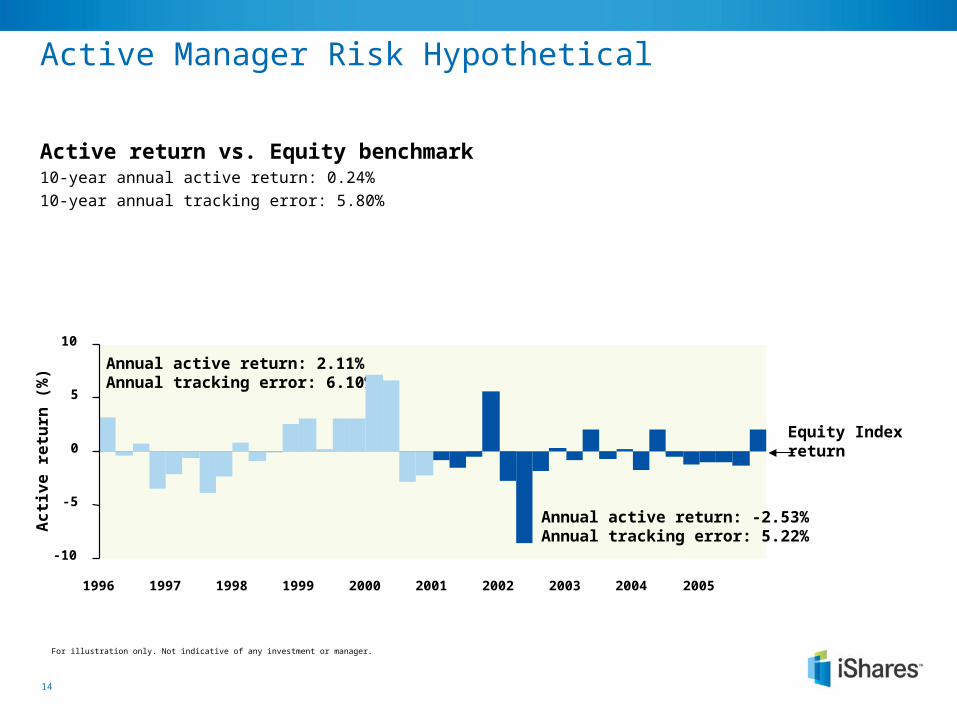
Active Manager Risk Hypothetical
Active return vs. Equity benchmark10-year annual active return: 0.24%
10-year annual tracking error: 5.80%
Equity Index return
Annual active return: -2.53%Annual tracking error: 5.22%
Annual active return: 2.11%Annual tracking error: 6.10%
-10
-5
0
5
10
1996 1997 1998 1999 2000 2001 2002 2003 2004 2005
Ac
tiv
e r
etu
rn (
%)
For illustration only. Not indicative of any investment or manager.

15
Active Manager Risk Hypothetical
2% active risk budget60% Equity Index / 40% large cap active manager
Equity Index return
Annual active return: -2.53%Annual tracking error: 5.22%
Annual active return: 2.11%Annual tracking error: 6.10%
-10
-5
0
5
10
1996 1997 1998 1999 2000 2001 2002 2003 2004 2005
Ac
tiv
e r
etu
rn (
%)
For illustration only. Not indicative of any investment or manager.
Portfolio with a 2% active risk budget
Annual active return: -0.97%Annual tracking error: 2.00%
100% active manager

16
Active Manager Risks – other considerations
Manager Turnover
Style drift Unknown portfolios (hidden risk)
Explaining underperformance to your clients
Costs to “be in the game” Trading cost Research cost Manager marketing cost
Risks need to be monitored and controlledRisks need to be monitored and controlled

17
Core-Satellite portfolio construction
Measuring risk within a portfolio How can active manager risk, introduced to the portfolio by active managers,
be controlled?
Setting a specific risk budget How can active managers and index managers be held within the same portfolio? What is the overall impact to the portfolio?
How many managers, how much to each?
What tools and resources do Barclays Global Investors make available?
www.iShares.euwww.iShares.eu
18
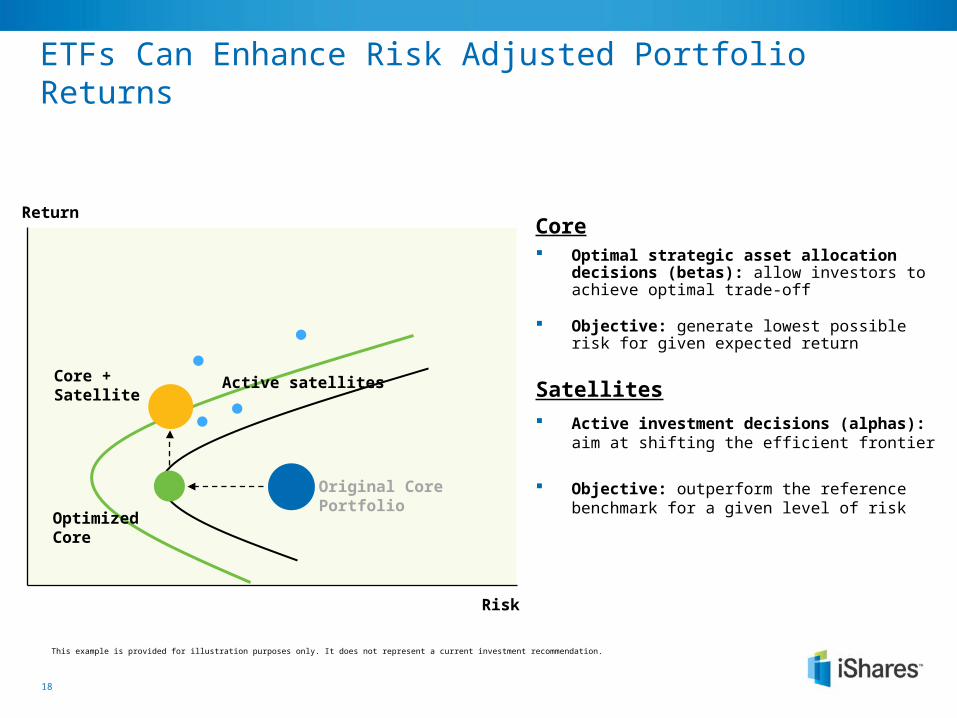
ETFs Can Enhance Risk Adjusted Portfolio Returns
Core Optimal strategic asset allocation decisions
(betas): allow investors to achieve optimal trade-off
Objective: generate lowest possible risk for given expected return
Satellites
Active investment decisions (alphas): aim at shifting the efficient frontier
Objective: outperform the reference benchmark for a given level of risk
Risk
Return
Core + Satellite Active satellites
Original Core Portfolio
Optimized Core
This example is provided for illustration purposes only. It does not represent a current investment recommendation.
19
Active Strategy
2
Active Strategy
3
Active Strategy
1
ETF(s)
ETF Satellite
ETF Satellite
ETFSatellite
Portfolio
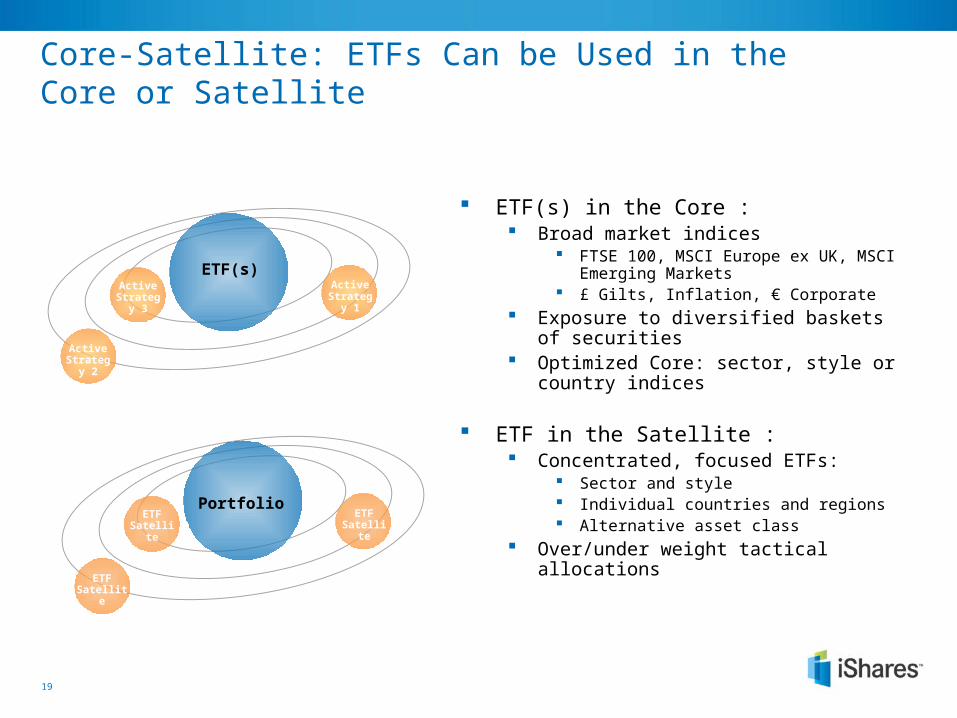
ETF(s) in the Core : Broad market indices
FTSE 100, MSCI Europe ex UK, MSCI Emerging Markets
£ Gilts, Inflation, € Corporate Exposure to diversified baskets
of securities Optimized Core: sector, style or country
indices
ETF in the Satellite : Concentrated, focused ETFs:
Sector and style Individual countries and regions Alternative asset class
Over/under weight tactical allocations
Core-Satellite: ETFs Can be Used in the Core or Satellite
20
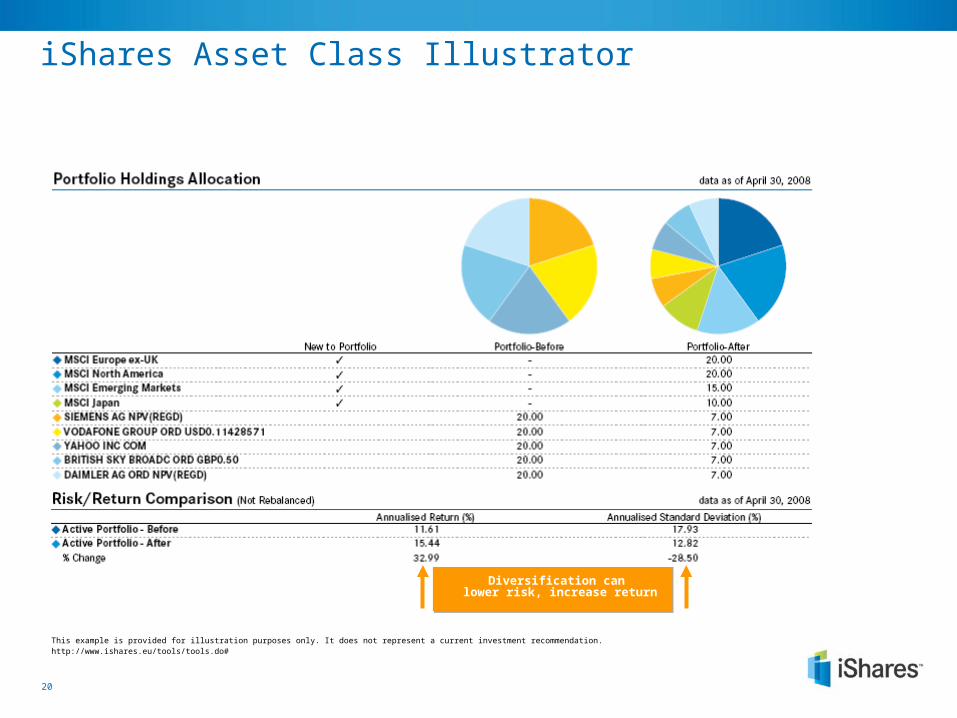
iShares Asset Class Illustrator
Diversification can lower risk, increase return
This example is provided for illustration purposes only. It does not represent a current investment recommendation.http://www.ishares.eu/tools/tools.do#

21
Efficient portfolio management
Ex
pe
cte
d r
etu
rn
Current portfolioLess risk / same return
Same risk / higher return
Risk (volatility)
This example is provided for illustration purposes only. It does not represent a current investment recommendation.
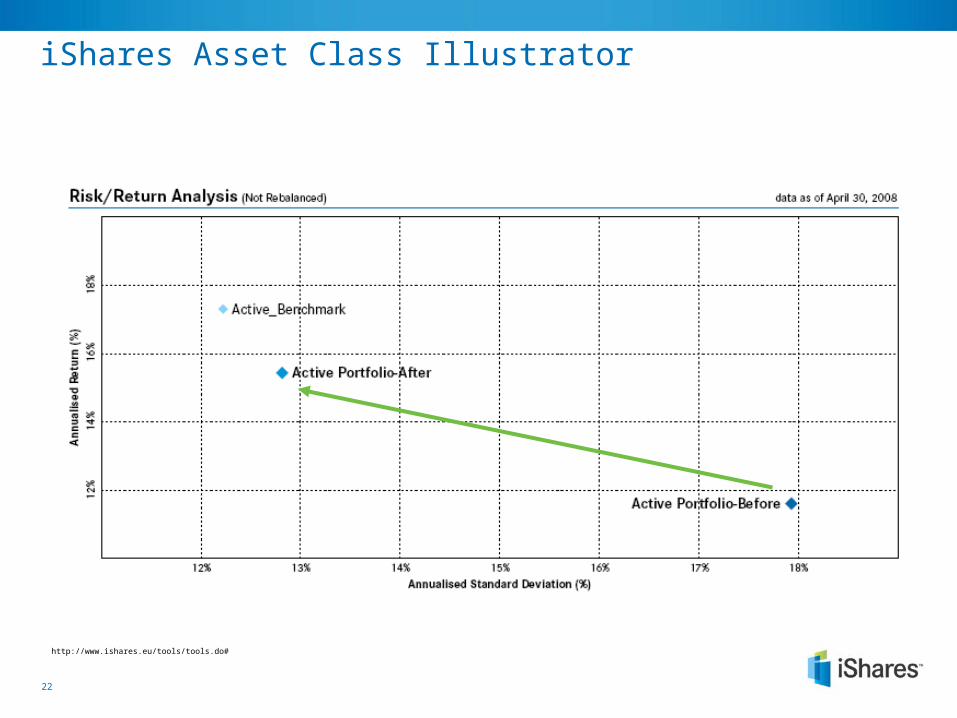
22
iShares Asset Class Illustrator
http://www.ishares.eu/tools/tools.do#
23
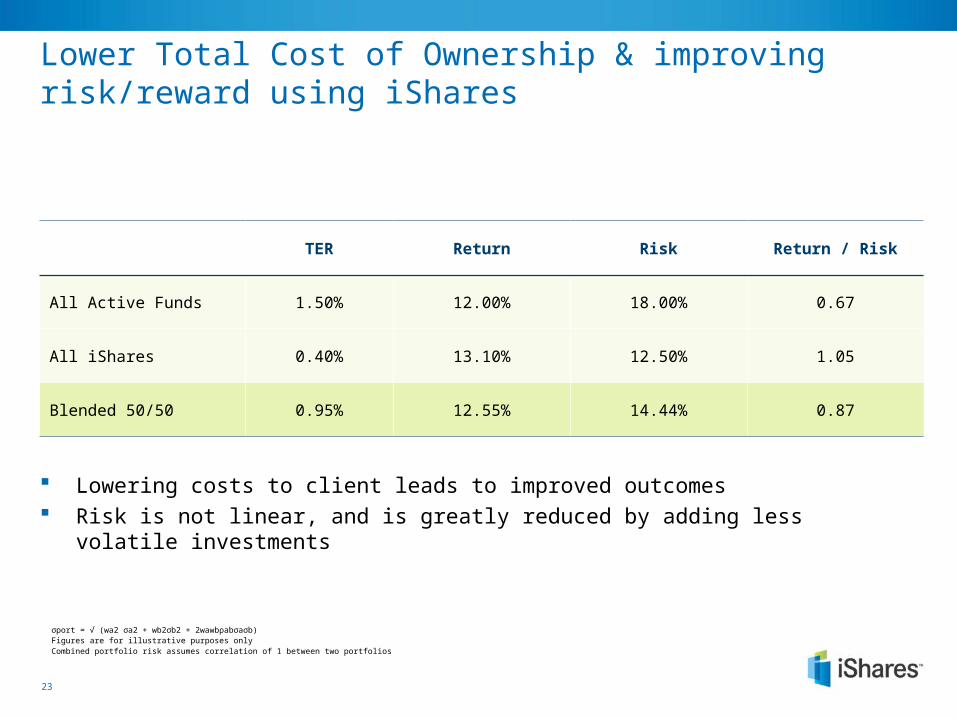
Lower Total Cost of Ownership & improving risk/reward using iShares
Lowering costs to client leads to improved outcomes Risk is not linear, and is greatly reduced by adding less
volatile investments
TER Return Risk Return / Risk
All Active Funds 1.50% 12.00% 18.00% 0.67
All iShares 0.40% 13.10% 12.50% 1.05
Blended 50/50 0.95% 12.55% 14.44% 0.87
σport = √ (wa2 σa2 + wb2σb2 + 2wawbρabσaσb)Figures are for illustrative purposes onlyCombined portfolio risk assumes correlation of 1 between two portfolios
24
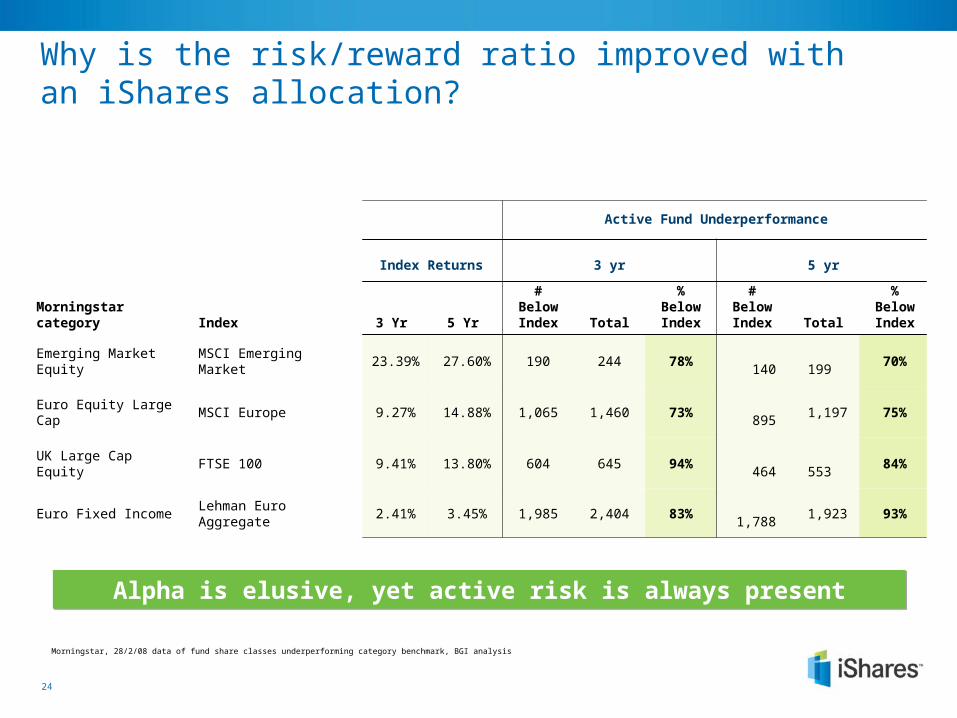
Why is the risk/reward ratio improved with an iShares allocation?
Alpha is elusive, yet active risk is always presentAlpha is elusive, yet active risk is always present
Morningstar, 28/2/08 data of fund share classes underperforming category benchmark, BGI analysis
Index Returns 3 yr 5 yr
Morningstar category Index 3 Yr 5 Yr # Below
Index Total
% Below Index
# Below Index Total
% Below Index
Emerging Market Equity MSCI Emerging Market 23.39% 27.60% 190 244 78% 140
199 70%
Euro Equity Large Cap MSCI Europe 9.27% 14.88% 1,065 1,460 73% 895
1,197 75%
UK Large Cap Equity FTSE 100 9.41% 13.80% 604 645 94% 464
553 84%
Euro Fixed Income Lehman Euro Aggregate 2.41% 3.45% 1,985 2,404 83%
1,788 1,923 93%
Active Fund Underperformance

25
Type of FundExchange Traded Funds*
Average Expense Ratio (bps)
European Sector ExposureEurozone Sector ExposureUS Sector ExposureGlobal ExposureCountry Exposure EuropeCountry Exposure United StatesInternational/Emerging MarketsStyleRegional Exposure EuropeRegional Exposure EurozoneFixed IncomeCommoditiesAll EquityOverall ETF
3938556140626740534319504945
Open-Ended Mutual Funds**
Average Active Fund TERAverage Index Fund TERAverage Bond Fund TER
171 91103
Active managers face a TER “headwind”
Average Total Expense Ratio (TER) comparisons in Europe
Source: Lipper, Morgan Stanley Investment Strategies. *As of end December 2007*Although these investment vehicles may be similar to ETFs, they are not identical and may offer additional benefits to investors over ETFs, such as increased returns and customized investment management.**As of end December 2007, for funds with a Q4 fiscal year end, the data used in the average are from 2006.
26
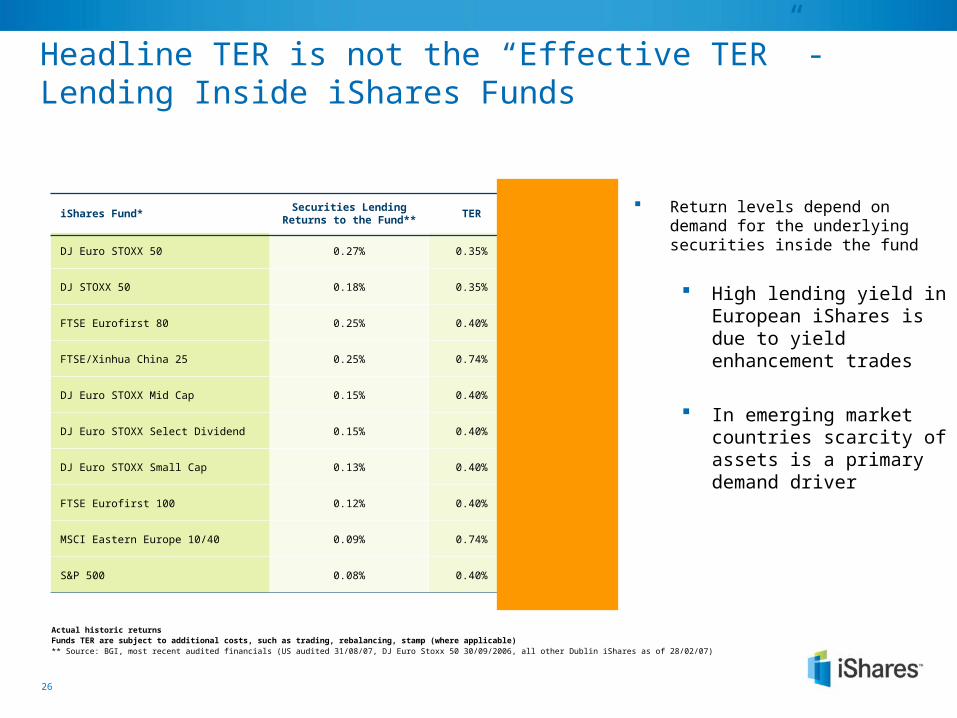
Headline TER is not the “Effective TER” - Lending Inside iShares Funds
Return levels depend on demand for the underlying securities inside the fund
High lending yield in European iShares is due to yield enhancement trades
In emerging market countries scarcity of assets is a primary demand driver
iShares Fund*Securities Lending Returns
to the Fund**TER Effective TER
DJ Euro STOXX 50 0.27% 0.35% 0.08%
DJ STOXX 50 0.18% 0.35% 0.17%
FTSE Eurofirst 80 0.25% 0.40% 0.15%
FTSE/Xinhua China 25 0.25% 0.74% 0.49%
DJ Euro STOXX Mid Cap 0.15% 0.40% 0.25%
DJ Euro STOXX Select Dividend 0.15% 0.40% 0.25%
DJ Euro STOXX Small Cap 0.13% 0.40% 0.27%
FTSE Eurofirst 100 0.12% 0.40% 0.28%
MSCI Eastern Europe 10/40 0.09% 0.74% 0.65%
S&P 500 0.08% 0.40% 0.32%
Actual historic returnsFunds TER are subject to additional costs, such as trading, rebalancing, stamp (where applicable)** Source: BGI, most recent audited financials (US audited 31/08/07, DJ Euro Stoxx 50 30/09/2006, all other Dublin iShares as of 28/02/07)
U20
0306
BD
GA
Indexation is anything but passive
28
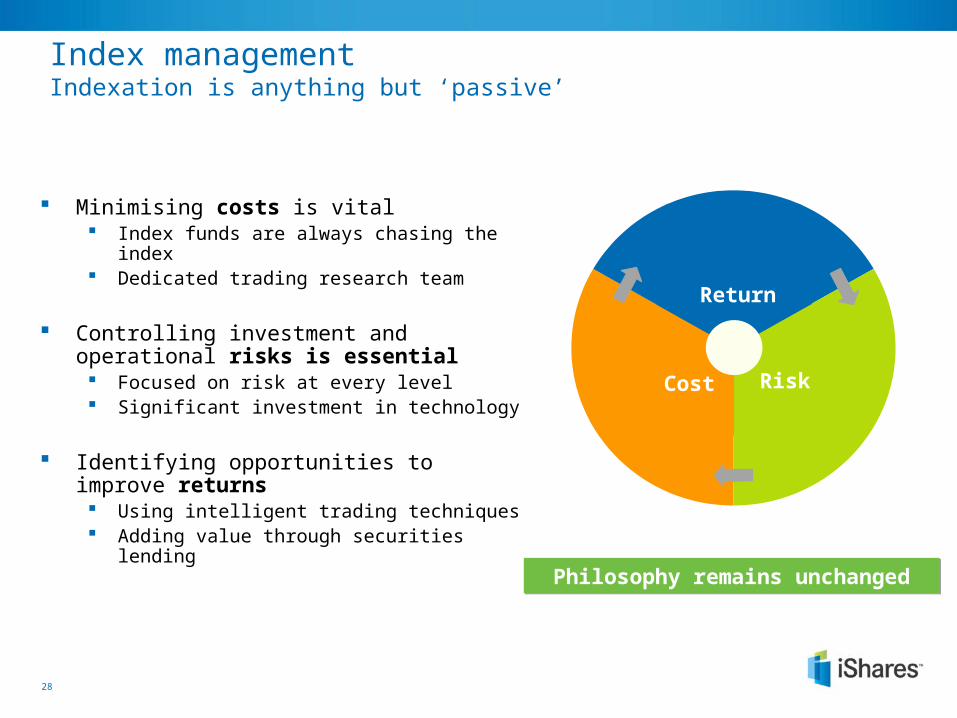
Minimising costs is vital Index funds are always chasing the index Dedicated trading research team
Controlling investment and operational risks is essential Focused on risk at every level Significant investment in technology
Identifying opportunities to improve returns Using intelligent trading techniques Adding value through securities lending
Return
RiskCost
Philosophy remains unchangedPhilosophy remains unchanged
Index managementIndexation is anything but ‘passive’

29
Minimising costsSmart trading saves you a small fortune
Index funds are always chasing the index Benchmarks assume zero costs
Maximising crossing limits market trades Size and diversity of global client base
Careful market trading keeps value in your fund Our global scale keeps costs low Focused trading research ensures
quality execution
Improving portfolio efficiency Use of new tools and instruments
Explicit CostsExplicit Costs
Implicit CostsImplicit Costs
30
Controlling risk No surprises
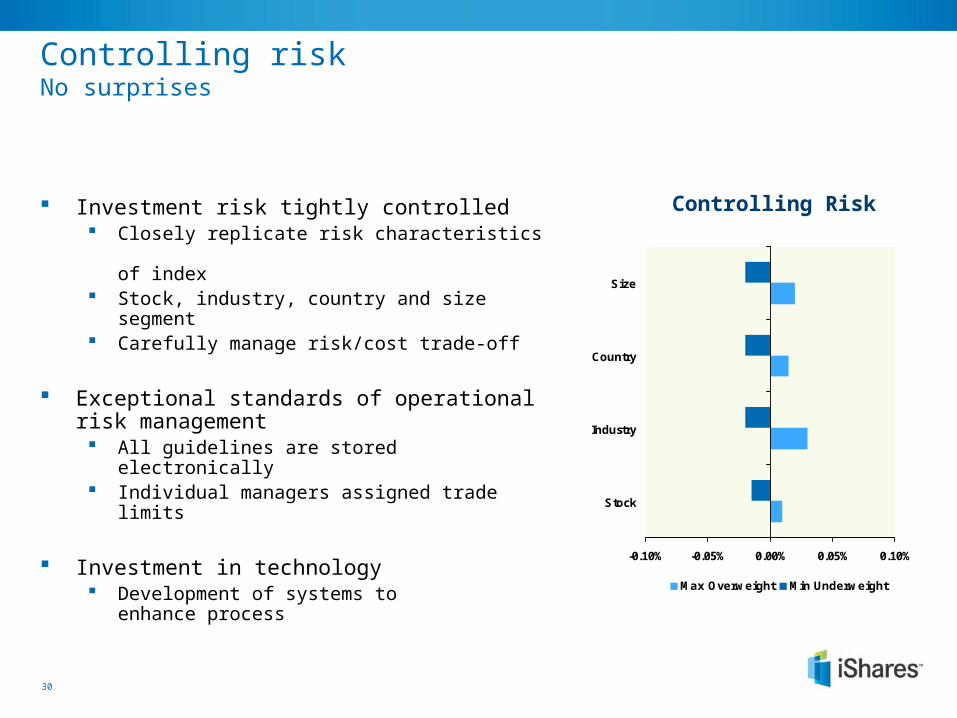
Investment risk tightly controlled Closely replicate risk characteristics
of index Stock, industry, country and size segment Carefully manage risk/cost trade-off
Exceptional standards of operational risk management All guidelines are stored electronically Individual managers assigned trade limits
Investment in technology Development of systems to
enhance process
Controlling Risk
-0.10% -0.05% 0.00% 0.05% 0.10%
Stock
Industry
Country
Size
Max Overweight Min Underweight
31
Improving returnsHelping to re-coup costs
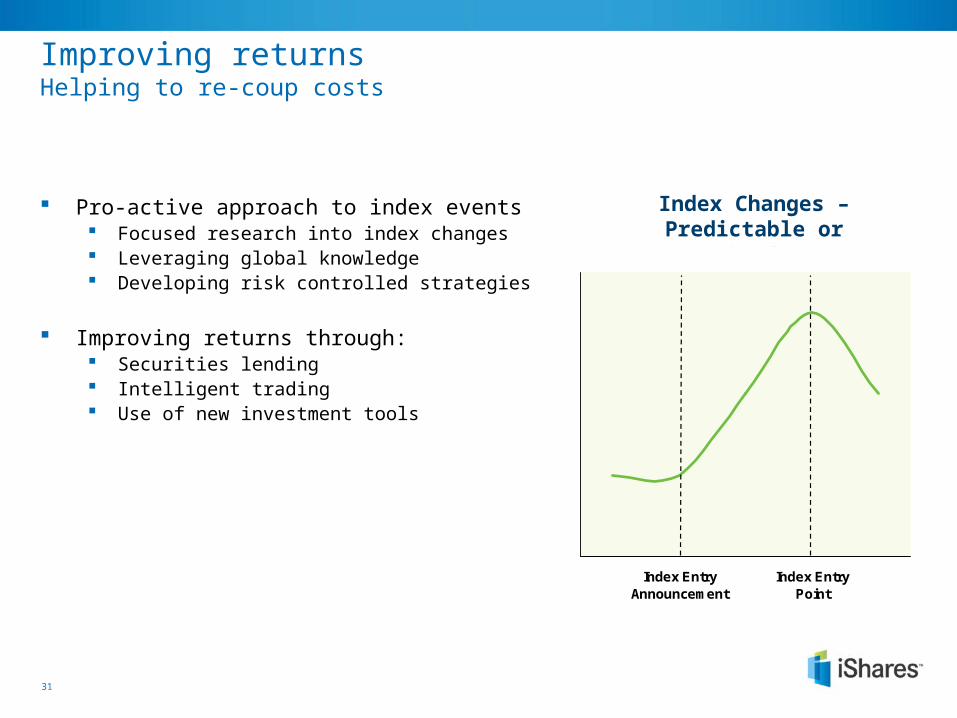
Pro-active approach to index events Focused research into index changes Leveraging global knowledge Developing risk controlled strategies
Improving returns through: Securities lending Intelligent trading Use of new investment tools
Index Changes – Predictable or Not?
Index EntryAnnouncement
Index EntryPoint
32
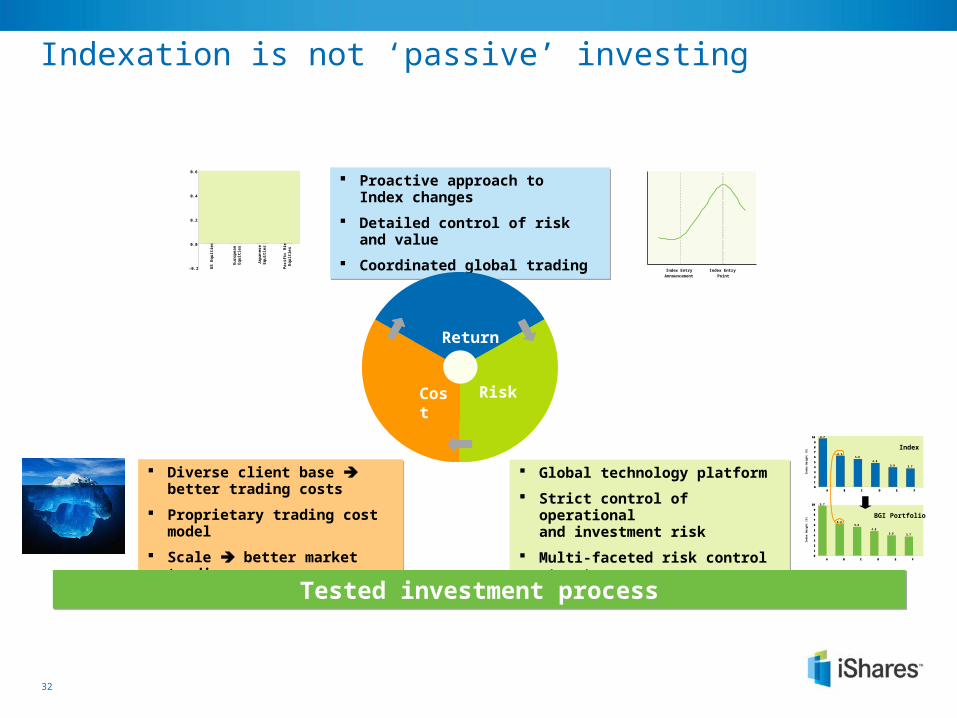
Indexation is not ‘passive’ investing
Proactive approach to Index changes
Detailed control of risk and value
Coordinated global trading
Proactive approach to Index changes
Detailed control of risk and value
Coordinated global trading
Global technology platform
Strict control of operational and investment risk
Multi-faceted risk control structure
Global technology platform
Strict control of operational and investment risk
Multi-faceted risk control structure
Diverse client base better trading costs
Proprietary trading cost model
Scale better market trading
Diverse client base better trading costs
Proprietary trading cost model
Scale better market trading
Return
RiskCost
-0.2
0.0
0.2
0.4
0.6
US
Eq
uit
ies
European
Eq
uit
ies
Jap
anes
eE
qu
itie
s
Pac
ific
Rim
Eq
uit
ies
Index Entry
Announcement
Index Entry
Point
9.7
6.25.6
4.8
3.9 3.7
0
1
2
3
4
5
6
7
8
9
10
A B C D E F
Ind
ex W
eig
ht
(%)
9.7
6.25.6
4.8
3.9 3.7
0
1
2
3
4
5
6
7
8
9
10
A B C D E F
Ind
ex W
eig
ht
(%)
9.7
6.25.6
4.8
3.9 3.7
0
1
2
3
4
5
6
7
8
9
10
A B C D E F
Index
BGI Portfolio
9.7
6.25.6
4.8
3.9 3.7
0
1
2
3
4
5
6
7
8
9
10
A B C D E F
Tested investment processTested investment process
33
Disclaimers
Regulatory InformationBarclays Global Investors Limited ('BGIL'), which is authorised and regulated by the Financial Services Authority ('FSA'), has issued this document for access by Professional Clients in the UK only and no other person should rely upon the information contained within it. iShares plc and iShares II plc (together 'the Companies') are open-ended investment companies with variable capital having segregated liability between their funds organised under the laws of Ireland and authorised by the Financial Regulator.
For investors in the UKMost of the protections provided by the UK regulatory system do not apply to the operation of the Companies, and compensation will not be available under the UK Financial Services Compensation Scheme on its default. The Companies are recognised schemes for the purposes of the Financial Services and Markets Act 2000. Important information is contained in the relevant prospectus, the simplified prospectus and other documents, copies of which can be obtained by calling 0845 357 7000, from your broker or financial adviser, by writing to Barclays Global Investors Limited, iShares Business Development, Murray House, 1 Royal Mint Court, London EC3N 4HH or by writing to the Manager of the Companies: Barclays Global Investors Ireland Limited, New Century House, International Financial Services Centre, Mayor Street Lower, Dublin 1, Ireland.
Restricted InvestorsThis document is not, and under no circumstances is to be construed as, an advertisement, or any other step in furtherance of a public offering of shares in the United States or Canada. This document is not aimed at persons who are resident in the United States, Canada or any province or territory thereof, where the Companies are not authorised or registered for distribution and where no prospectus for the Companies has been filed with any securities commission or regulatory authority. The Companies may not be acquired or owned by, or acquired with the assets of, an ERISA Plan.
Risk WarningsShares in the Companies may or may not be suitable for all investors. Barclays Global Investors Limited does not guarantee the performance of the shares or funds. The price of the investments (which may trade in limited markets) may go up or down and the investor may not get back the amount invested. Your income is not fixed and may fluctuate. Past performance is not a reliable indicator of future results. The value of the investment involving exposure to foreign currencies can be affected by exchange rate movements. We remind you that the levels and bases of, and reliefs from, taxation can change. Affiliated companies of Barclays Global Investors Limited may make markets in the securities mentioned in this document. Further, Barclays Global Investors Limited and/or its affiliated companies and/or their employees from time to time may hold shares or holdings in the underlying shares of, or options on, any security included in this document and may as principal or agent buy or sell securities.

34
Disclaimers
Index Disclaimers'Dow Jones', 'STOXX', 'Dow Jones EURO STOXX Mid Index', 'Dow Jones EURO STOXX Select Dividend 30 Index' and 'Dow Jones EURO STOXX Small Index' are proprietary and copyrighted material and trade marks and/or service marks of Dow Jones & Company, Inc. and/or STOXX Limited and have been licensed for use for certain purposes by Barclays Global Investors Limited. iShares DJ Euro STOXX MidCap, iShares DJ Euro STOXX Select Dividend and iShares DJ Euro STOXX SmallCap are not sponsored, endorsed, sold or promoted by Dow Jones or STOXX, and neither Dow Jones nor STOXX makes any representation regarding the advisability of investing in such funds.
'Dow Jones', 'STOXX', 'Dow Jones EURO STOXX 50 Index' and 'Dow Jones STOXX 50 Index' are proprietary and copyrighted material and trade marks and/or service marks of Dow Jones & Company, Inc. and/or STOXX Limited and have been licensed for use for certain purposes by Barclays Global Investors Limited and iShares II plc. iShares DJ Euro STOXX 50 and iShares DJ STOXX 50 are not sponsored, endorsed, sold or promoted by Dow Jones or STOXX, and neither Dow Jones nor STOXX makes any representation regarding the advisability of investing in such funds.
'FTSE®' is a trade mark jointly owned by the London Stock Exchange plc and the Financial Times Limited (the 'FT'). 'FTSEurofirst®' is a trademark jointly owned by FTSE International Limited ('FTSE') and Euronext N.V ('Euronext'). The FTSEurofirst 100 Index and FTSEurofirst 80 Index are compiled and calculated by or on behalf of FTSE. None of the Exchange, the FT, FTSE or Euronext sponsors, endorses or promotes iShares FTSEurofirst 100 and iShares FTSEurofirst 80 nor is in any way connected to the funds or accepts any liability in relation to their issue, operation and trading. All copyright and database rights within the index values and constituent list vest in FTSE and Euronext. Barclays Global Investors has obtained full licence from FTSE to use such copyright and database rights in the creation of these products.
The FTSE/Xinhua China 25 Index is calculated by or on behalf of FTSE/Xinhua Index Limited ('FXI'). FXI does not sponsor, endorse or promote iShares FTSE/Xinhua China 25. All copyright in the index values and constituent list vests in FXI. Barclays Global Investors has obtained full licence from FXI to use such copyright in the creation of this product. 'FTSE™' is a trade mark jointly owned by the London Stock Exchange plc and the Financial Times Limited. 'Xinhua' is a service mark and trade mark of Xinhua Finance Limited. All marks are licensed for use by FXI.
iShares funds are not sponsored, endorsed, or promoted by MSCI, and MSCI bears no liability with respect to any such funds or any index on which such funds are based. The Prospectus contains a more detailed description of the limited relationship that MSCI has with Barclays Global Investors and any related funds.
'Standard & Poor’s®', 'S&P®', 'S&P 500' are trademarks of The McGraw-Hill Companies, Inc. and have been licensed for use by Barclays Global Investors, N.A. iShares S&P 500 is not sponsored, endorsed, sold or promoted by S&P and S&P makes no representation regarding the advisability of investing in this product.
'iShares' is a registered trademark of Barclays Global Investors, N.A. All other trademarks, servicemarks or registered trademarks are the property of their respective owners. © 2008 Barclays Global Investors Limited. Registered Company No. 00796793. All rights reserved. Calls may be monitored or recorded.