Embed Size (px)
Citation preview

UAC of Nigeria PLC
Group Results Presentation – Full Year 2015

2
This presentation contains or will contain forward-looking statements which reflect management's expectations regarding the Company's future growth, results of operations, performance, business prospects and opportunities. Wherever possible, words such as "anticipate", "believe", "expects", "intend" "estimate", "project", "target", "risks", "goals" and similar terms and phrases have been used to identify the forward-looking statements. These statements reflect management's current beliefs and are based on information currently available to management. Certain material factors or assumptions have been applied in drawing the conclusions contained in the forward-looking statements. These factors or assumptions are subject to inherent risks and uncertainties surrounding future expectations generally. UAC of Nigeria cautions readers that a number of factors could cause actual results, performance or achievements to differ materially from the results discussed or implied in the forward-looking statements. These factors should be considered carefully and undue reliance should not be placed on the forward-looking statements. For additional information with respect to certain of these risks or factors, reference should be made to the Company’s disclosure materials filed from time to time with Securities & Exchange Commission in Nigeria. The Company disclaims any intention or obligation to update or revise any forward-looking statements, whether as a result of new information, future events or otherwise.
Important Notice

3
2
3
2
1
Contents
Summary & outlook 3
Financial Performance review
Overview of the business in FY 2015
Larry Ettah
GMD/CEO
Abdul Bello
CFO
Larry Ettah
GMD/CEO

4
2
3
2
1
Contents
Summary & outlook 3
FINANCIAL Performance review
Overview of the business in FY 2015
Larry Ettah
GMD/CEO
Abdul Bello
CFO
Larry Ettah
GMD/CEO


Presentation Overview
“Tough operating environment in 2015 but we held our market
positions”
6

Operating Environment of 2015
GDP growth down to 3% in 2015 (6.2% 2014)
Parallel Market FX Rates - N191/1$ (2014), N266/1$ (2015)
Inflation at 9.6% (7.9% 2014)
Political uncertainty, delayed transition and stability of new Government/ Cabinet
Insecurity in the North; national petroleum product shortages
Macro-economic challenges; Government revenue falls and build-up of arrears of public servants’ wages
All led to reduced consumer purchasing power
7
Outbreak of Avian Influenza across two-thirds of the States of Nigeria led to significant
reduction in bird population & weak poultry feeds’ demand
Turmoil in the Oil & Gas Industry, volatility in Capital market and decline in general
commercial activities led to a soft Real Estate and Paints markets
8
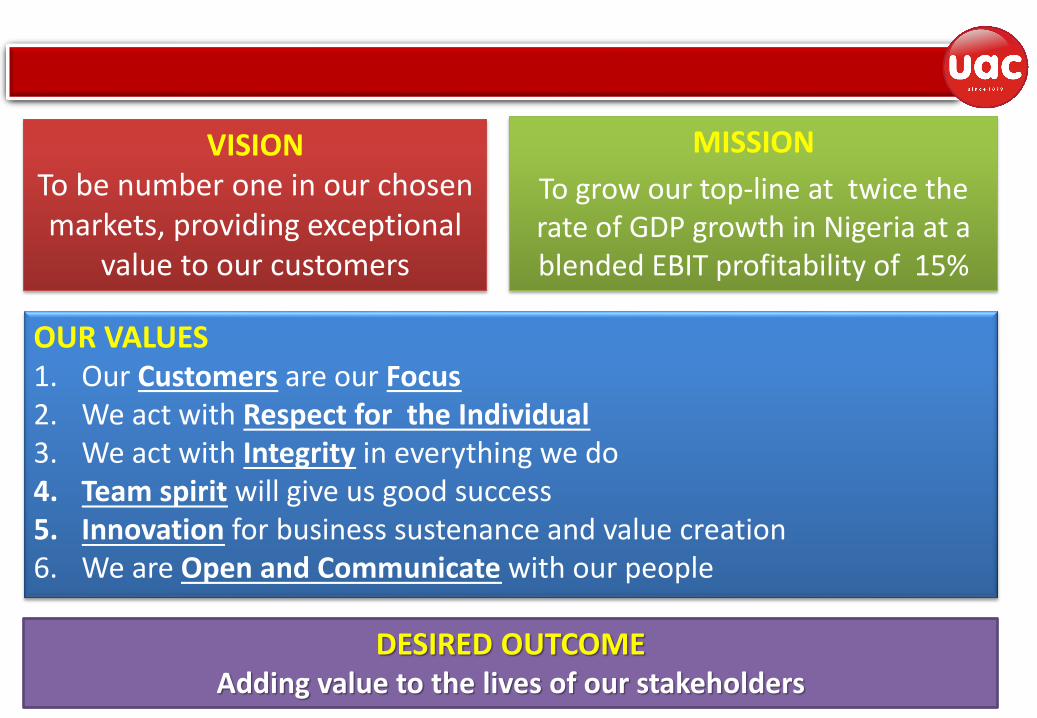
VISION To be number one in our chosen markets, providing exceptional
value to our customers
MISSION
To grow our top-line at twice the rate of GDP growth in Nigeria at a blended EBIT profitability of 15%
OUR VALUES 1. Our Customers are our Focus 2. We act with Respect for the Individual 3. We act with Integrity in everything we do 4. Team spirit will give us good success 5. Innovation for business sustenance and value creation 6. We are Open and Communicate with our people
DESIRED OUTCOME Adding value to the lives of our stakeholders

Group Structure
9
UAC Foods
LTD (51%)
UAC
Restaurants
LTD (51%)
Livestock
Feeds PLC
(51%)
CAP PLC
(50.18%)
MDS Logistics
LTD
(51%)
UPDC PLC
(46%)
Portland Paints
and Products
Nigeria PLC
(64.7%)
UNICO CPFA
(87%)
Grand Cereals
LTD
(64.9%)
Paints Logistics
Pension
Administrator
Snacks/Beverages QSR Animal Feed/Edible Oil/Maize Meal Animal Feed
Foods
Real Estate

10

11
Operations Review
Turnover down 14%
Bird flu and egg glut impacted poultry volumes
Launched Vital Gold, Aqua Boom & Farmers fish feed
Fish feed volume growth
Insecurity in the North continued to impact sales as well as
oilseeds and grains availability
Forex shortages and elevated input costs impacted margins
Turnover down 4% due reduced consumer spend
Increased input prices impacted margins
Northern operations hindered by security challenges
Turnover down 12%
Insecurity impacting operations in the North
Cold chain logistics and Power shortages are key challenges
Macro-economic challenges impacting footfall

12
Operations Review
Turnover up 13% on the back of new Ikeja mill & introduction of
Aquamax Fish feed
Rationalised Benin-City factory; toll milling from Grand Cereals’
Onitsha plant
Rising input costs and grains and oilseeds shortages
Egg glut & later ‘Bird Flu’ outbreak impacted volumes
Turnover up 1%
Launched Dulux TV Commercial
High cost of input materials impacted margins
Decline in consumer spend impacted volumes
Delayed forex allocations
Turnover down 23%
Restructured Sales model & impaired debts and inventory
associated with old model and exit from Sanitary wares
Operating environment – Oil & Gas, Construction impacted
volumes

13
Operations Review
Turnover down 56%
Property market remains soft
Rising interest rates impacting margins Festival Mall opened for business
Turnover up 1%
Increased client base but overall client volume decline
Major fire at Abuja Pharmaceutical warehouse; quickly
rebuilt and trading
Warehouse expansion/modernization at Abuja, Sokoto
and Acme locations
Portfolio optimisation of service offerings to clients

Performance of Key Subsidiaries
Grand Cereals (N’Million)
UAC Restaurants (N’Million) UAC Foods (N’Million)
14
Livestock Feeds (N’Million)
1,221
108
1,078
-134 Turnover PBT
2014 2015
35,813
2,925
30,620
2,041
Turnover PBT
2014 2015 7,914
361
8,963
280
Turnover PBT
2014 2015
15,143
1,463
14,550
1,434
Turnover PBT
2014 2015

Performance of Key Subsidiaries
UPDC (N’Million)
Portland Paints (N’Million) CAP (N’Million)
15
MDS (N’Million)
2,798
105
2,168
-332 Turnover PBT
2014 2015
11,701
3,541
5,121
56
Turnover PBT
2014 2015 4,836
1,501
4,860
1,026
Turnover PBT
2014 2015
6,988
2,442
7,057
2,572
Turnover PBT
2014 2015

UAC Group
Proposal for Private Placement of Preference Shares was not approved by the Shareholders
Approved Rights Issue of 1 for 12 aborted due to weak equity market
UPDC
Rights Issue of 2 for 3 in process. To raise approximately N5.6 billion
Commercial Paper Program of N24 billion in process
Livestock Feeds
Rights Issue of 1 for 2 in process. To raise approximately N1.1 billion
Portland Paints
Rights Issue of 3 for 2 in process. To raise approximately N2 billion
16
UAC will subscribe to the subsidiary Rights Issues using internally generated funds
Update on Capital Raise

17

18
2
3
2
1
Outline
Summary & outlook 3
FINANCIAL Performance review
Overview of the business in 1h 2015
Larry Ettah
GMD/CEO
Abdul Bello
CFO
Larry Ettah
GMD/CEO

19
Poor quality photo!

20
Key Performance Highlights
Financial
Performance
Financial
Position
Performance
Ratios
2015 2014 2015 2014
Turnover 73,145 85,654 821 929
Gross Profit 16,565 19,183 821 929
EBIT 7,607 12,394 2,684 3,941
PBT 7,944 14,097 4,162 5,341
2015 2014 2015 2014
Cash (N'm) 9,183 7,957 3,431 2,855
Borrowings (N'm) 25,649 28,295 - -
Total Assets (N'm) 128,655 130,361 27,572 26,474
Total Liabilities (N'm) 54,513 55,283 5,987 5,031
Net Assets (N'm) 74,142 75,078 21,585 21,443
2015 2014 2015 2014
Gross Margin 23% 22% 100% 100%
EBIT Margin 10% 14% 327% 424%
PBT Margin 11% 16% 507% 575%
ROE 7% 15% 16% 20%
Gearing 0.35x 0.38x - -
Group Company

21
Statement of Profit or Loss
Revenue decline largely on account
of drop in sales in UPDC (N6.2
billion) and Grand Cereals (N5.7
billion)
Other gains – Reduction in gains on
fair valuation of UPDC properties
Other losses – Impairment of
Assets in UPDC Hotels and decline
in property valuation at Holdco
Share of Profit in Associate – REIT
measurement period; 19 months in
2014 vs 12 months in 2015
Taxation relatively up on account of
back duty taxes post-restructuring
Comments 2015 2014 2015 2014
N'M N'M N'M N'M
Continuing Operations
Revenue 73,145 85,654 821 929
Cost of sales (56,580) (66,472) - - - -
Gross profit 16,565 19,183 821 929
Dividend income - - 3,216 3,534
Selling and distribution expenses (3,319) (3,629) - -
Administrative expenses (6,882) (6,551) (1,515) (1,479)
Other gains 1,959 3,464 343 1,028
Other losses (716) (73) (181) (71)
Operating profit 7,607 12,394 2,684 3,941 - -
Net finance (cost) / income (1,451) (1,276) 1,478 1,400
Share of profit of equity accounted associate 1,787 2,979 - - - -
Profit before taxation 7,943 14,097 4,162 5,341
Taxation (2,797) (3,366) (659) (1,028)
Profit from continuing operations 5,147 10,730 3,503 4,313
Profit from discontinued Operations 38 214 - -
Profit for the year 5,185 10,944 3,503 4,313 - -
Profit attributable to Parent 2,997 6,536 3,503 4,313
Profit attributable to NCI 2,188 4,409 - -
Group Company

22
Statement of Financial Position
2015 2014 2015 2014
N'M N'M N'M N'M
PPE 35,439 36,613 858 852
Investment property 20,035 19,924 2,985 3,199
Investments in associates 21,208 19,101 - -
Investments in subsidiaries - - 11,641 11,641
Trade and other receivables 14,594 15,950 8,572 7,815
Cash and short-term deposits 9,183 7,957 3,431 2,855
Other Assets 28,195 30,816 85 113 Total Assets 128,655 130,361 27,572 26,474
Long-term borrowings 8,126 7,737 - -
Short-term borrowings 17,523 20,558 - -
Trade and other payables 14,941 13,961 629 908
Other liabilities 13,923 13,026 5,358 4,123 Total Liabilities 54,513 55,283 5,987 5,031
Equity - Parent 44,588 44,968 21,585 21,443
NCI 29,554 30,110 - -
Total Equity 74,142 75,078 21,585 21,443
Total Equity & Liabilities 128,655 130,361 27,572 26,474
Group Company

Group Trend Analysis Operating Profit (N’M) Turnover (N’M)
23
Turnover trend in 2015 reflects the challenge of the environment and the
consumer
59,638
69,632
78,714 85,654
73,145
2011 2012 2013 2014 2015
7,715
11,526
15,192
12,394
7,607
2011 2012 2013 2014 2015

Group Trend Analysis DPS (Kobo) EPS (Kobo)
24
160 175 175
100
2012 2013 2014 2015
257
291
340
156
2012 2013 2014 2015
Dividend cut bolsters our capital position

Group Trend Analysis ROE Gearing/Current Ratio
25
12%
14% 15%
7%
2012 2013 2014 2015
1.22 1.16
1.25 1.19
0.50
0.36 0.38 0.35
2012 2013 2014 2015
Current Ratio Gearing
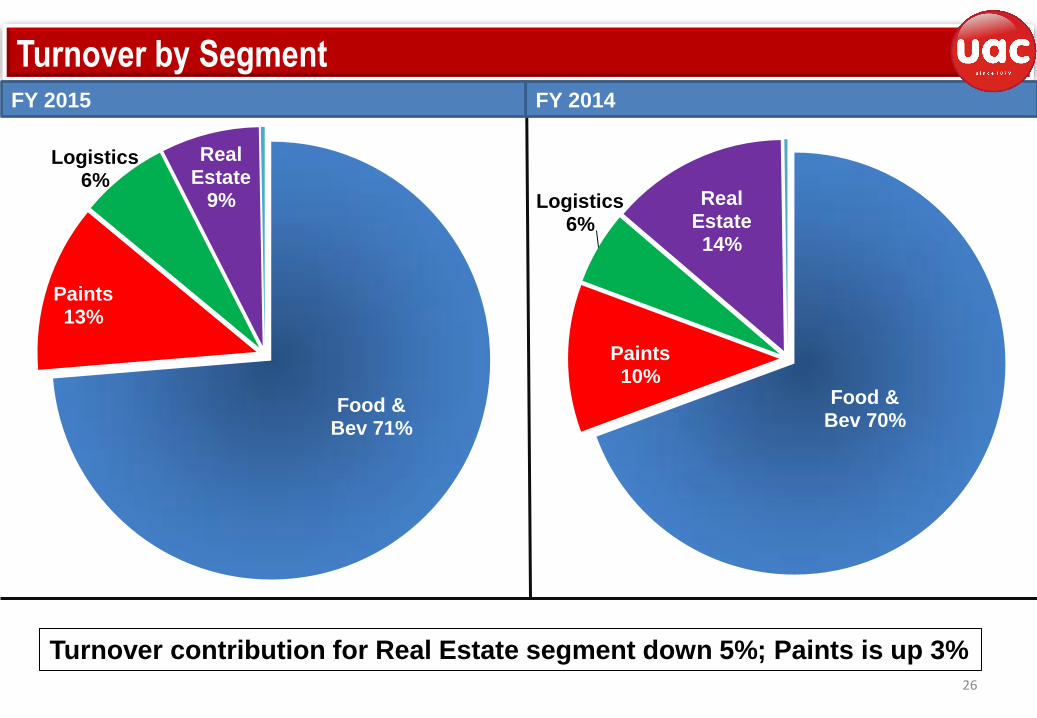
Turnover by Segment FY 2014 FY 2015
26
Turnover contribution for Real Estate segment down 5%; Paints is up 3%
Food & Bev 70%
Paints 10%
Logistics 6%
Real Estate 14%
Food & Bev 71%
Paints 13%
Logistics 6%
Real Estate
9%

PBT by Segment FY 2014 FY 2015
27
Paints contribution to PBT was 34%; Foods is up 11%, both on
account of decline in UPDC
Food & Bev 39%
Paints 20%
Logistics 12%
Real Estate 28%
Others 1%
Food & Bev 50%
Paints 34%
Logistics 14%
Others
2%

Segment Analysis Gross Margins Turnover (N’M)
28
60,091
11,701
4,836
9,786
55,212
5,121 4,860
9,225
Foods Real Estate Logistics Paints
17% 16%
36%
50%
16%
36%
29%
49%
Foods Real Estate Logistics Paints

Segment Analysis PBT Margins
29
8%
30% 31%
28%
6%
1%
21%
25%
Foods Real Estate Logistics Paints

30

31
2
3
2
1
Outline
Summary & outlook 3
FINANCIAL Performance review
Overview of the business in FY 2015
Larry Ettah
GMD/CEO
Abdul Bello
CFO
Larry Ettah
GMD/CEO

Outlook FY 2016
Planned Government spend will be inflationary but same should improve purchasing power of consumers
Forex shortages and Government focus on Agriculture should be supportive of our animal feed businesses
Government focus on Housing development should be supportive of our Real estate and Paints businesses
Planned reintroduction and passage of Petroleum Industry Bill should be supportive of our marine coatings segment of the Paints business
Forex shortages and exchange rate volatility will persist leading to input material shortages and rising input prices
We will achieve growth through strong execution of our strategic thrusts
32

33
1
2
3
Innovation
Talent
Management
Strategic
Fast-track innovation in manufacturing units
Introduce new products in key categories
Resource
Optimisation
4
Resourcing & Human Capacity building
Asset and yield optimisation
Drive for greater efficiency especially in supply chain
Cost optimisation
SAP ERP Benefit Realisation
Restructure financing of UPDC, Livestock Feeds & Portland Paints
Pursue greater integration of Livestock & Portland
Route to market redefinition
Our 2016 Priorities