Embed Size (px)
Citation preview

1
DUBAIUAE Food and Beverage Market
Trends and Opportunities
February 2020
Economic Research Department
Dubai Chamber of Commerce and Industry

OUTLINE
2
Section I: Overview
Section II: UAE Food and Beverage Market
Section III: Dubai Trade of Food and Beverage Products
Section IV: Opportunities in Food and Beverage Market
Section V: Conclusions
OverviewFood Security in UAE
5-year change in score of Global Food Security Index in GCC, 2014-2018
Source: Dubai Chamber based on EIU and Alpen Capital
UAE’s Global Food Security Index, 2014-2018
3
69.5
70.9
71.471.7
72.5
68
69
70
71
72
73
2014 2015 2016 2017 2018
Sc
ore
3.0
1.9
1.8
1.5
-0.6
-1.4
UAE
Bahrain
Oman
Saudi Arabia
Kuwait
QatarNote: Scores are out of 100
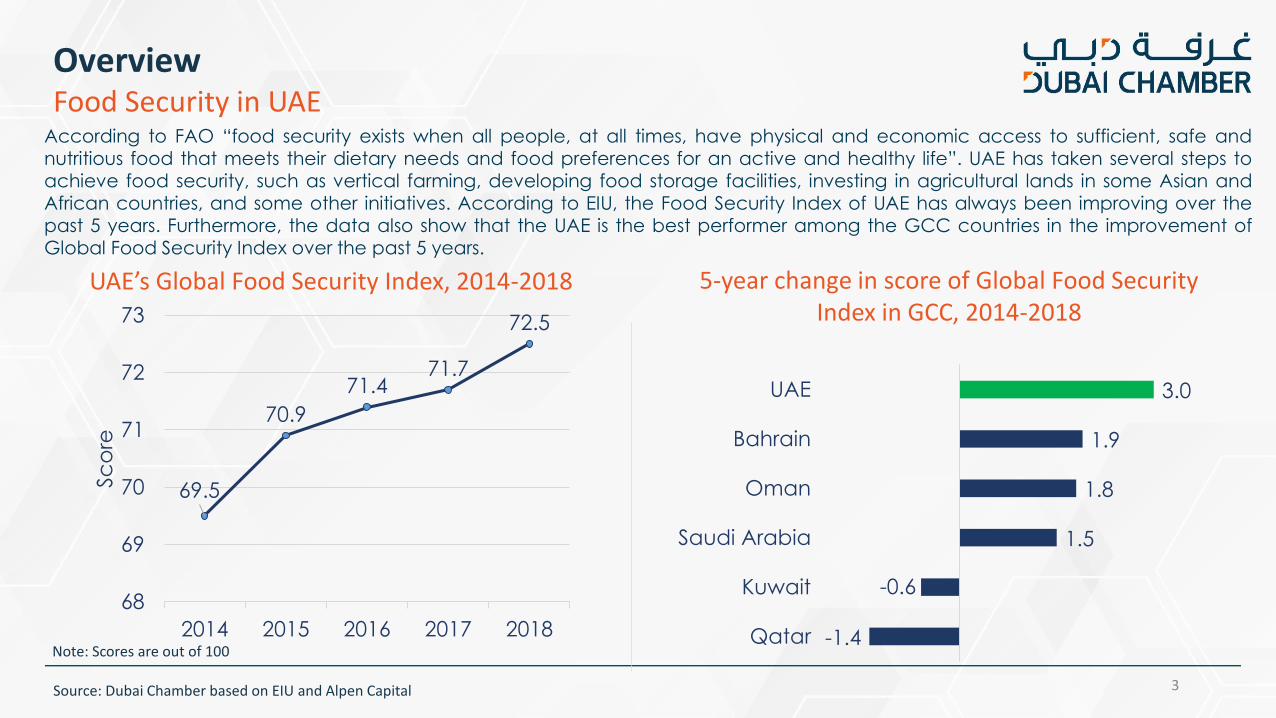
According to FAO “food security exists when all people, at all times, have physical and economic access to sufficient, safe andnutritious food that meets their dietary needs and food preferences for an active and healthy life”. UAE has taken several steps toachieve food security, such as vertical farming, developing food storage facilities, investing in agricultural lands in some Asian andAfrican countries, and some other initiatives. According to EIU, the Food Security Index of UAE has always been improving over thepast 5 years. Furthermore, the data also show that the UAE is the best performer among the GCC countries in the improvement ofGlobal Food Security Index over the past 5 years.
OverviewDriving Factors of Food Industry in UAE
Source: Dubai Chamber based on IMF World Economic Outlook and Dubai Media Office 4
Population Growth Rising Income Rising Tourist Arrivals
Total population of UAE was
around 10.7 million in 2019
GDP per capita in UAE was
around $39,749 in 2019
In 2019, Dubai welcomed 16.7 million tourists
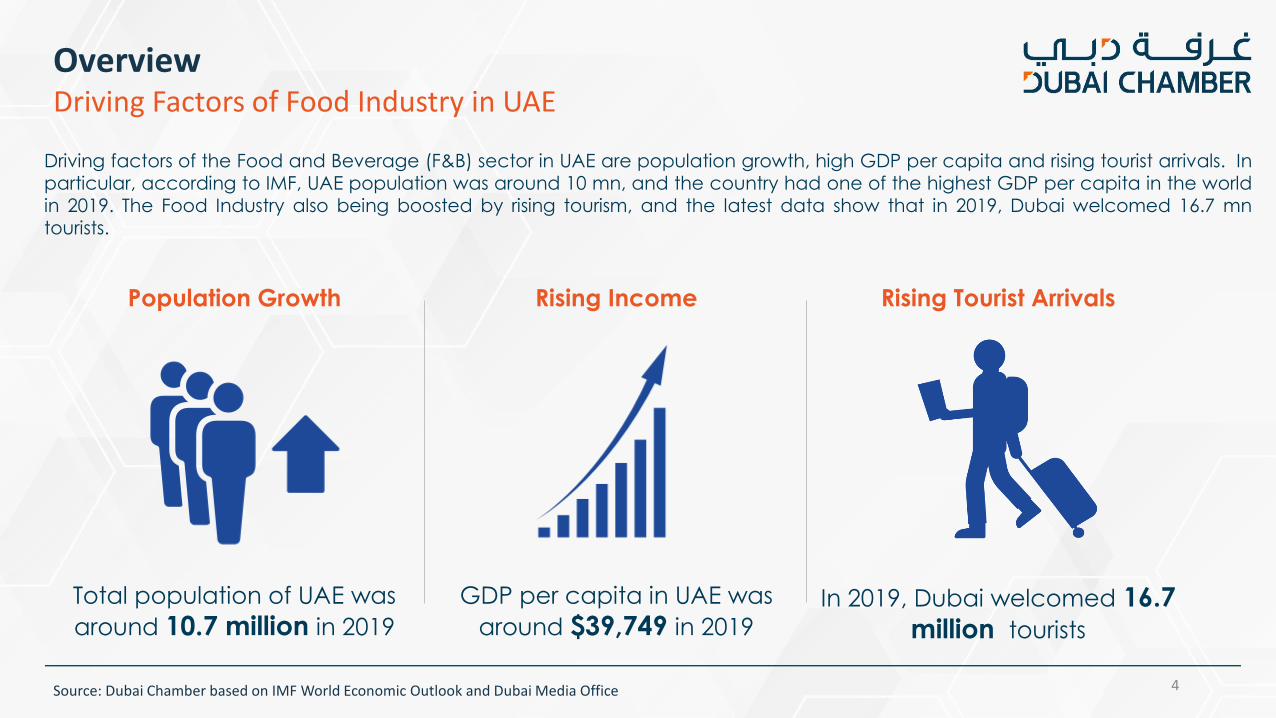
Driving factors of the Food and Beverage (F&B) sector in UAE are population growth, high GDP per capita and rising tourist arrivals. Inparticular, according to IMF, UAE population was around 10 mn, and the country had one of the highest GDP per capita in the worldin 2019. The Food Industry also being boosted by rising tourism, and the latest data show that in 2019, Dubai welcomed 16.7 mntourists.

OverviewUAE National Food Security Strategy 2051
Source: UAE Food Security Agenda 5
Facilitate global agri-business
trade and diversify international
food sources.
Enhance sustainable technology-
enabled domestic food supply
across the value chain.
Reduce food loss and waste.
Sustain food safety and improve
nutritional intake.
Enhance capacity to respond to
food security risks and crises.
Five pillars of National Food Security StrategyUAE Target by 2021
To make UAE within the top 10 in
Global Food Security Index ranking.
Domestic production target of
food over 100,000 tons by 2021.
Creation of more than 16,000 jobs
in food sector in the country.
Achieving economic returns of up
to AED 22 billion in food sector.

6
Section I: Overview
Section II: UAE Food and Beverage Market
Section III: Dubai Trade of Food and Beverage Products
Section IV: Opportunities in Food and Beverage Market
Section V: Conclusions
OUTLINE

UAE Food and Beverage MarketFood
Fresh Food and Packaged Food Retail Sales Value (USD bn)
Source: Euromonitor 7
2
3
4
5
6
7
8
9
2013 2014 2015 2016 2017 2018
USD
bn
Packaged Food Fresh Food
According to Euromonitor, in 2018, the retail sales value of fresh food and packaged food in UAE reached USD 8.0 bn and USD 5.5 bn,respectively. Furthermore, between 2013 and 2018, UAE retail sales of fresh food grew with CAGR of 5.1% and retail sales value ofpackaged food grew with CAGR of around 3.9%.

Fresh Food Retail Sales Value by Categories, USD bn (2018) and CAGR (2013-2018)
Source: Euromonitor
Packaged Food Retail Sales Value by Categories, USD bn (2018) and CAGR (2013-2018)
8
UAE Food and Beverage MarketFood by Categories
1.8
1.6
1.3
0.7
Staple Foods
Dairy
Snacks
Cooking Ingredients
and Meals
2.1
1.7
1.6
0.7
0.6
0.6
0.3
0.2
0.1
Meat
Vegetables
Fruits
Nuts
Fish & Seafood
Pulses
Starchy Roots
Eggs
Sugar & Sweeteners
4.8%
2.8%
4.2%
4.3%
CAGR
5.6%
5.8%
4.7%
5.4%
3.8%
7.0%
2.0%
3.0%
2.8%
CAGR
In 2018, staple foods had the highest retail sales value and growth rate among the packaged food categories, followed by dairy,snacks, and cooking ingredients and meals. In the fresh food category, the largest sales value was observed for meat, vegetablesand fruits, but pulses had the highest CAGR of 7% between 2013 and 2018.

Soft Drinks Retail Sales Value by Categories, USD million (2018) and CAGR (2013-2018)
Source: Euromonitor
Soft Drinks Retail Sales Value, USD bn (2018) and CAGR (2013-2018)
9
UAE Food and Beverage MarketBeverages
9%
2%
4%
10%
3%
6%
14%
22%
CAGR
2
3
4
5
6
2013 2014 2015 2016 2017 2018
2,201
1,378
974
458
54
16
13
6
Bottled Water
Juice
Carbonates
Energy Drinks
Concentrates
RTD Tea
Sports Drinks
RTD Coffee
As reported by Euromonitor, in 2018, UAE retail sales value of soft drinks reached USD 5.1 bn. From 2013 to 2018, UAE retail sales of softdrinks grew with CAGR of around 5.7%. The largest category in this group was bottled water, juice and carbonated water. It is alsoworth mentioning that Ready to Drink (RTD) coffee had the highest CAGR of 22% between 2013 and 2018.

Source: Euromonitor 10
UAE Food and Beverage MarketNew Trends in Food
Naturally Healthy Food Organic Food Free-From Food
$473 m
9.7%
$31 m
17.7%
$29 m
18.3%
Nuts & Seeds
Dairy
High Fibre
Fruit Snacks
Olive Oil
Honey
$162 m
$128 m
$48 m
$43 m
$36 m
$35 m
UAE Sales Value in 2018 (USD m) and CAGR (2013-2018)
20%
6%
8%
4%
7%
7%
Dairy
Baby Food
Sauces &
Dressings
Meat, Fruit &
Vegetables
Biscuits & Snacks
$10 m
$9 m
$4 m
$3 m
$3 m
30%
22%
7%
8%
14%
Dairy Free
Gluten Free
Allergens
Free
Lactose Free
$15 m
$8 m
$3 m
$1 m
13%
35%
10%
10%

31.6
55.7
71.582.1
98.1
115.9
2014 2015 2016 2017 2018 2019e
UAE Food and Beverage MarketE-commerce in Food Industry
Food and Drink Internet Retailing in UAE, USD million, 2014-2019
Source: Euromonitor 11
UAE has one of the highest internet penetration rates in the world, with almost 99% of its population using the internet. Moreover,many people in UAE use smartphones. This gave a push for the growth of food and drink internet retailing in UAE over the past fewyears. According to Euromonitor, between 2014 and 2019, UAE F&B internet retailing more than tripled and reached USD116 millionin 2019. In general, there are many e-commerce websites or mobile applications in UAE which offer food delivery services or theyconnect big supermarkets to consumers. Moreover, this market in UAE is growing very fast and there are also some specialized e-commerce websites that focused only on for instance, in organic products, or meat and seafood products.

12
Section I: Overview
Section II: UAE Food and Beverage Market
Section III: Dubai Trade of Food and Beverage Products
Section IV: Opportunities in Food and Beverage Market
Section V: Conclusions
OUTLINE

0
2
4
6
8
10
12
14
16
2012 2013 2014 2015 2016 2017 2018 2019
Q1-Q3
USD
bn
Export Import Re-export
Dubai Trade of Food and Beverage ProductsTotal trade
Dubai Trade of Food and Beverage Products with the World (USD bn) and CAGR (%, 2012-2018)
Source: Dubai Customs 13
CAGR=4.0%
22%
30%
2012 2019 Q1-Q3
Dubai’s re-export share in imports of Food and Beverage products from the world (%)
CAGR=0.1%
CAGR=1.7%
Note: Food and Beverage Trade includes all products from HS01 to HS23, excluding HS05 (Products of animal origin) and HS06 (Live trees, flowers etc.).
+8%
The Dubai Customs’s latest data show that in the first three quarters of 2019, Dubai imports of F&B products from the world reachedUSD 9.6 bn, and it grew with CAGR of 1.7% from 2012 to 2018. Furthermore, in 2019 (Q1-Q3), re-exports of F&B products reached USD2.9 bn, and had a CAGR of 4% between 2012 and 2018. The data also indicate that the share of re-exports in imports of F&B productsof Dubai with the world grew from 22% in 2012 to 30% in 2019, 8 percentage point growth.

Dubai Trade of Food and Beverage ProductsTrade Partners
Dubai’s Major Partners in Imports of Food and Beverage Products from the World, % share, 2019 Q1-Q3
Source: Dubai Customs 14
Note: Food and Beverage Trade includes all products from HS01 to HS23, excluding HS05 (Products of animal origin) and HS06 (Live trees, flowers etc.).
Dubai’s Major Partners in Total Exports of Food and Beverage Products to the World, % share, 2019 Q1-Q3
11%
10%
9%
4%
4%
3%3%
3%3%3%
47%
USA
India
Brazil
Australia
New Zealand
France
Canada
UK
Netherlands
China
Others
11%
8%
6%
3%
3%
3%
3%
3%2%2%
56%
Oman
Iraq
Saudi Arabia
China
Somalia
Egypt
India
Kuwait
Yemen
Maldives
Others
In 2019 (Q1-Q3), Dubai had diversified imports of F&B products and major import partners include the USA, India, Brazil, Australia andothers. The data also indicate that during the same period, Dubai also had diversified exports of F&B products, and major exportpartners in this product group include Oman, Iraq, Saudi Arabia, China, Somalia and other countries. In general, both figures indicatethat Dubai mainly imports F&B products from far countries such as the USA, Brazil and Australia, and exports them to the Middle Eastand African countries.

Dubai Trade of Food and Beverage ProductsMajor Traded Products
Dubai’s Major Imported Food and Beverage Products from the World, % share, 2019 Q1-Q3
Source: Dubai Customs 15
Note: Food and Beverage Trade includes all products from HS01 to HS23, excluding HS05 (Products of animal origin) and HS06 (Live trees, flowers etc.).
Dubai’s Major (Re-)Exported Food and Beverage Products to the World, % share, 2019 Q1-Q3
15%
13%
8%
7%7%6%
6%
6%
5%
5%
22%
Fruits and nuts
Meat (bovine, sheep, chicken)
Dairy
Beverages (soft drinks, spirits)
Coffee, tea, spices
Cereals
Other edible food
Vegetables
Cereal preperations
Cocoa & products of it
Others
16%
11%
10%
9%7%
7%
5%
5%
4%
4%
22%
Fruits and nuts
Beverages (soft drinks, spirits)
Dairy
Meat (bovine, sheep, chicken)
Other edible food
Coffee, tea, spices
Animal or vegetable fat
Cereal preperations
Vegetable preperations
Meat preparations
Others
Dubai Customs data also indicate that Dubai traded with many types of products with the world in 2019 (Q1-Q3). In imports, themajor products included fruits and nuts, meat, dairy, beverages and other products. In exports/re-exports major products are fruitsand nuts, beverages, dairy, meat and others.

16
Section I: Overview
Section II: UAE Food and Beverage Market
Section III: Dubai Trade of Food and Beverage Products
Section IV: Opportunities in Food and Beverage Market
Section V: Conclusions
OUTLINE

Source: Euromonitor 17
Opportunities in Food and Beverage MarketForecast for F&B Products Sales in UAE
Forecast for UAE’s Packaged Food Retail Sales Value, CAGR (2018-2023)
Forecast for UAE’s Fresh Food Retail Sales Value, CAGR (2018-2023)
Forecast for UAE’s Soft Drinks Retail Sales Value, CAGR (2018-2023)
5.1%
4.3%
2.6%
1.7%
Staple Foods
Cooking Ingredients
& Meals
Snacks
Dairy
7.0%
5.5%
5.4%
5.0%
4.3%
4.0%
4.0%
3.7%
1.9%
Meat
Pulses
Nuts
Vegetables
Sugar and…
Eggs
Fruits
Fish and Seafood
Starchy Roots
8.3%
4.4%
3.9%
3.3%
2.1%
-3.6%
-4.9%
-8.6%
RTD Coffee
Bottled Water
Concentrates
RTD Tea
Juice
Sports Drinks
Carbonates
Energy Drinks
According to Euromonitor’s forecast, from 2018 to 2023, UAE sales of packaged food, fresh food and soft drinks will grow with CAGR ofaround 3.5%, 5.2% and 1.2%, respectively. In packaged food, the growth of retail sales value will be the highest in staple food,followed by cooking ingredients, snacks and dairy. In fresh food, the largest growth is expected in meat, pulses, nuts and vegetables.Moreover, in soft drinks category, the largest growth will be in ready to drink (RTD) coffee, bottled water, concentrates, tea and otherproducts.

Source: Alpen Capital and EXPO 2020 Dubai 18
Opportunities in Food and Beverage MarketEXPO 2020
Visitors F&B Sales Meals
Expo 2020 expected to host
25 million visitors
Estimated onsite F&B sales
during the event worth
USD 545 million
Around 85,000 meals will be
served per hour in EXPO 2020
The growth of F&B sector in UAE is expected to continue with the upcoming mega event EXPO 2020. In particular, this event will offerlarge opportunities in F&B sector. EXPO 2020 expected to host 25 million visitors, and estimated onsite sales of F&B products expectedto be $545 million. Moreover, around 85,000 meals will be served per hour during the six months event.

Forecast of F&B Consumption in the World by Region, CAGR (2018-2023)
Source: Euromonitor 19
Forecast of F&B Value Sales in MENA by Categories, CAGR (2018-2023)
Opportunities in Food and Beverage MarketMENA
9.9%
8.8%
7.4%
6.7%
4.4%
4.3%
3.4%
Middle East & North Africa
Sub-Saharan Africa
Latin America
Asia Pacific
Europe
Australasia
North America
5.2%
5.2%
3.8%
3.6%
3.4%
3.3%
3.2%
2.9%
Meat & Poultry
Seafood
Pulses, Grains & Cereals
Beverages
Fats and Oils
Confectionery & Snacks
Cooking Ingredients
Dairy
It was mentioned before that the Middle East and North African countries have a significant share in Dubai’s total exports of F&Bproducts to the world. The region will continue to be the major trade partner, due to a high expected consumption growth of F&Bproducts in the world, according to Euromonitor. In particular, MENA countries expected to have high sales value growth in meat andpoultry, seafood, pulses, grain and cereals and other products over the next five years.

Source: Dubai Chamber based on Dubai Customs data 20
Potential F&B Products for Dubai imports
Opportunities in Food and Beverage MarketPotential Products for Imports
Dubai F&B imports volume (2019 Q1-Q3) vs. YoY change, 2018-2019 (Q1-Q3)
Dubai F&B imports value (2019 Q1-Q3) vs. YoY change, 2018-2019 (Q1-Q3)
-60%
-40%
-20%
0%
20%
40%
60%
0 1,000 2,000
2019 (
Q1-Q
3),
Yo
Y
ch
an
ge
in v
olu
me
Thousand ton
-40%
-20%
0%
20%
40%
60%
- 1 2 3 4 5 6
2019 (
Q1-Q
3),
Yo
Y
ch
an
ge
in
va
lue
AED Billion
Short Term Growth of
Dubai Imports, 2019 (Q1-
Q3), YoY change
Long Term
Growth of Dubai
imports
Volume
Growth
Value
Growth
CAGR of volume
(2011-2018)
Meat (bovine, sheep,
chicken)48% 52% 4%
Beverages (soft drinks,
spirits)42% 6% 5%
Cereal preparations 9% 12% 4%
Vegetable & fruits
preparations8% 6% 1%
Products of the milling
industry8% 0.5% 15%
Cocoa & products of it 8% 2% 11%
Fruits and nuts 7% 3% 4%
1.
2.
3.
4.
5.
6.
7.
12
3 5 46 7
1
23
45 76
These figures and table show Dubai’s imported food and beverage products from the
world which had a high short term (2018 vs 2019) volume and value growth rate. In
addition, these products also had high long term import growth rates. For instance,
between Q1-Q3 of 2018 and 2019, Dubai import volume and value growth of meat
products from the world grew by 48% and 52%, respectively. Besides, Dubai import volume
of meat from the world grew with CAGR of 4% from 2011 to 2018.

Source: Dubai Chamber based on Dubai Customs data 21
Potential F&B Products for Dubai re-exports
Opportunities in Food and Beverage MarketPotential Products for Re-exports
Dubai F&B re-exports volume (2019 Q1-Q3) vs. YoY change, 2018-2019 (Q1-Q3)
Dubai F&B re-exports value (2019 Q1-Q3) vs. YoY change, 2018-2019 (Q1-Q3)
-200%
0%
200%
400%
600%
800%
- 100 200 300
2019 (
Q1-Q
3),
Yo
Y
ch
an
ge
in v
olu
me
Thousand ton
-400%
0%
400%
800%
1200%
1600%
0.0 2.0 4.02019 (
Q1-Q
3),
Yo
Y
ch
an
ge
in v
alu
e
AED Billion
Short Term Growth of Dubai
re-exports, 2019 Q1-Q3,
YoY change
Long Term
Growth of
Dubai re-exp
Volume GrowthValue
Growth
CAGR of
volume (2011-
2018)
Meat (bovine, sheep,
chicken)747% 1155% 14%
Fish and Seafood 289% 108% 5%
Oil seeds and oleaginous fruits 220% 207% -12%
Cocoa & products of it 67% 54% 9%
Dairy 52% 64% 20%
Meat preparations 26% 21% 3%
Coffee, tea, & spices 9% 26% 0%
Beverages (soft drinks, spirits) 8% -2% 10%
Cereal preparations 8% 66% 1%
1
23
1.
2.
3.
4.
5.
6.
7.
8.
9.
4 576 89
1
32
857496
These figures and table show Dubai’s re-exported food and beverage products to the
world which had a high short term (2018 vs 2019) volume and value growth rate. In
addition, these products also had high long term re-export growth rates. For instance,
between Q1-Q3 of 2018 and 2019, Dubai re-export volume and value growth of meat
products to the world grew by 747% and 1,155%, respectively. Besides, Dubai re-export
volume of meat to the world grew with CAGR of 14% from 2011 to 2018.

Source: Fitch Connect, Dubai Exports, Dubai FDI, Thomson Reuters 22
Opportunities in Food and Beverage MarketInvestment Opportunities
F&B Business Environment Food Manufacturing Agriculture Halal Food
1st/18th
According to Fitch
Connect Risk Reward
Index, UAE ranked 1st in
MENA, and 18th globally in
F&B investment
environment attractiveness
in 2020 (Q1)
13%/17%
Dubai’s F&B manufacturing
contributes 13% of the
manufacturing value
added and 17% of the
manufacturing output.
Opportunities: Processed cereals, meat, fruits and
vegetables
>1,000
There are around 1,000
hydroponic projects in
UAE.
Opportunities: drought, heat, and salt-tolerant
crops, vertical and
hydroponic farming
Global halal food
expenditure will reach
$1,863 bn by 2023 and
Dubai wants to become a
hub in ‘halal’ food.
$1,303 bn
$1,863 bn
2017 2023

Source: Trademap 23
Opportunities in Food and Beverage MarketFinding Potential Buyers: Case Study for Frozen Chicken Exports to Oman
1. Open www.trademap.org
and type HS code of the
product (e.g. HS020714-Frozen
chicken), and country you want
to export (e.g. Oman), and
press Companies.
2. In the next page, select the
product category you want to
export (e.g. Poultry and poultry
products).
3. Get the list of companies in
product and country you are
interested in (e.g. 20 importing
companies of poultry products
in Oman).
Note: Register first on the website and it is free.

24
Section I: Overview
Section II: UAE Food and Beverage Market
Section III: Dubai Trade of Food and Beverage Products
Section IV: Opportunities in Food and Beverage Market
Section V: Conclusions
OUTLINE

Conclusions
25
The UAE remains the most attractive market in the region for food and beverage.
In UAE, the consumption of staple food, meat, and beverages is growing strongly by
value and volume.
Health, taste, nutrition, convenience and online shopping are becoming a new driving
factors of food industry in UAE and MENA region.
There are also large investment opportunities in food manufacturing, halal food and
innovative agriculture.
UAE is becoming a major hub for F&B trade in the MENA region.
Dubai Chamber International Offices can help importers and re-exporters of food and
beverage products to grow in their respective countries and regions.

References and useful links
26
• Alpen Capital. “GCC Food Industry Report 2019” http://www.alpencapital.com/industry-reports.html# (accessed February 2020).
• Dubai Customs. “Dubai Trade Statistics” https://www.dubaicustoms.gov.ae/en/TradeStatistics/Pages/default.aspx (accessed January
2020).
• EIU. “Global Food Security Index” https://foodsecurityindex.eiu.com/Index (accessed February 2020).
• Euromonitor. “Global Industry Outlook Report - Gulfood 2020”. https://www.gulfood.com/outlook-report (accessed February 2020).
• Euromonitor. “Food and Drink Internet Retailing in United Arab Emirates 2018”. https://www.euromonitor.com/food-and-drink-internet-
retailing-in-the-united-arab-emirates/report (accessed February 2020).
• Euromonitor. “Fresh Food in United Arab Emirates 2018”. https://www.euromonitor.com/fresh-food-in-the-united-arab-emirates/report
(accessed February 2020).
• Euromonitor. “Naturally Healthy Packaged Food in United Arab Emirates 2018”. https://www.euromonitor.com/naturally-healthy-
packaged-food-in-the-united-arab-emirates/report (accessed February 2020).
• Euromonitor. “Packaged Food in United Arab Emirates 2018”. https://www.euromonitor.com/packaged-food-in-the-united-arab-
emirates/report (accessed February 2020).
• Euromonitor. “Soft Drinks in United Arab Emirates 2018”. https://www.euromonitor.com/soft-drinks-in-the-united-arab-emirates/report
(accessed February 2020).
• Fitch Solutions. “United Arab Emirates Food & Drink Report” https://store.fitchsolutions.com/all-products/united-arab-emirates-food-drink-
report (accessed February 2020).
• IMF “World Economic Outlook by Country” https://www.imf.org/external/pubs/ft/weo/2019/02/weodata/weoselgr.aspx (accessed
February 2020).
• Trademap “Bilateral Trade Statistics” https://trademap.org/ (accessed February 2020).
• UAE Food Security Agenda. “National Food Security Strategy”
https://foodsecurity.gov.ae/en/download_report/jgSIGpzpofgXCw2VSCSC9hvhmAdDNPoc5I1TWqAW.pdf (accessed February 2020).