Embed Size (px)
Citation preview
uatlon
mmat
:ments
:ion_ )ors
.............
(NASA) 2O p
NASA Technical Memorandum 4131
Flight Evaluation
of a Pneumatic System
for Unsteady Pressure
Measurements Using
Conventional Sensors
Robert E. Curry and Glenn B. Gilyard
Ames Research Center
Dryden Flight Research Facility
Edwards, California
National Aeronautics and
Space Administration
Office of Management
Scientific and TechnicalInformation Division
1989

CONTENTS
SUMMARY
INTRODUCTION
NOMENCLATURE
BACKGROUND
EXPERIMENTAL HARDWARE AND INSTALLATION
FLIGHT MANEUVERS
DATA ANALYSIS
RESULTS AND DISCUSSION
Qualitative Analysis ...................
Power Spectral Density ..........................................
Transfer Function Analysis .........................................
CONCLUDING REMARKS
REFERENCES
TABLE
FIGURES
1
1
1
2
2
3
3
4
4
4
5
5
6
6
7
PRECEDING PAGE BLANK NOT FILMED
iii

=
I
r
SUMMARY
A flight experiment was conducted to evaluate a pressure measurement system which uses pneumatic tubing and
remotely located electronically scanned pressure transducer modules for in-flight unsteady aerodynamic studies. A
parametric study of tubing length and diameter on the attenuation and lag of the measured signals was conducted.
The hardware was found to operate satisfactorily at rates of up to 500 samples/see per port in flight. The signal
attenuation and lag due to tubing were shown to increase with tubing length, decrease with tubing diameter, and
increase with altitude over the ranges tested. Measurable signal levels were obtained for even the longest tubing
length tested, 4 ft, at frequencies up to 100 Hz.
This instrumentation system approach provides a practical means of conducting detailed unsteady pressure sur-
veys in flight.
INTRODUCTION
As efficient aircraft design increasingly relies on the prediction of unsteady aerodynamics, the need for high-
frequency pressure measurements is becoming more critical. In-flight measurement techniques for frequencies in
excess of 20 Hz are needed to validate unsteady aerodynamic analysis codes used for the prediction of flutter and
aeroservoelasticity. Regions of separated flow, vortex impingement, and phenomena such as vortex and shock-
induced oscillations can be identified with detailed unsteady pressure surveys. In-flight unsteady pressure measure-
ments also may prove useful to support flutter clearance testing. Despite these potential applications, few detailed
in-flight unsteady pressure surveys have been made.
A flight experiment was devised to test whether a pneumatic unsteady pressure measurement system with con-
ventional sensors could be used effectively for research flight testing. The specific objectives of the study wereas follows:
I. To demonstrate the operation of a scanning pressure transducer module and data system at rates up to 500
samples/see per port in a flight environment;
2. To perform a limited parametric study of tubing geometry (diameter and length);
3. To determine the level of high-frequency information that can be obtained through pneumatic tubing;
4. To determine whether transfer functions can be determined for later use in correcting remotely sensed data for
pneumatic effects.
The background, experimental setup, flight test techniques, and data analysis methods used to address theseobjectives are described. A discussion of the results is included.
NOMENCLATURE
ESP
ID
OWRA
PCM
PSD
electronically scanned pressureinside diameter
oblique wing research airplane
pulse code modulation
power spectral density
BACKGROUND
Conventional unsteady pressure measurements rely on pressure transducers which are installed flush to the air-
craft surface or connected to an orifice on the surface by a short pneumatic tube (approx_ately 1 in,). An example
of this type of instrumentation is described in Hess and others (1987). In many flight applications, access to wing
cavities for transducer installation or maintenance is difficult if not impossible. Sometimes redundant transducers
are installed at each measurement location so that replacement of failed transducersqs not necessary. The Wide
range of temperatures experienced in flight generally requires that the transducers be either temperature controlled
(to prevent the output from drifting out of range) or have a filter to rem0ve the steady-state value. If filtered, an
additional measurement system would be required to provide steady pressure data. Flush-mounted transducers are
also exposed to a variety of undesired high-frequency input (for example, from engine noise) and therefore require
antialias filtering. Electronic filtering introduces spectral distortion (magnitude and phase characteristics): that must
be accounted for in the data reduction process. All of these problems add to the system complexity and cost. For
these reasons, in-flight unsteady pressure surveys generally have been limited in scope.
Steady pressure surveys obtained in flight typically avoid these problems through the use o ffitish surface orifices,pneumatic tubing, and rcmot_atedtransducers' This approach allows_e use b_fan electronically scanned
pressure (ESP) module consisting of multiple transducers that are scanned and multiplexed onto a common data
channel. The ESP Can Use a single temp_ature con[roisysttrfi to prevent ran_ drift of all transducers in the module.
These features have made it possible to obtain detailed=steady pressure surveys in flight/it a reasonable cost.
Whenever tubing and remote transducers are used for unsteady data, the pneumatic effects (magnitude and phase
distortion of the actual surface pressure fluctuations) must be accounted for. Tile majority of analysis to determine
these pneumatic effects, such as Lamb (1957), is related to high-volume pneumatic systems and iow_frequency datarequirements (for applications such as air data measurements). Some studies (Tijclernan, l_B-ergh'_had Tljdeman,
1965) have concentrated on systems designed for use at frequencies up to I00 Hz. Results from these studies have
been used to successfully predict the pneumatic effects of tubing in correlation with laboratory studies of oscillating
pressures at the orifice (Chapin, 1983). These analytical methods, however, do not accurately account for the effect
of flows over the surface of an orifice which produce energy in the higher harmonic frequencies. In a wind tunnel
application of pneumatic tubing for unsteady pressures (Seidel and others, 1987), the pneumatic effects were found
to be small and measurable. In this case, however, the tubing length was only 18 in., too short for most flight
test applications. -
The authors show thatforsomein-flight applications, pneumatically sensed systems can provide suitable high-
frequency pressure data. This approach will allow more extensive unsteady pressure surveys at a reasonable cost.
One proposed application of this system was the F-8 oblique wing research airplane (OWRA) (Gregory, 1985) in
which in-flight steady and unsteady pressures were to be measured over a wide range of wing sweeps and flight
conditions. A system of about 400 flush orifices connected to 13 ESP modules and only 40 surface-mounted trans-
ducers was envisioned for this project. Obtaining this quantity of data through independent steady and unsteady
measurement systems would not have been practical because of the cost and instaliation compiexity.
EXPERIMENTAL HARDWARE AND INSTALLATION
The experimental hardware was installed in the right wing of an F-15 research airplane (fig. l(a)). An access
panel on the leading edge was used to install various flush orifices on the wing surface and to stow other system
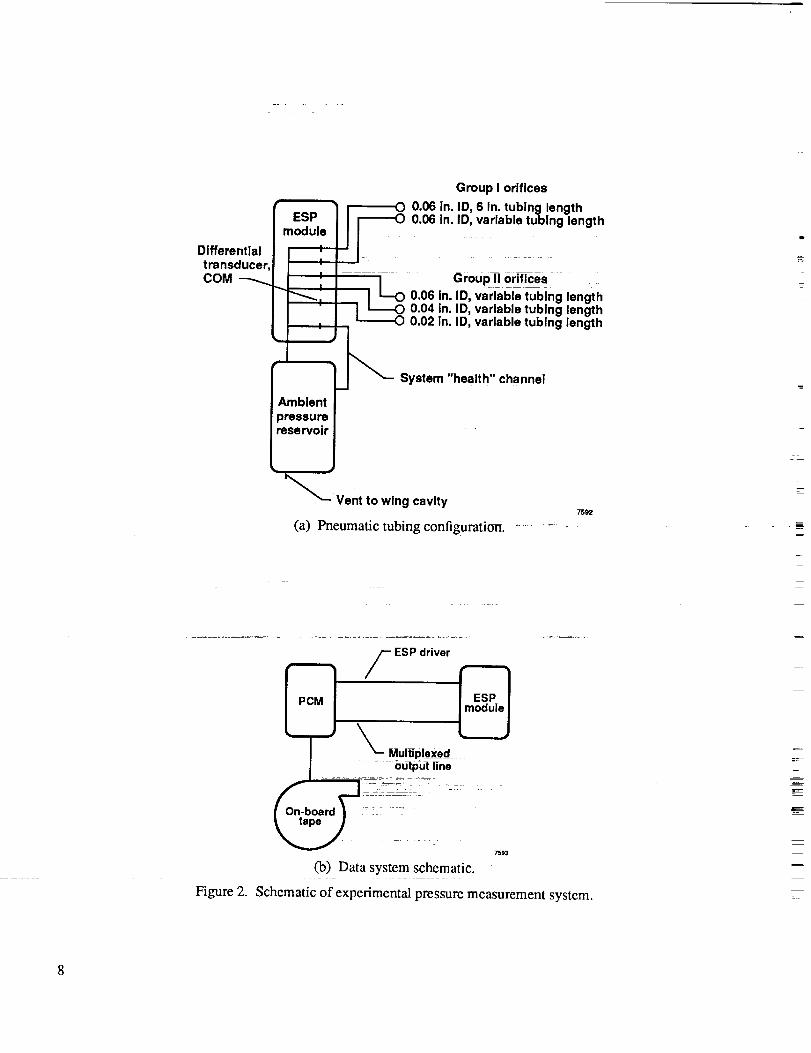
hardware (fig. l(b)). A schematic of the experimental system is shown in figures 2(a) and 2(b).
The orifice installation hardware was fabricated from approximately 1 in. of metal tubing with the desired inside
diameter (nominally 0.02, 0.04, or 0.06 in.). A washer was soldered around the tubing approximately 0.25 in. from
one end, and the unit was inserted from the inside of the wing skin through holes of appropriate diameter and epoxied
in place.Theprotrudingtubingthenwasfiledflushwiththewingsurface.Specificlengthsof flexibletubingwithsimilarinsidediameterasthemetalorificewereusedtoconnecttheorificeto anESPmodule.Themeasuredinsidediameters(IDs)of theorificesandflexibletubingaregivenin table1.Fortheremainderof thispaper,thenominalvaluesareused.
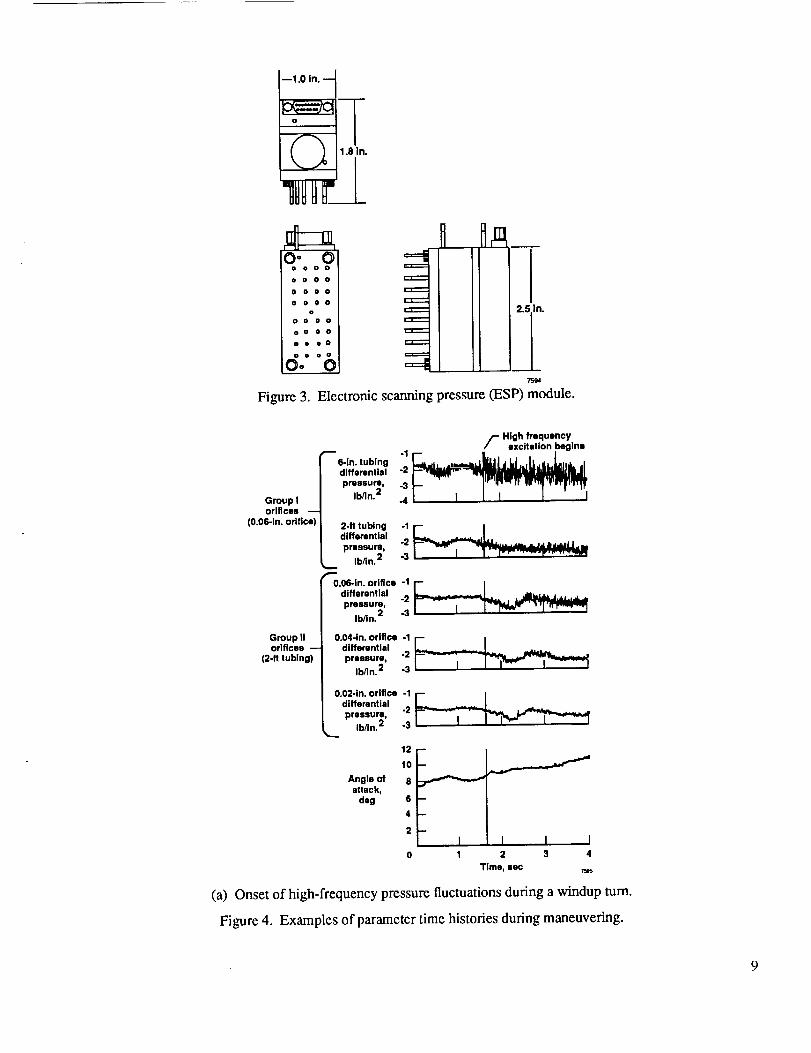
TheESPmodule(fig. 3) consistsof 32silicon-diaphragm,piezoresistive-pressuretransducers.DatafromtheESPmodulewererecordedatarateof 250samples/seeperportfortheinitial flights.Theratewaslaterincreasedto500samples/see.Thediameterof eachESPdifferentialdiaphragmis0.040in.andisattachedtoa0.59-in.metaltubealsoof 0.040-in.diameter.Themodulemultiplexestheindividualportmeasurements,theoutputis sentto a10-bitpulsecodemodulation(PCM)system,andrecordedononboardtape.TheESPmoduledoesnotprovideforsignalconditioningpriorto multiplexing.TheESPmoduletransducerswererangedfrom -5 to +5 psi. A heater
blanket was installed to maintain a constant temperature on the ESP module.
The reference side of the ESP module was connected to an ambient pressure reservoir that was vented to the
interior wing cavity. The reservoir allowed the reference pressure (backside of the ESP differential transducer) to
adjust to changes in altitude without high-frequency pressure oscillations. One port of the ESP module was connected
to this reservoir. Since this port was not exposed to the external flow, it was used to determine the inherent noise
level in the measurement system and was referred to as the system "health" channel.
The data presented in this paper were obtained from two groups of orifices on the upper surface of the wing
along the 10-percent chord line. These orifice groups are separated by about 12 in. and can be seen in figure l(b).
The first group consisted of two 0.06-in. ID orifices 0.5 in. apart. One of these orifices was connected to the ESP
module with 6 in. of tubing throughout the flight tests. The other orifice was connected with tubing lengths of either
2 or 4 ft. These are designated group I orifices.
The second group consisted of three orifices with IDs of 0.02, 0.04, and 0.06 in. These were located along a 2-in.
segment of the 10-percent chord line. Tubing lengths of either 2 or 4 ft were used with these three orifices. These
orifices are referred to as group II orifices.
Freestream air data parameters were measured with conventional nose-boom sensors. These data were acquired
through an independent onboard system which telemetered the PCM encoded channels to a ground station.
FLIGHT MANEUVERS
Specific flight maneuvers were conducted to generate high-frequency pressure fluctuations over the experimental
orifices. These maneuvers consisted of constant altitude, constant Mach number windup g turns. The maximum
g level (about 2.5 g) was held for approximately 10 sec.
The experimental system collected data for over 14 flights; the majority of the flight time was devoted to unre-
lated experiments. During postflight analysis of certain engine performance test manuevers, high-frequency, high-
amplitude fluctuations were noted in the pressure time histories. As a result, these maneuvers, consisting of high-
power setting constant altitude turns, were also used to evaluate the unsteady pressure measurement system.
DATA ANALYSIS
Time history pressure data from the onboard tape were replayed onto strip chart recorders. These strip charts
were analyzed visually to identify time frames (approximately 30 to 60 sec in duration) that included substantial
high-frequency excitation. Flight conditions during these time frames were determined from the air data instrumen-
tation system.
3
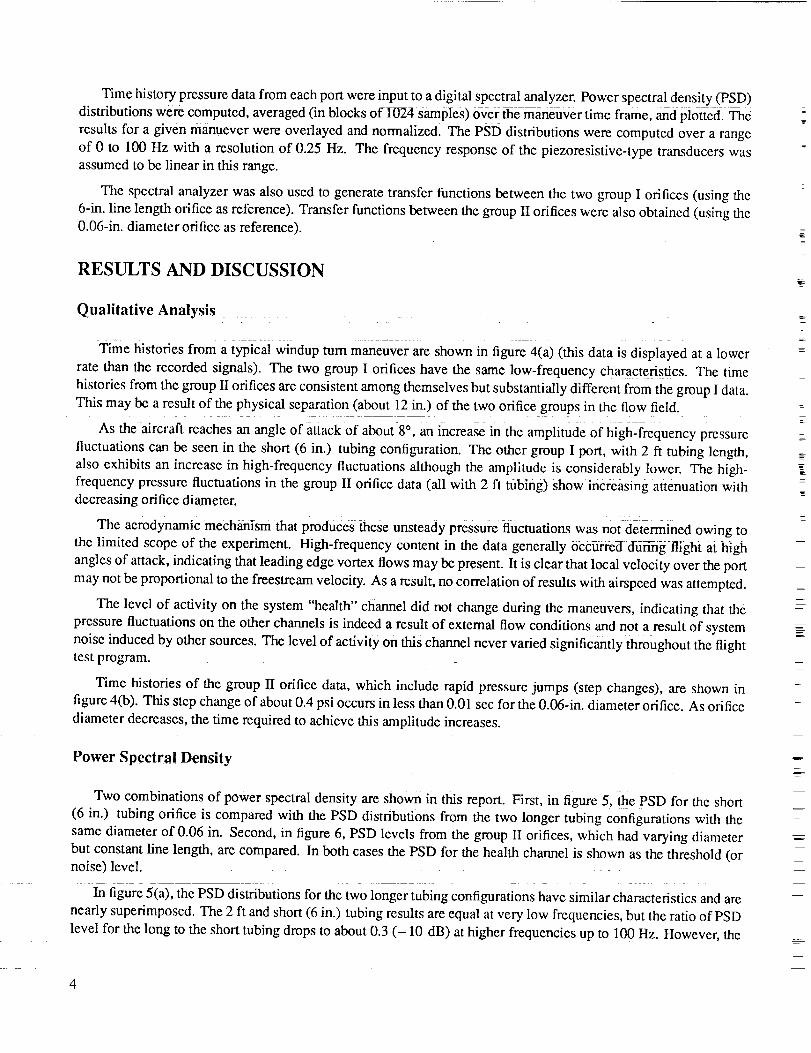
Timehistorypressuredatafromeachportwereinputtoadigitalspectralanalyzer.Powerspectraldensity(PSD)distributionswerecomputed,averaged(inblocksofi024 Samples)overthemaneuvertimeframe,andplotted.Theresultsfor agivenmanueverwereoverlayedandnormalize&ThePsDdistributionswerecomputedoverarangeof 0 to 100Hzwith aresolutionof 0.25Hz. Thefrequencyresponseof thepiezoresistive-typetransducerswasassumedtobelinearin thisrange.
ThespectralanalyzerwasalsousedtogeneratetransferfunctionsbetweenthetwogroupI orifices(usingthe6-in.line lengthorificeasreference).TransferfunctionsbetweenthegroupII orificeswerealsoobtained(usingthe0.06-in.diameterorificeasreference).
RESULTS AND DISCUSSION
Qualitative Analysis
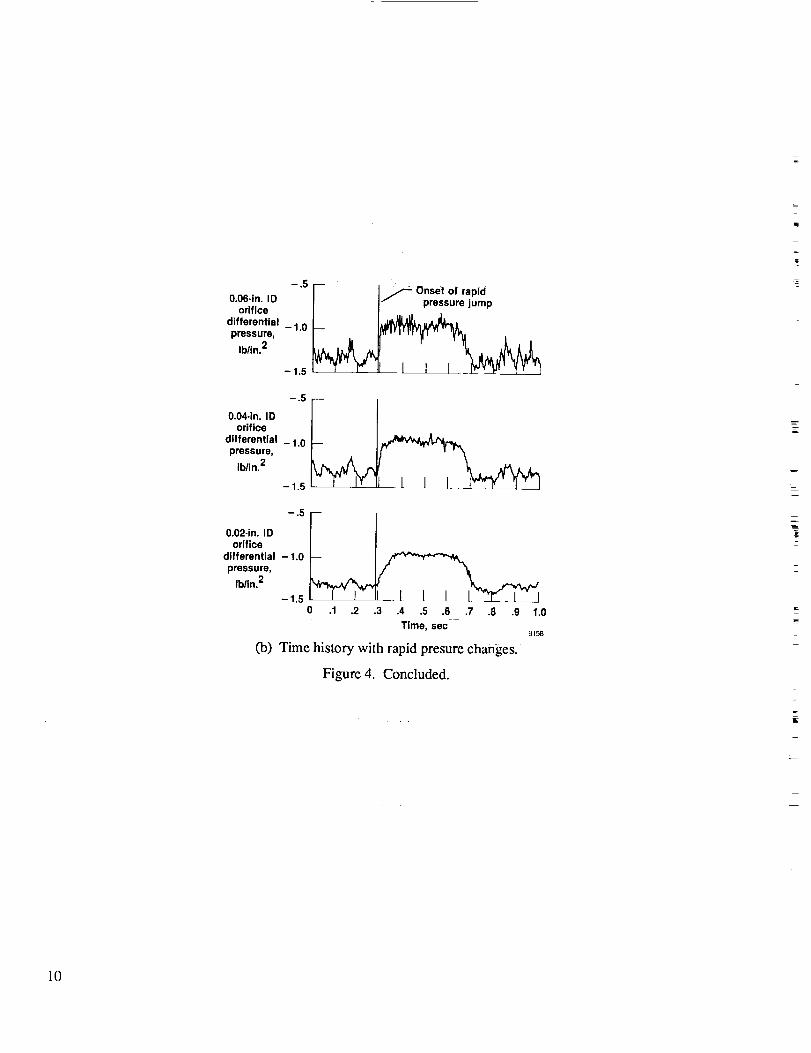
Time histories from a typical windup turn maneuver are shown in figure 4(a) (this data is displayed at a lower
rate than the recorded signals). The two group I orifices have the same low-frequency characteristics. The time
histories from the group II orifices are consistent among themselves but substantially different from the group I data.
This may be a result of the physical separation (about 12 in.) of the two orifice groups in the flow field.
As the =aircraft reaches Jan angle of attack of about 8° , an increase in the amplitude of high-frequency pressure
fluctuations can be seen in the short (6 in.) tubing configuration. The other group I port, with 2 ft tubing length,
also exhibits an increase in high-frequency fluctuations although the amplitude is considerably lower. The high-
frequency pressure fluctuations in the group II orifice data (all with 2 ft tubing) Show increasing attenuation withdecreasing orifice diameter.
The aerodynamic mechanism that produces these unsteady pressure _flUctuations was not determined owing to
the limited scope of the experiment. High-frequency content in the data generally OCCurred dufiflg-flight at high
angles of attack, indicating that leading edge vortex flows may be present. It is clear that local velocity over the port
may not be proportional to the freestream velocity. As a result, no correlation of results with airspeed was attempted.
The level of activity on the system "health" channel did not change during the maneuvers, indicating that the
pressure fluctuations on the other channels is indeed a result of extemal flow conditions and not a result of system
noise induced by other sources. The level of activity on this channel never varied significantly throughout the flighttest program.
Time histories of the group II orifice data, which include rapid pressure jumps (step changes), are shown in
figure 4(b). This step change of about 0.4 psi occurs in less than 0.01 sec for the 0.06-in. diameter orifice. As orifice
diameter decreases, the time required to achieve this amplitude increases.
Power Spectral Density
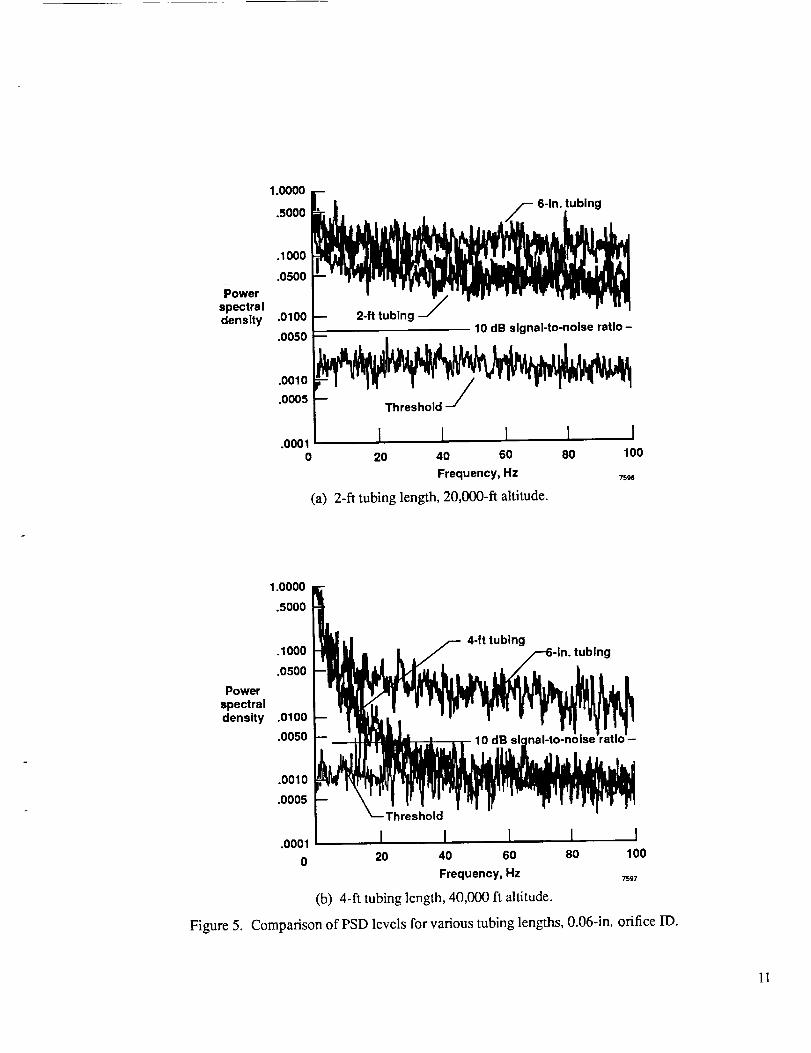
Two combinations of power spectral density are shown in this report. First, in figure 5, the PSD for the short
(6 in.) tubing orifice is compa_red with the PSD distributions from the two longer tubing configurations with the
same diameter of 0.06 in. Second, in figure 6, PSD levels from the group II orifices, which had varying diameter
but constant line length, are compared. In both cases the PSD for the health channel is shown as the threshold (ornoise) level.
In figure 5(a), the PSD distributions for the two longer tubing configurations have similar characteristics and are
nearly superimposed. The 2 ft and short (6 in.) tubing results are equal at very low frequencies, but the ratio of PSD
level for the long to the short tubing drops to about 0.3 (- 10 dB) at higher frequencies up to 100 Hz. However, the
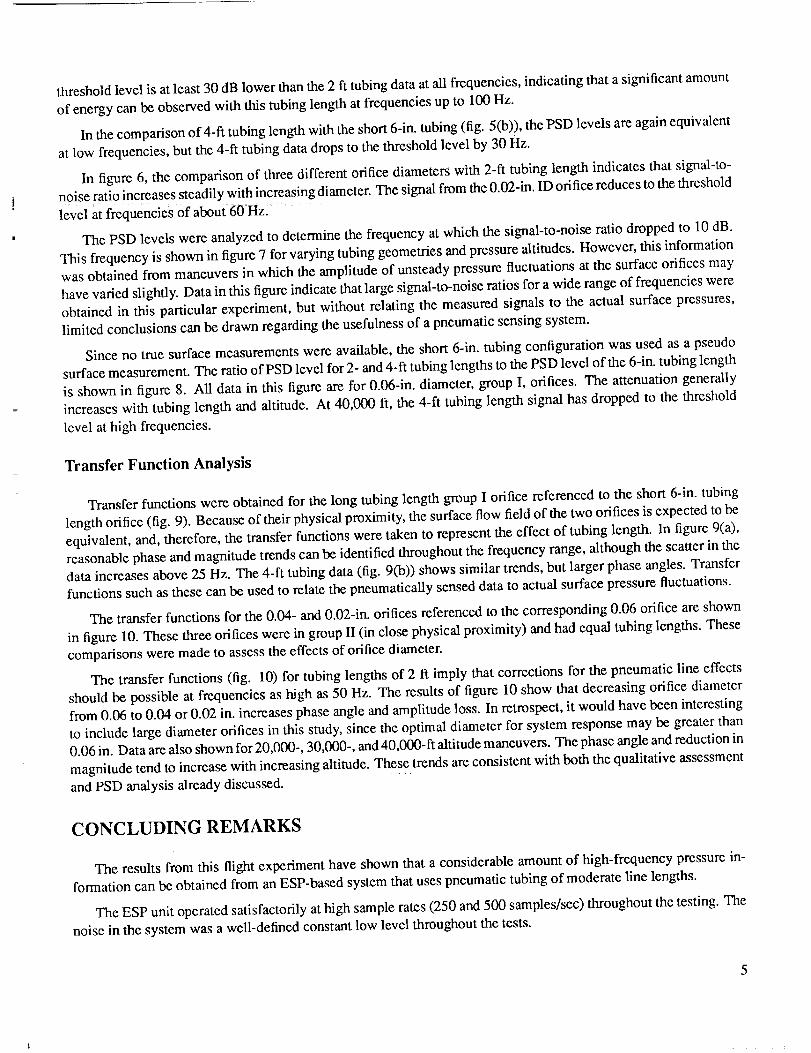
thresholdlevelisatleast30dBlowerthanthe2ft tubingdataatallfrequencies,indicatingthatasignificantamountof energycanbeobservedwiththistubinglengthatfrequenciesupto 100Hz.
In thecomparisonof 4-fttubinglengthwiththeshort6-in.tubing(fig.5(b)),thePSDlevelsareagainequivalentatlowfrequencies,butthe4-ft tubingdatadropsto thethresholdlevelby30Hz.
In figure6, thecomparisonof threedifferentorificediameterswith2-ft tubinglengthindicatesthatsignal-to-noiseratioincreasessteadilywithincreasingdiameter.Thesignalfromthe0.02-in.ID orificereducestothethresholdlevelatfrequenciesof about=60:Hz__
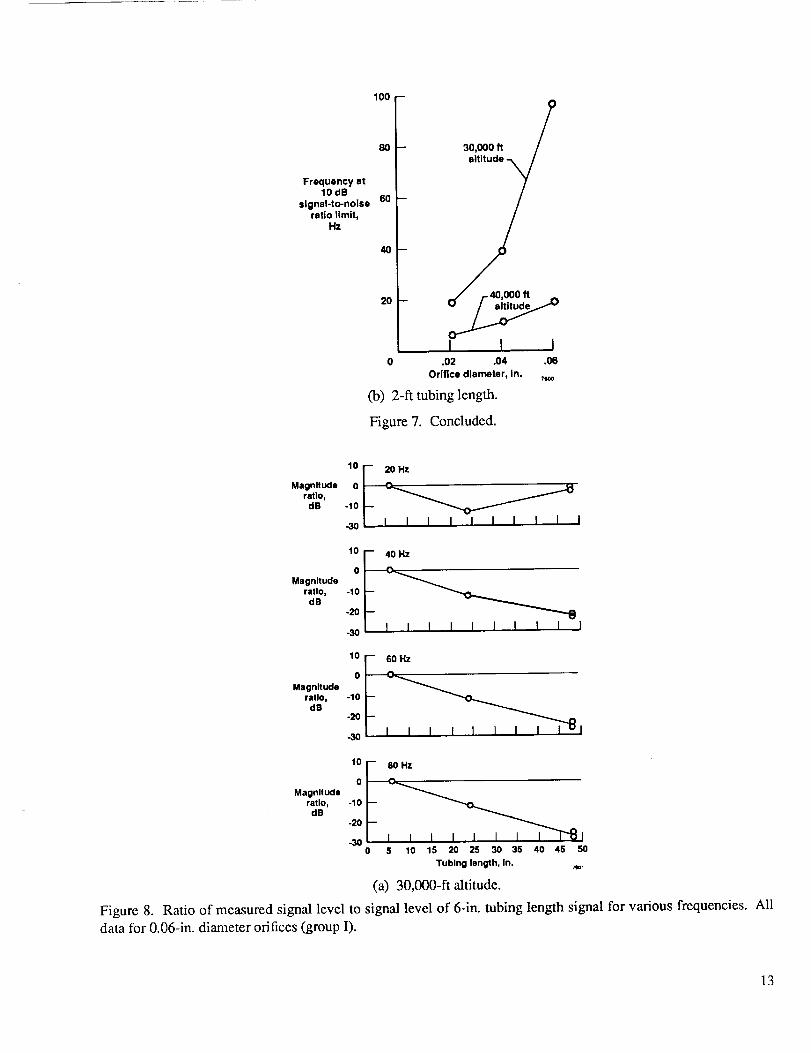
ThePSDlevelswereanalyzedto determinethefrequencyatwhichthesignal-to-noiseratiodroppedto 10dB.Thisfrequencyisshownin figure7forvaryingtubinggeometriesandpressurealtitudes.However,thisinformationwasobtainedfrommaneuversin whichtheamplitudeof unsteadypressurefluctuationsatthesurfaceorificesmayhavevariedslightly.Datain thisfigureindicatethatlargesignal-to-noiseratiosforawiderangeof frequencieswereobtainedin thisparticularexperiment,butwithoutrelatingthemeasuredsignalsto theactualsurfacepressures,limitedconclusionscanbedrawnregardingtheusefulnessof apneumaticsensingsystem.
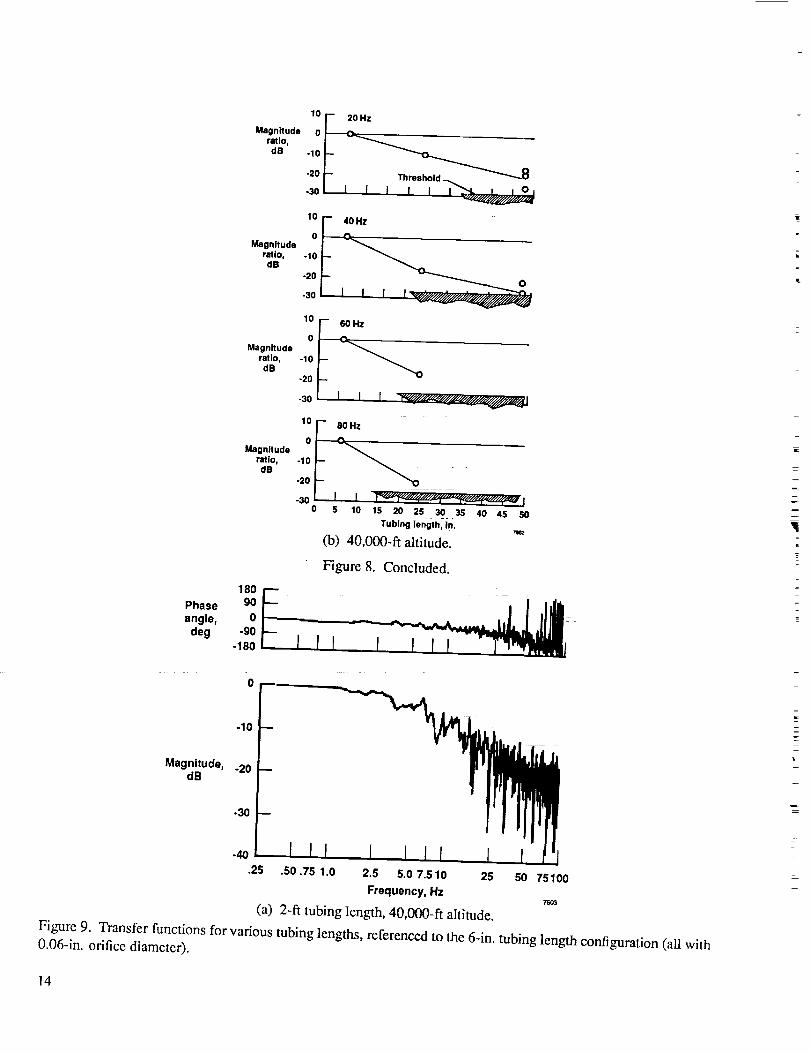
Sinceno truesurfacemeasurementswereavailable,theshort6-in.tubingconfigurationwasusedasapseudosurfacemeasurement.TheratioofPSDlevelfor2-and4-ft tubinglengthstothePSDlevelof the6-in.tubinglengthisshownin figure8. All datain this figurearefor 0.06-in.diameter,groupI, orifices.Theattenuationgenerallyincreaseswithtubinglengthandaltitude.At40,000ft, the4-ft tubinglengthsignalhasdroppedto thethresholdlevelathighfrequencies.
Transfer Function Analysis
Transfer functions were obtained for the long tubing length group I orifice referenced to the short 6-in. tubing
length orifice (fig. 9). Because of their physical proximity, the surface flow field of the two orifices is expected to be
equivalent, and, therefore, the transfer functions were taken to represent the effect of tubing length. In figure 9(a),
reasonable phase and magnitude trends can be identified throughout the frequency range, although the scatter in the
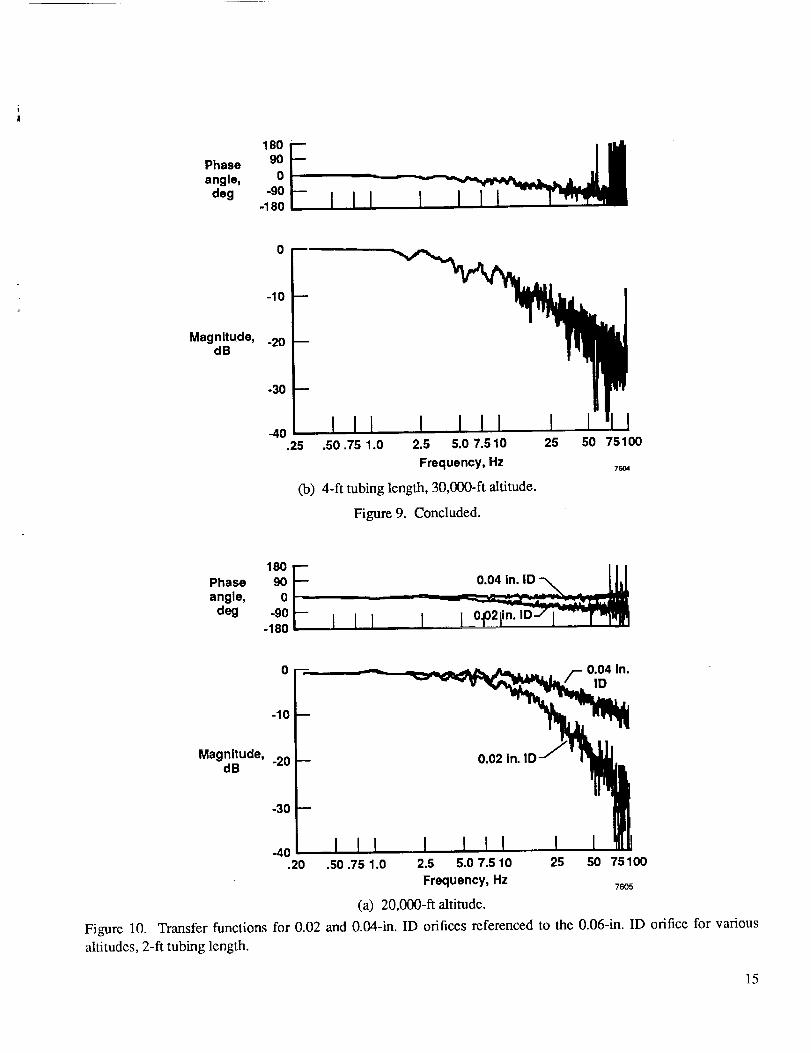
data increases above 25 Hz. The 4-ft tubing data (fig. 9(b)) shows similar trends, but larger phase angles. Transfer
functions such as these can be used to relate the pneumatically sensed data to actual surface pressure fluctuations.
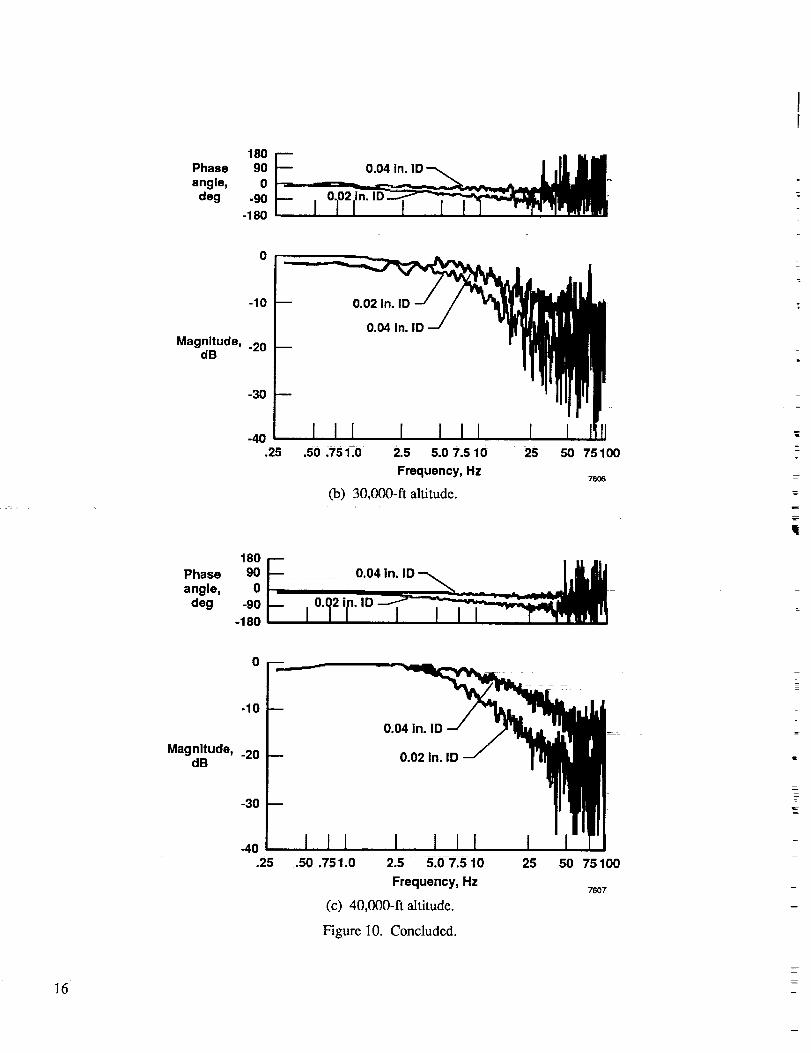
The transfer functions for the 0.04- and 0.02-in. orifices referenced to the corresponding 0.06 orifice are shown
in figure 10. These three orifices were in group II (in close physical proximity) and had equal tubing lengths. These
comparisons were made to assess the effects of orifice diameter.
The transfer functions (fig. 10) for tubing lengths of 2 ft imply that corrections for the pneumatic line effects
should be possible at frequencies as high as 50 Hz. The results of figure 10 show that decreasing orifice diameter
from 0.06 to 0.04 or 0.02 in. increases phase angle and amplitude loss. In retrospect, it would have been interesting
to include large diameter orifices in this study, since the optimal diameter for system response may be greater than
0.06 in. Data are also shown for 20,000-, 30,000-, and 40,000-ft altitude maneuvers. The phase angle and reduction in
magnitude tend to increase with increasing altitude. These trends are consistent with both the qualitative assessment
and PSD analysis already discussed.
CONCLUDING REMARKS
The results from this flight experiment have shown that a considerable amount of high-frequency pressure in-
formation can be obtained from an ESP-based system that uses pneumatic tubing of moderate line lengths.
The ESP unit operated satisfactorily at high sample rates (250 and 500 samples/sec) throughout the testing. The
noise in the system was a well-defined constant low level throughout the tests.
Transferfunctionswereobtainedbetweenpressuresignalsfromvariouspneumatictubinggeometries.Theattenuationandphaseshiftswereshowntoincreasewithincreasingtubinglength,decreasingorificediameter,andincreasingaltitude.Resultswereobtainedwhichcanbeusedto predictthehigh-frequencyperformanceof futuresystemsfortubinglengthsupto4 ft anddiametersin therangeof0.02to 0.06in.
Measurablesignallevelsatfrequenciesupto 100Hzweredemonstratedfor 2-ft tubinglengthsatall altitudestestedandfor 4-ft tubinglengthsataltitudesupto 30,000ft. Sincetheperformanceof thesystemimprovedwithincreasingdiameterthroughouttherangetested,it ispossiblethatusinglargerdiameterorifices(greaterthan0.06in.)mightallowtheuseof tubinglengthslongerthan4 ft.
Transferfunctionsof magnitudeandphaseangleweregeneratedfor allmaneuversanalyzed.Thequalityofthedataindicatesthatcorrectionsfor thepneumaticallysensedpressurescouldbemadeatfrequenciesatleastashighas25Hz.
REFERENCES
Berg, H., and H. Tijdeman, Theoretical and Experimental Results for the Dynamic Response of Pressure Measuring
Systems, NLR report E238, Nat. Luchtvaartlab (Amsterdam), Jan. 1965.
Chapin, William G., Dynamic-Pressure Measurements Using an Electronically Scanned Pressure Module, NASA
TM-84650, 1983.
Gregory, Tom, "Oblique Wing Ready for Research Aircraft," Aerospace America, vol. 23, no. 6, June 1985, p. 78.
Hess, Robert W., David A. Seidel, William B. Igoe, and Pierce L. Lawing, Highlights of Unsteady Pressure Tests ona 14 Percent Supercriticat Airfoil at High Reynolds Number, Transonic Condition, NASA TM-89080, 1987.
Lamb, J.P., Jr., The Influence of Geometry Parameters Upon Lag Error in Airborne Pressure Measuring Systems,
WADC TR 57-351, Wright-Patterson AFB, Ohio, July 1957.
Seidel, David A., Maynard C. Sandford, and Clinton V. Eckstrom, "Measured Unsteady Transonic Aerodynamic
Characteristics of an Elastic Supercritical Wing," AIAA Journal of Aircraft, vol. 24, no. 4, Apr., 1987,
pp. 225-230.
Tijdem an, H., Investigations of the Transonic Flow A round Oscillating Airfoils, NLR-TR-77090-U, National Aerospace
Lab, Amsterdam, Netherlands, 1977. (Available from DTIC as AD B027 633.)
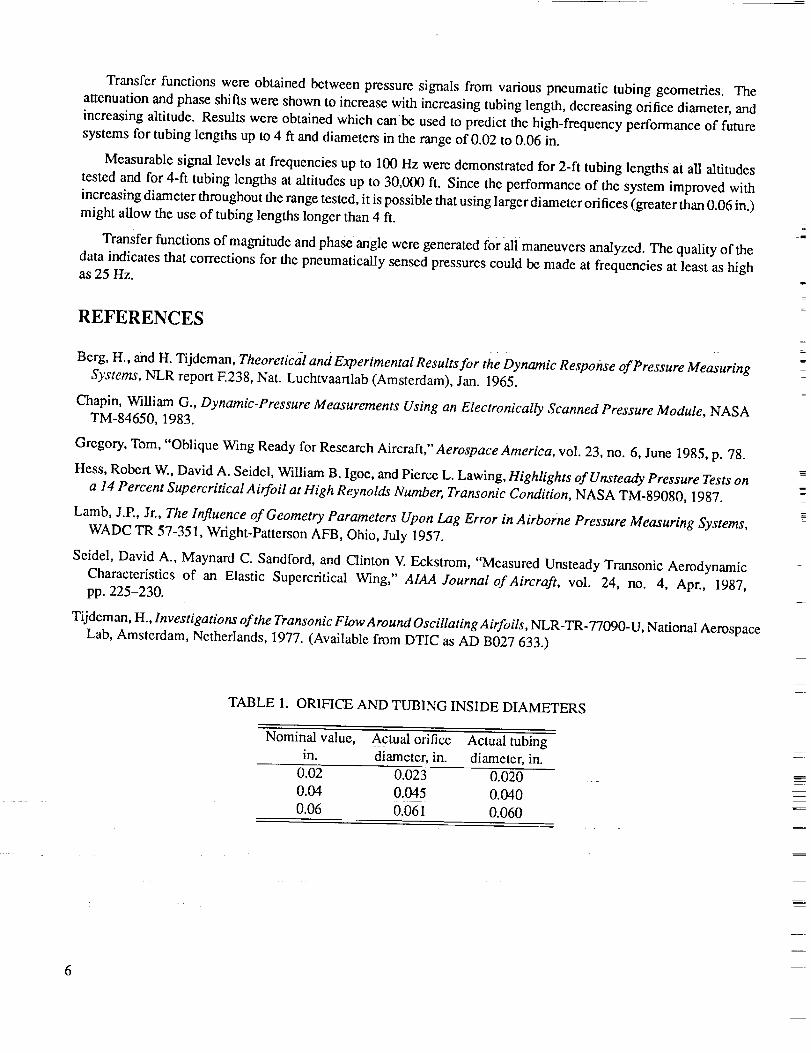
TABLE 1. ORIFICE AND TUBING INSIDE DIAMETERS
Nominal value, Actual orifice Actual tubingin. diameter, in. diameter, in.
0.02 0.023 0.020
0.04 0.045 0,0400.06 0.0-61 0.060
E
i
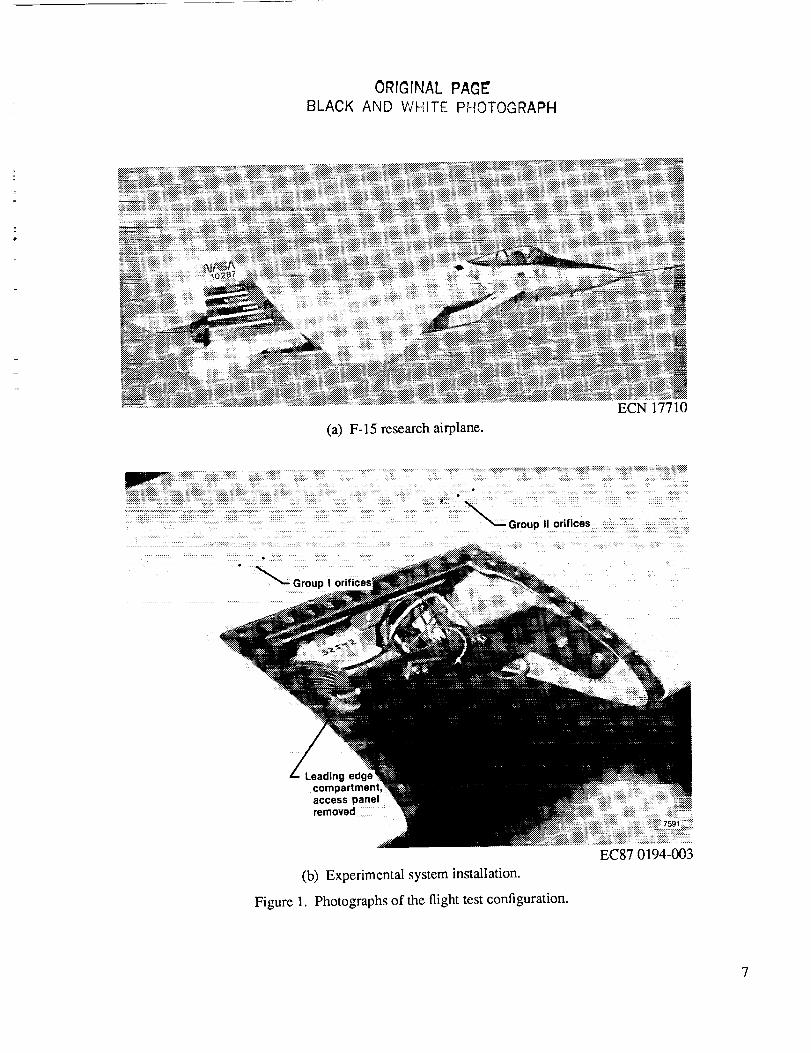
ORIGINAL PAGE'
BLACK AND WIqlTE PHOTOGRAPH
(a) F-15 research airplane.
ECN 17710
Z Leading edge
compartment,
access panel
removed .......
(b) Experimental system installation.
Figure 1. Photographs of the flight test configuration.
EC87 0194-003
7
k .
DifferentialtransducerCOM
ESPmodule
Group I orifices
i_ 0.06 in. ID, 6 in. tubing length
0.06 in. ID, variable tubing length
Group/I Orifices"_"'_! I I_O 0.06 ,n:lD, varlab/etubing iengih
i I _ 0.04 in. ID, variable tubing length• ' ,O 0.02 In. ID, variable tubing lengthli
__ System "health" channel
Ambient
pressurereservoir
"-- Vent to wing cavity
(a) Pneumatic tubing configuration.
7592
m
Figure 2.
'- ESP driver
0u_put line
_On-board _-J _ : ::
75_
(b) Data system schematic.
Schematic of experimental pressure measurement system.
-1.0 in.._!
_. 1.8 in.
,.._ld I---_-I_L,
• o o o
o o 0 o
0 • o o
o e 0 o
o 000 o
o • o o
o o o o
do"&
r-l-"--
l--r"---
r--,P---
r-"r----
r-r----
l,--r----
HI
I_,m,
r
75N
Figure 3. Electronic scanning pressure 0ESP) module.
Group Iorifices --
(0.06-In. odflce)
Group IIorifices --
(2-ft tubing)
High frequency__ _ excitation begins
differential" _I_pressure, '.3
Ibhn'2 -4 ]
2-11tubingdifferential
pressure,
Ib/in. 2
0.06.in. orificedifferential
pressure,
Ib/In. 2
0.04-in. orificedifferential
pressure,Ib/in. 2
'-2
-2.3 r'_
-2
.3 ['_
O.02-1n. orificedifferential
pressure,Ib/in. 2
-2
Angle ofattack,
deg
12
10
I I1 2
Time, sec
4
2
I Io 3 4
(a) Onset of high-frequency pressure fluctuations during a windup turn.
Figure 4. Examples of parameter time histories during maneuvering.
-.5
0.06-in. IDorifice
differential _ 1.0pressure,
Iblin. 2
- 1.5
-.5
0.04-in. IDorifice
differential _ 1.0pressure,
Iblin.2
- 1.5
0.02-in. ID -.5 rJ
orificedifferential - 1.0pressure,
Iblin.2
-1.50 .1 .2 .3 .4 .5 .6 .7 .8 .9 1.0
Time, sec9158
(b) Time history with rapid presure changes.
Figure 4. Concluded.
i
S
10
Powerspectraldensity
1.0000
.5000 [ _ _ 6-in. tubing
•1000
.0500
.0100 2-ft tubing10 dB signal-to-noise ratio-
.0050
.0010
.0005
.oom I I I I I0 20 40 60 80 100
Frequency, Hz rs_
(a) 2-ft tubing length, 20,000-ft altitude.
1.0000
.5000
.1000 tl /-- 4-ft tubing
.0500
Powerspectraldensity .0100
.0050
.0010
.0005
.0001 I I 1 I I0 20 40 60 80 100
Frequency, Hz 7s_
(b) 4-ft tubing length, 40,000 ft altitude.
Figure 5. Comparison of PSD levels for various tubing lengths, 0.06-in. orifice ID.
1I
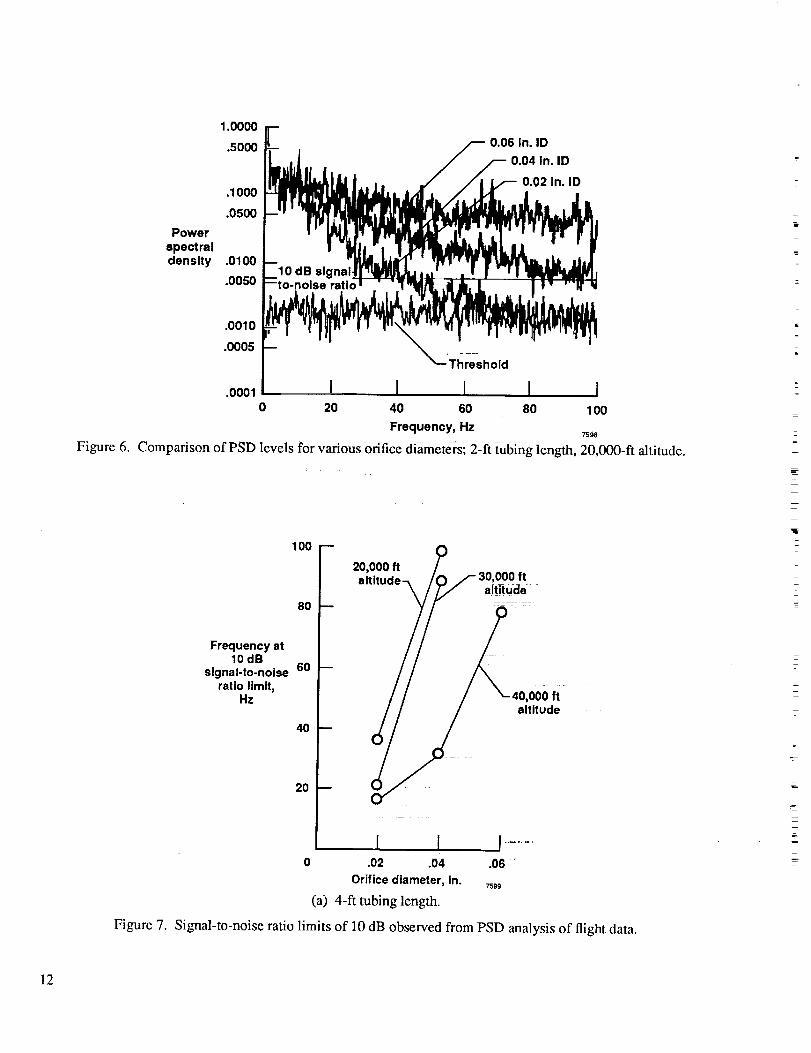
Figure6.
I10O_ F
L _ 0.06 in. ID
_°°°Ii..d //- o.o4,n.,o.10_
.0500
Powerspectra!density .0100
.0050
.0010
.0005
J _Threshold.OOOl[ J J "hi;_ '= I l
0 20 40 60 80 100
Frequency, Hz7598
Comparison of PSD levels for various orifice diameters; 2-ft tubing length, 20,000-ft altitude.
100
=o;oog£_ ,,i!u_e
80_- __/zo,oo0!t
40,000 ftaltitude
40
20 --
I 1 i .....0 .02 .04 .06 "
Orifice diameter, in. 75_
(a) 4-ft tubing length.
Frequency at10 dB
signal-to-noise 60ratio limit,
Hz
Figure 7. Signal-to-noise ratio limits of 10 dB observed from PSD analysis of flight data.
12
100 --
8O
Frequency at10 dB
signal-to-noise 60
ratio limit,Hz
40
2O
I I0 .02 .04
Orifice diameter, In.
(b) 2-ft tubing length.
Figure 7. Concluded.
30,000 ft /
I.06
Magnituderatlo,
dB
lO
o
_...-_
i i i i I I I l I [-lO
-30
Magnituderatio,dB
lO
o
-10
-2o
-30
Magnituderallo,
dB
lO
0
-I0
-20
-3o
Magnitude 1:
r.,o,.3o ! [ f I
0 5 10 lS 20 25 30 35 40 45 50
Tubing length, In.
(a) 30,O00-ft altitude.
Figure 8. Ratio of measured signal level to signal level of 6-in. tubing length signal for various frequencies. All
data for 0.06-in. diameter orifices (group I).
13
Magnituderatio,dB
Magnituderatio,dB
Magnituderatio,dB
Magnituderatio,
dB
-'°f-20
-30 I I I Th
o
-10
-20
-30
10
-10
-20
i I I I _T_-'-'/.,_'__I30
o
-lO
.0 __ .
-30 | 1 I I
0 5 10 15 20 25 30 35 40 45 50
Tubing length, in.
(b) 40,O00-ft altitude.
Figure 8. Concluded.
,8o Phase goangle, 0
deg -90-180
Magnitude, -20dB
-40
.25 .50.75 1.0 2.5 5.0 7.510 25 50 75100
Frequency, Hz76O3
(a) 2-ft tubing length, 40,000-fi altitude.
Figure 9. Transfer functions for various tubing lengths, referenced to the 6-in. tubing length configuration (all with0.06-in. orifice diameter).
Ik
=
14
Phase
angle,deg
18090
0-90
-180
MagnRude,dB
-10
-20
-30
-40.25 .50.75 1.0 2.5 5.0 7.510 25 50 75100
Frequency, Hz76_4
(b) 4-ft tubing length, 30,000-ft altitude.
Figure 9. Concluded.
18oFPhase 90
angle, 0
deg -90 _--180
0.04 in. ID J
0
Magnitude, -20dB
0.04 In.ID
0.02 in.
.50.75 1.0 2.5 5.0 7.5 10 25 50 75100
Frequency, Hz7605
(a) 20,000-ft altitude.
Figure 10. Transfer functions for 0.02 and 0.04-in. ID orifices referenced to the O.06-in. ID orifice for various
altitudes, 2-ft tubing length.
15
,so Phase 90 . .
angle, 0deg -90
-180
0
Magnitude, -20dB
0.02 in. ID
0.04 in. ID
I I II2.5 5.0 7.5 10
Frequency, Hz
(b) 30,000-ft altitude.
25 50 75100
76O6
18o Phase 90 , .
angle, 0deg -90
-180
0
-10
0.04 in. ID
Magnitude, -20 0.02 in. IDdB
-30
-40,25 .50 .751.0 2.5 5.0 7.5 10
Frequency, Hz
(c) 40,000-ft altitude.
Figure 10. Concluded.
25 50 75100
7_o07
=
,=
16


Ili
Nat,or'__'_r'autCs a_l
I. Report No.
NASA TM-4131
4. Title and Subtitle
Report Documentation Page
2. Government Accession No. 3. Recipient's Catalog No.
5. Report Date
Flight Evaluation of a Pneumatic System for Unsteady
Pressure Measurements Using Conventional Sensors
7. Author(s)
Robert E. Curry and Glenn B. Gilyard
9. Performing Organization Name end Address
NASA Ames Research Center
Dryden Flight Research Facility
P.O. Box 273, Edwards, CA 93523-5000
12." Sponsoring Agency Name and Address
National Aeronautics and Space Administration
Washington, DC 20546
August 1989
6. Performing Organization Code
8. Performing Organization Report No.
H-1508
10. Work Unit No.
RTOP 533-02-91
11. Contract or Grant No.
13. Type of Report and Period Covered
Technical Memorandum
14. Sponsoring Agency Code
15. Supplementaw Notes
16. Abstract
A flight experiment was conducted to evaluate a pressure measurement system which uses pneumatic tubing
and remotely located electronically scanned pressure transducer modules for in-flight unsteady aerodynamic
studies. A parametric study of tubing length and diameter on the attenuation and lag of the measured signals
was conducted. The hardware was found to operate satisfactorily at rates of up to 500 samples/see per port in
flight. The signal attenuation and lag due to tubing were shown to increase with tubing length, decrease with
tubing diameter, and increase with altitude over the ranges tested. Measurable signal levels were obtained
for even the longest tubing length tested, 4 ft, at frequencies up to 100 Hz. This instrumentation system
approach provides a practical means of conducting detailed unsteady pressure surveys in flight.
17. Key Words (Suggested by Author(s))
Flight testPneumatic attenuation
Pneumatic lag
Unsteady pressure
19. Security Classif. (of this report)
Unclassified
20. Security Classif. (of this page)
Unclassified
18. Distribution Statement
Unclassified -- Unlimited
Subject category 05
21. No. of pages
28 22. PriceA03
NASA FORM 1626 OCT 86
For sale by the National Technical Information Service, Springfield, VA 22161-2171.
NASA-Langley, 1989