Embed Size (px)
Citation preview

Ubiquitin Ser65 phosphorylation affects ubiquitin structure, chain assembly and
hydrolysis
Supplementary Material
Tobias Wauer#, Kirby N. Swatek#, Jane L. Wagstaff#, Christina Gladkova,
Jonathan N. Pruneda, Martin A. Michel, Malte Gersch, Christopher M. Johnson,
Stefan M.V. Freund and David Komander*
Medical Research Council Laboratory of Molecular Biology, Francis Crick
Avenue, Cambridge, CB2 0QH, UK.
* Corresponding author: David Komander, [email protected] # These authors contributed equally to this work
Running title: Ser65-phosphorylated ubiquitin

other
M199%
other0%
K3387%
K482%
K6311%K6
1%
K1189%
K27,K290%
K331%
K485%
K634%
M10%
K61% K11
1% K271%
K290%
K334%
K4890%
K633%
M10%
K698%
K11,K27,K290%
K331%
K481% K63,M1
0%
Supplementary Figure 1
other0%
K333%
K6397%
K6 Ub4 K11 Ub4 K33 Ub4
K48 Ub4 K63 Ub4 M1 Ub4
A
UbphosphoUb
GST-TcPINK1
GST-TcPINK1
0 15 30 60 180wt Ub
GST-TcPINK1 KI
0 15 30 60 180wt Ub
GST-PhPINK1
0 5 30 60 180 min
K63 Ub3
K63 Ub3
GST-PhPINK1
15
K63 Ub3 MonoPK63 Ub3 DiP
K63 Ub3 TriP
B
GST-PhPINK1
0 15 30 60 180 min
K63 Ub6
K63 Ub6
GST-PhPINK1
GST-PhPINK1K11 Ub4
K11 Ub4
GST-PhPINK1
0 180 min
C D
minMM
MM
M
F
E
K61%
other0%
K331%
K6398%
K63 Ub6
G
62-
38-
17-
kDa
188-
0 5 10 30 60 0 5 10 30 60
anti-Ub (FK2)
E1, ATPE2: UBE2D3E3: GST-cIAP 363-614
Phos-tag Coomassie Phos-tag Coomassie
Phos-tag Coomassie Phos-tag Coomassie
wtUb pUb
t [min]

Supplementary Figure 1. Phosphorylation of Ub and polyUb. A) Phos-tag gel as in Figure 1B, but in this case active (left) and kinase inactive
D359A (right) forms of GST-tagged TcPINK1 were used in a time course. B) Phosphorylation of Lys63-linked triUb with GST-tagged PhPINK1, followed by
Phos-tag gel in a time course. Distinct mono-phosphorylated (monoP) and di-
phosphorylated (diP) forms are labeled while presumably tri-phosphorylated (triP)
chains appear as a smear. C) Phosphorylation time course of Lys63-linked
hexaUb (K63 Ub6) with GST-tagged PhPINK1 on Phos-tag gel. D) Reaction from
C analyzed by AQUA mass spectrometry as in Figure 1D. E) Phosphorylation of
Lys11-linked tetraUb (K11 Ub4) on Phos-tag gel. F) AQUA mass spectrometry
analysis on reactions from Figure 1E. F) Anti-Ub (FK2) antibody recognizes
phosphoUb chains in a chain assembly reaction with cIAP as performed in
Supplementary Figure 11D. See Figure 6 below for more details.
Supplementary Figure 2
phosphoUb major species
10 9 8 7130
125
120
115
110
105
T7m
K6m
S20m
V70m
Q49m
Q2m
I3m
F4m
V5m L8m
T9
G10
K11m
T12m
I13m
T14m
L15m
E16m
V17m
E18m
D21m
T22m
I23m
E24N25
V26m
K27m
A28m
K29mI30m
Q31m
D32m
K33m
E34
G35
I36
D39
Q40mQ41m
R42m
L43m
I44m
F45m
A46mG47m
K48m
L50m
E51m
D52
R54m
T55m
L56m
S57m
D58m
Y59mN60
I61
Q62m
K63m
E64m S65m
T66m
L67
H68m
L69mL71m
R72mL73m
R74m
G76
G75
G53m
1H Chemical Shift / ppm
15N
Che
mic
al S
hift
/ ppm
phosphoUb minor species
10 9 8 7130
125
120
115
110
105
T55n
L56n
K27n
I3n
V17n
R54n
Q40n
K63n
T66n
T22n
Y59n
Q31n
I13n
5Vn
Q41n
K11n
T14nT12n
E18n
I44n
F45n L71nL50n
L15n
R42n R74n F4n
I30n
E16n
E51nD21n
D58nV70n
L8n
Q62n
S65n
K29nE64n
K6n
T7n
T9
G10
S20n
E24N25
A28n
D32n
K33n
E34
G35
I36
D39
L43n
G47n
Q49n
D52
N60
I61
S65m
L67
R72n
G76m
L69n
L73n
I23n
V26n
S57n
A46n
H68nK48n
G75m
G53n
Q2n
1H Chemical Shift / ppm
15N
Che
mic
al S
hift
/ ppm
A
B

Supplementary Figure 2. Assignment of phosphoUb species. Complete chemical shift assignment based on 3D triple resonance experiments
with 13C, 15N-labeled phosphoUb. Chemical shift positions of the major (m) (A) and of the minor (n) (B) form of phosphoUb are labeled. Where the two forms
share the same chemical shift only the residue type and number is given.

Supplementary Figure 3
9.5 9.0 8.5 8.0 7.5 7.01H Chemical Shift / ppm
130
125
120
115
110
105
15N
Che
mic
al S
hift
/ ppm
Q2m
Q2n
I3m
I3n
F4m
F4n
V5m
V5n
K6m
K6n
T7m
T7n
L8m
L8n
T9m
G10m
K11m
K11nT12m
T12n
I13m
I13n
T14m
T14n
L15m
L15n
E16mE16n
V17m V17n
E18m
E18n
S20m
S20n
D21m
D21n
T22mT22n
I23m
I23n N25
V26m V26n
K27m
K27n
A28mA28n
K29m
K29n
I30m I30n
Q31m
Q31n
D32m
D32n
K33m
K33n
E34m
G35
D39m
Q40mQ40n
Q41m Q41n
R42mR42n
L43m
L43n
I44m
I44n
F45m
F45n
A46mA46n
G47m G47n
K48mK48n
Q49m
Q49n
L50mL50n
E51m
E51n
D52
G53mG53n
R54m
R54n
T55m
T55n
L56m
L56n
S57m
S57n
D58m
D58n
Y59mY59nN60
I61
Q62m
Q62n
K63mK63n
E64m
E64n
S65m
S65nT66m
T66n
L67
H68m
H68n
L69m
L69n
V70m
V70n
L71m
L71n
R72m
R72n
L73m
L73n
R74m
R74n
G75G76

Supplementary Figure 3. ZZ exchange spectroscopy. ZZ exchange experiment of phosphoUb with a mixing time of 92 ms illustrating
the occurrence of exchange (cross) peaks between the (auto) resonances for the
major and minor forms.
Supplementary Figure 4
0.1 0.2 0.3 0.4 0.50
2.0x10⁸
0.1 0.2 0.3 0.4 0.5
0.1 0.2 0.3 0.4 0.5 0.1 0.2 0.3 0.4 0.5
0.1 0.2 0.3 0.4 0.5 0.1 0.2 0.3 0.4 0.5
0.1 0.2 0.3 0.4 0.5 0.1 0.2 0.3 0.4 0.5
1.5x10⁸
1.0x10⁸
5.0x10⁷
0
2.0x10⁸
1.5x10⁸
1.0x10⁸
5x10⁷
0
2.0x10⁸
1.5x10⁸
1.0x10⁸
5x10⁷
0
2.0x10⁸
1.5x10⁸
1.0x10⁸
5x10⁷
0
3.0x10⁷
2.5x10⁷
2.0x10⁷
1.5x10⁷
1.0x10⁷
5x10⁶
0
3.0x10⁷
2.5x10⁷
2.0x10⁷
1.5x10⁷
1.0x10⁷
5x10⁶
0
3.0x10⁷
2.5x10⁷
2.0x10⁷
1.5x10⁷
1.0x10⁷
5x10⁶
0
3.0x10⁷
2.5x10⁷
2.0x10⁷
1.5x10⁷
1.0x10⁷
5x10⁶
Delay in seconds
Pea
k he
ight
Ile23 auto peaks Ile23 cross peaks
Phe45 auto peaks Phe45 cross peaks
Ser57 auto peaks Ser57 cross peaks
Delay in seconds
Leu73 auto peaks Leu73 cross peaks
Pea
k he
ight
P
eak
heig
ht
Pea
k he
ight
phosphoUb minor speciesphosphoUb major species

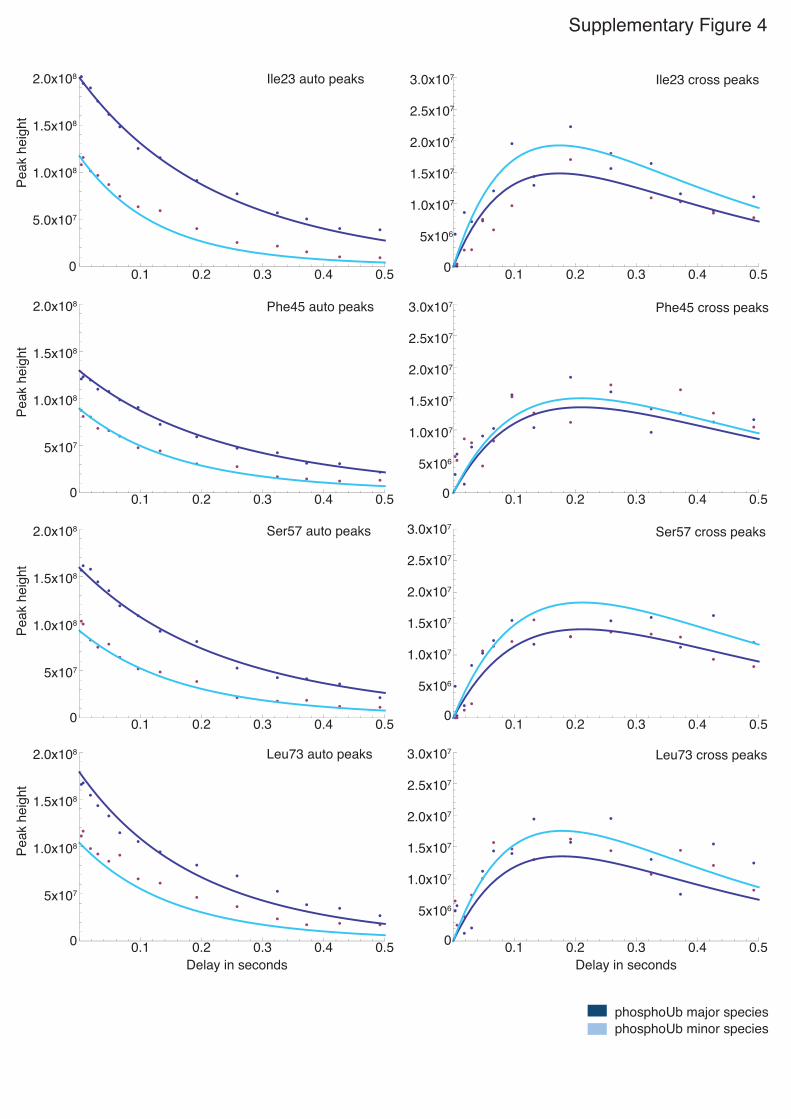
Supplementary Figure 4. ZZ exchange data. Peak intensities of (auto) signals of the major form (blue) and minor form
(lightblue) (left column) are fitted simultaneously to cross peaks as result of major
to minor exchange (blue) and minor to major exchange (lightblue) (right column)
for residues Ile23, Phe45, Ser57 and Leu73 using the methods described in
(Latham et al, 2009). This compensates for the loss of signal intensity due to
longitudinal T1 relaxation (apparent from the decaying auto peaks). The
exchange rate was calculated to be 1.76 ± 0.09 s-1.

Supplementary Figure 5
0
0.1
0.2
0.3
0.4
0.5
0.6
0.7
0.8
0.9
1
1 6 11 16 21 26 31 36 41 46 51 56 61 66 71 76
Pre
dict
ion
Con
fiden
ce
Residue Number
0
0.1
0.2
0.3
0.4
0.5
0.6
0.7
0.8
0.9
1
1 6 11 16 21 26 31 36 41 46 51 56 61 66 71 76
Pre
dict
ion
Con
fiden
ce
Residue Number
β-strand
α-helix
phosphoUb major species
phosphoUb minor species
A
B

Supplementary Figure 5. PhosphoUb secondary structure prediction. Backbone chemical shifts (HN, N, CA, CB and HA) were submitted to TALOS+
(Shen et al, 2009) for secondary structure prediction. Confidence in the
prediction of α-helix (blue) or β-sheet (red) is given for the major (A) and minor
(B) phosphoUb species. See Figure 2E for annotation.

10 9 8 7 6130
125
120
115
110
105
Supplementary Figure 6
1H Chemical Shift / ppm
15N
Che
mic
al S
hift
/ ppm
A
1 6 11 16 21 26 31 36 41 46 51 56 61 66 71 76
0
0.01
0.02
0.03
0.04
0.05
0.06
0.07
0.08
0.09
0
0.01
0.02
0.03
0.04
0.05
0.06
0.07
0.08
0.09
1 6 11 16 21 26 31 36 41 46 51 56 61 66 71 76
Wei
ghte
d C
SP
/ pp
m
Residue Number
B
Wei
ghte
d C
SP
/ pp
m
C
Residue Number
K63 diUb (72 resonances)phospho K63 diUb(128 resonances)
phosphoUb major vs phosphoUb Lys63 diUb major
phosphoUb minor vs phosphoUb Lys63 diUb minor

Supplementary Figure 6. Phosphorylation of Lys63 diUb. A) A comparison of the BEST-TROSY spectrum of wild-type Lys63 diUb (black,
72 peaks) with phosphorylated wild-type Lys63 diUb (blue, 128 peaks). B) Weighted chemical shift perturbations of the major species of phosphoUb
(Figure 2A) against the major species of phosphorylated wild-type Lys63 diUb.
C) Weighted chemical shift perturbations of the minor species of phosphoUb
(Figure 2A) against the minor species of phosphorylated wild-type Lys63 diUb.
Supplementary Figure 7
40 60 80 100 120
0
2
4
6
8
phosphoUb data phosphoUb fitted curve wt Ub data wt Ub fitted curve
Exc
ess
Hea
t Cap
acity
(kc
al/m
oleo
C)
Temperature (oC)
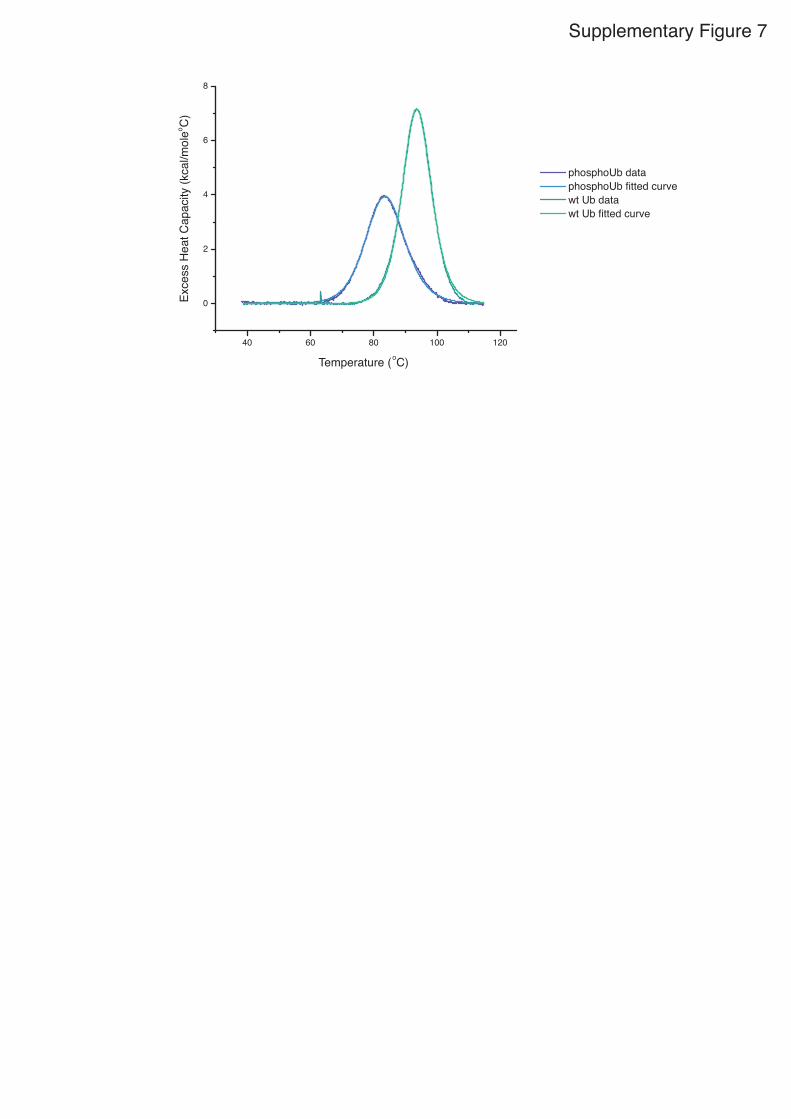
Supplementary Figure 7. Stability measurements of Ub and phosphoUb. DSC endotherms for Ub and phosphoUb (dark cyan / blue lines, respectively)
with fits to the data (light cyan / blue lines) for Ub; Tm 93.6 °C, ∆H calorimetric 88
kcal/mol and ∆H van’t Hoff 87 kcal/mol, and for phosphoUb Tm 83.7 °C, ∆H
calorimetric 65 kcal/mol and ∆H van’t Hoff 61 kcal/mol.
Supplementary Figure 815
N{1
H}
NO
E
Residue number
-0.4
-0.2
0
0.2
0.4
0.6
0.8
1
1 6 11 16 21 26 31 36 41 46 51 56 61 66 71
76
phosphoUb minor speciesphosphoUb major species

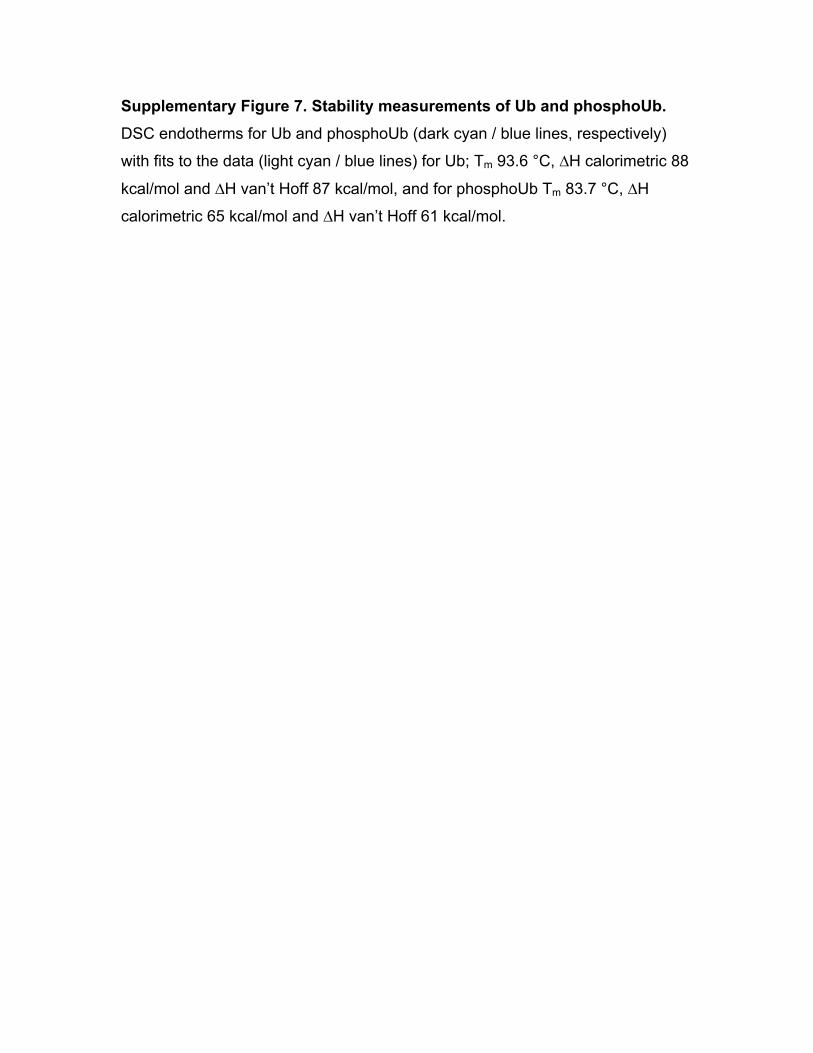
Supplementary Figure 8. HetNOE of phosphoUb. 15N{1H}hetNOE values for the major (dark blue) and minor (light blue) species of
phosphoUb. The value for the major form of pSer65 is omitted as it is artificially
suppressed in this experiment due to the proximity of its cross peak to the highly
flexible and therefore negative peak of Gly76 (see Supplementary figure 2A).

Q62
K63
E64
pS65
T66
L67
H68
L69
V70
L71
R72
L73R74
G75 G76
M1
Q2
I3
F4
V5
K6
T7
L8 T9G10
T12
I13
T14
L15
E16
E18
V17
L50
Q49
K48
G47 A46
F45
I44
L43
R42
Q41
Q40
D39
N
β2β1β5β3β4
K11
Q62
K63
E64
pS65
T66
L67
H68
L69
V70
L71
R72
L73R74
G75 G76
M1
Q2
I3
F4
V5
K6
T7
L8 T9G10
T12
I13
T14
L15
E16
E18
V17
L50
Q49
K48
G47 A46
F45
I44
L43
R42
Q41
Q40
D39
N
C
β2β1β5β3β4
K11
C
Supplementary Figure 9
BA

Supplementary Figure 9. Long distance NOE contacts of major and minor species of phosphoUb. The long distance NOE contacts of A) the major species of phosphoUb and B) the minor species of phosphoUb. The direction of the arrow indicates the
assignment of a NOE cross peak from the HN proton to either an HN, HA or HB
for a given residue. As a rule of thumb, NOE cross peaks are observed for
resonances up to 5 Å apart. The observed contacts confirm the altered
hydrogen-bonding pattern seen for the minor species of phosphoUb (Figure 4).

Supplementary Figure 10
K62%
K1138%
K270%
K290%K33
1%
K4837%
K6322%
M10% K6
3%
K1136%
K271%
K290%
K334%
K4854%
K632% M1
0%
K61%
K1172%
K271%
K290%
K330%
K4810%
K6316%
M10%
K65%
K1164%
K271%
K294%
K337%
K4816%
K633% M1
0%
K111%
K27,K29,K330%
K4897%
K632%
M1,K60%
K61% K11
3% K277%
K291%
K336%
K4862%
K6320%
M10%
Ub phosphoUb
Ub phosphoUb
Ub phosphoUb
UBE2T
UBE2R1
B
C
D
E2
Ub
E10
Ub pUb
M 180 0 180 min
E2
Ub
E10
Ub pUb
M 180 0 180 min
Coomassie
Coomassie
UBE2E1
0
Ub pUb
M 60 0 60 min
E2
Ub
Coomassie
Ser65
donor Ub
UBE2N
A

Supplementary Figure 10. Ubiquitin chain composition in E2 autoubiquitination reactions. A) SAXS-derived ensemble of UBE2N, where the E2 is shown under a blue
surface and the Ub is shown as a green ribbon. Ser65 is shown in sphere
representation. Ser65 does not contact the E2 enzyme in any orientation of Ub.
PDB files were downloaded from the Klevit-lab website
(http://depts.washington.edu/klvtlab/). B-D) Coomassie gels of a reaction with
UBE2T (B), UBE2E1 (C) and UBE2R1 (D) comparing Ub and phosphoUb, and
subsequent AQUA-based chain composition analysis. Quantification of linkages
is shown in Figure 5C.

Ub, E1, ATPE2: UBE2D1
0 5 10 30 60M 0 5 10 30 60
+ TRAF6
0 5 10 30 60 0 5 10 30 60 min
phosphoUb, E1, ATPE2: UBE2D1
- TRAF6 + TRAF6- TRAF6
anti-Ub
Ub
polyUb GST-TRAF6
28
38
49
62
98
188
14
6
E1, ATPE2: UBE2L3E3: HOIP RBR-LDD
0 5 10 30 60
Ub phosphoUb
M 0 5 10 30 60 min
Coomassie
UBE2L3
Ub
HOIP
diUb
E1
triUb
tetraUb
pentaUb
Supplementary Figure 11
cat Cys
Ser65
donor Ub
HOIP CBR-LDD
acceptor Ub
Ser65
cat Cys
Ser65
donor Ub
NEDD4 Ub at N-lobe
Ser65
cat Cys
donor Ub
UBE2D2
Ser65
BIRC7 RING
E1, ATPE2: UBE2D3E3: GST-TRAF6 50-285
0 5 10 30 60
Ub phosphoUb
M 0 5 10 30 60 min
Coomassie
UBE2D3
Ub
polyUbGST-TRAF6
GST-TRAF6
E1, ATPE2: UBE2D3E3: GST-cIAP 363-614
0 5 10 30 60
Ub phosphoUb
M 0 5 10 30 60 min
Coomassie
UBE2D3
Ub
polyUbGST-cIAP1
GST-cIAP1
UBE2L3
Ub
0
Ub
M 180 0 180 min
E1, ATPE2: UBE2L3E3: NleL
Coomassie
polyUb(K6,K48)
NleL
phosphoUb
E
A
D
F H
B C
G

Supplementary Figure 11. E3 ligase mediated assembly of phosphoUb chains A) Structure of BIRC7 (red) bound to Ub~UBE2D2 (cyan and blue) (pdb-id 4auq,
(Dou et al, 2012)). Ser65 is not contacted by the E2 or E3 enzyme. B) Composite
model that combines the crystal structure of NEDD4 bound to Ub~UBE2D (pdb-
id 3jw0, (Kamadurai et al, 2009), UBE2D is omitted for clarity) and the crystal
structure of NEDD4L with Ub bound to HECT N-lobe (2xbb, (Maspero et al,
2011)). In either position of Ub, Ser65 is not contacting the E3 ligase. C) Structure of the catalytic core of HOIP, comprising the catalytic IBR (CBR)
domain (also known as RING2) and the C-terminal LDD domain (4ljo, (Stieglitz et
al, 2013)), shown with acceptor and donor Ub (cyan) bound. Ser65 does not
contact the CBR-LDD in either Ub. D) Ubiquitination reaction as in Figure 6A
with GST-cIAP1 and UBE2D3. E) Ubiquitination reaction with UBE2D3 and GST-
TRAF6 50-285. F) Ubiquitination reaction as in E with or without TRAF6,
demonstrating that chain formation is TRAF6-dependent also with phosphoUb.
G) Ubiquitination reaction with NleL and UBE2L3. This combination makes free
Lys6/Lys48-linked polyUb (Hospenthal et al, 2013). A longer time point as
compared to Figure 6J is shown. H) Longer time course of the reaction of HOIP
RBR-LDD / UBE2L3 as shown in Figure 6K, showing that HOIP generates short
linear chains at later time points.

Supplementary Figure 12
1H Chemical Shift / ppm
15N
Che
mic
al S
hift
/ ppm
9
9
8
8
7
7
6
6
130 130
125 125
120 120
115 115
110 110
105 105
0
0.05
0.1
0.15
0.2
0.25
0.3
0.35
0.4
5 10 15 20 25 30 35 40 45 50 55 60 65 70 75
Min
ima
l Ma
p o
f W
eig
hte
d C
SP
/ p
pm
Residue Number
A
B
wt Ub (72 resonances)Ub S65D (69 resonances)Ub S65E (69 resonances)

Supplementary Figure 12. Comparison of Ub S65E with wild-type Ub. A) The BEST-TROSY spectrum of wild-type Ub (red) overlaid with the BEST-
TROSY spectrum of Ub S65E (blue) and Ub S65D (green). The phosphomimetic
Ub mutants shows no signs of the UbretraCT conformation as observed for
phosphoUb. B) A minimal map of the weighted chemical shift perturbations
(CSPs) between the peaks of S65E Ub and wild-type Ub. Resonances for Thr9,
Glu24 and Ala46 are presumed to be missing due to line broadening.

E1, ATPE2: UBE2D1E3: GST-TRAF6 1-285
Ub phosphoUb S65E Ub
0 5 10 30 60 0 5 10 30 60 0 5 10 30 60
Ub phosphoUb
E1, ATPE2: UBE2N, UBE2V1
S65E Ub Ub phosphoUb S65E Ub
0 5 10 30 60 0 5 10 30 60 0 5 10 30 60 0 5 10 30 60 0 5 10 30 60 0 5 10 30 60
28
38
49
62
98
188
14
6
28
3849
62
98
188
14
6
M
M M
Supplementary Figure 13A
B
Coomassie
Coomassie
anti-Ub
anti-Ub
Ub phosphoUb S65E Ub
0 5 10 30 60 0 5 10 30 60 0 5 10 30 60M
UBE2D3
Ub
polyUbGST-TRAF6
GST-TRAF6
Ub
UBE2NUBE2V1
GST
min min
min min

Supplementary Figure 13. Comparison of Ub, phosphoUb , and Ub S65E in chain assembly. A) Time course for a ligase reaction using GST-TRAF6 (1-285) and UBE2D1
combined with Ub, phosphoUb, or S65E Ub. Proteins were detected with
Coomassie and anti-Ub Westerns. B) Reactions with UBE2N/UBE2V1 combined
with Ub, phosphoUb, or S65E Ub. Proteins were detected as in A.

D ED
OTULIN
distal Ub
proximal Ub
distal UbOTUB1
proximal UbUBE2D
Glu395
Thr393
Ser65
USP21
distal Ub
proximal Ub(in S1 site)
Supplementary Figure 14
A B
C
Ataxin-3-like
distal Ub
E
AMSH-LP
distal Ubproximal Ub

Supplementary Figure 14. PhosphoUb chain disassembly by deubiquitinases. Structures of DUBs (red under a semi-transparent surface) bound to one or
where available two Ub molecules (cyan). Ub Ser65 atoms are shown as
spheres and indicated with a blue circle. A) Structure of USP21 bound to linear
diUb-aldehyde (2yb5, (Ye et al, 2011)). The insert shows the distal binding site
with USP21 Glu435 contacting the backbone of Ub. B) Structure of OTUB1
bound to E2 (blue, here UBE2D) with distal and proximal Ub bound (pdb-id 4ddg,
(Juang et al, 2012; Wiener et al, 2012)). C) Structure of inactive OTULIN bound
to Met1-linked diUb (3znz, (Keusekotten et al, 2013)). D) Crystal structure of the
MJD-family protein Ataxin-3L with Ub bound in the distal site (3o65, (Weeks et al,
2011)). E) Crystal structure of the JAMM family protein AMSH-LP with Lys63-
linked diUb bound across the active site (2znv, (Sato et al, 2008)).

Table S1. Peptides used for parallel reaction monitoring quantitation. Internal
standards were isotopically labelled (13C, 15N) and the corresponding residue(s)
is underlined. Modified residues with ubiquitination and phosphorylation are
indicated by (GG) or p, respectively. Fragment ions used for quantitation are
listed.
Name Peptide Sequence Light (m/z) Heavy (m/z) Fragment Ions
K6 MQIFVK(GG)TLTGK 465.9270+++ 468.2661+++ y5, y4, y3, y2
K11 TLTGK(GG)TITLEVEPSDTIENVK 801.4269+++ 803.4315+++ y11, y10, y9, y8, y7, y6
K27 TITLEVEPSDTIENVK(GG)AK 701.0390+++ 703.0436+++ y11, y7, y6, y5, y3
K29 AK(GG)IQDK 408.7323++ 411.7361++ y5, y4, y3, y2
K33 IQDK(GG)EGIPPDQQR 546.6129+++ 548.6175+++ y6, y5, y3
K48 LIFAGK(GG)QLEDGR 487.6001+++ 489.9391+++ y6, y5, y4, y3, y2
K63 (+3) 748.7376+++ 751.0767+++ y10, y9, y8, y5, y4, y3
K63 (+4) 561.8050++++ 563.5593++++
M1 GGMQIFVK 448.2389++ 451.2458++ y6, y5, y4, y3, y2
TLS TLSDYNIQK 541.2798++ 544.7884++ y7, y5, y4, y3, y2
EST ESTLHLVLR 356.5451+++ 358.8842+++ y5, y4, y3, y2
TITLE TITLEVEPSDTIENVK 894.4673++ 897.4742++ y12, y11, y10, y9, y4
TL-EpST (+3) TLSDYNIQKEpSTLHLVLR 737.3787+++ 739.7178+++ y10, y9, y8, y5, y4, y3
TL-EpST (+4) 553.2859++++ 555.0402++++
K63pS65 (+3) TLSDYNIQK(GG)EpSTLHLVLR 775.3931+++ 777.7321+++ y10, y9, y8, y5, y4, y3
K63pS65 (+4) 581.7966++++ 583.5509++++
EpST EpSTLHLVLR 383.2006+++ 385.5396+++ y5, y4, y3, y2
TLSDYNIQK(GG)ESTLHLVLR

SUPPLEMENTARY MATERIAL AND METHODS PINK1 purification Constructs of GST-tagged PhPINK1 (aa 115-575) and TcPINK1 (aa 128-570)
codon-optimized for bacterial expression were expressed in Rosetta2 pLacI
cells by inducing with 150 µM IPTG (OD600 ~1.0) at 37°C. The cells were
grown at 18°C for 12 h and lysed by sonication in 270 mM sucrose, 10 mM
glycerol 2-phosphate disodium, 50 mM sodium fluoride, 14 mM β-
mercaptoethanol, 50 mM Tris (pH 8.0) with added DNase, Lysozyme and
EDTA-free protease inhibitor tablets (Roche). After centrifugation (45000 x g,
30 min, 4°C) the supernatant was applied to Glutathione Sepharose 4B beads
(GE Healthcare), agitated for 1 h at 4°C and subsequently washed in high salt
buffer (500 mM NaCl, 10 mM DTT, 25 mM Tris pH 8.5) and equilibrated in low
salt buffer (200 mM NaCl, 10 mM DTT, 25 mM Tris pH 8.5). The GST-tagged
protein was eluted in low salt buffer containing 40 mM glutathione and applied
to gel filtration (Superdex 200, GE Life Sciences) in low salt buffer. Untagged
protein was cleaved for 12 h at 4°C with GST-3C protease and further purified
by gel filtration (Superdex 75, GE Life Sciences) in low salt buffer. Protein-
containing fractions were pooled, concentrated using a 30-kDa MWCO spin
concentrator (Sartorius) and flash frozen in liquid nitrogen.
Generation of phosphoUb 10 mg of bovine Ub (Sigma-Aldrich, U6253) were incubated with glutathione
S-transferase (GST)-tagged PhPINK1 (aa 115-575) in reaction buffer (40 mM
Tris pH 7.5, 10 mM MgCl2, 0.6 mM DTT) for 3 h at room temperature.
Reaction progress was monitored by ESI-MS. Reactions were stopped with
apyrase, PINK1 was removed using glutathione sepharose 4B resin (GE
Healthcare), and the reaction mixture was buffer exchanged to 20 mM Tris,
pH 8.7. PhosphoUb was purified by anion exchange using a pH gradient from
20 mM Tris pH 8.7 to 50 mM Tris pH 7.4. Phosphorylated but not
unphosphorylated Ub binds to MonoQ anion exchange resin at pH 8.7 and
elutes at lower pH. Fractions containing phosphoUb were concentrated using

VivaSpin 3.5K concentrators and frozen. For NMR analysis, samples were
generated as described below. Phosphorylation analysis of Ub Phosphorylation assays were performed by mixing 5 µM GST-PINK1 (species
as indicated), 0.2 mg/ml Ub or Ub chains as indicated, 10 mM ATP in reaction
buffer (40 mM Tris pH 7.5, 10 mM MgCl2, 0.6 mM DTT) and incubated at
room temperature for the specified time. The reaction was quenched in 4x
LDS sample buffer and samples were applied on a 12% polyacrylamide gel
containing 50 µM Phos-tag acrylamide (Wako Chemicals) and 0.77 mM
ZnCl2. MS analysis was performed as described below.
Intact protein MS analysis Ub and phosphoUb protein stocks were diluted to 1 µM (50% ACN, 0.1% FA)
prior to MS analysis. Samples were directly injected into the Q-Exactive
(Thermo Fisher Scientific) mass spectrometer at a flow rate of 10 µl min-1.
Protein ionization was achieved using Heated Electrospray Ionization (HESI-II
probe, Thermo Fisher Scientific). Ionization settings included the following:
spray voltage, 6.0 kV; capillary temperature, 320oC; sheath gas, 10; S-lens
RF level, 50. Raw spectra were deconvoluted using the Xtract node of
Thermo Xcalibur Qual Browser version 2.2. Extract node settings included the
following: generated mass mode, MH+; resolution, 140,000; S/N threshold, 3;
mass range, 800-2000 m/z; fit factor, 44%; remainder, 25%.
Parkin activity assays For Parkin activation assays a mixture of 0.1 µM E1, 9 µM Parkin, 10 mM
ATP and ligation buffer (40 mM Tris pH 7.5, 10 mM magnesium chloride, 0.6
mM dithiothreitol) was pre-incubated for 1 h at 30°C. The total Ub
concentration was kept at 0.5 mg/ml with the indicated mass percentages of
phosphoUb supplemented. The ubiquitination reaction was started by adding
0.1 µM E1 and 3 µM UBE2L3 and samples were taken at the indicated time
points by quenching 5 µl of the reaction with 5 µl LDS loading buffer
(Invitrogen). Disulfide bridges were reduced by adding 2 µl of 200 mM DTT
and prevented from reforming by acetylation with 1 µl of 0.5 M iodoacetamide.

Proteins were separated on NuPAGE 4-12% gradient Bis-Tris gels and
Western blotting was performed by transfer on a nitrocellulose membrane and
detection using a monoclonal anti-Ub FK2 antibody (Millipore).
PhosphoUb preparation for NMR analysis Isotope labeled Ub was expressed and purified as described previously
(Hospenthal et al, 2013). The phosphorylation of double labeled 15N, 13C-Ub
was monitored in the spectrometer by 1H,15N 2D BEST-TROSY at room
temperature containing 100 µM 15N, 13C-Ub, 2.5 µM PhPINK1, 10 mM ATP,
25 µl 20 x reaction buffer (400 mM Tris pH 7.5, 100 mM MgCl2, 6 mM DTT)
which was adjusted to 500 µl with NMR buffer (18 mM Na2HPO4, 7 mM
NaH2PO4 pH 7.2, 150 mM NaCl). 25 µl D2O was added as an internal
reference. After disappearance of the wt Ser65 signal of 15N, 13C-Ub, 21 µl of
a 500 mM EDTA solution was added to quench the reaction.
For the long range HNCO and 15N-edited NOESY experiments, 1.7 mM of 15N, 13C-Ub was phosphorylated with 17 µM GST-PhPINK1 in a 6 h reaction
containing 10 mM ATP, 10 mM Tris pH 7.5, 10 mM MgCl2, 0.6 mM DTT. After
6 h at room temperature the sample was applied to 600 µl equilibrated
Glutathione Sepharose 4B beads (GE Healthcare). After 1 h agitation the
beads were removed by gravity flow filtration and the flow through was
applied to gel filtration (Superdex 75, GE Life Sciences) equilibrated in NMR
buffer. Protein containing fractions were pooled and concentrated to 1 mM in
a 3-kDa MWCO spin concentrator (Sartorius).
For Lys63 15N, 13C-diUb generation the 15N, 13C-Ub was purified on an gel
filtration column (Superdex 75, GE Life Sciences) and Lys63 chain assembly
initiated in a volume of 1 ml by incubating 1.4 mM 15N, 13C-Ub with 2 µM E1,
16 µM UBE2N and 16 µM UBE2V1 in the presence of 10 mM ATP and
ligation buffer (40 mM Tris pH 7.5, 10 mM magnesium chloride, 0.6 mM
dithiothreitol). After 3 h at 37 °C the reaction was diluted with 50 mM sodium
acetate pH 4.5, applied on a MonoS cation exchange column (GE Life
Sciences) and eluted with a linear gradient to 50 mM sodium acetate pH 4.5,
1000 mM NaCl. The fractions containing Lys63 15N, 13C-diUb were pooled,
concentrated and flash frozen. The phosphorylation of 80 µM Lys63 15N, 13C-
diUb was performed with 2.5 µM PhPINK1 as described above and monitored

in 1H, 15N-2D BEST-TROSY experiments. Upon disappearance of the wt
Ser65 signal the reaction was quenched by adding 20 µM EDTA. Longer
chains (triUb, tetraUb) were purified and phosphorylated identically.
Solution studies of phosphoUb All NMR experiments were performed in phosphate buffered saline (18 mM
Na2HPO4, 7 mM NaH2PO4 pH 7.2, 150 mM NaCl).
NMR acquisition was carried out at 298 K on Bruker Avance III 600 MHz and
Avance2+ 700 MHz spectrometers equipped with cryogenic triple resonance
TCI probes. Topspin (Bruker) and Sparky (Goddard & Kneller, UCSF;
http://www.cgl.ucsf.edu/ home/sparky/) software packages were used for data
processing and analysis, respectively. 1H,15N 2D BEST-TROSY experiments
(Favier & Brutscher, 2011) were acquired with in-house optimized Bruker
pulse sequences incorporating a recycling delay of 400ms and 512*64
complex points in the 1H,15N dimension, respectively. High quality 2D data
sets were acquired in ~8 min.
Backbone chemical shift assignments were completed using Bruker triple
resonance pulse sequences. CBCACONH and HNCACB spectra were
collected with 1024*32*55 complex points in the 1H, 15N and 13C dimensions.
HNCO and HNCACO experiments were collected with Non Uniform Sampling
(NUS) at a rate of 25% of 1024*50*47 complex points in the 1H, 15N and 13C
dimensions, respectively. HA and HB proton shifts were obtained from an
HBHACONH spectrum collected with 50% NUS and 512*40*80 in the 1H, 15N
and indirect 1H dimensions, respectively. These data sets were processed
with Multi-Dimensional Decomposition or Compressed Sensing using the
MddNMR software package (Orekhov & Jaravine, 2011; Kazimierczuk &
Orekhov, 2011).
Weighted chemical shift perturbation calculations were completed using the
equation √(Δ1H)2+((Δ15N)2/5).
Secondary structure calculations were completed using TALOS+ (Shen et al,
2009) incorporating HN, N, CA, CB and HA shifts. 15N{1H}-heteronuclear NOE (hetNOE) measurements were carried out using a
Bruker pseudo 3D pulse program, applying a 120º 1H pulse train with a 5 ms
interpulse delay for a total of 5 s interleaved on- or off-resonance saturation.

The hetNOE values were calculated from peak intensities according the
equation Ion/Ioff.
The rate of exchange between the major and minor forms of phosphoUb was
established using ZZ exchange spectroscopy. Mixing times of 6, 18, 30, 48,
66, 96, 132, 192, 258, 324, 372, 426 and 492 ms were used in the pseudo 3D
data set. Peak intensities of the major and minor forms (auto) and their
exchange peaks (cross) of Ile23, Phe45, Ser57 and Leu73 were fitted in
Mathematica 9 (Wolfram) using the methods described in (Latham et al,
2009).
Differences in the hydrogen bonding network were established using the long
range TROSY-based HNCO (trHNCO) experiment described by (Cordier et al,
2008). A 1 mM sample of 15N,13C phosphoUb was used to collect a 3D
version of the long range trHNCO (133 ms N-C' magnetization transfer time) with 128 scans, 25% NUS and 1024*32*55 complex points in the 1H, 15N and 13C dimensions (~6 days). Cross peaks were assigned with reference to a
standard trHNCO data set, with 8 scans and 33 ms N-C' magnetization
transfer time, and processed as above.
The altered hydrogen bonding network was further confirmed by analysis of a 15N-edited 3D NOESY, collected on the 1 mM sample with 30% NUS and
1024*48*128 complex points in the direct 1H, 15N and indirect 1H dimensions
respectively.
Minimal maps of chemical shift perturbations (CSP) were created to compare
the unassigned BEST-TROSY spectra of phosphomimetic 15N-labelled Ub
S65E and wild type Ub. The weighted chemical shift difference was calculated
for each assigned peak of wild type Ub and all peaks in the Ub S65E
spectrum, using the equation √(Δ1H)2+((Δ15N)2/5). The smallest value was
then reported.
Stability measurements of Ub and phosphoUb Differential scanning calorimetry (DSC) was performed using a Microcal
Capillary DSC instrument. Samples of Ub and phosphoUb were dialyzed into
standard NMR buffer (25 mM phosphate, 150 mM NaCl, pH 7.2) and scanned
at a heating rate of 90 °C / hour in mid feedback mode. Sample rescans

indicated significant levels of reversibility for thermal denaturation with > 50%
of signal recovered despite heating initial runs to 115 °C. Data were corrected
for instrumental baseline using buffer scans recorded immediately before Ub
runs. After concentration normalization the intrinsic protein baseline between
pre and post transitional levels was corrected using the progress function in
the Origin software supplied with the instrument. Corrected endotherms were
fit to a non-two state model allowing Tm, ∆H calorimetric and ∆H van’t Hoff to
vary independently.
Crystallographic analysis of phosphoUb PhosphoUb for crystallization was generated by setting up a phosphorylation
reaction at room temperature with 10 mg/ml recombinant Ub and 23.3 µM
GST-PhPINK1 in 10 mM ATP, 40 mM Tris pH 7.5, 10 mM MgCl2, 0.6 mM
DTT (total volume 250 µl). After 4 h the reaction was applied to 400 µl
Glutathione Sepharose 4B beads (GE Healthcare) and agitated for 1 h. The
flow through was collected and buffer exchanged into water with a PD-10
desalting column (GE Healthcare) and applied on a MonoQ anion exchange
column (GE Life Sciences). Pure phosphoUb eluted in 50 mM Tris pH 7.4
and, was concentrated in a 3-kDa MWCO spin concentrator (Sartorius), and
crystallized at 3 mg/ml using the vapor diffusion method in sitting drop
experiments. Crystals grew in 30% (w/v) PEG 8000, 0.2 M ammonium sulfate,
and were vitrified in mother liquor containing 25.5% (w/v) PEG 8000, 0.17 M
ammonium sulfate, 15% (v/v) glycerol.
Data were collected at the Diamond Light Source (Harwell, UK) beamline I-03.
The structure was solved by molecular replacement in Phaser (McCoy et al,
2007), using truncated Ub (pdb-id 1UBQ, residues 1-71) as a search model.
Subsequent rounds of model building in coot (Emsley et al, 2010) and
refinement in Phenix (Adams et al, 2011) generated a final model with
statistics shown in Supplementary Table 1. All structure figures were done in
PyMol (www.pymol.org) and electrostatics were calculated with CHARMM
(http://www.charmm-gui.org).

Ubiquitin chain composition mass spectrometry analysis Chain assembly reactions were resolved on NuPAGE 4-12% gradient Bis-Tris
gel prior to in-gel digestion and the addition of 400 fmoles AQUA peptide
standards according to (Kirkpatrick et al, 2006) and (Ordureau et al, 2014).
Supplementary Table 1 contains a list of all AQUA peptide standards.
Isotopically labeled AQUA peptide standards were synthesized and
purchased from Cell Signalling Technology®. Extracted peptides were
lyophilized and stored at -80oC. Prior to MS analysis, peptides were
resuspended in 30 µl of reconstitution buffer (7.5% ACN, 0.5% TFA, 0.01%
H2O2). Oxidation of methionine-containing peptides was performed according
to (Phu et al, 2010). 10 µl was directly loaded onto an EASY-Spray reverse-
phase column via partial loop injection (C18, 3µm, 100Å, 75µm x 15µm) using
a Dionex UltiMate 3000 HPLC system (Thermo Fisher Scientific). Peptides
were eluted using a 25 min ACN gradient (2.5-35%) at a flow rate of 1.4 µl
min-1and flowmeter pressure of ~6,500 psi. Peptides were analyzed on a Q-
Exactive mass spectrometer (Thermo Fisher Scientific) using parallel reaction
monitoring (PRM), similar to (Tsuchiya et al, 2013). For PRM assays,
monoisotopic precursor masses were isolated (2 m/z window) and fragmented
at predetermined chromatographic retention times. Precursor masses were
fragmented using the following settings: resolution, 17,500; AGC target, 1E5;
maximum injection time, 120 ms; normalized collision energy, 28. Raw files
were searched and fragment ions quantified using Skyline version
2.5.0.6157© (MacLean et al, 2010). The fragment ions used for quantitation
are listed in Supplementary Table1. Data generated from Skyline was
exported into a Microsoft Excel spread sheet for further analysis according to
(Kirkpatrick et al, 2006).
Ubiquitin chain assembly studies For E2 charging assays, 250 nM E1 were mixed with 4 µM E2 enzymes and
15 µM Ub or phosphoUb in ligation buffer (40 mM Tris pH 7.5, 10 mM
magnesium chloride, 0.6 mM dithiothreitol) and incubated at 37 ºC. At
indicated timepoints, 9 µl samples were mixed with 9 µl 4xLDS loading buffer
(Invitrogen) without reducing agent, and resolved on 4-12% gradient SDS

PAGE gels in MES buffer (Invitrogen). Gels were Coomassie-stained with
InstantBlue (Expedeon).
For ligase reactions, 5-10 µM of respective E3 ligases were added to the E2
mixture. Western blotting was performed using rabbit polyclonal anti-Ub
antibody (Millipore). UBD pull-down assay Pull-down assays were essentially performed as previously described(Kulathu
et al, 2009). 30 µg of GST-tagged TAB2 NZF was immobilized on 25 µl of
Glutathione Sepharose 4B (GE Life Sciences) and washed three times with
pull-down assay buffer (PDAB; 50 mM Tris pH 7.4, 150 mM NaCl, 2 mM β-
mercaptoethanol, 0.1 % NP-40). Then, 1.5 µg of the indicated tetraUb species
(see section above; Generation of phosphoUb) was incubated with the
immobilized TAB2 NZF overnight at 4 ºC in a total volume of 450 µl pull-down
assay buffer containing 0.2 mg/ml BSA. The beads were then washed five
times with PDAB prior to separation by SDS-PAGE. Proteins were transferred
to PVDF and blotted using a polyclonal rabbit anti-Ub antibody (Millipore).
Disassembly of phosphorylated polyubiquitin DUBs were either kind gifts from Marc Pittmann, purchased, or purified
according to published procedures (Mevissen et al, 2013). Polyubiquitinated
cIAP substrate was generated from a ligase reaction with GST-tagged cIAP1
and UBE2D1, which was stopped with 0.1 U apyrase. 10 µl of this reaction
were used in a 30 µl DUB reaction, that contained 3 µl 10 x DUB buffer (500
mM sodium chloride, 500 mM Tris pH 7.5, 50 mM dithiothreitol) and DUBs at
indicated concentrations. During incubation at 37 ºC, aliquots of 6 µl of the
reaction were taken at the time points indicated and mixed with 6 µl 4 x LDS
loading buffer (Invitrogen) to stop the reaction. Samples (10 µl) were resolved
by SDS-PAGE as above and silver stained using the Bio-Rad Silver Stain
Plus kit according to the manufacturer’s protocol.
DiUb and tetraUb chains were phosphorylated with GST-PhPINK1 and Ser65
phosphorylation efficiency was assessed by either AQUA MS (tetraUbs) or
ESI-MS (K6 diUb). GST-PhPINK1 was removed by Glutathione 4B Sepharose
beads. Ub chains were diluted in PBS + 5 mM DTT at 1 µM (1.5x, tetraUb) or

3 µM (1.5x, diUb), DUBs were diluted to their respective 3x concentrations in
PBS + 5 mM DTT and both solutions were incubated at 37 ºC for 10 min prior
to start of the reaction. Samples were taken after the indicated time points and
quenched by addition 4xLDS loading buffer (Invitrogen), and analyzed by
SDS-PAGE and silver staining as described above.
SUPPLEMENTARY REFERENCES
Adams PD, Afonine PV, Bunkóczi G, Chen VB, Echols N, Headd JJ, Hung L-W, Jain S, Kapral GJ, Grosse Kunstleve RW, McCoy AJ, Moriarty NW, Oeffner RD, Read RJ, Richardson DC, Richardson JS, Terwilliger TC & Zwart PH (2011) The Phenix software for automated determination of macromolecular structures. Methods 55: 94–106
Cordier F, Nisius L, Dingley AJ & Grzesiek S (2008) Direct detection of N-H[...]O=C hydrogen bonds in biomolecules by NMR spectroscopy. Nat Protoc 3: 235–241
Dou H, Buetow L, Sibbet GJ, Cameron K & Huang DT (2012) BIRC7-E2 ubiquitin conjugate structure reveals the mechanism of ubiquitin transfer by a RING dimer. Nat Struct Mol Biol 19: 876–883
Emsley P, Lohkamp B, Scott WG & Cowtan K (2010) Features and development of Coot. Acta Crystallogr D Biol Crystallogr 66: 486–501
Favier A & Brutscher B (2011) Recovering lost magnetization: polarization enhancement in biomolecular NMR. J Biomol NMR 49: 9–15
Hospenthal MK, Freund SMV & Komander D (2013) Assembly, analysis and architecture of atypical ubiquitin chains. Nat Struct Mol Biol 20: 555–565
Juang Y-C, Landry M-C, Sanches M, Vittal V, Leung CCY, Ceccarelli DF, Mateo A-RF, Pruneda JN, Mao DYL, Szilard RK, Orlicky S, Munro M, Brzovic PS, Klevit RE, Sicheri F & Durocher D (2012) OTUB1 Co-opts Lys48-Linked Ubiquitin Recognition to Suppress E2 Enzyme Function. Mol Cell 45: 384–397
Kamadurai HB, Souphron J, Scott DC, Duda DM, Miller DJ, Stringer D, Piper RC & Schulman BA (2009) Insights into ubiquitin transfer cascades from a structure of a UbcH5B approximately ubiquitin-HECT(NEDD4L) complex. Mol Cell 36: 1095–1102
Kazimierczuk K & Orekhov VY (2011) Accelerated NMR spectroscopy by using compressed sensing. Angew Chem Int Ed Engl 50: 5556–5559
Keusekotten K, Elliott PR, Glockner L, Fiil BK, Damgaard RB, Kulathu Y, Wauer T, Hospenthal MK, Gyrd-Hansen M, Krappmann D, Hofmann K & Komander D (2013) OTULIN antagonizes LUBAC signaling by specifically hydrolyzing Met1-linked polyubiquitin. Cell 153: 1312–1326

Kirkpatrick DS, Hathaway NA, Hanna J, Elsasser S, Rush J, Finley D, King RW & Gygi SP (2006) Quantitative analysis of in vitro ubiquitinated cyclin B1 reveals complex chain topology. Nature Cell Biology 8: 700–710
Kulathu Y, Akutsu M, Bremm A, Hofmann K & Komander D (2009) Two-sided ubiquitin binding explains specificity of the TAB2 NZF domain. Nat Struct Mol Biol 16: 1328–1330
Latham MP, Zimmermann GR & Pardi A (2009) NMR chemical exchange as a probe for ligand-binding kinetics in a theophylline-binding RNA aptamer. J Am Chem Soc 131: 5052–5053
MacLean B, Tomazela DM, Shulman N, Chambers M, Finney GL, Frewen B, Kern R, Tabb DL, Liebler DC & MacCoss MJ (2010) Skyline: an open source document editor for creating and analyzing targeted proteomics experiments. Bioinformatics 26: 966–968
Maspero E, Mari S, Valentini E, Musacchio A, Fish A, Pasqualato S & Polo S (2011) Structure of the HECT:ubiquitin complex and its role in ubiquitin chain elongation. EMBO Rep 12: 342–349
McCoy AJ, Grosse Kunstleve RW, Adams PD, Winn MD, Storoni LC & Read RJ (2007) Phaser crystallographic software. J Appl Crystallogr 40: 658–674
Mevissen TET, Hospenthal MK, Geurink PP, Elliott PR, Akutsu M, Arnaudo N, Ekkebus R, Kulathu Y, Wauer T, Oualid El F, Freund SMV, Ovaa H & Komander D (2013) OTU Deubiquitinases Reveal Mechanisms of Linkage Specificity and Enable Ubiquitin Chain Restriction Analysis. Cell 154: 169–184
Ordureau A, Sarraf SA, Duda DM, Heo J-M, Jedrychowski MP, Sviderskiy VO, Olszewski JL, Koerber JT, Xie T, Beausoleil SA, Wells JA, Gygi SP, Schulman BA & Harper JW (2014) Quantitative Proteomics Reveal a Feedforward Mechanism for Mitochondrial PARKIN Translocation and Ubiquitin Chain Synthesis. Mol Cell
Orekhov VY & Jaravine VA (2011) Progress in Nuclear Magnetic Resonance Spectroscopy. Progress in Nuclear Magnetic Resonance Spectroscopy 59: 271–292
Phu L, Izrael-Tomasevic A, Matsumoto ML, Bustos DJ, Dynek JN, Fedorova AV, Bakalarski CE, Arnott D, Deshayes K, Dixit VM, Kelley RF, Vucic D & Kirkpatrick DS (2010) Improved quantitative mass spectrometry methods for characterizing complex ubiquitin signals. Mol Cell Proteomics
Sato Y, Yoshikawa A, Yamagata A, Mimura H, Yamashita M, Ookata K, Nureki O, Iwai K, Komada M & Fukai S (2008) Structural basis for specific cleavage of Lys 63-linked polyubiquitin chains. Nature 455: 358–362
Shen Y, Delaglio F, Cornilescu G & Bax A (2009) TALOS+: a hybrid method for predicting protein backbone torsion angles from NMR chemical shifts.
J Biomol NMR 44: 213–223
Stieglitz B, Rana RR, Koliopoulos MG, Morris-Davies AC, Schaeffer V, Christodoulou E, Howell S, Brown NR, Dikic I & Rittinger K (2013) Structural basis for ligase-specific conjugation of linear ubiquitin chains by HOIP. Nature 503: 422–426
Tsuchiya H, Tanaka K & Saeki Y (2013) The parallel reaction monitoring method contributes to a highly sensitive polyubiquitin chain quantification. Biochem Biophys Res Commun 436: 223–229
Weeks SD, Grasty KC, Hernandez-Cuebas L & Loll PJ (2011) Crystal structure of a Josephin-ubiquitin complex: evolutionary restraints on ataxin-3 deubiquitinating activity. J Biol Chem 286: 4555–4565
Wiener R, Zhang X, Wang T & Wolberger C (2012) The mechanism of OTUB1-mediated inhibition of ubiquitination. Nature 483: 618–622
Ye Y, Akutsu M, Reyes-Turcu F, Enchev RI, Wilkinson KD & Komander D (2011) Polyubiquitin binding and cross-reactivity in the USP domain deubiquitinase USP21. EMBO Rep 12: 350–357


![Ubiquitin and Ubiquitin-like Modifications in Viral ...1].pdf · Ubiquitin and Ubiquitin-like Modifications in Viral Infection and Immunity Abstracts of papers presented at the AUGUST](https://img.pdfslide.net/doc/110x75/5e2d68ba2a69b505b71e58fa/ubiquitin-and-ubiquitin-like-modifications-in-viral-1pdf-ubiquitin-and-ubiquitin-like.jpg)


![Ubiquitin phosphorylation in Parkinson’s disease: Implications ......age to parkin is associated with sporadic PD [61–63]. Parkin is a 465-amino-acid, cytosolic E3 ubiquitin-protein](https://img.pdfslide.net/doc/110x75/60ff3ba3c386cc67f77a5534/ubiquitin-phosphorylation-in-parkinsonas-disease-implications-age-to.jpg)