Embed Size (px)
Citation preview

UBPR for Management
STRI
CTLY
CON
FIDE
NTIA
LMarch 5, 2010

2
Required DisclosuresThe following information is for informational purposes only and was prepared from sources believed to be reliable but is not guaranteed as to accuracy and is not a complete summary
or statement of all available data. The views or opinions expressed in this material are solely those of the author and do not necessarily represent those of Janney Montgomery Scott LLC.
Janney Montgomery Scott LLC is a broker-dealer registered with the US Securities and Exchange Commission and member NYSE, FINRA, and SIPC.

3
Speaker Credentials: Roger G. Powell
Academic
B.A. Economics 1971 Davidson College, Davidson, NC
Certificate, Advanced Management Program 1978
North Carolina School of Banking, Chapel Hill, NC
Experience
Investment Banking
Banks / Thrifts
Mortgage Cos
Credit Card Cos
Commercial Fin
Asset Based
Premium Fin
Janney Montgomery Scott (2008 - )Alex. Brown & Sons (1990-2000)
Investment Research
Banks / Thrifts
Mortgage Cos
Credit Card Cos
Asset Managers
Alex. Brown & Sons (1983-1990)The Powell Group (1972-1976)
Corporate Development / Strategic Planning
Deutsche Bank AG (2000-2007)United Carolina Bancshares (1976 – 1982)

4
Critical themes for strategy and tactics in 2010
Competition
Capital
Control / Externals and Internals
Importance of UBPR
Users and motives
Construction of UBPR
Comparison to GAAP and MIS
Current regulator emphasis
Goal:
UBPR = Uniform Bank Performance Report

5
Summa de arithmetica, geometria, proportioni et proportionalita 1494
In the beginning….
Galleria Nazionale di Capodimonte (Naples)
Founder of the Medici Bank 1397
Mediateca di Palazzo Medici Riccardi
Fra Luca Bartolomeo de Pacioli (1446/7–1517) Giovanni di Averardo detto Bicci, de’ Medici (1360-1429)

6
The UBPR is:
An analytical tool
Created for
Bank supervisory;
Examination; and
Management purposes
Used as an aid in evaluating the
adequacy of earnings, liquidity, capital, asset and liability management, and growth management
…a common point of financial analysis between regulator and banker…
Source: A User’s Guide for the Uniform Bank Performance Report, December 2008
7
User Source Format Motive FrequencyRegulators Company Call
ReportsSupplemental Ledgers and reports
UBPRLedgersGAAP / SEC
Guarantor / Safety, soundness and compliance
Constant
Board and Management
General Ledger and analysis
MIS GAAP / SECUBPR
Fiduciary / ‘Prudent Man’ / Shareholder ValueIncentives Operations
Constant
Investors- Equity- Debt
CompanyAnalystsRegulators
GAAP / SECUBPR
Debt – Cash flow and repaymentEquity – Earnings and franchise value
Frequent
Public- Depositor- Borrower
CompanyAnalystsRegulators
GAAP/ SECUBPR
ConfidenceStrategic vendor
Occasional
Users and Motives…

8
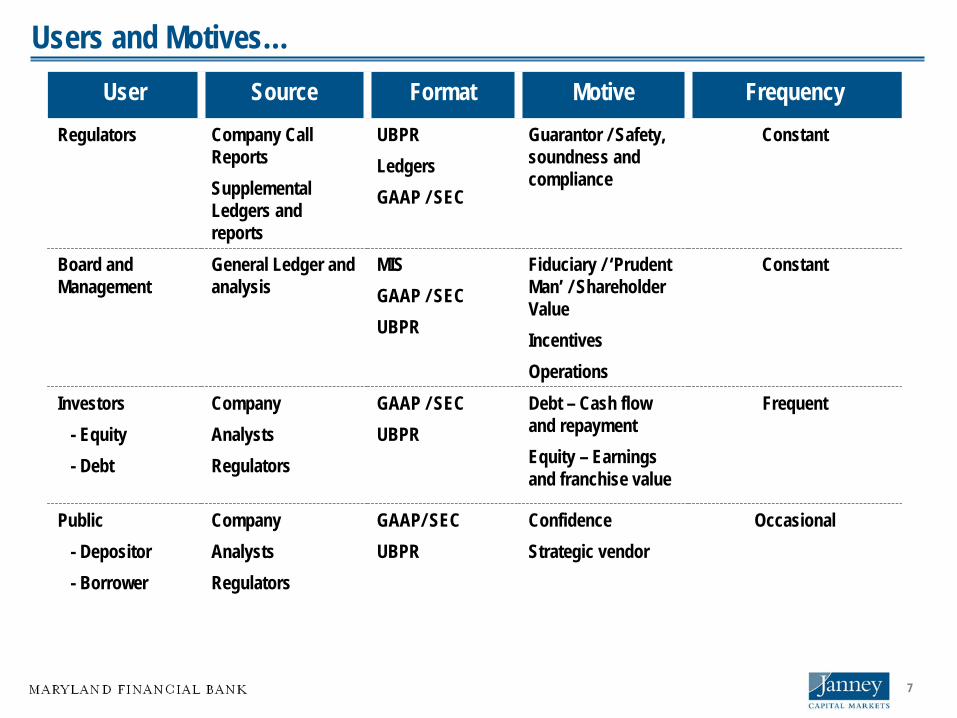
FFIEC Website
9
FFIEC Website

10
UBPR Construction
Sources: Regulatory reports
Custom Peer Groups may be constructed
Changes in 2008: added detail on construction and other risky lending categories
‘Trimmed Averages’ eliminate outliers
Tax Equivalent Adjustment mechanism
Sub S adjustment mechanism
Source: A User’s Guide for the Uniform Bank Performance Report, December 2008

11
UBPR Construction
Modules
Net Income =Non-interest income +Net-interest income +
[Interest Income – Interest Expense]
Credit expense –Non-interest expense –Tax expense
Source: A User’s Guide for the Uniform Bank Performance Report, December 2008

12
Net income (to average assets)
Other noninterest income
Personnel expense (to average assets)
Occupancy expense (to average assets)
Other operating expense (to average assets)
Average assets per domestic office
Fiduciary activities (income) (if available)
Average personnel expense per equiv employee - $MM
Premises, fixed assets (to average assets)
Average assets per employee - $MM
Noninterest income (to average assets)
Net interest income (TE) (to average assets)
Realized G/L available-for-sale sec
Net extraordinary items (to average assets)
Provision for loan & lease losses (to average assets)
Realized G/L held-to-maturity sec
Noninterest expense (to average assets)
Deposit service charges
Net from trading fees & comms (if available)
Foreign exchange trading (if available)
Applicable inc tax (TE) (to average assets)
UBPR Construction / Net Income
Source: Federal Financial Institutions Examination Council
13
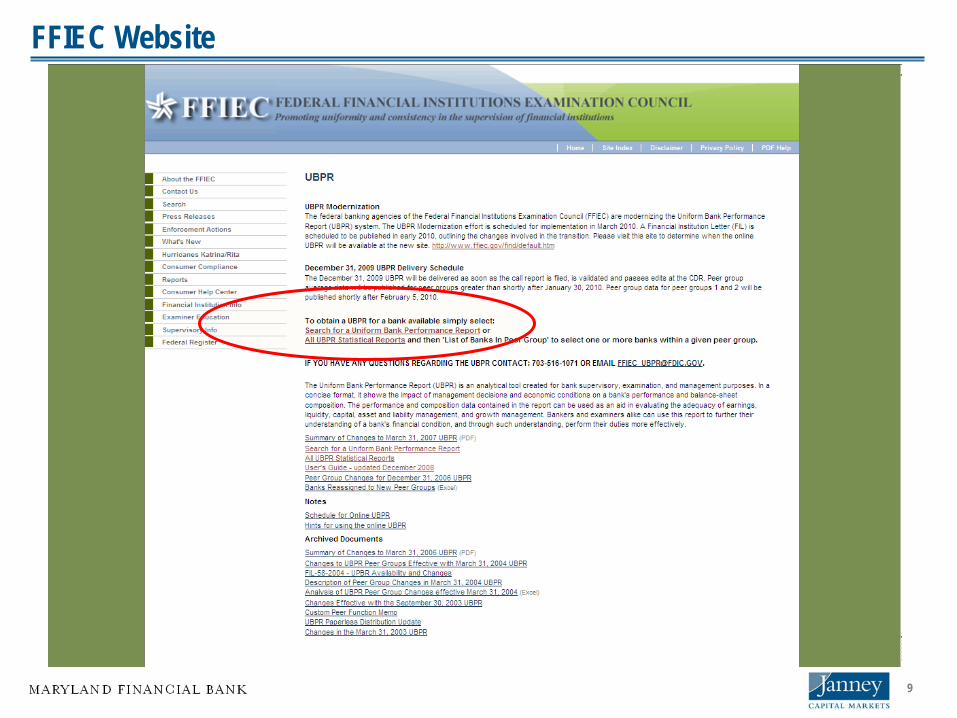
Interest income (TE) (to average assets)
Average earning assets (to average assets)
Interest income (TE) (to avg earning assets)
Interest-bearing bank balances (yield on)
US Treasury & agency securities (yield on)
Mortgage backed securities (yield on)
All other securities (yield on)
Total loans & leases (TE) (yield on)
Other interest income
Investment securities (TE) (yield on)
Federal funds sold & repos (yield on)
Agricultural loans (yield on)
Commercial & industrial loans (yield on)
Loans to individuals (yield on)
Real estate loans (yield on)
Trading account assets (to average assets)
Interest-bearing bank balances (to average assets)
Federal funds sold & resold (to average assets)
Net loans & leases (to average assets)
I.O. strips and other equity securities (to average assets)
Securities (AFS + HTM) (to average assets)
Interest expense (to average assets)
Source: Federal Financial Institutions Examination Council
UBPR Construction / Net Interest Income
14
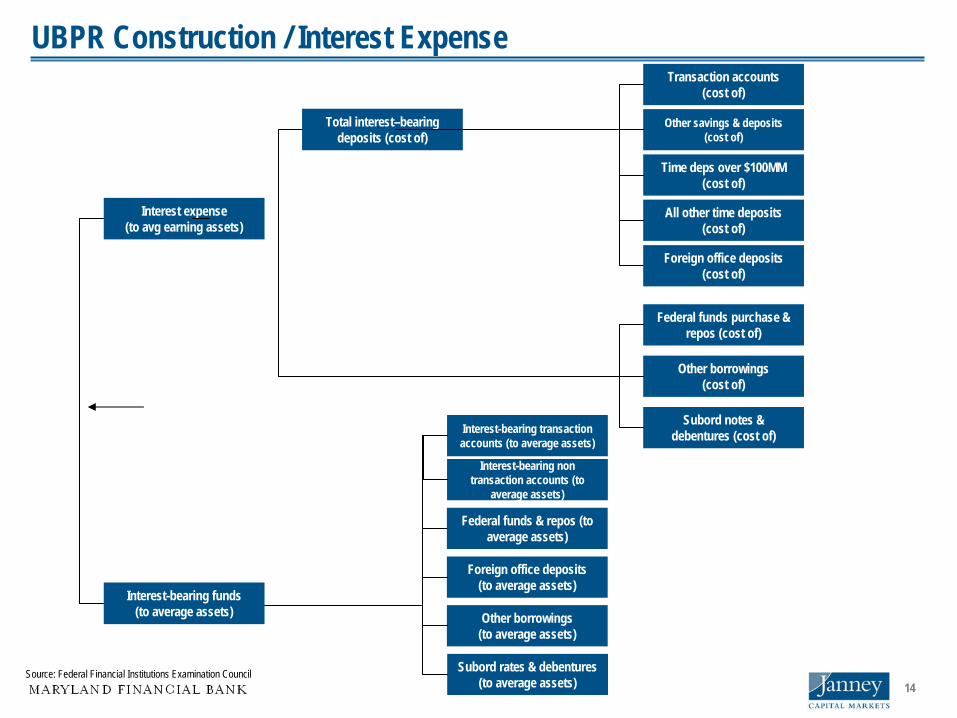
Interest expense (to avg earning assets)
Total interest–bearing deposits (cost of)
Foreign office deposits (cost of)
All other time deposits (cost of)
Other savings & deposits (cost of)
Time deps over $100MM (cost of)
Transaction accounts (cost of)
Other borrowings (to average assets)
Federal funds & repos (to average assets)
Foreign office deposits (to average assets)
Interest-bearing transaction accounts (to average assets)
Subord rates & debentures (to average assets)
Interest-bearing non transaction accounts (to
average assets)
Interest-bearing funds (to average assets)
Federal funds purchase & repos (cost of)
Other borrowings (cost of)
Subord notes & debentures (cost of)
UBPR Construction / Interest Expense
Source: Federal Financial Institutions Examination Council

15
Peer Groups
Group # Asset Size Branches Market1 $3 billion< NA NA
2 $1B<$3B NA NA3 $0.3B<$1B NA NA4 $0.1B<$0.3B 3 or more Metropolitan5 Non-metropolitan6 2 or fewer Metropolitan7 Non-metropolitan8 $0.05B<$0.1B 3 or more Metropolitan9 Non-metropolitan10 2 or fewer Metropolitan11 Non-metropolitan12 <$0.05B 2 or more Metropolitan13 Non-metropolitan14 1 Metropolitan15 Non-metropolitan
De-novo <0.75B Grouped by year of formation for five yearsSpecialty Groups FDIC Savings Banks, Credit card banks (<$1B, $1<$5B, $5B<), Bankers Banks, Fiduciary Banks
(<$0.1B, $0.1<$0.5B, $0.5<$1.0B, $1<$10B, $10<$100B, $100B<)
Source: Federal Financial Institutions Examination Council

16
Critical Issues
Capital
Asset Quality
Management
Earnings
Liquidity
Sensitivity to Market Risk

17
Case:
NASDAQ:FSBKTotal Assets $830 mmTang Common Equity $ 82 mm5-Year Avg ROAA 1.52%5-Year Avg ROAE 17.24%Market Capitalization ~$100 mn
Special Skills:Direct FreddieMac originator; packages own loans into securities for portfolio.Residential construction lending.
HQ: Washington, NC (Beaufort Co.)Major Competitors:
BB&T
Royal Bank of Canada
Wells Fargo
Source: Company; SNL Securities LLC

18
CERT # 31084 DIST/RSSD: 05 / 883874 FIRST SOUTH BANKCHARTER # 0 COUNTY: SUMMARY RATIOS
9/30/2009 9/30/2008
AVERAGE ASSETS ($000) 878,976 913,895NET INCOME ($000) 5,717 9,338NUMBER OF BANKS IN PEER GROUP 1,200 1,189 N/A N/AEARNINGS AND PROFITABILITY BANK PG 3 PCT BANK PG 3 PCTPERCENT OF AVERAGE ASSETS: INTEREST INCOME (TE) 5.74 5.17 86 6.79 6.02 92 - INTEREST EXPENSE 1.94 1.75 63 2.59 2.45 60 NET INTEREST INCOME (TE) 3.8 3.42 71 4.2 3.58 83 + NONINTEREST INCOME 0.98 0.75 71 1.01 0.79 71 - NONINTEREST EXPENSE 2.83 2.92 48 2.59 2.86 37 - PROVISION: LOAN&LEASE LOSSES 0.68 0.9 52 0.42 0.39 66 = PRETAX OPERATING INCOME (TE) 1.27 0.41 71 2.2 1.15 88 + REALIZED GAINS/LOSSES SEC 0.14 0.04 83 0.01 -0.03 72 = PRETAX NET OPERATING INC (TE) 1.41 0.44 75 2.22 1.04 89 NET OPERATING INCOME 0.87 0.31 68 1.36 0.74 79 ADJUSTED NET OPERATING INCOME 0.96 0.6 61 1.62 0.92 84 NET INC ATTRIB TO MIN INTS 0 N/A 98 N/A N/A N/A NET INCOME ADJUSTED SUB S 0.26 0.67 NET INCOME 0.87 0.31 68 1.36 0.74 79 MARGIN ANALYSIS: AVG EARNING ASSETS TO AVG ASSETS 95.18 93.63 68 95.2 93.88 67AVG INT-BEARING FUNDS TO AVG AST 78.83 81.72 29 78.78 80.64 35INT INC (TE) TO AVG EARN ASSETS 6.03 5.53 82 7.13 6.43 90INT EXPENSE TO AVG EARN ASSETS 2.04 1.87 60 2.72 2.61 57NET INT INC-TE TO AVG EARN ASSET 3.99 3.67 66 4.41 3.83 80
Summary - 01
Source: Federal Financial Institutions Examination Council; UBPR

19
CERT # 31084 DIST/RSSD: 05 / 883874 FIRST SOUTH BANKCHARTER # 0 COUNTY: SUMMARY RATIOS
9/30/2009 9/30/2008 LOAN & LEASE ANALYSIS NET LOSS TO AVERAGE TOTAL LN&LS 0.69 0.85 55 0.19 0.34 48EARNINGS COVERAGE OF NET LOSS(X) 3.34 6.52 53 16.04 18.17 65LN&LS ALLOWANCE TO NET LOSSES(X) 2.4 4.32 47 7.55 9.72 60LN&LS ALLOW TO LN&LS NOT HFS 1.79 1.71 64 1.49 1.3 72LN&LS ALLOWANCE TO TOTAL LN&LS 1.77 1.7 64 1.48 1.3 73NON-CUR LN&LS TO GROSS LN&LS 1.98 3.07 42 1.86 1.7 63 LIQUIDITY NET NON CORE FUND DEPENDENCE 31.91 26.65 64 31.53 30.25 55NET LOANS & LEASES TO ASSETS 79.97 69.26 83 84.73 72.37 88 CAPITALIZATION TIER ONE LEVERAGE CAPITAL 9.33 8.79 66 9.05 8.93 59CASH DIVIDENDS TO NET INCOME 102.2 28.8 91 62.66 37.66 73RETAIN EARNS TO AVG TOTAL EQUITY -0.2 -0.31 37 5.42 2.56 60RESTR+NONAC+RE ACQ TO EQCAP+ALLL 34.11 30.11 67 26.45 14.86 79 GROWTH RATES ASSETS -3.71 6.2 12 -2.16 9.08 11TIER ONE CAPITAL -0.61 5.39 25 0.06 6.04 22NET LOANS & LEASES -9.12 1.98 12 -1.45 10.37 13SHORT TERM INVESTMENTS 631.39 216.2 85 511.87 11.71 95SHORT TERM NON CORE FUNDING 25.77 7.52 74 3.24 20.6 34
Summary – 01
Source: Federal Financial Institutions Examination Council; UBPR

20
Capital – 11
RISK-BASED CAPITAL BANK PEER 3 PCTTIER ONE RBC TO RISK-WGT ASSETS 11.94 11.88 58TOTAL RBC TO RISK-WEIGHT ASSETS 13.2 13.13 58TIER ONE LEVERAGE CAPITAL 9.33 8.79 66 OTHER CAPITAL RATIO: DEF TAX ASSET TO T1 CAP 0.85 2.24 50
Source: Federal Financial Institutions Examination Council; UBPR

21
Capital – 11CAPITAL RATIOS BANK PG 3 PCTPERCENT OF BANK EQUITY: NET LOANS & LEASES (X) 7.94 7.5 56 SUBORD NOTES & DEBENTURES 0 0.02 94 LONG TERM DEBT 0 0.02 94 COM RE & RELATED VENTURES 518.22 357.4 79PERCENT OF AVERAGE BANK EQUITY: NET INCOME 8.85 2.97 67 DIVIDENDS 9.05 2.59 89 RETAINED EARNINGS -0.2 -0.31 37OTHER CAPITAL RATIOS: DIVIDENDS TO NET OPER INCOME 102.2 42.51 88 BANK EQUITY CAPITAL TO ASSETS 10.08 9.45 66 BANK EQ CAP + MIN INT TO ASSETS 10.08 9.46 66GROWTH RATES: TOTAL EQUITY CAPITAL 0.25 8.33 23 EQUITY GROWTH LESS ASST GROWTH 3.96 1.2 57INTANG ASSETS % BANK EQUITY MORTGAGE SERVICING RIGHTS 1.45 0.12 92 GOODWILL 4.91 2.73 75 PURCH CREDIT CARD RELATION 0 N/A 97 ALL OTHER INTANGIBLES 0.17 0.46 68 TOTAL INTANGIBLES 6.53 3.87 73
Source: Federal Financial Institutions Examination Council; UBPR
22
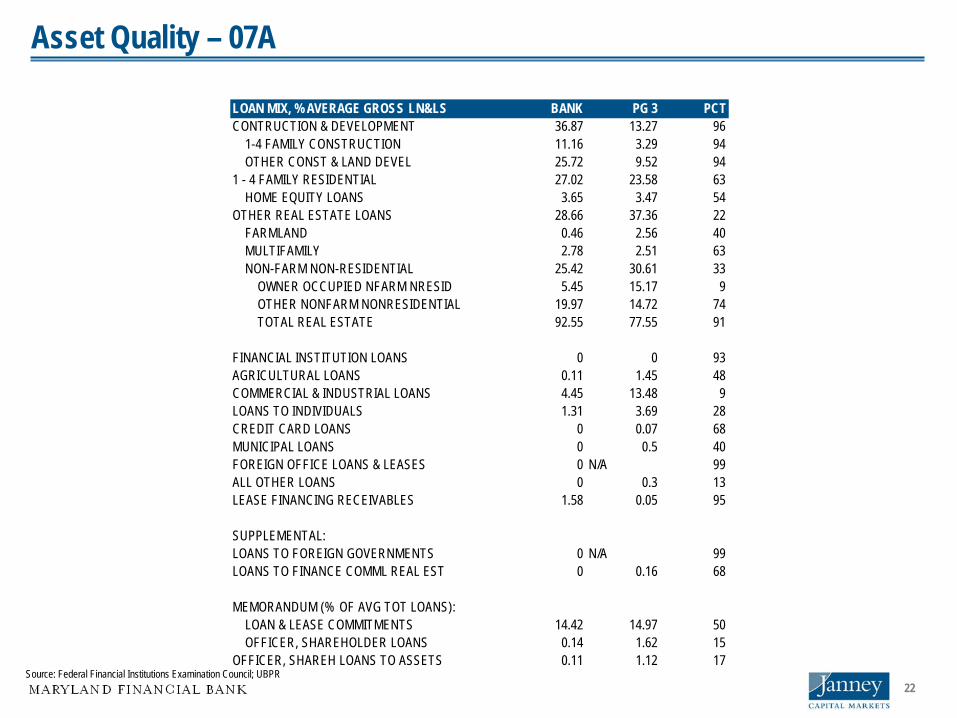
LOAN MIX, % AVERAGE GROSS LN&LS BANK PG 3 PCTCONTRUCTION & DEVELOPMENT 36.87 13.27 96 1-4 FAMILY CONSTRUCTION 11.16 3.29 94 OTHER CONST & LAND DEVEL 25.72 9.52 941 - 4 FAMILY RESIDENTIAL 27.02 23.58 63 HOME EQUITY LOANS 3.65 3.47 54OTHER REAL ESTATE LOANS 28.66 37.36 22 FARMLAND 0.46 2.56 40 MULTIFAMILY 2.78 2.51 63 NON-FARM NON-RESIDENTIAL 25.42 30.61 33 OWNER OCCUPIED NFARM NRESID 5.45 15.17 9 OTHER NONFARM NONRESIDENTIAL 19.97 14.72 74 TOTAL REAL ESTATE 92.55 77.55 91 FINANCIAL INSTITUTION LOANS 0 0 93AGRICULTURAL LOANS 0.11 1.45 48COMMERCIAL & INDUSTRIAL LOANS 4.45 13.48 9LOANS TO INDIVIDUALS 1.31 3.69 28CREDIT CARD LOANS 0 0.07 68MUNICIPAL LOANS 0 0.5 40FOREIGN OFFICE LOANS & LEASES 0 N/A 99ALL OTHER LOANS 0 0.3 13LEASE FINANCING RECEIVABLES 1.58 0.05 95 SUPPLEMENTAL: LOANS TO FOREIGN GOVERNMENTS 0 N/A 99LOANS TO FINANCE COMML REAL EST 0 0.16 68 MEMORANDUM (% OF AVG TOT LOANS): LOAN & LEASE COMMITMENTS 14.42 14.97 50 OFFICER, SHAREHOLDER LOANS 0.14 1.62 15OFFICER, SHAREH LOANS TO ASSETS 0.11 1.12 17
Asset Quality – 07A
Source: Federal Financial Institutions Examination Council; UBPR

23
LOAN & LSE % TOTAL CAPITAL BANK PG 3 PCTCONTRUCTION & DEVELOPMENT 278.76 92.11 95 1-4 FAMILY CONSTRUCTION 70.66 20.17 92 OTHER CONST & LAND DEVEL 208.1 67.99 941 - 4 FAMILY RESIDENTIAL 216.22 174.7 67 HOME EQUITY LOANS 28.5 26.62 55OTHER REAL ESTATE LOANS 230.99 284.53 32 FARMLAND 3.77 18.86 41 MULTIFAMILY 19.36 19.6 59 NON-FARM NON-RESIDENTIAL 207.86 232.75 43 OWNER OCCUPIED NFARM NRESID 42.68 115.03 11 OTHER NONFARM NONRESIDENTIAL 165.18 113.3 76 TOTAL REAL ESTATE 725.97 569.53 80 FINANCIAL INSTITUTION LOANS 0 N/A 95AGRICULTURAL LOANS 0.99 10.47 50COMMERCIAL & INDUSTRIAL LOANS 31.68 97.01 11LOANS TO INDIVIDUALS 9.61 25.31 28CREDIT CARD LOANS 0 0.48 69MUNICIPAL LOANS 0 3.5 41FOREIGN OFFICE LOANS & LEASES 0 N/A 99ALL OTHER LOANS 0 2.09 14LEASE FINANCING RECEIVABLES 12.26 0.37 95 SUPPLEMENTAL: LOANS TO FOREIGN GOVERNMENTS 0 N/A 99LOANS TO FINANCE COMM REAL EST 0 1.03 70 NONOWNER OCC COMML RE % TOT CAP 463.3 239 91TOTAL COMML REAL ESTATE % TOT CAP 505.98 359.56 79 CONSTRUCTION & DEVEL % TOT LNS 35.72 12.34 96NONOWNER OCC COMML RE % TOT LNS 59.36 32.21 92TOTAL COMML REAL ESTATE % TOT LNS 64.83 48.8 81
Asset Quality – 07B
Source: Federal Financial Institutions Examination Council; UBPR

24
Asset Quality:
0.0%
2.0%
4.0%
6.0%
8.0%
10.0%
12.0%
14.0%
16.0%
18.0%
20.0%
1990 1991 1992 1993 1994 1995 1996 1997 1998 1999 2000 2001 2002 2003 2004 2005 2006 2007 2008 2009Q3
Nationwide Maryland
Source: FDIC US Bank Statistics
Noncurrent Rate on Real Estate and Construction Development Loans
…When the cycle turns against him, the best construction lender will see 10% of his
construction portfolio non-performing; the worst will see 100%.
Source: Robert Morris Associates training program 1976

25
Asset Quality – 07
LOAN & LSE % TOTAL CAPITAL BANK PG 3 PCTCONTRUCTION & DEVELOPMENT 278.76 92.11 95 1-4 FAMILY CONSTRUCTION 70.66 20.17 92 OTHER CONST & LAND DEVEL 208.1 67.99 941 - 4 FAMILY RESIDENTIAL 216.22 174.7 67 HOME EQUITY LOANS 28.5 26.62 55OTHER REAL ESTATE LOANS 230.99 284.53 32 FARMLAND 3.77 18.86 41 MULTIFAMILY 19.36 19.6 59 NON-FARM NON-RESIDENTIAL 207.86 232.75 43 OWNER OCCUPIED NFARM NRESID 42.68 115.03 11 OTHER NONFARM NONRESIDENTIAL 165.18 113.3 76 TOTAL REAL ESTATE 725.97 569.53 80 FINANCIAL INSTITUTION LOANS 0 N/A 95AGRICULTURAL LOANS 0.99 10.47 50COMMERCIAL & INDUSTRIAL LOANS 31.68 97.01 11LOANS TO INDIVIDUALS 9.61 25.31 28CREDIT CARD LOANS 0 0.48 69MUNICIPAL LOANS 0 3.5 41FOREIGN OFFICE LOANS & LEASES 0 N/A 99ALL OTHER LOANS 0 2.09 14LEASE FINANCING RECEIVABLES 12.26 0.37 95 SUPPLEMENTAL: LOANS TO FOREIGN GOVERNMENTS 0 N/A 99LOANS TO FINANCE COMM REAL EST 0 1.03 70 NONOWNER OCC COMML RE % TOT CAP 463.3 239 91TOTAL COMML REAL ESTATE % TOT CAP 505.98 359.56 79 CONSTRUCTION & DEVEL % TOT LNS 35.72 12.34 96NONOWNER OCC COMML RE % TOT LNS 59.36 32.21 92TOTAL COMML REAL ESTATE % TOT LNS 64.83 48.8 81
Source: Federal Financial Institutions Examination Council; UBPR

26
0
5
10
15
20
25
30
35
40
45
2006 2007 2008
% of
Tota
l Loa
ns
FSBK Peer Group 3
Source: UBPR 9/30/2009
Asset Mix / Construction LendingConstruction Loans as a % of Total Loans

27
% OF NON-CURR LN&LS BY LN TYPE BANK PG 3 PCT REAL ESTATE LNS-90+ DAYS P/D 0.34 0.18 77 -NONACCRUAL 1.75 3.16 37 -TOTAL 2.1 3.45 40 -30-89 DAYS P/D 0.74 1.38 38 CONST & LAND DEV-90+ DAYS P/D 0.73 0.16 87 -NONACCRUAL 1.64 7.94 32 -TOTAL 2.37 8.38 34 -30-89 DAYS P/D 0.43 1.71 47 1-4 FAM CONS & L DEV-90+ DAYS 0 0.07 88 -NONACCRUAL 1.53 6.74 51 -TOTAL 1.53 7.16 50 -30-89 DAYS P/D 1.49 1.42 70 OTHER CONST & LAND DEV-90+ DAYS 0.97 8.01 N/A -NONACCRUAL 1.68 1.46 39 -TOTAL 2.65 0.43 41 -30-89 DAYS P/D 0.07 N/A 46 SINGLE & MULTI MTG-90+ DAYS P/D 0.2 0.15 71 -NONACCRUAL 2.03 1.78 64 -TOTAL 2.24 2.03 64 -30-89 DAYS P/D 0.8 1.3 41 NON-FARM/RESI MTG-90+ DAYS P/D 0 0.09 71 -NONACCRUAL 1.61 1.8 55 -TOTAL 1.61 2.02 52 -30-89 DAYS P/D 1.1 0.93 66 OWN OCC NFARM NONRE-90+ DAYS P/D 0 0.07 80 -NONACCRUAL 0 1.6 28 -TOTAL 0 1.78 25 -30-89 DAYS P/D 0.27 0.84 45 OTH NONFARM NONRES-90+ DAYS P/D 0 0.05 83 -NONACCRUAL 2.03 1.61 68 -TOTAL 2.03 1.84 65 -30-89 DAYS P/D 1.31 0.79 75
Asset Quality – 08
Source: Federal Financial Institutions Examination Council; UBPR

28
Management – 03
Trend analysis in every category
CERT # 31084 DIST/RSSD: 05 / 883874 FIRST SOUTH BANK WASHINGTON, NC PAGE 03CHARTER # 0 COUNTY: NONINTEREST INCOME AND EXPENSES ($000) AND YIELDS 1/20/2010 14:28
9/30/2009 9/30/2008 12/31/2008 12/31/2007 12/31/2006
PERCENT OF AVERAGE ASSETS BANK PG 3 BANK PG 3 BANK PG 3 BANK PG 3 BANK PG 3PERSONNEL EXPENSE 1.63 1.46 1.53 1.54 1.52 1.53 1.54 1.57 1.54 1.57OCCUPANCY EXPENSE 0.29 0.38 0.29 0.4 0.29 0.4 0.29 0.4 0.27 0.4OTHER OPER EXP(INCL INTANGIBLES) 0.91 1.05 0.76 0.89 0.79 0.93 0.64 0.87 0.63 0.85 TOTAL OVERHEAD EXPENSE 2.83 2.92 2.59 2.86 2.6 2.91 2.47 2.85 2.44 2.84OVERHEAD LESS NONINT INC 1.85 2.11 1.57 2.01 1.63 2.05 1.47 1.98 1.51 1.96OTHER INCOME & EXPENSE RATIOS:
Source: Federal Financial Institutions Examination Council; UBPR

29
Earnings – 01
AVERAGE ASSETS ($000) 878,976NET INCOME ($000) 5,717NUMBER OF BANKS IN PEER GROUP 1,200EARNINGS AND PROFITABILITY BANK PG 3 PCTPERCENT OF AVERAGE ASSETS: INTEREST INCOME (TE) 5.74 5.17 86 - INTEREST EXPENSE 1.94 1.75 63 NET INTEREST INCOME (TE) 3.8 3.42 71 + NONINTEREST INCOME 0.98 0.75 71 - NONINTEREST EXPENSE 2.83 2.92 48 - PROVISION: LOAN&LEASE LOSSES 0.68 0.9 52 = PRETAX OPERATING INCOME (TE) 1.27 0.41 71 + REALIZED GAINS/LOSSES SEC 0.14 0.04 83 = PRETAX NET OPERATING INC (TE) 1.41 0.44 75 NET OPERATING INCOME 0.87 0.31 68 ADJUSTED NET OPERATING INCOME 0.96 0.6 61 NET INC ATTRIB TO MIN INTS 0 N/A 98 NET INCOME ADJUSTED SUB S 0.26 NET INCOME 0.87 0.31 68 MARGIN ANALYSIS: AVG EARNING ASSETS TO AVG ASSETS 95.18 93.63 68AVG INT-BEARING FUNDS TO AVG AST 78.83 81.72 29INT INC (TE) TO AVG EARN ASSETS 6.03 5.53 82INT EXPENSE TO AVG EARN ASSETS 2.04 1.87 60NET INT INC-TE TO AVG EARN ASSET 3.99 3.67 66
Source: Federal Financial Institutions Examination Council; UBPR

30
AVERAGE ASSETS ($000) 878,976NET INCOME ($000) 5,717NUMBER OF BANKS IN PEER GROUP 1,200LOAN & LEASE ANALYSIS BANK PG 3 PCTNET LOSS TO AVERAGE TOTAL LN&LS 0.69 0.85 55EARNINGS COVERAGE OF NET LOSS(X) 3.34 6.52 53LN&LS ALLOWANCE TO NET LOSSES(X) 2.4 4.32 47LN&LS ALLOW TO LN&LS NOT HFS 1.79 1.71 64LN&LS ALLOWANCE TO TOTAL LN&LS 1.77 1.7 64NON-CUR LN&LS TO GROSS LN&LS 1.98 3.07 42 LIQUIDITY NET NON CORE FUND DEPENDENCE 31.91 26.65 64NET LOANS & LEASES TO ASSETS 79.97 69.26 83 CAPITALIZATION TIER ONE LEVERAGE CAPITAL 9.33 8.79 66CASH DIVIDENDS TO NET INCOME 102.2 28.8 91RETAIN EARNS TO AVG TOTAL EQUITY -0.2 -0.31 37RESTR+NONAC+RE ACQ TO EQCAP+ALLL 34.11 30.11 67 GROWTH RATES ASSETS -3.71 6.2 12TIER ONE CAPITAL -0.61 5.39 25NET LOANS & LEASES -9.12 1.98 12SHORT TERM INVESTMENTS 631.39 216.2 85SHORT TERM NON CORE FUNDING 25.77 7.52 74
Earnings – 01
Source: Federal Financial Institutions Examination Council; UBPR

31
PERCENT OF AVERAGE ASSETS: BANK PG 3 PCT INTEREST INCOME (TE) 5.71 5.1 87 - INTEREST EXPENSE 1.77 1.63 60 NET INTEREST INCOME (TE) 3.95 3.48 74 + NONINTEREST INCOME 0.97 0.74 71 - NON-INTEREST EXPENSE 2.99 2.9 57 - PROVISION: LOAN&LEASE LOSSES 0.58 1.03 46 PRETAX OPERATING INCOME (TE) 1.35 0.36 72 + REALIZED GAINS/LOSSES SECS 0 0.04 62 PRETAX NET OPERATING INC (TE) 1.35 0.37 70 NET OPERATING INCOME 0.82 0.27 63 ADJUSTED NET OPERATING INCOME 1.09 0.56 64 NET INC ATTRIB TO MIN INTS 0 N/A 98 NET INCOME ADJUSTED SUB S 0.82 0.23 66 NET INCOME 0.82 0.27 63MARGIN ANALYSIS: INT INC (TE) TO AVG EARN ASSETS 5.98 5.47 80INT EXPENSE TO AVG EARN ASSETS 1.85 1.74 57NET INT INC-TE TO AVG EARN ASST 4.13 3.73 69 LOAN & LEASE ANALYSIS NET LOSS TO AVERAGE TOTAL LN&LS 0.38 1.02 40EARNINGS COVERAGE OF NET LOSS(X) 6.24 7.13 67LN&LS ALLOWANCE TO NET LOSSES(X) 4.6 4.82 67
Earnings – Annualized Quarter – 12
Source: Federal Financial Institutions Examination Council; UBPR

32
Liquidity – 10
PERCENT OF TOTAL ASSETS BANK PG 3 PCTSHORT TERM INVESTMENTS 2.92 5.5 35MARKETABLE EQUITY SEC (MES) 0.05 0.03 81CORE DEPOSITS 56.09 64.34 18S T NON CORE FUNDING 28.67 20.09 81 LIQUIDITY RATIOS NET S T NONCORE FUND DEPENDENCE 27.94 16.32 84NET NON CORE FUND DEPENDENCE 31.91 26.65 64BROKERED DEPOSITS TO DEPOSITS 0.13 5.73 32BROKER DEP MAT < 1YR TO BKR DEPS 0 69.38 2SHORT TRM INV TO S T NCORE FUND 10.18 31.58 25SHORT TERM ASSET TO S T LIABS 59.65 81.69 31NET S T LIAB TO ASSETS 21.78 7.46 85NET LOANS & LEASES TO DEPOSITS 95.38 84.8 76NET LN&LS TO CORE DEPOSITS 142.59 109.13 90NET LN&LS & SBLC TO ASSETS 80.12 69.8 82
Source: Federal Financial Institutions Examination Council; UBPR

33
LONG ASSETS INSTS W/ OPTIONS BANK PG 3 PCTMORTGAGE LOANS & PASS THRUS 26.46 16.68 82 LOANS & SECURITIES OVER 15 YRS 10.29 2.88 90 LOANS & SECURITIES 5-15 YRS 5.09 3.31 74 OTHER LOANS AND SECURITIES 64.33 65.34 44 LOANS & SECURITIES OVER 15 YRS 0.39 1.98 25 LOANS & SECURITIES 5-15 YRS 7.3 9.02 43TOTAL LOANS & SECURITIES OVR 15 10.68 5.58 80 OVERALL RISK INDICATORS AVAILABLE FOR SALE 10.69 15.32 36HELD TO MATURITY 0.07 1.01 62OFF BALANCE SHEET 11.95 11.92 55 UNREALIZED APPN/DEPN 0 0.02 73UNREAL APP/DEP % TIER ONE CAP 0 0.24 69 CONTRACTUAL MAT/REPRICE DATA LOANS/SECURITIES OVER 3 YEARS 38.59 35.89 56LIABILITIES OVER 3 YEARS 0.12 3.13 10 NET 3 YEAR POSITION 38.47 32.24 66 LOANS/SECURITIES OVER 1 YEAR 59.84 54.83 64LIABILITIES OVER 1 YEAR 5.31 11.81 22 NET OVER 1 YEAR POSITION 54.53 42.32 78 NON-MATURITY DEPOSITS 29.13 41.61 15NON-MATURITY DEPS % LONG ASSETS 75.49 129.86 16 NET OVER 3 YEAR POSITION 9.46 -5.59 80
Sensitivity to Market Risk – 09
Source: Federal Financial Institutions Examination Council; UBPR

34
Custom Peer Group
9/30/2009AVERAGE ASSETS 878,976NUMBER OF BANKS IN TABULATION 19
BANK PEER PCTEARNINGS AND PROFITABILITYPERCENT OF AVERAGE ASSETS: INTEREST INCOME (TE) 5.74 5 95 - INTEREST EXPENSE 1.94 1.9 50 NET INTEREST INCOME (TE) 3.8 3.1 90 + NONINTEREST INCOME 0.98 0.69 70 - NON-INTEREST EXPENSE 2.83 2.7 65 - PROVISION: LOAN&LEASE LOSSES 0.68 1.05 30 = PRETAX OPERATING INCOME (TE) 1.27 0.03 95 + SECURITIES GAINS (LOSSES) 0.14 0.09 65 = PRETAX NET OPERATING INC (TE) 1.41 0.12 95 NET OPERATING INCOME 0.87 0.08 95 ADJUSTED NET OPERATING INCOME 0.96 0.43 85 NET INC ATTRIB TO MIN INTS 0 0 95 NET INCOME ADJUSTED SUB S 0.08 NET INCOME 0.87 0.08 95
Source: Federal Financial Institutions Examination Council; UBPR

35
Comparison
Regulators rely on UBPR / CDR
Most investors, borrowers and investment banks
Subscribe to SNL Financial
Review Company SEC reporting documents
Construct ‘relevant’ comparison groups
Rely on GAAP

36
Ratios below “well capitalized” or those required by order or agreement
Capital growth rate is less than total asset growth rate
Ratios significantly different from peer ratios
Declining capital levels or ratios
Dividend payout ratio is significantly higher than peer ratios
Concentration in nontraditional activities
Significant growth in off-balance-sheet activities
The OCC’s “Canary Report” – Red Flags / Capital
Source: Detecting Red Flags In Board Reports A Guide for Directors , Office of the Comptroller of the Currency, Washington, D.C. October 2003
37
Significant increase in loans to total assets ratio
Significant increase in loans to equity ratio
Significant change in portfolio mix
Significant upward or downward trend in the percent of the ALLL to total loans and leases
High growth rates in total loans or within individual categories of loans
Significant increase in loan yields
Source: Detecting Red Flags In Board Reports A Guide for Directors , Office of the Comptroller of the Currency, Washington, D.C. October 2003
Red Flags / Asset Quality

38
Loan yields significantly higher than peer group
Downward trends in risk ratings among pass credits and/or increases in special mention or classified assets
Significant volume of retail loans that have been extended, deferred, renewed, or rewritten
Increasing levels of past-due and nonperforming loans as a percent of loans
Significant changes in the ALLL
Significant increases in ALLL provisions
Stable or declining ALLL at the same time net loan losses trend upward
Red Flags / Asset Quality
Source: Detecting Red Flags In Board Reports A Guide for Directors , Office of the Comptroller of the Currency, Washington, D.C. October 2003
39
Annual net charge-offs that exceed the balance in the ALLL
ALLL averages and percentages significantly different from the peer group’s
Increasing levels of other real estate owned
Loans identified by internal and external loan review that are not included in problem loan lists provided by management
Any significant changes in the above relative to historical performance, planned performance, or peer performance
Red Flags / Asset Quality
Source: Detecting Red Flags In Board Reports A Guide for Directors , Office of the Comptroller of the Currency, Washington, D.C. October 2003

40
Significant increases or decreases in noninterest income
Significantly higher or lower average personnel expenses than peer banks
Significant variances in the ROAA, ROE, or NIM from prior periods and as compared with peer group
Significant variances from budgeted amounts on income or expense items and balance sheet accounts
Red Flags / Earnings
Source: Detecting Red Flags In Board Reports A Guide for Directors , Office of the Comptroller of the Currency, Washington, D.C. October 2003

41
Significant increases in reliance on wholesale funding
Significant increases in large certificates of deposit, brokered deposits, or deposits with interest rates higher than the market
Significant increases in borrowings
Significant increases in dependence on funding sources other than core deposits
Declines in levels of core deposits
Significant decreases in short-term investments
Red Flags / Liquidity
Source: Detecting Red Flags In Board Reports A Guide for Directors , Office of the Comptroller of the Currency, Washington, D.C. October 2003

42
Capital falling below the level established by the board to support interest rate risk
Significant increases or decreases in the percent of long-term assets to total assets
Significant decrease in the percent of nonmaturity funding sources to long-term assets
High or increasing percent of asset depreciation to tier 1 capital
Red Flags / Market Risk
Source: Detecting Red Flags In Board Reports A Guide for Directors , Office of the Comptroller of the Currency, Washington, D.C. October 2003

43
Inconsistent with the bank’s budget or strategic plan
Significantly greater than that of peer banks, even if projected in the bank’s budget or strategic plan
Unaccompanied by an increasing level of and sophistication in risk management controls
Results in:
a higher risk profile than forecast
Declining capital levels or ratios that result from asset growth
Reliance on unstable or short-term funding sources to support growth
Based on Introduction of new products or activities with little or no expertise or inadequate risk management controls
Generated largely by brokered or agent transactions
Red Flags / Growth Management
Source: Detecting Red Flags In Board Reports A Guide for Directors , Office of the Comptroller of the Currency, Washington, D.C. October 2003

44
SUM M ARY INFORM ATION FOR BANKS IN STATE OF M ARYLAND STAVGAVERAGE FOR ALL INSURED COMMERCIAL BANKS IN STATE BANKS WITH ASSETS - $MILL 9/30/2009
9/30/2009 9/30/2008 12/31/2008 12/31/2007 12/31/2006 0-25 25-100 100+
EARNINGS AND PROFITABILITY
PERCENT OF AVERAGE ASSETS:
INTEREST INCOME (TE) 5.14 5.91 5.84 6.74 6.34 NA ## 5.23
- INTEREST EXPENSE 1.80 2.31 2.28 2.79 2.32 NA ## 1.85
NET INTEREST INCOME (TE) 3.32 3.57 3.53 3.92 4.04 NA ## 3.40
+ NONINTEREST INCOME 0.54 0.58 0.56 0.60 0.70 NA ## 0.51
- NON-INTEREST EXPENSE 3.08 3.20 3.25 3.37 3.15 NA ## 2.99
- PROVISION: LOAN&LEASE LOSSES 0.90 0.44 0.59 0.20 0.09 NA ## 0.91
= PRETAX OPERATING INCOME (TE) -0.25 0.55 0.30 1.01 1.57 NA ## -0.04
+ SECURITIES GAINS (LOSSES) 0.03 -0.02 -0.02 0.00 0.00 NA ## 0.03
= PRETAX NET OPERATING INC (TE) -0.24 0.49 0.24 0.99 1.56 NA ## -0.02
NET OPERATING INCOME -0.22 0.33 0.13 0.64 1.00 NA ## -0.01
ADJUSTED NET OPERATING INCOME 0.17 0.47 0.41 0.77 1.05 NA ## 0.29
NET INC ATTRIB TO MIN INTS N/A N/A N/A N/A N/A ## ## N/A
NET INCOME ADJUSTED SUB S -0.23 0.31 0.12 0.65 0.97 NA ## -0.02
NET INCOME -0.22 0.33 0.13 0.64 1.00 NA ## -0.01
Maryland State Average – All Insured Banks
Source: Federal Financial Institutions Examination Council; UBPR

45
SUM M ARY INFORM ATION FOR BANKS IN STATE OF M ARYLAND STAVGAVERAGE FOR ALL INSURED COMMERCIAL BANKS IN STATE BANKS WITH ASSETS - $MILL 9/30/2009
9/30/2009 9/30/2008 12/31/2008 12/31/2007 12/31/2006 0-25 25-100 100+
MARGIN ANALYSIS:
AVG EARNINGS ASSETS TO AVG ASSETS 93.94 94.04 94.29 94.23 94.13 NA ## 94.22
AVG INT-BEARING FUNDS TO AVG AST 78.35 76.46 76.28 76.03 75.70 NA ## 79.14
INT INC (TE) TO AVG EARN ASSETS 5.48 6.32 6.24 7.20 6.81 NA ## 5.56
INT EXPENSE TO AVG EARN ASSETS 1.92 2.45 2.41 2.95 2.46 NA ## 1.96
NET INT INC-TE TO AVG EARN ASSET 3.57 3.85 3.80 4.21 4.33 NA ## 3.60
LOAN & LEASE ANALYSIS:
NET LOSS TO AVERAGE TOTAL LN&LS 0.67 0.34 0.41 0.12 0.04 NA ## 0.72
EARNINGS COVERAGE OF NET LOSS(X) 4.74 21.05 10.81 53.05 113.90 NA ## 4.79
LN&LS ALLOW TO LN&LS NOT HFS 1.51 1.11 1.28 1.06 1.07 NA ## 1.48
LN&LS ALLOWANCE TO NET LOSSES(X) 4.44 10.88 5.92 30.73 44.43 NA ## 4.49
LN&LS ALLOWANCE TO TOTAL LN&LS 1.51 1.10 1.27 1.06 1.06 NA ## 1.47
Maryland State Average – All Insured Banks
Source: Federal Financial Institutions Examination Council; UBPR

46
SUM M ARY INFORM ATION FOR BANKS IN STATE OF M ARYLAND STAVGAVERAGE FOR ALL INSURED COMMERCIAL BANKS IN STATE BANKS WITH ASSETS - $MILL 9/30/2009
9/30/2009 9/30/2008 12/31/2008 12/31/2007 12/31/2006 0-25 25-100 100+
LIQUIDITY:
NET NON CORE FUNDING DEPENDENCE 28.03 27.59 29.47 23.97 18.03 NA ## 28.37
NET LOANS & LEASES TO ASSETS 74.25 76.28 76.52 75.17 70.98 NA ## 75.30
CAPITALIZATION
TIER ONE LEVERAGE CAPITAL 9.79 10.24 10.09 10.36 10.26 NA ## 9.33
CASH DIVIDENDS TO NET INCOME 27.04 58.05 42.79 40.42 29.33 NA ## 26.56
RETAIN EARNS TO AVG TOTAL EQUITY -3.91 -1.21 -2.39 1.92 5.80 NA ## -2.82
GROWTH RATES:
ASSETS 10.84 10.80 11.17 7.85 11.99 NA ## 9.59
TIER ONE CAPITAL 8.41 5.47 5.97 4.05 9.50 NA ## 7.88
NET LOANS & LEASES 6.94 14.53 13.63 12.68 12.99 NA ## 5.91
SHORT TERM INVESTMENTS 108.87 54.71 30.58 0.86 34.32 NA ## 116.93
SHORT TERM NON CORE FUNDING 28.39 23.50 25.03 22.26 72.95 NA ## 22.11
NON-CURRENT LOANS & LEASES:
TOTAL LN&LS-90+ DAYS PAST DUE 0.34 0.27 0.37 0.15 0.05 NA ## 0.37
- NONACCRUAL 2.67 1.31 1.65 0.65 0.34 NA ## 2.74
- TOTAL 3.16 1.64 2.07 0.84 0.43 NA ## 3.27
TOTAL ASSETS ($MILLIONS) 23,252 31,665 28,132 29,725 44,148 0 435 22,817
EQUITY CAPITAL ($MILLIONS) 2,340 2,945 2,760 2,941 4,827 0 124 2,215
NET INCOME ($ MILLIONS) -60 72 -76 213 538 0 -20 -40
NUMBER OF BANKS IN TABULATION 50 55 53 55 65 0 5 45
Maryland State Average – All Insured Banks
Source: Federal Financial Institutions Examination Council; UBPR

47
SUM M ARY INFORM ATION FOR BANKS IN STATE OF M ARYLAND STAVGAVERAGE FOR ALL INSURED COMMERCIAL BANKS IN STATE BANKS WITH ASSETS - $MILL 9/30/2009
9/30/2009 9/30/2008 12/31/2008 12/31/2007 12/31/2006 0-25 25-100 100+
TOTAL ASSETS ($MILLIONS) 23,252 31,665 28,132 29,725 44,148 0 435 22,817
EQUITY CAPITAL ($MILLIONS) 2,340 2,945 2,760 2,941 4,827 0 124 2,215
NET INCOME ($ MILLIONS) -60 72 -76 213 538 0 -20 -40
NUMBER OF BANKS IN TABULATION 50 55 53 55 65 0 5 45
Maryland State Average – All Insured Banks
Source: Federal Financial Institutions Examination Council; UBPR
48
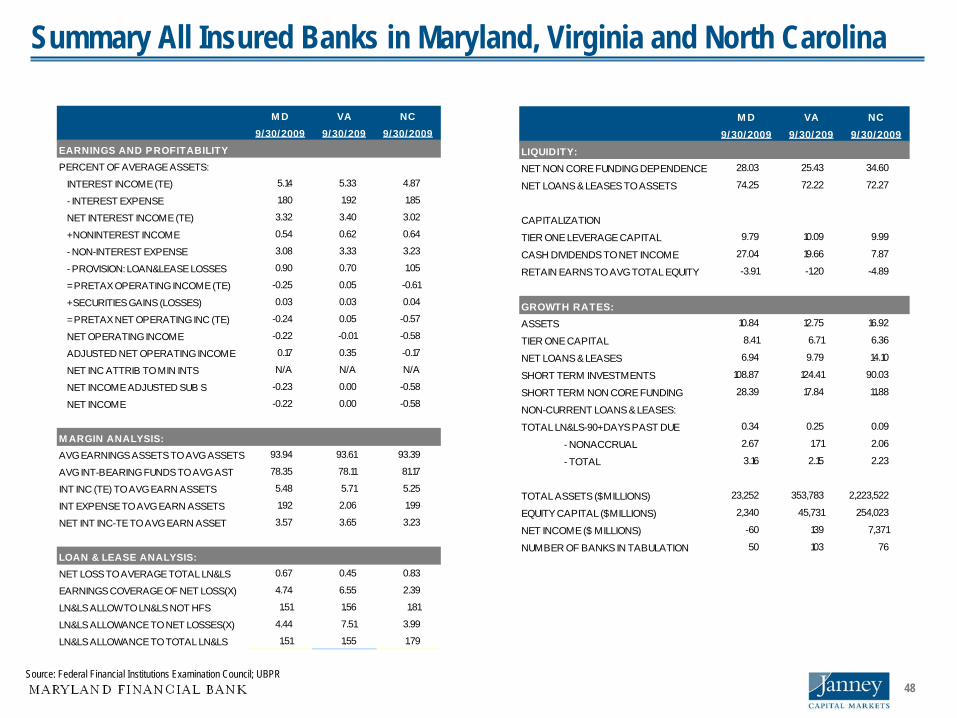
M D VA NC9/30/2009 9/30/209 9/30/2009
EARNINGS AND PROFITABILITY
PERCENT OF AVERAGE ASSETS:
INTEREST INCOME (TE) 5.14 5.33 4.87
- INTEREST EXPENSE 1.80 1.92 1.85
NET INTEREST INCOME (TE) 3.32 3.40 3.02
+ NONINTEREST INCOME 0.54 0.62 0.64
- NON-INTEREST EXPENSE 3.08 3.33 3.23
- PROVISION: LOAN&LEASE LOSSES 0.90 0.70 1.05
= PRETAX OPERATING INCOME (TE) -0.25 0.05 -0.61
+ SECURITIES GAINS (LOSSES) 0.03 0.03 0.04
= PRETAX NET OPERATING INC (TE) -0.24 0.05 -0.57
NET OPERATING INCOME -0.22 -0.01 -0.58
ADJUSTED NET OPERATING INCOME 0.17 0.35 -0.17
NET INC ATTRIB TO MIN INTS N/A N/A N/A
NET INCOME ADJUSTED SUB S -0.23 0.00 -0.58
NET INCOME -0.22 0.00 -0.58
M ARGIN ANALYSIS:
AVG EARNINGS ASSETS TO AVG ASSETS 93.94 93.61 93.39
AVG INT-BEARING FUNDS TO AVG AST 78.35 78.11 81.17
INT INC (TE) TO AVG EARN ASSETS 5.48 5.71 5.25
INT EXPENSE TO AVG EARN ASSETS 1.92 2.06 1.99
NET INT INC-TE TO AVG EARN ASSET 3.57 3.65 3.23
LOAN & LEASE ANALYSIS:
NET LOSS TO AVERAGE TOTAL LN&LS 0.67 0.45 0.83
EARNINGS COVERAGE OF NET LOSS(X) 4.74 6.55 2.39
LN&LS ALLOW TO LN&LS NOT HFS 1.51 1.56 1.81
LN&LS ALLOWANCE TO NET LOSSES(X) 4.44 7.51 3.99
LN&LS ALLOWANCE TO TOTAL LN&LS 1.51 1.55 1.79
M D VA NC9/30/2009 9/30/209 9/30/2009
LIQUIDITY:
NET NON CORE FUNDING DEPENDENCE 28.03 25.43 34.60
NET LOANS & LEASES TO ASSETS 74.25 72.22 72.27
CAPITALIZATION
TIER ONE LEVERAGE CAPITAL 9.79 10.09 9.99
CASH DIVIDENDS TO NET INCOME 27.04 19.66 7.87
RETAIN EARNS TO AVG TOTAL EQUITY -3.91 -1.20 -4.89
GROWTH RATES:
ASSETS 10.84 12.75 16.92
TIER ONE CAPITAL 8.41 6.71 6.36
NET LOANS & LEASES 6.94 9.79 14.10
SHORT TERM INVESTMENTS 108.87 124.41 90.03
SHORT TERM NON CORE FUNDING 28.39 17.84 11.88
NON-CURRENT LOANS & LEASES:
TOTAL LN&LS-90+ DAYS PAST DUE 0.34 0.25 0.09
- NONACCRUAL 2.67 1.71 2.06
- TOTAL 3.16 2.15 2.23
TOTAL ASSETS ($MILLIONS) 23,252 353,783 2,223,522
EQUITY CAPITAL ($MILLIONS) 2,340 45,731 254,023
NET INCOME ($ MILLIONS) -60 139 7,371
NUMBER OF BANKS IN TABULATION 50 103 76
Summary All Insured Banks in Maryland, Virginia and North Carolina
Source: Federal Financial Institutions Examination Council; UBPR

49
Themes for 2010 and beyond….
Competitive position
Capital
For growth
For stability
Control
External
Internal

50
Janney Montgomery Scott Contact Information
JMS Contact Telephone Email LocationCliff Booth, Head of FIG Practice 410-583-5992 [email protected] Baltimore / Philadelphia
Ed Losty, Head of Bank Practice 757-564-9737 / 215-665-4491 [email protected] Virginia / Philadelphia
Roger Powell, Managing Director 410-583-5993 / 215-665-6687 [email protected] Baltimore / Philadelphia
Jay Junior, Managing Director 215-665-4497 [email protected] Philadelphia

51
Off the Charts
Banks Out of the Woods? Maybe Not
By FLOYD NORRIS Published: February 26, 2010
MORE than $1 in every $10 that American banks have outstanding in loans is lent to a troubled borrower, a ratio far higher than…
Where do they get this stuff?