Embed Size (px)
Citation preview

UC BerkeleyConsortium on Deburring and Edge Finishing
TitleDeburring of Cross-Drilled Hole Intersections by Mechanized Cutting
Permalinkhttps://escholarship.org/uc/item/5d55v1d9
AuthorsAvila, Miguel C.Choi, JihongDornfeld, David Aet al.
Publication Date2004-05-31
eScholarship.org Powered by the California Digital LibraryUniversity of California

DEBURRING OF CROSS-DRILLED HOLE INTERSECTIONS BYMECHANIZED CUTTING
Avila, M. C., Choi, J., Dornfeld, D. A.
Laboratory for Manufacturing AutomationUniversity of California, Berkeley
Berkeley, California, United Statesmcavila, [email protected]
Kapgan, M., Kosarchuk, R.
JWDone CompanyHayward, California, United Statesmkapgan, [email protected]
ABSTRACT
Removal of burrs at cross-drilled holeintersections is often tedious and expensive dueto limited accessibility. Automated edge finishingof crossholes has been practiced successfullyusing robot-assisted, flexible abrasive brushdeburring, and non-traditional, mass finishingmethods such as electrochemical deburring(ECD), abrasive slurry, and thermal deburring.These methods are very efficient but mostrequire specialized equipment and dedicatedcleaning operations to remove chemicals ortrapped brush bristles. The Orbitool is an on-line, localized deburring alternative to brushesrecently developed by JWDone Company. TheOrbitool is a mechanized cutting tool withcarbide edges specifically designed forcrosshole deburring. Mechanized cuttingprovides greater selectivity and control ofdimensional specifications compared to brushingand mass finishing methods. Furthermore, it canbe implemented using existing machine toolequipment and cleaning procedures. As with anydeburring tool, its desired capability is burrremoval in the shortest time possible whilemeeting dimensional and surface qualityrequirements. To this end, process maps ofchamfer width and surface roughness of thedeburred edges, plotted against process
parameters, were developed in this study.Workpieces consisted of Al 6061 T6 bars withzero-offset, perpendicular cross-holes with adiameter of 7.94 mm (5/16 in.). The experimentswere conducted using Orbitools with a diameterof 6.35 mm (1/4 in.) and 36 cutting edges. Theeffect of the process inputs and their mutualinteraction was assessed using Taguchimethods. The results show that proper selectionof process parameters yield consistent andeffective removal of burrs at cross-drilledintersections while achieving surface roughnessvalues that range from 15 to 65 mm at thechamfers.
Keywords: aluminum, bore, burr, chamfering,deburring, drilling, edge finishing, intersectinghole, Orbitool.
INTRODUCTION
Burrs are defined as undesired projections ofmaterial beyond the theoretical edges of amachined component due to plastic deformation.Burrs at cross-drilled intersections are frequentlyfound in the production of automotive engineand transmission components. Burrs may affectdimensional tolerances, cause misalignments,and reduce the efficiency and service life of a

component. In many applications, cross-drilledholes act as conduits for lubrication and coolingfluids. Burrs may cause blockage of criticalpassages and turbulence in the flow of liquids orgases through the conduits, which might causeserious problems during service. Therefore, thedevelopment of effective deburring techniquesfor cross-drilled applications is of great interestin industry.
Gillespie (1975) has indicated that as much as30% of the manufacturing costs of precisioncomponents are incurred by edge finishing.Currently, despite the high degree ofautomation accomplished in general machiningprocesses, edge finishing of cross-holeintersections is tedious and may entail handdeburring techniques using dental instruments(Gillespie, 1975, 1990). The limited accessibilityand relatively complex geometry of holeintersections perplex automation of thedeburring stages, and quite often they becomebottlenecks in advanced manufacturing systems.
Traditional deburring methods can be classifiedinto global, or mass, methods, and localmethods (Dornfeld and Lisiewicz, 1992). Typicalglobal methods include: vibratory deburring,ultrasonic deburring, tumbling, electrochemicaldeburring, sand blasting, abrasive flow, andbrushing (Gillespie, 1975, 1990; Fistere, 1985;Koelsch, 1990). Global methods are veryefficient, but edge geometry and surface qualityare quite difficult to control. They may alsocontaminate the parts with chemical or abrasiveresidues. Broken bristles that get trapped insmall holes are often seen while using tubebrushes. These shortcomings make difficultsubsequent cleaning operations and addexpense. Furthermore, with the exception ofbrushing, which is flexible and fairly simple toautomate, global methods generally involvespecialized equipment, big capital investments,and “off-line” operation. In contrast, localdeburring methods are a selective means ofremoving the burrs because the point ofapplication of the tools can be controlled. Themost common local processes include handdeburring and mechanized cutting. Despiteseveral efforts to automate local deburringoperations using feedback control andmechanized cutting (see, for example Gillespie,1990, Dornfeld and Lisiewicz, 1992), handdeburring is still relied upon when goodconsistency and tight tolerances are required onsurfaces with complex geometries and difficult
accessibility such as hole intersections.Surprisingly, very little work has focused ondeburring of crossholes (Ohshima et al., 1993,using ball burnishing techniques). To the best ofthe authors’ knowledge, no dedicated work hasbeen carried out in the study of local,mechanized cutting deburring methods intendedfor cross-drilled hole intersections.
Recently, JWDone company developed the“Orbitool” a local deburring tool speciallydesigned for cross-drilled hole intersections. It isintended for machine tool usage in on-lineconfigurations. In this study, a full factorialdesign of experiments was applied to determinethe effect of process parameters on chamfersize and surface roughness of the deburrededges. Sensitivity analysis using Taguchimethods was performed to asses the effect ofinput parameters on chamfer size and theirmutual interaction.
THE ORBITOOL
The Orbitool is a mechanized cutting deburringtool designed to selectively create a chamfer onthe edges of cross-drilled hole intersections, andremove the burrs formed therein, while causingvirtually no damage to the surfaces of the holes.It consists of the following parts: (1) semi-spherical carbide cutter, (2) polished steelprotective disk, (3) tool-steel shaft, (4) elastomerflexible coupling, and (5) drive shaft (Figure 1).
(2) (1) (3) (4) (5)
FIGURE 1. THE ORBITOOL AND ITSCOMPONENTS.
Figure 2 depicts the standard tool path of theOrbitool. To perform the deburring operation, thetool is first inserted into the smallest diameterhole of the intersection, following the axis of the
Disk(polishedsteel)
Shapedcutter(carbide)
Shaft(toolsteel)
Flexiblecoupling(elastomer)
Driveshaft

FIGURE 2. OVERWIEW OF THE ORBITOOLPATH. (a) INSERTION INTO HOLE, (b) LOADING,(c) START OF MACHINING, ROTATION ANDINTERPOLATION, (d) END OF MACHINING (e)WITHDRAWAL.
hole, and positioned in such a way that the tip ofthe tool is as close as possible to theintersection (a). Then, the tool is movedtowards the surface of the hole, until the axis of
the tool coincides with the diameter ofinterpolation (b). The resultant load between thetool and the workpiece is a function of thestiffness of both the elastomeric coupling andthe tool shaft. At this stage, only the protectivedisk is making contact with the surface of thehole. The tool is then spun on its own axis andinterpolated following a helical path, inward intothe hole (c). As the tip of the tool reaches theintersection, the carbide cutter makes contactwith the edge and the cutting process begins.Once the entire profile of the cutter hastraversed the intersection (d), the tool isstopped, brought back to the centerline of thehole, and withdrawn (e).
TOOLPATH AND DEBURRING PROCESSPARAMETERS
Figure 3 presents a schematic view of processparameters and toolpath of the deburringprocess. The standard Orbitool toolpath consistsof a helix, with respect to a frame of referenceon the workpiece. The helical interpolation isdefined by the diameter of interpolation Di andthe helical pitch P. Di depends on the geometryof both the workpiece and the tool, namely:
Rotation
Interpolation
Holeintersection
Orbitool
(a)
(c)
(d) (e)
(b)
FIGURE 3. ORBITOOL DEBURRING PROCESSPARAMETERS. Di: DIAMETER OF HELICALINTERPOLATION, P: HELICAL PITCH, L: SHAFTLENGTH, C : COUPLING TYPE, Dc: CUTTERDIAMETER, n : FLUTE COUNT, N : SPINDLESPEED, F: FEEDRATE.
P
F
N
L
C
Di
Dc
n

Di = D – Ds – d (1)
where D is the diameter of the hole, D s thediameter of the tool shaft, and d a diametricalclearance intended to reduce rubbing betweenthe shaft and the workpiece (Figure 4). P definesthe number of tool passes along the intersection.Small P values increase tool dwell and materialremoval rate. The length of the tool shaft L andthe diameter of the cutter Dc also depend on thegeometry of the workpiece. L affects the bendingstiffness of the cutter, and should be adjusted sothat the entire profile of the cutter is capable ofreaching the burr-prone areas of the cross-holeintersection. However, L should be set as shortas possible to prevent excessive tool runout. Onthe other hand, the size of the cutter should besmall enough to fit into the hole and interpolatefreely, but large enough to maximize effectivecutting speed and material removal rate. ndenotes the number of flutes in the cutter. Acoarse flute count yields better efficiency butlower surface quality compared to a fine flutecount. C represents the type of flexible joint,which is characterized by its bending stiffnessand its mass. C affects the cutting loads andmaterial removal rate. Kinematical parameters ofthe deburring process are translational(interpolation) speed or feedrate F and rotationalspeed N.
FIGURE 4. SCHEMATIC VIEW OF INTERSECTINGHOLE DIAMETER (D ) , DIAMETER OFINTERPOLATION (Di), AND HEIGHT OF HELICALPATH (H).
The duration of a deburring operation, denoted t,depends on the length of the helical toolpath,and the speed of interpolation along the path.The length of the path depends on the diameterof interpolation, helical pitch, and height ofhelical path H. Cycle time is calculated from thefollowing expression:
(2)
SELECTION OF PROCESS PARAMETERSFOR OPTIMAL DEBURRING
Special care should be practiced in the selectionof deburring process parameters, in order toassure thorough burr removal, that dimensionaltolerances are met, and to satisfy surface qualityrequirements. For example, excessive dwellingor too slow feedrate can lead to unduechamfering of the edges. Likewise, insufficientdwelling or too slow rotational speed may notremove the burrs at all. In most instances, it isdesirable to machine off the least amount ofmaterial necessary to completely, andconsistently, remove the burrs. Evidently, theoptimum chamfer size or material removal issubject to the dimensions of the burrs,specifically, their root thickness. Hence, tominimize chamfering during the deburring stage,prior drilling processes must yield limited andrepeatable burr sizes.
Process maps showing the dependence ofchamfer size and surface quality on inputparameters allow the process engineer to selectthe appropriate set of conditions, based ondesign specifications and burr root thicknessesformed during upstream drilling operations. Inthis study, chamfer size and surface roughnesscharts were developed, specifically for deburringof Al 6061-T6 using an Orbitool with a semi-spherical carbide cutter of 6.35 mm (1/4 in.) indiameter and with 36 cutting edges.
Cycle time constraints are also critical during theselection of process parameters. It is desirableto minimize H so that no time is spared duringthe deburring cycle. To this end, the tip or disc ofthe Orbitool shall be placed by rapid-movedirectly above the intersection, point A, asshown in Figure 4. Additionally, the deburringpath can be finalized before the profile of thecarbide traverses the entire intersection, at point
√(P2 + "2Di2)H
P Ft =
B
H:heightofhelicalpath
Di = D-Ds -d
D
Ds
A

B, because burrs may not exist beyond certainregions due to the increase in exit angle. Thecycle time abacus shown in Figure 5, whichstems from Equation (2), provides a usefulmeans of estimated deburring times given H, P,Di , and F.
FIGURE 5. CYCLE TIME CONTOUR PLOT AS AFUNCTION OF F, P, Di, AND H.
EXPERIMENTAL FRAMEWORK
A full factorial experiment design was usedinitially to investigate the mechanized, localdeburring process of intersecting holes using theOrbitool. A full factorial scheme was justified bythe unknown response of output parametersfrom the Orbitool deburring technique. The goalof the experiments was to assess the effect ofprocess input factors on chamfer size andsurface roughness. The controllable inputfactors varied were: flexible coupling type (C),tool shaft length (L), helical pitch (P), feedrate(F) and spindle speed (N). On the other hand,the diameter (Dc), and number of flutes of thecutter (n ), were fixed throughout theexperiments. Table 1 shows the test matrix withcontrol factors and corresponding levels.
Test samples were manufactured from Al 6061-T6 bars. 22 cross-holes were drilled in eachsample (Figure 6). The geometric characteristicsof the hole intersections are indicated in Table 2.
The deburring experiments were performedusing a Matsuura MC-510V CNC verticalmachining center. Dry cutting was chosen
because the Orbitool deburring processgenerally involves low material removal ratesand low heat generation. Each combination offactors was executed twice to assure statisticalsignificance.
TABLE 1. CONTROL FACTORS OF FULL-FACTORIAL EXPERIMENT DESIGN.
Factors Levels
Cutting tooldiameter (Dc)
Dc = 6.35 mm (1/4 in.)
Number of cuttingedges (n) n = 36
Stiffness: 1.8 N ◊m/ degC1Mass: 34.12 g
Stiffness: 3.2 N ◊m/ deg
Coupling type (C)
C2Mass: 63.02 g
L1 = 51 ( 2.0 in.)Shaft length (L)(mm) L2 = 102 (4.0 in.)
P1 = 0.05 (0.002 in.)
P2 = 0.36 (0.014 in.)
P3 = 0.66 (0.026 in.)
P4 = 0.96 (0.038 in.)
Helical Pitch (P)(mm)
P5 = 1.27 (0.050 in.)
F1 = 0.33 (13 in./min)
F2 = 2.7 (106 in./min)Feedrate (F)(m/min)
F3 = 5.0 (198 in./min)
N1 = 2000
N2 = 4000
N3 = 6000
Spindle Speed (N)(rpm)
N4 = 8000

FIGURE 6. Al 6061-T6 TEST SAMPLE.
TABLE 2. GEOMETRIC CHARACTERISTICS OFHOLE INTERSECTIONS.
Geometriccharacteristic
Value
Hole diameter 7.94 mm (5/16 in.)
Cross-hole tointersecting holediameter ratio
1
Angle of intersection 90∞
Offset distance 0.0 mm (0.00 in.)
The projected width of the chamfers Wc wasselected as a metric of chamfer size in order tosimplify measurement. The projected width wasmeasured by means of an optical coordinatemeasuring machine. Measurements were takenat the diametrically opposed points were theangle of the edges in the meridional view isequal to 90∞; both valued were averaged. Atthese points, the exit angle of the drill is 90∞.With the geometric characteristics shown inTable 2, 90∞ is the minimum exit angle alongthe intersection, and maximum burr formationtakes place at these points. This is explained bythe fact that burr size increases monotonicallywith decreasing exit angle (Kim et al., 1999).For successful deburring, the amount ofchamfering must be at least equal to the rootthickness of the largest burrs along theintersection. Hence, measurements of chamferwidth were taken at the aforementioned points.Contour process maps were developed byplotting the Wc data against the control factors.In addition, to better understand the effect ofeach of the control factors on Wc and their
mutual interaction, and to distinguish the factorsthat have the strongest and weakest effects onprocess output, marginal mean graphs wereplotted using Taguchi robust design methods.An L16 orthogonal array (25 fractional factorialdesign with resolution V) was chosen to performthe analysis.
FIGURE 7. PROJECTED SIZE OF CHAMFER.
Surface roughness was gauged on the edgescorresponding to L1 and C2 conditions only. Raand Rt roughness values were measured usinga Veeco optical interferometer. Samplingbeams were focused on one of the 90∞ exitangle areas of the intersections. Within eachsampling window, 3 profiles perpendicular to thetool marks were recorded and their Ra and Rtroughness values averaged. Replication was notexercised in the roughness measurementsbecause good repeatability was observed.
RESULTS AND DISCUSSION
Figures 8, 9 and 10 show contour plots ofchamfer size as a function of spindle speed andhelical pitch, using feedrates F1, F2, and F3,respectively. The graphs correspond to the L2-C2 condition (long shaft, stiff coupling). Anumber of significant features can be discussedabout the behavior of the Orbitool deburringprocess. First, one key result is the monotonicresponse of W c vs. P and N . Chamferingincreases with increasing rotational speed andwith decreasing helical pitch. This samebehavior was seen throughout all testingconditions. Second, the increase in chamferwidth as rotational speed increases becomesless important as N approaches 8000 rpm. Thisbehavior suggests that dynamic effects of thetool’s rotating mass above 8000 rpm mayreduce chamfering efficiency. Third, a
Chamferwidth Wc

comparison between the three graphs illustratesthat material removal decreases with increasingfeedrate. It is worth noting, however, that thedecrease in chamfer width becomes modest asthe feedrate is varied from F2 to F3. This resultis quite advantageous, as faster cycle times canbe realized while incurring low reduction inchamfering efficiency. Likewise, the 2 latterresults were evidenced across all testingconditions.
FIGURE 8. PROJECTED CHAMFER WIDTH Wc ASA FUNCTION OF HELICAL PITCH (P) ANDSPINDLE SPEED (N). INTERPOLATION SPEED(F1) = 0.33 m/min, SHAFT LENGTH (L2) = 102 mm,C= C2. ALSO SHOWN: TOP-VIEW PHOTOGRAPHSOF HOLE INTERSECTION WITH EXCESSIVEOVERCUT (TOP) AND INSUFICIENT CHAMFERINGFOR BURR REMOVAL (BOTTOM).
The photographs in Figure 8 show the extremecases when chamfering is either too pronouncedor too small, relative to the cross-holedimensions (7.94 mm (5/16 in.) in diameter), andmaximum burr root thickness of the samples(approx. 0.20 mm (0.008 in.)), respectively. Thefirst case corresponds to the uppermost band ofthe Wc contour chart, where cutting conditionsyield projected chamfer widths greater than 1.20mm (0.047 in.). Although such overcut causesbore damage in the geometry tested, as shownin the top photograph, it should be noted thatthis is not the case in larger geometries with burrthicknesses approaching 1 mm. In the bottomphotograph, the opposite scenario is evidenced.Chamfering is too small relative to burr root
0.051 0.356 0.660 0.965 1.2702000
4000
6000
8000
P (mm)
N (r
pm)
F1-L2-C2
1.2-1.41-1.20.8-10.6-0.80.4-0.60.2-0.40-0.2
Wc (mm)
Bore damage
Burrs not removed
FIGURE 9. PROJECTED CHAMFER WIDTH Wc ASA FUNCTION OF HELICAL PITCH (P) ANDSPINDLE SPEED (N). INTERPOLATION SPEED(F2) = 2.7 m/min, SHAFT LENGTH (L2) = 102 mm.,C = C2.
0.051 0.356 0.660 0.965 1.2702000
4000
6000
8000
P (mm)
N (r
pm)
F2-L2-C2
0.8-10.6-0.80.4-0.60.2-0.40-0.2
Wc (mm)
FIGURE 10. PROJECTED CHAMFER WIDTH Wc ASA FUNCTION OF HELICAL PITCH (P) AND SPINDLESPEED (N). INTERPOLATION SPEED (F3) = 5.0m/min., SHAFT LENGTH (L2) = 102 mm, C = C2.
0.051 0.356 0.660 0.965 1.2702000
4000
6000
8000
P (mm)
N (r
pm)
F3-L2-C2
0.8-10.6-0.80.4-0.60.2-0.40-0.2
Wc (mm)
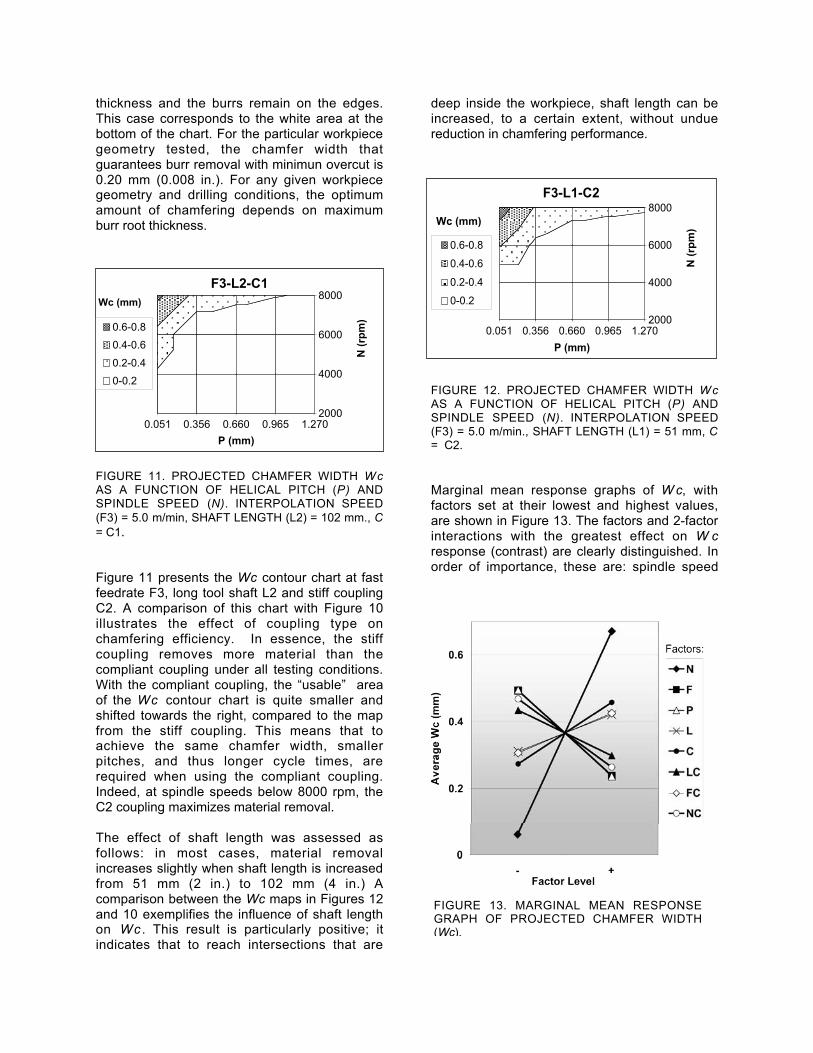
thickness and the burrs remain on the edges.This case corresponds to the white area at thebottom of the chart. For the particular workpiecegeometry tested, the chamfer width thatguarantees burr removal with minimun overcut is0.20 mm (0.008 in.). For any given workpiecegeometry and drilling conditions, the optimumamount of chamfering depends on maximumburr root thickness.
FIGURE 11. PROJECTED CHAMFER WIDTH WcAS A FUNCTION OF HELICAL PITCH (P) ANDSPINDLE SPEED (N). INTERPOLATION SPEED(F3) = 5.0 m/min, SHAFT LENGTH (L2) = 102 mm., C= C1.
Figure 11 presents the Wc contour chart at fastfeedrate F3, long tool shaft L2 and stiff couplingC2. A comparison of this chart with Figure 10illustrates the effect of coupling type onchamfering efficiency. In essence, the stiffcoupling removes more material than thecompliant coupling under all testing conditions.With the compliant coupling, the “usable” areaof the Wc contour chart is quite smaller andshifted towards the right, compared to the mapfrom the stiff coupling. This means that toachieve the same chamfer width, smallerpitches, and thus longer cycle times, arerequired when using the compliant coupling.Indeed, at spindle speeds below 8000 rpm, theC2 coupling maximizes material removal.
The effect of shaft length was assessed asfollows: in most cases, material removalincreases slightly when shaft length is increasedfrom 51 mm (2 in.) to 102 mm (4 in.) Acomparison between the Wc maps in Figures 12and 10 exemplifies the influence of shaft lengthon Wc . This result is particularly positive; itindicates that to reach intersections that are
deep inside the workpiece, shaft length can beincreased, to a certain extent, without unduereduction in chamfering performance.
FIGURE 12. PROJECTED CHAMFER WIDTH WcAS A FUNCTION OF HELICAL PITCH (P) ANDSPINDLE SPEED (N). INTERPOLATION SPEED(F3) = 5.0 m/min., SHAFT LENGTH (L1) = 51 mm, C= C2.
Marginal mean response graphs of W c, withfactors set at their lowest and highest values,are shown in Figure 13. The factors and 2-factorinteractions with the greatest effect on W cresponse (contrast) are clearly distinguished. Inorder of importance, these are: spindle speed
0.051 0.356 0.660 0.965 1.2702000
4000
6000
8000
P (mm)
N (r
pm)
F3-L1-C2
0.6-0.8
0.4-0.6
0.2-0.4
0-0.2
Wc (mm)
0.051 0.356 0.660 0.965 1.2702000
4000
6000
8000
P (mm)
N (r
pm)
F3-L2-C1
0.6-0.8
0.4-0.6
0.2-0.4
0-0.2
WWc (mm)
FIGURE 13. MARGINAL MEAN RESPONSEGRAPH OF PROJECTED CHAMFER WIDTH(Wc).

(N), helical pitch (P ), feedrate (F), spindlespeed-coupling type (N-C) interaction, couplingtype (C), and shaft length-coupling type (L-C)interaction. It comes as no surprise that spindlespeed is, by far, the control factor with thehighest contrast. Wc response is also sensitiveto helical pitch, because this factor determinesthe degree of overlap between tool passes alongthe hole intersection. Likewise, mean responseis sensitive to feedrate when varied from F1 toF3. However, this response flattens considerablyif levels are set at F2 and F3. Consequently, it isadvised to adjust F, as opposed to P, to satisfycycle time constraints. In contrast to the othermain factors, it is verified that shaft length (L)has a relatively weak effect on Wc. Apart fromN-C and L-C, it is found that 2-factor interactionshave a weak effect on mean Wc response.
The contrast displayed by the N-C and L-Cinteractions can be further explored by studyingtheir interaction graphs, which are shown inFigures 14 and 15, respectively. In Figure 14, itis observed that the increase in materialremoval as spindle speed increases, becomes
greater when the stiff coupling is used. On theother hand, the L-C interaction chart displaysopposing slopes of the response curves. Withthe stiff coupling, an increase in shaft lengthenhances material removal, whereas with thecompliant coupling, an increase in L slightlylowers material removal. Both behaviors derivefrom the dynamic effects of the mass of thecoupling and the leverage provided by the shaft.The centrifugal force generated by the stiffcoupling, which is almost twice as heavy as thecompliant coupling, aids material removal.Ultimately, as spindle speed is increased, thechamfering enhancement produced by the stiff
coupling stems from its mass, and not from itsstiffness.
FIGURE 15. L-C INTERACTION GRAPH.
Figures 16 and 17 show the effect of cuttingparameters on surface roughness Rt of thechamfered surfaces. Surface roughnessincreases monotonically with increasing spindlespeed and helical pitch. On the other hand,roughness decreases slightly when interpolationspeed is changed from 0.33 m/min (13 in./min)to 2.7 m/min (106 in./min), but then increasesconsiderable at F = 5.0 m/min (198 in./min).This result should be taken into considerationwhenever interpolation speeds need to beincreased to reduce cycle times. A goodcompromise between surface quality and cycletime is achieved at a feedrate of 2.7 m/min.
FIGURE 16. SURFACE ROUGHNESS Rt OFCHAMFERED EDGES AS A FUNCTION OFSPINDLE SPEED AND FEEDRATE. L = 51 mm, C =C2, P = 0.05 mm.
FIGURE 14. N-C INTERACTION GRAPH.

FIGURE 17. SURFACE ROUGHNESS Rt OFCHAMFERED EDGES AS A FUNCTION OFHELICAL PITCH. L = 51 mm., C = C2.
CONCLUSION
Experimental data of chamfer size and surfaceroughness were gathered to study themechanized deburring process of cross-drilledintersections using the 6.35 mm (1/4 in.)Orbitool. Process maps for the selection ofcutting conditions based on given burr rootthickness and surface quality requirements weredeveloped. The results are summarized asfollows:
(1) Mechanized deburring with the Orbitool is aviable alternative to abrasive brush deburring.It offers improved control on chamfering,good consistency, and minimal bore surfacedamage. The technique is ideally suited forimplementation in conventional machinetools, and does not contaminate theworkpieces.
(2) Material removal at the hole intersectionedges is mostly driven by rotational speed ofthe Orbitool, from 2000 to 8000 rpm, followedby helical pitch of the toolpath. The largestchamfers were obtained at 8000 rpm,however, the increase in chamfer size ceasesasymptotically due to dynamic effects asspindle speed approaches 8000 rpm.Chamfering efficiency decreases withincreasing helical pitch.
(3) Interpolation speed has a weak effect onmaterial removal from 2.7 to 5.0 m/min. To
satisfy cycle time constraints, it isrecommended to adjust feedrate instead ofhelical pitch. It is also encouraged to attemptinterpolation speeds above 5 m/min, since nolarge drops in chamfering efficiency areexpected.
(4) The optimum chamfer size for a givendeburring process is the minimum necessaryfor consistent burr removal, and it dependson the root thickness of the burrs.
(5) Dynamic effects of coupling mass influencematerial removal to a greater degree thanstatic coupling stiffness. These effectsenhance chamfering in the 2000 to 8000 rpmrange , however , t hey becomecounterproductive above 8000 rpm. At suchspindle speeds, elimination of the flexiblecoupling is recommended to reduce rotationalmass.
(6) Rt roughness worsens with increasing spindlespeed, helical pitch, and feedrate. Betweenfeedrates of 0.33 and and 5.0 m/min, Rtreaches a minimum. Observed values werebetween 15 and 75 mm.
Cycle time of deburring operations performed inmachine tools is particularly critical because theshare of machine tool uptime for value-addedoperations must be maximized. To reduceoperation time, testing of non-helical tool pathsand interpolation speeds above 5 m/min areunderway. Orbitools with less than 36 cuttingedges are also tested to obtain higher materialremoval rates.
ACKNOWLEDGMENT
This research is supported by JWDoneCompany and the members of the Consortiumon Deburring and Edge Finishing (CODEF).
REFERENCES
Dornfeld, D., Lisiewicz, V. (1992), “AcousticEmission Feedback for Precision Deburring”CIRP Annals, Vol. 41, No. 1, pp. 93-96.
Fistere, Howard C. (1985), “DeburringCrossholes”, Die Casting Engineer, Vol. 29 No.1, pp. 30-32.

Gillespie (1975), “Hand Deburring of PrecisionMiniature Parts”, Bendix Aerospace, KansasCity Division Report No BDX 613-1443.
Gillespie, L. K., (1990), “Deburring and SurfaceFinishing: The Past Ten Years and Projectionsfor the Next Ten Years”, Proc. Deburring Salon,Burr, Edge, and Surface Technology, Japan,Japan Society of Precision Engineers, Nagoya,Japan.
Kim, J., Dornfeld, D., Furness, R. (1999),“Experimental Study of Burr Formation in Drillingof Intersecting Holes With Gun and Twist Drills”,Tech Papers SME/NAMRI, pp. 39-44.
Koelsh, J. R., (1990), “Banish ManualDeburring”, Manufacturing Engineering, Vol. 105No. 1, pp. 71-75.
Ohshima, I., Maekawa, K., Murata, R. (1993),“Burr Formation and Deburring in Drilling CrossHoles”, Journal of the Japan Society of PrecisionEngineering, Seimitsu Kogaku Kaishi. Vol. 59No. 1, January, pp.155-160.