Embed Size (px)
Citation preview
UC San DiegoUC San Diego
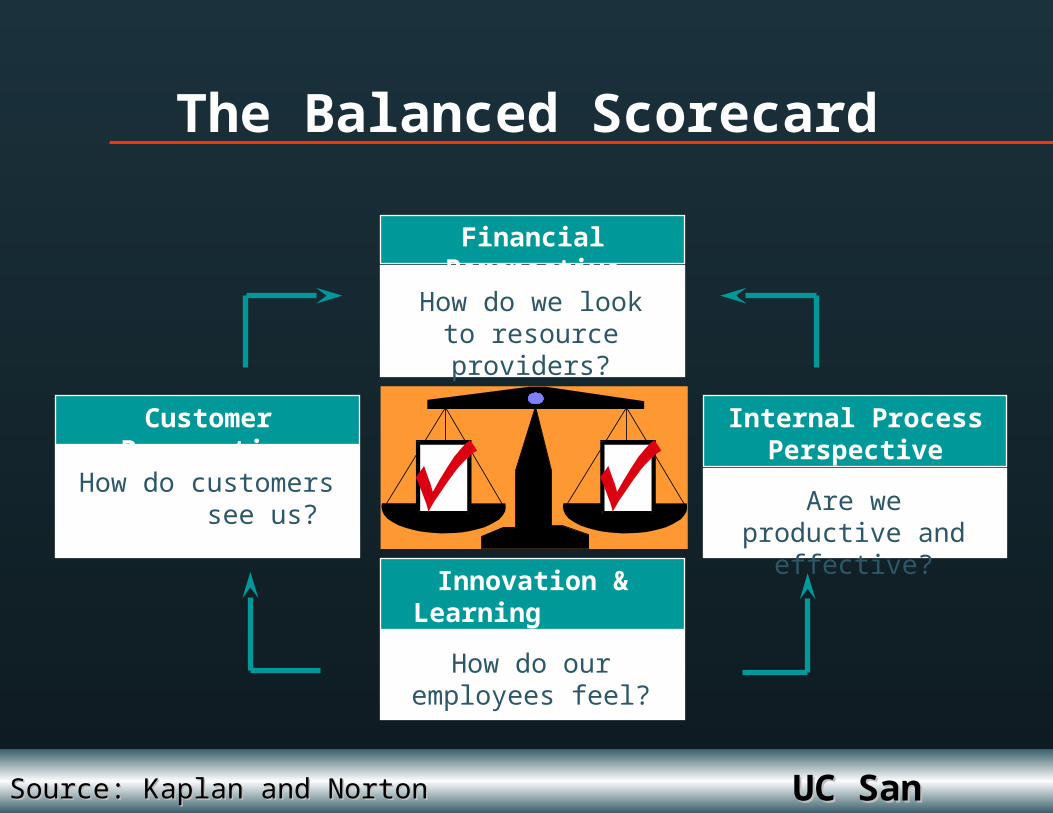
Financial Perspective
How do we look to resource providers?
Customer Perspective
How do customers see us?
Internal Process Perspective
Are we productive and effective?
Innovation & Learning Perspective
How do our employees feel?
The Balanced Scorecard
Source: Kaplan and NortonSource: Kaplan and Norton
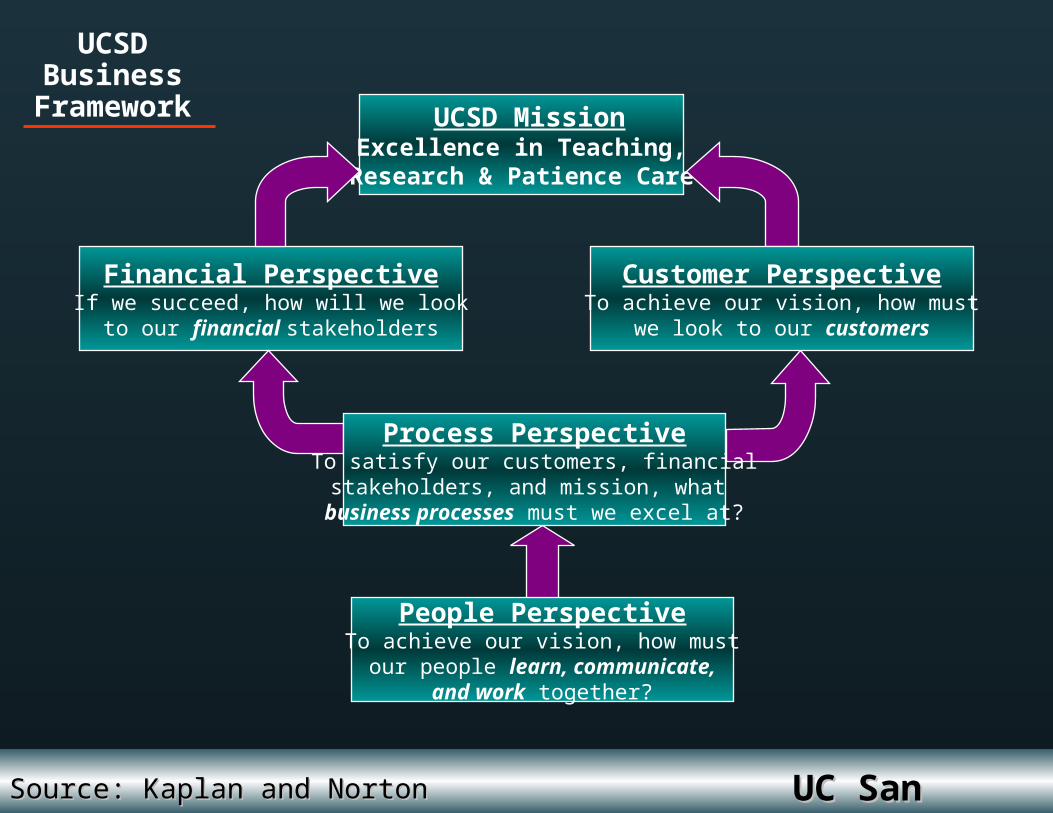
UCSD MissionExcellence in Teaching,
Research & Patience Care
Financial PerspectiveIf we succeed, how will we lookto our financial stakeholders
UCSDBusiness
Framework
Customer PerspectiveTo achieve our vision, how must
we look to our customers
Process PerspectiveTo satisfy our customers, financialstakeholders, and mission, what
business processes must we excel at?
People PerspectiveTo achieve our vision, how mustour people learn, communicate,
and work together?
Source: Kaplan and NortonSource: Kaplan and Norton UC San DiegoUC San Diego
UC San DiegoUC San Diego
Strategic Game Plan
• Within limited resources, maintain the most critical support services that will sustain the excellence of the University’s academic and clinical programs.
• Simplify procedures and reduce workload for academic and clinical departments.
• Provide our customers with intuitive and flexible tools so they can be successful.
UC San DiegoUC San Diego
• Reduce cycle time and improve the performance of our essential support services to students, faculty, and staff.
• Provide appropriate development opportunities for University staff.
• Enhance the University’s system of financial controls so we maintain the public trust of our stewardship of campus resources.
Strategic Game Plan
UC San DiegoUC San Diego
• Disseminate, promote, and put into action UC San Diego’s Principles of Community.
• Enhance methods of communicating with our key customers.
• In the area of technology, migrate the campus to a set of standard protocols and tools that will allow for improved customer support in the future.
Strategic Game Plan
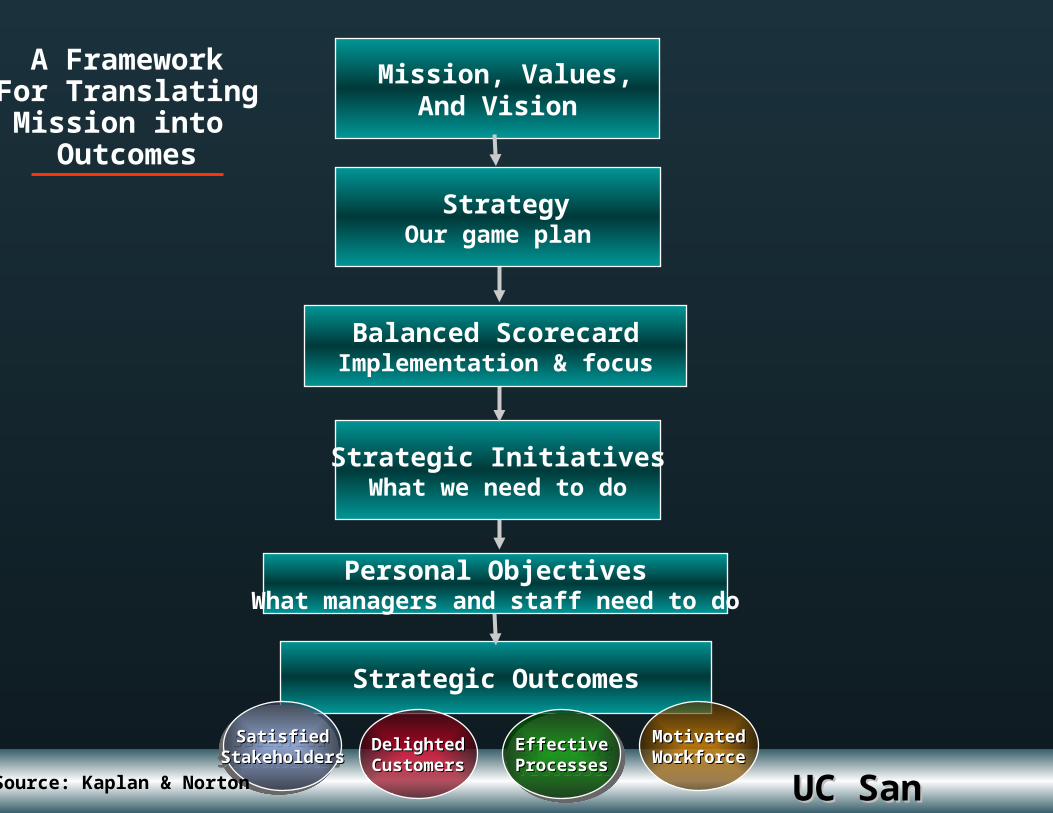
Strategic InitiativesWhat we need to do
Personal ObjectivesWhat managers and staff need to do
Strategic Outcomes
StrategyOur game plan
Balanced ScorecardImplementation & focus
A FrameworkFor Translating
Mission into Outcomes
DelightedDelightedCustomersCustomers
MotivatedMotivatedWorkforceWorkforceEffectiveEffective
ProcessesProcessesEffectiveEffective
ProcessesProcessesSatisfiedSatisfied
StakeholdersStakeholdersSatisfiedSatisfied
StakeholdersStakeholders
Source: Kaplan & Norton
Mission, Values,And Vision
UC San DiegoUC San Diego
UC San DiegoUC San Diego
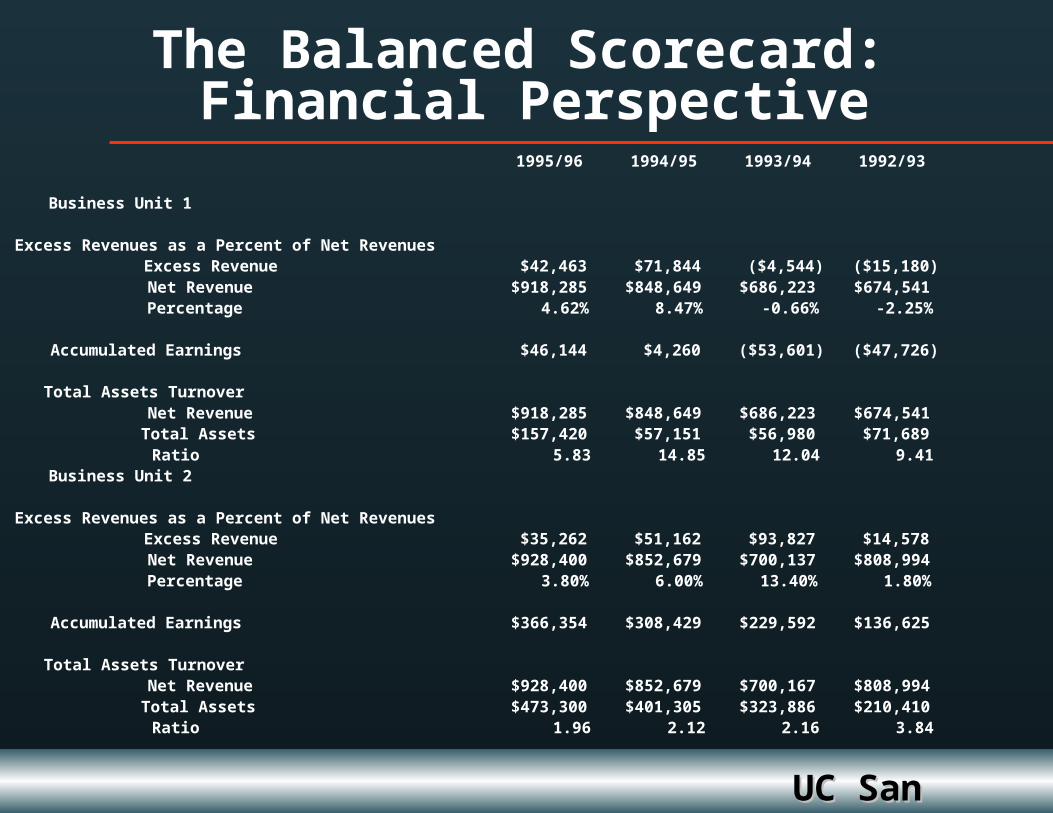
1995/96 1994/95 1993/94 1992/93
Business Unit 1
Excess Revenues as a Percent of Net RevenuesExcess Revenue $42,463 $71,844 ($4,544) ($15,180)Net Revenue $918,285 $848,649 $686,223 $674,541Percentage 4.62% 8.47% -0.66% -2.25%
Accumulated Earnings $46,144 $4,260 ($53,601) ($47,726)
Total Assets TurnoverNet Revenue $918,285 $848,649 $686,223 $674,541Total Assets $157,420 $57,151 $56,980 $71,689Ratio 5.83 14.85 12.04 9.41
Business Unit 2
Excess Revenues as a Percent of Net RevenuesExcess Revenue $35,262 $51,162 $93,827 $14,578Net Revenue $928,400 $852,679 $700,137 $808,994Percentage 3.80% 6.00% 13.40% 1.80%
Accumulated Earnings $366,354 $308,429 $229,592 $136,625
Total Assets TurnoverNet Revenue $928,400 $852,679 $700,167 $808,994Total Assets $473,300 $401,305 $323,886 $210,410Ratio 1.96 2.12 2.16 3.84
The Balanced Scorecard: Financial Perspective
UC San DiegoUC San Diego
3.2
3.2
3.2
3.0
3.3
3.3
3.0
3.4
3.2
3.6
3.4 3.5
3.4
3.7
3.6
3.4 3.
6
3.5
3.8
3.8
3.6 3.7 3.8
3.7
4.0
3.9
3.8
1
2
3
4
5
Overall
Understands n
eeds
Accessible via phone
Responsive
Effectiv
e advice
Problem resolutio
n
Professional
Courteous
Positive dire
ction
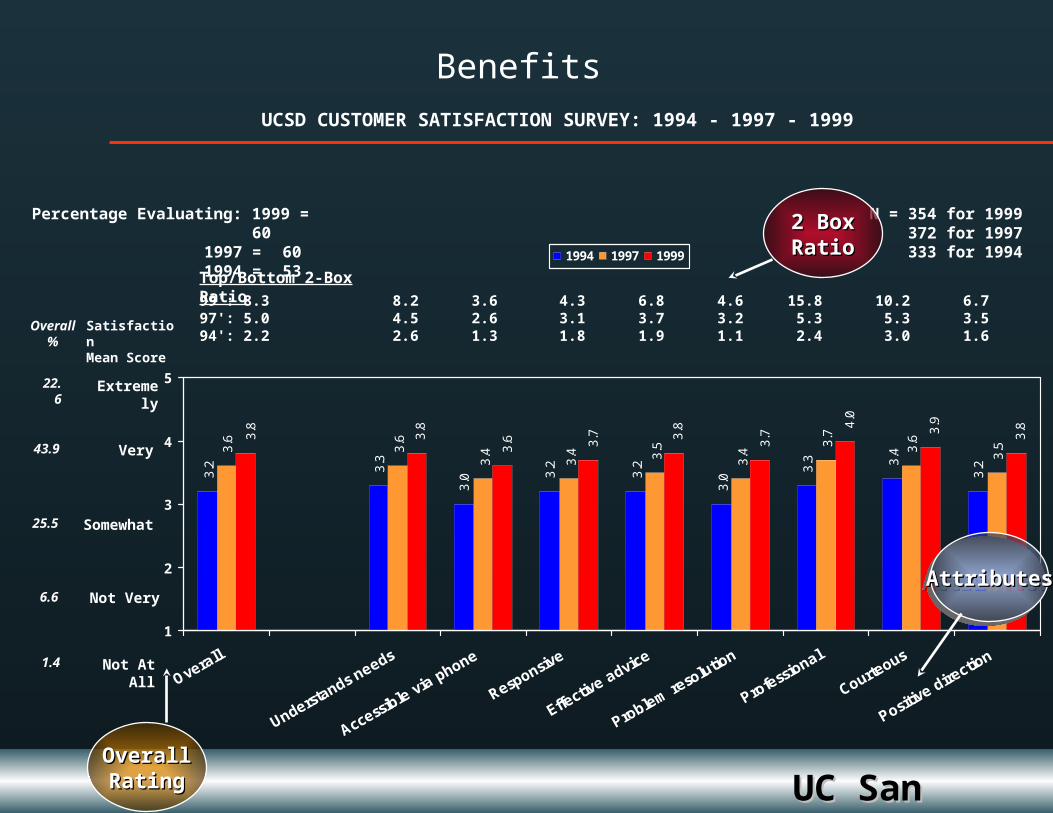
1994 1997 1999
Benefits
Top/Bottom 2-Box Ratio
99': 8.3 8.2 3.6 4.3 6.8 4.6 15.8 10.2 6.797': 5.0 4.5 2.6 3.1 3.7 3.2 5.3 5.3 3.594': 2.2 2.6 1.3 1.8 1.9 1.1 2.4 3.0 1.6
Percentage Evaluating: 1999 = 601997 = 601994 = 53
N = 354 for 1999372 for 1997333 for 1994
Extremely
Very
Somewhat
Not Very
Not At All
Satisfaction Mean Score
UCSD CUSTOMER SATISFACTION SURVEY: 1994 - 1997 - 1999
Overall%
22.6
43.9
25.5
6.6
1.4
2 Box2 BoxRatioRatio
OverallOverallRatingRating
AttributesAttributesAttributesAttributes
UC San DiegoUC San Diego
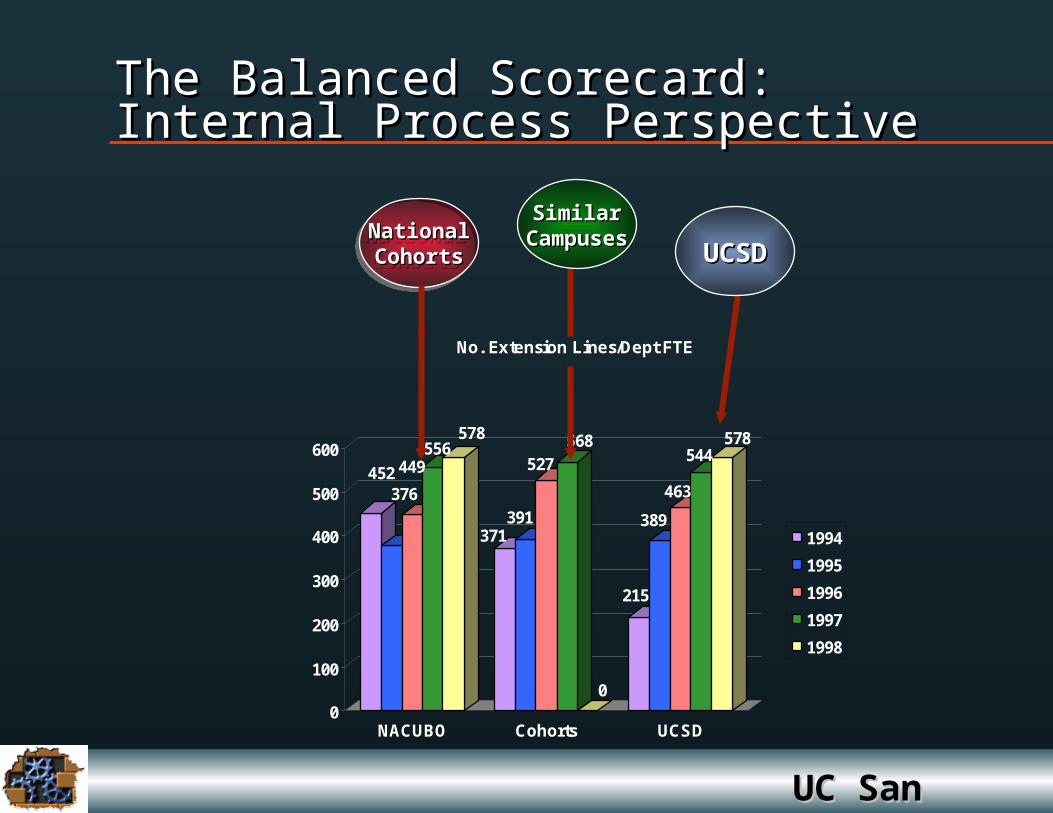
452376
449556
578
371391
527568
0
215
389
463
544578
0
100
200
300
400
500
600
NACUBO Cohorts UCSD
No. Extension Lines/Dept FTE
1994
1995
1996
1997
1998
The Balanced Scorecard: The Balanced Scorecard: Internal Process PerspectiveInternal Process Perspective
UCSDUCSD
SimilarSimilarCampusesCampusesNationalNational
CohortsCohortsNationalNationalCohortsCohorts
UC San DiegoUC San Diego
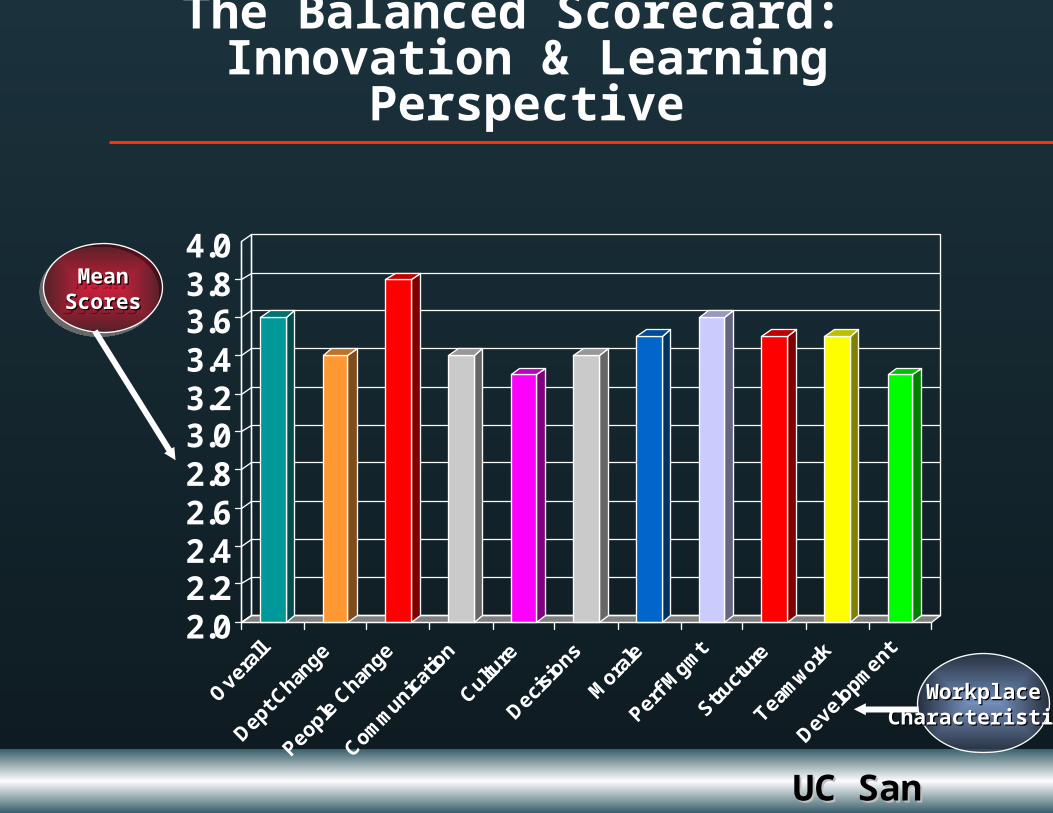
2.02.22.42.62.83.03.23.43.63.84.0
The Balanced Scorecard: Innovation & Learning Perspective
WorkplaceWorkplaceCharacteristicsCharacteristics
MeanMeanScoresScores
MeanMeanScoresScores
UC San DiegoUC San Diego
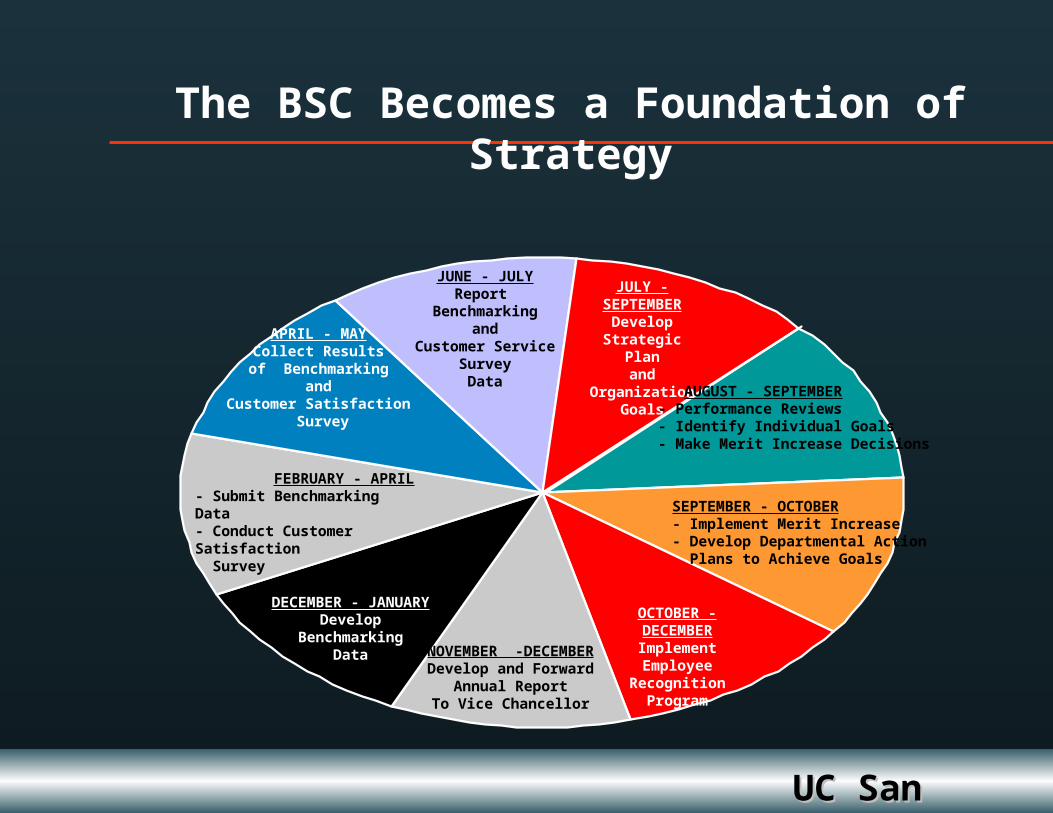
JUNE - JULYReport
Benchmarkingand
Customer ServiceSurvey
Data
JULY - SEPTEMBERDevelop
Strategic Planand
Organization Goals
AUGUST - SEPTEMBER- Performance Reviews- Identify Individual Goals- Make Merit Increase Decisions
SEPTEMBER - OCTOBER- Implement Merit Increase- Develop Departmental Action Plans to Achieve Goals
OCTOBER -DECEMBERImplement
Employee RecognitionProgram
NOVEMBER -DECEMBERDevelop and Forward
Annual ReportTo Vice Chancellor
DECEMBER - JANUARYDevelop
BenchmarkingData
FEBRUARY - APRIL- Submit Benchmarking Data- Conduct Customer Satisfaction Survey
APRIL - MAYCollect Results
of Benchmarkingand
Customer Satisfaction Survey
The BSC Becomes a Foundation of Strategy
Implement NewTechnology
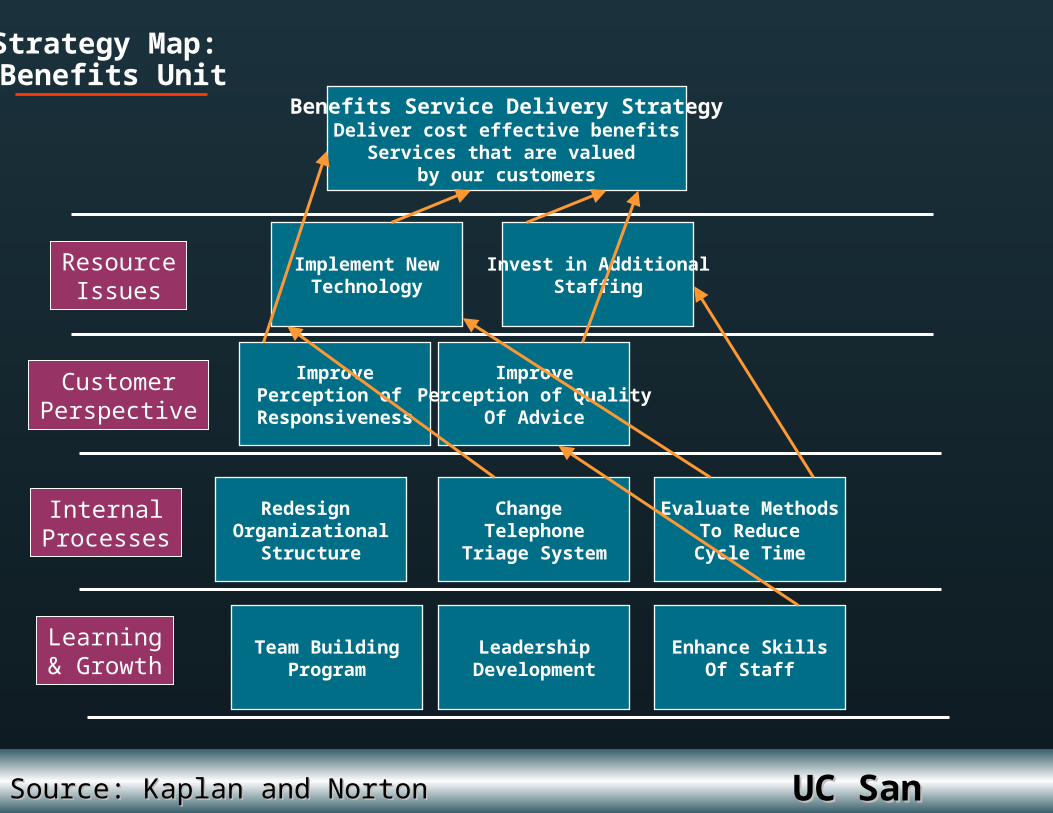
Strategy Map: Benefits Unit
Source: Kaplan and NortonSource: Kaplan and Norton UC San DiegoUC San Diego
Learning& Growth
CustomerPerspective
ResourceIssues
InternalProcesses
Team BuildingProgram
LeadershipDevelopment
Redesign Organizational
Structure
Enhance SkillsOf Staff
Change Telephone
Triage System
Invest in AdditionalStaffing
ImprovePerception of
Responsiveness
ImprovePerception of Quality
Of Advice
Benefits Service Delivery StrategyDeliver cost effective benefits
Services that are valued by our customers
Evaluate MethodsTo ReduceCycle Time
UC San DiegoUC San Diego
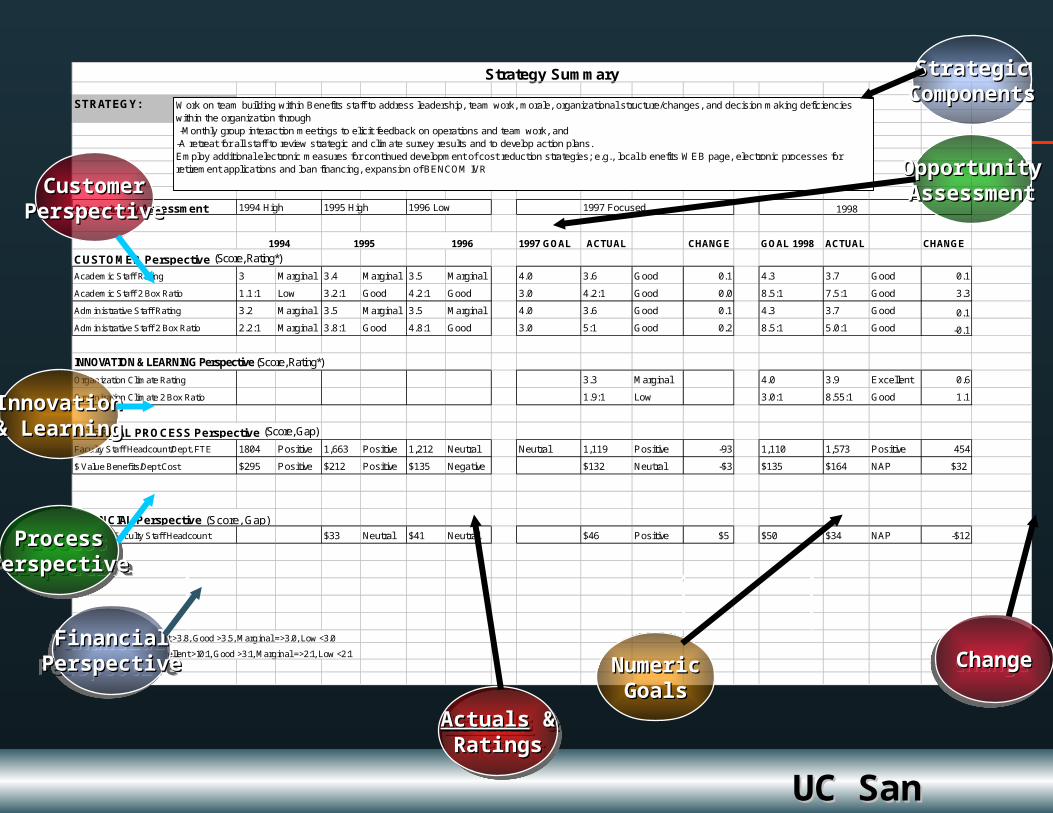
Strategy Summary
STRATEGY:
Opportunity Assessment 1994 High 1995 High 1996 Low 1997 Focused 1998
1994 1995 1996 1997 GOAL ACTUAL CHANGE GOAL 1998 ACTUAL CHANGE
CUSTOMER Perspective (Score, Rating*)
Academic Staff Rating 3 Marginal 3.4 Marginal 3.5 Marginal 4.0 3.6 Good 0.1 4.3 3.7 Good 0.1
Academic Staff 2 Box Ratio 1.1:1 Low 3.2:1 Good 4.2:1 Good 3.0 4.2:1 Good 0.0 8.5:1 7.5:1 Good 3.3
Administrative Staff Rating 3.2 Marginal 3.5 Marginal 3.5 Marginal 4.0 3.6 Good 0.1 4.3 3.7 Good 0.1
Administrative Staff 2 Box Ratio 2.2:1 Marginal 3.8:1 Good 4.8:1 Good 3.0 5:1 Good 0.2 8.5:1 5.0:1 Good -0.1
INNOVATION & LEARNING Perspective (Score, Rating*)
Organization Climate Rating 3.3 Marginal 4.0 3.9 Excellent 0.6
Organization Climate 2 Box Ratio 1.9:1 Low 3.0:1 8.55:1 Good 1.1
INTERNAL PROCESS Perspective (Score, Gap)
Faculty Staff Headcount/Dept. FTE 1804 Positive 1,663 Positive 1,212 Neutral Neutral 1,119 Positive -93 1,110 1,573 Positive 454
$ Value Benefits/Dept Cost $295 Positive $212 Positive $135 Negative $132 Neutral -$3 $135 $164 NAP $32
FINANCIAL Perspective (Score, Gap)Dept Cost/Faculty Staff Headcount $33 Neutral $41 Neutral $46 Positive $5 $50 $34 NAP -$12
*Rating Scale: Excellent >3.8, Good >3.5, Marginal =>3.0, Low <3.0
*2-Box Ratio Scale: Excellent >10:1, Good >3:1, Marginal =>2:1, Low <2:1
Work on team building within Benefits staff to address leadership, team work, morale, organizational structure/changes, and decision making deficiencies within the organization through -Monthly group interaction meetings to elicit feedback on operations and team work, and -A retreat for all staff to review strategic and climate survey results and to develop action plans.Employ additional electronic measures for continued development of cost reduction strategies; e.g., local b enefits WEB page, electronic processes for retirement applications and loan financing, expansion of BENCOM IVR
CustomerCustomerPerspectivePerspective
InnovationInnovation& Learning& Learning
FinancialFinancialPerspectivePerspective
FinancialFinancialPerspectivePerspective
ProcessProcessPerspectivePerspective
ProcessProcessPerspectivePerspective
StrategicStrategicComponentsComponents
OpportunityOpportunityAssessmentAssessment
ChangeChangeChangeChangeNumericNumericGoalsGoals
ActualsActuals & &RatingsRatings
ActualsActuals & &RatingsRatings
UC San DiegoUC San Diego
What Have Been the Results?
• Increased Productivity
• Reduction in Costs
• Understanding Customer Needs
UC San DiegoUC San Diego
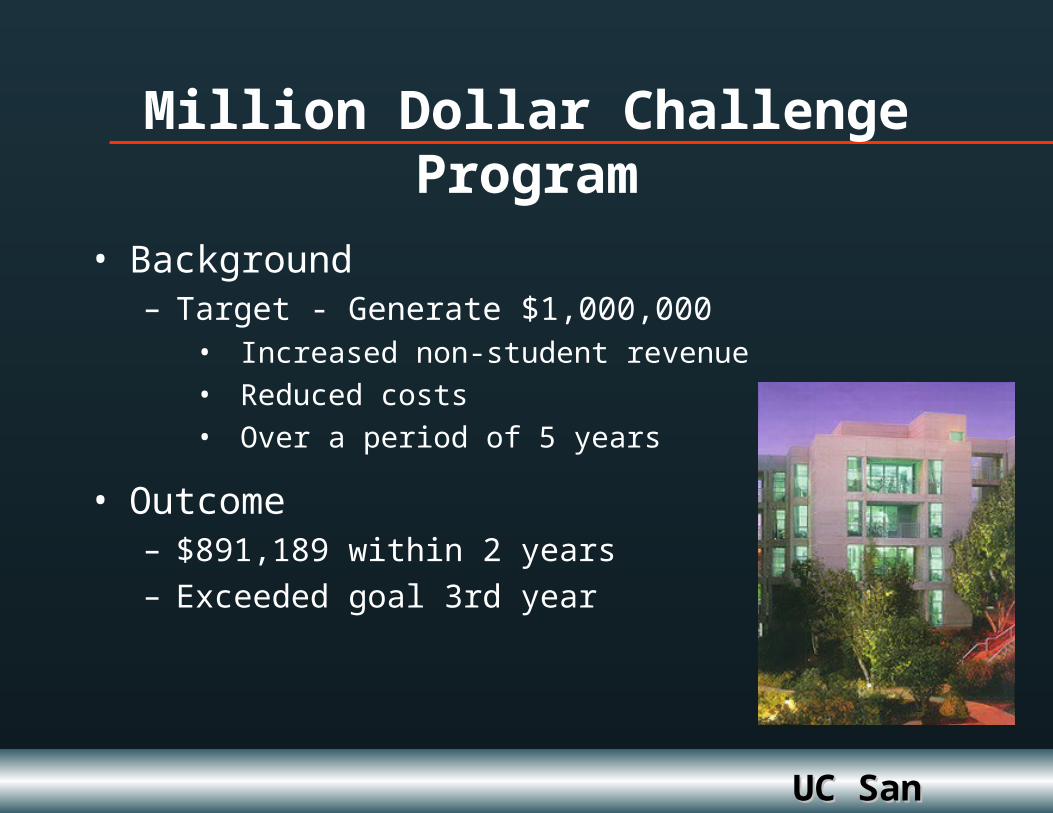
Million Dollar Challenge Program
• Background– Target - Generate $1,000,000
• Increased non-student revenue
• Reduced costs
• Over a period of 5 years
• Outcome– $891,189 within 2 years– Exceeded goal 3rd year
UC San DiegoUC San Diego
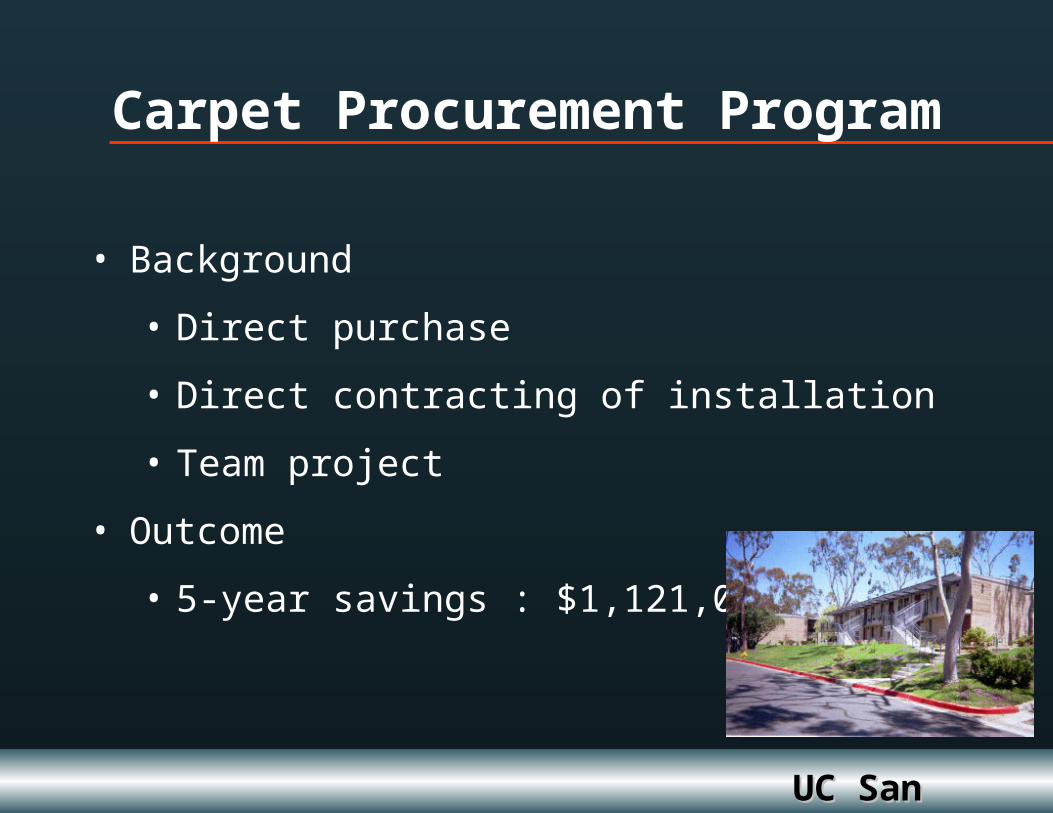
Carpet Procurement Program
• Background
• Direct purchase
• Direct contracting of installation
• Team project
• Outcome
• 5-year savings : $1,121,000

UC San DiegoUC San Diego
Custodial - Conditions in 1994
• Low Productivity
• High Cleaning Costs
• Low Customer Satisfaction
Costs/sq ft .94 centsCosts/sq ft .94 cents
Customer Satisfaction
2.5
2.7
2.9
3.1
3.3
3.5
3.7
1994
Acad.
Admin.
Target
UC San DiegoUC San Diego
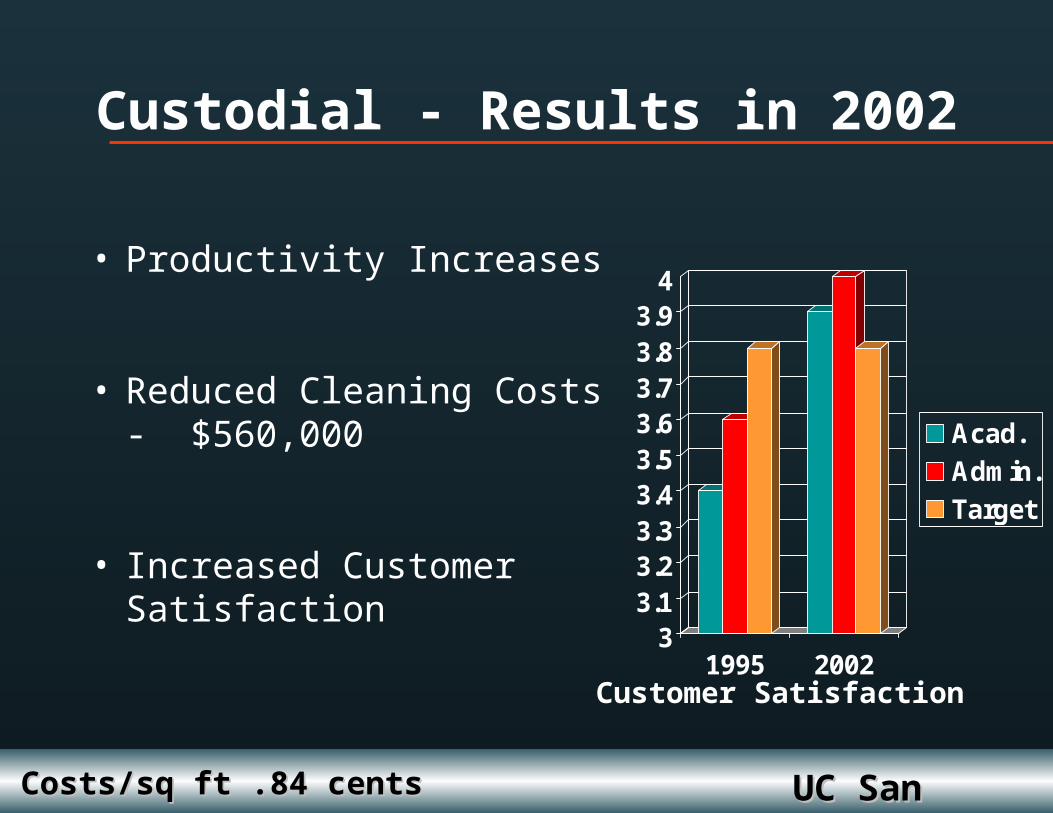
Custodial - Results in 2002
• Productivity Increases
• Reduced Cleaning Costs- $560,000
• Increased Customer Satisfaction 3
3.13.23.33.43.53.63.73.83.9
4
1995 2002
Acad.
Admin.
Target
Customer Satisfaction
Costs/sq ft .84 centsCosts/sq ft .84 cents
UC San DiegoUC San Diego
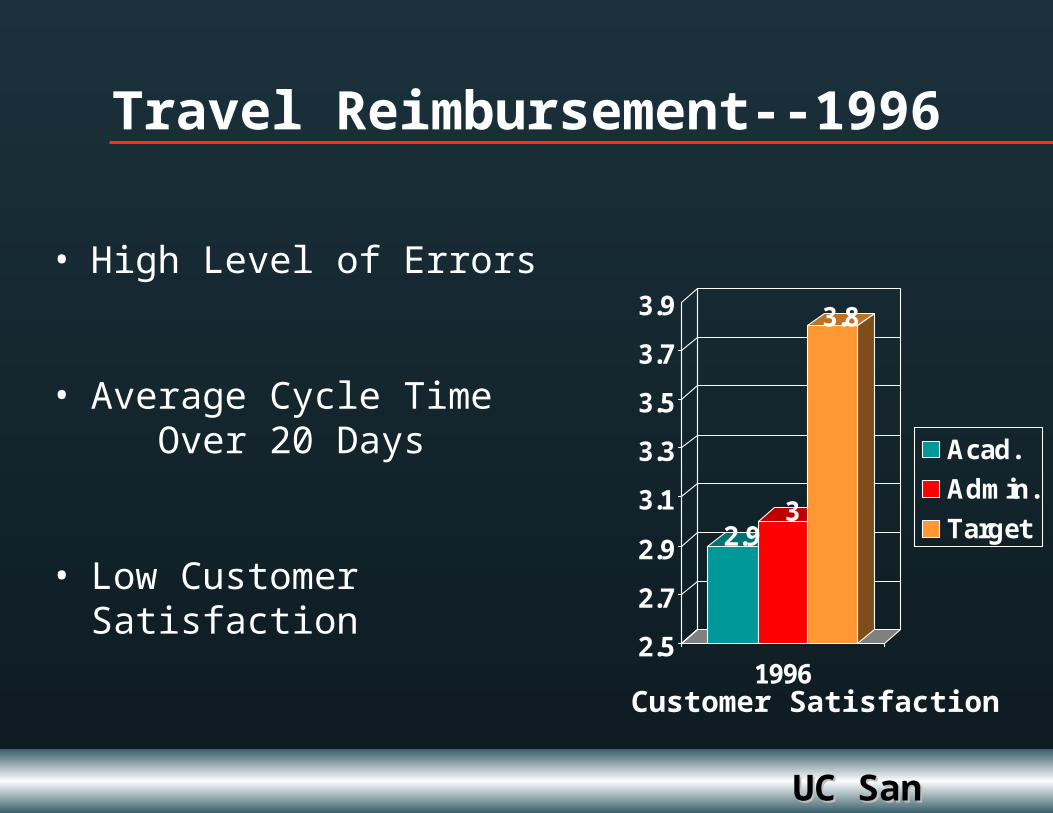
Travel Reimbursement--1996
• High Level of Errors
• Average Cycle Time Over 20 Days
• Low Customer Satisfaction2.9
3
3.8
2.5
2.7
2.9
3.1
3.3
3.5
3.7
3.9
1996
Acad.
Admin.
Target
Customer Satisfaction
UC San DiegoUC San Diego
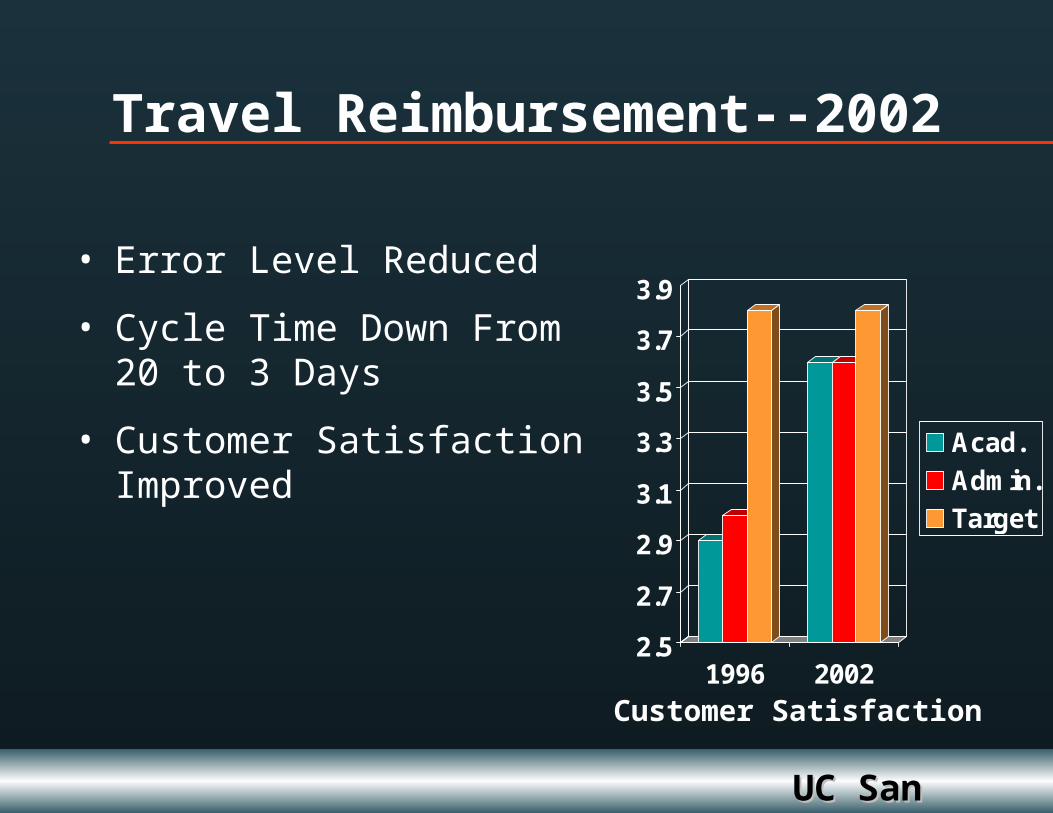
Travel Reimbursement--2002
• Error Level Reduced
• Cycle Time Down From 20 to 3 Days
• Customer Satisfaction Improved
2.5
2.7
2.9
3.1
3.3
3.5
3.7
3.9
1996 2002
Acad.
Admin.
Target
Customer Satisfaction
UC San DiegoUC San Diego
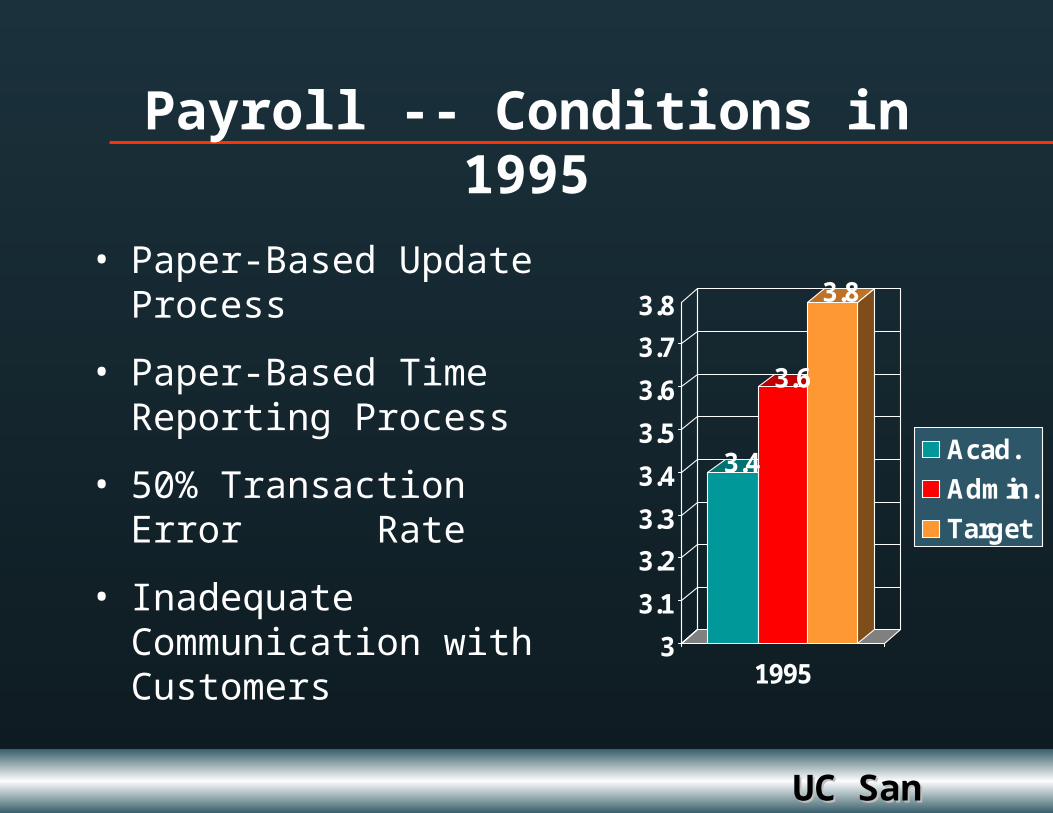
Payroll -- Conditions in 1995
• Paper-Based Update Process
• Paper-Based Time Reporting Process
• 50% Transaction Error Rate
• Inadequate Communication with Customers
3.4
3.6
3.8
3
3.1
3.2
3.3
3.4
3.5
3.6
3.7
3.8
1995
Acad.
Admin.
Target
UC San DiegoUC San Diego
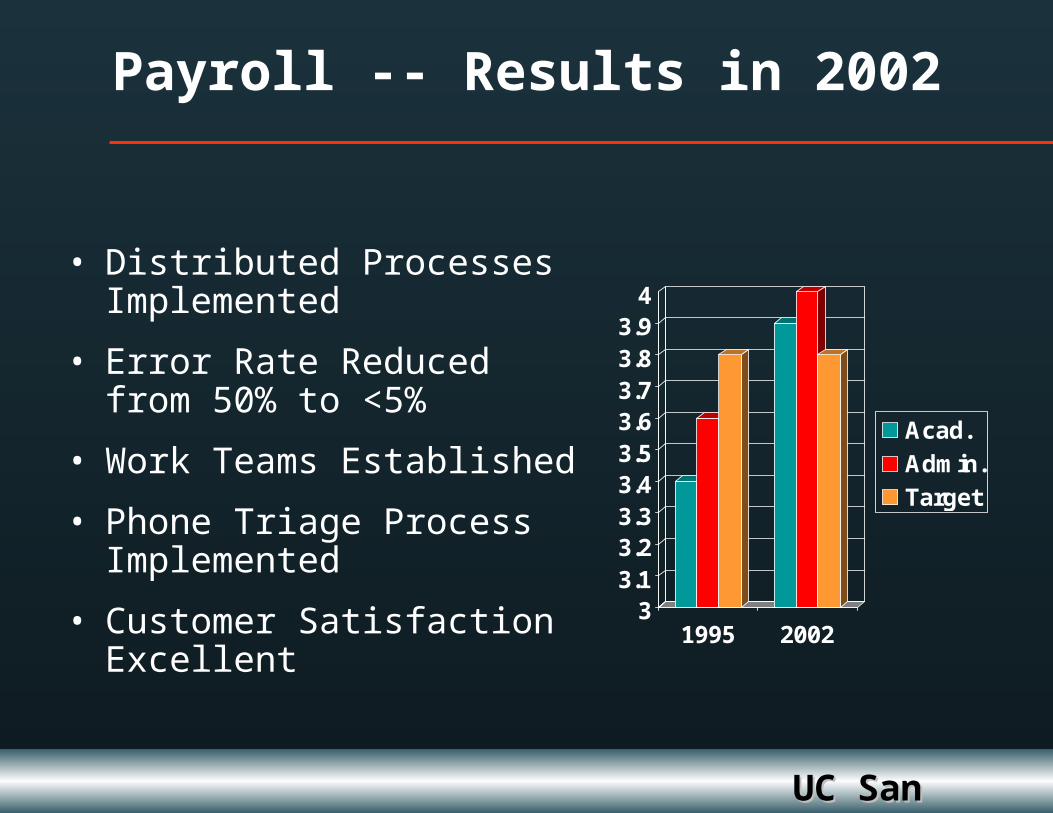
Payroll -- Results in 2002
• Distributed Processes Implemented
• Error Rate Reduced from 50% to <5%
• Work Teams Established
• Phone Triage Process Implemented
• Customer Satisfaction Excellent
33.13.23.33.43.53.63.73.83.9
4
1995 2002
Acad.
Admin.
Target
UC San DiegoUC San Diego
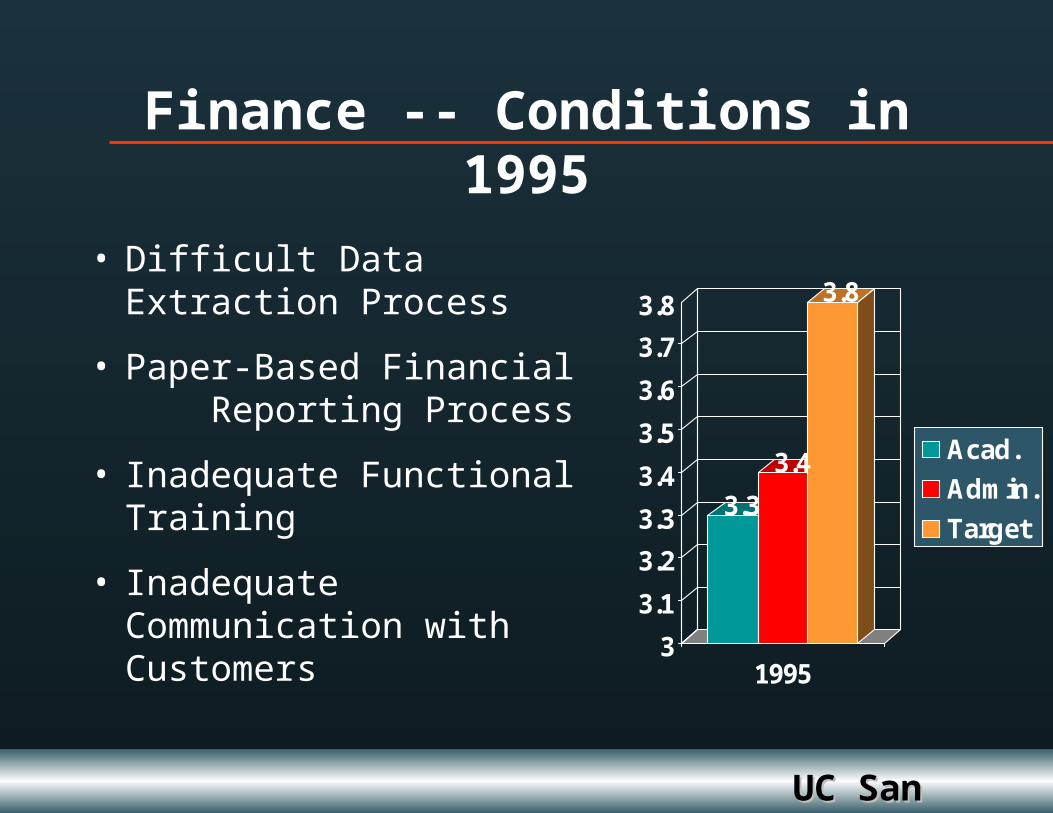
Finance -- Conditions in 1995
• Difficult Data Extraction Process
• Paper-Based Financial Reporting Process
• Inadequate Functional Training
• Inadequate Communication with Customers
3.3
3.4
3.8
3
3.1
3.2
3.3
3.4
3.5
3.6
3.7
3.8
1995
Acad.
Admin.
Target
UC San DiegoUC San Diego
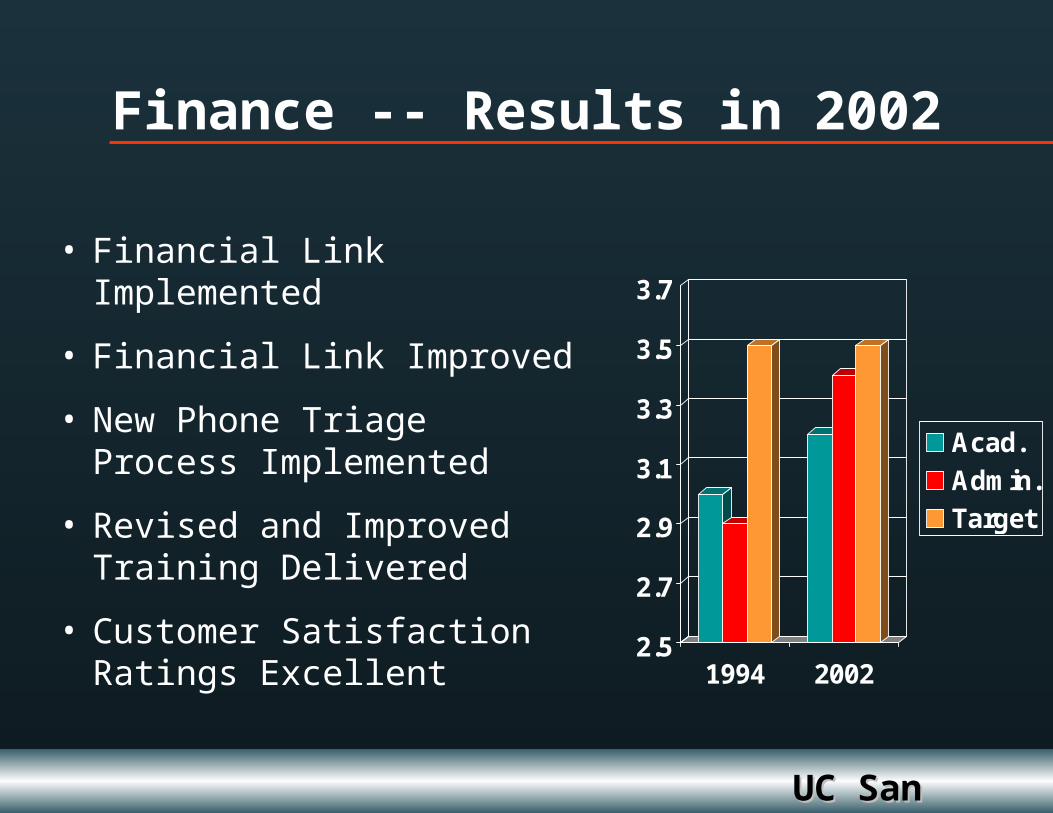
Finance -- Results in 2002
• Financial Link Implemented
• Financial Link Improved
• New Phone Triage Process Implemented
• Revised and Improved Training Delivered
• Customer Satisfaction Ratings Excellent 2.5
2.7
2.9
3.1
3.3
3.5
3.7
1994 2002
Acad.
Admin.
Target
UC San DiegoUC San Diego
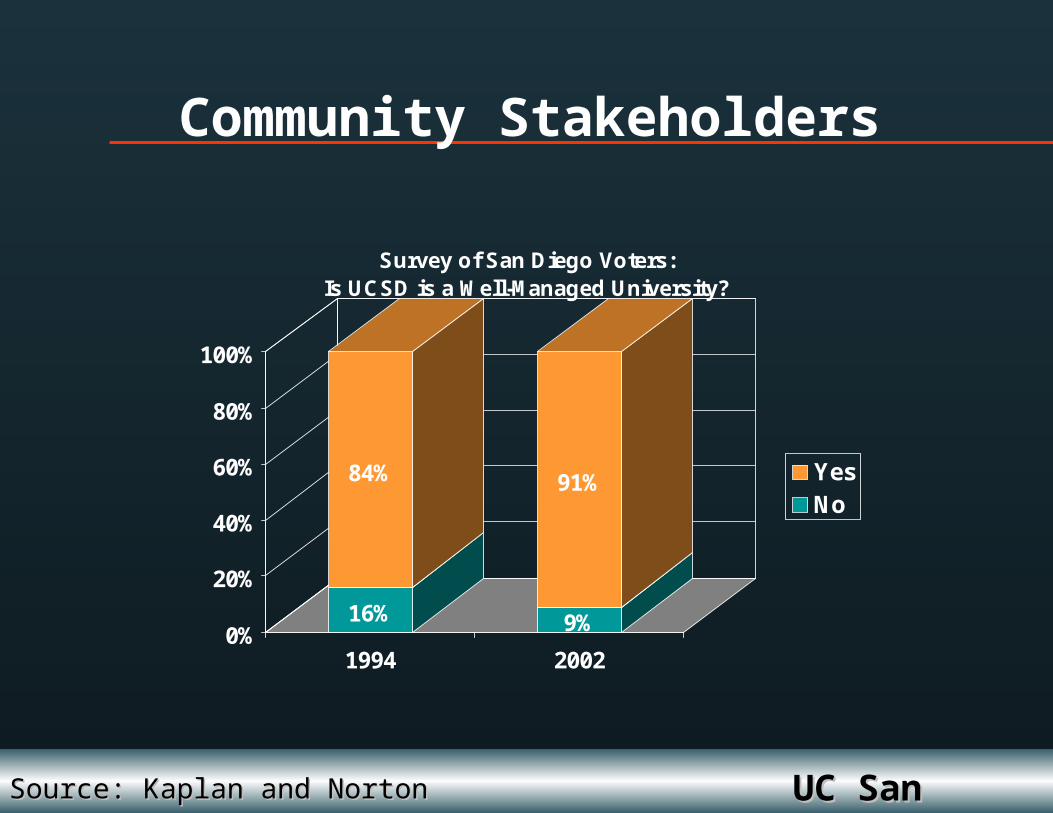
Community Stakeholders
Source: Kaplan and NortonSource: Kaplan and Norton
16%
84%
9%
91%
0%
20%
40%
60%
80%
100%
1994 2002
Survey of San Diego Voters: Is UCSD is a Well-Managed University?
YesNo
UC San DiegoUC San Diego
Why Consider this Approach in a Non-Profit Organization?
• It keeps an organization’s focus on what is important
• It is sustainable over the long-run
• It is explainable to your people
• It provides a context for decision making
UC San DiegoUC San Diego
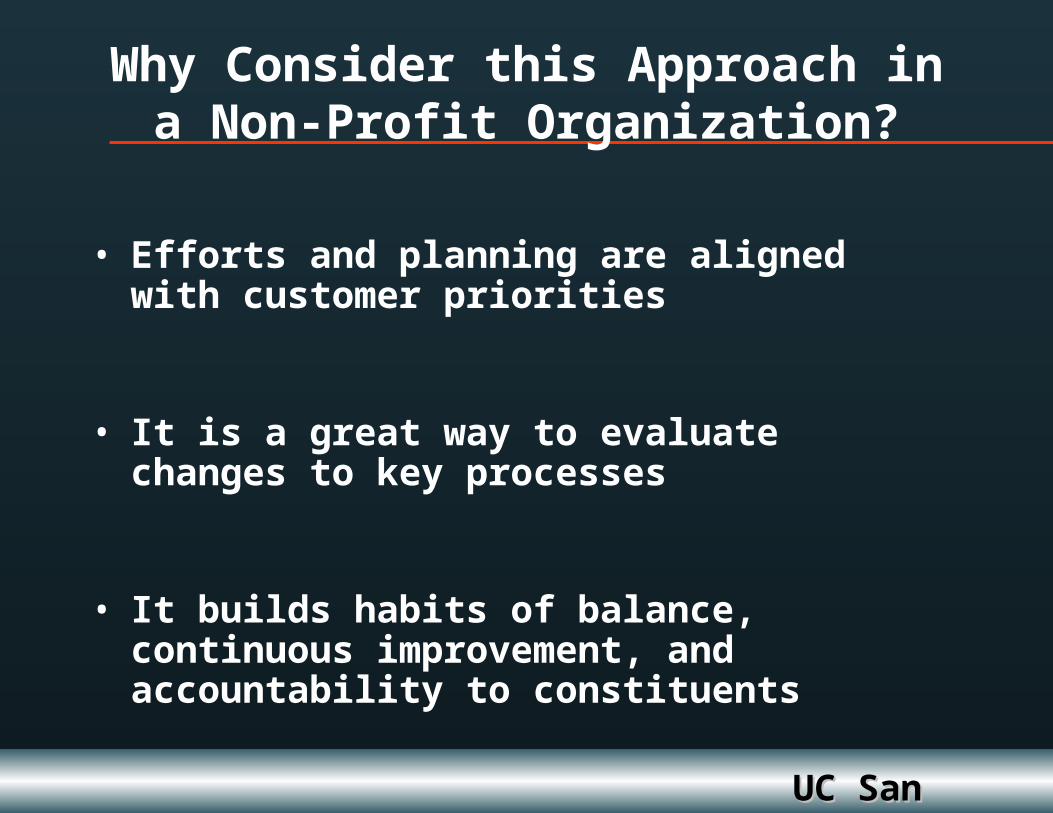
• Efforts and planning are aligned with customer priorities
• It is a great way to evaluate changes to key processes
• It builds habits of balance, continuous improvement, and accountability to constituents
Why Consider this Approach in a Non-Profit Organization?
UC San DiegoUC San Diego
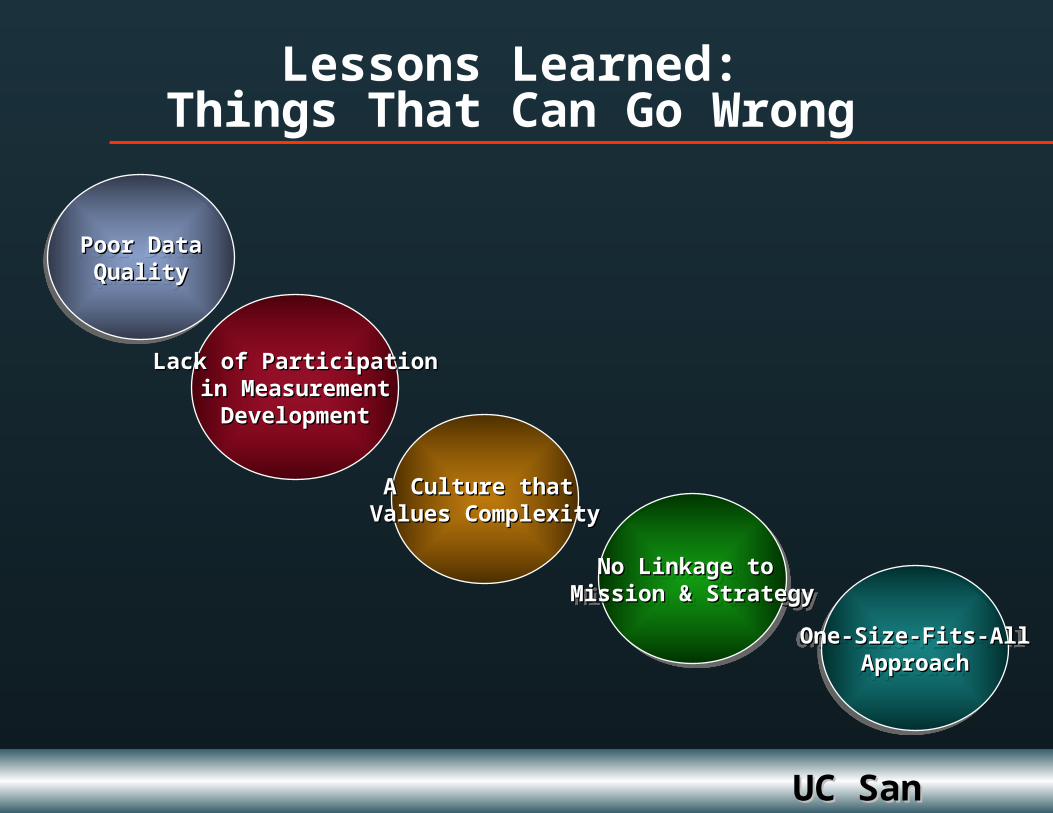
Lessons Learned:Things That Can Go Wrong
Poor DataPoor DataQualityQuality
Poor DataPoor DataQualityQuality
Lack of ParticipationLack of Participation in Measurement in Measurement
DevelopmentDevelopment
A Culture that A Culture that Values ComplexityValues Complexity
No Linkage to No Linkage to Mission & StrategyMission & Strategy
No Linkage to No Linkage to Mission & StrategyMission & Strategy
One-Size-Fits-AllOne-Size-Fits-AllApproachApproach
One-Size-Fits-AllOne-Size-Fits-AllApproachApproach
UC San DiegoUC San Diego
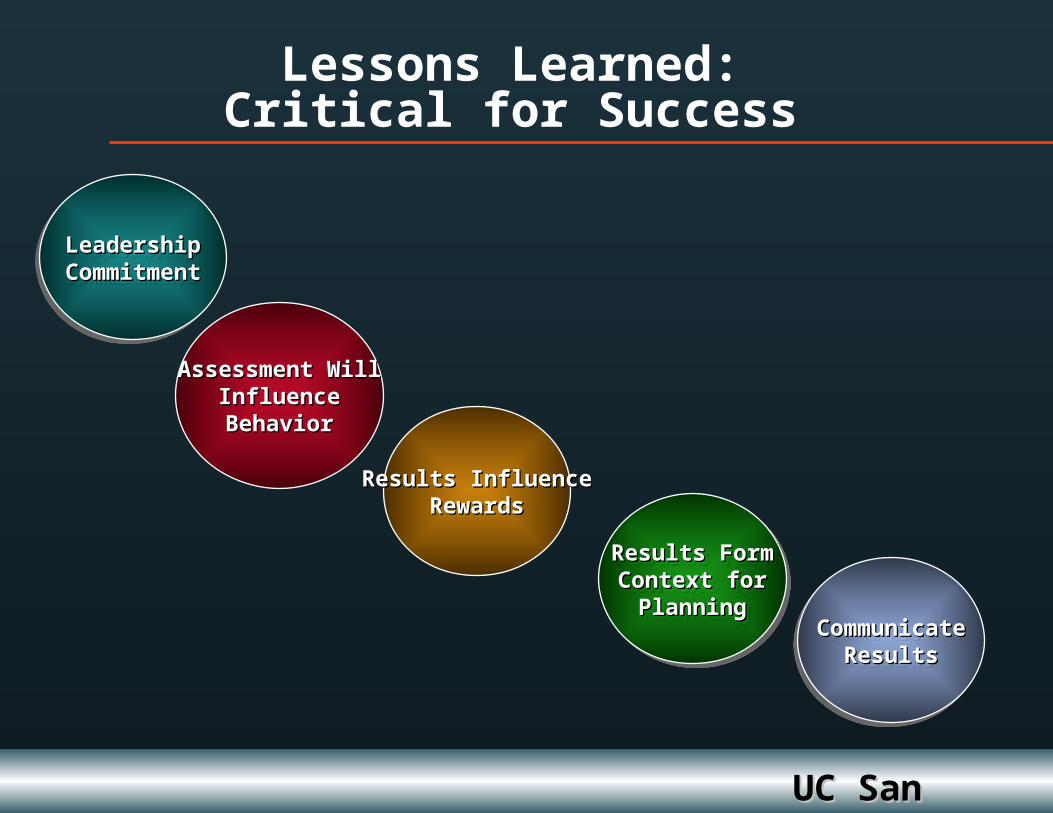
Lessons Learned:Critical for Success
LeadershipLeadershipCommitmentCommitment
LeadershipLeadershipCommitmentCommitment
Assessment WillAssessment WillInfluenceInfluenceBehaviorBehavior
Results InfluenceResults InfluenceRewardsRewards
Results FormResults FormContext forContext for
PlanningPlanning
Results FormResults FormContext forContext for
PlanningPlanningCommunicateCommunicate
ResultsResultsCommunicateCommunicate
ResultsResults