Embed Size (px)
DESCRIPTION
The Utah Collaborative Active Transportation Study (UCATS) is a response to Utahans along the Wasatch Front calling for more and better transportation options that include active transportation (walking and biking). The goal of UCATS is to develop a regional alternative transportation resource master plan for infrastructure that enhances and coordinates pedestrian and bicycle connectivity.
Citation preview
UTAH COLLABORATIVE ACTIVETRANSPORTATION STUDY
UTAH COLLABORATIVE ACTIVETRANSPORTATION STUDY
OCTOBER 2013
UCATS Final Report
October 2013
1
UCATS OVERVIEW
WHY IS UCATS NEEDED?
The Utah Collaborative Active Transportation Study (UCATS) is a response to Utahans along the
Wasatch Front calling for more and better transportation options that include active transportation
(walking and biking).
WHAT IS UCATS?
The goal of UCATS is to develop a regional alternative transportation resource master plan for
infrastructure that enhances and coordinates pedestrian and bicycle connectivity. The study lays the
groundwork for an urban network of bicycle routes (UCATS Regional Bicycle Network) throughout
the Wasatch Front and makes recommendations for pedestrian connections to transit within one
mile of UTA’s TRAX and FrontRunner stations. UCATS is managed by the Utah Department of
Transportation (UDOT) and the Utah Transit Authority (UTA), in partnership with the Wasatch Front
Regional Council (WFRC), Mountainland Association of Governments (MAG), and Salt Lake County.
HOW WILL UCATS HELP?
UCATS is designed to provide active transportation options for people who live and work along the
Wasatch Front. The plans generated under UCATS will help to link people who walk and bike to the
goods, services and recreational opportunities they need and desire. The project identifies bicycle
and pedestrian infrastructure that is usable and accessible to a wide range of people with varying
interests and abilities. The study proposes plans for a Regional Bicycle Network that is positioned to
grow into a complete active transportation system through the addition of infrastructure planned by
local municipalities. UCATS is focused on increasing transit ridership with plans that improve bicycle
and pedestrian access to UTA’s TRAX and FrontRunner stations.
WHAT IS THE RESULT OF UCATS?
In order to facilitate the eventual construction of the UCATS Regional Bicycle Network and transit
connections, UCATS pinpoints 25 project areas on the regional network. Potential bicycle and
pedestrian infrastructure and treatments have been identified and evaluated within the 25 project
areas. This evaluation has helped to determine construction and environmental challenges, as well as
economic and quality of life advantages associated with implementation. Coordination opportunities
with upcoming projects and possible funding sources for each project area have also been identified.
UCATS Final Report
October 2013
2
ACKNOWLEDGEMENTS
UCATS has been made possible through the support and guidance of the project partners. The
project team would like to thank:
Angelo Papastamos, Utah Department of Transportation
Evelyn Tuddenham, Utah Department of Transportation
Johanna Jamison, Utah Transit Authority
Jennifer McGrath, Utah Transit Authority
Jory Johner, Wasatch Front Regional Council
Jim Price, Mountainland Association of Governments
George Deneris, Salt Lake County
Spencer Sanders, Salt Lake County
Jaime White, Parsons Brinkerhoff
Active Transportation Committee
Project Stakeholder Committee
UCATS Final Report
October 2013
3
INTRODUCTION
WHAT IS UCATS?
The goal of the Utah Collaborative Active Transportation Study (UCATS) is to develop plans for
infrastructure that will improve mobility for bicycles and enhance pedestrian and bicycle connectivity
to major transit lines. The study lays the groundwork for an urban network of bicycle routes
throughout the Wasatch Front and recommends walking routes within one mile from the Utah
Transit Authority (UTA) TRAX and FrontRunner stations.
By mapping and analyzing current and proposed bicycle infrastructure in the metropolitan Wasatch
Front -- from Provo to Ogden – a UCATS Regional Bicycle Network has been identified that links
unfinished networks, fills in gaps, overcomes barriers and emphasizes connections to transit. Twenty-
five project areas have been singled out and each of those areas has been evaluated to determine
the construction and environmental challenges associated with building active transportation
infrastructure in those locations. To further promote the eventual build-out of the UCATS Regional
Bicycle Network and transit connections, the economic and quality of life advantages have been
researched and potential funding sources for the proposed infrastructure have been determined.
WHY IS UCATS NEEDED?
The UCATS project came about in response to requests from state and local agencies, local officials,
walking and biking advocates and other stakeholders for more active transportation options and
better facilities. UCATS answers those requests by identifying ways to strengthen bicycle and
pedestrian infrastructure and devising plans for a bicycle network that is positioned to grow into a
complete system. In order to determine and address needs, UCATS has captured a much needed
inventory of proposed and existing bicycle facilities within the metropolitan Wasatch Front and
addressed gaps in the current bicycle network. The study identifies bicycle and pedestrian projects
for construction that are accessible and appealing to a variety of people. In order to increase the
value of transit for all users, UCATS focuses on increasing ridership through better bicycle and
pedestrian access to UTA’s TRAX and FrontRunner stations.
WHO IS INVOLVED WITH UCATS?
The UCATS project is co-managed by the Utah Department of Transportation (UDOT) and the Utah
Transit Authority (UTA) in partnership with the Wasatch Front Regional Council (WFRC), the
Mountainland Association of Governments (MAG), and Salt Lake County. The project provides
opportunities for state agencies, local municipalities, advocacy groups and individual stakeholders to
work cooperatively to research and recommend active transportation infrastructure improvements.
This collaboration fosters opportunities for successful implementation of the plans UCATS produces
because key agencies are involved in all stages of the process. For example, plans from WFRC, MAG,
Salt Lake County and other municipalities were distilled to create the preliminary version of the
UCATS Regional Bicycle Network. Staff from each of the three UDOT Regions on the Wasatch Front
reviewed the proposed routes and infrastructure and made recommendations. Bike plans for each of
UCATS Final Report
October 2013
4
those UDOT Regions have been developed in conjunction with UCATS and are based on the final
version of the UCATS Regional Bicycle Network.
WHAT ARE THE BOUNDARIES OF THE UCATS STUDY AREA?
For bicycles, UCATS is focused on the urban areas of the Wasatch Front in Box Elder, Weber, Davis,
Salt Lake, and Utah Counties. For pedestrian facilities, UCATS is focused within a one-mile radius of
UTA’s TRAX and FrontRunner stations in those counties.
Additional active transportation (biking and/or walking) studies, conducted by various state and local
agencies, are planned or underway at all times throughout Utah. A collaborative approach that
encourages coordination of these studies and the information they generate is nurturing the creation
of a complete active transportation system across the state.
UCATS Final Report
October 2013
5
GOALS
UCATS MISSION STATEMENT
The Utah Collaborative Active Transportation Study (UCATS) lays the groundwork for a network of
bicycle routes throughout the urbanized Wasatch Front for cyclists of all ages and abilities. It
proposes facilities that will enhance pedestrian and bicycle connectivity to major transit lines, and
demonstrates the economic and quality of life benefits of walkable and bikeable communities
through a cooperative research and planning process aimed at improving active transportation
options.
UCATS GOALS
The UCATS process encourages state and local agencies and other stakeholders to work
collaboratively to establish needs, priorities and an organized approach that will lead to the
development of a system of pedestrian and bicycle infrastructure that connects to active
transportation destinations and to mass transit.
o Determines gaps and opportunities in the current bicycle and pedestrian network
o Determines and prioritizes appropriate infrastructure projects based on a set of criteria
including:
Connections to transit
Connections to recreation and green space
Connections to commercial centers
Environmental concerns
Constructability
o Evaluates costs and funding mechanisms for proposed infrastructure projects
o Creates a system for tracking the development of individual proposed infrastructure
projects
UCATS improves connections to transit:
o Emphasizes connections to transit by prioritizing bicycle and pedestrian projects
o Plans for short- and long-term bicycle parking at transit hubs
o Plans for bicycle and pedestrian infrastructure at transit-oriented development sites
UCATS Final Report
October 2013
6
UCATS develops plans for infrastructure that will improve quality of life by encouraging walking
and biking, resulting in fewer vehicles miles traveled, reduced emissions, improved air quality and
overall health benefits
UCATS develops plans for bicycle and pedestrian infrastructure that will boost economic
development by creating environments that attract and retain business and increase recreational
opportunities.
o Evaluates existing and proposed infrastructure to establish the benefits provided for
businesses
o Promotes the economic benefits of walking and bicycling to policy makers, chambers of
commerce and economic development agencies
UCATS improves safety with dedicated, well-maintained facilities that meet the specific needs of
bicyclists and pedestrians
o Considers all levels of experience and users when planning, locating, and designing
bicycle and pedestrian connections
o Plans proposed infrastructure with an emphasis on bicycle and pedestrian safety
o Utilizes innovative designs, where appropriate, to improve safety
o Considers facilities that are separated from vehicular traffic where possible
o Plans on-street bicycle and at-grade pedestrian facilities with adequate buffers from
automobile and transit traffic
UCATS Final Report
October 2013
7
PROCESS
The UCATS process has required extensive collaboration and comprehensive data. The existing bike
lanes and trails have been pinpointed and mapped. UTA station area walkability and the key
locations for potential bicycling and pedestrian activity have been identified. Public opinion has been
sought at every stage of the process through targeted outreach and a continual, interactive online
presence (www.ucatsplan.com). All of this work has led to the identification of plans for a UCATS
Regional Bicycle Network and connections to transit, along with infrastructure recommendations
designed to move the plans forward.
IDENTIFIYING WHAT IS ON THE GROUND
A first step in any planning process is to ascertain what is already on the ground. UCATS focuses on
different areas for bicycles and pedestrians. For bicycle facilities, the study comprises the urban areas
of the Wasatch Front within Box Elder, Weber, Davis, Salt Lake, and Utah Counties. For pedestrian
facilities, the study centers on the areas within one mile of UTA’s TRAX and FrontRunner stations.
Creating a map of all existing bicycle facilities within the Wasatch Front is a large undertaking
because most available maps were limited to individual cities. However, local cities, counties, and
planning organizations have worked collaboratively to help the UCATS team consolidate existing
bicycle infrastructure into a single map. More explanation of the mapping process can be found here.
Click here to see the Wasatch Front’s existing facilities map.
FACILITY TYPES
There are many ways to say the same thing when it comes to labeling bicycle infrastructure. UCATS
uses descriptive categories for bike facilities rather than the traditional “class” designations. This
approach is consistent with the guidelines of major
transportation policy organizations and is accepted by
public agencies, including Salt Lake County, which used
these categories in its 2013 Bicycle Best Practices Study.
The facility categories include: shared lane, marked shared
lane, paved shoulder, bike lane and shared use path.
A shared lane is a wide outside lane that is identified by
signs and shared by motorists and bicyclists. A marked
shared lane is a lane shared by both motorists and
bicyclists that is identified by signs and pavement
markings. A paved shoulder is a signed roadway with a
shoulder wide enough to accommodate bicyclists. A bike
lane is a signed roadway with a painted bike lane and a
shared use path is a paved, off-street linear corridor, like a
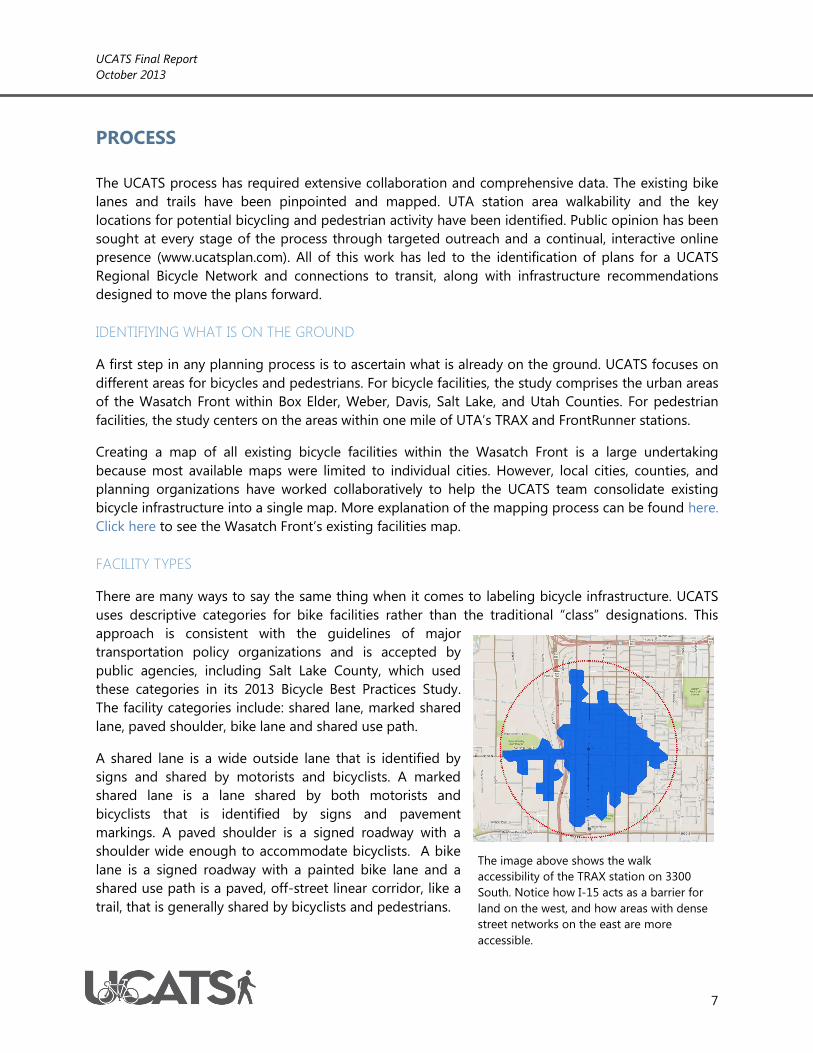
trail, that is generally shared by bicyclists and pedestrians.
The image above shows the walk
accessibility of the TRAX station on 3300
South. Notice how I-15 acts as a barrier for
land on the west, and how areas with dense
street networks on the east are more
accessible.
UCATS Final Report
October 2013
8
ACCESS TO TRANSIT
A key objective of the UCATS project is to improve active
transportation connections to transit, so existing walking
access to transit had to be identified. To do this, the project
team has analyzed the distance a person living within one
mile of a rail station (TRAX or FrontRunner) would need to
walk to access that station using existing streets and trails,
as compared to a one-mile straight line buffer from the rail
station (in other words, as the crow flies). A one-mile distance is used as it is assumed to be the
farthest distance someone will walk to access rail transit stations. Comparing the actual walk distance
to the “as-the-crow-flies distance” creates a “Walkability Index” that is used to identify areas where it
may be difficult for pedestrians to access transit.
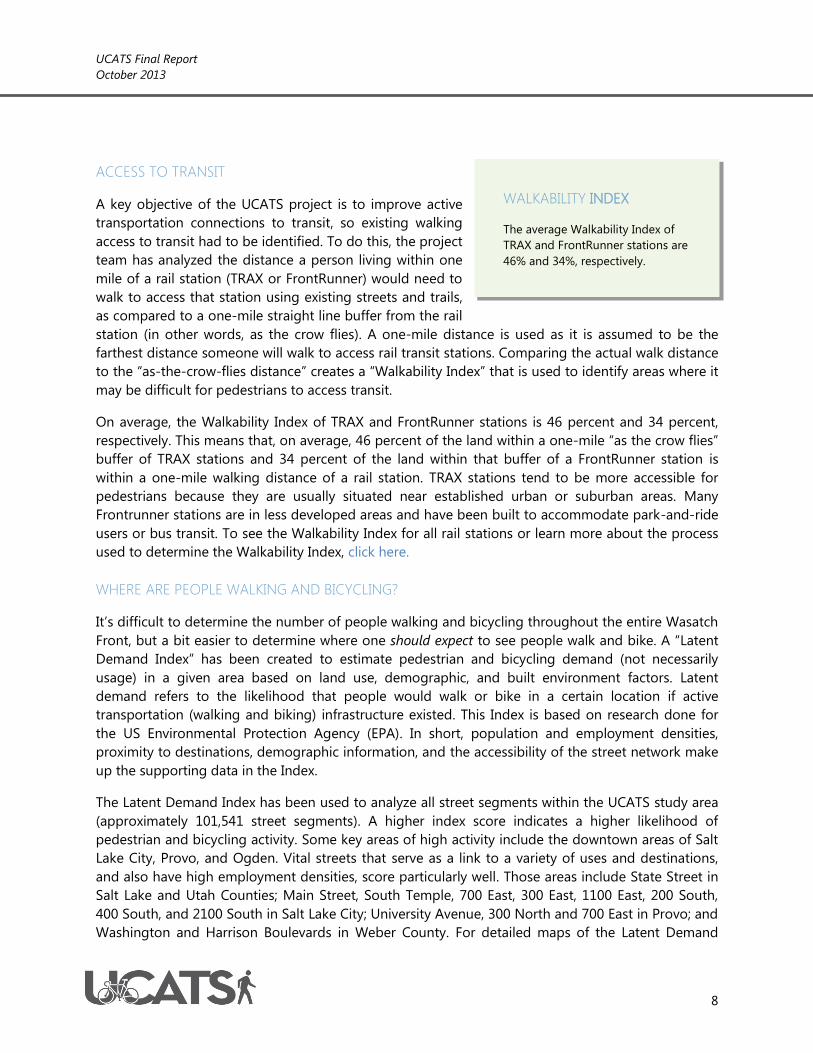
On average, the Walkability Index of TRAX and FrontRunner stations is 46 percent and 34 percent,
respectively. This means that, on average, 46 percent of the land within a one-mile “as the crow flies”
buffer of TRAX stations and 34 percent of the land within that buffer of a FrontRunner station is
within a one-mile walking distance of a rail station. TRAX stations tend to be more accessible for
pedestrians because they are usually situated near established urban or suburban areas. Many
Frontrunner stations are in less developed areas and have been built to accommodate park-and-ride
users or bus transit. To see the Walkability Index for all rail stations or learn more about the process
used to determine the Walkability Index, click here.
WHERE ARE PEOPLE WALKING AND BICYCLING?
It’s difficult to determine the number of people walking and bicycling throughout the entire Wasatch
Front, but a bit easier to determine where one should expect to see people walk and bike. A “Latent
Demand Index” has been created to estimate pedestrian and bicycling demand (not necessarily
usage) in a given area based on land use, demographic, and built environment factors. Latent
demand refers to the likelihood that people would walk or bike in a certain location if active
transportation (walking and biking) infrastructure existed. This Index is based on research done for
the US Environmental Protection Agency (EPA). In short, population and employment densities,
proximity to destinations, demographic information, and the accessibility of the street network make
up the supporting data in the Index.
The Latent Demand Index has been used to analyze all street segments within the UCATS study area
(approximately 101,541 street segments). A higher index score indicates a higher likelihood of
pedestrian and bicycling activity. Some key areas of high activity include the downtown areas of Salt
Lake City, Provo, and Ogden. Vital streets that serve as a link to a variety of uses and destinations,
and also have high employment densities, score particularly well. Those areas include State Street in
Salt Lake and Utah Counties; Main Street, South Temple, 700 East, 300 East, 1100 East, 200 South,
400 South, and 2100 South in Salt Lake City; University Avenue, 300 North and 700 East in Provo; and
Washington and Harrison Boulevards in Weber County. For detailed maps of the Latent Demand
WALKABILITY INDEX
The average Walkability Index of
TRAX and FrontRunner stations are
46% and 34%, respectively.
UCATS Final Report
October 2013
9
Index by county, click here. Click here to read more on the reasons Utahans walk or bike, and how
often.
PUBLIC OUTREACH
Previous active transportation
planning efforts by project partners
(such as UDOT’s 2008 Priority Routes
Study) included significant outreach
on a regional scale. Feedback from
those efforts was has been reviewed
by the UCATS project team to get a
more in-depth understanding of the
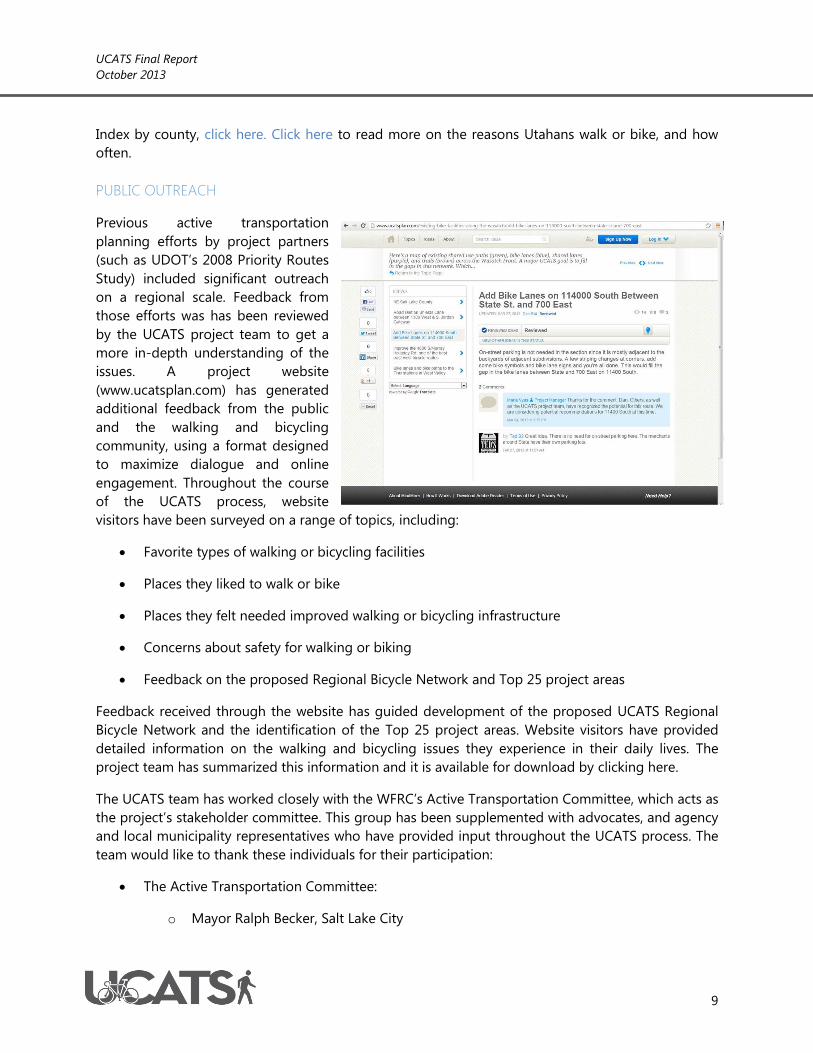
issues. A project website
(www.ucatsplan.com) has generated
additional feedback from the public
and the walking and bicycling
community, using a format designed
to maximize dialogue and online
engagement. Throughout the course
of the UCATS process, website
visitors have been surveyed on a range of topics, including:
Favorite types of walking or bicycling facilities
Places they liked to walk or bike
Places they felt needed improved walking or bicycling infrastructure
Concerns about safety for walking or biking
Feedback on the proposed Regional Bicycle Network and Top 25 project areas
Feedback received through the website has guided development of the proposed UCATS Regional
Bicycle Network and the identification of the Top 25 project areas. Website visitors have provided
detailed information on the walking and bicycling issues they experience in their daily lives. The
project team has summarized this information and it is available for download by clicking here.
The UCATS team has worked closely with the WFRC’s Active Transportation Committee, which acts as
the project’s stakeholder committee. This group has been supplemented with advocates, and agency
and local municipality representatives who have provided input throughout the UCATS process. The
team would like to thank these individuals for their participation:
The Active Transportation Committee:
o Mayor Ralph Becker, Salt Lake City
UCATS Final Report
October 2013
10
o Mayor Mike Caldwell, Ogden City Committee Vice-Chair
o Commissioner Louenda Downs, Davis County, Committee Chair
o Commissioner Larry Ellertson, Utah County
o Mayor Heather Jackson, Eagle Mountain City
o Councilmember Tina Kelley, Morgan County
o Mayor Brent Marshall, City of Grantsville
o Mayor Ben McAdams, Salt Lake County
o Cory Pope, UDOT
o Matt Sibul, UTA
o Mayor Todd Stevenson, Fruit Heights City
o Commissioner Jan Zogmaister, Weber County
o Scott Lyttle, Bike Utah
o Justin Anderson, Ogden City
o George Deneris, Salt Lake County
o Andrew Gruber, Wasatch Front Regional Council
o Ned Hacker, Wasatch Front Regional Council
o Scott Hess, Davis County
o Robin Hutcheson, Salt Lake City
o Jory Johner, Wasatch Front Regional Council
o Max Johnson, Salt Lake County
o Jim Price, Mountainland Association of Governments
o Greg Scott, Wasatch Front Regional Council
o Robert Scott, Weber County
o Evelyn Tuddenham, UDOT
o Josh Jones, City of Ogden
UCATS Stakeholder Committee:
UCATS Final Report
October 2013
11
o Roger Borgenicht, Utahans for Better Transportation
o Deborah Burney-Sigman, Breathe Utah
o Fred Doehring, UDOT
o Jesse Glidden, UDOT
o Paul Goodrich, Orem City
o Craig Hancock, UDOT
o Mike Hathorne, Suburban Land Reserve
o Dave Iltis, Cycling Utah
o Vincent Liu, UDOT
o AJ Martine, Salt Lake County Mayors Bicycle Advisory Committee
o Chad Mullins, Bike Utah
o Marjorie Rasmussen, UDOT
o George Shaw, South Jordan City
o Lisa Wilson, UDOT
o Brad Woods, Bike Utah
Materials and minutes from the ATC and UCATS stakeholder meetings can be found by clicking here.
UCATS Final Report
October 2013
12
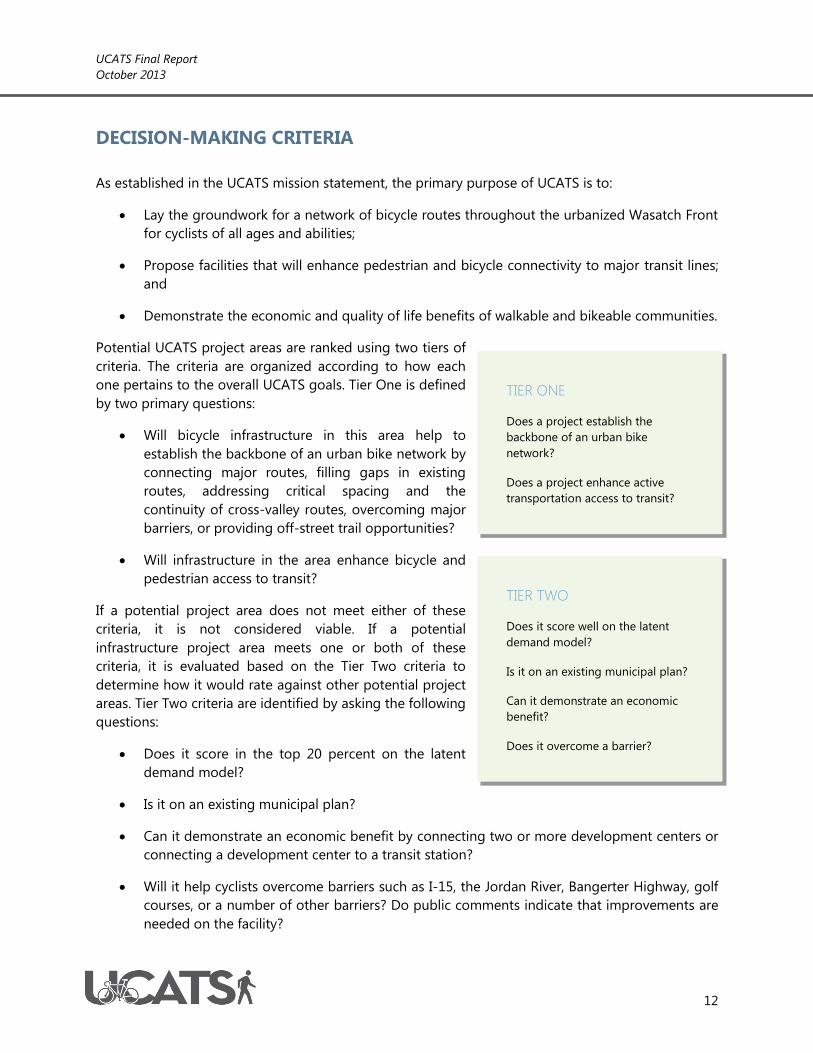
DECISION-MAKING CRITERIA
As established in the UCATS mission statement, the primary purpose of UCATS is to:
Lay the groundwork for a network of bicycle routes throughout the urbanized Wasatch Front
for cyclists of all ages and abilities;
Propose facilities that will enhance pedestrian and bicycle connectivity to major transit lines;
and
Demonstrate the economic and quality of life benefits of walkable and bikeable communities.
Potential UCATS project areas are ranked using two tiers of
criteria. The criteria are organized according to how each
one pertains to the overall UCATS goals. Tier One is defined
by two primary questions:
Will bicycle infrastructure in this area help to
establish the backbone of an urban bike network by
connecting major routes, filling gaps in existing
routes, addressing critical spacing and the
continuity of cross-valley routes, overcoming major
barriers, or providing off-street trail opportunities?
Will infrastructure in the area enhance bicycle and
pedestrian access to transit?
If a potential project area does not meet either of these
criteria, it is not considered viable. If a potential
infrastructure project area meets one or both of these
criteria, it is evaluated based on the Tier Two criteria to
determine how it would rate against other potential project
areas. Tier Two criteria are identified by asking the following
questions:
Does it score in the top 20 percent on the latent
demand model?
Is it on an existing municipal plan?
Can it demonstrate an economic benefit by connecting two or more development centers or
connecting a development center to a transit station?
Will it help cyclists overcome barriers such as I-15, the Jordan River, Bangerter Highway, golf
courses, or a number of other barriers? Do public comments indicate that improvements are
needed on the facility?
TIER ONE
Does a project establish the
backbone of an urban bike
network?
Does a project enhance active
transportation access to transit?
TIER TWO
Does it score well on the latent
demand model?
Is it on an existing municipal plan?
Can it demonstrate an economic
benefit?
Does it overcome a barrier?
UCATS Final Report
October 2013
13
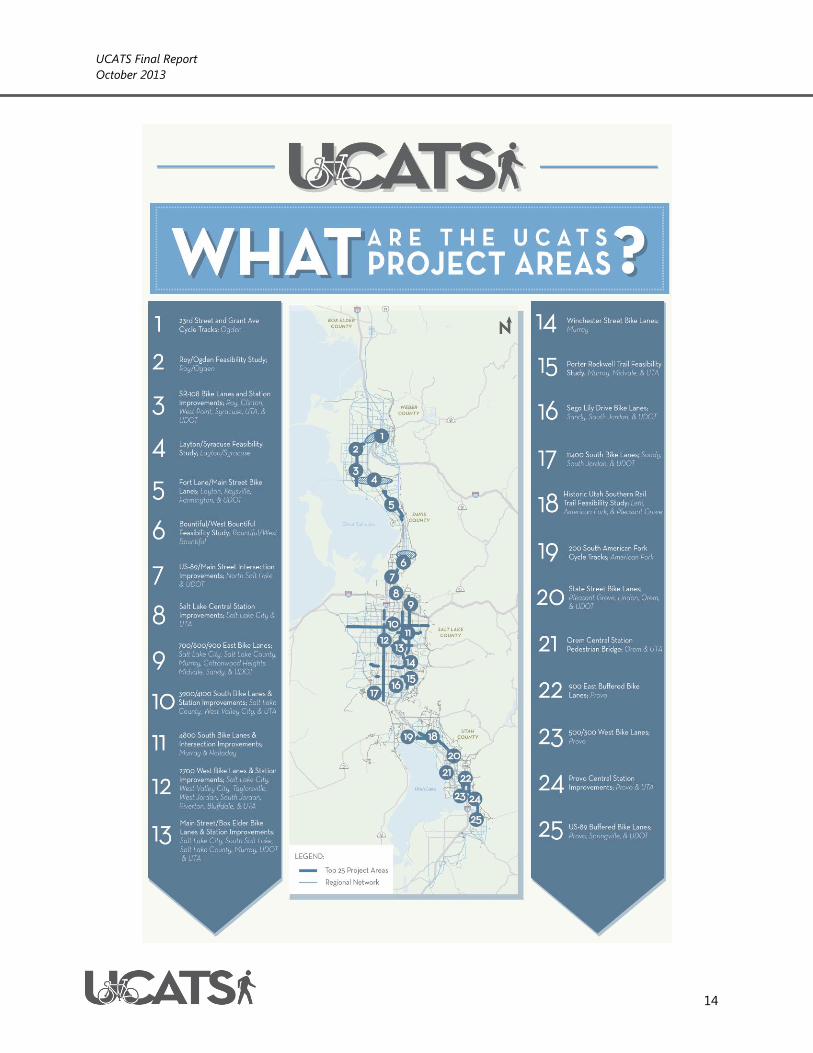
UCATS REGIONAL BICYCLE NETWORK AND TOP 25
The most important outcome of the UCATS process is the development of a regional network of
bicycle facilities and proposed projects that enhance active transportation access to transit. The
UCATS Regional Bicycle Network is comprised of bicycle facilities that fill in gaps in existing bicycle
networks, paths and routes, particularly those routes that connect to TRAX and FrontRunner transit
stations. Many of the regional network facilities are proposed on streets with less traffic and slower
speeds than parallel streets. These facilities appeal to people who may be less comfortable biking on
high-speed, multi-lane streets. All infrastructure proposed as part of the UCATS Regional Bicycle
Network meets one or both of the Tier One criteria by contributing to a regional network of bicycle
facilities, and/or enhancing access to transit.
Some routes and infrastructure proposed as part of the Regional Bicycle Network project areas also
meet the Tier Two criteria for UCATS projects by helping cyclists cross major barriers, linking locally
planned facilities, connecting people to economic centers, and/or scoring high on the latent demand
model. Routes and infrastructure that met the Tier One and Tier Two criteria became higher-priority
project areas, known as the Top 25. These areas have been analyzed in greater detail and reviewed
by UCATS stakeholders.
The UCATS Regional Bicycle Network and Top 25 project areas are available for viewing online. Click
here to see an illustrated map demonstrating all the proposed UCATS projects, including details on
the Top 25 project areas (the map works best when viewed in Google Chrome or Mozilla Firefox). An
illustration of the Regional Bicycle Network and Top 25 project areas is also provided below.
UCATS Final Report
October 2013
14
UCATS Final Report
October 2013
15
MAKING THE CASE FOR INVESTMENT
Walking and bicycling are effective ways for people to improve their health and wellbeing. But the
benefits of active transportation go beyond the health of the individual. A growing body of research
shows that active transportation can also benefit the environment and improve the transportation
network. The addition of active transportation infrastructure can even boost economic viability in the
places where it is located.
A short summary of UCATS research regarding the benefits of active transportation infrastructure is
provided below. Click here to see a detailed discussion with identified sources.
Air Quality
Research indicates that transportation accounts for
roughly 28 percent of the United States’ total
greenhouse gas (GHG) emissions (including carbon
dioxide, methane, hydrofluorocarbons,
perfluorocarbons, sulfur hexafluoride, and nitrous
oxide). Of commuting modes, automobiles have the
largest impact on air quality. Bicycling and walking
have a negligible GHG impact (outside of the
production needed in the manufacturing of the
bicycle).
The Rails To Trails Conservancy estimates that
bicycling and pedestrian travel can offset between 3
percent and 8 percent of GHG emissions in the United States caused by surface
transportation.
Many state applications for Congestion Mitigation and Air Quality Improvement Program
(CMAQ), a federal funding program, ask applicants to estimate the congestion and GHG
reduction potential of their bicycle and pedestrian projects. A federal review of CMAQ bicycle
and pedestrian projects found CO2 reductions of up to 38.4 kg emissions reductions each
day.
Reduced VMT
Many trips regularly done by car can be done by bicycle. The national average trip length is
2.25 miles for a one-way bicycling trip. Half of all trips taken in the United States are three
miles or less, with 40 percent under two miles. However, 90 percent of trips fewer than three
miles are taken by car.
A study in King County, Seattle, WA found that a 5 percent increase in walkability of a
community reduced vehicle miles traveled per capita by 6.5 percent and increased time spent
in physically active travel by 32.1 percent.
DID YOU KNOW?
According to research conducted
in the Portland area, every 1%
increase in miles traveled by active
transportation instead of by car
reduces regional greenhouse gas
emissions by 0.4%.
UCATS Final Report
October 2013
16
Congestion Reduction
A study by the Arizona Department of Transportation found significantly less congestion on
roads in older, higher density areas than in new, lower density suburban areas (volume-to-
capacity ratios of 0.8 to 0.9 compared to 1.6 to
2.0, respectively). Researchers determined this
connection was due to more mixed land uses
(particularly more retail in residential areas), more
transit and non-motorized travel, and a more
connected street grid, which provides more route
options and enables more walking and cycling.
Transit Benefits
Bike/transit integration supports both transit and
bicycle transportation and has proven successful
in attracting new transit riders. For example, 30 percent of users of Vancouver’s bike lockers
at a transit station had not previously used public transit to commute.
A study on bike access and how bicycle amenities effect mode share at California’s BART
stations found the Berkeley station increased its bicycle mode share from 7.4 percent to 11.7
percent and the Fruitvale station increased its bike mode share from 4.3 percent to 9.9
percent during the period from 1998-2008.
After bike racks were installed on Caltrain (the San Francisco-San Jose commuter rail system),
a 4 percent ridership increase was attributed to bicyclists.
Denver's Regional Transportation District (RTD) found that approximately 50 percent of the
bike-on-bus riders would not make the trip on transit if it were not for bike racks.
Mode Share Shift
Each additional mile of bicycle lane per square mile is correlated with an approximate one-
percent increase in the share of bike-to-work trips.
Cities with higher levels of bicycle infrastructure (lanes and paths) also saw higher levels of
bicycle commuting.
The construction of a bicycle and pedestrian bridge in Charleston, South Carolina led to more
cycling throughout the City. A survey conducted on trail use showed that 67 percent of users
claimed their physical activity had increased since the path opened.
Health Benefits
Communities with higher rates of bicycling and walking have lower obesity rates than
communities with lower levels of active transportation.
MAKING THE CASE
After bike racks were installed on
Caltrain (the San Francisco-San
Jose commuter rail system), a 4%
ridership increase was attributed to
bicyclists.
UCATS Final Report
October 2013
17
Researchers from Harvard University found that
bicycling for as little as five minutes each day can
prevent weight gain for middle aged women.
The National Institutes of Health have shown that
people are more likely to consistently ride a bicycle
or walk than to maintain a gym-based exercise
program.
Commuters using active transportation modes are
happier with their commutes.
People who use active transportation to commute
report fewer days of work missed due to illness
than those with non-active commutes.
A study by the National Institute of Health
determined that physically active employees
incurred approximately $250 less in health care
costs annually compared to sedentary employees.
An analysis of health savings generated by
Portland, Oregon’s bicycle infrastructure shows
that completion of their 2030 Plan would help the
City save $800 Million in fuel costs, health care,
and the value of reduced mortality.
Click here for an assessment of potential health benefits or impacts associated with the
UCATS Top 25 project areas.
Transportation Safety
There is safety in numbers. The walking/bicycling crash risk decreases as walking/bicycling
rates increase.
The National Institute of Health found that for every doubling of the number of cyclists, the
number of fatalities increases by 25 percent, thus reducing the overall risk of cycling by 37
percent.
In New York City, the increase in bike lanes reduced the risk of fatalities in pedestrian-
involved crashes by 40 percent (controlling for other factors). The installation of bike lanes
usually involves a narrowing of the motor vehicle portion of the roadway, which indicates to
drivers that they need to watch for other road users. These changes have a traffic calming
effect, lowering speeds and increasing driver attention.
The presence of bike lanes have been shown to reduce the overall crash rate by 18 percent
compared to streets without any bicycle facility.
MAKING THE CASE
An analysis of Portland, Oregon’s
bicycle infrastructure on health
savings shows that completion of
their 2030 Plan would help the City
save $800 Million due to fuel cost
savings, health care savings, and
the value of reduced mortality.
MAKING THE CASE
Bike lanes reduced the risk of
fatalities in pedestrian-involved
crashes by 40%.
UCATS Final Report
October 2013
18
Economic Benefits
The combined potential value of bicycling in Wisconsin totals nearly $2 billion yearly.
It’s been estimated that the entire bikeway network of Portland, Oregon was built for less
than the cost of constructing one mile of urban freeway.
Compared to the average US city, people in Portland, Oregon save $2.6 billion a year thanks
to reduced vehicular miles.
There is a 12.5 percent increase in productivity of employees who exercise as compared to
those who do not exercise.
The Southern Environmental Law Center cites examples of positive effects of pedestrian
improvements on retail sales and employment from Mountain Brook, a residential
community south of Birmingham, Alabama. As a result of pedestrian-friendly investments,
retail sales in the village increased by approximately 25 percent in the past two years.
A survey of residents along bicycle boulevards indicated that the majority of respondents felt
that bicycle boulevards have had a positive impact on home values, quality of life and sense
of community, along with reducing noise, improving air quality, and providing convenience
for bicyclists. Additionally, 42 percent of respondents said living on a bicycle boulevard
makes them more likely to bike.
Installation of bike lanes and bike racks can have a positive influence on the local economy.
Fort Worth, Texas spent $12,000 to purchase 80 bike racks and $160,000 on local road diets
in one district in town. As a result, local restaurants experienced a 200 percent increase in
business.
In a year of riding transit and using car share programs, a Bay Area bike commuter could
save between $6,677 and $6,957 per year over owning a car.
Click here for an assessment of how infrastructure investments at three UCATS project sites
(Ogden Central Station, 3900 South in Salt Lake County, and Provo Central Station) could
potentially add economic value to communities.
IMPACTS ON HOME VALUES
The walkability of an area can directly impact home
values. Homes with above average levels of
walkability are worth $4,000 to $34,000 more than
homes with average levels of walkability in the areas
studied. Typically, a one point increase in Walk Score
was associated with between a $500 and $3,000
increase in home value.
The Urban Land Institute compared four new pedestrian communities to determine the effect
of walkability on home prices. They determined that homebuyers were willing to pay $20,000
more for homes in walkable areas compared to similar homes in surrounding areas.
MAKING THE CASE
The combined potential value of
bicycling in Wisconsin totals nearly
$2 billion.
UCATS Final Report
October 2013
19
For developers, walkability translates into direct economic benefits. In Washington, buildings
in neighborhoods with good walkability command an average of $8.88/sq. ft. per year more
in office rents and $6.92/sq. ft. per year higher in retail rents, and generate 80 percent more
in retail sales as compared to places with fair walkability, holding household income levels
constant. Housing prices and property values are also increased in areas with higher
walkability – a place with good walkability, on average, commands $301.76 per month more
in residential rent and has for-sale residential property values of $81.54/sq. ft. more relative
to places with fair walkability, holding household income levels constant.
On a 100-point scale, a 10 point increase in walkability increases property values by 1-9
percent, depending on property type.
Adjacency to trails can also have a positive effect on property values. For instance, according
to the Rails to Trails Conservancy, lots adjacent to Wisconsin’s Mountain Bay Trail sold for 9
percent more than similar properties not adjacent to the trail.
In Apex, North Carolina, houses adjacent to a regional greenway sold for $5,000 more than
houses in the same subdivision that were not on
the greenway.
In Virginia, the influence of a trail on local and
nonlocal spending was estimated to be $2.5
million and total output was estimated to be $1.59
million, supporting 27.4 full-time job equivalents
annually.
In Ohio, analysis on the impact of a trail on
property values suggests that each one-foot
increase in distance from an existing trail decreases the sale price of a sample property by
$7.05. In other words, being closer a trail facility adds value to the single family residential
properties.
JOB CREATION
A national study of employment impacts following the installation of bicycle and pedestrian
infrastructure estimated that each $1 million in bicycle-related projects creates 11.4 jobs from
direct, indirect and induced construction spending. Likewise, pedestrian-only projects create
about 10 jobs and multi-use path projects create 9.6 jobs per $1 million of project cost.
Projects that combine pedestrian and bicycle facilities with other road improvements create
7.8 jobs per $1 million. In contrast, road-only projects generated 7.75 jobs per $1 million.
Spillover (indirect) employment adds an additional 3 jobs per $1 million.
In Colorado, the bicycling industry has created 513 manufacturing jobs and 700 full-time
equivalent retail jobs.
Bicycling has also shown to be integral in the tourism industry. Half of all summer visitors to
Colorado’s ski resorts spent time bicycling and most (70 percent of out of state visitors and
40 percent of local Coloradoans) said they would have chosen an alternative vacation
destination if bicycling was not available.
MAKING THE CASE
Bicycle projects create 11.4 jobs for
every $1 million invested, while
road-only projects create 7.75 jobs
per $1 million.
UCATS Final Report
October 2013
20
Similar results have been shown in Wisconsin, where the bicycling industry (consisting of
manufacturing, distribution, retail, and other services) contributes $556 million and 3,418 jobs
to the Wisconsin economy.
Portland’s bicycle industry has also contributed significantly to the local economy. In 2008,
revenues in the bicycle-related economic sector were found to be nearly $90 million.
In North Carolina, the annual economic impact of bicycling tourism is estimated at $60
million, with 1,400 jobs created and supported per year.
TOURISM
Research by the Maine Department of Transportation indicates the economic benefits of
statewide bicycle tourism reached $36.3 million in direct spending by over 2 million bicycle
tourists annually. Additionally, spending by tourists has a multiplier effect. Taking that into
account, the total economic impact of the bicycle tourism market is estimated to be $66.8
million dollars. This is calculated to include earnings of over $18.0 million, in wages and
salaries, and 1,200 full-time equivalent jobs.
Over 42,000 Ontarians’ jobs were a result of the Trans Canada Trail in Ontario, Canada. The
trail was estimated to generate $2.4 billion dollars in value added income in the province.
A study of bicycling tourism in Moab, Utah estimated the annual economic impact of
bicycling to be $1.33 Million. Average consumer spending per person was estimated to be
$585.
UCATS Final Report
October 2013
21
IMPLEMENTATION OPPORTUNITIES
The challenge of many planning studies lies in implementation: How can we make the project vision
become a reality and see the infrastructure identified under the study through to construction?
Further complicating the issue is the need for funding and coordination of projects identified under
the study. The pool of money available for building bicycle and pedestrian facilities is somewhat
limited, with many potential projects competing for the available funds. Agencies that are
responsible for building new transportation facilities are more inclined to include planned active
transportation elements in their projects if they receive information early in the project’s
development. This gives them time to incorporate active transportation in the project’s scope and
budget and design. Active transportation planners in Utah need to be resourceful and collaborative
to successfully build a transportation system that effectively includes bicycling and walking.
As part of the UCATS process, each of the UCATS Top 25 project areas has been reviewed to
determine whether planned state or local improvement projects might be modified to include UCATS
project elements. This effort required coordination with UDOT as well as many local city and county
engineers. Project team members have also coordinated with UDOT maintenance staff to learn what
is required to maintain the proposed facilities.
Funding for UCATS projects could come from a wide range of sources. MAP-21, the federal
transportation bill passed in 2012, reduced some funding programs for active transportation projects
but added other new programs. The UCATS funding source matrix identifies programs, such as MAP-
21’s Transportation Alternatives Program, that can be used to pay for projects, as well as the
requirements and qualifications for the programs. Click here to see the matrix)
To provide background information to UCATS stakeholders, project cut sheets on each of the Top 25
project areas have been produced. The cut sheets contain insights on upcoming local government
and UDOT construction projects that could potentially incorporate UCATS elements, along with
details on the status, and contacts for the projects. Coordination of this sort will increase resources
and offer better prospects for implementation. Details can be found in the “Implementation
Opportunities” section of each Top 25 cut sheet. Click here to see the cut sheets for each UCATS Top
25 project area.
Each of the UCATS Top 25 cut sheets also includes an assessment of the degree of environmental
clearance that may be needed prior to design and construction in the project areas. Transportation
projects that are built using federal dollars must comply with the National Environmental Policy Act,
which means that certain types of projects must complete an environmental study prior to
construction. The UCATS project team has used UDOT’s UPlan Planning and Environmental Linkage
(PEL) tool to evaluate the degree of environmental documentation that may be required in each
project area, along with the types of environmental impacts that would likely need to be addressed
in an environmental document. This information is contained in the “Environmental Clearance”
section of each Top 25 sheet.
UCATS Final Report
October 2013
22
SUMMARY
Many people rely on walking and biking to get to school, work, transit, shopping and other places
they need to or want to access. Many more would walk and bike if adequate opportunities were
available. As Utah continues to grow, it becomes more important to provide walking and biking
facilities that are safe, comfortable and accessible for a wide range of people. The UCATS project is a
partnership among local government and transportation agencies across the Wasatch Front that
agree with the idea that active transportation is important to healthy and vibrant communities.
UCATS has developed a Regional Bicycle Network with links to transit and identified 25 project areas
where adding bicycle and/or pedestrian treatments will kick-start the implementation of the plans
developed under the project. These plans will act as a foundation for creating a network of
connections that will eventually grow into a complete active transportation system for the Wasatch
Front.


![Final Mining Update - October[1]](https://img.pdfslide.net/doc/110x75/5571fbc1497959916995bc41/final-mining-update-october1.jpg)