Embed Size (px)
Citation preview

COLLEGE OF ENGINEERING
REPRODUCED BY
U.S. DEPARTMENT OF,COMMERCENATIONAL TECHNICAL INFORMATION SERVICESPRINGFIELD, VA, 22161
.IPB91-210898
UNIVERSITY OF CALIFORNIA AT BERKELEY
by
EARTHQUAKE ENGINEERING RESEARCH CENTER
IBRAHIM F. KHATIB
STEPHEN A. MAHIN
KARL S. PISTER
Report to the National Science Foundation
SEISMIC BEHAVIOR OFCONCENTRICALLY BRACEI)STEEL FRAMES
REPORT NO.
UCB/EERC.88101
JANUARY 19118
1:-,1~i.WWY1:_----..;'"

For sale by the National Technical InformationService, U.S. Department of Commerce,Springfield, Virginia 22161
See back of report for up to date listing ofEERC reports.
DISCLAIMERAny OpiniOnS, findings, and conclusions orrecommendations expressed in this publication are those of the authors and do not necessarily reflect the views of the National Science . Foundation or the EarthquakeEngineering Research Center, University ofCalifornia at Berkeley.

50272-101
REPORT DOCUMEN·rATJON 11. REPORT NO. .,
PAGE NSF/ENG-880402. 3. : PB91-210898
4. Title and Sublltle
"Seismic Behavior of Concentrically Braced Steel Frames."
7. Author(s)
I. Khatib, S. Mahin. and K. Pister9. PerformIns 0l1lanlzatlon Name and Acid,...
Earthquake Engineering Research CenterUniversity of California, Berkeley1301 S 46th St.Richmond, CA 94804
12. Sponsorins Ol1lanizatl,)n Name and Add.....
National Science Foundation1800 G. St. NWWashington, DC 20550
5. Report Date
JauJary 1988
10. ~1..:tlTaslclWork Unit No.
11. Contrllct(C) or Grant(G) No.
(C)
(G) CEE-8414904
14.
16. Ab.tract (Umit: 200 w.)nIs)
Concentrically braced steel frames designed by conventional methods may exhibit severalundesirable modes of behavior. Chevron-braced fr~mes have an inelastic cyclic behaviorthat is often characterized by rapid redistribution of internal forces.Cl deterioration ofstrength, a tendency of form soft stories, and fracture due to excessivE~ deformation demand. Parameters having a significant influence on these phenomena are identified.
, Recommendations are offered related to preferable ranges of brace slendE!rness, approachesfor designing 'beams, and a simplif.ied capacity design approach for proportioning columnsand connections. Optimization techniques are applied to the design of c:hevron-bracedto improve their seismic reponse. Further improvements related to changes in structuralsystems are pn~sented. These include the use of double story X-braced framing, incorporation of a sl~condary moment resisting frame, and the use of braces in a V configuration.Each of these iapproaches has advantages in certain circumstances. Each has disadvantageswhich are examined using results of analytical parametric studies. The basis of a newstructural system which incorporates vertical linkage eJemmts in a convEmtional chevronbraced frame and appears to overcome in an economical a,nd practical way many of the deficiencies of c.hevron-braced frames is examined and its effectiveness dE:monstrated.
17. Oocument Analysis a. Oescrlptors
concentrically bracedchevron-bracedX-bracedseismic
b. Identlfiers/Open·End"d Terms
steel frames
Co COSATI Field/Group
18. Availability Statemen:
Release Unlimited
[See ANSI-Z39.18)
19. Security Cla.s (This Report)
unclassified:zo. Security Cia.. (Thi. Pase)
unclassifiedSee InstructIon. on R...erse
/
21. No. of Pas"
23022. Price
OPTIONAL FORM 272 (4-77)(Formerly NTIS-3S)Department of Commerce


·(.tv
SEIs~ncBEllAVIOR OF CONCENfRlCALLY BRACED STEEL FRAMES
by
Ibrahim F. Khatib
Stephen A. Mahin
Karl S. Pister
A Re{X>rt on Research Conductedunder Grant CEB8414904 fromthe National Science Foundation
ReJXJI1 No. UCB'EERC-8&'01Earthquake Engineering Research Center
University of CaliforniaBerkeley, California
January 1988


ABSTRACT
Cono~ntrically braced steel frames designed by conventional methods may exhi
bit severall undesirable modes of behavior. In particular, chevron-braced frames
have an inelastic cyclic behavior that is often characterized by a rapid redistribution
of internal forces, a deterioration of strength, a tendency to form soft stories, and
fracture due to excessive deformation demand. Through analytical studies and
numerical simulations, parameters having a significant influence on these
phenomena are identified. Recommendations are offered related to preferable
ranges of brace slenderness, approaches for designing beams, and a simplified capa
city design approach for proportioning columns and connections. Optimization tech
niques are applied to the design of chevron-braced frames to improve their seismic
response. Further improvements related to changes in structural systems are
presented and discussed. These include the use of double story X-braced framing,
incorporation of a secondary moment resisting frame, and the use of bra:es in a V
configuration. Each of these approaches has been investigated and each has advan
tages in certain circumstances. Each also has disadvantages which are examined
using results of analytical parametric studies. A new structural system which incor
porates vertical linkage elements in a conventional chevron-braced frame appears to
overcome in an economical and practical way many of the deficiencies of chevron
braced frames. The basis of this system is examined, its effectiveness is demon
strated using analytical results, and finally, further research directions are outlined.

11
ACKNOWLEDGEMENTS
The study reported herein was supported by the National Science Foundation
grant CEE-8414904. This support is gratefully acknowledged. The views presented
herein, however, are those of the authors and not necessarily those of the National
Science Foundation.

111
TABLE OF CONTENTS
Abstract .Acknowledgements... II
Table of C:ontents 111
Notation VIi
Chapter 1: Introduction 11.1 Nature of the problem 11.2 Analytical studies ,. '" 21.3 Experimental studies 51.4 Discussion 61.5 Objectives 81.6 Scope 9
Chapter 2: Hysteretic behavior of braces 112.1 Introduction ,........ 112.2 Experimental programs 112.3 Analytical brace models 12
2.3.1 Physical models (force driven) 132.3.2 Kinematic models (displacement driven) 142.3.3 Phenomenological models (empirical) 14
2.4 Dimensionless brace model 142.4.1 Assumptions 152.4.2 Terminology......... 152.4.3 Normalization 16
2.5 Post buckling behavior of braces 162.6 Post buckling tangent stiffness 182.7 Energy dissipation demand 192.8 Energy dissipation capacity .. 20
2.8.1 Damage index for braces 202.8.2 Assumptions for the energy dissipation capacity of braces 212.8.3 Upper bound solution 1: global buckling mechanism 212.8.4 Upper bound solution 2: local buckling mechanism. '" 23
2.9 Displacement ductility capacity 252.10 C:onclusions 26
Chapter 3: Quasistatic inelastic force redistributions 273.1 Introduction 273.2 Postbuckling story lateral stiffness 27
3.2.1 Classification of beams 303.2.2 Vertical unbalance load on beams 31
3.3 Types of collapse mechanisms 32

iv
............................................................................................................................. 45454546464748494951515152525253545455555656565859616161
3.3.1 Flexible beam collapse mechanism 323.3.2 Stiff beam collapse mechanism 33
3.4 Computer simulations 343.4.1 Chevron-braced frames at constant Pc 353.4.2 Chevron-braced frames at constant Py 37
3.5 Conclusions 39Chapter 4: Inelastic dynamic response of a chevron-braced panel....................... 40
4.1 Introduction 404.2 Systems compared ,....................... 404.3 Response comparison for idealized excitations 414.4 Findings 414.5 Comparison of inelastic design spectra 424.6 Findings 434.7 Conclusions :................... 44
Chapter 5: Inelastic dynamic response of multistory chevron-braced frames
5.1 Introduction .5.2 Structural models .5.3 Cases considered .
5.3.1 The first set : .5.3.2 The second set .5.3.3 The third set .
5.4 Earthquake loading .5.5 Response quantities ; .5.6 Description of results .
5.6.1 Elastic design versus inelastic design ..5.6.2 Pinned connections versus moment connections .5.6.3 Stiff beams versus flexible beams .5.6.4 Stocky braces versus intermediate slenderness braces .5.6.5 Accidental variation in brace strength ..5.6.6 Large versus small frame participation .5:6.7 Proportional brace design ..5.6.8 Effect of ground motion intensity .
5.7 Analysis of results .5.7.1 Energy dissipation demand .5.7.2 Maximum story shear .5.7.3 Maximum story drift .5.7.4 Coupling of horizontal and vertical deformations .5.7.5 Column compression .
5.8 Conclusions .Chapter 6: Optimization of chevron-braced steel frames .
6.1 Introduction .6.2 Background of DELIGHT.STRUcr ..
v
6.3 Design methodology supported by DELIGHT.STRUCf 626.3.1 Limit states 626.3.2 Constraints 636.3.3 Objective functions 636.3.4 Design variables ,............... 64
6.4 Cases considered 646.5 Description of results 66
6.5.1 Volume of structure 666.5.2 Columns 666.5.3 Beams 676.5.4 Braces 676.5.5 Structural period 686.5.6 Frame participation 696.5.7 Beam to brace stiffness ratio 706.5.8 Story strength and stiffness distribution 706.5.9 Modal shapes and modal correlation 716.5.10 Set of active constraints 71
6.6 Conclusions 71Chapter 7.: Alternative structural systems 74
7.1 Introduction 747.2 Basic structural variants 747.3 Sirrrulation results 75
7.3.1 X-bracing 757.3.2 V-bracing 767.3.3 Split-X 777.3.4 Tie-bars-to-ground . 78
7.4 Need for a new configuration .. 787.5 Mechanism of the ZIPPER effect 797.6 Comparison of the ZIPPER configuration with KREG and TBTG
807.6.1 Maximum story shears 807.6.2 Maximum story drifts 817.6.3 Energy dissipation demand 827.6.4 Maximum interior column compression 827.6.5 Maximum exterior column compression 837.6.6 Maximum tie-bar forces 83
7.7 Conclusions 84Chapter 8: Conclusions and recommendations 87
8.1 SU'rnmary 878.2 Inelastic behavior of chevron-braced frames 878.3 Concepts validated 888.4 Concepts invalidated 888.5 Ne:w concepts 898.6 Further research needs 91

vi
8.6.1 Analytical .8.6.2 Experimental : .8.6.3 Numerical .
Appendix A: Miscellaneous analytical details .A.1 Introduction .A.2 Post buckling behavior of a brace .A.3 Post buckling brace tangent stiffness .A.4 Derivation of chevron-braced story post buckling stiffness .
A.4.1 Geometry .A.4.2 Material properties .A.4.3 Equilibrium .
Appendix B: Bounds on maximum column compression .B.1 Introduction .B.2 Column forces in KREG .
B.2.1 Maximum interior column compression for KREG ..B.2.2 Maximum exterior column compression for KREG .
B.3 Column forces in KSTO ; .B.3.1 Maximum interior column compression for KSTO .B.3.2 Maximum exterior column compression for KSTO ..
B.4 Column forces in KPRO .B.4.1 Maximum interior column compression for KPRO ..B.4.2 Maximum exterior column compression for KPRO .
B.5 Conclusions .Appendix C: Bounds on maximum tie-bar forces in TBTG and ZIPPER
C.1 Introduction .C.2 Maximum tie-bar compression in TBTG .C.3 Maximum tie-bar compression in ZIPPER .C.4 Maximum tie-bar tension in ZIPPER .C.5 Tie-bar stiffness in the ZIPPER configuration .C.6 Conclusions .
References .Tables .Figures .
9192929393939697979798
102102103104106107107109109109111112
114114114115116116117118124146

NOTATION
A --
E --
Fe
Hi
I
KoKbb
K bm
Kbr
KerKe
L
Mo
~P
Pe
Pet
PCAP
PDPg
p.gI
Po
PT
Purl.
Pun
Py
d
k
r
===
=
===
=
=
=
Vll
Cross sectional area
Modulus of elasticity
Story shear at impending buckling
Story height above base
Moment of inertia of cross-section
Story stiffness
Buckled brace contribution to story stiffness
Beam stiffness at midspan
Brace contribution to story stiffness
Frame contribution to story drift stiffness
Story stiffness with one brace buckled
Member length
Story overturning moment
Plastic moment of beam
Mean peak column compression
Brace buckling load
Column tension
Yield compression strength of column
Dynamic unbalance component of braced bay column compression
Gravity component of braced bay column compression
Midspan conc. load equiv. to uniform gravity loads at sto:ry i
Overturning moment component of braced bay column ccmpression
Total estimated column compression (SRSS approach)
Upper bound on dyn. unb. force from braces of story i
Unbalance load at beam midspan
Tension yield force
Depth of section
Effective length factor of the brace
Governing radius of gyration of cross-section
Total distributed gravity service load at story i
New cross-section factor
Shape factor of cross-section
Brace slenderness
Angle of inclination of brace


I.
CHAPTER I
INfRODUCTION
1.1. NATURE OF THE PROBLEM
Conce:ntrically braced steel frames are often used in the construction of multi
story high rise buildings. Compared with moment resisting frames, braced frames are
more efficient in providing the strength requircd to resist latcral loads and the stiff
ness needed to limit story drifts. The technique used for their design is usually an
allowable stress approach. It consists of a static clastic analysis for distributed lateral
loads in addition to the service level vertical gravity loads. Structural elements are
then proportioned on the basis of allowable stresses. Initially developed to account
for wind loading, this design technique is also used for earthquake resistant design.
Even though significant inelastic deformations are anticipated in braced frames in
the event of major earthquake shaking, this design approach has not been seriously
questioned until recently; most seismically resistant design codes still reeommend
equivalent static lateral loads corresponding to the elastic range of behavior.
Studies on the seismic response of braced frames progressed slowly until the
1970's. The expansion of offshore oil exploration in regions of seismic risk stimu
lated analytical and experimental investigations of the inelastic cyclic re;ponse of
tubular steel braced structures [6]. At the same time, evidence was accumulating
that buildings with braced frames were being damaged during major earthquakes in
the United States [74]' Japan [85] and more recently in Mexico [8]. These events
motivated an increasing number of studies on the inelastic behavior of steel braced
frames both analytically and experimentally. A good deal of this research effort has
focused on the study of individual brace behavior. Braced frames, when studied,
were often simple one bay one story structures, and were used to explore the effect
of end restraints on the behavior of braces. Comparatively fewer studies have been
oriented towards understanding the behavior of multistory braced frames a:ting as a
system. O)nsequently, numerous questions still exist regarding the influence of vari
ous design parameters on the response of steel braced frames and many uncertainties
remain regarding the adequacy of current design methods.
In the remainder of this chapter some results of the most relevant analytical and
experimental studies concerning braces and concentrically braced building frames are
reviewed, and their influence on current code provisions is examined. After sum
marizing the points on which all studies agree, conflicting and controversial items are

2
identified. These unresolved items fonn the basis of the research objectives for this
study. A detailed research plan is presented at the end of this chapter.
1.2. ANALYTICAL STUDIES
In one of the first analytical studies of frame response Workman [94] analyzed
a ten story X braced, single bay building frame using an elasto-plastic tension only
model to represent brace behavior. This model roughly approximated the hysteretic
behavior of very slender braces. Nonetheless it gave valuable insight'! into the differ
ences between the elastic and inelastic response of simple braced frames.
Jain, Gael and Hanson [38] studied the response of seven story frames with X,
chevron and eccentric (split-K) bracing. Two variants of the chevron-braced frames
were investigated; one with "weak girders" and "strong braces" and one with "weak
girders" and "weak braces". The quoted adjectives "weak" and "strong" are intended
to emphasize the fact that different authors associate different meanings to these
terms. For each type of bracing system, two brace slendemcsses (60 and 120) were
investigated. In the first phase of this investigation, only the elastic responses were
compared. In the second phase, the inelastic responses were compared for a single
triangular base acceleration pulse with a 1.5 g magnitude and a duration of 1/15 of
the structures' fundamental periods. In the third phase, only the seismic inelastic
response of eccentrically braced (split K) systems was studied. The comparison
quantities were the maximum story displacements, the maximum story shears, axial
forces in columns and braces, member ductilities, displacement and plastification his
tories. This study concluded that stocky braces of A :s; 60 should be treated as hav
ing fixed ends, while slender braces of A ~ 120 can be considered as pin-ended. It.
found that chevron-braced frames with "weak beams" suffer considerable plastifica
tion in columns and bracing members, irrespective of brace strength. In a subse
quent study, Singh [77] used a single story, single bay, chevron-braced frame to
compare the inelastic dynamic response obtained with various phenomenological
models developed up to that time. He concluded that the response predictions arc
very sensitive to the type of model used.
Jain and Goel [39] studied the response of two seven story, chevron-braced
frames subjected to a real and an artificial earthquake ground motion record. One
frame was designed as having "weak girders" and braces with intermediate slender
ness; the other had "strong beams" and "weak braces" (slender braces with a reduced
buckling load). The study concluded that stocky braces increase the ductility
demand in girders, columns and braces. They found that a "strong girder-weak

3
brace" design induces a better distribution of yielding over the height of the struc
ture. They also found that braces rarely yield in tension. Story displacements were
found to increase with increasing brace slenderness.
The response of several ten story, chevron-braced frames designed according to
different philosophies were studied by Nilforoushan [55]. In one frame (C) the
bracing members were considered as secondary elements ("strong beam-w~ak brace"
design). In the second frame (F) the bracing members were considered a~; main ele
ments statically supporting the beam at midspan ("weak beam-strong brace" design).
The third frame (FM) was designed similar to the second, except that it did not take
advantage of the 33% increase in allowable stresses for the braces for earthquake
loads. An X braced frame was considered for comparison. Nilforoushan found that
compared to a "strong beam-weak brace" design, the "weak beam-strong brace"
design had lighter girders, but suffered larger story displacements and accelerations,
and larger column axial forces in the upper stories. Braces in the "weak beam-strong
brace" design never yielded in tension. Compared to the other two designs, the con
servatively designed "weak beam-strong brace" (FM) frame had smaller story dis
placements, les~ energy dissipation in girders and braces, but greater column axial
forces. Compared to the chevron-braced frames, the X braced frame had a longer
fundamental period, more energy input, less energy dissipation, larger column duc
tility demands in lower floors and smaller beam ductility demands in the upper
floors. Gael [28] studied the combined effect of horizontal and vertical ground exci
tation from the 1940 El Centro earthquake on six story frames using chevron and
split X bracing. He concluded that split X systems are more sensitive to the vertical
component of ground aoceleration than chevron-braced systems. For horizontal exci~
tation only, they induce less yielding than chevron bracing, but for combined vertical
and horizontal input they cause more ductility demand in the columns.
Anderson [3] studied the inelastic response of three variants of a ten story
chevron-braced frame designed according to the "weak beam-strong braoe" concept.
The first frame had a single chevron-braced bay over its entire height. The second
frame was similar to the first except for the addition of a top hat truss. The third
frame was similar to the first except for a soft first story obtained by deleting the
bracing in the first story. He concluded that chevron bracing is effective in limiting
story drift in the inelastic range. Inelastic deformations tended to concentrate in the
soft stories (first story of the third frame). The outrigger truss improved the
response by transfering overturning axial forces from the interior columns to the
exterior ones. This increased the moment resisting capacity of the interior columns,

4
and the overturning moment capacity of the frame.
Ikeda [35] developed a "refined physical theory" brace model and used it to
reproduce experimental results already obtained for an offshore platfonn model, and
for a six story chevron-braced steel frame. He conducted parametric studies to select
the best analysis strategy and to investigate the governing design parameters for
chevron-braced frames. He found the response to be extremely sensitive to the
characteristics of earthquake ground motions. In addition, the response was found
sensitive to brace parameters in cases where a "weak" moment resisting frame was
used; when inelastic defonnations spread over braces, beams and columns. He
noted that the effects of brace slenderness and of brace buckling strength could be
separated. For example, at constant brace slenderness increasing the brace buckling
load reduced the occurrence of inelastic behavior. At constant buckling capacity,
large slenderness braces caused an increase in story stiffness and beam.s plastification,
but they reduced the occurrence of tension yielding in braces. Small slenderness
braces provided the structur~ with more ductility capacity.
Shibata and Wakabayashi [88] studied the response of a chevron-braced one
story one, bay frame to alternating cyclic defonnation. They concluded that the
strength deteriorates under constant amplitude repeated defonnation. The rate of
strength deterioration was linked to the stiffness of the beam and the slenderness of
the braces, being larger for slender braces in combination with flexible beams, than
for stocky braces and stiff beams. Most of the deterioration occurs in the first hys
teresis cycle. Tsugawa et aL [87] analysed chevron-braced frames of different pro
portions and concluded that a stiff beam allows story strength to increase after brace
buckling, while with a flexible beam the ultimate strength is lower than that at first
buckling. Sakamoto [70] conducted a Monte Carlo simulation of a three bay
multistory X braced frame for four different brace slendernesses (X. = 0,46,93,183).
Each frame was subjected to twenty artificial earthquake records. He concluded
that except for displacements the response in general becomes morc irregular with
increasing frame contribution to the lateral load resisting system. However, he
recommended that the frame participation be kept over 50%. Inoue [34] analyzed a
ten story X braced frame proportioned by plastic design. He concluded that lateral
story displacements become smaller and more unifonn as brace slenderness
increased. Fujiwara [24] studied the response of a seven story X braced frame sub
jected to five artificial earthquakes. He observed that maximum story drifts
increased with increasing brace slenderness. He explained this phenomenon by the
fact that the increased column compression that is associated with slender braces

5
favors a cantilever bending mode of deformation of the frame as a whole. He
recommended a gradual reduction of brace stiffness over the height of the structure
such that the top story braces have 30 to 40% the stiffness of the first story braces.
Design codes [6] for fixed offshore structures to be located in regions of seismic
hazard stipulate that the inelastic response of the structure be explicitly calculated to
demonstrate structural integrity during rare and unusually severe seismic events.
Considerable research has been carried out to develop analytical tools to perform
these computations, and numerous investigations of braced platform performance
have been undertaken [95]. However, as these structures often differ in many signi
ficant ways from building frames, this material will not be reviewed herein.
1.3. EXPERIMENTAL STUDIES
Wakabayashi et al [89] subjected a one story one bay X braced frame to alter
nating cyc:lic loading. They used various types of braces: H sections, tube sections
and built up sections. They compared the hysteresis behavior of the different brace
types and examined the effect of end restraints. They found that slender braces
resulted in significantly pinched hysteresis loops for the structure as a whole.
Takane and Tokyama [84] also tested a one story one bay chevron-bra::ed frame
subjected to alternating cyclic loading. For the stocky braces used, they concluded
that unless the beam is very stiff, the maximum strength deteriorates with repeated
cycling.
Fukuta et a1 [25] subjected a three story, two bay chevron-braced frame to
alternating cyclic deformation. They found that the composite (steel and concrete)
beams were very ductile, and that the brace buckling load was correctly predicted by
assuming the effective length factor (k) for the brace equal to unity. However, the
shape of the hysteresis loops corresponded more to a k between 0.50 and 0.65.
Takanashi and Ohi [83] carried shaking table tests on three story models of
unbraced and X braced frames. They concluded that braces reduce story drift con
siderably even if they buckle. Ghanaat and Clough [26] performed shaking table
tests on a moment resisting frame X braced with rods, pipes and double angles.
They concluded that rods are undesirable for bracing. Even if pretensioned, they
tend to slacken after a few cycles and impose impact loading on the frame as they
pick up tension again. Their failure tends to be brittle (by fracture). Dot;ble angles
and pipes are to be preferred for their good energy dissipation capacity, ~;pecially if
they are of low slenderness (PdPy > 0.5). Astaneh-Asl, Gael and Hanson [10]
observed that in an X-braced building frame the gusset plate joining braces at their

6
intersection causes uncertain end conditions for brace segments and hence unpredict
able behavior in compression.
Gough and Ghanaat [27] performed shaking table tests on a 5/48 scale model
of an X braced offshore platform frame made of tubular members. Quasistatic and
pseudo-dynamic tests [95] of a similar X braced frame were also performed. These
studies found that small brace slenderness and careful detailing provided full hys
teresis loops. However, initiation of local buckling led to a rapid deterioration of
brace stiffness and strength. In X braced panels, only one half of the compression
strut tended to buckle instead of both segments, thereby increasing local deformation
demands.
1.4. DISCUSSION
These studies have been of great value in revealing the many factors that influ
ence the behavior of braced frames. All the references reviewed agree on the fol
lowing points concerning the inelastic behavior of concentrically braced frames in
general. Braced frames are very effective in reducing lateral deflections. Braces
provide most of the lateral stiffness until they buckle. Since the strength of a
moment resisting frame develops at a much slower rate than that of a braced frame,
the inelastic behavior of braces governs the inelastic response of the entire frame.
The large reduction in brace stiffness after brace buckling subjects braced frames to
force redistributions that are more drastic than in ductile moment resisting frames
(DMRF). Such force redistributions, undetectable by elastic analysis, can lead to
premature loss of strength and to concentration of damage. Braced frames have less
displacement ductility capacity than ductile moment resisting frames.
In addition, chevron-braced frames have several peculiarities of their own.
Chevron-braced bays were found to fail in one of two mechanisms [74,92,84,87]:
1- A weak beam mechanism where the buckling of the compression brace
causes an unbalance force to be applied on the beam and subsequently the for
mation of plastic hinges in the beam.
Weak beams lead to considerable plastification in columns, beams and braces,
irrespective of brace slenderness. Slender braces mcrea<;e the ductility demand
in all remaining members, and rarely yield in tension.
2- A strong beam mechanism where buckling of the compression brace is fol
lowed by yielding of the tension brace, the beam being sufficiently strong to
remain elastic despite the vertical unbalance force applied to it by the braces at
midspan. Chevron-braced frames with strong beams and weak braces exhibit a
7
more uniform distribution of yielding with height than frames with weak beams
and strong braces.
Neveltheless, these studies have been of limited value in formulating design
recommendations concerning the member proportioning needed to obtain :a satisfac
tory inelastic behavior. There are several reasons behind this shortcoming. Most of
these studies have individually focused on only a few aspects of structural behavior.
Similarly, the basic assumptions and terminology have varied from study to study.
For example, in some studies the strength of an element refers actually to its stiffness
while in others it means its yield strength, and in others its buckling strength. In
some studiies the slenderness of the brace varies while the cross-sectional area is kept
constant; in other studies the brace slenderness and cross-sectional area vary such
that the brace buckling load remains constant. Most of the early analytical studies
were hampered by the lack of adequate brace models. An elasto-plastic model
overestimates the energy dissipation capacity of the brace and cannot reproduce the
global instability that accompanies buckling. Some early phenomenological models
could not reproduce the observed reduction in buckling load following inelastic
cycling. In many studies the inelastic analysis was based on only one or t'wo ground
motions of similar characteristics. These studies do not account for the strong sensi
tivity of the inelastic response to the characteristics of the ground motion.
As a result it is not surprising to see different studies conclude with conflicting
recommendations. For example, SEAOC [74] discourages the use of chevron
braced frames by requiring larger equivalent lateral forces in their design, and the
New Zealand code [93] does not allow their use in structures more than rive stories
high. On the other hand, the Japanese code [5] expects frame and bracing to resist
loads in proportion to their elastic stiffness, and requires the frame to have an ulti
mate strength that is a fraction of that of the braced bay. Meanwhile, Cheng and
Juang [20], based on an optimization study of elastic structural systems, conclude
that chevron-braced frames are the most efficient concentric bracing system. More
over, most researchers [18,26,89,56,5] favor the use of low slenderness braces over
braces of large slenderness because the former have "full" and "stable" hysteresis
loops, allowing them to dissipate more energy for a given displacement amplitude.
They discount slender braces on the basis of their low buckling load, their pinched
hysteresis loops (leading to "creeping" collapse), the impact loading when
straightened out (leading to fracture in connections), and the high axial forces they
induce in columns. Yet others [38,76,34] prefer slender braces on the basis that
early compression buckling will cause the tension brace to yield and dissipate energy

8
in tension. They argue that this energy dissipation mechanism is more reliable than
that of plastic hinge rotation in inelastic buckling of stocky braces which are likely to
fail prematurely by local buckling of the flanges.
In the case of chevron-braced frames it is not evident from the data in the
literature which collapse mechanism is preferable. The weak beam mechanism con
centrates the energy dissipation in the beams which are better energy dissipators than
the braces. However, it causes a deteriorating force deformation curve which leads
to more energy dissipation demand. The strong beam mechanism provides a tri
linear force deformation characteristic which is believed by many [53,68,69,88] to be
an ideal force deformation characteristic. On the other hand, it concentrates the
energy dissipation in the braces (the least capable elements) and may require unrea
sonably stiff and strong beams. In addition, it increases the maximum column
compression and hence the danger of column buckling. This is a very undesirable
situation for it might lead to column failure, soft story formation, or incremental col
lapse.
As for code recommendations concerning the design of steCl braced frames,
detailing requirements for connections based on capacity design are well founded.
However, most codes still proceed on the basis of elastic analyses under reduced
equivalent lateral loads. The complex inelastic behavior of braced frames and the
limited energy dissipation capacity of braces make rational selection of design load
factors difficult. Use of small load reduction factors reduces the probability of ine
lastic behavior. However, given the complexity of braced frame behavior and the
diversity of the factors influencing this behavior, it is not clear whether current code
provisions provide the same degree of safety as for moment resisting frames or
whether they are unduly conservative.
1.5. OBJECTIVES
In view of these observations , this research aims at investigating the inelastic
behavior of chevron-braced frames, and more specifically:
(1)- To investigate the parameters that affect the inelastic force redistributions
in chevron-braced frames.
(2)- To trace the sensitivity of their response to these parameters.
(3)- To look for optimal proportioning rulcs that can improve the response of
these frames.
(4)- To evaluate different design variants of chevron-braced frames.
(5)- To formulate design recommendations in a form that might be included in

9
design codes or their commentaries.
In carrying out this investigation, certain basic precepts were considered. For
example, in assessing the merits of each design variant it is desired to distlibute the
energy dissipation demand in proportion to the energy dissipation capacity of the ele
ments involved. Thus, careful attention must be paid to the post-buckling and
failure characteristics of braces. Moreover, since the magnitude of the: extreme
seismic loading is uncertain, it is desirable to make the structure's behavior as
predictable: and as insensitive to the characteristics of the ground motion a5 possible.
Consequently, the statistical nature of the response to a wide variety of excitations
should be considered. Similarly, because of the significant post-buckling force redis
tributions associated with braced systems, design recommendations concemed with
member proportioning and detailing formulae should be based on capacity design
concepts.
1.6. SCOPE
To achieve these objectives, the research proceeds in several steps. Chapter 2
reviews available analytical models for braces. Since inelastic brace behavior dom
inates the inelastic response of braced frames, the first step is to determine which
parametem control the postbuckling behavior of a brace. An analytic study, limited
to monotonic loading, identified several parameters that were later found useful in
numerical simulations of cyclic and dynamic loading.
Chapter 3 builds on the results of Chapter 2 and identifies those parameters at
the structure level which govern the inelastic deformation (collapse) mechanism and
attendant force redistributions in chevron-braced frames. The results of several
numerical simulations illustrate the importance of the parameters identified on the
magnitude of the force redistributions and on the overall inelastic characteristics of
the structure.
In ·Chapter 4 the dynamic inelastic behavior of a single story chevron-braced
fr?me is compared to that of a moment resisting frame of same dynamic characteris
tics and strength level. The effect of the deteriorating hysteresis loop characteristics
associated with braces of differing slenderness on displacement and energy ductility
demand is assessed.
In Chapter 5 a systematic parametric study of realistic multistory braced frames
is carried out to reassess the importance of the various parameters identified in the
previous chapters. Braced frames are compared with dual systems where the frame
participau:s in resisting the lateral load in different proportions. The effects of low

10
slenderness braces are compared to those of intermediate slenderness braces. The
comparisons are limited to the inelastic regime. A realistic physical brace model
(35) is used in all the brace simulations. Important dynamic interactions are
discovered that were not predictable or observable from the simplified analyses and
models used in the previous chapters.
Two approaches were taken to improve the behavior of chevron-braced frames.
Chapter 6 describes the use of optimization procedures in the seismic resistant design
of chevron-braced frames. The implications of the results concerning design recom
mendations and member Proportioning are discussed. Problems in using optimiza
tion techniques for such complex systems are also examined.
Chapter 7 examines the Performance of several alternative bracing configura
tions. Systems considered included those with V, split X, and Tie-Bars-To-Ground
configurations as well as a new variant devised during this research program (the
Zipper configuration). Computer simulations of this latter variant showed that it is
highly effective in distributing the energy dissipation over the whole frame in a way
that is relatively insensitive to ground motion characteristics.
In Chapter 8, results and conclusions are summarized. Based on these results,
basic design recommendations are formulated for each of the systems considered.
Directions for further research are also pointed out. Detailed design recommenda
tions and examples are presented in the Appendices.

11
CHAPTER 2
HYSTERETIC BEllAVIOR OF BRACES
2.1. INTRODUCTION
Research [45,80,21] has shown that inelastic structural response to earthquake
loading depends mainly on the period, strength level, hysteretic characteristics of the
structure cmd on the dynamic characteristics of the excitation. Since braces confer
most of the strength and stiffness to braced structures, a study of the dynamic inelas
tic behavior of braced frames should start with an examination of the inelastic
behavior of braces. In studying the inelastic behavior of braces, one needs to look
specifically at the rate of deterioration of strength with increasing deformation, the
defomiation capacity, as well as the energy dissipation demand and capaci~f·
This chapter starts with a review of experimental and analytical research on
brace behavior to identify assumptions that are appropriate for subsequent analytical
studies. Next, a dimensionless model of inelastic brace behavior is developed to help
evaluate the sensitivity of brace response to the various parameters. Then, a simple
model for brace deformation and energy dissipation capacities is developed. Finally,
the observed dependencies and their implications for structural design are summar
ized.
2.2. EXPJERIMENTAL PROGRAMS
Many experiments have been conducted by vanous researchers to investigate
the effects of slenderness ratio A = kUr, section shape and end-restraints on the
strength of braces and on the "fullness" of their hysteresis loops. These tests have
employed scale models as well as full size elements.
The effective brace slenderness has been found to be the major parameter con
trolling the characteristics of the hysteresis loop [18,38,66,91]. Hysteresis loops
become pinched for slender braces and tend to be fuller for stocky braces. Com
pared to stocky braces, slender braces also tend· to suffer more strength reduction
from cycle to cycle.
The effect of section shape has been studied independently by several groups of
investigators. Jain, Gael and Hanson [37] tested small tubes of square section,
angles and bars of rectangular cross-section. They concluded that differen.ces in the
hysteresis loop characteristics of different section types can be attributed to their dif
ferent susoeptibility to local buckling; thin walled sections being more likely to fail

12
prematurely by early local buckling. Oosed sections are less likely to suffer torsional
buckling, but their strength deteriorates faster with cycling because of the distortion
of the cross-section. Popov et al [18] tcsted a variety of full sized steel sections
(wide-flanges, double angles, channels, T sections, pipes, and square tubes) with
slenderness values equal to 40, 80 and 120). They noted that cyclic loading reduces
the buckling strength of braces, and that the effect of cross section shape on hys
teresis characteristics is most noticeable in small slenderness sections where
occurrence of local buckling is predominant. Gugerli [30] tested the effect of section
shape and scale effect on the hysteretic characteristics of rectangular tube and wide
flange sections. He found that the hysteresis loops of both section types were simi
lar, but that fracture was more critical than local buckling in limiting the resistance
and energy dissipating capacity of braces. The fracture life of tubes. was smaller
than that of wide flanges in his experiments.
Astaneh-Asl [10] investigated the effeCtiveness of gusset plates in restraining
double angle braces. He found that for buckling in the plane of the gusset plates,
the effective length factor can be taken as 0.5. Plastic hinges then form at midspan
in the braces and at their connections with the gusset plates. For out-of-plane buck
ling, an effective length factor of one was found to be satisfactory. Plastic hinges
form at midspan in the braces and in the gusset plates. Astaneh proposed new
detailing specifications for the gusset platcs to avoid local buckling and fracture
there, and improved stitching details for built-up members. Wakabayashi et a1. [90]
tested small scale elements with flexible end restraints.. They found that compared
to pin ended braces of the same effective slenderness , end-restrained braces have
more energy dissipating capacity (because of two additional plastic hinges). Jain.
[36,37,38] tested small rectangular tubes with gusset plates and concluded that the
ratio of bending stiffness of brace to gusset plate is more important than their
strength ratio in determining the effective end rcstraint.
Kahn and Hanson [40] performed tests to assess the effect of rate of loading.
1)1ey found no appreciable difference between quasistatic strain rates and those usu
ally encountered in seismic situations.
2.3. ANALYTICAL BRACE MODELS
The earliest analytical brace model is the so-called slip model. It is a bilinear
elastic model in compression with a compression yield force set equal to the elastic
buckling load of the brace. Bilinear hysteretic behavior is assumed in tension.
While this model is sufficient -to capture the initial nonlinearity that follows brace

13.
buckling, it is unable to reproduce the strength deterioration with increasing defor
mation and the softening observed with repeated cycles. As experimental work in
brace behavior has progressed, many improved analytical models have been
developed to predict their cyclic inelastic behavior. These models can be classified
into one of three categories [96]:
2.3.1. Ph:~sical models (force driven):
This category of brace models incorporates a simplified analytical description of
certain aspects of the physical buckling and yielding processes involved. 1:1 most of
these models the axial compression force is the independent variable and the defor
mation is the dependent variable. However, most structural analysis techniques sup
ply the mcdel with deformation increments and request the corresponding 2.xial force
(total or change). Detennination of the axial force P corresponding to a specified
displacement increment must then be accomplished by iteration. Convergence is
checked by comparing the displacement increment compatible with the assumed
value of P with the specified displacement increment. Many researchers have
worked on improving the iterative schemes (choice of iteration variables, recasting of
the equations, etc... ). The determination of the axial force P remains computation
ally expensive and sometimes not robust (i.e., may fail to converge to the correct
value).
One of the first physical brace models was developed by Higginbotham [31]
and featured a point plastic hinge, a provision for a yield surface involving the
interaction of axial . force P and moment M, and a formulation for large lateral
deformation involving elliptical integrals. This model was adequate for braces of
intermediate to large slenderness. The next model, developed by Nonaka [91], con
sisted of a point plastic hinge, provision for inelastic axial and flexural deformations
in the plastic hinge, and rigid sections for the remainder of the brace. This model
was adequate for braces of small to intermediate slenderness. Igarashi [33]
improved Nonaka's model by using a more refined yield function. Then,
Pragthuangsit [67] investigated the effect of end restraints, namely fixed ends,
pinned ends, elastic restraints. Singh [77] introduced a new model by using tri
gonometric functions instead of the elliptic integrals used by Higginbotham. Gugcrli
[30] refined Singh's model by including the residual deformation ~p and an empiri
cal provision for the reduction in maximum compressive strength after cycling.
Ikeda [35] improved Gugerli's model by adding a reduction of the modulw; of elasti
city upon cycling, "material nonlinearity" in the elastic range, and gradual

14
plastification of. the plastic hinge. Moreover, Ikeda developed numerical techniques
that substantially reduced the need for iteration, thereby facilitating the use of this
model in inelastic dynamic analyses of complete structures.
2.3.2. Kinematic models (displacement driven):
Comparatively little effort has been devoted to displacement driven models. In
these models, a tangent stiffnes..c; matrix is formed bascd on material properties, the
current state of strain and some paramcter(s) measuring accumulated damage.
Given the displacement increment from the analysis program and the tangent stiff
ness matrix a member force increment is computed and added to the current axial
force P. These models have the advantage of eliminating the iterations at element
level [46]. However, the rapid changes in brace post-buckling tangent stiffnesses
often require very small load increments and increase the number of iterations at the
global level. Fujimoto [23] used a finite element model to simulate the spread of the
inelastic zone. However, he used a linear Clastic perfC'.ctly plastic material property
assumption. Chen [19] and Zayas [96] each developed a displacement driven
model. These models were not very successful in reproducing the degradation in
strength and stiffness of braces under cyclic loading.
2.3.3. Phenomenological models (empirical rules and parameters):
These types of models are often favored for their computational economy, espe
cially when the structure analyzed contains many inelastic braces. These models are
governed by a set of empirical rules derived from experimental observations and con
tain parameters depending on material and geometric properties. Phenomenological
models are restricted in use to conditions similar to those from which the rules and
parameters were derived. One must often run some preliminary analyses in conjunc
tion with one of the other models (physical or kinematic) to fine tune some of the
input parameters. Almost every researcher [77,67,91] who has worked on a physical
model has also developed an alternate phenomenological model with a set of param
eters to approximate the results obtained with physical models and experimental
data.
2.4. DIMENSIONLESS BRACE MODEL
In order to identify the most important parameters governing the inelastic
behavior of braces, a physical brace model will be studied whose equations realisti
cally describe the actual behavior of the brace. Presenting the results in

15
dimensionless form makes them more compact, easier to grasp and more generally
applicable.
2.4.1. Assumptions:
Based on the review of eXlstmg physical brace models and of experimental
results, the following assumptions will be used in developing the dimensionless brace
model:
(1)- Every cross section along the axis retains its shape (no section distortion or
local buckling).
(2)- The effects of shearing stresses and strains are disregarded.
(3)- Plane sections remain plane.
(4)- Only wide flange sections bent about their minor principal axis are con
sidered. The web stress contribution is assumed negligible compared with that
of the flanges.
(5)- The lateral deflections and the corresponding slopes are relatively small
(first order deformations).
(6)- The plastic deformations at the plastic hinge are determined on the basis of
an associative flow rule.
(7)- The effective member length kL is used in place of the member length L
for determining buckling characteristics.
(8)- The initial buckling stress is computed using the AISC [2] formula with the
factors of safety removed.
(9)- The analytic study is limited in this chapter to a monotonically increasing
compressive deformation.
2.4.2. Terminology:
Brace slenderness X. is defined as X. = kUr where k is the effective length fac
tor, L is the clear span of the brace and r is the governing radius of gyration (such
that the ratio klr is maximum). Large slenderness is defined here as that for which
the elastic buckling stress is less than half the yield stress. That is X. ~ 770/ V Fy
where Fy is in kips per square inch (ksi). For A36 stccl large slenderness is
equivalent to X. > 130. Small slenderness is defined here as that for which yielding
and local buckling phenomena become predominant. The exact value depends on
the ratio of width to thickness of the flange and the restraint provided by the web
[59,60]. For A36 steel and the usual AISC compact sections used for braces, small
slenderness is equivalent to X.~60, approximately. Intermediate slendemf::5s is that
16
for which local buckling phenomena are less critical than inelastic buckling. For
A36 steel intennediate slenderness is equivalent to 60< A. < 130. The distinction
between small slenderness braces and intermediate slenderness braces is an important
one. In small slenderness braces large lateral displacementc:; initiated by yielding or
local buckling of a flange (wide flange sections) or plate (rectangular tube sections)
trigger global buckling of the brace. For compact sections, the buckling stress is very
close to the yield stress. Intennediate slenderness braces experience column buck
ling. However, the effective buckling stress is reduced because of residual fabrica
tion stresses.
2.4.3. Normalization:
In the following analyses of brace behavior, the brace buckling load Pc is held
to a constant value. There are several reasons for normalizing behavior with respect
to Pc instead of the brace yield load Py (as is usually done), the most important of
which is that brace buckling, not brace yielding, is the first likely inelastic event in a
braced steel frame. Furthennore, whether in an allowable stress approach or in
cases where serviceability or damageability limit states are considered, the structure
is assumed to resist its loading elastically. The design forces corresponding to these
cases define a lower limit for the brace buckling load, not its tcnsion yield load. It
is interesting to note that these forces are oftcn specified independently from the
brace slenderness.
2.4.4. Post buckling behavior of brace:
In this section a simple expression is developcd that relates the axial deforma
tion to the axial compression in a brace. The relation is in non-dimensional terms.
The next two sections will use the results obtained herein to derive expressions for
the tangent stiffness and energy dissipation demand as a function of brace deforma
tion and other relevant brace parameters. Referring to Figure 2-1 and the notation
in Appendix A, the deflection of the buckled brace is
'TT'"\. ;--p . 'TT'"\. /Py(x) = Acos(- V p-x) + B sm( - V ~-x)
2 ~ 2 ~
the boundary conditions being
y(O) = 0 - A = 0
L _ Mp(P)y(T) - p - B =
Psin(~'"\. rP)2 V P
2-1
2-2
2-3

17
The plastic ro~tion Op at the plastic hinge is given by
Op = 2y'( L2
) = 2M---L..
p7T vr1-P cos.2!..~-pL Pc 2 Pc
Psin(.2!..~ )2 Pc
2-4
The axial defonnation of the brace A has three components; elastic Ae ' geometric
Ag and plastic Ap:
A = Ae + Ag + Ap
where the elastic defonnation is
A = PL.e AE
and the geometric deformation
L
2 'lAg = 2f ~,y'2dx
o ••
and the plastic d"efonnation
_ dMp(P) P P d2Mp(P)Ap - --~Oplp. +f dp2 Op(P)dP
p.
Letting MP(P) = Mp(1 - P:) be a parabolic yield surface, thenPy
2-5
2-6
2-7
2-8
2-9Mp r-=2vr-- = 2-yrPy d
in which a new section property -y = vrld is defined. For wide flange sections bent
about their minor axis, -y has a narrow range of values (between 0.3 and 0.4; see
Table 2-1). For notational simplicity, the following dimensionless parameters are
defined:
Pu= -
Py2-10-a
2-1O-b

18
z" = 2
A = !:.r
2-1O-c
2-1O-d
2-10-e
Notice that " = Tin.~ can be recast to give u = 4a,,2/Ti2 = b,,2 where
b = 4a1Ti2. Using series expansions from Abramowitcz [1] for some of the functions
in Eq 2-1 to 2-8, and collecting terms, one obtains for the total deformation (details
of the derivation are in Appendix A):
2-11
+ 2(15.96334-22.432173,,0.25+ 7.43265,,0.50 -().29613,,2-9.50725e-2"4)
-b2(2.18817 + 2.59573" 4-1.68026"6)]
Figure 2-3 shows the results for this equation assuming 'Y = 0.3. It is clear from
that figure that at a constant buckling load, braces of intermediate slenderness have
the most rapid strength deterioration with increasing deformation. Very stocky
braces have practically elasto-plastic deformation characteristics while slender braces
have a. "long plateau" of elastic buckling before reaching the yield surface and
experiencing a reduction in strength.
2.5. POST BUCKLING TANGENT STIFFNESS
Since Eq 2-11 expresses the deformation in terms of the applied force, the
instantaneous tangent stiffness can be obtained relatively easily in terms of the force
level by inverting the brace flexibility expressed as a function of axial load. Thus,
_1_ _ a!1 ~ _..!!. 1 a!1Kbt - a,,· ap - 2 -yr;; a"
c
gives at" = Tin. (details of the derivation are in Appendix A)
2-12

2-13
19
1 1:= "2 2
1+ 2'TT2 '\ 3 (2. 93676a4-2. 18737a2-o.7137)EyA a
There are parameter combinations for which the ratio Kb/Ko is infinite or negative.
This corresponds to the cases where the tangent stiffness is infinite or positive. This
characteristic instability has been observed by other investigators as well [81]. To
overcome these difficulties a "secant stiffness" with an origin at the buckling load will
be used. This secant stiffness is defined as I<s= (Pc-P(~y))/(~c-~y). Figure 2-3
shows the variation of I<s with brace slenderness and axial defonnation. Intennedi
ate slenderness braces have the largest ratio of IK/Ko I·
2.6. ENERGY DISSIPATION DEMAND
The inelastic energy dissipation demand Ein can be expressed as ( Figure 2-4):
2-14
p
where Al = I~dP, A2 = (Pc-P)II2(~c+~cP/Pc)' and A3 = P(~-~cP/Pc)' SinceP,
unloading will not in general follow the initial loading slope, the term for A3 is only
approximate. Using the dimensionless variables previously defined, we obtain
_ Eyb 4Ein - 4-(" -6.08807) 2-15
+8~[-t(-~+ 21
2. 16941e-2,,2+ .!.6.112386e-3,,4+0.08285)A b 2" 4
+2(~ 0.99524,,2- ~ 0.29613,,4- ~ 9.50725e-2,,6- ~ ,,2{ln,,2-1)-o.65855)
-b2( }2.18817,,2+ ~ 2.59573,,6- ~ 1.68026,,8_1.41350)]
The energy demand is normalized with respect to Pc~c!2. Figure 2-5 shows that for
a given displacement ductility intermediate slenderness braces have the lowest rela
tive energy dissipation capacity. Alternatively, Figure 2-6 shows that to achieve a
given energy demand, braces of intermediate slenderness have to undergo the largest
displacement ductility when compared to stocky and slender braces. Figure 2-7-a
shows that there is a range of displacement ductility where a brace may dissipate
more energy than an elasto-plastic system of same strength and undergoing the same

20
defonnation. However this happens only for very stocky braces. Figure 2-7-b shows
that this is possible when area Al is larger than area A2.
2.7. ENERGY DISSIPATION CAPACITY
2.7.1. Damage index for braces:
Many of the analytical brace models available so far can satisfactorily reproduce
the main hysteretic characteristics of braces, but none of them can predict when a
brace will fail. Popovet al. [62,63,64,65], Mitani [47,50,51] and Kato [42] have
done extensive cyclic loading tests on beams, columns and beam to column connec
tions to detennine their failure mode and their energy dissipating capacity for low
cycle fatigue. This loading condition is characterized by a relatively low number of
cycles of large amplitude extending well into the inelastic range. They found that
such components fail by fracture. The fracture is usually the result of a crack start
ing at a weld or a re-entrant corner, that grows and propagates across the flange.
Alternatively, it can be initiated by a local buckling leading to cracking and ulti
mately to fracture. Research has shown that for low cycle fatigue damage indices
should be based on plastic strain cycles amplitude (Coffin-Manson [48]) or on cumu
lative hysteretic energy dissipation (Suidan and Eubanks [82], Srinivasan [78], Kato
[41]). Krawinkler [44] proposed a low cycle fatigue model for beams bent about
their major principal axis.
While some recent work has just been reported by Goel [86] on brace failure
criteria, most research is still oriented at understanding the cyclic behavior of braces
and at deriving models reproducing that behavior. There are several reasons that
prevent extrapolation of results obtained for beams to braces. First, in beams bent
about their major principal axis, flanges are uniformly stressed. In wide flange
braces buckling about their minor principal axis, flanges are under a more complex
stress distribution. Second, the plastic hinge length in a beam bent about its major
principal axis is much shorter than that of a brace buckled about its minor principal
axis ( because of a smaller shape factor and a larger moment gradient in the beam).
Third, in beam or column problems the bending moment and axial force are
independent while in a buckled brace they are totally coupled through the deflected
shape. Therefore, efforts are needed to develop failure criteria consistent with physi
cal behavior and analytical models.

21
2.7.2. Assumptions for the energy dissipation capacity of braces:
Given the lack of knowledge about the energy dissipation capacity of braces,
two simple bounds are herein proposed. In the absence of specific experimental
data, the bounds developed should be considered as approximate. There are several
assumptions made in developing these bounds. Material is assumed to be elastic
perfectly plastic. The energy dissipation capacity of the brace is limited by reaching
the material's ultimate strain anywhere in the member under monotonically increas
ing axial compression deformation. The cumulative energy dissipation capacity
under cyclic loading is assumed equal to that under monotonic loading [41].
Sequence ,effects and mean strain effects are neglected. The energy dissipation capa
city under tension yielding is assumed to be substancially larger than that under ine
lastic budJing, and is therefore not critical.
The ultimate strain Eu can be reached In one of two ways: eithl~r on the
compression side of a brace in a global buckling mode, or on the compression side of
a flange in local buckling mode. Accordingly, two energy dissipating mechanisms
are considered: a global buckling mechanism where energy is dissipated in a point
plastic hinge, and a local buckling mechanism where energy is dissipated in plastic
yield lines in the flanges. Torsional buckling is neglected, and the derivations are
limited to wide flange sections bent about their minor axis.
2.7.3. Upper Bound Solution 1; Global Buckling Mechanism:
Section curvatures are assumed to vary linearly between the first point on the
brace to yield and the ultimate curvature point at the midspan. Similarly, a linear
moment variation is assumed between these two points. These two assumptions
imply that the moment-curvature relationship is linear between the first yield and the
ultimate moments; however this implication later will be violated. The location of
the neutral axis between its first yield position and its position assuming rigid plastic
material is taken to be inversely proportional to the strain ductility. Energy dissipa
ti.on is assumed to occur only in plastic hinge rotations; plastic axial deformations
that are important in case of stocky braces are neglccted.
The total energy dissipation capacity Ein is assumed to be
Ein = MpCP)ep
where the ultimate plastic hinge rotation
2-16
2-16-a

22
is estimated from the effective length of the plastic hinge Lp and the ultimate curva
ture 0 u. The effective plastic moment Mp at the given axial compression P is given
by
p2 1M = M..n(1 - -)(1 - -) 2-16-b"-p t'" P 2 VII 2
Y r-s
and the effective length of the plastic hinge Lp is approximated by
- 1Lp = 2"Lp(0y+0u) 2-17
where
MLp = L(1 - .=Er.)
Mpu2-18
~/;:= L[1 - ]
(v~? - 1)(1 + PlPy)
It can be shown (Figure 2-8) that
P2Ei1 - p)
o = y
y d(1 - 2-K.)Py
2-18-a
2-19-a
and
2-19-b
where
2-20y = 1 [_1_(1 _ 2-K.)+(1 __1_)(1 _ -K.)2]2(1 - PlPy} ~sn Py ~sn Py
The parameter n in Figure 2-8 describes how rapidly the neutral axis migrates with
increasing curvature. Setting n = 1 for simplicity, gives
2-21
2~s ][1 +
1normalizing this with respect to 2"PcAe gIves the desired normalized energy

23
dissipation capacity:
2 P (1-P IP )(1-p2/p 2)I; = 4.Y:~( ---.£)2 c''' Y c Y [1 __1_]n v Py 1-2P!Py v~s2
2-22
2~s ][1 +
2.7.4. Upper Bound Solution 2; Local Buckling Mechanism:
Figure 2-9 indicates the kinematics assumed for the shape of the local buckles.
In this delivation, several major assumptions are made. The web is con:;idered to
limit the yield lines to one side of the flange only; it is assumed to have no effect on
axial force: and moment capacity. A uniform stress distribution is assumed in the
flanges. Although a triangular or trapezoidal stress distribution may be more
appropriate at impending flange buckling, stress redistributions occur as buckling
proceeds. These redistributions would tend to equalize the stresses across the flange.
Moreover, considering the uncertainty due to residual stresses, a more sophisticated
stress distJibution is not warranted. The plastic yield lines are assumed to form
simultaneously so that their plastic rotations can be kinematically related. Alterna
tively, the material can be assumed to be rigid plastic. The variation of moments
and axial forces at yield lines as the plastic rotation increases is neglected. An effec
tive modulus of elasticity corrected for residual stresses is used. That modulus
decreases linearly from its full value at half the yield stress to zero at the yield stress
[59,60].
The buckling stress is taken as the smallest of the global buckling stress for the
brace and the local buckling stress of the flange. Recall that the global buckling
stress a c =: aay where a is obtained from Eq 2-1O-b. The local buckling stress for
the flange is
a =cor'
a'(-+1)
a y
2-23
where
, 2krr2E tr 2
a = 12(l-v2) ( by'2 )
and k=0.5 approximately [60].

24
The flange's plastic moment is
cr 2c
~ = MJil(1 - cr 2 )y
1 bfand M ~ = -cr te2-·°txJ 4 y 2·
The ultimate plastic hinge rotation is
EU8 = -----TP te crc t>
-(1 --)2 cry
where Lp can be taken either as
2-24
2-25
2-26
cr 21 - 3_c_
. 3 5 cr/~ = mm("2 te , "2bf 2 )
Cfc1--
Cf2Y
The first value is an estimate, and the second is based on the assumption of linear
moment variation between su~ive yield lines.
The energy dissipation capacity, assuming only two folds are formed, is
E;n = 8Mp8p
which gives for the first definition of 1;,
Normalizing with respect to 112P~c, one gets
2-27
. 2-28
2-29

25
Figures 2-1O-a to 2-1O-d show the variation of allowable energy ductility for various
material strain ductilities .....5 and flange thickness ratios byte. It is evident that the
allowable energy ductility increases with increasing material strain ductility and with
decreasing flange thickness ratios. In all these cases the flange local buckling
mechanism was governing. Again, intennediate slenderness braces e"hibit the
lowest energy ductility.
2.8. DISPLACEMENT DUCTILITY CAPACITY
It is also useful to know the displacement at which the energy capacity of the
brace is exceeded. To facilitate comparisons, this will be nonnalized by the initial
buckling displacement. In addition to the assumptions made in the previous sec
tions, the assumption of point plastic hinge is reiterated. The required point plastic
hinge rotation, based on equilibrium is
2-30
On the other hand, the available plastic hinge rotation capacity based on a spread
plastic hinge and a linear distribution of moment is
Equating both equations and rearranging tenns, one obtains
2.....5 ] 2-31
2-32
~ Euwhere v= - is the section shape factor, ..... = - is th material strain ductility,
~y 5 Ey
and b=47Tbhr2. Equation 2-31 must be solved for TJ which is then substituted in Eq
2-11 for~,. The ratio .....b = : is then the brace displacement ductility capacity.c
The results of such an analysis are shown in Figure 2-11. The allowable displace-
ment ductilities can be rather large. Once again, intennediate slendern,~s braces

26
have the lowest allowable displacement ductility.
2.9. CONCLUSIONS
The brace slenderness ratio A is the single most important parameter governing
the brace inelastic behavior. The section shape factor 'Y is almost equally important,
but the limited range of values it can take makes it less critical for the response of
wide flange braces. Braces of intermediate slenderness seem to have the most
undesirable characteristics; namely, the fastest strength deterioration, the largest dis
placement demand for a given energy dissipation demand, and the smallest displace
ment and energy ductility capacity. It is interesting to note in this respect, that the
recently proposed SEAOC design recommendations [75] limit the allowable brace
slenderness values to the stocky and intermediate slenderness ranges. There is a dis
placement ductility range where stocky braces can dissipate more energy than an
elasto-plastic system of same strength undergoing the same deformation. Local
buckling seems to be the main limit to the energy dissipation capacity of braces.
The energy dissipation capacity increases with increasing material strain ductility and
decreasing flange slenderness. There is a need for experimental research in the
energy dissipation capacity of braces.

27
CHAPTER 3
QUASISTATIC INELASTIC FORCE REDISTRIBUflONS
3.1. INTRODUCTION
Braced steel frames arc usually designed according to an allowable stress
approach and using elastic analysis techniques. While their behavior in the elastic
range may be satisfactory, these frames can collapse suddenly once the design lateral
loads are exceeded. This apparent brittleness can be traced to the limited ductility of
braces and to the lack of consideration for the force redistribution that occur in such
frames. The previous chapter examined the parameters that control the enetgy dissi
pating capacity of braces. In this chapter, the inelastic force redistributions are stu
died analytically and the governing parameters are identified.
This chapter starts by an analytical study of the post-buckling stiffness of a sim
ple chevron-braced bay (Figure 3-1). Parameters that affect the shape of the story
hysteresis characteristics are identified. With the help of these parameters, it is pos
sible to classify beams quantitatively as being stiff or flexible. This classiEcation is
essential in studying the different collapse mechanisms that are possible and in deter
mining which one is likely to occur for a given structure. Two collapse mechanisms
are studied in detail with three subcases considered for each. The characteristic
postbuckling behavior and force redistribution pattern are identified for each sub
casc. Then, based on the results of numerical simulations, design recommendations
arc made to help improve the force-deformation characteristics of chevron-braced
frames and their energy dissipation capacity.
3.2. POSTBUCKLING STORY LATERAL STIFFNESS
Consider a simple chevron-braced bay loaded by lateral forces as in Figure 3-l.
A single braced panel from this frame will be considered as indicated in Figure 3-2
(t~ which all subsequent notation refers). It is assumed that beams are pin con
nected to the columns. No vertical loads are applied. Beams and columns are
assumed to be axially inextensible. In the clastic range, the tension force in the
brace Bl and the compression in the brace B2 arc equal in magnitude. The max
imum lateral resistance provided by the clastic braces is equal to
F = max fT+C)cosE> = 2P casE>c. c 3-1
The net veltical component Pun of brace forces applied at the beam midspan is zero:

28
Pun = (T-e)sinE> = 0
The lateral story stiffness provided by the braces is given by
Kbr = 2(~)b~E>
3-2
3-3
As soon as a compression brace buckles, the braced story stiffness drops and
can be analytically modeled as in Figure 3-2 where the beam provides an elastic
vertical restraint for the braces. As the lateral deformation is increased by At, the
axial deformation in the compression brace is increased by Abn: while the tension
brace axial elongation is increased by Abrt and the beam is deflected downward by:
Abrn. From Figure 3-3 it can be shown that
Abn: = Atcos0+ Abmsin0
Abrt = AtCOsE>-AtmSin0
The compression force in brace B2 decreases·by
3-4-a
3-4-b
3-5
where I<.tx, is the· current tangent postbuckling stiffness of the brace. The tension.
force in Bl increases by
3-6
where %t is the tensile tangent stiffness of brace Bl. Since the absolute values of
the force increments AT and AC in braces Bl and B2 are not equal, an unbalanced
force is applied to the beam. The vertical component of this force will be referred to
as the "unbalance-force" Pun. The vertical unbalance force on the beam changes by
3-7
where Kbm is the effective vertical stiffness provided by the beam at midspan. It is
clear from equilibrium that the total increase in lateral resistance is
AF = (~T+AC)cosE>
and the vertical unbalance increment is
3-8
APun = (AT-AC)sinE> 3-9
To obtain the effective story drift tangent stiffness (Ke =: AF/At) some manipulations
are required.
Noting that

29
~T-~C = Kt,..Abrt+~brc
= Kb..Atcos0-Kb..Abmsin0+ ~tcos0+K~bmsin0
Substituting this in Eq 3-9 gives
Kbr+Kbb~bm = ~rSinE>cos0 2
Kbm+(Kbr-Kbb)sin E>
Similarly
~T+~C=:K~~-Kbb~~
(Kbr+ Kbb)2sin2E>cos0=: [(K -K )0050 - ]~
br bb Kbm+ (Kbr-Kbb)sin20 t
Substituting this in Eq 3-8 for ~T + ~C gives
2 (Kbr+ Kbb)2sin20~F = ~tC()S 0[(Kbr-Kbb) - . 2 ]
Kbm+ (Kt,r-Kbb)sln 0
3-10
3-11
3-12
3-13
3-14
3-15
The effective tangent lateral stiffness is then
~F 2 (Kbr+ Kbbfsin20K = - = cos 0[(Kb -Kbb) - ]
e ~t r Kbm+(Kbr-Kbb)sin20
Notice that for an infinitely stiff beam ( Kbm = :lO ) the effective stiffness reduces to
K =e
And if Kbl) = 0 (elastic brace buckling) Ke becomes
Kb,.eos2E)
Kbr 2l+·--sin 0
K bm
3-16
3-17
3-18
In order to have Ke > 0 (assuming Kbb < Kbr), the following relation from Eq 3-15
must be satisfied: .
(Kbr+Kbb)2sin20Kbr- Kbb ;:~ 2
Kbm+(Kbr-Kbb)sin 0
or
3-19

30
The same expression is obtained for ~>%r' It should be noted that p-~ effects
have been disregarded. If gravity loads were considered, the limits on Kbm would
become more stringent.
3.2.1. Classification of beams:
Equation 3-19 specifies the minimum stiffness for the vertical degree of free
dom at the brace to beam connection to obtain a positive post-buckling tangent story
stiffness. The vertical displacement stiffness provided elastically by the beam is
EIKbm = 48 0: (-3)bm
L3-20
where 0: is a factor depending on boundary conditions. For fixed ends a = 4 and
for pinned ends a = 1. The brace stiffness for lateral load is
3-21
but Lbr = Lbnl2cose, therefore Eq 3-21 becomes·
3-22
Replacing Kbm and Kbr in Eq 3-19 by their respective values from Eq 3-20 and 3
22
3-23
To avoid having to consider column stiffnesses it is possible to establish a beam clas
sification based on flexural stiffness as follows:
A flexible beam fails to satisfy Eq 3-23 even if it had fixed ends ( a = 4 ). It is
then characterized by
1 A ~2 co~E>Ibm s - b bm 3-24
24 Kbr(--1)
Kbb
A stiff beam satisfies Eq 3-23 even if it were simply supported ( 0: = I ); it IS
characterized by
1 A ~2 cos3eIbm :> - b bm 3-25
- 6 Kbr
(Kbb
-1)

31
An intennediate stiffness beam has a moment of inertia falling between the limits
defined by Eq 3-24 and 3-25:
1 A L 2 cos30 1 A rI-- 2 cos30_ br bm ~ Ibm ~ _ b bm 3-2624 Kbl. 6 Kbr(---1) (--1)
K~, K~
Notice that for the same moment of inertia, a given beam will be considered as stiff,
intennediate or flexible as the area of the braces is increased from small to inter
mediate to large, respectively.
3.2.2. Velrtical unbalance load on beams:
From Figure 3-2 and Eq 3-5, 3-6 and 3-9 the maximum unbalance load that
can be statically applied to the beam can be approximated by
3-27
3-28.
or
Pun = (Pc-Pcy+ K.,~brt)sin0
where ~brc = ~y-~c and Pcy = P(~ = ~y). Replacing ~bm in Equations 3-4:a
and 3-4-b by its value from Equation 3-11, Equation 3-4-a now contains ~brc and ~t
only. Further, replacing ~t in Equation 3-4-b by its value in ~brc obtained from
Equation 3-4-a as modified hereabove, Equation 3-27 now becomes
sin2E>(Kbr+ Kbb)casE>
. sin2E>(Kbr-Kbb)+ KbmPun = SIn(~Pc-Pcy+Kb~brJ----'-2-----
SIn E>(Kbr+Kbb)cosE>+ --=------"---
. sin2E>(Kbr-Kbb)+ Kbm
Nonnalizing with respect to story shear at first buckling Vc = 2Pccos0:
Kbbsin20(1+-)
Kbrcos0 - -------=.::--2 Kbb Khmsin 0(1--)+--
1 Pcy Py Kbr Kbr= -tanE>(1 - - +(- - 1)]-------.:..:-----=---2 Pc Pc Kbb
sin2E>(1 +-)K
cosE>+ br2 Kbb Kbmsin 0(1--)+
Kbr Kbr
3-29
32
Figure 3-3-c illustrates the variation of the unbalance force with brace slenderness
and relative beam stiffness. A beam will be considered as strong if it can sustain the
maximum vertical unbalance force in addition to its nonnal gravity loading. A
weak beam develops plastic hinges prior to the yielding of the tension braces. The
collapse mechanism associated with such a case involves energy dissipation in the
buckled braces and the plastic hinges of the beam only. In all cases beams are
assumed to have sufficient shear strength to avoid failure by shear. The above men
tioned classification of beam strength is independent of the stiffness classification
previously established: a stiff beam could be strong or weak, as could be a flexible
beam. However, in the remainder of this chapter all beams, stiff and flexible, will
be assumed to be strong.
3.3. TYPES OF COLLAPSE MECHANISMS
Consider a typical chevron-braced panel from the structure in Figure 3-1. The
static collapsed state of that panel corresponds to the state in which no increase in
lateral load resistance can be obtained. If a strong-column weak-girder design
approach is used, there are two possible collapse mechanisms. The first collapse
mechanism is associated with a flexible beam and the second involves a stiff beam.
As seen from the previous section, the effective post buckling stiffness is very sensi
tive to the stiffnesses of the beam and of the braces. Since there are three categories
of brace slenderness (small, intennediate and large), there are three different cases
for each collapse mechanism. Moreover, the beam may yield before or after the ten
sion brace, leading to a total of twelve different mechanisms.
3.3.1. Flexible beam collapse mechanism:
For small brace slenderness the tension yield force Py is only slightly larger than
the buckling force magnitude (Figure 3-4-a). The unbalance force applied to the
beam is then about equal to (Py - Pc)sinE>. Since Py ::::: Pc, this implies that the
maximum unbalance is nearly zero. However the beam being very flexible, the ten
si'on force in Bl remains practically constant. Abrt increases less rapidly than Abrc
(Figures 3-4-a).
For intennediate slenderness the tension force Py is significantly larger than Pc.
The maximum unbalance force that can be applied to the beam is thus larger. How
ever, as for small slenderness braces, the beam being very flexible, the tension force
in Bl remains almost constant (Figure 3-4-c). Since intennediate slenderness braces
lose strength quickly with increasing defonnation, the total lateral resisting force

33
will decrease significantly with increasing defonnation. The overall behavior effect
is then that of a buckling element: a sudden drop in resistance (Figure 3-4-d1).
For large slenderness the tension yield force Py is much larger than the buckling
force Pc' The maximum unbalance force that can be applied to the beam is then
quite large, but the beam being flexible, the tension force in brace BI cannot not
increase to Py (Figure 3-4-e). Since the resistance of the compression brace
decreases slowly with increasing defonnation, the overall lateral resistance of the
panel decn:ases slowly as the defonnation is increased (Figure 3-4-f).
In all three cases the final collapse mechanism may occur when plastic hinges
fonn at the beam ends, rather than by yielding of the tension brace. This weak
beam case behaves similarly to the one with stronger beams but the onset of the col
lapse mechanism is sooner. Notice also that for all cases with a flexible beam, the
resistance when a collapse mechanism forms is smaller than the resistance at first
buckling.
3.3.2. Stiff beam collapse mechanism:
The second collapse mechanism is associated with a stiff beam. It is assumed
that the beam's shear strength is sufficient to avoid shear failure. Equations 3-4 to
3-9 still aplPly in this case. However, the beam being stiff, the tension brace elonga
tion ~brt is approximately equal in magnitude to the compression brace shortening
~brc (Figures 3-5-a,c,e). Again, one can distinguish three cases: small brace slender
ness, intermediate brace slenderness and large brace slenderness.
For small slenderness the tension yield force Py is only slightly larger than the
buckling force Pc' The beam being very stiff, the tension force in brace Bl will keep
increasing. The maximum unbalance force that can be applied to the beam is
(Py - PJsinE>. If the beam is strong, according to our definition, the tension in
brace BI will reach Py before the beam yields. From that point onward the resis
tance provided by the bracing cannot increase; in fact it drops slowly because the
compression in brace B2 decreases slowly with defonnation (Figure 3-5 -a). For
small slenderness the points where Pc and Py occur are so close that they can be con
sidered as a single event. The overall behavior is that of a defonnation softening
system (Figure 3-5-b).
For intennediate slenderness braces the tension yield force Py is significantly
larger than Pc, but cannot exceed 2Pc' The maximum unbalance Pun that can be
applied to the beam is larger than in the previous case. The tension force in brace

34
Bl will be increasing at the rate Ko, while the compression in brace B2 will be
decreasing· at the rate Kbb. For intennediate brace slenderness the buckled brace
tangent stiffness ~ is negative and starts with an absolute value larger than the
elastic brace stiffness Ko. The magnitude of Kbb decreases rapidly to stabilize at a
small fraction of Ko. The total effect is a sharp drop in story resisting force, fol
lowed by an increase at the rate Ke. Since Py is less than 2Pc ' the ultimate story
strength Fu is approximately equal to the strength at first buckling Fb (Figure 3-5-d).
After brace Bl yields in tension, the total resistance starts dropping slowly.
For large slenderness the tension yield force Py is much larger than Pc. The
maximum unbalance Pun that can be applied to the beam is larger than in the previ
ous case. The tension force in brace Bl will be increasing at the rate Ko, while the
compression in brace B2 will be decreasing at the rate l<nb (Figure 3-5-e). For large
slenderness l<nb is always numerically smaller than Kbp therefore Ke is always posi
tive and the resisting force is always increasing. After brace Bl yields in tension,
the total resistance starts dropping slowly. The overall behavior is that of trilinear
system with a defonnation softening final stage (Figure 3-5-f).
Again, as in the previous cases, beam yielding could precede yielding of the
tension brace. The same overall force-defonnation characteristics would be
observed.
3.4. COMPUTER SIMULATIONS
To demonstrate the effect of brace buckling on load redistribution more quanti
tatively, a two-story chevron-braced structure is used as the basis of a series of com
puter simulations (Figure 3-1). In order to limit the number of parameters in this
demonstration, all members are assumed pin jointed, and beams and columns are
assumed to be inextensible and infinitely strong axially. Beams have a finite Oexural
stiffness but are assumed to remain elastic. A linear lateral force pattern is imposed
quasistatically to permit comparison of results for cases with the same deformation
history but different member proportions.
Both Oexible and stiff beam configurations were investigated. Three different
brace slenderness ratios, equal to 20, 100 and 200, were employed. The analyses
are first carried out for braces having a constant buckling strength Pc (Section 3.4.1)
and then are repeated for braces having constant yield force Py (Section 3.4.2).
Details of the structures considered are contained in Figure 3-1 and Table 3-1. The
analysis was carried out using the structural analysis program ANSR [52), the braces

35
being modeled by Ikeda's brace element [35].
Severa.l quantities were used for comparisons. Story shear versus story drift
relationships are examined to study resistance characteristics of the structure follow
ing brace buckling. The internal forces of interest are the axial foras in the
columns, and the vertical unbalance force at midspan for the beams. To examine
the force redistribution process, results are plotted with respect to story drift. How
ever; to assess the magnitude of the redistributed forces and of their importance, the
variation of interna.l forces with story shear are also shown.
Results for stiff beams are compared to those obtained for flexible beams. In
all the figures, a solid line denotes results for small brace slenderness ( X. = 20).
Long-dashed lines represent values for braces of intermediate slenderness (
X. = 1(0), and short dashes are for large slenderness ( X. = 200). All forces are
normalized versus story shear at first buckling. Story drift is measured as a percen
tage of the story height.
3.4.1. Chlevron-braced frames at constant Pc:
In all cases examined in this section braces have the same buckling load Pc (see
Section 2.4.3). The quantitative results obtained are in complete agreement with the
qua.litative descriptions in Sections 3.1 and 3.2.
3.4.1.1. Story shear versus story drift: It can be seen from Figure 3-6 lhat small
slenderness braces cause a bilinear softening behavior, whether the beam is stiff or
flexible. An intermediate slenderness results in a degrading resistance-deformation
curve. The strength deterioration is more important for flexible beams than for stiffones. ~e resistance increases slowly with drift until the tension brace yields (beams
are assumed to remain elastic in these examples). Yielding of the tension brace
occurs sooner with stiff beams (0.5 % drift for x.= 100) than with flexihle beams
(2.5 % drift for X. =100). For large slenderness braces and a flexible beam, the
fqrce-deformation curve has a narrow range of reduced stiffness corresponding to the
elastic buckling strength plateau. This is followed by a strength degradation after
the compn:ssion brace forms a plastic hinge. If a stiff beam is used then one obtains
a trilinear hardening resistance-deformation curve.
Notice that the initial lateral stiffness increases with brace slcndern~;. This is
due to the constraint of constant brace buckling strength adopted in this sc:1ion. As
brace slenderness increases the buckling stress drops (Eq 2-1O-b). To maintain the
same buckling strength, the brace cross sectional area must be increased with

36
increasing slenderness. This increases the brace axial stiffness which is a major com
ponent of the structure's lateral stiffness.
3.4.1.2. Beam unbalance load: As expected, the maximum unbalance force on the
beam increases with brace slenderness. For the same brace slenderness, the unbal
ance force is larger and occurs earlier for stiff beams than for flexible beams (except
for the stocky braces where the results are similar). Unbalance forces occur at a
smaller drift for larger brace slenderness (Figure 3-7) because frames with slender
braces have more lateral stiffness and hence reach the buckling strength at a smaller
drift. The unbalance force keeps increasing until the tension brace yields. This hap
pens sooner with stiff beams (0.5 % for h=100) than with flexible beams (2.5 %
for h = 100). The maximum unbalance force can be quite large compared to the
story elastic shear strength Fe' especially in cases of stiff beams and slender braces.
It may not be possible to economically design beams that are strong enough to resist
such large unbalance forces.
The maximum unbalance force on the beam for a given story shear increases
with brace slenderness (Figure 3-9). For the same brace slenderness, the maximum
beam unbalance force is larger for stiff beams than for flexible beams.
3.4.1.3. Column axial forces: Axial forces in the columns originate from two
sources: an overturning moment component, and a component due to the vertical
unbalance load on the beam. Because of the geometry of the example frame and
the use of pinned connections, the first source of axial force, the overturning com
ponent is most clearly displayed in the ground story columns for the case of stocky
braces (h = 20). For that case the vertical unbalance component is almost non
existent with either flexible or stiff beams. The axial column forces on both sides of
the structure are almost symmetric across the horizontal axis in Figure 3-8-a. Since
the shapes of the base shear-lateral deflection relations for these cases (Figure 3-6)
are nearly elasto-perfectly plastic, column axial forces follow the same relationship
and have a maximum value as expected equal to 0.6 Fc' The second source of
axial force results from the shear in the beam attached to the top of the column. In
the elastic range this force is zero, but once a brace buckles in that story, the shear
in the beam increases column compression by Punbal / 2.
Both of these effects are combined in the first story columns. It is interesting to
note that the two effects tend to cancel in the column that would normally be in ten
sion. The unbalanced load is sufficient in many cases to induce net compression

37
forces in the tension column. Similarly, the compression forces can be significantly
increased.. The vertical unbalance component is most clearly displayed in Figure 3
8-b for the second story column axial forces. The overturning moment component
for these columns is nil because the lateral load is directly picked up by the braces.
It is evident in this case how the unbalance force developed in the beams after brace
buckling (Figure 3-7) is transmitted to the columns. The axial force is zero until
brace buckling occurs, and then it increases with brace slenderness, espe:cially in
presence of stiff beams. This is particularly significant in cases of slender braces
with stiff beams where the maximum column compression may be quite large (up to
three times the elastic story shear strength). Of course, beam yielding may limit
these forces. However, beams may be stronger than intended due to composite
action with slabs. Similarly, unbalance forces can be larger than expected due to use
of braces larger than the required size, approximate effective length factors and ini
tial imperfections (reducing PJ. If these possibilities are not accounted far at the
design stage, column yielding or buckling may occur leading to sudden collapse of
the whole structure. Consequently, it is important to consider the effect of brace
slenderness ratio as well as of beam stiffness and strength on the post·buckling
strength and redistribution of forces.
At any given story shear value after brace buckling has occurred, column
compression is larger for slender braces than for stocky braces (Figure ~,-lO-a,b).
The increase is not very large when flexible beams are used. At any braC(~ slender
ness and story shear, column compression is larger for a stiff beam than for a flexi
ble beam. Moreover, in case of stiff beams and slender braces, the colt;mn axial
compression after brace buckling increases with story shear at a faster rate than it
did before brace buckling (Figure 3-1O-a). The trend is even more evident in Figure
3-1O-b for the ,second story columns. This implies that for such cases, as the actual
loading increases beyond the story elastic shear strength column forces increase at a
faster rate and hence may fail earlier than predicted by an extrapolation of elastic
analysis results. Notice that the imposed displacement pattern yields the first story
before the second, hence the complicated curves in Figure 3-1O-a.
3.4.2. Ch4!Vron-braced frame at constant Py:
Another series of simulations was considered where the tension yield force Py
was held constant for various brace slendernesses (~ = 20,lOO,and200) end beam
stiffnesses (flexible and stiff). The objective was to compare the observations with
those based on constant Pc' As for constant Pc cases, the two most important

38
parameters were found to be brace slenderness and ratio of beam stiffness to brace
stiffness in the vertical direction.
3.4.2.1. Story shear versus story drift: Since the areas of the braces are the same
in all of the cases considered, the initial elastic stiffnesses of the frames are identical
(Figure 3-11). However, relative to the base shear capacity of a system with yield
ing rather than buckling braces, it is seen that the shear strength at which the first
brace buckling occurs decreases with increasing brace slenderness. The strength
reduces substantially following first buckling in all case<; except for slender braces
with stiff beams. A stiff beam increases the post-buckling strength for all brace
slenderness cases.
3.4.2.2. Beam unbalance load: For stiff beams, the unbalance force applied to the
beam occurs at smaller story drifts for large brace slenderness (Figure 3-12). That is
because large slenderness braces buckle at a smaller load and hence at a smaller
drift. Maximum beam unbalance force is largest for intennediate brace slenderness
and stiff beams. For flexible beams, the· unbalance force applied to the beam is
practically independent of brace slenderness.
3.4.2.3. Column axial forces:. For constant Py the overturning moment component
of column compression seems to be predominant over the vertical unbalance load
component. For flexible beams as well as for stiff beams, maximum column
compression in the first story decreases with increasing brace slenderness (Figure 3
13-a). Since the second story columns receive axial forces from the vertical unbal
ance force component only, their pattern of axial force variation with story drift is
the same as that of the vertical unbalance force on the beam. With stiff beams,
maximum column compression at any given story drift increases with brace slender
ness (Figure 3-13-b). With flexible beams, maximum column compression is practi
cally the same for all brace slendernesses.
Conclusions derived from comparisons at constant brace yield load are in gen
eral similar to those made from comparisons at constant brace buckling load. The
most important difference concerns column axial forces. At constant brace yield
force increasing the slenderness would reduce the columns axial forces, but it would
also reduce the story strength at the first inelastic event. This conclusion is mislead
ing because in practice the desired story strength would be detennined first hence
fixing the brace's buckling load. At constant brace buckling load increasing the

39
slenderness would· increase column axial forces, especially if a stiff strong beam is
used.
3.5. CONCLUSIONS
It has been shown that the post-buckling force redistributions in chevron-braced
frames are extensive and are very sensitive to beam stiffness and to brace slender
ness. _These force redistributions are entirely unpredictable by elastic analysis (e.g.,
the vertical unbalance force on the beam) or are underestimated (e.g., the i.ncreased
rate of column compression after brace buckling). Yet, to improve the ductility of
such frames, it is essential to keep in mind these redistributions when propartioning
the structural components. A classification for beams has been established according
to their stiffness. With this classification along with that of braces (Chapter 2) it is
possible to determine which collapse mechanism (flexible or stiff beam me:hanism)
is l~kely to occur for a given configuration. Alternatively, it becomes possibl.e to pro
portion beams and braces to favor one collapse mechanism over anothe:r. With
Equation 3-28 it is possible to predict the maximum unbalance force that 'the brace
can apply to the beam. This unbalance force will be considered further in following
chapters and appendices.
It is generally believed that a hardening post-yield force-deformation charac
teristic giV(:5 a better dynamic response than an elasto-plastic response whi,:h is still
preferable to a deteriorating resistance characteristic. Stiff beams and slender braces
are necessa.ry to achieve a trilinear response. From Equation 3-25, a table of steel
section properties and the usual braced bay dimensions, it is evident that it is diffi
cult or impractical to achieve a stiff beam effect. Furthermore, Equation 3-29
implies that the columns in such a frame would then have to be designed for very
large compression forces, if column yielding or buckling is to be avoided. Similarly,
it appears that intermediate slenderness braces should be avoided bea:.use they
induce the largest force redistributions. It appears from these static analY!iis results
that stocky braces should therefore be used wherever possible.

40
CHAPTER 4
INELASTIC DYNAMIC RESPONSE OF A CHEVRON-BRACED PANEL
4.1. INTRODUCTION
As shown in the analyses of Chapter 3, it is possible to obtain six different
modes of inelastic behavior in chevron-braced frames depending on the relative pro
portions of beams and braces. These quasi-static analyses are not sufficient by them
selves to recommend one mode of behavior over another.
In this chapter, the dynamic inelastic response of each mode of chevron-braced
frame behavior is analyzed for two kinds of idealized excitations: a pulse load and a
sinusoidal excitation. The response of an elasto-plastic system of same strength, fun
damental period and damping as the chevron-braced frame is used for comparison.
Inelastic design spectra developed for chevron-braced systems subjected to various
earthquake ground motions are compared to those for elasto-plastic systems. With
these comparisons it is possible to assess some of the recent code recommendations
for the design forces for braced systems.
4.2. SYSTEMS COMPARED
As shown in Figure 4-0, the structures used in the comparisons consist of one
story, one bay, chevron-braced frames, and one story, one bay, moment resisting
frames, proportioned to have the same fundamental period, viscous damping, and
strength level at the first inelastic event. For each of the six cases for a chevron
braced system identified iri Chapter 3, the brace and beam sections are chosen to
maintain the same strength level at first brace buckling.
The response quantities utilized for the comparisons are the maximum displace
ment and the maximum energy dissipation demand. These are normalized with
respect to the corresponding quantities for an equivalent elasto-plastic system of
sa.me strength level,. fundamental period and viscous damping. Since the dynamic
inelastic response of elasto-plastic systems has been widely researched and is
thoroughly documented, it constitutes a good basis for comparison. The ductility
demand for these elasto-plastic systems are shown in Figure 4-7 which is reproduced
from Biggs [17].

41 .
4.3. RESIf»ONSE COMPARISON FOR IDEALIZED EXCITATIONS
Earthquake excitations consist of a mix of pulses and of harmonic \ibrations.
The pulses often dominate in ground motions recorded close to the fault site while
harmonic vibrations are most noticeable far away from the epicentre of ':he earth
quake [54]. It is generally known that elasto-plastic systems are particularly vulner
able to excitations characterized by long pulses [14]. On the other hand, harmonic
excitations can induce the most severe response in elastic systems and hence hasten
the occurr,ence of yielding. They can also lead to problems of low cycle fatigue in
yielding systems. Accordingly, two idealized loadings are used to study the dynamic
inelastic response of chevron-braced systems. One excitation is a triangular pulse
with equal rise and fall time Tf' and the other consists of five cycles of a sine wave
of period T f .
For each of the simulations, the amplitude Pmax of the excitation ranges (Figure
4-0) from 0.2Fe to 2.0Fe. For the pulse excitation the ratio TIT sweeps the range
between 0.2 and 2.0. Similarly, for the sinusoidal excitation, the ratio T{f varies
between 0.2 and 2.0. In all cases, the system is assumed to be initially at rest.
4.4. FINDINGS
The results of all simulations are shown in Figures 4.1 to 4.4. The peak ductil
ity ratios are reported in Tables 4-1 and 4-2.
Figures 4-1-a to 4-1-f show the variation with TIT and Pma/Fe of the ratio of
maximum displacements for the six cases. It is evident from these graphs that for
the case of stocky braces, the beam stiffness does not appreciably affect the response.
However, displacement ductility demands are amplified when Pma/Py :> 1. For the
case of inrermediate slenderness braces, the maximum displacement for a braced sys-.
tern can also be a lot larger than that of a corresponding elasto-plastic system., How
ever, the use of a stiff beam reduces the magnitude of the peak displacement ratio
(which still remains large). For slender braces, the use of a stiff beam can tremen
dously reduce the maximum displacement ratio, even to less than one. This is due
to the trilinear deformation hardening characteristics.
Similarly, Figures 4-2-a to 4-2-f show the variation with TIT and Pma/Fe of
the ratio of maximum energy dissipation for the same six cases. These figures
dramatically show the relative sensitivity of the braced system with intermediate
slenderness braces. The high sharp peaks reflect the cases where an elasto-plastic
system barely yields while a braced system has to dissipate a large amount of energy.

42
The use of a stiff beam in all cases of brace slenderness does reduce the amount of
energy dissipation demand, but that amount still remain'i high compared to that in
an equivalent elasto-plastic system.
Figures 4-3-a to 4-3-f show the variation with T(f and Pma/Fc of the ratio of
maximum displacements for the six cases. These figures differ markedly from those
for the pulse excitation. The ratio of peak displacements are closer to one. In par
ticular, the response of frames with stiff and flexible beams are comparable. In the
case of stocky braces, the response is always larger than or equal to that of an
equivalent elasto-plastic system (because of the defonnation softening). Displace
ment ratios increase with increasing T(f and Pma/Py' In the cases of slender and
intennediate slenderness braces, the maximum displacement can in some cases be
smaller than that of corresponding elasto-plastic system irrespective of the beam stiff
ness. This can be probably related to the existence of a range of displacement
amplitudes where a braced system can dissipate more energy per cycle than a similar
elasto-plastic system. However, the displacement ratios generally increase with
increasing TIf for Pma!Py less than unity.
Figures 4-4-a to 4-4-f show the variation with T(f and Pma/Fc of the ratio of
energy dissipation demand for the hannonic loading cases. Although the ratio of·
energy dissipation demand is largest in the case of intennediate slenderness braces
and flexible beams, it is much smaller than the corresponding ratio for pulse loading.
The use of stiff beams reduces the maximum ratio of energy dissipation demand.
4.5. COMPARISON OF INELASTIC DESIGN SPECTRA
Inelastic design spectra have been developed for structures exhibiting elasto
plastic types of hysteresis loops [15,80]. These models represent the behavior of
moment resisting frames, but they are not suitable for chevron-braced frames which
exhibit a more complex hysteretic behavior. A special program (NOSPEC) was
developed to generate inelastic response spectra for a variety of structural hysteresis
msx}els. One model in NOSPEC represents the buckling behavior of chevron-braced
frames (Figure 4-5). Using this element, it is possible to generate inelastic design
spectra for buckling type structures and to compare them with those of moment
resisting structures. The design spectra are developed as follows. For every strength
level, a mean response spectrum is obtained by averaging the results of six earth
quake records (typical of the western United States, Table 4-3). The ductility
demand curves at constant strength levels are back interpolated to obtain design
strength levels TJ=F!Mvg. .. for constant ductility. The same procedure is repeated

43
for displaoement and energy ductility demands.
Three: cases were considered in generating the inelastic design spectra. Only
chevron-braced systems of deteriorating strength type are considered becmse they
are the most commonly encountered and the most critical. Data is available else
where for bilinear and trilinear hysteretic systems [15]. The systems considered are:
(1)- SNAP40: a braced system model with KtI~= -D.5, Kr'~=O.OOI and
Pmir/Pc=0.40. This case is an idealization of a chevron-braced sy~;tem with
inten1r1ediate slenderness braces and flexible beams.
(2)- SNAP70: a braced system model with KtI~= -D.5, Kr'Ko=O.OOl and
PmirIJPc=0.70. This case is an idealization of a chevron-braced sy~;tem with
intermediate slenderness braces and flexible beams and enclosed within a
moment resisting frame.
(3)- LEPP: a reference elasto-plastic model with Kr'~=O.OOI.
4.6. FINDINGS
Figures 4-6-a to 4-6-d show the ratio of design strength levels of chevron-braced
systems to those of elasto-plastic systems, necessary to maintain the same ductility
demands. It is evident from these results that the constraint of equal displacement
ductility demand (Figures 4-6-a and 4-6-c) is more stringent than that of equal
energy ductility demand (Figures 4-6-b and 4-6-d): it requires a higher strength level
for either braced system conSidered. Assuming that the allowable displaa~ment and
energy ductility capacities of chevron-braced systems are arbitrarily three-fourth (3/4)
of those for an elasto-plastic system, Table 4-4 shows that such braced systems must
be designed for a force level 1.3 to 1.9. In that case the proposed SEAONC [75]
code recommendations for chevron-braced frames appear to be on the conservative
side: 1.5· 12/ 8 = 2.25. The 12 and 8 are the design force reduction factors Rwspecified by SEAONC for moment resisting and braced systems respectively, and the
1.50 factor is for the 50% increase in design forces for chevron-braced systems.
These recommendations do not account for the different cases introduced here.
However, before more general conclusions can be drawn on the adcqual~' of such
recommendations more extensive studies on multidegrce of freedom systems must be
perfonned.

44
4.7. CONCLUSIONS
From comparing the results of pulse loading to those of harmonic excitation, it
is evident that pulse loading is particularly damaging for braced systems. For both
types of loading, the combination of stiff beam and slender braces has the most
desirable overall dynamic response, followed by cases of stocky braces. The combi
nation of flexible beam and intermediate slenderness braces has the most undesirable
response characteristics, namely very large displacement and energy dissipation
demands.
At the same strength level as a comparable elasto-plastic system, chevron
braced structures have to accommodate more displacement and energy dissipation
demand. However, braced systems usually have a smaller reliable energy dissipation
capacity, so that they must be designed for a higher strength level. The earthquake
design spectra generated have confirmed the already accepted notion of designing
concentrically braced frames for higher force levels. These results are strictly valid
only for single degree of freedom systems. The next chapter will examine the vali
dity of these conclusions for realistic multistory structure models.

45
CHAPTERS
INELAS'nC DYNAMIC RFSPONSE OF MULTISTORY CHEVRON-BRACED FRAMES
5.1. INTRODUCTION
The last two chapters have dealt with the static and dynamic respons,e charac
teristics of one story, one bay, chevron-braced structures. These were modeled as
single degree of freedom systems for the dynamic analyses. These chapters con
tained several important conclusions which may not be directly applicable to multi
degree of freedom systems. As discussed in Chapter 1, multistory chevron-braced
structures have been found to exhibit special problems, in particular a tendency to
fonn soft stories.
This chapter explores the behavioral characteristics specific to multistory
chevron-braced steel frames. It also examines the effectiveness of several design
recommendations that are generally believed to improve their response; namely,
(1)- The use of stocky braces instead of intennediate slenderness braces.
(2)- The use of stiff beams instead of flexible beams.
(3)- An increase of frame participation in resisting lateral loads.
These investigations are carried out using numerical simulations. The first sec
tion of this chapter describes the simulation procedures and the response quantities
monitored. Then, a detailed account of the results is examined, followed by a dis
cussion of some of the dynamic effects characteristic of chevron-braced frames.
Finally, conclusions are drawn regarding the effectiveness of the design r'~mmen
dations considered, and the implications of the results observed.
5.2. STRUCTURAL MODELS
The primary design parameters considered for this study are the brace slender
ness, the beam stiffness, and thc frame participation in resisting the latcral load. A
sU: story high by three bays wide chevron-braced steel frame is used to systematically
study the effects of these parameters on the dynamic inelastic response.
The frames analyzed (Figure 5-1) are assumed to be an exterior frame of a six
story building that is square in plan and that has three bays on each side. Frames
are spaced at 20 ft (6.10 m) in each direction and only the extcrior frames are
assumed to be braced and to resist the lateral loads. The gravity loads assumed con
sist of uniformly distributed dead loads of 110 psf (5.27kN/m2) and live loads of 80
psf (3.83kN/m2). The equivalent static lateral seismic loads are computed according

46
to 1985 UBC Zone 4 requirements. The factor K was taken equal to one (1) for all
frames except those considered as dual systems for which K is set to 0.8 [32). The
importance factor I was set to one (1) and the product CS was controlled by the
limit 0.12. Z being one (1) for zone 4, this leads to a base shear coefficient of 0.12
for the reference case KREG. Floor diaphragms are considered as rigid in plane
and flexible out of plane. In designing the beams of the braced bays, the support
provided by the braces at midspan is neglected. A weak beam-strong column philo
sophy is applied in selecting member proportions. A36 steel is used for all structural
steel members. The inertial mass for the horizontal degree of freedom at each story
is based on half the story dead load (there are two symmetric braced frames in each
direction). For the vertical degrees of freedom, inertial mass is computed based on
tributary area and dead load weight.
In all parameter variations for a given set of lateral loads the braces design
buckling loads are kept constant. This corresponds to the typical design situation
where equivalent lateral lo~ds are specified and simplified analysis procedures are
used in the design. Thus, brace sizes change with the assumed slenderness ratio so
as to maintain the same buckling load. When choosing brace sections from the
AISC tables, wide flange sections only were considered for braces except in one case
where double angles were used.
To carry out the analyses a physical theory brace model developed by Ikeda
[35) was used in the program .ANSR [52). The numerical time integration uses
Newmark's average acceleration scheme, with an integration time step of 0.001 s to
capture higher mode effects. Rayleigh type damping conforming to 3% in the first
two modes was used. Constant stiffness iteration is used at each time step to insure
convergence despite softening force-deformation characteristics.
5.3. CASES CONSIDERED
In conducting the parametric studies many cases were considered. To simplify
th.eir description, they can be classified into three sets:
5.3.1. The first set:
The first set looks at the sensitivity of the response in a chevron-braced frame
to such factors as hinged versus fixed beam to column connections, brace slender
ness, accidental brace understrength and overstrength, beam stiffness, and ground
motion intensity. For all cases in this set the UBC coefficient K is set to one (1).
(1)- KREG is the reference chevron-braced frame as described above with

47
intemlediate slenderness braces (>.. = 92). The braced bay is sized to carry all
the design lateral loads. However, all beams are connected to columns via
moment resisting connections designed for gravity loading.
(2)- KPIN is a chevron-braced frame similar to KREG but with pinned beam
to-column connections outside the braced bays.
(3)- KELAS is a frame similar to KREG except that all members are assumed
to remain elastic.
(4)- KSBM is a frame similar to KREG except that flexurally rigid infinitely
strong beams in the braced bay.
(5)- KSTO is a frame similar to KREG except that it uses small slenderness
braces (>.. = 46) each with the same buckling load as the corresponding brace
in KREG. These pin ended braces do not correspond to any real sections in
the AISC tables; their cross sectional areas are given in Table 5-1.
(6)- KOVER is a frame similar to KREG except that it is analyzed assuming
that the braces have an actual effective length of half the value assumed in the
design (for example the design assumes the braces have pinned ends while the
construction provides full fixity). The effective buckling strength of these
braces is 25% larger than that of their counterparts in KREG, and their effec
tive slenderness is 46.
(7)- KUNDER is a frame similar to KSTO except that it is analyzed assuming
that the braces have an actual effective length of twice the value assumed in the
design (for example the design assumes the braces to have fixed ends while the
construction provides pinned end conditions). The effective buckling strength
of these braces is 21 % lower than that of their counterparts in KSTO and in
KREG, and their effective slenderness is 92.
(8)- KREG30 is a frame similar to KREG except that the ground excitations
are proportionately scaled downward such that the North-South component of
the 1940 EI Centro record has a peak acceleration of 0.30g.
(9)- KREG70 is a frame similar to KREG except that the ground excitations
are proportionately scaled upward such that the North-South component of the
1940 EI Centro record has a peak acceleration of 0.70g.
5.3.2. Th,e second set:
The second set of studies looks at the effect of frame participation on the
response characteristics. In this set, design frame participation took valw::s of 0%,
25%, and 50% for intermediate slenderness braces and for stocky brace;. Frame
48
participation in this context is the proportion of the static lateral design loads that is
assigned to· the moment resisting frame. All beam to column connections are
moment resisting. All intermediate slenderness braces have a slenderness of 92 in
the first four stories and of 115 in the top two stories. All small slenderness braces
have a slenderness of 46 in the first four stories and of 57 in the top two stories.
For all the cases in this set the UBC coefficient K is set to 0.8.
(1)- KDOO is a frame similar to KREG but design('Ai using K=0.8 as for dual
systems, even though the moment resisting frame is not sized for the design
lateral loads. This case serves as a reference in determining the effect of frame
participation (when compared to KD25 and KD50) and of design load magni
tude (when compared with KREG). It should be noted however, that member
sizes in the moment resisting frame are controlled by gravity loads and do not
change as much as the braces. Braces do become smaller as a result of the
smaller K factor (see Table 5-1).
(2)- KD25 is a dual system chevron-braced frame with intermediate slenderness
braces and a moment resisting frame sized for 25% of the design lateral loads.
(3)- KS25 is a frame similar to KD25 except that it uses small slenderness
braces (A=46).
(4)- KD50 is a dual system chevron-braced frame with intermediate slenderness
braces and a moment resistant frame sized for 50% of the design lateral loads.
(5)- KSSO is a frame similar to KD50 except that it uses small slenderness
braces. The braces in KS25. and KS50 do not correspond to any sections in the
AISC tables; their cross-sectional areas are reported in Table 5-1.
5.3.3. The third set:
The third set of studies evaluates the merits of a design based on an "improved
strength and stiffness distribution". Such a distribution aims at achieving mean peak
forces and energy dissipation demands that are proportional to member capacities.
It is obtained as follows. An average power spectrum is derived for the earthquakes
used in the simulations. The trial structures are analyzed using random vibration
techniques for the input power spectrum determined above. The brace section sizes
are changed by trial and error until the section size distribution becomes propor
tional to the expected clastic peak brace compression. C--anvergencc to the "improved
design" is quite fast; requiring two or three iterations only. Since the random vibra
tion analysis technique used is applicable to elastic stnJetures only, the section sizes
finally obtained are scaled downward proportionately such that the first story brace

49
sizes equal those of the UBC based design. The section sizes in all other stories are
imaginary in that they do not correspond to the size of any section in the AISC
manual [2]. The required sizes of the imaginary sections reduce more rapidly with
height than do those of the UBC design (Table 5-1). All the proportional braces
have the same slenderness of 92 (Table B9). Only one structure was finally
analyzed for this set (i.e. KPRO) which corresponds to the conditions assumed for
KREG. Except for the braces, KPRO has the same member sizes as KREG (Table
5-1).
The range of fundamental periods is quite narrow, with KREG and KD50 at
the low end around 0.6s and KSTO, KPIN and KPRO at the upper end around
0.7s.
5.4. EARllHQUAKE LOADING
The simulations are confined to severe ground motions only. That i5. because
chevron-braced frames generally show an excellent response in the elaslic range
(corresponding to seismic excitations of moderate intensity). For the dynamic
analysis each frame is subjected to the "worst ten seconds" of six earthquakes
representative of the western United States (Table 5-2). The "worst ten seconds"
from each earthquake are taken as those where there is a maximum increment in
root mean square acceleration (Arias intensity [7]). To obtain the standard ground
motion intensity, the ten second window extracted from the North-South component
of the 1940 EI Centro record is scaled to a peak ground acceleration of 0.5g. The
remaining excitations are then scaled to the same root mean square aa::eleration
(Figure 5-2-a). The overall mean of the peak ground acceleration for the excitationsused is,O.56g. Figure 5-2-b shows the average input power spectrum of (rle scaled
excitations. The Tstart entry in Table 5-2 indicates the beginning of the 10 :i window
in the original earthquake record.
5.5. RESPONSE QUANTITIES
The response quantities used for evaluating seismic perfonnance of the different
cases include:
(1)- The total energy dissipation demand and its distribution over be indivi
dual stories. The total energy dissipation demand is a measure of the cumula
tive damage inflicted to the structure. The distribution over the individual
stories is a measure of design effectiveness, based on the premise that the more
uniform the distribution, the better the design. A distribution of energy

50
dissipation demand that is uniform or proportional to member strength distribu
tion reflccts the absence of soft stories and an "optimal" distribution of strength.
(2)- The maximum story shears. Maximum story shears give an indication of
the ability of the structure to meet or exceed its strength capacity. Maximum
story shears in conjunction with story ductility may be used heuristically to
decide how much one should increase or decrease story strength to achieve a
more uniform ductility demand over the structure.
(3)- The maximum story drift is another measure of damage incurred in the
structure. Drifts should be kept below a certain limit (e.g. In5 or 1/50 of the
story height) to avoid geometric instability [45].
(4)- The maximum column compression is a good indicator of the frame parti
cipation in the response and of force redistributions due to brace buckling.
Beam moments are not retained for evaluation bec..ause the frames are propor
tioned according to weak beam-strong column design philosophy and moments
. are thus limited by the beam yield value.
To account for the variability of inelastic response in evaluating each system's
performance, the mean and coefficient of variation (COV) of each response quantity
must be considered. Mean values are used to show trends and COY should reflect
the sensitivity of the response to the characteristics of the ground motion [4]. Ideal
structural configurations have uniform mean values and small coefficients of varia
tion, indicating a response that is relatively insensitive to the characteristics of the
excitations.
Consider, for example, the graphs for KREG shown in Figure 5-3; the solid
lines show the mean peak values, and the dashed lines a margin of plus and minus
one standard deviation. There is a 50% chance that the response exceeds the mean
peak value. The wider the band defined by the dashed lines, the more scattered the
response is. Assuming a normally distributed response, the probability of the
response falling within the band defined by the dashed lines is 33%. The narrow
bands for story shear and column compression forces indicate that the maxima of
these forces are controlled by the formation of collapse mechanisms. Hence, these
forces can be well predicted by capacity design methode;. The short dashed lines on
the column compression plots show for comparison the axial force'S present under
service gravity loads. It should be noted that these graphs do not vary unifonnly
with height. This reflects the tendency of chevron-braced frames to fonn soft
stories. Here, greater drifts and energy dissipation demands were concentrated in
the bottom three stories and in the fifth story. The typical story hysteresis loop

51
shown in lFigure 5-3 is for the shear-drift relation of the ftrst story for the East-West
component of the 1935 Helena record.
5.6. DESCRIPTION OF RESULTS
Results for the frames considered are shown in Figures 5-3 to 5-17 and Tables
5-3 to 5-17. The description of the observed results is divided into sections that
emphasize the effect of the design parameters on the response quantities:
5.6.1. El:astic design versus inelastic design (KELAS vs KREG, Figures 5-5 and
5-3 and Tables 5-5 and 5-3):
Designing the frame to remain elastic would require accomodating mean peak.
force leveJls two to three times as large as in a frame designed according to UBC.
Moreover, the COY of elastic forces is much larger than the corresponding COY in
KREG (twenty to thirty times bigger). Compared to KREG, drifts in KELAS are
smaller in the lower stories and larger in upper stories. The comparatively larger
lower story drifts in KREG are due to the occurrence of soft stories there. The rela
tively larger upper story drifts in KELAS can be possibly traced to three causes: (1)
higher mode effects in the elastic structure KELAS which are not limited by brace
buckling, (2) the increased column axial deformations (because of the higher elastic
forces) leading to an overall bending deformation of the frame (cantilever deflec
tion), and (3) the yielding of the lower stories in the inelastic frame (KREG) may
help isolate the upper stories from further excitation. However, it is interesting to
note that the COY of story drifts for KELAS are smaller than those for KREF.
5.6.2. Pilllned connections versus moment connections (KPIN vs KREG, Figures
5-4 and 5-3, Tables 5-4 and 5-3):
Th.e maximum story shears in KPIN are slightly lower than those in KREG due
to reduced frame participation. But they have larger COY except at the third and
fi!t'h floors. Maximum story drifts in KPIN are larger than those in KREG at all
stories except the first. The distribution of mean peak energy dissipation shows the
same trend for both cases, but with a slightly lower COY in the case of KPIN.
Compared to KREG, KPIN must dissipate slightly more energy in the upper stories.
52
5.6.3. Stiff beams versus flexible beams (KSBM vs KREG, Figures 5-6 and 5-3,
Tables 5-6 and 5-3):
The use of stiff and strong beams changes the hysteresis loop characteristics
from a deteriorating one (Type 2 as in Fig. 3-4-d) to a trilinear one (Type 6 as in
Fig. 3-5-f). Compared to KREG, story shears in KSBM are approximately 40%
larger and have a smaller COY (except in the first two stories). However, the
increased axial forces in the columns reduced the flexural capacities sufficiently to
completely yield the first story interior columns in flexure, causing a soft story there.
The first story experienced very large drifts, excessive energy dissipation demands in
the braces and the frame elements, and a doubling of exterior columns compression
(due to force redistribution to the moment resisting frame).
5.6.4. Stocky braces versus intermediate slenderness braces (KSTO vs KREG;
Figures 5-7 and 5-3 and Tables 5-7 and 5-3, KS25 vs KD25; Figures 5-14 and 5
13 and Tables 5-14 and 5-13, KS50 vs KD50; Figures 5-16 and 5-15 and Tables
5-16 and 5-15):
Using small slenderness braces (X. = 46) instead of intermediate slenderness
braces (X. = 92) reduced maximum story shears, brace energy dissipation demands,
and interior column compressions. On the other hand story drifts and total energy
dissipation demand remained practically unchanged, and exterior columns compres
sion increased. All these symptoms indicate an increased participation of the frame
in load resistance and in energy dissipation. The COVs of member forces and
energy dissipation demand are noticeably smaller for small slenderness braces than
for the intermediate slenderness braces.
5.6.5. Accidental variation in brace strength (KOVER vs KREG; Figures 5-8
and 5-3' and Tables 5-8 and 5-3, KUNDER vs KREG; Figures 5-9 and 5-3 and
Tables 5-9 and 5-3):
Compared to KREG, frames with accidentally overstrong braces (KOVER)
experience a different pattern of response. All maximum story shears are increased
by 30% approximately. Maximum story drifts remain approximately the same,
except at the top story where drift increases by 40% (due to the higher elastic forces
corresponding to the higher yield level). Compared to KREG, the largest amplifica
tion in story drift COY occurs for KOVER at the top and bottom of the frame (1.9
and 2.1 respectively), and maximum attenuation occurs at mid-height (fourth story;
0.21). The increased variability of story drift in the first story is probably due to the

53
less frequent yielding there. This is confinned by the lower mean peak energy dissi
pation demand there and its increased COY. The increased variability of story drift
in the top story is caused apparently by the larger elastic forces and the larger yield
levels in KOVER compared to KREG. Compared to KREG, the mean peak
energy dissipation demand in KOVER increases and so does its COY. The; location
of maximum energy dissipation demand moves from the first story to the third. The
increased brace capacities result in increased mean peak interior column forces (and
COVs) eVlerywhere except in the top floor. All exterior columns have increased
compression but not to the same extent as the interior columns.
Maximum story shears are naturally smaller and story drifts larger in
KUNDER than in KREG for all stories except the top and the bottom. Story shear
COVs are much larger in KUNDER than in KREG in all stories except the top.
The story drift COVs are smaller in KUNDER than in KREG in all stories except
the'top and the bottom. The story hysteretic loops in KUNDER are totally different
from those of KREG. Whereas KREG stories exhibit a deteriorating force
deformation hysteresis (Type 2, Fig. 3-4-d) KUNDER stories have trilinear force
deformation curves (Type 6, Fig. 3-5-f). The small section size of the originally
stocky braces makes the beam behave as a stiff and strong one.
Although maximum story shears in KUNDER are smaller and the drifts are
larger than those of KREG, the total energy dissipation demand is smaller, has less
variance and has a more uniform distribution than in KREG. The moment resisting
frame assumes a larger portion of the energy dissipation demand, mainly in the
beams (Table 5-18). The KUNDER frame resists the lateral load folJowing brace
buckling through a cantilever mode which transfers loads from the braced core to theexterior columns by shear in the beams. This is confirmed by the energy dissipation
demand in the beams and by the pattern of column axial forces. Mean peak column
compression and their COVs are much smaller in the interior columns of KUNDER
than in those of KREG, while the opposite is true for exterior columns,
5.6.6. Large versus small frame participation (KD25 vs KDOO; Figures 5-13 and
5-12 and Tables 5-13 and 5-12, KD50 vs KD25; Figures 5-15 and 5-13 and
Tables 5-15 and 5-13):
As the frame participation increases, maximum story shears and column
compressions increase ( a 15% increase for KD25 compared'to KrnO). The COVs
of all resp)nse quantities increase in general. The energy dissipation demands, how
ever, decrease. The locations of maximum story drift and of maximum energy

54
dissipation tend to shift to the story where the brace contribution to lateral story stiff
ness is largest (from the first to the second or third story 'in these cases).
5.6.7. Proportional brace design (KPRO vs KREG; Figures 5-17 and 5-3 and
Tables 5-17 and 5-3):
Compared to KREG, maximum story shears in KPRO are smaller, especially
in the upper stories. However they exhibit more variability, particularly in the lower
stories. Maximum story drifts are smaller in KPRO than in KREG for the first
three stories and larger for the last three stories. The smaller story drifts in KPRO
are the consequence of reduced plastification in those stories. The larger story drifts
in KPRO are due to larger elastic drifts (smaller brace sections) and increased ine
lastic activity in the upper stories. A comparison of the distribution of energy dissi
pation demand for KPRO and KREG confirms this observation. The ratio of
energy dissipation demand of KPRO compared to that of KREG shows the same
trend as the story drifts: smaller in the lower stories and larger in the top stories.
The interior column compressions in KPRO are smaller than those in KREG,
presumably because of the smaller brace sections in the top stories. On the other
hand the exterior columns of KPRO have larger compressions than the correspond
ing columns in KREG. This indicates an increased frame participation caused by
the lower overall strength and stiffness of the braced bay.
5.6.8. Effect of ground motion intensity (KREG30 vs KREG; Figures 5-10 and
5-3 and Tables 5-10 and 5-3, KREG70 vs KREG; Figures 5-11 and 5-3 and
Tables 5-11 and 5-3):
For the reduced ground motion intensity (KREG30 versus KREG) , one
observes a reduction in story drifts and in energy dissipation demand. The reduction
in drift is proportional to the ratio of earthquake intensities at the first floor, but top
story drifts remain practically equal. The reduction in story energy dissipation
demand is proportionally larger than the reduction in earthquake intensity. Max
unum story shears a'nd column compressions (interior and exterior) are practically
unchanged. Coefficients of variation of most quantities are larger in the case of
reduced earthquake intensity, compared to the reference case (KREG).
For the magnified ground motion intensity (KREG70 versus KREG), there is
an increase in story drifts and energy dissipation demand. The increase in story
drifts is largest at the lower three floors, story drifts of the top three stories remain
practically unchanged. The increase in energy dissipation demand in KREG70

55
compared to KREG is larger than the increase in earthquake intensity. The max
imum incre:ase in energy dissipation demand is in the third story. The Cays of
energy dissipation demand are noticeably reduced in all stories. Maximum column
compression in interior and exterior columns are practically unchanged; brace and
beam yielding effectively limit the amount of compression fed into the columns.
5.7. ANALYSIS OF RESULTS
This s,ection attempts to determine from the observed results the underlying
basic phenomena and to draw more general hypotheses and conclusions regarding
the factors controlling the behavior of braced frames.
5.7.1. EDE~rgy dissipation demand:
The energy dissipation demand was concentrated mostly in the braces (Table
5-18). The columns practically remained elastic and the total energy dissipation
demand in the beams was negligible compared to that in the braces. Since the
energy dissipation capacity of the braces is much less than that of the beams, the dis
cussion of energy dissipation demand is limited to that of the braces.
It can be noticed from the maximum story drifts in most figures that inelastic
deformations are concentrated in a few soft stories near the bottom of the building.
However, as the frame participation increases the maximum energy dissipation
demand increases and tends to move upwards (from the first story to the sl~ond) or
to where there are section changes (third and fifth stories). Similarly, as the braced
bay beam stiffness. and strength are increased the maximum energy c.issipation
demand increases and moves upward in the structure (to the third story). The COy
of energy dissipation demand decreases with increasing frame participation, increas
ing beam stiffness, and decreasing brace slenderness. This trend is more aeute when
stocky braces are used.
It can be inferred that as frame participation is increased by increasing column
si?es, frame stiffness and strength increase. The increase is most noticeable in the
first story where the base fixity helps the columns to develop their full potential
strength and stiffness. The increase is less noticeable in other stories where the
development of strength and stiffness depends on joint fixity and the restraint pro
vided by the beams. The first story being now relatively stronger, damage tends to
concentrate in the second story. The aforementioned trend is even more noticeable
when stocky braces, with smaller relative stiffness are used. This shift in the loca
tion of maximum energy dissipation demand is not necessarily detrimental. It might

56
be deliberately used to make the energy dissipation demand more uniform. It may
also create problems if not taken into account.
5.7.2. Maximum story shear:
Dual systems have smaller maximum story shears by design. As frame partici
pation increases, the COY of maximum story shear increases in the stories where
inelastic activity occurs. For dual systems there is no definite increase in maximum
story shear in going from intermediate slenderness braces to stocky braces.
The increase in COY with increasing frame participation and decreasing brace
slenderness reflects the variability of the frame resistance mechanism. This mechan
ism depends to a large extent on the joint rotations at the column ends. If the joints
at the ends of a column are rotating in the same direction while story drift occurs,
oolurnn resistance is increased. If they are rotating in opposite directions, column
resistance is decreased. This resistance mechanism is therefore sensitive to higher
modes through their effect on joint rotations." On the other hand, in KREG max
imum story shear is very simply linked to the buckling strength of the braces and the
amount of interstory drift. It is therefore less sensitive to higher modes effects, at
least in the absence of simultaneous vertical excitation.
5.7.3. Maximum story drift:
Maximum story drifts are larger for dual systems than for KREG because dual
systems are designed for smaller lateral loads. Maximum story drifts increase when
stocky braces are used instead of slender braces of same buckling load. Stocky
braces have larger buckling stresses than slender braces, hence they require less
cross-sectional area to achieve the same buckling load. As a result thcir axial stiff
ness is much lower than that of more slender braces. The smaller axial stiffness of
stocky braces causes larger elastic drifts compared to slender braces of same buckling
load.
5.7.4. Coupling of horizontal and vertical deformations:
A very interesting phenomenon observed in the dynamic response results is the
sharp drop in story resistance upon brace buckling, follm",'ed by small amplitude high
frequency fluctuations in resistance (e.g. Figure 5-18-a). This phenomenon can be
related to two separate causes: a quasi-static and a dynamic influence of vertical and
horizontal motions.

57
The quasi-static effect occurs when the unbalance force from the braces pulls
down the beam and imposes on the frame a defomlation pattern that bends the
columns in single curvature. Therefore the frame's instantaneous contribution to
story resistance is often reduced to zero, or even is made opposite to that of the brac
ing system (Figure 5-19-a). This effect is responsible for the sharp drop in story
resistance :right after brace buckling as observed in Figure 5-19-c. Similarly, Figure
5-19-d shows the instantaneous ratio of frame to bracing resistance which can take
values far from the nominal values assumed in design. Since this effect is indepen
dent of the rate of deformation, it is called quasi-static.
The dynamic coupling of vertical and horizontal vibrations depends on the rate
of application of the loads and cannot be observed for quasi-statically applied loads.
It is responsible for the small amplitude high frequency variation in story resistance,
particularly after first brace buckling. It is caused by the sudden application on the
beam of the vertical unbalance force developed by the braces. The beam then starts
to oscillate vertically. On its downward stroke, it increases the compressive deforma
tion in the buckled brace and thereby reduces its resistance. At the same time, it
reduces the elongation in the tension brace and hence its resistance as well. The net
result is a sharp reduction in the story strength. On its upward stroke, the beam
tends to reduce the compressive deformation in the buckled brace. Hcwever, an
increase in the lateral story drift will tend to compensate partially or totally for that
reduction in brace shortening. The buckled brace will then shorten or possibly
elongate slightly; but in either case its resistance will decrease. The tension brace
elongates sharply, and since it is still elastic its tension force also incrcas~ sharply.
The net effect is a momentary but noticeable increase in story strength. This
phenomenon is equally observed with stocky and regular slenderness braces. It is
less notic(:able in the case of strong stiff beams (KSBM).
In the absence of direct experimental data on such phenomenon, numerical
simulations were performed to verify whether these phenomena are genuine, and not
a result of numerical problems in the simulation scheme. Numerical proJlems were
niled out after carefully checking the program and testing it. The resulu; of KREG
were compared to those of a frame similar to KREG except that the inertial mass for
the vertical OOF at the brace to beam junction was set to zero. This frame is desig
nated KMSLS. Figure 5-18-a and 5-18-b show a typical story hysteresis loop in
KREG and KMSLS, respectively. The effect of the vertical beam vibration on story
resistance is clearly evident. Similarly, Figure 5-18-c and 5-18-d show the path of
the brace junction with the beam for KREG and KMSLS, respectively. The extent

58
of vertical beam vibration in KREG is clearly evident. Finally, Figure 5-18-e and
5-18-f show the history of the sum of vertical forces in the first story of KREG and
KMSLS for HE35EW. These figures show the importance of vertical forces induced
by the vertical vibration of the beam.
5.7.5. Column compression:
The maximum column compression has four components:
(1)- A gravity load component that is static.
(2)- A component due to the overturning moment on the structure caused by
the lateral loads. This component increases the axial compression in exterior
columns as frame participation is increased.
(3)- A quasi-static component due to the vertical unbalance load applied on the
beam of the chevron-braced bay, upon brace buckling.
(4)- A vertical inertial component due to the excitation of vertical oscillation
modes. This component is particularly important in the braced bays.
For interior columns all four components are significant. For exterior columns,
the first two are the most significant.
As seen in Chapter 3, the magnitude of the quasi-static component of axial
force increases with beam stiffness and brace slenderness. The inertial component's
dependence on section characteristics and story mass is more complicated to deter
mine. The magnitude of that component depends on the rate of application of the
unbalance load relative to the fundamental period of the beam-braces assembly for
vibration in the vertical direction. The rate of application of the unbalance force is
equal to Pun = (dPunldu ]( du/dt] where du/dt is the story lateral drift velocity and
dP/du is the rate of quasi-static unbalance generation v,'ith increasing story drift. As
seen in Chapter 3, dP/du depends on brace slenderness and the stiffness of the beam
compared to that of the brace. The fundamental period of the beam-braccs assem
bly depends on the stiffnesses of the beam and braces and the story mass associated
~th the vertical displacement degree of freedom at the beam to braces junction.
This period can be estimated as:
\ / M bm
VXbm+%rt+ KbrcTbm= 27T
It is clear from this brief overview that determining the peak value of the dynamic
unbalance force is a difficult undertaking. However, a approximate bound may be

59
taken as the maximum unbalance force Pud generated at any given story (quasi-static
plus dynamic component). The details for making this approximation are fully
covered in Appendix B.
5.8. CONCLUSIONS
The study of the dynamic inelastic response of chevron-braced frames shows
that the advantages of the various proportioning strategies are not as clear cut and
decisive as suggested from the results of the previous chapters (i.e. from static
analysis or dynamic analysis of one story systems). For example, the combination of
stiff beams and slender braces produces desirable story hysteretic characteristics but
leads to a rapid build-up of column compression forces and eventually to the forma
tion of soft stories. Similarly, the use of stocky braces still appears desirable, but
only if local buckling failure can be controlled.
Increasing the frame participation does not improve the hysteretic characteristics
and does not reduce the variability of the response. The concept of statically adding
the strength of the braced bay and of the moment resisting frame is clearly invalid.
Important static and dynamic interactions occur between the two systems that reduc~
the advantages of increasing the participation of the moment resisting frame. These
dynamic interactions need further study before they can be included in design guide
lines. On lhe other hand, designing the frame for a maximum strength larger than
that of the bracing system· seems to have some advantages (KUNDER versus
KOVER). The only economical way of achieving this situation is to deliberately
under-design the bracing system. Unfortunately, the damageability limit state
imposes lower limits on the strength of the bracing system that are incompaliblc with
the proposed underdesign approach.
Similarly, the idea of using an "improved strength and stiffness distribution" did
not have as beneficial effects as desired. Such strength distributions are the result of
an averaging process over several different earthquakes. Any single earthquakes
imposes a force pattern that is generally quite different from the average pattern,
and with the tendency of chevron-braced frames to form soft stories, damage still
tends to concentrate in one or two stories.
In all the simulations done, the energy dissipation demand is concentrated in
the braces (> =90%) followed by the beams and then the columns, yet no reliable
model for the energy dissipation capacity of braces has been developed. There is a
need for experimental investigations to develop damage laws and failure criteria for
braces.

60
In general, the dynamic inelastic response of chevron-braced frames seems to be
more sensitive to the characteristics of the ground motion (such as frequency and
pulse content, intensity) than to member proportioning strategies (such as brace
slenderness, beam stiffness, frame participation, selection and distribution of strength
levels). Proportioning parameters interact in a complex manner and often affect the
mean and COY of response quantities in opposing ways. Consequently, the follow
ing two chapters will explore two different approaches for improving braced frame
behavior. One is the use of an optimization approach which implicitly handles all
the interactions. The second is to investigate the merits of alternative concentric
bracing systems that would be less sensitive to ground motion characteristics and
would have better seismic behavior.

61
CHAPTER 6
OPTIMIZATION OF CHEVRON-BRACED STEEL FRAMES
6.1. INTRODUCTION
In this chapter the structural optimization program DELIGHT.STRUcr is
used to investigate the possibility of proportioning chevron-braced frames in a way
that improves their seismic response. Moreover, it is expected that additional insight
into the seismic behavior of such frames will be gained in the process. Also,
attempts will be made to evaluate the adequacy of the new recommendations for
their design (such as those formulated by SEAONC [75]).
In this chapter, the background of DELIGHT.STRUcr is briefly outlined,
emphasizing its capabilities and limitations, and the underlying design strategy.
Then, the trial problem structure is described and the optimization results are dis
cussed. Finally, the implications of these results are reviewed.
6.2. BACKGROUND OF DELIGHT.STRUCT
DELIGHT.STRUCf is a structural optimization program developed at the
University of California at Berkeley. It consists of the union of three components:
(1) DELIGHT [58]: an interactive user environment (shell) that includes
optimization algorithms and graphics capabilities. The optimization algorithm
that dlrives DELIGHT.STRUCf is based on a variant of the feasible directions
method of Zoutendijk [97]. In this method, the new search direction at any
point in the design space is a linear combination of the gradients of the objective functions and of the active constraints. In particular, the modification to
handle multiple objective functions is due to Nye and Tits [57]. Gradient
evaluation is done by numerical differentiation. Once the search direction is
defined, the Armijo step length method [16] is used to carry out a Ole dimen
sional minimization along that direction.
(2) ANSR [52]:a structural analysis program capable of handling inelastic
dynamic analyses of three dimensional structures. It has a library of structural
element models including in particular an inelastic beam-column clement and
Ikeda's brace element [35].
(3) STRUCf; an interface between the two previous modules to handle prob
lem definition and data exchange. STRUcr handles interactively the defini
tion of problem geometry, the assignment of design variables, and the definition

62
of design objectives and of design constraints.
In its· current version, DELIGHr.SfRUcr is geared toward the optimal
seismic resistant design of steel structures including braced steel frames. Balling et al
[13] used DELIGHr.SfRUcr in the design of planar moment resisting frames to
minimize story drift and energy dissipation for severe earthquake excitations. Austin
[11] used DELIGHr.SfRUcr to investigate the merits of friction damping in X
braced steel frames subjected to strong earthquakes, and to explore the implications
of a reliability based optimization formulation for moment resisting steel frames [12].
6.3. DESIGN METHODOLOGY SUPPORTED BY DELIGHT.STRUCT
The design methodology supported by DELIGHT.SfRUcr assumes three
limit states which must be satisfied for every design to be acceptable. These limit
states differ by the nature of the loads they include, their intensity, their frequency
of occurrence and the acceptable performance under these conditions.
6.3.1. Limit states:
The first limit state is the serviceability limit state (limit state I). Here the
structure must remain elastic and the deflections must remain within acceptable
bounds for combined dead and live loads. This limit state is represented by inequal
ity constraints on allowable member stresses and nodal deflections under gravity
loading.
The second limit state considered is the damagcability limit state (limit state II).
Here the structure is subjected to a combination of dead loads, live loads and
moderate earthquake excitations. Since moderate earthquakes may occur several
times during the life of the building, the structure is required to remain elastic and
deflections must be limited to avoid non-structural damage. This limit state is
represented by functional inequality constraints where maximum member stresses
and nodal displacements during an earthquake must remain within the allowable
values.
The third limit~tate is the ultimate limit state (limit state III). Here the struc
ture is subjected to dead loads, live loads and severe earthquake loads. Since such a
severe earthquake is expected to occur at most once during the life of the building,
and since its characteristics are not accurately predictable,
it is neither economical nor reasonable to expect the structure to resist such an
earthquake elastically. Inelastic behavior and structural damage are expected, and
large deformations are tolerated on the condition that no collapse occurs so that

63
occupants can evacuate the building safely. Typically, damage is measured by two
parameters: the energy ductility demand of structural elements, and the maximum
sway in the structure. The limits on ductility demand are to protect against the pos
sibility of fracture and collapse, and the limits on sway should prevent geometric ins
tability. Accordingly, inequality constraints are placed on the maximum element
ductility demand, and on maximum lateral sway.
6.3.2. Constraints:
To account for the uncertainties in earthquake resistant design (eai1hquake
occurrence and characteristics, inelastic dynamic behavior, strength and capacity of
structural elements), the constraints are recast in terms of probability of exceeding
acceptable response levels instead of in terms of the absolute difference between the
maximum response demand and the allowable one. Instead of using the response
for a single earthquake in computing the constraint violations, the responses for a set
of "similar design earthquakes" are considered. The average structural resp::mse and
its standard deviation are used in computing the probability of exceeding the accept
able response levels.
To normalize the constraint values, the designer is required to specify 'good'
and 'bad' values for the deterministic variables and 'high' and 'low' probability of
exceedance for the stochastic variables. For example, in case of a determin::stic vari
able which must be kept below a certain 'good' value, the constraint violat:.on value
is set to zero if the mean response is less than the 'good' value. It is set to [Mean
Good]/[Bad - Good] otherwise. Similarly, in case of a stochastic variable which
must be kept below a certain probability of exceedance, the constraint violation is set
to zero)f the mean response is below 'high-V' (the value which has a 'high' proba
bility of being exceeded). It is set to [Mean - Good]/[Low_V - High_V + Bad
Good]. See Austin [12] for more details.
6.3.3. Objective functions:
Several objective functions are supported by DELIGHT.STRUCf. These can
be used separately or simultaneously:
(1)- Minimum volume design. This is equivalent to minimum weight design
since only one type of material is used (steel). The quest towards minimum
weight design has its origin in the optimization of aerospace structures where
weight minimization has compound benefits. For earthquake resistant design of
building structures, the benefits of weight minimization are less evident. It can

64
be argued that minimizing structural weight reduces the magnitude of seismic
induced inertial forces. However, the weight of the load resisting elements is
often a minor fraction of the total weight of the structure. Nevertheless, it is
generally accepted that weight minimization reflects an efficient use of materi
als. This is the only objective function used in this study.
(2)- Minimum story drift. This is a design objective that might be required in
flexible building structures where nonstructural components might be damagcd
by excessive story drifts. This design objective is less applicable in case of
braced steel frames where interstory stiffness is very high and story drifts small.
(3)- Minimum earthquake energy input. This is a design objective that is usu
ally selected for base isolated structures. Base isolation for seismic purposes
works by moving the resonant frequencies of the structure away from the region
of peak power input. Such a design objective is not valid for this study.
(4)- Maximum energy dissipation in selected structural elements. This is the
energy counterpart of fully stressed design. Such a design objective is justifiable
when the structure incorporates sPecial elements (structural fuses) whose energy
dissipation capacity is very high (friction devices) or that is reliably predictable
(shear links, lead cores, flexural plates, etc.). These considerations effectively
rule out its application to braced frames where the braces are notorious for their
limited energy dissipation capacity and for the absence of data to predict such a
capacity accurately.
6.3.4. Design variables:
To keep the problem down to a manageable size only plane frames are con
sidered as in the previous chapters. One design variable at most (the moment of
inertia I) is allowed for each flexural member. Balling [13] derived empirical rela
tions tying the remaining section properties to this primary design variablc. At least
two design variables are required for each brace section. These are the brace cross
sectional area (A) and the brace effective slenderness A. The remaining brace sec
tion properties (elastic section modulus S, plastic section modulus Z) ,..an be obtained
from empirical relations similar to those of Balling (sec Chapter 2).
6.4. CASES CONSIDERED
Ideally, one of the frame models of the previous chapter should be selected for
optimization, but practical constraints related to storage and execution time
prevented the realization of this goal. Accordingly, the problem chosen to optimize

65
using the .capabilities of DELIGlIT.SrRucr is a four story, one bay, chcvron
braced frame reported in the SEAONC tentative recommendations for seismic design
[75]. This model is small enough to be computationally practicable, yet large
enough to exhibit characteristics of a multi-degree of freedom braced fraffil~. More
over, it indirectly serves as a test of the SEAONC recommendations for chevron
braced frames. Two sets of four ground motions each were considered in the design
process (Table 6-1).
The frame shown in Figure 6-1 is assumed to have rigid in-plane floor and roof
diaphragms. Unifonnly distributed dead loads of 2.4 kiplft (35.0kN/m) and live
loads of 1.0 kip/ft (14.6kN/m) are assumed for the beams. Beams are connected to
columns by moment resisting connections. Member section sizes are reported in
Tables 6-2-a and 6-2-b. Notice that braces in the original design were selected to
have a slenderness ratio of less than 80. The design as reported in Reference [75] is
incomplete with brace sections only being detennined. The initial beam and column
sections are chosen herein according to the design recommendations pr~;cribed in
that reference.
The primary design variables considered in optmuzmg this frame are the
moment of inertia for the columns in every story, the moment of inenia of the
beams, and the cross-sectional area and slenderness of braces in every story. For
reasons of practicability, the columns in the top two stories are constrained to have
the same moment of inertia, and all the beams are assumed to have the same. .
moment of inertia. As indicated in Figure 6-1 there are twelve design variables to
be detennined.
During the optmuzation process, the structure is subjected to four ground
motions. Two sets of four accelerograms are considered for comparison. In the first
set, ground motions are taken from a single site in EI Centro. This case will be
referred. to as the EI Centro set. In the second set, the ground motions selected are
varied as in the previous chapter. Two of the earthquakes contain strong pulses
(~elena, Parkfield) and two are characterized by many hannonics (EI Centro,
Olympia). This case will be referred to as the mixed set. Comparing results for
these two cases should reveal which a~pects of the optimization process depend on
ground motion characteristics and which optimal proportioning trends arc indepen
dent of the excitation characteristics. The ground motions are all scaled to the same
Arias intensity and are used at two intensity levels; one where the EI Centro record
is scaled to O.2g for limit state II (damageability during recurring moderate earth
quakes), and another where the EI Centro record is scaled to O.5g for limit state III

66
(safety against collapse during the design severe earthquake, Table 6-1).
The objective function used is the minimization of total volume. The minimum
volume design is not necessarily the most economical, but the process of reaching it
while satisfying all the constraints is a useful exercise that indicates the desirable pro
portions for an efficient design. The constraints are on allowable member stresses
for gravity load and during the moderate earthquakes, on allowable deformations
(deflections for gravity load, story drift for the damageability limit state, and sway
for the severe earthquake), and on allowable deformations (deflections for gravity
load, story drift for the damageability limit state, and sway for the severe earth
quake), and on allowable energy dissipation in each type of members during severe
earthquakes. Given the uncertainty of the energy dissipating capacity of buckled
braces and based on the results of Chapter 2 (Figure 2-11), the constraint on energy
dissipation capacity of braces is set to an energy ductility of 1 for the good value and
2 for the bad value, irrespective of the brace slenderness. Otherwise, the same
values as Austin's [12] are used for the allowable stresses in the flexural elements,
and the same "good" and "bad" constraint values, "high" and "low" probabilities of
exceedance of stresses, deflections and energy dissipation demands (see Tables 6-4
and 6-5). The "bad-volume" value is reset after the second (EI Centro set) or third
(mixed set) iteration to allow the algorithm to improve element responses after
reducing the overall volume.
6.5. DESCRIPTION OF RESULTS
Applying DELIGHT.STRUcr to the original design leads to drastic changes
in several structural parameters. The results are itemized in the following sections:
6.5.1. Yolume of structure:
For both sets of earthquakes, the final structure volume is about 1\'10 thirds of
the original volume (67700 in3 or 1.11 m3). .The largest reduction in volume o~urs
in the first iteration. The final volume for the case of EI Centro excitations is
noticeably smaller than for the case of mixed excitations (40990 in3 or 0.67 m3
against 47310 in3 or 0.77 m3).
6.5.2. Columns:
For both sets of earthquakes there is a considerable reduction in column sizes,
the largest reduction being for the first story columns. The final distribution of
column sizes is opposite to the original one, the stiffest columns being in the top two

67
stories, and the most flexible columns being in the first story. This pattern is
observed for both sets of earthquakes but is more acute for the EI Centro set (Fig
ures 6-3-a and 6-3-b, and Tables 6-2-a and 6-2-b). A possible justificatior. for this
unexpected pattern will be discussed in a later section regarding frame participation.
Mean peak column moments are larger for the mixed earthquakes set than for
the EI Centro case. For both cases, the column moments in the optimal design and
Limit State II are smaller than those in the original design, for all stories except the
top two (Tables 6-2-a and 6-2-b). For Limit State III all columns remain elastic in
the original design and for both sets of earthquakes. In the optimal design some
columns are slightly damaged. For the mixed earthquake set, the columns in the
first three stories have to dissipate moderate amounts of energy (Table 6-2-b). For
the EI Centro set, only the second story columns dissipate a small amount of energy
(Table 6-2-a).
6.5.3. Beams:
For both sets of earthquakes the change in beam size is ·smali. The final beam
sections are comparable, the beam size for the EI Centro set being slightl y smaller
than for the mixed set (582 in4 or 2.42xl0-4m4 against 595 in4 or 2.48x l0-4m4).
For both sets of earthquakes, there is a reduction in beam end moments and an
increase in midspan moments (Tables 6-2-a and 6-2-b). This trend can be traced to
t\vo factors:
(1)- The drastic reduction in column sizes changes the beam end conditions
from practically fixed-ends conditions to almost hinged ends, especially in the
lower stories.
(2)- The braces also decrease in cross-sectional area which decreases the effec
tiveness of the midspan support provided by the braces to the beam.
For the EI Centro set, all beams in the original and optimal design remain clas
tic (Table 6-2-a). For the mixed earthquake set, the first and second story beams in
both the original and final design have to dissipate a moderate amount of energy
(Table 6-2-b).
6.5.4. Braces:
This is the area in which the largest differences appear between the El Centro
and the mixed earthquake sets. For the El Centro set, the brace sizes in all stories
are reduced, the final brace sections being about tv.'o thirds of the original oncs.
Brace slendernesses in all stories remain practically unchanged. As a result,

68
maximum story shear strength is reduced in all stories (Table 6-2-a).
For the mixed earthquake set, brace sizes in all stones are reduced except in the
first story where the brace cross-sectional area increases by approximately 30% (9.32
in2 or 60.13 cm2 to 12.00 in2 or 77.42 cm2). The final brace sizes in the remaining
stories are approximately 60% of their original values. Curiously, the smallest brace
size is at the third story not at the fourth (top story) as is expected. Brace slen
dernesses do not change significantly in all stories except the first. In tllC first story,
brace slenderness increases from 78 to 107 to offset the increase in story strength
that would otherwise be expected based on the increase in brace cross sectional area
alone. The actual increase in story strength is 5% only instead of 30% (Table 6-2
b).
For limit state II, maximum brace compression forces are larger in thc case of
mixed earthquakes than for the EI Centro set. In both cases, maximum brace forces
in the optimal design are smaller than those -in the initial design (Tables 6-2-a and
6-2-b).
Similarly for limit state ill, the energy dissipation demand in the braces of the
optimal design is larger in case of mixed earthquakes than for ilie EI Centro set. In
both cases, the brace energy dissipation demand is distributed over the first two
stories. Braces in the original design remain elastic for the EI Centro set, while the
first story braces dissipate a small amount of energy for the mixed earthquake set
(Tables 6-2-a and 6-2-b).
6.5.5. Structural period:
For both sets of excitations the fundamental period of the optimal design is
longer than that of ilie original design (Figures 6-5-a and 6-5-b, and Tables 6-2-a
and 5-2-b). Refering to Figures 6-6-a and 6-6-b which show thc average input
power spectrum for the El Centro and the mixed sets, respectively, interesting trends
can be observed. In the original design, ilie fundamental period of the structure is
sljghtly below that of a peak in the input power spectrum. Occurrence of inelastic
response typically elongates the instantaneous elastic period and places it right on a
peak of the power spectrum. This is likely to increase the amount of damage due to
resonance and amplification of the deformation demand. In the final design the
fundamental period of the structure is slightly longer than that of the peak in the
power spectrum. As inelastic activity occurs it shifts the fundamental period of the
structure further away from the peak in power input, and hence limits the amount of
additional damage suffered by ~e structure. The elongation in elastic fundamental

,69
period of the optimal design is limited by minimum stiffness requirements for stabil
ity under gravity loads, by deflection limitations for the damageability limit state,
and by strength requirements for the ultimate strength limit state.
In the case of mixed earthquakes, the average input power spectrum :;till con
tains large peaks at periods larger than the fundamental period of the optimal
design, unlilke the EI Centro case. Thus, the beneficial effects of period shifting can
not be as completely realized as for the EI Centro records. That is probably why the
optimal design for the mixed earthquakes case has a higher level of design dissatis
faction than that for the EI Centro set.
6.5.6. Frame participation:
The frame participation ratio as defined in Chapter 3 is the ratio of moment
resisting frame stiffness to bracing stiffness for interstory drift deformation
(Kr/Kbr)h' In the original design, this ratio changes from one story to the next and
is largest in the second story. Both sets of excitations lead to the same evolution in
the distribution of frame participation ratios. The final distribution of frame partici
pation ratios is almost opposite to the original one, the smallest ratio being in the
first story, and the largest being at the top story (Figures 6-7-a and 6-7-b an d Tables
6-2-a and 6-2-b). These results, disconcerting at first glance, are reasonable if one
considers the different deformation patterns of braced bays and of moment resisting
frames. TIle braced bay rate of deflection under distributed lateral load i~; large at
the top and minimal at the bottom of the structure. Conversely, the moment resist
ing frame rate of deflection under distributed lateral loads is small at the top and
large at the bottom of the structure. Therefore, in resisting lateral loads, the braced
bay is mon~ efficient than the moment resisting frame in the lower stories, and the
opposite is true in the upper stories. Moreover, when the braced bay and the
moment resisting frame are forced to undergo the same pattern of deformalions in a
dual system, the total strength is less than'the sum of the individual strengths of
each system considered separately. In the lower stories the frame imposes additional
loads on the braced bay and the braced bay loads the moment resisting frame in the
upper stories. It is then remarquablc that the optimization algorithm manages to
reduce this undesirable interaction by decreasing the frame participation in the lower
stories and increasing it in the upper stories. It is therefore able to "squeez(: out" the
maximum possible story strength while reducing the overall volume of the :;tructure.
Paulay [29,61] describes similar interactions in reinforced concrete hybrid systems
consisting of shear walls and moment resisting frames.
70
6.5.7. Beam to brace stiffness ratio:
For both sets of earthquakes the ratio of beam to brace stiffness for vertical dis
placements at the beam to brace connection (KooI%r)v increases slightly in all
stories except the first (Figures 6-8-a and 6-8-b and Tables 6-2-a and 6-2-b). Since
most of the brace inelastic activity occurs in the first story, one can conclude that
increasing the beam to brace stiffness ratio is not essential for improving the response
of this structure. In fact, it may be harmful in this case to the columns whose size is
being tremendously reduced. Increasing the beam to brace stiffness ratio would
throw additional compressive forces on the columns and increase the possibility of
their failure. The observed increase in the ratio KooIKbr is only incidental and a
side effect of the more rapid reduction in brace size than in the beam size.
6.5.8. Story strength and stiffness distribution:
In the original braced frame design, the story strength and stiffness distributions
are proportional. This can be attributed to the overwhelming contribution of bracing
to story stiffness, and the linear relation between bracing stiffness and bracing
strength. In the original design, the story strength and stiffness distributions are
almost parabolic with a peak at the second story. For the El Centro set, the story
strength and stiffness distributions in the optimal design are also paral:xJlic but with a
less distinct peak at the third story (Figure 6-9-a and Table 6-2-a). Recalling that
for that case inelastic activity in the optimal design is concentrated in the first story
braces, it can be concluded that the distribution of story strength is of secondary
importance. It is a by-product of other considerations like moving the fundamental
period away from the peaks of the power input spectrum, and reducing the undesir
able interactions between frame and bracing. These wnsiderations would explain
the unusual distribution of story stiffness.
For the mixed earthquake set, the story strength and stiffness distributions in
the optimal design are practically linear with the maximum story strength in the first
st?ry (Figure 6-9-b and Table 6-2-b). The story strengths in this case are larger than
their counterparts in the El Centro case. The occurrence of inelastic activity in the
first two stories of the optimal design and the overall higher story strength indicate
that in case of mixed earthquakes the distribution of siOry strengths plays a role as
important as the other two factors previously mentioned.

71
6.5.9. Modal shapes and modal correlation:
For b:>th sets of earthquakes it is noticed that the first mode share of the
optimal design has a kink at the first story level and a larger amplitude at the top
story level than in the original design (Figures 6-10-a and 6-1O-b). The second
mode shap~ also has a larger amplitude in the top two stories than in the original
design. No remarquable changes are observed in the remaining two mode shapes.
A random vibration analysis carried with the mean input power spectra for the
two sets of earthquakes reveals that the modal correlations of the first mode with the
other mod(~ in the final designs are noticeably smaller than in the original design
(Table 6-3). The trend is more evident for the El Centro set than for the mixed
earthquakes set. No physical explanation for this trend can now be offered. How
ever, this trend warrants further investigation, especially for three dimensional sys
tems where translational and torsional modes. are often highly correlated.
6.5.10. Set of active constraints:
The EI Centro set of earthquakes leads to a lower number of active constraints
in the optimization process than the mixed earthquake set. Moreover, the ~;overning
constraint dissatisfaction for the EI Centro set is smaller than the corresponding one
for the mixed set. It also keeps decreasing from one iteration to another, while for
the mixed set the governing constraint value becomes practically fixed after the third
iteration.
The active constraints for the El Centro set are limited to energy dissipation
demands in the first two. story braces. The active constraints for the mixed set
include in addition to those of the El Centro set energy dissipation demand in the
columns and beams of the first two stories.
6.6. CONCLUSIONS
This study implies that the two major factors in improving the inelastic behavior
of chevron-braced frames are avoiding the peaks in the input power spectlUm, and
reducing any undesirable interaction between bracing and moment resisting frame.
Reduction of the undesirable interaction between bracing and moment resisting
frame was achieved for the trial design by reducing the frame participation in the
lower stories and increasing it in the upper stories. In the examples considered
where all the beams are constrained to have the same size, this leads to an unusual
distribution of column stiffnes~es where the stiffest columns are at the top of the

72
structure. Allowing the beams in every story to have different stiffnesses would
probably lead to the same distribution of frame participation, but with a more tradi
tional distribution of column stiffnesses.
The distribution of story strength does not seem to be of primary importance for
this structure, at least in the case of earthquakes lacking strong pulses. Other
parameters such as brace slenderness and beam to brace: stiffness ratio also seem to
be of secondary importance. It should be recognized that these structures suffered
only limited inelastic deformations.
The chevron-bracing scheme is once more proven to be very sensitive to the
characteristics of earthquake excitations. Comparing the results of the EI Centro set
and those of the mixed earthquake set shows that to get the maximum benefit from
the optimization procedure, the seismicity of the site must be well known. One must
have several earthquake records representative of the site or must be able to generate
them. For some areas where many earthquakes have been recorded applying the
optimization procedure presents no major problems. In areas where earthquake
records are scarce or inexistent, there is a need to develop better models for genera
tion of earthquakes that are typical of the site on which a structure is to be erected.
The SEAONC recommendations tested in this chapter are clearly superior to
those of the 1985 UBC tested in the previous chapter. However, the elastic response
of the SEAONC design to the EI Centro set and its slight damage when subjected
to the mixed earthquake set might suggest that the SEAONC recommendations are
possibly too conservative. The SEAONC recommendations therefore fulfill their
mission of providing a minimum of safety with a simplified design approach, at the
expense of economy. The optimization procedure shov.'S that one can improve on
the SEAONC design's economy without sacrificing the safety of the structure. How
ever the procedure involved is complex and computationally expensive, and cannot
be recommended as a standard design procedure, at least for the time being.
The redu~d modal correlation in the optimal design deserves further investiga
tion to determine whether it is only incidental or whether it represents a basic
phenomenon. In the latter case it would be interesting to extend the study to three
dimensional systems where torsional and translational modes may be highly corre
lated. Such an approach combined with the avoidance of the peaks in the input
power spectrum might lead to a modal synthesis approach that would be attractive
by its economy and simplicity compared to the currently used simulation approach.
The minimum weight optimization did not lead to a uniform distribution of
energy dissipation demand over all braces as desired. One should probably activate

73
an additional· objective functions aiming at maxuUlzmg the energy dissipation
demand in the braces or minimizing the COY of this demand. Alternatively, dif
ferent structural systems might be considered as will be done in the next chapter.

74
CHAPTER 7
ALTERNATIVE STRUCfURAL SYSTEMS
7.1. INTRODUCTION
The last two chapters have shown that complex interactions exist between
design and response parameters in chevron-braced frames subjected to severe earth
quake loading. The previous chapter demonstrated that an optimization approach
can be used to help control these interactions and to substancially improve the per
formance of a chevron-braced frame. However, optimal proportions were found to
be highly site specific i.e., they depend to a large extent on the characteristics of the
earthquake motions expected at the building site. This chapter examines the perfor
mance of structural variants that might be used to reduce the sensitivity of braced
frame response to earthquake characteristics. The variants considered have been
intentionally restricted to those consisting of simple rearrangements of braces, includ
ing the addition of vertical tie-bars. They all have in common the objective of
reducing the tendency of braced frames to form soft stories, mitigating any adverse
effects of post-buckling force redistributions, and achieving a trilinear hysteresis loop
without having to use overly stiff beams in the chevron-braced bay. Other variants
such as eccentric bracing, base isolation, use of friction dampers, and allowing
column uplift (rocking of the br.aced core) are not included in this study. Each con
stitutes a possible solution, but they are outside the scope of this investigation.
Accordingly, this chapter is divided into three main sections. The first section
introduces several basic chevron-bracing variants and compares them to the original
chevron-bracing scheme. The second section develops a new configuration and
explains how it works. The third section compares simulation results for this confi
guration to those for the original chevron-bracing scheme and to the competing vari
ants. The findings of this chapter and additional research needs are summarized in
the conclusion.
7.2. BASIC STRUCTURAL VARIANTS
The first set of variants consists of various alternative arrangements of K and X
braced systems. The same gcometry and a<;sumptions as LL<;cd in Chapter 5 arc used
here to facilitate comparison with the earlier work. Except for the X-braced frame
(XREG), they all use the same sections as the reference chevron-braced frame
(KREG). The following configurations were used as schematically illustrated in

75
Figure 7-1.
(1)- XREG: is an X-braced frame dcsigned for the same loads as KREG.
Braces were assumed to be pinned at their ends and not to be connected at
their midspans. Their slenderness ranges from 135 in the first two :;tories to
139 in the top two storics. Such frames are often used as alternatives to
chevron-braced frames. They are almost universally used for fixed steel
offshore platforms located in seismic regions.
(2)- IJWK: is similar to KREG in all points except that the braces are arranged
in a V shape instead of a chevron. This is oftcn cited as having the advantage
of prdoading the braces into tension prior to the application of lateral loads.
Thus, initial buckling would be delayed or smaller members might be used.
(3)- SPLIT-X: differs from KREG by having the braces of every two consecu
tive stories meeting at a single point. This gives a double story X braced frame
arrangement. It is hoPed that such a configuration would avoid the problems
associated with vertical unbalance loads acting on the beams in chevron-braced
frames.
(4)- TBTG: differs from KREG by having additional vertical struts (tie-bars)
placcd in all the braced bay storics. These tie bars are used to distlibute the
vertical unbalanced loads occurring in chevron-braced framcs.
(5)- INVZIP: differs from INVK by the addition of vertical tie-bars in all
stories except the top.
The comparison of the different variants uses the same protocol as in Chapter
5. This involves subjecting each frame model to the "worst tcn seconds" of six earth
quakes (Table 5-2). The earthquakes are normalized to have the same Alias inten
sity and are scaled so that the North-South component of the 1940 EI Centro earth
quake has a peak acceleration of 0.5g. In addition to the previously established
comparison parameters (story shears, drift, energy dissipation demand and column
compressions), .the tie-bar forces are also monitored.
7:3. SI1\1ULATION RESULTS
7.3.1. X-bracing (Figure 7-2 and Table 7-2):
Compared to KREG (Fig. 5-3), XREG has slightly larger story shears and
smaller drifts thanks to it'i trilinear hysteresis characteristics. The trilinear charac
teristics are obtained because the tension brace resistance keeps increasing after the
buckling of the compression brace until the tension yield stress is reached. The

76
energy dissipation demand is smaller in every story except the third, but it has a
larger cav, except in the fourth and fifth stories. The total energy dissipation
demand is less than that of KREG. However, the energy dissipation demand is still
concentrated in the braces of a few stories.
&th interior and exterior columns compression forces are significantly larger
than the corresponding ones in KREG and have larger Cays. The increase in exte
rior columns compression is compatible with the increased overturning moment asso
ciated with increased story shears. The large increase in interior column compres
sions results from the tension yielding of the braces. Every brace that yields in ten
sion induces into the story column adjacent to it a compression force of Prine.
This force is usually larger than what a buckled brace in a chevron-braced frame can
feed into the column ( II2Pud ).
Notice that an additional source of uncertainty, not considered in analyzing
XREG, is the effective restraint at the brace intersection. Since this uncertainty
affects the effective length of braces and hence their actual buckling load, it controls
the value of maximum elastic story shear. Another issue that was not considered is
the axial compression in the beam of the X-braced bay. The compressive force in
the beam of an X-braced bay is significant and can lead to the collapse of the struc
ture if it buckles that beam. This compression is more critical for the case of X
braced bays than for chevron-braced bays for several reasons: In X-braced bays the
horizontal force applied by the braces must be totally resisted by compression in the
beam, while in chevron-braced bays it is resisted partly in compression in one half of
the beam, and partly in tension in the other half. In X-braced bays the whole length
of the beam is in compression while in chevron-braced bays only half the beam span
1S 10 compression.
7.3.2. V Bracing (Figure 7-3, Table 7-3):
It has been shown (Chapter 3) that intermediate slenderness braces and flexible
beams lead to reduced maximum story strength and early deterioration of the story
resistance. The Y bracing scheme proposes to mitigate these undesirable response
aspects by delaying brace buckling through tensile preloading, and by improving the
hysteretic characteristics through the use of gravity forces as a restoring stiffening
force. The presumed advantages of prcloading the braces in tension, and of using
gravity load as a restoring force, were not observed in the simulations done (Figure
7-3). The maximum story shears in INVK are practically equal to those of KREG,
but show considerably more variance. Story drifts and energy dissipation demands

77
are larger in all stories except the first one. It must be noticed that since the first
story braces are connected at their intersection to the ground, they act as if they were
part of an X-braced frame or a chevron-braced frame with an infinitely stiff beam.
This is reflected in the first story's radically different behavior: trilinear hysteresis,
large story shear, limited drift and reduced energy dissipation demand. TIle overly
strong first story leads to a distribution of energy dissipation demand that is notice
ably different from that of KREG, and in particular to a concentration of energy
dissipation demand in the second story. Interior column compression forces in
INVK are much larger (20% to 40%) than in KREG, since the vertical components
of brace forces are applied to the columns at the top of the story rather than at the
bottom. The application of the vertical unbalance force from the braces to lhe beam
is so sudden that the impact sets up vertical vibrations in the beam. The inertia
forces generated override the beneficial effects due to gravity loads.
Reducing section sizes in the first story to compensate for the strength provided
by base fixity might increase lateral deflections sufficiently to create stability prob
lems under gravity and lateral wind loadings.
7.3.3. Spliit-X (Figure 7-4, Table 7-4):
SPLTI'-X (Figure 7-1) is used to designate a configuration where the braces
form an X-pattern spanning over two successive stories. This arrangement is
intended to relieve the problems associated with flexible beams and intermediate
slenderness braces, to couple successive stories, and hence to reduce the occurrence
of soft stories. It aims at obtaining the advantages of an X-braced system (trilinear
hysteresis loops) without incurring the detailing problems associated with the inter
section. of braces in a conventional X-bracing scheme. Compared to KREG, this
system increases story shears slightly (10% to 20%) and reduces story drifts and
energy dissipation demands. However, it causes a sizable increase in interior column
forces (30%), and a concentration of energy dissipation demand in the lower braces
and columns of every two-story module. The two stories in every module have usu
ally equal strengths, but the lower story is subjected to larger shears. Therefore it
tends to be more heavily damaged than the upper story, and hence it must dissipate
more energy.

78
7.3.4. Tie-Bars-To-Ground (TBTG) (Figure 7-5, Table 7-5):
In this variant, vertical tie bars are connected at each floor at the intersection of
the braces with the beams (Fig. 7-1). The tie bars resist the vertical unbalance load
caused by the buckling of compression braces. The tension braces are allowed to
develop their yield strength, and the braced bay columns are protected from addi
tional compression. It is hoped that this configuration may achieve the advantages
of a stiff beam without incurring any of its disadvantages (increased column
compression, plastic hinge formation in the columns). The analyses done have con
firmed these advantages (Figure 7-5). Compared to KREG, TBTG shows larger
story shears, trilinear hysteresis loops, and noticeably smaller story drifts and energy
dissipation demand. The cavs of all these quantities are also smaller. The
increase in interior columns compression is compatible with the increased story
shear. The only disadvantage is that the mean peak compression forces in the tie
bars are comparable to those in the interior columns, but have considerably larger
Cays (Figure 7-15). If tie bars must remain clastic, they have to be designed for
such large compression loads that they become another set of columns.
INVZIP (Figure 7-6, Table 7-6), a variant of TBTG, uses the same tie bar
arrangement but within a V-braced frame. The performance of this variant is basi
cally similar to that of TBTG in all points, except that the tie bars work mostly in
tension (Figure 7-15), and that interior column compressions are increased as in
INVK. However, the first story tie-bar develops a large tension force which must be
resisted in some way by the foundation.
7.4. NEED FOR A NEW CONFIGURATION
The preceding analyses have shown that some of the proposed variants do not
accomplish what they were intended to do (INVK), or only partially do so (SPLIT
X). Others (XREG, TBTG, INVZIP) achieve stable trilinear hysteresis loops, but
at the cost of increased column compressions. Compared to the regular chevron
b~acing, none of these variants exhibits a clearly reduced sensitivity to ground
motion characteristics (intensity, frequency content, pulse sequencing). Similarly,
none of them can have an optimal site independent strength and stiffness distribution
for the same reasons as the regular chevron-bracing scheme (Chapter 5).
Hence there is a need for a structural configuration that achievcs trilinear hys
teresis loops without having to use stiff beams and slender braces, and without caus
ing large increases in column axial forces. It must be less sensitive to earthquake
characteristics. In other words, it must react in basically the same way no matter

79
how intense the earthquake is or varied its frequency content is. This implies that
the structUre must behave in the inelastic range more as a single degree of freedom
system than as a multidegrce of freedom system. It must provide a reliably predict
able and more uniformly distributed energy dis.."ipation demands.
To accomplish this in a chevron-braced frame, one must make sun:~ that all
compression braces buckle simultaneously or at least successively. Since the
occurrence of such an inelastic deformation mechanism depends on the earthquake
characterislics, it is highly unprobable. Therefore, one must find a way (If "telling
other braa::s that one of them has already buckled and that they must now buckle".
The proposed configuration, called the "Zipper" configuration for reasons that will
become clear, does exactly that.
7.5. MECHANISM OF THE ZIPPER EFFECT
The Zipper configuration (Figure 7-1) features the same tie-bar arrangement as
the Tie-Bar-To-Ground configuration, except that the first story tie-bar is deleted.
This seemingly minor modification causes major changes in the structure's behavior
as follows.
Consider a Zipper-braced frame (Fig. 7-14) subjected to severe e<I.rthquake
induced lateral loads. If the compression brace in the first story buckles while all
other braa:~ remain elastic, a vertical unbalance force is then applied at midspan of
the first story beam. The vertical tie-bars mobilize the stiffnesses of all beams and
remaining braces to resist this unbalance. One then has the effect of a very stiff
beam without physically having one. The unbalance force transmitted through the
tie-bars increases the compression of the second story compression brace, eventually
causing it to buckle. At this stage, one has a larger total vertical unbalan:::e for the
same beam stiffness.
If ~he excitation is still forcing the structure in the same direction, then the large
unbalance will buckle the third story compression brace. The brace buckling will
p~opagate up in the structure such that all compression braces are buckled and beam
plastic hinges are activated, hence the name: the zipper effect. The desired effect of
distributing inelastic energy dissipation and obtaining a trilinear behavior is achieved.
If the excitation reverses sign, then unloading will occur and one would have had
the benefit of a trilinear force-deformation curve that limits drift to tolerabk values.
Figure 7-14 compares the development of the zipper effect to what normally
happens in a regular chevron-braced frame. In this figure .1 is the first !itOry drift
and V is the base shear. The thick lines indicate yielded or buckled mem bers, and

80
the dark dots mark the plastic hinges.
7.6. COMPARISON OF THE ZIPPER CONFIGURATION WITH KREG AND
TBTG
To verify the effectiveness of the zipper configuration, a frame model similar to
KREG is fitted with tie-bars between the second and the sixth stories. This model
will be referred to as ZIPPER (Figure 7-7, Table 7-7). For simplicity, the tie-bars
used have the same cross-sectional area over the height of the structure and are
assumed to remain elastic. Their cross-sectional area is of the same order as that of
the first story braces ( lOin2 or 64.52 cm2). The dynamic inelastic perfonnance of
ZIPPER is compared to that of KREG and TBTG using the previously established
comparison protocol.
In addition to the tests with the standard set of ground excitations, two more
simulation sets were conducted to examine the sensitivity of tie-bar-to-ground and
zipper configurations to the intensity of excitations. In the first set, the ground
motion intensities are uniformly scaled down such that the peak ground acceleration
in the EC40NS record is reduced to 0.3g. The simulation results for this case are
referred to as TBTG30 (Figure 7-8, Table 7-8) and ZrPPER30 (Figure 7-9, Table
7-9) and are compared to those of KREG30 (Figure 5-10, Table 5-10). In the
second set, the excitations are scaled up such that the peak acceleration in the
EC40NS record rises to 0.7g. The simulation results for this case are referred to as
TBTG70 (Figure 7-10, Table 7-10) and ZIPPER70 (Figure 7-11, Table 7-11) and
are compared to those of KREG70 (Figure 5-11, Table 5-11).
Moreover, "proportional brace" variants of the tie-bar-to-ground and zipper sys
tems are also designed and tested using the standard set of ground excitations.
These are designed similarly to the KPRO configuration described in Chapter 5.
These new configurations are referred to as TPRO (Figure 7-12, Table 7-12) and
ZPRO (Figure 7-13, Table 7-13), respectively, and are compared to KPRO (Figure
5-17, Table 5-17). Their brace sections are the same as those of KPRO (Table B9),
and their beam and column sections are the same as those of KREG and KPRO
(Table 5-2).
7.6.1. Maximum story shears:
TBTG has larger mean maximum story shears than KREG, while mean max
imum story shears in ZIPPER are slightly smaller than their counterparts in KREG.
Similarly, KPRO has maximum story shears falling between those of TPRO and

81
those of ZPRO, with TPRO having the largest story shears. The COV~i of story
shears are larger in both TBTG and ZIPPER than in KREG. Using "proportional
braces" reduces slightly the COVs of story shears in TPRO and ZPRO compared to
KPRO.
The sensitivity of maximum story shear to earthquake intensity is approximately
the same in TBTG and ZIPPER as in KREG. However, the story shear COVs in
TBTG and ZIPPER are less sensitive to earthquake intensity than in KREG.
The larger maximum story shears in TBTG are due to the presence of tie-bars
which allow the tension braces to develop their yield strength. The smaller max
imum story shears in ZIPPER can be attributed to the Zipper action wheTe the tie
bars "prematurely" induce brace buckling in adjacent stories, hence limiting their
contribution to maximum elastic story shear. In both TBTG and ZIPPER, the tie
bars action is responsible for the increase in COVs of maximum story shear.
Because of the tie-bars, maximum story shear is no more 2PccosE> ; it now also
depends on the instantaneous tie-bar forces. This is confinned by the larger story
shear COVs and their relative insensitivity to earthquake intenSity. It should be
noted, however that in all cases story shear COVs remain small compared to COVs
of other quantities such as story drift and energy dissipation demand.
7.6.2. Maximum story drifts:
Story drifts in the lower stories of both TBTG and ZIPPER are smaller than
their counterparts in KREG. Upper story drifts in TBTG and ZIPPER are larger
than those::: in KREG. That is, both of these systems achieve a more unifonn distri
bution of displacements than the original chevron-braced system. Compared to
KREG, the Cays of story drifts in ZIPPER and in TBTG are also smaller, except
in the top two stories. These two stories remained nearly elastic in KREG.
''Proportional braces" as used in TPRO and ZPRO reduce both story drift,; and
their COVs compared to KPRO. However, compared to the standard designs
CrPRO versus TBTG, ZPRO versus ZIPPER and KPRO versus KREG) maximum
story drifts increase in the upper stories of the "proportional brace" designs because
braces of smaller areas arc more flexible and cause larger clastic drifts.
The distributions of maximum story drifts in TBTG and ZIPPER change with
earthquake intensity in a way different from that in KREG. Unlike KREG, which
tends to concentrate damage in a few soft stories, these two alternatives tend to
achieve more unifonn story drifts distribution. Because of the dispersed inelastic
action, the COVs of story drifts in both TBTG and ZIPPER are more !:ensitive to

82
earthquake intensity than in KREG.
7.6.3. Energy dissipation demand:
TBTG has the lowest total energy dissipation demand thanks to its trilinear hys
teretic behavior and large maximum story shears. ZIPPER has the largest total
energy dissipation demand despite its trilinear hysteretic behavior because of its
lower effective maximum elastic story shears.
KREG has a concentration of energy dissipation demand in the first story (34%
of total), while TBTG has its maximum demand at the second story (25% of total)
and the maximum for ZIPPER is located in the first story (27% of total). The
COVs of energy dissipation demand are largest in KREG, and smallest in ZIPPER
( one quarter to one tenth the values for KREG).
Using proportional bracing makes the energy dissipation demand more evenly
distributed in all three variants (KPRO, TPRO, ZPRO), and increases the COVs of
energy dissipation demand in KPRO only. Compared to TBTG, the COVs of
energy dissipation demand in TPRO decrease only slightly. The largest reduction in
COVs of energy dissipation demand occurs in ZPRO ( 30% to 50% reduction com
pared to KREG and up to 90% reduction compared to KPRO).
Compared to KREG, TBTG seems to be more sensitive to a change in the
magnitude of the excitation. The increase in total energy dissipation demand in
going from TBTG to TBTG70 is greater than the increase in going from KREG to
KREG70. Similarly, the reduction in total energy dissipation demand in going from
TBTG to TBTG30 is larger than that observed between KREG and KREG30. The
same trend is observed for'the COVs of energy dissipation demand. On the other
hand, ZIPPER seems to be less sensitive than KREG to changes in the intensity of
the earthquake. The changes in energy dissipation demand in ZIPPER are propor
tional to those that occur in KREG, but the COY values change more slowly.
7..6.4. Maximum interior column compression loads:
Maximum interior column compression loads in both TBTG and ZIPPER are
larger than those in KREG. Compared to KREG, the COVs of column compres
sion loads are smaller in TBTG and larger in ZIPPER.
Using "proportional braces" reduces the column compression loads in all the
variants (KPRO, TPRO, and ZPRO) to practically the same values, Compared to
KPRO. the COVs of column compression in TPRO and ZPRO become much

· 83 .
smaller.
Interior column compression tends to be less sensitive to earthquake intensity in
TBTG and ZIPPER than in KREG.
7.6.5. Malximum exterior column compression loads:
Maximum exterior column compression loads in both TBTG and ZIPPER are
noticeably larger than their counterparts in KREG. This is associated in part with
the larger lateral drifts in the upper stories for these systems. Their COVs are much
larger than those in KREG.
Using; "proportional braces" increases the exterior column compression loads to
practically the same level in all three variants (KPRO, TPRO, and ZPRO). This
reflects an increased frame participation. The COVs of exterior column compression
load in TPRO and ZPRO are slightly reduced but are still larger than in KPRO.
Exterior column compression loads in TBTG and ZIPPER seem to be more
sensitive to earthquake intensity than in KREG. The COY values of exterior
column compression load show no definite trend in this resPect.
7.6.6. M1llximum tie-bar forces:
Among the variants exanlined, three (TBTG, INVZIP, and ZIPPER) use tie
bars to modify the response characteristics of chevron-braced frames. Yet, the tie
bars in each of these variants have a drastically different mission:
(1)- In TBTG, tic-bars are intended to transfer unbalance forces generated by
brace buckling,' and to carry them in compression to the ground.
(2)- In INVZIP, the tie-bars have the same function as in TBTG, except that
they carry their loads in tension.
(3)- In ZIPPER, the tie-bars are intended to distribute over all stories the
unbalance forces generated by brace bl,lckling. They must do that either in ten
sion or in compression.
In all these variants, the tie-bars should remain elastic to perform their function
properly. For economy, tic-bar compressions must be limited, and the tension mode
of action must be favored. Figures 7-15 shows for each of TBTG, TPRO, INVZIP,
ZIPPER and ZPRO the mean maximum tic-bar compression, tension, and a plus
and minus one standard deviation confidence interval. Figures 7-15-a compares tie
bar forces for different variants of chevron-bracing: TBTG, ZIPPER and INYZIP.
Figures 7-15-b compares tie-bar forces for different tie-bar-to-ground cases:

84
TBTG30, TBTG70 and TPRO. Figures 7-15-c compares tie-bar forces for different
zipper cases: ZIPPERJO, ZIPPER70 and ZPRO.
Figures 7-15 shows how rapidly the tie-bar compression builds up in TBTG and
TPRO, and how limited it is in INVZIP, ZIPPER and ZPRO. Conversely, tie-bar
tension is limited in TBTG and TPRO, but more developed in INVZIP, ZIPPER
and ZPRO. Notice that for Zipper configurations (ZIPPER and ZPRO), the max
imum tie-bar tension occurs about midheight in the structure, while in INVZIP it
occurs at the base level and must be resisted by the foundations.
Compared to ZIPPER, tie-bar compressions in ZPRO are larger and show
more variance. That is because in ZPRO, brace buckling is more likely to initiate in
upper stories than in ZIPPER, hence there is more unbalance forces to be carried in
compression than in ZIPPER. Otherwise, the tie-bar compressive forces in
ZIPPER, ZPRO and INVZIP, and the tensile tie-bar forces in TBTG and TPRO
are evidence of the importance of the vertical vibration modes in chevron-braced
structures, even when subjected to horizontal excitation
only.
Appendix C presents a method for estimating the maximum tie-bar forces for
the TBTG and ZIPPER configurations. Such a method is essential for achieving the
benefits of the ZIPPER and TBTG configurations which depend on elastic tie-bar
response. To simplify the comparisons in the examples analyzed, all the tie-bars
were chosen to have the same section and to remain elastic.
7.7. CONCLUSION
Several common alternatives to chevron-bracing have been reviewed in this
chapter. It has been shown that while some of them fail to achieve their goals
(INVK, SPLIT-X), others show definite improvement in inelastic perfonnance at the
cost of increased column compression. However, all these variants are as sensitive to
earthquake characteristics as the original chevron-bracing scheme. Their relative
~erits can be summarized as follows:
The X-braced design has the advantages of achieving stable trilinear hysteresis
loops, limited energy dissipation demand, and energy dissipation by tension yield in
the braces. Among its disadvantages are the large compressive forces generated in
the beams and columns of the braced bay.
The SPLIT-X design achieves the advantages of stable trilinear hysteresis loops,
but it still suffers from a concentration of energy dissipation in the lower panel of

85
every two story module. Moreover, braced bay columns are subjected to large
compression forces.
The V-bracing design tries to delay brace buckling by preloading them in ten
sion, and Ito use gravity loads as restoring forces to improve the hystereti,: charac
teristics. These modifications lead to increased column compression forces and to an
inevitable overstrength in the first story. This leads to excessive ductility demands in
the remain!mg stories.
The tie-bar-to-ground configuration achieves the advantages of stable hysteretic
loops, and limited energy dissipation demand, without large increases if, column
compressions. The only problem is that the tie-bars in such a design are subjected to
large compression forces.
The inverted tie-bar-to-ground (INVZIP) configuration has the advantages of
TBTG and tie-bars that work mostly in tension. However, it is subject to Increased
column forces, and requires the foundations to resist the large pull-out forces applied
by the first story tie-bar.
The :Z.ipper configuration introduced herein seems to overcome several of the
problems suffered by the other systems, namely it achieves:
(1)- A reduction in the response sensitivity to ground motion characteristics
(ampEtude, frequency content, number of pulses and their duration).
(2)- A more uniform damage distribution (maximum story drifts, and energy
dissipation demand).
(3)- Trilinear, stable hysteresis loops.
(4)- Limited column compressions if "proportional braces" are used throughout.
(5)- Ii: is ideally suited for cases with flexible beams and intermediate slender
ness braces.
There are still several important questions to be resolved before the Zipper con
figuration can be safely recommended for practical use. What happens if the first
brace to buckle is not in the first story? What if the structure is not in a first mock
deflected shape when the zipper effect is activated? How to proportion the braces to
maximize the effectiveness of the zipper effect? How to choose the relative
stiffnesses of the tic-bars and beams? What arc the expected axial forces in the tie
bars and in the columns? What would be the effect of simultaneous horizantal and
vertical excitations?
Many of these questions require full analytical and experimental research to be
answered. However, based on the numerical simulations completed, one can

86
already outline the answers to several of these questions:
The zipper effect is still effective when first brace buckling occurs at other than
the first story, provided the tie-bars do not buckle. The effectiveness of the zipper
effect is maximized when "proportional braces" are used (minimum cays on energy
dissipation and story drifts, minimum column compressions). However, first brace
buckling in the first story may be the ideal case for the zipper effect since it forces
the tic-bars to act mostly in tension, and it mobilizes the energy dissipation capacity
of the largest number of braces.
The choice of the best design criteria for the braces is the subject of future
research. The methodology developed and the resul ts obtained by other researchers
in the study of multiply supported secondary systems should be very useful in such
an enterprise [9]. In the mean time, a design methodology for the tie bars is pro
posed in Appendix C.
In choosing the relative stiffness of tie-bars and beams, a variant of equation 3
19 can be used to detennine the minimum tie-bar stiffness needed.
4KbbKbrKtxn+ Kbt~ ( K) sin
2E)
Kbr - bb
where Kbt = (AFJL)tie-bar is the effective axial stiffness of the tie-bar. In this
respect, flexible beams and intermediate slenderness braces are ideal since intermedi
ate slenderness braces induce the most rapid build-up of unbalance force, and flexi
ble beams allow most of the unbalance to go to the tie-bars. The determination of
maximum likely axial forces in tie-bars and consequently in the columns requires
further studies.
Similarly, more studies are needed to clarify the effect of combined horizontal
and vertical excitations. Additional work on the dynamic force redistributions must
also be completed before final proportioning recommendations can be made. In the
mean time, modal analysis procedures to compute the lateral design force distribu
tion are suggested and a simplified capacity design approach is recommended to esti
mate column and beam forces (appendix B) and tic-bar forces (Appendix C) once
the brace sizes have been selected.

87
CHAPTERS
CONCLUSIONS AND RECOMMENDATIONS
8.1. SUMMARY
The objectives of this study included identifying the design parameters that con
trol the inelastic behavior of chevron-braced frames, and tracing the effects of each
parameter in order to formulate rational design recommendations. These objectives
have been partially realized, the relationships obtained being less clear-cut than origi
nally hoped. The governing design parameters and their effects have however, been
identified and examined. These effects are complex and often conflicting; hence
complicating the formulation of definitive design rules. However, the explicit iden
tification of the governing design parameters, their effects and how they interact will
help designers make more informed decisions.
In concluding this work, the complex aspects of the inelastic behavior of
chevron-braced frames are reviewed. Research results are summarized under three
categories: concepts that have been validated, concepts that have been invalidated,
and new concepts. Finally, further research needs identified during this work are
outlined.
8.2. INELASTIC BERAVIOR OF CHEVRON-BRACED FRAMES
The complex inelastic behavior of chevron-braced frames requires a system
approach. Different conclusions can be reached by looking at limited subsystems, or
by adopting simplified analysis techniques. For example, a comparison of the
behavior of different slenderness braces having the same yield force leads to conclu
sions quite different than if the braces have the same buckling force. 'The com
parison should be based on equal buckling force (Chapter 2). In another example,
the study of braces alone under monotonic compressive deformation (Chapter 2) led
t~ the conclusion that intermediate slenderness braces should be avoided. Similarly,
the analysis of a chevron-braced one bay two story structure under monotonically
increasing lateral load favorized the use of stocky braces or of slender braces with
stiff beams over intermediate slenderness braces with flexible beams. Yet, the
optimization procedure (Chapter 6) lead in one case to a combination of intermedi
ate slendemess braces and flexible beams for the optimal design. Moreover, a con
sideration of force redistributions (Chapter 3) and dynamic inelastic simulations
(Chapter 5) discouraged the use of slender braces with stiff beams. Besides being

88
difficult to achieve for the usual frame geometries, such proportions lead to a rapid
build up of column compressive forces which is to be avoided. Similarly, the use of
stocky braces or of larger frame participation increases the dissipation capacity of the
structure and reduces its energy dissipation demand, but also increases the variance
of the response.
8.3. CONCEPTS VALIDATED
The results of this research have once more proven the extreme sensitivity of
the inelastic response of chevron-braced frames to the characteristics of ground exci
tation, and their tendency to fonn soft stories (Chapters 5 and 6). Considerable
force redistributions occur in chevron-braced frames and affect the overall perfor
mance to a large extent. Comparing the perfonnance of a 1985 UBC designs
(Chapter 5) to those of SEAONC designs (Chapter 6) shows that the SEAONC
recommendations are superior to those of UBC in terms of safety, without being
overly conservative. Comparing the optimization results of the EI Centro set to
those of the mixed earthquakes set (Chapter 6) clearly shows the need for a better
knowledge of site seismicity to take full advantage of the optimization procedure.
8.4. CONCEPTS INVALIDATED
Several widely accepted concepts in the design of chevron-braced frames have
been more or less invalidated by the results of this research. Chapter 5 showed that
the use of stiff beams in a multistory chevron-braced frame can be counterproductive
by generating large column compressive forces which may induce column yielding.
Designing columns to resist the increased compression would require much larger
column sizes. Similarly, the use of stocky braces did not significantly improve the
response of chevron-braced frames (Chapter 5), except for a slight reduction in max
imum compression in the braced bay columns. Until there is a reliable model for
the energy dissipation capacity of braces (stocky ones in particular), stocky braces
should be used with caution. The large bit ratios needed to achieve small slender
ness for a given strength favor the occurrence of local buckling which can prema
turely terminate the useful life of braces.
The concept of statically adding the individual strengths of braced bays and
moment resisting frames was shown to be invalid in Chapter 5 (directly, and
indirectly in Chapter 6). The different individual deformation patterns of both sys
tems under distributed lateral loads create additional interaction forces between the
two systems when they are forced to undergo the same deformation in a dual

89
system. These internal forces can reduce the total strength available to resist exter
nal loads. Moreover, important force redistributions occur upon brace buckling,
such that the instantaneous frame participation is quite greater than the original elas
tic one.
The idea of increasing the elastic design forces to improve the safety of the
structure is valid to a certain extent. It assumes that the peak ground acceleration
(or other measure of the earthquake damage potential) can be accurately predicted
so the stmcture can be designed to remain elastic. It neglects the massive force
redistributions that occur in chevron-braced frames after brace buckling (Chapter 3).
Careful consideration of these force redistributions is essential to improve the ductil
ity of chevron-braced structures in the inelastic range, when the actual earthquake
intensity exceeds the predicted value. This point was most clearly illustrated in
Chapter 6 for the mixed earthquake set, when the optimization algorithm increased
not only the brace cross-sectional area in the first story but the brace slenderness
also, to avoid increasing the story strength.
The concept of an optimal distribution of story strength heralded by many [49,
5] and adopted by the Japanese Earthquake Resistant Design Code, does not seem
to be valid for -chevron-braced steel structures. The optimal strength distribution (for
elasto-plastic models of story hysteresis) is obtained by trial and error such that the
average story ductility demand over several earthquakes is uniformly di:;tributed.
This concept does not seem to be valid for chevron-braced steel structures. Besides
the fact that the hysteresis loop for chevron-braced stories is far from elaslo-plastic,
the distribution of ductility demand for any given earthquake is quite different from
the average value. With the tendency of chevron-braced frames to form soft stories,
this can still result in excessive local ductility demands. This was demonstrated in
Chapter 5 where the proportional braces design (KPRO) had larger variances for
story drift and energy dissipation demand than the UBC design (KREG).
8.5. NE\V CONCEPTS
The dlynamic simulations of Chapter 5 have revealed that brace buckling intro
duces a coupling between vertical and horizontal modes of vibrations. Thi~; coupling
has quasistatic and dynamic components, and its effects are comparable in impor
tance to other parameters such as brace slenderness, beam stiffness and frame parti
cipation. Moreover, it contributes to increasing the axial compressive forces in the
braced bay columns.

90
The optimization study of Chapter 6 shows that the two main concepts in
improving the behavior of chevron-braced frames are avoiding tuning to the peaks of
the input power spectrum,
and reducing the detrimental interaction between braced bay and moment resisting
frame. The idea of avoiding the peaks of the input power spectrum is already
widely known and applied in the case of elastic systems (base isolation). For inelas
tic systems, the idea is to shift the fundamental elastic period to right above a peak
in the input power spectrum,
such that ocx::urrence of damage will elongate the instantaneous fundamental period
enough to shift away from the peak of energy input, and hence limit further dam
age. This strategy requires knowledge about the characteristics of future earth
quakes that is often not available. To reduce the detrimental interaction between
braced bay and moment resisting frame it is necessary to reduce the frame participa
tion at the base of the structure and to increase it at the top.
The optimization study showed that the optimal design depends to a large
extent on knowing the seismicity of the site and on the earthquake motions used to
simulate that seismicity. The optimal design of a standard chevron-braced frame is
therefore more sensitive to the characteristics of the ground motions than the original
design, and that in itself is undesirable. Chapter 7 considered several variants of
chevron-bracing, two of which enjoy behavior characteristics clearly superior to those
of the original chevron-bracing scheme. One of them (TBTG) achieves the advan
tages of trilinear hysteresis char?cteristics without increasing column compression or
using stiff beams. However, it causes large compression forces in the tie-bars. The
other (ZIPPER) adds to the advantages of TBTG the virtue of reduced sensitivity to
ground motion characteristics, and a predictable collapse mode.
Chapters 5 and 7 have shown the importance and the complexity of predicting
the maximum column compressions and the maximum forces in the tic-bars addi
tions required by the TBTG and ZIPPER modifications. These forces cannot be
adequately predicted from extrapolation of elastic analysis results. Simplified pro
cedures were developed to estimate the mean peak column compression in the
braced bay (Appendix B) and the mean peak tie-bar forces for the TBTG and
ZIPPER variants (Appendix C).

91
8.6. FURTHER RESEARCH NEEDS
In the:: course of this investigation several research areas that nec:d to be
explored had to be left unexplored. These can be classified under one of three
categories: .analytical, experimental and numerical.
8.6.1. Amdytical:(1)- lbe important coupling between vertical and horizontal vibration modes
requires investigating the behavior of chevron-braced frames and of their vari
ants (ZIPPER and TBTG) when subjected to combined horizontal and vertical
excitations.
(2)- The bounds developed in Appendices B and C for maximum column
compression loads and for maximum tie-bar forces need to be refin~. One
approach would involve representing the tie-bars and masses at beam to brace
connections as a secondary system subjected to multiple suppo::t inputs
[22,43,9].
(3)- The optimization study revealed the sensitivity of the optimum design to
the characteristics of ground motions. The relationship between parameters
characterizing the earthquake and the response parameters of the structure need
to be studied in more detail. The damage potential of an earthquake or given
site for a proposed structural system could then be easily estimated at the prel
imina:ry design stage. That would speed up the design process and make it less
expensive by avoiding costly revisions and extended comparative studies
between alternative structural systems.
(4)- The optimization results indicating a reduction in modal correlation in the
optimal design warrant a careful investigation and an evaluation of the conse
quences for three dimensional systems where torsional and translatio:1al defor
mation modes are often highly correlated.
(5)- l1l.e reliability formulation currently implemented in DELIGHT.STRUCT
is based on a component reliability approach. While this formulation is accept
able iill many cases for simple structures made of only one type of elements
(flexural members in moment resisting frames), it is deficient for hybrid struc
tures that involve different types of elements interacting in several ways (braced
frame:s comprising braces and flexural members). A system rcliabilit~, formula
tion is more desirable. There is evidence that the design space for rybrid sys
tems such as chevron-braced steel frames is not convex. The optimization algo
rithm may thus converge to a local minimum. Hence there is a nc::ed for an

92
optimization algorithm that can handle such problems; the "simulated anneal
ing" algorithm [71,72,73] is claimed to have such a capacity.
8.6.2. Experimental:
The lack of a reliable and general model for the energy dissipation capacity of
braces under cyclic loading was sorely missed in this study. Such a model would be
based at least on the brace geometric and material properties, and possibly would
consider the deformation history in deciding whether a brace is still serviceable or
not. Until recently, most of the experimental work on brace buckling concentrated
on understanding the behavior of these elements and on improving the models of
such behavior to include the effects of brace slenderness, imperfections and end con
dItions.
Computer simulations have led to two alternative bracing schemes (TBTG and
ZIPPER) that seem to perform better than the original chevron-bracing system. The
feasibility and superiority of these variants remain to be proven experimentally in a
shaking table or pseudo-dynamics tests.
6.G.:J. Numerical:
DELIGHT.STRUcr was originally developed to provide the user with an
extensive environment with many facilities that were not available in existing operat
ing systems at the time. As a result it consumes big amounts of memory, is slow in
execution (interpreted code) and is somewhat difficult to maintain. A modern ver
sion would be more streamlined and modular and would make maximum use of
facilities now provided by existing operating systems (like UNIX) and libraries (like
LINPACK, MATLAB) and graphic interfaces (X, GKS etc... ). A vectorized ver
sion of the ANSR structural simulation program would be installed on a CRAY
with facilities to run it remotely under the control of the optimization program which
would be on a personal workstation. Such a version would increase the size and
realism of problems that can be tackled since the structural simulation presently con
stitutes a time bottleneck, and the limited memory capacity of the personal worksta
tion a space bottleneck.

93
APPENDIX A
MISCELLANEOUS ANALYIlCAL DETAILS
A.I INTRODUCTION
This appendix contains the details of some of the derivations whose results are
discussed in Chapters 2 and 3. It is divided into two main sections the first of which
describes in detail the development of a dimensionless model of post buckling brace
behavior. The second main section is concerned with the tangent stiffness of a
chevron-braced panel after buckling of a compression brace.
A.2 POST BUCKLING BEHAVIOR OF BRACE
Referring to figure 2-1, the deflection of the buckled brace is
y(x) = Acos(~~ x) + B sin(~-v?- x)2 ~ 2 ~
The boundary conditions being
yeO) = a -. A = C
y(~) = ~_v1p_(P_) _ B = __M--,--p(_P)__2 P
'IT" IPPsin(- V -0-)
2 Pc
The plastic rotation Op at the plastic hinge is given by
, L M p 'IT ~ 11 ;-pe = 2y (--) = 2 - V -oos-V -p 2 L Pc 2 Pc
Psin( 11" -v?- )2 Pc
Al
A2-1
A2-2
A3
The axial deformation of the brace t1 has three components; clastic t1e , geometric
t1~ and plastic t1p :
t1 = t1e + t1g + t1p
where the elastic deformation is
t1 = PLe AE
and the geometric deformation:
A4
AS

~ =P
94
L
2 1~g = 2J"2y,2dx
o
and the plastic defonnation
dMp{P} 6 ( +JP d2Mp{P) 6 (P}dP
dP P p. dp2 Pp.
Let Mp(P) = Mp(l - ~)Py
Then
A6
A7
A8Mp r
=2vr- = 2-yrPy d
where -y = vr/d is a section property. For wide flange sections bent about their
minor axis, -y has a narrow range of values (between 0.3 and 0.4; see Table 2-1).
For simplicity, let us define the following dimensionless parameters:
Pu= -
PyA9-1
a= A9-2
z
" = -2
AkL=r
A9-3 .
A9-4
A9-5
Notice that" = TII2~-u = 4a,,2hr2 = b,,2 where b = 4ahr2 . We then have
in dimensionless terms
AlO-l
AlO-2

95
Using series expansions from Abramowitcz [1 J for some terms
A 10-3
1 3 2 5cotll = - - -!l.. - 2L - £!L.. . .. =
11 3 45 945
00
11cot11 = 1+L Czi_I112i
i=l
cot11 = -1._+ ~r_, 2i-2·z L.J '--21-I 1111 11' i=1
1 1 ~ (2' l)r- 2i-2-'-2- = -"2 - L.J 1- '--2i-l11Sin 11 1'1 i=1
" I ~ Czi-l 2iInSln11 = n11 + L.J -2-'-11
i=1 1
l.. +~ r_. 2i-1L.J '--21 - 111
11 i= IAll-1
A11-2
AlI-3
AlI-4
AII-5
it is possible to express thc tcrm ~gp = ~g + ~p as
_ ~ 1 2~gp - 8· 2[201 + 202 - b 03]L
A b
where
O 1 ~(' l)r- 2i-4I = -4 -- L.J 1- '--2i-l1111 i= 1
00 C2 . 1)"'" 1 + 1- 2iO2 = 1-211111 + L.J . Czi-l11i= 1 1
Q = 40+2 4+ ~ (i+l)(i+4)r. 2i+43 11 i-:t (i+2) '--21-111
A12
A13-1
A13-2
A13-3
Notice that thc expressions for 0 1 ' Oz , and 0 3 arc independcnt of brace rropertics
like slcnderness A and section shape factor 'Y. Therefore they can be ccor,omically
and accurately (see figure 2-2a,b,c) rcplaccd by a least square approximation:
QI-PI = _14
+2.16941c-2+ 6. 112386c-311 21'1
OrP2 = -2In11+0.99524-D.29613112-9,50725e-2114
Q3-P3 = 218817+2.59573Tl 4-1.68026Tl6
The tenn -2In11 in Q2 can be approximated for O.0057T:5Tl:50.57T by
A14-1
A14-2
A14-3

96
-21n1'l = 14.96810-22.4321731'1°·25+7.432651'1°·50 A15
P2 then becomes
P2 = 15.96334-22.4321731'1°.25+7.432651)°.5-o.29613T?-9.50723e-2114 Al6
Finally, the total defonnation is
~ = E brt2+8':cJ...[(_1_+2.1694Ie-2+6.l12386e-3112)L y A2 b2 1)4
+ 2(15.96334-22.4321731'1°.25 + 7.432651'1°.50 -0.29613112-9.50725e-2114)
-b2(2.l8817+2.59573114-1.68026116)]
A17
Using this polynomial expression, it is relatively easy to track the effect of brace
slenderness A and section shape factor "y on such quantities as post buckling tangent
stiffness Kbt and inelastic energy dissipation Ein
A.3 POST BUCKLING TANGENT STIFFNESS:
Since Equation AI7 expresses the defonnation in terms of the force, it is easier
to obtain the flexibility in terms of the force level and then invert it to obtain the
instantaneous stiffness in terms of the force level.
but
alla 2 1 -4~L = 2Eyb1)+8~2[(-5 +2x6.112386e-311)
A b 11
-.;(4x2.59573113_6x1.68026115)]
and
1f 1 1f11
"2 V PP ="2 1'IEy~c
Al8
Al9
A20

· 97
which impliles
Ko 'JT2 'V2 1 -2- = --e b+8....L.[-(-+6.112386e-3)
%t 2el,a Y A2 b2 ,,6
-7 -3- --(5.60804" 4 -3.71633" 2 +0.59226+0.38029,,2)
Evaluating Equation A21 at" = ;
A21
=1 12 2
1+2'JT2 \ 3 (2.93676a4 -2.18737a2 -o.7137)eyA a
A22
A.4 DERIVATION OF CHEVRON BRACED STORY POST BUCKLING STIFF
NESS
The derivation of the post-buckling stiffness of a chevron-braced bay may be
simply obtained from first principles. Refer to Figures 3-2 and 3-3 for the :~eomctry
and kinematics of the problem.
A.4.1 Geometry
~brc = ~tcosE)+ ~bmsine
Do brt = Dotcos0-DobmsinE>
A.4.2 Mah~rial Properties
~T = V'brt
~C = -Kb~brc
A23
A24
A25
A26
A27

98
A.4.3 Equilibrium
~F = (~T+~C)cose
~Pun = (~T-~C)sine
Get effective stiffness Ke = ~F/~t
~T-~C = Kt,~brt+~brc
= Kt,~rCOSe-KmAbmsin0+ K~tcos0+Kbb~bmsine
~Pun = (Kbr+ Ktx,)cosesin0~t-(Kbr-Kbb)sin20~bm = Kbm~bm
Km+Kbb- ~bm = ~r;inecose------
Kbm+ (Kbr-~)sin2e
~T+~C = ~~brt-Ktx,~brc
= K~tcose-Kt,~bmsine-K~tcose-K~bmsine
= (Kbr-Ktx,)~rCOS0-(Kbr+ Kbb)sin0~bm
(Kt,r+ Kbb)2sin2E>cos0= [(Kbr--:-Kt,b)cosE) - K (K K)' 21.:.\ ]~t
bm+ br- bb sm 0
~F = (~T+~C)cose
A28
A29
A30
A31
A32
A33
A34
A35
A36
A37
A38
A40
A392 (Kt,r+ Kbb)2sin2e
= ~tCOS e[(Kt,r-Kbb) - v. (K K)' 21:\]~'001+ br- bb sm \!:j
(Kt,r+ Kbb)2sin2E)Ke = cos2E)[(Kbr-Kbb) ]
Kbm+ (Kbr-Kbb)sin2e
If Kbm = 00, then Ke = Kt,rCQs2E).
KbPos20If Kbb = O,then Ke = -----
Kbr 2l+--sin e
Kbm
In order to have Ke > 0 (assuming Kbb < Kbr), the following relation must be satis
fied:
A41
or
A42

99
or
A43
Hence
KbrKblJSin2E)Ktxn > 4 (Kbr-K
bb) A44
Given that the original braces stiffness is Ko = 2KbP>~E), then the ratio Kc!Ko
equals
or
0<
and
(1+Kbb 2·2%r ) SIn E> K
bb:5 (1 - -) - 2eI
Kbm "1 Kbb ) . 20 Kbr--T~ - - Sill ~
%r Kbr
A47
Taking the inverses
A48
A49

100
or
This complicated expression simplifies considerably if Ktx. = 0;
2C1sin2e Kbm 2~sin2e---<:--<:---
1-2C1 - %r - 1-2~A51
A52
Given Equation A44 and the beam stiffness
Koot = 48 0: (EI)L 3 bm
where 1 <: 0: <: 4, 0: = 1 for simply supported beams and 0: = 4 for fixed ends
beams.
Reczlling that the brace stiffness for lateral load is
Kbr = (A ~ )brcos2e
and Lbr = Loo/2cosE), Equation AS3 becomes
v_ = 2 ArnE cos3e"~r L
bm
Then Equation A44 implies
1 Am.L&ncos3E)Ibm> ------
60: Ka-(-K-
bb-1)
A flexible beam then has 0: = 4 and satisfies
1 AmL&ncos3e:r.xn:$ 24 K~
(--1)Ktx.
A stiff beam has 0: = 1 and
1 A L2 cos3e1>- brbmbID - 6 Kbr
(Kbb
-1)
A53
A54
A55
A56
AS7

101
While a ~lm of intennediate stiffness has
1 At,rL&nc~E>
6 Kbr(--1)Kbb
A58
A60
The increment in vertical unbalance force at the beam midspan APun as expressed in
Equation J\32 becomes
Kbmsin8cose(Kbr+~) .AP = K A = AT A59
un tm bm Kbm+(Kt,r-Kbb)sin2E>
which can be rearranged as
sin8cosE>KootAPun = AT
K bm Kbr-Kbb . 2,---+ SlOE>I<~r+ Kbb Kbr+~
or
A61
102
APPENDIX B
BOUNDS ON MiU.'IMUM COLUMN COMPRESSION LOADS
B.l INTRODUCTION
111is research has shown the importance of the post-buckling force redistribu
tions in chevron-braced frames, the difficulty of predicting the magnitude of the
redistributed forces, and hence the need for a capacity design approach. In particu
lar, the detennination of maximum column compression and tension is essential to
insure the safety of the structure. A direct application of capacity design concepts is
simple, but leads to overly conservative column force estimates. This section
describes a proposed design procedure for chevron-braced frames in general, and
emphasizes the steps to follow in detennining the maximum credible column forces.
The central idea is that in a dynamic loading case, not all elements reach their capa
city at the same time. In the absense of an adequate random vibration theory for
inelastic systems, it is assumed that the events of elements reaching their capacity are
\;ilcQrrelated. Hence, a Square Root of Sum of Squares (SRSS) approach is justi
Ced.
A comprehensive approach to the seismic design of chevron-braced frames
would involve the lllllowing steps:
(1)- Obtain averaged nonlinear design strength spectra for a set of earthquakes
typical of the site on which the proposed structure is to be erected. For this
purpose, programs such as NOSPEC can be used in conjunction with an ade
quate hysteresis model: deteriorating strength models for regular chevron
bracing, trilinear models for ZIPPER or TBTG variants.
(2)- Select the maximum design strength level corresponding to the estimated
fundamental period of the structure and to acceptable displacement ductility
and energy ductility demands. The acceptable ductility levels would have been
established based on a study of the seismicity of the area and a determination
of the ductility capacity of the structural system chosen as well as the allowable
probability of exceedance of the specified ductility level (seismic risk study).
(3)- Select a lateral load distribution based on the vertical mass distribution and
an assumed story displacement distribution (e.g. linear or quadratic). This dis
tribution may be later refined by modal analysis if necessary.
(4)- Compute the base shear using a first mode mass, the design pseudo
spectral acceleration for the site, and the design strength level chosen in Step 2.
Compute the equivalent lateral forces based on the base shear obtained and the

103
latcral load distribution obtained in Step 3.
(5)- Select beam and brace sizes for the specificd gravity scrvice loads and
equivalcnt lateral loads. The selection may be based on the yield stresses for
flexural members and on buckling stresses for bracing membcrs. In designing
the beams, the support provided by the braces at midspan will be neglected.
The results of Chapter 3 (Eq. 3-28) may be used in proportioning the beams
and braces for the desired type of post-buckling behavior.
(6)- Compute the maximum story shear capacity using a simplified plastic
analysis approach as detailed below.
(7)- Compute the maximum possible overturning moment using an SRSS
approach as detailed below.
(8)- Compute the quasi static maximum vertical unbalances Pud at every story
as detailed below.
(9)- Compute the maximum column compression (using capacity approach) as
detailed below. As discussed in Chapter 5, column compression has four com
ponents: a gravity load component, an overturning moment component, a
quasi-static brace component, and a dynamic unbalance force component.
(10)- Compute the maximum column moments. The sum of cOlumn plastic
moments at a joint should be superior to the sum of beam plastic moments and
P6. moment.
(11)- Select column sections. Proceed from the top of the structure to the bot
tom, selecting column sections such that the maximum column compression
(from Step 9) and the maximum column moment (from Step 10) remain within
the section yield surface.
(12)- Evaluate the design for stability, serviceability, strength and constructibil
ity. It may be necessary to go back to previous steps (as far as step 1) to
correct any deficiencies in the design.
(13)- In the final design, proportion connections to develop the strength of con
necting elements.
In the: following, we will illustrate the application of Steps 6 to 9 in the determi
nation of column compression for three examples: KREG, KSTO and KPRO.

104
B.2 COLUMN FORCES IN KREG
B.2.1 Maximum interior column compression loads for KREG:
Detennine the maximum story shear capacity. For the frames discussed herein,
one might use for story i:
y. = 2P ·coseI C1 B1
B2
This formula assumes a weak girder design and neglects the frame contribution to
maximum story strength. The values of Vi are listed in Column 6 of Table B-1.
TABLE B-1 Miscellaneous Brace Data for KREG
Brace Brace Py Pc y. Pud1 Pud2 Pud1
Story Section Area (in2) (I.:) (I.:) (I.:) (It) (I.:) (I.:)
6 W8x28 8.25 297 1Tl 226 116 70 35
5 W8x28 8.25 297 1Tl 226 116 70 35
4 W8x31 9.13 329 243 311 178 70 35
3 W8x31 9.13 329 243 311 178 70 35
2,
W8x35 10.3 371 275 352 200 70 "'~
1 W8x35 10.3 :!71 275 352 200 70 35 J
The dynamic vertical unbalance force in any story applied to that story's braced bay
column is bounded by
1 . [ 2Pun = Pud1 _P = -mmud 2 (KMptlLbm-Pg) = Pud2
where Pun is computed from Equation 3-29. The factor of 2 in Pud1 is an upper
bound for dynamic magnification due to impact loading. The K factor assumes a
value of 4 or 8 depending on whether the beam has hinged connections to the
columns or fixed connections. Mpb is the plastic moment of the beam and Lbm is
the span of the beam in the chevron-braced bay. Pg=wgLoo/4 is the equivalent
Mgravity load at beam midspan. The second bound K~L pb -Pg is an approximation
bm
to the maximum point load increment that can be applied to the beam at midspan
before it forms a collapse mechanism. Each column of the braced bay would have
to be designed for one half of Pud ' hence the 1/2 factor. For this case K=8,
Pg=wgU4, and wg=1.9k1ft (27.74 kN/m) is the total gravity service load. For the
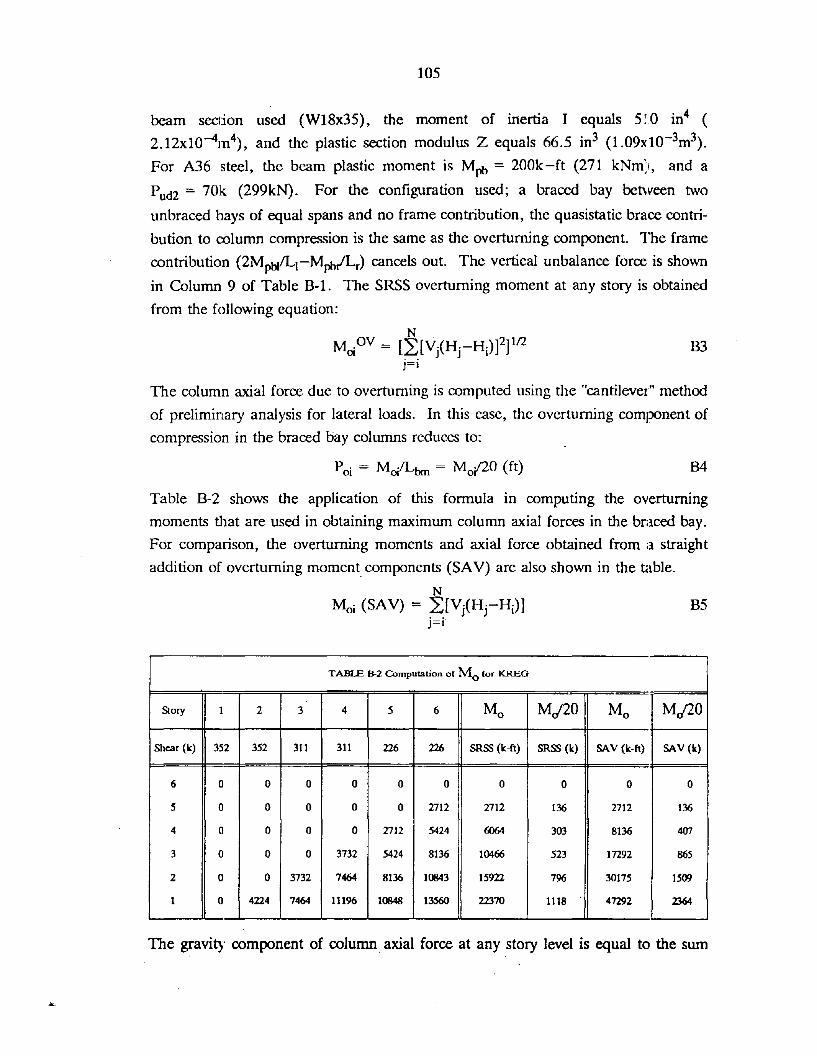
105
beam sec1ion used (W18x35), the moment of inertia I equals 510 in4(
2. 12xlO-4m4), and the plastic section modulus Z equals 66.5 in3 (1.09xlO-3m3).
For A36 steel, the beam plastic moment is Mpb = 200k-ft (271 kNm), and a
Pud2 = 70k (299kN). For the configuration used; a braced bay between two
unbraced bays of equal spans and no frame contribution, the quasistatic brace contri
bution to column compression is the same as the overturning component. The frame
contribution (2MpbllL\-MpbILr) cancels out. The vertical unbalance force is shown
in Column 9 of Table B-1. The SRSS overturning moment at any story is obtained
from the following equation:
NMoi
QV = LL[Vj(Hj -Hi)f]ll2j=i
B3
The column axial force due to overturning is computed using the "cantilever" method
of preliminary analysis for lateral loads. In this case, the overturning component of
compression in the braced bay columns reduces to:
B4
Table B-2 shows the application of this formula in computing the overturning
moments that are used in obtaining maximum column axial forces in the braced bay.
For comparison, the overturning moments and axial force obtained from a straight
addition of overturning moment, components (SAV) are also shown in the table.
NMoi (SAV) = L[Vj(Hj-Hi)] B5
j=i'
TABLE B-2 Computation of M o for KREG
Story 1 2 3 4 5 6 Mo MflO Mo MJ20
Shear (k) 352 352 311 311 226 226 SRSS (k-ft) SRSS (k) SAV (k-ft) SAV (k)
6 0 0 0 0 0 0 0 0 0 0
5 0 0 0 0 0 2712 2712 136 2712 136
4 0 0 0 0 2712 5424 6064 303 8136 407
3 0 0 0 3732 5424 8136 10466 523 17292 865
2 0 0 3732 7464 8136 10843 15922 796 30175 1509
1 0 4224 7464 11196 10848 13560 22370 1118 47292 2364
The gravity component of column axial force at any story level is equal to the sum

106
of gravity loads for the stories above (Pg in Table B-3). The effective axial com
ponent due to the vertical unbalance forces is obtained using an SRSS approach (Pd
in Table B-3).
N 112Pdi = [LPud?]
j=iB6
Finally, the maximum column force at any story level (PT in Table B-3) is estimated
by applying an SRSS sum to the components of overturning moment and dynamic
unbalance, and then adding the gravity component.
Pn = Pgi + [Pd,?+po?]ll2 B7
For comparison, P + 3<7 in Table B-3 shows the mean peak column compression
plus three standard deviations recorded during numerical simulations. Assuming a
nonnal distribution for maximum column compressions, the probability of exceeding
this value is 0.3 %. Puoc shows the UBC design elastic forces. PSEAOC show the
1985 SEAOC [75] estimate of column compression, assuming an Rw of 8. PCAP
shows the yield strength of the column section.
TABU;: B-3 Maximwn Interior Column Forces for KREG
Story Pg(k} Pd (k) Po(k} PT(k) P+ 3<7 (k) PUBC(k) PSEAOC(k) PCAP(k)
6 38 35 0 73 100 38 38 454
5 76 49 136 220 270 107 169 454
4 114 61 303 423 367 203 381 785
3 152 70 523 679 S75 319 653 785
2 190 78 796 990 831 451 973 1271
1 228 85 1118 1349 862 594 1326 1271
Figure B-1 compares the estimated peak interior column forces (solid line) to the
mean peak forces obtained in the analysis (long dashed line), the UBC design forces
(short dashed line), and the column yield forces (dotted line).
8.2.2 Maximum exterior column compression loads in KREG:
There is no dynamic vertical unbalance force applied to the exterior columns.
The gravity load component at any story level (Pg of Table B-4) is equal to the
linear sum of the gravity forces of the floors above. The axial force component due
to over-turning moment is limited by the amount of force that the beam can transmit

107
to the column. ~his component is accumulated using the SRSS technique (Pov of
Table B-4) on the dynamic components. Assuming plastic hinges occur ~.t the end
of the beam:N 112
Poi= LL2MpbyLbm2]j=i
B8
The estimate for maximum exterior column compression PT has only lWO com
ponents; a gravity load component and the overturning component defined
hereabove. PT.... of Table B-4 shows the exterior column compression computed by
the SRSS capacity technique PT.... = V pg2+Po
2 , and PT•AV
shows th,e straight
addition of the two components Pg and Po. P shows the mean peak column
compression obtained during the simulations, Puoc shows the UBC elaslic design
force, and PCAP shows the column section yield force.
TABLE B4 Maximum Exterior Column Compremon for KREG
Story Pg (I:) Po (k) PT.... (k) PTuv (k) P+3rr (k) PUBC(k) PSEAOC(k) PCAP(k)
6 19 20 28 39 29 19 19 454
5 38 28 47 78 61 38 38 454
4 57 35 67 117 94 57 57 454
3 76 40 86 156 111 76 76 454
2 95 45 105 195 167 95 95 454
1 114 49 124 234 173 114 114 454
The SRSS approach underestimates maximum exterior column compression while the
SAV approach is on the conservative side. The unconservative results for SRSS may
be mitigated by including. frame contribution to story capacity.
B.3 COLUMN FORCES IN KSTO
B.3.1 Maximum interior column compression loads for KSTO:
The same procedures used for KREG are also used here, so only the relevant
tables are listed. Figure B-2 has the same function for KSTO as Figure B-1 for
KREG.

108
TABLE 8-5 MiscclIaneous Bracc Data for KSfO
Brace Brace Py Pc y. Pud1 Pud2 PudI
Story Section Area (in2) (k) (k) (k) (k) (k) (k)
6 >"=55 5.25 189 177 226 83 70 35
5 >"=55 5.25 189 177 226 83 70 35
4 >"=46 7.21 260 243 311 85 70 35
3 >"=46 7.21 260 243 311 85 70 35
2 >"=46 8.13 293
I275 352 96 70 35
1 >"=46 8.13 293 275 352 96 70 35I
Notice that the mronmum unbalance force is still governed by the beam strength
rather than by the brace unbalance force. The maximum column forces will there
fore be the same as for KREG.
TABLE B{) Computation of M o for KSTO
Story 1 2 3 4 5 6 Mo Mel20 Mo Mel20
Shear (k) 352 352 311 311 226 226 SRSS (k-ft) SRSS (k) SAV (k-ft) SAV(k) I
6 0 0 0 0 0 0 0 0 0 0
5 0 0 0 0 0 2712 2712 136 2712 136
4 0 0 0 0 2712 5424 6064 303 8136 407
3 0 0 0 3732 5424 8136 10466 523 17292 865
2 0 0 3732 7464 8136 10843 15922I
796 30175 1509
I1 0 4224 7464 11196 10848 13560 22370 1118 47292 2364
and the maximum column forces are put in Table B-7:

109
TABLE 8-7 Maximum Interior Column Forces for KSfO
Story Pg (k) Pd (k) Po (k) PT(k) P+3<T (k) PUOC(k) PSEAOC(k) PCAP(k)
6 38 35 0 73 78 38 38 454
5 76 49 136 220 216 107 169 454
4 114 61 303 423 280 203 381 785
3 152 70 523 679 449 319 653 785
2 190 78 796 990 602 451 973 1271
1 2~1 85 1118 1349 787 594 1326 1271
8.3.2 Maximum exterior column compression loads for KSTO:
There are no changes in the assumptions or in the original numbers so the
values obtained are the same as for KREG.
TABlE B-8 Maximum Exterior Column Compression for KSTO
p~(·)1-Story Pg (Ie) Po (k) PT. (k) PTuy (k) P+ 3<T (k) PUOC(k) PSEAOC(k)
IR SI
6 19 20 28 39 28 19 19 454
5 38 28 47 78 60 38 38 454
4 57 35 67 117 92 57 57 454
3 76 40 86 156 137 76 76 454
2 95 45 105 195 181 95 95 454
1 114 49 124 234 229 114 114 454
8.4 COLUMN FORCES IN KPRO
8.4.1 Maximum interior column compression loads for KPRO:
The same procedure as for the previous two frames is applied to KPRO. The
results of the calculations are shown in Tables b-9 to B-11.

110
TABLE 8-9 Mi.'iCdlancous Brace Data for KPRO
Brace Brace Py Pc V Purl I Pud2 PUdI
Story Section Area (in2) (k) (k) (k) (k) (k) (k)
6 A=92 2.71 98 73 93 63 70 31
5 A=92 5.74 207 153 196 118 70 35
4 A=92 6.86 247 183 234 139 70 35
3 A=92 8.71 314 232 297 172 70 35
2 A=92 10.2 367 272 348 198 70 35
1 A=92 10.3 371 275 352 200 70 35
Even in this case, the maximum unbalance force is limited by what the beam can
transmit to the columns, except at the top story.
TABLE 8-10 Computation of M o for KPRO
Story 1 2 3 4 5 6 Mo MJ20 Mo MJ20
Shear (Ie) 352 348 297 234 196 93 SRSS (k-ft) SRSS (k) SAV (k-fi) SAV (k)
6 0 0 0 0 0 0 0 0 0 0
5 0 0 0 0 0 1116 1116 56 1116 56
4 0 0 0 0 2352 2232 3242 162 4584 229j
3 0 0 0 2808 4704 3348 6420 321 10860 543
2 0 0 3564 5616 7056 4464 10675 534 20700 1035
1 0 4176 7128 8424 9408 I 5580 16089 804 34716 1736I
It can be noticed that the column axial forces due to overturning are noticeably
reduced.

111
TABLE 8-11 Maximum Interior Column Forces for KPRO
-Story Pg (I:) Pd (k) PO(k) PT(k) P+ 3cr (k) PUOC(k) PSEAOC(k) PCAP(k)
6 38 31 0 (f) 159 38 38 454
5 76 46 56 148 188 107 169 454
4 114 58 162 286 306 203 381 785
3 152 68 321 480 449 319 653 785
2 190 76 534 729 670 451 973 1271
1 228 84 804 1036 938 594 1326 1271
TIle SRSS capacity approach underestimates column forces badly· for KPRO, espe
cially in the upper stories where frame contribution to story shear is less negligeable
than in other cases (because of the smaller braces). The force estimate may be
improved by adding the frame strength contribution to story shear capacity. To do
this, multiply the story capacity based on the strength of braces by the following
correction factor
B9
where Kbri is the braces contribution to story drift stiffness, and Keri is the frame
contribution to story drift stiffness. This correction was deliberately left Ollt in this
demonstration to simplify the presentation.
8.4.2 Maximum exterior column compression loads for KPRO:
The estimates of peak exterior column compressions are unchanged. T:1e actual
peak column compressions obtained from the simulations are actually higher than for
two otht?r frames.

112
TABlE 8-12 Maximum Exterior Column Compression for KPRO
-Story Pg (k) Po (k) PT.... (Ie) PTlAV (Ie) P+ 30" (k) Puoc (k) PSEAOC (k) PCAP'(k)
6 19 20 28 39 30 19 19 454
5 38 28 47 78 67 38 38 454
4 57 35 67 117 108 57 57 454
3 76 40 86 156 155 76 76 454 ii
95I
2 95 45 105 195 203 95 i 454II
1 114 49 124 234 240 114I
114 I 454I
I I
In this case also, the SRSS approach underestimates the mean peak column compres
sions. Here-, the SAY approach is more adequate.
8.5 CONCLUSION
When using a capacity design approach, a straight addition of the capacities of
the members feeding forces in a column adjacent to a braced bent is conservative
since the maximum member forces do not occur simultaneously. The UBC estimate
for column forces is consistently low, however the code has several factors of safety
built in. The SEAOC estimate for column forces is conservative at the lower stories
and unconservative at the upper stories. In both codes, the estimated column forces
do not vary over the building height in the same way as the simulated forces. Both
code estimates can therefore be unconservative in some sections of the building (e. g.
top), or too conservative at others (e.g. base).
An SRSS summation of the dynamic and redistributed force components seems
to be very adequate in bounding column forces. The resulting mean value Pde
would be added in absolute value to the static gravity component Pg to obtain the
final estimate of column compression. Subtracting Pde from Pg would give an esti
mate of the maximum column tension. Such an estimate is very useful in the design
of column base plates and of column splices. For exterior columns, a better bound
of maximum column compression is obtained by directly adding the absolute values
of the gravity component and of the overturning component (SAY).
The SRSS (Square Root of Sum of Squares) approach for the dynamic terms
seems to be adequate for bounding the column forces in the lower stories in the
braced bay. This approach tends to under-estimate column forces in the upper
stories in the braced bay, and in all stories of the exterior unbraced bays. One

113
possible reason is that frame contribution has not been included in the calc:ulations.
It is also consistent with the theory that for the small set of members feeding forces
into the columns in the upper stories. the assumption of uncorrclated inelaSlic action
is not adequate. These member forces tend to be highly correlated and tend to
occur simultaneously. For the lower stories, the set of clements contributing forces
to the columns is larger and the assumption of uncorrelation may be morl~ accept
able. This indicates the need for an analysis technique that takes into account the
correlation between member forces in the inelastic range, as did Ocr Kiureghian et al.
[22] for the analysis of elastic structures.
The SRSS approach is suggested in three separate instances:
(1)- To compute the overturning moment component of column compression
for columns at any story and bay.
(2)- TI~ compute the effective dynamic vertical unbalance component of column
compression in the braced bay columns.
(3)- To compute the total estimate of dynamic components of column compres
sion in any braced bay eolumn.

114
APPENDIXC
BOUNDS OF MAXIMUM TIE-BAR FORCES IN TBTG AND ZIPPER CONFlGURATIONS
C.I INTRODUCTION
It has been mentioned that an accurate prediction of maximum tie-bar forces
would involve a random vibration theory for inelastic systems with multiple support
inputs; a theory that has not yet been developed. On the other hand, simple SRSS
capacity bounds can be easily developed. In the following sections, bounds are pro
posed for the maximum tie-bar compression in the TBTG and ZIPPER configura
tions, and for the maximum tie-bar tension in the ZIPPER configuration only.
Maximum tie-bar tension in the TBTG system is negligible compared to the tie-bar
compression load which governs the design.
C.2, MAXIMUM TIE-BAR COMPRESSION IN TBTG
The maximum tie-bar compression Ci at story level i is estimated by:
NCi = [~:Pun/]1I2
j=iC-l
It is assumed that the presence of tie-bars stiffens the system enough to eliminate the
need for dynamic amplification; Pun is equal to the value computed from Equation
3-29. However, in using Equation 3-29, the contribution of the tie-bars to the effec
tive beam stiffness must be included, or alternatively an infinitely stiff beam may be
assumed. In the following, Ciold is the estimate obtained using the bare beam stiff
ness in Equation 3-29 (not including the tie-bar stiffness), and C; is calculated
assuming a rigid beam. In Table C-l C is the mean peak tic-bar compression in
TBTG.

115
TABLE Cl lie-1m cornpessim in 1BTG
Story Pun (k) Ci (k) Ciold (k) C (k)
6 192 192 116 42
5 192 272 164 120
4 187 330 242 174
3 187 379 300 1:15
2 212 434 361 352
1 212 483 413 472
C.3 MAXIMUM TIE-BAR COMPRESSION IN ZIPPER
In the ZIPPER configuration where the beam forms plastic hinges, dIe max
imum unbalance force that can be applied to the brace at any story is twice dIe value
obtained from Equation 3-29. The 1/2 factor in Equation 3-29 for equal distribu
tion to the two columns of the braced bay is not needed here. Therefore, the max
imum tie-bar compression ~ at story i is:
C-2
In a ZIPPER system Pus would most often be equal to Pus2 ' because of the forma
tion of plastic hinges, and because the presence of tie-bars increases Pusl tremen
dously.
TABLE C2 lie-1m compression in ZlPPER
-Story 2Pus (k) ~ (k) C,:k)
6 70 70 39
5 70 99 83
4 70 121 97
3 70 140 97
2 70 156 74
1 70 - ..

.116
C.4 MAXIMUM TIE-BAR TENSION IN ZIPPER
The bound for maximum tie-bar tension load in the ZIPPER configuration is
slightly more complicated than the compression bounds.
T = min1
C-3
The first bound is an SRSS approximation of the maximum tie-bar tension that can
be transmitted from the stories below. The second bound is an estimate of the max
imum tie-bar tension that can be transmitted to the stories above the tie-bar in con
sideration.
TABLE C3 TIe-bar tension in ZIPPER
i-I i-I -Story Pun (k) CLPun
2]II2 (k) [2: Pun2]112 (k) T j (k) T (k)j=l j=l
6 192 443 192 192 154
5 192 400 271 271 180
4 187 353 329 329 223
3 187 300 379 300 200
2 212 212 434 212 117
1 212 - - - -
C.s TIE-BAR STIFFNESS IN THE ZIPPER CONFIGURATION
The requirement of resisting elastically the maximum probable compression is
sufficient to determine the tie-bar section size in the tie-bar-to-ground configuration.
For the zipper configuration, the tie-bars mUst satisfy an additional minimum stiff
n~s requirements so that they can transmit a larger portion of the unbalance forces
to adjacent stories. In choosing the relative stiffness of tie-bars and beams, a variant
of Equation 3-19 can be used to determine the minimum tie-bar stiffness needed.
4KbbKbr . 2
Kbm+Kbt2': (Kbr-Kbb
) SIn e
where Kbt = (AE/L)tie-bar is the effective axial stiffness of the tie-bar. In this
respect, flexible beams and intermediate slenderness braces are ideal since

117
intennediatl~ slenderness braces induce the most rapid build-up of unbalan:e force,
and flexible beams allow most of the unbalance to go to the tie-bars.
C.6 CONCLUSION
The bounds developed could be refined by more carefully including the frame
contribution, but the method would lose its attractive simplicity. However, this
might be m:cessary in cases where the frame stiffness is not negligible compared to
that of the braced system. Moreover, the bounds obtained are quite close to the
mean peak tie-bar forces, but given the considerable scatter in peak tie-bar forces
(COY-O.S..O.6) and the approximations involved in the analysis. The design tie-bar
forces should be scaled up acc-ordingly. Assuming a probability distribution for the
mean peak tie-bar forces with a mean computed as above, and an estimated COY, it
is possible to compute factors of safety necessary to achieve a given probability of
exceedance of design forces.

118
REFERENCES:1. M. ABRAMOWITCZ and I. A. STEGUN, Handbook of mathematical functions, Dover.2. AISC, Manual of steel construction, AISC, 1980.3. J. C. ANDERSON, "Seismic behavior of K-braccd frames", ASCE Strct. Div.Vol. 101 no. 10, 1975.4. A. H. ANG and W. H. TANG, Probability concept<; in engineering planningand design, Vol. II, Wiley and sons, 1984.5. H. AOYAMA, "Outline of earthquake provisions in the recently revised japanesebuilding code", Bulletin New Zealand National Society for Earthquake EngineeringVol. 14 no. 2, 1981.6. API, API recommended practice for planning, designing and constructing fixedoffshore platforms, API, 9th edition.7. A. ARIAS, A measure of earthquake intensity, MIT Press, 1970.8. ASCE, The Mexico earthquake 1985: factors involved and lessons learned,ASCE Proceedings, 1986.9. A. ASFURA and A. DER KlUREGHIAN, A new floor response spectrummethod for seismic analysis of multiply supported secondary systems, University ofCalifornia at Berkeley EERC 84/04, 1984.10. A. ASTANEH-ASL, Cyclic behavior of double angle bracing members with endgusset plate, University of Michigan at Ann Arbor UMEE 82R7, 1982.11. M. A. AUSTIN and K. S. PISTER, Optimal design of friction braced framesunder seismic loading, University of California at Berkeley EERC 83/10, 1983.12. M. A. AUSTIN, K. S. PISTER and S. A. MAHIN, A methodology for computer aided design of earthquake resistant steel structures, University of California atBerkeley EERC 85/13, 1985.13. R. J. BALLING, V. CIAMPI, K. S. PISTER and E. POLACK, Optimaldesign of seismic resistant planar steel frames, University of California at BerkeleyEERC 81/20, 1981.14. V. V. BERTERO, Identification of research needs for improving aseismicdesign of building structures, University of California at Berkeley EERC 75/27,1973.15. V. V. BERTERO, J. HERRERA and S. A. MAHIN, Establishment of designearthquakes; evaluatior;. of present methods, Proceedings of International Symposiumon Earthquake Engineering, 1976.16. M. A. BHATTI, Optimal design of localized nonlinear systems with dual performance criteria under earthquake excitations, University of California at BerkeleyEERC 79/15, 1979.17. J. M. BIGGS, lntroduction to structural dynamics, Mc Graw-Hill.18. G. R. BLACK, W. A. WENGER and E. P. POPOV, Inelastic buckling ofsteel struts under cyclic load reversals, University of California at Berkeley EERC80/40, 1980.19. P. F. CHEN and G. H. POWELL, Generalized plastic hinge concepts for 3Dbeam-column clements, University of California at Berkeley EERC 82/20, 1982.20. F. CHENG and D. S. lUANG, Optimum design of braced and unbracedframes for static, seismic and wind forces with UBC, ATC-3 and TJ-11, Universityof Missouri-Rolla, 1985.21. R. W. CLOUGH and S..8. JOHNSTON, Effect of stiffness degradation on

119
earthquake ductility requirements, Proceedings of Japanese Earthquake Symposium,1966.22. A. DER KIUREGHIAN, J. L. SACKMAN and B. NOUR-OMID, Dynamicresponse of light equipment in structures, University of C1.lifomia at BerkeleyEERC 81105, 1981.23. M. FUJIMOTO, A. WADA, K. SHIBATA and R. KOSUGI, "Nonlinearanalysis of K-type braced steel framcs", Trans. AIl no. 209, 1973.24. T. FUJIWARA, "Inelastic earthquake rcsponse and optimum distn bution ofdynamic characteristics of bending type structurcs", Trans. AU no. 255, 1977.25. T. FUKUfA, H. YAMANOUCHI, I. NISHIYAMA, H. ENDOH and T.WATANABE, "Hysteresis behavior of 3 story concentric K-braced frames",Proceedings 8th WCEE, 1984.26. Y. GHANAAT and R. W. CLOUGH, Study of X-braced steel structures underearthquake simulation, University of California at Berkeley EERC 80/08, 1980.27. Y. GHANAAT, Shaking table test of a tubular steel frame model, University ofCalifornia at Berkeley EERC 82/02, 1982.28. S. G. GOEL, Seismic behavior of multistory K-braccd frames undcr combincdhorizontal and vertical ground motion, 6th WCEE, 1977.29. W. J. GOODSIR, T. PAULEY and A. J. CARR, "A study of th? ine1<lsticseismic response of reinforced concrete coupled frame shear-wall structurcs", Bul,etinNew Zealand National Society for Earthquake Engineering, Vol. 16 no. 3, 1983.30. H GUGERLI, Inelastic cyclic behavior of stccl bracing members, University ofMichigan at Ann Arbor UMEE 82R1, 1982.31. A. B. HIGGINBOTHAM, The inelastic cyclic behavio:- of axially lOJded steelmembers, University of Michigan at Ann Arbor UMEE 73R9, 1973.32. ICBO, Uniform building code, ICBO, 1982.33. S. IGARASHI, I. INOUE, K. OGAWA and M. ASANO, "HystcTtic characteristics of steel braced frames. Part I; the behavior of bracing members urder cyclicaxial forces", Trans. AU no. 196, 1972.34. S. IGARASHI, I. INOUE· and K. OGAWA, "A study on the plastic design ofbraced multistory steel frames", Trans. AIl no. 263, 1978.35. K. IKEDA, Analysis of the cyclic inelastic response of braced stc'?! ~;tructures,
University of California at Berkeley EERC 84/12, 1984.36. A. K. JAIN, S. C. GOEL and R. D. HANSON, "Inelastic response of restrained steel tubes", ASCE Strct. Div. Vol. 104 no. 6, 1978.37. A.K. JAIN, S. C. GOEL and R. D. HANSON, Static and dynamic hysteresisbehavior of steel tubular members with welded gusset plates, University of Michiganat Ann Arbor UMEE 77R3, 1977.38. A. K. JAIN, S. C. GOEL and R. D. HANSON, Hystercsis behavior of bracingmembers and seismic response of braced frames with different proportion:;, University of Michigan at Ann Arbor UMEE 78R3, 1978.39. A. K. JAIN and S. C. GOEL, Seismic rcsponse of eccentric and concentricbraced steel frames with different proportions, University of Michigan at Ann ArborUMEE 79R1, 1979.40. L. KAHN and R. D. HANSON, "Inelastic cyclcs of axially loaded steelmembers", ASCE Strct. Div. Vol. 102 no. 5, 1976.41. B. KATO and H, AKIYAMA, "Seismic design of steel buildings", ASCE Strct.Div, Vol. 108 no. 8, 1982.

120
42. B. KATO., H. AKIYAMA and Y. OBI, "Dcfonnation characteristics of Hshaped steel members influenced by local buckling", Trans. AIJ no. 257, 1977.43. J. M. KELLY and A. D. COWELL, Experimental studies of multisupportseismic loading on piping systems, University of California at Berkeley EERC 82/19,1982.44. H. KRAWINKLER and B. LASHKARI-IRVANI, Damage parameters for bilinear SOOF systems, 7th WCEE, 1982.45. S. A. MAHIN and V. V. BERTERO, "An evaluation of inelastic seismicdesign spectra", ASCE Strct. Div. Vol. 107. no. 9,1981.46. B. MAISON and E. P. POPOV, "Cyclic response prediction for braced steelframes", ASCE Strct. Div. Vol. 106 no. 7, 1980.47. M. MAKINO, C. MATSUI and I. MITANI, "Post local buckling behavior ofsteel beam-columns, part 1-4", Trans. AU no. 281, 286, 288, 290,1979.48. S. S. MANSON, "Fatigue: a complex subject, some simple approximations",Experimental Mechanics Vol. 5 no. 7, 1965.49. Y. MATSUSHIMA, Optimum distribution of shear coefficient" for MDOF systems subjected to white excitations, 8th WCEE, 1984.50. I. MITANI, M. MAKINO and C. MATSUI, Influence of local buckling oncyclic behavior of steel beam-column, 6th WCEE, 1977.51. I. MITANI and M. MAKINO, Post local buckling behavior and plastic rotationcapacity of steel beam-columns, 7th WCEE, 1980.52. D. P. MONDKAR and G. H. POWELL, ANSR-1; general purpose programfor analysis of nonlinear structural response, University of California at BerkeleyEERC 75/37, 1975.53. P. MUELLER, Towards rational inelastic aseismic design procedures, LehighUniversity Fritz Eng'g Laboratory, 1984.54. N. M. NEWMARK and E. ROSENBLUETH, Fundamentals of earthquakeengineering, Prentice Hall Inc., 1971.55. R. NILFOROUSHAN, Seismic behavior of multistory K-braced frame structures, University of Michigan at Ann Arbor UMEE 73R9, 1973.56. G. J. NORDENSON, Notes on the seismic design of concentrically bracedframes, 8th WCEE, 1984.57. W. T. NYE and A. L. TITS, DELIGHT for beginners, University of Californiaat Berkeley UCB/ERL M82!55 , 1982.58. W. 1'. NYE and D. WANG, DELIGHT for intennediates, University of California at Berkeley UCB/ERL M85/32, 1985.59. S. P. TIMOSHENKO and J. M. GERE, Theory of clastic stability, Mc GrawHill.60. S. P. TIMOSHENKO and S. WOINOWSKY-KRIEGER, Theory of plates andshells, Mc Graw-Hill.61. T. PAULAY and W. J. GOODSIR, "The capacity design of reinforced concretehybrid structures for multistory buildings", Bulletin New Zealand National Societyfor Earthquake Engineering Vol. 19 no. 1, 1986.62. E. P. POPOV and R. M. STEPHEN, Cyclic loading of full size steel connections, University of California at Berkeley EERC 70/03, 1970.63. E. P. POPOV, V. V. BERTERO and H. KRA\~INKLER, Inelastic behaviorof steel beam to column subassemblages, University of California at Berkeley,EERC 71107, 1971.

121
64. E. P. POPOV, V. V. BERTERO and H. KRAWINKLER, Further studies onseismic behavior of steel beam column subassemblages, University of California atBerkeley EERC 73/27,1973.65. E. P. POPOV, V. V. BERTERO and S. CHANDRANOULI, Hystereticbehavior of steel columns, University of California at Berkeley EERC 75/11, 1975.66. E. P. POPOV, Inelastic behavior of steel bracc..c;; under cyclic loading, Proc. 2ndUS National Conf. on Earthquake Engineering, 1979.67. D. PRAGTHUANGSIT, S. C. GOEL and R. D. HANSON, "Axial hysteresisbehavior with end restraints", ASCE Strct. Div. Vol. 104 no. 6, 1978.68. G. RlEGA and F. VESTRONI, "Statistical analysis of the inelastic response ofshear structures subjected to earthquakes", EESD Vol. 12, 1984.69. C. Vo.t'. ROEDER and E. P. POPOV, "Eccentrically braced steel frames forearthquakes", ASCE Strct. Div. Vol. 104 no. 3, 1978.70. J. SAKAMOTO, Y. KOHAMA and T. YAMAZAKI, "on the dynamicbehavior of braced steel frames", Trans. AIl no. 270, 1978.71. A. SANGIOVANNI-VINCENTELLI, W. NYE and A. TITS, 'Enhancedmethods of feasible directions for engineering design problems", Journal of optimization theory and applications.72. A. SANGIOVANNI-VINCENTELLI, F. ROMEO and C. SECHEN, Researchon .simulated annealing at Berkeley, Proceedings of the 1984 International Conference on Computer Design, 1984.73. A. SANGIOVANNI-VINCENTELLI, D. MITRA and F. ROMEO, Convergence and finite time behavior of simulated annealing, Proceedings of IEEE Conference on Decision and Control, 1985.74. SEAONC, Earthquake resistant design of concentric and K-braccd frames,SEAONC, 1982.75. SEAONC, Tentative lateral force requirements and commentary, SeismologyCommittee Structural Engineers Association of California, 1985.76. R. SHEPHERD, "Multiphase cross bracing in earthquake resistant s:ructures",EESD Vol. 1, 1973.77. SINGH, Seismic behavior of braces and braced stccl frames, University ofMichigan at Ann Arbor UMEE 77Rl, 1977.78. R. SRINIVASAN and W. H. MUNSE, Fatigue damage in stccl members,ASCE-IABSE Proceedings of International Conference on Planning and Design ofTall Buildings, 1972.79. K. STEINBRUGGE, A progress report: engineering aspects of the Alaskanearthquake of March 27 1964, 3d WCEE, 1965.80. G. SUBIMANI and J. ROESSETT, "Design spectra for degrading systems",ASCE Strc:t. Div. Vol. 111 no. 12, 1985.81. H. SUGIMOTO and W. F. CHEN, "Inelastic. post buckling behavior Df tubularmembers", ASCE Strct. Div. Vol. 111 no. 9, 1985.82. H. T. SUIDAN and R. A. EUBANKS, "Cumulative fatigue damage", ASCEStrct. Div. Vol. 99 no. 5, 1973.83. K. TAKANASHI and K. OHI, Shaking table tests on 3 story braced andunbraced steel frames, 8th WCEE, 1984.84. H. TAKANE and K. TOKYAMA, A study on the earthquake resistantbehavior of steel braced frames, part 2, Proceedings of Annual Convention All no.4, 1981.

122
85. A. TANAKA, K. MORITA and H. YAMANOUCHI, Damage of braced steelframes due to the 1978 Myagiken Oki earthquake, 7th WCEE, 1980.86. X. TANG and S. C. GOEL, Seismic analysis and design considerations ofbraced steel structures, University of Michigan at Ann Arbor, 1987.87. T. TSUGAWA, Y. GOTOH, H. MORIKAWA and Y. TAKENADA, Astudy on the earthquake resistant behavior of steel frames, Proceedings of AnnualConvention AU no. 6, 1983.88. M. WAKABAYASHI and M. SHIBATA, "Ultimate strength of K-type bracedframes", Trans. AU no. 326, 1983.89. M. WAKABAYASHI, C. MATSUI, K. MINAMI and 1. MITANI, Inelasticbehavior of steel frames subjected to constant vertical and alternating horizontalloads, Annual Conference Preprints AU, 1970.90. M. WAkABAYASHI, Experiments on the elastic plastic behavior of bars subjected to cyclic axial loads, Annual Conference Preprints AIl, 1972.91. M. WAKABAYASHI, T. NONAKA, T. NAKAMURA, S. MORINO and N.YOSlllDA, Experimental studies on the behavior of steel bars under repeated axialloading, Bulletin Disaster Prevention Research Institute Kyoto University no. 16B,1973.92. M. WAKABAYASHI and M. SHIBATA, "Experimental study on the hysteretic behavior of K-type braced frames subjected to repeated load", Trans. AIl no.326, 1983.93. W. R. WALPOLE, "Concentrically braced frames", Bulletin New ZealandNational Society for Earthquake Engineering Vol. 18 no. 4, 1985.94. G. WORKMAN, The inelastic behavior of multistory braced frame structuressubjected to earthquake excitation, University of Michigan at Ann Arbor UMEE69R1, 1969.95. V. ZAYAS, S. A. MAHIN and E. P. POPOV, Cyclic inelastic behavior ofsteel offshore structures, University of California at Berkeley EERC 80/27, 1980.96. V. ZAYAS, P. B. SHLNG, S. A. MAHIN and E. P. POPOV, Inelastic structural modeling of braced offshore platforms for seismic loading, University of California at Berkeley, EERC 81104, 1981.97. G. ZOUTENDIlK, Methods of feasible directions, Elsevier Amsterdam, 1960.

123
Table 2-1: T~(41 "y values for selected steel cross-sections
&x:tien -y
W:l4x730 0.40WJ.4x145 0.39W14x22 0.33W12x336 0.40Wl2x65 0.38W12x14 0.30W1OX1l2 0.39W1OX45 0.38WIOx12 0.31
Standard Pi~ 112" 0.28Standard Pipe 12" 0.31
Extra Streng Pipe 1/2" 0.27Extra Streng Pipe 12" .0.31
IXlUble Exira Strong Pipe 2" 0.26Double Extra Strong Pipc 8" 0.29
Table 3-1: Member sizes for the various cases in the numerical simulations
0)[15tant P~
Case of flexible Beam Stiff Beam
Brace Slenderness A = 20 A = 100 A = 200 A = 20 A = 100 A = 200Beam I in" 41 58 204 410 580 2040Brace A inL 0.33 0.47 1.64 0.33 0.47 1.64
KbnlKhr 0.1 0.1 0.1 1.0 1.0 1.0
Constant Pv
Case of flexible Beam Stiff BeamBrace Slenderness A = 20 A = 100 A = 200 A = 20 A = 100 A = 200Beam I in" 41 41 41 410 410 41~
Brace A inL 0.33 0.33 0.33 0.33 0.33 ~.33
I KhalKbr 0.1 0.1 0.1 1.0 1.0 1.0
Table 4-1 Ductility ratio for pulse loading
DuctiJjtv Ratio for Pulse Looding
Case Displacement Thlctility Energy Ductility
Pm;l/Fv t/f Ratio Pma!Fv VI' Ratio1 0.6 1.0 2.830 0.5 0.1 1£f.502 0.6 1.0 3.114 0.5 0.9 171.003 0.5 0.3 1.500 0.5 0.3 8.004 0.6 1.0 2.260 0.5 0.1 1~.OO
5 0.6 1.0 1.714 0.5 0.9 29.006 0.5 0.3 1.429 0.5 0.4 1.78

124
Table 4-2 IAactility ratio for harmonic looding
Ductility Ratio for Hannonic Looding
Case Displacement Ductility Energy Ductility
Pm:l/Fv tIT Ratio PJruI/Fv tIT Ratio
1 1.0 1.0 1.596 0.4 1.0 1.3822 0.5 1.0 1.339 0.4 1.0 2.3083 0.2 1.0 1.286 0.4 1.0 1.4094 1.0 1.0 1.502 0.8 0.2 1.0405 0.4 1.0 1.156 0.4 1.0 1.1206 0.2 1.0 1.286 0.4 0.8 0.648
Table 4-3 Earthquake records used
EARlHQUAKE RE(X)RDS USEDEARlHQUAKE ABBREVIAnON RMSA (cmlsk
) Max Ace (g)ELCENTRO 1940 NS ECAON 69.31 0.348HELENA 1935 EW HE5EW 18.96 0.145OLYMPIA 1949 N86W OlA986 56.37 0.280TAFf 1952 S69E TA5269 39.98 0.179PACDlMA 1971 N34E PA7134 154.. 69 1.076PARKHELD N65E PAN65E 50.. 89 0.489
Table 4-4 ~ign strength ratio of K-braced systems
Ratio of design design strength level of K-braced system to elasto-plastic system
SNAP40 to LEPP SNAP70 to LEPP
T TJ fulll rif= 0.75 TJpWTJpf= 0.75 TJriWTJrif= 0.75 TJpWTJpf= 0.750.200 1.706 1.342 1.467 1.3400.300 1.693 1.335 1.498 1.3290.400 1.964 1.306 1.466 1.3030.500 1.653 1.354 1.370 1.3390.600 1.613 1.378 1.328 1.3750.700 1.635 1.335 1.335 1.3250.800 1.711 1.331 1.328 1.3240.900 1.802 1.294 1.466 1.2871.000 1.643 1.341 1.386 1.3311.100 1.517 1.346 1.355 1.3351.200 1.533 1.315 1.322 1.3171.300 1.548 1.316 1.402 1.3141.400 1.704 1.216 1.522 1.2271.500 1.601 1.195 1.464 1.2121.600 1.540 1.160 1.227 1.1781.700 1.359 1.219 1.331 1.2221.800 1.714 1.154 1.492 1.1801.900 1.868 1.145 1.726 1.1532.()(X} ***** 1.221 ***.* 1.221

125
Table 5-1 BRACED FRAMES SECTION SIZES
BRACED FRAMES SEcnON SIZES
CASE BEAM IC1 IC2 IC3 EC1 EC2 EC3 BRI BRl BR3
KREG W18x35 W14xl20 W14x74 W14x43 W14x43 W14x43 W14x43 W8x35 W8x31 W8x28
KSTO W18x35 W14xl20 W14x74 W14x43 W14x43 W14x43 W14x43 8.13 in2 7.21 in2 5.25 in2
KDOO W18x35 W14xl09 W14x68 W14x43 W14x43 W14x43 W14x43 6x6x5/16 6x6xt/4 5x5xt/4
KD25 W18x35 W14xl09 W14x68 W14x43 W14x68 W14x48 W14x43 W8x31 W8x31 W8x24
KS25 W18x35 W14xl09 Wl4x68 W14x43 W14x68 W14x48 W14x43 7.21 in2 7.21 in2 t.64 in2
KD50 W18x35 Wl4xl09 W14x74 W14x48 W14x90 W14x74 W14x48 W8x31 W8x31 W8x24
KS50 W18x35 W14xl09 Wl4x74 W14x48 W14x90 W14x74 W14x48 7.21 in2 7.21 in2 t.64 in2
Table 5-2 EARTHQUAKE RECDRDS USED
EARlliQUAKE RECDRDS USED
EARlliQUAKE ABBREVIATION Tstart Tend RMSA Max AceELCENIRO 1940 NS EC40N 0.92 10.92 87.49 0.50HELENA 1935 EW HE5EW 0.24 10.24 49.52 0.68OLYMPIA 1949 N86W OL4986 9.84 19.84 68.85 0.56TAFT 1952 S69E TA5269 3.48 13.48 84.60 0.44PACDIMA 1971 N34E PA7134 0.96 10.96 19.95 0.62PARKFlELD N65E PAN65E 1.66 11.66 41.64 0.59
Table 5-3 STA1ISTICS FOR KREG
SfATISTIes FOR KREG
Story Number 1 2 3 4 5 6
Story Shear Mean (k) 392.067 357.350 323.150 321.467 253.650 2lO.350
Story Shear COY 0.015 0.024 0.052 0.041 0.023 0.084
Story Drift Mean (in) 1.465 1.747 1.428 0.712 1.137 0.503
Story Drift COY 0.619 0.653 0.596 0.473 0.392 0.050
Story Energy Mean (k-in) 820.258 634.212 344.207 86.732 289.700 0.000
Story Energy COY 0.727 0.750 0.762 1.850 0.935 0.000
Brace Energy Mean (k-in) 553.030 562.073 322.308 85.752 268.447 0.000
Brace Energy COV 0.552 0.709 0.769 1.848 0.913 0.000
Column Energy Mean (k-in) 178.997 9.030 1.347 0.000 10.615 0.000
Column Energy COy 1.278 1.394 1.484 0.000 1.748 0.000
Beam Energy Mean (k-in) 88.230 63.112 20.550 0.978 10.643 0.000
Beam Energy COV 1.297 1.292 0.962 1.999 1.108 0.000
Interior Column Compression Mean (k) 751.707 685.767 505.853 312.832 197.013 «i8.518
Interior Column Compression COY 0.049 0.071 0.046 0.058 0.125 0.157
Exterior Column Compression Mean (k) 151.115 147.467 96.840 87.633 57.415 ;!6.993
Exterior Column Compression COy 0.049 0.045 0.049 0.024 0.020 0.022 I
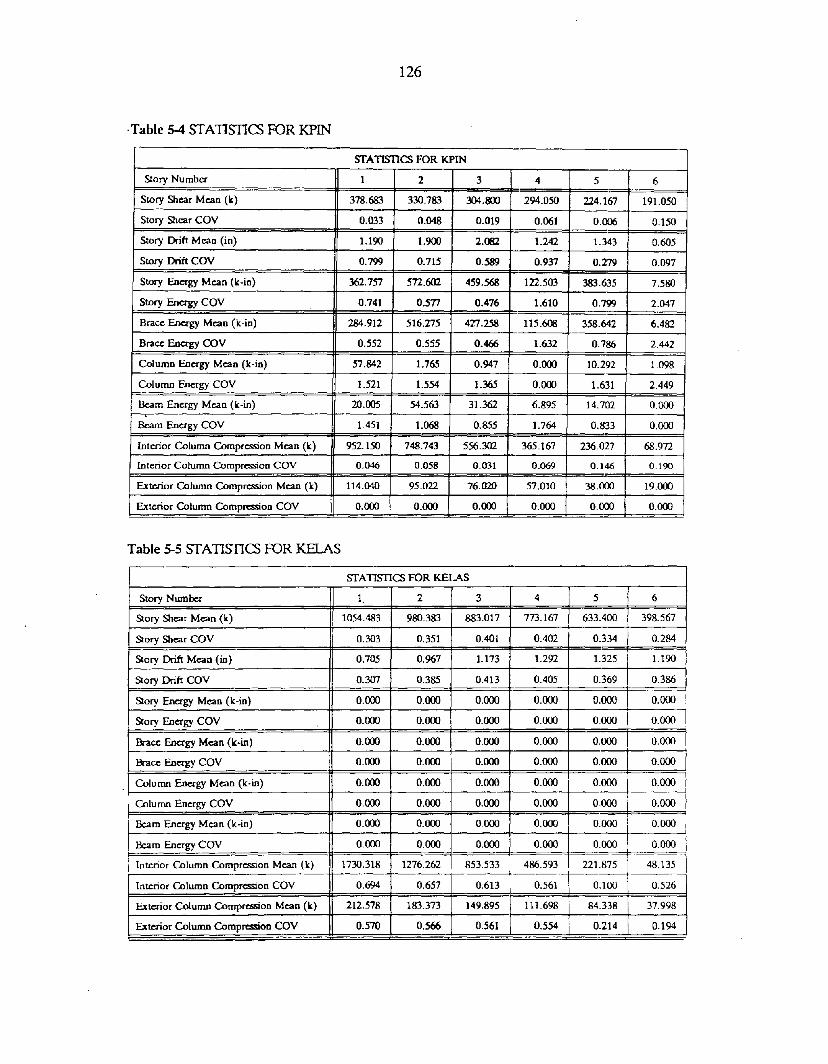
,Table 5-4 STATISTICS FUR KPIN
126
STA1lSl1CS FOR KPIN
Story Number 1 2 3 4 5 6
Story Shear Mean (k) 378.683 330.783 304.800 294.050 224.167 191.050
Story Shear COY 0.033 0.048 0.019 0.061 0.006 0.150
Story Drift Mean (in) 1.190 1.900 2.082 1.242 1.343 0.605
Story Drift COY 0.799 0.715 0.589 0.937 0.279 0.097
Story Energy Mean (k-in) 362.757 572.602 459.568 122.503 383.635 7.580
Story Energy COY 0.741 0.5n 0.476 1.610 0.799 2.047
Brace Enagy Mean (k-in) 284.912 516.275 4Z7.2.58 115.608 358.642 6.482
Brace Energy COY 0.552 0.555 0.466 1.632 0.786 2.442
Column Energy Mean (k-in) 57.842 1.765 0.947 0.000 10.292 1.098
Column Energy COY 1.521 1.554 1.365 0.000 1.631 2.449
Beam Energy Mean (k-in) 20.005 54.563 31.362 6.895 14.702 0.000
Beam Energy COY 1.451 1.068 0.&55 1.764 0.833 0.000
Interior Column Compression Mean (k) 952.150 748.743 556.302 365.167 236.027 68.972
Interior Column Compression COY 0.046 0.058 0.031 0.069 0.146 0.190
Exterior Column Compression Mean (II:) 114.040 95.022 76.020 57.010 38.000 19.000
Exterior Column Compression COY 0.000 0.000 0.000 0.000 0.000 0.000
Table 5-5 STATISTICS FUR KElAS
STA1lSl1CS FOR KELAS
Story Number 1 2 3 4 5 6
Story Shear Mean (k) 1054.483 980.383 883.017 773.167 633.400 398.567
Story Shear COY 0.303 0.351 0.401 0.402 0.334 0.284
Story Drift Mean (in) 0.705 0.967 1.173 1.292 1.325 1.190
Story Drift COY 0.307 0.3&5 0.413 0.405 0.369 0.386
Story Energy Mean (k-in) 0.000 0.000 0.000 0.000 0.000 0.000
Story Energy COY 0.000 0.000 0.000 0.000 0.000 0.000
Brace Energy Mean (k-in) 0.000 0.000 0.000 0.000 0.000 0.000
Brace Energy COY 0.000 0.000 i 0.000 0.000 0000 0.000
Column Energy Mean (k-in) 0.000 0.000 0.000 0.000 0.000 0.000
Column Energy COY 0.000 0.000 0.000 0.000 0.000 0.000
Beam Energy Mean (k-in) 0.000 0.000 0.000 0.000 0.000 0.000 I
Beam Energy COY 0.000 0.000 0.000 0.000 0.000 0.000 Ii Interior Column Compression Mean (II:) 1730.318 1276.262 853.533 486.593 221.875 48.135
Interior Column Compression COY 0.694 0.657 0.613 0.561 0.100 0.526
Exterior Column Compression Mean (II:) 212.578 183.373 149.895 111.698 84.338 37.998
Exterior Column Compression COY 0.570 0.566 0.561 0.554 0.214 0.194-

Table 5-6 SfAl1SI1CS FUR KSBM
127
STAllSIlCS FOR KSBM
Story Number 1 2 3 4 5 6
Story Shear Mean (k) 505.983 533.350 448.500 428.950 355.283 )42.767
Story Shear COY 0.030 0.056 0.025 0.023 0.009 0.127
Story Drift Mean (in) 22.585 0.483 0.900 0.650 2.938 2.573
Story Drift COY 0.666 0.104 0.218 0.200 0.387 0.453
Story Energy Meall (k-in) 5089.740 105.157 459.588 119.533 4760.144 U:25.325
Story Encrgy COV 0.675 0.396 0.533 0.482 0.530 0.602
Brace Energy Mean (k-in) 2117.975 103.532 431.668 116.233 3057.122 1~23.505
Brace Energy COV 0.367 0:392 0.509 0.474 0.533 0.602
Column Energy Mean (k-in) 2971.768 1.623 27.922 3.298 1703.027 ~O1.820
Column Energy COY 0.950 0.856 0.910 1.299 0.538 0.634
Beam Energy Mean (k-in) 0.000 0.000 0.000 0.000 0.000 0.000
Beam Energy COY 0.000 0.000 0.000 0.000 0.000 0.000
Interior Column Compll:SSion Mean (k) 794.897 533.702 . 410.647 295.475 256.327 171.517
Interior Column CDmpll:SSion COY 0.038 0.024 0.075 0.096 0.140 0.325
Exterior Column Compll:SSion Mean (k) 346.455 313.420 227.617 213.210 143.748 69.467
Exterior Column Compression COY 0.061 0.053 0.493 0.091 0.119 0.141
Table 5-7 SfAl1SllCS FUR KSID
STATISIlCS FOR KSTO
Story Number 1 2 3 4 5 6
Story Shear Mean (k) 326.117 292.583 261.200 258.450 190.900 152.983
Story Shear COY 0.034 0.039 0.048 0.064 0.041 0.088
Story Drift Mean {in) 1.463 1.905 1.653 0.742 1.162 0.422
Story Drift COY 0.659 0.663 0.662 0.633 0.142 0.083
Story Energy Mean (k-in) 658.718 638.993 388.643 98.372 341.112 2.348
Story Energy COY 0.476 0.584 0.776 1.531 0.537 2.449
Brace Energy Mean (k-in) 456.665 518.423 353.492 96.257 317.955 2.348
Brace Energy COV 0.240 0.534 0.758 1.530 0.537 2.449
Column Energy Mean (k-in) 120.307 6.557 0.532 0.000 11.212 0.000
Column Energy COY 1.375 1.215 2.449 0.000 1.150 0.000
Beam Energy Mean (k-in) 81.747 114.015 34.622 2.115 11.943 0.000
Beam Energy COy 1.044 1.010 1.078 1.555 0.964 0.000
Interior Column Compll:SSion Mean (k) 728.058 548.137 393.395 243.917 177.517 ~>6.152
Interior Column Compression COY 0.027 0.033 0.047 0.050 0.073 0.133
Exterior Column Compll:SSion Mean (k) 178.017 143.312 111.810 82.687 53.070 :~.047
Exterior Column Compression COY 0.096 0.088 0.076 0.038 0.043 0.039

Table 5-8 SfATISTICi FOR KOVER
128
STATIsnCS FOR KOVER
Story Number 1 2 3 4 5 6
Story Shear Mean (k) 500.200 459.700 418.483 412.483 366.083 285.650
Story Shear COY 0.023 0.013 0.022 0.064 0.072 0.155
Story Drift Mean (in) 1.515 1.193 1.547 0.675 0.918 0.697
Story Drift COY 1.193 0.835 0.496 0.098 0.415 0.105
Story Energy Mean (k-in) 807.202 404.418 915.430 23.038 105.477 13.977
Story Energy COY 1.011 1.115 0.918 1.587 1.510 1.044
Brace Energy Mean (k-in) 598.547 376.070 850.382 15.413 89.947 0.000
Brace Energy COY 0.816 1.060 0.872 2.449 1.676 0.000
Column Energy Mean (k-in) 173.223 2.082 60.478 0.000 2.722 0.000
Column Energy COY 1.640 2.449 1.758 0.000 2.281 0.000
Beam Energy Mean (k-in) 35.435 26.267 4.567 7.625 12.808 13.977
Beam En,ergy COY 1.551 2.012 1.617 1.822 1.122 1.044
Interior Column Comp~onMean (k) 1089.097 819.178 514.525 399.668 215.498 54.273
Interior Column Compression COY 0.057 0.078 0.493 0.068 0:185I
0.174I
Exterior Column Comp~onMean (k) 184.752 157.888 106.370 98.755 65.067 30.335
Exterior Column Comp~onCOY 0.059 0.041 0.491 0.045 0.043 0.047
Table 5-9 SfATISTICi FOR KUNDER
STATISTICS FOR KUNDER
Story Number 1 2 3 4 5 6
Story Shear Mean (k) 238.167 202.383 184.567 166.300 155.967 122.667
Story Shear COY 0.067 0.049 0.082 0.054 0.130 0.077
Story Drift Mean (in) 1.717 2.438 2.480 .1.690 1.418 0.738
Story Drift COY 0.927 0.623 0.541 0.334 0.234 0.153
Story Energy Mean (k-in) 350.682 390.297 351.050 229.983 157.993 71.573
Story Energy COY 0.702 0.239 0.207 0.212 0.355 0.320
Brace Energy Mean (k-in) 159.025 272.187 248.600 197.057 107.850 47.408
Brace Energy COY 0.267 0.301 0.283 0.290 0.473 0.551
Column Energy Mean (k-in) 105.312 11.017 3.820 2.638 4.933 0.000
Column Energy COY 1.994 0.768 1.689 2.449 1.789 0.000
Beam Energy Mean (k-in) 86.345 107.092 98.630 30.285 45.213 24.167
Beam Energy COY 0.543 0.732 0.457 0.408 0.401 0.562
Interior Column Comp~onMean (k) 460.078 378.482 300.593 217.4~ 149.017 84.693
Interior Column Compression COY 0.026 0.037 0.048 0.020 0.035 0.101
Exterior Column Comp~onMean (k) 198.660 163.325 126.072 89.237 54.830 24.182
Exterior Column Comp~onCOY 0.060 0.055 0.057 0.047 0.038 0.020

Table 5-10 SfAnsnQ; FOR KREG30
129
STATISTICS FOR KREG30
Story Number 1 2 3 4 5 6
Story Shear Mean (k) 390.033 365.317 328.050 303.000 251.467 202.933
Story Shear COy 0.033 0.014 0.021 0.083 0.048 0.074
Story Drift Mean (in) 0.973 0.807 0.430 0.518 0.808 0.482
Story Drift COy 0.783 0.780 0.042 0.235 0.387 0.066
Story Enecgy Mean (k-in) 308.220 329.292 11.962 23.390 120.638 0.000
Story Enecgy COV 1.058 1.139 1.276 1.617 0.917 0.000
Brace Energy Melin (k-in) 241.765 314.427 1.448 16.395 119.815 0.000
Brace Enecgy COV 1.067 1.146 1.589 2.449 0.915 0.000
Column Energy Mean (k-in) 44.807 6.550 0.000 0.000 0.822 0.000--
Column Energy COY 1.553 2.449 0.000 0.000 1.585 0.000
Beam Energy MellO (k-in) 21.652 8.318 10.515 6.995 0.000 0.000
Beam Enecgy COV 1.254 1.111 1.314 1.382 0.000 0.000
Interior Column Compression Mean (k) 834.752 645.988 470.018 313.050 180.695 1>1.142
Interior Column Compression COy 0.048 0.028 0.066 0.051 0.112 0.214
Exterior Column Compression Mean (k) 165.690 138.165 112.267 85.288 56.627 D.I08
Exterior Column Compression COY 0.046 0.025 0.022 0.022 0.021 0.032
Table 5-11 SfA"l1SllQ; FOR KREG70
STATISTICS FOR KREG70
Story Numbec 1 2 3 4 5 6
Story Shear Mean (k) 399.933 355.367 333.217 323.050 256.700 21)9.017
Story Shear COY 0.034 0.023 0.036 0.059 0.023 0.108
Story Drift Mean (in) 2.347 2.847 2.093 0.640 1.177 0.520
Story Drift COY 0.640 0.680 0.806 0.323 0.201 0.053 IStory Enecgy MC3IiI (k-in) 1355.280 1079.713 741.205 167.330 352.130 B.818
Story Energy COY 0.617 0.446 0.540 1.306 0.689 1.261
Brace Energy Mean (k-in) 741.725 910.625 649.900 123.630 309.902 0.000
Brace Energy COV 0.381 0.391 0.588 1.914 0.776 0.000
Column Energy MI:an (k-in) 396.920 31.535 19.412 0.000 15.020 0.000
Column Energy COV 1.102 1.101 0.950 0.000 1.124 0.000
Beam Enecgy Mean (k-in) 216.637 137.555 71.893 43.702 27.208 B.818
Beam Energy COy 0.851 1.032 0.475 0.733 0.684 1.261
Interior Column ulmpression Mean (k) 899.488 567.192 516.495 308.197 204.872 1)7.757
I interior Column ulmpression COy 0.055 0.494 0.054 0.045 0.078 0.097
Exterior Column Compression Mean (k) 180.328 124.232 116.838 87.965 57.580 D.163
Exterior Column Compression mv 0.048 0.486 0.011 0.021 0.019 0.021

Table 5-U SfATISIlQ; FOR KIXX>
130
SfATISTICS FOR KDOO
Story Number 1 2 3 4 5 6
Story Shear Mean (k) 318.833 270.583 239.083 239.717 192.700 166.983
Story Shear COY 0.025 0.033 0.028 0.033 0.061 0.129
Story Drift Mean (in) 1.258 1.832 1.662 0.838 0.928 0.475
Story Drift COY 0.748 0.594 0.541 0.560 0.179 0.099
Story Energy Mean (k-in) 470.173 760.825 614.018 160.873 143.812 2.588
Story Energy COY 0.875 0.440 0.320 1.454 0.499 2.086
Brace Energy Mean (k-in) 305.788 622.185 563.012 154.030 139.035 2.588
Brace Energy COY 0.579 0.358 0.301 1.437 0.491 2.086
Column Energy Mean (k-in) 90.538 6.803 1.192 0.000 0.322 0.000
Column Energy COY 1.664 1.422 1.575 0.000 2.229 0.000
Beam Energy Mean (k-in) 73.845 131.835 49.815 6.840 4.455 0.000
Beam Energy COY 1.289 0.997 0.627 1.8n 0.894 0.000
Interior Column Compression Mean (k) 696.538 549.583 410.738 261.648 171.145 56.098
Interior Column Compression COY 0.044 0.028 0.018 0.064 0.089 0.104
Exterior Column Compression Mean (k) 179.463 146.195 113.058 83.583 54.220 23.017
Exterior Column Compression COY o.on 0.068 0.063 0.032 0.033 0.283
Table 5-13 SfATISIlQ; FOR KD25
SfATISTICS FOR KD25
Story Number 1 2 3 4 5 6
Story Shear Mean (k) 356.350 328.083 313.700 303.667 221.217 186.300
Story Shear COY 0.057 0.026 0.053 0.088 0.022 0.123
I Story Drift Mean (in) 1.513 1.933 1.103 0.505 1.250 0.505
Story Drift COY 0.533 0.553 0.769 0.067 0.167 0.072
Story Energy ~ean (k-in) 916.402 709.848 272.175 0.515 289.655 0.000
Story Energy COY 0.640 0.531 1.189 2.449 0.528 0.000
Brace Energy Mean (k-in) 570.803 620.608 256.132 0.515 268.357 0.000
Brace Energy COY 0.273 0.489 1.196 2.449 0.548 0.000
Column Energy Mean (Ie-in) 205.497 3.105 0.000 12.068I
0.000 I 0.000
Column Energy COY 1.435 2.0n 0.000 0.000 1.161I
0.000I
Beam Enagy Mean (k-in) 140.100 86.135 16.042 0.000 9.2..10 0.000
Beam Energy COY 1.187 1.034 1.208 0.000 0.683 : 0.000
Interior Column Compression Mean (k) 825.292 634.988 451.170 272.965 183.550 ! 59.757
Interior Column Compression COY 0.060 0.046 I 0.036 0.032 0.124I 0.064
Exterior Column Compression Mean (k) 178.952 145.410 117.565 89.138 57.818 27.325
Exterior Column Compression COY 0.047 0.037 0.021 0.027 0.02.5 0.026

Table 5-14 SfATISIlCS FOR KS25
131
SfATISIlCS FOR KS25
Story Number 1 2 3 4 5 6
Story Shear MeaJ~ (k) 301.867 274.517 251.083 235.067 186.500 135.550
Story Shear COV 0.051 0.043 0.059 0.106 0.055 0.110
Story Drift Mean (in) 1.375 1.950 1.667 0.673 1.128 0.417
Story Drift COY 0.623 0.564 0.696 0.645 0.155 0.078
Story Energy Meln (k-in) 610.935 724.6lJ7 367.643 78.382 269.413 2.m
Story Energy COY 0.420 0.249 0.898 1.579 0.399 2.066
Brace Energy Mean (k-in) 429.552 603.638 331.288 76.835 252.530 2.m
Brace Energy COY 0.152 0.188 0.891 1.577 0.412 2.066
Column Energy Mean (k-in) 95.822 0.032 1.980 0.000 8.413 0.000
Column Energy COY 1.644 2.449 1.388 0.000 1.191 0.000
Beam Energy Mean (k-in) 85.560 120.937 34.373 1.547 8.468 0.000
Beam Energy COY 0.892 0.906 1.122 1.771 0.833 0.000
Interior Column Comprasion Mean (k) 673.452 531.357 379.770 228.915 172.263 59.160
Interior Column Comprasion COY 0.035 0.049 0.070 0.042 0.039 0.098
Exterior Column Comprasion Mean (k) 182.170 145.822 111.650 83.523 53.460 25.168
Exterior Column Comprasion COY 0.090 0.088 0.071 0.037 0.032 0.027
Table 5-15 SfA'IlSIlCS FOR KD50
SfAllSflCS FOR K050
Story Number 1 2 3 4 5 6
Story Shear Mean (k) 362.833 323.033 310.633 318.067 229.367 11:5.883
Story Shear COY 0.026 0.041 0.073 0.086 0.054 0.129
Story Drift Mean (in) 1.318 1.850 1.420 0.673 1.270 0.488
Story Drift COY 0.591 0.543 0.499 0.416 0.184 0.075
Story Energy Meal~ (k-in) 736.198 724.198 39O.lm 87.970 290.075 0.113
Story Energy COY 0.712 0.584 0.774 1.599 0.545 2.449
Brace Energy Mean (k-in) 480.262 620.028 365.650 85.027 266.052 0.113
Brace Energy COV 0.416 0.510 0.766 1.615 0.563 2.449
Column Energy Mean (k-in) 140.460 2.095 0.000 0.000 11.610 0.000
Column Energy COY 1.597 1.755 0.000 0.000 1.586 0.000
Beam Energy Mean (k-in) 115.477 102.073 25.153 2.943 12.417 0.000
Beam Energy CO" 1.285 1.254 0.996 2.066 0.789 0.000
Interior Column Comprasion Mean (k) 829.278 644.832 464.260 274.330 183.890 CiS.l00
·Interior Column Comprasion COY 0.044 0.042 0.049 0.040 0.078 0.129
Exterior Column Comprasion Mean (k) 185.362 150.478 120.665 90.710 58.840 :!7.517
Exterior Column Compression COY 0.052 0.041 0.023 0.028 0.028 0.026

Table 5-16 SfA11SIlCS FOR KS50
132
SfATISI1CS FOR KSSO
Story Number 1 2 3 4 5 6
Story Shear Mean (k) 309.150 278.533 254.333 236.783 191.250 140.050
Story Shear COY 0.058 0.062 0.051 0.093 0.060 0.110
Story Drift Mean (in) 1.232 1.830 1.598 0.923 1.035 0.397
Story Drift COY 0.648 0.619 0.719 0.621 0.128 0.063
Story F..neI'gy Mean (k-in) 553.~ 745.598 389.192 167.635 256.153 0.618
Story F..neI'gy COY 0.502 0.283 0.840 1.175 0.436 1.815
Brace F..neI'gy Mean (k-in) 394.885 613.228 343.995 159.182 246.613 0.618
Brace Energy COY 0.240 0.197 0.818 1.174 0.437 1.815
Column Energy Mean (k-in) 75.927 0.000 0.000 0.000 0.640 0.000.
Column Energy COY 1.912 0.000 0.000 0.000 2.070 0.000
Beam Energy Mean (k-in) 83.095 132.370 45.198 8.453 8.898 0.000
Beam Energy COY 1.042 1.030 1.188 1.245 0.871 0.000
Interior Column Compression Mean (k) 665.612 530.492 384.417 232.592 170.722 61.465iI
Interior Column Compression COY 0.049 0.052 0.046 0.076 0.053 0.175
Exterior Column Compression Mean (k) 187.733 152.822 117.282 85.605 54.158 25.368
Exterior Column Compression COY 0.074 0.085 0.073 0.034 0.029 0.029
Table 5-17 SfA11SIlCS FOR KPRO
srATISI1CS FOR KPRO
Story Number 1 2 3 4 5 6
Story Shear Mean (k) 389.900 344.800 303.600 260.617 214.833 145.917
Story Shear COY 0.032 0.063 0.050 0.029 0.024 0.134
Story Drift Mean (in) 1.453 1.485 1.383 1.325 1.393 0.923
Story Drift COY 0.977 1.052 0.912 0.400 0.311 0.277
Story Energy Mean (k-in) 493.018 442.255 362.562 488.540 470.292 192.705
Story Energy COY 0.994 1.022 1.276 0.624 0.788 1.187
Brace Energy Mean (k-in) 346.057 385218 316.042 454.575 421.620 184.827
Brace Energy COY 0.685 0.892 1.261 0.615 0.764 1.150
Column Energy Mean (k-in) 104.945 4.387 8.865 1.385 23.113 0.468
Column Energy COY 1.933 2.153 1.550 1.572 1.623 2.449
Beam Energy Mean (k-in) 42.020 52.650 37.655 32.578 25.557 7.412
Beam Energy COY 2.042 2.169 1.363 0.767 1.057 2.147
Interior Column Compression Mean (k) 784.925 578.150 411.722 262.752 155.093 90.493
Interior Column Compression COY 0.065 0.053 0.030 0.055 0.070 0.253
Exterior Column Compression Mean (k) 187.337 157.153 126.940 94.282 60.375 27.862
Exterior Column Compression COY 0.095 0.098 0.074 0.050 0.034 0.032

Table 5-18 Total Energy DissiJXltion Statistics
133
Total Enecgy Dissipation Statistics
Columns Beams Frame Braces Totll1
CASE Total (in-k) Ratio Total (in-k) Ratio Total (in-k) Ratio Total (in-k) Ratio Tot,l1 (in-k)
KREG 199.988 0.Q78 183.511 0.072 383.498 0.150 1791.609 0.850 21~'5.107
KPIN 71.942 0.032 127.525 0.060 199.468 0.092 1709.178 0.908 1908.646
KELAS 0.000 0.000 0.000 0.000 0.000 0.000 0.000 0.000 0.000
KSBM 5109.459 0.339 0.000 0.000 5109.459 0.339 7250.Q32 0.661 123~;9.491
KSrO 138.606 0.055 244.441 0.100 383.048 0.154 1745.142 0.846 21"8.189
KOVER 238.504 0.084 100.682 0.037 339.186 0.121 1930.358 0.879 2U,l}.544
KUNDER 127.721 0.068 391.732 0.248 519.452 0.316 1032.128 0.684 15~ 1.580
KREG30 52.180 0.056 47.478 0.042 99.657 0.098 693.844 0.902 7S3.501
KREG70 462.885 0.109 530.814 0.128 993.698 0.237 2735.779 0.763 37"9.478
KDOO 98.854 0.033 266.795 0.106 365.649 0.139 1786.641 0.861 21~2.290
KD25 220.670 0.Q78 251.504 0.092 472.174 0.169 1716.414 0.831 2HS.588
KS25 106.246 0.040 250.887 0.108 357.133 0.148 1696.620 0.853 2~3.753
KD50 154.164 0.051 258.061 0.095 412.225 0.146 1817.130 0.854 2~9.355
KS50 76.567 0.025 278.013 0.115 354.580 0.140 1758.525 0.860 2113.105
KPRO 143.164 0.073 197.872 0.065 341.036 0.139 2108.340 0.861 24<9.376 i
Table 6-1 Earthquake records used
Table 6-1; Earthquake records
Record Abbreviation (Vjt)max II (vJmax []El Centro 1940 NS EC40NS' 0.145 0.579
El Centro 1940 EW EC40EW 0.117 0.446
El Centro 1934 NS EC34NS 0.197 0.449
El Centro 1934.EW EC34EW 0.288 0.551
El Centro 1940 NS EC40NS 0.145 0.579
Helena 1935 EW HE35EW 0.197 0.787
Olympia 1949 N86E OLA986 0.162 0.647
Parkfield 1940 N65E PAN65E 0.171 0.683

134
Table 6-2-a: Summary d results for the El Centro set
Table 6-2-a Summary of results for the El Centro set
~ase ::>riginal bptimal
~tory 1 2 3 4 1 2 3 4
Column [ (in4) 1530 796 723 723 104 352 480 480
Beam [(in4) 612 612 612 612 582 582 582 582
Brace A (in2) 9.36 9.36 9.36 9.36 6.33 5.00 4.97 4.96
Brace A 78 72 72 72 79 72 72 72
:story Strength (k) 387 517 509 431 232 263 275 242
~tory Stiffness (klin) 963 1170 1150 975 584 590 622 547
Period (s) O.~ 0.0945 0.0551 0.032 0.3&: 0.122 0.0691 0.058
KflKbrh 0.141 0.365 0.342 0.138 0.02 0.28S 0.367 0.205
Km!Kt,..)v 0.09C 0.402 0.401 0.232 0.09~ 0.501 0.544 0.402
limit State II Mean Peak values and corresponding yidd values
Column Mma,.(k-in 472 249 248 398 427 208 279 409
Column My(k-in) 8241 4335 4029 4029· 547 1770 2644 2686 i
~ Mma,,(k-in) 8U56O ~95/575 533/528 4001548 41/844 79/587 479/522 ~/495
Beam ~(k-in) 2923 2923 2923 2923 2816 2816 2816 2816
Brace P max( k) 82 77 64 50 82 69 58 48
Brace Pc(k) 275 284 284 i84 184 152 151 151
~tory ~(in) O.OS(] 0.075 0.073 0.059 0.111 0.15~ 0.160 0.138
~tory £\n(in) 0.864 0.756 0.756 0.756 I 0.864 0.75<' 0.756 0.756
~imit state III mean peak energy dissipation demand and allowable values
Column E.ma,.(k-in) 0 0 0 . 0 0 0 0 0
tolumn E,.n(k-in) 152 68 68 68 8 28 44 44
Beam Emax(k-in) 0 0 0 0 0 0 0 0
Beam E,.n(k-in) 44 44..
44 44 30 30 30 30
6race Emax(k-in) 0 0 0 0 52 23 0 0
Brace E,.n(k-in) 157 145 145 145 106 77 77 77i

135
Table 6-2-b: Summary ci results for the mixed set
Table 6-2-b Summary of results for the milled set
Case :Aiginal PPtimaJ
Story 1 2 3 4 1 2 3 4
Column I (in4) 1530 796 723 723 153 356 566 566
~I (in4) 612 612 612 612 595 595 595 595
~race A (in2) 9.36 9.36 9.36 9.36 12.05 6.59 5.57 6.26
~race A 78 72 72 72 107 73 72 '/2
~tory Strength (k) 387 517 509 431 361 328 311 293
~tory Stiffness (klin) 963 1170 1150 975 1101 742 705 664
Period (s) 0.254 0.094~ 0.0551 0.032 0.32~ 0.101 0.0591 0.0490
K0<tth 0.141 0.365 0.342 0.138 0.01 O.23ol 0.382 0.159
Km/Ktt)v 0.090 0.402 0.401 0.232 0.05~ 0.43, 0.576 0.516
limit State n Mean Peak values and corresponding yidd values
Column Mma,,(k-i.n 666 281 286 433 495 201 323 4<.7
p>lumn M/k-in) 8241 4335 4029 4029 767 1786 3185 3US
~Mma,,(k-in) 57/560 33/576 ~77/528 33/548 091900 ~511634 ~79/622 447/516
Beam Mjk-in) 2923 2923 2923 2923 2864 2864 2864 28t4
Brace Pmax(k) 110 100 86 70 100 80 68 t6
Brace PeCk) 275 284 284 284 285 199 169 ISO
story Amax(in) 0.121 0.111 0.133 0.128 0.08 0.134 0.193 0.203
~tory ~(in) O.~ 0.756 0.756 0.756 O.~ 0.756 0.756 0.756
limit state In mean peak energy dissipation demand and allowable values
Column Emax(k-in) 12.7 0 0 0 9.0 27.1 8.9 0
Column Ean(k-in) 152 68 68 68 13 26 54 54
Beam Emax(k-in) 34.3 9.8 0 0 49.7 30.4 0 0
~m Ean(k-in) 44 44 44 44 42 42 42 42
~race Emax(k-in) 221 0 0 0 178 98 0 0
~race Ean(k-in) 157 145 145 145 202 102 86 97
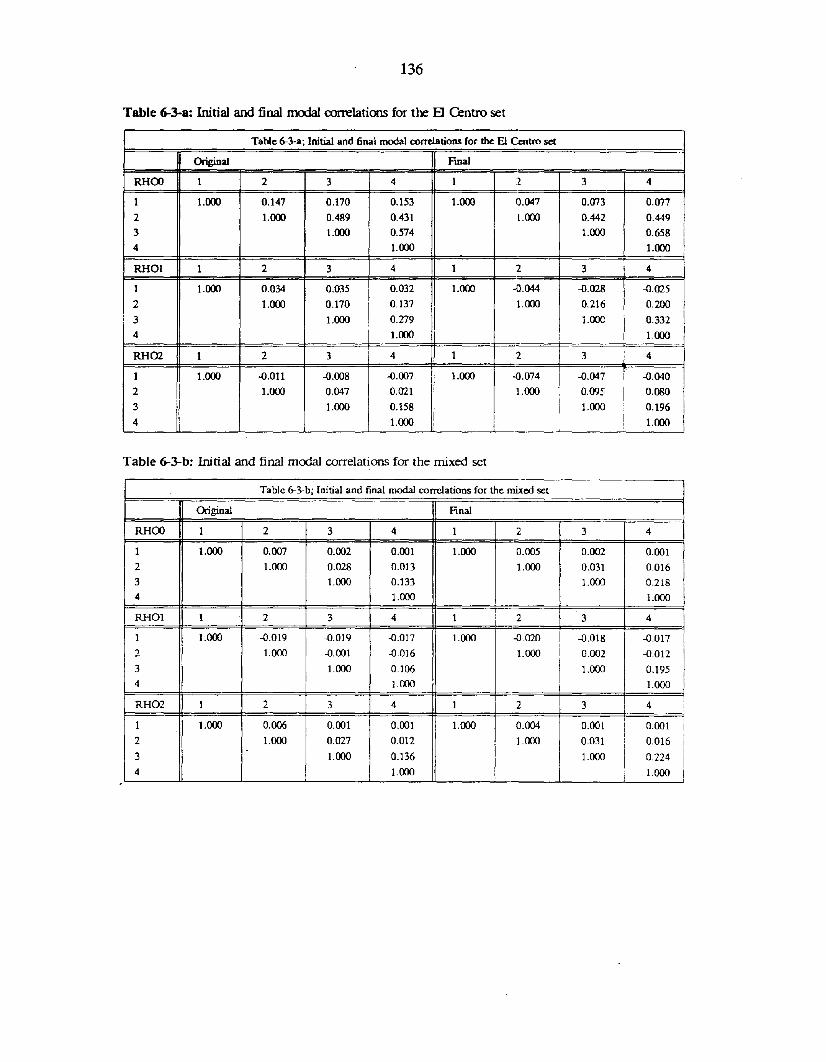
136
Table ~3-a: Initial and final modal correlations for the E Centro set
Table 6-l-a; Initial and final modal correlations for the El Centro set
Original Fmal
RHCXl 1 2 3 4 1 2 3 4
1 1.000 0.147 0.170 0.153 1.000 0.047 0.073 0.077
2 1.000 0.489 0.431 1.000 0.442 0.449
3 1.000 0.574 1.000 0.658
4 1.000 1.000
RHOI 1 2 3 4 1 2 3 4
1 1.000 0.034 0.035 0.032 1.000 -0.044 -0.028 -0.025
2 1.000 0.170 0.137 UXX) 0.216 0.200
3 1.000 0.279 1.000 0.332 I4 1.000 1.000
RH02 1 2 3 4 1 2 3 4
1 1.000 -0.011 -0.008 -0.007 1.000 -0.074 -0.047 -0.040
2 1.000 0.047 0.021 1.000 0.095 0.080
3 1.000 0.158 1.000 0.196
I4 1.000 1.000
Table ~3-b: Initial and final modal correlations for the mixed set
Table 6-l-b; Initial and final rnodaI correlations for the mixed set
Original Final
RHOO 1 2 3 4 1 2 3 4
1 1.000 0.007 0.002 0.001 1.000 0.005 0.002 0.001
2 1.000 0.028 0.013 1.000 0.031 0.0163 1.000 0.133 1.000 0.2184 1.000 1.000
RHOl 1 2 3 4 1 2 3 4
1 1.000 -0.019 -0.019 -0.017 1.000 -0.020 -0.018 -0.017I
2 1.000 -0.001 -0.016 1.000 0.002 -0.012
I3 1.000 0.106 1.000 0.1954 1.000 1.000 iRH02 1 2 3 4 1 2 3 I 4 i
1 1.000 0.006 0.001 0.001 1.000 0.004 0.001 ! 0.001
2 1.000 0.027 0.012 1.000 0.031 i 0.016
3 1.000 0.136 1.000 I 0.224
4 I 1.000 I 1.000

137
Table 6-4: Deterministic optimization pmuncters
Detenninistic ol!imization rmarneters
Svmbol Value ~ription
GoocCCaihol 25000 Good vdume (in3)
Bad Ca>tvol. 85000 Bad vdume (in3)
Limit State I coostraint prrameters
Svmbol Value IXscription
GoOO_CoIax 0.500 Good gravity column axial force factorBad_CoIax 0.600 Bad gravity column axial force factol"GoOO_CoIgra 0.600 Good gravity column moment factOlBad_CoIgra 0.800 Bad gravity column momcnt factorGoOO_Girgra 0.600 Good gravity girder moment factorBad_Girgra 0.800 Bad gravity girder moment factorGoOO_Bragra 0.950 Good gravity brace axial force factOlBad Bragra 1.000 Bad gravity brace axial force factor
GoOO_Girdef 1/240 Good girder midspan deflection latioBad Girdef 1/220 Bad ~rder midspan deflection ratio
Limit State II con<;traint parameters
Svmbol Value ~ription
GoOO_CoIy1d 0.850 Good mooerate column yield factorBad_CoIy1d 1.100 Bad mooerate column yield factorGoOO_Giryld 0.900 Good mooerate girder yield factorBad Giryld 1.100 Bad mooerate girder yield factorGoOO_Drift 4.50e-3 Good mooerate maximum story driftBad Drift 8.00e-3 Bad mooerate m;u.;mum storY drift
Limit State ill constraint parameters
Svmbol Value. ~riPtion
GoOO_CoIduc 3.000 Good column energy ductilityBad_CoIduc 4.000 Bad column energy ductilityGoOO_GirdUic 4.000 Good girder energy ductilityBad_Girduc 6.000 Bad girder energy ductilityGoOO_Braduc 1.000 Good brace energy ductilityBad Braduc 2.000 Bad brace energy ductility
GoOO_Sway 1.4e-2 Good maximum swayBad Sway 2.0c-2 Bad maximum sway

Table 6-5: Probabilistic optimization parameters
138
Probabilistic ortimization oarametersSVrnlxJI Value D::scriori00
HigILCdmcprob 0.200 High column axial force factorLow_Colax...prob 0.100 Low coIunm axial force factorHigILCdgnLprob 0.200 High column moment factorLow_Colgr<Lprob 0.100 Low column moment factorHigILGirgra-PTob 0.200 High girder moment factorLow_Girgm..prob 0.100 Low girder moment factorHigILBragrcWJr<X> 0.200 High brace axial force factorLow Bra!!l"a moo 0.100 Low brace axial force factor
HigILGirdeLprab 0.200 High girder midspan deflection ratioLow Girdef_Proo 0.100 Low girder midspan deflection ratio
HigILCdyld-JX"Ob 0.200 High moderate column yield factorLow_Colyld~rob 0.100 Low mooerate column yield factorHigh_Giryld_prob 0.200 High mooerate girder yield fa~or
Low_GirYld _Drab 0.100 Low mcderate girder yield factor
High_Drift~rob 0.200 High mooerate maximum story driftLow Drift J)rab 0.100 Low mcderate maximum story drift
High_Cdduc~ab 0.200 High column energy ductilityLow_Colduc_prob 0.100 Low column energy ductilityHigh_Girduc_JYob 0.200 High girder energy ductilityLow_Girduc-Pfob 0.100 Low girder energy ductilityHigh_Braduc_prob 0.200 High brace energy ductilityLow Braduc _Pl'ob 0.100 Low brace energy ductility
High_S\\'ay~rab 0.200 High maximum swayLow SwaY_Drab 0.100 Low maximum S\\'aY
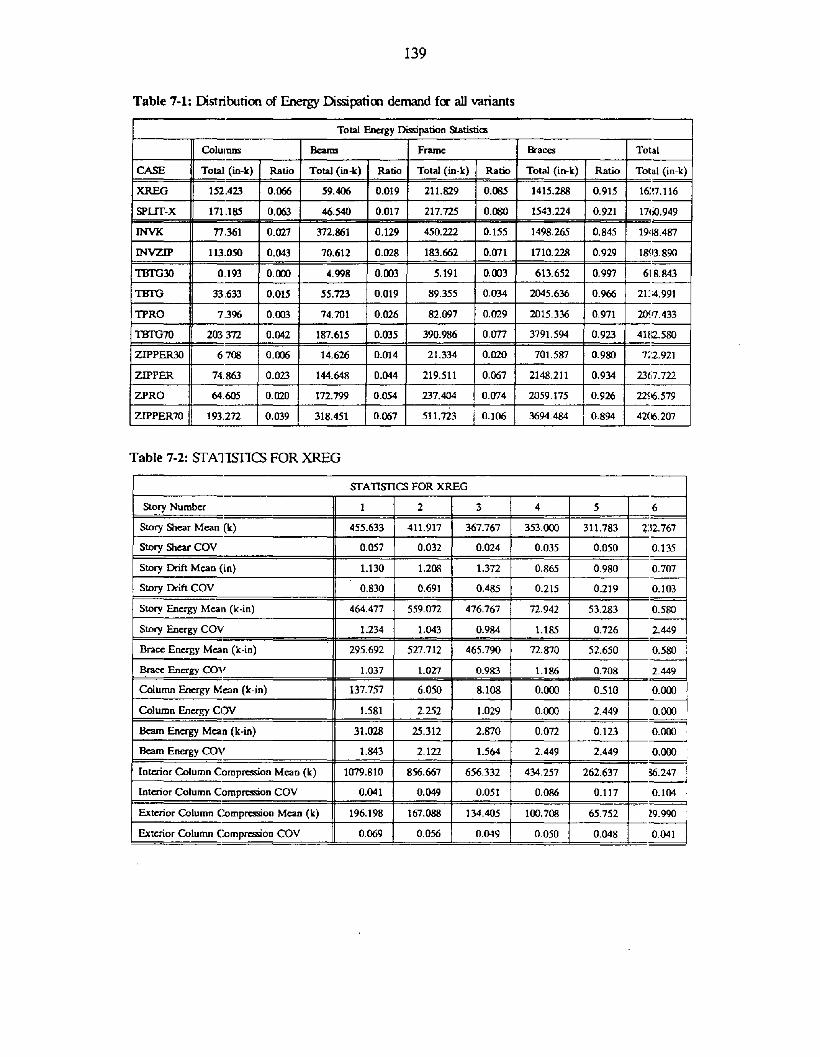
139
Table '-I: Distribution of Energy Dissi~tim demand fer all variants
Total Energy Dimpation Statistics
Columns Beams Frame Braccs Total
CASE Total (in-k) Ratio Total (in-k) Ratio Total (in-k) Ratio Total (in-k) Ratio Total (in-k)
XREG 152.423 0.066 59.406 0.019 211.829 0.085 1415.288 0.915 16:a.116
SPLIT-X 171.185 0.063 46.540 0.017 217.725 O.~ 1543.224 0.921 17CiO.949
INVK 77.361 0.027 372.861 0.129 450.222 0.155 1498.265 0.845 1948.487
rNVZIP 113,050 0.043 70.612 0.028 183.662 0.071 1710.228 0.929 1893.890
11JTG30 0.193 O.lXXl 4.998 0.003 5.191 0.003 613.652 0.997 618.843
11JTG 33,633 0.015 55.723 0.019 89.355 0.034 2045.636 0.966 21:14.991
TIRO 7.396 0.003 74.701 0.026 82.097 0.029 2015.336 0.971 2097.433
11JTG7O 203372 0.042 187.615 0.035 390.986 o.ern 3791.594 0.923 411:2.580
ZIPPER30 6708 0.006 14.626 0.014 21.334 0.020 701.587 0.980 7:2.921
ZIPPER 74863 0.023 144.648 0.044 219.511 0.067 2148.211 0.934 2367.722
ZPRO 64605 0.020 172.799 0.054 237.404 0.074 2059.175 0.926 2296.579
ZIPPER70 193,272 0.039 318.451 0.067 511.723 0.106 3694.484 0.894 42(16.207
Table '-2: STA11STICS FOR XREG
SfAllSTICS FOR XREG
Story Number 1 2 3 4 5 6
Story Shear Mean (k) 455.633 411.917 367.767 353.000 311.783 2:12.767
Story Shear COY 0.057 0.032 0.024 0.035 0.050 0.135
Story Drift Mean (in) 1.130 1.208 1.372 0.865 0.980 0.707
Story Drift COY 0.830 0.691 0.485 0.215 0.219 0.103
Story Energy Mean (k-in) 464.477 559.072 476.767 72.942 53.283 0.580
Story Energy COV 1.234 1.043 0.984 1.185 0.726 2.449
Brace Energy Mean (k-in) 295.692 527.712 465.790 72.870 52.650 0.580
Bra= Energy COV 1.037 1.027 0.983 1.186 0.708 2.449
Column Energy Mean (k-in) 137.757 6.050 8.108 0.000 0.510 0.000
Column Energy COY 1.581 2.252 1.029 0.000 2.449 0.000
Beam Energy Mean (k-in) 31.028 25.312 2.870 0.072 0.123 0.000
Beam Energy COV 1.843 2.122 1.564 2.449 2.449 0.000
Interior Column Compression Mean (k) 1079.810 856.667 656.332 434.257 262.637 g(j.247
Interior Column Compression COY 0.041 0.049 0.051 0.086 0.117 0.104
Exterior Column Compression Mean (k) 196.198 167.088 134.405 100.708 65.752 29.990
Exterior Column Compression COy 0.069 0.056 0.049 0.050 0.048 0.041

Table 7-3: SfAusnCS FOR INVK
140
SfATISIlCS FOR INVK
Story Numbec 1 2 3 4 5 6
Story Shear Mean (Ie) 430.450 384.000 351.033 331.100 276.050 231.633
Story Shear COY 0.055 0.010 0.025 0.077 0.030 0.198
Story Drift Mean (in) 0.642 2.247 2.248 0.718 0.955 0.663
Story Drift COY 0.325 0.714 0.666 0.184 0.304 0.083
Story Energy Mean (Ie-in) 294.050 981.642 542.410 38.395 91.425 0.562
Story Energy COY 1.308 0.660 0.656 2.248 1.128 2.449
Brace Energy Mean (Ie-in) 144.608 7rJl.232 526.818 33.158 85.885 0.562
Brace Energy COY 0.990 0.471 0.651 2.445 1.120 2.449
Column Energy Mean (Ie-in) 5.767 53.898 12.158 0.000 5.540 0.000
Column Energy COY 1.146 1.771 1.231 0.000 1.470 0.000
Beam Energy Mean (k-in) 143.677 220.510 3.433 5.238 0.000 0.000
Beam Energy COY 1.666 1.306 2.440 1.276 0.000 0.000
Interior Column Compression Mean (Ie) 1096.777 833.623 627.368 465.262 282.185 148.808
Interior Column Compression COY 0.059 0.034 0.070 0.075 0.079 0.203
Exterior Column Compression Mean (k) 192.002 160.933 127.617 96.385 63.532 29.488
Exterior Column Compression COY 0.066 0.057 0.031 0.031 0.031 0.028
Table 7-4: SfATISTICS FOR SPUf-X
srATISTICS FOR SPLIT-X
Story Number 1 2 3 4 5 6
Story Shear Mean (k) 452.450 409.367 366.383 352.100 311.317 255.300
Story Shear COY 0.072 0.040 0.040 0.042 0.058 0.104
Story Drift Mean (in) 1.180 1.192 1.260 0.785 1.023 0.697
Story Drift COY 0.798 0.690 0.324 0.242 0.168 0.065
Story Energy Mean (k-in) 754.818 236.462 606.347 14.652 148.675 0.000
Story Energy COY 0.912 1.1rJl 0.800 2.457 0.249 0.000
Brace Energy M~n (k-in) 581.005 214.752 586.538 13.333 147.595 0.000
Brace Energy COY 0.774 1.059 0.770 2.457 0.249 0.000
Column Energy Mean (k-in) 146.203 5.355 17.228 1.318 1.080 0.000
Column Energy COY 1.615 2.136 1.820 2.449 1.255 0.000
Beam Energy Mean (k-in) 27.608 16.352 2.580 0.000 0.000 0.000
Beam Energy COY 1.693 1.880 1.712 I 0.000 0.000 0.000
Interior Column Compression Mean (k) 1011.582 957.528 ! 610.242 I 5$.227 260.995 221.133!
Interior Column Compression COY 0.074 0.074 0.046 I 0.046 0.083 0.092 !
Exterior Column Compression Mean (k) 192.357 163.158 I 131.918 101.170 66.250 30.872
Exterior Column Compression COY 0.056 0.036 i 0.044 0.041 0.034 I 0.027

Table 7-5: SfAl1SI1CS FOR TBTG
141
STATISTICS FOR TBTG
Story Number 1 2 3 4 5 6
Story Shear Mean {It) 443.500 399.950 345.117 333.650 277.883 219.533
Story Shear COY 0.070 0.066 0.038 0.036 0.049 0.Q75
Story Drift Mean (in) 0.807 1.100 1.135 1.048 0.992 0.782
Story Drift COy 0.650 0.518 0.463 0.228 0.207 0.176
Story Energy Meal] (It-in) 413.542 580.232 513.398 319.697 225.378 f:2.745
Story Energy coV 0.7OS 0.712 0.652 0.667 0.511 0.581
Brace Energy Mean (It-in) 364.593 558.033 504.678 313.600 222.407 1:2.333
Brace Energy COV 0.664 0.688 0.650 0.658 0.496 0.577
Column Energy Mean (It-in) 31.863 1.452 0.000 0.000 0.318 0.000
Column Energy COy 1.672 2.449 0.000 0.000 1.624 0.000
Beam Energy Mean (It-in) 17.088 20.748 8.721 6.095 2.655 0.410
Beam Energy COV 1.556 1.866 1.405 1.183 1.811 1.915
Interior Column Compression Mean (It) 88S.80S 676.410- 529.132 345.377 230.470 mussInterior Column Compression COy 0.038 0.021 0.042 0.038 0.083 0.222
Exterior Column Compression Mean (It) 190.735 162.017 130.303 95.867 61.708 :!7.925
Exterior Column Compression COy 0.096 0.091 0.094 0.085 0.051 0.027
Table 7-6: SfA1l1STICS FOR INVZIP
STATISTICS FOR INVZIP
Story Number 1 2 3 4 5 6
Story Shear Mean (It) 446.633 394.767 348.633 328.633 266.067 212.733
Story Shear COy 0.062 0.034 0.027 0.041 0.047 0.101
Story Drift Mean (in) 0.990 1.123 1.267 1.143 1.115 0.993
Story Drift COy 0.785 0.430 0.487 0.250 0.263 0.262
Story Energy Mean (It-in) 357.913 449.595 477.700 302.365 220.400 85.918
Story Energy COV 1.246 0.801 0.774 0.960 1.104 0.779
Brace Energy Mean (It-in) 245.322 423.137 452.630 291.030 212.~65 85.747
Brace Energy COV 1.145 0.760 0.773 0.983 1.113 0.778
Column Energy Mean (It-in) 98.548 6.992 4.977 0.723 1.643 0.172
Column Energy COY 1.504 2.173 1.928 2.449 1.629 1.936
Beam Energy Mean (It-in) 14.045 19.465 20.097 10.612 6.390 0.000
Beam Energy COV 1.618 1.670 1.423 1.156 1.594 0.000
Interior Column Compression Mean (It) 1188.157 917.203 667.793 456.497 281.627 124.965
Interior Column Compression COY 0.101 0.099 0.107 0.154 0.128 0.085
Exterior Column Compression Mean (It) 210.821 180.345 145.438 107.412 70.047 31.735
Exterior Column Compression COy 0.084 0.084 0.083 0.082 0.083 0.085

Table 7-7: SfATISTICS FOR ZIPPER
142
STAllSIlCS FOR ZIPPER
Story Number 1 2 3 4 5 6
Story Shear Mean (It) 380.600 348.717 315.633 305.583 200.767 210.167
Story Shear COV 0.105 0.037 0.036 0.062 0.117 0.150
Story Drift Mean (in) 1.068 1.208 1.210 1.098 1.097 0.915
Story Drift COy 0.563 0.437 0.382 0.439 0.444 0.528
Story Energy Mean (It-in) 625.900 612.313 454.847 340.283 218.915 115.465
Story Energy COY 0.469 0.582 0.618 0.614 0.600 0.875
Brace Energy Mean (It-in) 506.405 576.632 429.513 321.210 2CJ7.235 lCJ7.222
Brace Energy COY 0.351 0.553 0.587 0.584 0.583 0.842
Column Energy Mean (It-in) 73.837 0.323 0.000 0.000 0.000 0.700
Column Energy COy 1.4CJ7 2.449 0.000 0.000 0.000 2.449
Beam Energy Mean (It-in) 45.655 35.358 25.335 19.075 11.680 , 7.543!I
Beam Energy COY 1.257 1.383 1.412 1.393 1.457 1.508
Interior Column Compression Mean (It) 861.925 69O.4fIJ 525.570 352.205 225.320 101.913
Interior Column Compression COY 0.046i
0.054 0.055 0.125 0.109 0.265
Exterior Column Compression Mean (It) 187.130 134.758 108.790 96.942 62.202 28.103
Exterior Column Compression COY 0.119 0.478 0.504 0.097 0.088 0.064
Table 7-8: SfATISTICS FOR 1BTG30
STA1lSIlCS FOR TBTG30
Story Number 1 2 3 4 5 6
Story Shear Mean (It) 405.333 373.633 335.433 316.767 265.550 199.867
Story Shear COy 0.031 0.034 0.015 0.052 0.062 0.111
Story Drift Mean (in) 0.420 0.642 0.742 0.707 0.687 0.533
Story Drift COy 0.342 0.391 0.376 0.323 0.149 0.098
Story Energy Mean (It-in) 103.298 169.648 166.962 93.002 65.760 20.173
Story Energy COy 0.797 1.063 1.126 1.235 1.057 1.671
Brace Energy Mean (It-in) 102.320 169.202 165.370 93.002 63.588 20.173
Brace Energy COY 0.782 1.059 1.117 1.235 1.039 1.671
Column Energy Mean (It-in) 0.193 0.000 0.000 0.000 0.000 0.000 II
Column Energy COy 2.449 0.000 0.000 0.000 0.000 0.000
Beam Energy Mean (It-in) 0.787 0.447 1.593 0.000 2.172 0.000
Beam Energy COY 2.449 2.449 2.221 0.000 1.629 0.000
Interior Column Compression Mean (It) 847.433 669.595 498.113 317.062 175.532 64.518
Interior Column Compression COy 0.035 0.020 0.014 0.062 0.197 0.312
Exterior Column Compression Mean (It) 170.815 145.242 117.277 87.655 57.757 26.842
Exterior Column Compression COy 0.071 0.060 0.033 0.010 0.021 0.026

Table 7-9: SfATISTICS FOR ZlPPER30
143
SfATISIles FOR ZIPPER30
Story Numbec 1 2 3 4 5 6
Story Shear Mean (k) 368.567 346.933 320.900 296.667 246.683 194.067
Story Shear COY 0.012 0.036 0.022 0.085 0.073 0.147
Story Drift Mean (in) 0.628 0.698 0.683 0.637 0.582 0.497
Story Drift COY 0.480 0.405 0.305 0.329 0.164 0.152
Story Energy Mean (k-io) 250.147 216.122 143.830 67.605 37.838 7.380
Story Energy CO" 0.579 0.770 0.804 1.110 1.089 2.449
Brace Energy MelLO (k-io) 235.545 215.970 139.157 67.408 36.130 7.377
Brace Energy COY 0.543 0.769 0.799 1.107 1.098 2.449
Column Energy Mean (k-in) 6.708 0.000 0.000 0.000 0.000 0.000
Column Energy COY 1.691 0.000 0.000 0.000 0.000 0.000
Beam Energy MelLO (k-io) 7.893 0.152 4.673 0.195 1.708 0.003
Beam Energy COY 1.227 2.449 1.238 2.449 1.335 2.449
Interior Column Compression Mean (k) 865.257 670.000 498.060 323.433 178.023 63.202
Interior Column Compression COY 0.048 0.040 0.055 0.104 0.247 0.172
Encrior Column Compression Mean (k) 168.363 140.655 113.535 85.635 56.970 :16.897
Exterior Column Compression COY 0.067 0.053 0.031 0.027 0.038 0.040
Table 7-10: SfATISIlCS FOR TBTG70
SfA1lSI1CS FOR 11JTG70
Story Number 1 2 3 4 5 6
Story Shear Mean (k) 457.033 392.717 362.883 346.833 293.950 221.567
Story Shear COY 0.027 0.037 0.023 0.050 0.049 0.107
Story Drift Mean (in) 1.473 1.702 1.740 1.350 1.155 0.918
Story Drift COY 0.747 0.645 0.500 0.255 0.247 0.265
Story Energy Mean (k-io) 957.012 1050.132 997.877 646.662 379.128 U1.770
Story Energy COV 0.674 0.515 0.385 0.341 0.278 0.269
Brace Energy Mean (k-io) 699.307 998.187 939.137 639.963 363.398 1:i1.607
Brace Energy COV 0.527 0.496 0.363 0.336 0.274 0.268
Column Energy Mean (k-io) 185.635 4.113 11.763 0.412 1.452 0.000
Column Energy COY 1.424 1.648 1.041 2.449 1.949 0.000
Beam Energy Meal) (k-io) 72.070 47.835 46.980 6.285 14.282 0.163
Beam Energy COV 1.612 1.625 1.634 1.892 1.085 2.449
Interior Column O)mpression Mean (k) 864.425 711.165 524.945 342.922 231.537 104.927
Interior Column O)mpression COY 0.048 0.048 0.021 0.040 0.065 0.143
Exterior Column Compression Mean (k) 198.797 168.457 112.365 97.538 62.192 :!8.212
Exterior Column Comp~onCOY 0.107 0.094 0.492 0.082 0.061 0.041

Table 7-11: SfATISllCS FOR ZJPPER70
144
SfATISIlCS FOR ZIPPER70
Story Number 1 2 3 4 5 6
Story Shear Mean (k) 392.650 340.633 321.217 306.933 251.033 206.067
Story Shear COy 0.094 0.021 0.055 0.088 0.141 0.103
Story Drift Mean (in) 1.607 1.795 1.823 1.702 1.720 1.460
Story Drift COY 0.624 0.599 0.602 0.649 0.651 0.592
Story Energy Mean (k-in) 1073.767 1046.677 850.568 615.365 432.922 186.900
Story Energy COy 0.316 0.265 0.304 0.304 0.163 0.563
Brace Energy Mean (k-in) 792.042 983.530 779.632 577.505 392.050 169.730
Brace Energy COY 0.156 0.241 0.278 0.276 0.164 0.541
Column Energy Mean (k-in) 186.763 2.528 0.507 0.000 2.275 1.200
Column Energy COy 1.290 2.092 1.571 0.000 2.004 2.271
Beam Energy Mean (k-in) 94.967 60.622 70.430 37.860 38.598 15.972
Beam Energy COY 0.976 1.274 1.143 .1.330 1.010 1.082
Interior Column Compression Mean (k) 884.373 742.218 558.708 312.327 214.892 122.638
Interior Column Compression COY 0.038 0.037 0.046 0.500 0.502 0.159
Exterior Column Compression Mean (k) 207.162 173.388 138.842 103.428 65.982 28.m
Exterior Column Compression COY 0.119 0.097 0.082 0.071 0.070 0.054
Table 7-12: SfATISllCS FOR TPRO
SfATISIlCS FOR TPRO
Story Number 1 2 3 4 5 6
Story Shear Mean (k) 412.000 381.600 319.900 283.483 232.533 156.183
Story Shear COY 0.061 0.058 0.041 0.056 0.040 0.037
Story Drift Mean (in) 0.602 0.903 1.115 1.W 1.222 1.038
Story Drift COY 0.528 0.592 0.530 0.451 0.199 0.152
Story Energy Mean (It-in) 213.528 384.605 470.728 474.943 383.183 170.445
Story Energy COY 0.667 0.684 0.728 0.809 0.832 0.288
Brace Energy Mean (k-in) 201.937 367.220 445.322 455.797 376.235 168.828 .
Brace Energy COY 0.627 0.653 0.695 0.815 0.835 0.280
Column Energy Mean (It-in) 5.250 O.gg) 0.910 0.000 0.355 0.000
Column Energy COy 2.264 2.449 2.449 0.000 1.983 0.000
Beam Energy Mean (It-in) 6.343 16.505 24.497 19.148 6.595 1.617
Beam Enc:rgy COy 1.753 1.524 1.903 1.646 1.204 2.327
Interior Column Compression Mean (k) 798.688 595.033 418.630 267.702 155.678 98.093
Interior Column Compression COY 0.018 0.020 0.047 0.046 0.049 0.109
Exterior Column Compression Mean (It) 193.020 165.158 134.368 100.197 63.780 28.132
Exterior Column Compression COy 0.113 0.098 0.073 0.062 0.055 0.025

y
x
145
2l.1
.3!..2 2
\ • I
ffi\ ~,
p
I I~r L
.-.:
. 6 :
21.,I
p
x
Figure 2-1 Brace deform ation
200
Figure 2-2 Variation of brace resistance with slenderness and deforma-tIOn l7 = 0.0012 "'I = 03

146
5ec¥It Stiffness at Max. D1SPl. K.J=10.20
S 0.250ec 0.225an 0.200t
S 0.175t 0.1501f 0.125fn 0.100e5 0.075s
R 0.050a 0.025ti O.OCO0
0.000
Ey = 0.(XH2 'Y = 0.3
.........-"'f.Ls = 20
"""-..
40.0c0 80.000 120.000 160.000 200.000
Brace Slenderness
Figure 2-3 Variation of secant stiffness with slenderness and deformation
p
Figure 2-4 Energy dissipation demand

147
r:- _ Jl p A~C --::, cUe..
200
f7 =0.0012 .., =0.3
Figure 2-5 Variation of energy ductility with slenderness and deformation
o
200
f7 =0.0012 .., =0.3
-Figure 2-~. Variation of displacement ductility with slenderness and energy ductilIty
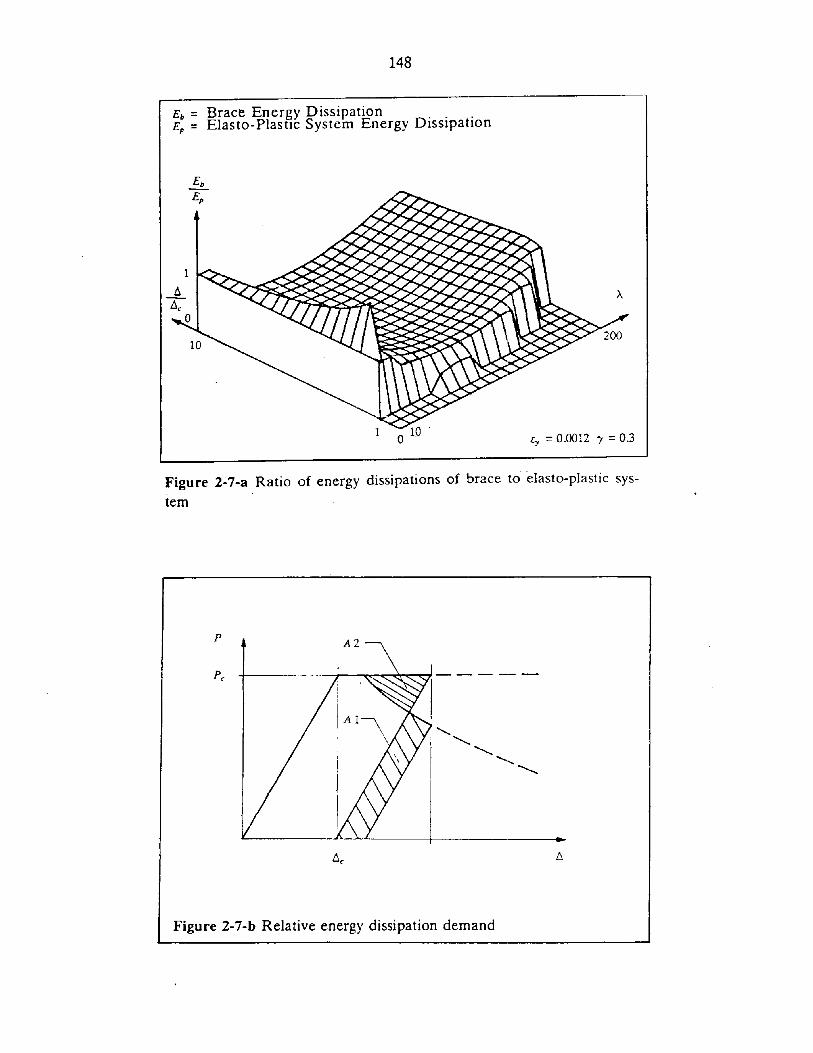
148
Eb = Brace Energy DissipationEp = Elasto-Plastlc System Energy Dissipation
200
e., =0.0012 -y =0.3
Figure 2-7-3 Ratio of energy dissipations of brace to elasto-plastic sys
tem
pA2
..
Figure 2-7-b Relative energy dissipation demand

149
Strains at fi~ yield Neutral axis migration Strains at failure
1
-,---(1-
1Y
)d ; 1.-----yd
f{!, 0-.tL_...I..- _
I-v),1
vd
Uy
Stresses at fai IureP1'1', Failure surface
1
U,
Stresses at first yield
~(l-y)d
-1----yd I Pel1'y I----~--':u._-L-____ 1
-!!.L MMp Mp
Figure 2-8 Neutral axis migration
.!!L2
Figur«~ 2-9 Local buckling mechanism

150
5.1lIlD
••!lOO
••1lIlD
3.500
].GOO •
2.!lOO
2.000
1.500
1.000
••500
••000 .."'"-_.
C, _CUlf'al .,-0..3 "AJ -10
CLCIXl 1D.0IXl UD.CIDD MO.CXI) 2CIO.aoo---
5.000
••!lOO
•.000
3.!lOO
3.0ll0
2._2.000
1.!eX'
'.000
..!lOO
••000 .."'"
............,..
C).CICIO .:J.CIDD 120.000 dO.CD) 2IDD.GDO_.~
(a) .. - 0.... , - o.J ."., - 10 ... 10 .. _ .. (b) .,_'..cD12.,.O.J"'AI_:I)~_IO ... ·1D
Cl.ClCIO ICl.CXI) 12D.ODO 16O.ClCIO 2X>.CDO
~51_
~.,~':~
-·i;ObJicii,-,·:~·~··: •'0"'-"-
5.000
••!lOO.....3.500
3.000
2.500
2.000
1.500
1.000
•.500
••O"JO
..000
C, _O.DOll ,.-0.3 ..... -20
.................. ...- ...._......
4O.CIXl ICl.ClQC J2CUD::I 160.CJCX) 2DJ.CIlXl__ SJ-..
5.000
••!lOO
•.000
3.!lOO
3.000
2._2.000
1.500
1.000
••!lOO
•.000 .....(c) .. _OJDU .,-cu .,II,-IO"At -10 .... -10
Figure 2-10 Ener?y Ductility Capacity
Displacement Ductility Capacity
DuCti11tY
50.000
45.000
40.000
35.000
30.000
25.000
20.000
15.000
10.000
5.000
0.000
0.000 40.000
.'
l:.y = O.OOl~ 7 = 03
80.000 120.000 160.000 200.000
Brace Slenderness
Figure 2-11 Displacement Ductility Capacity

151
..L =240
F
:... L /2 L /2
F
---'-'---r---- -_.. ~----~~-------q-_e-
21/
/I = 144
II = 14~I
I
Iy y
F /2 F /2
<fl-----,......,~~---___q---
Figu rc 3-1 Typical K-braced frame

F /2
152
F/2
e e
Figure 3-2 Equivalent spring model.

WEAK BEAM COLLAPSE MECHANISM
153
STRONG BEAM COLLAPSE MECHANISM
Figure 3-3-3 Lateral deformation of a K-braced panel
..t:.,
...
Figure 3·3-b Kinematics of deformations at braces-to-beam junctio:l

154
2o =4SO
/
"1
""
200100
I
.I
"",-;-
.I
".1
"""",."",. ,/
,,/ /,." //
-""' .... / .~,.~- _/
-,,' ----"'",....-~ ,..--
,-:;;-----,~......-:
Kb••,1K/)r ~ 10 -----KbmIK/)r = 1 --KbmIK/)r = 0.1
1
o
Brace Slenderness A
Figure 3-3-c Normalized unbalance force on beam.

p Brace resistance.155
Story shear-
p
p
3-4-a
3-4-c
3-4-e
>---ioc'---- B1... ....
B2
/),t
Small Sle.ndernc;:s~
F
,..----- Bl
" " "
B2•/),t
Intermediate Slenderness
.F
Bl
B2
/),t
Large Slenderness
-/).
J-4-h t
Figure 3-4 Story force-deformation characteristics for different bracesIendernesses ana flexible beams.

p Brace res'istance156
F Story shear
Bl
B2
p
p
3-5-a
1-5-c
1-5-e
t::.t
Small Slenderness
F)",---4--- B1
B2
t::.t
Intermediate Slenderness
F
A--4----- Bl
B2
t::.t
Large Slenderness
t::.t
3-5-1)
t::.t
~-5-d
t::.t
3-5-f.
Figure 3-5 Story force-defonnation characteristics for differen! braceslendem~sses an~ stiff beams.

157
Story shear
F IF..:
3 Flexible beam >.. = 20>.. =100>.. =200
1 f:7'.:{ \"- -----------· . ..._---------- ~--
· \. -'------------
.3 Stiff beam.
- .
.... ..
'-'I
,
>.. = 20>.. =100>.. = 200
---------------1 -r :'v-:=:::=----------------!: /1-.../--
· I
~'o 1
Story drift 0/0
5
Figure 3-6 Quasi-static force-deformation characteristics for variousbeam stiffnesses and brace slendernesses. (2nd story)

158
Unbalance forceP"" I Fe3 .
FlexIble beam
1
···III·••·I
I·I··········1 .
A =20A = 100A =200
A = 20A =100A =200
-------------------~ /
II
o· 1Story drift %
Figure 3-7 Unbalance force on beam versus story drift.

159
51
A =20Flexible beam ---- A =100------ A =200
--------------/~ c.::..:::;.::.:----~V'r., --- .-.----- -~. ~------_._-
'---
-- A =20Stiff beam/-, --- A =100
~
,A =200, ------,
,,, ,
, ,, ,
,,, ..'/~-------------------
~? _..--- .......
r0~,...::---~-. .-.'.
~
1
1
o
a
3
·1
-1
-3 a
Column compressionP / Fr
3
Story drift %
Figure 3-8-a First story columns compression versus story drift.

160
Colum n com pression
A =20A =100A = 200
Flexible beam
P / Fe3r-----------------..
1
.--------------_.o~-.===-=:::::=.::-----------~
-1
A = 20--- A =100- - - - - - A = 200
Stiff beam3F===='====~===!===:=:d===~
1 ,/
.",<tI'
o ,~-------------------
-1
51- 3 :-__---L. ....1- 1....-.__~ ....J
oSto'ry drift 0/0
Figure 3-8-b Second story columns compression versus story drift.
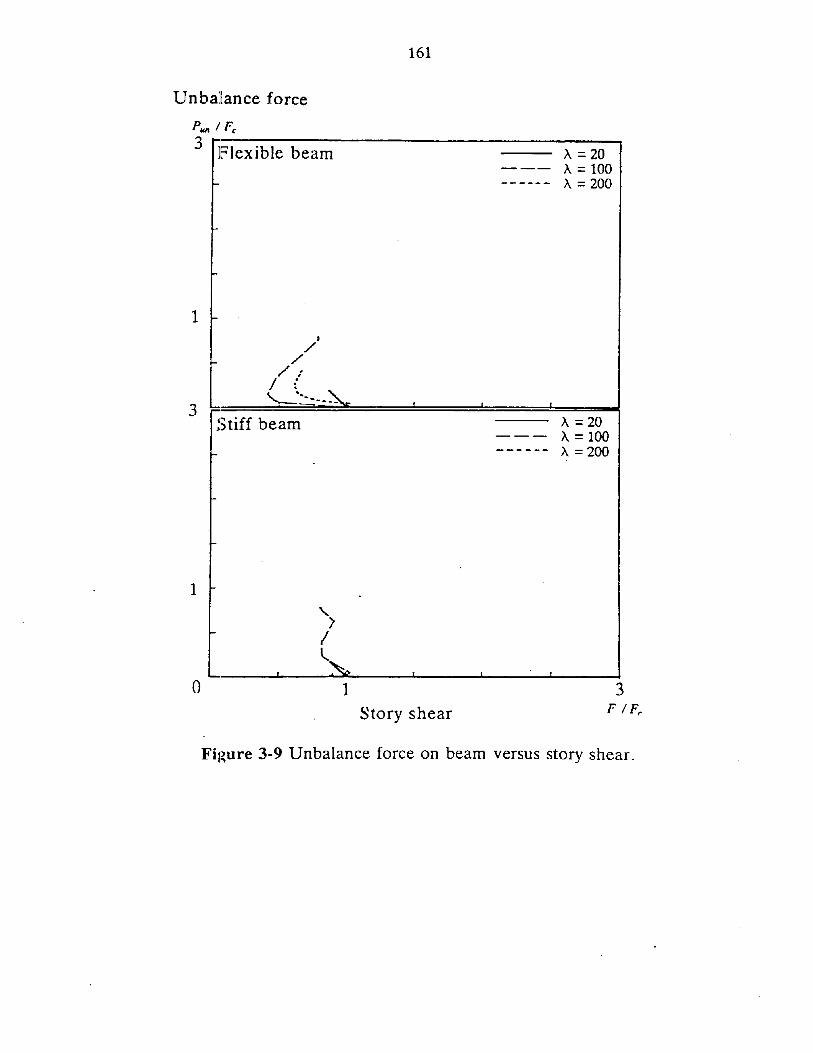
161
Unbalance force
PM 1Ft:
3 Flexible beam
1 ~
A =20--- A =100------ A = 200
Stiff beam3
1 ~
o
I
//
/:/ {~':::.:-~~
1Story shear
A =20A = 100A = 200
Fil~ure 3-9 Unbalance force on beam versus story shear.

Column compression
p / F"
3 Flexible beam
1
162
--- ;\=20--- ;\=100- -- - - - ;\ = 200
o~~~~--------1L--'~ _
-1
3Stiff beam -- A=20
-'-- A = 100------ A = 200
1
----o "-~=-----------_-=--=--,-,----.....=--=..;....---------.-------1... _-----"
-1
-3o 1
Story shear
Figure 3-10-a First story columns compression versus story shear.

163
Column compression
P / Fe3
Flexible beam X =20X = 100X =200
1
o
-1
3
--...-': -
Stiff beam X =20X =100X = 200
1
o
-1
-3
I-
o
_.--------,------..-..---.,...'
~ .. --'"'c--_ _- ••
1
Story shear
3F /}~
Figure 3-10-b Second story cO!l1mns com'pression versus story shear.

164
>.. = 20- - -- >.. = 100------- >.. =200
Story shear
F / Fe:1
"'- ..........'----------------------
..----------------- Flexible beam
1--->"=20- - - >.. =100
- - -- >.. = 200
r-----\ ;/.:--_. ---------_.\ ~/'-~-'
,,
,"-'
Stiff beam
o 1 5
Story drift 0/0
Figure 3-11 Quasi-static force-deformation characteristics for vanousbeam stiffnesses and brace slendernesses.

165
Unbalance force
PIIII I F~
1 Flexible beam ---'A =20- -- 'A = 100------ 'A =200
---'A =20--- 'A =100- - - - - - 'A = 200
1L~~======·:J~Stiff beam
5.
1
,r-----------./
/./ --------"1/.
/.•.Y
.;7.-y
.,'/ .
,1'/_../~/ .
o·Story drift %
Figure 3-12 Unbalance force on beam versus story drift.

166
Colum n com pression
--...-._--------------
---x =20---X=100- - - - - - x = 200
\L _
---------------;:=:.:..----------I
-----
P / Fr
1 Flexible beam
o
-------.----..--- (--....--
--_ox =20---i\ =100
L- ~'::_==-:::X = 200-------\ --~--::---....-., ..
---_.-.---
Stiff beam1
o
-1o 1 5
Story drift %
Figure 3-13-a First story columns compression versus story drift.

167
Column compression
Flexible beam A = 20--- A = 100------ A =200
~
Stiff beam A = 20- -- A = 100- - - - - - A = 200
-------------~-~__-;~ 0
o.
J .
o
1
o
-1o 1
Story drift %
5
Fi~urle 3-13-b First story columns compr~ssion versus story drift.

p
BRACED SYSTEM
6y 6muBRACED SYSTEM RESISTANCE
PULSE EXCITATION
PJ
Figure 4.0 Idealized sy.;tcms COlSidcrcd
168
p
T{
ELASTO··PLASTIC SYSTEM
6y ~uELASTO-PLASTIC SYSTEM
RF.sISTANCE
HARMO"IC EXCITATIOf\.'
Pm"" -

4-1-a Flexible Beam. >"=20
4-I-c Flexible Beam, )..=100
'4- I -~ f-kx ible Beam, A=2oo
169
4-I-b Stiff Beam, )..=20
4-I-d Stiff Beam, )..=100
4- I -f Stiff Be:!m. 1..=200
Figure 4-1 Ratio of displacement ductility of braced system tofram ed system for pulse loading

170
T,fT • 1.0
4-2-3 Flexible Beam. ),=20T,fT •• I U
4-2-b Stiff Beam, )..=20
T,fT.
4-2-c Flexible Beam, ).=100
IT,fTIU u
4-2-d Stiff Beam, )..=100
F.../F,
10
4-2-f St.iff
~JfAJT,n ~~,:=::'.~":::~:>--~~>-;-;;
'I ..' n \J 1
~-2-e Flexible Beam, ),.=200
Figure 4-2 Ratio o.f energy ductility of braced system to framed system for pulse loading

4-3-2 Flexible Beam. ),=20
4-3-c Flexible Betim. ).=100
171
4-3-b Stiff Beam. ),=20
4-3-d Stiff Be2m. >-=100
iJ.-:'~/iJ.4'~
It. \
--< .TJJT~
u 1 0 ~
o
4-3-e Flexible Beam. ).=200
10
F ....JF,
o ~ 0 :o
4-3-f Stiff Beam. >-=200
Figure 4-3 Ratio of displacement ductility of br2ced system toframed system for harmonic loading (sine wave)

4-4-3 Flexible Beam. A=20
0:' 0 01
4-4-c Flexible Beam, A=100
.4-4-c Flcxible Beam, »=200
172
4-4-b Stiff BeamG, A=20
G.} 0 0.1
4-4-d Stiff Bcam, )..=100
.,; ......n>u~4-4-f Stiff I3c3m. )..=200
Figure 4-4 Ratiq of energy <?uctility of braced system to fram ed s)'stern for harmonic loading (sine wavc)

173
--------r-=::::=--------r-<:E:...f---¥~_:::::>"Lr_-___:!_--J~---- ...
!J./ !J.c
Figure 4-5 Idealized h)'steresis model of K- braced s ys tem s

174
Figure~a Ratio of design strength of SNAP40 to LEPP for equal displace~nt ductility demand
T
Figure~b Ratio of design strength of SNAP40 to LEPP for equal energy dissipation demand

175
Figure 4-6< Ratio of design strength of SNAP70 to LEPP for equal displacement ductility demand
Figure 4-6-d Ratio eX design strength of SNAP70 to LEPP for equal energy dissipation demand

176
I
//
/I
/ / I
I r ~ ./I 1/ / ./"
I
c:11*~.~ ~~.61-R.. /F,.0.2 0.5 0.7- -I / I I
V / / II
I I II / / ,/ I II II I I ), If J I
I
I-t- -- I- -V -/Ij-+ -I- I- --1-1--1 - 7 -
I 0.8..1..-
I I
I/ Vt;;h V
- ~I
1-- 1 - --1- J ~ -I - - --1-
I l V I 1/ I./
I / V' / V I I 1/ If---I1f1l---l-ji+,-+V--l-+,..."...f-I--V+/-M-f-~----j_,c--1'-+I-¥--+-+-+-+-+,/--H O. 9 i
20
100
80
50
~;d';~~~~ ~ltf\:~~, -~-1.0 / /I /' !'\ 1.00T-
0.8 / / / /~ "r-....."/ I. 20-+--
/ yo A ./ -- """-l. " "../ ", 1.60~
0.5/~; V:/F~~FL R~ / ~ tT':~//VV: : Rm
t'm --.--: I
y~~~ t: : F0.• V ~ I ~ td I t'd t' tm t I"~-+-~+ ~-I I Triangular pulse ResiSlonce Displocemenl
I I J Iload, funclion funclion,II
O. 1 '----'----'---'~----'---'--'-..L.-L..L...J-_~_'__,~.......'--','-----"--'---'--'-L..J._--'-----'01 0.2 0.5 0.8 1 2 5 6 10 20
10
8
5::l-n
~
"~2
Figure 4-7: Maximum response of elasto-plastic systems (undamped) due to equilateral triangular
load p.I1ses (from '1ntroduction to structural dynamics" J. M. BIGGS, McGraw Hill ed.)

EC3
EC:~
Eel
177
3 @ 240" = 720"
~-~- BR3
~++--BRl
~-14-._ BRI
K-BRACED SYSTEI\1
II
@
Figure 5-1 Elevation of a typical K-braced frame

178
0.5
0.0
0.0 5.0Time (s)
10.C
Fig~re 5-2-8 Normalized cumulative Arias intensity for the groundmotIons used
300.0
<Ilc::Q)....c::-
0.30
0.01Period (s)
1.0
Figure 5-2-b Average power spectrum for the ground motions used
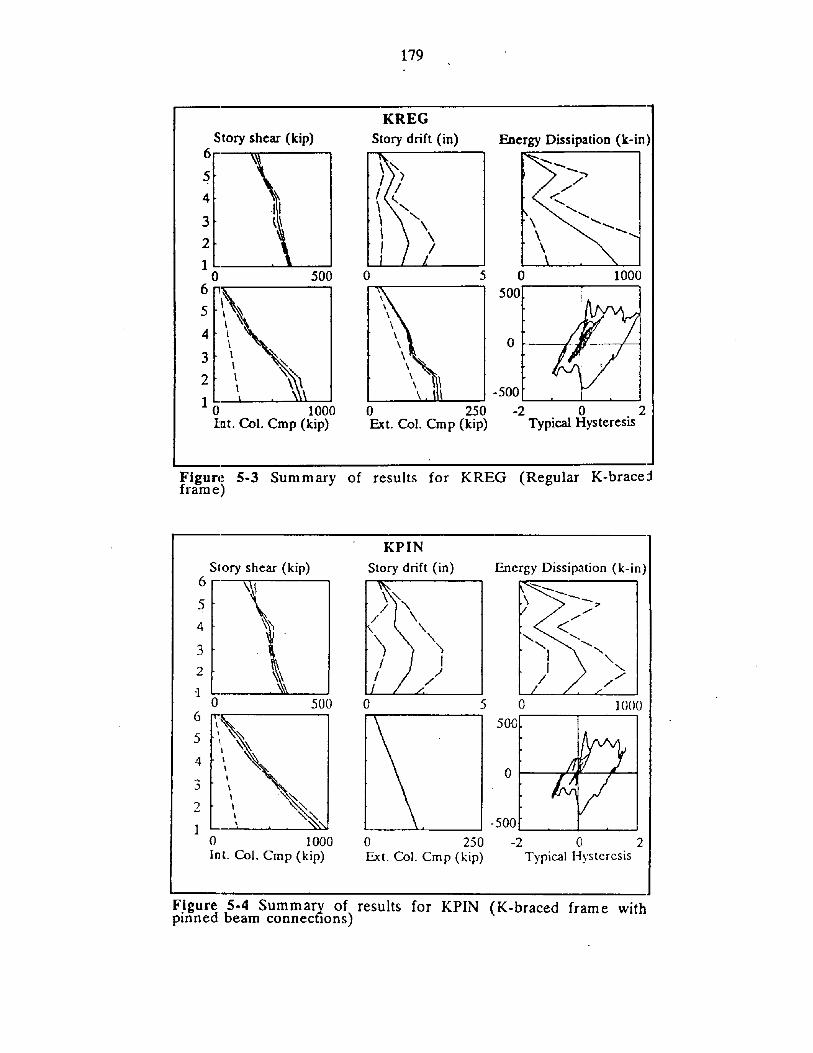
179
Energy Dissipation (k-in)
500\\\\\\,
\\\
KREGStory drift (in)
-500L...-_---'~u....__--' L.._"""------'_~--'
o 250 -2 0 2Ext. Col. Cmp (kip) Typical Hysteresis
1 0 1000lnt. Col. Cmp (kip)
Story shear (kip)6r------,m------,
5
4
3
2
1 ....----'-""""----'o 500
6 n"C"'"-------,
5 \ ~4 \
\3 \
\2 \
\
Figurl~ 5-3 Summary of results for KREG (Regular K-bracedframe)
2
1000
Energy Dissipation (k-in)
o t----,!-'l--fS--l
\~/ '\.
/ \\.
"-'II
,I/
KPINStory drift (in)
5 0r.-------, 50C..---...,-----,
L--_--''"''"--__--' - 500 L-----'-_~___''__--'
o 250 -2 0 2Ext. Col. Cmp (kip) Typical Hysteresis
o500o
o 1000Int. Col. Cmp (kip)
Story shear (kip)
6 \54 ~\
3
-1
Figure 5-4 Summary of results for KPIN (K-braced frame withpinned beam connections)

180
1000
o t------t------1
Energy Dissipation (k-in)
500'5
KELASStory drift (in)
,,\ ~
'\ "\ I "-\ '-~, "-\\ "-\\ "-\ \
\\\ -500 '----'---'--4-_-'----"
o 250 -2 0 2Ext. Col. Crop (kip) Typical Hysteresis
o
Story shear (kip)
6 ",,~5 ". \4 \
\3 \,21 L-__-'--__--'
o 5006 r+r--------,
5 ,,~\ I ..........
4 \ .....\ \
3 I \I \
2 1\\ \\1 L-.........._-"-__.......
o 1000Int. Col. Crop (kip)
Figure 5-5 Summary of results for KELAS (Elastic K-braced frame)
1000
----
\ -............\ ..... ">
/ -/. -.--
----
o
o r-----If--+-f'-+--i
Energy Dissipation (k-in)
5005
-----
KSBMStory drift (in)
\
\
\
\,\,,,,,
\
'. -500'----'----""Y-_.............~o 250 ··2 0 2Ext. Col. Crop (kip) Typical Hysteresis
o
1 0 1000Int. Col. Crop (kip)
Story shear (kip)
6 \5 I
4
3
21 L-__-'--_....LIL--'
o 500
6 '\\5 \ '\,
Iq4 " 1Il~
\ ~~3 \ \l~
2 " ~I
Figure 5-6 Summary of results for KSBM (K-braced frame withstrong stiff beams)

181
1000o500
Energy Dissipation (k-in;,
5\\ ,
\\\
'. ~~"'\ ~\ '\ ~",\'
KSTOStory drift (in)
-500L----L._-4.-_'----'o 250 -2 0 2Ext. Col. Crop (kip) Typical Hysteresis
o500
Story shear (kip)6 .....---------.
5
4
32lL---~--...J
o6 Mr-------,
5
4
3
2
1 (I 1000Int. Col. Crop (kip)
Figurf 5-7 Summary of results for KSTO (K-braced frame withstocky braces)
KOVER
o
Energy Dissipation (k-in):'-..
"-/>
\
\\
\
\
;'<..~ 1
'.'-....;: \'. ~~
5 ar-T"I-------, 500 ,----.,.....---
-5'00'--_--'u.-.....u..:>....---' ..._-'-----4''-'--........._,
a 250 -2 0 2Ext. Col. Cmp (kip) Typical Hysteresis
a500
\~~\,\:~
\ ~&.\ ~\ /, I ",,--- \
\ -"",\.\ "
o 1000Int. Col. Cmp (kip)
5
4
3
2
1o
6
5
4
3
2
1
Figul'e 5-8 Summary of results for KOVER (K-braced frame withoverstrong braces) .

182
1000
o 2Typical Hysteresis
(II
o
Energy Dissipation (k-in)
500
KUNDER
Story drift (in)
\~\~
\\I ' ........\ "'-
/ \/ /
·500 l_--,-_~----,,--Ja 250-2Ext. Col. Crop (kip)
o500
4
Story shear (kip)6.--""1'11"""-----,
~~5 \ I
~3 \
~
2 \~\1 '--_.....w.....o.-__-'
o6 n1r------,
5
4
3
21 L-......lo.....---..J~__--J
o 1000Int. Col. Crop (kip)
Figure 5-9 Summary of results for KUNDER (K-braced frame withunaerstrong braces)
1000()
o
Energy Dissipation (k-in)
500.
,..)
\\\
\\
\\
\\\\ ~
\ -500 1,_-_-'----'-_-'----J
a 250 -2 0 2Ext. Col. Crop (kip) Typical Hysteresis
KREG30Story drift (in)Story shear (kip)
6 ...-...:..-.........----.;.---,
5 '"'\4 \:'\
\
3
2
1 a 1000Int. Col. Crop (kip)
3
2
10 soo 0
6
5"
4
Fi~re 5-10 Summary of results for KREG30 (K-braced frame withO.3Ug earthquakes)

183
100(1o
Energy Dissipation (k-ill)
500
L-_----lo...o....-::::.::...L...--1 - 500 '----'-_-0....-_'----'
o 250 -2 0 2Ext. Col. Cmp (kip) Typical Hysteresis
KREG70Story drift (in)
'\~/,'1
I't-I --~ --,\ "-I }
o 5
2I·o 1000Int. Col. Cmp (kip)
...
.)
Story shear (kip)6 ,..--........----,
5
4
3
2
1 o soo6
5
4
Figure 5-11 Summary of results for KREG70 (K-braced frame with0.70g earthquakes).
1000
o 1--+-.1£--+--1------1
Energy Dissipation (k-in)
KDOOStory drift (in)
~/~( ~\ ") "-I \
/ )5 0
,.......--------, 500..------.-----.
-500L---'-_...I-_<----'
o 250 -2 0 2Ext. Col. Cmp (kip) Typical Hysteresis
o
Story shear (kip)6 ..---.-.,.....-------,
5
4
3
2IL ..L..__-1
o 5006 nr-------,
5
4
3
2
1 0 1000Int. Col. Cmp (kip)
Figure 5-12 Summary of results for KDOO (Dual K-braced framl~with 0% frame participation)

184
1000o
-2 0 2Typical Hysteresis
Energy Dissipation (k-in)
-5001------"_--'-_-'--'
5
\\\
\
\\\
\\\\\\
\
KD25Story drift (in)
o 250Ext. Col. Crop (kip)
o
Story shear (kip)6
5
4
3
21 L.-__~U-.-_-.l
o 5006
5
4
3~
2 ~~
1 0 1000Int. Col. Crop (kip)
Figure 5-13 Summary of results for KD25 (Dual K-braced framewith 25% frame partiCipation)
Energy Dissipation (k-in)
-500'------'----'---'--'
-2 0 2Typical Hysteresis
5
\\\\
\
'. ~\~\ ,\,-
\ ':\'. \ ~
KS25Story drift (in)
)~
/ I( t\ ..............\ .......\ \/ )
o 250Ext. Col. Crop (kip)
o
Story shear (kip)6.----n-r------,
5
4
3
21L-__.w....__~
o 5006
5
4
3
2
1 0 1000Int. Col. Crop (kip)
Figure 5-14 Summary of results for KS25 (Dual K-braced framewith 25% frame and stocky braces)

185
1000
Energy Dissipation (k-in)
5
\~/, /
I I\ ",\ "\ \I )
KD50Story drift (in)
\\\
\
\
\\
\
\
'. ~
" ~~ -500o 250 -2'---'--0'----'---'2Ext. Col. Crop (kip) Typical Hysteresis
o500
3
21 L. .........L.-_--'
o6,...,,....------,
5
4 '.\
3 "\2 '.
I
1 0 1000lnt. Col. Crop (kip)
Figure 5-15 Summary of results for KD50 (Dual K-braced framewifh 50% frame participation)
1000
o t------7'~'+--I---;
Energy Dissipation (k-in)KS50
Story drift (in)
'--_---''-'---'-'...............J -500 '----'-_-'-_'----'o 250 -2 0 2Ext. Col. Crop (kip) Typical Hysteresis
5 0"..-------, ,..-----.-------,
500
a
Story shear (kip)6....--m-------,
5
4
3
2lL-__..JAl....__....J
o 500
~r.4L~·3 '.
2 \\
1 .....1...._~>.>.>-_....Jo 1000lot. Col. Crop (kip)
Figure S-16 Summary of results for KS50 (Dual K-braced framewith 50% frame and stocky braces)

186
1000
.....................I(\\\\
'\
\\
./
a
Energy Dissipation (k-in)
500
5
KPROStory drift (in)
\\\\ 1I II \
lJI \\\
/
'--_---''-'--~_>____' - 500 L_---'-_....I....-_'----'
o 250 -2 a 2Ext. CoL Cmp (kip) Typical Hysteresis
a500
4
3
21 '----'-_....o...----"-~__'
o 1000Int. Col. Cmp (kip)
Story shear (kip)6 ~
5
4
3
21 '--__....0...-""""'-_ __'
o6,..,.,.,--------,
5
Figure 5-17 Summary of results for KPRO (K-braced frame with"proportional braces")
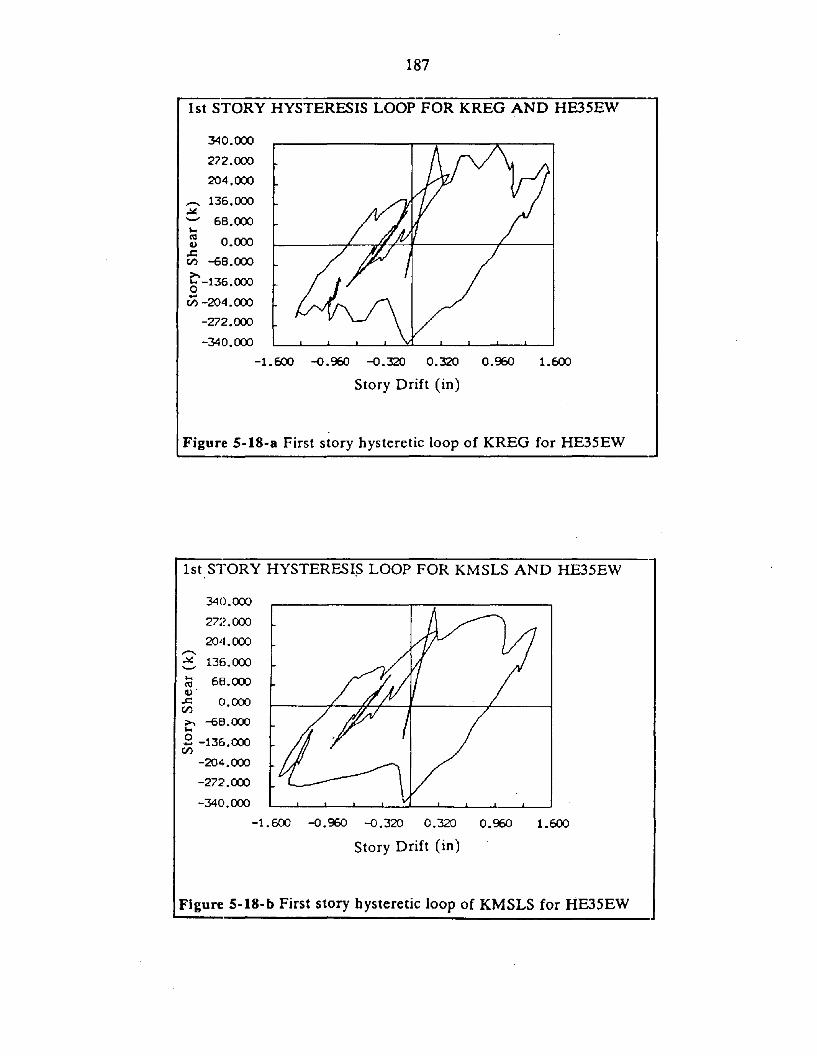
340.000
272.000
204.000
136.000
187
1st STORY HYSTERESIS LOOP FOR KREG AND HE35EW
.......
.lol:
........ 68.000....~ 0.000.ctI) -68.000
~-136.ooo
ri) -204.000
-272.000
-340.000
-1.600 -0.960 -0.320 0.320 0.960 1.600
Story Drift (in)
Figure 5-18-8 First story hysteretic loop of KREG for HE35EW
1st STORY HYSTERESI~LOOP FOR KMSLS AND HE35EW
340.000
.......~ 136.000
~ 6E1.ooo4).
c;5 0.000
>. -6E1.ooo.....B -136.000tI)
-204.000
-27:;~.000
-340.000
-1.600 -0.960 -0.320 0.320 0.960 1.600
Story Drift (in)
Figure 5-18-b First story hysteretic loop of KMSLS for HE35EW

188
TRACE OF 1st STORY K-JOINT FOR KREG AND HE35EW
0.000
-0.150
-0.300
-0.450,-...= -0.600
~ -0.750en.... -0.900o>- -1.050
-1.200
-1.350
-1.500
-1.600 -0.960 -0.320 0.320 0.960 1.600
X-DISP (in)
Figure 5-18-<: Trace of first story braces to beam junction in KREUfor HE35EW
TRACE OF 1st STORY K-JOINT FOR KMSLS AND HE35EW
0.000
-0.150
-0.300
? -0.450
........ -0.600p..
~ -0.750
'? -0.900;>-
-1.050
-1.200
-1.350
-1.500
-1.600 -0.960 -0.320 0.320 0.960 1.600
X-DISP (in)
Fi~ure 5-18-d Trace of first story ·braces to beam junction inKMSLS for HE35EW

189
1st STORY VERTICAL FORCE HISTORY FOR KREG ANDHE35EW
1000
900.........~ 000--~ 700Ut:( 6000Lt. 500
....:l 400<U 300....f-< 200~~ 100;>
0
0.000 2.000 4.000 6.000 8.000 10.000
TIME (s)
Figure 5-18-e First story vertical forces in KREG for HE35EW
1st STORY VERTICAL FORCE HISTORY FOR KMSLS ANDHE35EW
1000
900,.-.~ 800'-'
UJ 700U~ 6000
500Lt.
..J 400<U 300-f-< 200t:(~ 100;>
0
0.000 2.000 4.000 6.000 8.000 10.000
TIME (s)
Figure 5-18-f First story vertical forces in KMSLS for HE35EW

190
350 r--------.-----------,
70oI-----+---...........~...,L_----~:-__I
-70
-350 L..---'----'_....L----'_-'---.1._....1...-----'-_..l---J
-1.60 -0.32 0 0.32 1.60
Story Drift (in)
Figure 5-19-a Braces contribution to first story resistance in KREfor HE35EW
350
,........~"-'~
CIl0 70..c
tr:J 00
E -70CIl~
u..
-350 L..---'----''---....L----'_....L.---I._-'--.-L_..J..-~-1.60 -0.32 ,0 0.32 1.60
Story Drift (in)
Figure 5-19-b Frame contribution to first story resistance in KREGfor HE35EW

I~
1/,V~ I
~l~
V
h, II r IV r- .~ f\ r"\ /"\I
!~IrJ I
'1 '
191
350 r-----------,-:----::------,
-..ll(-.... 70~
t) O~---~--#-A-------J:.---~..c:CI) -70~o-CI)
-350 L-.....L...----L...----JL....-.....L...-...)Q...----JL....-.....L..-.---L...--JL..--...J
-1.60 -0.32 0 0.32 1.60
Story Drift (in)
Figure 5-19-c Total story in shear in KREG for HE35EW
t)u~ 5.000...CIlCIl 4.000t)
p::: 3.000
v 2.CXJOuE 1.000
a:lo 0.000-t) --1.000
§ --2.000....u.. ·-3.000....o --4.000
~ --5.000~
p::: 0.000 2.000 4.000 6.000 8.000 10.000
Time (s)
Fi~ur'e 5-19-d Ratio of frame to braces resistance in first story ofKREG for HE35EW -l
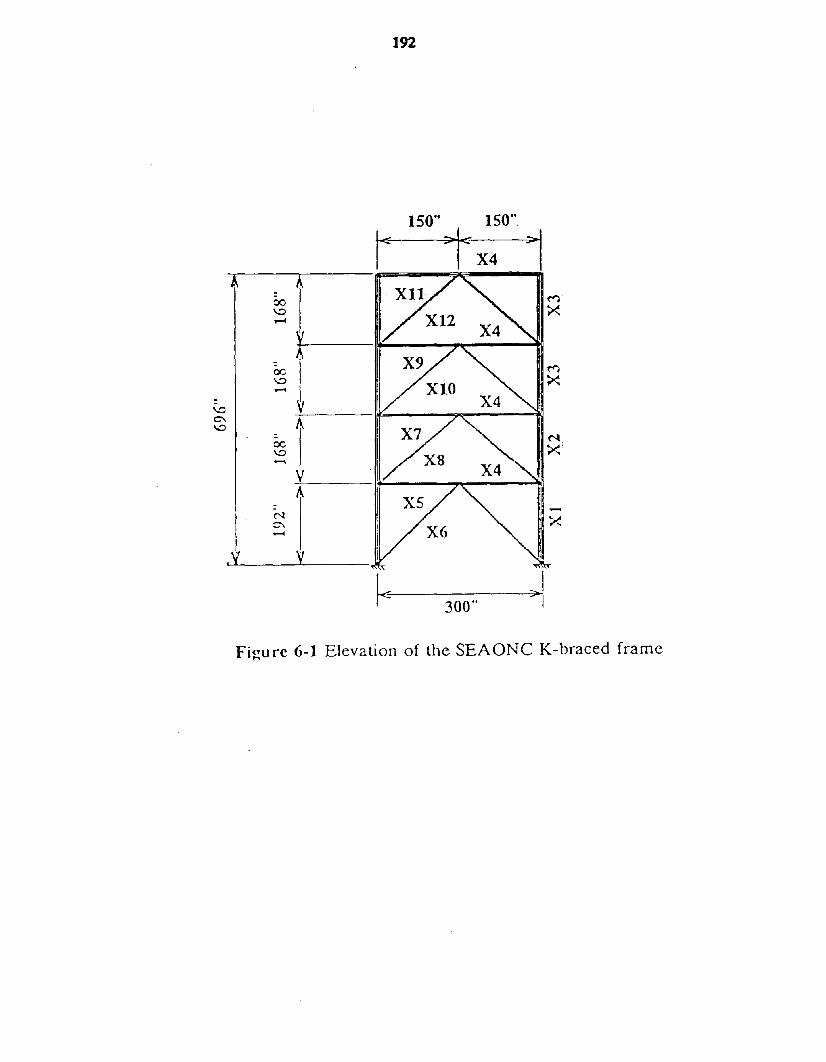
192
tY
Figure 6-1 Elevation of the SEAONC K-braced frame

3.00
2.50
2.00CJ:,c; 1.50;;;.
1.00
0.50
0.00
193
Objectivc~
- - - Constraint
./r- _
.///
o 1 2 3
Iteration
4 5 6
Figur·e 6-2-a Evolution of nonnalized objective function (volume) and of constnlintvalue for the El Centro setL- ---J
--'-- Objective- -- Constraint
3.00
2.50
2.00 r ........Q,l "-:1 1 ........
1.50 / '--elI~. /1
1.00
0.50
0.00
-,"""-
.........._------
o 1 234
Iteration
5 6
Figur«~ 6-2-b Evolution of nonnalized objective functiori (volume) and of constraintvalue for the mixed set
......_------------------------------'"

2000
-- lBCX>-.51600'""'"
CIS: 1400'"Col
1200c-.... lOCO0... BCX>cCol
E 6000
~ 400
200
0
194
---------- Seam--- 1" Story Column- - - ']:'J Story Column-------3,.,,4'" Story Column
o 1 2 3
Iteration
4 5 6
Figure 6-3-a Evolution of flexural member sizes for the El Centro s~t
2000
lBCX>.2- 1600
~ 1400....'"Col 1200C- 1000....0.... BCX>cCol 600E0 400::t
200
0
-------- Beam--- 1" Story Column- - -']:'J Story Column------Yd,4'" Story Column
~~~--------------
o 1 2 3
Iteration
4 5 6
Figure 6-3-b Evolution of flexural member sizes for the mixed set
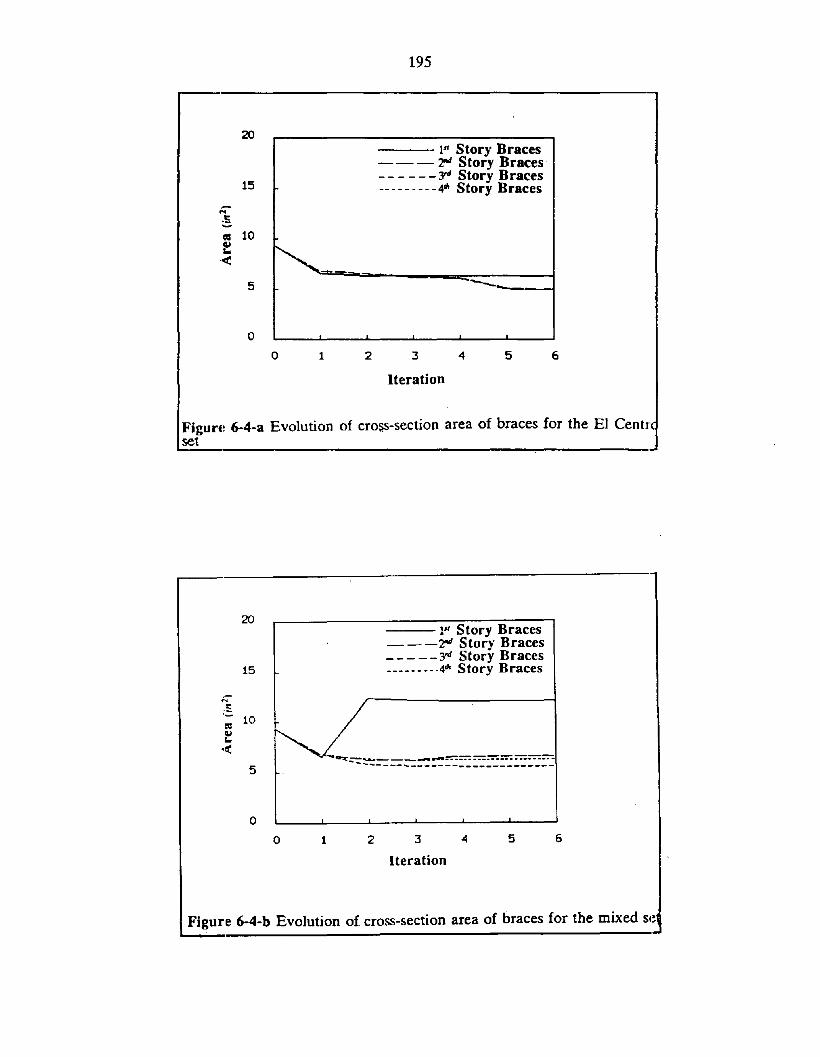
195
20
15
.........
.5.....CIS 10cu..
.0(
5
o
---- 1n Story Braces--- ']!'d Story Braces'------3"" Story Braces---------4'" Story Braces
-----o 1 2 3
Iteration
4 5 6
Figurt~ 6-4-a Evolution of cross-section area of braces for the EI Cent]'set
20
15
i;'""5.~
10=Cl.I....(5
o
--- 1" Story Braces---']!'d Story Braces___ - _yd Story Braces---------4'" Story Braces
o 1 2 3
Iteration
4 5 6
Figure 6-4-b Evolution of cross-section area of braces for the mixed sc~

196
0.50
0.40
.-
VCIJ0.30"-
'C
"1:~ 0.20
Q.,
---1" Mode Period-- -']!"I Mode Period--- ---J'd Mode Period---------4'" Mode Period
0.10 _--------------------
0.00
o 1 234
Iteration5 6
Figure 6-5-a Evolution of modal periods for the EI Centro set
0.50
0.40
--~ 0.30'C
".i:.~ 0.20
::l.c
--- 1" Mode Period---']."'I Mode Period- - - - - - 3'd Mode Period_________ 41i1 Mode Period
0.10
0.00
~--------------------
o 1 2
Iteration
3 4
Figure 6-5-b Evolution of modal periods for the mixed set

100.000
~ 90.000I:~ 80.000.e._ 70.000III
~ 60.000Q=50.000o;: 40.000(lS
t 30.000
"B 20.000u-< 10.000
0.000
0.010
197
--- Initial Period--- Final Period
1.000Period (s)
Fi~ure 6-6-a Mean input power spectrum for the EI Centro set
--- Initial Period--- Final Period
,....100.000
~ 90.000.5';:: 130 • (XX)...iii ?O.OOO
=Q 60.000
= !50.000.£~ 40.000
~ :50.000Cj~ ;W.OOO
-< l.O.OOO
0.000
0.010Period (s)
1.000
Fi~ure 6-6-b Mean input power spectrum for the mixed set

198
-------------------,------, /~
,,\ /"', /,-, / - ---~ -1--- ---,:----,
",,' ...--,- ..._- -... ---,,_,'--"'-'~"-" ••••.•., .•.• ---...-.•.-,. 1" Story
---'J!"l Story- -- 3'4 Story•• -.----- 4"" Story
0.50
0.40
~ 0.30Js~
~ 0.20.......
0.10
0.00
0 1 2 3
Iteration
4 5 6
Figure 6-7-a Evolution of the frame participation ratio for the El Centro set
0.50
0.40
~ 0.30
~:><""'-' 0.20
0.10
0.00
-------------------------------......--------.....................
----------------- .. -- .... ----_ .... --- .. ---_ .. --_ .. --"'- .. ---
--- I" Story- - - 'J:'d Story------J'd Story.--.------4"" Story
o 1 2
Iteration
3 4
Figure 6-7-b Evolution of the frame participation ratio for the mixeset

1.00
0.90
0.00
0.70
......t 0.60
~.... 0.50
J'-' 0.40
0.30
0.20
0.10
0.00
199
-------1- Story- -- -1!'d Story- - - - - -3'" Story-- --_. -- --4'" Story
--------------------,,".... .,.J:~----------,~----...:----:..j.;c:;.. /' •__ •• ••__ '_"
..,.,,~- ~_ _~::--..'..-..-_ ...-,--_ ......-.... -,-_ ... ,
,6- ...., ..
o 1 2 3
Iteration
4 5 6
Figurl~ 6-8-a Evolution of the beam to brace stiffness ratio for the ECentro set
1.00
0.90
0.00
0.70
......t 0.60oJ....... 0.50J'-' 0.40
0.30
0.20
0.10
0.00
1" Story------ 1!'d Story- - - - - - 3'" Story._.------- 4'" Story
---------------------------~~~~~~----------~~ ..::
~' ...... -..._- ----_ .. --- ... _------_ .... --_ ... --,.......... '..-.-'-
o 1 2
Iteration3 4
Figur,e 6-8-b Evolution of the beam to brace stiffness ratio for t1lmIxed[ set

200
4
3
2
1
\inal ,\1'8'IIIII
//o 100 200 300 400 500 600
Shear Strength (k)
Figure 6-9-a Original and final story strength distribution for the ECentro set
4
3
2
1
o
\ Final \lia,\\\\\\\
\
/\\\\
100 200 300 400 500 600
Shear Strength (k)
Figure 6-9-b Original and final story strength distribution for the mixedset

201
---Initial--- Final
4
3
1
o-2.0 -1.2 -0.4 0.4 1.2 2.0
Figul'e 6-10-a Original and final mode shapes for the EI Centro set
---Initial---Final
4
3
1
o-2.0 -1.2 -0.4 0.4 1.2 2.0
Fij!ulre 6-10-b Original and final mode shapes for the mixed set
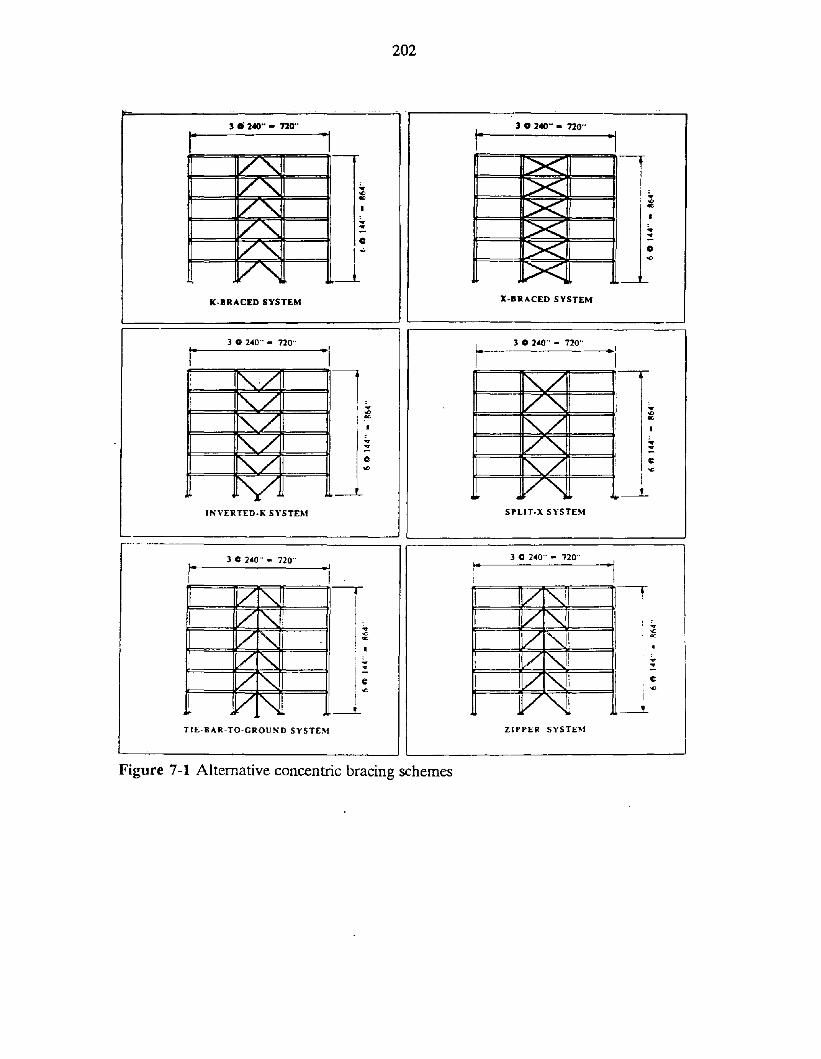
202
3 fi 240" - 720"
I3 0 240" - 720"
r -I IV,,", >< IV,," ;" ":5<: I.., i:
eo ,:V,,", I ><
l~V,,",
;" ><:.
V",c -=><I~
V,,", ~ l><K·IIRACED SYSTEM X·IIRACED SYSTEM
3 0 240" - 720" r--3 0 240" - 720"I- -I .1
Ii'../ I: i'../i'../ 7"... ....., ..,"'../
oc;
"'-./oc;
I I
,/ ... V" :...,/ 0 f"'-./ e
'0 -e
y ,- V" l~INVERTED·" SYSTEM SPLIT·X SYSTEM
.---
3 C 240" - 720" 3 C 240" - 720"
I- .' r- -IIII 1/'" I V i'.. ----,I '/'" I: 17"",-I
,I I;'
'/ "'., Ii [7""I -ei '"
: I i I
i V "' : IV "",-I I
I:
I ' ... I I'"
I~I:'
I V l"- I V r". I IeoC>
I V I, [7"1 i--l 10 ---l..
T1E·BAR·TO·GROUND SYSTEM ZIPPER SYSTEM
Figure 7-1 Alternative concentric bracing schemes

203
lOJO
\\"------
o
o .....tr---t+----i
Energy Dissipation (k-in
500
5
XREGSklry drift (in)
\~I )I II \.") "I I
I I
\\
\\
\\
\ ~" ~~\ '\ \'--_---.,;''-'---->-oU...-....J -500 '----'-_-4------''----'
o 250 -2 0 2Ext. Col. Cmp (kip) Typical Hysteresis
o500
Story shear (kip)
'\~~~~
~
6
5
4
3
2
1 '-----'----""""'------'o
1 0 1000Int. Col. Cmp (kip)
\
.5 \\
4 ~\
3 \,2 \
\
6~------,
Figure 7-2: Summary of results for X-bracing
1000o
o
Energy Dissipation (k-in)
5005
INVK
Story drift (in)
~~\\
'--__....&...-~...:..\---1 -500'----'-_-'--_'--,--lo 250 -2 0 2Ext. Col. Cmp (kip) Typical Hysteresis
o. 500
Story shear (kip)
6 \ \5 ~
\l~4 ~~
\13
21 L.-__'----l.ll..--.J
o6...--..,~-----,
~~~
~~~~
~~~~
'%..~~~
:1; t
I 1 0'------''----1-0-'00LIn!. Col. Cmp (kip)
Figure 7-3: Summary of results for invcrted K-bracing

204
1000o
o ~-+=-I..I--J.-.J---1
Energy Dissipation (k-in)
5005
\
\\
\\
\\\\\
\
SPLIT-XStory drift (in)
-500l--"'.."...~~_,--~o 250 -2 0 2Ext. Col. Cmp (kip) Typical Hysteresis
o500
3
21 L..-..__-'--.......u~~
o
Story shear (kip)6 ,...------rl:-r----,
5
4
6 I
5 \\
4 ~\
3 \\
2 "\1 '---~-"""'---_.......o 1000lnt. Col. Cmp (kip)
Figure 7-4: Summary of results for "split-X-bracing"
TBTGStory shear (kip) Story drift (in) Energy Dissipation (k-in)
6~~ \~\ \""5 ~
~ I \ I "4 " \ \ I ""
\\ I \ \ "-.......3 ~~ I , , ........
\~ I I I \2 \ \ /1/ J ./
1./
0 500 0 5 0 10006 500\
5 \
~\\
4 I\
~ 0I
3 \ ~
\ ~
2 \\ ~
1'I 0 20 1000 0 250 -..
Int. Col. Cmp (kip) Ext. Col. Cmp (kip) Typical Hysteresis
Figure 7-5: Summary of results for "Tic-Bars-To-Ground" bracing
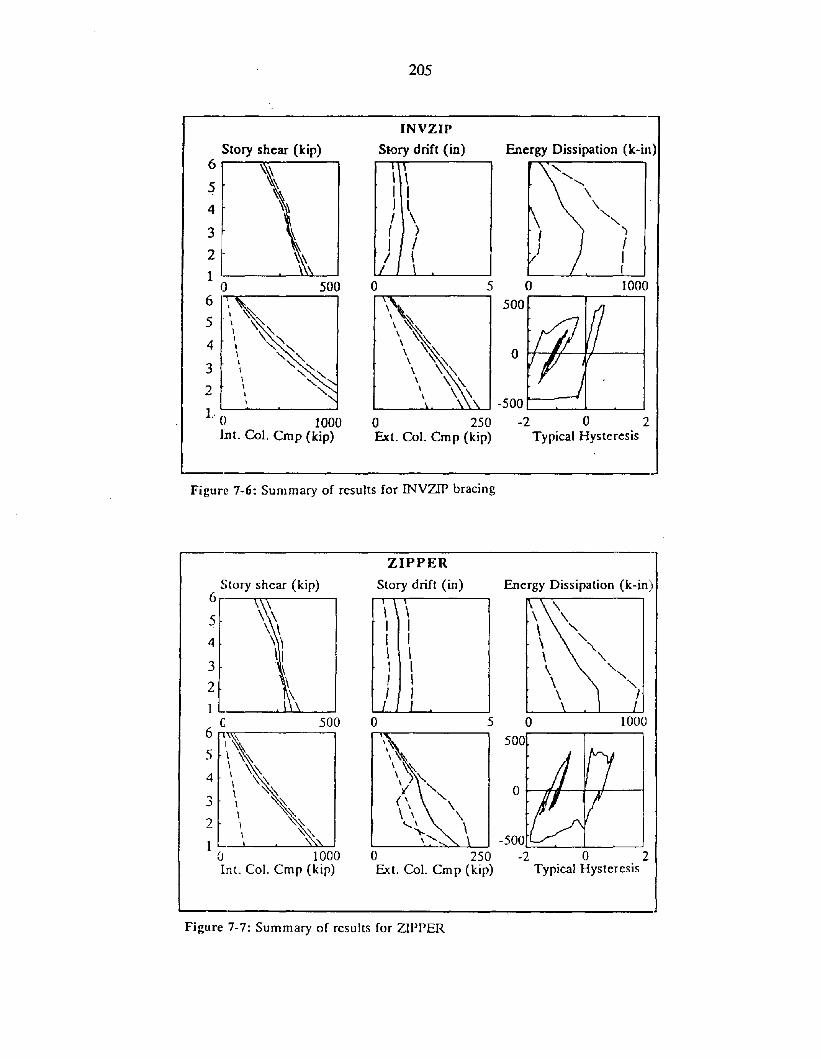
205
1000o
o H--I-t'---f+---l
Energy Dissipation (k-in)
"'"\\'-,,
')
II
500
5
INVZIP
Srory drift (in)1\\, \I IJ lI \I >I I
/ I \\
"~,~\ ~\ -.\'-.\ -. ~\ '\ ~, \ ~" \ \'---_---''-'-----''-''-''--' -500 '------'-~...L_---'~-..J
o 250 -2 0 2Ext. Col. Cmp (kip) Typical Hysteresis
o
L 0 1000lnt. Col. Cmp (kip)
Story shear (kip)
6 ~~5 ~~. ~~
4 ~~
32-1 ' ...L..--->">'~-..J
o 5006 I
I
5 \\
4 't\
3 't\
2 ..,
Figure 7-6: Summary of results for INVZIP bracing
ZIPPER
Story shear (kip) Story drift (in) Energy Dissipation (k-in)6 \ \ \ \5 \
I I "-4 I I ,
\.\ I ,
3 1 I ',,-2 I ,
"-/ I I
16 0 500 a 5 a 1000
I ~~ '''l 5005 \ ~~ \~
\ '\~ ,~
4 \ \(~ , );\,\ '.:::~ 'I' "- 0.., \ ~~ (' "-.:>
\ ~~ \ ' \, \2 \ ~~ ....... ' \\ '::~ '\-'1 -500
0 1000 0 250 -2 a 2Int. Col. Cmp (kip) Ext. Col. Cmp (kip) Typical Hysteresis
Figure 7-7: Summary of results for ZIPPER

206
5 0 1000500
r0
-500J
\\\\\\\ ~\ ~~
\ \~
T8TG30
Story drift (in) Energy Dissipation (k-in)
~I \I \I ~I IhI
o 250 -2 0 2Ext. Col. Cmp (kip) Typical Hysteresis
o500
I,\~
\ ~~\~\\\\\\\
Story shear (kip)6 '\5 ~~. '\~
4 \~\
3
2
1o
6 ........-------,
5
4
3
2
1a 1000Int. Col. Cmp (kip)
Figure 7-8: Summary of results for TBTG30 (TBTG at O.3g)
1000
~\\\\\
\1
o f----f-fi----I
Energy Dissipation (k-in)
~\I \I \I II \
J I
ZIPPER30Story drift (in)
L-_---'u..-u.>-_--' - 500 L_---'--_-'-~'--___J
o 250 -2 a 2Ext. Col. Cmp (kip) Typical Hysteresis
o 5 0r'IT------, 500.-----r-----,
500
4
Story shear (kip)6 ...-------..........-----,
5
3
2
1 o6 nr.-------,
\\~5 \ '\~
\ '\:~4 \ ~~
\ ~~3 \ ~
\ ~2 \ ~\..\ ~~
1 a 1000Int. Col. Cmp (kip)
Figure 7-9: Summary of results for ZIPPER30 (ZIPPER at O.3g)

.207
1000o
o tf----+--I---4
500
Energy Dissipation (k-in)
5
\ \I \\ \I "} "'I
I \J }
TBTG70Story drift (in)
o\
\,\~\ ) \..'y ,<..,\ '
"........ \\ ....... \\ \ \
'---_----''""''--.....................-' -500 t==::~--->._--"---'
o 250 -2 0 2Ext. Col. Cmp (kip) Typical Hysteresis
500
I\
" ,\\\\I\,
I
Story shear (kip)6,--.........,.----,
5
4
3
2
1o6 ,"T"1«'------,
5
4
3
21 L_......L...._"""---_->..>.Jo.-'
o 1000Int. Col. Cmp (kip)
Figure 7-10: Summary of results for TBTG70 (TBTG at 0.7g)
1000o500
Energy Dissipation (k-in)
5
I \ \I II I\ \} 1I I
J I ./\\
\ 'l"~~\ '\: \\.\ ~ \\" \;:'-.\ \"
\ \ \.'---__''-''--~--''-l--.J • 500 '------'-_....>..---'_--'
-2 0 2Typical Hysteresis
ZIPPER70Story drift (in)
o
o 250Ext. Col. Cmp (kip)
500
4
Story shear (kip)
6 \
5 \\.4 \ \
\ I3 \ \
2
1 06 ,.,....T!~-----,
"\\ \5 '\ \
\ \,............... \\ ....... ,'\
3 \ ~\ ~
2 \ ~~
1 0 1000Int. Col. Cmp (kip)
Figure 7-11: Summary of results for ZIPPER70 (ZIPPER at 0.7g)
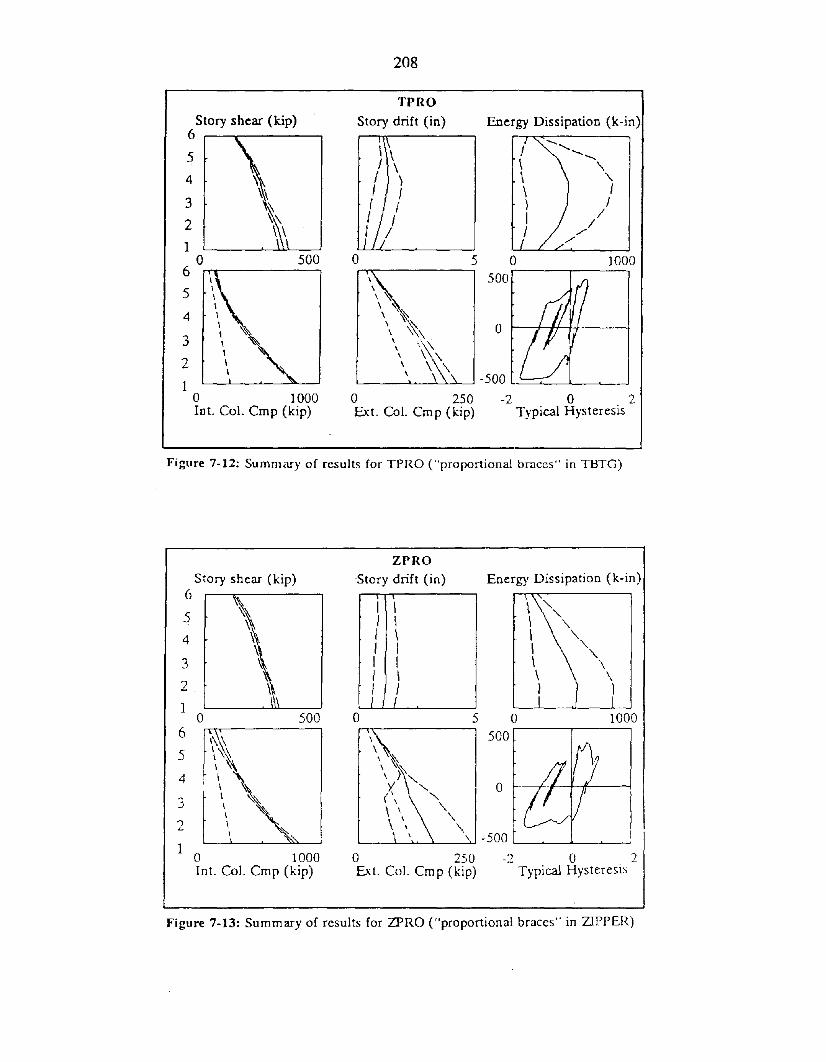
208
500 1000
-..,-..,\
\..I
I/
//'
/'
o
o
500
Energy Dissipation (k-in)
5
TPRO
Story drift (in)
,,, ,"~~\ ~ ~
\ \;\." \' \\ \ \\ \ \
L...-_---"u..--'---''-->-___J - 500 L_----'-_--L.----'~ _ ___J
o 250 -2 0 2Ext. Col. Cmp (kip) Typical Hysteresis
Story shear (kip)6
5
4
3
2
1o
6 rrr--------,
5
4
3
2
1o 1000In!. Col. Cmp (kip)
Figure 7-12: Summary of results for TPRO ("proportional braces" in TBTG)
1000o
o
500
Energy Dissipation (k-in)
'"'"\\
\..'\.
\\1
5
I \I \I \I II II \I /I I
ZPRO
-Story drift (in)
o\
\\ ~")~y "'-"(\ "\ \ \\ ' \..
\ \, -500 L...----'-_--L.-_~........i
o 250 -2 0 2Ext. Col. Cmp (kip) Typical Hysteresis
500
\'\\\ '\~
\ ~\\\\\\I
o
Story shear (kip)6
5
4
3
2.
1
3
6
5
4
2
1 o 1000Int. Col. Cmp (kip)
Figure 7-13: Summary of results for ZPRO ("proportional braces" in ZIPPER)

209
Zipper Configuration
v v v
Regular K-bracing
v v
Figure 7-14: Zipper effect action sequence

210
500
o 500Tie-bar Ten.(kip)
500
INVZlPTie-bar Cmp.(kip)
\~
I'I \\ I) II JIi
o
TBTGTie-bar Cmp.(kip)
\~\,\ ""- ", ,
\ "-\ "-\ '
o 500
1'\( J
I I/ ./
./
If
o 500Tie-bar Ten.(kip)
ZlPPER6 Tie-bar Cmp.(kip)
5 \ \. I \
4 I \I \
3 )2 \ /) /1 y-
O6 r--"'T'""""\'--:-----,
I '5 ( ,\ \
4) \I I
3 I ./)2 I ./
/v;"//
1 ~----,,-------I
o 500.Tie-bar Ten.(kip)
Figure 7-IS-a: Distribution of tie-bar forces, part-I
500 500
TPRO
Tie-bar Cmp.(kip)
'\,,~
~~~~
I "I '" "" "-\
a 500Tie-bar Ten.(kip)
IJI.~ \~/I
o500
TBTG70
Tie-bar Cmp.(kip)
~~'\~/ '-,/ ,\ "'\'--, '-........ ........, ,
a 500Tie-bar Ten.(kip)
o
TBTG30
Tie-bar Cmp.(kip)6
\~5 ))4 I I
I "", ", ""\ '-,
3
2
1 o6 . r-r-,.------.5 }
/4 ~{//3 ~(
2
1 a 500Tie-bar Ten.(kip)
Figure 7-IS-b: Distribution of tie-bar forces, part-II

211
o 500Tie-bar Ten.(kip)
500
ZPRO
Tie-bar Cmp.(kip)
I'1 "I ,\ \I )I /
I .....,/y
o
o 500Tie-bar Ten.(kip)
500
ZIPPER70
Tie-bar Cmp.(kip)
~ :--\ \\ \I II 1\ I\ Jb~
o
o 500Tie-bar Ten.(kip)
500\
, \, \) I( jI/'/
ZIPPER30
Tie-bar Cmp.(kip)6 rTf~-------..
5 if ~
4
3 ·1
2 I)1 ,'----"-----'
(I6
5
4
3
2
1
Figure '7-15-c: Distribution of tie-bar forces, part-rn

212
---- Mean Peak + 3 a
1500
"
I
1000
- . - . - - - Capacity
----- SEAOe-- .. ---- .. -- SRSS
- - - - - - - - - uue
\~"\ \"\ ':--,'. ':',
\ ,\
\\
\\
\\\
\\
\\
\\ ,,
\ ,,,\ ,,
500o
4
5
6
3
2
1
coen
Column Compression (k)
Figure 8-1: Interior Column Compression for KREG
6
\ " Mean Peak + 3a I
\ ~ ------- Capacity I5 \
.. ----- SEAOe I.. ,\ SAY I-----------\ I
4 \ J~
\"
J0V5 " I
3 \ I
\..
I
\ ~ I2 \ .
I,\ .. I
\ ~ I1
100 7-00 300 400 5000
Column Compression (k)
Figure B-1: Exterior Column Compression for KREG

213
':-..\\\ "-,,,,,
\,,\ ,,
\ ,\ ,,,,
\ ,\
\\ ,
\\
2
3
6 ..........----.-----------,Mean Peak + 3 cr
- - - - - - -Capacil)'...... ------ SEAOC
.....". .------ .. -- •• -- SRSS
"" - - - - - - - - - - UBC
500 1000 1500
Column Compression (k)
-Figur«: B-3: Interior Column Compression for KSTO
Mean Peak + 3 a j---------Capacity i------ SEAOC i--------------- SAVj
I
I
6 ,.\
,,
5 \ ,\ ..\\
4 \~ \0
\V;3 \
\\
2 \\\
10 100 300 400 500
Column Compression (k)
Figur«: 8-4: Exterior Column Compression for KSTO

214
Mean Peak + 3 a
- - - - - - -. - Capacity--- --- SEAOC
.... " - - - - - - - - . - - - . - - SRSS
". ---------.-- UI3C
15001000
"
500
,
\\\ ,
\\\\ ~
\ ... "'I '. "-, " "-
'. "-, "-\ "-
\ "-, .......'. '-
\ '-, '--" ..... ......... ........, '- I" .
\ '. I, ..........., ,, ~
6
5
4i:"0
"on3
2
1)
Column Compression (k)
Figure D-5: Interior Column Compression for KPRO
6Mean Peak + 3a
\ I------- Capacity
,\ I
5 \ ------- SEAOC I.\ ------------- SAY I..\ I
4 \..
1,r.... \
0,I0
Vi \ I,3 \ I,
\ I
\ I
2 \ .. I
\ '. I
\ .. I
10 1..xJ 200 300 "lOO 500
Column Compression (k)
Figure D-6: Exterior Column Compression for KPRO

215
6
5
>,4I-,o-'en
3
2
1
o 100 200 300 400 500
Tie-Bar Compres:'Oion (k)
Figure C-1: Tic-Dar Comprcssion for TDTC
"Mean Peak ' ......'\\\\IIJ
//
/./-- ......--------.......
6
5
2
1
200o 100
Tic-Bar CompressIOn (k)
Figure C-2: TIc-Dar CompressIon for ZIPPER

6
5
>,4l-e-'(f) 3
2
1
216
o 100 200 300 400Tic-Bar Tension (k)
figure C-3: Tie-Bar Tension for ZIPPER

217
EARTHQUAKE ENGINEERING RESEARCH CENTER REPORT SERIES
EERC repons are available from the' National Information Service for Eanhquake Engineering(NISEE) and from the National Technical InformationService(NTIS). Numbers in parentheses are Accession Numbers assigned by the National Technical Information Service; these are followed by a price code.Contact NTIS, 52S5 Pon Royal Road, Springfield Virginia, 22161 for more information. Repons without Accession Numbers were D<>t available from NTISat the time of printing. For a current complete list ofEERC repons (from EERC 67-1) and availablity information, please contact University of California,EERC, NISEE, 1301 South 46th Street, Richmond, California 94S04.
UCB/EERC-SO/O I
UCB/EERC-SO/21
UCB/EERC-SO/07
UCB/EERC-SOIl9
UCB/EERC-SO/OS
UCB/EERC-SO/09
UCB/EERC·SO/IO
UCB/EERC-SO/IS
UCB/EERC·SO/l5
UCB/EERC-SO/l6
UCB/EERC-SO/17
UCB/EERC-SO/II
UCB/EERC·SO/12
UCB/EERC-SO/l3
UCB/EERC-SO/14
UCB/EERC-SO/02
UCB/EERC"SO/03
UCB/EERC-SO/05
UCB/EERC-SO/06
UCB/EERC-SO/04
-Eanhquake Response of Concrete Gravity Dams Including Hydrodynamic and Foundation Interaction Effeets, - by Chopra, A.K.,Chakrabarti, P. and Gupta, S., January 19S0, (AD-AOS7297)AIO.
"Rocking Response of Rigid Blocks to Eanhquakes," by Yim, C.S., Chopra, A.K. and Penzien, J., January 19S0, (PBSO 166 002)A04.
"Optimum Inelastic Design of Seismic-Resistant Reinforced Concrete Frame Structures: by Zagajeski, S.W. and Benero, V.V., January19S0, (PBW 164 635)A06.
"Effects of Amount and Arrangement of Wall-Panel Reinforcement on Hysteretic Behavior of Reinforced Concr:te Walls: by Iliya, R.and Benero, V.V., February 19S0, (PBSI 122 525)A09.
"Shaking Table Research on Concrete Dam Models: by Niwa, A. and Clough, R.W., September 19S0, (PBSI 122 36S)A06.
"The Design of Steel Energy-Absorbing Restrainers and their Incorporation into Nuclear Power Plants for Enhanced Safety (Voila):Piping with Energy Absorbing Restrainers: Parameter Study on Small Systems: by Powell, G.H., Oughourlian, C, and Simons, J., June19S0.
"Inelastic Torsional Response of Structures Subjected to Eanhquake Ground Motions: by Yamazaki, Y., April 19S0, (PBSI 122327)AOS.
"Study of X-Braced Steel Frame Structures under Eanhquake Simulation: by Ghanaat, Y., April 19S0, (PBS I 12:! 335)AII.
"Hybrid Modelling of Soil-Structure Interaction: by Gupta, S., Lin, T.W. and Penzien, J., May 19S0, (PBSI 122 3l9)A07.
"General Applicability of a Nonlinear Model of a One Story Steel Frame: by Sveinsson, B.I. and McNiven, H.D., May 19S0, (PBSI124 S77)A06.
-A Green-Function Method for Wave Interaction with a Submerged Body: by Kioka, W., April 19S0, (PBS I 122 269)A07.
-Hydrodynamic Pressure and Added Mass for Axisymmetric Bodies.: by Nilrat, F., May 19S0, (PBSI 122 343)AIlS.
"Treatment of Non-Linear Drag Forces Acting on Offshore Platforms: by Dao, B.V. and Penzien, J., May 19S0, (PBSI 153 413)A07.
-2D Plane/Axisymmetric Solid Element (Type 3-Elastic or Elastic-Perfectly Plastic)for the ANSR-II Program: by Mondkar, D.P. andPowell, G.H., July 19,5O, (PBSI 122 350)A03.
"A Response Spectrum Method for Random Vibrations: by Der Kiureghian, A., June 19S1, (PBSI 122 301)A03.
'Cyclic Inelastic Buckling of Tubular Steel Braces: by Zayas, VA, Popov, E.P. and Mahin, S.A., June 19SI, (PElS I 124 SS5)AIO.
-Dynamic Response of Simple Arch Dams Including Hydrodynamic Interaction: by Poner, C.S. and Chopra, I~.K., July 19SI, (PBSI124000)AI3.
'Experimental Testing of a Friction Damped Aseismic Base Isolation System with Fail-Safe Characteristics: by Kelly, J.M., Beucke,K.E. and Skinner, M.S., July 19S0, (PBSI 14S 595)A04.
"The Desil:rt of Steel Energy-Absorbing Restrainers and their Incorporation into Nuclear Power Plants for Enhanced Safety (Vol.lB):Stochastic Seismic Analyses of Nuclear Power Plant Structures and Piping Systems Subjected to Multiple SUPl>oned Excitations: byLee, M.C.and Penzien, J., June 19S0, (PBS2 201 S72)AOS.
-The Design of Steel Energy-Absorbing Restrainers and their Incorporation into Nuclear Power Plants for Enhanced Safety (Vol IC):Numerical Method for Dynamic Substructure Analysis: by Dickens, J.M. and Wilson, E.L., June 19S0.
"The Design of Steel Energy-Absorbing Restrainers and their Incorporation into Nuclear Power Plants for Enhanced Safety (Vol 2):Developm.:nt and Testing of Restraints for Nuclear Piping Systems: by Kelly, J.M. and Skinner, M.S., June 198(,.
lJCB/EERC-SO/22 "3D Solid Element (Type 4-Elastic or Elastic:Perfectly-Plastic) for the ANSR-II Program: by Mondkar, D.P. and Powell, G.H... July19S0, (PBa I 123 242)A03.
UCB/EERC-SO/20
lJCB/EERC-SO/23 "Gap-Friction Element (Type 5) for the Ansr-II Program: by Mondkar, D.P. and Powell, G.H., July 19S0, (PBSI 1222S5)A03.
lJCB/EERC-SO/24 "V-Bar Re:.traint Element (Type II) for the ANSR-II Program: by OUghourlian, C. and Powell, G.H., July 19S0, (PBS I 122 293)A03.
lJCB/EERC-SO/25 'Testing of a Natural Rubber Base Isolation System by an Explosively Simulated Eanhquake: by Kelly, J.M., August 19S0, (PBSI 201360)A04.
UCB/EERC-SO/26 "Input Identification from Structural Vibrational Response," by Hu, Y., August 19S0, (PBS I 152 30S)A05.
UCB/EERC-SO/27 "Cyclic Inelastic Behavior of Steel Offshore Structures: by Zayas, V.A., Mahin, SA and Popov, E.P., August 19S0, (PBS I 196ISO)AI5.
UCB/EERC-SO/2S "Shaking Table Testing of a Reinforced Concrete Frame with Biaxial Response: by Oliva, M.G., October 19S0, (PBS 1 154 304)AIO.
UCB/EERC-SO/29 "Dynamic Propenies of a Twelve-Story Prefabricated Panel Building: by Bouwkamp, J.G., Kollegger, J.P. and ~;tephen, R.M., October19S0, (PBa2 13S 777)A07.
UCB/EERC,SO/30 -Dynamic Propenies of an Eight-Story Prefabricated Panel Building: by Bouwkamp, J.G., Kollegger, J.P. and ~tephen, R.M., October19S0, (PBS I 200 313)A05.
UCB/EERC-SO/31 "Predictive Dynamic Response of Panel Type Structures under Eanhqualces: by Kollegger, J.P. and Bouwkamp, J.G., October 19S0,(PB8l 152 316)A04.
UCB/EERC-SO/32 "The Desil:n of Steel Energy-Absorbing Restrainers' and their Incorporation into Nuclear Power Plants for Enhanced Safety (Vol 3):Testing of Commercial Steels in Low-Cycle Torsional Fatigue: by Spanner, P., Parker. E.R., Jongewaard. E. and Dory, M., 1980.
UCB/EERC-80/33
UCB/EERC-80/34
UCBIEERC-80/35
UCBIEERC-80/36
UCB/EERC-80/37
UCBIEERC-80/38
UCBIEERC-80/39
UCB/EERC-80/40
UCBIEERC-80/41
UCB/EERC-80/42
UCB/EERC-80/43
UCBIEERC-81/01
UCB/EERC-81/02
UCB/EERC-81/03
UCB/EERC-81/04
UCB/EERC-81/05
UCB/EERC-81/06
UCB/EERC-81/07
UCB/EERC-81/08
UCB/EERC-81/09
UCB/EERC-81/1O
UCB/EERC-81/11
UCB/EERC-81112
UCB/EERC-81113
UCB/EERC-81/14
UCB/EERC-81/15
UCB/EERC-81/16
UCB/EERC-81117
UCB/EERC-81/18
UCB/EERC-81/19
UCB/EERC-81/20
UCBIEERC-8210 I
UCBIEERC-82102
218
·The Design of Steel Energy.Absorbing Restrainers and their Incorporation into Nuclear Power Plants for Enhanced Safety (Vol 4):Shaking Table Tests of Piping Systems with Energy-Absorbing Restrainers: by Stiemer, S.F. and Godden, W.G., September 1980,(PB82 201 880)A05.
·The Design of Steel Energy-Absorbing Restrainers and their Incorporation into Nuclear Power Plants for Enhanced Safety (Vol 5):Summary Report,' by Spencer, P., 1980.
"Experimental Testing of an Energy-Absorbing Base Isolation System,' by Kelly, J.M., Skinner, M.S. and Beucke, K.E., October 1980,(PB81 154 072)A04.
·Simulating and Analyzing Artificial Non-Stationary Earth Ground Motions,' by Nau, R.F., Oliver, R.M. and Pister, K.S., October1980, (PB81 153 397)A04.
"Earthquake Engineering at Berkeley - 1980: by , September 1980, (PB81 205 674)A09.
·Inelastic Seismic Analysis of Large Panel Buildings: by Schricker, V. and Powell, <I.H., September 1980, (PB81 154 338)AI3.
·Dynamic Response of Embankment, Concrete-Gavity and Arch Dams Including Hydrodynamic Interation: by Hall, J.F. and Chopra,A.K., October 1980, (PB81 152 324)AII.
·Inelastic Buckling of Steel Struts under Cyclic Load Reversal.'- by Blac\c, R.G., Wenger, W.A. and Popov, E.P., October 1980, (PB8l154312)A08.
·Influence of Site Characteristics on Buildings Damage during the October 3,1974 Lima Earthquake: by Repetto, P., Arango,!. andSeed, H.B., September 1980, (PB81 161 739)A05.
-Evaluation of a Shaking Table Test Program on Response Behavior of a Two Story Reinforced Concrete Frame: by Blondet, J.M.,Clough, R.W. and Mahin, S.A., December 1980, (PB82 196 544)AII.
·Modelling of Soil-Structure Interaction by Finite and Infinite Elements,· by Medina, F., December 1980, (PB81 229 270)A04.
·Control of Seismic Response of Piping Systems and Other Structures by Base Isolation: by Kelly, J.M., January 1981, (PB81 200735)A05.
·OPTNSR- ~ Interactive Software System for Optimal Design of Statically and Dynamically Loaded Structures with NonlinearResponse: by Bhatti, M.A., Ciampi, V. and Pister, K.S., January 1981, (PB81 218 851)A09.
•Analysis of Local Variations in Free Field Seismic Ground Motions: by Chen, J.-c., Lysmer, J. and Seed, H.B., January 1981, (ADA099508)AI3.
-Inelastic Structural Modeling of Braced Offshore Platforms for Seismic Loading: by Zayas, V.A., Shing, P.-S.B., Mahin, S.A. andPopov, E.P., January 1981, (PB82 138 777)A07.
"Dynamic Response of Light Equipment in Structures: by Der Kiureghian, A., Sackman, J.L. and Nour-Omid, B., April 1981, (PB81218497)A04.
-Preliminary Experime~ta1 Investigation of a Broad Base Liquid Storage Tank: by Bouwkamp, J.G., Kollegger, J.P. and Stephen: R.M.,May 1981, (PB82 140 385)A03.
·The Seismic Resistant Design of Reinforced Concrete Coupled Structural Walls: by Aktan, A.E. and Bertero, V.V., June 1981, (PB82113 358)AII.
·Unassigned: by Unassigned, 1981.
·Experimental Behavior of a Spatial Piping System with Steel Energy Absorbers Subjected to a Simulated Differential Seismic Input,' byStiemer, S.F., Godden, W.G. and Kelly, J.M., July 1981, (PB82 201 898)A04.
·Evaluation of Seismic Design Provisions for Masonry in the United States: by Sveinsson, B.X., Mayes, R.L. and McNiven, RD.,August 1981, (PB82 166 075)A08.
·Two-Dimensional Hybrid Modelling of Soil-Structure Interaction: by Tzong, T.-J., Gupta, S. and Penzien, J., August 1981, (PB82 142118)A04.
·Studies on Effects of Infills in Seismic Resistant RIC Construction: by Brokken, S. and Bertero, V.V., October 1981, (PB82 166190)A09.
'Linear Models to Predict the Nonlinear Seismic Behavior of a One-Story Steel Frame: by Valdimarsson, R, Shah, A.H. andMcNiven, RD., September 1981, (PB82 138 793)A07. .
·TLUSH: A Computer Program for the Three-Dimensional Dynamic Analysis of Earth Dams: by Kagawa, T., Mejia, L.H., Seed, H.B.and Lysmer, J., September 1981, (PB82 139 940)A06.
·Three Dimensional Dynamic Response Analysis of Earth Dams: by Mejia, L.H. and Seed, H.B., September 1981, (PB82 137 274)AI2.
·Experimental Study of Lead and Elastomeric Dampers for Base Isolation Systems: by Kelly, J.M. and Hodder, S.B., October 1981,(PB82 166 I82)A05.
·The Influence of Base Isolation on the Seismic Response of Light Secondary Equipment: by Kelly, J.M., April 1981, (PB82 255266)A04.
·Studies on Evaluation of Shaking Table Response Analysis Procedures: by Blondet, J. M., November 1981, (PB82 197 278)AIO.
-DELIGHT.STRUcr: A Computer-Aided Design Environment for Structural Engmeering: by Balling, R.J., Pister, K.S. and Polak, E.,December 1981, (PB82 218 496)A07.
·Optimal Design of Seismic-Resistant Planar Steel Frames,· by Balling, R.J., Ciampi, V. and Pister, K.S., December 1981, (PB82 220179)A07.
·Dynamic Behavior of Ground for Seismic Analysis of Lifeline Systems: by Sato, T. and Der Kiureghian, A., January 1982, (PB82 218926)A05.
-Shaking Table Tests of a Tubular Steel Frame Model: by Ghanaat, Y. and Clough, R.W., January 1982, (PB82 220 161)A07.

219
UCBIEERC-82/15
UCB/EERC-82108
LCB/EERC-82/21
UCB/EERC-82/18
UCB/EERC-82103
UCB/EERC"82114
UCBIEERC"82107
UCB/EERC-82116
UCB/EERC-82/17
UCB/EERC-82104
VCB/EERC·82105
l}CB/EERC"82106
lJCB/EERC-82109
lJCB/EERC-82110
lJCBIEERC-82111
lJCB/EERC·82112
lICB/EERC-82119
l'CB/EERC-82120
"Behavior (If a Piping System under Seismic Excitation: Experimental Investigations of a Spatial Piping System lupported by Mechanical Shock Arrestors," by Schneider, S., Lee, H.-M. and Godden, W. G., May 1982, (pB83 172 544)A09.
"New Approaches for the Dynamic Analysis of Large Structural Systems; by Wilson, E.L., June 1982, (PB83 148 080)A05.
"Model Study of Effects of Damage on the Vibration Properties of Steel Offshore Platforms: by Shahrivar, F. and Bouwkamp, J.G.,June 1982, (PB83 148 742)AIO.
"States of the Art and Pratice in the Optimum Seismic Design and Analytical Response Prediction of RIC Frame Wall Structures; byAktan, A.E. and Bertero, V.V., July 1982, {PB83 147 736)A05.
"Further Study of the Earthquake Response of a Broad Cylindrical Liquid-Storage Tank Model; by Manos, G.c. and Clough, R.W.,July 1982, {PB83 147 744)AII.
"An Evaluation of the Design and Analytical Seismic Response of a Seven Story Reinforced Concrete Frame," by Charney, F.A. andBertero, V.V., July 1982, (PB83 157 628)A09.
"Fluid-Struc·ture Interactions: Added Mass Computations for Incompressible Fluid," by Kuo, J.S.-H., August 1982, (PB83 156 281)A07.
"Joint-opening Nonlinear Mechanism: Interface Smeared Crack Model; by Kuo, J.S."H., August 1982, {PB83 149 195)A05.
"Dynamic Response Analysis ofTechi Dam; by Oough, RW., Stephen, R.M, and Kuo, J.S.-H., August 1982, {PB83 147 496)A06.
"Prediction of the Seismic Response of RIC Frame-Coupled Wall Structures; by Aktan, A.E., Bertero, V.V. and Piazzo, M., August1982, (PB8;, 149 203)A09.
"Preliminar:1 Report on the Smart I Strong Motion Array in Taiwan; by Bolt, B.A., Loh, C.H., Penzien, J. and Tsai, Y.B., August1982, (PB8;, 159 400)AI0.
"Shaking-Table Studies of an Eccentrically X-Braced Steel Structure; by Yang, M.S., September 1982, (PB83 260 '718)AI2.
-The Perfonnance of Stairways in Earthqualces; by Roha, C., Axley, J.W. and Bertero, V.V., September 1982, (PB33 157 693)A07.
"The Behavior of Submerged Multiple Bodies in Earthquakes; by Liao, W.-G., September 1982, {PB83 158 709)AI)7.
"Effects of Concrete Types and Loading Conditions on Local Bond·Slip Relationships," by Cowell, A.D., Popov, E.P. and Bertero, V.V.,September 1982, (PB83 153 577)A04.
"Mechanical Behavior of Shear Wall Vertical Boundary Members: An Experimental Investigation; by Wagner, M.T. and Bertero, V.V.,October 1982, (PB83 159 764)A05.
"Experimenlal Studies of Multi.support Seismic Loading on Piping Systems," by Kelly, J.M. and Cowell, A.D., November 1982.
"Generalized Plastic Hinge Concepts for 3D Beam-Column Elements; by Chen, P. F.-S. and Powell, G.H., November 1982, {PB83 247%I~I~ .
"ANSR-II: General Computer Program for Nonlinear Structural Analysis: by Oughourlian, C.V. and Powell, GH., November 1982,(PB83 251 330)AI2.
UCB/EERC·82/22 'Solution Strategies for Statically Loaded Nonlinear Structures; by Simons, J.W. and Powell, G.H., November 1982, (PB83 197970)A06.
UCB/EERC-82113
UCB/EERC-82/23
UCB/EERC-82/24
UCB/EERC-82/25
UCB/EERC-82/26
UCB/EERC-82127
UCB/EERC-83/01
UCB/EERC·83/02
UCBIEERC-83/03
UCBIEERC-83/04
UCB/EERC·83/05
UCB/EERC-83/06
UCB/EERC·83/07
UCB/EERC-83/08
UCB/EERC·83/09
UCB/EERC-83/1O
UCB/EERC·83/11
UCB/EERC"83/12
UCB/EERC·83/13
"Analytical Model of Deformed Bar Anchorages under Generalized Excitations; by Ciampi, V., Eligehausen, R., Bertero, V.V. andPopov, E.P., November 1982, {PB83 169 532)A06.
"A Mathema.tical Model for the Response of Masonry Walls to Dynamic Excitations; by Sucuoglu, H., Mensi, Y. and McNiven, H.D.,November 1982, (PB83 169 011)A07.
"Earthquake Response Considerations of Broad Liquid Storage Tanks; by Cambra, F.J., November 1982, (PB83 2:)) 215)A09.
"Computational Models for Cyclic Plasticity, Rate Dependence and Creep; by Mosaddad, B. and Powell, G.H., N,)vember 1982, (PB83245 829)A08.
"Inelastic Analysis of Piping and Tubular Structures," by Mahasuverachai, M. and Powell, G.H., November 1982, (PB83 249 987)A07.
"The Economic Feasibility of Seismic Rehabilitation of Buildings by Base Isolation," by Kelly, J.M., January 1983, (PB83 197 988)A05.
-Seismic Moment Connections for Moment-Resisting Steel Frames.; by Popov, E.P., January 1983, (PB83 195 412)A04.
"Design of Links and Beam·tO-Column Connections for Eccentrically Braced Steel Frames: by Popov, E.P. and Malley, J.O., January1983, (PB83 194 811 )A04.
"Numerical Techniques for the Evaluation of Soil-Structure Interaction Effects in the Time Domain; by Bayo, E. and Wilson, E.L.,February 1983, (PB83 245 605)A09.
"A Transducer for -Measuring the Internal Forces in the Columns of a Frame-Wall Reinforced Concrete Structure; by Sause, R. andBertero, V. V" May 1983, (PB84 119 494)A06.
"Dynamic Interactions Between Floating Ice and Offshore Structures," by Croteau, P., May 1983, (PB84 119 486)A 16.
"Dynamic Analysis of Multiply Tuned and Arbitrarily Supported Secondary Systems," by Igusa, T. and Der Kiureghian, A., July 1983,(PB84 118 2·'2)AII.
"A Laboratory Study of Submerged Multi-body Systems in Earthqualces; by Ansari, G.R., June 1983, (PB83 261 8~·2)AI7.
"Effects of Transient Foundation Uplift on Earthqualce Response of Structures," by Yim, C.-S. and Chopra, A.K., JJne 1983, {PB83 261396)A07.
"Optimal De:;ign of Friction-Braced Frames under Seismic Loading," by Austin, M.A. and Pister, K.S., June 1983, (PB84 119 288)A06.
"Shaking Table Study of Single·Story Masonry Houses: Dynamic Performance under Three Component Seismic Input and Recommendations; by Manos, G.c., Clough, R.W. and Mayes, R.L, July 1983, (UCB/EERC-83/11)A08.
"Experimentlll Error Propagation in Pseudodynamic Testing: by Shiing, P.B. and Mahin, SA, June 1983, (PB84 119 270)A09.
-Experiment«1 and Analytical Predictions of the Mechanical Characteristics of a lIS-scale Model of a 7·story RIC Frame-Wall BuildingStructure; by Aktan, A.E., Bertero, V.V., Chowdhury, A.A. and Nagashima, T., June. 1983, {PB84 119 213)A07.

220
UCB/EERC,83114 "Shaking Table Tests of Large,Panel Precast Concrete Building System Assemblages: by Oliva, M.G. and Clough, R.W., June 1983,(PB86 110 210/AS)A11.
UCB/EERC,83/15 'Seismic Behavior of Active Beam Links in Eccentrically Braced Frames: by Hjelmstad, K.D. and Popov, E.P., July 1983, (PB84 119676)A09.
UCB/EERC-83/16 -System Identification of Structures with Joint Rotation: by Dimsdale, J.S., July 1983, (PB84 192 21O)A06.
UCB/EERC,83/17 "Construction of Inelastic Response Spectra for Single,Degree-of-Freedom Systems: by Mahin, S. and Lin, J., June 1983, (PB84 208834)A05.
UCB/EERC-83/18 'Interactive Computer Analysis Methods for Predicting the Inelastic Cyclic Behaviour of Structural Sections: by Kaba, S. and Mahin,S., July 1983, (PB84 192 012)A06.
UCB/EERC,83/19 'Effects of Bond Deterioration on Hysteretic Behavior of Reinforced Concrete Joints: by Filippou, F.e., Popov, E.P. and Bertero, V.V.,August 1983, (PB84 192 020)AlO.
UCB/EERC,83/20 'Correlation of Analytical and ExPerimental Responses of Large,Panel Precast Building Systems: by Oliva, M.G., Clough, R.W., Vel,kov, M. and Gavri10vic, P., May 1988.
UCB/EERC,83/21 'Mechanical Characteristics of Materials Used in a 1/5 Scale Model of a 7-Story Reinforced Concrete Test Structure: by Bertero, V.V.,Aktan, A.E., Harris, RG. and Chowdhury, A.A., October 1983, (PB84 193 697)A05.
UCB/EERC,83/22 'Hybrid Modelling of Soil,Structure Interaction in Layered Media,' by Tzong, T.,J. and Penzien, J., October 1983, (PB84 192 178)A08.
UCB/EERC,83/23 'Local Bond Stress-Slip Relationships of Deformed Bars under Generalized Excitations: by Eligehausen, R., Popov, E.P. and Bertero,V.V., October 1983, (PB84 192 848)A09.
UCB/EERC-83/24 -Design Considerations for Shear Links in Eccentrically Braced Frames: by Malley, ./.0. and Popov, E.P., November 1983, (PB84 192I86)A07.
UCB/EERC-84/01 'Pseudodynamic Test Method for Seismic Performance Evaluation: Theory and Implementation: by Shing, P.-S.B. and Mahin, S.A.,January 1984, (PB84 190 644)A08.
UCB/EERC-84/02 'Dynamic Response Behavior of Kiang Hong Dian Dam: by Clough, R.W., Chang, K.-T., Chen, H.-Q. and Stephen, R.M., April 1984,(PB84 209 402)A08.
UCB/EERC-84/03 'Refined Modelling of Reinforced Concrete Columns for Seismic Analysis,' by Kaba, SA and Mahin, S.A., April 1984, (PB84 234384)A06.
UCB/EERC-84/04 -ANew Floor Response Spectrum Method for Seismic Analysis of Multiply Supported Secondary Systems: by Asfura, A. and DerKiureghian, A., June 1984, (PB84 239 417)A06.
UCB/EERC-84/05 "Earthquake Simulation Tests and Associated Studies of a 1/5th-scale Model of a 7-Story RIC Frame-Wall Test Structure,' by Bertero,V.V., Aktan, A.E., Charney, EA. and Sause, R., June 1984, (PB84 239 409)A09.
UCB/EERC-84/06 "RIC Structural Walls: Seismic Design for Shear: by Aktan, A.E. and Bertero, V.V., 1984.
UCB/EERC-84/07 -Behavior of Interior itnd Exterior Flat-Plate Connections subjected to Inelastic Load Reversals: by Zee, RL. and Moehle. J.P., August1984, (PB86 117 629/AS)A07.
UCB/EERC-84/08 'Experimental Study of the Seismic Behavior of a Two-Story Flat-Plate Structure: by Moehle, J.P. and Diebold, J.W., August 1984,(PB86 122 553/AS)AI2.
UCB/EERC-84/09 -Phenomenological Modeling of Steel Braces under Cyclic Loading, - by Ikeda, K., Ma.hin, S.A. and Dermitzakis, S.N., May 1984, (PB86132 1981AS)A08.
UCB/EERC-84/10 'Earthquake Analysis and Response of Concrete Gravity Dams: by Fenves, G. and Chopra,' A.K., August 1984, (PB85 193902/AS)AII.
UCB/EERC-84/11 'EAGD-84: A Computer Program for Earthquake Analysis of Concrete Gravity Dams: by Fenves, G. and Chopra, A.K., August 1984,(PB85 193 613/AS)A05.
UCB/EERC-84/12 'A Refined Physical Theory Model for Predicting the Seismic Behavior of Braced Steel Frames: by Ikeda, K. and Mahin, S.A., July1984, (PB85 191 450/AS)A09.
UCB/EERC,84/13 "Earthquake Engineering Research at Berkeley - 1984: by, August 1984, (PB85 197 341/AS)AIO.
UCB/EERC-84114 'Moduli and Damping Factors for Dynamic Analyses of Cohesionless Soils: by Seed, RB., Wong, R.T., Idriss, I.M. and Tokimatsu, K.,September 1984, (PB85 191 4681AS)A04.
UCB/EERC,84/15 'The Influence of SPT Procedures in Soil Liquefaction Resistance Evaluations: by Seed, H.B., Tokimatsu. K., Harder, L.F. and Chung,R.M., October 1984, (P.B85 191 7321AS)A04.
UCB/EERC,84/16 'Simplified Procedures for the Evaluation of Settlements in Sands Due to Earthquake Shaking: by Tokimatsu, K. and Seed, H.B.,October 1984, (PB85 197 887/AS)A03.
UCB/EERC-84/17 'Evaluation of Energy Absorption Characteristics of Highway Bridges Under Seismic Conditions - Volume I and Volume II(Appendices): by Imbsen, R.A. and Penzien, J., September 1986.
UCB/EERC-84/18 'Structure-Foundation Interactions under Dynamic Loads: by Liu, W.O. and Penzien, J., November 1984, (PB87 124 8891AS)A II.
UCB/EERC-84/19 'Seismic Modelling of Deep Foundations: by Chen, e.-H. and Penzien, J., November 1984, (PB87 124 798/AS)A07.
UCB/EERC,84/20 "Dynamic Response Behavior of Quan Shui Dam,' by Clough, R.W., Chang, K.-T., Chen, H.-Q., Stephen, R.M., Ghanaat, Y. and Qi,J.-H., November 1984, (PB86 I 15 I77/AS)A07.
UCB/EERC-85101 "Simplified Methods of Analysis for Earthquake Resistant Design of Buildings: by Cruz, E.F. and Chopra, A.K., February 1985, (PB86112299/AS)AI2.
UCB/EERC-85102 "Estimation of Seismic Wave Coherency and Rupture Velocity using the SMART 1 Strong-Motion Array Recordings: by Abrahamson,N.A., March 1985, (PB86 214 343)A07.

lICB/EERC-85/03
lJCB/EERC-85/04
lJCB/EERC-85/05
lICB/EERC-85/06
lICB/EERC-85/07
lJCB/EERC-85/08
lICB/EERC-85/09
lICB/EERC-85/10
lICB/EERC-85/11
lICB/EERC-85/12
lICB/EERC-85/13
lICB/EERC-85/14
lICB/EERC-85/15
lICB/EERC-85/16
lICB/EERC-86/0 I
UCB/EERC-86/02
UCB/EERC-86/03
UCB/EERC-86/04
UCB/EERC-86/05
UCB/EERC-86/06
UCB/EERC-86/07
UCB/EERC-86/08
lICB/EERC-86/09
UCB/EERC-86/10
UCBlEERC-86111
UCB/EERC-86/12
UCB/EERC-87/01
UCB/EERC-87102
UCB/EERC-87103
UCB/EERC-87/04
UCB/EERC-87105
UCB/EERC-87/06
lJCB/EERC-87107
UCBlEERC-87/08
lJCBlEERC-87/09
UCB/EERC-87/1 0
UCB/EERC-87/11
221
-Dynamic Properties of a Thirty Story Condominium Tower Building: by Stephen. R.M., Wilson. E.L. and Slander. N., April 1985.(PB86 I I8965/AS)A06:
-Developme:nt of Substructuring Techniques for On-Line Computer Controlled Seismic Performance Testing: by Dermitzakis. S. andMahin, S., February 1985, (PB86 13294I/AS)A08.
-A Simple Model for Reinforcing Bar Anchorages under Cyclic Excitations: by Filippou, F.e.. March 1985. (PB86 112 919/AS)A05.
-Racking B,:havior of Wood-framed Gypsum Panels under Dynamic Load: by Oliva, M.G., June 1985.
-Earthquak,: Analysis and Response of Concrete Arch Dams: by Fok. K.-L. and Chopra, A.K., June 1985, (PB86 139672/AS)AI0.
-Effect of Inelastic Behavior on the Analysis and Design of Earthquake Resistant Structures: by Lin, J.P. and Mahin, S.A., June 1985,(PB86 135340/AS)A08.
"Earthquak.: Simulator Testing of a Base-Isolated Bridge Deck: by Kelly, J.M., Buckle. I.G. and Tsai, H.-e., January 1986. (PB87 124I52/AS)A06.
"Simplified Analysis for Earthquake Resistant Design of Concrete Gravity Dams: by Fenves, G. and Chopra, ,1.K., June 1986, (PB87124 160/AS)A08.
-Dynamic Interaction Effects in Arch Dams: by Clough, R.W., Chang, K.-T., Chen, H.-Q. and Ghanaat, Y., October 1985, (PB86135027/AS)A05.
"Dynamic Response of Long Valley Dam in the Mammoth Lake Earthquake Series of May 25-27, 1980: by Lai, S. and Seed, H.B.,November 1985. (PB86 I42304/AS)A05.
"A Methodology for Computer-Aided Design of Earthquake-Resistant Steel Structures; by Austin, M.A., Pister, K.S. and Mahin, S.A.,December 1985, (PB86 159480/AS)A 10.
-Response I)f Tension-Leg Platforms to Vertical Seismic Excitations: by Liou, G.-S., Penzien, J. and Yeung, :'t.W., December 1985,(PB87 124 :l7I/AS)A08.
"Cyclic L02.ding Tests of Masonry Single Piers: Volume 4 - Additional Tests with Height to Width Ratio 01' I: by Sveinsson, B.,McNiven, RD. and Sucuoglu, H., December 1985.
"An Experimental Program for Studying the Dynamic Response of a Steel Frame with a Variety of Infill Partitions: by Yanev, B. andMcNiven, H.D., December 1985.
"A Study 01' Seismically Resistant Eccentrically Braced Steel Frame Systems; by Kasai, K. and Popov, E.P., January 1986. (PB87 124I78/AS)AI4.
"Design Pre,blems in Soil Liquefaction; by Seed, H.B.• February 1986, (PB87 124 I86/AS)A03.
"Implications of Recent Earthquakes and Research on Earthquake-Resistant Design and Construction of Buildings; by Bcrtero, V.V.,March 1986, (PB87 124 I94/AS)A05.
"The Use of Load Dependent Vectors for Dynamic and Earthquake Analyses: by Leger, 1'., Wilson. E.L. and Clough, R.W., March1986. (PB8'7 124 202/AS)AI2.
"Two Beam-To-Column Web Connections,: by Tsai. K.-e. and Popov, E.P., April 1986, (PB87 124 30I/AS)A04.
"Determination of Penetration Resistance for Coarse-Grained Soils using the Becker Hammer Drill; by Harde', L.F. and Seed, H.B.,May 1986, WB87 124 210/AS)A07.
"A Mathematical Model for Predicting the Nonlinear Response of Unreinforced Masonry Walls to In-Plane Earthquake Excitations; byMengi, Y. and McNiven, H.D., May 1986, (PB87 124 780/AS)A06. .
"The 19 September 1985 Mexico Earthquake: Building Behavior: by Bertero, V.V., July 1986.
"EACD-3D: A Computer Program for Three-Dimensional Earthquake Analysis of Concrete Dams: by Fok, K.-L., Hall, J.F. andChopra, A.I(.. July 1986, (i'B87 124 228/AS)A08.
"Earthquak,: Simulation Tests and Associated Studies of a 0.3-Scale Model of a Six-Story Concentrically Braced Steel Structure, - byUang. e.-M. and Bertero. V.V.• December 1986. (1'687163 564/AS)AI7.
"Mechanical Characteristics of Base Isolation Bearings for a Bridge Deck Model Test: by Kelly, J.M., Buckle, I.G. and Koh, e.-G.,November 1987.
"Effects of Axial Load on Elastomeric Isolation Bearings: by Koh, e.-G. and Kelly, J.M., November 1987.
"The FPS Earthquake Resisting System: Experimental Report: by Zayas, V.A., Low, S.S. and Mahin, S.A., June 1987:
"Earthquake: Simulator Tests and Associated Studies of a 0.3-SCale Model of a Six-Story Eccentrically Braced Stc el Structure: by Whittaker, A.. Uang, e.-M. and Bertero, V.V., July 1987.
"A Displacement Control and Uplift Restraint Device for Base-Isolated Structures: by Kelly, J.M., Grillith, M.C and Aiken, I.D., April1987.
"Earthquake: Simulator Testing of a Combined Sliding Bearing and Rubber Bearing IsolatiQn System: by Kelly, J.M. and Chalhoub,M.S., 1987.
"Three-Dimensional Inelastic Analysis of Reinforced Concrete Frame-Wall StruclUres: by Moazzami, S. and Bef1ero, V.V., May 1987.
"Experiments on Eccentrically Braced Frames with Composite Floors: by Ricles, J. and Popov, E., June 1987.
"Dynamic Analysis of Seismically Resistant Eccentrically Braced Frames," by Ricles. J. and Popov, E., June 1987.
"Undrained Cyclic Triaxial Testing of Gravels-The Effect of Membrane Compliance: by Evans. M.D. and Seed. H.B., July 1987.
"Hybrid Solution Techniques for Generalized Pseudo-Dynamic Testing: by Thewalt, e. and Mahin. S.A., July I~187.
"Ultimate Behavior of BUll Welded Splices in Heavy Rolled Steel Sections: by Bruneau, M., Mahin, S.A. and Popov. E.P., July 1981.
"Residual Strength of Sand from Dam Failures in the Chilean Earthquake of March 3, 1985: by De Alba, 1'., Seed. H.B., Retamal, E.and Seed, R.B.. September 1987.
UCB/EERC-87/12
UCB/EERC-87/13
UCB/EERC-87/14
UCB/EERC-87/15
UCB/EERC-87/16
UCB/EERC-8711 7
UCB/EERC-87/18
UCB/EERC-87119
UCB/EERC-87/20
UCB/EERC-87/21
UCB/EERC-87/22
UCB/EERC-88/0 I
222
-Inelastic Seismic Response of Structures with Mass or Stiffness Eccentricities in Plan: by Bruneau, M. and Mahin, S.A.. Septembcr1987.
"CSTRUCT: An Interactive Computer Environment for the Design and Analysis of Earthquake Resistant Steel Structures, - by Austin,M.A., Mahin, S.A. and Pister, K.S., September 1987.
-Experimental Study of Reinforced Concrete Columns Subjected to Multi-Axial Loading: by Low, S.S. and Moehle, J.P., September1987.
-Relationships between Soil Conditions and Earthquake Ground Motions in Mexico City in the Earthquake of Sept. 19, 1985: by Seed.H.B., Romo, M.P., Sun, J., Jaime, A. and Lysmer, J., October 1987.
-Experimental Study of Seismic Response of R. C. Setback Buildings: by Shahrooz,. B.M. and Moehle, J.P., October 1987.
-The Effect of Slabs on the Flexural Behavior of Beams, - by Pantazopoulou. S.J. and Moehle, J.P., October 1987.
-Design Procedure for R-FBI Bearings: by Mostaghel, N. and Kelly, J.M., November 1987.
-Analytical Models for Predicting the Lateral Response of R C Shear Walls: Evaluation of their Reliability: by Vulcano, A. and Ber-tero, V.V., November 1987.
-Earthquake Response of Torsionally-Coupled Buildings: by Hejal, R. and Chopra, A.K., December 1987.
"Dynamic Reservoir Interaction with Monticello Dam: by Clough, R.W., Ghanaat, Y. and Qiu, X-F., December 1987.
"Strength Evaluation of Coarse-Grained Soils: by Siddiqi, F.H., Seed, R.B., Chan, C.K., Seed, H.B. and Pyke, R.M., December 1987.
-Seismic Behavior of Concentrically Braced Steel Frames: by Khatib, I., Mahin, S.A. and Pister, K.S., January 1988.