Embed Size (px)
Citation preview

1529 UCD Planning Sustainability Report No01 Rev04 02-05-17.doc
UCD STUDENT ACCOMMODATION MASTERPLAN PHASE 1
Project
No. Document Title Rev Prepared by:
Issue Date:
Checked by:
1529
PLANNING SUSTAINABILITY REPORT
04
JT
02/05/17
SOB
1 P:\Secretarial\2015\1529 UCD Student Residences Phases 3-6\Reports\UCD Planning Sustainability Report\1529 UCD Planning Sustainability Report No01 Rev04 02-05-17.doc
CONTENT 1.0. INTRODUCTION PAGE 2 2.0. ENERGY REPORT FOR BLOCK D PAGE 4 3.0. BEDROOM WINDOW ANALYSIS PAGE 8 4.0. WATER CONSERVATION PLAN PAGE 19
2 P:\Secretarial\2015\1529 UCD Student Residences Phases 3-6\Reports\UCD Planning Sustainability Report\1529 UCD Planning Sustainability Report No01 Rev04 02-05-17.doc
1.0 INTRODUCTION:
The project involves the design, procurement and construction of new Student Accommodation of approximately 2,946-beds over 6 number blocks located South West of the centre of UCD Main Campus. This project of 924 Beds forms part of the overall masterplan for UCD’s Strategic Campus Development Plan 2016-2021. The design not only reviews current standards, it also benefits from the experience gained from post-occupancy surveys carried out by UCD on previous residential complexes.
The Standards, Statutory Instruments, Rules and Regulations governing the design and installation of Mechanical and Electrical Services for this type of building include the following: S.I. 44 Safety, Health and Welfare at Work Regulations (2016) IS EN 12464 Lighting of Work Places (2011)
IS.3217 Code of Practice for Emergency Lighting System (2013) IS 3218 Code of Practice for Fire Detection & Alarm System (2013) IS EN 50131/1 Alarm Systems - Intrusion Systems (2006) IS EN 62305 Lightning Protection (2006) ETCI National Rules for Electrical Installation (2009) Building Control Regulations (2015)
The Chartered Institution of Building Services Engineers (CIBSE) Guides and Technical Memoranda
Relevant Irish/British Standards and Code of Practice for Mechanical & Electrical Building Services Installations
UCD Building and Services Maintenance and Technical Services Guidelines for Designers and Specifiers.
Post Occupancy Survey results Roebuck Hall and Roebuck Castle. Preliminary analysis whole building monitoring Roebuck Hall 2 Student Residence.

3 P:\Secretarial\2015\1529 UCD Student Residences Phases 3-6\Reports\UCD Planning Sustainability Report\1529 UCD Planning Sustainability Report No01 Rev04 02-05-17.doc
We are complying with Building Regulation TGD L 2017 Buildings other than Dwellings. The Buildings do not need to comply with the Nearly Zero Energy Building (NZEB) element of TGD L 2017 Buildings other than Dwellings until 31st December 2020 as the Building whereas owned by a Public Body (UCD) is not occupied by a Public Body as the Students are not UCD Employees. This has been confirmed as a correct interpretation by the Department of the Environment. Therefore we will be demonstrating compliance with TGD L 2017 Buildings other than Dwellings and achieving a BER of A3 but with no requirement for Renewable Energy Content. We have included for Planning Purposes PV Panels on the Roof however these PV panels have not been taken into account in our BER or TGD L Compliance Calculations as the PV Panels may be installed at a future date by UCD to demonstrate NZEB compliance beyond 2021. The following studies have been carried out at this early stage to optimise the performance of the building fabric. 1. BER Energy Report
2. Bedroom Windows Analysis
The thermal performance will exceed the current Building Regulation requirements. The minimum building fabric “U” values which have been identified at this stage are; % Improvement Part L 2017 External Wall: 0.21w/m²k 0% 0.21 Floor: 0.15w/m²k 29% 0.21 Roof: 0.15w/m² ºK 25% 0.2 Windows: 1.3w/m² ºK 20% 1.6 on average Air Tightness: 2.5m³/m²/hr 50% 5 The window is the single most important and influential element. This is both in terms of air movement in the rooms but also thermal performance and impact on the BER. Window Type 7 in the Window Analysis Report has been selected for use in the Project. This window has been designed to maximise ventilation performance as set out in the Window Analysis Report. They have also been designed to a “U” Value of 1.3w/m² ºK.
4 P:\Secretarial\2015\1529 UCD Student Residences Phases 3-6\Reports\UCD Planning Sustainability Report\1529 UCD Planning Sustainability Report No01 Rev04 02-05-17.doc
2.0. ENERGY REPORT FOR BLOCK D
2.1. BUILDING REGULATIONS & BER:
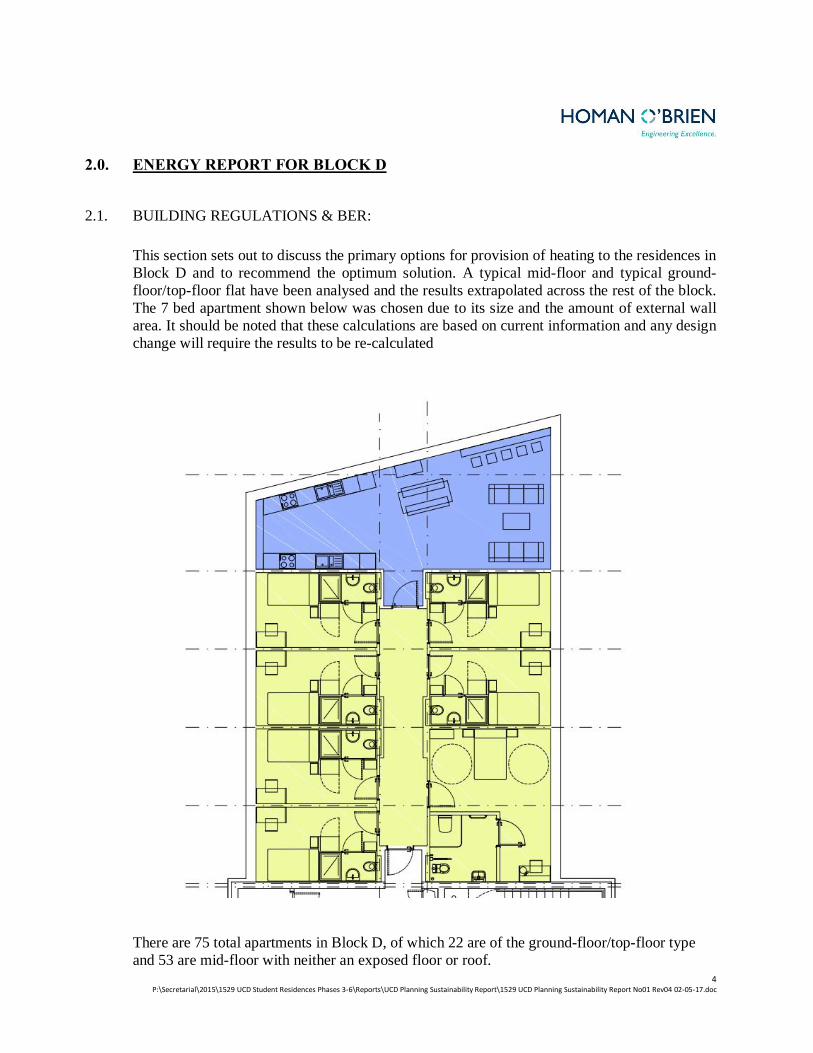
This section sets out to discuss the primary options for provision of heating to the residences in Block D and to recommend the optimum solution. A typical mid-floor and typical ground-floor/top-floor flat have been analysed and the results extrapolated across the rest of the block. The 7 bed apartment shown below was chosen due to its size and the amount of external wall area. It should be noted that these calculations are based on current information and any design change will require the results to be re-calculated
There are 75 total apartments in Block D, of which 22 are of the ground-floor/top-floor type and 53 are mid-floor with neither an exposed floor or roof.
5 P:\Secretarial\2015\1529 UCD Student Residences Phases 3-6\Reports\UCD Planning Sustainability Report\1529 UCD Planning Sustainability Report No01 Rev04 02-05-17.doc
There are four main criterion this section aims to demonstrate compliance with
- Building Energy Rating - Energy Performance Coefficient - Carbon Performance Coefficient
Building Energy Rating (BER) There is no specific BER rating that is required to comply with Part L. However, as part of the project brief, a BER of A3 has been specified as a minimum target. Energy Performance Coefficient (EPC) & Carbon Performance Coefficient (CPC) The EPC and CPC are the two figures that are used to determine whether the dwelling complies with Part L on an overall basis. The EPC is the calculated primary energy consumption of the proposed dwelling, divided by that of a reference building of the same size. To comply with Part L, the EPC must be better than the Maximum Energy Performance Coefficient (MEPC) which is 1.0. The CPC is the calculated carbon dioxide emissions of the proposed dwelling, divided by that of a reference building of the same size. To comply with Part L, the CPC must be better than the Maximum Carbon Performance Coefficient (MEPC) which is 1.0.
6 P:\Secretarial\2015\1529 UCD Student Residences Phases 3-6\Reports\UCD Planning Sustainability Report\1529 UCD Planning Sustainability Report No01 Rev04 02-05-17.doc
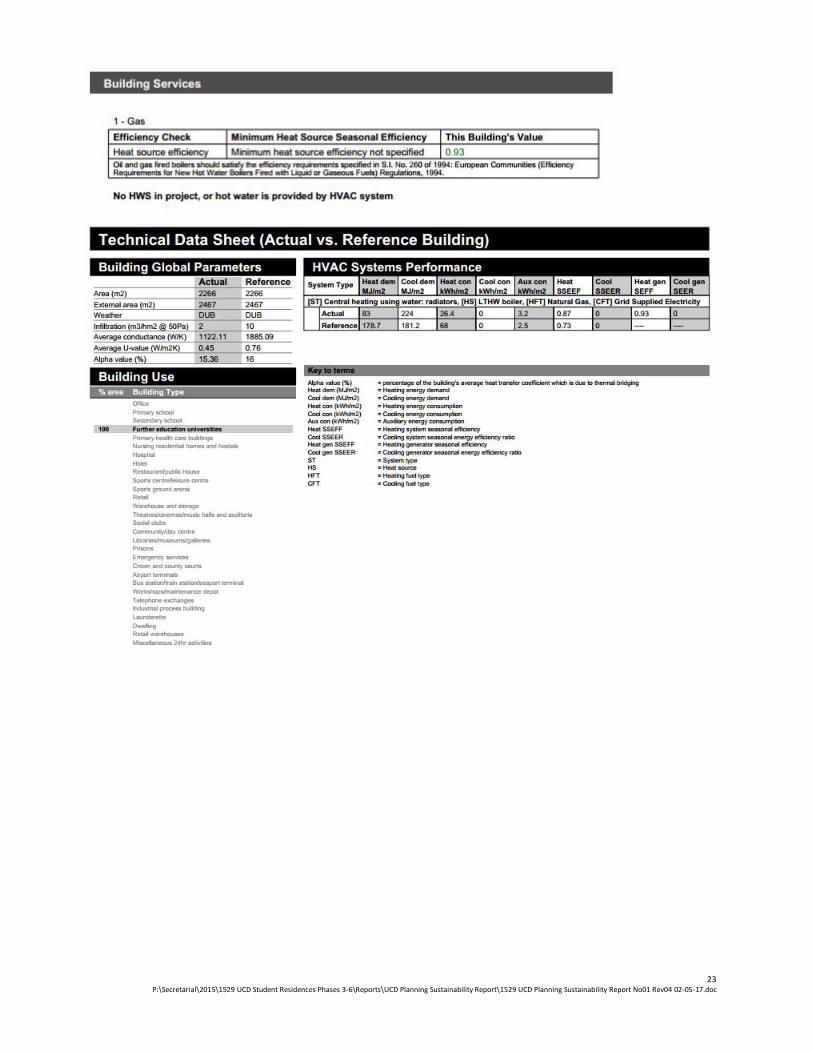
2.2 INPUT DATA There are a number of criteria entered into the model which do not vary from one option to the next: Dimensions/Constructions
- All windows to have a g-value of 0.64 - Glazing area of glazing plus spandrel panels to have average U-Value of 1.3 W/m2.K - Wall U-Value of 0.21 W/m2.K - Ground Floor U-Value of 0.10 W/m2.K - Roof U-Value of 0.10 W/m2.K
Ventilation
- PODs to have 15 l/s extract in each toilet - SFP of 0.93 W/l/s
Hot Water
- 300 litre cylinder per apartment - Heat loss of 1.80 kWh/day per cylinder - Cylinders to be heated by central heating boilers
Lighting
- All light fittings will be high-efficiency LED - Lighting level of 200 lux in bedrooms, bathrooms and circulation areas - Lighting level of 400 lux in communal areas - PIR occupancy sensing in circulation areas
Heating
- Group boiler system serving all apartments - Boiler will be gas-fired with an efficiency of 93%
Renewables
- No renewable energy sources are required to comply with building regulations and achieve a BER of A3.
7 P:\Secretarial\2015\1529 UCD Student Residences Phases 3-6\Reports\UCD Planning Sustainability Report\1529 UCD Planning Sustainability Report No01 Rev04 02-05-17.doc
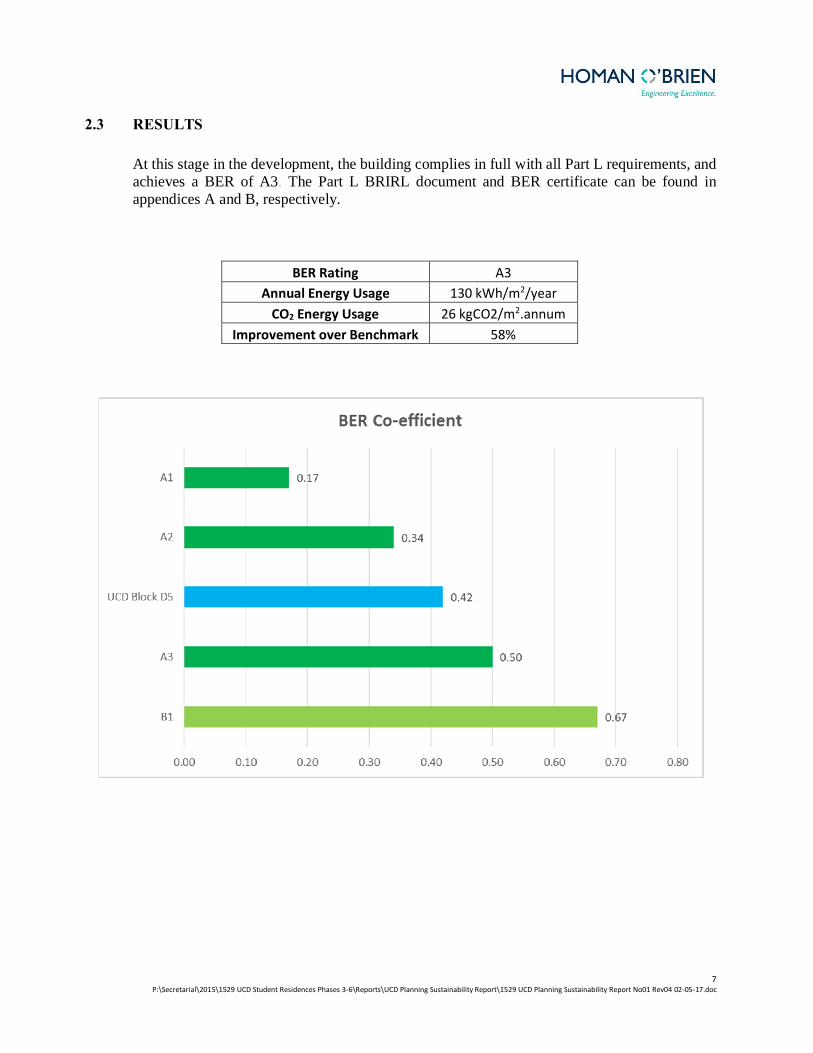
2.3 RESULTS
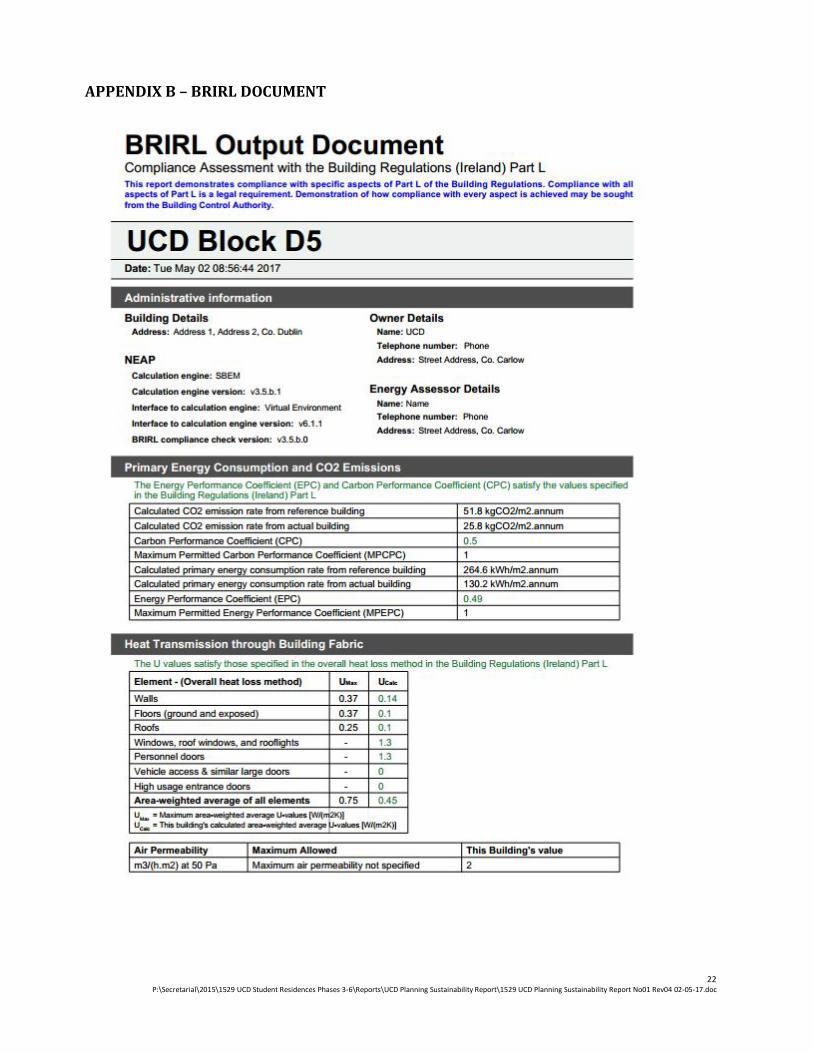
At this stage in the development, the building complies in full with all Part L requirements, and achieves a BER of A3. The Part L BRIRL document and BER certificate can be found in appendices A and B, respectively.
BER Rating A3
Annual Energy Usage 130 kWh/m2/year CO2 Energy Usage 26 kgCO2/m2.annum
Improvement over Benchmark 58%

8 P:\Secretarial\2015\1529 UCD Student Residences Phases 3-6\Reports\UCD Planning Sustainability Report\1529 UCD Planning Sustainability Report No01 Rev04 02-05-17.doc
3.0. BEDROOM WINDOW ANALYSIS 3.1 INTRODUCTION
This section sets out the findings of a preliminary study on the window design for the proposed student accommodation at UCD Belgrove. Four proposed window designs were examined with various window opening configurations. In order to comply with Building Regulations Part F 2009 all windows must be able to achieve a minimum openable area of 5% of the total bedroom floor area. Ideally, this will be achieved using a combination of high and low level openings in order to provide varying ventilation control options to the user while taking advantage of the stack effect thereby maximising ventilation and cooling effect. A thermal model was developed to test the effectiveness of each window design. The window designs were tested for daylight penetration, ventilation rates and peak internal temperatures. It was noted in Post Occupation Studies carried out by UCD that poor ventilation was rated as a big issue. Therefore the proposed design will seek to exceed the minimum Building Regulation and Ventilation requirements, within reason. The target performance levels for each aspect of the tests are as follows
Daylighting.
• A daylight factor of 4.2% is to be achieved in all bedrooms: The department of education requires a minimum daylight factor of 4.2% - 4.5% as stated in Technical guidance document TGD-03.
• BS 8206 also suggests that “If the average daylight factor in a space is at least 5% then electric lighting is not normally needed during the daytime, provided the uniformity is satisfactory”- whilst this is in no way a requirement, getting close to this figure would mean very little to no artificial lighting would be required during daylight hours.
Ventilation
• A minimum openable area of 5% of room floor area as required by Building Regulations
Part F • The ventilation rate should exceed 10 l/s/p for 100% of the occupied time in accordance
with CIBSE Guide A. • An increased target of 12 l/s/person was identified in order to address the concerns raised
during the post occupancy surveys of previous UCD residences.
9 P:\Secretarial\2015\1529 UCD Student Residences Phases 3-6\Reports\UCD Planning Sustainability Report\1529 UCD Planning Sustainability Report No01 Rev04 02-05-17.doc
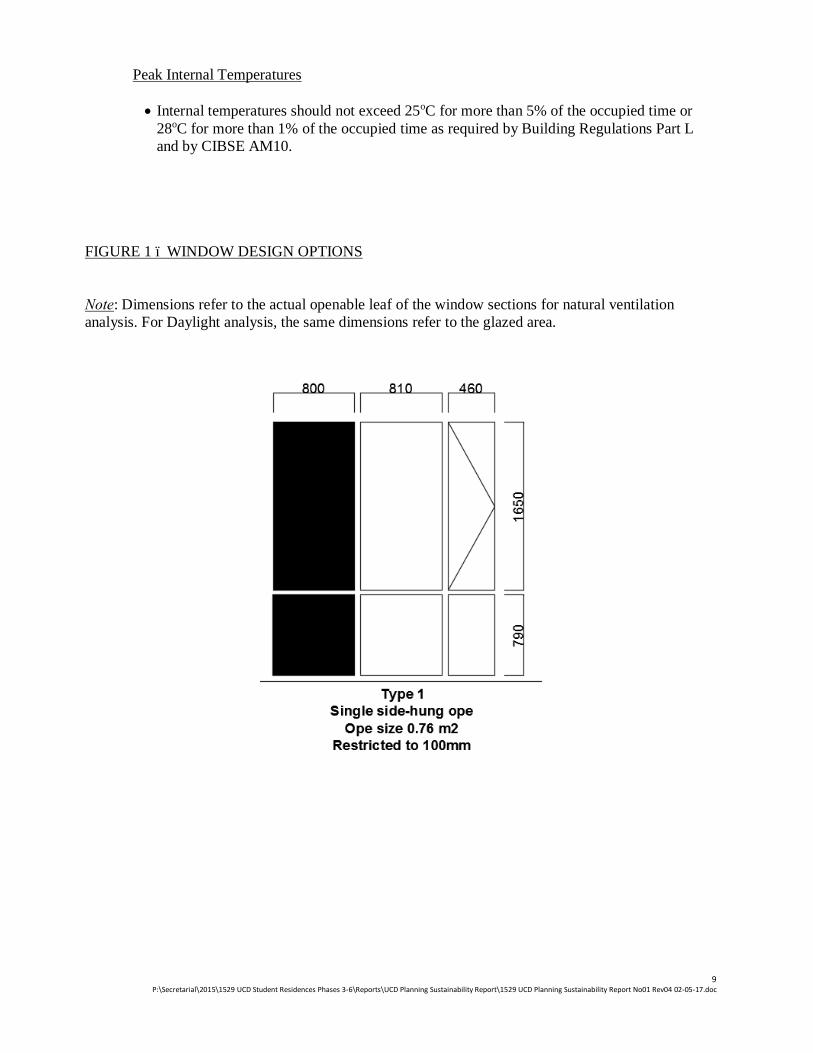
Peak Internal Temperatures
• Internal temperatures should not exceed 25oC for more than 5% of the occupied time or 28oC for more than 1% of the occupied time as required by Building Regulations Part L and by CIBSE AM10.
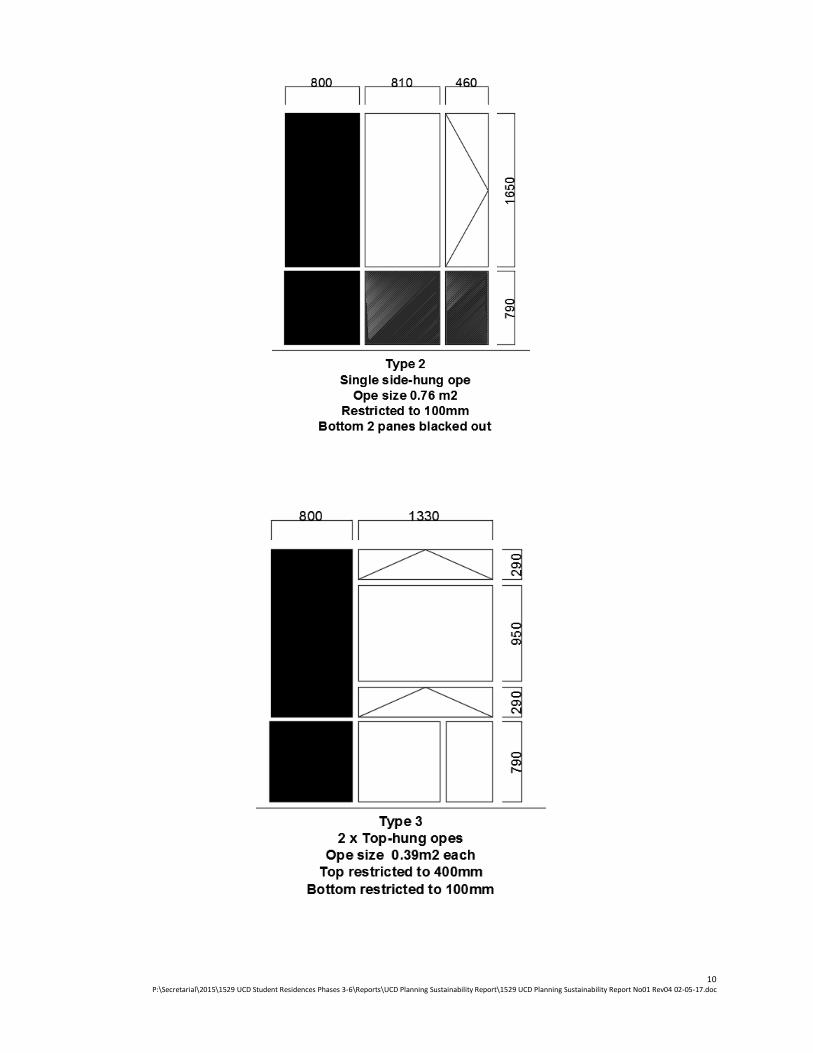
FIGURE 1 – WINDOW DESIGN OPTIONS Note: Dimensions refer to the actual openable leaf of the window sections for natural ventilation analysis. For Daylight analysis, the same dimensions refer to the glazed area.
10 P:\Secretarial\2015\1529 UCD Student Residences Phases 3-6\Reports\UCD Planning Sustainability Report\1529 UCD Planning Sustainability Report No01 Rev04 02-05-17.doc

11 P:\Secretarial\2015\1529 UCD Student Residences Phases 3-6\Reports\UCD Planning Sustainability Report\1529 UCD Planning Sustainability Report No01 Rev04 02-05-17.doc

12 P:\Secretarial\2015\1529 UCD Student Residences Phases 3-6\Reports\UCD Planning Sustainability Report\1529 UCD Planning Sustainability Report No01 Rev04 02-05-17.doc
13 P:\Secretarial\2015\1529 UCD Student Residences Phases 3-6\Reports\UCD Planning Sustainability Report\1529 UCD Planning Sustainability Report No01 Rev04 02-05-17.doc
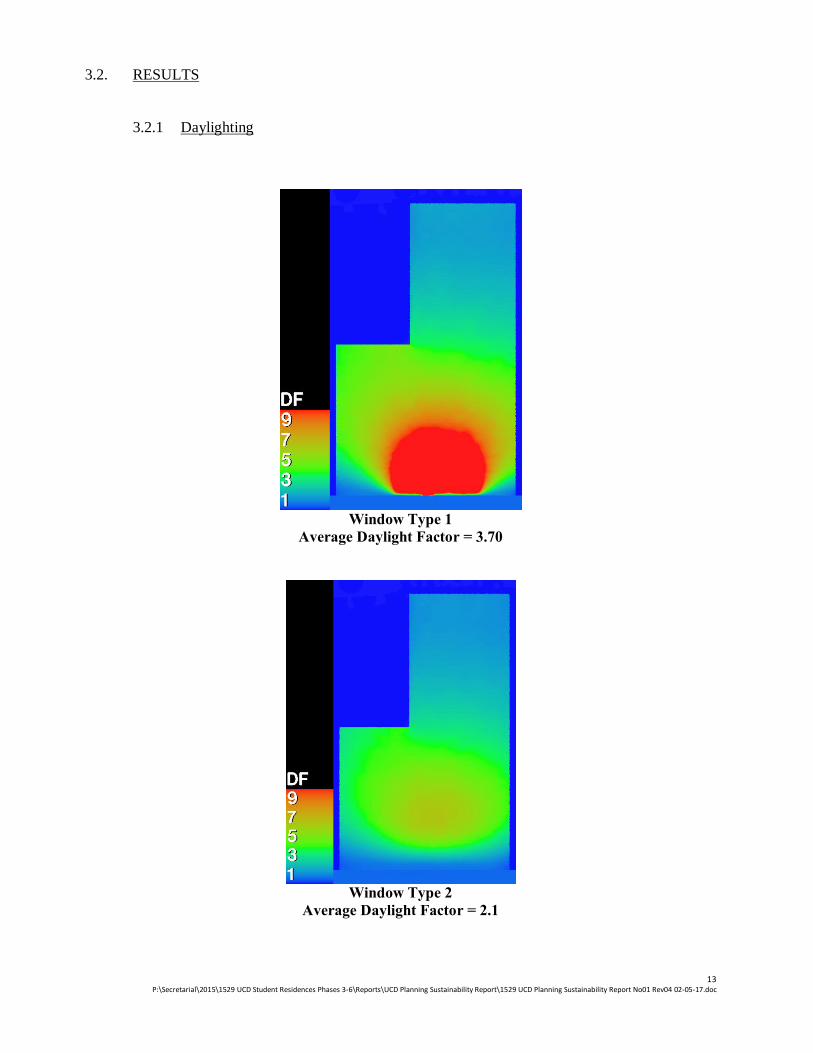
3.2. RESULTS
3.2.1 Daylighting
Window Type 1
Average Daylight Factor = 3.70
Window Type 2
Average Daylight Factor = 2.1

14 P:\Secretarial\2015\1529 UCD Student Residences Phases 3-6\Reports\UCD Planning Sustainability Report\1529 UCD Planning Sustainability Report No01 Rev04 02-05-17.doc
Window Type 3
Average Daylight Factor = 3.65
Window Type 4
Average Daylight Factor = 2.05
15 P:\Secretarial\2015\1529 UCD Student Residences Phases 3-6\Reports\UCD Planning Sustainability Report\1529 UCD Planning Sustainability Report No01 Rev04 02-05-17.doc
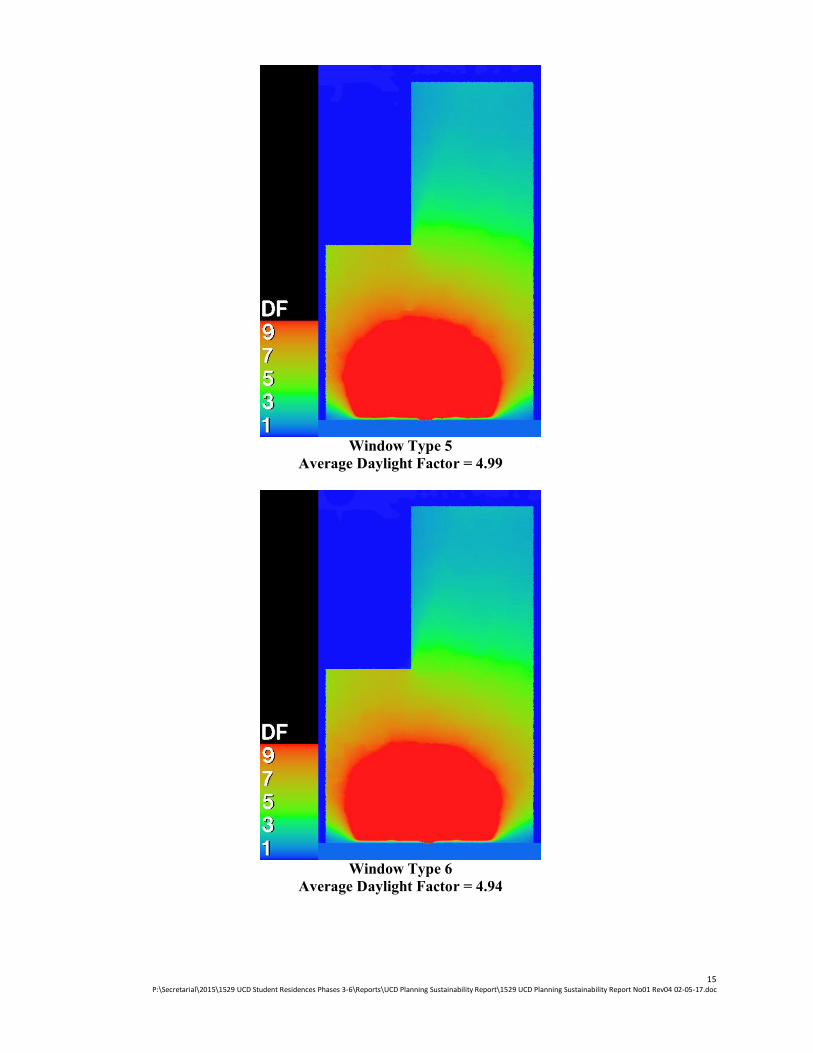
Window Type 5
Average Daylight Factor = 4.99
Window Type 6
Average Daylight Factor = 4.94

16 P:\Secretarial\2015\1529 UCD Student Residences Phases 3-6\Reports\UCD Planning Sustainability Report\1529 UCD Planning Sustainability Report No01 Rev04 02-05-17.doc
Window Type 7
Average Daylight Factor = 4.29
17 P:\Secretarial\2015\1529 UCD Student Residences Phases 3-6\Reports\UCD Planning Sustainability Report\1529 UCD Planning Sustainability Report No01 Rev04 02-05-17.doc
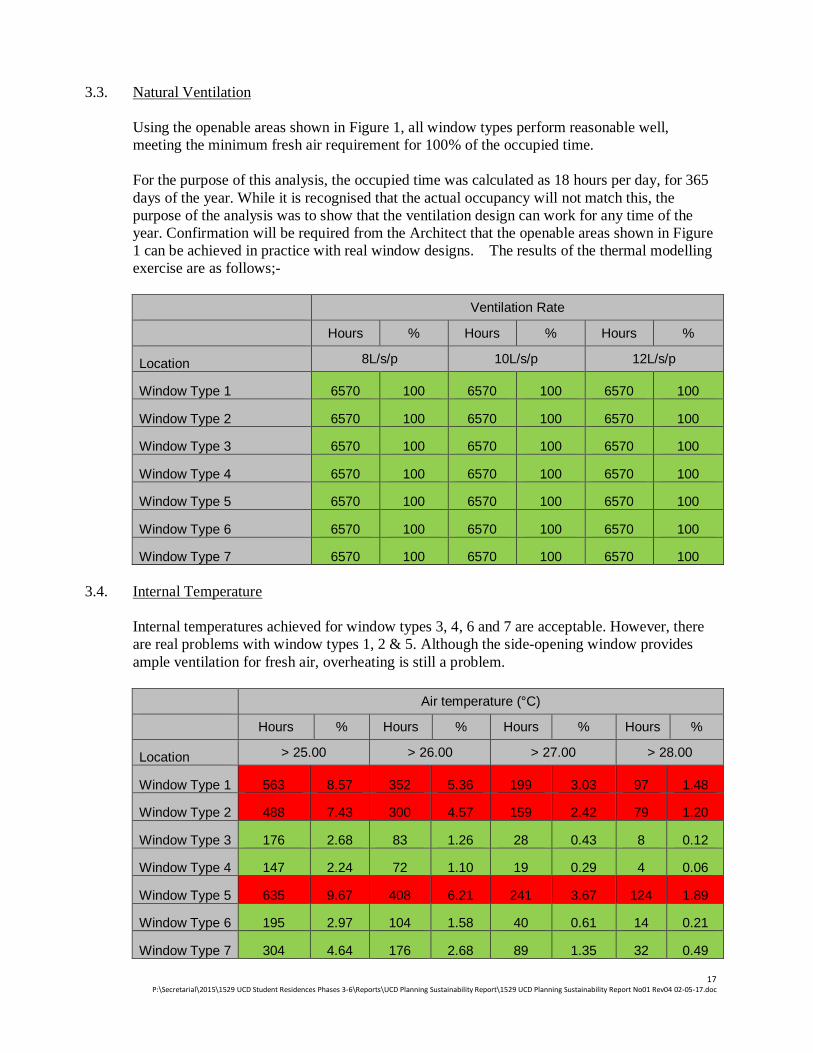
3.3. Natural Ventilation
Using the openable areas shown in Figure 1, all window types perform reasonable well, meeting the minimum fresh air requirement for 100% of the occupied time. For the purpose of this analysis, the occupied time was calculated as 18 hours per day, for 365 days of the year. While it is recognised that the actual occupancy will not match this, the purpose of the analysis was to show that the ventilation design can work for any time of the year. Confirmation will be required from the Architect that the openable areas shown in Figure 1 can be achieved in practice with real window designs. The results of the thermal modelling exercise are as follows;-
Ventilation Rate
Hours % Hours % Hours %
Location 8L/s/p 10L/s/p 12L/s/p
Window Type 1 6570 100 6570 100 6570 100
Window Type 2 6570 100 6570 100 6570 100
Window Type 3 6570 100 6570 100 6570 100
Window Type 4 6570 100 6570 100 6570 100
Window Type 5 6570 100 6570 100 6570 100
Window Type 6 6570 100 6570 100 6570 100
Window Type 7 6570 100 6570 100 6570 100 3.4. Internal Temperature
Internal temperatures achieved for window types 3, 4, 6 and 7 are acceptable. However, there are real problems with window types 1, 2 & 5. Although the side-opening window provides ample ventilation for fresh air, overheating is still a problem.
Air temperature (°C)
Hours % Hours % Hours % Hours %
Location > 25.00 > 26.00 > 27.00 > 28.00
Window Type 1 563 8.57 352 5.36 199 3.03 97 1.48
Window Type 2 488 7.43 300 4.57 159 2.42 79 1.20
Window Type 3 176 2.68 83 1.26 28 0.43 8 0.12
Window Type 4 147 2.24 72 1.10 19 0.29 4 0.06
Window Type 5 635 9.67 408 6.21 241 3.67 124 1.89
Window Type 6 195 2.97 104 1.58 40 0.61 14 0.21
Window Type 7 304 4.64 176 2.68 89 1.35 32 0.49
18 P:\Secretarial\2015\1529 UCD Student Residences Phases 3-6\Reports\UCD Planning Sustainability Report\1529 UCD Planning Sustainability Report No01 Rev04 02-05-17.doc
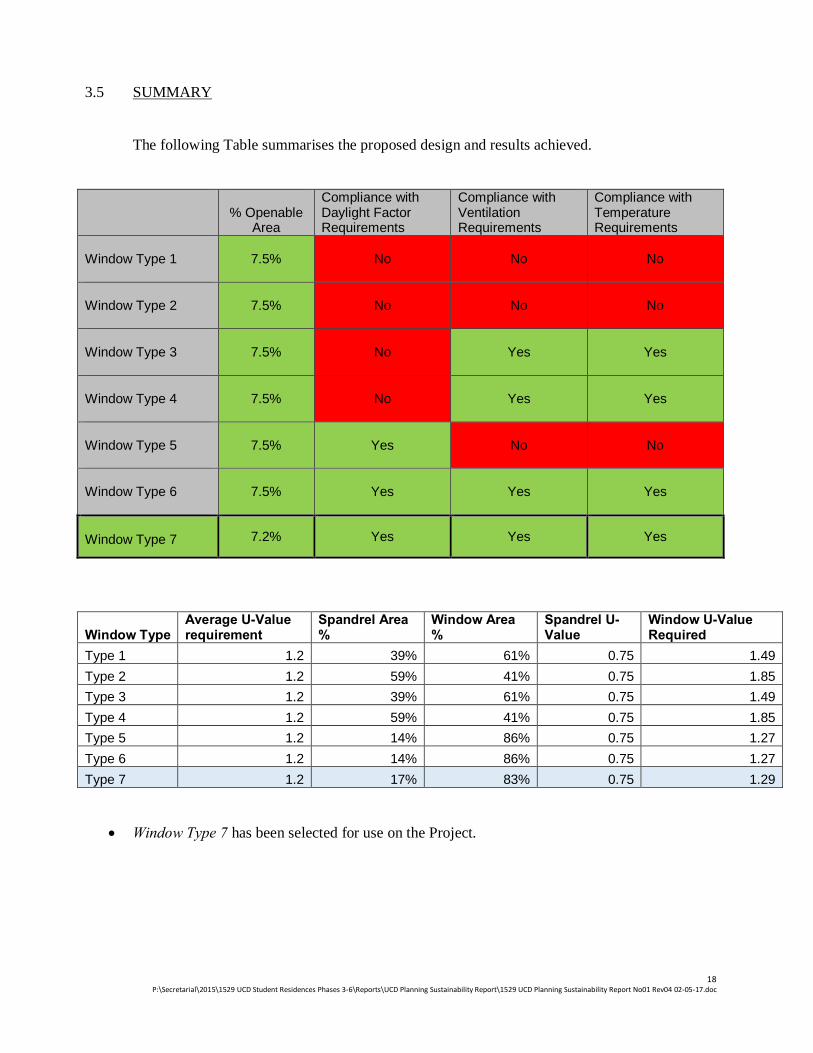
3.5 SUMMARY
The following Table summarises the proposed design and results achieved.
% Openable Area
Compliance with Daylight Factor Requirements
Compliance with Ventilation Requirements
Compliance with Temperature Requirements
Window Type 1
7.5% No No No
Window Type 2
7.5% No No No
Window Type 3
7.5% No Yes Yes
Window Type 4
7.5% No Yes Yes
Window Type 5
7.5% Yes No No
Window Type 6
7.5% Yes Yes Yes
Window Type 7 7.2% Yes Yes Yes
Window Type Average U-Value requirement
Spandrel Area %
Window Area %
Spandrel U-Value
Window U-Value Required
Type 1 1.2 39% 61% 0.75 1.49 Type 2 1.2 59% 41% 0.75 1.85 Type 3 1.2 39% 61% 0.75 1.49 Type 4 1.2 59% 41% 0.75 1.85 Type 5 1.2 14% 86% 0.75 1.27 Type 6 1.2 14% 86% 0.75 1.27 Type 7 1.2 17% 83% 0.75 1.29
• Window Type 7 has been selected for use on the Project.
19 P:\Secretarial\2015\1529 UCD Student Residences Phases 3-6\Reports\UCD Planning Sustainability Report\1529 UCD Planning Sustainability Report No01 Rev04 02-05-17.doc
4.0. WATER CONSERVATION PLAN 4.1 INTRODUCTION
UCD has an Internal Policy to minimize Water Consumption on all new Developments in the Campus. All Buildings will have dedicated 24-hour Water Storage and dedicated Rainwater Harvesting Storage to minimize the peak demand impact on the College internal mains Water System. Water consumption and the conservation of water has become increasingly important in recent times. There are a number of potential advantages from the conservation of water both environmentally and financially. The reduction in usage of water and the harvesting of rainwater result in reductions in energy, wastewater and in turn associated costs.
The water supply for the site will be taken from UCD mains network. There are a number of features which will be included in the design of the water services installation which will reduce the consumption of potable water.
4.2. LOW WATER USE SANITARY WARE
The sanitary ware selected within the buildings can have a significant effect on the water consumption. Low use appliances such as aerated taps, dual flush WC’s and low water use showers will be installed throughout the development The following is a table detailing maximum water consumption for various appliances:
Appliance Minimum Standard Dual Flush Cistern 6/4 Litres or better Showers <9 litres/min Taps Aerating Taps (approx. 0.5l/use) Urinals Cistern control device or waterless urinals
20 P:\Secretarial\2015\1529 UCD Student Residences Phases 3-6\Reports\UCD Planning Sustainability Report\1529 UCD Planning Sustainability Report No01 Rev04 02-05-17.doc
4.3. LEAK DETECTION
A leak detection system capable of detecting major leaks on the water supply will be included. The system will cover all mains water supply pipework between the building and the site boundary and will be capable of detecting major leaks that may otherwise go undetected Comparisons of actual usage as recorded within the building will be compared with a pre-determined expected usage pattern any excessive consumption caused by leaks will be detected by the BMS.
4.4. RAIN WATER HARVESTING & GREY WATER COLLECTION
There are two distinct methods which can be used to reduce the consumption of potable water supplies within buildings; rainwater harvesting and grey water collection. Rainwater harvesting is the practice of collecting precipitation which falls on the roof of the building and storing this water for use within the building. Grey water collection involves the collection of wastewater from wash hand basins or laundry uses within the building.
The water collected by either of the methods described above can be stored and used within the building, most commonly in WC’s or externally for irrigation of green spaces. It is proposed that rainwater collection will be the favoured over grey water recycling. Grey water systems can prove technically difficult and also presents more risks in terms of water borne contaminants in storage tanks. Rainwater collection and harvesting will be used for toilet and urinal flush in each building only.
4.5. IDENTIFICATION OF EXCESSIVE CONSUMPTION AND/OR LEAKS
A pulsed water meter shall be provided at the site boundary to continually record and monitor water consumption.
The pulsed meter will be linked to the Building Management System which will be programmed with a series of water consumption patterns for different times of the day, week and year. The BMS system will continually compare actual usage with predicted norms and where an out of range reading is recorded, the BMS will register an alarm.
The cold water storage tank overflows shall also be monitored on a regular basis and if found to be discharging then the mains water inlet ball valve shall be checked in conjunction with the tank outlets. Overflows shall be located to cause a “nuisance” in the event of a discharge. Any defects shall be corrected in a timely manner.

21 P:\Secretarial\2015\1529 UCD Student Residences Phases 3-6\Reports\UCD Planning Sustainability Report\1529 UCD Planning Sustainability Report No01 Rev04 02-05-17.doc
APPENDIX A – BER CERTIFICATE
22 P:\Secretarial\2015\1529 UCD Student Residences Phases 3-6\Reports\UCD Planning Sustainability Report\1529 UCD Planning Sustainability Report No01 Rev04 02-05-17.doc
APPENDIX B – BRIRL DOCUMENT
23 P:\Secretarial\2015\1529 UCD Student Residences Phases 3-6\Reports\UCD Planning Sustainability Report\1529 UCD Planning Sustainability Report No01 Rev04 02-05-17.doc

DRAFT TGD PART L 2017
COMPLIANCE REPORT
for
FULCRUM BUILDING, UCD
Project No. Document Title Rev Prepared by: Issue Date: Checked
by:
1529 Part L Report 02 JT 24/08/2017 SB
Part L Report
QF 19 Issue No. 02 Issue Date: 10/05/2017 Page 1 of 23

Part L Report
QF 19 Issue No. 02 Issue Date: 10/05/2017 Page 2 of 23
CONTENTS
PAGE
SECTION 1 BUILDING REGULATIONS & BER 3
SECTION 2 INPUT DATA 7
SECTION 3 ENERGY EFFICIENCY & SUSTAINABILITY 9
3.1 Reducing Energy Consumption – Building Fabric 9
3.2 Low Carbon & Renewable Energy Solutions 10
3.3 Rainwater Harvesting 11
SECTION 4 ENERGY RESULTS 12
4.1 Interim NZEB Standards 12
4.2 Overheating Requirements 15
4.3 CO2 Concentration 16
4.2 Solar Gains 17
APPENDIX A – NZEB INTERIM TOOL 18
APPENDIX B – BER CERTIFICATE 20
APPENDIX C – OVERHEATING & CO2 RESULTS 21
APPENDIX D – TM52 ANALYSIS RESULTS 22

Part L Report
QF 19 Issue No. 02 Issue Date: 10/05/2017 Page 3 of 23
SECTION 1 BUILDING REGULATIONS & BER This report sets out to demonstrate compliance with the “Draft TGD Part L 2017 Buildings Other Than Dwellings” and “Interim NZEB Performance Specification” for new buildings owned and occupied by public authorities. This will apply to the ground and first floor of the UCD Fulcrum Building only. The Fulcrum studio apartments, constructed from level 2 to 6 are dealt with separately. It is proposed to construct the building to the SEAIs Interim NZEB specification which is detailed in the following pages. To achieve compliance with the interim NZEB standards, the actual building must be compared with a “reference” building, using the input data taken from Appendix 1 of the interim NZEB Performance Specification. The actual building must use less energy than the reference building, on a W/m2 basis. To fully comply with the interim NZEB standards, the building must also demonstrate that 20% of the building energy is provided via on-site renewable sources. In addition to NZEB compliance, this report will also include a BER certificate for the first two floors of the Fulcrum Building.

Part L Report
QF 19 Issue No. 02 Issue Date: 10/05/2017 Page 4 of 23

Part L Report
QF 19 Issue No. 02 Issue Date: 10/05/2017 Page 5 of 23

Part L Report
QF 19 Issue No. 02 Issue Date: 10/05/2017 Page 6 of 23
Part L Report
QF 19 Issue No. 02 Issue Date: 10/05/2017 Page 7 of 23
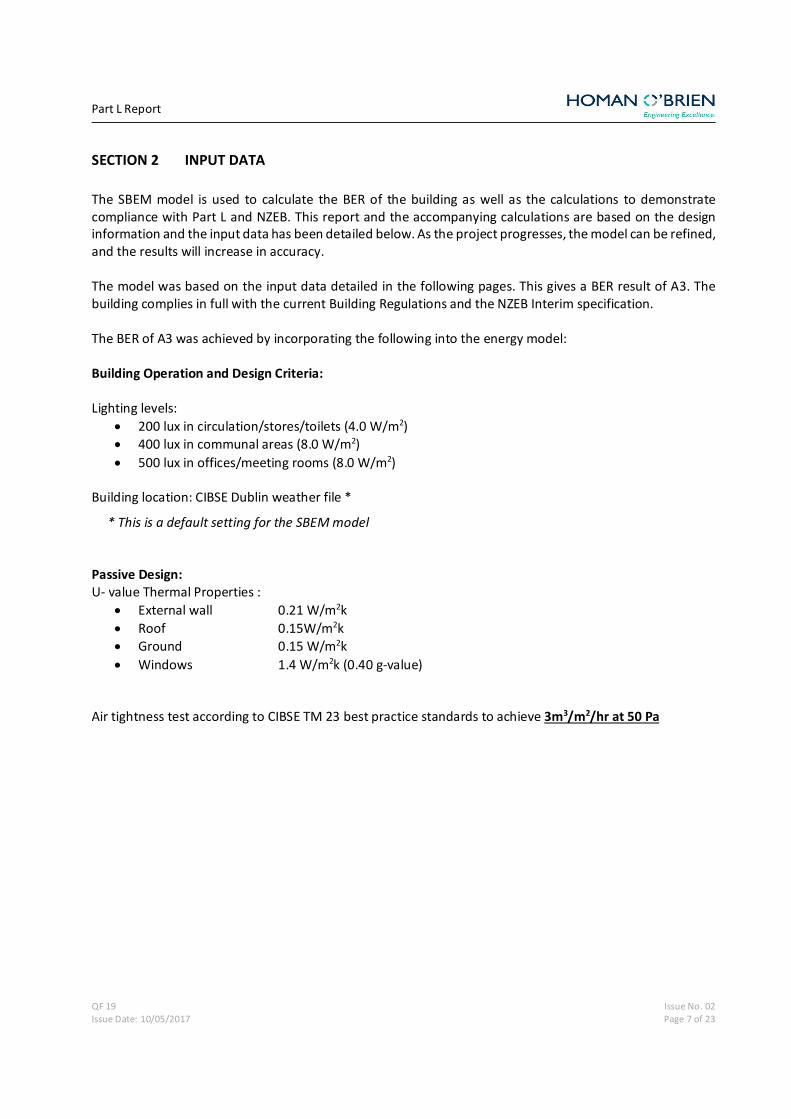
SECTION 2 INPUT DATA The SBEM model is used to calculate the BER of the building as well as the calculations to demonstrate compliance with Part L and NZEB. This report and the accompanying calculations are based on the design information and the input data has been detailed below. As the project progresses, the model can be refined, and the results will increase in accuracy. The model was based on the input data detailed in the following pages. This gives a BER result of A3. The building complies in full with the current Building Regulations and the NZEB Interim specification. The BER of A3 was achieved by incorporating the following into the energy model: Building Operation and Design Criteria: Lighting levels:
• 200 lux in circulation/stores/toilets (4.0 W/m2) • 400 lux in communal areas (8.0 W/m2) • 500 lux in offices/meeting rooms (8.0 W/m2)
Building location: CIBSE Dublin weather file *
* This is a default setting for the SBEM model Passive Design: U- value Thermal Properties :
• External wall 0.21 W/m2k • Roof 0.15W/m2k • Ground 0.15 W/m2k • Windows 1.4 W/m2k (0.40 g-value)
Air tightness test according to CIBSE TM 23 best practice standards to achieve 3m3/m2/hr at 50 Pa
Part L Report
QF 19 Issue No. 02 Issue Date: 10/05/2017 Page 8 of 23
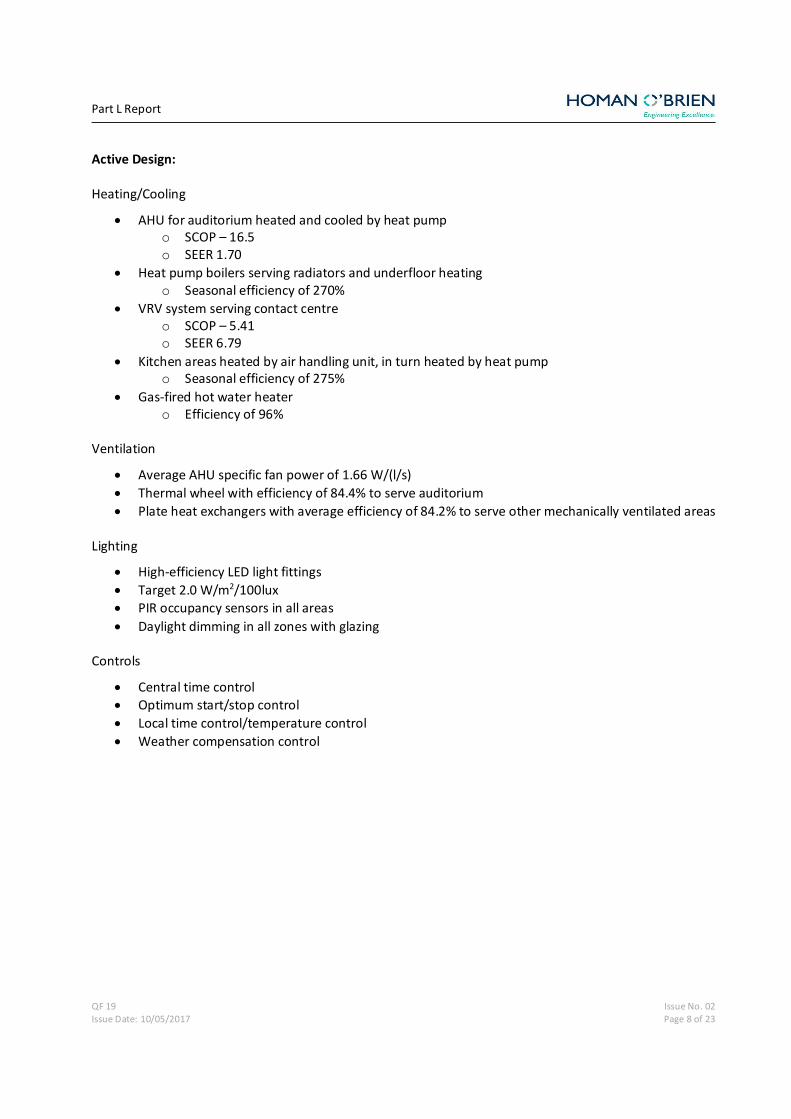
Active Design: Heating/Cooling
• AHU for auditorium heated and cooled by heat pump o SCOP – 16.5 o SEER 1.70
• Heat pump boilers serving radiators and underfloor heating o Seasonal efficiency of 270%
• VRV system serving contact centre o SCOP – 5.41 o SEER 6.79
• Kitchen areas heated by air handling unit, in turn heated by heat pump o Seasonal efficiency of 275%
• Gas-fired hot water heater o Efficiency of 96%
Ventilation
• Average AHU specific fan power of 1.66 W/(l/s) • Thermal wheel with efficiency of 84.4% to serve auditorium • Plate heat exchangers with average efficiency of 84.2% to serve other mechanically ventilated areas
Lighting
• High-efficiency LED light fittings • Target 2.0 W/m2/100lux • PIR occupancy sensors in all areas • Daylight dimming in all zones with glazing
Controls
• Central time control • Optimum start/stop control • Local time control/temperature control • Weather compensation control
Part L Report
QF 19 Issue No. 02 Issue Date: 10/05/2017 Page 9 of 23
SECTION 3 ENERGY EFFICIENCY & SUSTAINABILITY
3.1 Reducing Energy Consumption – Building Fabric In order to reduce the energy consumption of the heating and lighting systems integration between the architects, services engineer and structural engineer is required. This approach ensures the form of the building seeks to minimise heat gains in summer and heat loss in winter and also ensures that the choice of heating, cooling and ventilation systems will complement the building design and vice versa. 3.1.1 Elemental U-Values
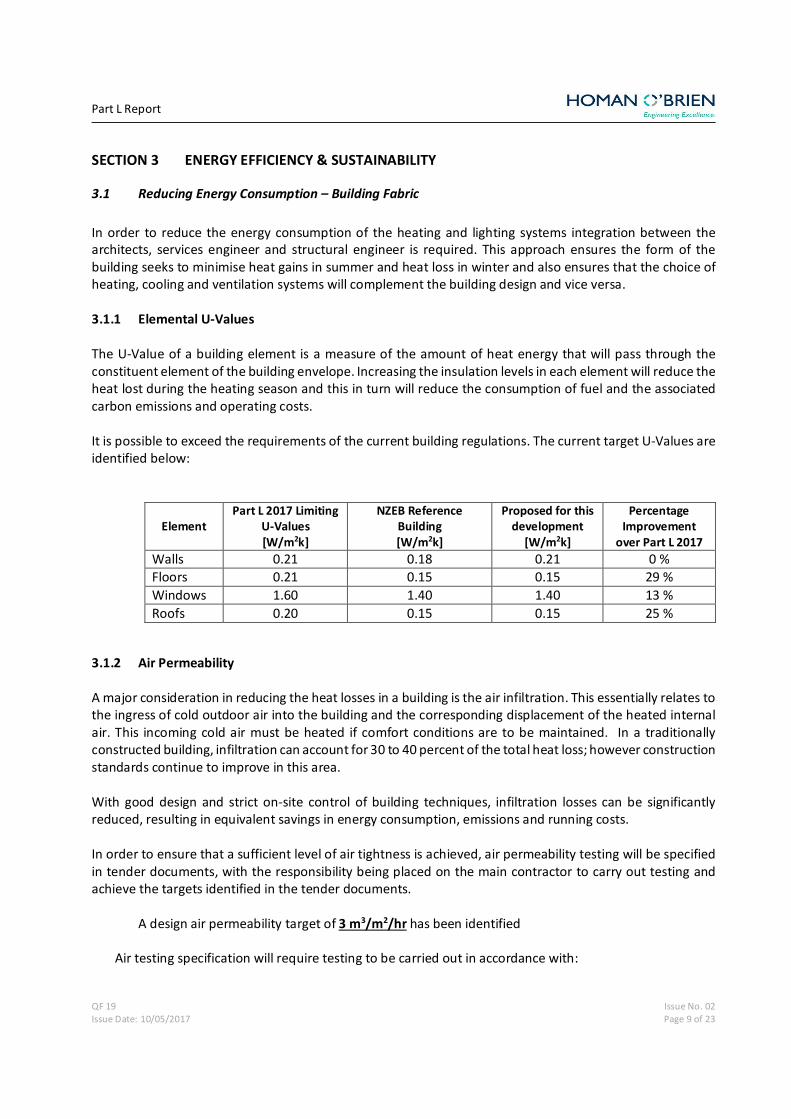
The U-Value of a building element is a measure of the amount of heat energy that will pass through the constituent element of the building envelope. Increasing the insulation levels in each element will reduce the heat lost during the heating season and this in turn will reduce the consumption of fuel and the associated carbon emissions and operating costs. It is possible to exceed the requirements of the current building regulations. The current target U-Values are identified below:
Element Part L 2017 Limiting
U-Values [W/m2k]
NZEB Reference Building [W/m2k]
Proposed for this development
[W/m2k]
Percentage Improvement
over Part L 2017 Walls 0.21 0.18 0.21 0 % Floors 0.21 0.15 0.15 29 % Windows 1.60 1.40 1.40 13 % Roofs 0.20 0.15 0.15 25 %
3.1.2 Air Permeability A major consideration in reducing the heat losses in a building is the air infiltration. This essentially relates to the ingress of cold outdoor air into the building and the corresponding displacement of the heated internal air. This incoming cold air must be heated if comfort conditions are to be maintained. In a traditionally constructed building, infiltration can account for 30 to 40 percent of the total heat loss; however construction standards continue to improve in this area. With good design and strict on-site control of building techniques, infiltration losses can be significantly reduced, resulting in equivalent savings in energy consumption, emissions and running costs.
In order to ensure that a sufficient level of air tightness is achieved, air permeability testing will be specified in tender documents, with the responsibility being placed on the main contractor to carry out testing and achieve the targets identified in the tender documents.
A design air permeability target of 3 m3/m2/hr has been identified Air testing specification will require testing to be carried out in accordance with:

Part L Report
QF 19 Issue No. 02 Issue Date: 10/05/2017 Page 10 of 23
o BS EN 13829:2001 ‘Determination of air permeability of buildings, fan pressurisation method’
o CIBSE TM23: 2000 ‘Testing buildings for air leakage’
3.2 Low Carbon & Renewable Energy Solutions
The building services design on any project is responsible for a large part of how a building will consume energy. The design of heating, ventilation and lighting systems will determine the energy consumption characteristics of the building. The approach that has been adopted to delivering a development which is both highly efficient and sustainably designed has been to involve all members of the design team from the earliest possible stage in the design process. This integrated design approach will be continued throughout the design process. This approach ensures that the knowledge and expertise of each member of the design team was available from the outset. The goals for sustainable design were identified at this early stage and each element of the design was progressed accordingly. Several renewable and low carbon technologies were considered during the preliminary design process and heat pump technology was selected. Heat Pump Technology The general principal of heat pump technology is the use of electrical energy to drive a refrigerant cycle capable of extracting heat energy from one medium at one temperature and delivering this heat energy to a second medium at the desired temperature. The basic thermodynamic cycle involved is reversible which allows the heat pump to be used for heating or cooling. The efficiency of any heat pump system is measured by it’s coefficient of performance (CoP). This is a comparison between the electrical energy required to run the heat pump and the useful heat output of the heat pump, e.g. a heat pump requiring 1kW of electrical power in order to deliver 3kW of heat energy has a CoP of 3.0. This operating principle can be applied to different situations, making use of the Most readily available heat source on any given site. The most common types are.
• Ground Source • Water Source • Air Source
Water source heat pumps generally offer the highest CoP however they can be expensive to install and maintain and must have a source of water from a well, lake or river.

Part L Report
QF 19 Issue No. 02 Issue Date: 10/05/2017 Page 11 of 23
An initial technical and financial analysis of the technology has shown that water-source will not be suitable for use within the building. There are also concerns regarding the potential practical difficulties and programming implications of incorporating vertical boreholes. Air-source heat pump technology will be included in the form of a VRV system and integrated AHU heating & cooling. Air-to-water heat pumps will also be included to serve radiators, underfloor heating and AHU heating.
3.3 Rainwater Harvesting A rainwater harvesting system will be included in the development, although this does not affect the BER or Part L calculations. There is no provision in the SBEM software to input this data.

Part L Report
QF 19 Issue No. 02 Issue Date: 10/05/2017 Page 12 of 23
SECTION 4 ENERGY RESULTS
4.1 Interim NZEB Standards To test compliance with the interim NZEB standards, a reference building must be created based on data from SEAI. This input data for the reference building is detailed below:

Part L Report
QF 19 Issue No. 02 Issue Date: 10/05/2017 Page 13 of 23
There are three main criteria required to meet the NZEB standards: - The Energy Performance Co-efficient (EPC) must be lower than the reference building - The Carbon Performance Co-efficient (CPC) must be now more than 15% higher than the reference
building - The Renewable Energy Ratio (RER) must be at least 0.20, or 20% of the total building energy.
To meet the 20% renewable energy ratio, heat pump boilers have been included in the design:
Required Achieved EPC ≤1.00 0.87 Compliant CPC ≤1.15 0.93 Compliant RER ≥0.20 0.20 Compliant
Part L Report
QF 19 Issue No. 02 Issue Date: 10/05/2017 Page 14 of 23
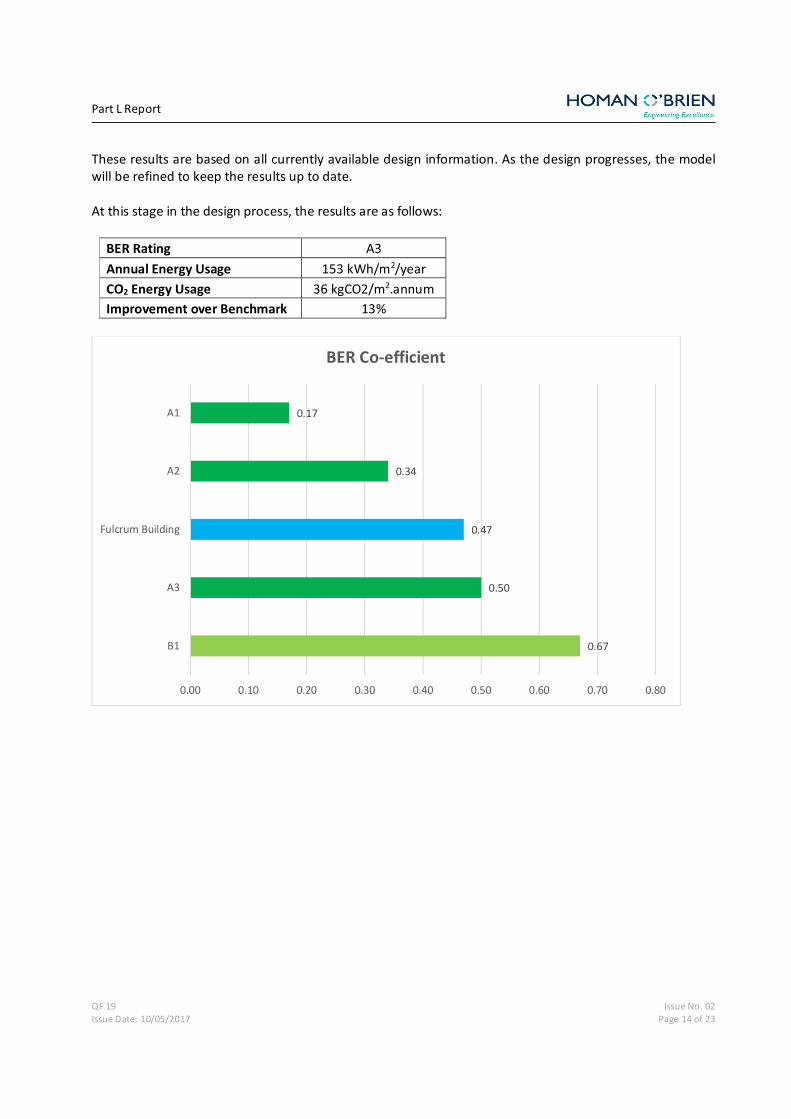
These results are based on all currently available design information. As the design progresses, the model will be refined to keep the results up to date. At this stage in the design process, the results are as follows:
BER Rating A3 Annual Energy Usage 153 kWh/m2/year CO2 Energy Usage 36 kgCO2/m2.annum Improvement over Benchmark 13%
0.67
0.50
0.47
0.34
0.17
0.00 0.10 0.20 0.30 0.40 0.50 0.60 0.70 0.80
B1
A3
Fulcrum Building
A2
A1
BER Co-efficient
Part L Report
QF 19 Issue No. 02 Issue Date: 10/05/2017 Page 15 of 23
4.2 Avoidance of Overheating 4.1.1 Part L Requirements The NZEB Interim Performance Spec suggests that “Public Authorities should work with their design teams to define a satisfactory criteria for the internal environment”. The requirements for the 2017 Part L calcs are that each room must receive less solar gains over the period of April to September than a reference building laid out in section 1.3.5 of the TGD. Unfortunately, this calculation is not possible with the current SBEM software, and the new version will not be released until next year. The previous Part L requirements were to ensure that naturally ventilated spaces will not exceed 28oC for in excess of 1% of the annual occupied hours Calculations were carried out using IESVE software to demonstrate that the current design complies with Part L. To improve the design, the hours over 28oC are limited to 1% of the summer occupied hours, rather than the annual occupied hours. Results shown in Appendix C. In addition, the temperature above 25oC was limited to 5% of the summer occupied hours. The building has been modelled as being occupied between 8am and 10pm including the weekends, from 1st April to 30th September. The solar gains aspect of Part L will be dealt with in section 4.4. 4.2.1 TM 52 The building has also been tested for compliance with CIBSE Technical Memorandum 52, which sets out three criteria for overheating. Each room must pass at least two of these three criteria to comply with TM52:
Criteria 1 - This displays the percentage hours when the difference in operative temperature minus the maximum acceptable temperature is greater than or equal to 1 K. Criteria 2 - This displays the maximum daily degree hours found for the space. This fails if it is greater than 6 K. Criteria 3 - This displays the maximum ΔT for the space. This space fails if it is greater than or equal to 4 K.
The results for compliance with TM52 can be found in Appendix D, these results are based on an air speed of 0.15 m/s, taken from ASHRAE 55:
“For operative temperatures below 22.5 ºC (72.5 ºF), the limit will be 0.15 m/s (30 ft/min), to avoid local cold discomfort due to draft.” – ASHRAE 55 5.2.3.3.2

Part L Report
QF 19 Issue No. 02 Issue Date: 10/05/2017 Page 16 of 23
4.3 CO2 Concentration It is important that the ventilation design provides adequate fresh air for the given occupancy of any occupied space. This fresh air prevents the carbon dioxide concentration from reaching uncomfortable levels. High levels of CO2 concentration can result in a reduction in concentration and productivity as well as the comfort considerations, so it is vital for CO2 to be kept within reasonable ranges. Levels of CO2 concentration can be measured in parts per million (ppm) and CIBSE suggests that the concentration should not exceed 1000 ppm, with a reduction to 600-800 ppm more desirable. The table in Appendix C shows the CO2 concentration for each occupied room in the building.

Part L Report
QF 19 Issue No. 02 Issue Date: 10/05/2017 Page 17 of 23
4.4 Solar Gains Under Part L, there is also a requirement to keep the solar gains below 25 W/m2 in perimeter zones for occupied spaces. Based on the current input data, and including the Brie Soleil indicated on the BIM Model, a number of rooms currently exceed the limit of 25 W/m2 for solar gains. It is recommended that the solar gains to these spaces be reduced by shading, improved g-values or reduced glazing area.
Room Total Floor Area Solar Gains (kW) Solar Gains (W/m2) 00 Atrium 1270.139 27.26 21.46 00 Auditorium 302.227 0.00 0.00 00 CCTV 22.819 0.35 15.14 00 Grocery Shop / Deli 267.85 3.37 12.56 00 Kitchen 85.54 0.10 1.17 00 Office 02 15.428 0.33 21.07 00 Reception 20.328 0.36 17.68 00 Restaurant 11.515 0.16 14.19 00 Shop 01 87.119 2.16 24.84 00 Shop 02 52.799 0.50 9.54 00 Shop 03 52.943 0.63 11.81 00 Shop 04 52.883 0.62 11.77 01 Aerobics Room 86.07 1.86 21.61 01 Atrium 50.37 1.11 21.96 01 Bookable Room 05 659.963 6.26 9.48 01 Community Liaison 81.59 1.39 17.02 01 Consultation 1 16.873 0.34 20.43 01 Consultation 2 18.668 0.38 20.42 01 Consultation 3 21.75 0.26 11.87 01 Consultation 4 35.913 0.83 22.99 01 Female Changing 24.15 0.53 22.00 01 First Aid 30.319 0.23 7.73 01 Gym 20.313 0.24 11.88 01 Male Changing 110.461 2.28 20.66 01 Meeting 30.319 0.23 7.58 01 Nutrition 22.084 0.53 24.21 01 Office (Above kitchen) 33.627 0.34 10.18 01 Office (Consultation Rooms) 11.921 0.21 17.70 01 Open Plan Office 21.498 0.28 12.82 01 Pastoral Office 88.888 1.57 17.70 01 Reflection Rooms (N) 16.873 0.34 20.43 01 Reflection Rooms (S) 19.277 0.18 9.10 01 Repro Room 19.091 0.04 1.86
Part L Report
QF 19 Issue No. 02 Issue Date: 10/05/2017 Page 18 of 23
APPENDIX A – NZEB INTERIM TOOL
Part L Report
QF 19 Issue No. 02 Issue Date: 10/05/2017 Page 19 of 23
Part L Report
QF 19 Issue No. 02 Issue Date: 10/05/2017 Page 20 of 23
APPENDIX B – BER CERTIFICATE

Part L Report
QF 19 Issue No. 02 Issue Date: 10/05/2017 Page 21 of 23
APPENDIX C – OVERHEATING & CO2 RESULTS
Part L Report
QF 19 Issue No. 02 Issue Date: 10/05/2017 Page 22 of 23
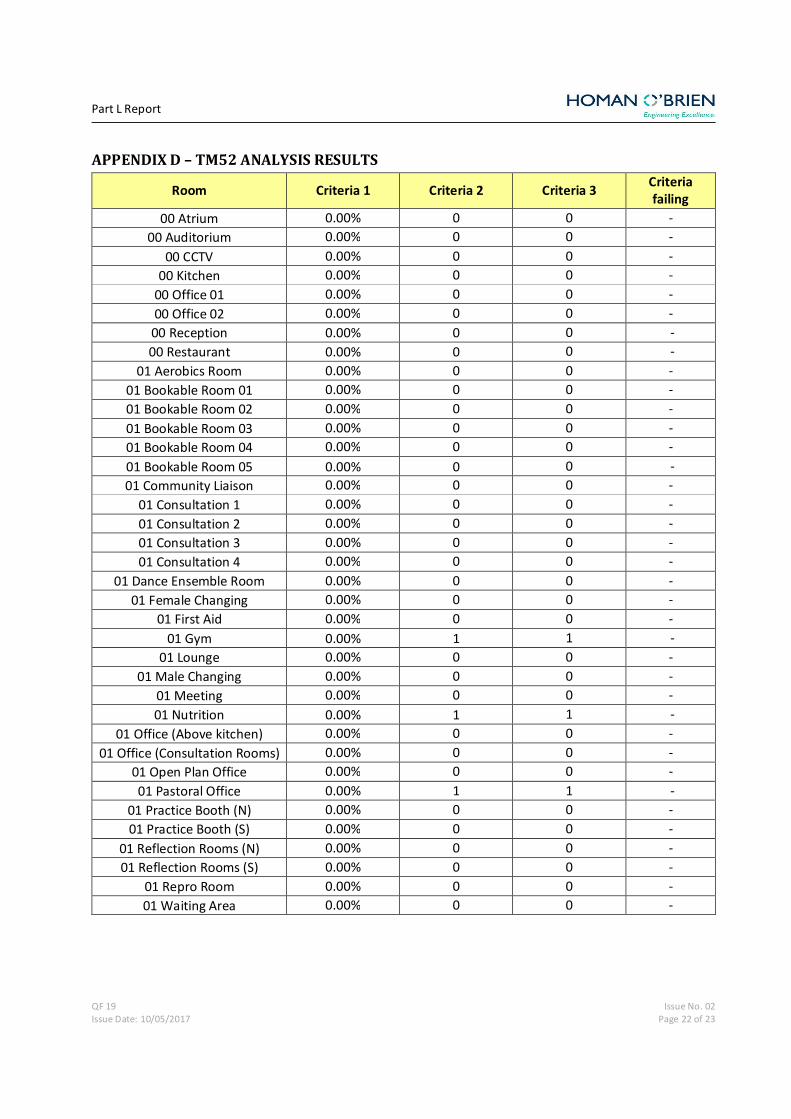
APPENDIX D – TM52 ANALYSIS RESULTS
Room Criteria 1 Criteria 2 Criteria 3 Criteria failing
00 Atrium 0.00% 0 0 - 00 Auditorium 0.00% 0 0 -
00 CCTV 0.00% 0 0 - 00 Kitchen 0.00% 0 0 -
00 Office 01 0.00% 0 0 - 00 Office 02 0.00% 0 0 - 00 Reception 0.00% 0 0 - 00 Restaurant 0.00% 0 0 -
01 Aerobics Room 0.00% 0 0 - 01 Bookable Room 01 0.00% 0 0 - 01 Bookable Room 02 0.00% 0 0 - 01 Bookable Room 03 0.00% 0 0 - 01 Bookable Room 04 0.00% 0 0 - 01 Bookable Room 05 0.00% 0 0 - 01 Community Liaison 0.00% 0 0 -
01 Consultation 1 0.00% 0 0 - 01 Consultation 2 0.00% 0 0 - 01 Consultation 3 0.00% 0 0 - 01 Consultation 4 0.00% 0 0 -
01 Dance Ensemble Room 0.00% 0 0 - 01 Female Changing 0.00% 0 0 -
01 First Aid 0.00% 0 0 - 01 Gym 0.00% 1 1 -
01 Lounge 0.00% 0 0 - 01 Male Changing 0.00% 0 0 -
01 Meeting 0.00% 0 0 - 01 Nutrition 0.00% 1 1 -
01 Office (Above kitchen) 0.00% 0 0 - 01 Office (Consultation Rooms) 0.00% 0 0 -
01 Open Plan Office 0.00% 0 0 - 01 Pastoral Office 0.00% 1 1 -
01 Practice Booth (N) 0.00% 0 0 - 01 Practice Booth (S) 0.00% 0 0 -
01 Reflection Rooms (N) 0.00% 0 0 - 01 Reflection Rooms (S) 0.00% 0 0 -
01 Repro Room 0.00% 0 0 - 01 Waiting Area 0.00% 0 0 -