Embed Size (px)
Citation preview
Institute for Software ResearchUniversity of California, Irvine
www.isr.uci.edu/tech-reports.html
Danyel FisherUniversity of California, [email protected]
Paul DourishUniversity of California, [email protected]
Activating the Social Workscape
August 2002
ISR Technical Report # UCI-ISR-02-2
Institute for Software ResearchICS2 210
University of California, IrvineIrvine, CA 92697-3425
www.isr.uci.edu

Activating the Social Workscape
Danyel Fisher and Paul DourishInstitute for Software ResearchUniversity of California, Irvine
{danyelf,jpd}@ics.uci.edu
ISR Technical Report #UCI-ISR-02-2
Abstract: Most everyday tasks performed on or through computer systems involvemultiple people. Documents are written for others and sent to them; email messagesarrive from individuals and are sent to groups; web pages are written for others to read,and presentations are created to communicate ideas to others. By contrast, mostinteractive computer systems are stubbornly and resolutely individual. Even emailsystems – perhaps the prototypical example of an everyday system that involves multiplepeople – tend to be constructed as single-user browsers for databases of text objects(messages), conveying little “sense of the other.” One line of research that we arecurrently pursuing is to monitor, model, and derive information about the temporal andsocial patterns that characterize people’s interactions with each other, and thenincorporate this information into the user experience. Our goal is to invest the userinterface with a sense of the social workscape within which it is used and embedded.
Page 1 of 10 Activatin g the So cial W o rkscape August 23, 2002
ACTIVATING TH E SOCIAL W ORKSCAPE Danyel Fisher and Paul Dourish
UCI-ISR-02-2 August, 2002
INTRODUCTION Today’s PC is very much a “personal” computer. Conventional computer systems are designed around the paradigm of an individual user sitting in front of a single computer. The interaction model provided in typical desktop interfaces has followed suit, and provided interfaces and applications that focus on individuals and their information.
Everyday life is very different, though. In the everyday world, we don’t talk about interacting with information, but with other people. Our daily activities are suffused with other people, and the information that we process is typically enmeshed in processes by which we communicate, collaborate, and deliberate with others. Our computers may serve as intermediaries and storage devices, holding and displaying messages from others or carrying artifacts that we exchange with them, but it’s the other people who are the central elements of our lives. In a pinch, we could work without the computer, but we couldn’t get by without the colleagues, customers, friends and family who occupy our lives.
The observation that communication and collaboration are central aspects of working activities is the launching-point for the research domain of Computer-Supported Cooperative Work, which seeks to understand the relationship between technology and collaboration, and to provide tools that explicitly support the ways that people interaction and work in concert. Much of the technical output of CSCW has consisted of collaborative or “groupware” tools. However, we believe that this approach creates an artificial distinction between “single-user” and “multi-user” technologies. If we take seriously the observation that almost all forms of activity involve either implicit or explicit interaction with others, then it follows that support for collaboration should not be isolated to specific applications, but rather should be incorporated throughout the user experience. The author of an individual document, sitting alone in front of a computer, is working with a co-author, colleagues, and future readers in mind.
In other words, the traditional approach creates a separation between collaborative and individual work which we believe is inappropriate and unwarranted. To the user, there is no such distinction: rather, projects flow smoothly between individual and shared tasks. A telling case of this false division is that of email programs. Sending, reading, and processing email messages are inherently collaborative activities, ones in which we might expect to be suffused with a “sense of the other.” Yet, most email programs are essentially single-user browsers for databases of text documents: an archive of files, labeled with “from” and “date” fields. Contacts are limited to being a string with an “@” sign in the middle, and little more. Some programs allow manipulations of the address book (another database) to store a phone number, but there is no mechanism to communicate information about users. More critically, there is no sense of the pattern of interactions with these individuals, nor any representation or way to visualize the intricate threads of activity lying behind each message. The essential activities that electronic mail supports are somehow left out.
A second example of this division is in the design of current-day file systems and their shells. Currently, it is possible to search a file system by the name and date of a file—but there's no way to find files based on who last edited them, or who emailed them, although this could be useful information to the user. In fact, many of the files stored in personal filespaces are meant to be shared, and were previously received or sent by another person. A file system that has a notion
Page 2 of 10 Activatin g the So cial W o rkscape August 23, 2002
of a social workscape would be aware of what people are associated with which files. Practically, the user of such a file system might be able to quickly review their collaborations with a colleague just before a meeting.
The goal of our current research is to break down this division by introducing collaborative aspects to the ordinary single-user experience, and to bring a better awareness of the presence of other users to the computer and the desktop. The two concepts around which our designs are based are those of social netw orks and rhy thm s.
SOCIAL NETW ORKS This project is conceptualized around the idea of social networks—the set of connections that people make between each other as they interact. This idea, borrowed from the social sciences, has gained some currency as a way to analyze patterns in a group's interaction. Social networks can be used to trace a range of potential relationships between people – their interactions, their mutual presence in physical space, their knowledge of each other or of common others, their membership in institutions, etc. Each network reflects a pattern of relationships which ties individuals together. Theories of social networks have provided mechanisms for analyzing a variety of group behaviors, from the behavior of criminal groups (Krebs, 2002) to the locations of expertise in companies (Burt, 1995). By tracing the connections in a group, network analysts can draw a “ big picture” and search for important patterns (such as smaller clusters, the centrality of specific individuals, the network size and growth patterns, etc.)
Traditionally, a researcher looks at the network from without, and performs a social network analysis on a group of participants for the purpose of an external review. By contrast, this project inverts that design, viewing networks from the perspective of, and for the benefit of, the end user. The central questions we are interested in addressing are, first, can social network information be used as a way to reflect patterns of action and interaction back to members of the group? Second, can this information be integrated into existing tools in order to provide a “ sense of the other” through traditional technologies? Third, to what extent is it possible to automatically extract and analyze this information, with as little direct intervention by the end user as possible?
RH YTH MS AND DYNAMICS Networks are not static entities: members become more or less important as the day progresses. Similarly, patterns of individual action and interaction change over time, in both small and large scales. The user examining his or her social network may want to know about the connections that have happened within the last week, or those that have extended over the past year. Our research attempts to make network information more meaningful and more salient for end users by incorporating understandings of cycles of action.
1.Rhythm ic chan ge s o ve r the sho rt te rm In the short term, over the course of a day or a week, a person’s availability varies. A colleague may be out of the room, or in another place; they may be working actively, or in a meeting. To some extent, these states are predictable—people tend to take lunch and head home around the same time each day. This project seeks to predict short-term availability and interest based on previous activity logs.
2 .Dyn am ic chan ge s in the lo n ge r te rm In the longer term, over a month or a year, social networks themselves change. Collaborators from a previous project fade away; new colleagues become important. By reflecting these

Page 3 of 10 Activatin g the So cial W o rkscape August 23, 2002
changes in response to both user input and system changes, this project allows users to remain aware of less-current connections, and to understand how those changes affect their active networks.
INTUITIONS Based on these related notions of social networks and rhythms, we are exploring the following ideas:
x Collaborative facilities might fruitfully be combined with the desktop and other traditionally single-user environments;
x There is useful data that might be extracted from a user’s interactions, and it can be meaningfully mined;
x Social networks are a good framework for understanding interaction patterns;
x This mined data might be analyzed with the concepts of social networks to derive meaningful information about interaction patterns;
x It might be possible and valuable to use these networks to create tools for end-user communication and collaboration.
To test these ideas, we are implementing them stepwise, by mining information from a variety of online data sources, exploring this mined data from a variety of perspectives, and then directing this information into the user interface. Our goal is to develop an information infrastructure, a set of algorithms, and a series of user interface designs which can collectively provide end users with a sense of the others with whom they collaborate deeply integrated into the conventional user experience.
RELATED LITERATURE A number of other projects are also interested in expanding single-user interaction. Email is a common starting point. One of the first social-network based methods for interpreting email was ContactMap (Nardi et al, 2002). With ContactMap, users are invited to organize their contacts— those people with whom they are in regular communication— into groups, representing the categories of communication they maintain. The system then displays the maps and maintains some information about those users. The groups that the user designates also become sorting criteria within the user’s mail client and organizing principles for other sorts of mail-based data. However, ContactMap is unaware of the dynamism of social networks; the user must suggest changes. Further, ContactMap has limited itself to being a mail-based program; it doesn’t attempt to bring itself deeper into the computer’s infrastructure.
Bellotti et al (2001) have discussed the place of email within a user’s working day. Their work highlights that email is an activity that is meant to get work done: users working on email are generally trying to complete a task, rather than sending email for its own sake. In order to do so, users understand their email client as a storage site for information (such as appointments and phone numbers), and as a running log of their interactions with others. This suggests that it would be helpful to construct an environment in which collaboration fit more smoothly into the full range of activities.
One way users maintain their views of networks is to cluster individual messages into conversations. In a thread-oriented view, the rhythm of the conversation is maintained through a sequence of replies and responses. A series of visualizations (Rohall et al, 2001) help clarify both the chronology of a conversation as well as its participants.
Page 4 of 10 Activatin g the So cial W o rkscape August 23, 2002
An earlier attempt to bring Social Networks to the user came from a variety of projects in knowledge management. Contractor’s IKNOW project (1998) collects network information based on co-authorship and co-citation. Their network can then be used to locate clusters of knowledge about particular topics.
Three recent projects on rhythm have highlighted various patterns of use during a day. These studies suggest that there are meaningful, repeatable patterns to projects and activities. Reddy and Dourish (2002) explore patterns of information seeking and information sharing in medical work, and point to the role played by broad understandings of the temporal organization of work within the unit, which provides individuals with an understanding of what information might be needed, by whom, where, and when. In a more technical domain, Begole et al (2002) have examined the information that can be extracted from instant messaging clients. Their project successfully showed meaningful patterns in work schedules, and allowed teams to coordinate work schedules with each other. Finally, here, Hudson et al (2002) recently ran a study of interruptibility, trying to discern a pattern of when managers at a large organization were more or less available. Their investigation uncovered definite patterns of availability, and was able to isolate particular times as busy and empty times.
PRIVACY AND PERSONAL PROTECTION A project that deals with this much personal information must have an explicit privacy policy. This project is built to ensure that users can control their appearance to other users, and that third parties without explicit permission cannot see a user’s interactions. Generally, this project is based on the principle that it is valuable to see personal information about others, but that it comes at the cost of one’s own private data: users who hide their availability will be unable to see others’ participation. (The broader question of the relationship between privacy and publicity is explored elsewhere – see Palen and Dourish, forthcoming.)
STRATEGY Our strategy to explore these ideas is divided into two parts. First, we are collecting and mining a variety of social networks, and trying to understand what connection these networks have to the social workscape. Second, we are developing end-user tools that can capitalize on this information to infuse the user experience with a sense of the people with whom they interact.
Currently, we are primarily engaged in the first of these stages, and have created a number of tools that begin to explore them. These tools are designed to experiment with ideas, and are particularly interesting as a means to locate useful patterns from conversations.
Architecturally, our work is based around a database of information about user interaction and activity. Given the diversity of applications and interactions that make up daily activity, we believe that a coherent account of user action and communication will need to draw upon a range of information sources. For example, a period with no email might imply a lunch break—or might suggest a time of dedicated writing; or a single collaborative activity may span many different communication systems as we draw on multiple resources and technologies to progress our work. As more information is collected from applications, a better image of the social workscape can be developed. Accordingly, our database is not committed to specific forms of activity (e.g. email), but rather can record information about a wide range of communication modalities, both direct (as in email or IM) or indirect (as in file exchange).
This database is accompanied by a number of other components. One set of components are responsible for generating information to populate the database, while another set provides interactive visual depictions of data records, allowing us to explore the information and find useful metrics, statistics, and measures. Since we are storing heterogeneous data from a variety

Page 5 of 10 Activatin g the So cial W o rkscape August 23, 2002
of sources into one database, and our visualizations all display from this same database, the metrics that we extract can focus on single applications or on relevant combinations of activity in different modalities. This point is worth underscoring: our visualizations are independent of our choices of data, and are capable of viewing a variety of data sources. We are interested in the entire workscape.
The following examples show some of the first-stage tools we are exploring.
EMAIL VISUALIZATION Our first data source takes email traffic as a proxy for social interactivity: an emailing user is understood to be an active user, and a user who emails another frequently is understood to be closely connected. Based on these ideas, we collected logging records from an outgoing mail service. Consenting users lent us access to their mail records, and for each of their messages, we recorded the sender, the date, and the list of receivers.
Working from this minimal information, a series of visualizations have been developed illustrating some of the ways in which these interactions can be understood. The first figure, the Association Chart, highlights the connections between
pairs of users. This chart shows the set of all users who have been simultaneously addressed or carbon copied on more than one message.
In this mail archive, that of one of the authors, the network diagram consists of a number of disconnected components. The blue cluster in the center represents the participants in a conference; the green cluster on the top left is all officemates and co-researchers. Other clusters are social ties or are dedicated to small, specific projects. The yellow boxes on the peripheries indicate people who were not sent more than two shared messages.
The tool allows the user to explore the data. The interface has a variety of controls: users may vary the strength of ties on the screen, and can change the range of dates being examined. With these, it is possible to search out the dates over which a particular collaboration endured, or the ways in which multiple participants were added to a group.
It is, again, important to emphasize that this is not intended as a tool for end-users. Although it yields valuable information, we are trying to extract a very thin layer from it: we wish to learn what measurements are most valuable or interesting. Hopefully, simpler interfaces can reflect these core aspects at a later phase of the project.
We can understand this chart to tell us a variety of things. The dense cluster, for example, resembles the pattern of an ad-hoc mailing list: its uniformity shows a large number of users, carbon-copied a number of times. Contrast it with the smaller cluster at the top-left, the user’s
Figure 1: The Association Chart. Links connect carbon-copied users; clusters are colored as distinct populations.
Page 6 of 10 Activatin g the So cial W o rkscape August 23, 2002
research group. The denser cluster in this group reflects a shared activity (and, again, an ad-hoc mailing list); the looser entries on the bottom represent specific collaborations within the team. The other loose clusters around the screen reflect various social groups; ties seem to indicate shared interest.
This visualization, then, has produced several productive revelations. There is a similarity metric that pairs of users share; it is quite possible to intuitively see the connections between people. Walking a series of lines from one participant to another finds bridges of shared interest between people. Some of the connections are spurious (say, from accidentally-typed addresses, or generalized announcements); however, as the filter increases, so too does the meaningfulness of the connections. These networks can be used to find meaningful groups, and even the sub-segmentation of these groups carries meaning as clusters with shared interests. A challenge, then, would be to find the “ sweet spot” of balance, where spurious connections fade and useful
ties begin to dominate the image.
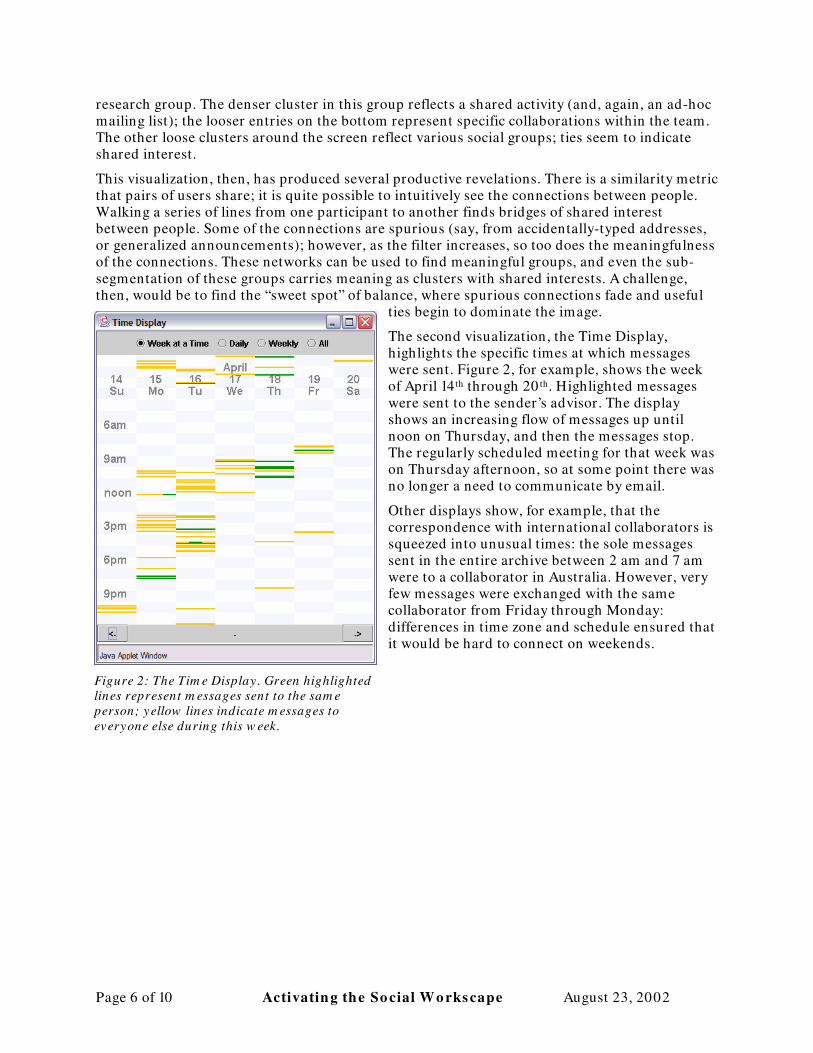
The second visualization, the Time Display, highlights the specific times at which messages were sent. Figure 2, for example, shows the week of April 14 th through 20 th. Highlighted messages were sent to the sender’s advisor. The display shows an increasing flow of messages up until noon on Thursday, and then the messages stop. The regularly scheduled meeting for that week was on Thursday afternoon, so at some point there was no longer a need to communicate by email.
Other displays show, for example, that the correspondence with international collaborators is squeezed into unusual times: the sole messages sent in the entire archive between 2 am and 7 am were to a collaborator in Australia. However, very few messages were exchanged with the same collaborator from Friday through Monday: differences in time zone and schedule ensured that it would be hard to connect on weekends.
Figure 2: The Tim e Display . Green highlighted lines represent m essages sent to the sam e person; yellow lines indicate m essages to everyone else during this w eek.
Page 7 of 10 Activatin g the So cial W o rkscape August 23, 2002
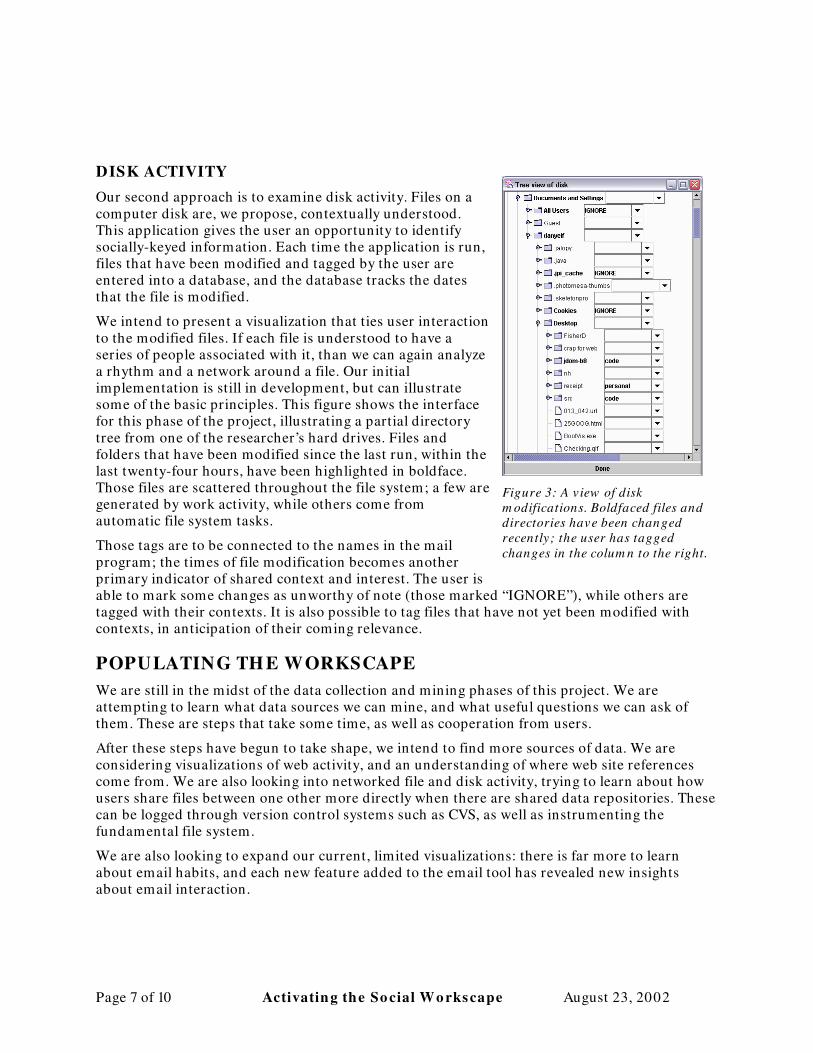
DISK ACTIVITY Our second approach is to examine disk activity. Files on a computer disk are, we propose, contextually understood. This application gives the user an opportunity to identify socially-keyed information. Each time the application is run, files that have been modified and tagged by the user are entered into a database, and the database tracks the dates that the file is modified.
We intend to present a visualization that ties user interaction to the modified files. If each file is understood to have a series of people associated with it, than we can again analyze a rhythm and a network around a file. Our initial implementation is still in development, but can illustrate some of the basic principles. This figure shows the interface for this phase of the project, illustrating a partial directory tree from one of the researcher’s hard drives. Files and folders that have been modified since the last run, within the last twenty-four hours, have been highlighted in boldface. Those files are scattered throughout the file system; a few are generated by work activity, while others come from automatic file system tasks.
Those tags are to be connected to the names in the mail program; the times of file modification becomes another primary indicator of shared context and interest. The user is able to mark some changes as unworthy of note (those marked “ IGNORE”), while others are tagged with their contexts. It is also possible to tag files that have not yet been modified with contexts, in anticipation of their coming relevance.
POPULATING TH E WORKSCAPE We are still in the midst of the data collection and mining phases of this project. We are attempting to learn what data sources we can mine, and what useful questions we can ask of them. These are steps that take some time, as well as cooperation from users.
After these steps have begun to take shape, we intend to find more sources of data. We are considering visualizations of web activity, and an understanding of where web site references come from. We are also looking into networked file and disk activity, trying to learn about how users share files between one other more directly when there are shared data repositories. These can be logged through version control systems such as CVS, as well as instrumenting the fundamental file system.
We are also looking to expand our current, limited visualizations: there is far more to learn about email habits, and each new feature added to the email tool has revealed new insights about email interaction.
Figure 3: A view of disk m odifications. Boldfaced files and directories have been changed recently ; the user has tagged changes in the colum n to the right.
Page 8 of 10 Activatin g the So cial W o rkscape August 23, 2002
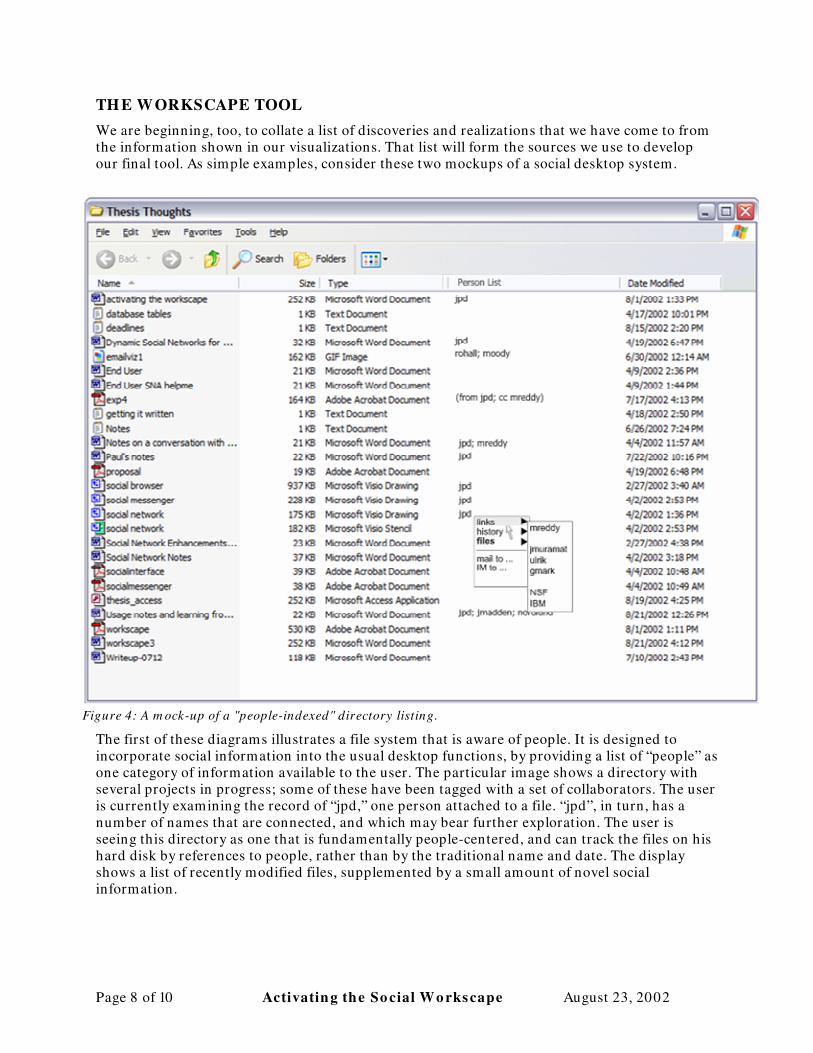
TH E W ORKSCAPE TOOL We are beginning, too, to collate a list of discoveries and realizations that we have come to from the information shown in our visualizations. That list will form the sources we use to develop our final tool. As simple examples, consider these two mockups of a social desktop system.
The first of these diagrams illustrates a file system that is aware of people. It is designed to incorporate social information into the usual desktop functions, by providing a list of “ people” as one category of information available to the user. The particular image shows a directory with several projects in progress; some of these have been tagged with a set of collaborators. The user is currently examining the record of “ jpd,” one person attached to a file. “ jpd” , in turn, has a number of names that are connected, and which may bear further exploration. The user is seeing this directory as one that is fundamentally people-centered, and can track the files on his hard disk by references to people, rather than by the traditional name and date. The display shows a list of recently modified files, supplemented by a small amount of novel social information.
Figure 4: A m ock-up of a "people-indexed" directory listing.

Page 9 of 10 Activatin g the So cial W o rkscape August 23, 2002
The second demonstration diagram shows a social network-oriented instant messenger interface. Rather than IM based on “ groups” or “ buddies” , this IM is based on a vision of a network. The smaller remote icons suggest the other users who are in frequent contact with each contact, in turn; their presence (even if not explicitly identified) is a reminder that the workscape is a shared resource, and that time and attention are needed by many callers.
CONCLUSION Even individual work is collaborative: projects have readers, editors, writers. Even when a particular phase of it is done individually, it is impossible to disregard the presence of other parties. Despite this, current computer systems persist in drawing a firm boundary between “ collaborative” and “ individual” work. We are experimenting with ways to diminish this boundary by making the computer system aware of the presence of people. We are exploring ways that people’s presence can be felt explicitly in the file system and in a user’s interactions, not merely within explicitly collaborative programs.
In order to do that, we are attempting to collect wide-ranging information about work rhythms and social networks. We are developing a series of tools that allow us to record and explore networks and rhythms in order to develop a more complete picture of collaboration and work patterns.
As we develop a fuller picture of network interactions, we are exploring how they might be understood by various levels of the computer system and integrated into a variety of applications. We look forward to computer systems that have a more developed notion of the user’s desire for shared interaction.
Figure 5: A m ock-up of a netw ork m essage tool
Page 10 of 10 Activatin g the So cial W o rkscape August 23, 2002
REFERENCES Bellotti, V. and Ducheneaut, N. 2001. “ E-mail as habitat: an exploration of embedded personal information management.” Interactions, 8:5
Begole, J ., Tang, J ., Smith, R., and Yankelovich, N. 2002. “ Exploring work rhythm awareness: Coordinating contact among colleagues.” Proc. ACM Conf. Com puter-Supported Cooperative W ork CSCW 2002.
Burt, R. 1995. Structural Holes. Belknap.
Contractor N., Zink, D., & Chan, M. (1998). “ IKNOW: A tool to assist and study the creation, maintenance, and dissolution of knowledge networks.” In Toru Ishida (Ed.), Com m unity Com puting and Support System s, Lecture Notes in Com puter Science 1519 (pp. 201-217). Berlin: Springer-Verlag.
Hudson, J ., Christensen, J ., Kellogg, W., and Erickson, T., 2002. "I'd be overwhelmed, but it's just one more thing to do": availability and interruption in research management. Proc. ACM Conf. Hum an Factors in Com puting System s CHI 2002.
Krebs, V.E. 2002. “ Mapping Networks of Terrorist Cells.” Connections: the J ournal of the International Network of Social Network Analysts. 24:3
Nardi, B., Whittaker, S., Isaacs, E., Creech, M., Johnson, J ., and Hainsworth, J . 2002. “ Integrating communication and information through ContactMap.” Com m unications of the ACM , 45:4, pp. 89-95
Palen, L. and Dourish, P. In preparation. Unpacking Privacy: Articulating Concerns for a Networked Age.
Reddy, M. and Dourish, P. 2002. “ A Finger on the Pulse: Temporal Rhythms and Information Seeking in Medical Work.” Proc. ACM Conf. Com puter-Supported Cooperative W ork CSCW 2002.
Rohall, S., Gruen, D., Moody, P., and Kellerman, S. 2001. “ Email Visualizations to Aid Communications.” IEEE Sym posium on Inform ation Visualization (InfoVis), San Diego, CA.