Embed Size (px)
Citation preview

INTERNAL CAPITAL ADEQUACY ASSESSMENT PROCESS (ICAAP) REPORT
Aِpril 2017

ICAAP Report
2
Document Name Internal Capital Adequacy Assessment Process (ICAAP) Report
APPROVAL & SIGN OFF Name Designation Signature & Date
Chairman
Mr. Moustafa Ashour Chief Executive Officer
Mr. Tarek Yahia Zakaria Chief Financial Officer

ICAAP Report
3
Table of Contents 1 EXECUTIVE SUMMARY ..................................................................................................... 6
2 BACKGROUND................................................................................................................... 9
3 SUMMARY OF CURRENT AND PROJECTED FINANCIAL AND CAPITAL POSITION .. 11
3.1 OVERVIEW ............................................................................................................................11 3.2 UFH BUSINESS STRATEGY ....................................................................................................11 3.3 PROJECTED CAPITAL POSITION..............................................................................................13
4 CAPITAL ADEQUACY ...................................................................................................... 14
4.1 RISK APPETITE ......................................................................................................................14 4.1.1 Risk Appetite Statement ........................................................................................................... 14
4.2 TIMING OF ICAAP .................................................................................................................14 4.3 RISK ANALYZED .....................................................................................................................15
4.3.1 Pillar 1 Risks ...................................................................................................................15 4.3.1.1 Credit Risk ...................................................................................................................................15 4.3.1.2 Market Risk .................................................................................................................................16 4.3.1.3 Operational Risk ...........................................................................................................................17 4.3.2 Pillar 2 Risks ...................................................................................................................18
4.3.2.1 Concentration Risk ................................................................................................................................... 18 4.3.2.2 Interest Rate Risk ..................................................................................................................................... 19 4.3.2.3 Liquidity Risk ............................................................................................................................................ 19 4.3.2.4 Strategic Risk............................................................................................................................................ 20 4.3.2.5 Reputational Risk...................................................................................................................................... 22 4.3.2.6 Regulatory Risk ........................................................................................................................................ 25
5 CAPITAL PLANNING AND STRESS TESTS .................................................................... 27
5.1 INTRODUCTION ......................................................................................................................27 5.2 CAPITAL PLAN .......................................................................................................................27
5.2.1 Objectives & Time Horizon ....................................................................................................... 27 5.2.2 Capital Planning Process ......................................................................................................... 27 5.2.3 Projected Capital Requirement ................................................................................................ 28 5.2.4 Assumptions ............................................................................................................................. 28
5.3 STRESS TESTING ...................................................................................................................29 5.3.1 Introduction ............................................................................................................................... 29 5.3.2 Stress Testing Framework ....................................................................................................... 29
5.3.2.1 Governance and Oversight ....................................................................................................................... 29 5.3.2.2 Use of Stress Testing Results ................................................................................................................... 29 5.3.2.3 Weakness / limitation of Stress Testing .................................................................................................... 29 5.3.2.4 Time Horizon & reference dates ............................................................................................................... 30 5.3.3 Stress Testing Scenarios and results ....................................................................................... 30 5.3.4 Stress Testing Results ............................................................................................................. 32
6 CHALLENGE AND ADOPTION OF ICAAP ...................................................................... 36
6.1 ICAAP GOVERNANCE ............................................................................................................36
7 USE OF ICAAP WITHIN UFH ............................................................................................ 38
8 ANNEXURES .................................................................................................................... 39
8.1 STRATEGIC RISK – SCORECARD ........................................................................................... 39 8.2 REPUTATIONAL RISK – SCORECARD...................................................................................... 42 8.3 REGULATORY RISK – CHECKLIST .......................................................................................... 45 8.4 REFERENCES ....................................................................................................................... 46

ICAAP Report
4
LIST OF TABLES
Table 1 – Projected Capital Requirement .................................................................................................. 6
Table 2 – Risk Type - Capital Adequacy Approach .................................................................................... 7
Table 3 – Summary – Pillar 1 & Pillar 2 Capital Requirement ..................................................................... 8
Table 4 – Financial Highlights ................................................................................................................. 10
Table 5 – Business Strategy/ Plan ........................................................................................................... 11
Table 6 – Projected Income Statement .................................................................................................... 12
Table 7 – Balance Sheet Projections ....................................................................................................... 12
Table 8 – Projected Capital Position ........................................................................................................ 13
Table 9 – Risk Appetite Statement .......................................................................................................... 14
Table 10 – Risk Analysed ........................................................................................................................ 15
Table 11 – Credit Risk Pillar 1 Capital Calculation Summary ................................................................... 15
Table 12 – Credit Risk – Projections Risk Capital .................................................................................... 16
Table 13 – Market Risk – Pillar 1 Risk Capital ......................................................................................... 17
Table 14 – Operational Risk Pillar 1 Capital Calculation Summary ........................................................... 18
Table 15 – Concentration Risk – Asset Management Holdings ................................................................ 18
Table 16 – Prohibited Risk Capital – Concentration of AFS Investments .................................................. 19
Table 17 – Interest Rate Risk Capital ...................................................................................................... 19
Table 18 – Strategy Risk – Score Calibration........................................................................................... 21
Table 19 – Strategy Risk – Score Assessment ........................................................................................ 21
Table 20 – Strategic Risk – Projection Capital ......................................................................................... 22
Table 21 – Reputational Risk – Score Calibration .................................................................................... 23
Table 22 – Reputational Risk – Score Assessment .................................................................................. 24
Table 23 – Reputation Risk – Projection Capital ...................................................................................... 25
Table 24 – Regulatory Risk –Checklist .................................................................................................... 25
Table 25 – Projected Capital Requirement .............................................................................................. 28
Table 26 – Stress Testing Scenarios ....................................................................................................... 31
Table 27 – Stress Testing – Single Factor Results ................................................................................... 32
Table 28 – Stress Testing – Composite Scenario Results ........................................................................ 33
Table 29 – Stress Testing – Impact on Projected Year Income Statement ............................................... 33
Table 30 – Stress Testing – 3 Year Projections ....................................................................................... 34
Table 31 – ICAAP Summary Table .......................................................................................................... 35
Table 32 – ICAAP Governance – Role & Responsibilities ........................................................................ 37

ICAAP Report
5
LIST OF FIGURES
Figure 1 – Organizational Structure ........................................................................................................... 9
Figure 2 – Strategic Risk – Scorecard factors .......................................................................................... 20
Figure 3 – Strategic Risk – Calibration Result .......................................................................................... 22
Figure 4 – Reputational Risk – Scorecard factors .................................................................................... 23
Figure 5 – Reputational Risk – Calibration Result .................................................................................... 24

ICAAP Report
6
1 Executive Summary The Internal Capital Adequacy Assessment Process (ICAAP) is introduced under Pillar II of the Prudential Rules, which is contained in Part 6 (Article 66) and Annex 9 of the Prudential Rules. The purpose of Pillar II is to ensure that authorised persons have sufficient capital to support all material risks to which their business exposes them. It shall therefore reinforce the link between the risks and the capital, so that the authorised person’s risk management strategy, approaches and systems are integrated with its capital planning.
Based on the CMA guidelines, the ICAAP at the firm depicts the approach towards risk management framework and addresses capital planning, assessment of material risks, capital required for all material risks, and internal processes to manage these risks. The current ICAAP Report is prepared for United Financial House (UFH) on a standalone basis.
Capital Planning
Capital Planning covers the process of translating the projected business profile into capital projections thereby outlining the changes in the capital position of the firm over the next 3 years. This process also enables to identify the minimum capital required under Pillar I for the projected balance sheet.
The following table reflects the projected available and required minimum capital for Pillar 1 up to 2019.
(All amounts in ‘000 SAR)
Capital Projections 2016 2017 2018 2019
< Actual > < Budget > < Forecast > < Forecast >
Pillar 1 Capital requirements 10,170 1,791 1,559 1,441
Credit Risk 9,306 930 846 747
Market Risks - - - -
Operational risks 863 861 714 694
Pillar 2 Capital requirements 213 37 33 30
Concentration Risk - - - -
Interest Rate Risk - - - -
Liquidity Risk - - - -
Strategic/ Business Risk 152 27 23 22
Reputational Risk 61 11 9 9
Regulatory Risk - - - -
Total of Pillar 1 and Pillar 2 Capital 10,382 1,828 1,592 1,471
Tier 1 Capital 11,333 12,550 10,445 8,170
Tier 2 Capital 336 - - -
Capital base 11,669 12,550 10,445 8,170
Total Capital Ratio 1.15 7.01 6.70 5.67
Capital Ratio with Pillar 1 and Pillar 2 1.12 6.86 6.56 5.55
Table 1 – Projected Capital Requirement
The results indicate that the firm’s capital ratio remains well above 1x times. It also indicates that the firm will be able to maintain sufficient capital to meet future expansion plans such that the minimum capital requirements are met.

ICAAP Report
7
Material Risk Assessment
As part of the risk assessment, UFH identified the risks in the following categories:
Pillar 1 Risks - Credit Risk, Market Risk, Operational Risk
Pillar 2 Risks - Concentration Risk, Interest Rate Risk, Liquidity Risk, Strategic Risk, Reputational Risk and Regulatory Risk
The following table summarizes the risk type and capital adequacy approach adopted to assess the level of risk & potential capital charge impact under ICAAP.
S.N. Types of Risk Materiality Capital Charge Implication Methodology/ remarks
Pillar 1
1 Credit Risk Material Yes Standardized Approach
2 Market Risk Material No Standardized Approach
3 Operational Risk Material Yes Basic Indicator Approach / Expenditure Based Approach
Pillar 2
4 Concentration Risk Material No Revenue Concentration Approach
5 Interest Rate Risk Not Material No No Interest rate sensitive assets & liabilities
6 Liquidity Risk Material No Expected Cash flow Analysis and Liquidity Ratios
7 Settlement Risk Not Applicable No proprietary trading book
8 Strategic Risk Material Yes Scorecard approach
9 Reputation Risk Material Yes Scorecard approach
10 Regulatory Risk Material No Compliance checklist
Table 2 – Risk Type - Capital Adequacy Approach
UFH believes that the risk assessment undertaken for the above risks reflects an acceptable level of its risk profile. Over and above this, additional capital has been set aside for the Pillar II Risks using best practices for their assessment and associated capital charge.
ICAAP Governance
UFH has Board approved ICAAP policy and capital policy based on CMA’s guidelines. The Company has developed assessment methodologies and tools for assessment of material Pillar II risks, capital planning and scenarios for stress testing. The outcome of the ICAAP analysis was presented to the Senior Management as part of the challenge and review process. Wherever refinements were required, they were undertaken and the methodologies, analysis and conclusions were drawn and approved by the Senior Management and CEO. The Report is then presented to the Board of Directors for final review & approval.
The Internal Audit as per the annual plan will independently review the governance and capital requirements under Pillar II, based on the ICAAP Report prepared by the firm, and report its findings for appropriate action/modifications.

ICAAP Report
8
Capital Assessment
In line with the regulatory requirements, UFH has identified all the material risks prevalent within the business operations and conducted stress testing on all the identified risks for the estimation of capital requirements. The following table presents capital and capital requirement for the current year projection (2017):
(All amounts in ‘000 SAR) Pillar 1 Pillar II
Particulars Minimum Capital Requirement ICAAP
Market Risk - -
Credit Risk 930 930
Operational Risk 861 861
Pillar 1 1,791 1,791
Concentration Risk - -
Liquidity Risk - -
Interest Rate Risk - -
Reputation risk - 11
Strategic risk - 27
Regulatory Risk - -
Pillar 2 37
Additional capital to cover stress testing 2,620
ICAAP Capital requirement 4,448
Additional Capital required 2,658
Capital Base 12,550 11,868
Surplus (Deficit) in Capital Base 10,759 7,420
Capital ratio 7.01 2.67
Table 3 – Summary – Pillar 1 & Pillar 2 Capital Requirement
The overall risk assessment shows that the Capital Ratio after including Pillar II risks and additional capital for stress testing is at 2.67x.

ICAAP Report
9
2 Background United Financial House Company (the “Company”) is a Closed Joint Stock Company registered with the Capital Market Authority (CMA) under license number 08118-07 dated 2 Shawwal 1429H (corresponding to 20 October 2008). It has a declared and paid up capital of SR 52.5 Million. However, the capital will be reduced to SR 15 Million adjusting for accumulated losses to ensure compliance with Ministry of Commerce and Investment regulations.
The Company operates in the Kingdom of Saudi Arabia under commercial registration number 1010261112 dated 20 Moharam 1430H (corresponding to 17 January 2009). The objectives of the Company are to act as principal and provide asset management and custodial services.
The primary business line of UFH is:
Asset Management: UFH offers services in local mutual funds, discretionary portfolio management and real estate fund. As of the end of 2016, UFH has one active fund “Jawharat Al Shefa Fund” with 33 subscribers building up the AUM size of SAR 284.16 Million.
The organizational structure of UFH is as below:
Figure 1 – Organizational Structure

ICAAP Report
10
Financial information of UFH for last two years is as follows:
(Amounts in SAR ‘000)
Financial Information Dec -15 Dec – 16
Balance Sheet
Total Assets 17,659 22,835
Total Liabilities 1,526 11,167
Capital Base
Tier-1 Capital1 14,744 11,333
Tier-2 Capital2 1,389 336
Total Capital 16,133 11,669
Profit and Loss
Commission Income - -
Gain From sale of investments 1,466 -
Management Fee 262 -
Dividend Income 122 50
Gross Income 1,850 50
Expenses 3,992 3,184
Zakat 320 269
Net Income (2,463) (3,403)
Table 4 – Financial Highlights
As of Dec-16, UFH holds a surplus capital of SAR 1.5 Mn under CMA Pillar I calculations and maintaining a capital ratio of 1.15 times.
1 Tier 1 Capital is comprised of Share Capital, Statutory Reserves and Accumulated Loss/ Earnings 2 Tier 2 Capital is “Change in Fair value of AFS investments”

ICAAP Report
11
3 Summary of Current and Projected Financial and Capital Position
3.1 Overview
The purpose of Pillar II is to ensure that financial services entities have sufficient capital to support all material risks to which their business exposes them. It shall therefore reinforce the link between the risks and the capital, so that the entity’s risk management strategy, approaches and systems are integrated with its capital planning.
UFH’s financial projections shall be for at least three years and shall be consistent with its business plan. This initial projection would form the ‘base case’ for the capital planning analysis. Finance Department shall collate the required information from the different business and support units and make following projections for at least three years according to the requirements of prudential rules of CMA:
Profit and Loss Accounts showing all the sources of income and expenses
Balance Sheet showing all the items of assets and liabilities
Capital Adequacy Summary showing separately tier I and II capital components
3.2 UFH Business Strategy
The business plan has been developed taking into account the continued challenging economic environment & business outlook. The plan factors in the growth rate observed in the past, strategic growth, penetration into existing and new sectors and markets and diversification into new product offerings and industry outlook. The business plans for UFH for year 2017-2019 are presented below:
S. No. Business Strategy
1 Al Shefa fund will mature in FY 2017 and will generate exit commission.
2 There will be no AFS Investments and majority of the assets will be deposited with local banks and will be invested in money market. Money market investments will generate income in FY 2018 and 2019 respectively.
3 There will be no revenue from brokerage and discretionary portfolio businesses.
Table 5 – Business Strategy/ Plan
Based on the abovementioned strategic objectives, UFH has formulated the detailed budget for the year 2017 and forecast for the years 2018 and 2019.

ICAAP Report
12
The projected Income Statement for the period 2017-2019 is shown below:
(Amounts in SAR ‘000)
Income Statement Actual Budgeted Projection Projection
F2016 F2017 F2018 F2019
Commission Income - 4,660 - -
Gain/ Loss from Investment - - 750 500
Management Fee - - - -
Dividend Income 50 - - -
Total Income 50 4,660 750 500
Salaries and employee related expenses (1,824) (1,824) (1,500) (1,500)
Rent (500) (500) (500) (500)
Depreciation (104) (103) (103) (103)
Other general and Admin Expenses (756) (700) (500) (500)
Total Expenses (3,184) (3,127) (2,603) (2,603)
Profit/ Loss before Zakat (3,134) 1,533 (1,853) (2,103)
Zakat 269 316 252 172
Net Income for the year (3,403) 1,217 (2,105) (2,275)
Table 6 – Projected Income Statement
The Balance Sheet projections for the period 2017-2019 are shown below:
(Amounts in SAR ‘000)
Financial Projections Actual Budgeted Projection Projection
F2016 F2017 F2018 F2019
Ass
ets
Cash and Bank balances 11,842 23,404 21,634 19,654
Prepayments and Other Current Assets 117 80 100 100
Investment held as "Available for Sale" 10,336 - - -
Investment in Subsidiary 100 100 100 100
Property and Equipment, net 440 337 234 131
Total Assets 22,835 23,921 22,068 19,985
Liab
ilitie
s Accrued Expenses and other Current Liabilities 9,293 9,293 9,293 9,293
Accrued Zakat 311 200 200 220
Employee End of Service benefits 1,562 1,878 2,130 2,302
Total Liabilities - - - -
Shar
ehol
ders
' Eq
uity
Share Capital 11,166 11,371 11,623 11,815
Statutory Reserve
Accumulated losses 52,500 15,000 15,000 15,000
Fair Value Reserve - 122 122 122
Other Reserves (41,167) (2,572) (4,677) (6,952)
Total Shareholders' Equity 11,669 8,323 9,970 5,767
Total Liabilities and Shareholders’ Equity 22,835 23,921 22,068 19,985
Table 7 – Balance Sheet Projections

ICAAP Report
13
The other assumptions were made in forecasting of balance sheet of the Company:
The Company shall invest majority of capital and retained earnings in deposits with local banks and in money market investments.
The Company shall be reducing its capital from SR 52.5 Million to SR 15 Million adjusting for accumulated losses to ensure compliance with Ministry of Commerce and Investment regulations.
3.3 Projected Capital Position
UFH does not foresee significant increase in business volumes in the forthcoming years, and thereby does not envisage a requirement of additional capital expansion to support its business operations. The capital position for the period 2016-2019 is shown below:
(Amounts in SAR ‘000)
2016 2017 2018 2019
Capital base
Total Capital base 11,669 12,550 10,445 8,170
Tier 1 11,333 12,550 10,445 8,170
Tier 2 336 - - -
Minimum capital requirement
Market Risks - - - -
Credit Risks 9,306 930 846 747
Credit Risk (excluding Prohibited Exposure Risk) 5,006 930 846 747
Prohibited Exposure Risk 4,300 - - -
Operational risks 863 861 714 694
Total minimum capital requirement 10,170 1,791 1,559 1,441
Total capital ratio (times) 1.15 7.01 6.70 5.67
Surplus/(Deficit) in Capital 1,499 10,759 8,886 6,729
Table 8 – Projected Capital Position
The above table shows that capital base is primarily composed of Tier I capital with insignificant composition of Tier II capital. Within Tier I capital, share capital would remain the prime source of capital requirements with gradual decrease in accumulated losses. The projected Pillar 1 capital ratio would continue to remain more than 1x times indicating the strong financial position of UFH.

ICAAP Report
14
4 Capital Adequacy
4.1 Risk Appetite
Risk appetite is defined as the amount and type of risks that the firm is willing to take within the context of its business strategy. Risk appetite is either quantitatively defined by the appropriate indicators (e.g., capital adequacy level and risk limits) or qualitatively outlined (e.g., underwriting criteria).
UFH annually identifies a number of key risk components and related risk appetite statement for these risks. The level of risk appetite is arrived at in consideration of the various business targets and the risk management processes adopted.
It is the endeavor of the Finance Department to monitor such limits on the regular basis and review the adequacy of these limits annually.
Finance shall escalate the breach of risk appetite threshold for each defined level to the appropriate authority. Based on the corrective action suggested by the authority, the CEO in coordination with other departments shall initiate the action plan to bring down the level in line with the defined risk appetite levels.
4.1.1 Risk Appetite Statement
The table below shows the Risk Appetite Statement:
S.N. Risk Types Risk Appetite Statement
1 Credit Risk UFH shall maintain its seed capital investments with only high credit quality counterparties. It has overall low appetite for Credit Risk.
2 Market Risk UFH shall adopt a conservative approach when investing in Held for Trading instruments
3 Operational Risk (Operational loss & People Risk)
Operational Risk Loss to be controlled with improvement in systems, policies & procedures of UFH’s business.
UFH strives to retain talent by employee friendly policies and offer competitive compensation structures
4 Liquidity Risk UFH shall maintain adequate liquidity to meet its short-term obligations
5 Interest Rate Risk UFH shall manage its rate sensitive assets and liability such that the change in market rates do not breach internal threshold
6 Regulatory and compliance risk
a) UFH shall maintain zero tolerance for any violation on regulatory guidelines related to its business lines or prudential rules issued by CMA.
b) For Asset Management: UFH shall not exceed the threshold prescribed by CMA for large exposure to a single counterparty and total value of large exposures
7 Reputational Risk
UFH shall avoid any situation and action from adverse media News/Statements or customer services complaints resulting in a negative impact on reputation of any product or UFH. If an undesirable situation arises it will manage the same aggressively to preserve reputation and brand image.
8 Strategic Risk UFH develops its strategic plan and business initiatives to meet the same. UFH shall actively tracks and manages its major initiatives to ensure successful execution.
9 Capital Adequacy UFH shall maintain minimum Capital adequacy coverage ( ≥ 1x) with adequate buffer at all times to meet CMA rules as well as to remain adequately solvent
Table 9 – Risk Appetite Statement
4.2 Timing of ICAAP
The current ICAAP report has been prepared as of 31st December 2016 and can be read in conjunction with the annual report. The report prepared is consistent with the Pillar 2 guidelines issued by CMA.

ICAAP Report
15
4.3 Risk Analyzed
Considering the risk profile and operating environment of the firm, the material risks to which the firm is exposed to are mentioned in the table below:
S.N. Types of Risk Materiality Capital Charge Implication Methodology/ remarks
Pillar 1
1 Credit Risk Material Yes Standardized Approach
2 Market Risk Material No Standardized Approach
3 Operational Risk Material
Yes Basic Indicator Approach / Expenditure Based Approach
Pillar 2
4 Concentration Risk Material No Revenue Concentration Approach
5 Interest Rate Risk Not Material No No Interest rate sensitive assets & liabilities
6 Liquidity Risk Material No Expected Cash flow Analysis and Liquidity Ratios
7 Settlement Risk Not Applicable No proprietary trading book
8 Strategic Risk Material Yes Scorecard approach
9 Reputation Risk Material Yes Scorecard approach
10 Regulatory Risk Material No Compliance checklist
Table 10 – Risk Analysed
In ICAAP, the treatment of Credit, Market and Operational risks for the calculation of capital requirement is same as in Pillar 1 i.e., a Pillar I Plus approach is adopted for the ICAAP purposes.
4.3.1 Pillar 1 Risks
4.3.1.1 Credit Risk
Credit risk may arise from the default of the counterparties due to inability or unwillingness to meet their obligation in relation to lending, trading, settlement or other financial transactions. From the firm’s perspective, the credit risk shall arise due to default from counterparties with whom short term deposits are placed regularly.
4.3.1.1.1 Credit Risk Assessment
UFH follows the Standardized approach suggested by CMA for assessment of credit risk capital requirements where weights are assigned to respective assets and capital is computed at 14% of the risk weighted assets. The following table summarizes the credit risk assessment activity undertaken by UFH for the year 2016.
(Amounts in SAR ‘000)
Non – Trading Activities Exposure (2016) Risk Weight Capital Requirement
Prohibited Risk Capital
Deposits with local banks (< 1 year) 11,837 20% 331 -
AFS Investment Funds 10,336 300% 4,341 4,300
Other Items 662 360% 334 -
Total 22,835 5,006 4,300
Table 11 – Credit Risk Pillar 1 Capital Calculation Summary

ICAAP Report
16
On the basis of the financial projections of year 2017-2019, the credit risk capital is estimated using same risk weights as of the year 2016 and the results are as follows:
Non – Trading Activities 2017 2018 2019
Exposure Capital Requirement Exposure Capital
Requirement Exposure Capital Requirement
Deposits with local banks (< 1 year) 23,394 655 21,625 605 19,646 550
AFS Investment Funds - - - - - -
Other Items 527 275 443 240 339 197
Total 23,921 930 22,068 846 19,985 747
Table 12 – Credit Risk – Projections Risk Capital
4.3.1.1.2 Capital Charge for Credit Risk
As of 31st December 2016, the total Pillar I Credit Risk capital charge excluding Prohibited exposure is SAR 5 M. After including the prohibited exposure capital charge of SAR 4.3 M, the total Pillar I Credit Risk Capital charge is SAR 9.3 M.
4.3.1.2 Market Risk
Market risk is the risk of losses in on-and off-balance sheet positions arising from movements in market rates or prices such as profits rates, foreign exchange rates, equity prices, credit spreads and/or commodity prices resulting in a loss to earnings and capital. The main components for Market Risk are as follows:
Interest Rate Risk - Interest rate risks shall be calculated for positions in interest rate linked financial instruments included in the firm’s trading book. The interest rate exposure faced by the firm could be specific – due to counterparty risk or general – due to changes in the macro-economic factors governing the market. Calculating capital requirements for specific and general risk may be carried out on the company’s net positions in interest rate linked financial instruments.
Foreign Exchange Risk – The firm faces foreign exchange risk if it holds net open positions (whether long or short) in foreign currencies due to the risk that exchange rates may move against it. The open positions may be either trading positions or, simply, exposures caused by the company’s overall assets and liabilities in local currency and foreign currencies. As per CMA guidelines, foreign exchange risk will comprise of both trading and non-trading activities.
Commodity Risk – The firm faces risk from commodity positions as a result of commodity price movements resulting in adverse price movement of commodities in which the firm has open positions in spot or forward transactions.
Equity Price Risk – The equity exposure of the firm shall lead to specific and general risk which arises from various factors including counterparty assessment and change in macro-economic conditions.
Investment Fund Risk – The risk related to investment fund shall arise due to volatility in the prices of the underlying assets which constitute the investment funds.
Underwriting Risk – The firm shall be confronted with underwriting risk when it would be obliged to purchase previously issued equity and/or interest bearing financial instruments securities due to overestimation of demand for underwritten securities or sudden change in market conditions.
Settlement Risk – Settlement risk arises due to failure of the counterparty in fulfilling the terms of the contract at the time of settlement. In trading portfolio, the risk related to the settlement is the risk of loss when counterparty in a foreign exchange transaction pays the currency it sold but does not receive the

ICAAP Report
17
currency it bought. Settlement failures can arise from counterparty default, operational problems, market liquidity constraints and other factors.
Counterparty Risk – Such risk arises from transactions in which the counterparty has not fulfilled its delivery or payment obligations and credit exposure arising out of OTC derivatives.
Excess Exposure Risk – Risk in the trading book arising from the exposure to the counterparties or a group of connected counterparties exceeding the proposed limits in prudential rules issued by the CMA. The current limits require that exposure to single counterparty or group of connected counterparties shall not exceed 25% of the capital base of the lending entity.
4.3.1.2.1 Market Risk Assessment
UFH follows a Standardized approach for assessment of capital adequacy of market risk.
The Market Risk capital for Projected Years is shown as Nil as UFH does not intend to invest in any market risk related exposures for 2017-2019. The capital requirement calculation is shown as below:
Equity Price Risk 2016 < Actual >
2017 < Budget >
2018 < Forecast >
2019 < Forecast >
Equity Investment (Long) - - - -
Specific Risk - - - -
General Risk - - - -
Equity Risk Capital - - - -
Investment Risk
Funds Investment (Long) - - - -
Funds Investment Risk Capital - - - -
Total Risk Capital - - - -
Table 13 – Market Risk – Pillar 1 Risk Capital
4.3.1.2.2 Market Risk Capital Charge
As of 31st December 2016, the Market Risk Capital Charge is Nil based on the calculations above.
4.3.1.3 Operational Risk
Operational risk is defined as “the risk of loss resulting from inadequate or failed internal processes, people and systems or from external events”. It includes legal risk but excludes reputation and business/strategic risk. Operational risk is inherent within each and every activity or process conducted by the business.
4.3.1.3.1 Operational Risk Assessment
UFH follows a basic indicator approach for assessment of capital adequacy of operational risk. In this approach, UFH computes the capital requirements at 15% of the average operating income of the last three years subject to minimum of 25% of overhead expenses.

ICAAP Report
18
(Amounts in SAR ‘000)
Operational Risk - Capital Projections (in SAR '000)
Year 2014 < Actual >
2015 < Actual >
2016 < Actual >
2017 < Budget >
2018 < Forecast >
2019 < Forecast >
Gross Income 1,718 1,850 50 4,660 750 500
Last 3 Years Average 1,206 2,187 1,820 1,970
Factor 15% 15% 15% 15%
BIA Capital Charge 181 328 273 296
25% of Expense 863 861 714 694
OR Capital Charge 863 861 714 694
Table 14 – Operational Risk Pillar 1 Capital Calculation Summary
The Operational Risk capital for Projected Years is calculated using projected gross income and expenses for 2017-2019.
4.3.1.3.2 Operational Risk Capital Charge
As of 31st December 2016, the Operational Risk Capital Charge is SAR 0.86 M based on the calculations.
4.3.2 Pillar 2 Risks
4.3.2.1 Concentration Risk
Concentration risk can be linked to individual client or group of connected clients leading to large exposures. These groups refer to companies which are legally or economically connected in such a way that a majority of the individual borrowers in the group would encounter repayment problems if a single one of them encountered financial difficulties. Credit risk concentration shall not be from related counterparties but can also arise from concentration in particular geographical region, country, product, industry and economic sector.
4.3.2.1.1 Concentration Risk Assessment
Considering the business activities of UFH, concentration risk does not originate from the balance sheet as the firm does not extend the credit facilities to individuals, corporates or any other institutions. Although there is no credit concentration in the balance sheet of the firm, there is a revenue concentration in the business activities of UFH considering the revenue generated from asset management business. This report shall identify any client concentration in the asset management business.
Asset Management: The holding pattern in the funds is typically concentrated with a few clients holding of majority of investment. The following table shows the analysis for client concentration of the fund.
Fund Name Fund’s AUM (SAR ‘000) Total contribution by Top 10 clients
Jawharat Al Shefa Fund 284,158 79.97%
Table 15 – Concentration Risk – Asset Management Holdings
From the above table it is observed that there is concentration of holdings in “Jawharat Al Shefa Fund”. The aforementioned is a specialized fund for the real estate sector catering to the investment requirements of UFH’s clients. Exit of the fund is expected in 2017. Since this exposure is not on the balance sheet of UFH, there is no direct impact on capital requirement. However, the impact on gross income is considered as a part of stress testing exercise.

ICAAP Report
19
4.3.2.1.2 Concentration Risk Capital Charge
As of 31st December 2016, there is no principal credit exposure other than AFS investments, which is already subjected to prohibited Risk exposure limit and under which UFH is keeping a capital of SAR 4.3 Mn.
For projected years, the prohibited Risk Capital is calculated based on the balance sheet projections of 2017-2019.
Prohibited Exposure
2016 < Actual >
2017 < Budget >
2018 < Forecast >
2019 < Forecast >
Jawharat Al Shefa Fund 10,336 - - -
Exposure Above Capital Base 7,419 - - -
Existing Risk Weights 300% 300% 300% 300%
Additional Capital Requirement 4,300 - - -
Table 16 – Prohibited Risk Capital – Concentration of AFS Investments
There is no capital charge allocated for Concentration Risk under Pillar 2 risk assessment.
4.3.2.2 Interest Rate Risk
Interest rate risk arises due to mismatch of interest rate re-pricing between borrowing and lending of financial services entity engaged in providing fund based services to its customers. Interest rate risk originates in the books of the banks or financial institutions or financial services companies which borrow the funds from the market and lends the borrowed funds to its customers and such risk primarily arises from gap between the fixing of interest rates on borrowing and lending. Since, UFH is not engaged in the borrowing and lending business therefore interest rate in banking book (i.e. borrowing and lending portfolio of the Company) is not applicable.
4.3.2.2.1 Interest Rate Risk Assessment
As of 31st December 2016, the firm does not have any exposures/ investments which are exposed to Interest rate variations. Hence there is no capital requirement for Interest Rate Risk.
For Projections, the firm does not project any income which is exposed to interest rate variations. Hence, for projections 2017-2019 the firm does not keep any capital for Interest Rate Risk.
Interest Rate Risk
2016 < Actual >
2017 < Budget >
2018 < Forecast >
2019 < Forecast >
Interest Rate Sensitive Exposure - - - -
Capital Requirement - - - -
Table 17 – Interest Rate Risk Capital
4.3.2.3 Liquidity Risk
Liquidity Risk is the ‘potential for loss’ to an institution arising from either its inability to meet its obligations or to fund assets as they fall due without incurring unacceptable cost or losses. Often, liquidity risk arises due to mismatch in the maturity pattern of assets and liabilities. In the case of surplus situation, liquidity takes the form of opportunity cost in the form of loss of income due to investment of idle funds in low yield assets rather than higher yielding assets.

ICAAP Report
20
4.3.2.3.1 Liquidity Risk Assessment
Analysis of the UFH balance sheet shows that firm has no significant short term liabilities and earning assets are funded by equity.
As per the assessment and the control effectiveness in place, there is no capital charge allocated for Liquidity Risk under Pillar 2 assessment.
4.3.2.4 Strategic Risk
Strategic risk arises from adverse changes in business environment with respect to the economy, political landscape, regulations, technology and actions of competitors or adverse business decisions or improper implementation of decisions taken by the senior management. Such risk can result into reduced demand for products and services offered by the firm, resulting in loss of revenues or reduced revenues, as well as inability to deal with lower-than anticipated business volumes resulting in higher fixed costs or cost inflexibility. Characteristic of strategic risk is its low frequency and high severity.
4.3.2.4.1 Strategic Risk Management
To minimize Strategic Risk, the firm actively tracks and manages its major initiatives to ensure successful execution. UFH develops its strategic plan and business initiatives to meet the same. Annual budgets are prepared considering the expected business and operating environment.
4.3.2.4.2 Strategic Risk Methodology
For assessment of strategic risk, the firm identified key drivers of the risk, assess the level of the risk and adequacy and effectiveness of the strategic risk management and finally formulate strategic risk drivers for evaluation of such risk. The strategic risk drivers evaluate the various components e.g. strategic goals and objective, success in implementation of strategies and expansion plans, responsiveness for change in operating environment etc. for strategic risk assessment within the firm. The key drivers considered for the assessment are shown in the figure below:
Figure 2 – Strategic Risk – Scorecard factors
Factors under each category in the above figure are provided in the annexure. The scores are then calculated based on weight given to each response and aggregated to arrive at a final score for Strategic

ICAAP Report
21
Risk. This score is then calibrated with the Pillar 1 Capital table using interpolation method as per the calibration table given below:
S. N. Min Max Applicable % of Pillar 1 Capital
1 95 100 0.00%
2 85 94.99 1.00%
3 75 84.99 2.00%
4 65 74.99 4.00%
5 50 64.99 8.00%
6 25 49.99 15.00%
7 0 24.99 25.00% Table 18 – Strategy Risk – Score Calibration
Limitations of scorecard approach are as follows:
Scorecard gives an overall view of the key areas for concern in strategy implementation; these key areas may not paint the whole picture as the information included on the scorecard is a mix of qualitative and quantitative responses. Also, the result is highly dependent on the reviewer of the scorecard because it is assumed that reviewer has the expertise in its field and has complete knowledge of the firm’s current standing against each factor in the scorecard.
4.3.2.4.3 Strategic Risk Assessment
The firm has assessed its Strategic Risk based on a scorecard approach considering factors related to strategic planning process and Implementation capabilities. The detailed scorecard together with the methodology adopted is described in the section 4.3.2.4.2.
Find below a snapshot of the scorecard results:
S. N. Risk Driver UFH Score Max Score
1 Formulation of overall business and corporate objectives 10.7 12.5
2 Competitive environment 8.3 10.0
3 Innovation risk 0.8 2.5
4 Macro environment 4.6 5.0
5 Stakeholders/ customer environment 1.0 7.5
6 Management environment 12.5 12.5
7 Business Planning 7.5 10.0
8 Implementation of Strategy 5.8 10.0
9 Financial environment 5.0 5.0
10 Product Profiling 4.6 5.0
11 Alignment of Board, Executives, Employees and Systems to Strategic Goals 9.2 10.0
12 Building Operational Plans in line with Strategic Business Plan 10.0 10.0
Score 80.05 100
Table 19 – Strategy Risk – Score Assessment

ICAAP Report
22
4.3.2.4.4 Capital Charge for Strategic Risk
Figure 3 – Strategic Risk – Calibration Result
The score obtained from assessment of Strategic Risk is 80.05 out of 100, on the basis of which the firm has allocated 1.49% of Pillar 1 Risk Capital i.e. SAR 152 K for Strategic Risk.
For 2017-2019 Projections, Strategic Risk score is considered to be same as 80.05 out of 100. Hence, the capital charge for Strategic Risk is calculated as follows:
Strategic Risk 2016 2017 2018 2019
Pillar 1 – Capital 10,170 1,791 1,559 1,441
Strategic Risk Score 80.05 out of 100
Capital % of Pillar 1 Capital 1.49%
Strategic Risk Capital (SAR ‘000) 152 27 23 22
Table 20 – Strategic Risk – Projection Capital
4.3.2.5 Reputational Risk
Reputational risk is the risk of indirect loss (current or prospective) and indirect risk to earnings and capital arising from adverse perception of the image of the firm on the part of customers, counterparties, shareholders, investors or regulators. It is manifested in the fact that the external opinion on the institution is less favorable than desired. Sources of reputational risk may be large system downtime, regular account closure by the clients, non-compliance with regulatory guidelines, regulatory fines for unethical business practices etc.
4.3.2.5.1 Reputational Risk Management
The management and mitigation of reputational risk is conducted through the processes that have been put in place to obviate operational and regulatory risks.
A sound risk management and control environment is essential for UFH to safeguard their assets and capital, and to mitigate reputation risk. Although there is no guarantee that the institution of adequate risk management and controls will always prevent fraud and abuse, such acts will be able to be perpetrated more easily if the overall risk management and control environment is weak.
4.3.2.5.2 Reputational Risk Methodology
Reputation risk is generally less quantifiable therefore the firm shall focus in identification of drivers of such risk events, risk management and mitigation than quantification of such risks. The level, adequacy and

ICAAP Report
23
effectiveness of reputation risk can be assessed through a score card with the parameters on market and public perception of the firm, number of customer complaints, litigation issues, adverse publicity comments, compliance with product and services guidelines etc.
The key drivers considered for the assessment are shown in the figure below:
Figure 4 – Reputational Risk – Scorecard factors
Factors under each category in the above figure are provided in the annexure. The scores are then calculated based on weight given to each response and aggregated to arrive at a final score for Reputational Risk.
This score is then calibrated with the Pillar 1 Capital Charge using interpolation method as per the calibration table given below:
S. N. Min Max Applicable % of Pillar 1 Capital
1 95 100 0.00%
2 85 94.99 1.00%
3 75 84.99 2.00%
4 65 74.99 4.00%
5 50 64.99 8.00%
6 25 49.99 15.00%
7 0 24.99 25.00% Table 21 – Reputational Risk – Score Calibration
4.3.2.5.3 Reputational Risk Assessment
The firm has assessed the Reputational Risk based on a scorecard approach. The scorecard benchmarks various risk drivers to best practices and generates an overall score.
The detailed scorecard together with the methodology adopted is described in the section 4.3.2.5.2. Find below a snapshot of the scorecard results:

ICAAP Report
24
S. N. Risk Driver UFH Score Max Score
1 Asset Management 29.1 30.0
2 Equity Brokerage 0.0 0.0
3 Investment Banking 0.0 0.0
4 Peer group Comparison 6.7 10.0
5 Management Integrity 10.0 10.0
6 Staff competence and support 8.9 10.0
7 Corporate Culture 7.5 10.0
8 Financial Soundness 10.0 10.0
9 Customer Satisfaction 8.0 10.0
10 Contagion Risk 5.0 5.0
11 Crisis management 3.9 5.0
Score 89.04 100
Table 22 – Reputational Risk – Score Assessment
Limitations of scorecard approach are as follows:
Scorecard gives an overall view of the key areas for concern to asses Reputational Risk; these key areas may not paint the whole picture as the information included on the scorecard is a mix of qualitative and quantitative responses. Also, the result is highly dependent on the reviewer of the scorecard because it is assumed that reviewer has the expertise in its field and has complete knowledge of the firm’s standing against each factor.
4.3.2.5.4 Capital Charge for Reputational Risk
Figure 5 – Reputational Risk – Calibration Result
The score obtained from assessment of Reputational Risk is 89.04 out of 100, on the basis of which the firm has allocated 0.60% of Pillar 1 Risk Capital i.e. SAR 61 K for Reputation Risk.
For 2017-2019 Projections, Reputation Risk score is considered to be same as 89.04 out of 100. Hence, the capital charge for Reputation Risk is calculated as follows:

ICAAP Report
25
Reputational Risk 2016 2017 2018 2019
Pillar 1 - Capital 10,170 1,791 1,559 1,441
Reputation Risk Score 89.04 out of 100
Capital % of Pillar 1 Capital 0.60%
Reputational Risk Capital 61 11 9 9
Table 23 – Reputation Risk – Projection Capital
4.3.2.6 Regulatory Risk
Regulatory Risk is measure of firm’s compliance level in adherence to laws, regulations, guidelines and specifications relevant to its business and operating environment. Non Adherence to regulatory guidelines may result in disciplinary actions/ penalties.
4.3.2.6.1 Regulatory Risk Management
The Compliance function is responsible for mitigating and managing regulatory risk by ensuring alignment of the firm with local laws and regulations in all jurisdictions where it operates.
4.3.2.6.2 Regulatory Risk Assessment
The firm’s compliance with regulatory laws has been assessed through a scorecard approach. The scorecard administered to measure regulatory risk included the evaluation of “key important factors” such as the firm’s compliance with The CMA’s trading rules, the effectiveness of the existing corporate governance structure, the firm’s accuracy in its reporting responsibilities, the safeguarding of confidential client data etc. The detailed scorecard along with the methodology adopted is described in the annexure. Shown below is a snapshot of the regulatory scorecard assessment:
S.N. Compliance Checklist
1 Product lines meet regulatory requirements?
2 Financials consistent with CMA requirements on timing and accuracy
3 Information related requirements
4 Corporate Governance regulations
5 CMA penalties for marketing and encouraging others to invest in capital markets outside KSA
6 Compensation suits filed against the firm in recent years
7 Compliance with Anti-money Laundering and counter-terrorism financing rules
8 Intimation to CMA on registration/ termination of employees etc.
9 Any loss of data that has led to a regulatory breach
10 KYC requirements
11 Segregation of business units /Chinese Wall
12 Failure to identify and categorize a high risk account
Table 24 – Regulatory Risk –Checklist
UFH has provided the responses against each of the risk drivers in the check list and the firm adheres to all the major compliance rules as provided in the above table.

ICAAP Report
26
4.3.2.6.3 Capital Charge for Regulatory Risk
The compliance function has made much progress in increasing awareness and training to enhance the compliance culture within the Firm. There has been significant progress in regards to increasing its human resource and technical capability with qualified and well trained staff.
UFH has zero tolerance policy for Regulatory and Compliance risk as it adheres to all the requirements of the CMA and Tadawul. Hence, there is no capital charge allocated for the Regulatory risk.

ICAAP Report
27
5 Capital Planning and Stress Tests
5.1 Introduction
The purpose of capital planning is to define process and key owners for managing UFH's capital plan based on the identified capital requirements from the ICAAP assessment and separately developed business plans.
5.2 Capital Plan
5.2.1 Objectives & Time Horizon
The objective of Pillar II is to ensure that the firms have sufficient capital to support all material risks to which their business exposes them. It shall therefore reinforce the link between the risks and the capital, so that the entity’s risk management strategy, approaches and systems are integrated with its capital planning.
The objectives of capital planning are as follows:
Safeguarding UFH’s ability to continue as a going concern and increase the returns for the shareholders
Complying with regulatory capital requirements set by the CMA
Allocate capital to various businesses in an efficient manner
Maintain capital adequacy ratios above the minimum specified by the CMA
Capital planning exercise is carried out at the time of annual budget preparation. It is based on UFH’s strategic plans and how they relate to macroeconomic factors, including the internal strategy for maintaining capital levels that incorporate factors such as business growth expectations, future sources and uses of funds and dividend policy.
5.2.2 Capital Planning Process
Finance Department collates the required information from the different business and support units and make following projections for at least three years according to the requirements of prudential rules of CMA:
Profit and Loss Accounts showing all the sources of income and expenses
Balance Sheet showing all the items of assets and liabilities
Capital Adequacy Summary showing separately tier I and II capital components
In addition to the above quantified capital requirements, UFH considers at a qualitative level –
The markets in which it operates and whether any competitive / customer changes are expected.
The capability levels of its personnel and their ability to execute on the proposed plans.
The likelihood of disruption to the firm's business from external issues.
Dividend policy of the firm
Based on the long term goals set by the Board as to the level and composition of the capital structure, the business units may be requested to adjust their proposed projections to minimize any surplus or deficit (e.g., to maintain a minimum profitability level or meet specific capital targets). Once adjusted, if a surplus or deficit of capital still exists, then the firm will take appropriate steps to either raise additional capital through
Existing shareholders;

ICAAP Report
28
Deploy the excess capital (e.g., Retained Earnings); or
Issue Capital instruments
5.2.3 Projected Capital Requirement
The following table reflects the capital requirement for the next 3 years up to 2019, based on the business plan, projected financials and assuming the 2016 actual risk profile as the base case:
(All amounts in ‘000 SAR)
Financial Projections 2016 2017 2018 2019
< Actual > < Budget > < Forecast > < Forecast >
Pillar 1 Capital requirements 10,170 1,791 1,559 1,441
Credit Risk 9,306 930 846 747
Market Risks - - - -
Operational risks 863 861 714 694
Pillar 2 Capital requirements 213 37 33 30
Concentration Risk - - - -
Interest Rate Risk - - - -
Liquidity Risk - - - -
Strategic/ Business Risk 152 27 23 22
Reputational Risk 61 11 9 9
Regulatory Risk - - - -
Total of Pillar 1 and Pillar 2 Capital 10,382 1,828 1,592 1,471
Tier 1 Capital 11,333 12,550 10,445 8,170
Tier 2 Capital 336 - - -
Capital base 11,669 12,550 10,445 8,170
Total Capital Ratio 1.15 7.01 6.70 5.67
Capital Ratio with Pillar 1 and Pillar 2 1.12 6.86 6.56 5.55
Table 25 – Projected Capital Requirement
The results indicate that the firm’s capital ratio remains well above 1x times. It also indicates that the firm will be able to maintain sufficient capital to meet future expansion plans such that the minimum capital requirements are met.
5.2.4 Assumptions
The following assumptions form the basis for preparing the projected risk profile and capital requirements for material risks:
Credit Risk: The risk weights are assumed same as on 31st December, 2016.
Market Risk: The Market risk capital charge is calculated basis the Company not intending to invest in any market risk related exposures for 2017-2019.
Operational Risk: In the case of Operational Risk, the capital charge is based on the projected gross income of the firm using the Basic Indicator Approach and Expenditure Based Approach.

ICAAP Report
29
Concentration Risk: It is assumed to remain zero in year 2017, 2018 and 2019 because there is no exposure on the projected balance sheet of the firm.
Interest Risk: It will remain to be zero in year 2017, 2018 and 2019 because there is no interest rate sensitive exposure on the projected balance sheet of the firm.
Liquidity Risk: Expected cash flow gap between financial assets and liabilities for the firm will remain positive due to nature of business profile of the firm.
Strategic Risk: It is assumed to be in same proportion of Pillar 1 Capital as that was in year 2016.
Reputational Risk: It is assumed to be in same proportion of Pillar 1 Capital as that was in year 2016.
5.3 Stress testing
5.3.1 Introduction
The objectives of the stress test are to assess the resilience, solvency, liquidity and profitability of UFH to hypothetical stressed events. Depending on the nature of the risk factor, the impact of the stress testing exercise where applicable, are measured on the following indicators:
Impact on Capital Base – increase/decrease in the accounting profit/loss (Profitability);
Impact on Minimum Capital Requirements – measured in terms of changes in total amount of capital and the Capital Adequacy Ratio (CAR)
5.3.2 Stress Testing Framework
The salient features of the Stress Testing framework are given below:
Stress testing can be done by using sensitivity analysis (wherein impact of change in one variable is assessed on the firm’s financial position) or using scenario test (which include simultaneous moves in a number of variables based on a single event experienced in the past).
UFH shall analyze the impact that new legislation, the actions of competitors or other factors may have on its performance, in order to determine what changes in the environment it could sustain.
Frequency of stress testing shall be at least annually.
5.3.2.1 Governance and Oversight
Finance shall be involved in stress testing framework including design of stress scenarios, review and approval of the results of stress testing. All stress test results shall be shared with the Senior Management and Board for review as a part of ICAAP exercise.
5.3.2.2 Use of Stress Testing Results
Stress Testing results shall be used to take necessary remediation action whenever the profitability or capital adequacy levels are significantly impacted.
5.3.2.3 Weakness / limitation of Stress Testing
Stress testing results are highly dependent upon application of precise assumptions. Any major deviation in adoption of relevant and precise assumptions can widely vary the results.
Further, stress testing result might also consider extreme events that are not plausible and the firm may never face such stressed situation. To mitigate this situation, the firm’s management discusses each scenario/ stress test prior to application to ensure that only plausible tests are implemented.

ICAAP Report
30
5.3.2.4 Time Horizon & reference dates
The exercise was carried out on the basis of the budget figures of the FY 2017 ending on 31st December, 2017 (base case) and the scenarios are applied over this period. The time horizon of one year is consistent with industry best practices and complies with regulatory requirements.
5.3.3 Stress Testing Scenarios and results
UFH has identified the following stress scenarios which are relevant for the purpose of ICAAP stress testing. It is a mix of single factors.
S.N. Scenario
Business Line Description Scenario Assumptions Impact Area
Single Factor Testing
1
Asset Management
Fall in NAV of funds For Real Estate Fund: Fall of 15% in AUM considering the current economic scenario of KSA and real estate prices
Reduced Asset Management Revenues (Impact on Capital Base)
2 Fall in NAV of DPMs
UFH has discontinued the DPM business in 2016 and did not forecast any income being generated from this revenue stream
-
3 AFS investments Fall in Market Value of AFS Investments
A fall of 30% in Market Value considering the current economic scenario of KSA and real estate prices
Stressed Scenario: 30% Fall in Market Value of AFS Investment
30% Fall in Listed equity portfolio
As UFH has not considered any exposure to AFS investments on its balance sheet during 2017-19, this scenario will not be applicable
-
4 Operational Risk
Loss due to Internal Fraud / Litigation / customer claim / external fraud
or
Loss of fixed assets due to natural disaster or calamity
Hypothetical scenario as per industry practice
Stressed Scenario: Internal Fraud / Litigation / customer claim / external fraud – 25% of average revenue for the last 3 years
Loss of fixed assets due to natural disaster or calamity – 25%
Increased Operational Expenditure (Impact on Capital Base)
5 Rating Downgrade
Rating Downgrade of Banks’ with UFH’s deposits leading to higher Risk weight under Credit Risk
A Rating downgrade from 1 to 3 is assumed resulting in a higher risk weight of 100% over the existing 20%
Increased Capital Requirements (Impact on Minimum Capital Requirements)
6 Money Market Investments
Fall in Income from Money Market Investments
Fall in SAIBOR leading to fall in income from Money market investments. 32% fall in SAIBOR is considered based on historical SAIBOR data.
Reduced income from Money market investments (Impact on Capital Base)
Composite/ Multi Factor Testing
A
Combined Scenario considered for Stress Testing Capital
Reduced RE Asset Management Revenues
Increased Operational
This scenario is an aggregation of the selected individual single factor scenarios
(Considered in line with the new CMA Checklist)
Impact on Capital Base and Impact on Minimum Capital Requirements

ICAAP Report
31
S.N. Scenario
Business Line Description Scenario Assumptions Impact Area
Requirement:
Fall in the value of real estate funds
Operational Risk
Rating Downgrade
Fall in the value of Money Market Investments
expenditure
Rating downgrade - Banks with UFH's deposits
Fall in Income from MM Investments
Table 26 – Stress Testing Scenarios
ICAAP Report
32
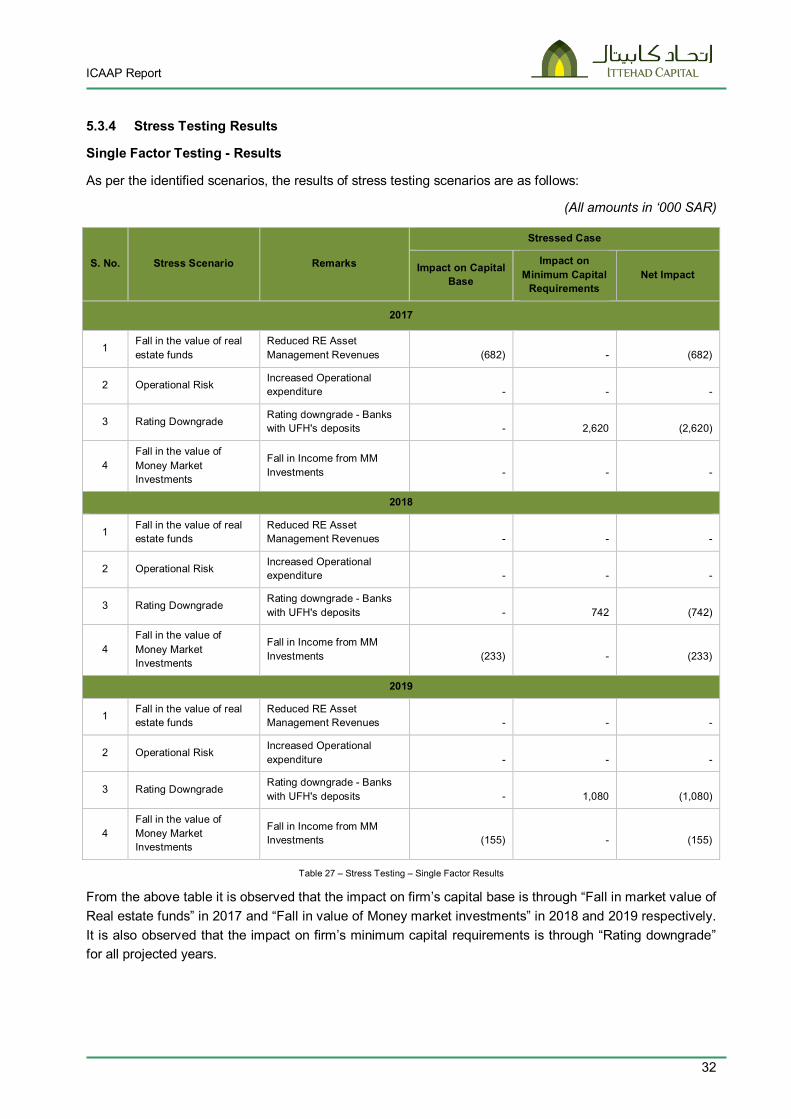
5.3.4 Stress Testing Results
Single Factor Testing - Results
As per the identified scenarios, the results of stress testing scenarios are as follows:
(All amounts in ‘000 SAR)
S. No. Stress Scenario Remarks
Stressed Case
Impact on Capital Base
Impact on Minimum Capital
Requirements Net Impact
2017
1 Fall in the value of real estate funds
Reduced RE Asset Management Revenues
(682)
-
(682)
2 Operational Risk Increased Operational expenditure
-
-
-
3 Rating Downgrade Rating downgrade - Banks with UFH's deposits
-
2,620
(2,620)
4 Fall in the value of Money Market Investments
Fall in Income from MM Investments
-
-
-
2018
1 Fall in the value of real estate funds
Reduced RE Asset Management Revenues
-
-
-
2 Operational Risk Increased Operational expenditure
-
-
-
3 Rating Downgrade Rating downgrade - Banks with UFH's deposits
-
742
(742)
4 Fall in the value of Money Market Investments
Fall in Income from MM Investments
(233)
-
(233)
2019
1 Fall in the value of real estate funds
Reduced RE Asset Management Revenues
-
-
-
2 Operational Risk Increased Operational expenditure
-
-
-
3 Rating Downgrade Rating downgrade - Banks with UFH's deposits
-
1,080
(1,080)
4 Fall in the value of Money Market Investments
Fall in Income from MM Investments
(155)
-
(155)
Table 27 – Stress Testing – Single Factor Results
From the above table it is observed that the impact on firm’s capital base is through “Fall in market value of Real estate funds” in 2017 and “Fall in value of Money market investments” in 2018 and 2019 respectively. It is also observed that the impact on firm’s minimum capital requirements is through “Rating downgrade” for all projected years.
ICAAP Report
33
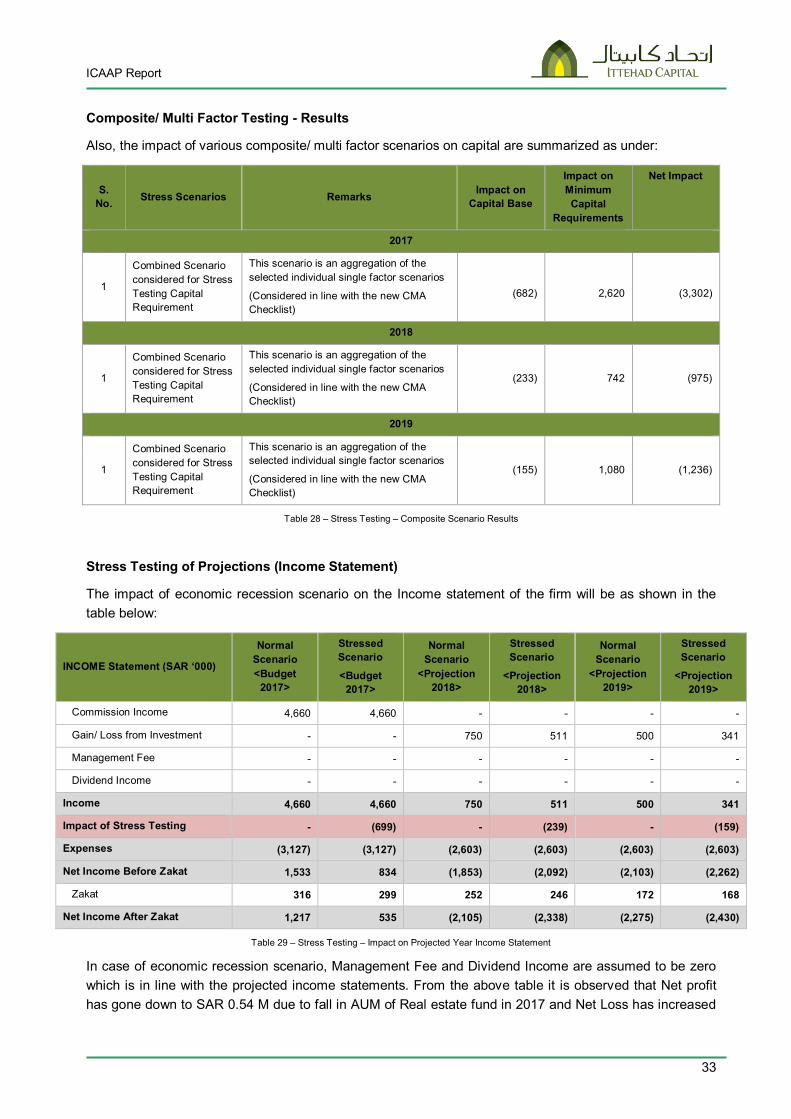
Composite/ Multi Factor Testing - Results
Also, the impact of various composite/ multi factor scenarios on capital are summarized as under:
S. No. Stress Scenarios Remarks Impact on
Capital Base
Impact on Minimum Capital
Requirements
Net Impact
2017
1
Combined Scenario considered for Stress Testing Capital Requirement
This scenario is an aggregation of the selected individual single factor scenarios
(Considered in line with the new CMA Checklist)
(682)
2,620
(3,302)
2018
1
Combined Scenario considered for Stress Testing Capital Requirement
This scenario is an aggregation of the selected individual single factor scenarios
(Considered in line with the new CMA Checklist)
(233) 742 (975)
2019
1
Combined Scenario considered for Stress Testing Capital Requirement
This scenario is an aggregation of the selected individual single factor scenarios
(Considered in line with the new CMA Checklist)
(155) 1,080 (1,236)
Table 28 – Stress Testing – Composite Scenario Results
Stress Testing of Projections (Income Statement)
The impact of economic recession scenario on the Income statement of the firm will be as shown in the table below:
INCOME Statement (SAR ‘000)
Normal Scenario <Budget
2017>
Stressed Scenario
<Budget 2017>
Normal Scenario
<Projection 2018>
Stressed Scenario
<Projection 2018>
Normal Scenario
<Projection 2019>
Stressed Scenario
<Projection 2019>
Commission Income 4,660 4,660 - - - -
Gain/ Loss from Investment - - 750 511 500 341
Management Fee - - - - - -
Dividend Income - - - - - -
Income 4,660 4,660 750 511 500 341
Impact of Stress Testing - (699) - (239) - (159)
Expenses (3,127) (3,127) (2,603) (2,603) (2,603) (2,603)
Net Income Before Zakat 1,533 834 (1,853) (2,092) (2,103) (2,262)
Zakat 316 299 252 246 172 168
Net Income After Zakat 1,217 535 (2,105) (2,338) (2,275) (2,430)
Table 29 – Stress Testing – Impact on Projected Year Income Statement
In case of economic recession scenario, Management Fee and Dividend Income are assumed to be zero which is in line with the projected income statements. From the above table it is observed that Net profit has gone down to SAR 0.54 M due to fall in AUM of Real estate fund in 2017 and Net Loss has increased

ICAAP Report
34
to SAR 2.34 M and SAR 2.43 M due to fall in income from Money market investments in 2018 and 2019 respectively.
Impact of Stress Testing for projected years as follows:
(All amounts in ‘000 SAR)
Stressed Scenario –
<Budget 2017> Stressed Scenario – <Projection 2018>
Stressed Scenario – <Projection 2019>
Tier-1 capital 12,550 10,445 8,170
Tier-2 capital - - -
Capital base 12,550 10,445 8,170
Credit Risk 930 846 747
Market Risk - - -
Operational Risk 861 714 694
Pillar 1 Capital Requirement 1,791 1,559 1,441
Pillar 1 Capital Ratio 7.01 6.70 5.67
Concentration Risk - - -
Interest Rate Risk - - -
Liquidity Risk - - -
Strategic/ Business Risk 27 23 22
Reputational Risk 11 9 9
Regulatory Risk - - -
Pillar 2 Capital Requirement 37 33 30
Capital Ratio before Stress Test 6.86 6.56 5.55
Impact on Capital Base to Cover Stress Test -682 -233 -155
Impact on Minimum Capital Requirement 2620 742 1080
ICAAP Capital Requirement 4,448 2,334 2,551
Change in Capital Base due to Stress 11,868 10,212 8,015
Surplus (Deficit) in Capital Base 7,420 7,878 5,464
ICAAP and Stressed Capital Ratio 2.67 4.38 3.14
Table 30 – Stress Testing – 3 Year Projections

ICAAP Report
35
The following table presents capital and capital requirement for the current year projection (2017):
(All amounts in ‘000 SAR)
Pillar 1 Pillar II
Particulars Minimum Capital Requirement ICAAP
Market Risk - -
Credit Risk 930 930
Operational Risk 861 861
Pillar 1 1,791 1,791
Concentration Risk - -
Liquidity Risk - -
Interest Rate Risk - -
Reputation risk - 11
Strategic risk - 27
Regulatory Risk - -
Pillar 2 37
Additional capital to cover stress testing 2,620
ICAAP Capital requirement 4,448
Additional Capital required 2,658
Capital Base 12,550 11,868
Surplus (Deficit) in Capital Base 10,759 7,420
Capital ratio 7.01 2.67
Table 31 – ICAAP Summary Table
After considering the stress testing capital and additional capital for Reputational and Strategic risk, the overall ICAAP Capital requirement comes out to be SAR 4.45 M against the capital base of SAR 11.87 M. The new Capital Ratio is 2.67x which is above the minimum capital ratio prescribed by CMA, it also shows that the firm is adequately capitalized to meet the adverse economic conditions.

ICAAP Report
36
6 Challenge and Adoption of ICAAP The Internal Capital Adequacy Assessment Process, after getting established by UFH, is challenged at by Senior Management so that the ICAAP framework, methodology, and assumptions etc. are in line with CMA guidelines. The ICAAP governance, information flow as well as the role and responsibilities of all stakeholders are clearly described in the section 6.1 of this document. The ICAAP of UFH follows a consultative process with the inputs from appropriate units. A series of meetings and workshops were held with the appropriate units for brainstorming on the material risks impacting various businesses, the possible methods of measuring and evaluating them, the related mitigants, etc. Inputs from these meetings were collated and used to refine earlier independent assessments made. The final ICAAP Report is presented to Senior Management for challenge process. The report is then signed off from the CEO and submitted to Board for approval.
In compliance with regulatory guidelines, the ICAAP shall also be subjected to an independent review or validation through an internal audit process. The report obtained from an internal audit on the independent review performed on the ICAAP shall also be presented to the Senior Management so that appropriate corrective actions could be taken at the earliest.
6.1 ICAAP Governance
UFH’s Senior Management is aware and acknowledges the responsibility placed on them in view of the CMA guidelines on ICAAP. The Chief Executive Officer of UFH has the responsibility over the ICAAP and ensure that the ICAAP is an integrated part of the business environment. The ICAAP is proportionate to the nature, scale and complexity of the activities of the firm. The table below lists down the activities / processes to be undertaken in ICAAP:
S. N. Activity / Process Unit Responsible Deliverable Frequency Review /
Approver
A Risk Assessment
1 Develop / Review Risk Appetite Statement CFO Risk Appetite Annual CEO
2 Risk Assessment of Material Pillar II Risks CFO
Risk Assessment Section of ICAAP Document
Annual CEO
B Capital Adequacy and Strategic Planning
3 Pillar I Capital Computations CFO Pillar I Capital Computations Monthly CFO
4 Development of Strategic Intent, Annual Budget & Strategic Focus for 3 years
CFO Annual Budget and Strategic Plan (for at least 3 years)
Annual
Reviewed by CEO and approved by the Board
5
Collate relevant portion of projected capital adequacy positions and other relevant details to develop the capital assessment section of ICAAP Document
CFO
Capital Assessment Section of ICAAP Document
Annual CEO
C Stress Testing

ICAAP Report
37
S. N. Activity / Process Unit Responsible Deliverable Frequency Review /
Approver
6 Conduct Stress Testing CFO Stress Testing Section of ICAAP Document
Annual or earlier if deemed necessary
CEO
D ICAAP Document
7
Develop first version of ICAAP Document and assess the adequacy given Pillar 2 calculations and present to Senior Management for review and Challenge.
CFO ICAAP Document Annual (from ICAAP perspective)
CEO
8
Refine the ICAAP based on amendments (if any) suggested by CEO/ Board & Submit the finalized ICAAP document
CFO Comments on ICAAP Document Annual CEO & Board
E Internal Review
9 Independent Review of the ICAAP Document Internal Audit Audit Report Annual Audit Committee
Table 32 – ICAAP Governance – Role & Responsibilities
The ICAAP Report will be approved by the Board. The Internal Audit will independently review as per the annual plan, the governance and capital requirements under Pillar II, based on the ICAAP Report prepared by the firm, and report its findings to Audit Committee for their action/modifications.

ICAAP Report
38
7 Use of ICAAP within UFH The ICAAP enables the UFH to review the capital impact of assessed Pillar II risks as well as to examine any new risk dimensions coming out of existing and new business / products. It acts as a sanity check for the feasibility of business plans based on projected risk profile and capital. Important elements of ICAAP including growth and profitability targets, scenario analysis, and stress testing shall be used in setting of business plans and management policies. It is also used as a platform to sensitize board, senior management, and key stakeholders about the CMA guidelines, risk concepts, risk appetite, risk profile, risk management framework and capital linkage enabling the strengthening of risk framework (by identifying future refinements) as well as institutionalization of Risk Culture within the Firm.

ICAAP Report
39
8 Annexures
8.1 Strategic Risk – Scorecard
S. No. Categories for Strategic Risk Response
1 Formulation of overall business and corporate objectives
1.1 Strategy document in place approved by BoD Yes
1.2 Mission & Vision Statement of the firm clearly defined Yes
1.3 Goals and Objectives of the firm Yes
1.4 Implementation roadmap/Action plan Yes
1.5 Does the firm consider Strategy as a dynamic document and update the strategy on a periodical basis and present the changes / updates report to the Board for their review and approval?
Needs Improvement
1.6 Does the firm have adequate internal controls in place to monitor the progress of the strategy implementation and early identification of problems and failure of strategy.
Needs Improvement
1.7 Does the firm monitor changes in technology, regulation and macro-economic factors within KSA, GCC region and Global investment firms which may potentially effect the strategy.
Needs Improvement
2 Competitive environment
2.1 Threat of new entrants No Impact
2.2 Benchmarking (AUM fees, brokerage fees, services, etc.) exercise against peers Yes
2.3 Threat of substitute services (similar funds with similar benchmarks) No Impact
2.4 Entry into a new market [geographic, service or product] Moderate Survival
3 Innovation risk
3.1 Adoption of new technologies in core areas/systems /offerings/products In line with Industry Standards
3.2 Efficiency of Business processes In line with Industry Standards
4 Macro environment
4.1 Does the firm undertake a regular assessment/research of changing economic scenario (change in government fiscal policy, budgets etc.) and its impact on its Business?
Yes
4.2 Impact of Saudi Arabia's Economy (Stock market and Oil Prices) on firm's Business Low Severity
4.3 Impact of recession in the world economy and on firm's Business Medium Severity
4.4 Impact of Interest Rate movements on firm's Business Low Severity
5 Stakeholders/ customer environment
5.1 Does the firm do regular customer profiling and segmentation to understand its needs ? No
5.2 Does the firm do regular studies to understand the profitability and risks associated with each customer segment?
No
5.3 Is the firm's customer base retention comparable to industry standards? Comparable to industry standards
5.4 Is the firm proactive at aligning compensation benefits for its employees as per market benchmarks?
Comparable to industry standards
5.5 Does the firm have enough employee back-up in lieu of absenteeism to service the clients? No
6 Management environment
6.1 Succession Planning In Place
6.2 Loss of key staff 0 to 2
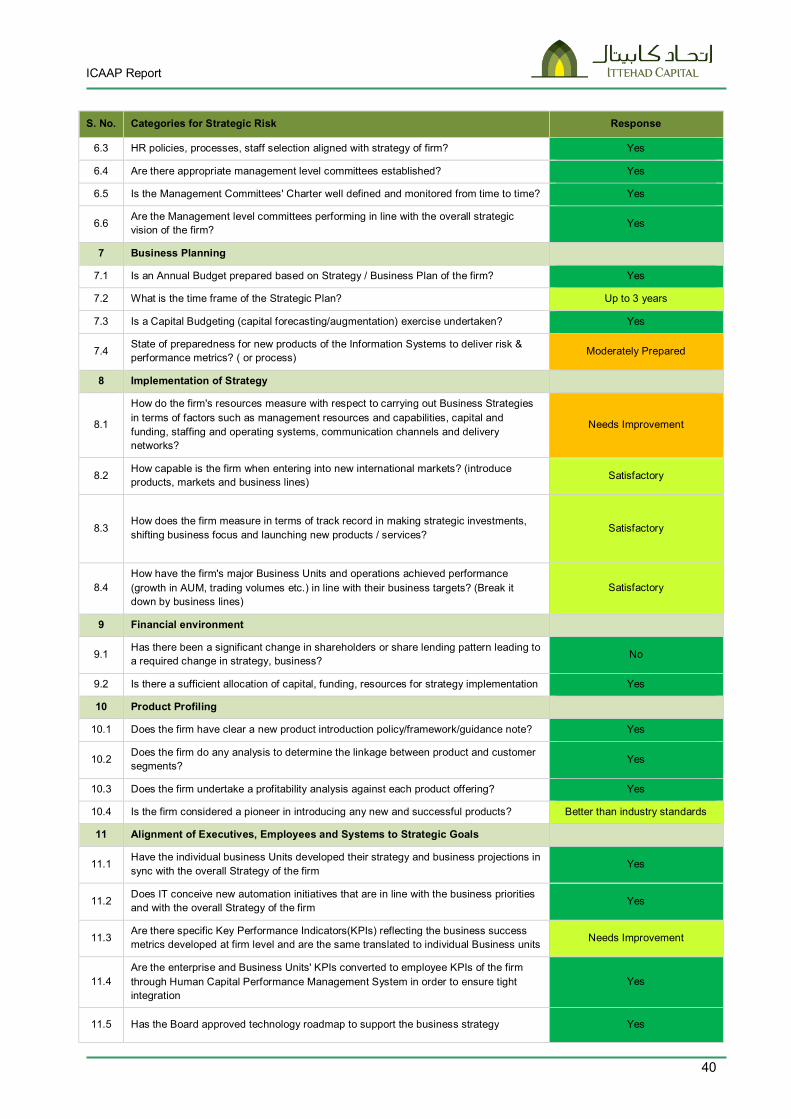
ICAAP Report
40
S. No. Categories for Strategic Risk Response
6.3 HR policies, processes, staff selection aligned with strategy of firm? Yes
6.4 Are there appropriate management level committees established? Yes
6.5 Is the Management Committees' Charter well defined and monitored from time to time? Yes
6.6 Are the Management level committees performing in line with the overall strategic vision of the firm? Yes
7 Business Planning
7.1 Is an Annual Budget prepared based on Strategy / Business Plan of the firm? Yes
7.2 What is the time frame of the Strategic Plan? Up to 3 years
7.3 Is a Capital Budgeting (capital forecasting/augmentation) exercise undertaken? Yes
7.4 State of preparedness for new products of the Information Systems to deliver risk & performance metrics? ( or process) Moderately Prepared
8 Implementation of Strategy
8.1
How do the firm's resources measure with respect to carrying out Business Strategies in terms of factors such as management resources and capabilities, capital and funding, staffing and operating systems, communication channels and delivery networks?
Needs Improvement
8.2 How capable is the firm when entering into new international markets? (introduce products, markets and business lines) Satisfactory
8.3 How does the firm measure in terms of track record in making strategic investments, shifting business focus and launching new products / services? Satisfactory
8.4 How have the firm's major Business Units and operations achieved performance (growth in AUM, trading volumes etc.) in line with their business targets? (Break it down by business lines)
Satisfactory
9 Financial environment
9.1 Has there been a significant change in shareholders or share lending pattern leading to a required change in strategy, business? No
9.2 Is there a sufficient allocation of capital, funding, resources for strategy implementation Yes
10 Product Profiling
10.1 Does the firm have clear a new product introduction policy/framework/guidance note? Yes
10.2 Does the firm do any analysis to determine the linkage between product and customer segments? Yes
10.3 Does the firm undertake a profitability analysis against each product offering? Yes
10.4 Is the firm considered a pioneer in introducing any new and successful products? Better than industry standards
11 Alignment of Executives, Employees and Systems to Strategic Goals
11.1 Have the individual business Units developed their strategy and business projections in sync with the overall Strategy of the firm
Yes
11.2 Does IT conceive new automation initiatives that are in line with the business priorities and with the overall Strategy of the firm Yes
11.3 Are there specific Key Performance Indicators(KPIs) reflecting the business success metrics developed at firm level and are the same translated to individual Business units Needs Improvement
11.4 Are the enterprise and Business Units' KPIs converted to employee KPIs of the firm through Human Capital Performance Management System in order to ensure tight integration
Yes
11.5 Has the Board approved technology roadmap to support the business strategy Yes

ICAAP Report
41
S. No. Categories for Strategic Risk Response
12 Building Operational Plans in line with Strategic Business Plan
12.1 In the formulation of firm Strategies, are the business units required to prepare their respective business plans complete with Income Statement and Balance sheet metrics which are then aggregated into the firm Strategies.
Yes
12.2 In particular, does the firm has operational plans aggregating into strategic business plan in terms of:
12.2.1 Strategic Growth rates Yes
12.2.2 Revenues Yes
12.2.3 Expenses Yes
12.2.4 Profits Yes
12.2.5 (No. of resources with required skill sets) Quality of resources with required skill set Yes
12.2.6 Sufficient succession planning / backup for the key resources Yes

ICAAP Report
42
8.2 Reputational Risk – Scorecard
S. No. Categories for Reputation Risk Response
1 Asset Management specific factors
1.1 Does the firm have fair and consistent valuation methodologies in place for NAV computation?
Consistent and reviewed by third party
1.2 Do the portfolio managers enjoy complete independence on risk analysis and investments? Yes
1.3 Does the firm has all the managed portfolios being benchmarked and the hard limits from any deviations clearly specified? Yes
1.4 Are all Investment Charter limits being monitored (such as Min investment in liquid assets, return on investment, Quarterly VaR limit, Sharp ratio)?
Not Applicable
1.5 Number of pre-mature closure of funds under management in last 2 years No pre-mature closure
1.6 Have the Asset managers been sued for using different strategies than mentioned in prospectus over last 2 years?
No
1.7 Decline in the value of portfolio's under management vis-à-vis- portfolios benchmarks during the last 3 years Increment between 0 and 10%
1.8 Does the firm understand and monitor the client risk tolerance and expectations periodically? Yes; Half-yearly
1.9 Does the firm issue invoices for fees and get them settled? Invoices are sent before deduction of fees
1.10 Has any of the funds under management suffered liquidity pressure and the firm was not able to return cash in a timely manner in last 3 years? No
1.11 Are clients given preference over proprietary investments when dealing in same stock?
Yes
2 Brokerage specific factors
2.1 Number of significant downtime in trading systems without back-up support to cover power outages/loss of system availability in last 2 years Not Applicable
2.2 Number of instances where customers complained about unsolicited advises given by the brokers during last 2 years
Not Applicable
2.3 Does the firm record all the transaction related communications made with the customers?
Not Applicable
2.4 Do the institutional and retail trading desks have clear separation of roles to prevent any conflict of interest ? Not Applicable
2.5 Does the firm addresses client complaints on bad temperament of brokers adequately? Not Applicable
2.6 Are brokers at all times available to take calls during trading hours? Not Applicable
2.7 Are the trade confirmations sent to client through sms/e-mail/post? Not Applicable
3 Investment Banking specific factors
3.1 Advisory Deal becoming unprofitable Not Applicable
3.2 Advice perceived to be incompetent Not Applicable
3.3 Delays in executing the assignment Not Applicable
3.4 Negligent advice with regulatory implications Not Applicable
3.5 Failure to identify significant M&A issue Not Applicable
3.6 Undersubscription of an issue/underwriting deal Not Applicable

ICAAP Report
43
3.7 Insider Trading Not Applicable
4 Peer group Comparison
4.1 Fund Rankings 4 to 6
5 Management Integrity
5.1 Number of instances of middle or top management fraud/corruption/willful negligence in the past 3 years? 0
5.2 Number of instances of serious incorrect disclosure to the regulator / stakeholder, advertently or inadvertently come to light?
0
5.3 Number of instances of acts of management (like unwise investment in its own group company) that has been questioned in the public domain
0
6 Staff competence and support
6.1 Does the firm have a documented recruitment policy? Yes
6.2 Are job descriptions clearly documented and mapped to qualifications so as to avoid any bias in both recruitment and selection?
Both description and qualifications documented and mapped
6.3 Number of cases/ litigation and/or adverse publicity with regards to disgruntled employees in the past 3 years? 0
6.4 Is employee remuneration in line with industry and peers/competition? Entirely
6.5 Is staff attrition in line with industry standards? Lower than most firm
6.6 Are criteria for promotions on jobs and career structure clearly defined? Yes
6.7 Have there been any cases or adverse publicity regarding working conditions and/or timings?
No
6.8 How evolved is the performance appraisal process in the firm? Appraisal process on ad hoc basis
6.9 Does the firm undertake employee friendly measures like soft loans to employees, subsidized education/healthcare to employees?
Best in the industry
7 Corporate Culture
7.1 Is there a properly documented Code of Ethics for the employees? Yes
7.2 Does the firm conduct training for the employees on the 'Code of Ethics'? No
7.3 Does the firm have a documented whistle blower policy? Yes
7.4 Is there a formal process for employees to voice concerns ? (Grievance Redressal policy)
Yes
8 Financial Soundness
8.1 Number of adverse comments in media or in the industry about the financial soundness of the firm or its promoter in the past 3 years? 0
8.2 Has the firm or its promoter made any large investment in the past 3 years that has been adversely reviewed by the media/regulator/internal auditor?
No
8.3 Has the firm been involved in any hostile takeover bids in the past 3 years? No
9 Customer Satisfaction
9.1 Number of cases where customer information has been mishandled - inadvertently destroyed, lost, exposed to third parties etc. thereby breaching confidentiality obligations in the last 2 years?
None
9.2 Does the firm have a dedicated customer service/complaints team? Yes
9.3 Does the firm have a clear escalation process set up in handling customer Yes

ICAAP Report
44
complaints?
9.4 Online Customer Complain platform No
9.5 Number of instances where the firm has been accused of overcharging on agreed fees in the last 2 years? 0
10 Contagion Risk
10.1 Is the firm susceptible to reputation events from subsidiaries, parent or sister concerns?
No
10.2 Does the firm have significant exposure against a group or a single customer such that a reputation event against that customer can affect the firm?
No single exposure more than 10% of its portfolio
10.3 Were any of the firm's service providers (including outsourced services) involved in causing a reputation event for the firm? No
11 Crisis management
11.1 Does the firm have a documented BCP plan and DRP plan in place? Yes, both BCP and DRP
11.2 How often is the BCP reviewed? Annually
11.3 How often is the DRP reviewed? Annually

ICAAP Report
45
8.3 Regulatory Risk – Checklist
S.no Compliance Checklist Response
1 Do all the products in all the business lines meet regulatory requirements? Compliant
2 Does the firm ensure that the financials are consistent with the CMA requirements on timing and the accuracy of information published?
Compliant
3 Trading rules
3.1 Does the firm fully comply with the CMA trading rules? Not Applicable
3.2 Has the firm being charged for indulging in Wash trades (buy through one broker sell through other; manipulate trading volumes of a stock)? Not Applicable
4 Information
4.1 Has the firm been fined due to the actions of an employee that has created false or misleading information as to the prices or the value of a security(violation of Art.49 of Capital Market Law)?
Compliant
4.2 Has there been instances where the senior management and other employees have been accused for providing material insider information (Art.50 of Capital Market Law) Compliant
4.3 Have the funds complied with the rules and regulations as mentioned in the prospectus? Compliant
4.4 Misleading information in communication material Compliant
5 Does the firm comply with the corporate governance regulations as specified by CMA for below mentioned areas:
5.1 Main Functions of the Board Compliant
5.2 Responsibilities of the Board Compliant
5.3 Committees of the Board Compliant
5.4 Meetings of the Board Compliant
6 Has the firm been penalized by the CMA for marketing and encouraging others to invest in capital markets outside KSA and collecting money from them (violation of Article 5 of securities Business regulations)
Compliant
7 Has there been an instance where the firm was ordered by Committee for Resolution of Securities Disputes (CRSD)/ Appeal Committee for the Resolution of Securities Conflicts (ACRSC) to pay for any compensation suit filed against the firm in recent years?
Compliant
8 Does the firm fully comply with the Anti-money Laundering and a counter-terrorist financing rule issued by CMA and ensures that an account for an ineligible client is never opened? Compliant
9 Intimation to CMA on the following:
9.1 Registration of new Staff Compliant
9.2 Termination of Staff Compliant
9.3 Use of non-certified Staff Compliant
10 Has the firm suffered a loss/destruction of important data which have led to a regulatory breach? Compliant
11 Is the firm fully compliant with KYC requirement and perform updates accordingly Compliant
12 Segregation
12.1 Is there a Chinese wall in place between the relevant business divisions? Compliant
12.2 Is there a segregation of proprietary and client funds? Compliant
13 Failure to identify and categorize a high risk account Compliant

ICAAP Report
46
8.4 References
Capital Market Authority - Prudential Rules - Issued by the Board of the Capital Market Authority, based on the Capital Market Law, issued by Royal Decree No. M/30, dated 2/6/1424AH
CMA - Internal Capital Adequacy Assessment Process (ICAAP) - Suggested format for ICAAP Report, Version 1.0, 30 January 2014
CMA - ICAAP - Stress Testing Expectations, 4 April 2017