Embed Size (px)
Citation preview
UGANDA AGRICULTURAL SNAPSHOT 2009/10 Roberts, Cleophelia; Azzarri, Carlo
MARCH, 2014 HARVESTCHOICE - INTERNATIONAL FOOD POLICY RESEARCH INSTITUTE (IFPRI)
harvestchoice.org
1
Abstract The purpose of this series of country briefs is to provide a comprehensive and standardized view of agricultural characteristics integrat-
ed with socioeconomic variables across countries. In the Uganda Agricultural Snapshot, we illustrate the state of agriculture in Uganda
with reference to both household characteristics and the national context. Graphs and tables are generated using data from the Uganda
National Panel Survey (NPS) 2009/2010. Income and expenditure variables, including expenditure deciles and income shares, are based
on the expenditure and income aggregates constructed by HarvestChoice and the Rural Income Generating Activities (RIGA) team at the
Food and Agriculture Organization (FAO) of the United Nations.
The 2009/2010 NPS is a multi-topic survey conducted over a twelve-month period on a nationally representative sample. It took
place in two visits to accommodate seasonality in agricultural activity and consumption and was sampled in households from 322 of the
783 enumeration areas (EAs) of the Uganda National Household Survey (UNHS) 2005/2006. Data from the NPS are representative at the
level of the following strata: 1) Kampala, 2) other urban areas, 3) central rural areas, 4) eastern rural areas, 5) western rural areas, and 6)
northern rural areas. In each of these strata, EAs from the 2005/2006 UNHS were selected with equal probability, apart from rural areas
of ten districts which were oversampled in the 2005/2006 UNHS.
Suggested Citation Roberts, Cleophelia; Azzarri, Carlo (2014) "Uganda Agricultural Snapshot 2009/10," HarvestChoice - International Food Policy Research
Institute (IFPRI).
2
Table of Contents
Abstract .................................................................................................................................................................................... 1
Suggested Citation ................................................................................................................................................................... 1
List of Tables and Figures ......................................................................................................................................................... 2
1 Introduction ..................................................................................................................................................................... 2
2 The Country at a Glance .................................................................................................................................................. 3
3 Farm Assets, Farming Systems and Agricultural Input Use ............................................................................................. 9
4 Crop Production ............................................................................................................................................................. 15
5 Livestock ........................................................................................................................................................................ 17
6 Nutrition ......................................................................................................................................................................... 18
7 Conclusion ...................................................................................................................................................................... 23
References ................................................................................................................................................................................................ 25
List of Tables and Figures Table 1: Characteristics of Uganda Population ............................................................................................................................................... 3
Table 2: Characteristics of Ugandan Households ............................................................................................................................................ 5
Table 3: Household Characteristics by Expenditure Quintile .................................................................................................................... 6
Table 4: Income Sources for Ugandan Households ........................................................................................................................................ 7
Table 5: Income Composition by Expenditure Decile.................................................................................................................................... 8
Table 6: Household Agricultural Plots by Season .........................................................................................................................................10
Table 7: Mean Household Agricultural Input Use, by Region ...................................................................................................................11
Table 8: Agricultural Input Use by Characteristics of Household Head ...............................................................................................12
Table 9: Agricultural Input Use by Household Characteristics ................................................................................................................13
Table 10: Top Inputs during the First and Second Cropping Seasons ..................................................................................................14
Table 11: Prevalence of Livestock Ownership and Average Number of Livestock Owned, by Region ...................................17
Table 12: Child Nutritional Outcomes, by Gender and Region ................................................................................................................20
Table 13: Child Nutritional Outcomes, by Child and Household Characteristics .............................................................................23
Figure 1: Agricultural Engagement and Poverty by Region ........................................................................................................................ 4
Figure 2: Income Composition by Expenditure Decile .................................................................................................................................. 8
Figure 3: Mean Cultivated Area for Two Cropping Seasons, by Household ......................................................................................... 9
Figure 4: Top Ten Crops by Average Production Value, Mean by Household ...................................................................................15
Figure 5: Top Three Crops by Region, Mean by Household by Average Production Value .........................................................15
Figure 6: Crop Production Value by Expenditure Quintile ........................................................................................................................16
Figure 7: Top Farming Systems ............................................................................................................................................................................16
Figure 8: Child Nutritional Outcomes by Region ...........................................................................................................................................19
Figure 9: Stunting Prevalence by Age and Gender ........................................................................................................................................21
Figure 10: Underweight Prevalence by Age and Gender............................................................................................................................22
Figure 11: Wasting Prevalence by Age and Gender......................................................................................................................................22
1 Introduction As Uganda’s population remains overwhelmingly rural, Ugandans are heavily involved in agriculture and obtain most of their income
from it. Yet, despite agriculture’s importance to the country, the contribution of agriculture to the economy is in decline, as the service
sector expands. However, employment in the service sector is not keeping pace with the sector’s contribution to gross domestic product
(GDP). Instead, even as agriculture’s contribution to GDP wanes, it employs an increasing number of Ugandans. While the birth rate
remains at 6.7 live births per woman, the death rate is steadily decreasing (Mukwaya et al. 2012). Therefore, the rising population will
require steady employment over the coming years.
3
Much of Uganda’s agricultural activity remains devoted to subsistence rather than commercial farming. Rural households hold
small amounts of land and consume most of their produce. Whereas agriculture is of increasing importance to rural households, which
make up most of the population, urban-oriented sectors are driving most of the country’s growth (Mukwaya et al. 2012). Yet Diao et al.
(2012) argue that agriculture-driven growth is more pro-poor than service-led growth. In ten countries in Africa, Diao et al. (2012) find
that a one-percent addition to GDP growth from agriculture leads to a three- to four-percent decrease in poverty. Their findings further
suggest that staple crops are most effective at producing economic growth and reductions in poverty than export crops (Diao et al.
2012).
To observe increased growth in agriculture, public investment in agriculture, especially in rural roads, irrigation, and education, is
necessary (Diao et al. 2012).The government of Uganda recognizes that transport and communication infrastructure are essential to
economic development in rural areas. Therefore, it has invested in roads from rural areas to urban markets. However, the most distant
rural areas are not always linked to these roads (Mukwaya et al. 2012). Increasing access to markets for these remote areas is vital to
lifting them out of poverty. Furthermore, regionally specific interventions are necessary. Because of the great geographic and cultural
diversity of Uganda, any agricultural growth strategy must be adapted to the various regions of the country. It is unlikely that a single
strategy will work for the entire country (Diao et al. 2012).
The following brief describes the current state of households in Uganda. Section 2 focuses on household characteristics such as
wealth, education, and participation in agriculture. In Section 3 we describe land holdings and input use patterns. Sections 4 and 5 focus
on crop and livestock production, respectively. In Section 6 we address the state of nutrition in Uganda. Finally, Section 7 concludes.
2 The Country at a Glance
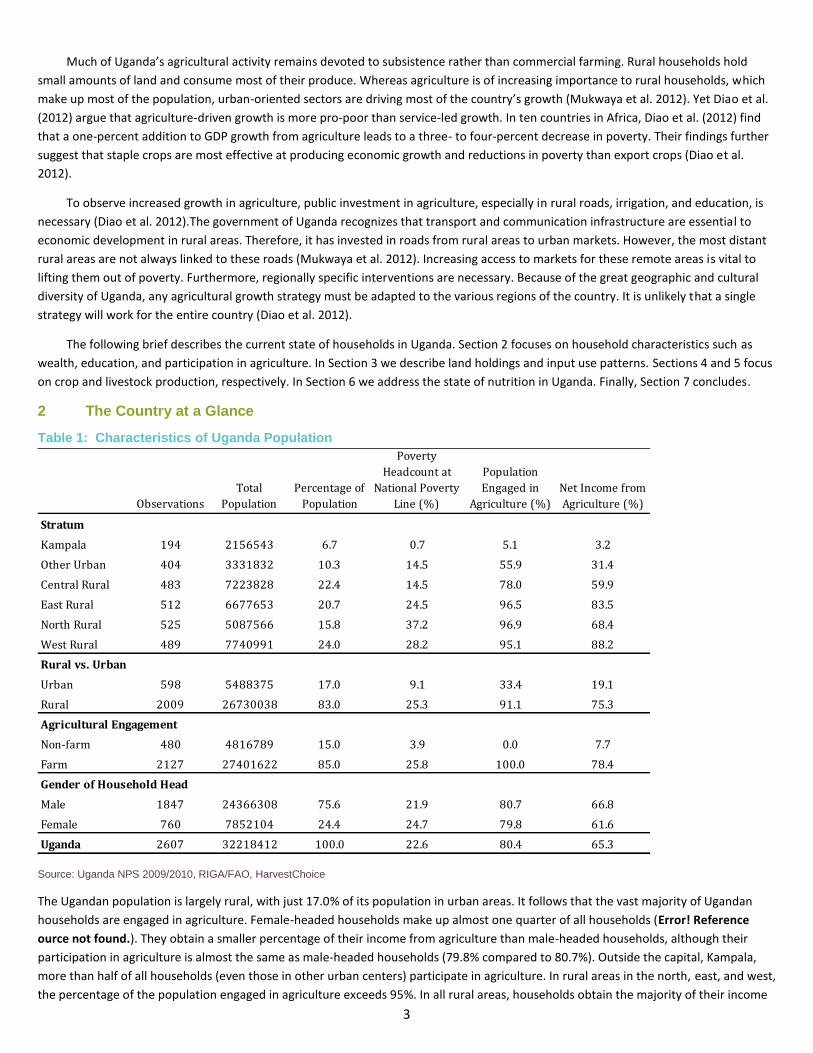
Table 1: Characteristics of Uganda Population
Source: Uganda NPS 2009/2010, RIGA/FAO, HarvestChoice
The Ugandan population is largely rural, with just 17.0% of its population in urban areas. It follows that the vast majority of Ugandan
households are engaged in agriculture. Female-headed households make up almost one quarter of all households (Error! Reference
ource not found.). They obtain a smaller percentage of their income from agriculture than male-headed households, although their
participation in agriculture is almost the same as male-headed households (79.8% compared to 80.7%). Outside the capital, Kampala,
more than half of all households (even those in other urban centers) participate in agriculture. In rural areas in the north, east, and west,
the percentage of the population engaged in agriculture exceeds 95%. In all rural areas, households obtain the majority of their income
Observations
Total
Population
Percentage of
Population
Poverty
Headcount at
National Poverty
Line (%)
Population
Engaged in
Agriculture (%)
Net Income from
Agriculture (%)
Stratum
Kampala 194 2156543 6.7 0.7 5.1 3.2
Other Urban 404 3331832 10.3 14.5 55.9 31.4
Central Rural 483 7223828 22.4 14.5 78.0 59.9
East Rural 512 6677653 20.7 24.5 96.5 83.5
North Rural 525 5087566 15.8 37.2 96.9 68.4
West Rural 489 7740991 24.0 28.2 95.1 88.2
Rural vs. Urban
Urban 598 5488375 17.0 9.1 33.4 19.1
Rural 2009 26730038 83.0 25.3 91.1 75.3
Agricultural Engagement
Non-farm 480 4816789 15.0 3.9 0.0 7.7
Farm 2127 27401622 85.0 25.8 100.0 78.4
Gender of Household Head
Male 1847 24366308 75.6 21.9 80.7 66.8
Female 760 7852104 24.4 24.7 79.8 61.6
Uganda 2607 32218412 100.0 22.6 80.4 65.3
4
from agriculture. Rural households in the east and west obtain more than 80% from agriculture. Kampala households, by contrast,
obtain just 3.2% of their income from agriculture.
Not only do urban households obtain a smaller share of their income from agriculture, they are less likely than rural households to
be poor. They also have a higher standard of living than their rural counterparts (Mukwaya et al. 2012). While 9.1% of urban individuals
are poor according to the national poverty line, 25.3% of rural individuals live below the national poverty line. In Kampala only 0.7% of
individuals live in poverty. Northern rural areas have the highest poverty headcount ratio (37.2%). There is a small difference between
the poverty headcount ratio among male- and female-headed households. While just 21.9% of individuals in male-headed households
are poor, 24.7% of individuals in female-headed households are. On the other hand, the difference in the poverty headcount ratio
between farm and non-farm households is more striking. Around 4% of individuals in non-farm households are poor, compared to more
than 26% of individuals in farm households
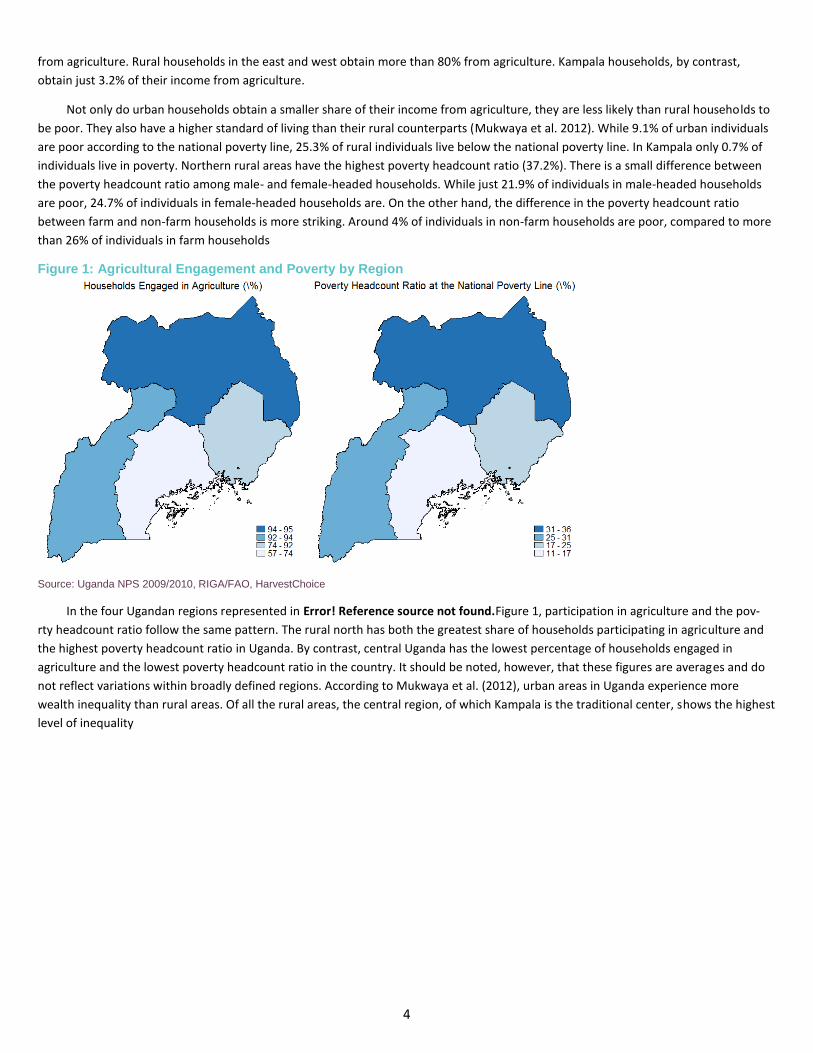
Figure 1: Agricultural Engagement and Poverty by Region
Source: Uganda NPS 2009/2010, RIGA/FAO, HarvestChoice
In the four Ugandan regions represented in Error! Reference source not found.Figure 1, participation in agriculture and the pov-
rty headcount ratio follow the same pattern. The rural north has both the greatest share of households participating in agriculture and
the highest poverty headcount ratio in Uganda. By contrast, central Uganda has the lowest percentage of households engaged in
agriculture and the lowest poverty headcount ratio in the country. It should be noted, however, that these figures are averages and do
not reflect variations within broadly defined regions. According to Mukwaya et al. (2012), urban areas in Uganda experience more
wealth inequality than rural areas. Of all the rural areas, the central region, of which Kampala is the traditional center, shows the highest
level of inequality
5
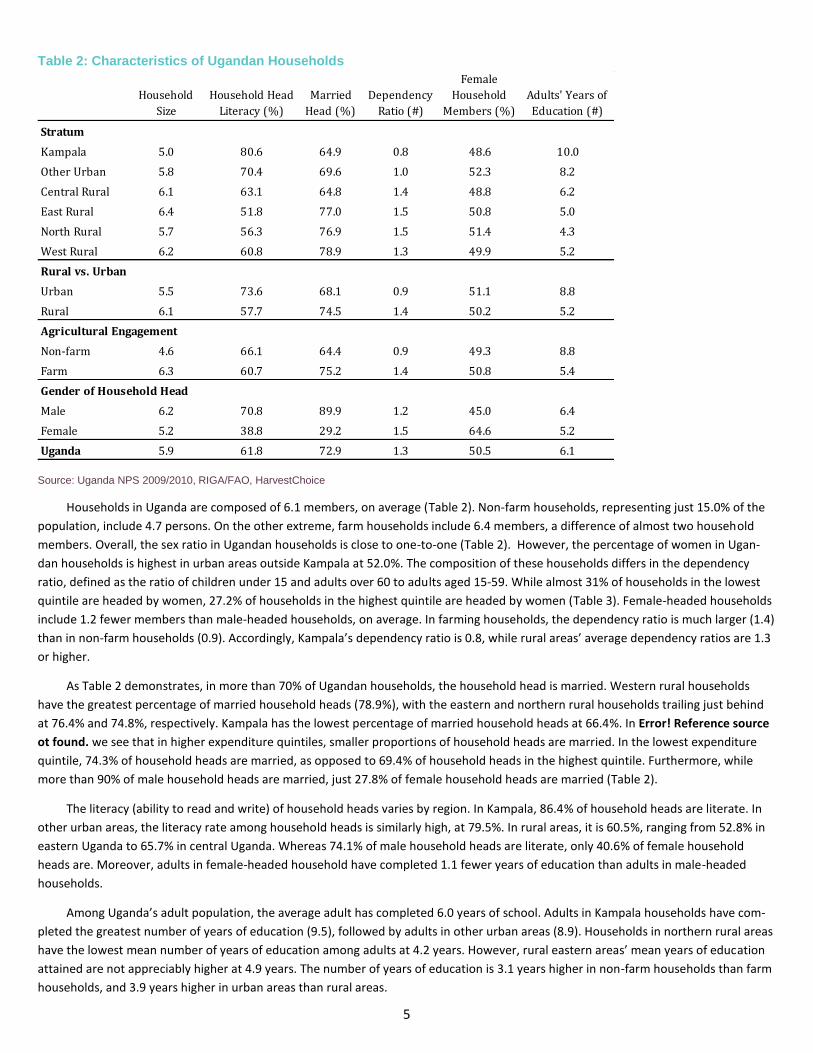
Table 2: Characteristics of Ugandan Households
Source: Uganda NPS 2009/2010, RIGA/FAO, HarvestChoice
Households in Uganda are composed of 6.1 members, on average (Table 2). Non-farm households, representing just 15.0% of the
population, include 4.7 persons. On the other extreme, farm households include 6.4 members, a difference of almost two household
members. Overall, the sex ratio in Ugandan households is close to one-to-one (Table 2). However, the percentage of women in Ugan-
dan households is highest in urban areas outside Kampala at 52.0%. The composition of these households differs in the dependency
ratio, defined as the ratio of children under 15 and adults over 60 to adults aged 15-59. While almost 31% of households in the lowest
quintile are headed by women, 27.2% of households in the highest quintile are headed by women (Table 3). Female-headed households
include 1.2 fewer members than male-headed households, on average. In farming households, the dependency ratio is much larger (1.4)
than in non-farm households (0.9). Accordingly, Kampala’s dependency ratio is 0.8, while rural areas’ average dependency ratios are 1.3
or higher.
As Table 2 demonstrates, in more than 70% of Ugandan households, the household head is married. Western rural households
have the greatest percentage of married household heads (78.9%), with the eastern and northern rural households trailing just behind
at 76.4% and 74.8%, respectively. Kampala has the lowest percentage of married household heads at 66.4%. In Error! Reference source
ot found. we see that in higher expenditure quintiles, smaller proportions of household heads are married. In the lowest expenditure
quintile, 74.3% of household heads are married, as opposed to 69.4% of household heads in the highest quintile. Furthermore, while
more than 90% of male household heads are married, just 27.8% of female household heads are married (Table 2).
The literacy (ability to read and write) of household heads varies by region. In Kampala, 86.4% of household heads are literate. In
other urban areas, the literacy rate among household heads is similarly high, at 79.5%. In rural areas, it is 60.5%, ranging from 52.8% in
eastern Uganda to 65.7% in central Uganda. Whereas 74.1% of male household heads are literate, only 40.6% of female household
heads are. Moreover, adults in female-headed household have completed 1.1 fewer years of education than adults in male-headed
households.
Among Uganda’s adult population, the average adult has completed 6.0 years of school. Adults in Kampala households have com-
pleted the greatest number of years of education (9.5), followed by adults in other urban areas (8.9). Households in northern rural areas
have the lowest mean number of years of education among adults at 4.2 years. However, rural eastern areas’ mean years of education
attained are not appreciably higher at 4.9 years. The number of years of education is 3.1 years higher in non-farm households than farm
households, and 3.9 years higher in urban areas than rural areas.
Household
Size
Household Head
Literacy (%)
Married
Head (%)
Dependency
Ratio (#)
Female
Household
Members (%)
Adults' Years of
Education (#)
Stratum
Kampala 5.0 80.6 64.9 0.8 48.6 10.0
Other Urban 5.8 70.4 69.6 1.0 52.3 8.2
Central Rural 6.1 63.1 64.8 1.4 48.8 6.2
East Rural 6.4 51.8 77.0 1.5 50.8 5.0
North Rural 5.7 56.3 76.9 1.5 51.4 4.3
West Rural 6.2 60.8 78.9 1.3 49.9 5.2
Rural vs. Urban
Urban 5.5 73.6 68.1 0.9 51.1 8.8
Rural 6.1 57.7 74.5 1.4 50.2 5.2
Agricultural Engagement
Non-farm 4.6 66.1 64.4 0.9 49.3 8.8
Farm 6.3 60.7 75.2 1.4 50.8 5.4
Gender of Household Head
Male 6.2 70.8 89.9 1.2 45.0 6.4
Female 5.2 38.8 29.2 1.5 64.6 5.2
Uganda 5.9 61.8 72.9 1.3 50.5 6.1
6
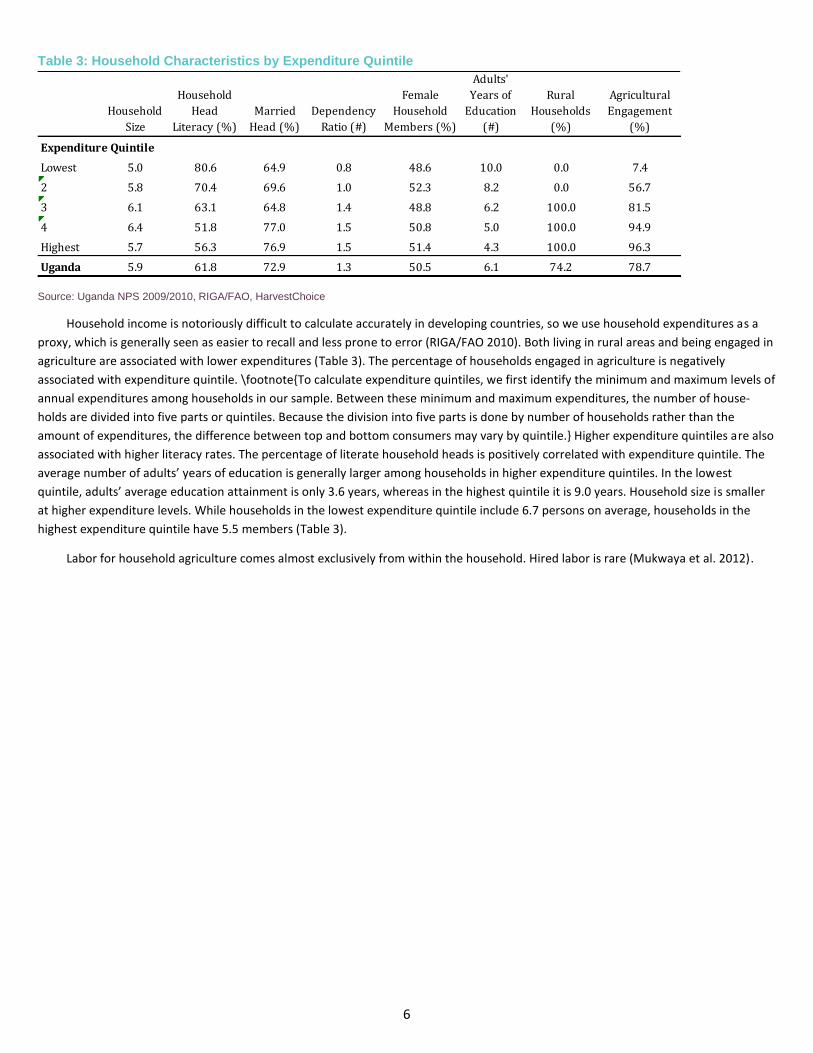
Table 3: Household Characteristics by Expenditure Quintile
Source: Uganda NPS 2009/2010, RIGA/FAO, HarvestChoice
Household income is notoriously difficult to calculate accurately in developing countries, so we use household expenditures as a
proxy, which is generally seen as easier to recall and less prone to error (RIGA/FAO 2010). Both living in rural areas and being engaged in
agriculture are associated with lower expenditures (Table 3). The percentage of households engaged in agriculture is negatively
associated with expenditure quintile. \footnote{To calculate expenditure quintiles, we first identify the minimum and maximum levels of
annual expenditures among households in our sample. Between these minimum and maximum expenditures, the number of house-
holds are divided into five parts or quintiles. Because the division into five parts is done by number of households rather than the
amount of expenditures, the difference between top and bottom consumers may vary by quintile.} Higher expenditure quintiles are also
associated with higher literacy rates. The percentage of literate household heads is positively correlated with expenditure quintile. The
average number of adults’ years of education is generally larger among households in higher expenditure quintiles. In the lowest
quintile, adults’ average education attainment is only 3.6 years, whereas in the highest quintile it is 9.0 years. Household size is smaller
at higher expenditure levels. While households in the lowest expenditure quintile include 6.7 persons on average, households in the
highest expenditure quintile have 5.5 members (Table 3).
Labor for household agriculture comes almost exclusively from within the household. Hired labor is rare (Mukwaya et al. 2012).
Household
Size
Household
Head
Literacy (%)
Married
Head (%)
Dependency
Ratio (#)
Female
Household
Members (%)
Adults'
Years of
Education
(#)
Rural
Households
(%)
Agricultural
Engagement
(%)
Expenditure Quintile
Lowest 5.0 80.6 64.9 0.8 48.6 10.0 0.0 7.4
2 5.8 70.4 69.6 1.0 52.3 8.2 0.0 56.7
3 6.1 63.1 64.8 1.4 48.8 6.2 100.0 81.5
4 6.4 51.8 77.0 1.5 50.8 5.0 100.0 94.9
Highest 5.7 56.3 76.9 1.5 51.4 4.3 100.0 96.3
Uganda 5.9 61.8 72.9 1.3 50.5 6.1 74.2 78.7
7
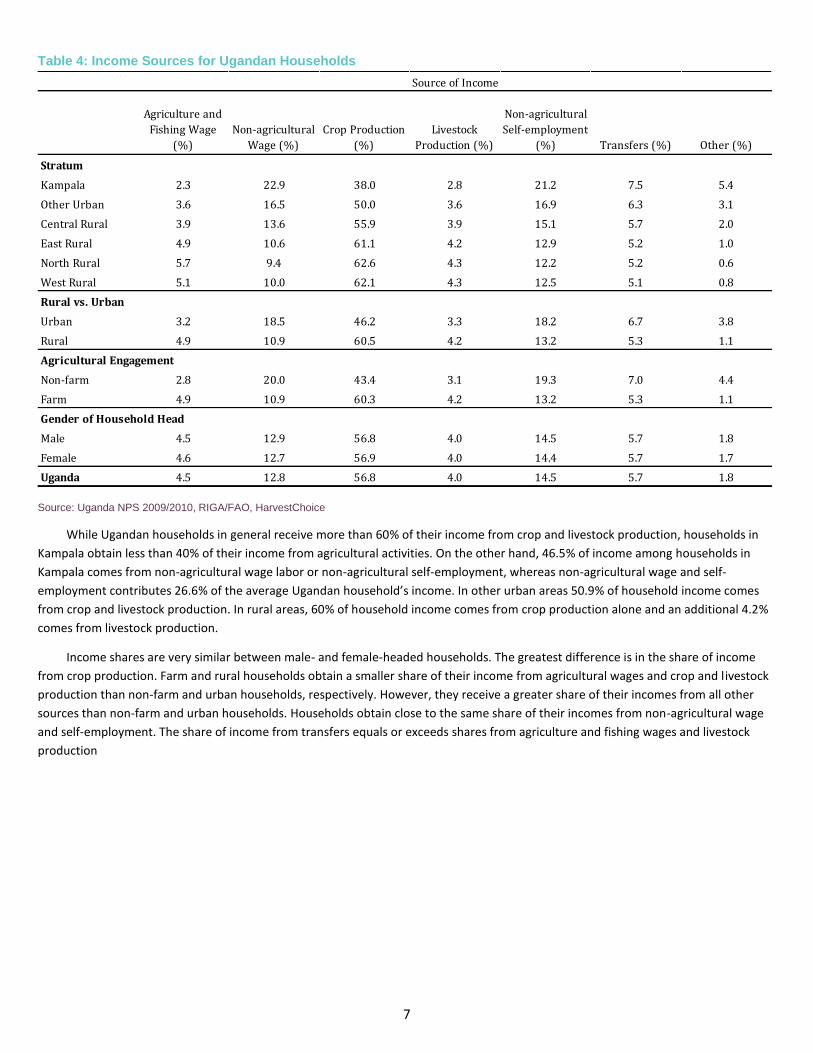
Table 4: Income Sources for Ugandan Households
Source: Uganda NPS 2009/2010, RIGA/FAO, HarvestChoice
While Ugandan households in general receive more than 60% of their income from crop and livestock production, households in
Kampala obtain less than 40% of their income from agricultural activities. On the other hand, 46.5% of income among households in
Kampala comes from non-agricultural wage labor or non-agricultural self-employment, whereas non-agricultural wage and self-
employment contributes 26.6% of the average Ugandan household’s income. In other urban areas 50.9% of household income comes
from crop and livestock production. In rural areas, 60% of household income comes from crop production alone and an additional 4.2%
comes from livestock production.
Income shares are very similar between male- and female-headed households. The greatest difference is in the share of income
from crop production. Farm and rural households obtain a smaller share of their income from agricultural wages and crop and livestock
production than non-farm and urban households, respectively. However, they receive a greater share of their incomes from all other
sources than non-farm and urban households. Households obtain close to the same share of their incomes from non-agricultural wage
and self-employment. The share of income from transfers equals or exceeds shares from agriculture and fishing wages and livestock
production
Agriculture and
Fishing Wage
(%)
Non-agricultural
Wage (%)
Crop Production
(%)
Livestock
Production (%)
Non-agricultural
Self-employment
(%) Transfers (%) Other (%)
Stratum
Kampala 2.3 22.9 38.0 2.8 21.2 7.5 5.4
Other Urban 3.6 16.5 50.0 3.6 16.9 6.3 3.1
Central Rural 3.9 13.6 55.9 3.9 15.1 5.7 2.0
East Rural 4.9 10.6 61.1 4.2 12.9 5.2 1.0
North Rural 5.7 9.4 62.6 4.3 12.2 5.2 0.6
West Rural 5.1 10.0 62.1 4.3 12.5 5.1 0.8
Rural vs. Urban
Urban 3.2 18.5 46.2 3.3 18.2 6.7 3.8
Rural 4.9 10.9 60.5 4.2 13.2 5.3 1.1
Agricultural Engagement
Non-farm 2.8 20.0 43.4 3.1 19.3 7.0 4.4
Farm 4.9 10.9 60.3 4.2 13.2 5.3 1.1
Gender of Household Head
Male 4.5 12.9 56.8 4.0 14.5 5.7 1.8
Female 4.6 12.7 56.9 4.0 14.4 5.7 1.7
Uganda 4.5 12.8 56.8 4.0 14.5 5.7 1.8
Source of Income
8
Figure 2: Income Composition by Expenditure Decile
Source: Uganda NPS 2009/2010, RIGA/FAO, HarvestChoice
Table 5: Income Composition by Expenditure Decile
Source: Uganda NPS 2009/2010, RIGA/FAO, HarvestChoice
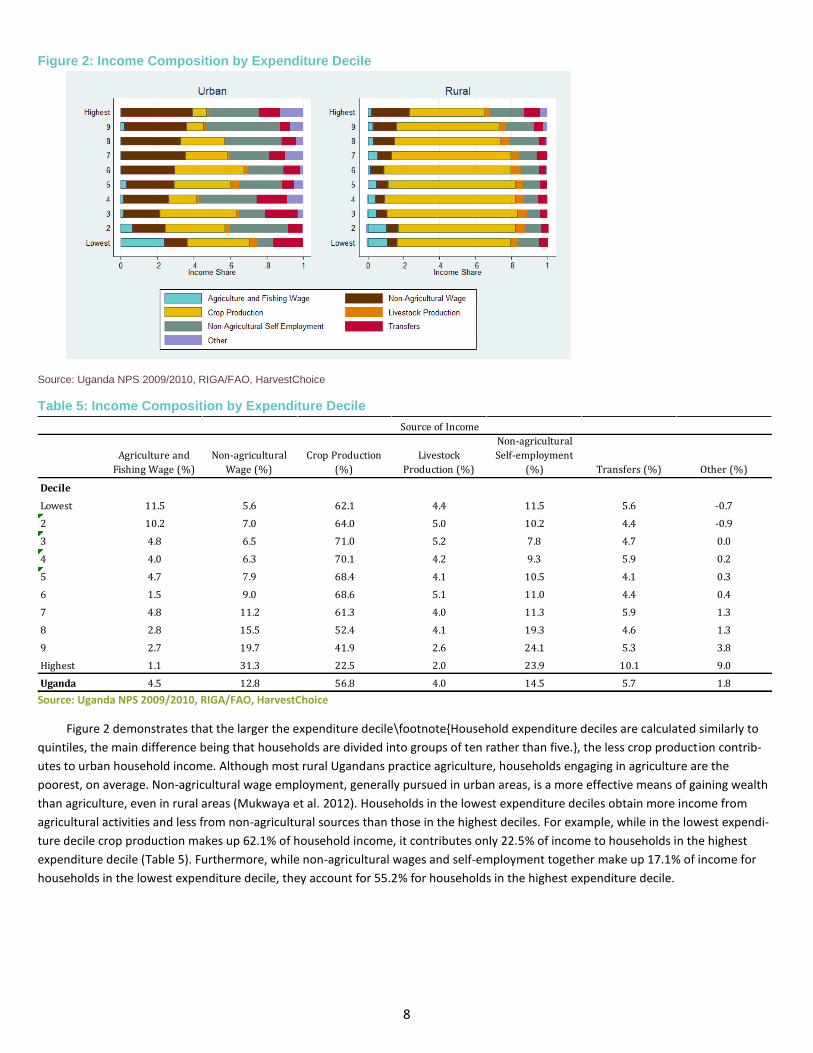
Figure 2 demonstrates that the larger the expenditure decile\footnote{Household expenditure deciles are calculated similarly to
quintiles, the main difference being that households are divided into groups of ten rather than five.}, the less crop production contrib-
utes to urban household income. Although most rural Ugandans practice agriculture, households engaging in agriculture are the
poorest, on average. Non-agricultural wage employment, generally pursued in urban areas, is a more effective means of gaining wealth
than agriculture, even in rural areas (Mukwaya et al. 2012). Households in the lowest expenditure deciles obtain more income from
agricultural activities and less from non-agricultural sources than those in the highest deciles. For example, while in the lowest expendi-
ture decile crop production makes up 62.1% of household income, it contributes only 22.5% of income to households in the highest
expenditure decile (Table 5). Furthermore, while non-agricultural wages and self-employment together make up 17.1% of income for
households in the lowest expenditure decile, they account for 55.2% for households in the highest expenditure decile.
Agriculture and
Fishing Wage (%)
Non-agricultural
Wage (%)
Crop Production
(%)
Livestock
Production (%)
Non-agricultural
Self-employment
(%) Transfers (%) Other (%)
Decile
Lowest 11.5 5.6 62.1 4.4 11.5 5.6 -0.7
2 10.2 7.0 64.0 5.0 10.2 4.4 -0.9
3 4.8 6.5 71.0 5.2 7.8 4.7 0.0
4 4.0 6.3 70.1 4.2 9.3 5.9 0.2
5 4.7 7.9 68.4 4.1 10.5 4.1 0.3
6 1.5 9.0 68.6 5.1 11.0 4.4 0.4
7 4.8 11.2 61.3 4.0 11.3 5.9 1.3
8 2.8 15.5 52.4 4.1 19.3 4.6 1.3
9 2.7 19.7 41.9 2.6 24.1 5.3 3.8
Highest 1.1 31.3 22.5 2.0 23.9 10.1 9.0
Uganda 4.5 12.8 56.8 4.0 14.5 5.7 1.8
Source of Income
9
3 Farm Assets, Farming Systems and Agricultural Input Use
Figure 3: Mean Cultivated Area for Two Cropping Seasons, by Household
Source: Uganda NPS 2009/2010, RIGA/FAO, HarvestChoice
Agricultural land is of enormous customary and material importance in Uganda. In a series of profiles of women in northern Uganda by
the United States Agency for International Development (USAID), the International Food Policy Research Institute (IFPRI), and the
Oxford Poverty and Human Development Initiative (OPHI) (2012), all of the women interviewed listed either land or crops as their
greatest material asset. More than 80% of land in Uganda is owned through unregistered traditional tenure. However, customary rights
are trumped by legal rights in land conflicts, which are increasing in frequency due to large-scale land acquisitions. According to the
1995 Constitution, legal land rights are recognized equally between men and women. However, women’s names rarely appear on titles,
even when their management rights to land are recognized (Bomuhangi, Doss, and Meinzen-Dick 2011). In effect, women’s control of
land is tenuous and unequal to men’s. Yet Bomuhangi, Doss, and Meinzen-Dick (2011) find that due to women’s involvement in
agriculture, there is more equality in men and women’s management rights to land than in their ability to transfer land.
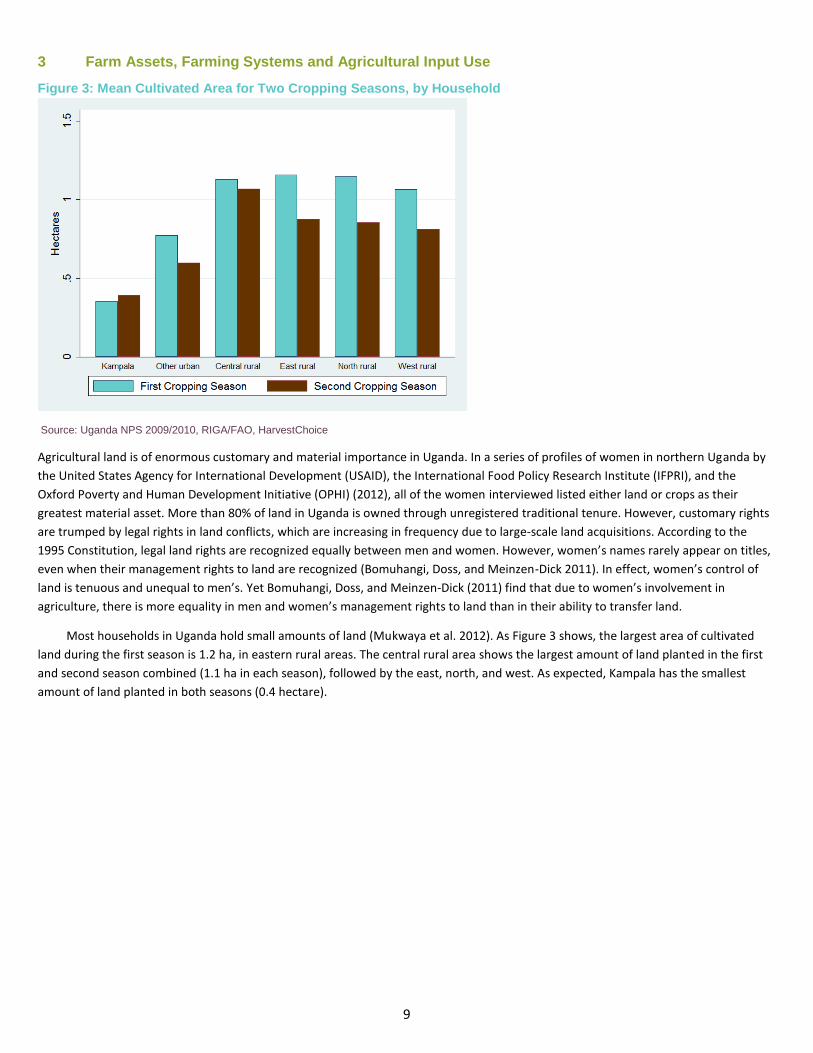
Most households in Uganda hold small amounts of land (Mukwaya et al. 2012). As Figure 3 shows, the largest area of cultivated
land during the first season is 1.2 ha, in eastern rural areas. The central rural area shows the largest amount of land planted in the first
and second season combined (1.1 ha in each season), followed by the east, north, and west. As expected, Kampala has the smallest
amount of land planted in both seasons (0.4 hectare).
10
Table 6: Household Agricultural Plots by Season
Source: Uganda NPS 2009/2010, RIGA/FAO, HarvestChoice
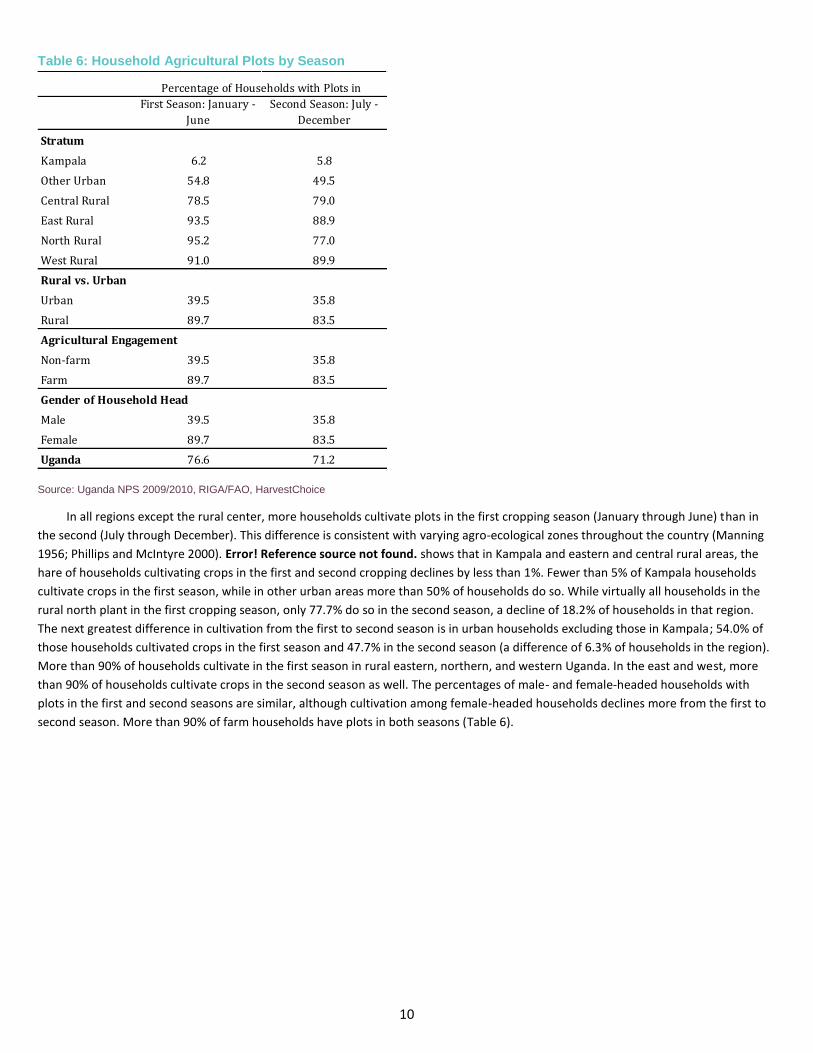
In all regions except the rural center, more households cultivate plots in the first cropping season (January through June) than in
the second (July through December). This difference is consistent with varying agro-ecological zones throughout the country (Manning
1956; Phillips and McIntyre 2000). Error! Reference source not found. shows that in Kampala and eastern and central rural areas, the
hare of households cultivating crops in the first and second cropping declines by less than 1%. Fewer than 5% of Kampala households
cultivate crops in the first season, while in other urban areas more than 50% of households do so. While virtually all households in the
rural north plant in the first cropping season, only 77.7% do so in the second season, a decline of 18.2% of households in that region.
The next greatest difference in cultivation from the first to second season is in urban households excluding those in Kampala; 54.0% of
those households cultivated crops in the first season and 47.7% in the second season (a difference of 6.3% of households in the region).
More than 90% of households cultivate in the first season in rural eastern, northern, and western Uganda. In the east and west, more
than 90% of households cultivate crops in the second season as well. The percentages of male- and female-headed households with
plots in the first and second seasons are similar, although cultivation among female-headed households declines more from the first to
second season. More than 90% of farm households have plots in both seasons (Table 6).
First Season: January -
June
Second Season: July -
December
Stratum
Kampala 6.2 5.8
Other Urban 54.8 49.5
Central Rural 78.5 79.0
East Rural 93.5 88.9
North Rural 95.2 77.0
West Rural 91.0 89.9
Rural vs. Urban
Urban 39.5 35.8
Rural 89.7 83.5
Agricultural Engagement
Non-farm 39.5 35.8
Farm 89.7 83.5
Gender of Household Head
Male 39.5 35.8
Female 89.7 83.5
Uganda 76.6 71.2
Percentage of Households with Plots in
11
Table 7: Mean Household Agricultural Input Use, by Region
Source: Uganda NPS 2009/2010, RIGA/FAO, HarvestChoice
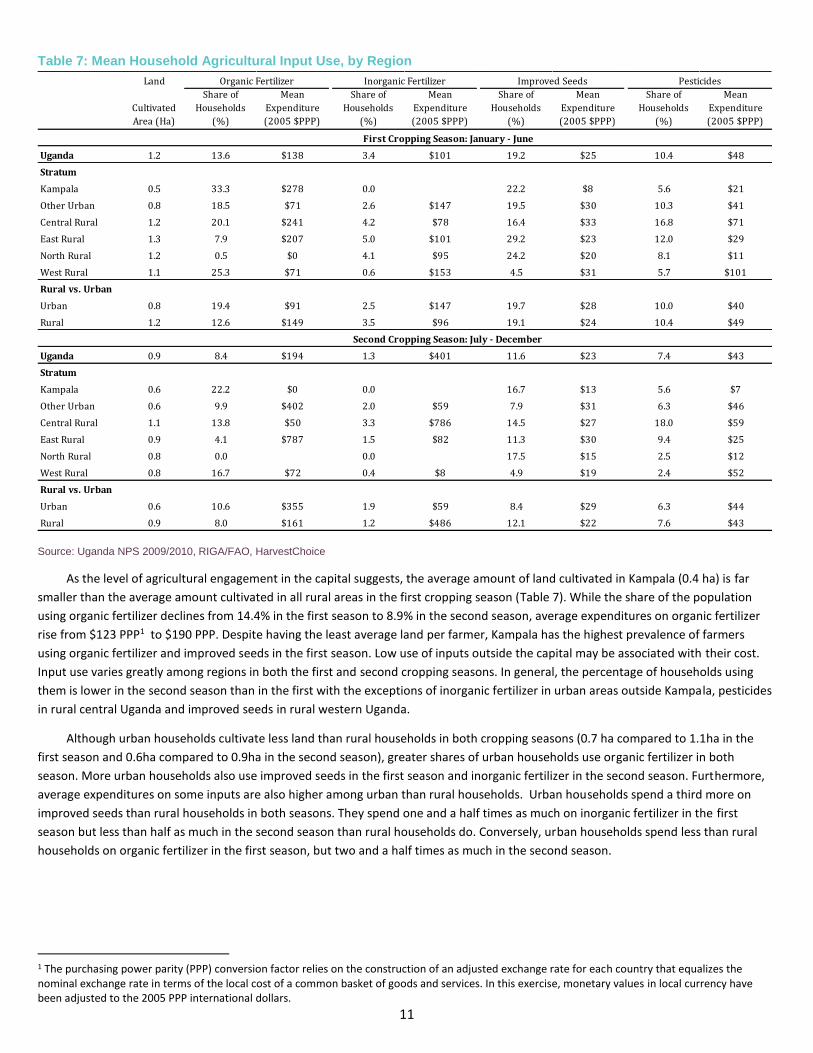
As the level of agricultural engagement in the capital suggests, the average amount of land cultivated in Kampala (0.4 ha) is far
smaller than the average amount cultivated in all rural areas in the first cropping season (Table 7). While the share of the population
using organic fertilizer declines from 14.4% in the first season to 8.9% in the second season, average expenditures on organic fertilizer
rise from $123 PPP1 to $190 PPP. Despite having the least average land per farmer, Kampala has the highest prevalence of farmers
using organic fertilizer and improved seeds in the first season. Low use of inputs outside the capital may be associated with their cost.
Input use varies greatly among regions in both the first and second cropping seasons. In general, the percentage of households using
them is lower in the second season than in the first with the exceptions of inorganic fertilizer in urban areas outside Kampala, pesticides
in rural central Uganda and improved seeds in rural western Uganda.
Although urban households cultivate less land than rural households in both cropping seasons (0.7 ha compared to 1.1ha in the
first season and 0.6ha compared to 0.9ha in the second season), greater shares of urban households use organic fertilizer in both
season. More urban households also use improved seeds in the first season and inorganic fertilizer in the second season. Furthermore,
average expenditures on some inputs are also higher among urban than rural households. Urban households spend a third more on
improved seeds than rural households in both seasons. They spend one and a half times as much on inorganic fertilizer in the first
season but less than half as much in the second season than rural households do. Conversely, urban households spend less than rural
households on organic fertilizer in the first season, but two and a half times as much in the second season.
1 The purchasing power parity (PPP) conversion factor relies on the construction of an adjusted exchange rate for each country that equalizes the nominal exchange rate in terms of the local cost of a common basket of goods and services. In this exercise, monetary values in local currency have been adjusted to the 2005 PPP international dollars.
Land
Cultivated
Area (Ha)
Share of
Households
(%)
Mean
Expenditure
(2005 $PPP)
Share of
Households
(%)
Mean
Expenditure
(2005 $PPP)
Share of
Households
(%)
Mean
Expenditure
(2005 $PPP)
Share of
Households
(%)
Mean
Expenditure
(2005 $PPP)
Uganda 1.2 13.6 $138 3.4 $101 19.2 $25 10.4 $48
Stratum
Kampala 0.5 33.3 $278 0.0 22.2 $8 5.6 $21
Other Urban 0.8 18.5 $71 2.6 $147 19.5 $30 10.3 $41
Central Rural 1.2 20.1 $241 4.2 $78 16.4 $33 16.8 $71
East Rural 1.3 7.9 $207 5.0 $101 29.2 $23 12.0 $29
North Rural 1.2 0.5 $0 4.1 $95 24.2 $20 8.1 $11
West Rural 1.1 25.3 $71 0.6 $153 4.5 $31 5.7 $101
Rural vs. Urban
Urban 0.8 19.4 $91 2.5 $147 19.7 $28 10.0 $40
Rural 1.2 12.6 $149 3.5 $96 19.1 $24 10.4 $49
Uganda 0.9 8.4 $194 1.3 $401 11.6 $23 7.4 $43
Stratum
Kampala 0.6 22.2 $0 0.0 16.7 $13 5.6 $7
Other Urban 0.6 9.9 $402 2.0 $59 7.9 $31 6.3 $46
Central Rural 1.1 13.8 $50 3.3 $786 14.5 $27 18.0 $59
East Rural 0.9 4.1 $787 1.5 $82 11.3 $30 9.4 $25
North Rural 0.8 0.0 0.0 17.5 $15 2.5 $12
West Rural 0.8 16.7 $72 0.4 $8 4.9 $19 2.4 $52
Rural vs. Urban
Urban 0.6 10.6 $355 1.9 $59 8.4 $29 6.3 $44
Rural 0.9 8.0 $161 1.2 $486 12.1 $22 7.6 $43
Second Cropping Season: July - December
First Cropping Season: January - June
PesticidesImproved SeedsInorganic FertilizerOrganic Fertilizer
12
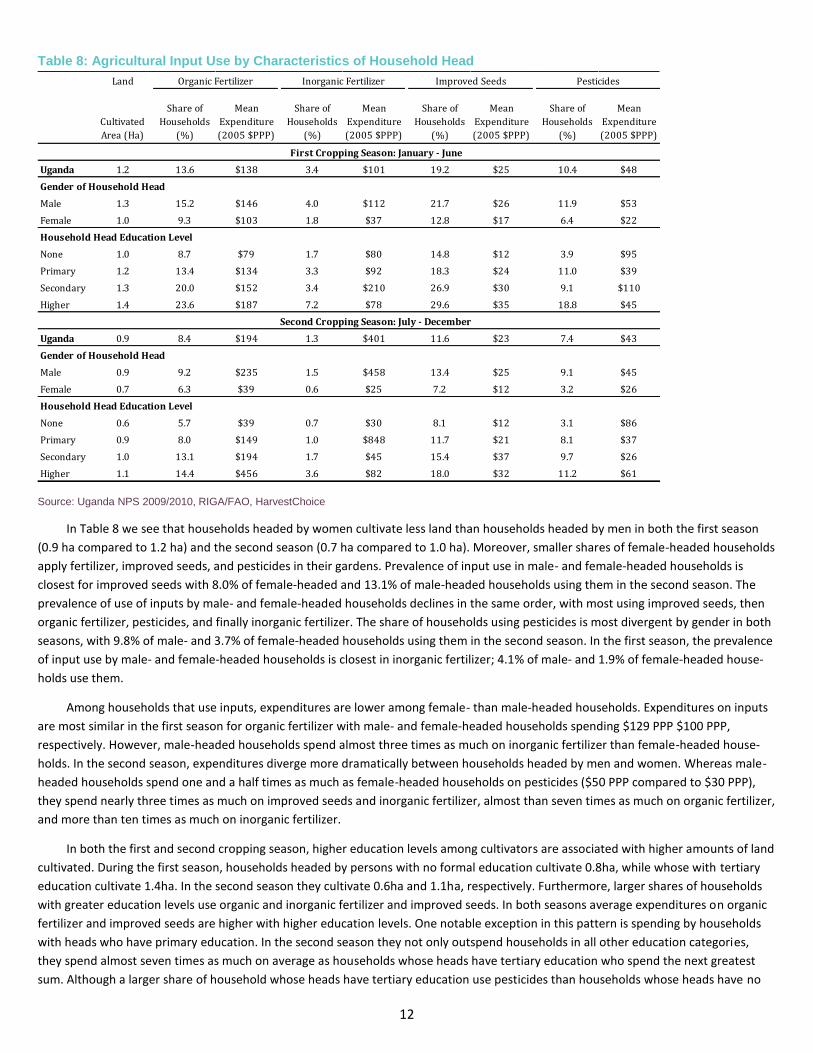
Table 8: Agricultural Input Use by Characteristics of Household Head
Source: Uganda NPS 2009/2010, RIGA/FAO, HarvestChoice
In Table 8 we see that households headed by women cultivate less land than households headed by men in both the first season
(0.9 ha compared to 1.2 ha) and the second season (0.7 ha compared to 1.0 ha). Moreover, smaller shares of female-headed households
apply fertilizer, improved seeds, and pesticides in their gardens. Prevalence of input use in male- and female-headed households is
closest for improved seeds with 8.0% of female-headed and 13.1% of male-headed households using them in the second season. The
prevalence of use of inputs by male- and female-headed households declines in the same order, with most using improved seeds, then
organic fertilizer, pesticides, and finally inorganic fertilizer. The share of households using pesticides is most divergent by gender in both
seasons, with 9.8% of male- and 3.7% of female-headed households using them in the second season. In the first season, the prevalence
of input use by male- and female-headed households is closest in inorganic fertilizer; 4.1% of male- and 1.9% of female-headed house-
holds use them.
Among households that use inputs, expenditures are lower among female- than male-headed households. Expenditures on inputs
are most similar in the first season for organic fertilizer with male- and female-headed households spending $129 PPP $100 PPP,
respectively. However, male-headed households spend almost three times as much on inorganic fertilizer than female-headed house-
holds. In the second season, expenditures diverge more dramatically between households headed by men and women. Whereas male-
headed households spend one and a half times as much as female-headed households on pesticides ($50 PPP compared to $30 PPP),
they spend nearly three times as much on improved seeds and inorganic fertilizer, almost than seven times as much on organic fertilizer,
and more than ten times as much on inorganic fertilizer.
In both the first and second cropping season, higher education levels among cultivators are associated with higher amounts of land
cultivated. During the first season, households headed by persons with no formal education cultivate 0.8ha, while whose with tertiary
education cultivate 1.4ha. In the second season they cultivate 0.6ha and 1.1ha, respectively. Furthermore, larger shares of households
with greater education levels use organic and inorganic fertilizer and improved seeds. In both seasons average expenditures on organic
fertilizer and improved seeds are higher with higher education levels. One notable exception in this pattern is spending by households
with heads who have primary education. In the second season they not only outspend households in all other education categories,
they spend almost seven times as much on average as households whose heads have tertiary education who spend the next greatest
sum. Although a larger share of household whose heads have tertiary education use pesticides than households whose heads have no
Land
Cultivated
Area (Ha)
Share of
Households
(%)
Mean
Expenditure
(2005 $PPP)
Share of
Households
(%)
Mean
Expenditure
(2005 $PPP)
Share of
Households
(%)
Mean
Expenditure
(2005 $PPP)
Share of
Households
(%)
Mean
Expenditure
(2005 $PPP)
Uganda 1.2 13.6 $138 3.4 $101 19.2 $25 10.4 $48
Gender of Household Head
Male 1.3 15.2 $146 4.0 $112 21.7 $26 11.9 $53
Female 1.0 9.3 $103 1.8 $37 12.8 $17 6.4 $22
Household Head Education Level
None 1.0 8.7 $79 1.7 $80 14.8 $12 3.9 $95
Primary 1.2 13.4 $134 3.3 $92 18.3 $24 11.0 $39
Secondary 1.3 20.0 $152 3.4 $210 26.9 $30 9.1 $110
Higher 1.4 23.6 $187 7.2 $78 29.6 $35 18.8 $45
Uganda 0.9 8.4 $194 1.3 $401 11.6 $23 7.4 $43
Gender of Household Head
Male 0.9 9.2 $235 1.5 $458 13.4 $25 9.1 $45
Female 0.7 6.3 $39 0.6 $25 7.2 $12 3.2 $26
Household Head Education Level
None 0.6 5.7 $39 0.7 $30 8.1 $12 3.1 $86
Primary 0.9 8.0 $149 1.0 $848 11.7 $21 8.1 $37
Secondary 1.0 13.1 $194 1.7 $45 15.4 $37 9.7 $26
Higher 1.1 14.4 $456 3.6 $82 18.0 $32 11.2 $61
PesticidesImproved SeedsInorganic FertilizerOrganic Fertilizer
Second Cropping Season: July - December
First Cropping Season: January - June
13
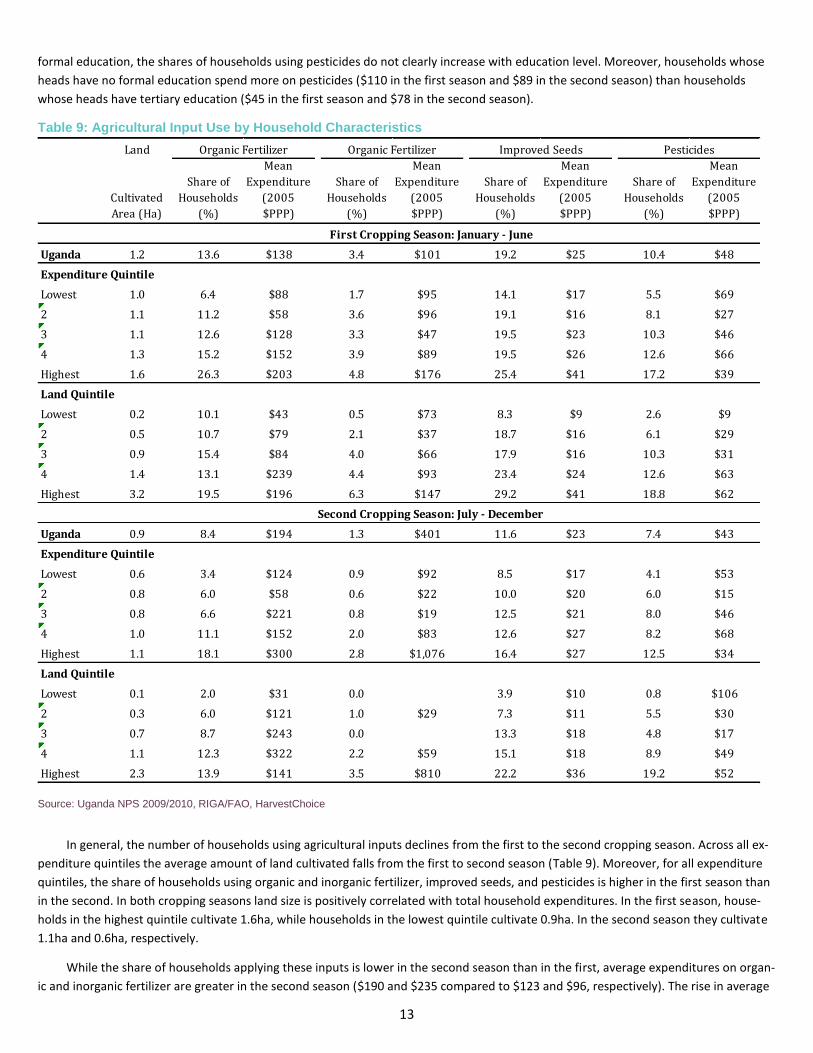
formal education, the shares of households using pesticides do not clearly increase with education level. Moreover, households whose
heads have no formal education spend more on pesticides ($110 in the first season and $89 in the second season) than households
whose heads have tertiary education ($45 in the first season and $78 in the second season).
Table 9: Agricultural Input Use by Household Characteristics
Source: Uganda NPS 2009/2010, RIGA/FAO, HarvestChoice
In general, the number of households using agricultural inputs declines from the first to the second cropping season. Across all ex-
penditure quintiles the average amount of land cultivated falls from the first to second season (Table 9). Moreover, for all expenditure
quintiles, the share of households using organic and inorganic fertilizer, improved seeds, and pesticides is higher in the first season than
in the second. In both cropping seasons land size is positively correlated with total household expenditures. In the first season, house-
holds in the highest quintile cultivate 1.6ha, while households in the lowest quintile cultivate 0.9ha. In the second season they cultivate
1.1ha and 0.6ha, respectively.
While the share of households applying these inputs is lower in the second season than in the first, average expenditures on organ-
ic and inorganic fertilizer are greater in the second season ($190 and $235 compared to $123 and $96, respectively). The rise in average
Land
Cultivated
Area (Ha)
Share of
Households
(%)
Mean
Expenditure
(2005
$PPP)
Share of
Households
(%)
Mean
Expenditure
(2005
$PPP)
Share of
Households
(%)
Mean
Expenditure
(2005
$PPP)
Share of
Households
(%)
Mean
Expenditure
(2005
$PPP)
Uganda 1.2 13.6 $138 3.4 $101 19.2 $25 10.4 $48
Expenditure Quintile
Lowest 1.0 6.4 $88 1.7 $95 14.1 $17 5.5 $69
2 1.1 11.2 $58 3.6 $96 19.1 $16 8.1 $27
3 1.1 12.6 $128 3.3 $47 19.5 $23 10.3 $46
4 1.3 15.2 $152 3.9 $89 19.5 $26 12.6 $66
Highest 1.6 26.3 $203 4.8 $176 25.4 $41 17.2 $39
Land Quintile
Lowest 0.2 10.1 $43 0.5 $73 8.3 $9 2.6 $9
2 0.5 10.7 $79 2.1 $37 18.7 $16 6.1 $29
3 0.9 15.4 $84 4.0 $66 17.9 $16 10.3 $31
4 1.4 13.1 $239 4.4 $93 23.4 $24 12.6 $63
Highest 3.2 19.5 $196 6.3 $147 29.2 $41 18.8 $62
Uganda 0.9 8.4 $194 1.3 $401 11.6 $23 7.4 $43
Expenditure Quintile
Lowest 0.6 3.4 $124 0.9 $92 8.5 $17 4.1 $53
2 0.8 6.0 $58 0.6 $22 10.0 $20 6.0 $15
3 0.8 6.6 $221 0.8 $19 12.5 $21 8.0 $46
4 1.0 11.1 $152 2.0 $83 12.6 $27 8.2 $68
Highest 1.1 18.1 $300 2.8 $1,076 16.4 $27 12.5 $34
Land Quintile
Lowest 0.1 2.0 $31 0.0 3.9 $10 0.8 $106
2 0.3 6.0 $121 1.0 $29 7.3 $11 5.5 $30
3 0.7 8.7 $243 0.0 13.3 $18 4.8 $17
4 1.1 12.3 $322 2.2 $59 15.1 $18 8.9 $49
Highest 2.3 13.9 $141 3.5 $810 22.2 $36 19.2 $52
Second Cropping Season: July - December
Organic Fertilizer Organic Fertilizer Improved Seeds Pesticides
First Cropping Season: January - June
14
expenditures for organic fertilizer is reflected in all expenditure quintiles. For inorganic fertilizer the rise in average expenditures is
driven by the bottom and top two expenditure quintiles. Although there is an overall decline in average expenditures on improved
seeds, and pesticides from the first to the second season, households in the three middle quintiles spend more on improved seeds in
the second season and households in the top two quintiles spend more on pesticides in the second season.
Greater shares of households in the highest expenditure quintile than in the lowest use all four input types examined here. While
the share of households applying organic fertilizer is lower in the second season than in the first, average expenditures on organic
fertilizer are greater in the second season for households in all quintiles. Edmeades, Smale, and Karamura (2006) note that wealthier
farmers are generally able to grow more varieties than smaller farmers, which may explain elevated use of inputs among households in
the highest expenditure quintile. Average expenditures on improved seeds in both seasons are higher in higher quintiles, while average
expenditures on other inputs show no clear pattern by expenditure quintile. However, average expenditures on organic and inorganic
fertilizer by households in the highest quintile in the second season are almost twice and three times, respectively, as much as expendi-
tures by households in the lowest quintile. More households in the highest quintile use inorganic fertilizer and improved seeds than
households in the lowest quintile, but between the extremes there is no clear relationship between share of use and expenditure
quintile.
Households in the highest land quintile cultivate 15 times as much land (3.0ha) as households in the lowest land quintile (0.2ha)
during the first season. In the second season the difference is a factor of 23. The households in the highest land quintile cultivate 2.3ha,
compared to just 0.1ha for households in the lowest land quintile. More households among large landholders use organic and inorganic
fertilizer, improved seeds, and pesticides than households with little land in both seasons. However, higher landholdings do not
necessarily translate into greater input use. For example, while 18.4% of households in the second land quintile use improved seeds
during the first season, 17% of households in the third quintile do.
Average prices for these inputs seem unrelated to their prevalence. Households in the highest land quintile spend more than
households in the lowest on organic and inorganic fertilizer and improved seeds, but households in the middle land quintiles spend the
most on organic fertilizer in both seasons. Average expenditures on pesticides are seven times higher in the second season for house-
holds in the lowest land quintile. In the second season, they are higher for the poorest households ($78) than for the wealthiest
households ($57).
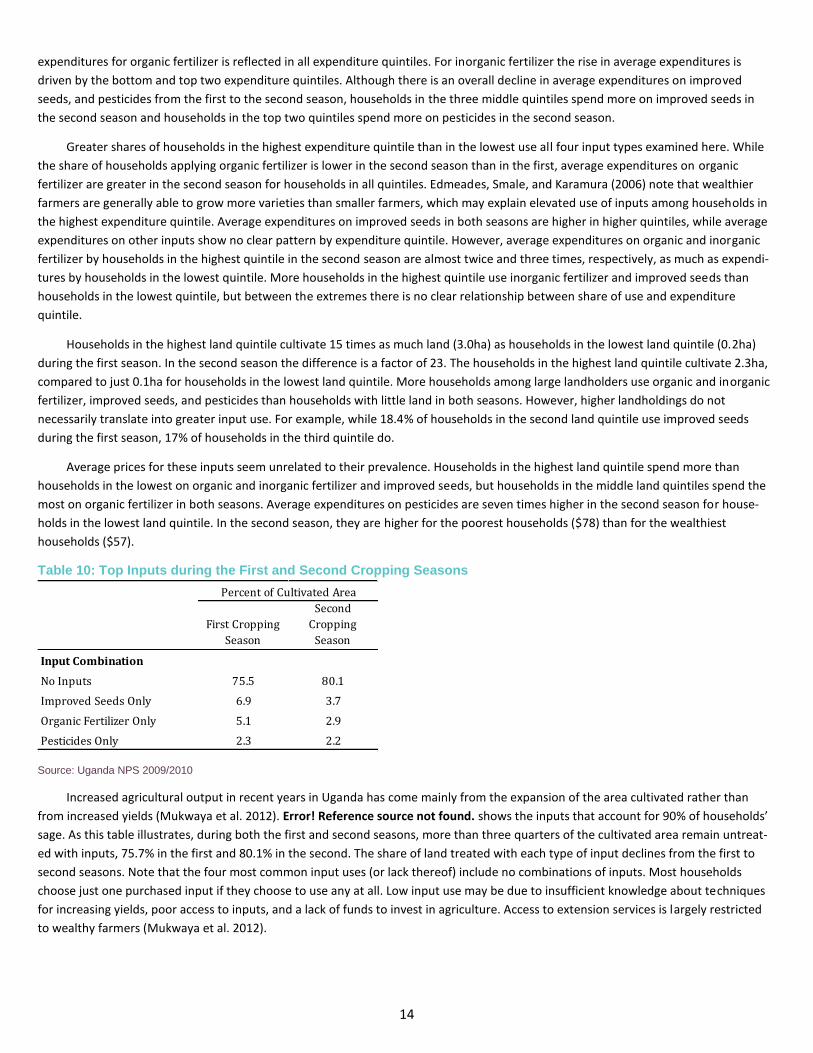
Table 10: Top Inputs during the First and Second Cropping Seasons
Source: Uganda NPS 2009/2010
Increased agricultural output in recent years in Uganda has come mainly from the expansion of the area cultivated rather than
from increased yields (Mukwaya et al. 2012). Error! Reference source not found. shows the inputs that account for 90% of households’
sage. As this table illustrates, during both the first and second seasons, more than three quarters of the cultivated area remain untreat-
ed with inputs, 75.7% in the first and 80.1% in the second. The share of land treated with each type of input declines from the first to
second seasons. Note that the four most common input uses (or lack thereof) include no combinations of inputs. Most households
choose just one purchased input if they choose to use any at all. Low input use may be due to insufficient knowledge about techniques
for increasing yields, poor access to inputs, and a lack of funds to invest in agriculture. Access to extension services is largely restricted
to wealthy farmers (Mukwaya et al. 2012).
First Cropping
Season
Second
Cropping
Season
Input Combination
No Inputs 75.5 80.1
Improved Seeds Only 6.9 3.7
Organic Fertilizer Only 5.1 2.9
Pesticides Only 2.3 2.2
Percent of Cultivated Area
15
4 Crop Production
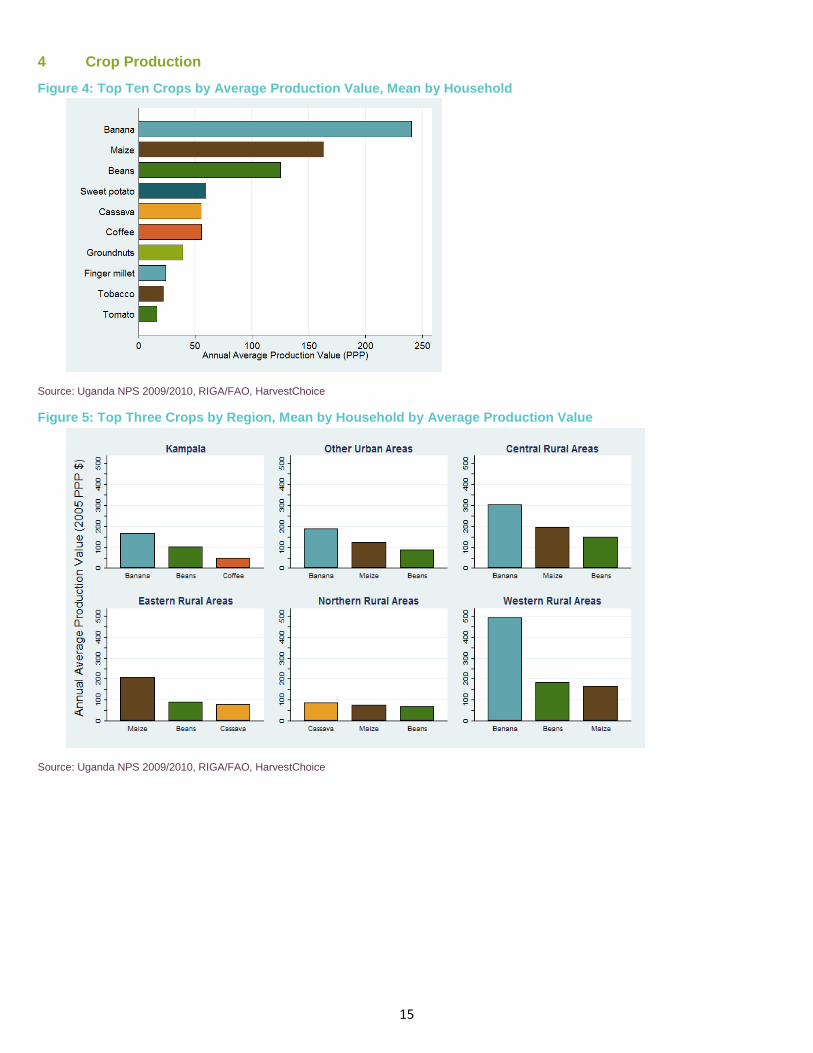
Figure 4: Top Ten Crops by Average Production Value, Mean by Household
Source: Uganda NPS 2009/2010, RIGA/FAO, HarvestChoice
Figure 5: Top Three Crops by Region, Mean by Household by Average Production Value
Source: Uganda NPS 2009/2010, RIGA/FAO, HarvestChoice
16
Figure 6: Crop Production Value by Expenditure Quintile
Source: Uganda NPS 2009/2010, RIGA/FAO, HarvestChoice
Figure 7: Top Farming Systems
Source: Uganda NPS 2009/2010, RIGA/FAO, HarvestChoice
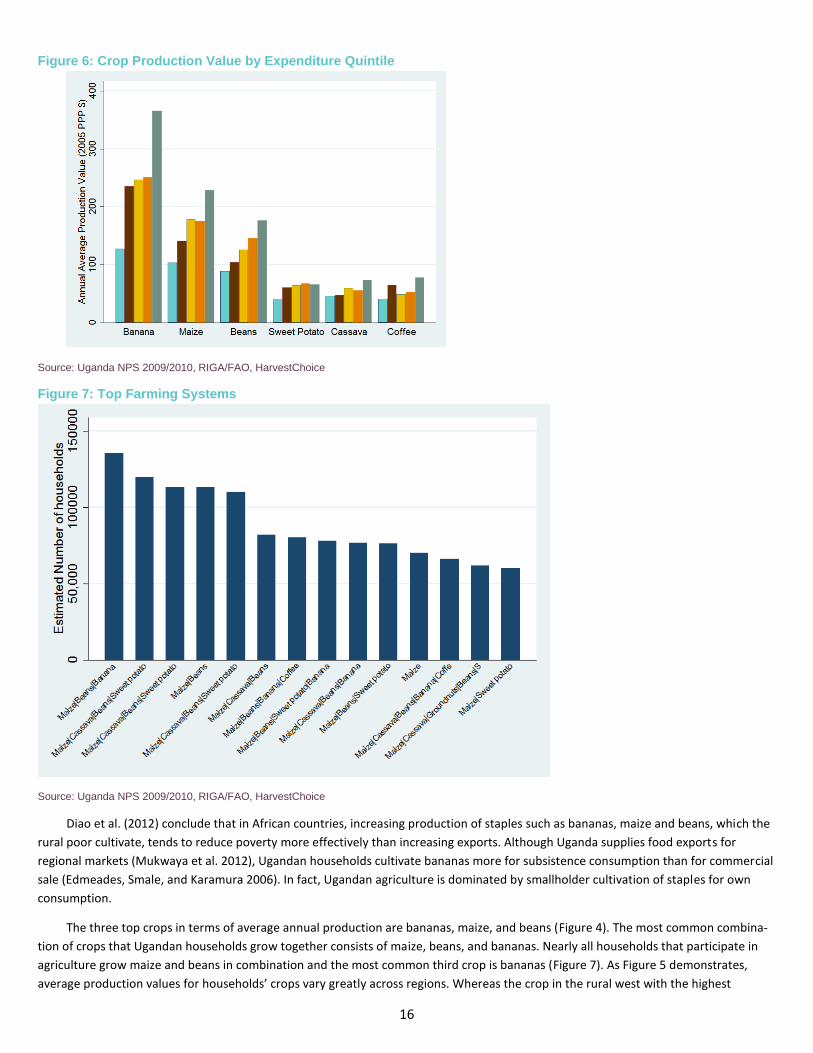
Diao et al. (2012) conclude that in African countries, increasing production of staples such as bananas, maize and beans, which the
rural poor cultivate, tends to reduce poverty more effectively than increasing exports. Although Uganda supplies food exports for
regional markets (Mukwaya et al. 2012), Ugandan households cultivate bananas more for subsistence consumption than for commercial
sale (Edmeades, Smale, and Karamura 2006). In fact, Ugandan agriculture is dominated by smallholder cultivation of staples for own
consumption.
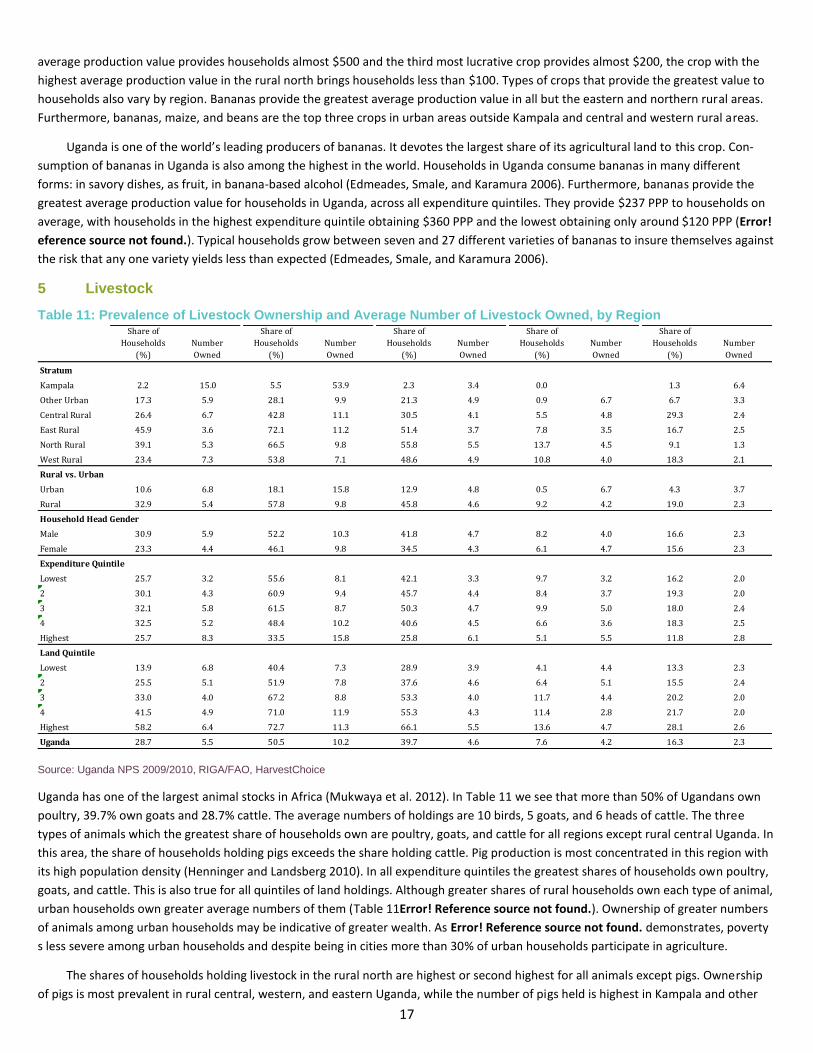
The three top crops in terms of average annual production are bananas, maize, and beans (Figure 4). The most common combina-
tion of crops that Ugandan households grow together consists of maize, beans, and bananas. Nearly all households that participate in
agriculture grow maize and beans in combination and the most common third crop is bananas (Figure 7). As Figure 5 demonstrates,
average production values for households’ crops vary greatly across regions. Whereas the crop in the rural west with the highest
17
average production value provides households almost $500 and the third most lucrative crop provides almost $200, the crop with the
highest average production value in the rural north brings households less than $100. Types of crops that provide the greatest value to
households also vary by region. Bananas provide the greatest average production value in all but the eastern and northern rural areas.
Furthermore, bananas, maize, and beans are the top three crops in urban areas outside Kampala and central and western rural areas.
Uganda is one of the world’s leading producers of bananas. It devotes the largest share of its agricultural land to this crop. Con-
sumption of bananas in Uganda is also among the highest in the world. Households in Uganda consume bananas in many different
forms: in savory dishes, as fruit, in banana-based alcohol (Edmeades, Smale, and Karamura 2006). Furthermore, bananas provide the
greatest average production value for households in Uganda, across all expenditure quintiles. They provide $237 PPP to households on
average, with households in the highest expenditure quintile obtaining $360 PPP and the lowest obtaining only around $120 PPP (Error!
eference source not found.). Typical households grow between seven and 27 different varieties of bananas to insure themselves against
the risk that any one variety yields less than expected (Edmeades, Smale, and Karamura 2006).
5 Livestock
Table 11: Prevalence of Livestock Ownership and Average Number of Livestock Owned, by Region
Source: Uganda NPS 2009/2010, RIGA/FAO, HarvestChoice
Uganda has one of the largest animal stocks in Africa (Mukwaya et al. 2012). In Table 11 we see that more than 50% of Ugandans own
poultry, 39.7% own goats and 28.7% cattle. The average numbers of holdings are 10 birds, 5 goats, and 6 heads of cattle. The three
types of animals which the greatest share of households own are poultry, goats, and cattle for all regions except rural central Uganda. In
this area, the share of households holding pigs exceeds the share holding cattle. Pig production is most concentrated in this region with
its high population density (Henninger and Landsberg 2010). In all expenditure quintiles the greatest shares of households own poultry,
goats, and cattle. This is also true for all quintiles of land holdings. Although greater shares of rural households own each type of animal,
urban households own greater average numbers of them (Table 11Error! Reference source not found.). Ownership of greater numbers
of animals among urban households may be indicative of greater wealth. As Error! Reference source not found. demonstrates, poverty
s less severe among urban households and despite being in cities more than 30% of urban households participate in agriculture.
The shares of households holding livestock in the rural north are highest or second highest for all animals except pigs. Ownership
of pigs is most prevalent in rural central, western, and eastern Uganda, while the number of pigs held is highest in Kampala and other
Share of
Households
(%)
Number
Owned
Share of
Households
(%)
Number
Owned
Share of
Households
(%)
Number
Owned
Share of
Households
(%)
Number
Owned
Share of
Households
(%)
Number
Owned
Stratum
Kampala 2.2 15.0 5.5 53.9 2.3 3.4 0.0 1.3 6.4
Other Urban 17.3 5.9 28.1 9.9 21.3 4.9 0.9 6.7 6.7 3.3
Central Rural 26.4 6.7 42.8 11.1 30.5 4.1 5.5 4.8 29.3 2.4
East Rural 45.9 3.6 72.1 11.2 51.4 3.7 7.8 3.5 16.7 2.5
North Rural 39.1 5.3 66.5 9.8 55.8 5.5 13.7 4.5 9.1 1.3
West Rural 23.4 7.3 53.8 7.1 48.6 4.9 10.8 4.0 18.3 2.1
Rural vs. Urban
Urban 10.6 6.8 18.1 15.8 12.9 4.8 0.5 6.7 4.3 3.7
Rural 32.9 5.4 57.8 9.8 45.8 4.6 9.2 4.2 19.0 2.3
Household Head Gender
Male 30.9 5.9 52.2 10.3 41.8 4.7 8.2 4.0 16.6 2.3
Female 23.3 4.4 46.1 9.8 34.5 4.3 6.1 4.7 15.6 2.3
Expenditure Quintile
Lowest 25.7 3.2 55.6 8.1 42.1 3.3 9.7 3.2 16.2 2.0
2 30.1 4.3 60.9 9.4 45.7 4.4 8.4 3.7 19.3 2.0
3 32.1 5.8 61.5 8.7 50.3 4.7 9.9 5.0 18.0 2.4
4 32.5 5.2 48.4 10.2 40.6 4.5 6.6 3.6 18.3 2.5
Highest 25.7 8.3 33.5 15.8 25.8 6.1 5.1 5.5 11.8 2.8
Land Quintile
Lowest 13.9 6.8 40.4 7.3 28.9 3.9 4.1 4.4 13.3 2.3
2 25.5 5.1 51.9 7.8 37.6 4.6 6.4 5.1 15.5 2.4
3 33.0 4.0 67.2 8.8 53.3 4.0 11.7 4.4 20.2 2.0
4 41.5 4.9 71.0 11.9 55.3 4.3 11.4 2.8 21.7 2.0
Highest 58.2 6.4 72.7 11.3 66.1 5.5 13.6 4.7 28.1 2.6
Uganda 28.7 5.5 50.5 10.2 39.7 4.6 7.6 4.2 16.3 2.3
18
urban areas. A smaller share of households in Kampala own livestock than the national average. However, they do not necessarily hold
the fewest heads of each animal type. The average cattle-owning household in Kampala holds 15 heads, almost twice the average
number held by a household in western rural Uganda, the region with the second greatest per-household holding at 8 heads of cattle.
Uganda’s “cattle belt” extends from the southwest corner of the country to the northeast (Benson and Mugarura 2010).The greatest
shares of households who raise cattle are in rural areas of eastern (47.9%), northern (38.8%), and western (22.3%) Uganda, while the
greatest holdings are in Kampala (15) and rural western (8) and central (6) Uganda (Error! Reference source not found.).
The regions with the greatest shares of poultry-owning households are in rural eastern (74.0%), northern (66.2%), and western
(54.6%) Uganda, while the greatest average number held is in Kampala (47.1), rural eastern (11.6) and central (11.0). According to
Benson and Mugarura (2010), poultry production is growing in peri-urban areas of Uganda. The highest prevalence of goat ownership
among households is in northern (56.4%), eastern (54.6%), western (49.2%) rural Uganda, while the greatest number of goats held is in
the rural north (5.5), urban areas outside the capital (5.1), and western (4.9) Uganda. Sheep ownership is most prevalent in rural
northern (13.3%), western (10.3%), and eastern (8.7%) Uganda, while numbers of sheep held are greatest in urban areas outside
Kampala (6.7), and rural central and northern Uganda (4.7 in each).
A greater percentage of male-headed households own cattle, poultry, goats, sheep, and pigs than female-headed households. Fur-
thermore, households headed by men own a greater number of each of those animal types, with the exception of sheep and pigs. Male-
headed households own an average of 4 sheep, while female-headed households own 5 sheep. The number of pigs owned by male- and
female-headed households is the same, at 2.3. Table 11 shows that the prevalence of livestock ownership is highest among the lowest
three expenditure quintiles, for poultry, goats, and sheep. In the middle three quintiles we find the highest shares of households owning
cattle. Households in the highest expenditure quintile own the greatest number of cattle on average (9).
6 Nutrition Uganda faces a dual threat from malnutrition: it sees both high levels of undernutrition and increasing numbers of overweight and
obese citizens (Ulimwengu et al. 2011). Undernutrition remains, however, the greater threat, having negative effects on children’s
physical and cognitive development. Stunting (low height for age) is an indicator of the negative impact of a poor nutritional status on
pre-school children. Stunting in childhood may result in decreased productivity in adulthood. Being underweight (low weight for age)
and wasting (low weight for height) are also major indicators of poor nutritional status among children under five years old (Ruel and
Hoddinott 2008).
More than half of the calories that Ugandan households consume come from their own production (Mukwaya et al. 2012), indicat-
ing that households’ participation in agriculture bears directly on their consumption and nutrition. The most calorie-deficient house-
holds are located in the capital. However, the most food-insecure households are in rural areas (Mukwaya et al. 2012). Ulimwengu et al.
(2011) identify two common ways for intensified agriculture to improve nutrition: first, through increased food availability from
increased production and second, through higher agricultural income. Furthermore, increased food availability may result in improved
nutritional outcomes that in turn, may positively affect agricultural productivity (Ulimwengu et al. 2011).
Effects of increased food prices on nutritional outcomes are likely to be mixed, depending on the type of household and the time
elapsed since the price change. Net agricultural producers benefit from higher food prices through increased income, while net con-
sumers experience less access to preferred foods (Ulimwengu and Ramadan 2009). Both higher income and decreased consumption can
occur in the same household. In addition, increased prices of preferred foods may lead households to substitute cheaper, less nutritious
foods or even less food overall. In Uganda, this substitution often results in poorer diet quality, especially among the most vulnerable
households. Households that gain the most from increased food prices generally live in rural areas, where they also have greater access
to agricultural services than others (Ulimwengu and Ramadan 2009). A recent paper by Campenhout et al. (2013) found that while the
overall effect of increased food prices in the short run was negative, in the longer run the effects were positive. Consistent with
Ulimwengu and Ramadan (2009) findings, effects were not uniform; in the longer run, welfare levels of rural farm households in
particular increased sharply, primarily as a result of increased returns to farm labor and agricultural land coupled with improved market
prices for output sold.
19
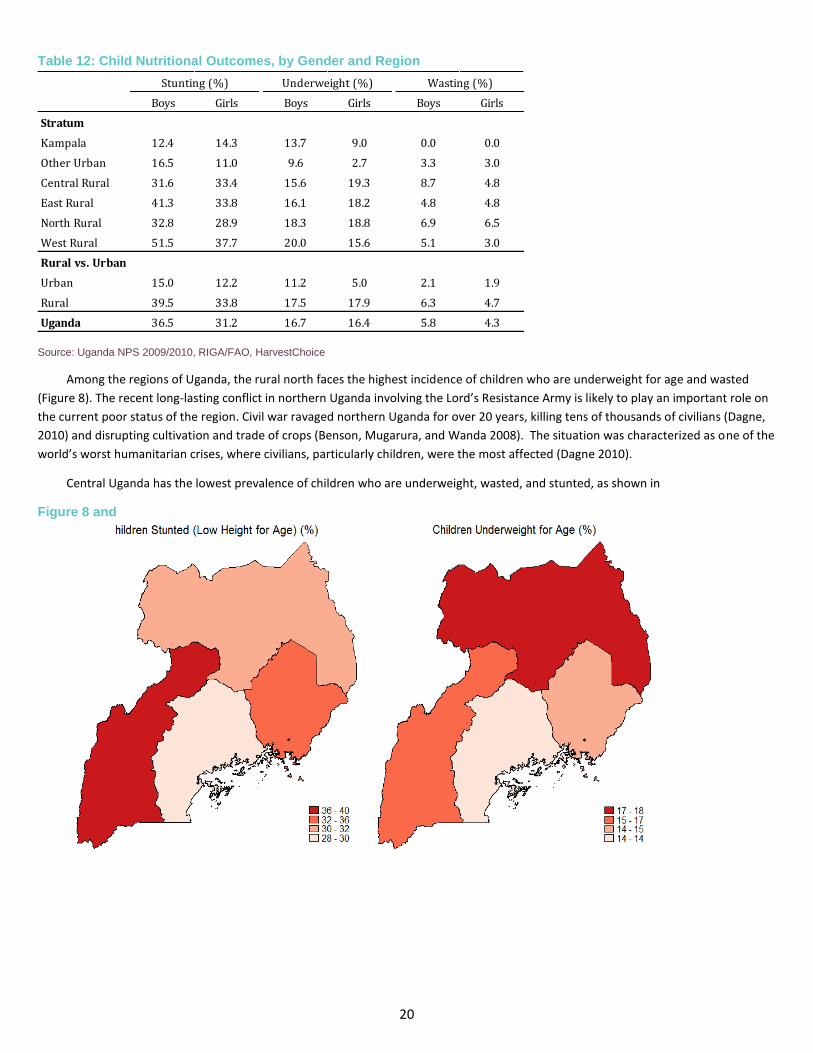
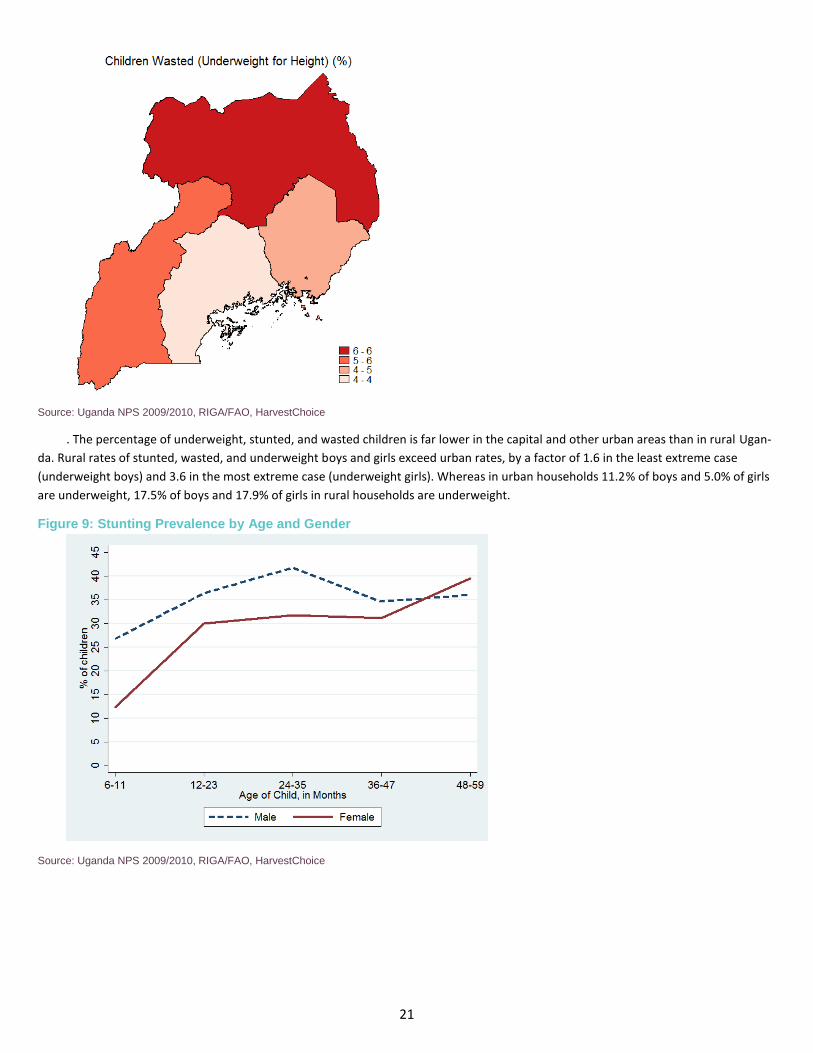
Figure 8: Child Nutritional Outcomes by Region
Source: Uganda NPS 2009/2010, RIGA/FAO, HarvestChoice
20
Table 12: Child Nutritional Outcomes, by Gender and Region
Source: Uganda NPS 2009/2010, RIGA/FAO, HarvestChoice
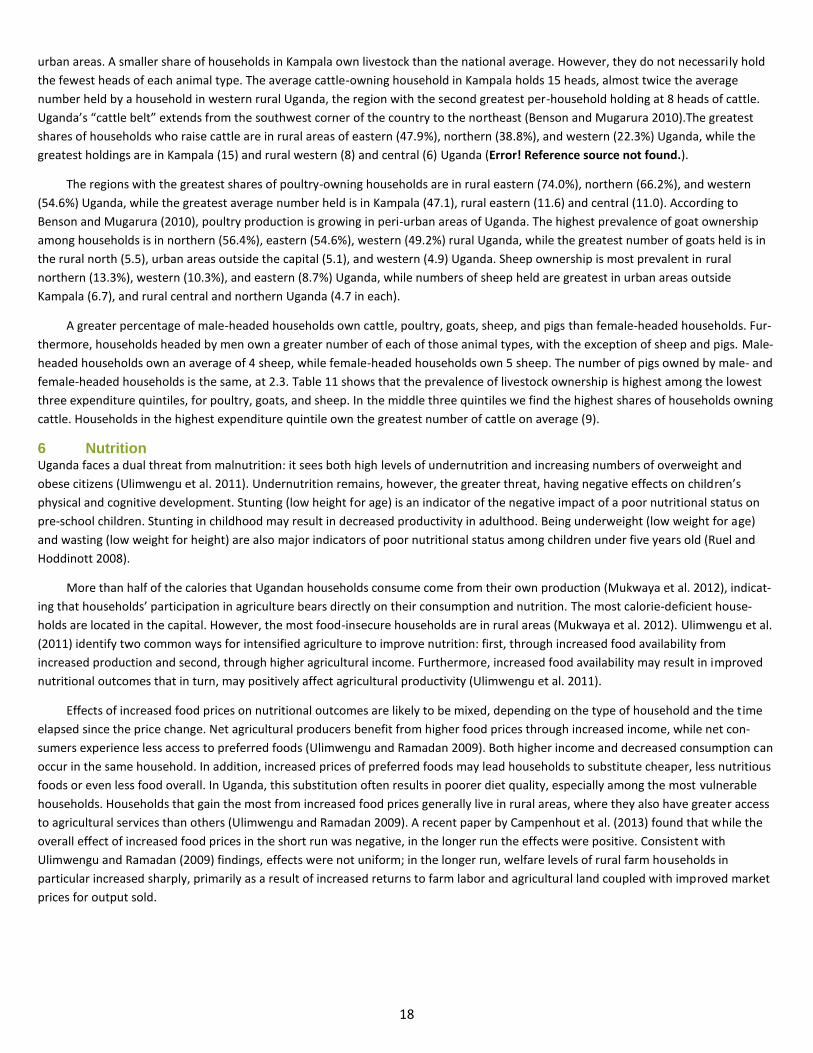
Among the regions of Uganda, the rural north faces the highest incidence of children who are underweight for age and wasted
(Figure 8). The recent long-lasting conflict in northern Uganda involving the Lord’s Resistance Army is likely to play an important role on
the current poor status of the region. Civil war ravaged northern Uganda for over 20 years, killing tens of thousands of civilians (Dagne,
2010) and disrupting cultivation and trade of crops (Benson, Mugarura, and Wanda 2008). The situation was characterized as one of the
world’s worst humanitarian crises, where civilians, particularly children, were the most affected (Dagne 2010).
Central Uganda has the lowest prevalence of children who are underweight, wasted, and stunted, as shown in
Figure 8 and
Boys Girls Boys Girls Boys Girls
Stratum
Kampala 12.4 14.3 13.7 9.0 0.0 0.0
Other Urban 16.5 11.0 9.6 2.7 3.3 3.0
Central Rural 31.6 33.4 15.6 19.3 8.7 4.8
East Rural 41.3 33.8 16.1 18.2 4.8 4.8
North Rural 32.8 28.9 18.3 18.8 6.9 6.5
West Rural 51.5 37.7 20.0 15.6 5.1 3.0
Rural vs. Urban
Urban 15.0 12.2 11.2 5.0 2.1 1.9
Rural 39.5 33.8 17.5 17.9 6.3 4.7
Uganda 36.5 31.2 16.7 16.4 5.8 4.3
Wasting (%)Underweight (%)Stunting (%)
21
Source: Uganda NPS 2009/2010, RIGA/FAO, HarvestChoice
. The percentage of underweight, stunted, and wasted children is far lower in the capital and other urban areas than in rural Ugan-
da. Rural rates of stunted, wasted, and underweight boys and girls exceed urban rates, by a factor of 1.6 in the least extreme case
(underweight boys) and 3.6 in the most extreme case (underweight girls). Whereas in urban households 11.2% of boys and 5.0% of girls
are underweight, 17.5% of boys and 17.9% of girls in rural households are underweight.
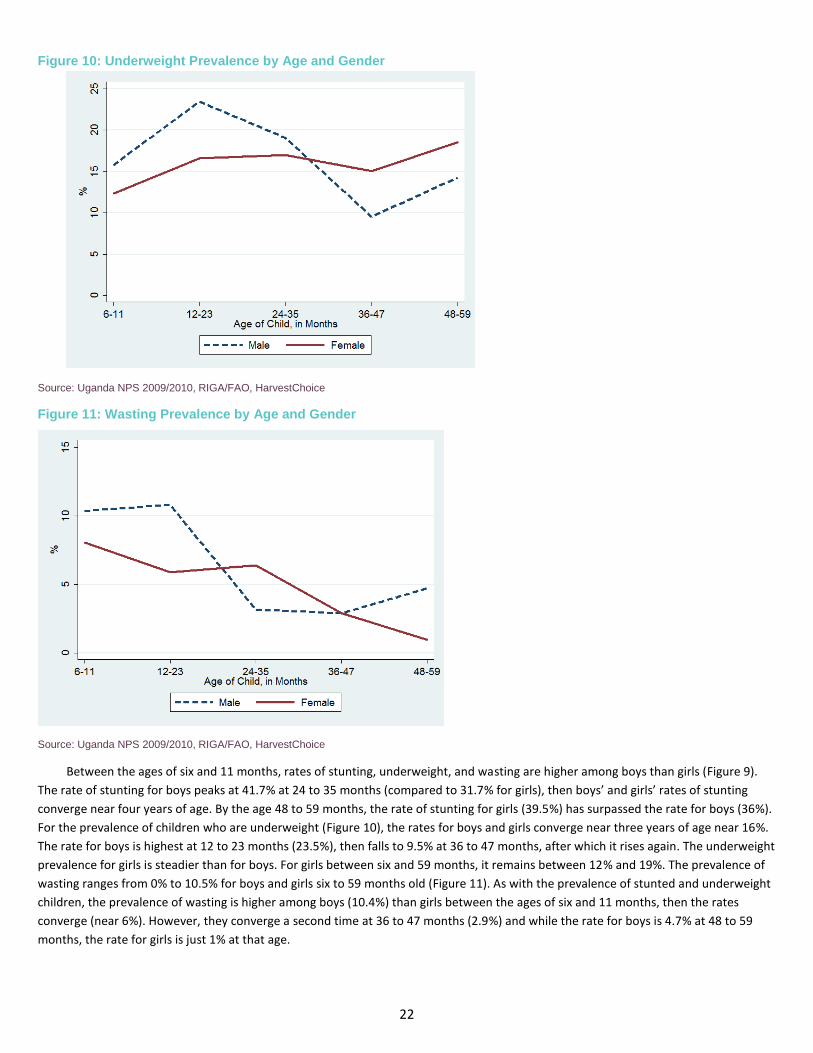
Figure 9: Stunting Prevalence by Age and Gender
Source: Uganda NPS 2009/2010, RIGA/FAO, HarvestChoice
22
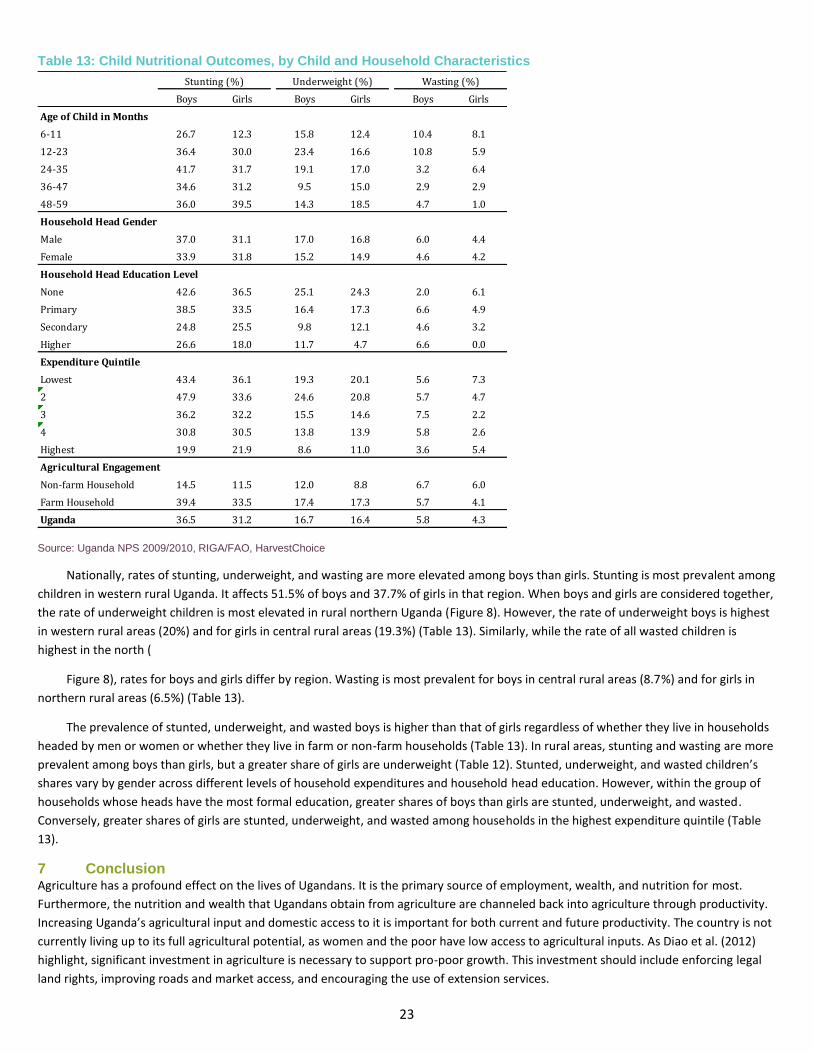
Figure 10: Underweight Prevalence by Age and Gender
Source: Uganda NPS 2009/2010, RIGA/FAO, HarvestChoice
Figure 11: Wasting Prevalence by Age and Gender
Source: Uganda NPS 2009/2010, RIGA/FAO, HarvestChoice
Between the ages of six and 11 months, rates of stunting, underweight, and wasting are higher among boys than girls (Figure 9).
The rate of stunting for boys peaks at 41.7% at 24 to 35 months (compared to 31.7% for girls), then boys’ and girls’ rates of stunting
converge near four years of age. By the age 48 to 59 months, the rate of stunting for girls (39.5%) has surpassed the rate for boys (36%).
For the prevalence of children who are underweight (Figure 10), the rates for boys and girls converge near three years of age near 16%.
The rate for boys is highest at 12 to 23 months (23.5%), then falls to 9.5% at 36 to 47 months, after which it rises again. The underweight
prevalence for girls is steadier than for boys. For girls between six and 59 months, it remains between 12% and 19%. The prevalence of
wasting ranges from 0% to 10.5% for boys and girls six to 59 months old (Figure 11). As with the prevalence of stunted and underweight
children, the prevalence of wasting is higher among boys (10.4%) than girls between the ages of six and 11 months, then the rates
converge (near 6%). However, they converge a second time at 36 to 47 months (2.9%) and while the rate for boys is 4.7% at 48 to 59
months, the rate for girls is just 1% at that age.
23
Table 13: Child Nutritional Outcomes, by Child and Household Characteristics
Source: Uganda NPS 2009/2010, RIGA/FAO, HarvestChoice
Nationally, rates of stunting, underweight, and wasting are more elevated among boys than girls. Stunting is most prevalent among
children in western rural Uganda. It affects 51.5% of boys and 37.7% of girls in that region. When boys and girls are considered together,
the rate of underweight children is most elevated in rural northern Uganda (Figure 8). However, the rate of underweight boys is highest
in western rural areas (20%) and for girls in central rural areas (19.3%) (Table 13). Similarly, while the rate of all wasted children is
highest in the north (
Figure 8), rates for boys and girls differ by region. Wasting is most prevalent for boys in central rural areas (8.7%) and for girls in
northern rural areas (6.5%) (Table 13).
The prevalence of stunted, underweight, and wasted boys is higher than that of girls regardless of whether they live in households
headed by men or women or whether they live in farm or non-farm households (Table 13). In rural areas, stunting and wasting are more
prevalent among boys than girls, but a greater share of girls are underweight (Table 12). Stunted, underweight, and wasted children’s
shares vary by gender across different levels of household expenditures and household head education. However, within the group of
households whose heads have the most formal education, greater shares of boys than girls are stunted, underweight, and wasted.
Conversely, greater shares of girls are stunted, underweight, and wasted among households in the highest expenditure quintile (Table
13).
7 Conclusion Agriculture has a profound effect on the lives of Ugandans. It is the primary source of employment, wealth, and nutrition for most.
Furthermore, the nutrition and wealth that Ugandans obtain from agriculture are channeled back into agriculture through productivity.
Increasing Uganda’s agricultural input and domestic access to it is important for both current and future productivity. The country is not
currently living up to its full agricultural potential, as women and the poor have low access to agricultural inputs. As Diao et al. (2012)
highlight, significant investment in agriculture is necessary to support pro-poor growth. This investment should include enforcing legal
land rights, improving roads and market access, and encouraging the use of extension services.
Boys Girls Boys Girls Boys Girls
Age of Child in Months
6-11 26.7 12.3 15.8 12.4 10.4 8.1
12-23 36.4 30.0 23.4 16.6 10.8 5.9
24-35 41.7 31.7 19.1 17.0 3.2 6.4
36-47 34.6 31.2 9.5 15.0 2.9 2.9
48-59 36.0 39.5 14.3 18.5 4.7 1.0
Household Head Gender
Male 37.0 31.1 17.0 16.8 6.0 4.4
Female 33.9 31.8 15.2 14.9 4.6 4.2
Household Head Education Level
None 42.6 36.5 25.1 24.3 2.0 6.1
Primary 38.5 33.5 16.4 17.3 6.6 4.9
Secondary 24.8 25.5 9.8 12.1 4.6 3.2
Higher 26.6 18.0 11.7 4.7 6.6 0.0
Expenditure Quintile
Lowest 43.4 36.1 19.3 20.1 5.6 7.3
2 47.9 33.6 24.6 20.8 5.7 4.7
3 36.2 32.2 15.5 14.6 7.5 2.2
4 30.8 30.5 13.8 13.9 5.8 2.6
Highest 19.9 21.9 8.6 11.0 3.6 5.4
Agricultural Engagement
Non-farm Household 14.5 11.5 12.0 8.8 6.7 6.0
Farm Household 39.4 33.5 17.4 17.3 5.7 4.1
Uganda 36.5 31.2 16.7 16.4 5.8 4.3
Wasting (%)Underweight (%)Stunting (%)
24
Higher agricultural production not only has the potential to increase food availability, it may offset changes in prices. The crops
most important to the rural poor are staples such as maize, beans, and bananas. Assisting smallholders in boosting production of these
crops can reduce poverty through increases in income and food availability. Since most Ugandan consumption comes from self-
production (Mukwaya et al 2012), increased food production could prove a powerful weapon for defeating malnutrition. For children,
this is a particularly worthy goal. Malnutrition in young children is a threat to the realization of their physical and cognitive develop-
ment, which can have pernicious and long-lasting effects on health, educational attainment, and economic productivity.
The importance of agriculture to the Ugandan economy is likely to change in the latter part of this decade due to the exploitation
of Uganda’s oil reserves. Peak production is expected to be reached in 2017. While oil revenues may support pro-poor investment, they
will require judicious management (Mukwaya et al. 2012).
The vast majority of Ugandan employment comes from agriculture. Therefore, the sector is of high importance to poverty reduc-
tion (Mukwaya et al. 2012). Furthermore, macro-level growth from agriculture has a greater effect on poverty than growth from any
other source (Diao et al. 2012)
25
REFERENCES Benson, T. and S. Mugarura. 2010. Livestock Development Planning in Uganda: Identification of Areas of Opportunity and Challenge.
IFPRI Discussion Paper 01008. Washington, DC: International Food Policy Research Institute.
Benson, T., S. Mugarura, and K. Wanda. 2008. An Assessment of the Likely Impact on Ugandan Households of Rising Global Food Prices.
Uganda Strategy Support Program (USSP) Background Paper no. USSP 01. Washington, DC: International Food Policy Research Insti-
tute.
Bomuhangi, A., C. Doss, and R. Meinzen-Dick. 2011. Who Owns the Land? Perspectives from Rural Ugandans and Implications for Land
Acquisitions. IFPRI Discussion Paper 01136. Washington, DC: International Food Policy Research Institute.
Dagne, T. 2010. Uganda: Current Conditions and the Crisis in North Uganda. DIANE Publishing.Diao, X., J. Thurlow, S. Benin, and
S. Fan. 2012. Strategies and Priorities for African Agriculture: Economywide Perspectives from Country Studies. IFPRI Issue Brief 73.
Washington, DC: International Food Policy Research Institute.
Edmeades, S., M. Smale, and D. Karamura. 2006. Biodiversity of Bananas on Farms in Uganda. IFPRI, IPGRI, and CIMMYT Genetic
Resource Policies Brief 24. Washington, DC: International Food Policy Research Institute.
FAO (Food and Agriculture Organization of the United Nations). 2013. Rural Income Generating Activities (RIGA). Accessed on December
4, 2013. http://www.fao.org/economic/riga/rural-income-generating-activities/en/
Henninger, N. and F. Landsberg. 2010. “An Overview of Livestock and Poverty.” In Mapping a Better Future: Spatial Analysis and Pro-
poor Livestock Strategies in Uganda edited by H. Billings, P. Ghazi, and G. Mock, 12-22. Nairobi, Kenya: The Regal Press Kenya Ltd.
International Food Policy Research Institute (IFPRI), United States Agency for International Development (USAID), Oxford Poverty and
Human Development Initiative (OPHI). 2012. Case Study Profile: Florence, Uganda. Feed the Future Women’s Empowerment in Agri-
culture Index Profile. Washington, DC.
International Food Policy Research Institute (IFPRI), United States Agency for International Development (USAID), Oxford Poverty and
Human Development Initiative (OPHI). 2012. Case Study Profile: Harriet, Uganda. Feed the Future Women’s Empowerment in Agri-
culture Index Profile. Washington, DC.
International Food Policy Research Institute (IFPRI), United States Agency for International Development (USAID), Oxford Poverty and
Human Development Initiative (OPHI). 2012. Case Study Profile: Peace, Uganda. Feed the Future Women’s Empowerment in Agricul-
ture Index Profile. Washington, DC.
International Food Policy Research Institute (IFPRI), United States Agency for International Development (USAID), Oxford Poverty and
Human Development Initiative (OPHI). 2012. Case Study Profile: Uganda, Lilian. Feed the Future Women’s Empowerment in Agricul-
ture Index Profile. Washington, DC.
Manning, H.L. 1956. “The Statistical Assessment of Rainfall Probability and Its Application in Uganda Agriculture.” Proceedings of the
Royal Society of Biological Sciences 144. London.
Mukwaya, P., Y. Bamutaze, S. Mugarura, and T. Benson. 2012. Rural-Urban Transformation in Uganda. Uganda Strategy Support
Program Working Paper July 2012. Washington, DC: International Food Policy Research Institute.
Phillips, J. and B. McIntyre. 2000. “ENSO and Interannual Rainfall Variability in Uganda: Implications for Agricultural Management.”
International Journal of Climatology 20 (2000): 171-182.
Quisumbing, A. and L. Pandofelli. 2008. Promising Approaches to Address the Needs of Poor Female Farmers. IFPRI Note 13. Washington,
DC: International Food Policy Research Institute.
Ruel, M. and J. Hoddinott. 2008. Investing in Early Childhood Nutrition. IFPRI Policy Brief 8. Washington, DC: International Food Policy
Research Institute.
Ulimwengu, J. and R. Ramadan. 2009. How Does Food Price Increase Affect Ugandan Households? An Augmented Multimarket Ap-
proach. IFPRI Discussion Paper 00884. Washington, DC: International Food Policy Research Institute.

26
Ulimwengu, J., S. Liverpool-Tasie, J. Randriamamonjy, and R. Ramadan. 2011. Understanding the Linkage between Agricultural Produc-
tivity and Nutrient Consumption: Evidence from Uganda. IFPRI Discussion Paper 01128. Washington, DC: International Food Policy
Research Institute.
Van Campenhout, B., K. Pauw and N. Minot. 2013. The Impact of Food Price Shocks in Uganda. IFPRI Discussion Paper 01284. Washing-
ton, DC: International Food Policy Research Institute.
This publication has been prepared as an output of the [XXX PROGRAM AND/OR NAME OF PROJECT], [which is facilitated by NAME OF ORG., IF APPLICABLE]. It has not been peer reviewed. Any opinions stated herein are those of the author(s) and do not necessarily reflect the policies of the International Food Policy Research Institute.
Copyright © 2013 International Food Policy Research Institute. All rights reserved. To obtain permission to republish, contact [email protected].