Embed Size (px)
Citation preview
AFRICAN DEVELOPMENT BANK GROUP
UGANDA
COUNTRY STRATEGY PAPER 2017-2021
RDGE/COUG
June 2017
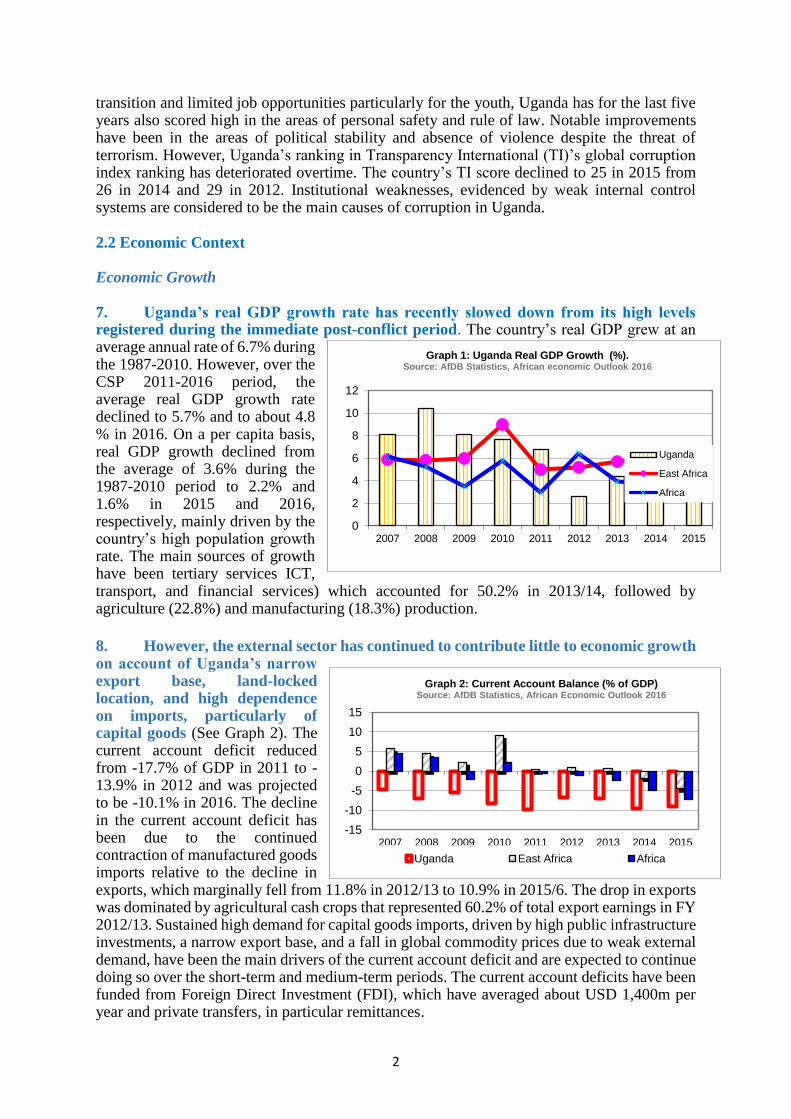
TABLE OF CONTENTS
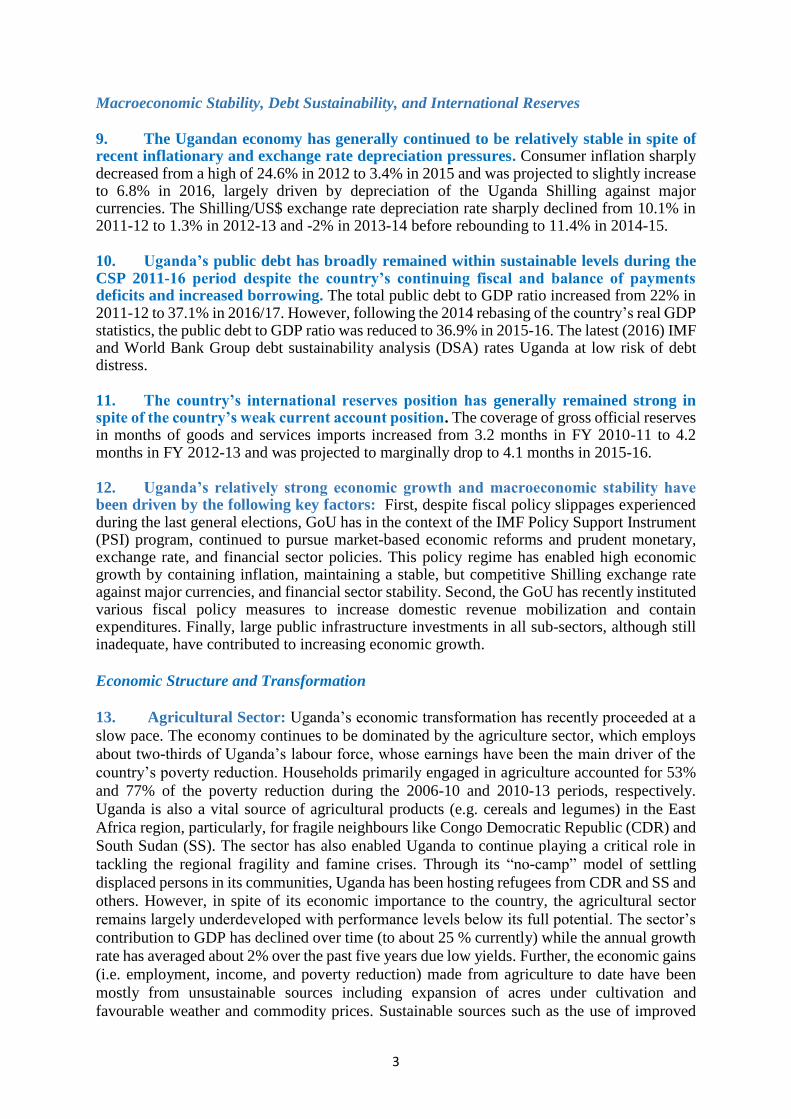
EXECUTIVE SUMMARY ................................................................................................................. iii
I. INTRODUCTION ............................................................................................................................. 1
II. THE COUNTRY CONTEXT ......................................................................................................... 1
2.1 Political Context ......................................................................................................................................... 1
2.2 Economic Context ...................................................................................................................................... 2
2.3 Social development and Cross-cutting
Issues……………………………………………………………….. .............................................. 5
III. STRATEGIC OPTIONS, PORTFOLIO PERFORMANCE AND LESSONS ........................ 7
3.1 Country Strategic Framework .................................................................................................................. 7
3.2 Aid Coordination and Harmonization ...................................................................................................... 8
3.3 Country Challenges & Weaknesses and Opportunities and Strengths ................................................. 8
3.5 Key Findings of the CSP 2011-16 Country Portfolio Performance Review (CPPR) .......................... 11
3.6 Main Findings of the CSP 2011-2016 Completion Report .................................................................... 11
3.7 Lessons Learned from the CSP2011-2016 Completion Report and CPPR 2015/16 ........................... 12
IV. BANK GROUP STRATEGY 2017-21 ........................................................................................ 13
4.1 Rationale and Strategic Selectivity ......................................................................................................... 13
4.2 CSP Objectives and Strategic Pillars ...................................................................................................... 13
4.3 Bank Group Indicative Lending Program ............................................................................................. 17
4.4 Non-Lending Activities ............................................................................................................................ 17
4.5 Financing the CSP .................................................................................................................................... 18
4.6 CSP Monitoring and Evaluation ............................................................................................................. 18
4.7 Country Dialogue ..................................................................................................................................... 18
4.8 Risk and Mitigation Measures ................................................................................................................ 19
V. CONCLUSION AND RECOMMENDATIONS ......................................................................... 18
ANNEXES .............................................................................................................................................. I
ANNEX1: INDICATIVE LENDING PROGRAM (2017-21) ........................................................................ I
ANNEX 2: UGANDA ANALYTICAL WORK PROGRAM ...................................................................... II
ANNEX 3 RESULTS-BASED FRAMEWORK FOR THE 2017-21 CSP PERIOD ................................ V
ANNEX 4: LIST OF KEY STAKEHOLDERS MET DURING THE CSP PREPARATION
MISSION ...................................................................................................................................... XI
ANNEX 5: COUNTRY’S COMPARATIVE SOCIO-ECONOMIC INDICATORS ............................ XIV
ANNEX 6: UGANDA- DEVELOPMENT PARTNER TECHNICAL WORKING GROUPS ............ XVI
ANNEX 7: DONOR COORDINATION MATRIX FOR UGANDA .................................................... XVII
ANNEX 8: BANK’S ONGOING PORTFOLIO IN UGANDA [As of 31 November 2016] ............... XVIII
ANNEX 9: STATUS OF IMPLEMENTATION OF THE 2015 COUNTRY PORTFOLIO
IMPROVEMENT PLAN (CPIP) ............................................................................................. XIX
ANNEX 10: COUNTRY PORTFOLIO PERFORMANCE REVIEW ................................................ XXII
ANNEX11: SUMMARY TABLE OF MDG INDICATORS ................................................................ XXIII

ANNEX 12: UGANDA-CLIMATE RESILIENT AND GREEN DEVELOPMENT PROFILE ...... XXIV
ANNEX 13: GOVERNANCE, BUSINESS ENVIRONMENT AND COMPETITIVENESS ............ XXVI
ANNEX 14:CSP 2017-2021: ALIGNMENT TO UGANDA’S DEVELOPMENT PRIORITIES ..... XXIX
ANNEX15: COUNTRY FIDUCIARY RISK ASSESSMENT-CFRA ................................................... XXX
ANNEX16: DETAILED ECONOMIC AND SOCIAL CONTEXTS
ANALYSIS……………… ................................................................................ …………...XLVIII
ANNEX17: RATIONALE & SELECTIVITY CRITERIA FOR NEWCSP STRATEGIC PILLARS &
PROGRAMS……………………………………………………………… ........ ………………………...LVII
ANNEX18: CONTRIBUTION OF CSP PILLARS AND PROGRAMS TO THE HIGH-5s…… .…LVIII
ANNEX 19: REFERENCES....................................................................................................................... LIX
END NOTES .................................................................................................................................................. LX
i
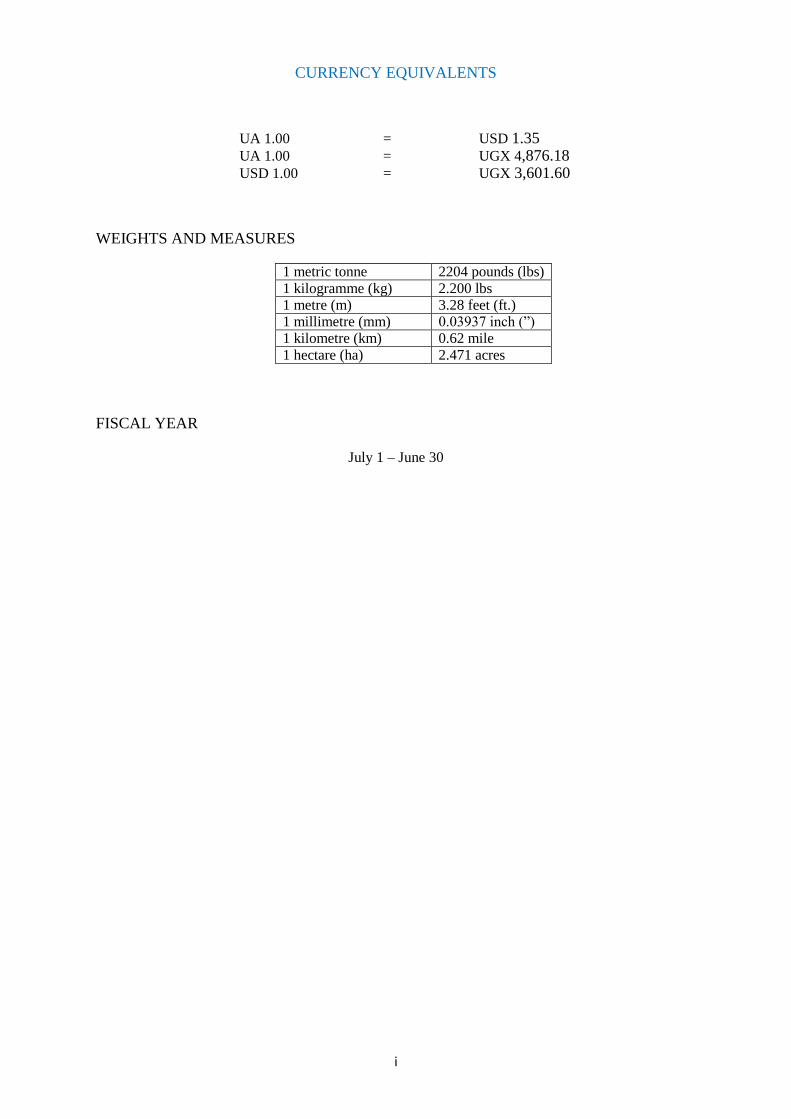
CURRENCY EQUIVALENTS
UA 1.00 = USD 1.35
UA 1.00 = UGX 4,876.18
USD 1.00 = UGX 3,601.60
WEIGHTS AND MEASURES
1 metric tonne 2204 pounds (lbs)
1 kilogramme (kg) 2.200 lbs 1 metre (m) 3.28 feet (ft.) 1 millimetre (mm) 0.03937 inch (”) 1 kilometre (km) 0.62 mile
1 hectare (ha) 2.471 acres
FISCAL YEAR
July 1 – June 30
ii
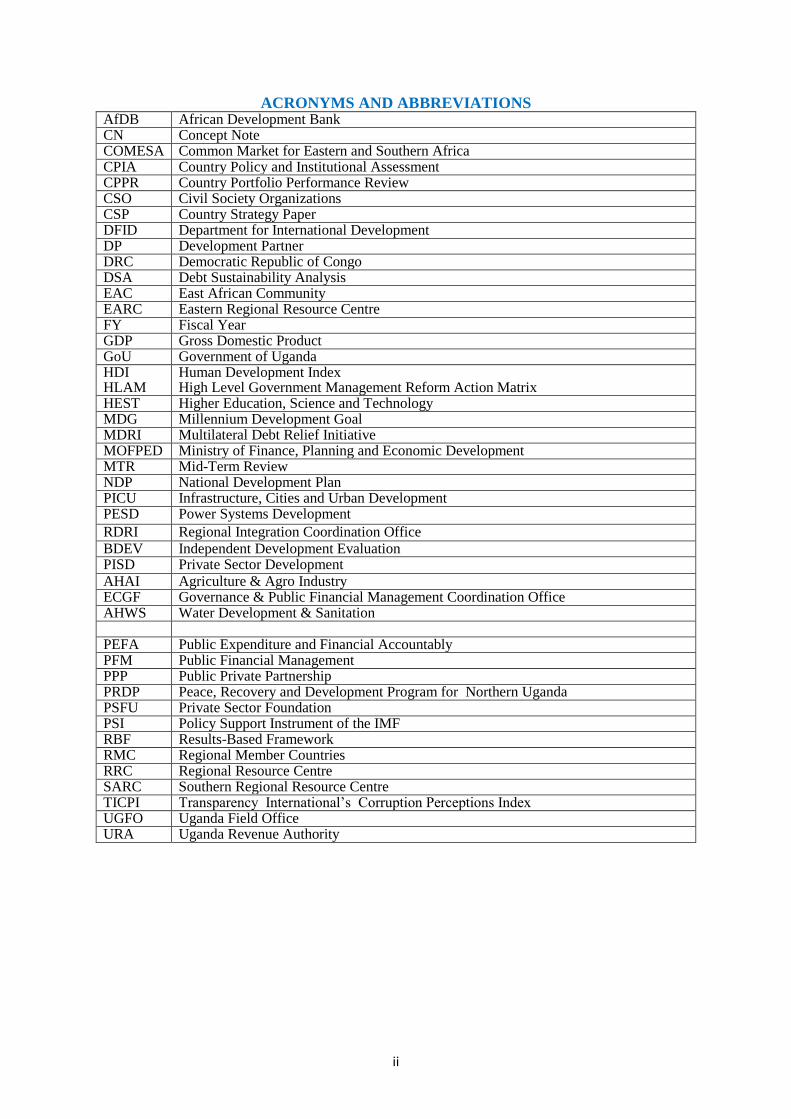
ACRONYMS AND ABBREVIATIONS AfDB African Development Bank CN Concept Note COMESA Common Market for Eastern and Southern Africa CPIA Country Policy and Institutional Assessment CPPR Country Portfolio Performance Review CSO Civil Society Organizations CSP Country Strategy Paper DFID Department for International Development DP Development Partner DRC Democratic Republic of Congo DSA Debt Sustainability Analysis EAC East African Community EARC Eastern Regional Resource Centre FY Fiscal Year GDP Gross Domestic Product GoU Government of Uganda HDI HLAM
Human Development Index High Level Government Management Reform Action Matrix
HEST Higher Education, Science and Technology MDG Millennium Development Goal MDRI Multilateral Debt Relief Initiative MOFPED Ministry of Finance, Planning and Economic Development MTR Mid-Term Review NDP National Development Plan PICU Infrastructure, Cities and Urban Development PESD Power Systems Development
RDRI Regional Integration Coordination Office
BDEV Independent Development Evaluation PISD Private Sector Development
AHAI Agriculture & Agro Industry ECGF Governance & Public Financial Management Coordination Office AHWS Water Development & Sanitation PEFA Public Expenditure and Financial Accountably PFM Public Financial Management PPP Public Private Partnership PRDP Peace, Recovery and Development Program for Northern Uganda PSFU Private Sector Foundation PSI Policy Support Instrument of the IMF RBF Results-Based Framework RMC Regional Member Countries RRC Regional Resource Centre SARC Southern Regional Resource Centre TICPI Transparency International’s Corruption Perceptions Index UGFO Uganda Field Office URA Uganda Revenue Authority
iii
EXECUTIVE SUMMARY
1. Uganda’s economic growth has recently slowed down from the high rates recorded
in the immediate post-conflict period. The average annual real GDP growth rate fell from
6.7% during the 1987-2010 period to 5.7% over the 2011-16 period. In spite of this
economic slowdown, the country has managed to reduce its poverty levels from 56.4% in 1993
to 19.7% in 2013i. However, the country still faces a number of development challenges. The
main challenges are rising income inequalities across gender, age groups, and regions and
various structural problems, including low levels of industrialization and declining total factor
productivity. The main causes of these challenges are inadequate human capital and lack of
quality infrastructure, particularly, in the priority agriculture, minerals, oil and gas, industrial
manufacturing, and tertiary services sectors, and weak public institutional capacity.
2. Although the Government has recently increased its investment expenditure to
develop the country’s infrastructure and human capital base, more investments are still
required to unlock the country’s economic transformation potential. This transformation is vital
for further reducing the country’s high poverty levels and promoting inclusive green growth
through sustainable employment creation and business development for underserved youths,
women and rural areas. The recently launched NDPII (2015/16-2019/20) aims to redress the
country’s infrastructure and human capital deficiencies so as to contribute towards realizing
the GoU Vision 2040 economic transformation agenda.
3. The new CSP 2017-21 aims to support the NDPII development agenda.
Consultations with GoU and key stakeholders further re-affirmed the relevance and alignment
of the Bank’s planned interventions with the GoU’s development objectives and priorities as
stated in the NDP II. Building on progress made under its predecessor, CSP 2017-21 programs
will also be aligned to the Bank’s Ten-Year-Strategy’s inclusive and green growth twin
objectives, the High-5s priorities, and Corporate Strategies.
4. The Uganda CSP 2017-21 is articulated around the following two pillars: (i)
Infrastructure Development for Industrialization, and; (ii) Skills and Capacity
Development. The investment program under the CSP will be narrowed down to not more than
four sectors where development impact and outcomes will be maximized through multiple
linkages and spill-over effects of the Bank’s interventions. Pillar 1 programs will support
development of the agriculture, agriculture, transport, water and sanitation and energy
infrastructure sub-sectors. Pillar 2 programs will support human capital development to
increase employable and entrepreneurship skills with a focus on business and vocational
training institutions and graduates re-skilling programs that will target youths, women, and
regions in priority economic sectors. To ensure sustainable employment and business
opportunities creation for the targeted beneficiaries, programs will be coupled with appropriate
internships, vocational jobs, and entrepreneurship flagship programs under the Bank’s Jobs for
Youth in Africa and Gender Strategies. Moreover, to ensure their effectiveness, the design of
the programs will be informed by appropriate non-lending activities that will include demand-
driven technical assistance, advisory services, and knowledge works.
5. CSP 2017-21 programs will be financed through Bank and external resources. Bank funds
will include concessional (ADF 14) and non- concessional (ADB) resources. ADF 14 funds will finance
operations under both pillars. ADB funds will supplement the concessional resources while
Uganda’s remaining headroom will be used to support PPP projects and private sector
investments. Additional funds will be mobilized through the Bank’s RISP for Eastern Africa (2017-21)

iv
to support multinational operations. Other non-concessional funding windows, accessible through
the Bank, include the Africa Growing Together Fund and Africa50. Potential external funding
sources include funds to be mobilised through PPP projects, and co-financing with third-party
DPs. In light of the expected limited CSP funding resources, and taking advantage of Uganda’s favorable
credit rating, the Bank will also actively consider issuing project-based local currency bonds to
leverage and also deepen the domestic capital markets.
1
I INTRODUCTION
1. The growth rate of Uganda’s economy has recently declined from the high rates
achieved in the immediate post conflict period. The average annual real GDP growth rate
declined to 5.7% over the 2011-16 period from 6.7% recorded during the 1987-2010 period.
Real GDP growth is projected to remain between 5% and 6% over the next three years. In spite
of the economic slow-down, Uganda has significantly reduced its poverty levels from 56.4%
in 1993 to 19.7% in FY2013/14ii, surpassing its MDG target.
2. In spite of the good progress Uganda has made in growing the economy and
reducing poverty levels, the country still faces significant development challenges. Major
challenges include rising income inequalities across gender, age groups, and regions, multiple
structural problems that include low levels of industrialization and declining total factor
productivity. The underlying main causes of these challenges are inadequate infrastructure,
human capital, and public institutional capacity. To redress these problems and achieve its
Vision 2040 development goals, GoU is implementing the NDPII 2015-20.
3. The proposed Uganda new CSP 2017-21 intends to support realization of the
NDPII objectives. The CSP has the following two strategic pillars: (i) Infrastructure
development for industrialization and (ii) Skills and Capacity Development. Bank support
under Pillar I will seek to consolidate and expand on the achievements made under the previous
CSP 2011-2016. Further, it will focus on supporting development of Uganda’s infrastructure
to improve the country’s competitiveness in attracting investments towards agribusiness,
mineral, oil and gas beneficiation, and manufacturing activities, among others. Under the
second pillar, Bank interventions aim to support GoU’s quest to upgrade the skills of its
workforce, and boost formal employment, particularly for the youth, to maximise inclusion and
economic growth opportunities.
4. The rest of the Country Strategy Paper (CSP) 2017-2021 is organized as follows:
Section II reviews and assesses the salient features of the country context; Section III discusses
strategic options, portfolio performance and lessons learnt; Section IV presents Bank Group
Strategy 2017-21; while Section V draws conclusions and presents recommendations for senior
management.
II COUNTRY CONTEXT 2.1 Political Context 5. Uganda remains generally peaceful and politically stable despite the early 2016 controversial general elections that were contested in court by the opposition. The country held its presidential and parliamentary elections on 18 February 2016 in which the incumbent President, Yoweri Museveni and the ruling National Resistance Movement (NRM), were re-elected with a 60.6% majority for another five-year term. However, opposition parties rejected the electoral results citing various electoral malpractices, including lack of transparency, vote rigging, and police brutality, among others. An opposition party launched a legal petition, but this was rejected by the Supreme Court for lack of evidence on the various allegations made. Uganda’s governance ranking in the Mo Ibrahim Index of African Governance, has slightly deteriorated by -1.3 since 2011. In 2015, Uganda was ranked 19th out of 54 countries with an overall score of 54.6 (out of 100) in overall governance. 6. Nonetheless, the country still scores higher than the African average of 50.1. Despite growing internal dissent since 2011, with emerging concerns related to power
2
transition and limited job opportunities particularly for the youth, Uganda has for the last five years also scored high in the areas of personal safety and rule of law. Notable improvements have been in the areas of political stability and absence of violence despite the threat of terrorism. However, Uganda’s ranking in Transparency International (TI)’s global corruption index ranking has deteriorated overtime. The country’s TI score declined to 25 in 2015 from 26 in 2014 and 29 in 2012. Institutional weaknesses, evidenced by weak internal control systems are considered to be the main causes of corruption in Uganda. 2.2 Economic Context Economic Growth 7. Uganda’s real GDP growth rate has recently slowed down from its high levels registered during the immediate post-conflict period. The country’s real GDP grew at an average annual rate of 6.7% during the 1987-2010. However, over the CSP 2011-2016 period, the average real GDP growth rate declined to 5.7% and to about 4.8 % in 2016. On a per capita basis, real GDP growth declined from the average of 3.6% during the 1987-2010 period to 2.2% and 1.6% in 2015 and 2016, respectively, mainly driven by the country’s high population growth rate. The main sources of growth have been tertiary services ICT, transport, and financial services) which accounted for 50.2% in 2013/14, followed by agriculture (22.8%) and manufacturing (18.3%) production.
8. However, the external sector has continued to contribute little to economic growth on account of Uganda’s narrow export base, land-locked location, and high dependence on imports, particularly of capital goods (See Graph 2). The current account deficit reduced from -17.7% of GDP in 2011 to -13.9% in 2012 and was projected to be -10.1% in 2016. The decline in the current account deficit has been due to the continued contraction of manufactured goods imports relative to the decline in exports, which marginally fell from 11.8% in 2012/13 to 10.9% in 2015/6. The drop in exports was dominated by agricultural cash crops that represented 60.2% of total export earnings in FY 2012/13. Sustained high demand for capital goods imports, driven by high public infrastructure investments, a narrow export base, and a fall in global commodity prices due to weak external demand, have been the main drivers of the current account deficit and are expected to continue doing so over the short-term and medium-term periods. The current account deficits have been funded from Foreign Direct Investment (FDI), which have averaged about USD 1,400m per year and private transfers, in particular remittances.
0
2
4
6
8
10
12
2007 2008 2009 2010 2011 2012 2013 2014 2015
Graph 1: Uganda Real GDP Growth (%). Source: AfDB Statistics, African economic Outlook 2016
Uganda
East Africa
Africa
-15
-10
-5
0
5
10
15
2007 2008 2009 2010 2011 2012 2013 2014 2015
Graph 2: Current Account Balance (% of GDP)Source: AfDB Statistics, African Economic Outlook 2016
Uganda East Africa Africa
3
Macroeconomic Stability, Debt Sustainability, and International Reserves 9. The Ugandan economy has generally continued to be relatively stable in spite of recent inflationary and exchange rate depreciation pressures. Consumer inflation sharply decreased from a high of 24.6% in 2012 to 3.4% in 2015 and was projected to slightly increase to 6.8% in 2016, largely driven by depreciation of the Uganda Shilling against major currencies. The Shilling/US$ exchange rate depreciation rate sharply declined from 10.1% in 2011-12 to 1.3% in 2012-13 and -2% in 2013-14 before rebounding to 11.4% in 2014-15. 10. Uganda’s public debt has broadly remained within sustainable levels during the CSP 2011-16 period despite the country’s continuing fiscal and balance of payments deficits and increased borrowing. The total public debt to GDP ratio increased from 22% in 2011-12 to 37.1% in 2016/17. However, following the 2014 rebasing of the country’s real GDP statistics, the public debt to GDP ratio was reduced to 36.9% in 2015-16. The latest (2016) IMF and World Bank Group debt sustainability analysis (DSA) rates Uganda at low risk of debt distress. 11. The country’s international reserves position has generally remained strong in spite of the country’s weak current account position. The coverage of gross official reserves in months of goods and services imports increased from 3.2 months in FY 2010-11 to 4.2 months in FY 2012-13 and was projected to marginally drop to 4.1 months in 2015-16. 12. Uganda’s relatively strong economic growth and macroeconomic stability have been driven by the following key factors: First, despite fiscal policy slippages experienced during the last general elections, GoU has in the context of the IMF Policy Support Instrument (PSI) program, continued to pursue market-based economic reforms and prudent monetary, exchange rate, and financial sector policies. This policy regime has enabled high economic growth by containing inflation, maintaining a stable, but competitive Shilling exchange rate against major currencies, and financial sector stability. Second, the GoU has recently instituted various fiscal policy measures to increase domestic revenue mobilization and contain expenditures. Finally, large public infrastructure investments in all sub-sectors, although still inadequate, have contributed to increasing economic growth.
Economic Structure and Transformation
13. Agricultural Sector: Uganda’s economic transformation has recently proceeded at a
slow pace. The economy continues to be dominated by the agriculture sector, which employs
about two-thirds of Uganda’s labour force, whose earnings have been the main driver of the
country’s poverty reduction. Households primarily engaged in agriculture accounted for 53%
and 77% of the poverty reduction during the 2006-10 and 2010-13 periods, respectively.
Uganda is also a vital source of agricultural products (e.g. cereals and legumes) in the East
Africa region, particularly, for fragile neighbours like Congo Democratic Republic (CDR) and
South Sudan (SS). The sector has also enabled Uganda to continue playing a critical role in
tackling the regional fragility and famine crises. Through its “no-camp” model of settling
displaced persons in its communities, Uganda has been hosting refugees from CDR and SS and
others. However, in spite of its economic importance to the country, the agricultural sector
remains largely underdeveloped with performance levels below its full potential. The sector’s
contribution to GDP has declined over time (to about 25 % currently) while the annual growth
rate has averaged about 2% over the past five years due low yields. Further, the economic gains
(i.e. employment, income, and poverty reduction) made from agriculture to date have been
mostly from unsustainable sources including expansion of acres under cultivation and
favourable weather and commodity prices. Sustainable sources such as the use of improved

4
inputs, innovative production technologies, knowledge and skills, water and land resource
management, and farm to value-chain to markets connectivity have contributed very little.
14. The predominance of subsistence and low levels of commercial farming in Uganda has
resulted in the following agricultural sector structural deficiencies: Limited research and
development and innovation, low quality inputs (such as seeds and fertilizers), low yields and
product diversification, high post-harvest wastage losses, weak land and water resources
management, and inefficient and uncompetitive farm to agro-processing to markets (i.e.
national, regional, and global markets) linkages.Thus, to unlock and sustain the potential
economic benefits of the agricultural sector, farming commercialization needs accelerating.
This is turn requires, among others, scaling up of both public and private investments in
agricultural hard (i.e. transport, storage, logistics, water supply, sanitation, irrigation, energy,
ICT) and soft (extension services, land registration reforms, and water and land management)
infrastructure, particularly in the underserved northern and eastern regions.
15. Private Sector: Uganda still has a nascent private sector that is dominated by micro,
small, and medium scale enterprises (MSMEs), which mainly operate in light manufacturing
and retail sectors. Enterprises are fragmented and weakly integrated into the national, regional,
and global industrial value-chains and markets. They are further characterised by low and
declining productivity, low levels of product, process, and organization innovation, low
competitiveness (due to high operating costs and unstable product quality), informality, weak
governance standards, and limited access to finance, particularly long-term finance for growth.
Other sector attributes include underemployment, low remuneration, low scale of operations,
and high vulnerability to economic, geo-political, and natural shocks. As a consequence of the
foregoing structural deficiencies of the private sector, Uganda’s economy has been
experiencing steadily declining contribution of total factor productivity (TFP) to real GDP
growth. TFP fell from about 34% during 1990-2000 to 28% during 2001-2010, and to 15%
during 2011-12. The major underlying drivers of Uganda’s nascent private sector are
underdeveloped infrastructure (i.e. transport, water & sanitation, energy, ICT, human,
financial, social, natural), high administrative tax burden, weak investor protection, cross
border trade non-tariff constraints, and poor governance.
16. Oil and Gas sector: The Government is currently in the process of establishing key institutions to support development of Uganda’s nascent oil and gas industry. This is to ensure that the development pace of the industry is well aligned with that of institutions responsible for its management and regulation. To facilitate this, the Bank supported the National Seminar on Managing Oil Revenue in Uganda to share information on the country’s oil prospects with key stakeholders, provide a forum to discuss the National Oil and Gas Policy, propose oil and gas legislation, and also share pertinent macroeconomic and political economy experiences of other oil-producing countries. The GoU also has formulated policies, laws, regulations and instruments that are required to ensure a robust and transparent oil revenue management system. Lastly, the GoU has instituted reforms to strengthen the institutional capacity of tax administration in assessing, collecting, and reporting oil revenues. In support of the Government’s initiatives, the Bank has funded a study to determine the potential economic benefits of the oil and gas project- The Lake Albert Basin Development Project to Uganda. The study has the following main findings: (i) The project will create between 100,000 to 150,000 jobs through direct, indirect, and induced employment; (ii) Uganda will face the human resources challenge of not having the right number and level of certification of technicians to comply with oil and gas sector standards; (iii) Some industries will be able to meet the oil sector’s demands while many will not due to lack of or weak technical and management capacity, and; (iv) To ensure that the country benefits for the oil and gas resources, the
5
Government must, through a Local Content policy, promote the development of Ugandan companies, which must also establish partnership with knowledge institutions to produce the skilled manpower the industry needs.
17. Business Climate and Competitiveness: Uganda’s business climate remains weak and
uncompetitive. The country has generally stagnated in promoting a competitive business
environment in spite of the gains made from the Government’s previous market-based policy
reforms and increased infrastructure investment to achieve Vision 2040 objectives, Uganda has
yet to significantly improve its business climate to enhance its competitiveness. According to
the Economic Freedom Index by the Heritage Foundation /Wall Street Journal (2016),
Uganda’s overall ranking is 91st among 180 countries, and 9th in its region. Although it has
improved on key indicators such as Labour Freedom (10th), Monetary Stability (72nd), and
Trade Freedom (93rd), Uganda needs to improve in the following areas vital for improving
competitiveness: Gguaranteeing and implementing property laws (126th); Ensuring Judicial
Effectiveness (114th); and Government Integrity )152nd ). The World Economic Forum 2016-
17 Global Competitive Report indicators show similar patterns for Uganda. The country’s good
positioning in macroeconomic environment (73th); innovation (12th); labor market efficiency
(29th) and financial market development (77th), are undermined by relatively weak institutions
(93rd), and inadequate infrastructure (126th). The 2017 WBG Doing Business (DB) Report
ranks Uganda’s overall competiveness at a still low position of 115th out of 190 countries,
despite improving from 122nd /189 in DB 2016. Within the EAC, the country continues to rank
behind at 3rd best after Rwanda (56) and Kenya (92), ahead of Tanzania’s (132) and Burundi
(157). The underlying constraints on the development of Uganda’s agricultural and private
sectors cited-above are the main drivers of the country’s weak business climate and low
competitiveness.
18. Regional Integration: Uganda is an active East African Community (EAC) and
Common Market for Eastern and Southern Africa (COMESA) member. The Government has
adopted a common external tariff (CET) and free trade agreement within the EAC Common
Market Agreement. It is also working with its peers to establish a single customs territory by
eliminating internal and external tariffs and reducing non-tariff barriers (NTBs) to further
unlock trade. Uganda’s membership in these economic communities has sharply increased its
regional trade volumes resulting in both export and import benefits. The country’s exports to
EAC and COMESA countries almost doubled to 25% in 2011 from 15% 2007. The increased
trade opportunity has also enabled Uganda to diversify its exports to include manufactured
products like cement, iron sheets, and plastics, which have gradually also substituted imports.
The Government has also revised its legal and regulatory frameworks to support customs union
and common market protocols to increase its private sector’s competitiveness and access to
broader regional markets. Uganda is further actively participating in the Northern Corridor
initiative for strengthening the country’s integration with the rest of East Africa. However, the
quality and quantity of Uganda’s transport infrastructure remain inadequate, needing
rehabilitation and expansion. To fast-track regional trade development, Uganda has joined
other EAC member states to develop vital transport infrastructure networks, some of which
will link the country’s oil and gas production facilities to regional markets.
2.3 Social Development and Cross-cutting Issues
19. Poverty status and Millennium Development Goals (MDGs): Uganda is among the
few sub-Saharan countries that have succeeded in achieving their poverty reduction MDGs.
6
Extreme poverty levels were halved from 56.4% in 1992/93 to 24.5% and 19.7% in 2009/10
and 2013/14 respectively, in line with its 2015 MDG target (See Annex 4 and 10). The country
is also on course to achieving its goals in universal access to primary education and reduction
in gender inequalities in this sector. However, progress on other MDGs has been slow. For
example, the MDG on maternal mortality, despite declining from 438/100,000 in 2011 to
310/100,000 in 2015, continues to be of grave concern being amongst the highest in the world
(see Annex 10).
20. Economic Inclusion: Uganda’s poverty reduction and high economic growth rates
have not been inclusive as inequality has recently increased across all dimensions. The
country’s Gini Index, rose from 0.36 in 1993 to 0.44 in 2013 (Human Development Report
2013). Further, inequalities across regions (that is, between rural and urban areas, the northern
and eastern parts and the rest of the country), gender, and age groups have also deteriorated.
The following factors have been the main causes of inequality: high gender and youth
unemployment, low access to enabling basic social services (education and healthcare) and
infrastructure, jobs-skills mismatches, low savings, declining productivity, cultural biases
against women (such as women’s rights to land, assets and inheritance), and lack of and/or
insufficient social safety protection services.
21. Carbon Emissions, Climate, and Resources Management: Uganda has made good
progress in CO2 emission growth trends, carbon sink, carbon intensity, CC exposure and
adaptive capacity, but not on climate change sensitivity (Annex 11). It has performed better on
carbon intensity, carbon sink and climate change exposure when compared to lower-middle
income peers. However, the country continues to face challenges in the areas of adaptive
capacity and sensitivity to climate change. Thus, building climate change resilience into
infrastructure development for transforming agricultural and industrial production will
improve green growth performance. Uganda has performed better than its low-income peers in
promoting eco-friendly growth in the areas of water stress, endangered species, and soil heath,
but less on forest cover change, natural resource depletion and water quality. The country also
still faces serious natural resource depletion challenges. Its forestry cover reduces by 90,000
Ha annually. Large losses of forests and degradation mainly occur on private land, which
constitutes about 64% of Uganda’s forest area cover. More than 93% of Ugandans depend on
biomass energy from forestry. Uganda’s environmental degradation has been driven mainly
by: (i) Conversion to farmland and inappropriate farming methods; (ii) High rate of
urbanization, which has and continues to increase charcoal and timber demand for energy,
construction, and furniture use; (iii) Increasing population on scarce land, and; (iii) Wasteful
use of energy resources.
22. Gender Equity and Women’s Empowerment: Good progress has been made to
improve the institutional and regulatory environment towards gender equality. Major initiatives
have included reinforcing gender in sectoral ministries, establishing a national institutional
architecture to deal, amongst others, with gender issues and approval of legislations like the
Equal Opportunities Act (2007), Domestic Violence Act (2010), Prohibition of Female Genital
Mutilation Act (2010), and amendment of the Land Act (2010). The Government has also
ratified various international commitments, including the Convention on Eliminating All
Forms of Discrimination against Women and the Beijing Platform of Action. It has further fully
subscribed to the fifth SDG of achieving gender equality and women’s empowerment.
However, the following gender inequalities still persist despite the legal and institutional
framework being put in place to support gender equality: Labour market gender inequalities
(% of males in wage labour remains twice higher than that of women (26%/13%); Women are
7
less represented in decision making than men in parliament (35% - 65%), and; Women are
almost absent in customary structures of decision making that affect, amongst others, their right
to land despite legislation approved in 2013.
23. Demography: Major demographic trends include high growth rates of population,
fertility, and youth bulge. Uganda’s current population growth rate of 3.3% has been
persistently above Africa’s average. At this rate, the country’s population is expected to grow
to between 60-70 million by 2030 from 38 million in 2014. Of particular social concern are the
country’s high fertility rate and rapidly increasing youth population. Currently, Uganda has a
high fertility rate of about 6.2 children per women that is mostly associated with low-income
households while about 48.3% of its population are below 15 years (see Annex 4). The
combined high fertility rate and youthful population have resulted in a very high youth
dependency ratio that is 45% higher among the bottom 40% of households compared to the top
60%. Households are increasingly unable to save and build their asset base to support
dependents’ education and skills building. These problems have in turn adversely affected the
ability of dependents to build the quality and quantity of human capital needed by the labour
market and business sector for sustainable employment and business income generation. Weak
human capital formation has also contributed to Uganda’s high and growing unemployment
and income inequality. Youth unemployment, in particular, remains one of the major
demographic challenges for Uganda. The country faces the challenge of the economy’s limited
capacity to absorb the large numbers of youths entering the labour market every year in addition
to the mismatch between available skills and market’s needs. To address the youth problem,
the Government has developed a 10-year Strategy for Uganda’s Skills Development and
Vocational Training.
III. STRATEGIC OPTIONS, PORTFOLIO PERFORMANCE AND LESSONS
3.1 Country Strategic Framework
24. Country Development Framework: Uganda’s development policy framework is
anchored on the Government’s ‘Vision 2040’ whose overarching goal is to ‘transform
Uganda from a peasant society to a prosperous low-middle income country by 2040’. The GoU
is also implementing its SDGs through the NDP II (2015/16-2020/21), which Cabinet adopted
in May 2015 as successor to the NDP ME (2010/11-2014/15). The NDPII’s main goal is to
support attainment of Uganda’s middle income status by 2020 through improving the country’s
competitiveness for sustainable wealth and employment creation, and inclusive and green
growth. The Plan’s main objectives are: (i) Increasing sustainable production, productivity, and
value-addition in key economic growth opportunities; (ii) Increasing the stock and quality of
strategic infrastructure to accelerate the country’s competitiveness; (iii) Enhancing human
capital development, and; (iv) Strengthening mechanisms for quality, effective, and efficient
social services delivery. The following strategies have been adopted to achieve the objectives:
(i) Industrialization and export- oriented growth through value-addition, agro-processing,
mineral beneficiation, selected heavy and light manufacturing; (ii) Employment creation
through fast tracking skills development and harnessing the demographic dividend; (iii)
Ensuring macroeconomic stability with fiscal expansion for frontloading infrastructure
investments; (iv) Strong Public Private Partnerships (PPPs); (v) A private sector led growth
and quasi-market approach, and; (vi) Strengthening governance mechanisms and structures.
8
3.2 Aid Coordination and Harmonization
25. Uganda’s development cooperation landscape comprises various multilateral and
bilateral DPs with a well-established structure for aid coordination and harmonization
dialogue as reported in the CSP 2011-16 CR+CPPR report. The Bank and DPs continue to
implement the Paris Declaration commitments and subsequent aid-effectiveness declarations on the
effective use of country systems. Therefore, the Bank and DPs have adhered to Uganda’s PFM systems,
including a recent introduction of a single treasury account. The country dialogue structure comprises
30 DPs active in 25 economic sectors (See Annex 6). DPs contribute to almost all sectors and
their total commitments for each year account for about 18.2% of Uganda’s national budget.
3.3 Country Challenges, Weaknesses, Opportunities and Strengths
26. Challenges and Weaknesses: Based on the Bank’s consultations with the Government,
stakeholders and economic sector and analytical works, key constraints on Uganda’s progress
towards attaining its Vision 2024 aspirations include mutually re-enforcing micro-level (i.e.
business enterprise and households) and macro-level (i.e. macroeconomic, geo-political,
natural environment) challenges and weaknesses. Major micro-level challenges and
weaknesses, as prioritized by the NDPII, are infrastructure and human capital constraints.
Major macro-level challenges and weaknesses are weak public sector management and
governance, low business climate competitiveness, and the country’s high vulnerability to
adverse climate change and geo-political shocks.
27. Infrastructure Constraints: Despite the Government’s large allocations of public
investment towards infrastructure development over the past decade, the quantity and quality
of Uganda’s transport, water & sanitation, energy, and agriculture infrastructure remain
inadequate to meet the Government’s economic transformation and development objectives.
The main infrastructure constraints are as follows:
Transport Sector: Uganda still suffers from poor transit and transport infrastructure, which has
increased the cost of doing business. As a landlocked country and transit for EAC and Great
Lakes regions countries, but with underdeveloped inland water, railway, and air infrastructure,
its roads are the main transportation mode, carrying 90% of all land transport in the country.
This has led to overloading and insufficient road maintenance which has accelerated
deterioration of the roads. The roads in underserved regions are also insufficient of poor quality
resulting in weak connectivity with markets and basic social services. These challenges have
resulted in high costs of transportation and logistics costs for both intra and inter regional trade
thereby constraining investments and business development.
Water & Sanitation: Despite achieving its MDG national target (72%) for access to improved
drinking water, Uganda’s water supply remains low as only 19% of households are able to
access piped water. About 35% of the population (10 million, rural, and 1.7 million, urban) are
unable to access safe drinking water and only 2% of water supply is used for industrial
production. Low piped water supply is due to inadequate and uneven distribution of water
supply infrastructure across districts. Industrial and domestic water supply and access
challenges are expected to intensify with mounting droughts and high population growth.
Uganda has yet to achieve its MDG national target (70%) for sanitation. Only 35% of Ugandans
have access to improved and safe sanitation facilities.
9
Country financial losses due to poor infrastructure are estimated at US$177 million per annum
(i.e. US$5.5 per capita per year or 1.1% of GDP) while social costs (like sickness, insecurity
etc.) are also high, with women and children bearing most of the burden.
Energy Sector: Although energy supply capacity has recently been increased (i.e. the Bujagari
hydro-electric plant), access to electricity remains low at about 14% and 7%, respectively, at
the nationally and rural levels compared to the average of 24% for Sub-Sahara Africa (SSA).
The projected industrial and domestic energy demand growth is expected to outstrip the current
supply capacity if extra power generation, transmission, and distribution capacity is not
installed. This will aggravate access to clean energy and use of unsustainable energy sources.
Presently, despite the increased energy supply capacity, electricity tariffs have remained high
while power outages and load shedding have persisted resulting in increased costs of doing
business and undermining of Uganda’s economic and business competitiveness.
Agriculture Infrastructure: Agriculture commercialization to unlock Uganda’s economic
transformation potential is partly constrained by inadequate and poor quality exiting transport,
water supply, and energy infrastructure. Thus, the country needs to prioritize scaling up of
infrastructure investments with a focus on the following: Urban and rural feeder roads,
particularly in underserved northern and eastern regions; Water supply and irrigation systems;
Agricultural storage, trucking, and logistics facilities, and; Affordable clean energy supply to
reduce inputs and product costs and increase market access and trade facilitation.
28. Human Capital Constraints: Uganda has a significant shortage of skilled manpower,
especially in the tertiary services and value-adding industries, which the country needs to
realize its Vision 2040 goals. Although progress in skills development has been made in
Business, Technical, Vocational Education and Technical Training (BTVET), in line with the
BTVET Act 2008, the country continues to face the following human capital constraints: Labor
market demand-supply skills mismatch; Poor skills development outcomes due to weak
training curriculums, training materials, teacher quality, and lack of accountability; Weak
synergies and silo-mentality among primary, secondary, and tertiary education systems; Low
enrollment levels; Weak performance-based management system; Inadequate remuneration
systems, and; Declining public budget allocation to education.
29. Public Sector Management and Governance Weaknesses: GoU has recently
instituted civil service, PFM, devolution, anticorruption policy and regulatory reforms to
improve social services delivery and governance. However, the following weaknesses persist
at all government levels: Weak budget credibility and controls; Low compliance with PFM
regulations leading to wasteful expenditures, arrears increases, and inadequate accountability;
Weak public investment management, including poor planning and inefficient procurement,
and implementation; Failure to control rent-seeking behaviour and corruption, and; Erosion of
participation and voice. These weaknesses are mainly attributed to policy implementation gaps,
which are in turn a consequence of weak institutional capacity and enforcement of sanctions
and adverse political incentives.
30. Business Climate Challenges: GoU has implemented various policy reforms to
strengthen predictability, transparency, and impartiality of laws affecting economic activity
(such as property and land rights) to improve Uganda’s business climate and competitiveness.
Nonetheless, the country still faces the following business climate challenges, which continue
to undermine competitiveness: Heavy burdens of business regulations in registering and
obtaining compulsory trading licenses and the high administrative burden of taxes.
10
31. Climate Change and Geo-political Vulnerabilities: Uganda remains highly
vulnerable to adverse climate changes such as droughts. In addition, country remains
vulnerable to security and attendant refugee spill-over effects of fragile neighbors like CDR
and SS.
32. Opportunities and Strengths: Uganda’s significant opportunities and strengths for
achieving its economic growth and development objectives are its agricultural sector, natural
resources sector, political stability, macroeconomic stability and low risk of debt distress, its
geographic location, regional integration, and growing urbanization rate.
Agriculture: In spite of its structural challenges, the agricultural sector remains a strategic
opportunity for spearheading Government’s NDPII and Vision 2040 objectives. However, to
unlock the sector’s potential, both hard (transport and logistics, water supply, irrigation) and
soft (water and land management, extension services) infrastructure investments need scaling
up.
Natural Resources: Uganda is endowed with the following abundant and commercially viable
natural resources: Rich fauna and flora that have become a tourist attraction and led to a thriving
tourism and hospitality services sector with significant potential for growth and expansion
(tourism earned 26% of total exports forex and contributed 9.9% of GDP in 2014), and;
Undeveloped commercial viable oil & gas, and mineral resources. Oil and gas production are
expected to come on-stream by 2019.
Political Stability: GoU has restored and maintained peace and stability after years of civil
turmoil and conflict. The peace dividend has enabled Uganda to implement successful
economic policies for the country’s reconstruction and development. The country’s favorable
political conditions have also been a key driver of Uganda’s significant FDI inflows over the
last two decades.
Macroeconomic Stability: Uganda continues to post relatively high economic growth and price
stability that has partly been driven by implementation of prudent macroeconomic policies.
The stable macroeconomic environment, coupled with low risk of debt distress and ample
foreign exchange reserves, have contributed to promoting high real GDP growth, which has
led to a significant reduction in the country’s poverty levels. The country’s stable
macroeconomic environment offers an ideal opportunity to leverage savings of local investors’
such as pension funds and insurance companies through use of local currency instruments to
fund infrastructure projects and businesses.
Location, Regional Integration, and Urbanization: Uganda is strategically located within
easy access to the Central, Eastern Africa and COMESA regional markets. Thus, the country
remains a potential regional transportation, logistics and transit hub for trade in both imports
and exports. With adequately developed infrastructure connectivity, Uganda can easily access
regional markets and value-chains, thereby increasing its trade and investments with its
neighbors. The country also has rapidly growing urban centers and youth population. If
appropriately harnessed and managed, these demographic dynamics can enable accelerating of
the country’s economic growth and development through agglomeration spill-over effects
(such as, increased domestic market, industrialization, employment, economies of scale and
scope, and business and financial innovations).
11
3.4 Key Findings of the CSP 2011-16 Country Portfolio Performance Review (CPPR)
33. Size and Composition of Bank Group’s ongoing portfolio. As at December 2016, the Bank’s active portfolio in Uganda amounted to UA 917.6 million, comprising 15 public sector operations of UA 782.51 million, 6 multinational operations of UA 124.12 million and 3 private sector operations of UA 16 million (see Annex 8 for a comprehensive list of ongoing operations excluding private sector operations). The portfolio comprises operations in the following sectors: transport (15.57%), social (13.4%), agriculture (22.4%), water supply and sanitation (16.36%), energy (17%), multinational (13.53%), and private sector (1.74%). Thus, the portfolio is skewed towards infrastructure development focusing on most of the sub-sectors in line with the CSP 2011-2016 pillars.
34. Bank Group’s Portfolio Performance. The average cumulative disbursement rate for the
overall public sector and multinational portfolio was 34%, as at end 2016. The 3 private sector
operations, valued at UA16 million, have recorded a 97.33% disbursement ratio. The average
age of the portfolio stands at 3.31 years. The portfolio has a satisfactory rating of 2.95 (on a
SAP 0-4 and IPR 1-4 scale) (See Annex 10 – Key Portfolio Performance Indicators). The
portfolio has no problem project, but has a potentially problematic project of 6.7% and
commitment at risk of 8%. The average size of the portfolio is UA 52 million. Major portfolio
challenges have included weaknesses in areas such as quality-at-entry, delays in Parliament
ratification of approved projects, institutional and human capacity constraints of implementing
agencies, contract management, and slow disbursements emanating due to procurement
problems. These challenges are being addressed by the Government and Bank through the
implementation of the Country Portfolio Improvement Plan (CPIP) as detailed in Annex 9.
35. Portfolio Issues and Improvement Plan. The CPPRs have highlighted areas needing improvement and the following remedial measures have been implemented: (i) To avoid project effectiveness, start-up and implementation delays, GoU has started addressing the issues of payment of compensation and obtaining land and right of way for implementation of Bank projects and ratification of projects by Parliament that were largely responsible for the delays in projects becoming effective; (ii) Regarding procurement delays, GoU has agreed to work through the Public Procurement and Disposal of Assets (PPDA) Authority established to minimise the effects of procurement challenges, such as activities of whistle blowers and bidders dissatisfied with outcomes of contract award processes; (iii) Regarding Financial Management issues, GoU is expected to exempt Bank funded projects from VAT/Taxes or provide the VAT/Tax deductions made to projects in good time to enable contractors continue working and; (iv) To address the challenges relating to low disbursement, the Bank’s fast-tracking of effectiveness processes will mitigate low disbursement caused by start-up and effectiveness delays. 3.5 Main Findings of the CSP 2011-2016 Completion Report 36. Implementation of the CSP 2011-16 has generally been successful. Good progress was made in achieving most CSP outputs and outcomes. The Completion Report (CR) noted that 23 out of 27 outputs (82%) and 26 out of the 31 outcomes (84%) were achieved while the remaining outputs and outcomes were expected to be achieved under CSP 2017-21. The overall assessment of the implementation of the CPIP 2015 was rated satisfactory. Thus, Bank assistance under the CSP 2011-16 contributed to addressing Uganda’s infrastructure bottlenecks in transport, agriculture, and water and sanitation infrastructure sub-sectors. However, the Bank needs to sustain its support to contribute to Uganda’s achievement of its economic transformation, inclusive, and green growth objectives .
12
3.6 Lessons Learned from the CSP 2011-2016 Completion Report and CPPR 2015/16
37. The following are major lessons learned from the CSP 2011-2016 CR and CPPR and incorporated in the CSP 2017-21:
Country Ownership: The Government has been less effective in implementing development
programs when these has been mainly donor driven, but most effective when it has been the
owner and main driver. To ensure country ownership, the new CSP pillars and work programs
are aligned with the Government’s national development plan objectives and programs (see
para. 40).
Project Selection and Quality-at-Entry: GoU’s institutional effectiveness and governance
challenges continue to undermine the country’s effective absorption of development assistance.
The Bank must, therefore, selectively focus its investments on a few high impact projects and
sectors to effectively contribute to Uganda’s development programs and objectives. The Bank
should also conduct rigorous analytics to inform and ensure quality design of projects at entry.
Project selectivity is incorporated in the new CSP by focusing investment programs on a few
sectors critical for unlocking Uganda’s economic transformation (see para. 40). To ensure
quality-at-entry, each investment program will be informed by appropriate non-lending works
(see para. 64).
Fiscal Policies: The following Government fiscal policies have adversely affected
implementation of Bank projects and need to be sustainably resolved: Taxes and VAT payment
of projects, non-release or release of inadequate counterpart funds, and; challenges associated
with land acquisition and obtaining the right of way for Bank funded projects. Resolution of
the foregoing fiscal policies under the new CSP will be addressed through the planned dialogue,
non-lending, and portfolio management activities.
Portfolio Management: Institutional and human capacity weaknesses have been a major
challenge to quality portfolio management. Thus, the Bank should continue to closely monitor
project implementation through quarterly reviews of CPIPs, following up on outstanding
portfolio issues, and constant reminders of the implications of flagged problematic projects.
Under the new CSP, the Bank will continue to actively manage its portfolio through close and
frequent monitoring of Government implementation of projects and CPIPs recommendations.
Further, portfolio performance results will be monitored and evaluated the new results
measurement framework (RMF) (see. Annex 3).
Development Effectiveness and Capacity Building: To improve the development
effectiveness of Bank projects, GoU must improve its capacity in the following areas of
weakness: Timely preparation and submission of quality project audit reports; Hiring PIUs staff
with requisite skills in procurement, financial management, disbursement, and monitoring and
evaluation; PIUs proactive follow ups with relevant agencies to expedite approval processes;
Due diligence and technical assessments of contractors; Proactive application of the cross
debarment process jointly shared by the Bank and World Bank, and; Development of a system
for grading contractors to reduce whistleblowing and ensure quality performance. The new
CSP will support the Government in building its capacity in the foregoing weakness areas (to
improve the development effectiveness of Bank projects) through the dialogue, non-lending,
and portfolio management activities.
13
Coordination of Development Assistance: The Local Development Partners Group (LDPG)
platform has proved very effective for coordinating dialogue between the LDPG and GoU.
Coordinated pressures from LDPG actions triggered needed reforms in the country’s PFM
system, especially after the 2013 budget support suspension due to irregular use of aid. Hence,
Bank-DPs coordination must be sustained to ensure effective delivery of development
assistance. The new CSP interventions will maintain active Bank-DP coordination through the
LDPG platform to ensure effective delivery of development assistance in Uganda (see para.
68)
Country Dialogue: Country dialogue has helped to better understand issues of national interest
and the best means of aligning national priorities with Bank strategies and assistance. Thus, the
Bank needs to continue pursuing active dialogue with Government on key development issues,
especially accelerating inclusion of the High 5s in Uganda’s development agenda and cross-
cutting issues of governance, gender equity, youths and rural areas. The new CSP work
programs will include active dialogue with GoU and key stakeholders on issues critical for
achieving the CSP 2017-21 and NDPII objectives (see para. 68). IV BANK GROUP STRATEGY 2017-21 4.1 Rationale and Strategic Selectivity
38. CSP Preparation Methodology: To ensure that the new CSP 2017-21 is anchored on
strategic pillars and programs appropriate for effectively addressing Uganda’s pressing development
needs so as to deliver the Government’s Vision 2040 agenda in general, and NDPII objectives, in
particular, a three-pronged methodology was adopted to inform identification of the rationale and
selection criteria for the pillars and their programs. First, extensive dialogue and consultations were
conducted with the Government and key stakeholders, including DPs, civil society organizations, the
private sector, academia and think tanks (see Annex 4). Second, the Bank conducted various analytical
works on the country’s economic and social development context. Key analytical works included the:
‘East-African Manufacturing Report’, a study on ‘Resource Mobilization in Uganda’ and a
‘Systematic Country Diagnostic study for Uganda’. Third, the Task Team also conducted
extensive desk research on relevant analytical works conducted on Uganda by various parties
(See Annex 19).
39. Selectivity Criteria: Based on the results of the country dialogue and consultations,
and analytical and research works, the following criteria, which is summarized in Annex 17
has been applied to select the new CSP’s pillars and programs; (i) Uganda’s most pressing
development needs; (ii) Alignment to Uganda’s national development strategy framework; (iii)
Alignment to the Bank’s corporate strategies and operational priorities; (iv) Stakeholders’
recommendations; (v) DPs’ focus areas; (vi) Bank’s past achievements and areas of
comparative advantages, and (vii) lessons drawn from the Bank’s interventions under the CSP
2011-16.
4.2 CSP Objectives and Strategic Pillars 40. The CSP 2017-21 will continue to support Uganda’s vision 2040 to transform the country from a low-income agriculture-based to a prosperous middle income industrial society. This will be achieved through aligning and supporting NDPII (2015-20) objectives. Building on the progress made under CSP 2011-16, and in line with the Bank’s key corporate strategies (Agricultural Transition in Africa, Industrialization for Africa, Jobs for Youth, and Human Capital Strategies), and operational priories (the High-5s), the new CSP will focus on
14
addressing Uganda’s infrastructure and human capital development needs, which the Government has identified as the most critical enablers for achieving its NDPII objectives. In this context, the CSP 2017-21 will be articulated around the following two strategic pillars: Pillar 1: Infrastructure Development for Industrialisation; and Pillar 2: Skills and Capacity Development. PILLAR 1: Infrastructure Development for Industrialisation 41. Pillar 1 Objectives: The main objectives of Pillar 1 interventions are to reduce Uganda’s binding infrastructure bottlenecks and create a more enabling business climate by scaling-up selected investments and supportive non-lending activities to boost the country’s industrialization, employment and business creation activities in priority economic sectors. The interventions will focus on the following four infrastructure sub-sectors: (1) Agriculture, (2) Transport, (3) Water Supply and Sanitation, and (4) Energy.
Agriculture Sector Objectives, Outcomes and Programs:
42. Objectives: Agriculture sector interventions will aim at: (i) transforming the sector to unlock its
full inclusive and sustainable growth and development potential by enhancing production, productivity,
value-addition, and marketing activities in the value-chain, and: (ii) promoting greater inclusivity through
increasing sector incomes and employment, with a focus on underserved women, youth and regions
(particularly the eastern and northern regions).
43. Outcomes: Target intermediate outcomes by end 2021 include: (i) 20% increase in
marketable agricultural produce; (ii) 10% increase in farm gate prices; (iii) 20% increase in
rice and maize production; (iii) 30% increase in commercial funds available for agricultural
lending, and; (iv) 20% increase in businesses in the agricultural value chain. Whereas the
NDPII targets 12 commodity value-chains (cotton, coffee, tea, maize, rice, cassava, beans, fish,
beef, milk, citrus and bananas), the Bank will prioritize the maize and rice commodity value-
chains and beef and dairy cattle value-chains, given its resource constraints and the need to be
more selective to ensure effective delivery of impact on the ground. However, at the midterm
review, the investment portfolio and resources will be reassessed for possible inclusion of other
commodity value-chains. 44. Programs: In addition to on-going projects (see Annex 3), the planned Agricultural Value Chains Development Programs (AVCP) I and II, will be the flagship programs under the agricultural sector. In line with the Bank’s Agricultural Transformation in Africa Strategy, programs will combine investment and non-lending (that is, knowledge, technical assistance, advisory and advocacy) activities to remove binding capital (broadly defined to include hard infrastructure-transport, water, energy, soft-infrastructure-knowledge & skills, land tenure system, enabling business regulations, human, innovation, and financial capital) constraints in each segment of the targeted agro value-chains. Thus, for each value-chain, programs will target removing sources of underperformance in research and development, inputs supply, production, aggregation, post-production aggregation, transportation, and logistics, value-addition or agro-processing, and markets access and trade facilitation (particularly linkages to national, regional, and global markets and value-chains).
Transport Sector Objectives, Outcomes and Programs:
45. Objectives: Consistent with the Uganda Ten-Year Road Sector Development Program
(RSDP) 2012-2022 objective, Bank interventions in the transport sector will aim at: (i)
15
Developing an efficient and effective road transport network for promoting inclusive and green
socio-economic development through increasing businesses and household’ access to better
markets and basic social services; (ii) increasing the safety of transport services, and; (iii) improving
the human resource and institutional capacity of the sector.
46. Outcomes: Target intermediate outcomes by end 2021 include: (i) 25% of national road
network to be paved and 60% of Kampala City road network to be upgraded; (ii) Reducing road
accident fatalities per 10,000 vehicles to 20; (iii) Reducing delays as a result of improved road
infrastructure (iv) Reducing road fatalities, and; (v) Training 150 nationals (to be equally split
between men and women) in transport sector related areas, and: (vi) establishment of a Road
Safety Authority and amendment of the Road Act.
47. Programs: The proposed programs include construction of the Kampala-Jinja Express and Kampala City Road and Rehabilitation and upgrading of the Kikorongo-Katurugu-Ishasha and Ikumba-Kanungu-Buhoma roads. The Kampala-Jinja Express, Kikorongo-Katurugu-Ishasha and Ikumba-Kanungu-Buhoma roads are vital regional links and Kampala City Road Rehabilitation is key to industrialization. Water and Sanitation Sector Objectives, Outcomes, and Programs: 48. Objective: Bank interventions in the water and sanitation sector will aim at improving access to clean and safe water and sanitation facilities of agribusiness centers/zones, industrial parks, business centers and underserved households, particularly in underserved areas. Bank support will, hence, support the Government’s goal to ensure availability and sustainable management of water and sanitation for all (Sustainable Development Goal 6). 49. Outcomes: Target intermediate outcomes by end 2021 include the following: (i) 90%
rural population with access to safe drinking water; (ii) 95% of urban households with access
to improved sanitation; (iii) 50% of urban households with access to and using hand washing
facilities; (iv)50 % of schools (students) in urban areas with access to and using hand washing
facilities; (v) 95% functionality rate of urban water supplies systems, and; (vi) 95 % of water
points with actively functioning water and sanitation committees.
50. Programs: The water and sanitation program includes the Strategic Towns Water Supply and Sanitation Project” (STWSSP) and Angololo Irrigation Development and Watershed Management Regional Project. The latter project is designed to facilitate water supply for agro-production through improved irrigation to ultimately increase agricultural productivity and enhance climate change resilience. The project is also designed to take on board fresh graduates for about a year with pay and undergraduate interns in addition to providing skills training for unemployed local women and youths. This arrangement is intended to address employment requirement for about 150 graduates and skills for 2000 youths and women. The Bank will also support implementation of the Government’s large gravity flow schemes programs that cover wider and water stressed areas. Energy Sector Objectives, Outcomes, and Programs:
51. Objectives: The main objectives of Bank interventions in the energy sector are to: (i)
increase access to power by reducing energy production costs and electricity tariffs (i.e.
industrial, business, and retail tariffs), and; (ii) increase renewable energy supply so as to
promote the country’s industrialization program and inclusive economic growth and
development.
16
52. Outcomes: Target intermediate outcomes by end 2021 include: (i) Reduced average
Bujagali tariff from the current estimate of 10.7 cents/kWh to 8.2 cents/kWh, and the overall
end-user tariff from 15 Cents/KwH status to 13.5 cents/KwH, and; (ii) Increased share of
renewable energy in Uganda to 90%; (iii) double efficient use of water from Lake Victoria,
and; (iv) Offset 880,000 tons of carbon dioxide per year.
53. Program: Bank intervention, through the private sector window, will largely comprise restructuring of the Bujagali Energy Limited (BEL)’s debt to ensure that its tariff trajectory over the 2018 – 2023 period is significantly reduced to allow for affordable power costs for the priority industrial, business and retail sectors. Currently, Bujagali’ s electricity tariff is planned to gradually increase to 14.5 US cents by 2023 due to the debt amortization in the short term and the end of the tax ‘holiday’ (accelerated depreciation), before decreasing to 7 US cents/kWh afterward. This tariff trajectory is, however, considered to be too high for the priority sectors. Mainstreaming of Cross-Cutting Issues: 54. Gender and Youth: To ensure greater inclusivity, Bank interventions in each sector will incorporate gender and youth programs and outcomes. The Bank’s Gender Strategy and Jobs for Youth Strategy will guide the choice and structuring of programs and target outcomes in each sector to maximize development impact. Potential programs will, thus, include the ENABLE Youth Program, Rural Microenterprise Flagship Program, and Skills enhancement zone Flagship Programs. 55. Governance: To improve public sector management effectiveness and governance, the Bank will focus its interventions on the weakest links, namely, policy implementation gaps, institutional and human capacity deficiencies, weak governance and corruption. Firstly, the Bank will conduct regular project supervision missions to assist the government implementing agencies and their PIUs implement CPPRs recommendations for improving portfolio performance. Second, the Bank will proactively provide capacity building training, technical assistance, and advisory services to address identified policy implementation gaps. Third, weak governance and corruption will be dealt with by ensuring that Bank fiduciary, procurement, and disbursement policies and guidelines are complied with in all Bank-funded programs and projects. Fourth, the Bank will proactively pursue dialogue and advocacy activities with key authorities, DPs, and stakeholders to ensure effective delivery of commitments agreed upon with GoU on measures to be implemented to redress identified public sector management and governance challenges. PILLAR 2: Skills and Capacity Development 56. Pillar 2 Objective: The overarching objective of this pillar is to contribute towards developing a knowledgeable and analytically productive population, across all sectors of the society, with relevant job and business skills that will lead to increased employability and entrepreneurship and, hence, inclusive and green economic growth. To achieve this objective, Pillar 2 programs will focus on Vocational Education and Training, namely on business and vocational training institutions and graduates re-skilling programs. Vocational Education and Training (VET) Objectives, Outcomes, and Programs:
57. Objectives: VET programs will aim at boosting vocational and technical skills for the
youth and women to enable them to capitalize on emerging formal employment and business
opportunities in the priority economic sectors. The ultimate goal will be to enhance formal
employment and entrepreneurial business opportunities for the youth and women.
17
58. Outcomes: Target intermediate outcomes are: (i) increase in gross vocational education from
60,000 in 2015 to about 160,000 of whom 27% should women in 2021; (ii) increase in formal and
informal employment of more than 100,000 of primary and secondary education graduates accessing
formal and informal employment; (iii) Enhancement of secondary education curriculum with technology
and business skills; (iv) enhancement of skills in advanced research in science and technology, and; (v)
increase in number of women and youth entrepreneurs.
59. Programs: VET interventions will be implemented through the flagship Support to Youths Skills for Employability and Enhancement of Technology in Secondary Education and Support to Technology and Vocational Training Programs. The programs comprise the following main components: (i) expansion of skills training facilities, including technology institutes and centres in rural districts, and programs for formal and non-formal skills training at different levels; (ii) skilling and re-tooling program for graduates across the country, and; (iii) post-training support, including entrepreneurship and business development services. To ensure creation of sustainable employment and business opportunities for the targeted beneficiaries, the various programs will be coupled with appropriate internships and vocational jobs, and entrepreneurship flagship programs under the Bank’s Jobs for Youth in Africa and Gender Strategies. In addition, to guarantee effective delivery of impact on the ground, program designs will be informed by appropriate technical assistance, advisory and knowledge works. Mainstreaming of Cross -Cutting Issues: 60. Gender and Youth: The VET target objectives, outcomes, and programs, as indicated in the forgoing sections, are designed to directly empower women and youths to enable these underserved sectors them capitalize on the Government’s economic development programs. 61. Governance: To improve public sector management effectiveness and governance in the VET programs, the Bank will adopt the same programmatic approach as under the infrastructure programs indicated in paragraph 58. 62. Contribution to the High-5s: Bank programs under the two pillars will, both directly and indirectly, significantly contribute to promoting the High-5s. Annex 18 summarizes the expected programs’ contribution to the High-5s.
4.3 Bank Group Indicative Lending Program 63. The Indicative Lending Program for the CSP 2017-2021 (See Annex I) was discussed and agreed with GoU during the CSP preparation mission in April 2016. The Program comprises infrastructure, skills and capacity development support, private sector, and regional operations. The Bank, in consultation with GoU, will jointly assess the lending program at the mid-term review with a view to make any necessary adjustments to the strategic pillars and programs. 4.4 Non-Lending Activities 64. The Bank will also continue to support Uganda through demand-driven non-lending (both investment-linked and stand-alone) activities that will include technical assistance (TA), advisory services (AS), and various Economic Sector Works (ESWs). TAs and AS will target strengthening institutional capacity with initial emphasis on domestic resource mobilization, investment management, compliance with Bank operational procedures (specifically, fiduciary, procurement, disbursement, public financial management, and governance requirements), and results-based management. ESWs will fill knowledge gaps with respect to the country’s progress towards attaining High-5s and major challenges faced and opportunities. Findings of ESWs will also be used to inform design of new projects or adjustments to be made
18
to existing ones to more effectively facilitate the country’s progress towards its development objectives and the High-5s goals. The indicative pipeline of all non-lending activities to be financed from trust funds is presented in Annex 2. 4.5 Financing the CSP 65. CSP 2017-21 programs will be financed with both Bank and external resources. Bank funds will include concessional (ADF 14) and non- concessional (ADB) resources. ADF 14 funds will finance Pillar1 (transport, agriculture, water and sanitation and energy) and Pillar 2 (skills and capacity development) operations (see Annex 1). Uganda’s ADF-14 allocation amounts to UA 155 million for the 3-year cycle covering 2017-2019 of the CSP 2017-2021 period. The country also has access to the ADB sovereign window on a case-by-case basis, from which the Bank will support the country’s PPP projects, as well as private sector activities in agriculture and manufacturing. Additional funds will be mobilized through the Bank’s RISP for Eastern Africa (2017-21), to support multinational operations highlighted in the indicative lending program. Potential non-concessional sources, accessible through the Bank, include the Africa Growing Together Fund and Africa50. Potential external funding sources include funds to be mobilised through PPPs projects, co-financing and parallel financing with third-party DPs such as the WB, EU and JICA. Funding for non-lending programs will be also mobilized through the various trust funds managed by the Bank. 66. In light of the reduced new CSP funding resources, and taking advantage of Uganda’s favorable credit rating, the Bank will also actively consider issuing project-based local currency bonds to leverage the domestic capital market. For instance, the Bank will consider partly financing the Kampala- Jinja Expressway project through issuing a local currency bond equivalent to USD$100m (the estimated project cost) to institutional investors such as the National Social Security Fund (NSSF) as the anchor investor and other institutional investors towards the project’s local currency tranche. Such project financing transactions will have the added benefit of crowding in private equity capital into infrastructure projects and also deepening the local capital market. 4.6 CSP Monitoring and Evaluation 67. The system for monitoring and evaluating implementation progress and performance results of the new CSP will be based on the Results Measurement Framework (RMF) presented in Annex 3. The RMF is anchored on the Uganda national monitoring and evaluation system. Reporting on the CSP’s implementation status and results will be undertaken in collaboration with the Ministry of Finance and Economic development (MFNP) and through regular meetings between the Bank, MFNP and PIUs. To facilitate results measurement, disaggregated data on key cross-cutting areas addressed by the CSP 2017-21, such as gender, youth employment, climate change and green growth will be incorporated in all Bank Group operations and reflected in the RMF. This may be adjusted at the CSP Mid-Term Review expected in 2019, to ensure that CSP programs results are achieved at completion. 4.7 Country Dialogue 68. The Bank will continue to actively dialogue with GoU and key stakeholders on issues critical for achieving the CSP 2017-21 and NDPII objectives. Country dialogue will focus on approaches to tackling Uganda’s structural problems to accelerating its economic transformation through the targeted economic sectors and capacity and skills development. However, dialogue will prioritize portfolio implementation, policy, institutional, and regulatory issues affecting the business climate of targeted sectors. The Bank will also use its
19
position as leading Local Development Partners Group (LDPG) member, education sector chair, and member of several other Sector Working Groups (See Annex 5 and 6) to actively advocate for other cross-cutting issues including governance enhancement, approaches to promoting inclusiveness through youth employment initiatives and mainstreaming gender promotion, in Government policies and throughout all Bank supported operations. 4.8 Risk and Mitigation Measures 69. Near-term downside high risks to the successful implementation and achievement of the new CSP objectives and outcomes continue to be external economic head-winds, domestic macroeconomic, natural, regional fragility related geopolitical and security spill over shocks, and public sector capacity deficiencies. Major global economic headwinds include low demand for exports from China and Europe on account of their declining and sluggish economic growth rates, respectively (which may be further aggravated by spill-over effects of BREXIT and growing anti-globalization sentiments in the US and EU). Others are rising global interest rates and investment capital outflows due to the tightening of international financial conditions and foreign investors’ portfolio adjustments and de-risking behavior. Natural environmental shocks include climate-change related adverse effects of droughts on the country’s underdeveloped agricultural sector. Potential downside domestic macroeconomic stability risks include a sharp depreciation of the Shilling against major currencies and its inflationary and high interest rate impacts; sharp increases in fiscal and current account deficits in the event that global economic head winds and other risks crystalize and public policy response (in terms of fiscal and financial management policies, among others is weak, and; sharp declines in investments, productions, and real GDP growth in response to the other macroeconomic shocks. 70. To effectively manage the global and domestic economic and natural risks, GoU needs to implement strategies and policies for transforming the Ugandan economy consistent with its Vision 2040 and NDPII. In this context, Government needs to implement strategies and policies that should be targeted at capitalizing on the country’s opportunities and tackling key structural challenges. Regarding the challenges, GoU needs to reverse the declining trend in TFP contribution to GDP growth, promote greater industrialization, international (regional as well as global) trade, commercialization of agriculture, private sector development (particularly MSME development), financial sector deepening, and strengthen public institutions capacity (including public delivery of social services, governance, public financial management, and public investment management). The Bank will assist GoU in mitigating the above risks through its planned support programs. 71. Geopolitical risks include adverse spill-over economic and social effects of political instability in Uganda’s fragile neighbors, particularly, South Sudan, Burundi and Democratic Republic of Congo. Potential high risks here include a reduction in regional export revenues, especially tourism revenues and private investment capital flows, and increases in fiscal budget pressures to accommodate refugee and humanitarian crises and counter terrorism and crime. GoU is actively managing these risks through active participation in the IGAD peace initiative; Peace building operations in South Sudan, Somalia, and the Central African Republic and; Providing humanitarian emergence and defense support. The Bank will support the management of geopolitical risks through its new CSP interventions and also country and regional strategies and programs in the neighboring fragile states. 72. Significant public sector capacity risks include institutional weaknesses in following and implementing policy guidelines, systems, and processes, institutional and human capacity deficiencies, and weak governance and corruption. Measures to mitigate public sector risks will include: Regular supervision missions to assist PIUs in implementing
20
CPPR recommendations; Technical assistance and capacity building services to address policy implementation gaps; Strict monitoring of programs to ensure compliance with Bank fiduciary, procurement, and disbursement guidelines, and; Proactive dialogue with GoU to ensure effective delivery of commitments. In addition, to ensure their robustness, each of the risk remedies will be informed by relevant analytical works. V. CONCLUSION AND RECOMMENDATIONS
73. GoU has over the post conflict period achieved high economic growth, which has enabled Uganda to substantially reduce its poverty levels. However, the country still faces serious development challenges. These include rising income inequalities (across gender, age groups, and regions) and various structural problems, key among which are high population growth and unemployment rates, low level of industrialization, and declining total factor productivity.The Uganda CSP 2017-21 proposes two strategic pillars, namely, infrastructure development with a focus on transport, agriculture, water and sanitation, and energy sub-sectors, and skills and capacity development to support the Government’s Vision 2040 and NDPII economic transformation agenda. The Boards of Directors are invited to consider and approve the proposed Uganda CSP 2017-2021.
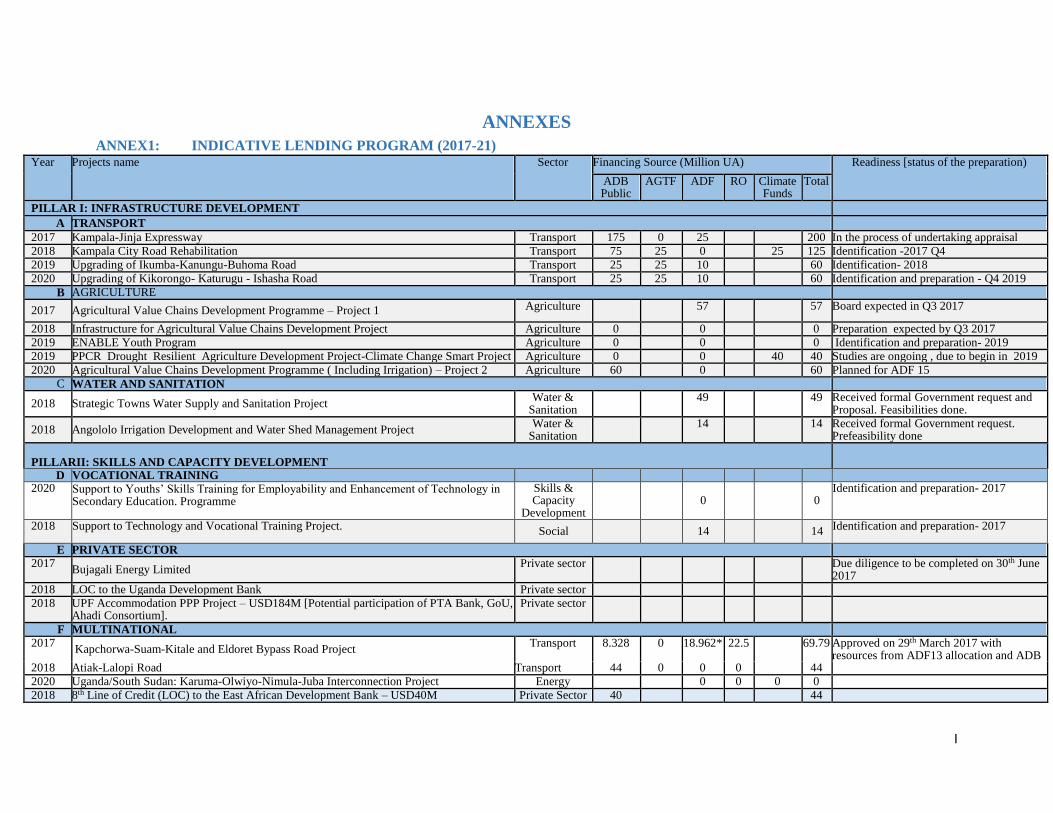
I
ANNEXES
ANNEX1: INDICATIVE LENDING PROGRAM (2017-21) Year Projects name Sector Financing Source (Million UA) Readiness [status of the preparation)
ADB Public
AGTF ADF RO Climate Funds
Total
PILLAR I: INFRASTRUCTURE DEVELOPMENT
A TRANSPORT
2017 Kampala-Jinja Expressway Transport 175 0 25 200 In the process of undertaking appraisal
2018 Kampala City Road Rehabilitation Transport 75 25 0 25 125 Identification -2017 Q4
2019 Upgrading of Ikumba-Kanungu-Buhoma Road Transport 25 25 10 60 Identification- 2018
2020 Upgrading of Kikorongo- Katurugu - Ishasha Road Transport 25 25 10 60 Identification and preparation - Q4 2019
B AGRICULTURE
2017 Agricultural Value Chains Development Programme – Project 1 Agriculture 57 57 Board expected in Q3 2017
2018 Infrastructure for Agricultural Value Chains Development Project Agriculture 0 0 0 Preparation expected by Q3 2017
2019 ENABLE Youth Program Agriculture 0 0 0 Identification and preparation- 2019
2019 PPCR Drought Resilient Agriculture Development Project-Climate Change Smart Project Agriculture 0 0 40 40 Studies are ongoing , due to begin in 2019
2020 Agricultural Value Chains Development Programme ( Including Irrigation) – Project 2 Agriculture 60 0 60 Planned for ADF 15
C WATER AND SANITATION
2018 Strategic Towns Water Supply and Sanitation Project Water &
Sanitation 49 49 Received formal Government request and
Proposal. Feasibilities done.
2018 Angololo Irrigation Development and Water Shed Management Project Water &
Sanitation 14 14 Received formal Government request.
Prefeasibility done
PILLARII: SKILLS AND CAPACITY DEVELOPMENT
D VOCATIONAL TRAINING 2020 Support to Youths’ Skills Training for Employability and Enhancement of Technology in
Secondary Education. Programme Skills & Capacity
Development 0 0
Identification and preparation- 2017
2018 Support to Technology and Vocational Training Project. Social 14 14 Identification and preparation- 2017
E PRIVATE SECTOR
2017 Bujagali Energy Limited
Private sector Due diligence to be completed on 30th June 2017
2018 LOC to the Uganda Development Bank Private sector
2018 UPF Accommodation PPP Project – USD184M [Potential participation of PTA Bank, GoU, Ahadi Consortium].
Private sector
F MULTINATIONAL
2017 Kapchorwa-Suam-Kitale and Eldoret Bypass Road Project
Transport 8.328 0 18.962* 22.5 69.79 Approved on 29th March 2017 with resources from ADF13 allocation and ADB
2018 Atiak-Lalopi Road Transport 44 0 0 0 44
2020 Uganda/South Sudan: Karuma-Olwiyo-Nimula-Juba Interconnection Project Energy 0 0 0 0
2018 8th Line of Credit (LOC) to the East African Development Bank – USD40M Private Sector 40 44
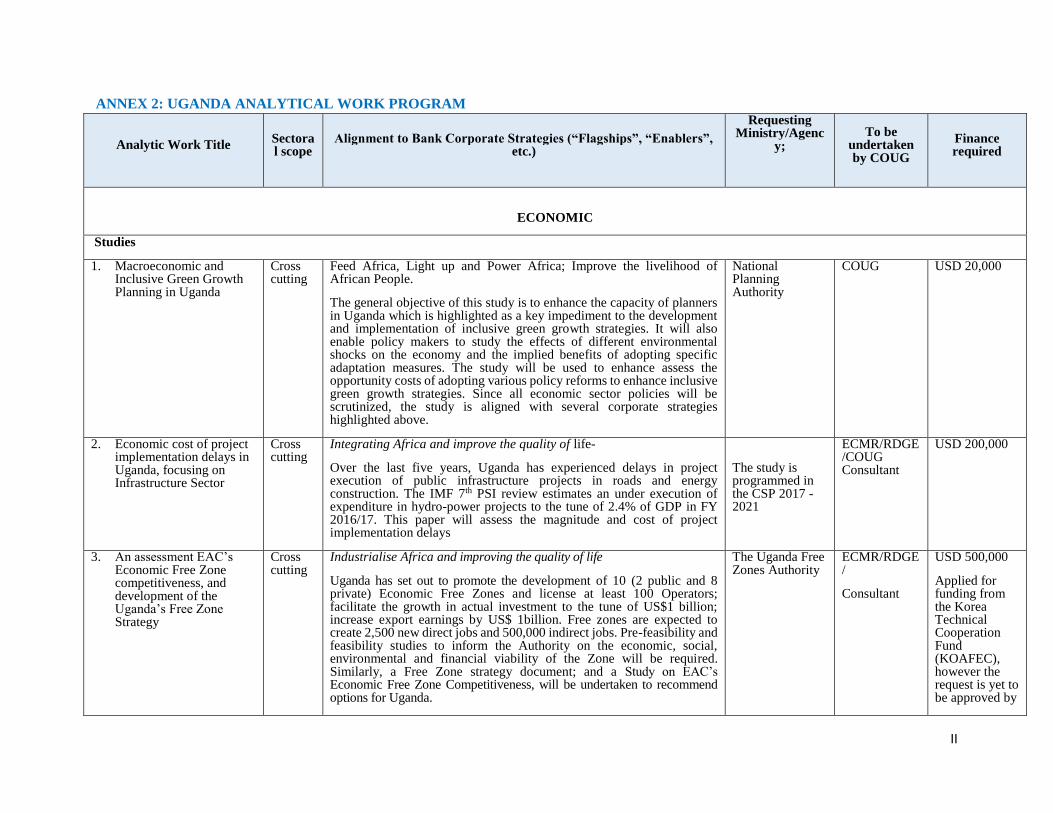
II
ANNEX 2: UGANDA ANALYTICAL WORK PROGRAM
Analytic Work Title
Sectoral scope
Alignment to Bank Corporate Strategies (“Flagships”, “Enablers”, etc.)
Requesting Ministry/Agenc
y;
To be undertaken by COUG
Finance required
ECONOMIC
Studies
1. Macroeconomic and Inclusive Green Growth Planning in Uganda
Cross cutting
Feed Africa, Light up and Power Africa; Improve the livelihood of African People.
The general objective of this study is to enhance the capacity of planners in Uganda which is highlighted as a key impediment to the development and implementation of inclusive green growth strategies. It will also enable policy makers to study the effects of different environmental shocks on the economy and the implied benefits of adopting specific adaptation measures. The study will be used to enhance assess the opportunity costs of adopting various policy reforms to enhance inclusive green growth strategies. Since all economic sector policies will be scrutinized, the study is aligned with several corporate strategies highlighted above.
National Planning Authority
COUG USD 20,000
2. Economic cost of project implementation delays in Uganda, focusing on Infrastructure Sector
Cross cutting
Integrating Africa and improve the quality of life-
Over the last five years, Uganda has experienced delays in project execution of public infrastructure projects in roads and energy construction. The IMF 7th PSI review estimates an under execution of expenditure in hydro-power projects to the tune of 2.4% of GDP in FY 2016/17. This paper will assess the magnitude and cost of project implementation delays
The study is programmed in the CSP 2017 - 2021
ECMR/RDGE/COUG Consultant
USD 200,000
3. An assessment EAC’s Economic Free Zone competitiveness, and development of the Uganda’s Free Zone Strategy
Cross cutting
Industrialise Africa and improving the quality of life
Uganda has set out to promote the development of 10 (2 public and 8 private) Economic Free Zones and license at least 100 Operators; facilitate the growth in actual investment to the tune of US$1 billion; increase export earnings by US$ 1billion. Free zones are expected to create 2,500 new direct jobs and 500,000 indirect jobs. Pre-feasibility and feasibility studies to inform the Authority on the economic, social, environmental and financial viability of the Zone will be required. Similarly, a Free Zone strategy document; and a Study on EAC’s Economic Free Zone Competitiveness, will be undertaken to recommend options for Uganda.
The Uganda Free Zones Authority
ECMR/RDGE/
Consultant
USD 500,000
Applied for funding from the Korea Technical Cooperation Fund (KOAFEC), however the request is yet to be approved by
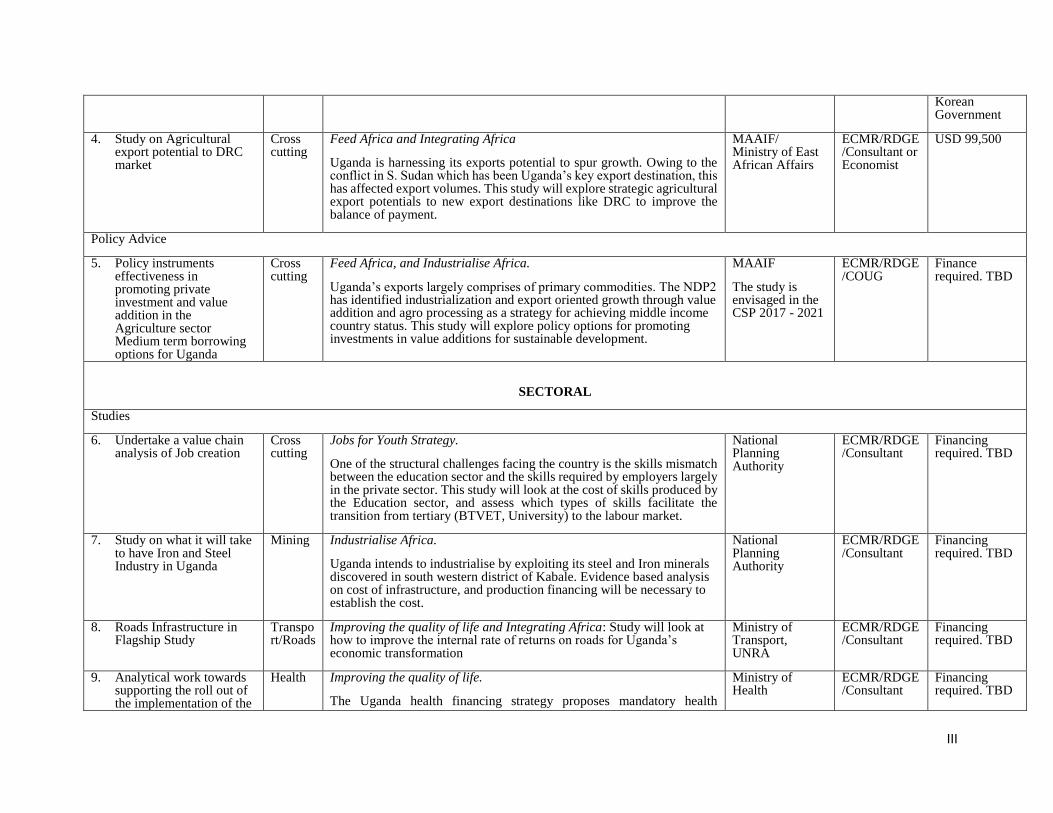
III
Korean Government
4. Study on Agricultural export potential to DRC market
Cross cutting
Feed Africa and Integrating Africa
Uganda is harnessing its exports potential to spur growth. Owing to the conflict in S. Sudan which has been Uganda’s key export destination, this has affected export volumes. This study will explore strategic agricultural export potentials to new export destinations like DRC to improve the balance of payment.
MAAIF/ Ministry of East African Affairs
ECMR/RDGE/Consultant or Economist
USD 99,500
Policy Advice
5. Policy instruments effectiveness in promoting private investment and value addition in the Agriculture sector Medium term borrowing options for Uganda
Cross cutting
Feed Africa, and Industrialise Africa.
Uganda’s exports largely comprises of primary commodities. The NDP2 has identified industrialization and export oriented growth through value addition and agro processing as a strategy for achieving middle income country status. This study will explore policy options for promoting investments in value additions for sustainable development.
MAAIF
The study is envisaged in the CSP 2017 - 2021
ECMR/RDGE/COUG
Finance required. TBD
SECTORAL
Studies
6. Undertake a value chain analysis of Job creation
Cross cutting
Jobs for Youth Strategy.
One of the structural challenges facing the country is the skills mismatch between the education sector and the skills required by employers largely in the private sector. This study will look at the cost of skills produced by the Education sector, and assess which types of skills facilitate the transition from tertiary (BTVET, University) to the labour market.
National Planning Authority
ECMR/RDGE/Consultant
Financing required. TBD
7. Study on what it will take to have Iron and Steel Industry in Uganda
Mining Industrialise Africa.
Uganda intends to industrialise by exploiting its steel and Iron minerals discovered in south western district of Kabale. Evidence based analysis on cost of infrastructure, and production financing will be necessary to establish the cost.
National Planning Authority
ECMR/RDGE/Consultant
Financing required. TBD
8. Roads Infrastructure in Flagship Study
Transport/Roads
Improving the quality of life and Integrating Africa: Study will look at how to improve the internal rate of returns on roads for Uganda’s economic transformation
Ministry of Transport, UNRA
ECMR/RDGE/Consultant
Financing required. TBD
9. Analytical work towards supporting the roll out of the implementation of the
Health Improving the quality of life.
The Uganda health financing strategy proposes mandatory health
Ministry of Health
ECMR/RDGE/Consultant
Financing required. TBD
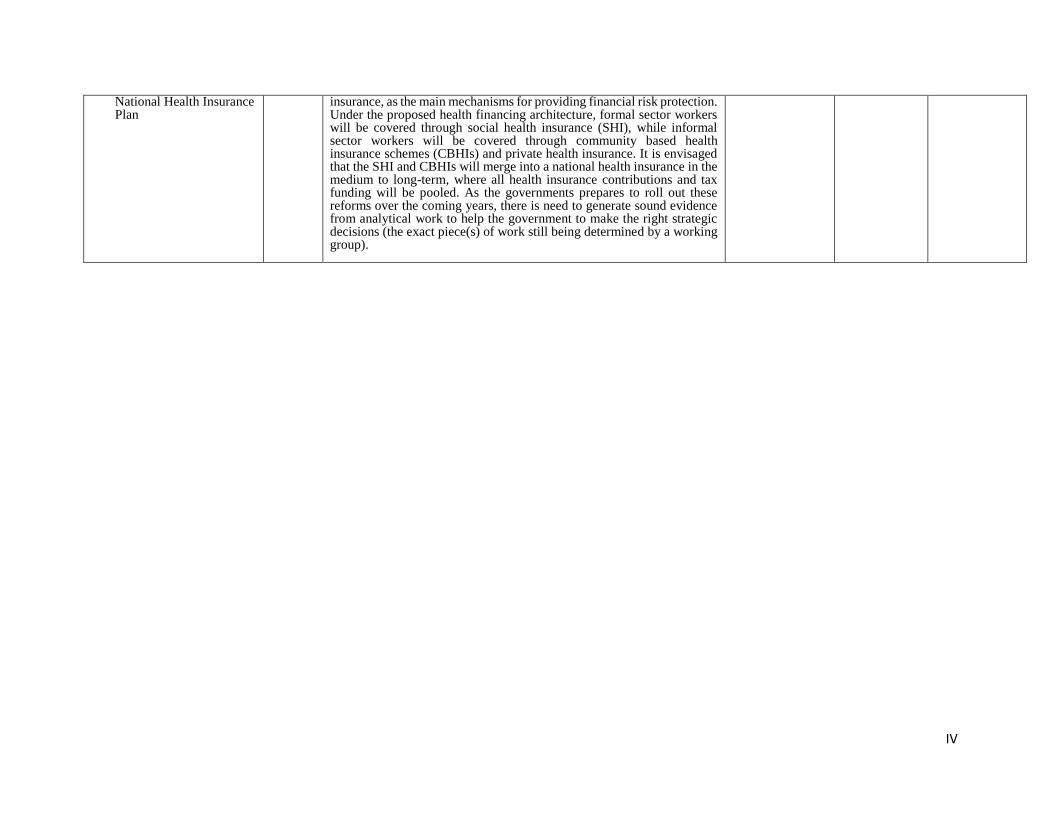
IV
National Health Insurance Plan
insurance, as the main mechanisms for providing financial risk protection. Under the proposed health financing architecture, formal sector workers will be covered through social health insurance (SHI), while informal sector workers will be covered through community based health insurance schemes (CBHIs) and private health insurance. It is envisaged that the SHI and CBHIs will merge into a national health insurance in the medium to long-term, where all health insurance contributions and tax funding will be pooled. As the governments prepares to roll out these reforms over the coming years, there is need to generate sound evidence from analytical work to help the government to make the right strategic decisions (the exact piece(s) of work still being determined by a working group).
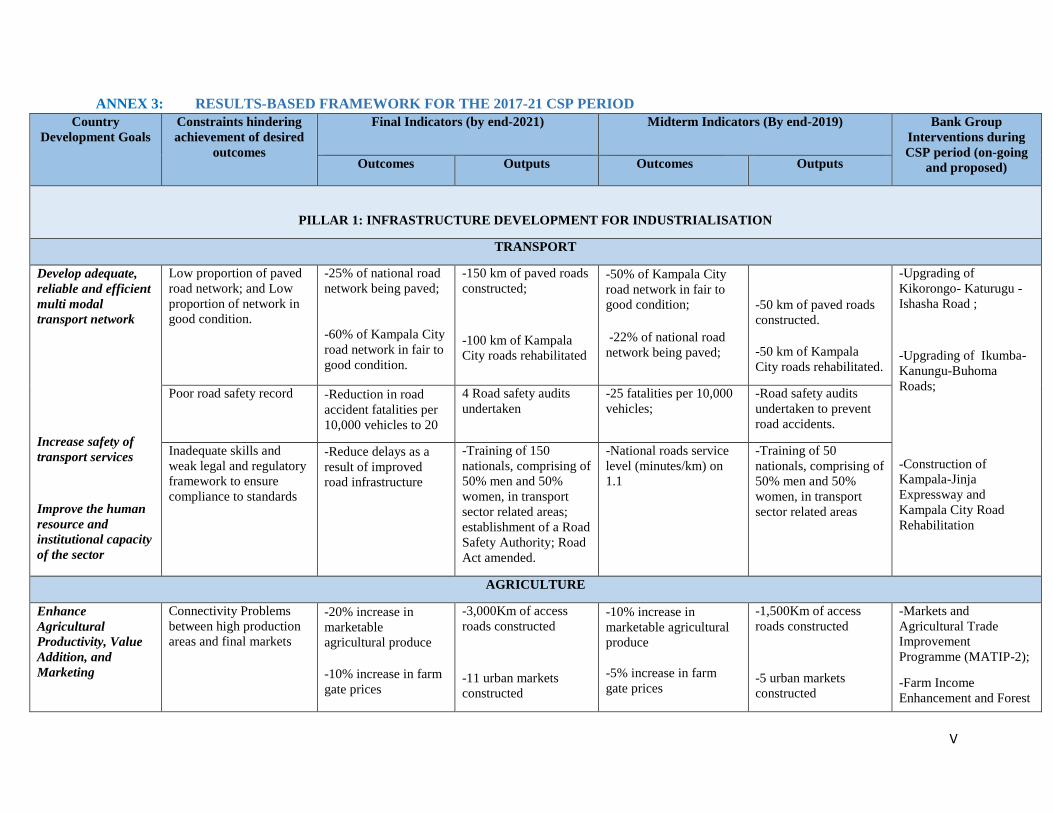
V
ANNEX 3: RESULTS-BASED FRAMEWORK FOR THE 2017-21 CSP PERIOD
Country
Development Goals
Constraints hindering
achievement of desired
outcomes
Final Indicators (by end-2021)
Midterm Indicators (By end-2019) Bank Group
Interventions during
CSP period (on-going
and proposed) Outcomes Outputs Outcomes
Outputs
PILLAR 1: INFRASTRUCTURE DEVELOPMENT FOR INDUSTRIALISATION
TRANSPORT
Develop adequate,
reliable and efficient
multi modal
transport network
Increase safety of
transport services
Improve the human
resource and
institutional capacity
of the sector
Low proportion of paved
road network; and Low
proportion of network in
good condition.
-25% of national road
network being paved;
-60% of Kampala City
road network in fair to
good condition.
-150 km of paved roads
constructed;
-100 km of Kampala
City roads rehabilitated
-50% of Kampala City
road network in fair to
good condition;
-22% of national road
network being paved;
-50 km of paved roads
constructed.
-50 km of Kampala
City roads rehabilitated.
-Upgrading of
Kikorongo- Katurugu -
Ishasha Road ;
-Upgrading of Ikumba-
Kanungu-Buhoma
Roads;
-Construction of
Kampala-Jinja
Expressway and
Kampala City Road
Rehabilitation
Poor road safety record -Reduction in road
accident fatalities per
10,000 vehicles to 20
4 Road safety audits
undertaken
-25 fatalities per 10,000
vehicles;
-Road safety audits
undertaken to prevent
road accidents.
Inadequate skills and
weak legal and regulatory
framework to ensure
compliance to standards
-Reduce delays as a
result of improved
road infrastructure
-Training of 150
nationals, comprising of
50% men and 50%
women, in transport
sector related areas;
establishment of a Road
Safety Authority; Road
Act amended.
-National roads service
level (minutes/km) on
1.1
-Training of 50
nationals, comprising of
50% men and 50%
women, in transport
sector related areas
AGRICULTURE
Enhance
Agricultural
Productivity, Value
Addition, and
Marketing
Connectivity Problems
between high production
areas and final markets
-20% increase in
marketable
agricultural produce
-10% increase in farm
gate prices
-3,000Km of access
roads constructed
-11 urban markets
constructed
-10% increase in
marketable agricultural
produce
-5% increase in farm
gate prices
-1,500Km of access
roads constructed
-5 urban markets
constructed
-Markets and
Agricultural Trade
Improvement
Programme (MATIP-2);
-Farm Income
Enhancement and Forest

VI
Country
Development Goals
Constraints hindering
achievement of desired
outcomes
Final Indicators (by end-2021)
Midterm Indicators (By end-2019) Bank Group
Interventions during
CSP period (on-going
and proposed) Outcomes Outputs Outcomes
Outputs
-Dependency on Rain Fed
Agriculture
20% increase in rice
and Maize production
-5 large scale irrigation
schemes constructed
-10% increase in rice and
Maize production
-2 large scale irrigation
schemes constructed
Conservation
Programme (FIEFOC-2);
-Agricultural Value
Chains Development
Programme 1&2;
-Community
Agricultural
Infrastructure
Improvement
Programme (CAIIP-3) ;
-Climate Change Smart
Agricultural Project.
- ENABLE Youth
Program.
-Limited availability of
improved farm inputs. Increase the
percentage of farmers
accessing input, and
ultimately increasing
yield
-No. of farmers (50%
Women) accessing
improved farm inputs
(seed and fertiliser)
-A reliable input delivery
system established and
functional
-No. of farmers (50%
Women) accessing
improved farm inputs
(seed and fertiliser)
-Limited Access to
Agricultural Finance 30% increase in
commercial funds
available for Agric
lending
-No. of farmers and
value chain operators
(50% women)
accessing agricultural
loans
-15% increase in
commercial funds
available for Agric.
lending
-No. of farmers and
value chain operators
(50% women)
accessing agricultural
loans
-Limited Value Addition,
lack of storage facilities,
and weak regulatory
services.
20% increase in
businesses in the
agricultural value
chain.
-No. of Businesses in
the agricultural value
chain.
-10% increase in
businesses in the
agricultural value chain.
-No. of Businesses in
the agricultural value
chain.
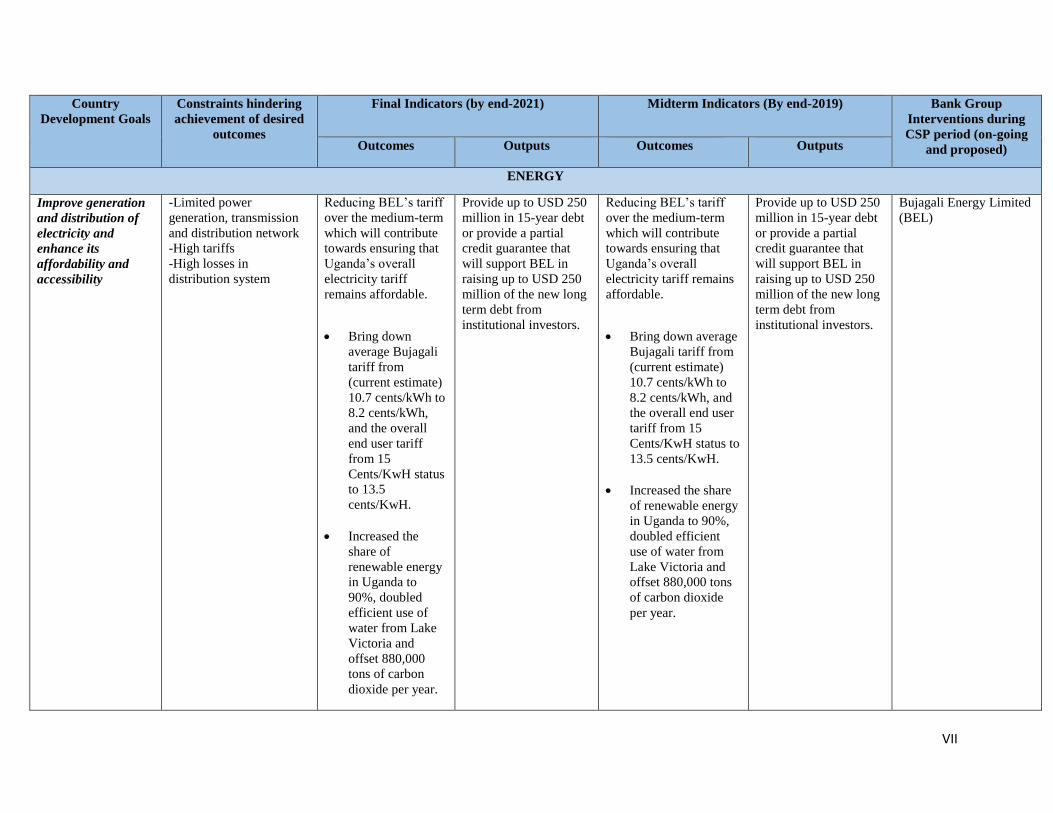
VII
Country
Development Goals
Constraints hindering
achievement of desired
outcomes
Final Indicators (by end-2021)
Midterm Indicators (By end-2019) Bank Group
Interventions during
CSP period (on-going
and proposed) Outcomes Outputs Outcomes
Outputs
ENERGY
Improve generation
and distribution of
electricity and
enhance its
affordability and
accessibility
-Limited power
generation, transmission
and distribution network
-High tariffs
-High losses in
distribution system
Reducing BEL’s tariff
over the medium-term
which will contribute
towards ensuring that
Uganda’s overall
electricity tariff
remains affordable.
Bring down
average Bujagali
tariff from
(current estimate)
10.7 cents/kWh to
8.2 cents/kWh,
and the overall
end user tariff
from 15
Cents/KwH status
to 13.5
cents/KwH.
Increased the
share of
renewable energy
in Uganda to
90%, doubled
efficient use of
water from Lake
Victoria and
offset 880,000
tons of carbon
dioxide per year.
Provide up to USD 250
million in 15-year debt
or provide a partial
credit guarantee that
will support BEL in
raising up to USD 250
million of the new long
term debt from
institutional investors.
Reducing BEL’s tariff
over the medium-term
which will contribute
towards ensuring that
Uganda’s overall
electricity tariff remains
affordable.
Bring down average
Bujagali tariff from
(current estimate)
10.7 cents/kWh to
8.2 cents/kWh, and
the overall end user
tariff from 15
Cents/KwH status to
13.5 cents/KwH.
Increased the share
of renewable energy
in Uganda to 90%,
doubled efficient
use of water from
Lake Victoria and
offset 880,000 tons
of carbon dioxide
per year.
Provide up to USD 250
million in 15-year debt
or provide a partial
credit guarantee that
will support BEL in
raising up to USD 250
million of the new long
term debt from
institutional investors.
Bujagali Energy Limited
(BEL)
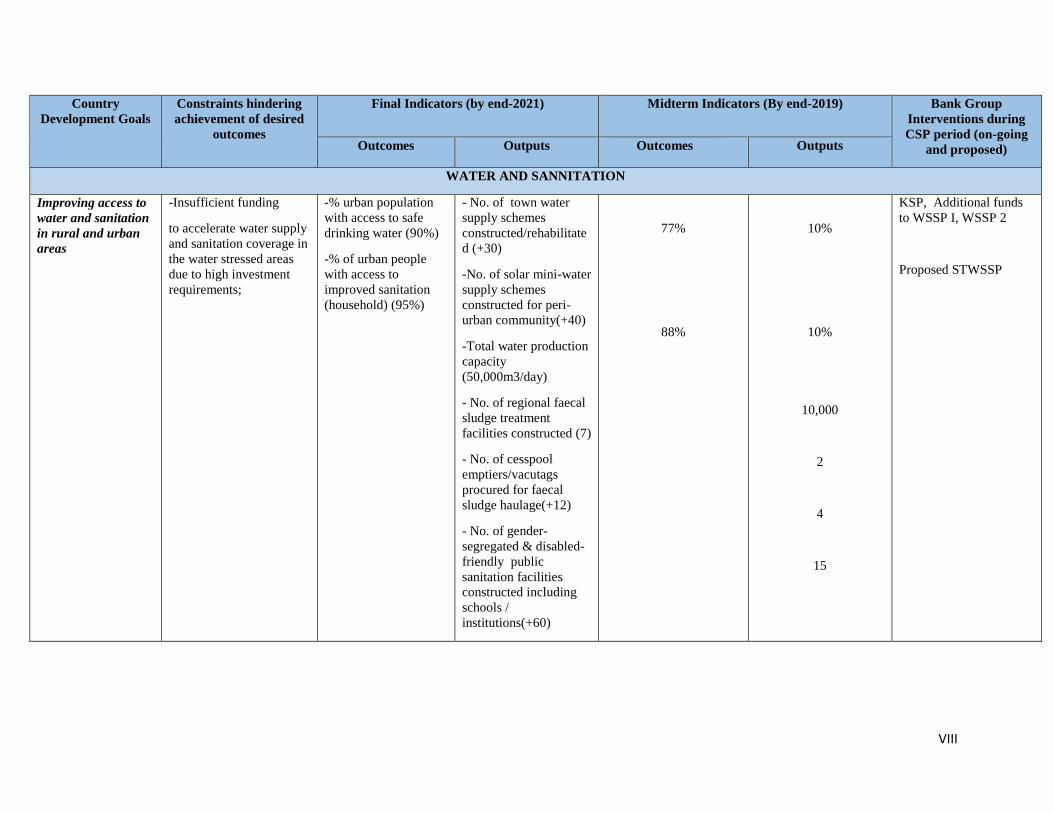
VIII
Country
Development Goals
Constraints hindering
achievement of desired
outcomes
Final Indicators (by end-2021)
Midterm Indicators (By end-2019) Bank Group
Interventions during
CSP period (on-going
and proposed) Outcomes Outputs Outcomes
Outputs
WATER AND SANNITATION
Improving access to
water and sanitation
in rural and urban
areas
-Insufficient funding
to accelerate water supply
and sanitation coverage in
the water stressed areas
due to high investment
requirements;
-% urban population
with access to safe
drinking water (90%)
-% of urban people
with access to
improved sanitation
(household) (95%)
- No. of town water
supply schemes
constructed/rehabilitate
d (+30)
-No. of solar mini-water
supply schemes
constructed for peri-
urban community(+40)
-Total water production
capacity
(50,000m3/day)
- No. of regional faecal
sludge treatment
facilities constructed (7)
- No. of cesspool
emptiers/vacutags
procured for faecal
sludge haulage(+12)
- No. of gender-
segregated & disabled-
friendly public
sanitation facilities
constructed including
schools /
institutions(+60)
77%
88%
10%
10%
10,000
2
4
15
KSP, Additional funds
to WSSP I, WSSP 2
Proposed STWSSP
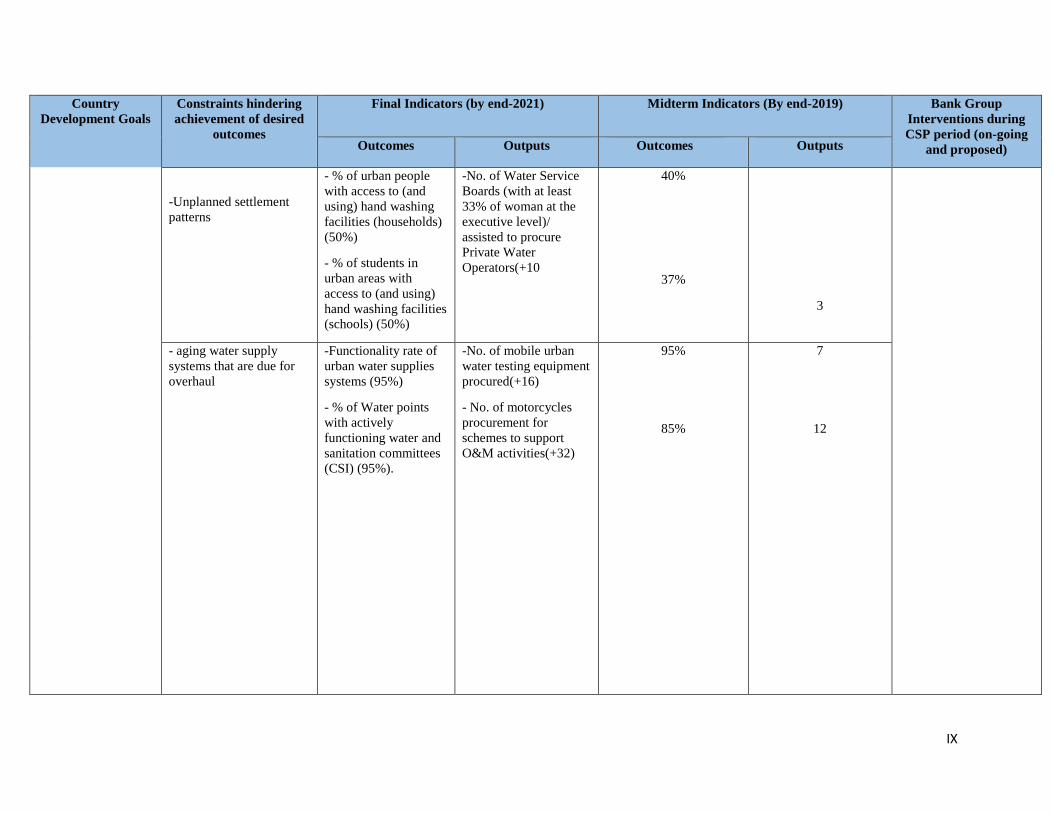
IX
Country
Development Goals
Constraints hindering
achievement of desired
outcomes
Final Indicators (by end-2021)
Midterm Indicators (By end-2019) Bank Group
Interventions during
CSP period (on-going
and proposed) Outcomes Outputs Outcomes
Outputs
-Unplanned settlement
patterns
- % of urban people
with access to (and
using) hand washing
facilities (households)
(50%)
- % of students in
urban areas with
access to (and using)
hand washing facilities
(schools) (50%)
-No. of Water Service
Boards (with at least
33% of woman at the
executive level)/
assisted to procure
Private Water
Operators(+10
40%
37%
3
- aging water supply
systems that are due for
overhaul
-Functionality rate of
urban water supplies
systems (95%)
- % of Water points
with actively
functioning water and
sanitation committees
(CSI) (95%).
-No. of mobile urban
water testing equipment
procured(+16)
- No. of motorcycles
procurement for
schemes to support
O&M activities(+32)
95%
85%
7
12
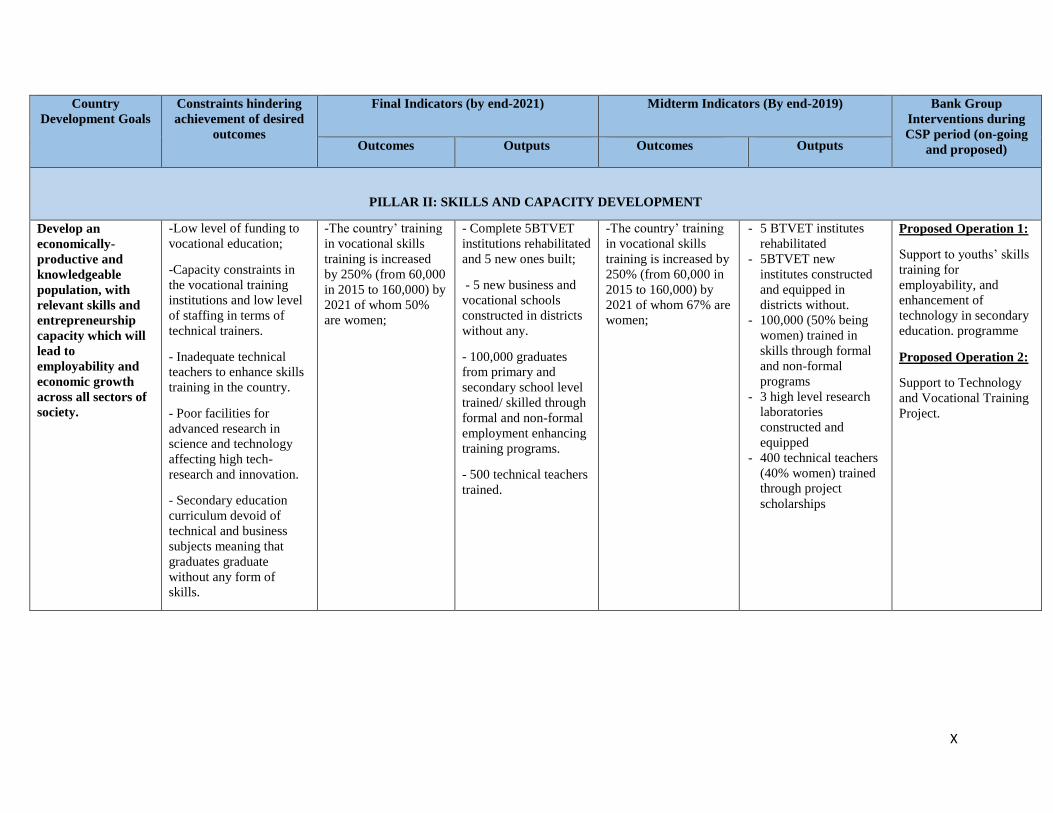
X
Country
Development Goals
Constraints hindering
achievement of desired
outcomes
Final Indicators (by end-2021)
Midterm Indicators (By end-2019) Bank Group
Interventions during
CSP period (on-going
and proposed) Outcomes Outputs Outcomes
Outputs
PILLAR II: SKILLS AND CAPACITY DEVELOPMENT
Develop an
economically-
productive and
knowledgeable
population, with
relevant skills and
entrepreneurship
capacity which will
lead to
employability and
economic growth
across all sectors of
society.
-Low level of funding to
vocational education;
-Capacity constraints in
the vocational training
institutions and low level
of staffing in terms of
technical trainers.
- Inadequate technical
teachers to enhance skills
training in the country.
- Poor facilities for
advanced research in
science and technology
affecting high tech-
research and innovation.
- Secondary education
curriculum devoid of
technical and business
subjects meaning that
graduates graduate
without any form of
skills.
-The country’ training
in vocational skills
training is increased
by 250% (from 60,000
in 2015 to 160,000) by
2021 of whom 50%
are women;
- Complete 5BTVET
institutions rehabilitated
and 5 new ones built;
- 5 new business and
vocational schools
constructed in districts
without any.
- 100,000 graduates
from primary and
secondary school level
trained/ skilled through
formal and non-formal
employment enhancing
training programs.
- 500 technical teachers
trained.
-The country’ training
in vocational skills
training is increased by
250% (from 60,000 in
2015 to 160,000) by
2021 of whom 67% are
women;
- 5 BTVET institutes
rehabilitated
- 5BTVET new
institutes constructed
and equipped in
districts without.
- 100,000 (50% being
women) trained in
skills through formal
and non-formal
programs
- 3 high level research
laboratories
constructed and
equipped
- 400 technical teachers
(40% women) trained
through project
scholarships
Proposed Operation 1:
Support to youths’ skills
training for
employability, and
enhancement of
technology in secondary
education. programme
Proposed Operation 2:
Support to Technology
and Vocational Training
Project.

XI
ANNEX 4: LIST OF KEY STAKEHOLDERS MET DURING THE CSP PREPARATION
MISSION
INSTITUTION NAME/DESIGNATION CONTACT/EMAIL Ministry of Finance, Planning and Economic Development
Mr. Keith Muhakanizi Mr. Patrick Ocailap Mr. Isaac Mpoza Ms. Maris Wanyera Mr. Charles C. Ogol Mr. Geoffrey Turwamuhire Ms. Joy Glessa Mr.Swalleh Senteza- Mr. Lawrence Semakula Mr. Mpoza Issac David Mr. Paulo T. Kyama FINMAP III Esther Akullo
Permanent Secretary Deputy Secretary to the Treasury Acting Director Commissioner- DARC Ag DC-DARC 2 Ag PIE/DARC Senior Economist- Debt Management Department Head of Internal Audit Accountant General Ag. Director Debt and Cash Management Change Management and Communication Specialist Monitoring and Evaluation Officer-FINMAP III-MoF
Bank of Uganda Mr. Louis Kasekende Mr. Edward Tenywa Mr. Martin Brownbridge
Deputy Governor Personal Assistant to Deputy Governor Advisor to Governor
National Planning Authority
Mr. Kabagambe Sufian Dr. Muvawala Joseph Mr. Asumani Guloba Mr. Okitoi Paul Mr. Katungi David Mr. Othieno Odoi Mr. Dhikusooka Gyaviira Mr. Nokrach Chris Otim Mr. Dhizaala S. Moses Dr. Tom Gidudu Mr. Sebukeera Hennery Mr. William Epiaka Mr. Joseph Tenywa
ARO M&E Executive Director Head Research Head Strategic & Economic Planning Senior Planner & Local Gov’t Planning P&T Specialist Specialist M&E Specialist M&E Head M&E Technical Advisor Planner HRP/D M&E Officer Head ICT
Office of the Prime Minister
Mr. Albert Byamugisha Mr. Abdul Muwanika Mr. Lubanga Mr. Samuel Galiwangu
Commissioner, M&E Principal Economist, M&E Assistant Commissioner, M&E Senior Economist
Ministry of Water and Environment
Ms. Florence Grace Adongo Eng. Ephraim Kisembo Eng. Dominic Kavutse Eng. Gilbert Kimanzi Mr. Disan K. Ssozi Dr. Callist Tindimugaya Mr. Samuel Otuba Eng. Ahmed Sentumbe Eng. Arinaitwe Mutahinduka Mr. Alfred O. Okidi Mr. Kasirikale Geoffrey Mr. John Magezi Ndamira Eng. Felix Twinomucunguzi Eng. Christopher Tumusiime Ms. Adata Margret Ms. Phiona Mpanga Mr. Jareth Epitu Mr. Mugabi Stephen David
Director- WRM DWRM/MWE Commissioner WURD/MWE Commissioner DWD/MWE Assistant Commissioner WFP/MWE Commissioner MWE/WESLD Commissioner DWRM/MWE Commissioner Policy Planning MWE Assistant Commissioner RWSSD/MWE SM Projects NWSC AMD-FCS NWSC Manager-Projects NWSC NPC FIEFOC Project MOWE Principal Engineer/ Urban MWE Assistant Commissioner Rural MWE Commissioner Forestry MWE Legal and Policy Consultant MAK Asst. Commissioner Sector Capacity Dev’t MOWE Commissioner-Environment Section Support Services
Ministry of Trade, Industry and Cooperatives
Mr. Joshua Mutambi Mr. C.K Ndorere Mr. Stephen Kamukama Mr. Yudaya Kadondi
Assistant Commissioner Dept. Industry and Technology Principal Commercial Officer Desk Officer, COMESA, Senior Commercial Officer External Trade Department Senior Economist Uganda Development Corporation
The Public Procurement
Mr. Benson Turamye Mr. Cornelia Sabim
Director PM Executive Director
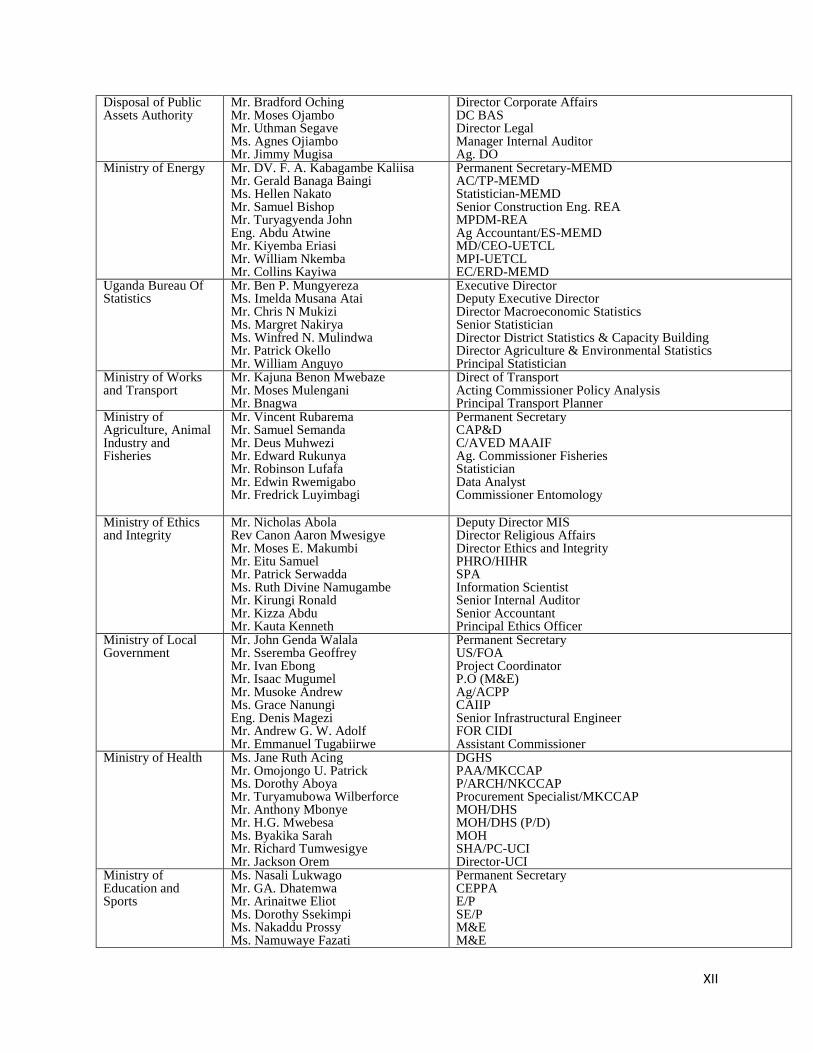
XII
Disposal of Public Assets Authority
Mr. Bradford Oching Mr. Moses Ojambo Mr. Uthman Segave Ms. Agnes Ojiambo Mr. Jimmy Mugisa
Director Corporate Affairs DC BAS Director Legal Manager Internal Auditor Ag. DO
Ministry of Energy Mr. DV. F. A. Kabagambe Kaliisa Mr. Gerald Banaga Baingi Ms. Hellen Nakato Mr. Samuel Bishop Mr. Turyagyenda John Eng. Abdu Atwine Mr. Kiyemba Eriasi Mr. William Nkemba Mr. Collins Kayiwa
Permanent Secretary-MEMD AC/TP-MEMD Statistician-MEMD Senior Construction Eng. REA MPDM-REA Ag Accountant/ES-MEMD MD/CEO-UETCL MPI-UETCL EC/ERD-MEMD
Uganda Bureau Of Statistics
Mr. Ben P. Mungyereza Ms. Imelda Musana Atai Mr. Chris N Mukizi Ms. Margret Nakirya Ms. Winfred N. Mulindwa Mr. Patrick Okello Mr. William Anguyo
Executive Director Deputy Executive Director Director Macroeconomic Statistics Senior Statistician Director District Statistics & Capacity Building Director Agriculture & Environmental Statistics Principal Statistician
Ministry of Works and Transport
Mr. Kajuna Benon Mwebaze Mr. Moses Mulengani Mr. Bnagwa
Direct of Transport Acting Commissioner Policy Analysis Principal Transport Planner
Ministry of Agriculture, Animal Industry and Fisheries
Mr. Vincent Rubarema Mr. Samuel Semanda Mr. Deus Muhwezi Mr. Edward Rukunya Mr. Robinson Lufafa Mr. Edwin Rwemigabo Mr. Fredrick Luyimbagi
Permanent Secretary CAP&D C/AVED MAAIF Ag. Commissioner Fisheries Statistician Data Analyst Commissioner Entomology
Ministry of Ethics and Integrity
Mr. Nicholas Abola Rev Canon Aaron Mwesigye Mr. Moses E. Makumbi Mr. Eitu Samuel Mr. Patrick Serwadda Ms. Ruth Divine Namugambe Mr. Kirungi Ronald Mr. Kizza Abdu Mr. Kauta Kenneth
Deputy Director MIS Director Religious Affairs Director Ethics and Integrity PHRO/HIHR SPA Information Scientist Senior Internal Auditor Senior Accountant Principal Ethics Officer
Ministry of Local Government
Mr. John Genda Walala Mr. Sseremba Geoffrey Mr. Ivan Ebong Mr. Isaac Mugumel Mr. Musoke Andrew Ms. Grace Nanungi Eng. Denis Magezi Mr. Andrew G. W. Adolf Mr. Emmanuel Tugabiirwe
Permanent Secretary US/FOA Project Coordinator P.O (M&E) Ag/ACPP CAIIP Senior Infrastructural Engineer FOR CIDI Assistant Commissioner
Ministry of Health Ms. Jane Ruth Acing Mr. Omojongo U. Patrick Ms. Dorothy Aboya Mr. Turyamubowa Wilberforce Mr. Anthony Mbonye Mr. H.G. Mwebesa Ms. Byakika Sarah Mr. Richard Tumwesigye Mr. Jackson Orem
DGHS PAA/MKCCAP P/ARCH/NKCCAP Procurement Specialist/MKCCAP MOH/DHS MOH/DHS (P/D) MOH SHA/PC-UCI Director-UCI
Ministry of Education and Sports
Ms. Nasali Lukwago Mr. GA. Dhatemwa Mr. Arinaitwe Eliot Ms. Dorothy Ssekimpi Ms. Nakaddu Prossy Ms. Namuwaye Fazati
Permanent Secretary CEPPA E/P SE/P M&E M&E
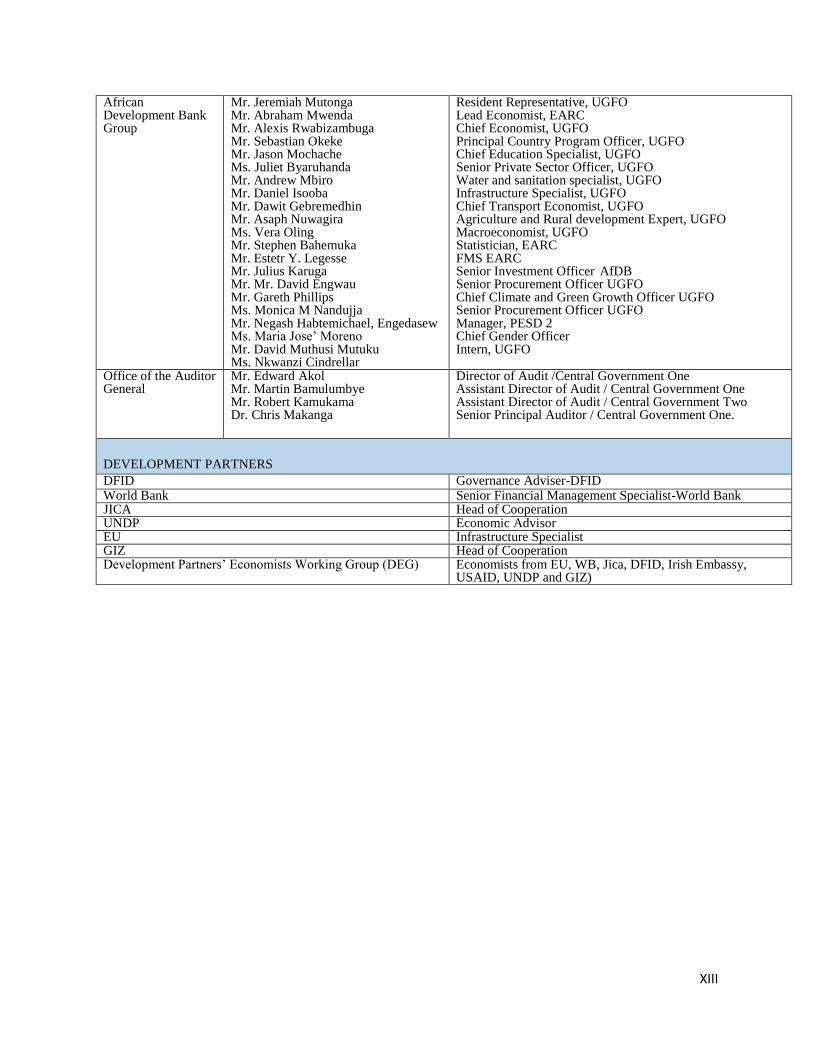
XIII
African Development Bank Group
Mr. Jeremiah Mutonga Mr. Abraham Mwenda Mr. Alexis Rwabizambuga Mr. Sebastian Okeke Mr. Jason Mochache Ms. Juliet Byaruhanda Mr. Andrew Mbiro Mr. Daniel Isooba Mr. Dawit Gebremedhin Mr. Asaph Nuwagira Ms. Vera Oling Mr. Stephen Bahemuka Mr. Estetr Y. Legesse Mr. Julius Karuga Mr. Mr. David Engwau Mr. Gareth Phillips Ms. Monica M Nandujja Mr. Negash Habtemichael, Engedasew Ms. Maria Jose’ Moreno Mr. David Muthusi Mutuku Ms. Nkwanzi Cindrellar
Resident Representative, UGFO Lead Economist, EARC Chief Economist, UGFO Principal Country Program Officer, UGFO Chief Education Specialist, UGFO Senior Private Sector Officer, UGFO Water and sanitation specialist, UGFO Infrastructure Specialist, UGFO Chief Transport Economist, UGFO Agriculture and Rural development Expert, UGFO Macroeconomist, UGFO Statistician, EARC FMS EARC Senior Investment Officer AfDB Senior Procurement Officer UGFO Chief Climate and Green Growth Officer UGFO Senior Procurement Officer UGFO Manager, PESD 2 Chief Gender Officer Intern, UGFO
Office of the Auditor General
Mr. Edward Akol Mr. Martin Bamulumbye Mr. Robert Kamukama Dr. Chris Makanga
Director of Audit /Central Government One Assistant Director of Audit / Central Government One Assistant Director of Audit / Central Government Two Senior Principal Auditor / Central Government One.
DEVELOPMENT PARTNERS
DFID Governance Adviser-DFID World Bank Senior Financial Management Specialist-World Bank JICA Head of Cooperation UNDP Economic Advisor EU Infrastructure Specialist GIZ Head of Cooperation Development Partners’ Economists Working Group (DEG) Economists from EU, WB, Jica, DFID, Irish Embassy,
USAID, UNDP and GIZ)
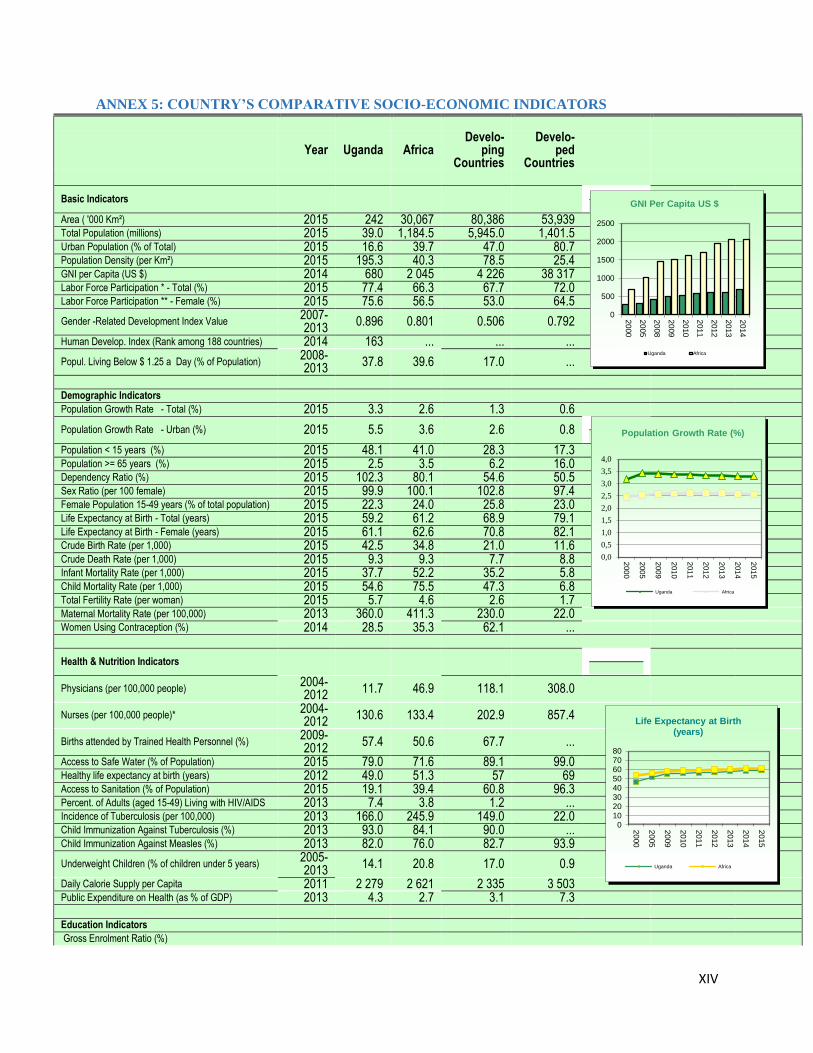
XIV
ANNEX 5: COUNTRY’S COMPARATIVE SOCIO-ECONOMIC INDICATORS
Year Uganda Africa Develo-
ping Countries
Develo- ped
Countries
Basic Indicators
Area ( '000 Km²) 2015 242 30,067 80,386 53,939 Total Population (millions) 2015 39.0 1,184.5 5,945.0 1,401.5 Urban Population (% of Total) 2015 16.6 39.7 47.0 80.7 Population Density (per Km²) 2015 195.3 40.3 78.5 25.4 GNI per Capita (US $) 2014 680 2 045 4 226 38 317 Labor Force Participation * - Total (%) 2015 77.4 66.3 67.7 72.0 Labor Force Participation ** - Female (%) 2015 75.6 56.5 53.0 64.5
Gender -Related Development Index Value 2007-2013
0.896 0.801 0.506 0.792
Human Develop. Index (Rank among 188 countries) 2014 163 ... ... ...
Popul. Living Below $ 1.25 a Day (% of Population) 2008-2013
37.8 39.6 17.0 ...
Demographic Indicators Population Growth Rate - Total (%) 2015 3.3 2.6 1.3 0.6
Population Growth Rate - Urban (%) 2015 5.5 3.6 2.6 0.8
Population < 15 years (%) 2015 48.1 41.0 28.3 17.3 Population >= 65 years (%) 2015 2.5 3.5 6.2 16.0 Dependency Ratio (%) 2015 102.3 80.1 54.6 50.5 Sex Ratio (per 100 female) 2015 99.9 100.1 102.8 97.4 Female Population 15-49 years (% of total population) 2015 22.3 24.0 25.8 23.0 Life Expectancy at Birth - Total (years) 2015 59.2 61.2 68.9 79.1 Life Expectancy at Birth - Female (years) 2015 61.1 62.6 70.8 82.1 Crude Birth Rate (per 1,000) 2015 42.5 34.8 21.0 11.6 Crude Death Rate (per 1,000) 2015 9.3 9.3 7.7 8.8 Infant Mortality Rate (per 1,000) 2015 37.7 52.2 35.2 5.8 Child Mortality Rate (per 1,000) 2015 54.6 75.5 47.3 6.8 Total Fertility Rate (per woman) 2015 5.7 4.6 2.6 1.7 Maternal Mortality Rate (per 100,000) 2013 360.0 411.3 230.0 22.0 Women Using Contraception (%) 2014 28.5 35.3 62.1 ...
Health & Nutrition Indicators
Physicians (per 100,000 people) 2004-2012
11.7 46.9 118.1 308.0
Nurses (per 100,000 people)* 2004-2012
130.6 133.4 202.9 857.4
Births attended by Trained Health Personnel (%) 2009-2012
57.4 50.6 67.7 ...
Access to Safe Water (% of Population) 2015 79.0 71.6 89.1 99.0 Healthy life expectancy at birth (years) 2012 49.0 51.3 57 69 Access to Sanitation (% of Population) 2015 19.1 39.4 60.8 96.3 Percent. of Adults (aged 15-49) Living with HIV/AIDS 2013 7.4 3.8 1.2 ... Incidence of Tuberculosis (per 100,000) 2013 166.0 245.9 149.0 22.0 Child Immunization Against Tuberculosis (%) 2013 93.0 84.1 90.0 ... Child Immunization Against Measles (%) 2013 82.0 76.0 82.7 93.9
Underweight Children (% of children under 5 years) 2005-2013
14.1 20.8 17.0 0.9
Daily Calorie Supply per Capita 2011 2 279 2 621 2 335 3 503 Public Expenditure on Health (as % of GDP) 2013 4.3 2.7 3.1 7.3 Education Indicators Gross Enrolment Ratio (%)
0
500
1000
1500
2000
2500
20
00
20
05
20
08
20
09
20
10
20
11
20
12
20
13
20
14
GNI Per Capita US $
Uganda Africa
0,0
0,5
1,0
1,5
2,0
2,5
3,0
3,5
4,0
200
0
200
5
200
9
201
0
201
1
201
2
201
3
201
4
201
5
Population Growth Rate (%)
Uganda Africa
01020304050607080
20
00
20
05
20
09
20
10
20
11
20
12
20
13
20
14
20
15
Life Expectancy at Birth (years)
Uganda Africa
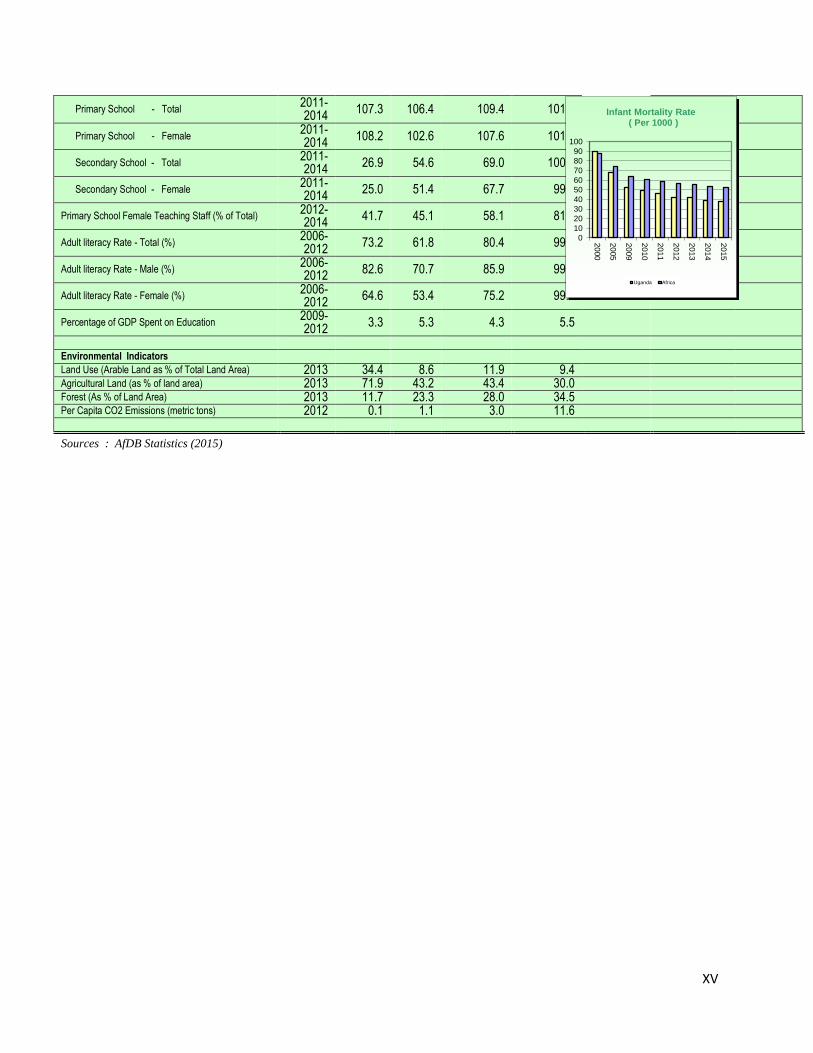
XV
Primary School - Total 2011-2014
107.3 106.4 109.4 101.3
Primary School - Female 2011-2014
108.2 102.6 107.6 101.1
Secondary School - Total 2011-2014
26.9 54.6 69.0 100.2
Secondary School - Female 2011-2014
25.0 51.4 67.7 99.9
Primary School Female Teaching Staff (% of Total) 2012-2014
41.7 45.1 58.1 81.6
Adult literacy Rate - Total (%) 2006-2012
73.2 61.8 80.4 99.2
Adult literacy Rate - Male (%) 2006-2012
82.6 70.7 85.9 99.3
Adult literacy Rate - Female (%) 2006-2012
64.6 53.4 75.2 99.0
Percentage of GDP Spent on Education 2009-2012
3.3 5.3 4.3 5.5
Environmental Indicators Land Use (Arable Land as % of Total Land Area) 2013 34.4 8.6 11.9 9.4 Agricultural Land (as % of land area) 2013 71.9 43.2 43.4 30.0 Forest (As % of Land Area) 2013 11.7 23.3 28.0 34.5 Per Capita CO2 Emissions (metric tons) 2012 0.1 1.1 3.0 11.6
Sources : AfDB Statistics (2015)
0
10
20
30
40
50
60
70
80
90
100
20
00
20
05
20
09
20
10
20
11
20
12
20
13
20
14
20
15
Infant Mortality Rate( Per 1000 )
Uganda Africa
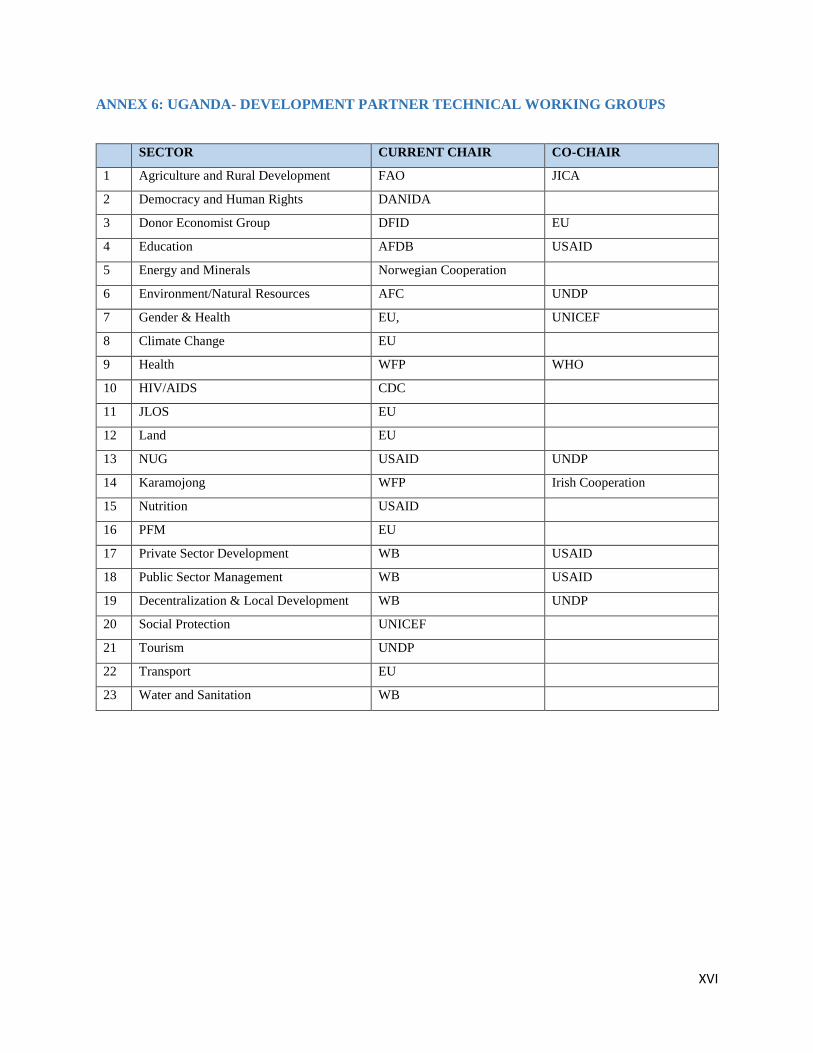
XVI
ANNEX 6: UGANDA- DEVELOPMENT PARTNER TECHNICAL WORKING GROUPS
SECTOR CURRENT CHAIR CO-CHAIR
1 Agriculture and Rural Development FAO JICA
2 Democracy and Human Rights DANIDA
3 Donor Economist Group DFID EU
4 Education AFDB USAID
5 Energy and Minerals Norwegian Cooperation
6 Environment/Natural Resources AFC UNDP
7 Gender & Health EU, UNICEF
8 Climate Change EU
9 Health WFP WHO
10 HIV/AIDS CDC
11 JLOS EU
12 Land EU
13 NUG USAID UNDP
14 Karamojong WFP Irish Cooperation
15 Nutrition USAID
16 PFM EU
17 Private Sector Development WB USAID
18 Public Sector Management WB USAID
19 Decentralization & Local Development WB UNDP
20 Social Protection UNICEF
21 Tourism UNDP
22 Transport EU
23 Water and Sanitation WB
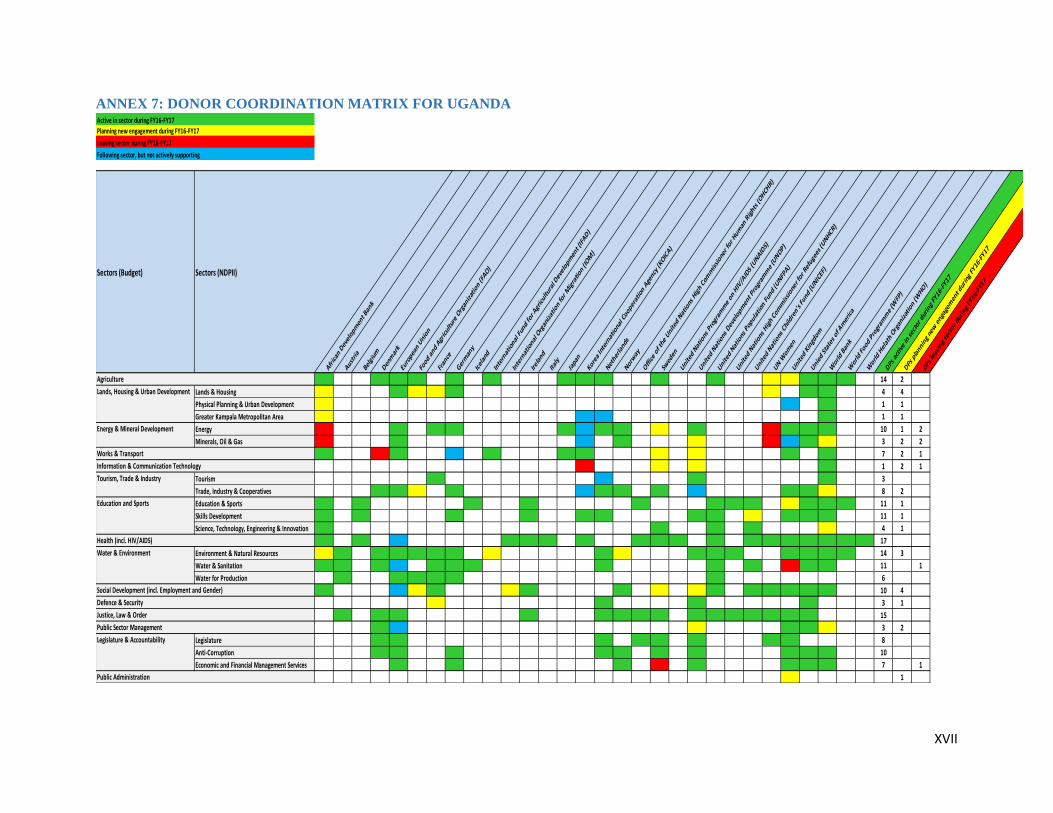
XVII
ANNEX 7: DONOR COORDINATION MATRIX FOR UGANDA
Active in sector during FY16-FY17
Planning new engagement during FY16-FY17
Leaving sector during FY16-FY17
Following sector, but not actively supporting
Sectors (Budget) Sectors (NDPII)
Africa
n Dev
elop
men
t Ban
k
Austria
Belgium
Den
mar
k
Euro
pean
Union
Food
and
Agr
icultu
re O
rgan
ization (FAO
)
Fran
ce
Ger
man
y
Icelan
d
Inte
rnat
iona
l Fun
d fo
r Agr
icultu
ral D
evelop
men
t (IFAD
)
Inte
rnat
iona
l Org
anizat
ion fo
r Migra
tion (IO
M)
Ireland
Italy
Japa
n
Kore
a Inte
rnat
iona
l Coo
pera
tion Ag
ency
(KOICA)
Net
herla
nds
Nor
way
Offi
ce of t
he U
nite
d Nat
ions
High Co
mmission
er fo
r Hum
an Right
s (OHCH
R)
Swed
en
Unite
d Nat
ions
Pro
gram
me on
HIV
/AID
S (U
NAI
DS)
Unite
d Nat
ions
Dev
elop
men
t Pro
gram
me (U
NDP
)
Unite
d Nat
ions
Pop
ulat
ion Fu
nd (U
NFP
A)
Unite
d Nat
ions
High Co
mmission
er fo
r Refug
ees (
UNHC
R)
Unite
d Nat
ions
Childre
n's F
und (U
NICEF
)
UN W
omen
Unite
d King
dom
Unied
State
s of
Amer
ica
Wor
ld Ban
k
Wor
ld Foo
d Pr
ogra
mm
e (W
FP)
Wor
ld H
elat
h Org
anization (W
HO)
DPs
active in se
ctor
dur
ing FY
16-FY1
7
DPs
plann
ing ne
w eng
agem
ent d
uring FY
16-FY1
7
DPs
leav
ing se
ctor
dur
ing FY
16-FY1
7
14 2
Lands & Housing 4 4
Physical Planning & Urban Development 1 1
Greater Kampala Metropolitan Area 1 1
Energy 10 1 2
Minerals, Oil & Gas 3 2 2
7 2 1
1 2 1
Tourism 3
Trade, Industry & Cooperatives 8 2
Education & Sports 11 1
Skills Development 11 1
Science, Technology, Engineering & Innovation 4 1
17
Environment & Natural Resources 14 3
Water & Sanitation 11 1
Water for Production 6
10 4
3 1
15
3 2
Legislature 8
Anti-Corruption 10
Economic and Financial Management Services 7 1
1Public Administration
Health (incl. HIV/AIDS)
Legislature & Accountability
Lands, Housing & Urban Development
Energy & Mineral Development
Tourism, Trade & Industry
Education and Sports
Water & Environment
Social Development (incl. Employment and Gender)
Defence & Security
Agriculture
Works & Transport
Information & Communication Technology
Justice, Law & Order
Public Sector Management
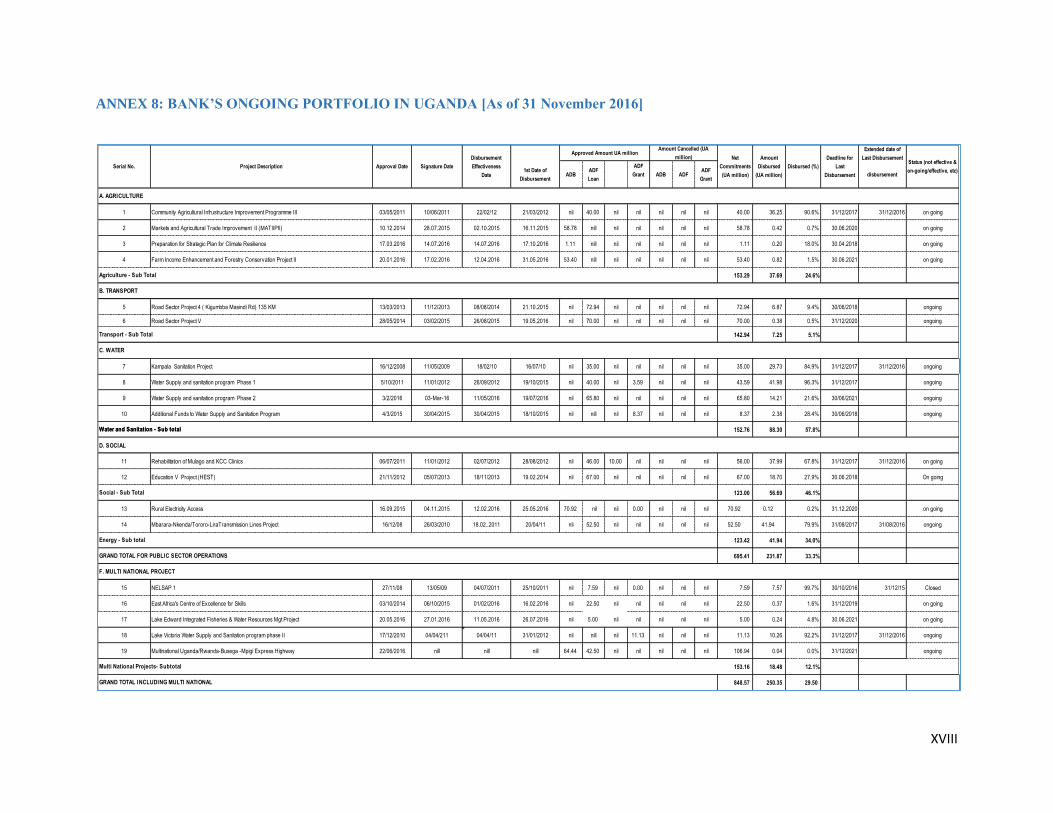
XVIII
ANNEX 8: BANK’S ONGOING PORTFOLIO IN UGANDA [As of 31 November 2016]
Extended date of
Last Disbursement
1st Date of
DisbursementADB
ADF
Loan
ADF
Grant ADB ADFADF
Grantdisbursement
1 Community Agricultural Infrustructure Improvement Programme III 03/05/2011 10/06/2011 22/02/12 21/03/2012 nil 40.00 nil nil nil nil nil 40.00 36.25 90.6% 31/12/2017 31/12/2016 on going
2 Markets and Agricultural Trade Improvement II (MATIIPII) 10.12.2014 28.07.2015 02.10.2015 16.11.2015 58.78 nill nil nil nil nil nil 58.78 0.42 0.7% 30.06.2020 on going
3 Preparation for Strategic Plan for Climate Resilience 17.03.2016 14.07.2016 14.07.2016 17.10.2016 1.11 nill nil nil nil nil nil 1.11 0.20 18.0% 30.04.2018 on going
4 Farm Income Enhancement and Forestry Conservation Project II 20.01.2016 17.02.2016 12.04.2016 31.05.2016 53.40 nill nil nil nil nil nil 53.40 0.82 1.5% 30.06.2021 on going
153.29 37.69 24.6%
5 Road Sector Project 4 ( Kigumbba Masindi Rd) 135 KM 13/03/2013 11/12/2013 08/08/2014 21.10.2015 nil 72.94 nil nil nil nil nil 72.94 6.87 9.4% 30/06/2018 ongoing
6 Road Sector Project V 28/05/2014 03/02/2015 26/08/2015 19.05.2016 nil 70.00 nil nil nil nil nil 70.00 0.38 0.5% 31/12/2020 ongoing
142.94 7.25 5.1%
7 Kampala Sanitation Project 16/12/2008 11/05/2009 18/02/10 16/07/10 nil 35.00 nil nil nil nil nil 35.00 29.73 84.9% 31/12/2017 31/12/2016 ongoing
8 Water Supply and sanitation program Phase 1 5/10/2011 11/01/2012 26/09/2012 19/10/2015 nil 40.00 nil 3.59 nil nil nil 43.59 41.98 96.3% 31/12/2017 ongoing
9 Water Supply and sanitation program Phase 2 3/2/2016 03-Mar-16 11/05/2016 19/07/2016 nil 65.80 nil nil nil nil nil 65.80 14.21 21.6% 30/06/2021 ongoing
10 Additional Funds to Water Supply and Sanitation Program 4/3/2015 30/04/2015 30/04/2015 18/10/2015 nil nill nil 8.37 nil nil nil 8.37 2.38 28.4% 30/06/2018 ongoing
152.76 88.30 57.8%
D. SOCIAL
11 Rehabilitation of Mulago and KCC Clinics 06/07/2011 11/01/2012 02/07/2012 28/08/2012 nil 46.00 10.00 nil nil nil nil 56.00 37.99 67.8% 31/12/2017 31/12/2016 on going
12 Education V Project (HEST) 21/11/2012 05/07/2013 18/11/2013 19.02.2014 nil 67.00 nil nil nil nil nil 67.00 18.70 27.9% 30.06.2018 On going
123.00 56.69 46.1%
13 Rural Electricity Access 16.09.2015 04.11.2015 12.02.2016 25.05.2016 70.92 nil nil 0.00 nil nil nil 70.92 0.12 0.2% 31.12.2020 on going
14 Mbarara-Nkenda/Tororo-LiraTransmission Lines Project 16/12/08 26/03/2010 18.02..2011 20/04/11 nil 52.50 nil nil nil nil nil 52.50 41.94 79.9% 31/08/2017 31/08/2016 ongoing
123.42 41.94 34.0%
695.41 231.87 33.3%
15 NELSAP 1 27/11/08 13/05/09 04/07/2011 25/10/2011 nil 7.59 nil 0.00 nil nil nil 7.59 7.57 99.7% 30/10/2016 31/12/15 Closed
16 East Africa's Centre of Excellence for Skills 03/10/2014 06/10/2015 01/02/2016 16.02.2016 nil 22.50 nil nil nil nil nil 22.50 0.37 1.6% 31/12/2019 on going
17 Lake Edward Integrated Fisheries & Water Resources Mgt Project 20.05.2016 27.01.2016 11.05.2016 26.07.2016 nil 5.00 nil nil nil nil nil 5.00 0.24 4.8% 30.06.2021 on going
18 Lake Victoria Water Supply and Sanitation program phase II 17/12/2010 04/04/211 04/04/11 31/01/2012 nil nill nil 11.13 nil nil nil 11.13 10.26 92.2% 31/12/2017 31/12/2016 ongoing
19 Multinational Uganda/Rwanda-Busega -Mpigi Express Highway 22/06/2016 nill nill nill 64.44 42.50 nil nil nil nil nil 106.94 0.04 0.0% 31/12/2021 ongoing
153.16 18.48 12.1%
848.57 250.35 29.50
Social - Sub Total
GRAND TOTAL INCLUDING MULTI NATIONAL
F. MULTI NATIONAL PROJECT
GRAND TOTAL FOR PUBLIC SECTOR OPERATIONS
Multi National Projects- Subtotal
Energy - Sub total
Agriculture - Sub Total
B. TRANSPORT
Transport - Sub Total
Water and Sanitation - Sub totalWater and Sanitation - Sub total
C. WATER
A. AGRICULTURE
Approval Date Signature Date
Disbursement
Effectiveness
Date
Approved Amount UA millionAmount Cancelled (UA
million)
Serial No. Project DescriptionStatus (not effective &
on-going/effective, etc)
Net
Commitments
(UA million)
Amount
Disbursed
(UA million)
Disbursed (%)
Deadline for
Last
Disbursement
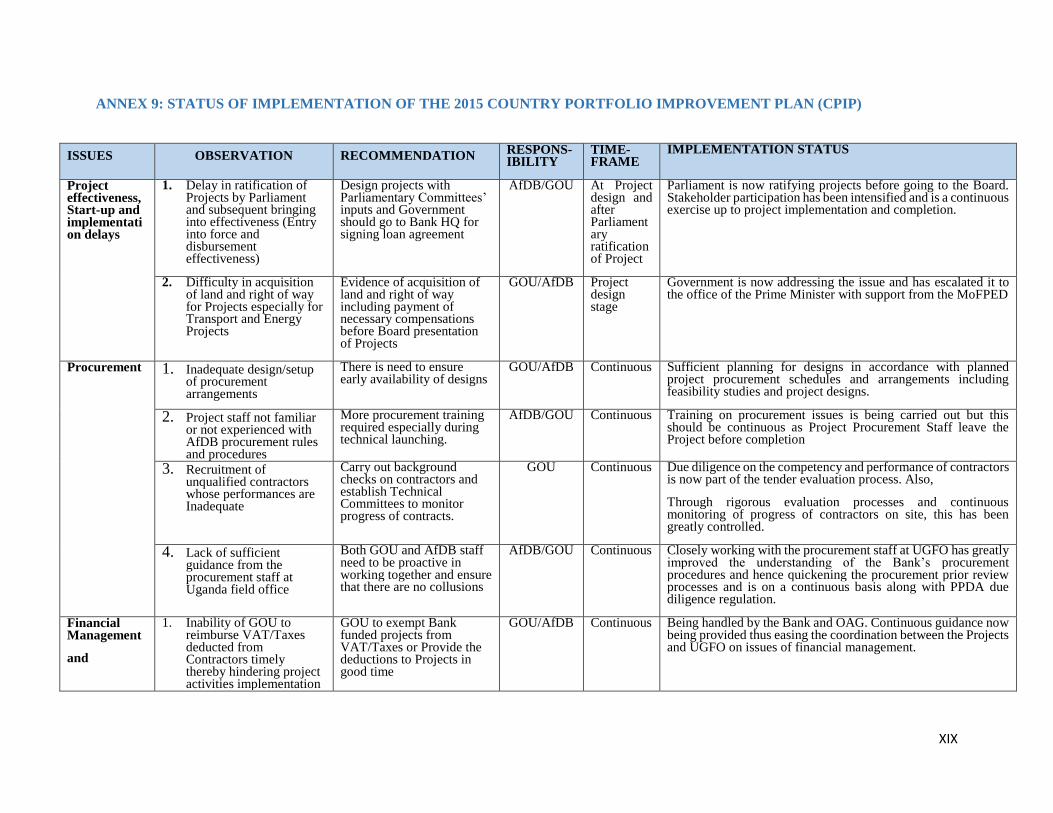
XIX
ANNEX 9: STATUS OF IMPLEMENTATION OF THE 2015 COUNTRY PORTFOLIO IMPROVEMENT PLAN (CPIP)
ISSUES OBSERVATION RECOMMENDATION RESPONS-IBILITY
TIME-FRAME
IMPLEMENTATION STATUS
Project effectiveness, Start-up and implementation delays
1. Delay in ratification of Projects by Parliament and subsequent bringing into effectiveness (Entry into force and disbursement effectiveness)
Design projects with Parliamentary Committees’ inputs and Government should go to Bank HQ for signing loan agreement
AfDB/GOU At Project design and after Parliamentary ratification of Project
Parliament is now ratifying projects before going to the Board. Stakeholder participation has been intensified and is a continuous exercise up to project implementation and completion.
2. Difficulty in acquisition of land and right of way for Projects especially for Transport and Energy Projects
Evidence of acquisition of land and right of way including payment of necessary compensations before Board presentation of Projects
GOU/AfDB Project design stage
Government is now addressing the issue and has escalated it to the office of the Prime Minister with support from the MoFPED
Procurement 1. Inadequate design/setup of procurement arrangements
There is need to ensure early availability of designs
GOU/AfDB Continuous Sufficient planning for designs in accordance with planned project procurement schedules and arrangements including feasibility studies and project designs.
2. Project staff not familiar or not experienced with AfDB procurement rules and procedures
More procurement training required especially during technical launching.
AfDB/GOU Continuous Training on procurement issues is being carried out but this should be continuous as Project Procurement Staff leave the Project before completion
3. Recruitment of unqualified contractors whose performances are Inadequate
Carry out background checks on contractors and establish Technical Committees to monitor progress of contracts.
GOU Continuous Due diligence on the competency and performance of contractors is now part of the tender evaluation process. Also,
Through rigorous evaluation processes and continuous monitoring of progress of contractors on site, this has been greatly controlled.
4. Lack of sufficient guidance from the procurement staff at Uganda field office
Both GOU and AfDB staff need to be proactive in working together and ensure that there are no collusions
AfDB/GOU Continuous Closely working with the procurement staff at UGFO has greatly improved the understanding of the Bank’s procurement procedures and hence quickening the procurement prior review processes and is on a continuous basis along with PPDA due diligence regulation.
Financial Management
and
1. Inability of GOU to reimburse VAT/Taxes deducted from Contractors timely thereby hindering project activities implementation
GOU to exempt Bank funded projects from VAT/Taxes or Provide the deductions to Projects in good time
GOU/AfDB Continuous Being handled by the Bank and OAG. Continuous guidance now being provided thus easing the coordination between the Projects and UGFO on issues of financial management.
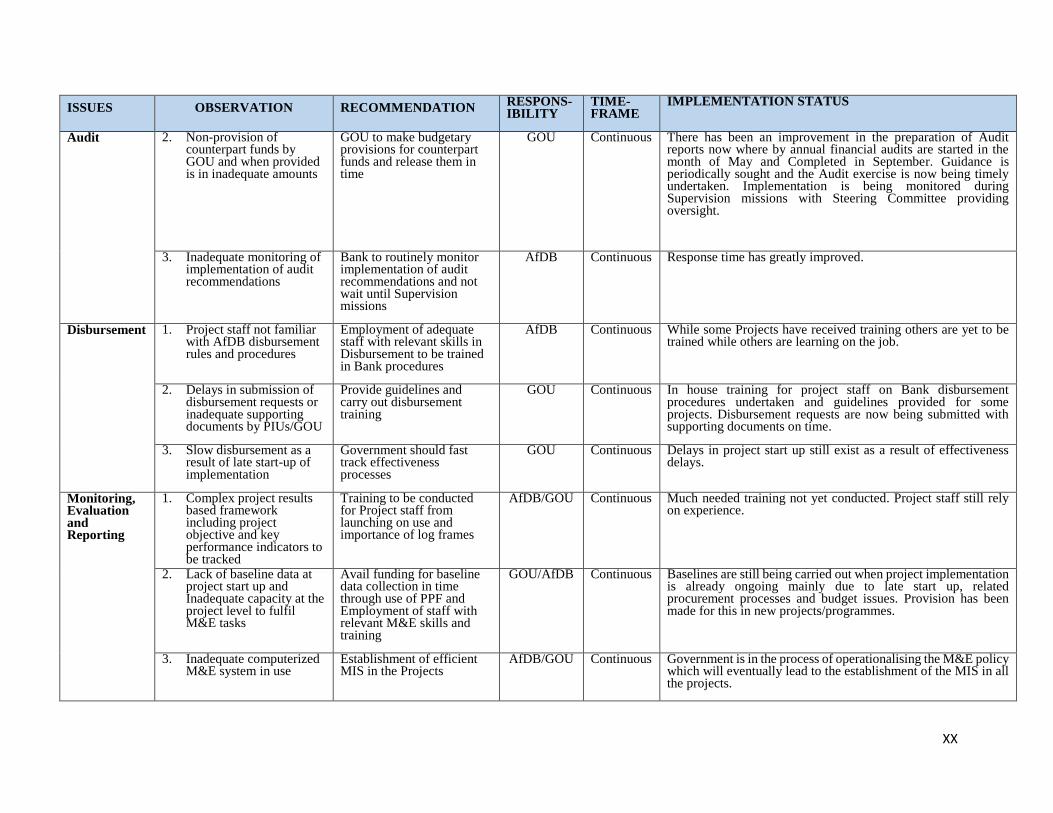
XX
ISSUES OBSERVATION RECOMMENDATION RESPONS-IBILITY
TIME-FRAME
IMPLEMENTATION STATUS
Audit
2. Non-provision of counterpart funds by GOU and when provided is in inadequate amounts
GOU to make budgetary provisions for counterpart funds and release them in time
GOU Continuous There has been an improvement in the preparation of Audit reports now where by annual financial audits are started in the month of May and Completed in September. Guidance is periodically sought and the Audit exercise is now being timely undertaken. Implementation is being monitored during Supervision missions with Steering Committee providing oversight.
3. Inadequate monitoring of implementation of audit recommendations
Bank to routinely monitor implementation of audit recommendations and not wait until Supervision missions
AfDB Continuous Response time has greatly improved.
Disbursement 1. Project staff not familiar with AfDB disbursement rules and procedures
Employment of adequate staff with relevant skills in Disbursement to be trained in Bank procedures
AfDB Continuous While some Projects have received training others are yet to be trained while others are learning on the job.
2. Delays in submission of disbursement requests or inadequate supporting documents by PIUs/GOU
Provide guidelines and carry out disbursement training
GOU Continuous In house training for project staff on Bank disbursement procedures undertaken and guidelines provided for some projects. Disbursement requests are now being submitted with supporting documents on time.
3. Slow disbursement as a result of late start-up of implementation
Government should fast track effectiveness processes
GOU Continuous Delays in project start up still exist as a result of effectiveness delays.
Monitoring, Evaluation and Reporting
1. Complex project results based framework including project objective and key performance indicators to be tracked
Training to be conducted for Project staff from launching on use and importance of log frames
AfDB/GOU Continuous Much needed training not yet conducted. Project staff still rely on experience.
2. Lack of baseline data at project start up and Inadequate capacity at the project level to fulfil M&E tasks
Avail funding for baseline data collection in time through use of PPF and Employment of staff with relevant M&E skills and training
GOU/AfDB Continuous Baselines are still being carried out when project implementation is already ongoing mainly due to late start up, related procurement processes and budget issues. Provision has been made for this in new projects/programmes.
3. Inadequate computerized M&E system in use
Establishment of efficient MIS in the Projects
AfDB/GOU Continuous Government is in the process of operationalising the M&E policy which will eventually lead to the establishment of the MIS in all the projects.
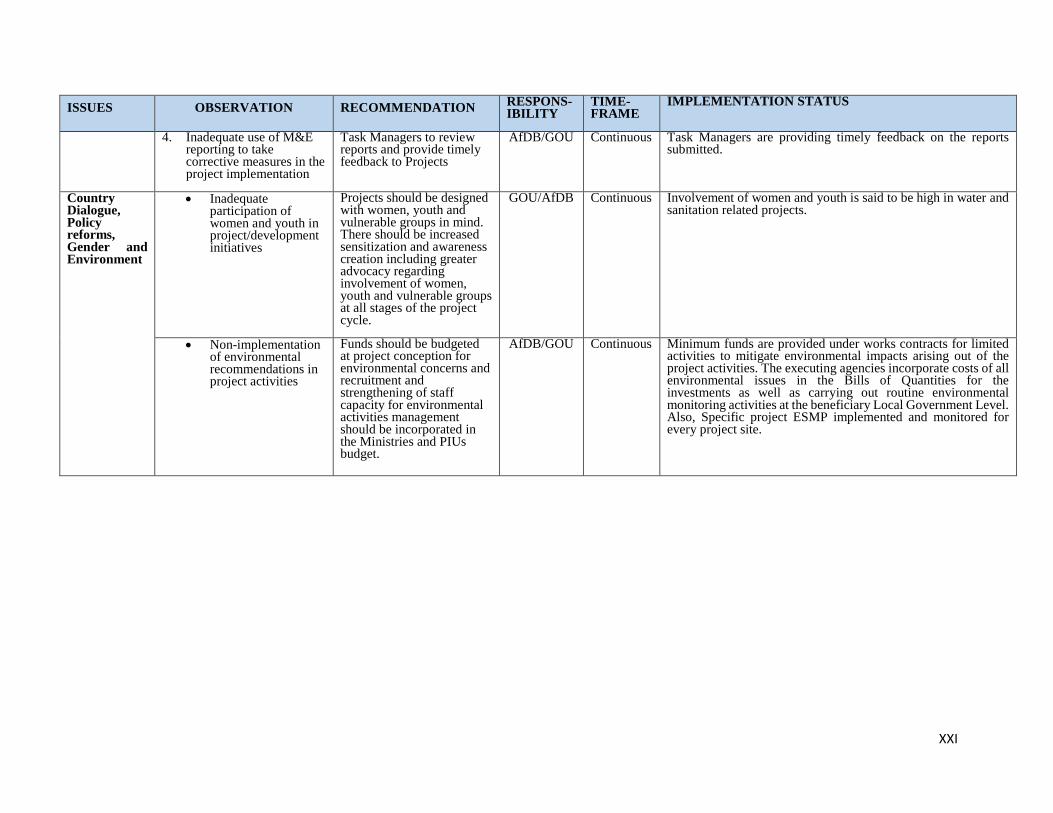
XXI
ISSUES OBSERVATION RECOMMENDATION RESPONS-IBILITY
TIME-FRAME
IMPLEMENTATION STATUS
4. Inadequate use of M&E reporting to take corrective measures in the project implementation
Task Managers to review reports and provide timely feedback to Projects
AfDB/GOU Continuous Task Managers are providing timely feedback on the reports submitted.
Country Dialogue, Policy reforms, Gender and Environment
Inadequate participation of women and youth in project/development initiatives
Projects should be designed with women, youth and vulnerable groups in mind. There should be increased sensitization and awareness creation including greater advocacy regarding involvement of women, youth and vulnerable groups at all stages of the project cycle.
GOU/AfDB Continuous
Involvement of women and youth is said to be high in water and sanitation related projects.
Non-implementation of environmental recommendations in project activities
Funds should be budgeted at project conception for environmental concerns and recruitment and strengthening of staff capacity for environmental activities management should be incorporated in the Ministries and PIUs budget.
AfDB/GOU
Continuous
Minimum funds are provided under works contracts for limited activities to mitigate environmental impacts arising out of the project activities. The executing agencies incorporate costs of all environmental issues in the Bills of Quantities for the investments as well as carrying out routine environmental monitoring activities at the beneficiary Local Government Level. Also, Specific project ESMP implemented and monitored for every project site.
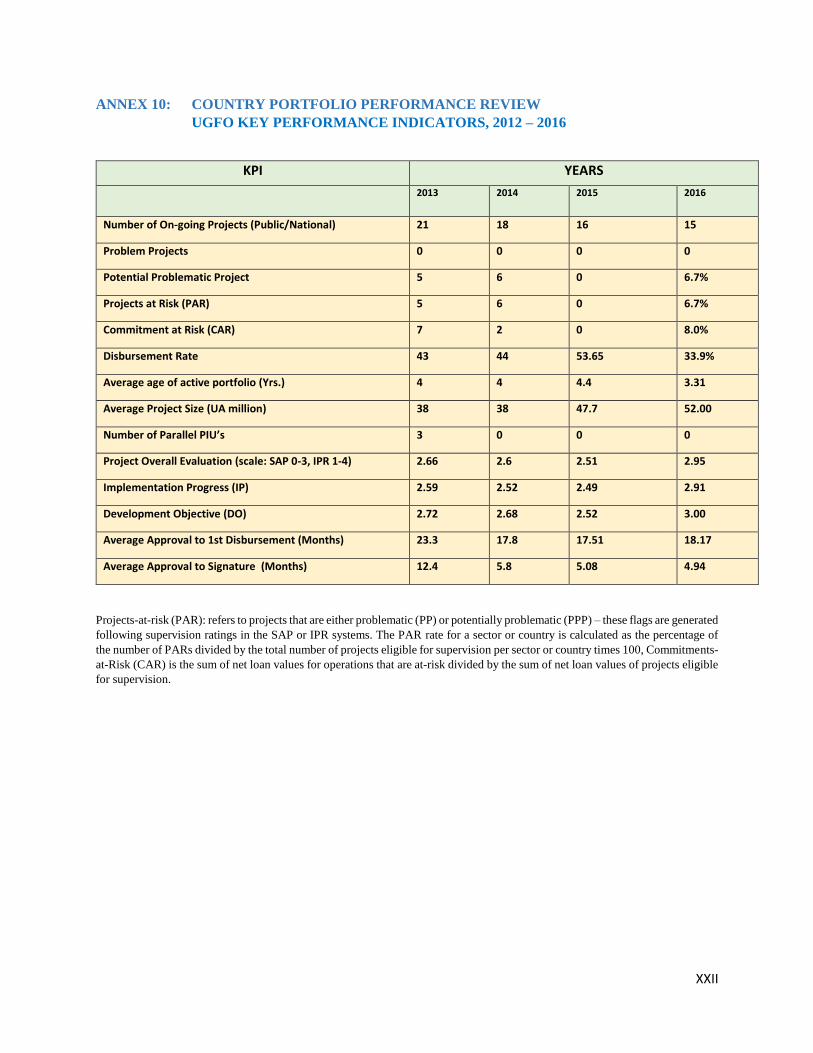
XXII
ANNEX 10: COUNTRY PORTFOLIO PERFORMANCE REVIEW
UGFO KEY PERFORMANCE INDICATORS, 2012 – 2016
KPI YEARS
2013 2014 2015 2016
Number of On-going Projects (Public/National) 21 18 16 15
Problem Projects 0 0 0 0
Potential Problematic Project 5 6 0 6.7%
Projects at Risk (PAR) 5 6 0 6.7%
Commitment at Risk (CAR) 7 2 0 8.0%
Disbursement Rate 43 44 53.65 33.9%
Average age of active portfolio (Yrs.) 4 4 4.4 3.31
Average Project Size (UA million) 38 38 47.7 52.00
Number of Parallel PIU’s 3 0 0 0
Project Overall Evaluation (scale: SAP 0-3, IPR 1-4) 2.66 2.6 2.51 2.95
Implementation Progress (IP) 2.59 2.52 2.49 2.91
Development Objective (DO) 2.72 2.68 2.52 3.00
Average Approval to 1st Disbursement (Months) 23.3 17.8 17.51 18.17
Average Approval to Signature (Months) 12.4 5.8 5.08 4.94
Projects-at-risk (PAR): refers to projects that are either problematic (PP) or potentially problematic (PPP) – these flags are generated
following supervision ratings in the SAP or IPR systems. The PAR rate for a sector or country is calculated as the percentage of
the number of PARs divided by the total number of projects eligible for supervision per sector or country times 100, Commitments-
at-Risk (CAR) is the sum of net loan values for operations that are at-risk divided by the sum of net loan values of projects eligible
for supervision.
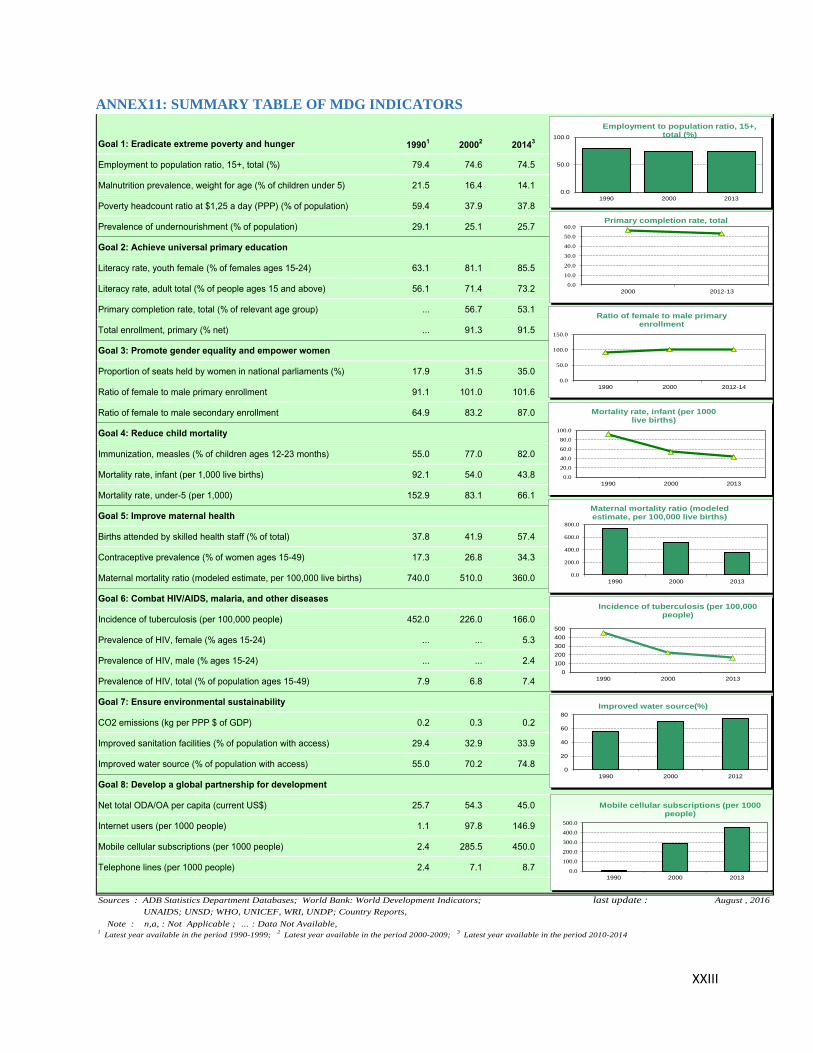
XXIII
ANNEX11: SUMMARY TABLE OF MDG INDICATORS
Goal 1: Eradicate extreme poverty and hunger 19901
20002
20143
Employment to population ratio, 15+, total (%) 79.4 74.6 74.5
Malnutrition prevalence, weight for age (% of children under 5) 21.5 16.4 14.1
Poverty headcount ratio at $1,25 a day (PPP) (% of population) 59.4 37.9 37.8
Prevalence of undernourishment (% of population) 29.1 25.1 25.7
Goal 2: Achieve universal primary education
Literacy rate, youth female (% of females ages 15-24) 63.1 81.1 85.5
Literacy rate, adult total (% of people ages 15 and above) 56.1 71.4 73.2
Primary completion rate, total (% of relevant age group) ... 56.7 53.1
Total enrollment, primary (% net) ... 91.3 91.5
Goal 3: Promote gender equality and empower women
Proportion of seats held by women in national parliaments (%) 17.9 31.5 35.0
Ratio of female to male primary enrollment 91.1 101.0 101.6
Ratio of female to male secondary enrollment 64.9 83.2 87.0
Goal 4: Reduce child mortality
Immunization, measles (% of children ages 12-23 months) 55.0 77.0 82.0
Mortality rate, infant (per 1,000 live births) 92.1 54.0 43.8
Mortality rate, under-5 (per 1,000) 152.9 83.1 66.1
Goal 5: Improve maternal health
Births attended by skilled health staff (% of total) 37.8 41.9 57.4
Contraceptive prevalence (% of women ages 15-49) 17.3 26.8 34.3
Maternal mortality ratio (modeled estimate, per 100,000 live births) 740.0 510.0 360.0
Goal 6: Combat HIV/AIDS, malaria, and other diseases
Incidence of tuberculosis (per 100,000 people) 452.0 226.0 166.0
Prevalence of HIV, female (% ages 15-24) ... ... 5.3
Prevalence of HIV, male (% ages 15-24) ... ... 2.4
Prevalence of HIV, total (% of population ages 15-49) 7.9 6.8 7.4
Goal 7: Ensure environmental sustainability
CO2 emissions (kg per PPP $ of GDP) 0.2 0.3 0.2
Improved sanitation facilities (% of population with access) 29.4 32.9 33.9
Improved water source (% of population with access) 55.0 70.2 74.8
Goal 8: Develop a global partnership for development
Net total ODA/OA per capita (current US$) 25.7 54.3 45.0
Internet users (per 1000 people) 1.1 97.8 146.9
Mobile cellular subscriptions (per 1000 people) 2.4 285.5 450.0
Telephone lines (per 1000 people) 2.4 7.1 8.7
Sources : ADB Statistics Department Databases; World Bank: World Development Indicators; last update :
UNAIDS; UNSD; WHO, UNICEF, WRI, UNDP; Country Reports,
Note : n,a, : Not Applicable ; … : Data Not Available,1
Latest year available in the period 1990-1999; 2
Latest year available in the period 2000-2009; 3
Latest year available in the period 2010-2014
August , 2016
0
100
200
300
400
500
1990 2000 2013
Incidence of tuberculosis (per 100,000 people)
0.0
50.0
100.0
1990 2000 2013
Employment to population ratio, 15+, total (%)
0.0
10.0
20.0
30.0
40.0
50.0
60.0
2000 2012-13
Primary completion rate, total
0.0
50.0
100.0
150.0
1990 2000 2012-14
Ratio of female to male primary enrollment
0.0
20.0
40.0
60.0
80.0
100.0
1990 2000 2013
Mortality rate, infant (per 1000 live births)
0.0
200.0
400.0
600.0
800.0
1990 2000 2013
Maternal mortality ratio (modeled estimate, per 100,000 live births)
0.0
100.0
200.0
300.0
400.0
500.0
1990 2000 2013
Mobile cellular subscriptions (per 1000 people)
0
20
40
60
80
1990 2000 2012
Improved water source(%)
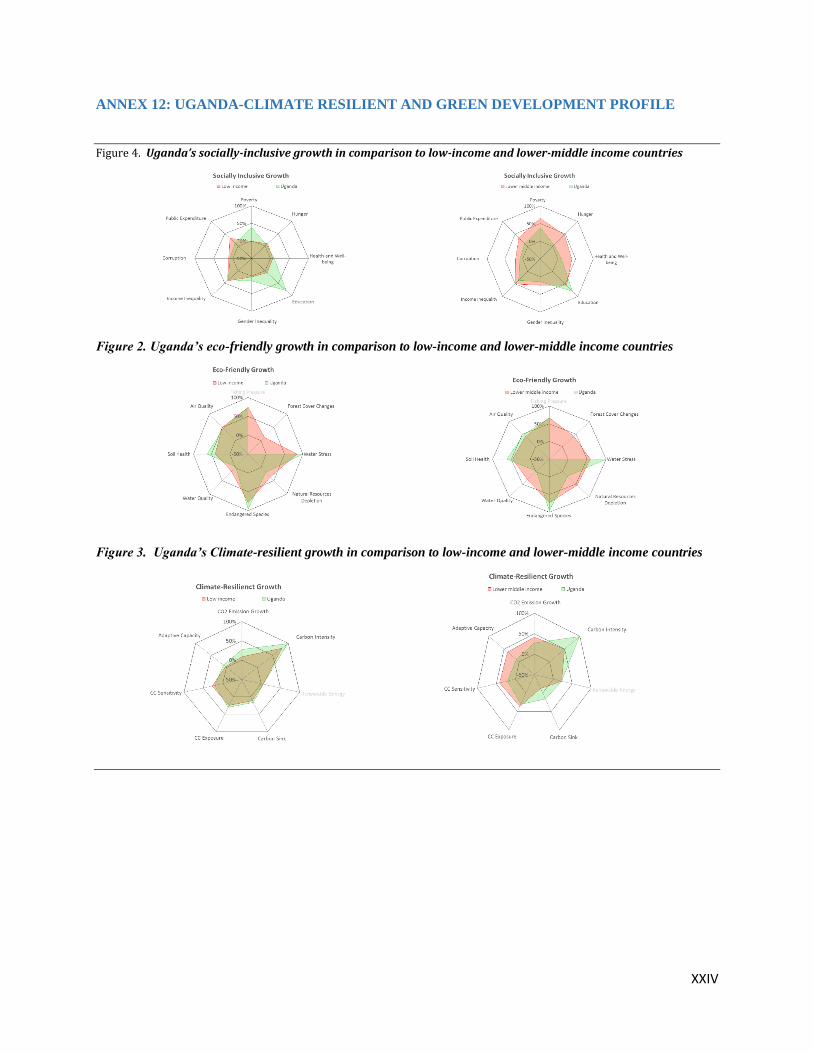
XXIV
ANNEX 12: UGANDA-CLIMATE RESILIENT AND GREEN DEVELOPMENT PROFILE
Figure 4. Uganda’s socially-inclusive growth in comparison to low-income and lower-middle income countries
Figure 2. Uganda’s eco-friendly growth in comparison to low-income and lower-middle income countries
Figure 3. Uganda’s Climate-resilient growth in comparison to low-income and lower-middle income countries
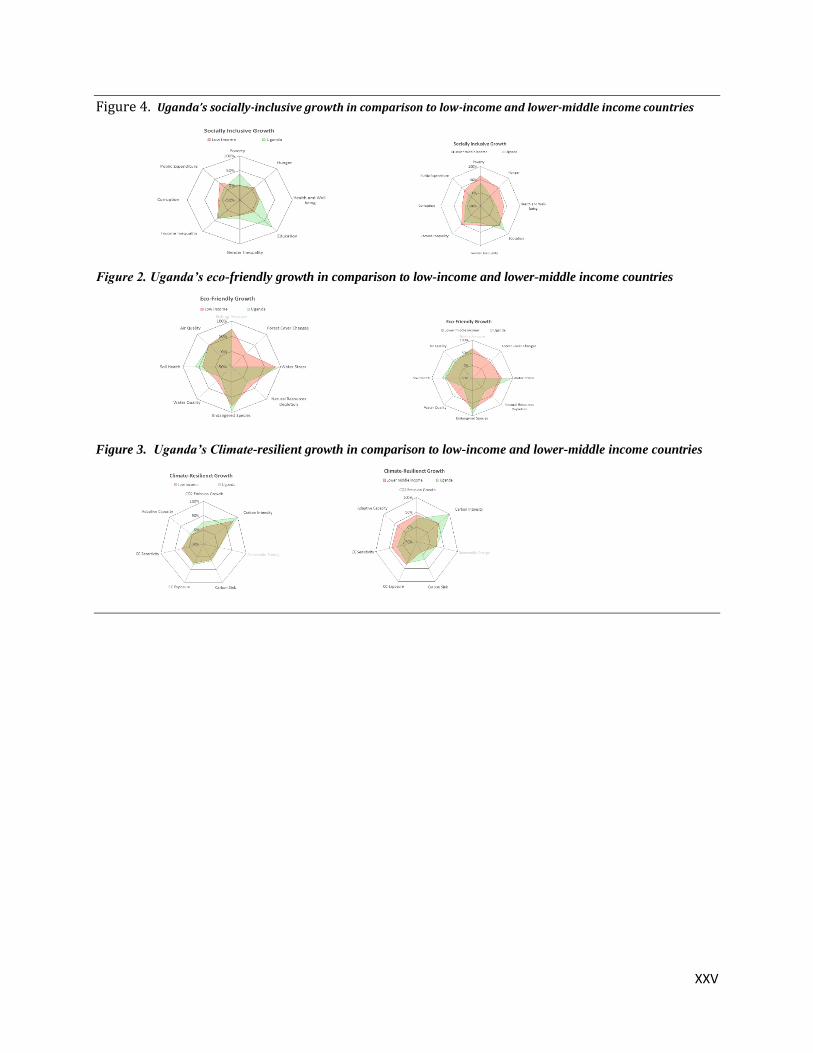
XXV
Figure 4. Uganda’s socially-inclusive growth in comparison to low-income and lower-middle income countries
Figure 2. Uganda’s eco-friendly growth in comparison to low-income and lower-middle income countries
Figure 3. Uganda’s Climate-resilient growth in comparison to low-income and lower-middle income countries
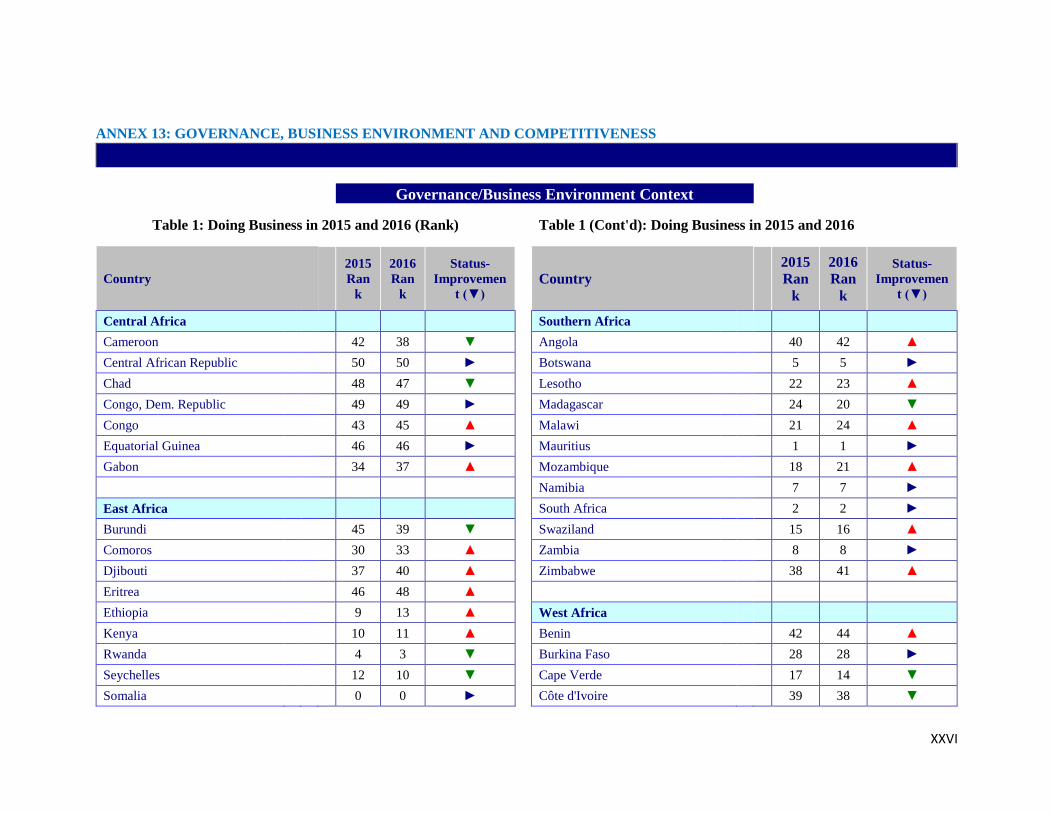
XXVI
ANNEX 13: GOVERNANCE, BUSINESS ENVIRONMENT AND COMPETITIVENESS
Governance/Business Environment Context
Table 1: Doing Business in 2015 and 2016 (Rank)
Table 1 (Cont'd): Doing Business in 2015 and 2016
Country
2015
Ran
k
2016
Ran
k
Status-
Improvemen
t (▼)
Country
2015
Ran
k
2016
Ran
k
Status-
Improvemen
t (▼)
Central Africa Southern Africa
Cameroon 42 38 ▼ Angola 40 42 ▲
Central African Republic 50 50 ► Botswana 5 5 ►
Chad 48 47 ▼ Lesotho 22 23 ▲
Congo, Dem. Republic 49 49 ► Madagascar 24 20 ▼
Congo 43 45 ▲ Malawi 21 24 ▲
Equatorial Guinea 46 46 ► Mauritius 1 1 ►
Gabon 34 37 ▲ Mozambique 18 21 ▲
Namibia 7 7 ►
East Africa South Africa 2 2 ►
Burundi 45 39 ▼ Swaziland 15 16 ▲
Comoros 30 33 ▲ Zambia 8 8 ►
Djibouti 37 40 ▲ Zimbabwe 38 41 ▲
Eritrea 46 48 ▲
Ethiopia 9 13 ▲ West Africa
Kenya 10 11 ▲ Benin 42 44 ▲
Rwanda 4 3 ▼ Burkina Faso 28 28 ►
Seychelles 12 10 ▼ Cape Verde 17 14 ▼
Somalia 0 0 ► Côte d'Ivoire 39 38 ▼
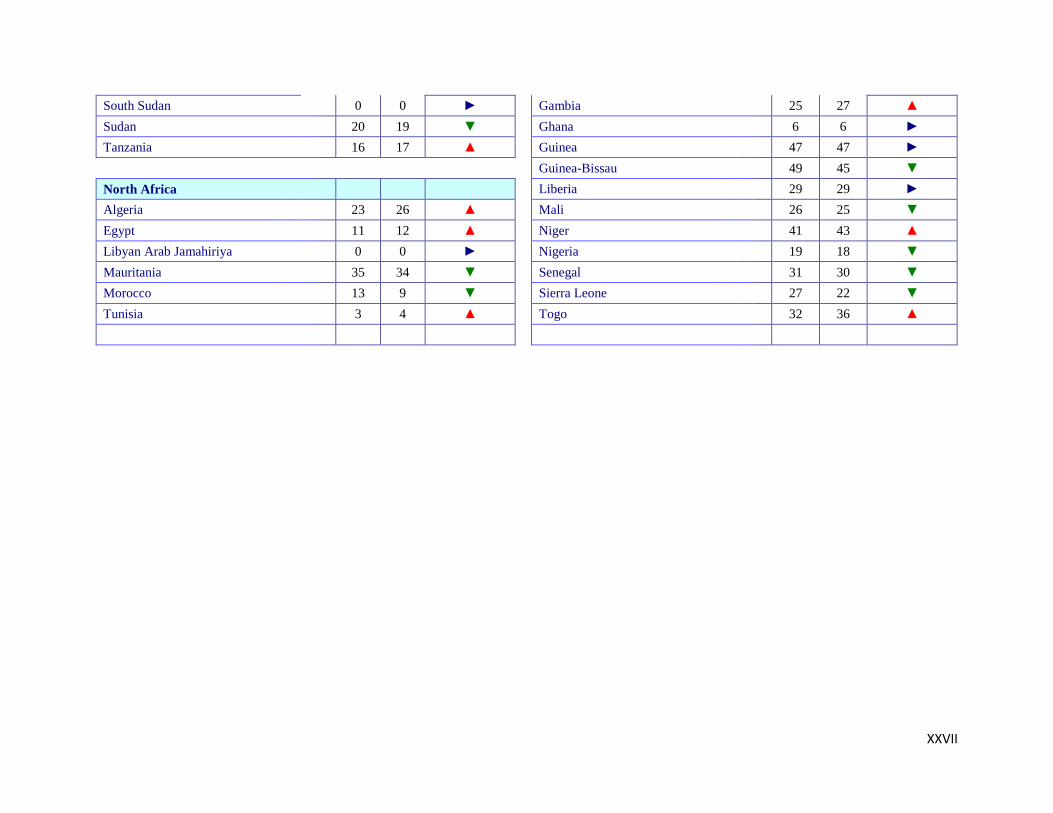
XXVII
South Sudan 0 0 ► Gambia 25 27 ▲
Sudan 20 19 ▼ Ghana 6 6 ►
Tanzania 16 17 ▲ Guinea 47 47 ►
Guinea-Bissau 49 45 ▼
North Africa Liberia 29 29 ►
Algeria 23 26 ▲ Mali 26 25 ▼
Egypt 11 12 ▲ Niger 41 43 ▲
Libyan Arab Jamahiriya 0 0 ► Nigeria 19 18 ▼
Mauritania 35 34 ▼ Senegal 31 30 ▼
Morocco 13 9 ▼ Sierra Leone 27 22 ▼
Tunisia 3 4 ▲ Togo 32 36 ▲
XXVIII
Governance/Business Environment Context (Con'd)
Table 2: Doing Business in 2015 and 2016 (Rank)
Table 3: Governance Indicators - Score -3.0 (Worst) to 2.5 (Best)
Item 2015 Ran
k
2016 Ran
k
Status - Improvemen
t (▼)
Ease of Doing Business 122 115 ▼
Indicators 2014
2015
Starting a business 168 165 ▼
Government Effectiveness -
0.50
-
0.48
Dealing with licenses 161 151 ▼
Voice and Accountability -
0.58
-
0.59
Registering property 120 116 ▼
Corruption Perception -
1.10
-
1.05
Getting credit 42 44 ▲
Rule of Law -
0.39
-
0.34
Protecting investors 99 106 ▲
Source: AfDB Statistics Department using data from the WEF, 2016
Paying taxes 105 75 ▼
Trading across borders 128 136 ▲
Enforcing contracts 78 64 ▼
Closing a business 104 111 ▲
Source: AfDB Statistics Department using data from Doing Business,WB
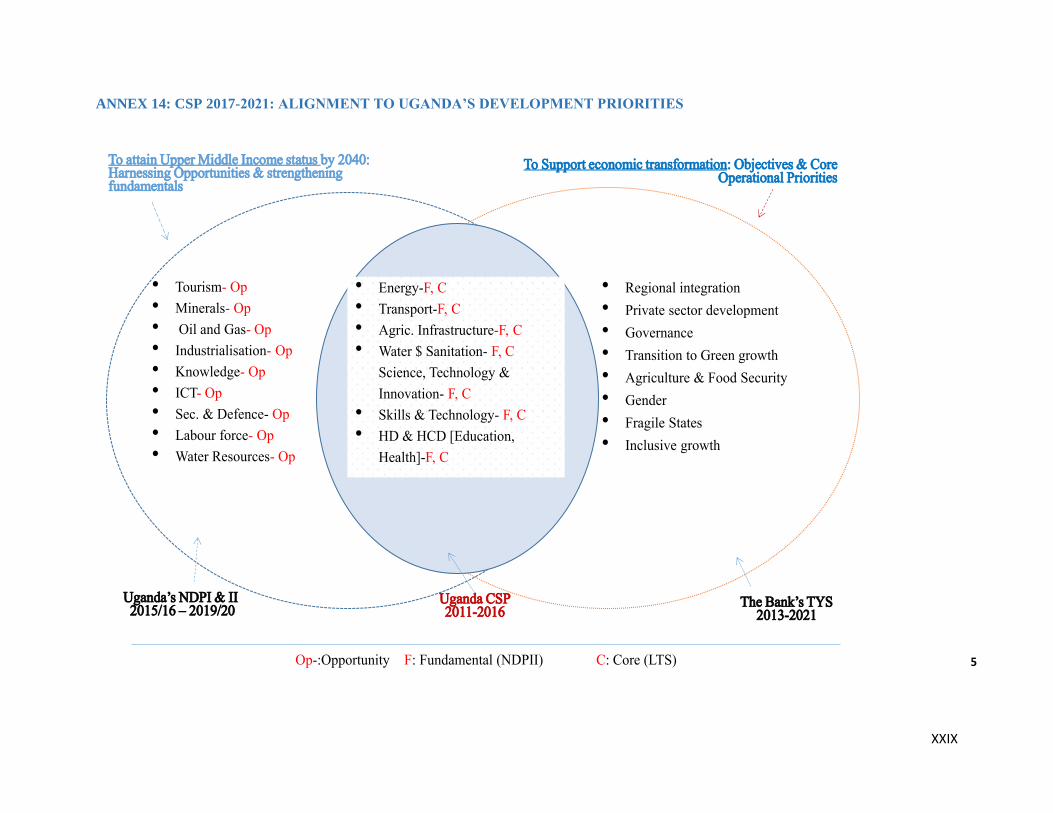
XXIX
ANNEX 14: CSP 2017-2021: ALIGNMENT TO UGANDA’S DEVELOPMENT PRIORITIES
Uganda CSP2011-2016
Uganda’s NDPI & II2015/16 – 2019/20 The Bank’s TYS
2013-2021
• Tourism- Op• Minerals- Op• Oil and Gas- Op• Industrialisation- Op• Knowledge- Op• ICT- Op• Sec. & Defence- Op• Labour force- Op• Water Resources- Op
• Energy-F, C• Transport-F, C• Agric. Infrastructure-F, C• Water $ Sanitation- F, C
Science, Technology & Innovation- F, C
• Skills & Technology- F, C• HD & HCD [Education,
Health]-F, C
• Regional integration• Private sector development• Governance• Transition to Green growth• Agriculture & Food Security• Gender• Fragile States• Inclusive growth
To Support economic transformation: Objectives & Core Operational Priorities
To attain Upper Middle Income status by 2040: Harnessing Opportunities & strengthening fundamentals
Op-:Opportunity F: Fundamental (NDPII) C: Core (LTS) 5
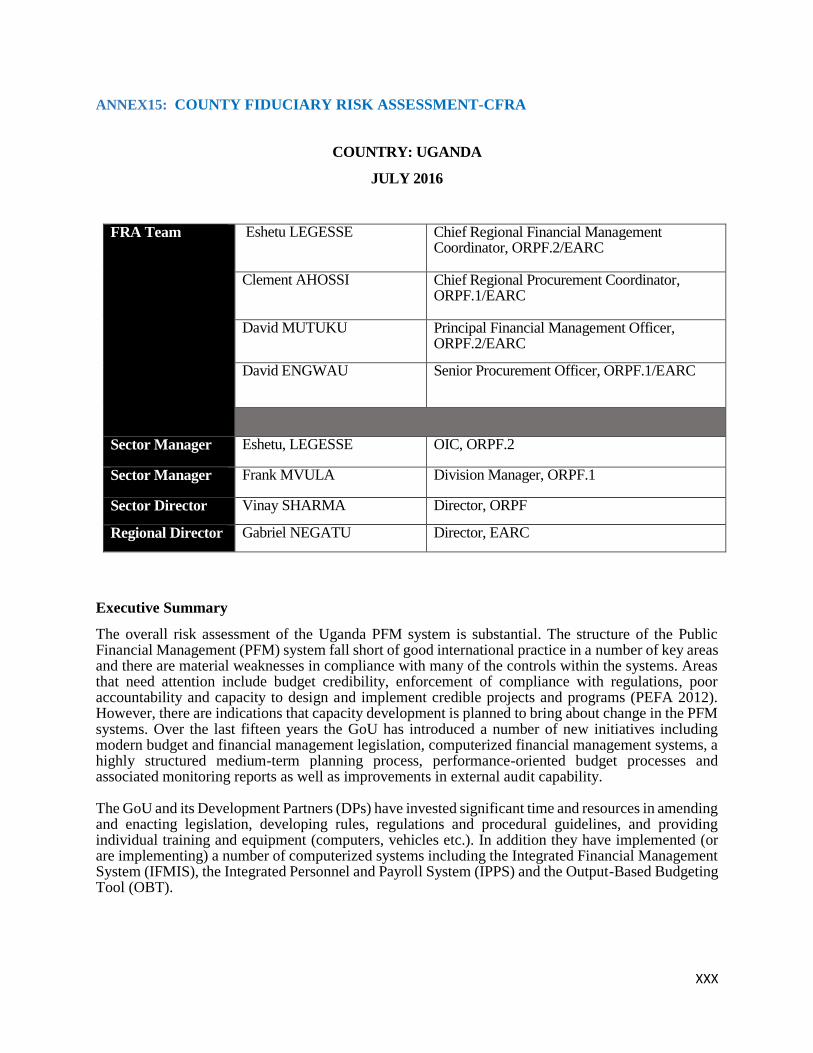
XXX
ANNEX15: COUNTY FIDUCIARY RISK ASSESSMENT-CFRA
COUNTRY: UGANDA
JULY 2016
FRA Team
Eshetu LEGESSE Chief Regional Financial Management Coordinator, ORPF.2/EARC
Clement AHOSSI Chief Regional Procurement Coordinator, ORPF.1/EARC
David MUTUKU Principal Financial Management Officer, ORPF.2/EARC
David ENGWAU Senior Procurement Officer, ORPF.1/EARC
Sector Manager Eshetu, LEGESSE OIC, ORPF.2
Sector Manager Frank MVULA Division Manager, ORPF.1
Sector Director Vinay SHARMA Director, ORPF
Regional Director Gabriel NEGATU Director, EARC
Executive Summary
The overall risk assessment of the Uganda PFM system is substantial. The structure of the Public Financial Management (PFM) system fall short of good international practice in a number of key areas and there are material weaknesses in compliance with many of the controls within the systems. Areas that need attention include budget credibility, enforcement of compliance with regulations, poor accountability and capacity to design and implement credible projects and programs (PEFA 2012). However, there are indications that capacity development is planned to bring about change in the PFM systems. Over the last fifteen years the GoU has introduced a number of new initiatives including modern budget and financial management legislation, computerized financial management systems, a highly structured medium-term planning process, performance-oriented budget processes and associated monitoring reports as well as improvements in external audit capability. The GoU and its Development Partners (DPs) have invested significant time and resources in amending and enacting legislation, developing rules, regulations and procedural guidelines, and providing individual training and equipment (computers, vehicles etc.). In addition they have implemented (or are implementing) a number of computerized systems including the Integrated Financial Management System (IFMIS), the Integrated Personnel and Payroll System (IPPS) and the Output-Based Budgeting Tool (OBT).
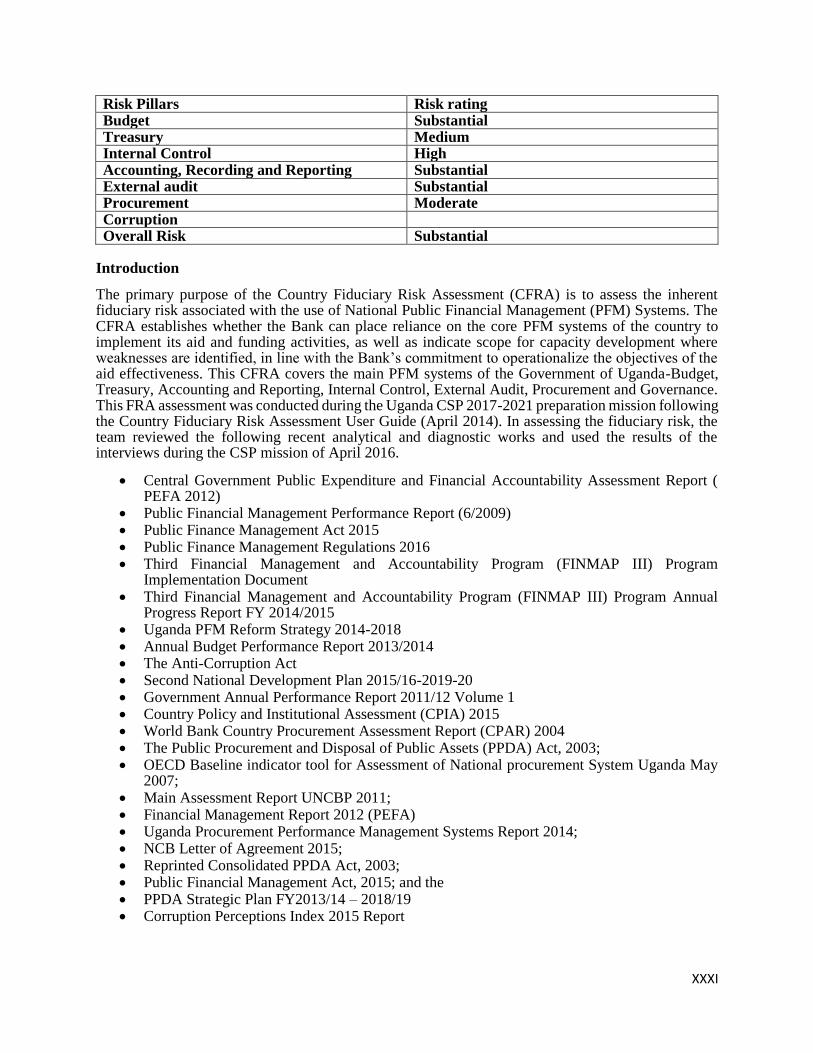
XXXI
Risk Pillars Risk rating Budget Substantial Treasury Medium Internal Control High Accounting, Recording and Reporting Substantial External audit Substantial Procurement Moderate Corruption Overall Risk Substantial
Introduction
The primary purpose of the Country Fiduciary Risk Assessment (CFRA) is to assess the inherent fiduciary risk associated with the use of National Public Financial Management (PFM) Systems. The CFRA establishes whether the Bank can place reliance on the core PFM systems of the country to implement its aid and funding activities, as well as indicate scope for capacity development where weaknesses are identified, in line with the Bank’s commitment to operationalize the objectives of the aid effectiveness. This CFRA covers the main PFM systems of the Government of Uganda-Budget, Treasury, Accounting and Reporting, Internal Control, External Audit, Procurement and Governance. This FRA assessment was conducted during the Uganda CSP 2017-2021 preparation mission following the Country Fiduciary Risk Assessment User Guide (April 2014). In assessing the fiduciary risk, the team reviewed the following recent analytical and diagnostic works and used the results of the interviews during the CSP mission of April 2016.
Central Government Public Expenditure and Financial Accountability Assessment Report ( PEFA 2012)
Public Financial Management Performance Report (6/2009) Public Finance Management Act 2015 Public Finance Management Regulations 2016 Third Financial Management and Accountability Program (FINMAP III) Program
Implementation Document Third Financial Management and Accountability Program (FINMAP III) Program Annual
Progress Report FY 2014/2015 Uganda PFM Reform Strategy 2014-2018 Annual Budget Performance Report 2013/2014 The Anti-Corruption Act Second National Development Plan 2015/16-2019-20 Government Annual Performance Report 2011/12 Volume 1 Country Policy and Institutional Assessment (CPIA) 2015 World Bank Country Procurement Assessment Report (CPAR) 2004 The Public Procurement and Disposal of Public Assets (PPDA) Act, 2003; OECD Baseline indicator tool for Assessment of National procurement System Uganda May
2007; Main Assessment Report UNCBP 2011; Financial Management Report 2012 (PEFA) Uganda Procurement Performance Management Systems Report 2014; NCB Letter of Agreement 2015; Reprinted Consolidated PPDA Act, 2003; Public Financial Management Act, 2015; and the PPDA Strategic Plan FY2013/14 – 2018/19 Corruption Perceptions Index 2015 Report
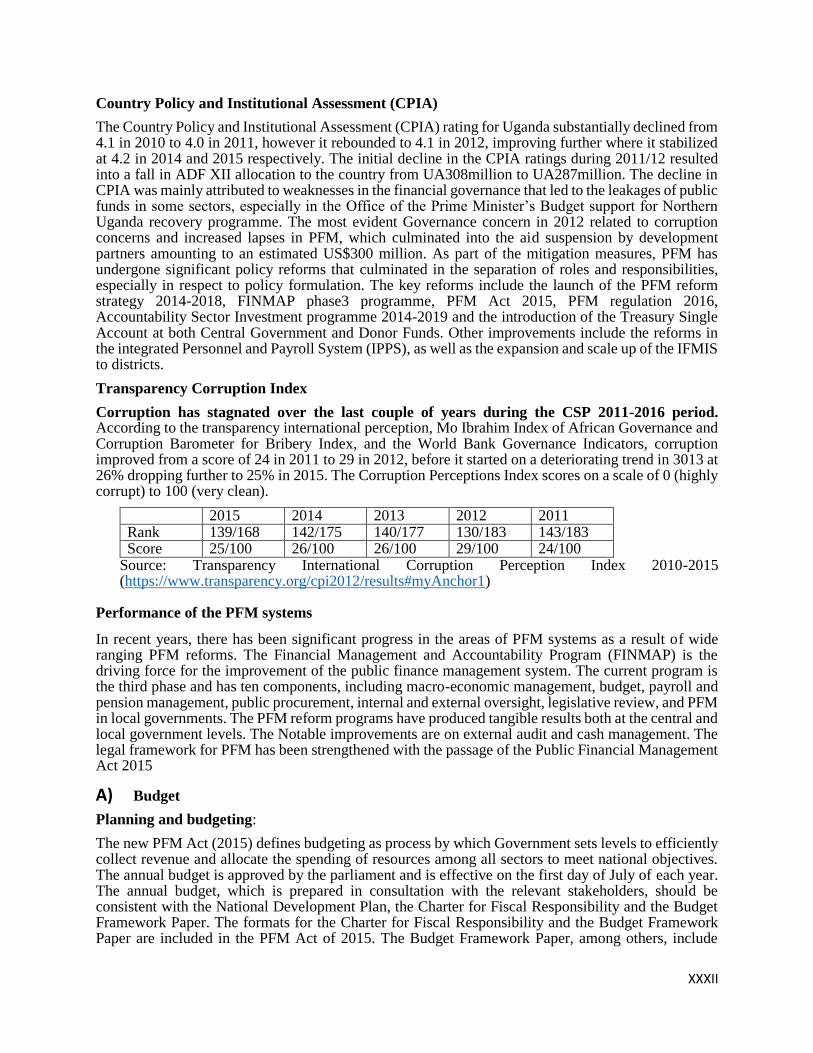
XXXII
Country Policy and Institutional Assessment (CPIA)
The Country Policy and Institutional Assessment (CPIA) rating for Uganda substantially declined from 4.1 in 2010 to 4.0 in 2011, however it rebounded to 4.1 in 2012, improving further where it stabilized at 4.2 in 2014 and 2015 respectively. The initial decline in the CPIA ratings during 2011/12 resulted into a fall in ADF XII allocation to the country from UA308million to UA287million. The decline in CPIA was mainly attributed to weaknesses in the financial governance that led to the leakages of public funds in some sectors, especially in the Office of the Prime Minister’s Budget support for Northern Uganda recovery programme. The most evident Governance concern in 2012 related to corruption concerns and increased lapses in PFM, which culminated into the aid suspension by development partners amounting to an estimated US$300 million. As part of the mitigation measures, PFM has undergone significant policy reforms that culminated in the separation of roles and responsibilities, especially in respect to policy formulation. The key reforms include the launch of the PFM reform strategy 2014-2018, FINMAP phase3 programme, PFM Act 2015, PFM regulation 2016, Accountability Sector Investment programme 2014-2019 and the introduction of the Treasury Single Account at both Central Government and Donor Funds. Other improvements include the reforms in the integrated Personnel and Payroll System (IPPS), as well as the expansion and scale up of the IFMIS to districts.
Transparency Corruption Index
Corruption has stagnated over the last couple of years during the CSP 2011-2016 period. According to the transparency international perception, Mo Ibrahim Index of African Governance and Corruption Barometer for Bribery Index, and the World Bank Governance Indicators, corruption improved from a score of 24 in 2011 to 29 in 2012, before it started on a deteriorating trend in 3013 at 26% dropping further to 25% in 2015. The Corruption Perceptions Index scores on a scale of 0 (highly corrupt) to 100 (very clean).
2015 2014 2013 2012 2011 Rank 139/168 142/175 140/177 130/183 143/183 Score 25/100 26/100 26/100 29/100 24/100
Source: Transparency International Corruption Perception Index 2010-2015 (https://www.transparency.org/cpi2012/results#myAnchor1)
Performance of the PFM systems
In recent years, there has been significant progress in the areas of PFM systems as a result of wide ranging PFM reforms. The Financial Management and Accountability Program (FINMAP) is the driving force for the improvement of the public finance management system. The current program is the third phase and has ten components, including macro-economic management, budget, payroll and pension management, public procurement, internal and external oversight, legislative review, and PFM in local governments. The PFM reform programs have produced tangible results both at the central and local government levels. The Notable improvements are on external audit and cash management. The legal framework for PFM has been strengthened with the passage of the Public Financial Management Act 2015
A) Budget
Planning and budgeting:
The new PFM Act (2015) defines budgeting as process by which Government sets levels to efficiently collect revenue and allocate the spending of resources among all sectors to meet national objectives. The annual budget is approved by the parliament and is effective on the first day of July of each year. The annual budget, which is prepared in consultation with the relevant stakeholders, should be consistent with the National Development Plan, the Charter for Fiscal Responsibility and the Budget Framework Paper. The formats for the Charter for Fiscal Responsibility and the Budget Framework Paper are included in the PFM Act of 2015. The Budget Framework Paper, among others, include
XXXIII
Medium-Term Macroeconomic Forecast, Medium-Term Fiscal Framework, Medium-Term Fiscal Forecast, and Medium-Term Expenditure Framework.
Budget execution
The credibility of the budget as a planning and control mechanism is determined by the extent to which actual expenditures and revenues are consistent with the approved budget. At an aggregate level, the latest PEFA assessment shows credibility over the past three years has deteriorated. In 2008/09 and 2009/10, budget credibility was good (below 5 per cent variance), but in 2010/11 there was a significant deterioration as variance levels reached 28.7 per cent. There is wide variations between approved budget and actual expenditures as reported in PEFA 2012.
Monitoring and evaluation of the budget has not yet been extended to cover all sectors. The concepts and benefits of budget monitoring and evaluation are not well understood or appreciated by implementing agencies (PFM reform strategy paper).
Policy-based budgeting
The budget process is orderly and transparent and the GoU is now using a form of performance based budgeting. However, the Medium-Term Fiscal Framework remains a poor indicator of future funding levels. The National and Sector Budget and Work Plan are largely aligned with Government policies as a result of Output-Based Budgeting Tool (OBT). The OBT enables clear allocation of resources within sector ceilings. Efforts are being made to improve the OBT functionality and automation to bring about data integrity, timely and reliable budget information for both the central and local government institutions (PFM strategy paper).
Predictability and control in budget execution:
Revenue administration has undergone significant organizational and technological modernization of systems and management structure that promote efficiency (PFM strategy paper). An integrated Tax Administration System is in place for online registration, filing, payments and account balances. Tax laws are regularly reviewed.
However, revenue mobilization remains inadequate to finance the National Budget and Local Governments’ own revenue are significantly constrained. The PEFA 2012 indicates that the Uganda Revenue Authority does not have a strong record of debt collection and arrears management with penalties being ineffective.
Information on in-year budget adjustments is not communicated in time for spending institutions to respond appropriately and there is a weak communication flow between the Sector MDAs and LGs. There is a need to strengthen the capacity of the Budget Monitoring and Accountability Unit (BMAU) to cover other key areas of the budget so as to provide more comprehensive budget performance data for decision making. In addition, the concepts and benefits of budget monitoring and evaluation concepts are not well understood or appreciated by implementing agencies which makes data collection difficult due to lack of both capacity and commitment (PFM Strategy Paper). Transparency and comprehensiveness:
According to the Open Budget Index (OBI) and the latest PEFA assessment, there is a fair degree of comprehensiveness and transparency in terms of budget documentation and public access to financial information. A clear budget calendar is issued to Ministries, Departments and Agencies with initial ceilings communicated. The timetable is adhered and the Budget Circular is comprehensive and clear (PEFA 2012). As per the PEFA 2012, the budget classification is in line with international standards, such as Government Financial Statistics (GFS) and Classification of the Function of Government (COFOG).
XXXIV
The budget process is participatory and a mechanism is in place to facilitate inter-sectoral coordination. The budget process includes consultative workshops with different stakeholders, including civil society.
The Local Government grants allocation formulae are numerous, complex and difficult for LGs to understand and predict reliably for planning and budget execution. The PEFA 2012 (PI-8) scored poorly (D+) on the basis that allocation formulae were not transparent and information was released too late to change LG budgets effectively. Overall fiduciary risk rating for the budget component is Substantial. Detailed analysis of the fiduciary risk is shown in table 1.
B) Treasury
The introduction of Treasury Single Account (TSA) has improved the predictability of funds to Ministries, Agencies and Local Government. As part of the effort to improved cash management in government, the implementation of the first phase of the Treasury Single Account (TSA) framework targeting Central Government connected to the IFMIS was launched in October 2013. During FY 2014/2015 TSA framework targeting donor funded projects and local government was also developed, initial consultation took place with the development partners (DPs) and other stakeholders. DPs were agreeable (in principle) to the implementation of the framework in donor funded projects. The framework will subsequently be implemented once outstanding operational and legal issues are resolved. The GoU also intends to implement the TSA framework in local government thereafter.
There is progress in quarterly cash flow forecasts, issuance of quarterly ceilings to Ministries, Departments and Agencies (PEFA 2012). Some improvements to cash management have been achieved through quarterly cash flow forecasts and the issuance of quarterly ceilings to MDAs.
The TSA is on IFMIS, which improves cash management and consolidates government bank accounts. Domestic and external debt records are substantially complete and reconciled.
There is limited reliance on quarterly work plans and cash need projections by Ministries, Departments, Agencies and Local Governments due to lack of credibility of cash forecast and plan. Bank reconciliations still are not carried out on a regular basis, particularly for holding accounts, as noted in the OAG special investigation report on the OPM fraud.
Overall fiduciary risk rating for the Treasury component is Medium. Detailed analysis of the fiduciary risk is shown in table 1.
C) Internal controls
The legislative and regulatory frameworks in Uganda provide a reasonably sound base, which is understood by those directly involved in its implementation. A commitment control system is in place, whereby controls in the IFMIS prevent any commitment that would result in cumulative expenditure exceeding the budget and quarterly cash allocations. However, this system is bypassed and manual commitments (for example purchase orders) are generated outside the system. The OAG’s reports and the findings of special investigations highlight significant problems with records management and overall compliance with internal procedures leading to fund misappropriation and fraudulent activities. There is little visible enforcement of regulations, especially at higher levels, which builds a culture of disrespect for the law and personal impunity (PEFA 2012).
The performance of internal audit shows that all key MDAs have Internal Audit Departments (IADs) reporting administratively to the heads of their agencies and functionally to Audit Committees.
XXXV
The review of payroll controls shows that there are inconsistencies between the various personnel records held by different organizations. There is a lack of regular reconciliations of teacher records and civil servant records with the respective payrolls.
The introduction of the Integrated Personnel and Payroll System (IPPS) is designed to address some of these issues, but there have been delays in its implementation and problems with overall project management which are impacting on data controls and integrity.
Because of the previous reported significant fiduciary risks by both the OAG and the Internal Auditor General (IAG), the GoU embarked on decentralizing its payroll so as to hold accounting officers at both central and local governments responsible. Decentralizing of payroll was also as a way of curbing inefficiencies and frauds e.g. the pension scandal in which ghost workers were paid. Payroll and pension control has also improved through the introduction of a computerized Integrated Personnel and Payroll System (IPPS). However, with the above controls related to payroll, there still exists inconsistences between personnel records and personnel database and lack of regular reconciliations between civil servants records and their respective payrolls.
Another scandal which occurred in 2013 was the loss of funds at the Office of the Prime Minister (OPM). This scandal necessitated the improvement of controls related to impress management whereby new low thresholds were set. Payment of suppliers directly where necessary was adopted minimising the amount of cash directly withdrawn by staff members. The risk of funds losses is however still present as a result of cash advances to staff as outstanding advances are not always validated and reconciled at the end of the year.
The use of the commitment control system has also improved with IFMIS. The system does not allow any commitments by an MDA on the system for goods and services that are not supported by available funds, but IFMIS is sometimes bypassed, i.e. commitments are made outside the system. Bank reconciliations are done automatically once the transactions data from the Bank of Uganda (BoU) is uploaded onto the IFMIS system.
Management does not take keen interest in reviewing of internal audit reports and implementation of recommendations. Some internal audit units for autonomous bodies have no approved formal internal audit charter that spells out goals, objectives and core responsibilities of its internal audit function. Some internal audit functions have not adopted the risk based methodology to management of risk, contrary to the charter for Internal Audit function (November 2008) developed by Treasury and contemporary internal audit practice. (Uganda PFM Reform Strategy July 2014-June 2018).
Overall fiduciary risk rating for the internal control component is high. Detailed analysis of the fiduciary risk is shown in table 1.
D) Accounting and Financial Reporting
The Public Finance Management Act was enacted into law in March 2015 setting the stage for a wide range of reforms and changes in the public financial management agenda of the Government of Uganda (GoU). Also, the GoU has come up with the Public Financial Management (PFM) Reform Strategy (FY 2014/2015-FY 2017/18 which entails strengthening of the PFRM reforms at all levels of Government and ensuring efficient, effective and accountable use of public resources.
The Integrated Financial Management Information System (IFMIS) is in operation covering the Central government. Fifty-six out of 143 local government agencies are now running on IFMIS. The system has proved to be useful for payments and tailor made reports including donor reports.
XXXVI
During the FY year 2014/2015, there was a significant improvement in the quality of financial reporting from 58% to 70% in the proportion of MDAs submitting financial reports in compliance with the public finance and accounting regulations. This was largely due to an increase in the effective utilisation of the IFMIS by MDA’s.
The 2014/2015 GoU were prepared on time and submitted to the OAG. The audited accounts were submitted to parliament in December 2015. No consolidation of parastatals was included but there is a note on the performance of the various parastatals. Harmonization of all GoU entities financial years is expected in three years’ time.
Despite all the positive achievements aiming at improving the fiduciary environment, the OAG continues to raise significant findings in his annual audits over the years. The OAG in the 2014/2015 audit reports gave various recommendations including, mismanagement of funds under the Ministry of local government, diversion of funds including lack of funds accountabilities, lack of consolidated local government annual accounts, irregular payments to pensioners and various recommendations relating to failure by the GoU in nugatory expenditure.
Overall fiduciary risk rating for the accounting and financial reporting component is Substantial. Detailed analysis of the fiduciary risk is shown in table 1.
F) External audit
The Office of the Auditor-General (OAG) is responsible for auditing all public funds and is a member of INTOSAI, AFROSAI and AFROSAI-E. It conducts its audits in adherence to international auditing standards. The OAG mandate under Article 163 (3) of the Constitution of the Republic of Uganda and as amplified by Sections 13 (1) and 18 of the National Audit Act, 2008, is to audit and report to Parliament on the Public Accounts of Uganda and of all Public Offices including the courts, the central and local government administrations, universities and public institutions of like nature, and any public corporations or other bodies established by an Act of Parliament. Article 163 (3) (b) requires the Auditor General to conduct Financial and Value for Money audits in respect of any project involving public funds.
According to the Extracts of the summary of Key Findings of the Annual Report of the OAG For the financial year 2014/2015, the OAG had planned to conduct 1,403 audits but ended up doing 1,423 as at March 2015. Significant increase was recorded in local authority’s audits. Out of this, 107(98%) were MDA’s and 1,074 (100%) were local authorities. Other audits conducted were donor funded projects (99-74%), statutory authorities (76-84%), Value for money/specialised audits (15-94%) and special/investigations audits (57-100%). The OAG plans to conduct over 2000 audits in the 2015/2016 financial year.
Of all statements for the 2013/2014 financial year audited, 70% had unqualified opinions for the central government, 69% for local governments and 60% for statutory authorities. Disclaimer and adverse opinions were less than 3% with the rest (up to 30%) being qualified opinions.
The OAG listed some key findings which require urgent intervention including irregular payments to pensioners, outstanding court awards and compensations, unsustainable pension liability, mismanagement of funds under the Ministry of local government among other key findings.
Over the years, commendable progress has been registered in the proportion of external audit reports submitted to parliament within the statutory period except only in FY 2013/2014 where there was a drop. Percentage of external audit reports both local and central government submitted to parliament within the statutory period were 69% in FY 2010/2011, 70% in FY 2011/2012, 90% in FY 2012/2013, 67% in FY 2013/2014 and 96% in FY 2014/2015.
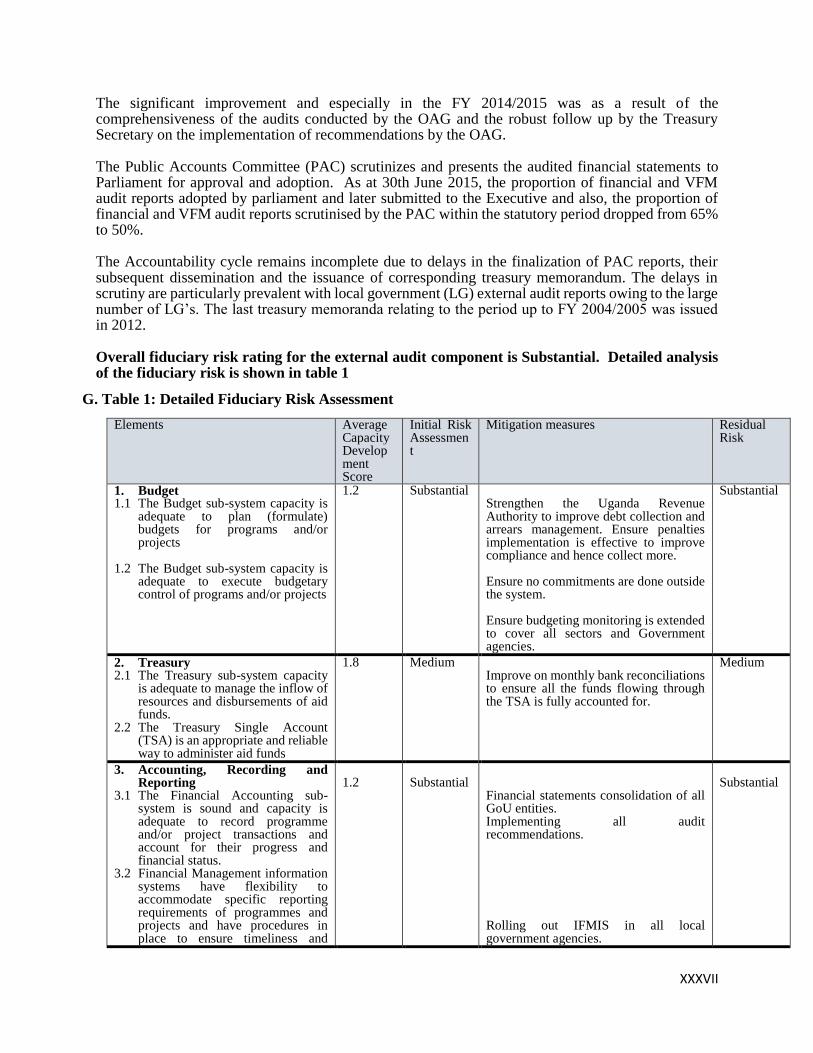
XXXVII
The significant improvement and especially in the FY 2014/2015 was as a result of the comprehensiveness of the audits conducted by the OAG and the robust follow up by the Treasury Secretary on the implementation of recommendations by the OAG.
The Public Accounts Committee (PAC) scrutinizes and presents the audited financial statements to Parliament for approval and adoption. As at 30th June 2015, the proportion of financial and VFM audit reports adopted by parliament and later submitted to the Executive and also, the proportion of financial and VFM audit reports scrutinised by the PAC within the statutory period dropped from 65% to 50%.
The Accountability cycle remains incomplete due to delays in the finalization of PAC reports, their subsequent dissemination and the issuance of corresponding treasury memorandum. The delays in scrutiny are particularly prevalent with local government (LG) external audit reports owing to the large number of LG’s. The last treasury memoranda relating to the period up to FY 2004/2005 was issued in 2012.
Overall fiduciary risk rating for the external audit component is Substantial. Detailed analysis of the fiduciary risk is shown in table 1
G. Table 1: Detailed Fiduciary Risk Assessment
Elements Average Capacity Development Score
Initial Risk Assessment
Mitigation measures Residual Risk
1. Budget 1.1 The Budget sub-system capacity is
adequate to plan (formulate) budgets for programs and/or projects
1.2 The Budget sub-system capacity is adequate to execute budgetary control of programs and/or projects
1.2 Substantial Strengthen the Uganda Revenue Authority to improve debt collection and arrears management. Ensure penalties implementation is effective to improve compliance and hence collect more. Ensure no commitments are done outside the system. Ensure budgeting monitoring is extended to cover all sectors and Government agencies.
Substantial
2. Treasury 2.1 The Treasury sub-system capacity
is adequate to manage the inflow of resources and disbursements of aid funds.
2.2 The Treasury Single Account (TSA) is an appropriate and reliable way to administer aid funds
1.8 Medium Improve on monthly bank reconciliations to ensure all the funds flowing through the TSA is fully accounted for.
Medium
3. Accounting, Recording and Reporting
3.1 The Financial Accounting sub-system is sound and capacity is adequate to record programme and/or project transactions and account for their progress and financial status.
3.2 Financial Management information systems have flexibility to accommodate specific reporting requirements of programmes and projects and have procedures in place to ensure timeliness and
1.2
Substantial
Financial statements consolidation of all GoU entities. Implementing all audit recommendations. Rolling out IFMIS in all local government agencies.
Substantial
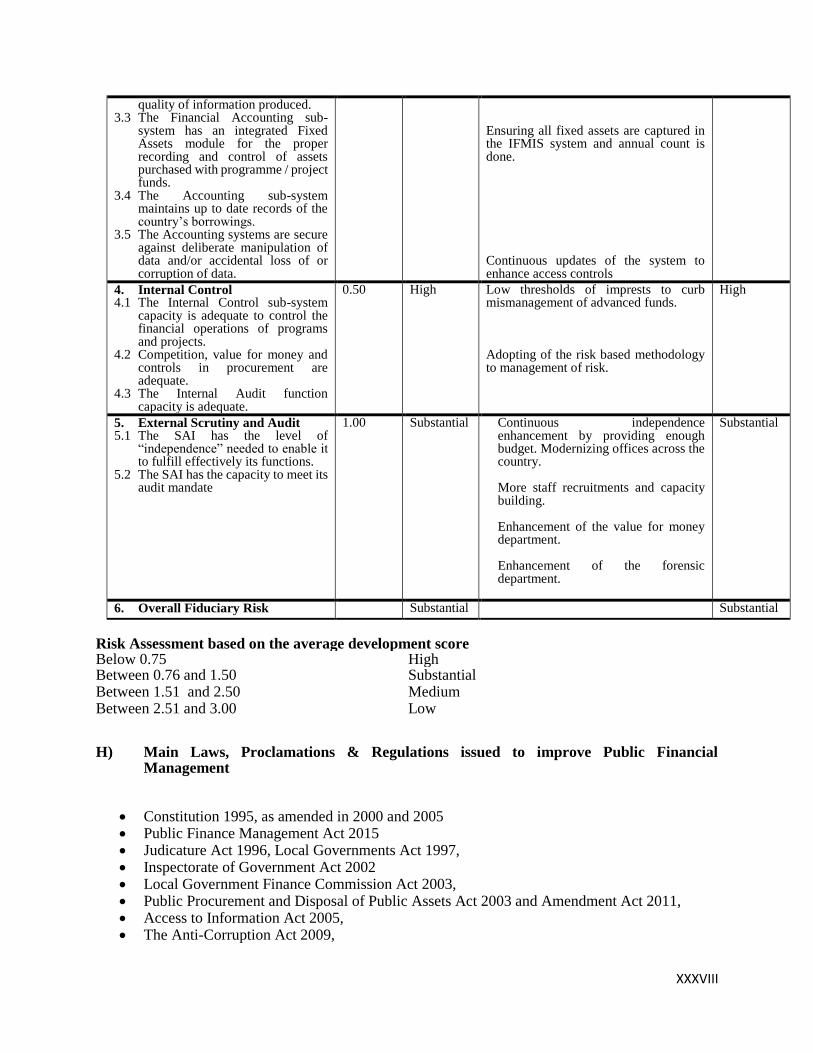
XXXVIII
quality of information produced. 3.3 The Financial Accounting sub-
system has an integrated Fixed Assets module for the proper recording and control of assets purchased with programme / project funds.
3.4 The Accounting sub-system maintains up to date records of the country’s borrowings.
3.5 The Accounting systems are secure against deliberate manipulation of data and/or accidental loss of or corruption of data.
Ensuring all fixed assets are captured in the IFMIS system and annual count is done. Continuous updates of the system to enhance access controls
4. Internal Control 4.1 The Internal Control sub-system
capacity is adequate to control the financial operations of programs and projects.
4.2 Competition, value for money and controls in procurement are adequate.
4.3 The Internal Audit function capacity is adequate.
0.50
High Low thresholds of imprests to curb mismanagement of advanced funds. Adopting of the risk based methodology to management of risk.
High
5. External Scrutiny and Audit 5.1 The SAI has the level of
“independence” needed to enable it to fulfill effectively its functions.
5.2 The SAI has the capacity to meet its audit mandate
1.00 Substantial Continuous independence enhancement by providing enough budget. Modernizing offices across the country. More staff recruitments and capacity building. Enhancement of the value for money department. Enhancement of the forensic department.
Substantial
6. Overall Fiduciary Risk Substantial Substantial
Risk Assessment based on the average development score Below 0.75 High Between 0.76 and 1.50 Substantial Between 1.51 and 2.50 Medium Between 2.51 and 3.00 Low
H) Main Laws, Proclamations & Regulations issued to improve Public Financial Management
Constitution 1995, as amended in 2000 and 2005 Public Finance Management Act 2015 Judicature Act 1996, Local Governments Act 1997, Inspectorate of Government Act 2002 Local Government Finance Commission Act 2003, Public Procurement and Disposal of Public Assets Act 2003 and Amendment Act 2011, Access to Information Act 2005, The Anti-Corruption Act 2009,
XXXIX
Local Government Financial and Accounting Regulations 2007 and the National Audit Act 2008.
I) PFM reforms
In recent years, there has been significant progress in the areas of PFM systems as a result of wide ranging PFM reforms. The Financial Management and Accountability Program (FINMAP) is the driving force for the improvement of the public finance management system. The current program is the third phase and has ten components, including macro-economic management, budget, payroll and pension management, public procurement, internal and external oversight, legislative review, and PFM in local governments. To implement the current Program, the government has prepared a PFM strategy for 2014-2018. The Program is being financed by DPs and the Government. The PFM reform programs have produced tangible results both at the central and local government levels. The Notable improvements are on external audit and cash management. The legal framework for PFM has been strengthened with the passage of the Public Financial Management Act 2015
J) Short-term measures to mitigate fiduciary risk
The PFM diagnostic reviews conducted in recent years indicate some weaknesses in the areas include budget credibility, enforcement of compliance with regulations, poor accountability and capacity to design and implement credible projects and programs The recently Public Expenditure and Financial Accountability (PEFA 2012) Assessment Report for the Central Government states that The structure of the Public Financial Management (PFM) system fall short of good international practice in a number of key areas and there are material weaknesses in compliance with many of the controls within the systems. ). However, there are indications that capacity development is planned to bring about change in the PFM systems. Over the last fifteen years the GoU has introduced a number of new initiatives including modern budget and financial management legislation, computerized financial management systems, a highly structured medium-term planning process, performance-oriented budget processes and associated monitoring reports as well as improvements in external audit capability. The GoU and its development partners (DPs) have invested significant time and resources in amending and enacting legislation, developing rules, regulations and procedural guidelines, and providing individual training and equipment (computers, vehicles etc.). In addition they have implemented (or are implementing) a number of computerized systems including the Integrated Financial Management System (IFMIS), the Integrated Personnel and Payroll System (IPPS) and the Output-Based Budgeting Tool (OBT).
K) Assessment of Uganda Procurement Systems
Background Uganda’s national procurement laws and regulations are governed by the Republic of Uganda’s Public Procurement and Disposal of Public Assets Act, 2003, and the Public Procurement and Disposal of Public Assets Regulations, 2014 (the “Regulations”). The Act prescribes that procurement and disposal shall be conducted in Uganda, in a manner which promotes non-discrimination from participation in public procurement; transparency, accountability and fairness and also maximizes competition, promotes economy, efficiency and achieves value for money. The Act is applicable to all public entities, i.e. ministries (including departments and agencies), state enterprises, public institutions and local authorities that benefit from public funds. The Act and the Regulations describe in detail the procedures for International and National Competitive Bidding, and other procurement methods comprising restricted domestic and international bidding, request for quotations, and single source procurement/direct contracting, including methods for disposal of surplus goods. The NCB assessment of 2010 by the African Development noted that procurement procedures presently in force in the Republic of Uganda and of the bidding documents currently in use are generally consistent with the Banks Rules and Procedures. However, there are deviations and omissions in the Public Procurement
XL
& Disposal of Assets (PPDA) act, regulations and standard bidding documents, deemed not consistent with Bank’s fiduciary obligations and best practices. These deviations, as indicated in Table 2 below, are highlighted in the Letter of Agreement for Application of National Procurement Procedures for National Competitive Bidding for project financed by the African Development Bank signed between the Bank and the Government of Uganda on 18 May 2015. In terms of institutions, the Act established the Public Procurement and Disposal of Public Assets Appeals Tribunal (PPDAAT), Public Procurement and Disposal of Public Assets Authority (PPDA), Contracts Committees in all Procuring and Disposal Entities (PDEs), Procurement and Disposal Units, (PDUs) and Bid Evaluation Committees for effective management of public procurement. The PPDA is an autonomous body corporate with perpetual succession and a common seal established with the objective to ensure application of fair competitive, transparency in the procurement process, non-discrimination and value for money procurement and disposal standards and practices; harmonized procurement and disposal policies, systems and practices; set standards; monitor compliance; and develop capacity. The Act establishes a Board of Directors to execute the functions and powers of the PPDA to formulate policy and to approve the budget. Progress and challenges for the ongoing reform Uganda has a fairly robust public procurement law. The law is complemented by Regulations, Guidelines, Forms, Codes of Conduct, Standard Bidding Documentation and Circulars. Act, backed by detailed regulations and Standard Bidding Documents (SBDs). These serve to guide all stakeholders (PPDA, Procurement Entities, Service Providers and Civil Society) to effectively carry out their functions as required by the law and good practice. This is a very important factor in light of the fact that public procurement expenditures in Uganda represent about 50% of the total budget and could be as high as 12% of the Gross Domestic Product (GDP) and therefore, the country needs a robust public procurement system to ensure that its resources are not wasted, but are efficiently utilized for the much-needed economic growth. In this regard, the law and the attendant Regulations and SBDs provide a basic platform for a sound public procurement system that should enable the country to implement public procurement in a non-discriminatory manner and achieve value for money. In addition, it is a good basis for meeting public procurement objectives, ensuring transparency, and creating equal opportunity for all potential bidders. Despite the inherent soundness of the legal, regulatory and institutional framework, building strong national institutions that have effective sustainable systems in the RMCs is one of the Banks efforts. The Central Government Public Expenditure and Financial Accountability Assessment Report (PEFA) 2012 is the latest independent report available on performance of Public Financial Management Systems in Uganda. The Bank’s 2016 Assessment of the Countries Procurement System based on OECD/DAC Methodology for Assessing (MAPS) established notable improvements in the country procurement system so far. Legislative and Regulatory Framework The legal and regulatory instruments is derived from the National Constitution, PPDA Act; detailed regulations; procedures; and bidding documents that are formally in use. Uganda has a fairly robust public procurement law. The law is complemented by Regulations, Guidelines, Forms, Codes of Conduct, Standard Bidding Documentation and Circulars which are explicit and accessible to the public in print and web portal. It covers goods, works services (consulting and non-consulting) and is applicable to all public entities, i.e. ministries (including departments and agencies), state enterprises, public institutions and local authorities which benefit from public funds. Procurement methods are well established and applied competitively in accordance with international practice. However, there are no specific provisions for participation of government owned enterprises in procurement. This risk is mitigated through the bidding documents for procurement of goods, works and consulting services which require that for state-owned enterprises to be eligible to participate in public procurement, they should be legally and financially autonomous and operate under commercial law. None of the government owned enterprises meets the eligibility requirements and are, therefore, effectively restrained from participation in public procurement.
XLI
Institutional Framework and Management Capacity The institutional framework looks at the integration and mainstreaming of public systems into the broader public sector governance system and whether managerial and technical capacity exist and are adequate to handle procurement without unnecessary cost and/or delay. The framework also examines the existence of a regulatory and discharge of its core mandate. Section 5 of the Act establishes the Public Procurement and Disposal of Public Assets Authority (PPDA). The objectives of PPDA are derived from section 6 of the PPDA Act, 2003 and they are to ensure the application of fair, competitive, transparent, non-discriminatory and value for money procurement and disposal standards and practices; harmonize the procurement and disposal policies, systems and practices of the central government, local governments and statutory bodies; set standards for the public procurement and disposal system in Uganda; monitor compliance of procuring and disposing entities; and build procurement and disposal capacity in Uganda. In Uganda, procurement and disposal planning are central to proper procurement management. Section 58 of the Act provides for procurement and disposal planning based budget preparation procedures issued by the minister of finance. User departments are required to prepare a multi-annual, rolling work plan for procurement based on the approved budget, which are be submitted to the PDU to facilitate orderly execution of annual procurement activities. In terms of institutional capacity development, PPDA is mandated to develop procurement capacity. To this end, PPDA has, since 2003 to date trained 24,000 stakeholders’ involved in public procurement and these include Accounting Officers, Procurement Officers; members of the user departments; Members of the Contracts committee; Political Leaders; civil society and service providers. In spite of these achievements, the capacity Building efforts that PPDA has undertaken in the past has been described as ineffective because of various reasons such as the limited set of approaches, content, and quality that do not meet the stakeholder expectations and the increasing number of personnel in need of capacity building. This indirectly affected the public procurement operations, which in turn affected the efficiency and performance of public procurement. To minimize this effect, PPDA in its Strategic Plan for FY 2014-15 to 2018-19 intends to address the limitations identified in capacity building through a reoriented capacity-building program. This reoriented program will possess special features that will focus on the following strategies:
1. Broaden the capacity building tools and strategies used beyond training through identified gaps 2. Effective use of ICT in capacity building 3. Develop and Implement support and outreach plan for high spending agencies 4. Generate research and knowledge products on topical issues and disseminate 5. Collaborate with Ministry of Finance, Planning and Economic Development and relevant
stakeholder(s) to influence career progression of Procurement Staff 6. Enhance quality of certification and accreditation systems for institutions, firms, individual
consultants, standards/practices etc. Altogether, these strategies will improve the quality, content, and results of the capacity-building program. Procurement Operations and Market Practice Procurement operation and market practice relates to the efficiency and effectiveness of the procurement system at the level of the implementing entities; market response to public procurement solicitation; and quality of contract administration and payment systems. PPDA Contract audits reveal that approximately 50% of contracts are successfully implemented on time in Uganda. For the unsuccessful contracts, there is clearly wastage of resources and even worse,

XLII
intended beneficiaries miss the benefit that the successful completion would otherwise bring. While contract implementation is sometimes perceived as being outside of direct procurement, it is in fact a reflection of an effective public procurement system. The perception that it is separate from procurement is underlined by the fact that procurement personnel often do not participate or contribute to contract management. Accurate and quality reports are essential to ensure prudent management and control of contracts. The weak monitoring results in inadequate oversight in contract performance. Poor contract execution is only highlighted very late into the implementation stage. By then, any mitigation measures are insufficient to minimize the impact of failed contract execution. Bureaucratic delays in Government (mainly delays in payment, evaluation of progress reports etc.) also impacts significantly and negatively on the delivery of successful contracts. Delays in payment also lead to delayed contractor performance as contractors end up with insufficient funds to implement contracts. The delayed payments also increase the costs of future contracts. Contractors edge against delayed payments as a way of managing risks. Weak arrangements for monitoring and reporting on contract management impede timely remedial actions. There is also limited consolidation and reporting on contract management across the PDE as no single department is charged with this responsibility. While it is recognized that Government established PPDA, realigned major policies such as the National Trade policy, National Industrial Policy plus the East African Community treaties to support and streamline procurement reform, the Private Sector (particularly SME’s), has still not effectively seized the opportunities offered under public procurement. This is mainly due to the many barriers faced as they attempt to enter the public procurement market. Such barriers include; the cost, time and complexity of preparing bids as well as the inadequacy of skills and entrepreneurship. Such expertise rests largely with big companies that quite often have well-established management. Uganda’s private sector is still under-developed with the bulk of businesses (over 800,000) falling in the category of small enterprises despite the fact that they constitute 92% of all firms in urban areas and employing less than 20 employees. The Private Sector Foundation Uganda (PSFU) is the national lead partner in private sector development in Uganda. It is strengthening private sector capacity and providing a forum for policy discussion as well as maintaining dialogue, on behalf of the private sector, with government on policy issues that affect private sector development. Through these engagements, PSFU has been able to participate in various fora at national, regional and international level including Budget Sector Working Group; the Presidential Investor Roundtable; East Africa Community engagements; Prime Minister’s Forum, Presidential Economic Council; and other stakeholder engagements. Through these fora a lot has been achieved including strengthened Public Private Partnerships; improved government response to private Sector concern; increases awareness and participation by the private sector in national, regional and international trade issues and negotiations. In spite of the PSFU achievements on policy dialogue, public procurement remains a challenge for the private sector. The public procurement market ought to be focused on the SMEs and government needs to address the constraints (delivery mechanisms) faced by SMEs in preparing bids. Increased participation usually occurs where there are more opportunities for subcontracting rather than direct tendering; where SMEs must compete directly with large firms who already enjoy economies of scale. There are also delays in payment (settling of contracts) by the public sector and uncertainty of guarantees. This constrains private sector cash flows as it ties up capital. Tendering procedures continue to be unclear to small bidders. Political interference in the tendering process is commonplace especially at local governments. In the construction industry, awarding of tenders to local constructors is constrained because of lack of capacity in terms of sufficient capital and the quality of work is sub-optimal. Limited transparency in evaluating bids and awarding of tenders especially at decentralized levels have continued to complicate the bidding processes.
XLIII
Transparency and Integrity in the Procurement System The quality, reliability and timeliness of the internal and external checks and control systems in place to support implementation of the procurement functions has been assessed to determine the nature and scope the anticorruption measures and how this address fraud and corruption in the procurement process. Internal and External Controls The legal framework, organization, policy, and procedures providing for internal and external control and audit of public procurement which enforces the proper application of laws, regulations and procedures, have been assessed and the risk for its use has been assessed as “moderate”. Internal control mechanism and oversight functions are well documented in the PPDA Act which provided for their composition and independence in relations to their respective functions and powers. Among these are the Accounting Officer, Contracts Committee, Internal Audit, and Evaluation Committee (ad hoc). In the exercise of its powers, PPDA conducts procurement audits, compliance checks and investigations when deemed necessary. Complaint Review and Appeal Mechanism Administrative review is the process of handling complaints arising out of alleged breaches of the procurement law. An administrative review is initiated when a complaint from a bidder is made, claiming to have lost or is at the risk of losing a tender due to a breach of procurement law or as a result of errant actions by a Procuring and Disposing Entity or competitors. When a complaint is lodged, the administrative review body (i.e. the Accounting Officer or PPDA) re-examines how the Procuring and Disposing Entity managed the procurement process to determine whether it was carried out in accordance with the law. A bidder can apply for administrative review at any stage of the procurement process but in any case, within 10 working days from the date when the bidder first became aware of the circumstances giving rise to the complaint. A bidder cannot apply for administrative review after a contract has been signed. A bidder requesting for administrative review must show that there has been an omission or breach of the PPDA Act, Regulations, and guidelines, provisions of the standard bidding documents or best practices by a Procuring and Disposing Entity. A complaint is first submitted to the Accounting Officer upon payment of a prescribed fee. A complaint should be submitted within 10 working days from the date the bidder first became aware or ought to have become aware of the facts giving rise to the complaint. If a bidder is not satisfied with the Accounting Officer’s decision, or where the Accounting Officer does not issue his decision within 15 working days, the bidder may appeal to the Authority within 10 working days. A bidder may appeal to the PPDA Appeals Tribunal where a bidder is aggrieved by a decision of the Authority in an administrative review; the Authority does not issue a decision in respect of a review of the decision by the Accounting Officer within 15 working days; and the bidder alleges that the Authority cannot handle a review impartially. The appeal to the Tribunal should be made within 10 working days from the date the decision appealed against is made. The Appeals Tribunal sits as a quasi-judicial body to handle applications (appeals) brought before it. Members of the Tribunal and the Registrar are expected to have a good understanding of the procurement laws and procedures in order to adjudicate matters before the Tribunal effectively. The PPDA Appeals Tribunal (the Tribunal) is created under the PPDA law but is independent of PPDA in its composition, funding, accountability and execution of its mandate. The amendment to the Public Procurement and Disposal of Public Assets Act in 2011 provided for among other things, the establishment of the Public Procurement and Disposal of Public Assets Appeals Tribunal (the Tribunal) as an independent body. The Tribunal’s core function is to hear applications for review of decisions of the Public Procurement and Disposal of Public Assets Authority
XLIV
(PPDA) made to it by aggrieved bidders or aggrieved procuring and disposing entities. The Tribunal also has power to hear matters referred to it by PPDA. Part VIIA of the PPDA Act provides a framework for the delivery of the Tribunal’s mandate. The Tribunal came into being in July 2014. Its five pioneer members, all appointed from among members of the private sector, were sworn into office on 13th August 2014 with an Acting Registrar seconded to the Tribunal from the Ministry of Justice and Constitutional Affairs. The existing complaints system has been reviewed to ensure that it sets out clear specific conditions that provide for fairness, independent and due process, and the risk for its use in Bank-financed projects is rated at “substantial” because the decisions rendered by the complaints bodies are usually not rendered in a timely manner and thus unduly delay procurement processes. Corruption External oversight function on corruption is mainly undertaken by a number of anti-corruption initiatives and legislation such as the Anti-Corruption Act 2009; the Penal Code 1950; the Inspectorate of Government Act 2002; the Public Finance and Accountability Act 2015 (PFAA); the Leadership Code Act 2002 (LCA); the Public Prosecution and Disposal of Public Assets Act 2003; The Whistle-blowers Protection Act 2010; and the Audit Act 2008. These initiatives are backed by a number of agencies such as The Inspectorate of Government, Anti-Corruption Court, Directorate of Ethics and Integrity, Inter Agency Forum, Directorate of Public Prosecutions, Auditor General. The nature of corruption in Uganda is a subject of some debate and it was ranked 139th out of 168 with a score of 25 according to Global Corruption Perception Index 2015 report. Despite fairly elaborate formal control mechanisms, corruption continues to be a major problem. Anti-corruption agencies are understaffed and underfinanced, which greatly undermines their practical capacity to enforce legislative measures to combat corruption. Although Uganda has certain initiatives in place to combat corruption, including the anti-corruption bill of 2009 and the Anti-Corruption Court, the resources to enforce them are generally lacking. The Anti-Corruption Act 2009 has the potential to affect positive developments in Uganda's fight against corruption. Although the nature of the results of this act will be dependent upon the effectiveness of its implementation. Remaining Challenges Uganda has established a robust regulatory and institutional framework for public procurement. In the last 10 years, the focus has been on enhancing transparency and accountability, building capacity of the various stakeholders and monitoring compliance with set standards. In terms of the National Procurement Systems, it is noted that significant progress has been made in the amended law to address deviations in the MAPs Assessment of June 2011 by the Bank. Based on PPDA strategic plan 2013/14 – 2018/19, the remaining challenges for government is to build on the achievements made in the last 10 years and shift focus to addressing the key constraints to the achievement of value for money, particularly the need to move beyond compliance with the rules to;
a. Strengthening transparency and accountability in procurement b. Enhance the efficiency of public procurement process by reducing lead times. c. Strengthen contract management and performance d. Increase competition and hence contribute to domestic industry development e. Enhance the performance of public procurement beyond compliance f. Increase technology use through e-procurement to improve procurement outcomes. g. Enhance the effectiveness of capacity building, research and knowledge management h. Leverage and enhance PPDA partnership and collaboration with other stakeholders i. Strengthen internal capacity to deliver performance of public procurement
XLV
Level of Recommendation for use of the Country Procurement System
Based on the remaining issues identified within Uganda’s Procurement System, the risk for its use in Bank-financed project is globally rated as “moderate”. In order to bring this risk level down to “low”, the Bank will make its decision on the use of the BPS at the stage of preparation/appraisal of a given project, depending on: (i) the current status of the identified discrepancies; (ii) the outcome of the sector market analysis; (iii) the amount and complexity of transactions; (iv) the procurement methods to be used; (v) the Bank’s oversight arrangements (prior and post); and (vi) any other specific recommendations to be taken at the level of the Executing Agency to ensure adequate overall capacity and performance to implement procurement actions under the project in accordance to Bank Procurement Policy. The following table proposes a list of actions to address the discrepancies identified among the 21 critical sub-indicators, which will be discussed with the Government as part of the Bank’s ongoing dialogue. Appendix 1 Table 2: Deviations Identified in the Uganda/Borrower Procurement System
Pillar N°
Sub-indicator
Identified discrepancies Proposed Reform Actions
1
1(d) Specific rules for the participation of government owned enterprises in procurement are lacking in the Act.
The legal framework needs to be revised to establish rules for the participation of government owned enterprises in procurement, and for example require that they be legally and financially autonomous and operate under commercial law.
1(f)
Method of evaluation: Regulation of the Public Procurement and Disposal of Public Assets (Evaluation) Regulations permit a merit based evaluation method (especially, in the case of text books, information technology systems and design and build contracts (cf Regulation 6(2).
The standard bidding documents for the Procurement of Supplies and for the Procurement of Works to be revised to exclude the merit based method of evaluation for Bank-financed projects
4
9(a) The Authority does not conduct regular procurement audits.
An action plan should be developed for the Authority to undertake audits on a regular basis.
12(b)
Definition of fraud and corruption: Does not cover all elements stipulated in Bank’s Policy; in particular, “coercive practices” are not included in the definition.
The SBD for the Procurement of Supplies and the SBD for the Procurement of Works shall be revised to reflect the Bank’s definition of fraud and corruption as stipulated in its Procurement Policy.
Other
Force Majeure: Clause 62 of the General conditions in the SBD for the Procurement of Works is not comprehensive enough as to the rights and obligations of parties in the event “force majeure” is invoked as a reason for release from contractual obligations.
The SBD for the Procurement of Works shall be revised to reflect the Bank’s definition of force majeure as stipulated in its Procurement Rules and Procedures and its SBDs for Works.
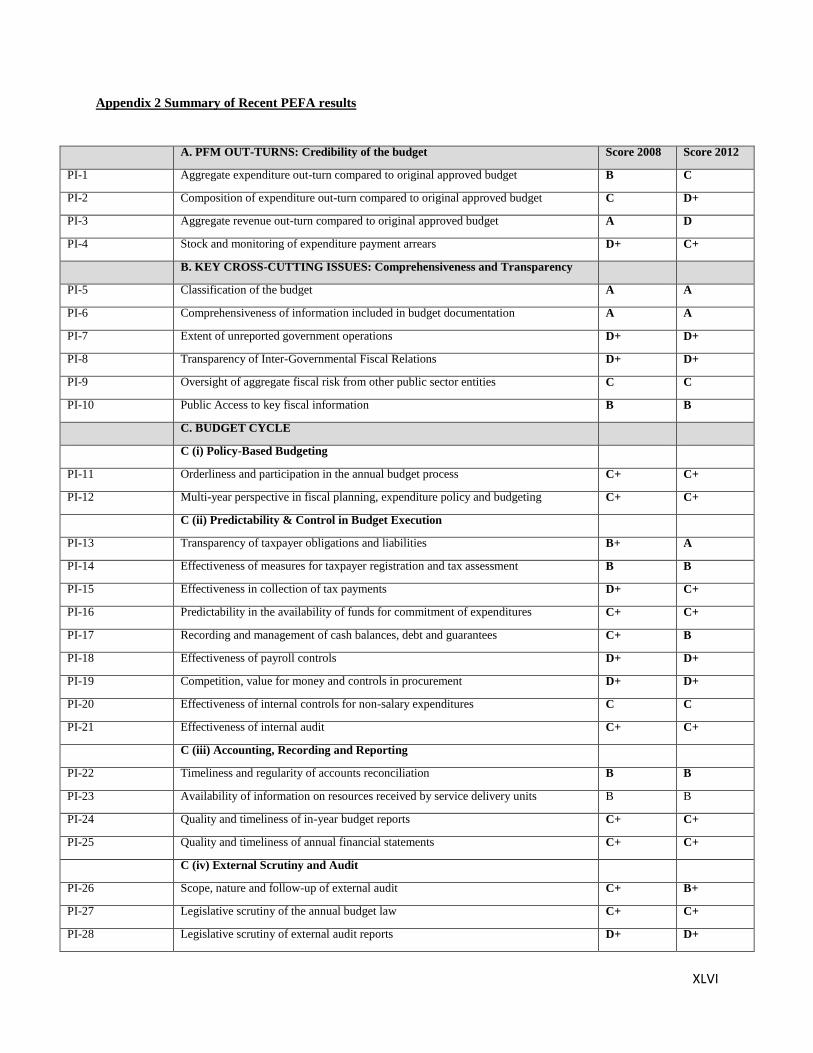
XLVI
Appendix 2 Summary of Recent PEFA results
A. PFM OUT-TURNS: Credibility of the budget Score 2008 Score 2012
PI-1 Aggregate expenditure out-turn compared to original approved budget B C
PI-2 Composition of expenditure out-turn compared to original approved budget C D+
PI-3 Aggregate revenue out-turn compared to original approved budget A D
PI-4 Stock and monitoring of expenditure payment arrears D+ C+
B. KEY CROSS-CUTTING ISSUES: Comprehensiveness and Transparency
PI-5 Classification of the budget A A
PI-6 Comprehensiveness of information included in budget documentation A A
PI-7 Extent of unreported government operations D+ D+
PI-8 Transparency of Inter-Governmental Fiscal Relations D+ D+
PI-9 Oversight of aggregate fiscal risk from other public sector entities C C
PI-10 Public Access to key fiscal information B B
C. BUDGET CYCLE
C (i) Policy-Based Budgeting
PI-11 Orderliness and participation in the annual budget process C+ C+
PI-12 Multi-year perspective in fiscal planning, expenditure policy and budgeting C+ C+
C (ii) Predictability & Control in Budget Execution
PI-13 Transparency of taxpayer obligations and liabilities B+ A
PI-14 Effectiveness of measures for taxpayer registration and tax assessment B B
PI-15 Effectiveness in collection of tax payments D+ C+
PI-16 Predictability in the availability of funds for commitment of expenditures C+ C+
PI-17 Recording and management of cash balances, debt and guarantees C+ B
PI-18 Effectiveness of payroll controls D+ D+
PI-19 Competition, value for money and controls in procurement D+ D+
PI-20 Effectiveness of internal controls for non-salary expenditures C C
PI-21 Effectiveness of internal audit C+ C+
C (iii) Accounting, Recording and Reporting
PI-22 Timeliness and regularity of accounts reconciliation B B
PI-23 Availability of information on resources received by service delivery units B B
PI-24 Quality and timeliness of in-year budget reports C+ C+
PI-25 Quality and timeliness of annual financial statements C+ C+
C (iv) External Scrutiny and Audit
PI-26 Scope, nature and follow-up of external audit C+ B+
PI-27 Legislative scrutiny of the annual budget law C+ C+
PI-28 Legislative scrutiny of external audit reports D+ D+

XLVII
D. DONOR PRACTICES
D-1 Predictability of Direct Budget Support D D
D-2 Financial information provided by donors for budgeting and reporting on project and program aid
C C
D-3 Proportion of aid that is managed by use of national procedures D D
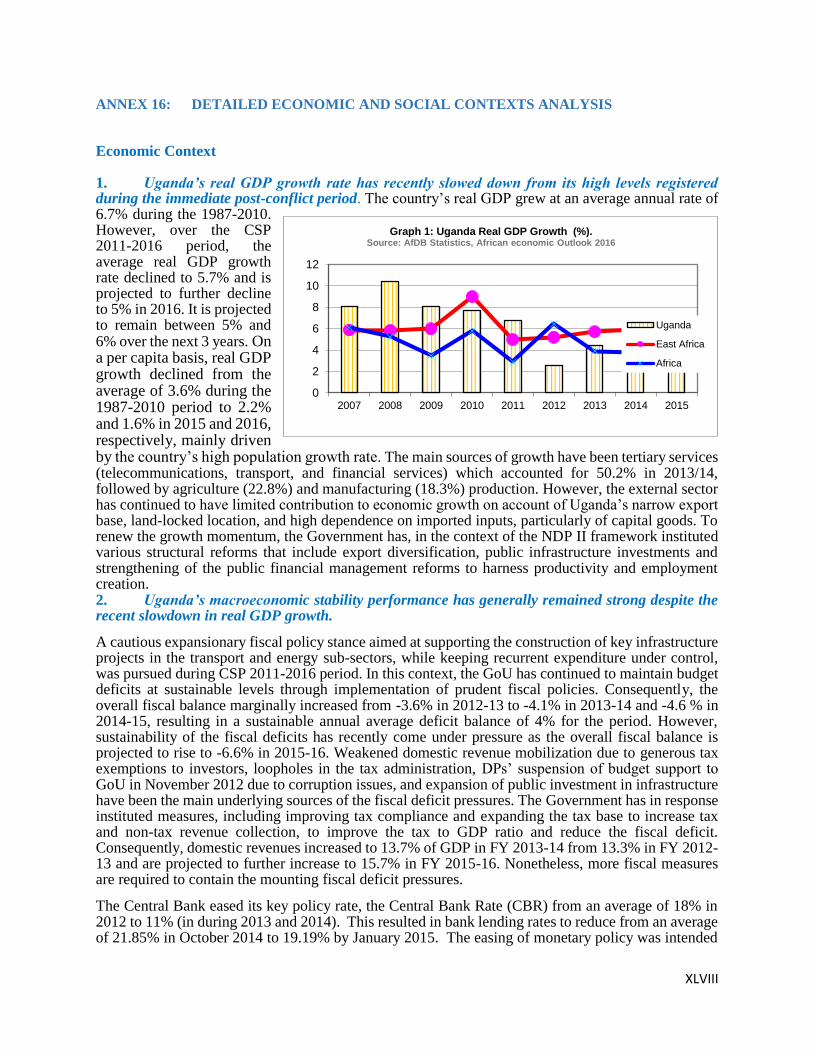
XLVIII
ANNEX 16: DETAILED ECONOMIC AND SOCIAL CONTEXTS ANALYSIS
Economic Context 1. Uganda’s real GDP growth rate has recently slowed down from its high levels registered during the immediate post-conflict period. The country’s real GDP grew at an average annual rate of 6.7% during the 1987-2010. However, over the CSP 2011-2016 period, the average real GDP growth rate declined to 5.7% and is projected to further decline to 5% in 2016. It is projected to remain between 5% and 6% over the next 3 years. On a per capita basis, real GDP growth declined from the average of 3.6% during the 1987-2010 period to 2.2% and 1.6% in 2015 and 2016, respectively, mainly driven by the country’s high population growth rate. The main sources of growth have been tertiary services (telecommunications, transport, and financial services) which accounted for 50.2% in 2013/14, followed by agriculture (22.8%) and manufacturing (18.3%) production. However, the external sector has continued to have limited contribution to economic growth on account of Uganda’s narrow export base, land-locked location, and high dependence on imported inputs, particularly of capital goods. To renew the growth momentum, the Government has, in the context of the NDP II framework instituted various structural reforms that include export diversification, public infrastructure investments and strengthening of the public financial management reforms to harness productivity and employment creation. 2. Uganda’s macroeconomic stability performance has generally remained strong despite the recent slowdown in real GDP growth.
A cautious expansionary fiscal policy stance aimed at supporting the construction of key infrastructure projects in the transport and energy sub-sectors, while keeping recurrent expenditure under control, was pursued during CSP 2011-2016 period. In this context, the GoU has continued to maintain budget deficits at sustainable levels through implementation of prudent fiscal policies. Consequently, the overall fiscal balance marginally increased from -3.6% in 2012-13 to -4.1% in 2013-14 and -4.6 % in 2014-15, resulting in a sustainable annual average deficit balance of 4% for the period. However, sustainability of the fiscal deficits has recently come under pressure as the overall fiscal balance is projected to rise to -6.6% in 2015-16. Weakened domestic revenue mobilization due to generous tax exemptions to investors, loopholes in the tax administration, DPs’ suspension of budget support to GoU in November 2012 due to corruption issues, and expansion of public investment in infrastructure have been the main underlying sources of the fiscal deficit pressures. The Government has in response instituted measures, including improving tax compliance and expanding the tax base to increase tax and non-tax revenue collection, to improve the tax to GDP ratio and reduce the fiscal deficit. Consequently, domestic revenues increased to 13.7% of GDP in FY 2013-14 from 13.3% in FY 2012-13 and are projected to further increase to 15.7% in FY 2015-16. Nonetheless, more fiscal measures are required to contain the mounting fiscal deficit pressures.
The Central Bank eased its key policy rate, the Central Bank Rate (CBR) from an average of 18% in 2012 to 11% (in during 2013 and 2014). This resulted in bank lending rates to reduce from an average of 21.85% in October 2014 to 19.19% by January 2015. The easing of monetary policy was intended
0
2
4
6
8
10
12
2007 2008 2009 2010 2011 2012 2013 2014 2015
Graph 1: Uganda Real GDP Growth (%). Source: AfDB Statistics, African economic Outlook 2016
Uganda
East Africa
Africa
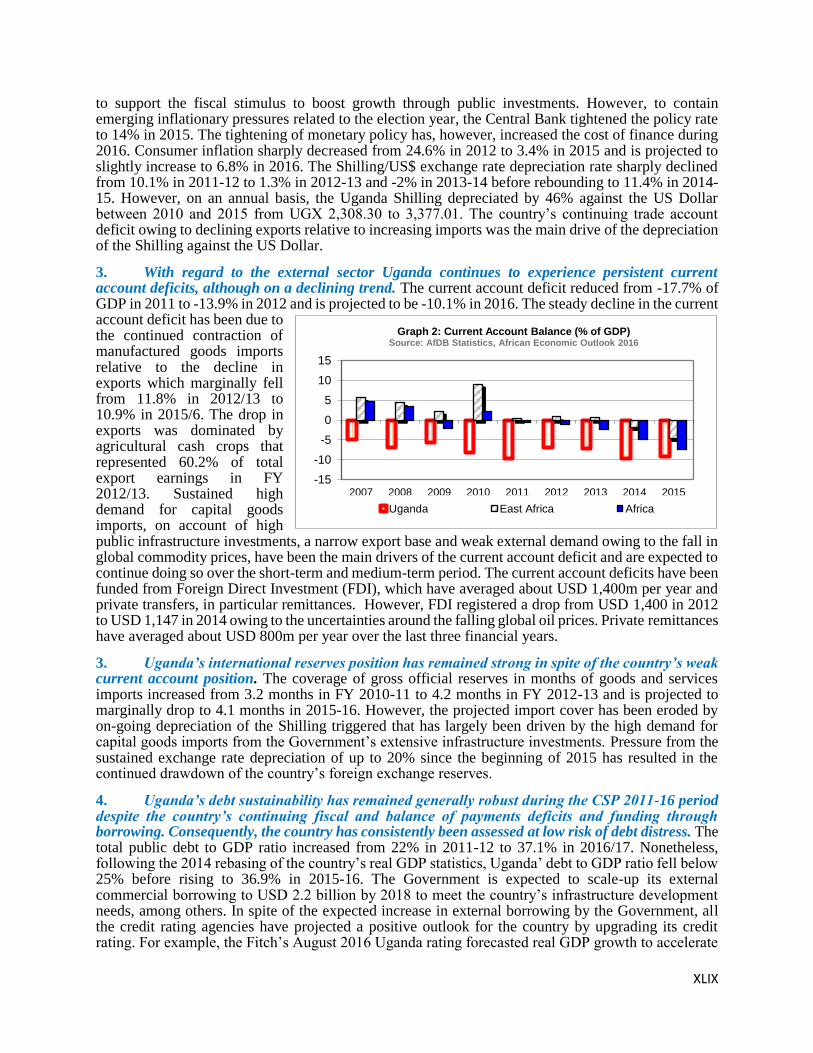
XLIX
to support the fiscal stimulus to boost growth through public investments. However, to contain emerging inflationary pressures related to the election year, the Central Bank tightened the policy rate to 14% in 2015. The tightening of monetary policy has, however, increased the cost of finance during 2016. Consumer inflation sharply decreased from 24.6% in 2012 to 3.4% in 2015 and is projected to slightly increase to 6.8% in 2016. The Shilling/US$ exchange rate depreciation rate sharply declined from 10.1% in 2011-12 to 1.3% in 2012-13 and -2% in 2013-14 before rebounding to 11.4% in 2014-15. However, on an annual basis, the Uganda Shilling depreciated by 46% against the US Dollar between 2010 and 2015 from UGX 2,308.30 to 3,377.01. The country’s continuing trade account deficit owing to declining exports relative to increasing imports was the main drive of the depreciation of the Shilling against the US Dollar.
3. With regard to the external sector Uganda continues to experience persistent current account deficits, although on a declining trend. The current account deficit reduced from -17.7% of GDP in 2011 to -13.9% in 2012 and is projected to be -10.1% in 2016. The steady decline in the current account deficit has been due to the continued contraction of manufactured goods imports relative to the decline in exports which marginally fell from 11.8% in 2012/13 to 10.9% in 2015/6. The drop in exports was dominated by agricultural cash crops that represented 60.2% of total export earnings in FY 2012/13. Sustained high demand for capital goods imports, on account of high public infrastructure investments, a narrow export base and weak external demand owing to the fall in global commodity prices, have been the main drivers of the current account deficit and are expected to continue doing so over the short-term and medium-term period. The current account deficits have been funded from Foreign Direct Investment (FDI), which have averaged about USD 1,400m per year and private transfers, in particular remittances. However, FDI registered a drop from USD 1,400 in 2012 to USD 1,147 in 2014 owing to the uncertainties around the falling global oil prices. Private remittances have averaged about USD 800m per year over the last three financial years.
3. Uganda’s international reserves position has remained strong in spite of the country’s weak current account position. The coverage of gross official reserves in months of goods and services imports increased from 3.2 months in FY 2010-11 to 4.2 months in FY 2012-13 and is projected to marginally drop to 4.1 months in 2015-16. However, the projected import cover has been eroded by on-going depreciation of the Shilling triggered that has largely been driven by the high demand for capital goods imports from the Government’s extensive infrastructure investments. Pressure from the sustained exchange rate depreciation of up to 20% since the beginning of 2015 has resulted in the continued drawdown of the country’s foreign exchange reserves.
4. Uganda’s debt sustainability has remained generally robust during the CSP 2011-16 period despite the country’s continuing fiscal and balance of payments deficits and funding through borrowing. Consequently, the country has consistently been assessed at low risk of debt distress. The total public debt to GDP ratio increased from 22% in 2011-12 to 37.1% in 2016/17. Nonetheless, following the 2014 rebasing of the country’s real GDP statistics, Uganda’ debt to GDP ratio fell below 25% before rising to 36.9% in 2015-16. The Government is expected to scale-up its external commercial borrowing to USD 2.2 billion by 2018 to meet the country’s infrastructure development needs, among others. In spite of the expected increase in external borrowing by the Government, all the credit rating agencies have projected a positive outlook for the country by upgrading its credit rating. For example, the Fitch’s August 2016 Uganda rating forecasted real GDP growth to accelerate
-15
-10
-5
0
5
10
15
2007 2008 2009 2010 2011 2012 2013 2014 2015
Graph 2: Current Account Balance (% of GDP)Source: AfDB Statistics, African Economic Outlook 2016
Uganda East Africa Africa
L
to 5.7% in FY16/17 from an estimated 4.6% in the previous fiscal year and a positive medium-term growth outlook resulting in affirming the country at B+ with a stable outlook. In addition, the IMF/World Bank debt sustainability and risk analysis (DSA) carried out in October 2012 assessed Uganda’s PPG external debt to be sustainable, with all five debt burden indicators remaining below their sustainability thresholds during the projection period of 2010-18.
5. Agricultural Sector: Uganda’s economic transformation has recently proceeded at a slow
pace. The economy continues to be dominated by the agriculture sector, which employs about two-
thirds of Uganda’s labour force, whose earnings have been the main driver of the country’s poverty
reduction. Households primarily engaged in agriculture accounted for 53% and 77% of the poverty
reduction during the 2006-10 and 2010-13 periods, respectively. Uganda is also a vital source of
agricultural products (e.g. cereals and legumes) in the East Africa region, particularly, for fragile
neighbours like Congo Democratic Republic (CDR) and South Sudan (SS). The sector has also
enabled Uganda to continue playing a critical role in tackling the regional fragility and famine
crises. Through its “no-camp” model of settling displaced persons in its communities, Uganda has
been hosting refugees from CDR and SS and others. However, in spite of its economic importance
to the country, the agricultural sector remains largely underdeveloped with performance levels
below its full potential. The sector’s contribution to GDP has declined over time (to about 25 %
currently) while the annual growth rate has averaged about 2% over the past five years due low
yields. In addition, the economic gains (i.e. employment, income, and poverty reduction) made
from the agriculture to date have been mostly from unsustainable sources such as expansion of
acres under cultivation, favourable weather and commodity prices. Innovative factors such as use
of improved inputs, production technologies, knowledge and skills, water and land resource
management, and farm to value-chain to markets connectivity have contributed very little.
6. Due to the predominance of subsistence and low levels of commercialization farming,
Uganda’s agriculture sector is characterized by the following structural deficiencies: Low
levels of research and development and innovation, low quality inputs (such as seeds and
fertilizers), low product yields and diversification, high produce wastage losses, weak land and
water resources management, and weak and uncompetitive farm to agro-processing to markets (i.e.
national, regional and global markets) linkages.Thus, to unlock and sustain the potential full
economic benefits of the agricultural sector, farmers need to transform to commercial farming. To
facilitate this transformation both public and private investments in agricultural hard (i.e. transport,
storage, logistics, water supply, sanitation, irrigation, energy, ICT) and soft (extension services,
land registration reforms, and water and land management) infrastructure and financial services
must be scaled-up, particularly in underserved locations like the northern and eastern regions.
7. Private Sector: Uganda’s private sector is still in a nascent state. Although tertiary services
have recently grown rapidly and contributed the most to GDP, the sector remains highly dependent
on scarce high level education and skilled manpower. MSMEs that mainly operate in light
industrial manufacturing and retail trade sectors dominate the private sector. These enterprises are
fragmented and not well integrated into the national, regional, and global markets and industrial
value-chains. This is because the enterprises are characterised by low and declining productivity,
low competitiveness (due to high production costs and unstable product quality), informality, low
levels of product, process, and business organization innovation, weak governance standards, and
limited access to finance, particularly long-term finance for growth. Other sector attributes include
underemployment coupled with meagre employee remuneration, restricted scale of operation, and
vulnerability to external economic, geo-political, and environmental shocks. Largely as a
LI
consequence of the combined effect of the foregoing structural deficiencies, the economy has over
time experienced a steady decline in the contribution of total factor productivity (TFP) to real GDP
growth, from about 34% during 1990-2000 to 28% during 2001-2010, and to 15% during 2011-
12. Development of the private sector in Uganda is also constrained by the combined effects of
underdeveloped infrastructure (i.e. transport, water & sanitation, energy, ICT, human, financial,
social, natural), high administrative tax burden, weak investor protection, cross border trade non-
tariff constraints, and poor governance.
8. To develop a robust private sector, the Government has instituted a number of policy measures, including the following: Revision of various laws and regulations to create greater government accountability and reduce the cost doing business; Implementation of an ambitious industrial infrastructure development program covering energy, water and sanitation, and transport sub-sectors, among others; Formulation of a financial literacy strategy to facilitate businesses and houses-holds greater access to financial services; Enacting, through Parliament, the PPP Act, and; Establishing a Public Private Partnership (PPP) unit at the Ministry of Finance to spearhead PPP investments. 9. The Country’s emerging oil and gas sector: GoU is currently working to establish key institutions to support development of the country’s nascent oil and gas industry. This is to ensure that the pace of the industry’s development is well aligned with that of the institutions responsible for its management and regulation. To facilitate this, the Bank supported the National Seminar on Managing Oil Revenue in Uganda to share information on the country’s oil prospects with key stakeholders, provide a forum to discuss the National Oil and Gas Policy, propose oil and gas legislation, and also share pertinent macroeconomic and political economy experiences of other oil-producing countries. The Government has also formulated policies, laws, regulations and instruments that are required to ensure a robust and transparent oil revenue management system. Lastly, the GoU has instituted reforms to strengthen the institutional capacity of tax administration in assessing, collecting, and reporting oil revenues. 10. In support of the GoU initiatives, the Bank has funded a study to determine the potential economic benefits of the oil and gas project- The Lake Albert Basin Development Project to Uganda. The study has the following three main findings: (i) The project will create between 100,000 to 150,000 jobs through direct, indirect, and induced employment; (ii) Uganda will face the human resources challenge of not having the right number and level of certification of technicians to comply with oil and gas sector standards; (iii) Some industries will be able to meet the oil sector’s demands (in terms of supplies of the right quantity and standards of products and services) while many will not due to lack of or weak technical and management capacity, and; (iv) To ensure that the country benefits for the oil and gas resources, the Government must promote the development of Ugandan companies, which must also establish partnership with knowledge institutions to produce the skilled manpower the industry needs.
11. Business Climate and Competitiveness: Uganda’s business climate remains weak and
uncompetitive. The country has generally stagnated in promoting a competitive business
environment in spite of the gains made from the Government’s previous market-based policy
reforms and increased infrastructure investment to achieve Vision 2040 objectives, Uganda has
yet to significantly improve its business climate to enhance its competitiveness. According to the
Economic Freedom Index by the Heritage Foundation /Wall Street Journal (2016), Uganda’s
overall ranking is 91st among 180 countries, and 9th in its region. Although it has improved on key
LII
indicators such as Labour Freedom (10th), Monetary Stability (72nd), and Trade Freedom (93rd),
Uganda needs to improve in the following areas vital for improving competitiveness:
Gguaranteeing and implementing property laws (126th); Ensuring Judicial Effectiveness (114th);
and Government Integrity )152nd ). The World Economic Forum 2016-17 Global Competitive
Report indicators show similar patterns for Uganda. The country’s good positioning in
macroeconomic environment (73th); innovation (12th); labor market efficiency (29th) and financial
market development (77th), are undermined by relatively weak institutions (93rd), and inadequate
infrastructure (126th). The 2017 WBG Doing Business (DB) Report ranks Uganda’s overall
competiveness at a still low position of 115th out of 190 countries, despite improving from 122nd
/189 in DB 2016. Within the EAC, the country continues to rank behind at 3rd best after Rwanda
(56) and Kenya (92), ahead of Tanzania’s (132) and Burundi (157). The underlying constraints on
the development of Uganda’s agricultural and private sectors cited-above are the main drivers of
the country’s weak business climate and low competitiveness.
12. Regional Integration: Uganda is a proactive member of the East African Community
(EAC) and the Common Market for Eastern and Southern Africa (COMESA). This is evidenced
by the Government’s acceptance and adoption of a common external tariff (CET) and free trade
agreement within the EAC Common Market Agreement. The GoU is also working with its peers
to establish a single customs territory to eliminate internal and external tariffs and reduce non-
tariff barriers (NTBs) to unlock trade. As already noted, Uganda’s membership with these regional
communities has led to a sharp increase in the country’s regional trade volumes with both export
and import benefits. The country’s exports to EAC and COMESA partners almost doubled to 25%
in 2011 from 15% 2007. The regional trade opportunity has further enabled Uganda to diversify
its exports to include manufactured products like cement, iron sheets, and plastics. These products
have also gradually substituted domestic market imports. It has further incorporated international
and regional agreements in its legal and regulatory frameworks to harmonize laws to support
customs union and common market protocols to increase competition and increase access to a
broader markets for its private sector. GoU is also actively participating in the Northern Corridor
initiative for integrating the country with the rest of East Africa. However, Uganda’s existing
transport infrastructure remains limited in both quality and quantity and, hence, is in need of
rehabilitation and expansion. To fast-track regional trade development, GoU has joined other EAC
member states to develop vital infrastructure like road, rail and pipeline networks linking the
country’s expected oil production facilities to its neighbouring markets.
13. Uganda has performed strongly in the areas of poverty and education, but poorer on prevalence of undernourishment and life expectancy. In comparison to lower-middle income peers (See Annex 11), Uganda faces challenges in the areas of poverty, corruption and public expenditure on health and education although it had stronger performance on net primary school enrolment. Stronger political economy, government investment, and access to finance will improve social inclusion and socio-economic performance. In promoting eco-friendly growth, Uganda had a stronger performance than its low-income peers in the areas of water stress, endangered species, and soil heath, but poorer on forest cover change, natural resource depletion and water quality. Compared to lower-middle income countries, Uganda faces challenges in areas of natural resource depletion and water quality. However, the country had stronger performance on water stress, soil health, and endangered species.
14. In comparison to low-income peers, Uganda had performed better with respect to CO2 emission growth trends, carbon sink, carbon intensity, CC exposure and adaptive capacity, but
LIII
poorer on climate change sensitivity (Annex 11). The country faces challenges in the areas of adaptive capacity to climate change and climate change sensitivity, but has performed better on carbon intensity, carbon sink and climate change exposure when compared to lower-middle income peers. Thus, building climate resilience into infrastructure development, energy generation and agricultural production through the appropriate interventions will improve green growth performance.
15. Natural Resources Management and Environment: Uganda has abundant natural resources, but continues to suffer from environmental degradation and climate change. Uganda’s forestry cover reduces by 90,000 Ha annually. A large proportion of the forest loss and degradation occurs on private land, which constitutes about 64% of the area of Uganda’s forest cover. Some of the key causes of forest loss include: conversion to farmland, the rapid rate of urbanization which is increasing the demand for charcoal and timber for construction and furniture. More than 93% of Ugandans depend on biomass energy derived from forestry. Generally, the primary reasons for environmental degradation in Uganda include: (i) inappropriate farming methods; (ii) increasing population on scarce land, and; (iii) wasteful use of energy resources. Furthermore, Uganda’s greenhouse emissions are expected to rise with the exploitation of the country’s oil resources. To promote environmental sustainability, Government has developed a National Climate Change Policy, and established the National Climate Change Policy (NCCP) Unit to implement the policy. In addition, a Green Growth Policy Framework and Strategy are currently under preparation.
16. The Country’s emerging oil sector: Uganda is currently working to establish key institutions to support its nascent oil industry. The Government has been keen to ensure that the pace of its oil sector development is aligned with the rate at which a number of institutions responsible for managing it are adjusting. Towards this end, the Bank in 2008 supported a National Seminar on Managing Oil Revenue in Uganda to share information on the country’s oil prospects with key stakeholders; provide a forum for the discussion of the National Oil and Gas Policy, and the proposed oil and gas legislation; and shared the macroeconomic and political economy experiences of other countries. GoU has since formulated requisite policies, laws, regulations and other mechanisms and instruments to ensure a robust and transparent system of oil revenue management. The Government has also beefed up institutional capacity for tax administration in assessing, collecting and reporting oil revenues. A Memorandum of Understanding (MOU) signed between the government of Uganda and the oil companies, namely Tullow Oil, Total and China, -on February 2014, paved the way to begin preparations for the implementation of the development phase, which will include the construction for a crude oil export pipeline, an oil refinery and a petroleum to power project.
A study was carried out to determine the potential demand of the project for goods and services with the capacity of the Ugandan market to deliver them, uncovered the following: Firstly, The Lake Albert Basin Development Project will create between 100,000 to 150,000 jobs through direct and indirect and induced employment. Whereas jobs directly related to the oil project account between 10-15% of the above, the rest of indirect and induced jobs will be created by other sectors which will benefit from the economic development triggered by the oil project. Secondly, a human resources challenge will be expected, relating to the number and level of certification of technicians, to comply with oil and gas standards. Thirdly, some industries will be able to absorb project demands while many will need to enhance their capacity in terms of production volumes and standards. For the business community to effectively respond to the demands of the oil and gas development project, they will require more visibility and information about business opportunities and investment in technology and capacity. Finally, to make national content in the oil and gas sector a success it was advised to promote the development of Ugandan companies, and by seeking partnership with Ugandan education system to produce qualified graduates for the industry. Meanwhile, there is scope for the Bank and other DPs to help GoU bridge highlighted capacity gaps that must be sealed ahead of the commencement of oil production, which is expected in 2019.
17. Uganda’s relatively strong economic growth and macroeconomic stability have been driven by a number of factors. First, the Government has continued to pursue pro-market economic reforms coupled with sound and prudent fiscal, monetary, exchange rate, and financial sector policies. These
LIV
economic policies have been targeted at achieving higher real GDP growth through containing inflation, maintaining a stable, but competitive domestic exchange rate, and a sound financial sector. Second, as already noted, the Government has instituted various fiscal policy measures to increase domestic revenue mobilization. Third, the Government has implemented large infrastructure investments in the energy, transport and logistics, water and sanitation, and agriculture infrastructure sectors. Finally, the Government has agreed and broadly complied with the IMF on a Policy Support Instrument (PSI) program and conditionality. The PSI has been critical for building and sustaining development partners and markets confidence in GoU’s commitment to pursuing sound and credible economic, structural and stabilization policies.
18. However, Uganda still faces a host of mutually re-enforcing development challenges that continue to constrain the country’s achievement of higher, inclusive, and sustainable real economic growth and therefore able to improve the quality of life of the population. The main economic development challenges include: (i) Poverty vulnerability, malnutrition and growing inequality; (ii) Economic structural deficiencies; (iii) Inadequate capital resources, and; (iv) Institutional capacity and governance weaknesses. Although Uganda’s relatively high real GDP growth has contributed to sharply reducing the country’s poverty rates (the poverty ratio declined from 56.4% in 1993 to 19.7% in 2013), poverty vulnerability to external shocks remains high. This is because the observed reduction in poverty has been mainly driven by increases in agricultural incomes from farm land expansion, high commodity prices, and favourable weather, all of which factors are highly vulnerable to external shocks and risks. Levels of commercialization and application of efficient production technologies, critical factors for achieving sustainable poverty reduction, in Uganda’s agricultural sector contribution to GDP remains very low at 26% yet it employs over 75% of the population. In addition, the reduction in poverty levels has not been accompanied by decreases in inequality. On the contrary, inequality has increased as the Uganda’s Gini Index rose from 0.36 in 1993 to 0.4 in 2013. Inequalities across regions (between rural and urban areas, and the northern and eastern parts and the rest of the country) and gender have also deteriorated owing to high youth unemployment driven by the skills mismatch, low savings and productivity among others. Several socio-economic policy interventions are under implementation to improve service delivery and enhance skills for increased household incomes.
19. Uganda’s major economic structural challenges include the following: (i) The sharp decline over time of total factor productivity contribution to real GDP growth (from 34% during 1990-2000, to 28% during 2001-2010 and to 15% during 2011-12); (ii) A nascent private sector dominated by Small and Medium-sized Enterprises (SMEs) that mostly operate in the light manufacturing and retail trade sectors that are characterised by low productivity, informal business transactions, low levels of technology innovation, poor governance, underemployment coupled with poor employee remuneration, low scale of operation, and high vulnerability to external shocks and risks; (iii) A growing tertiary services sector that contributes the most to GDP, but is highly dependent on scarce high level education and skilled manpower; (iv) An agriculture sector that is poorly commercialized with low and declining productivity and growth rates, and high vulnerability to shocks and employs two-thirds of Uganda’s labour force; Low agricultural sector productivity is attributed to poor quality of inputs, under-developed value chains, and low public and private investment in the sector; (v) Low supply of and access to affordable and appropriate finance due to financial sector underdevelopment; (vi) Poor business and investment climate characterised by high administrative tax burden, high costs of doing business, and corruption; (vii) Low education and a skills mismatch, high unemployment; worsening gender, youth, and spatial inequalities, and; (viii) High fertility rates and dependence ratios and poor working culture which undermine wealth creation. These structural challenges continue to impose binding constraints on the country’s ability to exploit its development opportunities. The latter include commercial viable oil wealth discoveries, economic integration (regional and global export market value-chains), ICT development, and urbanization. The recent launch of the Second National Development Plan (NDPII) seeks to introduce structural reforms for addressing the challenges cited above, as well as direct public investment towards growth-enabling infrastructure sectors and skills and technology development, in order to boost the country’s development opportunities.
LV
20. Significant infrastructure gaps, poor basic services delivery, and weak public institutional capacity and governance are the major underlying drivers of Uganda’s development problems. Although the GoU has continued to focus public investments on infrastructure, the country’s infrastructure remains poorly developed in terms of both quality and quantity, requiring substantial rehabilitation and development. Systems for delivering basic social services continue to be both inefficient and ineffective. Public institutional capacity weaknesses include poor public financial management systems, public investment management, and weak governance standards and compliance, particularly in enforcing the rule of law to combat corruption.
21. Therefore, to achieve higher, inclusive, and green economic growth, in addition to sound macroeconomic policies, the Government needs to also implement policies for addressing the country’s identified development challenges in a manner that facilitates exploitation of its development opportunities. These policies should essentially include both macro-level as well as micro-level policy initiatives. Macro-level policies should particularly aim at scaling up investment in infrastructure to close the existing gaps, enhancing the efficiency and effectiveness of basic services delivery systems, and strengthening the capacity of public institutions, especially in public financial and investment management. These policy initiatives should also be targeted at creating an enabling environment for promoting investments and economic diversification, particularly in the private, industrial, natural resources, agricultural, financial, and export sectors. Micro-level policies should be targeted at strengthening the country’s capital resource-base, including improving human capital (knowledge, kills and innovation), technology (to improve total factor productivity), and access to financial, natural resources (including land and mineral resources), social and political support for business development.
Social Context 22. Poverty status and Millennium Development Goals (MDGs): Uganda is among the few sub-Saharan countries that have succeeded in achieving their poverty reduction MDG. The country reduced by about halve extreme poverty levels from 56.4% in 1992/93 to 24.5% and 19.7% in 2009/10 and 2013/14 respectively, in line with its 2015 MDG target (See Annex 4 and 10). The country is also on course to achieving its goals in universal access to primary education and reduction in gender inequalities in this sector. However, progress on the other MDGs has been slow. For example, the MDG on maternal mortality, despite declining from 438/100,000 in 2011 to 310/100,000 in 2015, continues to be of grave concern, being amongst the highest in the world (see Annex 10).
23. Gender Equality and Women’s Empowerment: Progress has been made to improve the institutional and regulatory environment towards gender equality, including the reinforcement of gender in sectoral ministries, the establishment of a national institutional architecture dealing amongst others, with gender issues and the approval of legislations such as the equal opportunities act (2007), Domestic Violence Act (2010), the Prohibition of Female Genital Mutilation (2010), and amendment of the land act (2010). The Government has also ratified various international commitments, including the Convention on the Elimination of All Forms of Discrimination against Women and the Beijing Platform of Action, and it has further fully subscribed to the fifth SDG of achieving gender equality and women’s empowerment. However important gender inequalities persist despite the legal and institutional framework put in place to support gender equality. Outstanding issues disadvantaging women and jeopardising the country’s efforts to improve its development indicators which need to be addressed by public policies include: gender inequalities in the labour market. The percentages of males in wage labour remains two times higher than that of women (26%/13%). In terms of representation and gender hierarchies, women are less represented in decision making than men in parliament 35% - 65%, and are almost absent in customary structures of decision making, what affects amongst others their right to land despite legislation approved in 2013. Furthermore, despite Governments significant efforts to ensure an inclusive education, which saw a high number of girls joining primary education, their subsequent transition to secondary and university is less fluid for them than for boys. Thy as such continue to be minority in the education sector. Although GoU has instituted legislation and policy frameworks for tackling gender inequality, further effort is needed to reinforce
LVI
the gender perspective in public policies and budgets, reinforce pro-equality legislation and to strengthen women’s rights to land, assets, and inheritance as well as the efforts towards compliance of the laws.
24. Demography: Major demographic trends including rapid population growth, urbanization, and particularly a growing proportion of youth unemployment remain major social challenges. Youth unemployment in Uganda remains one of the biggest demographic challengesiii. About 48.3% of Uganda’s population are below the age of 15 years (see Annex 4) and 32% of the youth were estimated to be unemployed in 2013.The Government still faces challenges related to limited labour market capacity to absorb the large numbers of youth entering the market every year, as well as the mismatch between available skills and labour market needsiv. To address the youth problem, the Government has developed a 10-year Strategy for Uganda’s Skills Development and Vocational Training.
25. While overall poverty levels have declined, economic growth has not been inclusive due to slow structural reforms. Income inequality has been rising in recent years, with the Gini coefficient increasing from 0.42 in 2009 to 0.44 in 2012 (Human Development Report 2013). Moreover, health and education outcomes and access to basic social services have not been sufficiently inclusive, especially across regions. Spatial disparities in the incidence of poverty also exist, with Northern Uganda being the most impoverished. Therefore, pro-poor growth strategies to tackle spatial inequalities, youth unemployment and skills development, social protection to reduce the vulnerability of the poor, improvements in education retention rates for the children of chronically poor households, and introducing legislation to strengthen women’s rights to land, assets and inheritance, and supporting smallholder agriculture are required to make economic growth more inclusive.
LVII
ANNEX 17: RATIONALE & SELECTIVITY CRITERIA FOR NEWCSP STRATEGIC PILLARS &
PROGRAMS
Ugandans’ most pressing developmental challenges. Inadequate and poor quality transport, agriculture,
energy, and water and sanitation infrastructure continue to impose binding constraints on efforts to achieve
economic transformation and inclusive green growth. Hence, more public and private investments are needed
to rehabilitate and increase the quantity and quality of all infrastructure to support the development of value-
adding activities and industrialisation, and create opportunities for employment, particularly in the agricultural,
agro-processing and manufacturing sectors and promote inclusive and green growth.
Alignment to Uganda’s strategic framework. The proposed CSP pillars are aligned with Uganda’s Vision
2040 and the country’s medium term development framework and objectives of the NDPII (2015-2020) and
Vision 2020.
Alignment to the Bank’s corporate strategies. The new CSP pillars are aligned with the Bank’s TYS 2013-
22’s inclusive, and green growth twin objectives; High 5s; and following Corporate strategies-Agricultural
Transformation, Industrialization, Job for Youth Strategy, Gender, and Human Capital Strategies.
Outcome of stakeholder consultations. The two pillars and programs reflect the Bank’s comparative
advantage as agreed in the consultations the Country Team conducted with the Government and its stakeholders
on the significance of Bank support in agriculture, transport, and water and sanitation, and energy to support
Uganda’s economic transformation and industrialisation.
Sectorial focus of DPs activities. On-going DPs support to Uganda is informed by similar assessment of the
country’s need for more and better infrastructure. Infrastructure investment requirements remain high to achieve
the country’s Vision 2040. The Bank’s proposed support to agriculture, transport, energy, and water and sanitation
sub-sectors are expected to significantly contribute to the required investments.
Building on the Bank’s past achievements, comparative advantage and aid effectiveness. The Bank has a
long standing presence in the agriculture, transport, water and sanitation, and energy sub-sectors (See Annex
8). Its support has contributed to several key results, a confirmation of the Bank’s significant comparative
advantage in the three sectors. However, more investments in agriculture, transport, water and sanitation and
energy are still required for Uganda to achieve its development objectives under Vision 2040.
Lessons learned. New CSP pillars and programs incorporate CSP 2011-16 CR key lessons such as the need for
country ownership of development programs, development effectiveness, development assistance coordination and
project selectivity in a few areas of Bank’s comparative advantage to ensure quality projects for maximising
development impact.
LVIII
ANNEX 18: CONTRIBUTION OF CSP PILLARS AND PROGRAMS TO THE HIGH-5s
Feed Africa: Pillar 1 interventions in the agriculture sector will contribute to achieving feed Uganda objectives by
reversing the decline in agricultural productivity and growth. Declining productivity has been a key challenge to
attaining Uganda’s growth and poverty reduction and inclusion objectives. This will be achieved by restoring
productivity, providing quality inputs, supporting value-chains and agro-processing development, market access,
and promoting private investment and value addition economic activities in the sector. Pillar 2 interventions will
equip youth and women with farming and agribusiness skills.
Industrialize Africa: Pillar1: Agriculture sector interventions will transform the sector through development of
agricultural value-chains, and; re-focusing on and promotion manufacturing activities allied to the country’s
agricultural value-chains. Transport interventions will expand Uganda’s road network, improve the country’s
competitiveness, thereby reducing the cost of doing business and boosting value-adding activities. Water &
sanitation sector will contribute to creating an enabling environment for private investment in value addition activities with the
potential to generate formal employment opportunities. Energy sector interventions will facilitate industrialization by reducing
electricity tariffs. Pillar 2 intervention will equip youths and women with the right technical and entrepreneurial skills to meet
industry requirements. This will boost formal employment and business enterprises and ultimately local content of industrial
development activities.
Integrate Africa: Pillar 1interventions in the transport sector will expand Uganda’s road network and connectivity with
regional markets and link several regions in the country with each other to boost local economic development through reduced
transportation costs and marketability of local produces, especially in the agriculture sector. Improved access to Uganda’s
regional markets, including COMESA, will also markedly improve the country’s competitiveness, as its location
makes it a potential strategic logistics and transit hub for imports and exports to and from its landlocked
neighboring countries.
Light Up and Power Africa: Energy sector interventions will support lighting up and powering Uganda by
reducing industrial, business and retail electricity tariffs which will make power more affordable for businesses,
industrial parks, business centers and underserved house-holds and regions.
Improve the quality of life for the people of Africa: Pillar 1 interventions will improve Ugandan’s livelihoods in various ways;
Access to water and sanitation services for households in rural and small towns will reduce communicable
deceases and reduce time cost of securing water, particularly for women; The large gravity flow programs to cover
wider and water stressed areas will bring clean piped water closer to the rural communities, benefiting rural
woman in particular who often have to travel long distances to fetch water. Under Pillar 2, Bank support will
enhance employability and entrepreneurship for the youth and women, which will ultimately improve their
livelihoods. Transport investments will improve access to social services and markets; Agricultural infrastructure
will boost incomes through sustainable employment and businesses.
LIX
ANNEX 19: REFERENCES
African Development Bank (2014) ‘East Africa’s Manufacturing Sector: Promoting Technology, Innovation and Linkages. Uganda Country Report. Ministry of Finance, Planning and Economic Development. ‘Poverty Status Report: Structural Change and Poverty Reduction in Uganda’, 2014. Ministry of Trade, Industry and Cooperatives. ‘Trade, industry and cooperatives sector: issues paper for the development of the National Development Plan II, 2014. Ministry of Energy and Mineral Development, Energy and Mineral Development Sector Issues Paper for the NDP, 2014. Water and Environmental Sector (2014) ‘Input to the Second National Development Plan FY 2015/16-2019/20’. Ministry of Water and Environment, Republic of Uganda. Ministry of Agriculture, Animal Industry and Fisheries (MAAIF), ‘Agriculture Issues Paper for the Second National development Plan’, 2014. World Bank, ‘Uganda Country Diagnostics 2015. African Development Bank, ‘Uganda Gender Profile’, 2016. Millennium Development Report-Uganda, 2015 National Planning Authority. 2014. Youth Priorities in the NDP II: Increasing Opportunities for Youth for Competitiveness, Growth, and Development. Ministry of Education and Sports, Education and Sports Issues Paper. Issues Note for the Second national Development Plan FY 2014/15-2019/2020, 2014. National Planning Authority, ‘Integration of Climate Change Policy Concerns into the Second National Development Plan (NDP II)’. Final Report, 2014. National Planning Authority, ‘Analytical study on democratic governance in Uganda to support the formulation of the National Development Plan II 2015/16 -2018/2019)’, 2014. Economic Policy Research centre, ‘Dynamics of War to Peace Transition in Northern Uganda’, 2016. Ssewanyana, S., and I. Kasirye (2012) “Poverty and inequality dynamics in Uganda: Insights from the Uganda national Panel Surveys 2005/6 and 2009/10” EPRC Research Series, No 9. Uganda Bureau of Statistics, ‘GDP estimates rebased to 2009/10’, November 2014.
LX
END NOTES
i The national poverty line ranges from US$0.88 to US$1.04 2005 PPP per capita depending on the region. Poverty in Uganda is
calculated using a cost-of-basic needs approach. Consumption expenditure data collected is collected on food and non-food items
through the UNHS conducted every three to four years. The poverty line was set in 1993 by calculating the cost of consuming 3000
calories per adult equivalent to and then adding an amount (depending on the region) of non-food expenditures. The poverty line
has only been updated for the cost of inflation since then and is low by international standards. In Uganda, prosperity was shared
with the poorest segments of the population as annual consumption growth of the bottom 40 percent in the income
distribution averaged around 3 percent during 1993–2013.
ii Ministry of Finance, Planning and Economic Development. ‘Poverty Status Report: Structural Change and Poverty
Reduction in Uganda’, 2014.


![[GOU] Plan de Desarrollo UAH 2009 - 2015](https://img.pdfslide.net/doc/110x75/568c36081a28ab023596788a/gou-plan-de-desarrollo-uah-2009-2015.jpg)