Embed Size (px)
Citation preview

73
UHUO, EMMANUEL NNAEMEKA
(PG/Ph.D/10/57831)
EFFECTS OF ETHANOL, METHANOL AND N-HEXANE LEAF AND FRUIT EXTRACTS OF Kigelia africana ON SOME OXIDATIVE AND BIOCHEMICAL PARAMETERS IN
ALLOXAN-INDUCED DIABETIC RATS
FACULTY OF BIOCHEMISTRY
DEPARTMENT OF BIOCHEMISTRY
Paul Okeke
Digitally Signed by: Content manager’s Name DN : CN = Webmaster’s name O= University of Nigeria, Nsukka OU = Innovation Centre
74
EFFECTS OF ETHANOL, METHANOL AND N-HEXANE LEAF AND FRUIT EXTRACTS OF Kigelia africana ON SOME
OXIDATIVE AND BIOCHEMICAL PARAMETERS IN ALLOXAN-INDUCED DIABETIC RATS
BY
UHUO, EMMANUEL NNAEMEKA
(PG/Ph.D/10/57831)
DEPARTMENT OF BIOCHEMISTRY UNIVERSITY OF NIGERIA
NSUKKA
JANUARY, 2015
75
TITLE
EFFECTS OF ETHANOL, METHANOL AND N-HEXANE LEAF AND FRUIT EXTRACTS OF Kigelia africana ON SOME
OXIDATIVE AND BIOCHEMICAL PARAMETERS IN ALLOXAN-INDUCED DIABETIC RATS
A THESIS SUBMITTED IN PARTIAL FULFILMENT OF THE REQUIREMENTS FOR AWARD OF THE DEGREE OF
DOCTOR OF PHILOSOPHY (Ph.D) IN MEDICAL BIOCHEMISTRY, UNIVERSITY OF NIGERIA,
NSUKKA
BY
UHUO, EMMANUEL NNAEMEKA (PG/Ph.D/10/57831)
DEPARTMENT OF BIOCHEMISTRY UNIVERSITY OF NIGERIA
NSUKKA
SUPERVISORS: PROF. L.U.S. EZEANYIKA DR V.N. OGUGUA
JANUARY, 2015
76
CERTIFICATION
UHUO, Emmanuel Nnaemeka, a postgraduate student with Registration Number PG/Ph.D/10/57831 in the Department of Biochemistry has satisfactorily completed the requirements for the research work for the degree of Doctor of Philosophy (Ph.D) in Medical Biochemistry. The work embodied in this report is original and has not been submitted in part or full for any other diploma or degree of this or any other university.
PROF L.U.S. EZEANYIKA DR V. N. OGUGUA (Supervisor) (Supervisor) PROF O.F.C. NWODO EXTERNAL EXAMINER (Head of Department)
77
DEDICATION
This Thesis is dedicated wholly to God Almighty who, out of His infinite mercy granted me
good health, wisdom and ability to produce this work and the entire members of Uhuo‘s
family.
78
ACKNOWLEDGEMENTS
I sincerely wish to express my profound gratitude to my supervisors, Prof. L.U.S. Ezeanyika
and Dr V.N Ogugua, for their immense contributions, guidance, tolerance and fatherly role
throughout the course of this study. My appreciation goes to the Head of Department, Prof.
OFC.Nwodo and all the lecturers of the Department of Biochemistry- Prof. O.U. Njoku, Prof.
I.N.E. Onwurah, Prof. F.C. Chilaka and Dr Parker Elijah Joshua, for their wonderful
interactions with me all these years of my academic sojourn in the department. I happily
remember my fellow students, and colleagues whose interaction and love also made this
programme successful. I, with due respect appreciate the sacrifices of all the members of
Uhuo’s family. They have contributed immensely and May God reward them.
My sincere appreciation also goes to all the staff of Shalon Medical Laboratory for their help
in my laboratory work, Department of Botany and Crop Science University of Nigeria,
Nsukka for their help during phytochemical and proximate analyses. Included in the list of
appreciation are the staff of the Department of Home Science, Nutrition Dietetics, University
of Nigeria, Nsukka and Ogugua‘s family at Ayamelum, Anambra State for their numerous
contributions and assistance.
Calvary greetings to all members of Assemblies of God Church, Upper Housing Estate,
Abakpa, Enugu, Congratulation for prayers all these years. I must humbly appreciate the
moral support of Rev. Dr. Onyemaech Oti even when the going was so tough. Finally, may I
most humbly submit to God Almighty who has been everything good and possible to me. I
praise His Holy Name in the name of our Lord and Saviour Jesus Christ, Amen.
79
ABSTRACT
Globally, the estimated incidence of diabetes and projection for the year 2030 as given by the International Diabetes Federation (IDF) is 350 million. Kigelia africana is highly used for ethnomedicinal purposes although there is paucity of scientific information on its use. This work was therefore, aimed at evaluating the anti-diabetic and antioxidative potential of the plant. Ethanol, methanol and n- hexane extracts of the leaves of Kigelia africana were used for the study. Alloxan diabetes was induced in a total of 60 adult male albino rats weighing between 90 and 160 g. The alloxan was dissolved in cold normal saline. After 72 hr, diabetes was confirmed and the rats were divided into twelve (12) groups of five (5) rats each. Group 1 served as the normal control, group 2 was the diabetic untreated, group 3 received 2.5 mg /kg b.wt of glibenclamide, groups 4, 6 and 8 received ethanol, methanol and n-hexane leaves extract while group 5, 7 and 9 received ethanol, methanol and n-hexane fruit extract respectively of 500 mg/kg b.wt of the extracts. Groups 10-12 were administered equal combination of the leaves and fruits extracts. The rats were fed orally for 21 days after which some biochemical and oxidative parameters were statistically analysed. Phytochemical screening for different bioactive compounds was done using standard methods and indicated the presence of flavoniods, alkaloids, saponins, soluble carbohydrates, tannin, steroids, glycosides and reducing sugars. Proximate analysis revealed the presence of proteins (13.9%), carbohydrates (63.5%), fats and oil (11.4%) and crude fibre (2.2%). LD50 showed that the extracts were safe. The glucose level decreased while body weight increased in all the treated groups compared with the diabetic rats untreated. Oral administration of 500mg/kg b.w of K. africana extract significantly reduced (p<0.05), the sorbitol, glycohaemoglobin (HbA1c), total protein, and vitamin C concentrations in diabetic rats (groups 4-12) in comparison with the positive control. There were significant differences in glycohaemogolin, sobitol, total protein and vitamin C concentration in diabetic rats fed with a combination of the two parts of the plant extracts (groups 10-12) as against groups 4-9 administered single extracts. Malondiadehyde (MDA) concentration significantly decreased (p < 0.05) in all the test groups compared with the diabetic untreated rats. Low density lipoprotein, total cholesterol, and triacylgycerol levels decreased significantly (p < 0.05) in the treated groups in comparison with the positive control animals (group 3). However, administration of 500 mg/kg b.w of K. africana increased significantly (p<0.05) the high density lipoprotein (HDL) across the test groups as against the diabetic untreated group. Significant decreased (p<0.05) in the lipid profiles (except HDL) was recorded in groups 10, 11 and 12 treated with a combination of two parts (leaf and fruit) of K. africana in comparison with groups 4-9 orally fed with a single plant extract. Furthermore, the data recorded significantly increased (p < 0.05) antioxidant enzymes (SOD, CAT GPX) activities in diabetic treated groups (both combination and single) with reference to the positive control group. Similarly, significant increase (p > 0.05) of SOD and CAT activities and SOD percentage inhibition was observed in group 3 treated with 2.5 mg/kg b.wt of glibenclamide (standard) compared with all the test groups. Significant reduction (p < 0.05) in the activities of ALT, ALT and total bilirubin concentration were observed in the test groups treated with the extracts compared with the diabetic untreated rats. ALT activity and total bilirubin level decreased significantly (p < 0.05) in groups 10, 11 and 12 administered a combination of leaf and fruit extracts as against groups 4-9 treated with either leaf or fruits only. The results suggest that management and prevention of diabetic complications can be achieved by the use of K. africana.
80
TABLE OF CONTENTS
PAGE Title Page .. .. .. .. .. .. .. .. .. .. i Certification .. .. .. .. .. .. .. .. .. .. ii Dedication .. .. .. .. .. .. .. .. .. .. iii Acknowledgements .. .. .. .. .. .. .. .. .. iv Abstract .. .. .. .. .. .. .. .. .. .. vi Table of Contents .. .. .. .. .. .. .. .. .. vii List of Figures .. .. .. .. .. .. .. .. .. .. xiii List of Tables .. .. .. .. .. .. .. .. .. .. xv List of Abbreviations .. .. .. .. .. .. .. .. .. xvi CHAPTER ONE: INTRODUCTION 1.1 Kigelia africana … … … … … … … … 3
1.1.1 Description of Kigelia africana … … … … … … 3
1.1.2 Taxonomy of Kigelia africana … … … … … … 4
1.1.3 Traditional uses of Kigelia africana … … … … … … 4
1.1.4 Chemical constituents of Kigelia africana … … … … … 5
1.1.5 Antibacteria and antifungi … … … … … … … 6
1.2 Diabetes ... ... … … … … … … … 7
1.2.1 Diabetes mellitus ... ... ... ... ... ... ... ... 7
1.2.2 Diabetes Type 1 and 2 … … … … … … … 8
1.2.3 Insulin resistance … … … … … … … … 9
1.2.4 Diabetic complications … … … … … … … 10
1.3 Hyperglycemia and diabetic complication … … … … … 10
1.4 Mechanism of tissue damage mediated by hyperglycemia … … … 11
1.4.1 Aldose reductase pathway … … … … … … … 11
1.4.2 Non-enzymatic glycation … … … … … … … 13
1.4.3 Carbonyl stress in diabetes … … … … … … … 14
1.4.4 Activation of protein kinase C isoforms … … … … … 15
1.5 Oxidative stress … … … … … … … … 17
1.5.1 Mechanism of increased oxidative stress in diabetes mellitus … … 17
1.5.2 Glucose autoxidation … … … … … … … … 19
1.5.3 Free radicals … … … … … … … … 20
1.5.4 Reactive oxygen species and oxidative stress … … … … 20
1.6 Antioxidant system … … … … … … … … 22
1.6.1 Scavenging properties of antioxidants … … … … … … 23
81
1.6.2 Positive and negative effects of free radicals … … … … … 25
1.7 Lipid peroxidation … … … … … … … … 26
1.8 Antioxidant supplementation in diabetes mellitus … … … … 28
1.9 Alloxan … … … … … … … … … 29
1.9.1 Alloxan diabetes and streptozotocin diabetes … … … … … 29
1.9.2 Alloxan: Mechanism of action … … … … … … 31
1.9.3 Beta cell toxicity and diabetogenicity of alloxan … … … … 32
1.9.4 Streptozotocin: Mechanism of action and beta cell selectivity … … 35
1.9.5 Beta cell toxicity of streptozotocin … … … … … … 35
1.9 Rationale for the study … … … … … … … 36
1.10 Aim and objectives of the study … … … … … … 37
1.10.1 Aim of the study … … … … … … … … 37
1.10.2 Specific objectives of the study … … … … … … 37
CHAPTER TWO: MATERIALS AND METHODS
2.1 Materials … … … … … … … … … 38
2.1.1 Chemicals … … … … … … … … … 38
2.1.2 Instrument/Equipment … … … … … … … 38
2.1.3 Drug … … … … … … … … … … 38
2.1.4 Plant material … … … … … … … … … 38
2.2 Methods … … … … … … … … … 39
2.2.1 Animal management … … … … … … … … 39
2.2.2 Preparation of plant extracts … … … … … … … 39
2.2.3 Design of the experiment … … … … … … … 39
2.2.4 Yield of extracts … … … … … … … … 40
2.2.5 Phytochemical analysis of the crude extracts … … … … … 40
2.2.5.1 Test for the presence of alkaloids … … … … … … 40
2.2.5.2 Test for carbohydrates … … … … … … … 40
2.2.5.3 Test for reducing sugar … … … … … … … 40
2.2.5.4 Test for protein … … … … … … … … 41
2.2.5.5 Test for fats and oil … … … … … … … … 41
2.2.5.6 Test for glycosides … … … … … … … … 41
2.2.5.7 Test for acidic substances … … … … … … … 41
2.2.5.8 Test for the presence of flavonoids … … … … … … 41
82
2.2.5.9 Test for the presence of steroids … … … … … … 41
2.2.5.10 Test for tannins … … … … … … … … 42
2.2.5.11 Test for resins … … … … … … … … 42
2.2.5.12 Test for saponins … … … … … … … … 42
2.2.3.13 Test for terpenoids and steroids … … … … … … 43
2.2.6 Proximate Analysis … … … … … … … … 43
2.2.6.1 Crude protein … … … … … … … … … 43
2.2.6.2 Crude fat … … … … … … … … … 45
2.2.6.3 Moisture … … … … … … … … … 45
2.2.6.4 Ash /Mineral matter … … … … … … … … 46
2.2.6.5 Crude fibre … … … … … … … … … 46
2.2.6.6 Carbohydrate or nitrogen free extract (NFE) … … … … 47
2.2.7 Acute toxicity test … … … … … … … … 47
2.2.7.1 Determination of LD50 of the extract … … … … 47
2.2.8 Induction of diabetes … … … … … … … … 48
2.2.9 Determination of fasting and random glucose concentrations … … 48
2.2.10 Determination of sorbitol concentration … … … … … 49
2.2.11 Determination of total protein concentration … … … … … 50
2.2.12 Determination of haemoglobin glycosylation … … … … 51
2.2.13 Determination of malondialdehyde concentration … … … … 53
2.2.14 Determination of vitamin C concentration … … … … … 55
2.2.15 Assay of catalase activity … … … … … … … 57
2.2.16 Assay of superoxide dismutase (SOD) activity … … … … 58
2.2.17 Assay of glutathione peroxidase activity … … … … … 62
2.2.18 Determination of total cholesterol concentration … … … … 63
2.2.19 Determination of high density lipoprotein (HDL) cholesterol concentration … 64
2.2.20 Determination of low density lipoprotein (LDL) cholesterol concentration … 65
2.2.21 Determination of triacylglycerol concentration … … … … 66
2.2.22 Assay of aspartate aminotransferase (AST) activity … … … … 68
2.2.23 Assay of alanine aminotranferase (ALT) activity … … … … 70
2.2.24 Determination of total bilirubin concentration … … … … 71
2.3 Statistical analysis … … … … … … … … 72
83
CHAPTER THREE: RESULTS
3.1 Qualitative phytochemical composition of ethanol, methanol
and n-hexane leaf and fruit extracts of Kigelia africana … … … 73
3.2 Quantitative phytochemical composition of ethanol, methanol
and n-hexane leaf and fruit extracts of Kigelia africana … … … 75
3.3 Percentage proximate compositions of ethanol, methanol
and n-hexane leaf and fruit extracts of Kigelia africana … … … 77
3.4 Percentage yield of leaf and fruit samples of Kigelia Africana … … 79
3.5 Acute toxicity studies … … … … … … … … 81
3.6 Effect of ethanol, n-hexane and methanol extracts of leaves and fruits of Kigelia africana on sugar level of diabetic rats … … … … 83
3.7 Body weights of diabetic rats treated with ethanol, n-hexane
and methanol extracts of leaves and fruits of Kigelia africana before and after experiment … … … … … … 85
3.8 Effect of ethanol, methanol and n-hexane leaf and fruit
extract of Kigelia africana on sorbitol concentration in alloxan-induced diabetic rats … … … … … … 87
3.9 Effect of ethanol, methanol and n-hexane leaf and fruit extract of
Kigeria africana on total protein in alloxan-induced diabetic rats … … 89 3.10 Effect of ethanol, methanol and n-hexane leaf and fruit
extract of Kigelia africana on glycosylated haemoglobin concentration in alloxin-induced diabetic rats … … … … 91
3.11 Effect of ethanol, methanol and n-hexane extracts of leaf
and fruit of Kigelia africana on malondialdehyde (MDA) concentration in alloxan-induced diabetic rats … … … … 93
3.12 Effect of ethanol, methanol and n-hexane leaf and fruit extract of Kigelia africana on vitamin C concentration in alloxan-induced diabetic rats … … … … … … 95
3.13 Effect of ethanol, methanol and n-hexane leaf and fruit extract of Kigelia africana on catalase activity in alloxan-induced diabetic rats … … … … … … 97
3.14 Effect of ethanol, methanol and n-hexane leaf and fruit extract of Kigelia africana on superoxide dismutase (SOD) activity in alloxan- induced diabetic rats … … … … 99
84
3.15 Effect of ethanol methanol and n-hexane leaf and fruit
extracts of Kigelia africana on percentage inhibition of superoxide dismutase in alloxan-induced diabetic rats … … … 101
3.16 Effect of ethanol, methanol and n-hexane leaf and fruit
extract of Kigelia africana on glutathione peroxidase activity in alloxan-induced diabetic rats … … … … … 103
3.17 Effect of ethanol, methanol and n-hexane leaf and fruit extract of Kigelia africana on cholesterol concentration in alloxan-induced diabetic rat … … … … … … 105
3.18 Effect of ethanol, methanol and n-hexane leaf and fruit
extract of Kigelia africana high density lipoprotein in alloxan-induced diabetic rats … … … … … … 107
3.19 Effect of ethanol, methanol and n-hexane leaf and fruit
extracts of Kigelia africana on low density lipoprotein concentration in alloxan-induced diabetic rats … … … … 109
3.20 Effect of ethanol, methanol and n-hexane leaf and fruit
extracts of Kigelia africana on triacylglycerol (TAG) concentration in alloxan-induced diabetic rats … … … … 111
3.21 Effect of ethanol, methanol and n-hexane leaf and fruit extract
of Kigelia africana on aspartate aminotranferase (AST) in alloxan-induced diabetic rats … … … … … … 113
3.22 Effect of ethanol, methanol and n-hexane leaf and fruit
extract of Kigelia africana on alanine aminotransferase (ALT) in alloxan-induced diabetic rats … … … … … 115
3.23 Effect of ethanol, methanol and n-hexane leaf and fruit extract of Kigelia africana on total bilirubin concentration in alloxan-induced diabetic rats … … … … … … 117
CHAPTER FOUR: DISCUSSION 4.1 Discussion … … … … … … … … 119
4.2 Conclusion … … … … … … … … 125
REFERENCES … … … … … … … … … 126 APPENDICES … … … … … … … … … 140
85
LIST OF FIGURES Fig.1: Flower, leaves and fruit of Kigelia africana … … … … 4 Fig. 2: Pathway leading to AGE formation … … … … 12 Fig. 3: Formation of advanced glycation end- products (AGEs)
by combination of glycation and oxidation … … … … … 16 Fig. 4: Pathways that contribute to oxidative stress in response
to increased glucose flux … … … … … … … 19 Fig. 5. Endogenous stimuli leading to ROS generation … … … … 21 Fig. 6: Interactions between endogenous antioxidants
in the process of detoxifying lipid peroxides … … … … … 24 Fig. 7: Phasic glucose response to a diabetogenic dose of alloxan or streptozotocin 30 Fig. 8: Redox cycling reaction between alloxan and dialuric acid … … … 34 Fig. 9a: Structure of streptozotocin … … … … … … … 35 Fig. 9b: Structure of methylnitroso urea … … … … … … 35 Fig. 10: Reaction of thiobarbituric acid (TBA) with malondialdehyde (MDA) … 53 Fig. 11: Effect of ethanol, n-hexane and methanol extracts of leaf
and fruit of Kigelia africana on sorbitol concentration in alloxan-induced diabetic rats … … … … … … 88
Fig. 12: Effect of ethanol, n-hexane and methanol extracts of leaf and fruit of Kigelia africana on protein concentration in alloxan-induced diabetic rats … … … … … … 90
Fig. 13: Effect of ethanol, n-hexane and methanol extracts of leaf
and fruit of Kigelia africana on glycosylated haemoglobin concentration in alloxan-induced diabetic rats … … … … 92
Fig. 14: Effect of ethanol, n-hexane and methanol extracts of leaf and
fruit of Kigelia africana on malondialdehyde concentration in alloxan-induced diabetic rats … … … … … … 94
Fig. 15: Effect of ethanol, n-hexane and methanol extracts of leaf
and fruit of Kigelia africana on vitamin C concentration in alloxan-induced diabetic rats … … … … … … 96
86
Fig. 16: Effect of ethanol, n-hexane and methanol extracts of
leaf and fruit of Kigelia africana on catalase activity in alloxan-induced diabetic rats … … … … … … 98
Fig. 17: Effect of ethanol, n-hexane and methanol extracts of leaf and
fruit of Kigelia africana on superoxide dismutase activity in alloxan-induced diabetic rats … … … … … … … 100
Fig. 18: Effect of ethanol, n-hexane and methanol extracts of leaf and
fruit of Kigelia africana on percentage of superoxide dismutase inhibition in alloxan-induced diabetic rats … … … … … 102
Fig. 19: Effect of ethanol, n-hexane and methanol extracts of leaf
and fruit of Kigelia africana on glutathione peroxidase activity in alloxan-induced diabetic rats … … … … … 104
Fig. 20: Effect of ethanol, n-hexane and methanol extracts of leaf and fruit of Kigelia africana on percentage of total cholesterol concentration in alloxan-induced diabetic rats … … … … … … 106
Fig. 21: Effect of ethanol, n-hexane and methanol extracts of leaf and
fruit of Kigelia africana on percentage of high density lipoprotein concentration in alloxan-induced diabetic rats … … … … 108
Fig. 22: Effect of ethanol, n-hexane and methanol extracts of leaf and
fruit of Kigelia africana on percentage of low density lipoprotein concentration in alloxan-induced diabetic rats … … … … 110
Fig. 23: Effect of ethanol, n-hexane and methanol extracts of leaf
and fruit of Kigelia africana on percentage of triacylglycerol concentration in alloxan-induced diabetic rats … … … … 112
Fig. 24: Effect of ethanol, n-hexane and methanol extracts of leaf
and fruit of Kigelia africana on aspartate aminotransferase activity in alloxan-induced diabetic rats … … … … … 114
Fig. 25: Effect of ethanol, n-hexane and methanol extracts of leaf
and fruit of Kigelia africana on alanine aminotransferase activity in alloxan-induced diabetic rats … … … … … 116
Fig. 26: Effect of ethanol, n-hexane and methanol extracts of leaf
and fruit of Kigelia africana on total bilirubin concentration in alloxan-induced diabetic rats … … … … … … 118
LIST OF TABLES Table 1: Vascular complications of diabetes mellitus … … … … 8
Table 2: Comparison of the chemical properties of alloxan and streptozotocin … 32
Table 3: Volumes of the various materials/reagents put into the sample and blank … 55
87
Table 4: Volumes of the various materials/reagents put into the sample and blank … 59
Table 5: Absorbance of AST in the serum … … … … … 69
Table 6: Absorbance of ALT in the serum … … … … … 71
Table 7: Qualitative phytochemical composition of ethanol, methanol and n-hexane leaf and fruit extracts of Kigelia africana … … … 74
Table 8: Quantitative phytochemical composition of ethanol, methanol
and n-hexane leaf and fruit extracts of Kigelia afrcana … … … 76 Table 9: Percentage proximate composition of ethanol, methanol and
n-hexane leaf and fruit extracts of Kigelia afrcana … … … … 78 Table 10: Percentage yield of leaf and fruit samples of Kigelia afrcana … … 80 Table 11a: First acute toxicity test (LD50) of Kigelia africana extracts … … 82 Table 11b Second acute toxicity test (LD50) of Kigelia africana extracts … … 83 Table 12: Effect of ethanol, n-hexane and methanol extracts of
leaves and fruits of Kigelia africana on glucose level of diabetic and non-diabetic rats … … … … … … 84
Table 13: Body weights of diabetic and non-diabetic rats treated
with ethanol, n-hexane and methanol extracts of leaves and fruits of Kigelia africana before and after experiment … … … 86
88
LIST OF ABBREVIATIONS
A Alloxan
AAS Atomic abosorption spectrophotometer
AST Aspartate aminotransferase
ALT Alanine aminotransferase
ADP Adinine diphosphate
AGEs Advanced glycation end- product
AVP Arginine vasopressin
AQP-2 Aquaporin-2
AVPR2 Arginine vasopressin 2 receptor
AQP-2 Aquaporin-2
ATP Adenosine triphosphate
BH4 Tetrahydrobiopterin
CAT Catalase
Ca2+ Calmodulin.
Cu2+ Copper (ii) Iron
CUZnSOD Copper zinc superoxide dismutase
DAG Diacylglycerol
DHLA Dihydrolipoic acid
DMSO Dimethyl sulphuroxide
DNA Deoxyribo neucleic acid
3-DG 3-Deoxy glucosone
DM Diabetes mellitus
DI Diabetes inspidus
EDTA Ethylene diamine tetraacetate
EDRF Endothelium derived relaxing factor
eNOS Endothelia nitric oxide synthase
FAD Flavin adenine dinucleotide
Fe2+ Iron
FMN Flavin mononucleotide
GAPD Glyceraldehydes -3-Phosphate dehydrogenase
GLO Glyoxal
GR Glutathione reductase
89
GSH Glutathione
GSSG Oxidized glutathione
GPx Glutathione peroxidase
GLUT2 Glucose transporter
HDL High density lipoprotein
HOCL Hydrochlorous acid
H2O2 Hydrogen peroxide
HO. Hydroxyl radical
HNE 4-Hydroxyl-2-nonenal
HK Hexokinase
IDDM Insulin -dependent diabetes mellitus
I.N.T 2-(4-iodophenyl)-3-(4-nitrophenol)-5-Phenyltetrazolium chloride
1L-1 Interleukin -1
LA Lipoic acid
LD50 Lethal dose
LDL Low density lipoprotein
MNU N- methyl-N-nitrosourea
MDA Malondialdehyde
Mn-SOD Manganese superoxide dismutase
MGD Methylglyoxal
NADPH Nicotinamide adenine dinucleotide phosphate (Reduced form)
NAD+ Nicotinamide adenine dinucleotide (oxidized form)
NIDDM Non- insulin dependent diabetes mellitus
NOS Nitrogen oxygen species
NO Nitric oxide
ONOO- Peroxylnitrite 1O2 Singlet oxygen
O2-. Superoxide anion
PDGF Platelet- derived growth factor
PKC Protein kinase C
PS Phosphotidyl serine
PPP Pentose phosphate pathway.
PVS Polyvinyl sulphate
PUFA Polyunsaturated fatty acid
90
PVN Paraventricular nuclei
RAGE Advanced glycation end- product
RNS Reactive nitrogen species
RO. Alkoxyl radicals
ROS Reactive oxygen species
STZ Streptozotocin
SON Supraoptic nuclei
SOD Superoxide dismutase
TG Triacylglycerol
TLC Thin layer chromatography
TNF Tumor necrosis factor
TBA 2-Thiobarbituric acid
TCA Trichloloroacetic acid
UKPDS United kingdom prospective diabetes study
VEGF Vascular endothelial growth factor
XOD Xanthine oxidase
91
CHAPTER ONE
INTRODUCTION
Diabetes mellitus is a metabolic disorder resulting from a defect in insulin secretion, insulin
action or both. Insulin deficiency in turn leads to chronic hyperglycemia with disturbances of
carbohydrate, fat and protein metabolism (Kumar et al., 2011).
During diabetes, failure of insulin-stimulated glucose uptake by fat and muscle cause glucose
concentration in the blood to remain high, consequently glucose uptake by insulin-
independent tissue increases. Increased glucose flux both enhances oxidant production and
impairs antioxidant defenses by multiple interacting non-enzymatic, enzymatic and
mitochondrial pathways (Klotz 2002; Mehta et al., 2006). These include activation of protein
kinase C isoforms (Inoguchi et al., 2000), increased hexosamine pathway (Kaneto et al.,
2001), glucose autoxidation (Brownlee, 2001), increased methylglyoxal and advanced
glycation end-product (AGEs) formation (Thornalley, 1998) as well as increased polyol
pathway flux ( Lee and Chung, 1999). These seemingly different mechanisms are the results
of a single process-that is, overproduction of superoxide by the mitochondrial electron
transport system (Tushuizen et al., 2005). This hyperglycaemia-induced oxidative stress
ultimately results in modification of intracellular proteins resulting in an altered function and
DNA damage, activation of the cellular transcription (NFK B), causing abnormal changes in
gene expression, decreased production of nitric oxide, and increased expression of cytokines,
growth factors and pro-coagulant and pro-inflammatory molecules (Palmer et al., 1988;
Evans et al., 2002; Klotz, 2002; Taniyama and Griendling, 2003). Oxidative stress is
responsible for molecular and cellular tissue damage in a wide spectrum of human diseases
(Halliwell, 1994), amongst which is diabetes mellitus. Diabetes produces disturbances of
lipid profiles, especially an increased susceptibility to lipid peroxidation (Lyons, 1991),
which is responsible for increased incidence of atherosclerosis (Guigliano et al., 1996), a
major complication of diabetes mellitus . An enhanced oxidative stress has been observed in
these patients as indicated by increased free radical production, lipid peroxidation and
diminished antioxidant status (Baynes, 1991).
Globally, the estimated incidence of diabetes and projection for year 2030, as given by
International Diabetes Federation is 350 million (Ananda et al., 2012). Currently available
pharmacotherapies for the treatment of diabetes mellitus include oral hypoglycemic agents
92
and insulin. However these drugs do not restore normal glucose homeostasis and they are not
free from side effects (Bandawane et al., 2011). In view of the adverse effects associated with
the synthetic drugs and as plants are safer, affordable and effective, conventional antidiabetic
plants can be explored (Kumar et al., 2010). Over 400 traditional plants have been reported
for the treatment of diabetes (Ramachandran et al., 2011). Furthermore, following World
Health Organization recommendations, investigation of hypoglycemic agents from medicinal
plants has become more important (Kumar et al., 2010). Also diabetes has been treated orally
with several medicinal plants based on folklore medicine since ancient times.
Kigelia africana (Lam.) Benth (Family: Bignoniaceae) plant has many medicinal properties
due to the presence of numerous secondary metabolites. These compounds include iridiods,
flavonoids, naphthoquinones and volatile constituents (Houghton, 2002; Gorman, 2004;
Asekun et al., 2006). Experimentally, the plant has shown antibacterial, antifungal,
antineoplastic, analgesic, anti-inflammatory and antioxidant properties (Saini et al., 2009).
Crude extracts of herbs and spices and other materials rich in phenolics are of increasing
interest in the food industry because they retard oxidative degradation of lipids and thereby
improving the quality and nutritional value of food. Flavonoids, are groups of polyphenolic
compounds with known properties, which include free radical-scavenging and anti-
inflammatory activities (Frankel, 1995).
An enhanced oxidative stress has been observed in diabetic patients as indicated by increased
free radical production, lipid peroxidation and diminished antioxidant status (Baynes, 1991).
In diabetes mellitus, alterations in the endogenous free radical scavenging defense
mechanisms may lead to ineffective scavenging of reactive oxygen species, resulting in
oxidative damage and tissue injury. Oxidative stress is currently suggested as mechanism
underlying diabetes and diabetic complications. Oxidative stress may cause oxidative damage
of cellular membranes and changes in the structural and functional integrity of sub- cellular
organelles and many produce effects that result in the various complications in diabetic
disease (West, 2000). Recently, there has been an upsurge of interest in the therapeutic
potentials of plants, as antioxidants in reducing free radical induced tissue injury. Although
several synthetic antioxidants, such as ascorbic acid, butylated hydroxyanisole and butylated
hydroxytoluene are commercially available, they are quite unsafe and toxic (Viny, et
al.,2010). A survey of literature revealed that there is no experimental evidence of the
antidiabetic effect of Kigelia africana. Therefore, the present work explores this and will in
93
addition study its potential effect on the oxidative and biochemical parameters of alloxan-
induced diabetic rats.
1.1 Kigelia africana
1.1.1 Description of Kigelia africana
Nature has been a source of medicinal agents including modern drugs for the thousands of
years (Cordell, 2000). Plant based traditional medicine system continues to play an essential
role in health care with about 80% of the world’s inhabitants relying mainly on traditional
medicines for their primary health care .
Kigelia africana (Lam) Benth of Bignoniaceae family is widely distributed in South central
and West Africa. It is known as the cucumber or sausage tree because of its huge fruits
(average 0.6m in length and 4kg in weight) which hang from long fibrous stalks. It is also
known as Balm Khene in Hindi and is distributed all over India but found in abundance in
West Bengal. It is found mostly in wetter areas and spread abundantly across wet Savannah
and riverine areas (Sofowora et al., 1980). The plant grows approximately 10m high, with
odd pinnate, composite opposite leaves; leaflets are ovate- to- oblong in shape and 4-18 cm
long. The flowers are found in the spring or summer season, hanging ancillary panicles up to
2 m long. It has a corolla with fused petals, irregularly bell shaped 9-13 cm long, yellowish
outside and purple on inside . Fruits are oblong, 30-50 cm long, hanging on stalk for several
months.
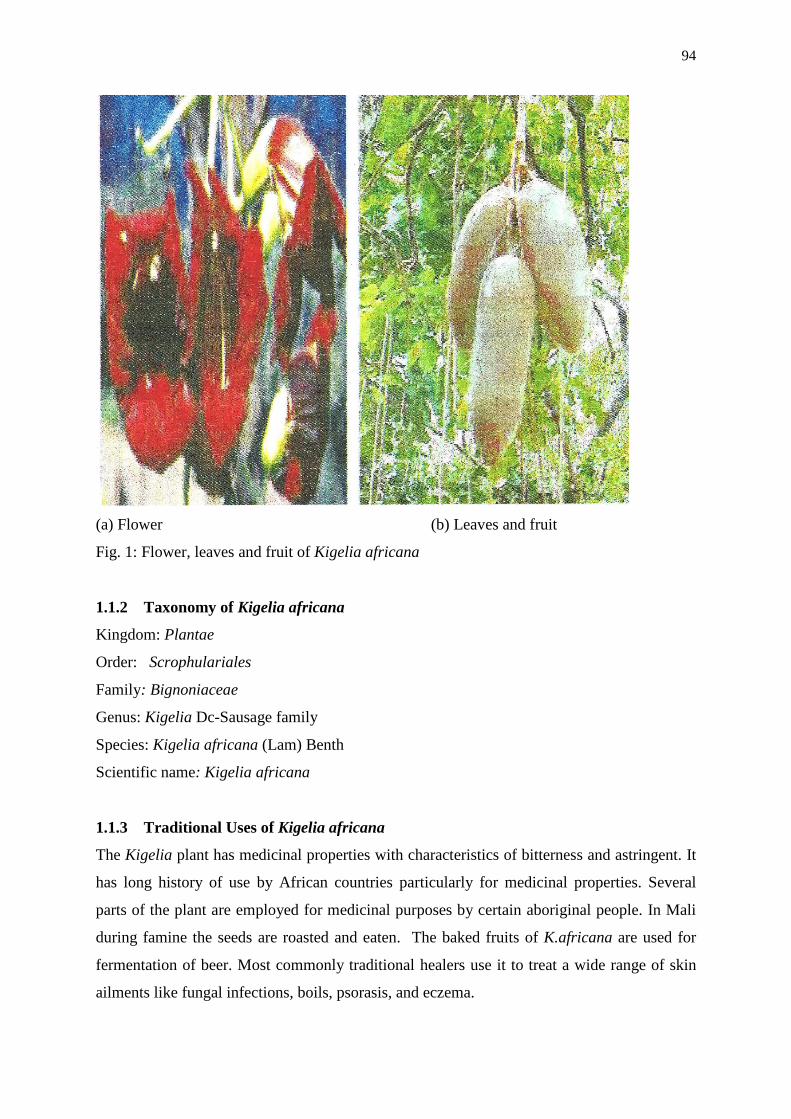
94
(a) Flower (b) Leaves and fruit
Fig. 1: Flower, leaves and fruit of Kigelia africana
1.1.2 Taxonomy of Kigelia africana
Kingdom: Plantae
Order: Scrophulariales
Family: Bignoniaceae
Genus: Kigelia Dc-Sausage family
Species: Kigelia africana (Lam) Benth
Scientific name: Kigelia africana
1.1.3 Traditional Uses of Kigelia africana
The Kigelia plant has medicinal properties with characteristics of bitterness and astringent. It
has long history of use by African countries particularly for medicinal properties. Several
parts of the plant are employed for medicinal purposes by certain aboriginal people. In Mali
during famine the seeds are roasted and eaten. The baked fruits of K.africana are used for
fermentation of beer. Most commonly traditional healers use it to treat a wide range of skin
ailments like fungal infections, boils, psorasis, and eczema.
95
It has also internal applications including treatment of dysentery, ringworm, tapeworm,
postpartum haemorrhage, malaria, diabetes, pneumonia and tooth care (Gill, 1992). The
Tonga women of Zambezi valley regularly apply cosmetic preparations of kigelia fruits to
their faces to ensure a blemish- free complexion (Pooleg, 1993). In folk medicine, the fruits
of the plant are used as dressing for ulcers, purgative and for increasing the flow of milk in
lactating women (Oliver-Bever, 1986). The roots are said to yield a bright yellow dye. The
Shona people from India tend to use the bark or root as powder or infusion for application to
ulcers, or in the treatment of pneumonia, as a gargle for toothache and backache (Maisiri and
Gundidza, 1999).
In West Africa, the root and unripe fruit is used as vermifuge and as a treatment for
haemorrhoids and rheumatism. The bark is traditionally used as remedy for syphilis and
gonorrhea. The fruits and bark ground and boiled in water are taken orally or used as an
enema in treating children’s stomach ailments – usually worms. The unripe fruit is used in
Central Africa as a dressing for wounds, haemorrhoids and rheumatism. Palm wine exracts of
leaf, bark and fruit extracts of the tree are used for treatment of venereal diseases (Walt el
al., 1962).
1.1.4 Chemical Constituents of Kigelia africana
K. africana plant has many medicinal properties due to the presence of numerous secondary
metabolites. These compounds include irridiods, flavonoids and naphthoquinones and
volatile constituents (Houghton, 2002; Gorman et al., 2004; Asekun et al., 2006). Pinnatal
and isopinatal were isolated from tropical trees that belong to the plant family of
Bignoniaceae. Pinnatal was found in a root bark extract of the plant. Thin layer
chromatography (TLC) examination of the most active fractions of both stem bark and fruits
showed the presence of some major components which were found to be norviburtinal and B-
sitosterol. Gouda et al.(2006) isolated a furanone derivative, 3- (21-hydroxyethyl)-5-(2”-
hydroxypropyl)- dihydrofuran -2(3H)- one and four irridoids, 7 hydroxy viteoid II, 7 hydroxy
eucommic acid, 1- hydroxyl – 10- deoxyecuommiol and 10-deoxy eucommoil together with
seven known irridoids, jiofuran, jioglutolide, 1-dehydroxy-3, 4- dehydroaucubigenin, des-p-
hydroxybenzoyl kisasagenol B, ajugol, verminoside and 6-trans-caffeoyl ajugol from the fruit
(Gouda et al., 2003). They also isolated a phenyl propanoid derivatives identified as 6-p-
coumaroyl-sucrose together with ten known phenylpropanoid and phenylethanoid derivatives
96
and a flavonoid glycoside from fruits of K.africana (Gouda et al., 2006). The structures of the
isolated compounds were characterized by different spectroscopic methods. Govodachari et
al. (1971) isolated kigelin as the major constituent of the plant from the root heartwood.
1.1.5 Antibacterial and Antifungal
A biologically monitored fractionation of the methanolic extracts of the root and fruits led to
the isolation of the naphthoquinones, kigelinone, iso-pinnatal, dehydro-α- Lapachone, and
lapachol and the phenyl propanoids, p-coumaric acid and ferulic acid as the compounds
responsible for the observed antibacterial and antifugal activity (Binutu et al., 1996). The
compounds isolated were tested for their activities against Staphylococcus aureus, Bacillus
Subtilis, Corynebacterium diphetheriae, Aspergillus niger, A. flavus, Candida albicans and
Pullularia pullularis (Aureobasiduim sp). The steroids and flavonids are hygroscopic and
have fungicidal properties.
Chemical investigation showed that the aqueous extracts of the stem bark of the plant contain
irridoids as major components. In the light of traditional uses of this plant, antimicrobial
activities of the aqueous extracts and two major irridoids were tested against Bacillus subtilis,
Escherichia coli, Pseudomonas aeruginosa, Staphylococcus aureus and Candida albican.
The crude aqueous extracts showed significant antimicrobial activity, which could be
partially explained by the activity of the irridoids present (Akunyili et al., 1991). The fruits
are popular sources of traditional medicine throughout Africa. The stem bark has been widely
analyzed for pharmacological activity but fruit is limited despite more extensive use in
traditional remedies.
In the microtitre plate bioassay, stem bark and fruit extracts of K.africana showed similar
antibacterial activity against Gram negative and Gram positive bacteria. A mixture of free
fatty acids exhibiting antibacterial effect was isolated from the ethyl acetate extract of the
fruits using bioassay-guided fractionation. Palmitic acid, already known to possess
antibacterial activity, was the major compound in this mixture. These results confirm
antibacterial activity of K. africana fruits and stem bark, and support the traditional use of the
plant in therapy of bacterial infections (Grace et al., 2002). A disc diffusion susceptibility
test was used to screen concentrated extracts from the bark of 3 medicinal plants (Aistonia
boonei de wild, Morinda lucida Benth and K. africana) for antimicrobial activity (Kwo and
Craker, 1996). Solvents with different polarities were used for the extraction (methylene
Chloride, ethyl acetate, 95% ethanol and acetonitrite), and the extracts were tested against
97
Candida albicans, Staphylococcus aureus, Enterococcus faecalis, Escherichia coli and
Pseudomonas aeruginosa. The patterns of inhibition varied with the plant extract, the solvent
used for extraction and the organism tested. The largest zone of inhibition was observed for
ethanol extracts of K. africana against S. aureus and P. aeruginosa. S. aureus was the most
inhibited new organism. No inhibitory effects were observed against C. albican. The extent
of the inhibition of the bacteria was related to the concentration of the plant extract (Kwo and
Craker, 1996).
1.2 Diabetes
1.2.1 Diabetes Mellitus
Diabetes mellitus (DM) in all its heterogeneity has taken the centre stage as one of the
ultimate medical challenges. Diabetes complications are the major cause of morbidity and
mortality in patients with Diabetes mellitus (Wolf, 1993). Diabetes mellitus is considered to
be one of a rank free radical diseases which propagates complications with increased free
radical formation (Baynes, 1991; Varvarovska et al., 2004).
One of the major hypotheses proposed to explain the hyperglycemia-induced onset of
diabetic complications is an increase in oxidative stress (Brownlee, 2001; Sheetz and King,
2002, Creager et al., 2003). Similar to their proposed role in the onset of diabetic
complications, reactive oxygen species (ROS) such as superoxide, (02.-), hydroxyl radical,
(OH.) and hydrogen peroxide H2O2 have been linked to other diseases and injury states,
including Alzheimer’s disease, (Yamagishi et al., 2001), Parkinson’s disease (Practico, 1999;
Hyun et al., 2002), Chronic obstructive pulmonary disease (Practico et al; 1998), and
Ischemia (Roberts and Morrow, 2000). Evidence suggests that ROS function not only as
mediators of destruction, but also as intracellular second messengers that regulate signal
transduction cascades and gene expression (Varvarovska, et al., 2004).
1.2.2 Diabetes Type 1 and 2
Diabetes is associated with a variety of metabolic abnormalities. The so-called metabolic
syndromes include hyperglycaemia characterized by hypertriaglyceridemia, reduced High
Density lipoprotein cholesterol (HDL) and abnormal postprandial lipidemia, atherosclerosis
and pro-coagulant state. The metabolic syndrome represents a cycle whereby insulin
98
resistance leads to compensatory hyperinsulinemia which maintain normal plasma glucose
and may exacerbate insulin resistance.
Type 1 diabetes or insulin dependent diabetes mellitus (IDDM) is a complex multifactorial
disease involving severe destruction of the insulin-producing pancreatic β-cells. Type 1
diabetes is generally associated with young juvenile onset. Type 2 diabetes or non-insulin
dependent diabetes mellitus (NIDDM) typically occurs with older age and obesity. Although
glycemic control, insulin treatment and other chemical therapies can control many aspects of
diabetes, numerous complications are common and diverse. Diabetic patients have an
increased risk of developing various clinical complications that are largely irreversible and
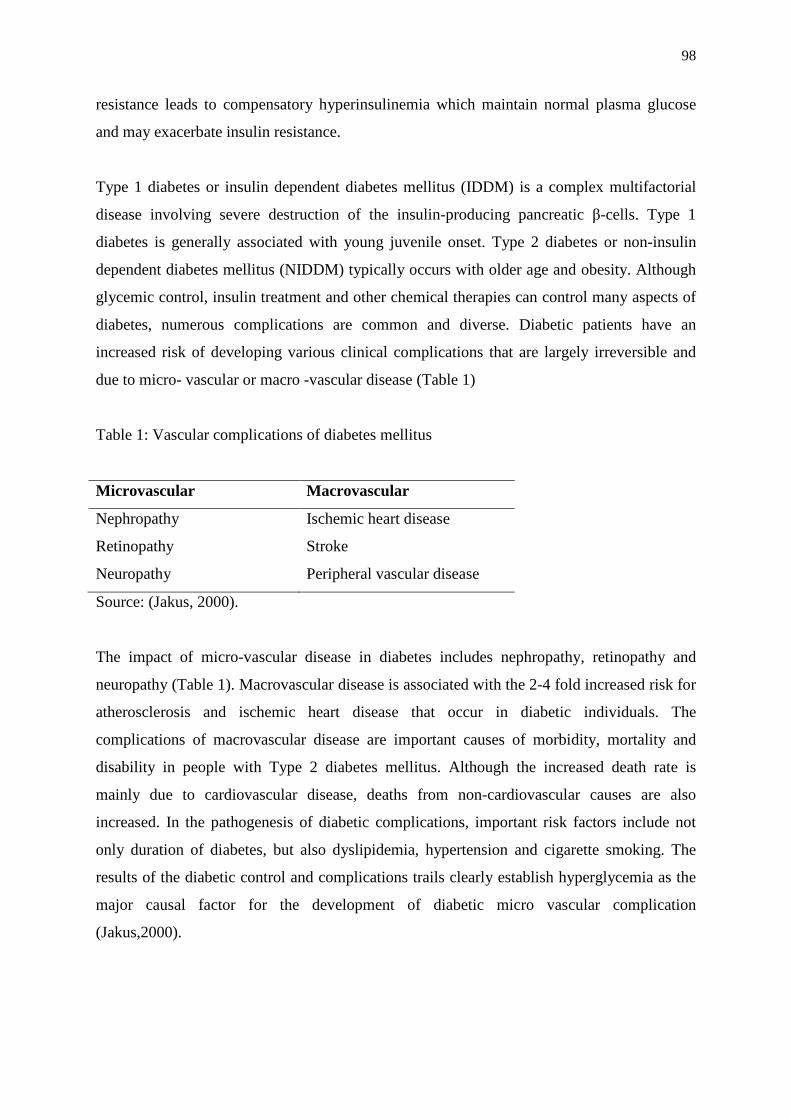
due to micro- vascular or macro -vascular disease (Table 1)
Table 1: Vascular complications of diabetes mellitus
Microvascular Macrovascular
Nephropathy Ischemic heart disease
Retinopathy Stroke
Neuropathy Peripheral vascular disease
Source: (Jakus, 2000).
The impact of micro-vascular disease in diabetes includes nephropathy, retinopathy and
neuropathy (Table 1). Macrovascular disease is associated with the 2-4 fold increased risk for
atherosclerosis and ischemic heart disease that occur in diabetic individuals. The
complications of macrovascular disease are important causes of morbidity, mortality and
disability in people with Type 2 diabetes mellitus. Although the increased death rate is
mainly due to cardiovascular disease, deaths from non-cardiovascular causes are also
increased. In the pathogenesis of diabetic complications, important risk factors include not
only duration of diabetes, but also dyslipidemia, hypertension and cigarette smoking. The
results of the diabetic control and complications trails clearly establish hyperglycemia as the
major causal factor for the development of diabetic micro vascular complication
(Jakus,2000).
99
The role of hyperglycaemia as an independent risk factor (not the major) for the development
of cardiovascular disease is supported by United Kingdom prospective Diabetes Study.
Improving glycaemic control delays the onset and reduces the severity of diabetic
complication. However, even with intensive current antidiabetic agents, more than 50% of
diabetic patient with type 2 suffer poor glycaemic control and 18% develop serious
complications within six years of diagnosis (Jakus, 2000). Thus,there is need for new
antidiabetic agents.
1.2.3 Insulin Resistance and Oxidative Stress
Several studies show that acute hyperglycemia can impair the physiological homeostasis of
many systems in living organisms. Excessive hyperglycemia may impair insulin activity and
sensitivity by the mechanism of “glucose toxicity” (Mooradian, 1999). Insulin stimulates the
uptake and utilization of glucose in muscle and adipose tissue, inhibits glycogenolysis and
gluconeogenesis in the liver and lipolysis in adipose tissue. Deficient action of insulin
reverses the metabolism of carbohydrates. Thus, with increased lipolysis are enhanced level
of free fatty acids and their oxidation in liver. In animal models, hyperglycemia increases
fatty acid availability in muscle. Thus, both “glucotoxicity” and “lipotoxicity” could lead to
insulin resistance and hyperinsulinemia (McGarry and Dobbis, 1999). It appears that insulin
resistance must occur in both muscle and liver for Type 2 diabetes. Both hyperglycemia and
insulin resistance are accompanied by reduced insulin action. Hyperglycemia and insulin
resistance may also be accompanied by oxidative stress.
Ceriello (2001) hypothesized a model that oxidative stress represents the common pathway
through which hyperglycaemia and insulin induce a depressed insulin action. This point of
view is supported by studies with antioxidants, which are able to improve the activity of
insulin.
1.2.4 Diabetic Complications
Diabetes is both a metabolic and vascular disease associated with numerous long-term
clinical complications that contribute to increased morbidity of the disease(Schalkwijk and
Stehouwer 2005). Vascular complications of diabetes can be divided into micro-and macro-
vascular. Retinal and renal microangiopathy cause diabetic retinopathy and nephropathy
respectively while microangiopathy of the vasa nervorum is important in the pathogenesis of
100
neuropathy. Clinically, the complications are manifested as blindness, end stage renal failure,
defective nerve conduction and impaired wound healing. Macroangiopathy in diabetes refers
to a disease of larger vessels consisting mainly of an accelerated form of atherosclerosis that
affects the coronary, carotid and peripheral arteries, thus increasing the risk of myocardial
infarction, angina, congestive heart failure and stroke (Fantus, 2002).
Hypoglycemia has been identified as a risk factor for the development of diabetic
complications. A number of equally tenable hypotheses have been put forward to account for
the association of complications with this small molecule, glucose. These include but are not
limited to increased aldose reductase pathway, advanced glycation end- products (AGES)
formation, oxidative stress and increased protein kinase C (PKC) pathway. All these
mechanisms have been extensively studied and reviewed over a number of years (Wolff et
al., 1991; Guigliano et al., 1996; Brownlee, 2005). An abnormal activity of aldose reductase
pathway by sustained hyperglycemia seems to trigger a number of cellular and molecular
changes that are responsible for the micro- and macro- vascular complications.
1.3 Hyperglycemia and Diabetic Complications
The factors that strongly affect the risk of diabetic complications are disease duration and
degree of glycemic control (Nathan, 1998 ; Semenkovich and Heinecke,1997). These
observations have given rise to the “glucose hypothesis” which suggests that glucose
mediates many of the deleterious effects of diabetes. Although, this appears to be an over-
simplification of a complex process, it has gained strong support from clinical trials in Type 1
and Type 2 diabetes. Both the Diabetes Control and Complication Trial and United Kingdom
Prospective Diabetes Study found that strict glycemic control dramatically lowered the
incidence of retinopathy, nephropathy and neuropathy (Nathan, 1998). This salutary finding
suggests that hyperglycemia promotes or even initiates these complications. Therefore,
glucose itself may be toxic to the micro vasculature. However, strict glycemic control alone
does not prevent diabetic complications, suggesting the involvement of additional factors.
Thus, factors other than glucose, such as abnormalities in lipoproteins, metabolic
derangements (insulin resistance, elevated free fatty acid levels) and variations in gene
controlling lipid metabolism might be important in macrovascular as well as microvascular
disease (Semenkovich and Heinecke, 1997).
1.4 Mechanism of Tissue Damage Mediated by Hyperglycemia
101
Proposed mechanisms for the pathogenesis of diabetic complications include formation of
advanced glycosylation end-products (AGES) (Baynes and Thorpe, 2000; Stem, et al.,2002
), oxidative stress ( Monnier, 2001), carbonyl stress (Baynes and Thorpe, 2000; Monnier,
2001), increased protein Kinase C activity (Ishie et al., 1998), altered growth factor or
cytokine activities ( Sharma and Ziyadeh, 1997), reductive stress or pseudohypoxia (Ido et
al., 1997), and mitochondrial dysfunction (Nishikawa et al., 2000; Brownlee, 2001). Some of
these hypothesis overlap. For example, AGES might promote growth factor expression and
oxidative stress, and oxidative stress might promote AGES formation ( Baynes and Thorpe,
2000; Monnier, 2001). All these hypotheses are supported by extensive data, but a unifying
hypothesis remains elusive. The existence of several credible hypotheses might mean that
different tissues are differentially vulnerable to various oxidative pathways.
1.4.1 Aldose Reductase Pathway
An increased flux of glucose via the polyol pathway leads to the intracellular accumulation of
sorbitol. Accumulation of this non-permeable sugar in cells especially the lens and nerves
results in osmotic stress, cellular edema, redox imbalance, depletion of water soluble
antioxidants and susceptibility to oxidative insult (Cameron et al., 1999). Under
normoglycemia, most of the cellular glucose is phosphorylated to glucose 6-phosphate by
hexokinase. A minute part of non-phosphorylated glucose (approximately 8%) enters the so-
called polyol pathway, the alternative route of glucose metabolism (Maria et al., 2007),
implicating the enzyme aldose reductase. Aldose redcutase normally reduces toxic aldehydes
in the cell to inactive alcohols, but when the glucose concentration in the cell becomes too
high, glucose reduces to sorbitol in the presence of aldose redctase and NADPH which is
later oxidized to fructose by the sorbitol delydrogenase at the cost of NAD+ (Fig. 2)
102
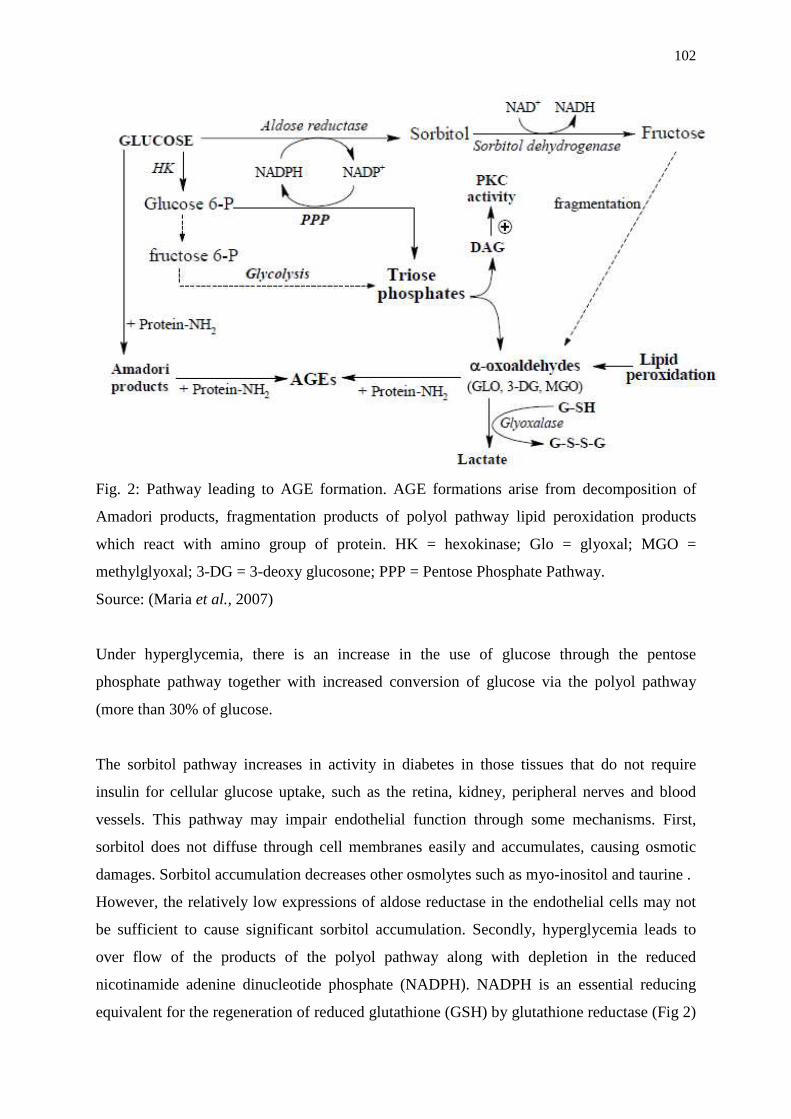
Fig. 2: Pathway leading to AGE formation. AGE formations arise from decomposition of
Amadori products, fragmentation products of polyol pathway lipid peroxidation products
which react with amino group of protein. HK = hexokinase; Glo = glyoxal; MGO =
methylglyoxal; 3-DG = 3-deoxy glucosone; PPP = Pentose Phosphate Pathway.
Source: (Maria et al., 2007)
Under hyperglycemia, there is an increase in the use of glucose through the pentose
phosphate pathway together with increased conversion of glucose via the polyol pathway
(more than 30% of glucose.
The sorbitol pathway increases in activity in diabetes in those tissues that do not require
insulin for cellular glucose uptake, such as the retina, kidney, peripheral nerves and blood
vessels. This pathway may impair endothelial function through some mechanisms. First,
sorbitol does not diffuse through cell membranes easily and accumulates, causing osmotic
damages. Sorbitol accumulation decreases other osmolytes such as myo-inositol and taurine .
However, the relatively low expressions of aldose reductase in the endothelial cells may not
be sufficient to cause significant sorbitol accumulation. Secondly, hyperglycemia leads to
over flow of the products of the polyol pathway along with depletion in the reduced
nicotinamide adenine dinucleotide phosphate (NADPH). NADPH is an essential reducing
equivalent for the regeneration of reduced glutathione (GSH) by glutathione reductase (Fig 2)
103
and for the activity of the NADPH- dependent thioredoxin system, two important cell
antioxidants against oxidative damage. Cells have several sources of NADPH, including the
two dehydrogenases of the pentose–phosphate pathway (glucose 6-phosphate dehydrogenase
and 6-phosphogluconate dehydrogenase; both insulin- induced enzymes), the malic enzyme
and the NADPH-dependent isocitrate dehydrogenase. The impairment of the hexose
monophosphate shunt leads to a reduced NADPH availability, and negatively influences
other enzymes and systems involved in defensive process against oxidative agents, such as
the catalase and glutathione systems. Several papers have been published that underline the
role of glucose 6- phosphate dehydrogenase deficiency in the pathogenesis of diabetes (West,
2002,)
NADPH is a cofactor of important enzymes of reactive nitrogen species (RNS) and reactive
oxygen species (ROS) metabolism, nitrogen oxygen species (NOS) (Nishikawa et al., 2000)
and NADPH- Oxidase respectively. Intracellular depletion of NADPH leads to a decreased
NO synthesis since NADPH is cofactor of NO synthesis, which synthesizes NO from L-
arginine. All isoforms of NOS contain a reductase domain and an oxygenase domain
separated by a calmodulin-binding region. NOS requires five cofactors/ prosthetic groups
such as flavin adenine dinucleotide, FAD, flavin mononucleotide (FMN), heme,
tetrahydrobiopterin (BH4) and Ca2+- calmodulin.
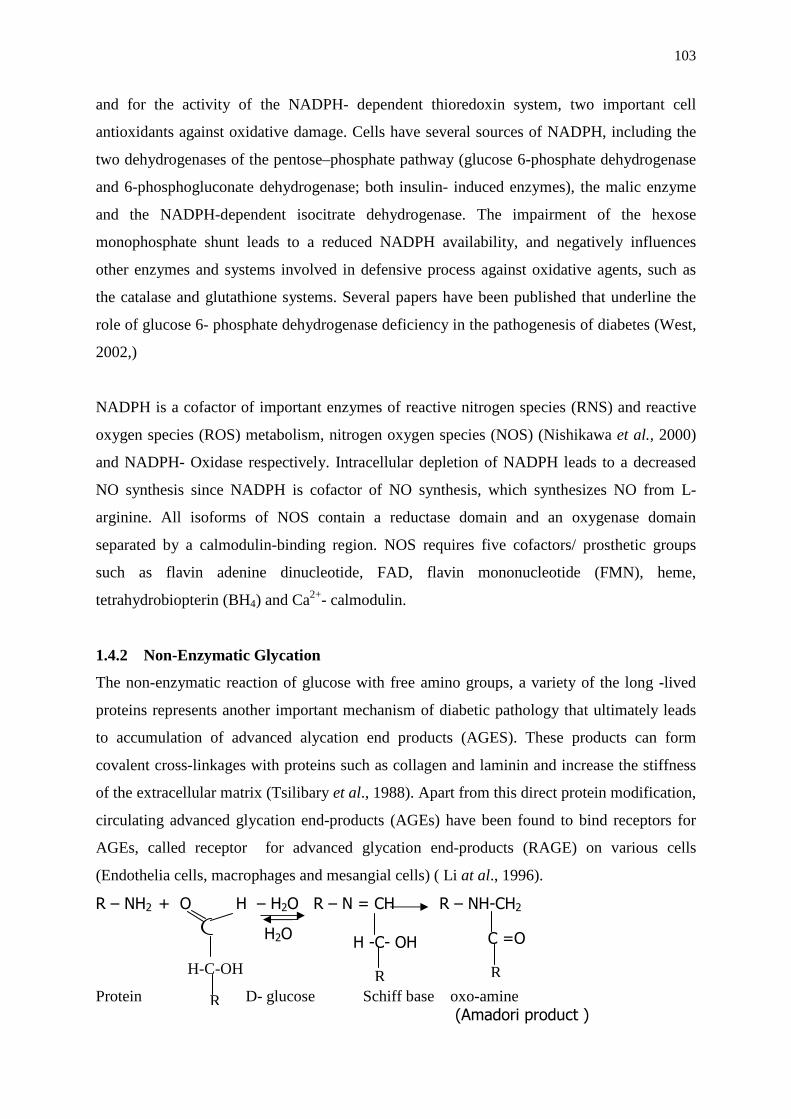
1.4.2 Non-Enzymatic Glycation
The non-enzymatic reaction of glucose with free amino groups, a variety of the long -lived
proteins represents another important mechanism of diabetic pathology that ultimately leads
to accumulation of advanced alycation end products (AGES). These products can form
covalent cross-linkages with proteins such as collagen and laminin and increase the stiffness
of the extracellular matrix (Tsilibary et al., 1988). Apart from this direct protein modification,
circulating advanced glycation end-products (AGEs) have been found to bind receptors for
AGEs, called receptor for advanced glycation end-products (RAGE) on various cells
(Endothelia cells, macrophages and mesangial cells) ( Li at al., 1996).
R – NH2 + O H – H2O R – N = CH R – NH-CH2
H-C-OH
Protein D- glucose Schiff base oxo-amine R
(Amadori product )
H2O H -C- OH C =O
R
R
104
Binding of these receptors, stimulate the expression of pro-inflammatory cytokines such as
tumor necrosis factor α (TNF -α) and interleukin - 1 (1L-1), growth factor such as vascular
endothelial growth factor (VEGF) and platelet – derived growth factor (PDGF) and
transcription factor (Yamagishi et al ., 1998). RAGE activation increases the vascular
permeability that generates ischemia and microaneurysm in the eye and hemorrhage in the
brain (Paolino and Garner, 2005).
Cataract occurs as a result of the precipitation of glycated lens crystalline proteins and
glycation of retinal vessels leading to inflammation and microhemorrhage. Accumulation of
AGE products such as carboxy methyllysine, pentosidine, and imidozolene in the aqueous
humor has been implicated in the diabetic retinopathy (Franke et al, 2003)
1.4.3 Carbonyl Stress in Diabetes
Carbonyl stress explains increased modification of protein in diabetes, uremia and other
diseases by a generalized increase in the concentration of reactive carbonyl precursors of
AGEs, glycoxidation and lipoxidation products (Lyons and Jenkins, 1997). These carbonyls
may damage not only proteins but phospholipids and nucleotide base DNA. Carbonyl stress
may result from an increase in the deficiency of detoxification of carbonyl compounds.
Carbonyl stress refers to the intracellular generation and accumulation of reactive compounds
with carbonyl groups. These include both six- carbon derivative of glucose such as 3-
deoxyglucosone, and 3–carbon fragmentation products of glycolytic intermediate,
glyceraldehyde–3-phosphate called glyoxal and methyl glyoxal (Begenbardt et al., 1998).
These reactive species form covalent linkages with the amino groups of proteins both intra –
and extracellularly resulting in altered structure and function.
1.4.4 Activation of Protein Kinase C isoforms
Excess glucose may activate protein kinase C (PKC) directly by several mechanisms,
including through de novo synthesis of diacylglycerol (DAG), by activation of phospholipase
C, and by inhibition of DAG kinase (Keogh et al., 1997) or indirectly (via ligation of AGE
receptors or increased activity of the polyol pathway). Increased activity of protein kinase C
results in functional changes to vascular cells via activation of phospholipase A2 (the
105
enzyme supplying the substrates arachidonic acid for prostaglandin production), the
expression of growth factors e.g. transforming growth factor–β, endothelia, and vascular
endothelial growth factor) and alterations in the expression of certain basement membrane
proteins (Koya, et al., 1997). Glycation may be responsible for the increased deformability of
granulocytes observed in diabetes (Sulochana et al., 2001).
Glycated products can be oxidized by several ROS, including HO. and ONOO- to give AGEs
shown in the Fig.3 below (Yim et al., 2002; Ahmed et al., 2005). Glycoxidation products
such as pentosidine and NE carboxyl methyl lysine are the best chemically characterized
AGEs compounds found in humans. The non- enzymatic glycation reaction proceeds slowly
through different stages leading to alteration of protein structure and molecular surface
topology that profoundly change the biochemical properties of the affected molecule. The
major biological effects of excessive glycation include inhibition of regulatory molecule
binding , cross linking of glycated proteins, trapping of soluble protein by glycated
extracellular matrix, decreased susceptibility to proteolysis, inactivation of enzymes and
transformation factors and abnormalities in relation to immune complex formation (Turk,
2001;Yim et al., 2002; Ahmed et al., 2005; Halliwell and Gutteridge, 2007). Glycation is
faster at elevated glucose in diabetic patients. Some tissues such as the liver, kidneys, and
erythrocytes are more susceptible to AGEs formation than others (Bohlender et al., 2005).
Glycated haemoglobin (HbA1c) contains a glucose amadori product attached to the N–
terminal valine of the β-chain. Glucose also glycates CuZnSOD in the erythrocyte, decreasing
its activity; this may account for the lower SOD activity reported in the blood of some
diabetics (Aral et al., 1987). Both CuZnSOD and ceruloplasmin can fragment after glycation
to release pro- oxidant copper ions (Islam et al., 1995). Fig. 3 shows the formation of
advanced glycation end-products (AGEs) by combination of glycation and oxidation.
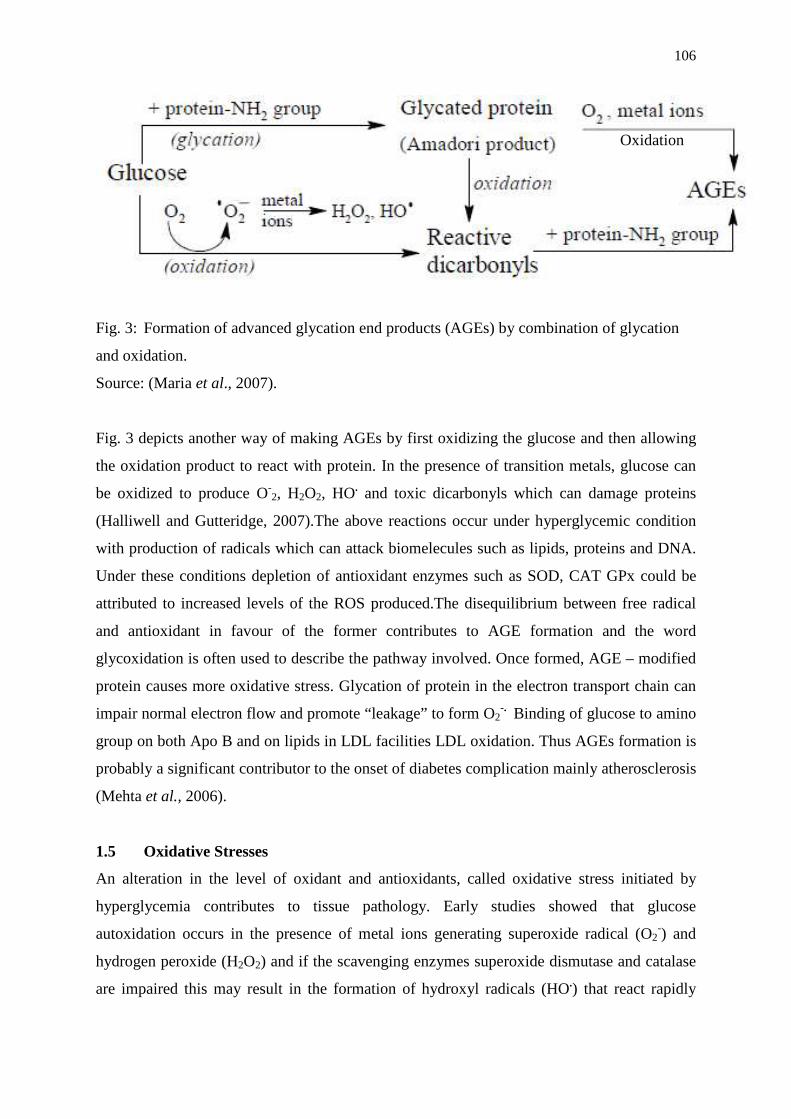
106
Fig. 3: Formation of advanced glycation end products (AGEs) by combination of glycation
and oxidation.
Source: (Maria et al., 2007).
Fig. 3 depicts another way of making AGEs by first oxidizing the glucose and then allowing
the oxidation product to react with protein. In the presence of transition metals, glucose can
be oxidized to produce O-2, H2O2, HO. and toxic dicarbonyls which can damage proteins
(Halliwell and Gutteridge, 2007).The above reactions occur under hyperglycemic condition
with production of radicals which can attack biomelecules such as lipids, proteins and DNA.
Under these conditions depletion of antioxidant enzymes such as SOD, CAT GPx could be
attributed to increased levels of the ROS produced.The disequilibrium between free radical
and antioxidant in favour of the former contributes to AGE formation and the word
glycoxidation is often used to describe the pathway involved. Once formed, AGE – modified
protein causes more oxidative stress. Glycation of protein in the electron transport chain can
impair normal electron flow and promote “leakage” to form O2-. Binding of glucose to amino
group on both Apo B and on lipids in LDL facilities LDL oxidation. Thus AGEs formation is
probably a significant contributor to the onset of diabetes complication mainly atherosclerosis
(Mehta et al., 2006).
1.5 Oxidative Stresses
An alteration in the level of oxidant and antioxidants, called oxidative stress initiated by
hyperglycemia contributes to tissue pathology. Early studies showed that glucose
autoxidation occurs in the presence of metal ions generating superoxide radical (O2-) and
hydrogen peroxide (H2O2) and if the scavenging enzymes superoxide dismutase and catalase
are impaired this may result in the formation of hydroxyl radicals (HO.) that react rapidly
Oxidation
107
with and damage lipids, protein and DNA (Baynes, 1991). So many data (clinical and
experimental) have clearly documented the depletion of extra and intracellular antioxidants in
the diabetic state and the prevention of complications by antioxidant supplementation
(Baynes and Therpe, 2000; Cederberg et al., 2001; Yamagishi et al., 2001). Browlee (2001)
speculates that in the setting of hyperglycemia, over- production of superoxide by
mitochondrial electron transport chain and the resultant oxidative stress is the unifying
mechanism linking the major biochemical pathways triggered by hyperglycaemia. Oxidative
stress may be important in diabetes not just because of its role in the development of
complication but because persistent hyperglycaemia, secondary to insulin resistance may
induce oxidative stress and contribute to beta cell destruction in Type 2 diabetes (Maria et al.,
2007). Protein kianse C activation induced by glycemia may also represent a common
pathway by which oxidants and glycation products may mediate their advanced effects.
1.5.1 Mechanism of Increased Oxidative Stress in Diabetes Mellitus
Many studies have shown that increased lipid peroxides and/or oxidative stress are present in
diabetic subjects. Oxidative stress can be increased before clinical signs of diabetic
complications. In diabetes, oxidative stress is caused by both increased production of reactive
oxygen species (ROS), sharp reduction in antioxidant defenses and altered cellular redox
status (West, 2000). Hyperglycaemia may lead to increased generation of free radicals via
multiple mechanisms. Patients with diabetes may be prone to acute and chronic oxidative
stress which enhances the development of late diabetic complications. Enhanced oxidative
stress in hyperglycemia is indicated by urinary excretion of 8 -iso –prostaglandin F2 alpha.
Oxidative stress measured as index an of lipid peroxidation and protein oxidation has been
shown to increase in both insulin-dependent diabetes and non-insulin dependent diabetes
(Nishikawa et al., 2000; Cerieillo et al., 2001; Mohora et al., 2006; Stephens et al., 2006).
Although, the source of oxidative stress remains unclear, it has been suggested that the
chronic hyperglycaemia in diabetes enhances the production of ROS from glucose
autoxidation, protein glycation and glycoxidation, which leads to tissue damage. Also,
cumulative episode of acute glycemia can be source of acute oxidative stress.
During diabetes or insulin resistance, increased oxidative glucose metabolism itself increases
mitochondria production of O2-, which will be then converted to OH., and H2O2 (Nishikawa
et al, 2000). Beyond glucose, ROS formation is also increased by free fatty acids, through
direct effects on mitochondria (Evans et al., 2002). Enhanced oxidative stress in diabetes
108
(Type 2) has further a variety of important effects in atherogenesis, including lipoprotein
oxidation, particularly low density lipoprotein (LDL) oxidation. Lipid peroxidation of
polyunsaturated fatty acid (PUFA), one of the radical reactions in vivo, can adequately reflect
increased oxidative stress in diabetes (Slatter et al., 2002). The over-production of O.2, in
particular by mitochondria, causes inhibition of the glyceraldehyde -3-phosphate
dehydrogenase (GAPDH) and of cytochrome enzyme of the electron transport system
responsible for oxidative phosphorylation associated with the Krebs cycle (Nishikawa et al.,
2000). Hyperglycaemia- induced GAPDH inhibition was a consequence of poly (ADP-
ribosylation) of GAPDH by poly (ADP-ribose) polymeras], which was activated by DNA
strand breaks produced by mitochondria superoxide over production (Du et al., 2003).
As a result, glycolytic intermediates upstream of GAPDH accumulate, leading to increased
substrate- directed activity of the diacylglycerol synthetic pathway , which further activates
PKC (protein kinase C isoforms) and NADPH oxidase , as well as the hexosamine and polyol
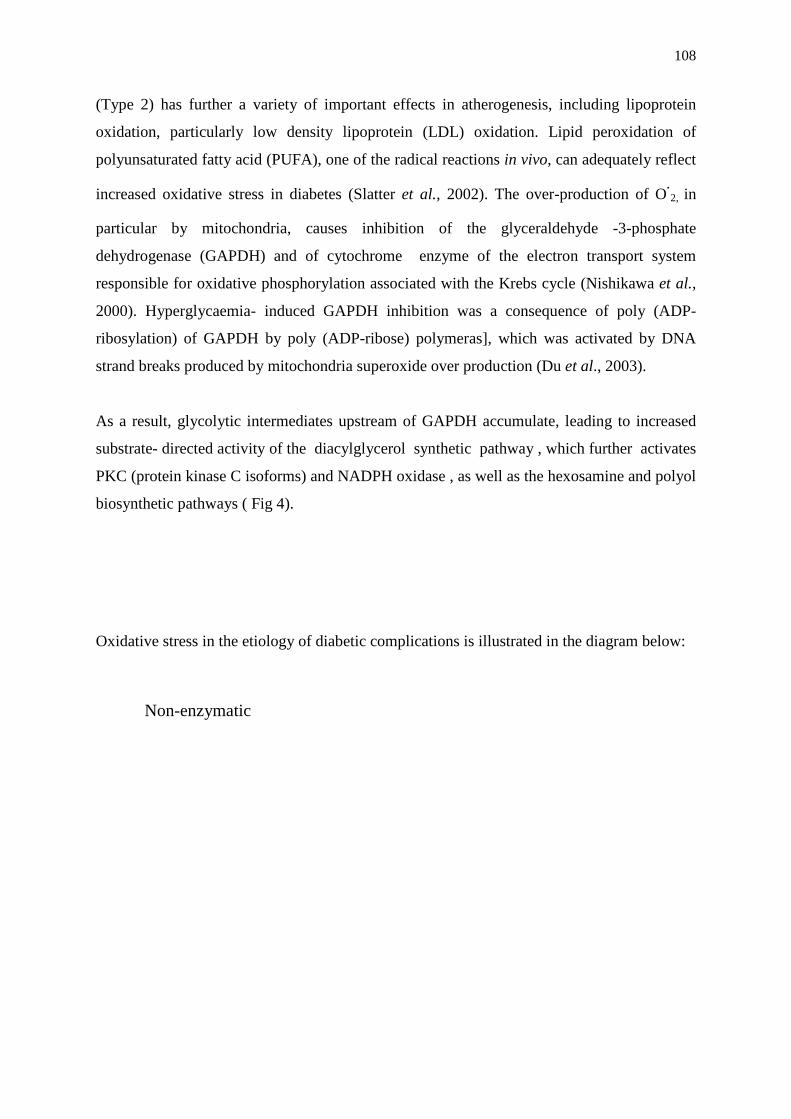
biosynthetic pathways ( Fig 4).
Oxidative stress in the etiology of diabetic complications is illustrated in the diagram below:
Non-enzymatic
109
Fig. 4: Pathways that contribute to oxidative stress in response to increased glucose flux
Source: (Maria et al., 2007).
1.5.2 Glucose Autoxidation
Hyperglycaemia –induced oxidative stress also occur in non-nucleated cells lacking
mitochondria and the NADPH oxidase (i.e. erythrocytes) (Jain, 1989). There must therefore
be another mechanism of ROS formation in these cells. One hypothesis is glucose
autoxidation. Glucose and many of its metabolites can react with hydrogen peroxide in the
presence of transition metals, such as Fe2+ and Cu2+, to form hydroxyl radical (OH.), the most
reactive ROS (Robertson et al., 2003).
1.5.3 Free Radicals
Free radicals are defined as atoms or molecules that contain one or more unpaired electrons,
making them unstable and highly reactive. The most important ROS are superoxide anion
(O2-) hydroxyl radical (OH.) hydrogen peroxide (H2O2), alkoxyl (RO.), peroxyl (ROO.) and
hydrochlorous acid (HOCl). Other non-oxygen species existing as reactive nitrogen species
(RNS), such as nitric oxide (NO) and peroxynitrite have also important bioactivity. ROS are
Poly(ADP-Ribose) Polymerase
Excess Mitochondria
110
continuously generated in physiological conditions and effectively eliminated by several
intracellular and extracellular antioxidant systems (Halliwell and Guttreridge, 1999). Free
radicals may be electrically neutral or either positively or negatively charged. They attack
sites of increased electron density such as the nitrogen atom present in proteins and DNA
predominantly and carbon-carbon double bonds present in polyunsaturated fatty acids and
phospholipids to produce additional free radicals which are often reactive intermediates
(Knight, 1999). Uncontrolled production of ROS often leads to damage of cellular
macromolecules,DNA, lipids and proteins and compromise cell function leading to cell death
by necrosis or apoptosis.
1.5.4 Reactive Oxygen Species and Oxidative Stress
Oxidative stress is defined as a disturbance in the proxidant- antioxidant balance in favor of
the former leading to potential damage and disruption of redox signaling and control. Cellular
metabolism generates reactive oxygen species (ROS). Molecular or ground state oxygen can
be activated to a ROS by means of energy transfer (e.g. under the influence of ultraviolet
radiation), forming singlet oxygen (1O2), or by electron transfer, forming incomplete
reduction products i.e. the superoxide anion radical (O2-). Small amount of oxygen (between
0.4 and 4% of all oxygen consumed) are reduced to O-2 by the mitochondria electron
transport chain during the course of normal respiration which is essential for generating ATP
(Boveris, 1984). Subsequently, O-2 can be converted into other ROS and RNS as shown in
Fig.5.
Under normal conditions, O2 - molecules are quickly converted to H2O2 by the key
mitochondrial enzyme, manganese superoxide dismutase (Mn-SOD) within the mitochondria
and by copper and zinc (CuZn-SOD) in the cytosol (Mendez et al., 2006). H2O2 is then
either detoxified to H2O and O2 by glutathione peroxidase (in the mitochondria) in
conjunction with glutathione reductase, or diffuse into the cytosol and detoxified by catalase
in peroxisomes. H2O2 can also be converted to the highly reactive hydroxyl radicals (HO-) in
the presence of reduced transition metals such as Cu or Fe (Fenton reaction). Further reactive
oxygen species may be derived from H2O2 such as the hypochlorite (OCL-) peroxyl radicals
(ROO.) and alkoxyl radicals (RO.) or from peroxidation of polyunsaturated fatty acids
(PUFA) such as conjugated dienes, lipid hydroperoxides and malondialdehyde (MDA)
(Taniyama and Griendling, 2003).
111
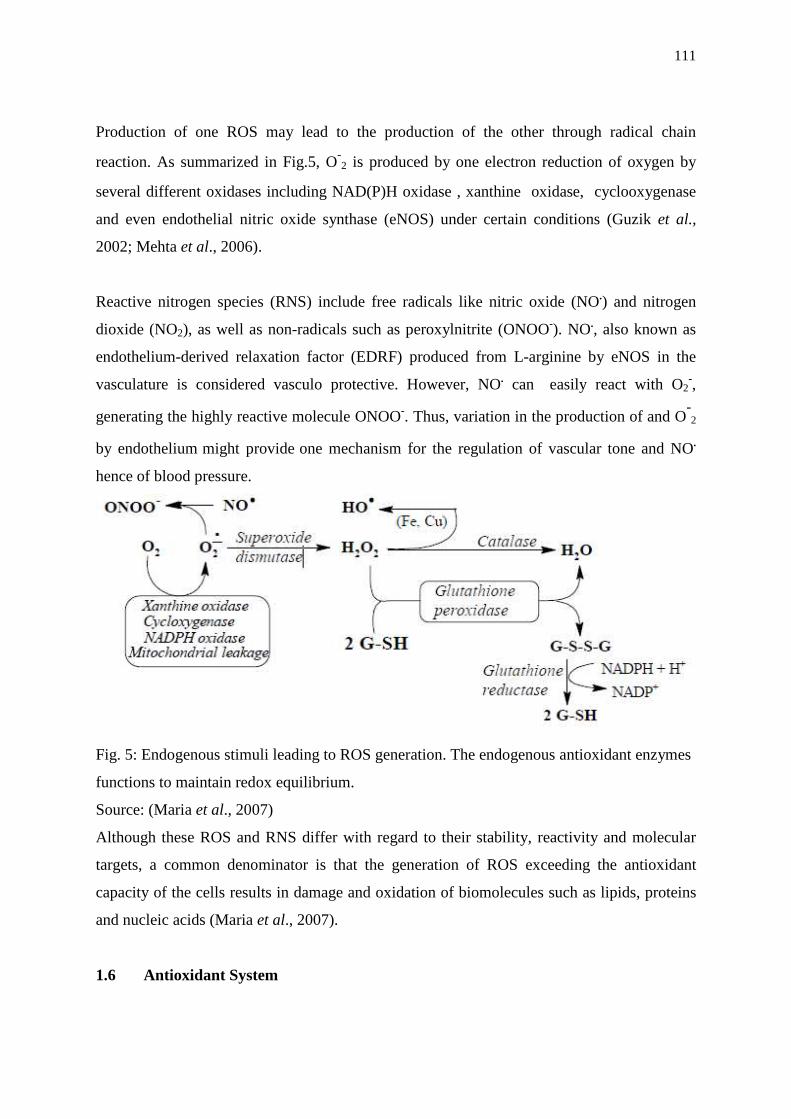
Production of one ROS may lead to the production of the other through radical chain
reaction. As summarized in Fig.5, O-2 is produced by one electron reduction of oxygen by
several different oxidases including NAD(P)H oxidase , xanthine oxidase, cyclooxygenase
and even endothelial nitric oxide synthase (eNOS) under certain conditions (Guzik et al.,
2002; Mehta et al., 2006).
Reactive nitrogen species (RNS) include free radicals like nitric oxide (NO.) and nitrogen
dioxide (NO2), as well as non-radicals such as peroxylnitrite (ONOO-). NO., also known as
endothelium-derived relaxation factor (EDRF) produced from L-arginine by eNOS in the
vasculature is considered vasculo protective. However, NO. can easily react with O2-,
generating the highly reactive molecule ONOO-. Thus, variation in the production of and O-2
by endothelium might provide one mechanism for the regulation of vascular tone and NO.
hence of blood pressure.
Fig. 5: Endogenous stimuli leading to ROS generation. The endogenous antioxidant enzymes
functions to maintain redox equilibrium.
Source: (Maria et al., 2007)
Although these ROS and RNS differ with regard to their stability, reactivity and molecular
targets, a common denominator is that the generation of ROS exceeding the antioxidant
capacity of the cells results in damage and oxidation of biomolecules such as lipids, proteins
and nucleic acids (Maria et al., 2007).
1.6 Antioxidant System
112
The reactive oxygen intermediates produced in mitochondria, peroxisomes, and the cytosol,
are scavenged by cellular defense systems including enzymatic (e.g. super oxide dismutase,
glutathione peroxidase, glutathione reductase, and catalase) and non-enzymatic antioxidants
(e.g. glutathione (GSH), thioredoxin, lipoic acid, ubiquinol, albumin, uric acid, flavonoids,
vitamins A, C and E, ).These antioxidants are located in the cell membranes, the cytosol or
blood plasma (Maritim et al., 2003). A major cellular thiol antioxidant and redox buffer of
the cell is reduced glutathione (GSH) which is regenerated most efficiently from oxidized
form (GSSG) by glutathione reductase and reduced nicotinamide adenine dinucleotide
phosphate (NADPH). Glutathione is highly abundant in cytosol (1 - 11 mM) nuclei (3 –
15mM); and mitochondria (5 – 11mM) and is the major soluble antioxidant in these
compartments (Masella et al., 2005; Valko et al., 2007). GSH in the nucleus maintains the
redox state of critical protein sulfhydryl that are necessary for DNA repair and expression.
Oxidized glutathione is accumulated inside the cell and the ratio of GSH/GSSG is a good
measure of oxidative stress of an organism (Valko et al., 2007). There are many other redox
couples in the cell, examples include NAD+ /NADH, ascorbate/dehydroascorbate,
NADP+/NADPH, and α – lipoic acid (LA)/dihydrolipoic acid (DHLA).
The main protective roles of glutathione against oxidative stress are (i) glutathione is a
cofactor of several detoxifying enzymes against oxidative stress, e.g. glutathione peroxidase,
(GPX), glutathione reductase, glyoxalases and enzymes involved in leucotriene synthesis.
(ii) GSH can react with ONOO- leading to formation of some nitrosothiol (GSNO), which
can decompose to regenerate NO., hence GSH can to some extent, recycle ONOO- to NO.
(iii) GSH scavenges hydroxyl radicals and singlet oxygen directly; detoxifying hydrogen
peroxides by the catalytic action of glutathione peroxidase (iv) Glutathione is able to
regenerate the most important antioxidants lipoic acid, vitamin C and E, back to their active
forms. Glutathione can reduce the tocopherol radicals of vitamin E directly or indirectly via
reduction of semi dehydroascorbate to ascorbate (Masella et al., 2005). The capacity of
glutathione to regenerate the most important antioxidant is linked with the redox state of
glutathione disulphide – glutathione couple (GSSG/2GSH) (Pastore et al., 2003)
1.6.1 Scavenging Properties of Antioxidants
A number of major cellular antioxidant defense mechanisms exist to neutralize the damaging
effects of free radicals. Enzymatic antioxidant system (Cu, Zn and Mn- superoxide dismutase
(SOD), catalase,glutathione (GSH), glutathione peroxidase (GPX), and glutathione reductase
113
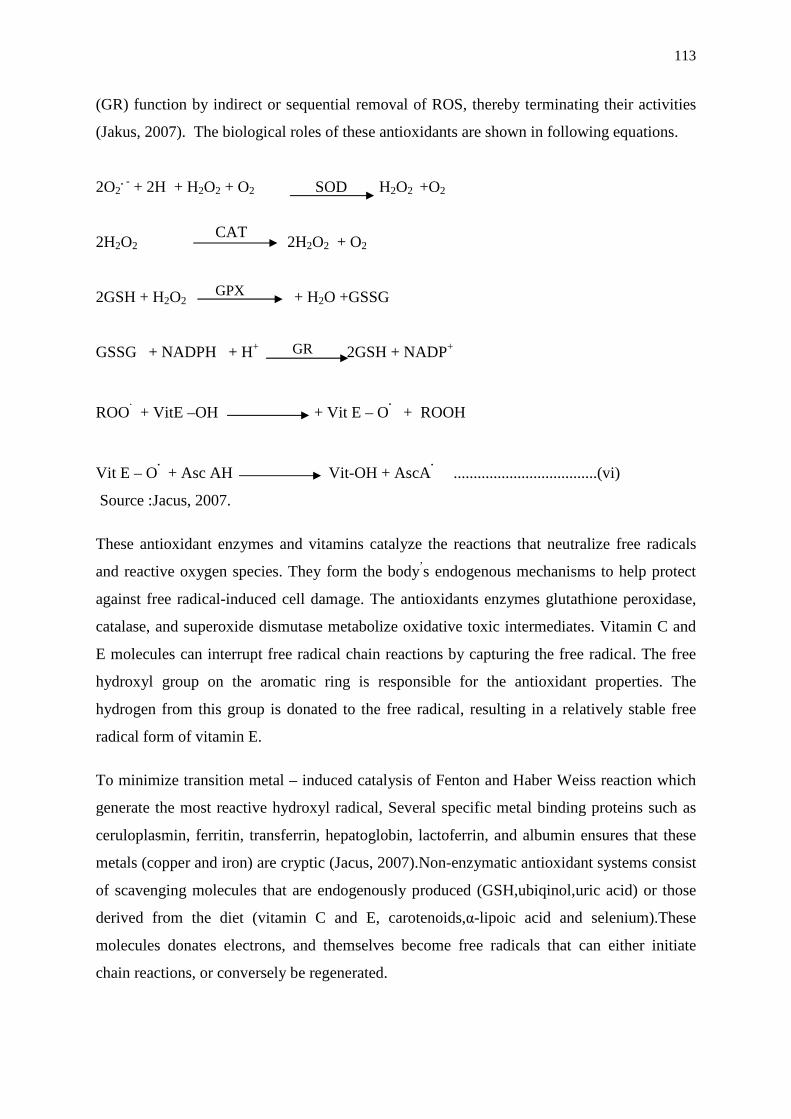
(GR) function by indirect or sequential removal of ROS, thereby terminating their activities
(Jakus, 2007). The biological roles of these antioxidants are shown in following equations.
2O2. - + 2H + H2O2 + O2 SOD H2O2 +O2
2H2O2 2H2O2 + O2
2GSH + H2O2 + H2O +GSSG
GSSG + NADPH + H+ 2GSH + NADP+
ROO. + VitE –OH + Vit E – O
. + ROOH
Vit E – O. + Asc AH Vit-OH + AscA
. ....................................(vi)
Source :Jacus, 2007.
These antioxidant enzymes and vitamins catalyze the reactions that neutralize free radicals
and reactive oxygen species. They form the body’s endogenous mechanisms to help protect
against free radical-induced cell damage. The antioxidants enzymes glutathione peroxidase,
catalase, and superoxide dismutase metabolize oxidative toxic intermediates. Vitamin C and
E molecules can interrupt free radical chain reactions by capturing the free radical. The free
hydroxyl group on the aromatic ring is responsible for the antioxidant properties. The
hydrogen from this group is donated to the free radical, resulting in a relatively stable free
radical form of vitamin E.
To minimize transition metal – induced catalysis of Fenton and Haber Weiss reaction which
generate the most reactive hydroxyl radical, Several specific metal binding proteins such as
ceruloplasmin, ferritin, transferrin, hepatoglobin, lactoferrin, and albumin ensures that these
metals (copper and iron) are cryptic (Jacus, 2007).Non-enzymatic antioxidant systems consist
of scavenging molecules that are endogenously produced (GSH,ubiqinol,uric acid) or those
derived from the diet (vitamin C and E, carotenoids,α-lipoic acid and selenium).These
molecules donates electrons, and themselves become free radicals that can either initiate
chain reactions, or conversely be regenerated.
CAT
GPX
GR
114
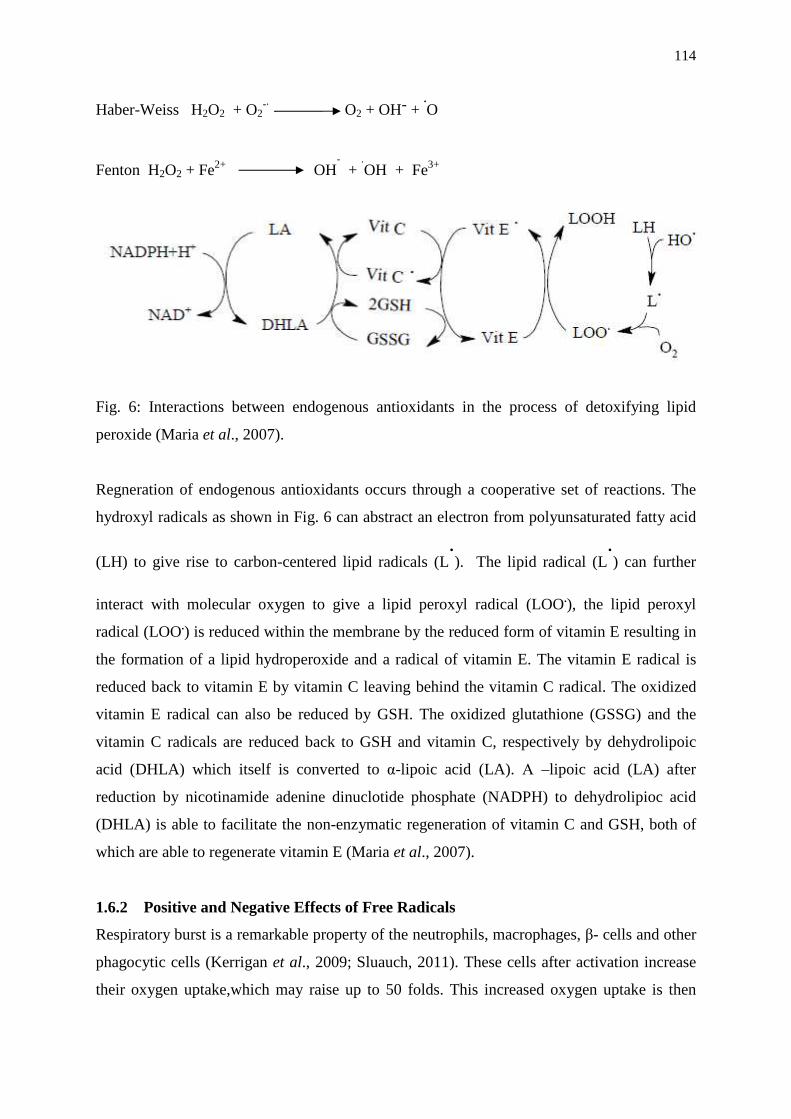
Haber-Weiss H2O2 + O2-. O2 + OH- +
.O
Fenton H2O2 + Fe2+ OH- +
.OH + Fe3+
Fig. 6: Interactions between endogenous antioxidants in the process of detoxifying lipid
peroxide (Maria et al., 2007).
Regneration of endogenous antioxidants occurs through a cooperative set of reactions. The
hydroxyl radicals as shown in Fig. 6 can abstract an electron from polyunsaturated fatty acid
(LH) to give rise to carbon-centered lipid radicals (L.). The lipid radical (L
.) can further
interact with molecular oxygen to give a lipid peroxyl radical (LOO.), the lipid peroxyl
radical (LOO.) is reduced within the membrane by the reduced form of vitamin E resulting in
the formation of a lipid hydroperoxide and a radical of vitamin E. The vitamin E radical is
reduced back to vitamin E by vitamin C leaving behind the vitamin C radical. The oxidized
vitamin E radical can also be reduced by GSH. The oxidized glutathione (GSSG) and the
vitamin C radicals are reduced back to GSH and vitamin C, respectively by dehydrolipoic
acid (DHLA) which itself is converted to α-lipoic acid (LA). Α –lipoic acid (LA) after
reduction by nicotinamide adenine dinuclotide phosphate (NADPH) to dehydrolipioc acid
(DHLA) is able to facilitate the non-enzymatic regeneration of vitamin C and GSH, both of
which are able to regenerate vitamin E (Maria et al., 2007).
1.6.2 Positive and Negative Effects of Free Radicals
Respiratory burst is a remarkable property of the neutrophils, macrophages, β- cells and other
phagocytic cells (Kerrigan et al., 2009; Sluauch, 2011). These cells after activation increase
their oxygen uptake,which may raise up to 50 folds. This increased oxygen uptake is then
115
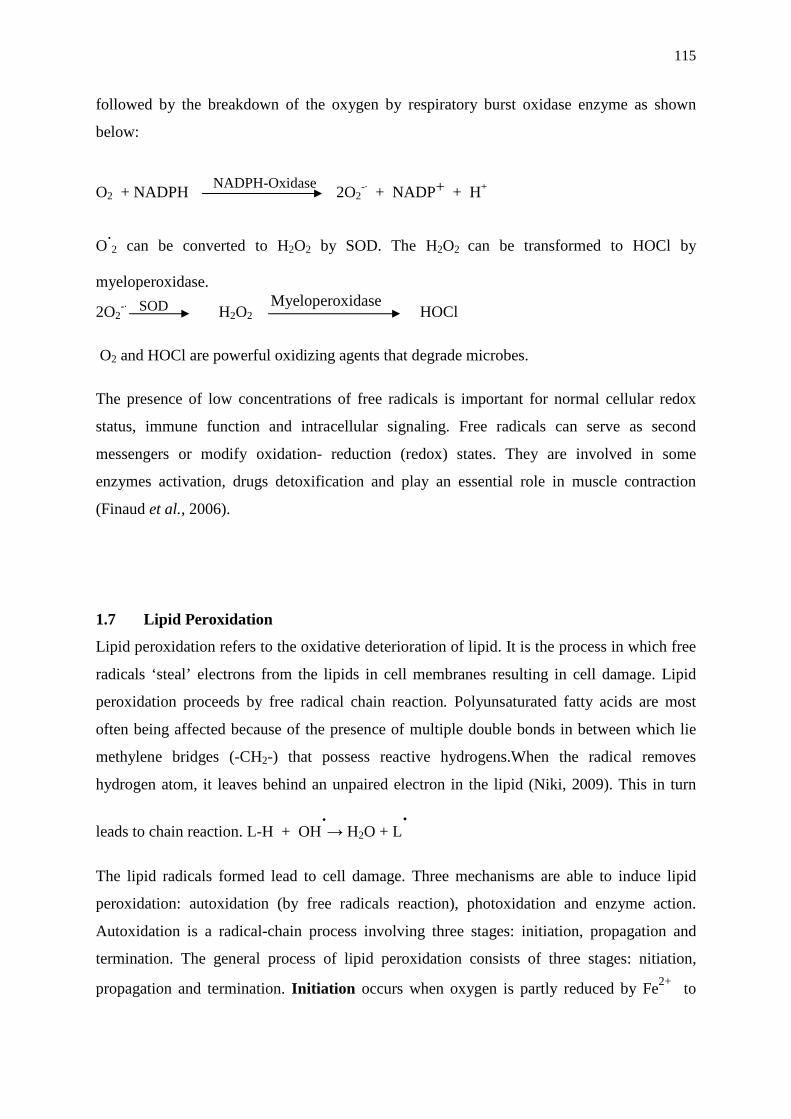
followed by the breakdown of the oxygen by respiratory burst oxidase enzyme as shown
below:
O2 + NADPH 2O2-. + NADP+ + H+
O.2 can be converted to H2O2 by SOD. The H2O2 can be transformed to HOCl by
myeloperoxidase.
2O2-. H2O2 HOCl
O2 and HOCl are powerful oxidizing agents that degrade microbes.
The presence of low concentrations of free radicals is important for normal cellular redox
status, immune function and intracellular signaling. Free radicals can serve as second
messengers or modify oxidation- reduction (redox) states. They are involved in some
enzymes activation, drugs detoxification and play an essential role in muscle contraction
(Finaud et al., 2006).
1.7 Lipid Peroxidation
Lipid peroxidation refers to the oxidative deterioration of lipid. It is the process in which free
radicals ‘steal’ electrons from the lipids in cell membranes resulting in cell damage. Lipid
peroxidation proceeds by free radical chain reaction. Polyunsaturated fatty acids are most
often being affected because of the presence of multiple double bonds in between which lie
methylene bridges (-CH2-) that possess reactive hydrogens.When the radical removes
hydrogen atom, it leaves behind an unpaired electron in the lipid (Niki, 2009). This in turn
leads to chain reaction. L-H + OH.→ H2O + L
.
The lipid radicals formed lead to cell damage. Three mechanisms are able to induce lipid
peroxidation: autoxidation (by free radicals reaction), photoxidation and enzyme action.
Autoxidation is a radical-chain process involving three stages: initiation, propagation and
termination. The general process of lipid peroxidation consists of three stages: nitiation,
propagation and termination. Initiation occurs when oxygen is partly reduced by Fe2+ to
NADPH-Oxidase
SOD Myeloperoxidase
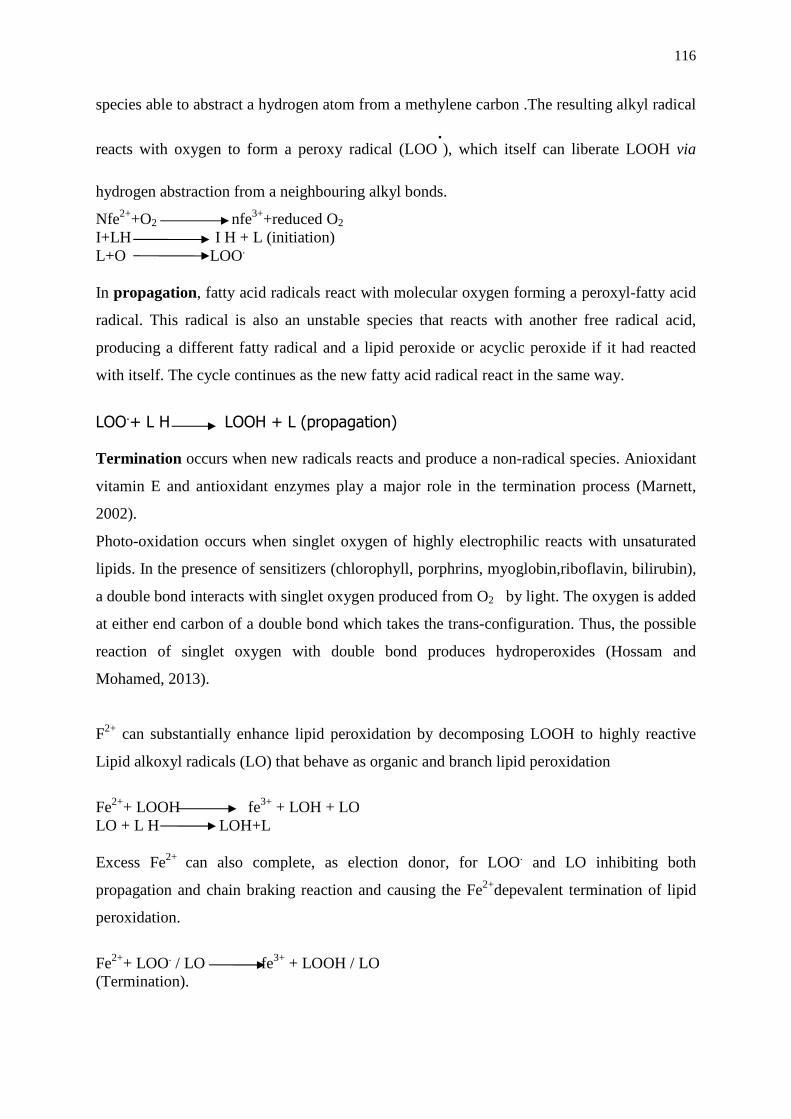
116
species able to abstract a hydrogen atom from a methylene carbon .The resulting alkyl radical
reacts with oxygen to form a peroxy radical (LOO.), which itself can liberate LOOH via
hydrogen abstraction from a neighbouring alkyl bonds.
Nfe2++O2 nfe3++reduced O2
I+LH I H + L (initiation) L+O LOO.
In propagation, fatty acid radicals react with molecular oxygen forming a peroxyl-fatty acid
radical. This radical is also an unstable species that reacts with another free radical acid,
producing a different fatty radical and a lipid peroxide or acyclic peroxide if it had reacted
with itself. The cycle continues as the new fatty acid radical react in the same way.
LOO.+ L H LOOH + L (propagation) Termination occurs when new radicals reacts and produce a non-radical species. Anioxidant
vitamin E and antioxidant enzymes play a major role in the termination process (Marnett,
2002).
Photo-oxidation occurs when singlet oxygen of highly electrophilic reacts with unsaturated
lipids. In the presence of sensitizers (chlorophyll, porphrins, myoglobin,riboflavin, bilirubin),
a double bond interacts with singlet oxygen produced from O2 by light. The oxygen is added
at either end carbon of a double bond which takes the trans-configuration. Thus, the possible
reaction of singlet oxygen with double bond produces hydroperoxides (Hossam and
Mohamed, 2013).
F2+ can substantially enhance lipid peroxidation by decomposing LOOH to highly reactive
Lipid alkoxyl radicals (LO) that behave as organic and branch lipid peroxidation
Fe2++ LOOH fe3+ + LOH + LO LO + L H LOH+L Excess Fe2+ can also complete, as election donor, for LOO. and LO inhibiting both
propagation and chain braking reaction and causing the Fe2+depevalent termination of lipid
peroxidation.
Fe2++ LOO. / LO fe3+ + LOOH / LO (Termination).
117
Malondialdehyde (MDA) is a late–stage lipid oxidation by-product that can be formed non
enzymatically as a by-product of cycloxygenase activity (Slatter et al., 2002). MDA is a
highly toxic product formed in part by lipid oxidation-derived free radicals. Many studies
have shown that its concentration is considerably high in diabetes mellitus correlating with
poor glycemic control (Slatter et al., 2002, Hoff et al., 2003). MDA is a volatile molecule that
reacts, via Schiff base formation, with free amine groups of proteins, lipids and DNA. It is
estimated that up to 80% of MDA is protein-bound (Slatter et al., 2002). In addition,
accumulation of MDA affects membrane organization by increasing phosphotidyl serine (PS)
externalization. Accumulation of MDAand MDA adducts were correlated with many disease
state, such as hepatitis C, Down syndrome (Muchova et al., 2001), cancer (Marneth et al.,
2002), liver injury (Tuma, 2002), neurodegenerative disease and diadetes mellitus (Slatter et
al., 2002).
4-Hydroxy–nonenal is another lipid oxidation by-product which can form non-enzymatically
by-product. 4-Hydroxy–nonenal is formed from scission of precursor lipid hydroperoxide and
degradation of cyclic intermediates in lipid oxidation (Hoff et al., 2003). Compared with
MDA, 4-HNE is more reactive with proteins, potentiated by the ability for Michael addition
as well as Schiff based information. 4-HNE reacts with lysine from proteins and forms
pyrrols, cysteine and histidine. Few studies have demonstrated the accumulation of 4-HNE
in diabetes mellitus. 4-HNE is increased in microsomes and mitochondria of the IDDM
model mice (Traverso et al., 2002) and in the kidney of STZ-induced diabetic rats.
Lipid hydroperoxides are intermediates of lipid oxidation and are also formed enzymatically
through the action of lipoxygenases. Both forms of lipid peroxidation by-products are
structurally similar and can be further modified to hydroxyl fatty acid, leukotrienes, and
lipids by lipoxygenases and glutathione peroxidase. These molecules are ultimately important
in regulation of inflammation and atherosclerosis (Funk and Cyrus, 2001 and Natarajan and
Nadle, 2003). They initiate apoptosis in vascular smooth muscle cells (Dandona and Mjada,
2002).There is evidence that both non-enzymatically and enzymcatically formed lipid
hydroperoxides and their derivatives are elevated in diabetic state and are associated with a
few of the diabetic complications.
Non-enzymatically produced lipid hydroperoxide increased in the retina of STZ- induced
diabetic rats (Kowluru, 2003) and in the plasma of NIDDM (Nourooz-zadeh et al., 1997) and
IDDM (Davison et al., 2002) patients.
118
Isoprostanes are nonenzymatic products of arachidonic acid oxidation that are formed in situ
in the cell membrane and are released through the action of phospholipases. Isoprostanes
metabolites, such as epoxyisoprostanes and epoxycyclopentenones, stimulate endothelia cell
protein expression and synthesis (Subbanagounder et al., 2002). In addition isoprostane have
been used extensively as indicators of oxidative stress in cigarette smoking – induced
oxidation, pesticide exposure, chronic obstructive pulmonary disease, athero-thrombotic
disease, heart disease, atherosclerosis and diabetic mellitus (Subbanagounder et al., 2002).
They offer specificity and sensitivity advantages over MDA, the classic oxidant indicator.
1.8 Antioxidant Supplementation in Diabetes Mellitus
Given the involvement of oxidative stress in diabetic complications, supplementation with
antioxidants could be of interest since they delay the appearance or the development of
vascular complications. Some information is available on the effects of treatments with
classical antioxidants such as vitamin E, vitamin C or lipoic acid. Specifically, vitamin E
normalizes retinal blood flow and PKC activity in vascular tissue of diabetic rats (Kunisaki et
al., 1995). Lipoic acid has been suggested but not proven, to decrease the severity of diabetic
neuropathy by maintaining G-SH level and / or by its direct antioxidant properties (Vincent et
al., 2004). Vitamin E decreases the extent of diabetic complications, including renal damage,
and embryo pathway, nerve damage and vascular dysfunction. It equally delays lipid
peroxidation.
1.9 Alloxan
Alloxan and streptozotocin are the most prominent diabetogenic chemicals in diabetes
research. Both are cytotoxic glucose analogues. Although their cytotoxicity is achieved via
different pathways, their mechanisms of beta cell selective action are identical (Lenzen,
2007). In 1938 Wohler and Liebig synthesized a pyrmidine derivative, which they later called
alloxan (Lenzen et al., 1996). In 1943, interest in alloxan increased when Dunn and Mc
letchie reported that it could induce diabetes in animals as a result of the specific necrosis of
the pancreatic beta cells (Peschke et al., 2000). The resulting insulinopenia causes a state of
experimental diabetes mellitus called alloxan diabetes. The reduction product of alloxan,
dialuric acid, has been shown to be diabetogenic in animals and to cause ultrastructural
changes identical to those observed in response to alloxan (Jorns et al., 1997). It was
reported that streptozotocin is diabetogenic and could cause diabetes by specific necrosis of
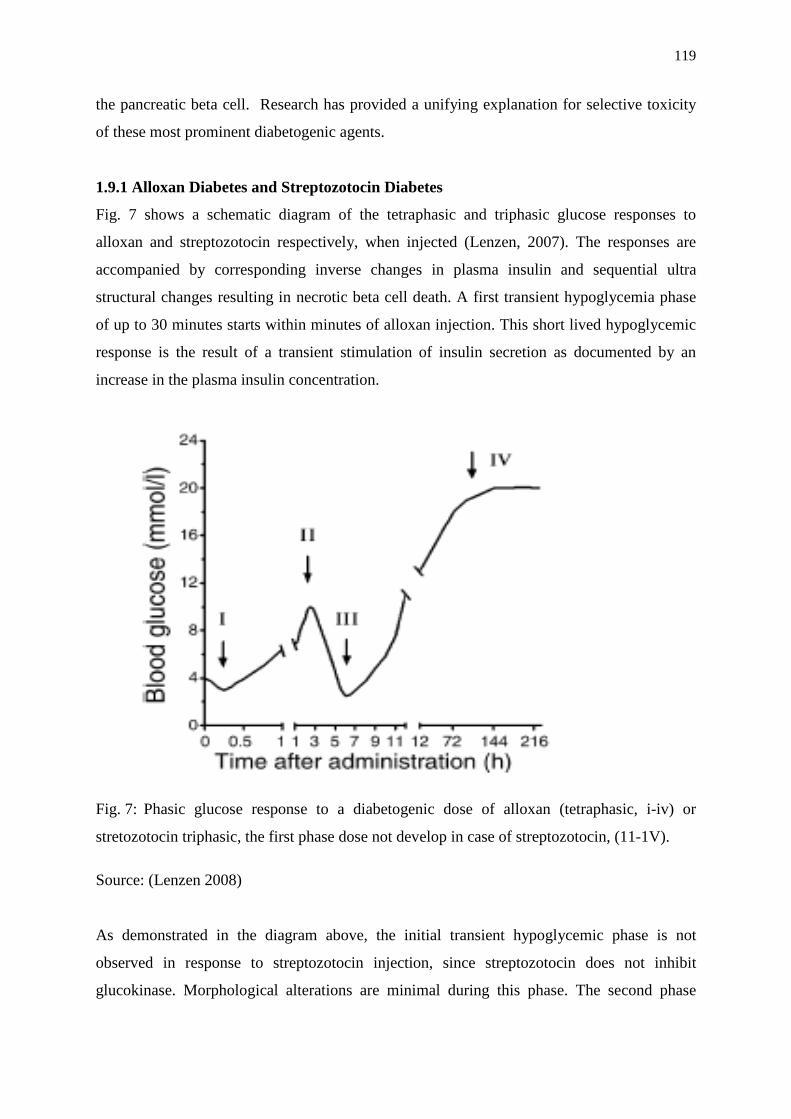
119
the pancreatic beta cell. Research has provided a unifying explanation for selective toxicity
of these most prominent diabetogenic agents.
1.9.1 Alloxan Diabetes and Streptozotocin Diabetes
Fig. 7 shows a schematic diagram of the tetraphasic and triphasic glucose responses to
alloxan and streptozotocin respectively, when injected (Lenzen, 2007). The responses are
accompanied by corresponding inverse changes in plasma insulin and sequential ultra
structural changes resulting in necrotic beta cell death. A first transient hypoglycemia phase
of up to 30 minutes starts within minutes of alloxan injection. This short lived hypoglycemic
response is the result of a transient stimulation of insulin secretion as documented by an
increase in the plasma insulin concentration.
Fig. 7: Phasic glucose response to a diabetogenic dose of alloxan (tetraphasic, i-iv) or
stretozotocin triphasic, the first phase dose not develop in case of streptozotocin, (11-1V).
Source: (Lenzen 2008)
As demonstrated in the diagram above, the initial transient hypoglycemic phase is not
observed in response to streptozotocin injection, since streptozotocin does not inhibit
glucokinase. Morphological alterations are minimal during this phase. The second phase
120
starts with an increase in the blood glucose concentration 1h after administration of the
toxins, and a decrease in plasma insulin. This first hyperglycemic phase, which usually lasts
2-4h, is caused by inhibition of insulin secretion leading to hypoinsulinemia. The third phase,
again a hypoglycemic phase typically occurs 4-8h after the injection of the toxins and last
several hours. It may be so severe that it causes convulsions, and may even be fatal without
glucose administration, in particular when liver glycogen stores are depleted through
starvation. This severe transitional hypoglycemia is produced by the flooding of the
circulation with insulin as a result of toxin – induced secretory granule and cell membrane
rupture (Lenzen., 2008). The fourth phase is the permanent diabetic hyperglycemic phase.
Morphologically, complete degranulation and loss of beta cell integrity is seen within 12-48h.
Non–beta cells remain intact, demonstrating the beta cell- selective character of the toxin.
Thus, injection of alloxan and streptozotocin principally induce the same blood glucose and
plasma insulin response and cause an insulin-dependent type 1- like diabetic syndrome. All of
the described morphological features of beta cell destruction are characteristic of necrotic cell
death (Lenzen, 2007).
1.9.2 Alloxan: Mechanism of Action
Alloxan has two distinct pathological effects: it selectively inhibits glucose-induced
insulin secretion through specific inhibition of glucokinase, the glucose sensor of the beta
cell, and causes a state of insulin-dependent diabetes through its ability to induce ROS
formation, resulting in the selective necrosis of beta cells (Lenzen, 2008). Due to its chemical
properties, in particular the greater stability (Table 2), streptozotocin is the agent of choice for
reproducible induction of a diabetic metabolic state in experimental animals (Lenzen et al.,
1996). Alloxan on the other hand, as a model compound of ROS-mediated beta cell toxicity,
is the agent with the greater impact upon the understanding of ROS mediated mechanisms of
beta cell death in type 1 and type 2 diabetes mellitus.
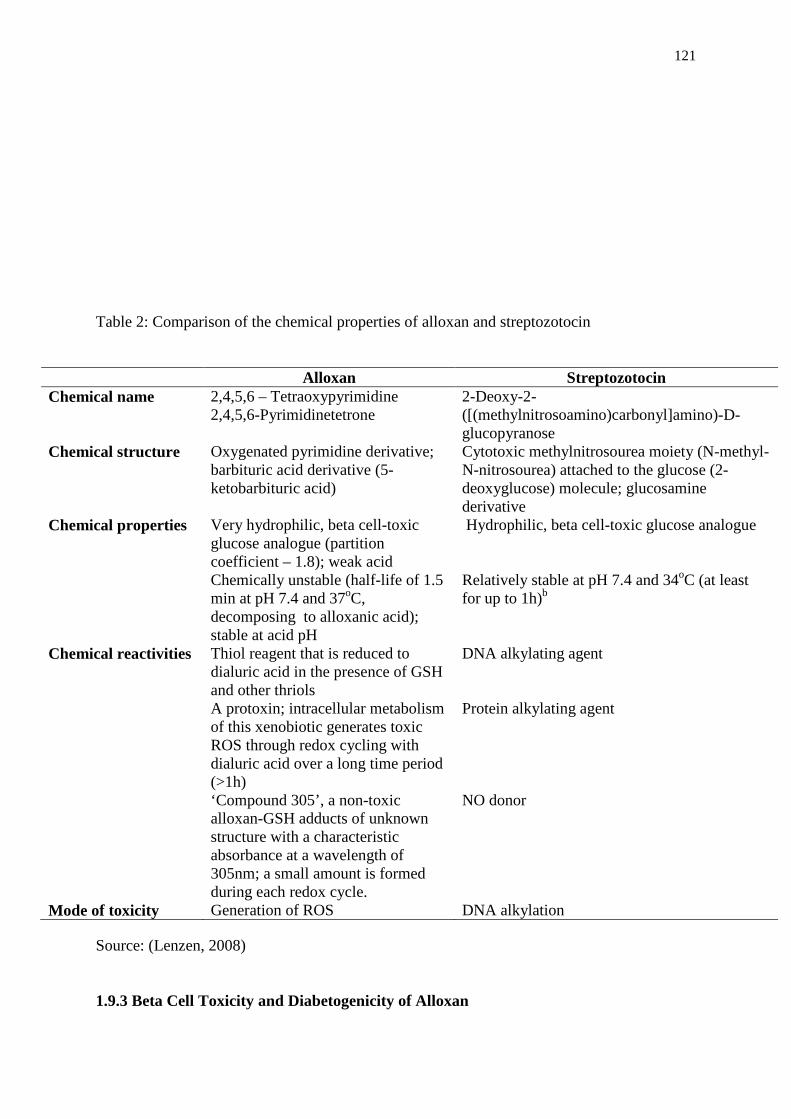
121
Table 2: Comparison of the chemical properties of alloxan and streptozotocin
Alloxan Streptozotocin Chemical name 2,4,5,6 – Tetraoxypyrimidine
2,4,5,6-Pyrimidinetetrone 2-Deoxy-2- ([(methylnitrosoamino)carbonyl]amino)-D-glucopyranose
Chemical structure Oxygenated pyrimidine derivative; barbituric acid derivative (5-ketobarbituric acid)
Cytotoxic methylnitrosourea moiety (N-methyl-N-nitrosourea) attached to the glucose (2-deoxyglucose) molecule; glucosamine derivative
Chemical properties Very hydrophilic, beta cell-toxic glucose analogue (partition coefficient – 1.8); weak acid
Hydrophilic, beta cell-toxic glucose analogue
Chemically unstable (half-life of 1.5 min at pH 7.4 and 37oC, decomposing to alloxanic acid); stable at acid pH
Relatively stable at pH 7.4 and 34oC (at least for up to 1h)b
Chemical reactivities Thiol reagent that is reduced to dialuric acid in the presence of GSH and other thriols
DNA alkylating agent
A protoxin; intracellular metabolism of this xenobiotic generates toxic ROS through redox cycling with dialuric acid over a long time period (>1h)
Protein alkylating agent
‘Compound 305’, a non-toxic alloxan-GSH adducts of unknown structure with a characteristic absorbance at a wavelength of 305nm; a small amount is formed during each redox cycle.
NO donor
Mode of toxicity Generation of ROS DNA alkylation
Source: (Lenzen, 2008)
1.9.3 Beta Cell Toxicity and Diabetogenicity of Alloxan
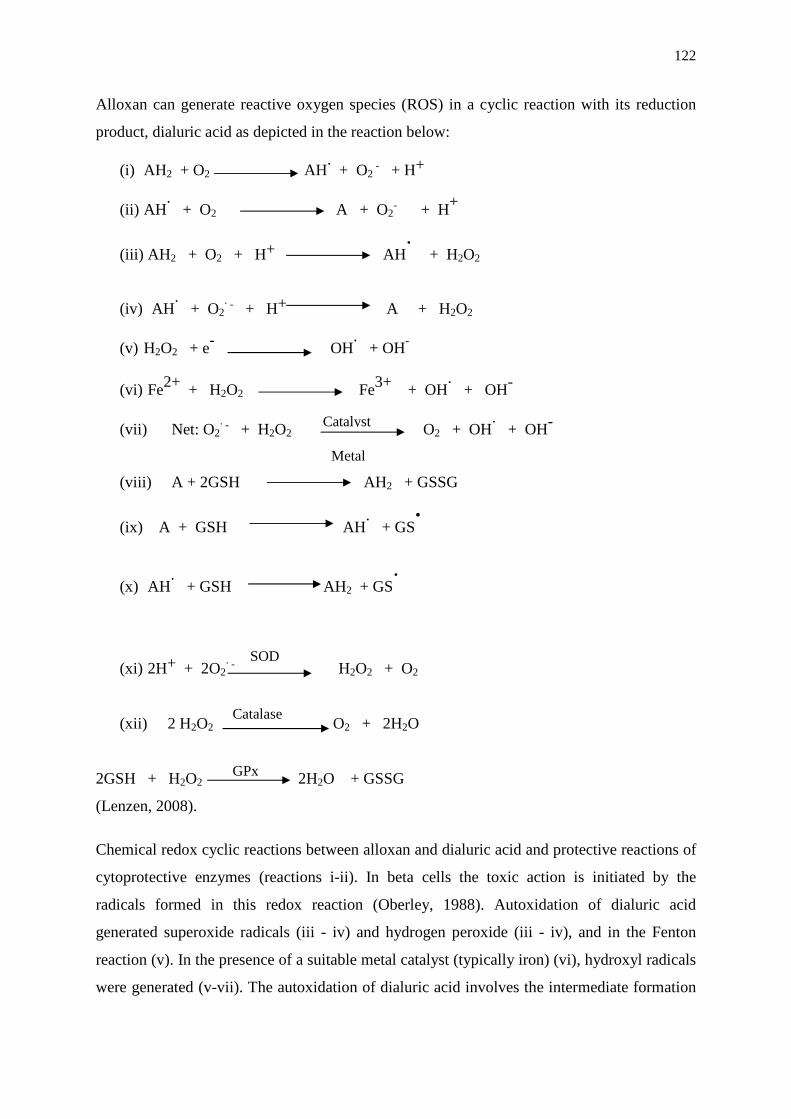
122
Alloxan can generate reactive oxygen species (ROS) in a cyclic reaction with its reduction
product, dialuric acid as depicted in the reaction below:
(i) AH2 + O2 AH. + O2
- + H+
(ii) AH. + O2 A + O2- + H+
(iii) AH 2 + O2 + H+ AH.
+ H2O2
(iv) AH. + O2
. - + H+ A + H2O2
(v) H2O2 + e- OH. + OH-
(vi) Fe2+ + H2O2 Fe3+ + OH. + OH-
(vii) Net: O2. - + H2O2 O2 + OH
. + OH-
Metal
(viii) A + 2GSH AH2 + GSSG
(ix) A + GSH AH. + GS
.
(x) AH. + GSH AH2 + GS
.
(xi) 2H+ + 2O2. - H2O2 + O2
(xii) 2 H2O2 O2 + 2H2O
2GSH + H2O2 2H2O + GSSG
(Lenzen, 2008).
Chemical redox cyclic reactions between alloxan and dialuric acid and protective reactions of
cytoprotective enzymes (reactions i-ii). In beta cells the toxic action is initiated by the
radicals formed in this redox reaction (Oberley, 1988). Autoxidation of dialuric acid
generated superoxide radicals (iii - iv) and hydrogen peroxide (iii - iv), and in the Fenton
reaction (v). In the presence of a suitable metal catalyst (typically iron) (vi), hydroxyl radicals
were generated (v-vii). The autoxidation of dialuric acid involves the intermediate formation
Catalyst
SOD
Catalase
GPx
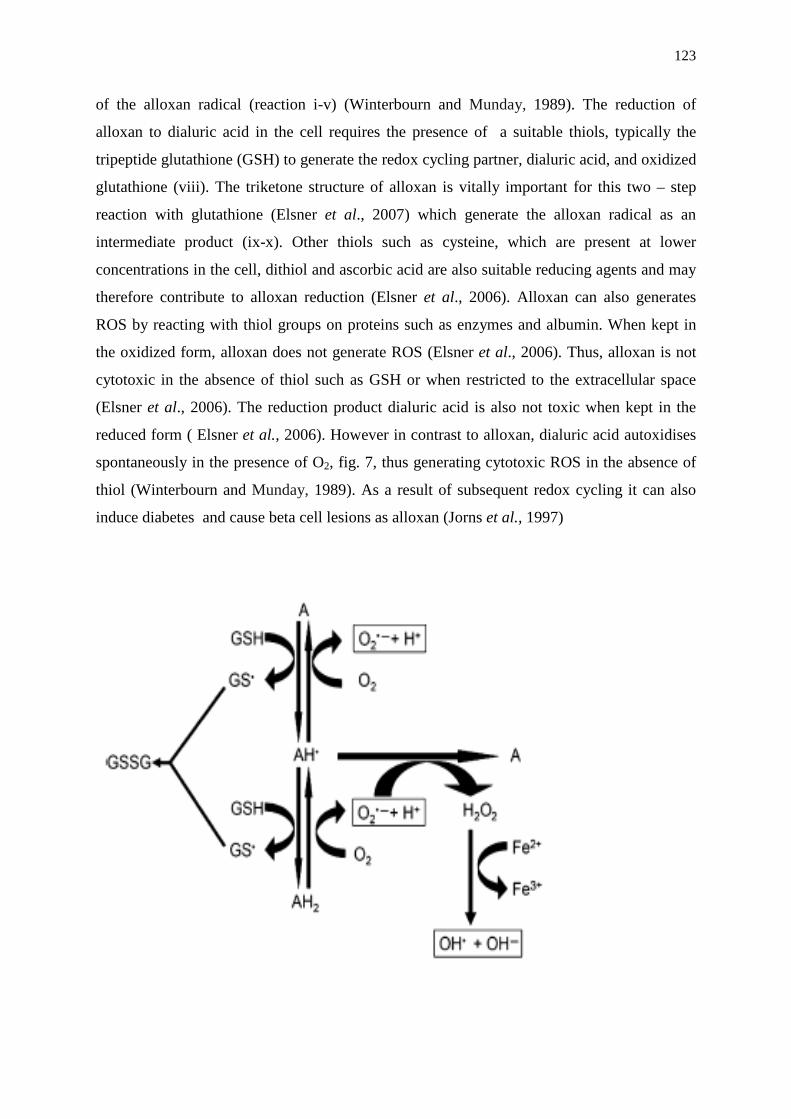
123
of the alloxan radical (reaction i-v) (Winterbourn and Munday, 1989). The reduction of
alloxan to dialuric acid in the cell requires the presence of a suitable thiols, typically the
tripeptide glutathione (GSH) to generate the redox cycling partner, dialuric acid, and oxidized
glutathione (viii). The triketone structure of alloxan is vitally important for this two – step
reaction with glutathione (Elsner et al., 2007) which generate the alloxan radical as an
intermediate product (ix-x). Other thiols such as cysteine, which are present at lower
concentrations in the cell, dithiol and ascorbic acid are also suitable reducing agents and may
therefore contribute to alloxan reduction (Elsner et al., 2006). Alloxan can also generates
ROS by reacting with thiol groups on proteins such as enzymes and albumin. When kept in
the oxidized form, alloxan does not generate ROS (Elsner et al., 2006). Thus, alloxan is not
cytotoxic in the absence of thiol such as GSH or when restricted to the extracellular space
(Elsner et al., 2006). The reduction product dialuric acid is also not toxic when kept in the
reduced form ( Elsner et al., 2006). However in contrast to alloxan, dialuric acid autoxidises
spontaneously in the presence of O2, fig. 7, thus generating cytotoxic ROS in the absence of
thiol (Winterbourn and Munday, 1989). As a result of subsequent redox cycling it can also
induce diabetes and cause beta cell lesions as alloxan (Jorns et al., 1997)
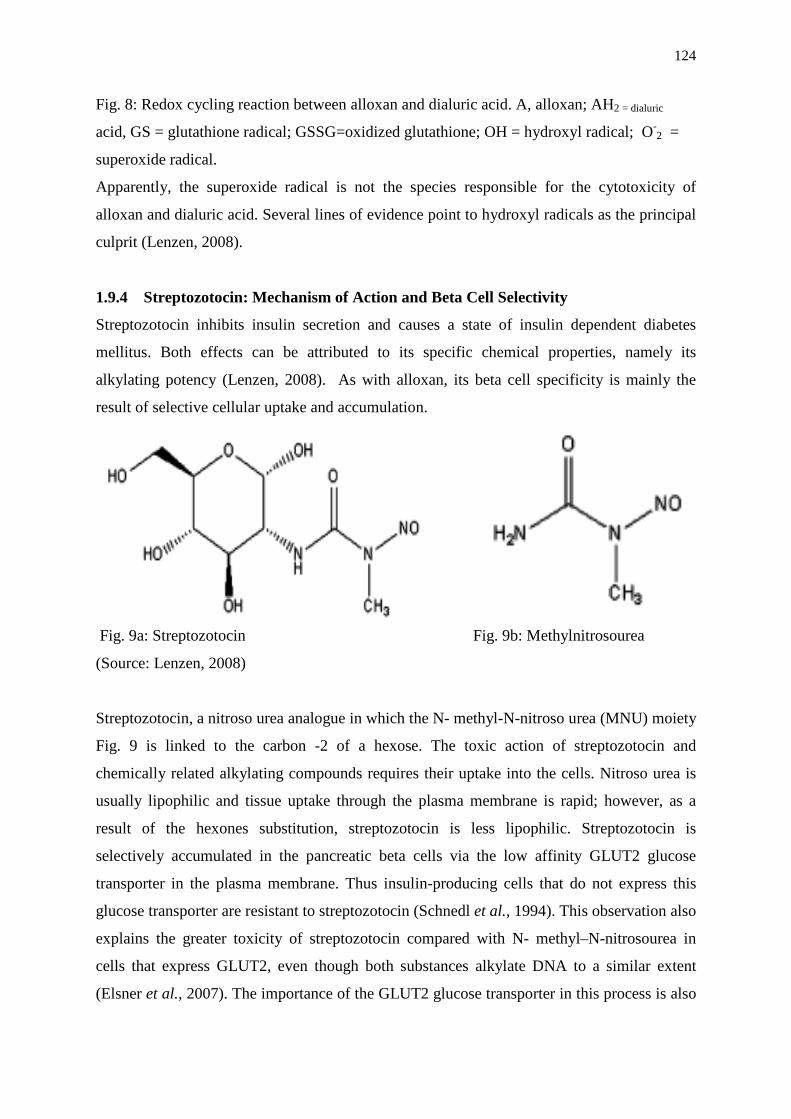
124
Fig. 8: Redox cycling reaction between alloxan and dialuric acid. A, alloxan; AH2 = dialuric
acid, GS = glutathione radical; GSSG=oxidized glutathione; OH = hydroxyl radical; O-2 =
superoxide radical.
Apparently, the superoxide radical is not the species responsible for the cytotoxicity of
alloxan and dialuric acid. Several lines of evidence point to hydroxyl radicals as the principal
culprit (Lenzen, 2008).
1.9.4 Streptozotocin: Mechanism of Action and Beta Cell Selectivity
Streptozotocin inhibits insulin secretion and causes a state of insulin dependent diabetes
mellitus. Both effects can be attributed to its specific chemical properties, namely its
alkylating potency (Lenzen, 2008). As with alloxan, its beta cell specificity is mainly the
result of selective cellular uptake and accumulation.
Fig. 9a: Streptozotocin Fig. 9b: Methylnitrosourea
(Source: Lenzen, 2008)
Streptozotocin, a nitroso urea analogue in which the N- methyl-N-nitroso urea (MNU) moiety
Fig. 9 is linked to the carbon -2 of a hexose. The toxic action of streptozotocin and
chemically related alkylating compounds requires their uptake into the cells. Nitroso urea is
usually lipophilic and tissue uptake through the plasma membrane is rapid; however, as a
result of the hexones substitution, streptozotocin is less lipophilic. Streptozotocin is
selectively accumulated in the pancreatic beta cells via the low affinity GLUT2 glucose
transporter in the plasma membrane. Thus insulin-producing cells that do not express this
glucose transporter are resistant to streptozotocin (Schnedl et al., 1994). This observation also
explains the greater toxicity of streptozotocin compared with N- methyl–N-nitrosourea in
cells that express GLUT2, even though both substances alkylate DNA to a similar extent
(Elsner et al., 2007). The importance of the GLUT2 glucose transporter in this process is also
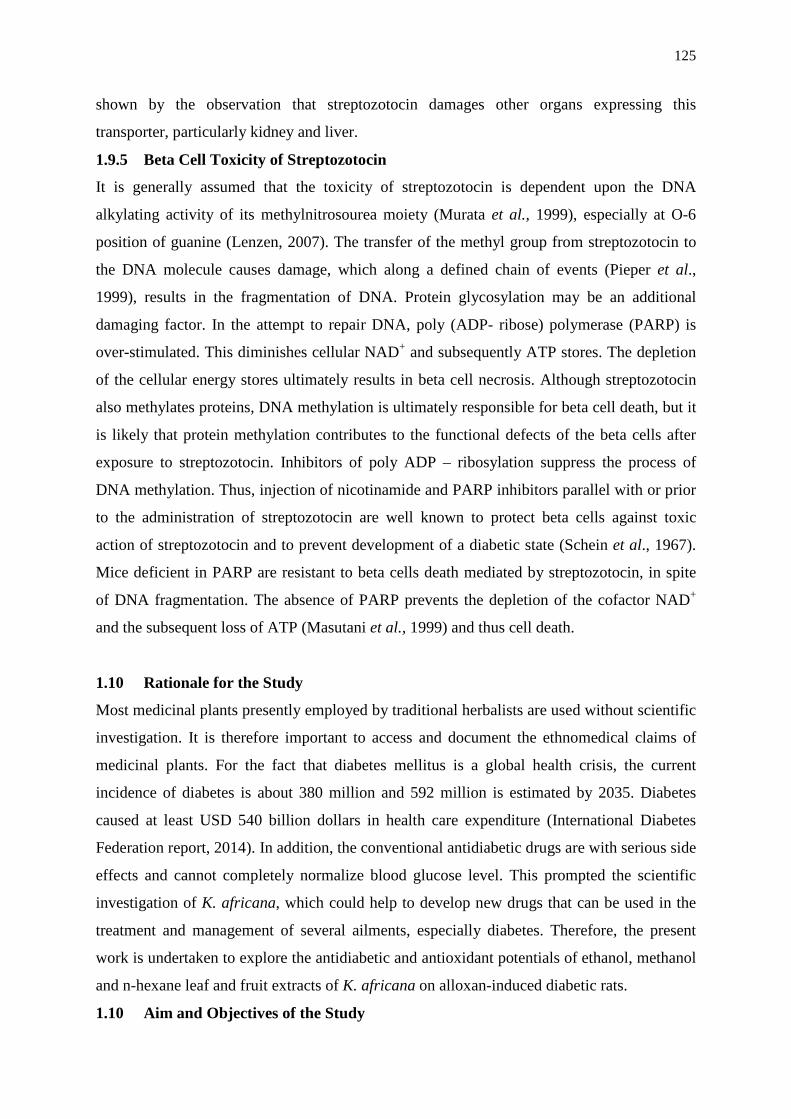
125
shown by the observation that streptozotocin damages other organs expressing this
transporter, particularly kidney and liver.
1.9.5 Beta Cell Toxicity of Streptozotocin
It is generally assumed that the toxicity of streptozotocin is dependent upon the DNA
alkylating activity of its methylnitrosourea moiety (Murata et al., 1999), especially at O-6
position of guanine (Lenzen, 2007). The transfer of the methyl group from streptozotocin to
the DNA molecule causes damage, which along a defined chain of events (Pieper et al.,
1999), results in the fragmentation of DNA. Protein glycosylation may be an additional
damaging factor. In the attempt to repair DNA, poly (ADP- ribose) polymerase (PARP) is
over-stimulated. This diminishes cellular NAD+ and subsequently ATP stores. The depletion
of the cellular energy stores ultimately results in beta cell necrosis. Although streptozotocin
also methylates proteins, DNA methylation is ultimately responsible for beta cell death, but it
is likely that protein methylation contributes to the functional defects of the beta cells after
exposure to streptozotocin. Inhibitors of poly ADP – ribosylation suppress the process of
DNA methylation. Thus, injection of nicotinamide and PARP inhibitors parallel with or prior
to the administration of streptozotocin are well known to protect beta cells against toxic
action of streptozotocin and to prevent development of a diabetic state (Schein et al., 1967).
Mice deficient in PARP are resistant to beta cells death mediated by streptozotocin, in spite
of DNA fragmentation. The absence of PARP prevents the depletion of the cofactor NAD+
and the subsequent loss of ATP (Masutani et al., 1999) and thus cell death.
1.10 Rationale for the Study
Most medicinal plants presently employed by traditional herbalists are used without scientific
investigation. It is therefore important to access and document the ethnomedical claims of
medicinal plants. For the fact that diabetes mellitus is a global health crisis, the current
incidence of diabetes is about 380 million and 592 million is estimated by 2035. Diabetes
caused at least USD 540 billion dollars in health care expenditure (International Diabetes
Federation report, 2014). In addition, the conventional antidiabetic drugs are with serious side
effects and cannot completely normalize blood glucose level. This prompted the scientific
investigation of K. africana, which could help to develop new drugs that can be used in the
treatment and management of several ailments, especially diabetes. Therefore, the present
work is undertaken to explore the antidiabetic and antioxidant potentials of ethanol, methanol
and n-hexane leaf and fruit extracts of K. africana on alloxan-induced diabetic rats.
1.10 Aim and Objectives of the Study
126
1.10.1 Aim of the Study
In this study, the effects of oral administration of ethanol, methanol and n-hexane extracts of
K. africana leaves and fruits in alloxan-induced diabetic rats were evaluated.
1.10.2 Specific Objectives of the Study
The above-mentioned aim of the study was achieved through the following specific
objectives: Determination of the effect of the extracts on
(i) blood glucose level of both normal and alloxan-induced diabetic rats,
(ii) body weight of both normal and alloxan-induced diabetic rats,
(iii) the concentration of sorbitol of both normal and alloxan-induced diabetic rats,
(iv) the concentration of total protein of both normal and alloxan-induced diabetic rats,
(v) glycosylated haemoglobin level of both normal and alloxan-induced diabetic rats,
(vi) lipid peroxidation index (MDA) of both normal and alloxan-induced diabetic rats,
(vii) vitamin C concentration of both normal and alloxan-induced diabetic rats,
(viii) the activities of some antioxidant enzymest (SOD, CAT, GPx) of both normal and
alloxan-induced diabetic rats,
(ix) lipid profiles of both normal and alloxan-induced diabetic rats,
(x) The activities of liver marker enzymes (ALT, AST), and the concentration of total
bilirubin and comparison of the effectiveness and synergistic effect of the extracts.
CHAPTER TWO
MATERIALS AND METHODS
2.1 Materials
127
2.1.1 Chemicals
These were analytical grade products and include ethanol, methanol, n-hexane,
ethylene diamine tetraacetate (EDTA), hydrochloric acid, sulphuric acid, trichloloroacetic
acid, (TCA), 2-thiobarbituric acid (TBA), alloxan monohydrate (sigma-Aldrich, USA), 1-
chloro-2, 4 dinitrothiobenzene, glutathione peroxidase kit (Randox Laboratories Limited,
UK), protein assay kits (Randox Company, USA), superoxide dismutase kit (Randox
Company, USA), glycosylated haemoglobin kit (Randox company,USA), sorbitol kit, lipid
profile kit, slucose test (Life Scan Inc, California, USA)
2.1.2 Instruments/Equipment
Atomic Absorption Spectrophotometer (AAS) Scientific 210 VGP, Buck, Centrifuge
PIC, England, pH meter Pye, Unican 293, England, Refrigerator, Air Thermocool, UV
Spectrometer,UNICO – UV-2012 , water bath DK-SA,Gallenkamp, England, Rotary
Evaporator, Model Modulyo 4K, England.
2.1.3 Drug
A dose of 2.5 mg/ kg body weight of glibenclamide was used as potent standard
(reference) drug (Nigerian German Chemical Plc).
2.1.4 Plant Material
The leaves and fruits of Kigelia africana were obtained from the plant in its natural
habitat in Omor Village, Ayamelum L.G.A, Anambra State, Nigeria and authenticated in the
Herbarum Unit of Department of Plant Science and Biotechnology, University of Nigeria
Nsukka.
2.2 Methods
2.2.1 Animal Management
Male albino rats (6-8 weeks old) of average weight 65 ±0.50 g were used for this
study. For LD50 determination mice of about 4-6 weeks old with average weight of 28±0.40 g
were used. These animals were obtained from the Department of Zoology, University of
Nigeria, Nsukka. The animals were kept under optimum temperature of 25oC for 14 days
with free access to water and food before the experiment commenced.
128
2.2.2 Preparation of Plant Extracts
Fresh leaves and fruits of K. africana were dried in the laboratory at room temperature,
crushed and soaked separately in 200 ml of analytical grade (98 %) methanol, Ethanol and n-
hexane for 72 hours. The mixture was filtered and evaporated with rotary evaporator at room
temperature to obtain the crude extract.
2.2.3 Design of the experiment
The animals were divided into 12 (twelve) groups of 5 (five) rats each. Treatment was carried
out orally using intubation tube. Groups 4-9 received 500 mg/kg body weight of the extract
while groups 10-12 were given 250 mg/kg body weight each of leaves and fruits extracts. The
groups were as follows:
Group 1: Normal rats administered normal saline
Group 2: Diabetic untreated rats
Group 3: Diabetic rats treated daily with a reference drug (glibenclamide) at a dose of
2.5mg/kg body weight.
Group 4: Diabetic rats treated with n-hexane extract of K. africana leaves
Group 5: Diabetic rats treated with n-hexane extract of K. africana fruits
Group 6: Diabetic rats treated with ethanol extract of K. africana leaves
Group 7: Diabetic rats treated with ethanol extract of K. africana fruits
Group 8: Diabetic rats treated with methanol extract of K. africana leaves
Group 9: Diabetic rats treated with methanol extract of K. africana fruits
Group 10: Diabetic rats treated with n-hexane extract of K. africana leaves and fruits
Group 11: Diabetic rats treated with methanol extract of K. africana leaves and fruits
Group 12: Diabetic rats treated with methanol extract of K. africana leaves and fruits. At the
end of 21 days post- treatment, the animals were bled through ocular puncture and blood
samples were received into clean dry test tubes for estimation of some biochemical and
oxidative parameters.
2.2.4 Percentage Yield of Extract
% Yield = 100pulp sample ground of (g)Weight
evaporatedextract dry of (g)Weight ×
2.2.5 Phytochemical Analysis of the Crude Extract
129
The preliminary analysis involved testing for the presence or absence of the following
plant constituents: alkaloids, flavonoids, glycosides, proteins, carbohydrates, reducing sugars,
saponins, tannins, oil, resins and terpenoids.
2.2.5.1 Test for the presence of alkaloids
Exactly 0.2 g of leaf /fruit extract of K. africana was boiled with 20% hydrochloric
acid (5 ml) on a steam bath allowed to cool and then filtered. One millilitre of the solution
was treated with 2 drops of Dragendorff reagent (Bismuth potassium iodide solution). A red
precipitate indicated the presence of alkaloids
2.2.5.2 Test for carbohydrates
The leaf/fruit extract (0.1 g) was shaken vigorously in 5 ml of distilled water and then
filtered. To the aqueous filtrate was added few drops of molisch reagent followed by vigorous
shaking. Concentrated sulphuric acid (1 ml) was carefully added to the solution. A brown
ring layer at the inter-phase indicates the presence of carbohydrates.
2.2.5.3 Test for reducing sugar
A quantity (0.1 g) of the crude extract was mixed with 5 ml of equal parts of Fehling’s
solution A and B and heated on a water bath for 5 minutes. A brick red precipitate showed
the presence of reducing sugar.
2.2.5.4 Test for protein
To 5 ml of distilled water was added 0.1 g of the sample and the mixture left to stand
for 3 hours and then filtered. To 2 ml portion of the filtrate was added 0.1 ml of million’s
reagent, shaken and kept for observation. Formation of yellow precipitate showed the
presence of proteins.
2.2.5.5 Test for fats and oil
A quantity (0.1 g) of the sample was pressed on the fliter paper and the paper was observed.
A control was also prepared by placing 2 drops of olive oil on filter paper. Translucency of
the filter paper indicated the presence of fats and oil.
2.2.5.6 Test for glycoside
130
Two grammes (2 g) of the extracts were mixed with 30 ml of water. The mixture was heated
on water bath for 5 minutes and filtered. To 5 ml of the filtrate was added a mixture of
Fehling’s solution A and B of equal volumes (0.2 ml each) until it turned alkaline (tested with
litmus paper). It was then boiled in waterbath for 3 minutes. A brick red precipitate indicated
presence of glycoside
2.2.5.7 Test for acidic substances
The sample (0.1 g) was placed in a clean dry test tube and sufficient distilled
water added. This was kept in a water bath and then cooled. A strip of neutral
litmus paper was dipped with the filtrate. Red colour of the litmus paper
indicated acidity.
2.2.5.8 Test for the presence of flavonoids
A quantity (0.2 g) of the extract was heated with 10 ml of ethyl acetate in boiling water for 3
minutes. The mixture was filtered and the filtrate used for the test. Four millilitres (4 ml) of
the filtrate were shaken with 1% aluminum chloride solution (1 ml) and observed. A
yellowish colouration in the ethylacetate layer indicated the presence of flavonoids.
2.2.5.9 Test for the presence of steroids
To a mixture of 10 ml of lead acetate solution (90% w/v) and 20 ml of aqueous ethanol (50%)
were added 1 g of the sample in a 200 ml conical flask. The mixture was placed on a boiling
waterbath for 3 minutes, cooled and filtered. The filtrate was extracted twice with 15 ml of
chloroform. Five ml of the chloroform extract was evaporated to dryness on a waterbath. To
the residue, 2 ml of 3, 5- dinitrobenzoic acid solution (2% in ethanol) and 1ml of 1 M sodium
hydroxide solution were added. A reddish brown interphase showed the presence of steroids.
2.2.5.10 Test for tannins
Two grammes of the sample were boiled in 5ml of 45% ethanol for 5 minutes. The mixture
was cooled and filtered. To one ml of the filtrate were added 3 drops of lead acetate solution.
A gelatinous precipitate indicated the presence of tannins.
2.2.5.11 Test for resins
131
i) Precipitate test: A weighed quantity of ( 0.2 g) of the sample was extracted with 15 ml
of 96% ethanol. The alcoholic extract was then poured into 20 ml of distilled water in a
beaker. A precipitate indicated the presence of resins.
ii) Colour test: A weighed quantity of (0.2 g) of the sample was extracted with
chloroform and the extract concentrated to dryness. The residue was dissolved in 3 ml of
acetone and another 3ml of concentrated hydrochloric acid was added. The mixture was
heated in a water bath for 30 minutes.
A pink colour, which changes to magenta red, indicated the presence of resins.
2.2.5.12 Test for saponins
The sample (0.1 g) was weighed and boiled with 5 ml of distilled water on a hot water bath
for 5 minutes. The mixture was filtered hot, allowed to cool and the filtrate used for the
following tests.
i) Emulsion test: To 1 ml of the filtrate, 2 drops of olive oil were added and the
mixture shaken vigorously. The formation of an emulsion indicated the presence
of saponins.
ii) Frothing test: One millitre (1 ml) of the filtrate was diluted with 4 ml of distilled
water, shaken vigorously and then observed on standing for a stable froth.
2.2.3.13 Test for terpenoids and steroids
Exactly 9 ml of ethanol (96%) was added to 9 g of the sample and refluxed for a few
minutes and filtered. The filtrate was concentrated to 2.5 ml on a boiling water bath and then
5 ml of hot water was added. The mixture was allowed to stand for 1 hour and the waxy
matter was filtered off. The filtrate was extracted with 2.5 ml chloroform using separating
funnel. To 0.5 ml of the chloroform extract in a test tube was carefully added 1 ml of
concentrated sulphuric acid to form a layer. A reddish brown interphase showed the presence
of steroids. Another 0.5 ml of chloroform extract was evaporated to dryness on a waterbath
and heated with 3 ml of concentrated sulphuric acid for 10 minutes on a waterbath. A gray
colour indicated the presence of terpernoids.
2.2.6 Proximate Analysis
132
Percentage concentrations of protein, carbohydrate, crude fiber, moisture and ash in the
leaves and fruits of K.africana extract were determined using the AOAC method (1990).
2.2.6.1 Crude protein
Principle
The crude protein content was determined using the micro Kjeldahl method. The method is
generally used to determine nitrogen (N) in substances which contain N as ammonium salts,
nitrates or organic N compounds. Since it measures the total amount of N in a compound
only a rough indication of the total content can be obtained hence the term crude protein. The
quantity of N measured was then multiplied by 6.25 to obtain the protein content of the
compound. The multiplication factor can vary with some materials (AOAC, 1990).
The N of protein and other compounds were converted to ammonium sulphate by acid
digestion with boiling H2SO4.The acid digest was cooked, diluted with water and made
strongly basic with NaOH. Ammonium was released and distilled into a 4% boric acid
solution. The amount of ammonium borate formed was determined with standard H2SO4 or
HCl.
The indicator used, bromocresol green, gave a pink colour end point at a hydrogen ion
concentration corresponding to a solution of NH4CI. Boric acid is so weak that it has no
appreciable influence on the pH. The reactions are represented as:
NH3 +HBO3 NH4 +BO3-
H+ +BO2 HBO2 (AOAC, 1990)
The method involved three major steps:
A. Digestion of the sample
B. Distillation of the ammonia into a trapping solution.
C. Quantification of the ammonia by titration.
(a) Digestion: A small quantity of sample of K. africana leaf or fruit extract (0.1 g) was
weighed in kjeldhal flask containing 2.0 g sodium sulphate/copper sulphate as catalyst.
Concentrated H2SO4 (20 ml) was introduced into the flask and the content gently digested to
yield a clear solution.
133
(b) Distillation: The content of the flask was washed with 220 ml distilled water into a
distillation flask and cooled under ice blocks. To the flask, 100 ml of 4% boric acid was first
added; later, 3 drops of screened methyl red was also added to the distillate and titrated
against 0.5 N Na2SO4 solution.
(c) Back titration: After cooling, 40% NaOH (50 ml) was added and the distillate was
titrated against 0.5 N Na2SO4 solution
The percentage nitrogen was calculated using the relationship
% Nitrogen = 100sample ofWeight
×××× MWNDfNT
Where
T = Titre volume
N = Normality of acid
Df = Dilution factor
MWN = Molecular weighted of nitrogen
% protein = % Nitrogen x 6.25
Where 6.25 =conversion factor of Nitrogen to protein
2.2.6.2 Crude fat
Principle
The sample was continuously extracted with ether. After extraction, the ether extract was
evaporated to dryness and the residue designated the ether extract also contained organic
acids, oil, pigments, alcohols and fat-soluble vitamins and was referred to as crude fat. Many
of the complex lipids, such as phospholipids are not completely extracted in this procedure
(Ensimger and Olentine, 1978).
Procedure
A washed, dried and cooled quick-fit flask was weighed. Extracts of K. africana leaves and
fruits were individually weighed into the extraction thimble and placed in the quick-fit
soxhlet apparatus. The solvent flask containing 250 ml of diethyl ether was connected to a
condenser. The set-up was heated for 16 hrs for complete extraction. The extract was
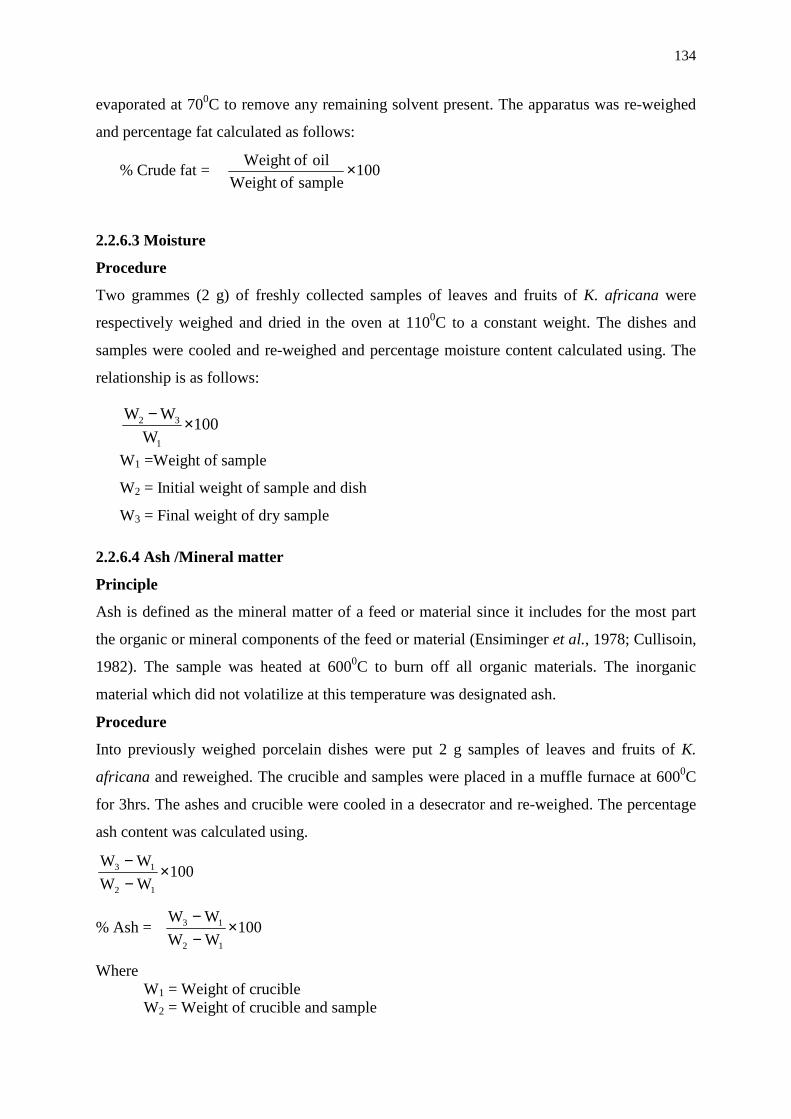
134
evaporated at 700C to remove any remaining solvent present. The apparatus was re-weighed
and percentage fat calculated as follows:
% Crude fat = 100sample ofWeight
oil ofWeight ×
2.2.6.3 Moisture
Procedure
Two grammes (2 g) of freshly collected samples of leaves and fruits of K. africana were
respectively weighed and dried in the oven at 1100C to a constant weight. The dishes and
samples were cooled and re-weighed and percentage moisture content calculated using. The
relationship is as follows:
W1 =Weight of sample
W2 = Initial weight of sample and dish
W3 = Final weight of dry sample
2.2.6.4 Ash /Mineral matter
Principle
Ash is defined as the mineral matter of a feed or material since it includes for the most part
the organic or mineral components of the feed or material (Ensiminger et al., 1978; Cullisoin,
1982). The sample was heated at 6000C to burn off all organic materials. The inorganic
material which did not volatilize at this temperature was designated ash.
Procedure
Into previously weighed porcelain dishes were put 2 g samples of leaves and fruits of K.
africana and reweighed. The crucible and samples were placed in a muffle furnace at 6000C
for 3hrs. The ashes and crucible were cooled in a desecrator and re-weighed. The percentage
ash content was calculated using.
100WW
WW
12
13 ×−−
% Ash = 100WW
WW
12
13 ×−−
Where W1 = Weight of crucible W2 = Weight of crucible and sample
100W
WW
1
32 ×−
135
W3 = Weight of crucible and ash
2.2.6.5 Crude fibre
Principle
This fraction was designed to include those materials in food which were of low digestibility
namely cellulose, certain hemicelluloses and some of the lignin, if present. Some of the
lignin, however, may be included in the nitrogen free extract. A moisture- free, ether extract
was digested first with weak acid solution (1.25% H2SO4) and then with a weak base solution
(1.25% NaOH). The organic residue left digestion is collected.
The loss of weight on ignition was called crude fibre.
Procedure
Samples of the leaf or fruit of K. africana extracts (2 g) each was weighed into 500 ml
beakers containing pre-heated concentrated H2S04 (40 ml). The content was boiled for 30
mins and filtered. The residue was washed three times with hot water, and then 150 ml of
pre-heated KOH and drops antifoam agent (loctanol) were added to the sample in the beaker
and heated to boiling. The mixture was boiled slowly for more 30 minutes, filtered and
washed three times with hot water. Acetone was then used in washing it three times in cold
extraction unit and the content dried at 1300C for one hour.
After ashing the content at 5000C, the ash was weighed and the percentage fibre calculated as
follow:
% Crude fibre = 100sample ofWeight
fibre ofWeight ×
2.2.6.6 Carbohydrate or Nitrogen-Free Extract (NFE)
Principle
Proximate analysis of carbohydrate is also known as Nitrogen-Free Extract (NFE)
determination. It includes mostly sugars and starches and also some of the more soluble
hemicelluloses and some of the more soluble lignin according to the method of Cullison,
(1982). Since this fraction was designed to include the more soluble carbohydrates, it is
sometimes refereed to as the carbohydrate portion of the material being analyzed.
136
Procedure
NFE was calculated by subtracting the sum of the fractions from 100 as follows:
100 – (% moisture + % crude protein +%crude fat +crude fibre +%ash) = NFE.
2.2.7 Acute Toxicity Test
2.2.7.1 Determination of LD50 of the Extract (Lorke, 1983)
Median lethal dose (LD50) is the 1og dose of a drug that kills 50 % of the population to which
the drug is administered. Investigation on the acute toxicity study LD50 of the extract was
determined using the method of Lorke (1983).Thirteen experimental mice were distributed in
3 groups each. These studies were conducted in two stages; 3 groups of mice were
administered differently 10 mg/kg, 100 mg/kg and 1000 mg/kg body weight of the K.
africana fruit and leaf extracts. The extracts were injected intraperitoneally.
The mice were observed for 24 hours for reactions, abnormal behavior and general body
conditions. Based on the percentage survival, further increased dose of 1,600, 2000 and 2900
mg/kg body weight were administered respectively and the fourth mice received only normal
saline. The mice were observed for another 24 hours. The LD50 was calculated as the
geometric mean of highest non-lethal and the lowest lethal doses.
2.2.8 Induction of Experimental Diabetes
The animals were fasted for 24 hours before induction. A total of eighty-four (84) rats with
blood glucose concentration 60 – 90 mg/dl were injected intraperitonally with alloxan
monohydrate (Sigma, USA) dissolved at cold normal saline in a dose of 160 mg/kg body
weight. The animals were fed with Bendel feed and Flour Mill Limited pelleted Guinea
Grower Mash. After seventy-two (72) hours blood glucose concentrations were determined
using glucometer (Acu-chek). Rats with blood glucose concentrations of 200 mg/dl and
above were used for determination of antidiabetic and antioxidative effects of K. africana leaf
and fruit extracts. The diabetic rats were divided into nine groups of five rats each. The
extract was dissolved in dimethyl sulphoxide (DMSO) and normal saline (1:10 v : v ) and
was given orally with oro-gastric tube throughout the duration of the experiment.
2.2.9 Determination of Fasting blood Glucose Concentration
Fasting blood sugar was determined using Accu-check Active glucometer by Roche
diagnostics Turkey, A.S according to the method of Mark and Dawson (1965).
Principle
Glucose oxidase
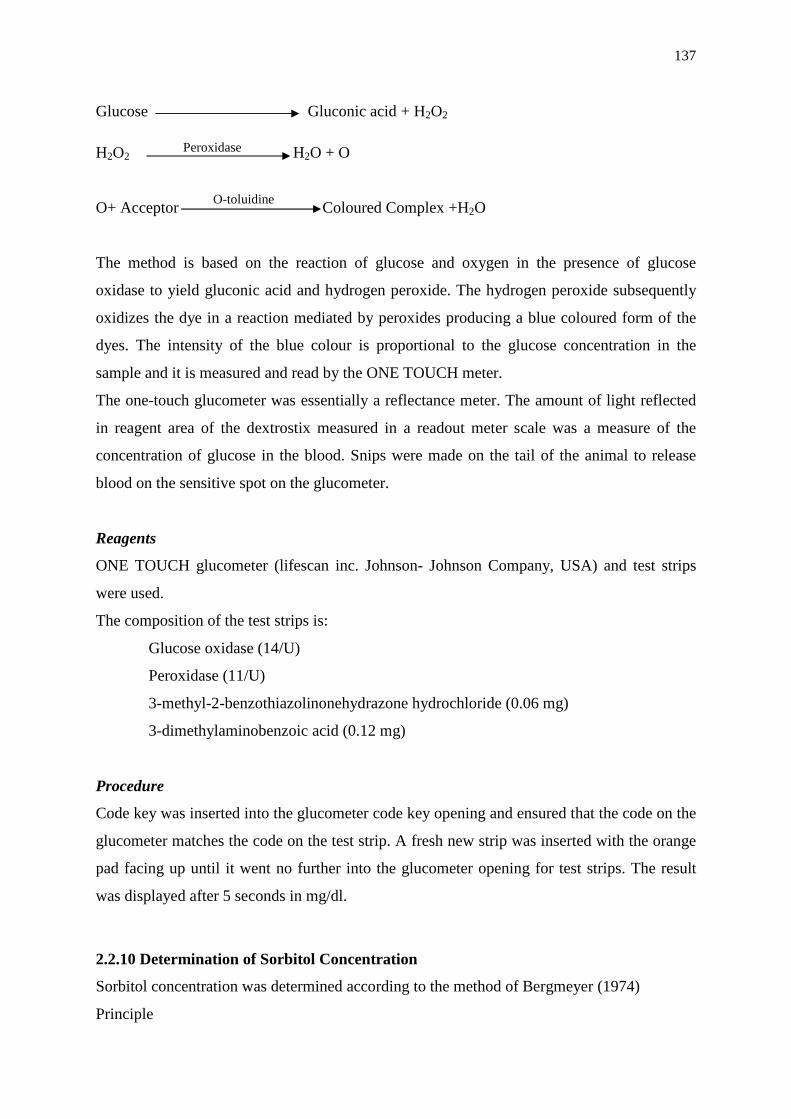
137
Glucose Gluconic acid + H2O2 H2O2 H2O + O
O+ Acceptor Coloured Complex +H2O
The method is based on the reaction of glucose and oxygen in the presence of glucose
oxidase to yield gluconic acid and hydrogen peroxide. The hydrogen peroxide subsequently
oxidizes the dye in a reaction mediated by peroxides producing a blue coloured form of the
dyes. The intensity of the blue colour is proportional to the glucose concentration in the
sample and it is measured and read by the ONE TOUCH meter.
The one-touch glucometer was essentially a reflectance meter. The amount of light reflected
in reagent area of the dextrostix measured in a readout meter scale was a measure of the
concentration of glucose in the blood. Snips were made on the tail of the animal to release
blood on the sensitive spot on the glucometer.
Reagents
ONE TOUCH glucometer (lifescan inc. Johnson- Johnson Company, USA) and test strips
were used.
The composition of the test strips is:
Glucose oxidase (14/U)
Peroxidase (11/U)
3-methyl-2-benzothiazolinonehydrazone hydrochloride (0.06 mg)
3-dimethylaminobenzoic acid (0.12 mg)
Procedure
Code key was inserted into the glucometer code key opening and ensured that the code on the
glucometer matches the code on the test strip. A fresh new strip was inserted with the orange
pad facing up until it went no further into the glucometer opening for test strips. The result
was displayed after 5 seconds in mg/dl.
2.2.10 Determination of Sorbitol Concentration
Sorbitol concentration was determined according to the method of Bergmeyer (1974)
Principle
Peroxidase
O-toluidine
138
D-Glucose + ß-NADH D-Sorbitol +ß-NAD+
Procedure:
Phosphate buffer (2 ml) solution was pipetted into a test tube. One milllitre (1 ml) of sample
was followed by 0.1 ml of nicotinamide adanine dinucleotide solution.The tube was mixed
and extinction E1 at 340 nm was measured. Sorbitol dehydrogenase (0.5 ml) was added and
mixed by inversion, allowed to stand for 60 mins after which the extinction E2 was read
again.
Sorbitol Conc. = E1/E2 × Concentration of std.
Whrere E1 and E2 = absorbancies
2.2.11 Determination of Total Protein Concentration
Total protein concentration was determined using protein assay kits according to the method
of Lowry et al. (1951)
Principle
This method is based on the principle that cupric ions, in an alkaline medium, interact with
peptide bonds of proteins resulting in the formation of a coloured complex.
Reagents contained in assay kits (Randox company, USA)
Contents
1. Biuret Reagent
Sodium hydroxide
Na – K – tartrate
Potassium iodide
Cupric sulphate
Concentration
100 mmol/L
16 mmol/L
15 mmol/L
6 mmol/L
2. Blank Reagent
Sodium hydroxide
Na – K – tartrate
100 mmol/L
16 mmol/L
3. Standard
Protein
60 g/L (6.0 g/dl)
139
Procedure
Distilled water (0.02 ml) was pipetted into reagent blank (B) test tube only. Standard solution
(0.02 ml) was added to another test tube labeled ST (standard) only. After which 0.02 ml of
the sera from the different rats were added to different test tubes labeled SA (sample) only.
Biuret reagent (1.0 ml) was added to all the three sets of test tubes. The content was mixed
thoroughly and incubated for 30 minutes at 25OC (room temperature). Absorbance of the
Sample (Asample) and of the Standard (Astandard) against the reagent blank was read at a
wavelength of 530 nm.
The total Protein concentration was calculated as follows:
Total Protein Conc. = Conc. StandardA
A
Standard
Sample ×
Where:
A sample = Absorbance of the Sample
A standard = Absorbance of the Standard
2.2.12 Determination of Haemoglobin Glycosylation
Principle
A haemolyzed preparation of the whole blood is mixed continuously for 5 minutes with a
weakly binding cation–exchange resin. During this time HbAo binds to the resin. After the
mixing period, a filter is used to separate the supernatant containing the glycohaemoglobin
from the resin.
The percentage glycohaemoglobin is determined by measuring the absorbance at 415 mm for
the haemoglobin and the total haemoglobin fraction. The ratio of the two absorbencies gives
the present haemoglobin
Reagent: Commercial kits obtain from TECO Diagnostics, USA
140
Content Concentration
Resin Reagent 8 mg/ml cation – exchange
Resin buffered at pH 6.9
Lysing Reagent 10 mm potassium cyanide,
surfactant added
Glycohaemoglobin standard 10% glycohaemoglobin
Serum separator -
Preparation of Reagents
1. Glycohaemoglobin lysing reagent: contents were brought to room temperature.
2. Glycohaemoglobin cation–exchange Resin: contents were brought to room
temperature. Each of the 5 tubes was swirl and gently inverted for a minimum of 10
times after addition.
Procedure
A. hemolysate preparation:
The lysing reagent (500 µl) was dispersed into tubes labelled standard, control and sample.
Well- mixed blood sample (100 µl) was placed into the appropriately labeled tube, mixed
well and allowed to stand for 5 minutes.
B. Glycohaemoglobin Preparation.
Exactly 3 ml of glycohaemoglobin cation-exchange resin was dispensed into 13 x 100 mm
tube labeled standard, control and sample 1. The haemolysate sample (100 µl) was added
into the sample test tubes. Filter separators were positioned in the test tube so that the rubber
sleeve is approximately 1cm above the liquid level. The tubes were placed on rotator and
mixed continuously for 5 minutes. Filter separator was pushed into the tubes until the resin
was firmly packed. The supernatant was poured into another tube for absorbance
measurement. The instrument was adjusted to zero absorbance at 415 mm with deionized
water as the blank.
Absorbance was read and recorded for standard, control and sample. These readings were for
glycohaemoglobin.
C Total Haemoglobin
Deionized water ( 5 µl ) was put into tubes labeled standard, control and sample 1.
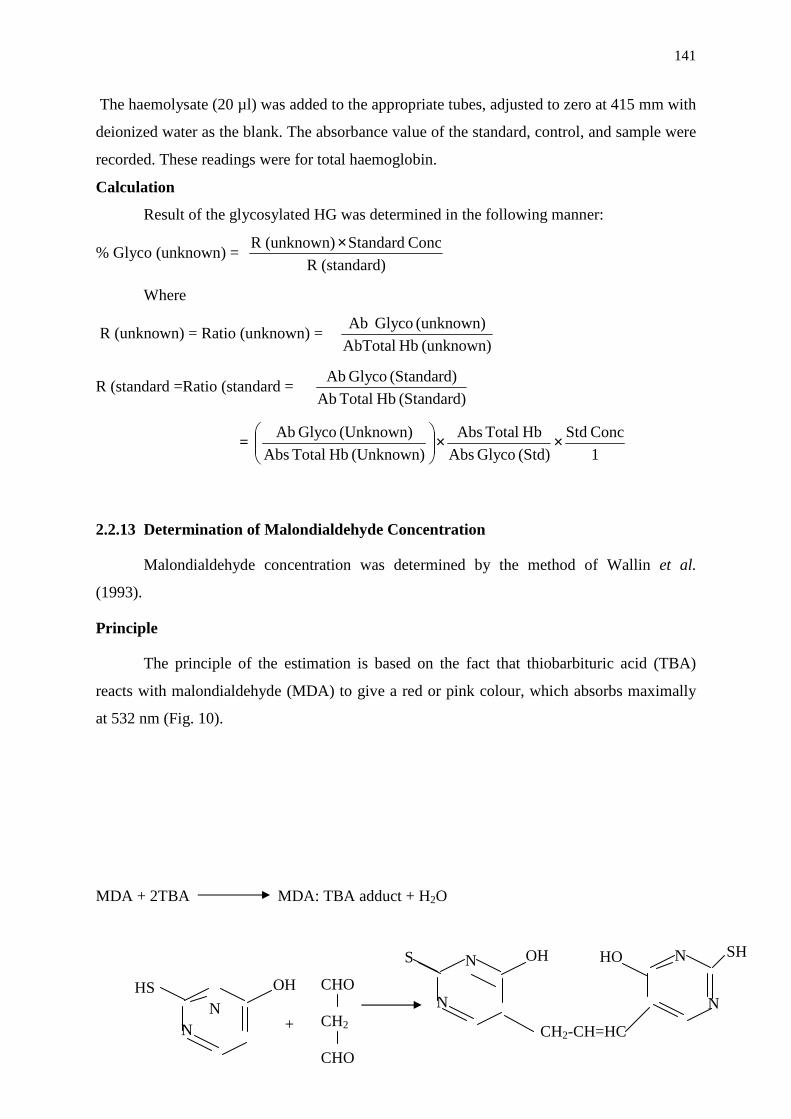
141
The haemolysate (20 µl) was added to the appropriate tubes, adjusted to zero at 415 mm with
deionized water as the blank. The absorbance value of the standard, control, and sample were
recorded. These readings were for total haemoglobin.
Calculation
Result of the glycosylated HG was determined in the following manner:
% Glyco (unknown) = (standard) R
Conc Standard (unknown) R ×
Where
R (unknown) = Ratio (unknown) = (unknown) Hb AbTotal
(unknown) Glyco Ab
R (standard =Ratio (standard = (Standard) Hb Total Ab
(Standard) Glyco Ab
= 1
Conc Std
(Std) Glyco Abs
Hb Total Abs
(Unknown) Hb Total Abs
(Unknown) Glyco Ab ××
2.2.13 Determination of Malondialdehyde Concentration
Malondialdehyde concentration was determined by the method of Wallin et al.
(1993).
Principle
The principle of the estimation is based on the fact that thiobarbituric acid (TBA)
reacts with malondialdehyde (MDA) to give a red or pink colour, which absorbs maximally
at 532 nm (Fig. 10).
MDA + 2TBA MDA: TBA adduct + H2O
N N
OH CHO CH2 CHO
HS
+
S OH
CH2-CH=HC
N N
N SH N HO
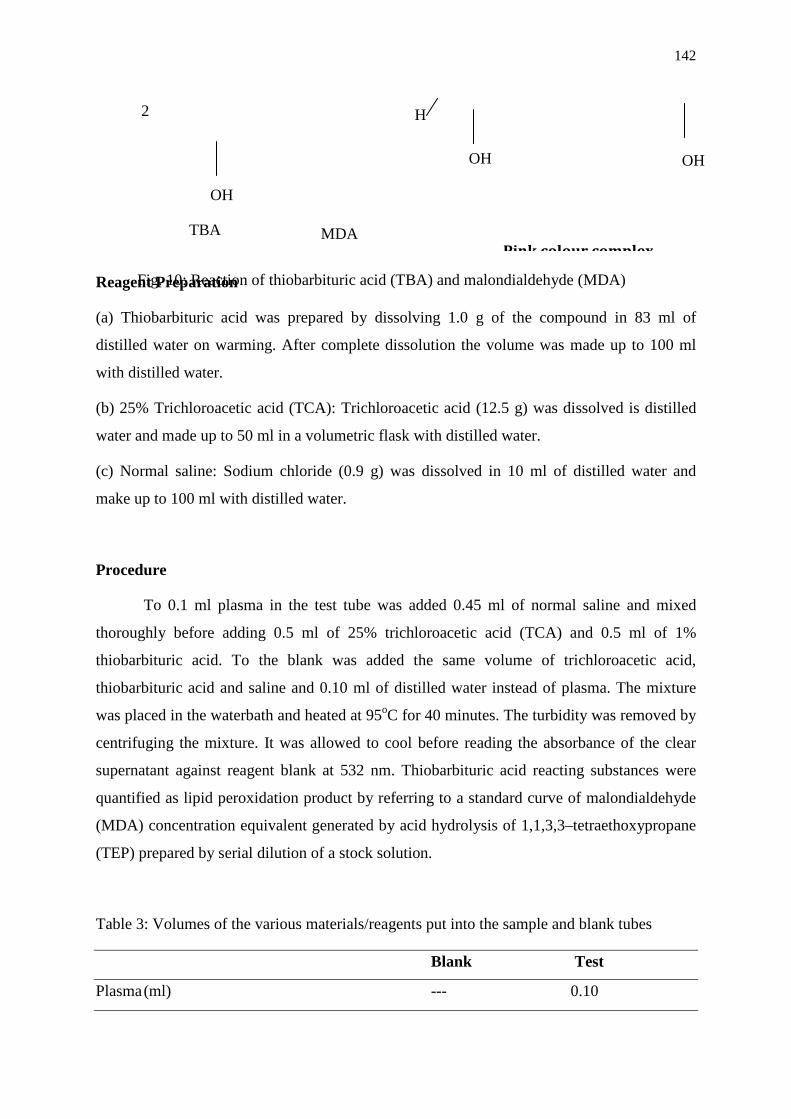
142
Reagent Preparation
(a) Thiobarbituric acid was prepared by dissolving 1.0 g of the compound in 83 ml of
distilled water on warming. After complete dissolution the volume was made up to 100 ml
with distilled water.
(b) 25% Trichloroacetic acid (TCA): Trichloroacetic acid (12.5 g) was dissolved is distilled
water and made up to 50 ml in a volumetric flask with distilled water.
(c) Normal saline: Sodium chloride (0.9 g) was dissolved in 10 ml of distilled water and
make up to 100 ml with distilled water.
Procedure
To 0.1 ml plasma in the test tube was added 0.45 ml of normal saline and mixed
thoroughly before adding 0.5 ml of 25% trichloroacetic acid (TCA) and 0.5 ml of 1%
thiobarbituric acid. To the blank was added the same volume of trichloroacetic acid,
thiobarbituric acid and saline and 0.10 ml of distilled water instead of plasma. The mixture
was placed in the waterbath and heated at 95oC for 40 minutes. The turbidity was removed by
centrifuging the mixture. It was allowed to cool before reading the absorbance of the clear
supernatant against reagent blank at 532 nm. Thiobarbituric acid reacting substances were
quantified as lipid peroxidation product by referring to a standard curve of malondialdehyde
(MDA) concentration equivalent generated by acid hydrolysis of 1,1,3,3–tetraethoxypropane
(TEP) prepared by serial dilution of a stock solution.
Table 3: Volumes of the various materials/reagents put into the sample and blank tubes
Blank Test
Plasma (ml) --- 0.10
2
TBA MDA Pink colour complex
Fig. 10: Reaction of thiobarbituric acid (TBA) and malondialdehyde (MDA)
OH
H
OH OH
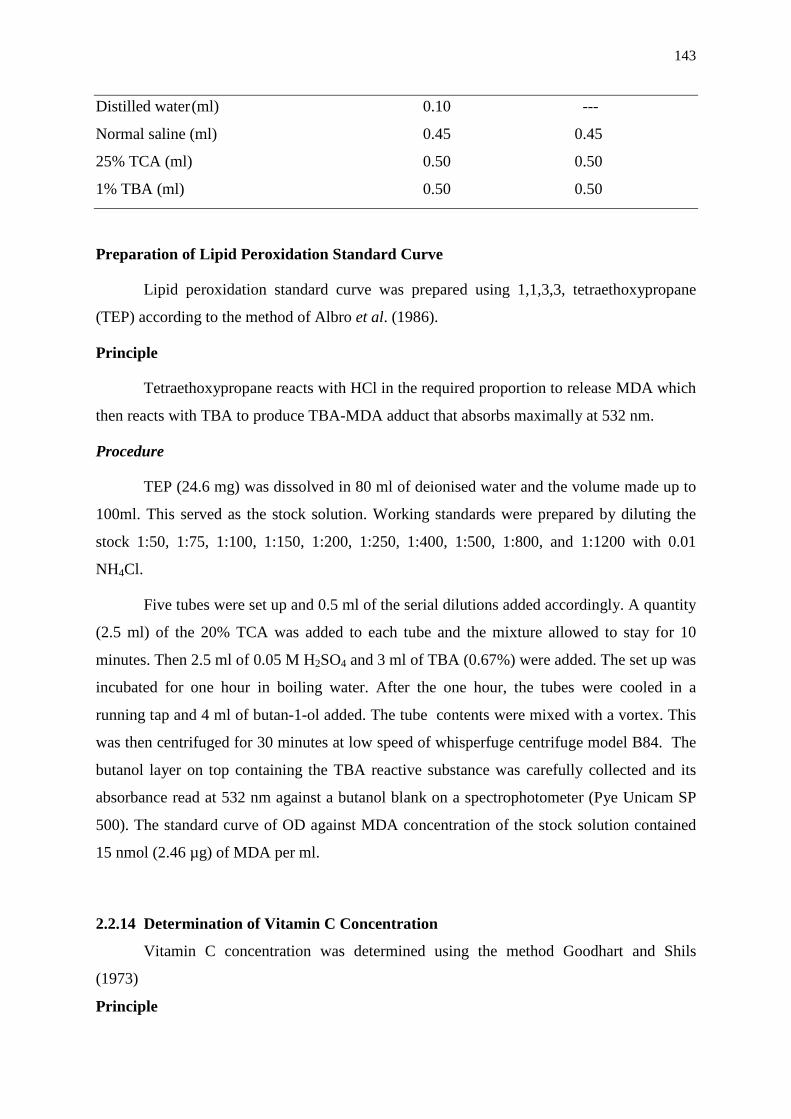
143
Distilled water (ml) 0.10 ---
Normal saline (ml) 0.45 0.45
25% TCA (ml) 0.50 0.50
1% TBA (ml) 0.50 0.50
Preparation of Lipid Peroxidation Standard Curve
Lipid peroxidation standard curve was prepared using 1,1,3,3, tetraethoxypropane
(TEP) according to the method of Albro et al. (1986).
Principle
Tetraethoxypropane reacts with HCl in the required proportion to release MDA which
then reacts with TBA to produce TBA-MDA adduct that absorbs maximally at 532 nm.
Procedure
TEP (24.6 mg) was dissolved in 80 ml of deionised water and the volume made up to
100ml. This served as the stock solution. Working standards were prepared by diluting the
stock 1:50, 1:75, 1:100, 1:150, 1:200, 1:250, 1:400, 1:500, 1:800, and 1:1200 with 0.01
NH4Cl.
Five tubes were set up and 0.5 ml of the serial dilutions added accordingly. A quantity
(2.5 ml) of the 20% TCA was added to each tube and the mixture allowed to stay for 10
minutes. Then 2.5 ml of 0.05 M H2SO4 and 3 ml of TBA (0.67%) were added. The set up was
incubated for one hour in boiling water. After the one hour, the tubes were cooled in a
running tap and 4 ml of butan-1-ol added. The tube contents were mixed with a vortex. This
was then centrifuged for 30 minutes at low speed of whisperfuge centrifuge model B84. The
butanol layer on top containing the TBA reactive substance was carefully collected and its
absorbance read at 532 nm against a butanol blank on a spectrophotometer (Pye Unicam SP
500). The standard curve of OD against MDA concentration of the stock solution contained
15 nmol (2.46 µg) of MDA per ml.
2.2.14 Determination of Vitamin C Concentration
Vitamin C concentration was determined using the method Goodhart and Shils
(1973)
Principle
144
This method involves the oxidation and conversion of ascorbic acid to diketogluconic
acid in strong acid solution. A diphenylhydrazine is formed by the reaction of sulphuric acid
with 2, 4-dinitrophenylhydrazine. Cupric ions act as the oxidizing agent, followed by
hydrazone formation. The hydrazone dissolves in strong sulphuric acid solution to produce a
light red colouration, whose intensity gives a measure of the concentration of ascorbic acid.
The addition of thiourea as a reducing agent adds specificity by avoiding interference from
non-ascorbate chromogens.
Reagents for Vitamin C
i) Trichloroacetic acid (TCA) (10% w/v): Trichloroacetic acid (10 g) was dissolved
in 20 ml distilled water and the volume made up to 100 ml.
ii) 2, 4-Dinitrophenylhydrazine Reagent: Concentrated sulphuric acid (25 ml) was
added to 75 ml of chilled water to give 9.0 N H2SO4. Crystalline 2, 4-
dinitrophenylhydrazine (2 g) was dissolved in 100 ml of 9.0 N H2SO4 and the
resultant solution was filtered and stored in a brown bottle in the refrigerator.
iii) Thiourea Solution: Thiourea (10 g) was dissolved in 100 ml of 50% ethanol and
the solution stored in the refrigerator.
iv) Cupric Sulphate (1.5% w/v): Cupric sulphate (1.5 g) was dissolved in 10 ml of
distilled water and made up to 100 ml.
v) Combined Colour Reagent: This was prepared fresh each day by mixing:
2, 4-dinitrophenylhydrazine reagent (5 ml)
Cupric sulphate solution (0.1 ml) and
Thiourea solution (0.1 ml).
vi) Sulphuric acid (85%): Concentrated H2SO4 (180 ml) was added to 20 ml of
distilled water. The solution was thoroughly mixed, cooled and stored in a glass-
stoppered bottle in the refrigerator.
vii) Ascorbic Acid Standard: Ascorbic acid (1 g) was dissolved and diluted to 100 ml.
This was further diluted with distilled water just before use to give a working
standard of 2 mg/100 ml (1:50 dilution ratio).
Procedure
To serum (0.1 ml) in a test tube was added 10% trichloroacetic acid (1 ml) and
chloroform (0.5 ml). The test tube was stoppered, shaken vigorously for 15 seconds and
centrifuged at 10,000 rpm for 5 minutes. The clear supernatant (1 ml) was pipetted into
another sample test tube. Five hundred microllitres (500 µl) of trichloroacetic (10%) was
145
added to 0.5 ml distilled water and to 0.5 ml of freshly prepared ascorbic acid standard to
give the blank and the working standard respectively.
Freshly prepared colour reagent (0.4 ml) was added to the blank, working standard
and test sample. The resulting solution was thoroughly mixed, stoppered and placed in a
waterbath for 1 hour at 56OC. The test tubes were cooled in an ice bath for 5 minutes.
Ice-cold 85% sulphuric acid (2 ml) was slowly added to each test tube with mixing
and allowed to stand at room temperature for 30 minutes. Absorbance of test sample and
standard was measured against blank at 500 nm
Ascorbic acid concentration was calculated thus:
2)(
)( ×SA
TAmg Ascorbic acid/100 ml
Where A (T) = Absorbance of test sample
A (S) = Absorbance of standard
2.2.15 Assay of Catalase Activity
Catalase was assayed by the method described by Aebi (1983)
Principle
The ultraviolet absorption of hydrogen peroxide can be easily measured at 240 nm.
On the decomposition of hydrogen peroxide with catalase, the absorption decreases with time
and from this decrease catalase activity can be measured.
Reagent
Phosphate buffer, pH 7
3.522 g KH2 PO4 and 7.268 g Na2H PO4.2H20 in 1000 ml water.
Hydrogen peroxide solution
0.085ml of 30% hydrogen per oxide in 25 ml phosphate buffer.
Procedure
Immediately following the addition of 1ml phosphate buffer and 2 ml diluted
haemolysate into the blank test tube (B) and 1 ml hydrogen peroxide and 2 ml haemolysate
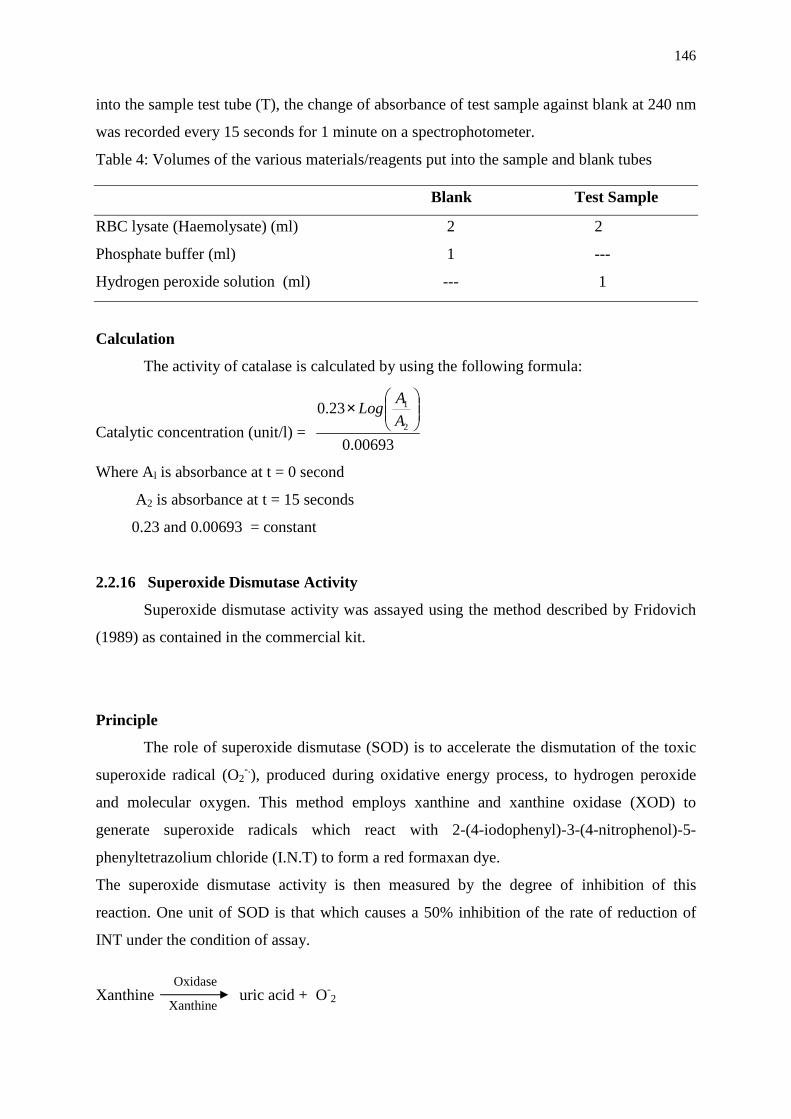
146
into the sample test tube (T), the change of absorbance of test sample against blank at 240 nm
was recorded every 15 seconds for 1 minute on a spectrophotometer.
Table 4: Volumes of the various materials/reagents put into the sample and blank tubes
Blank Test Sample
RBC lysate (Haemolysate) (ml) 2 2
Phosphate buffer (ml) 1 ---
Hydrogen peroxide solution (ml) --- 1
Calculation
The activity of catalase is calculated by using the following formula:
Catalytic concentration (unit/l) = 00693.0
23.02
1
×
A
ALog
Where Al is absorbance at t = 0 second
A2 is absorbance at t = 15 seconds
0.23 and 0.00693 = constant
2.2.16 Superoxide Dismutase Activity
Superoxide dismutase activity was assayed using the method described by Fridovich
(1989) as contained in the commercial kit.
Principle
The role of superoxide dismutase (SOD) is to accelerate the dismutation of the toxic
superoxide radical (O2-.), produced during oxidative energy process, to hydrogen peroxide
and molecular oxygen. This method employs xanthine and xanthine oxidase (XOD) to
generate superoxide radicals which react with 2-(4-iodophenyl)-3-(4-nitrophenol)-5-
phenyltetrazolium chloride (I.N.T) to form a red formaxan dye.
The superoxide dismutase activity is then measured by the degree of inhibition of this
reaction. One unit of SOD is that which causes a 50% inhibition of the rate of reduction of
INT under the condition of assay.
Xanthine uric acid + O-2 Xanthine
Oxidase
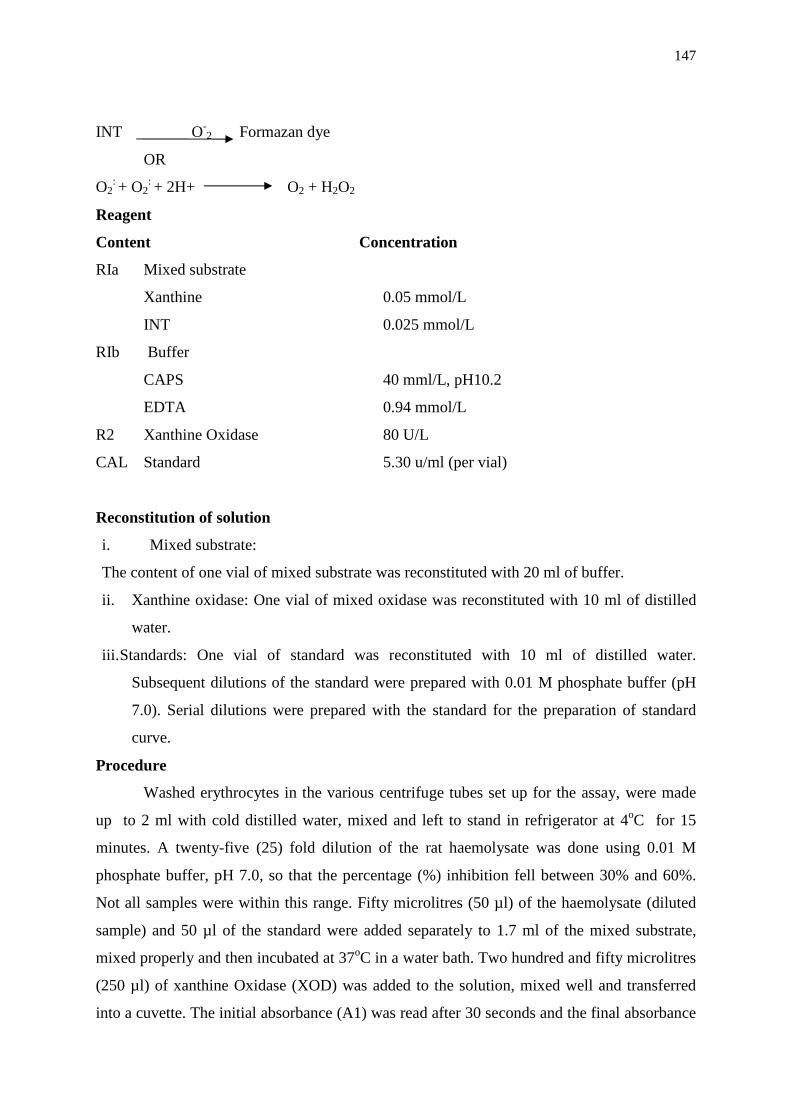
147
INT O-2 Formazan dye
OR
O2: + O2
: + 2H+ O2 + H2O2
Reagent
Content Concentration
RIa Mixed substrate
Xanthine 0.05 mmol/L
INT 0.025 mmol/L
RIb Buffer
CAPS 40 mml/L, pH10.2
EDTA 0.94 mmol/L
R2 Xanthine Oxidase 80 U/L
CAL Standard 5.30 u/ml (per vial)
Reconstitution of solution
i. Mixed substrate:
The content of one vial of mixed substrate was reconstituted with 20 ml of buffer.
ii. Xanthine oxidase: One vial of mixed oxidase was reconstituted with 10 ml of distilled
water.
iii. Standards: One vial of standard was reconstituted with 10 ml of distilled water.
Subsequent dilutions of the standard were prepared with 0.01 M phosphate buffer (pH
7.0). Serial dilutions were prepared with the standard for the preparation of standard
curve.
Procedure
Washed erythrocytes in the various centrifuge tubes set up for the assay, were made
up to 2 ml with cold distilled water, mixed and left to stand in refrigerator at 4oC for 15
minutes. A twenty-five (25) fold dilution of the rat haemolysate was done using 0.01 M
phosphate buffer, pH 7.0, so that the percentage (%) inhibition fell between 30% and 60%.
Not all samples were within this range. Fifty microlitres (50 µl) of the haemolysate (diluted
sample) and 50 µl of the standard were added separately to 1.7 ml of the mixed substrate,
mixed properly and then incubated at 37oC in a water bath. Two hundred and fifty microlitres
(250 µl) of xanthine Oxidase (XOD) was added to the solution, mixed well and transferred
into a cuvette. The initial absorbance (A1) was read after 30 seconds and the final absorbance
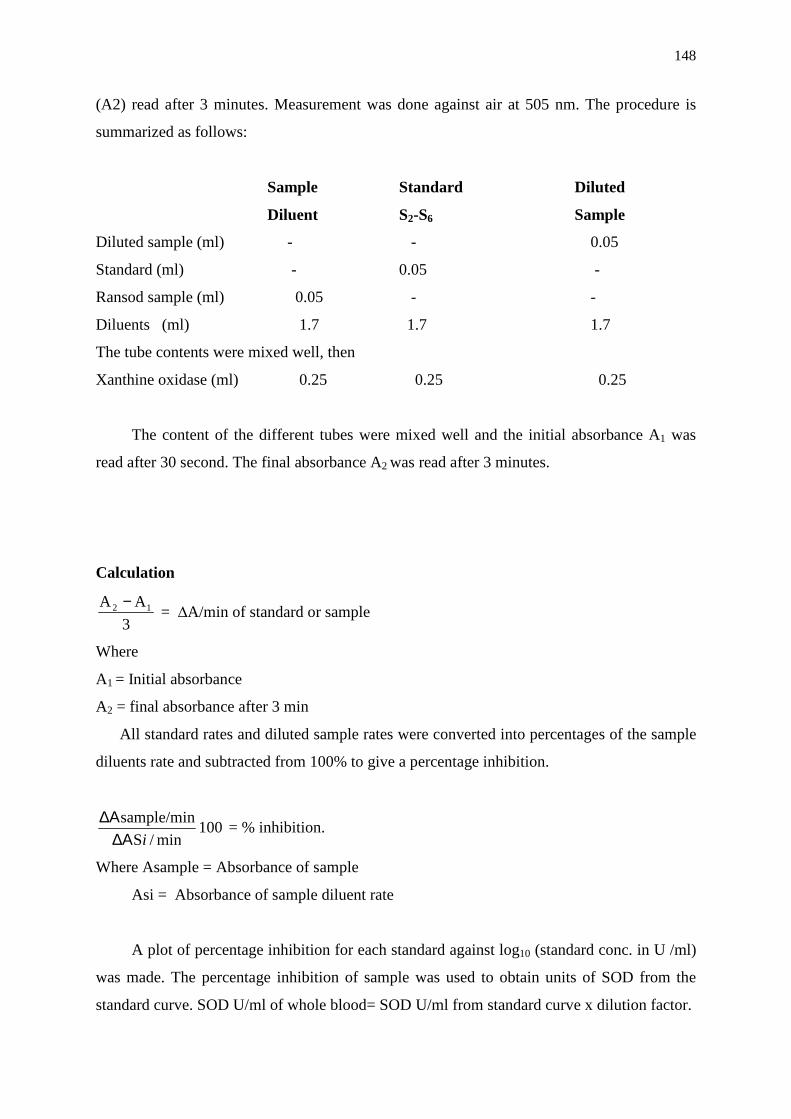
148
(A2) read after 3 minutes. Measurement was done against air at 505 nm. The procedure is
summarized as follows:
Sample Standard Diluted
Diluent S2-S6 Sample
Diluted sample (ml) - - 0.05
Standard (ml) - 0.05 -
Ransod sample (ml) 0.05 - -
Diluents (ml) 1.7 1.7 1.7
The tube contents were mixed well, then
Xanthine oxidase (ml) 0.25 0.25 0.25
The content of the different tubes were mixed well and the initial absorbance A1 was
read after 30 second. The final absorbance A2 was read after 3 minutes.
Calculation
3
AA 12 − = ∆A/min of standard or sample
Where
A1 = Initial absorbance
A2 = final absorbance after 3 min
All standard rates and diluted sample rates were converted into percentages of the sample
diluents rate and subtracted from 100% to give a percentage inhibition.
100min/S
sample/min
i∆Α∆Α
= % inhibition.
Where Asample = Absorbance of sample
Asi = Absorbance of sample diluent rate
A plot of percentage inhibition for each standard against log10 (standard conc. in U /ml)
was made. The percentage inhibition of sample was used to obtain units of SOD from the
standard curve. SOD U/ml of whole blood= SOD U/ml from standard curve x dilution factor.
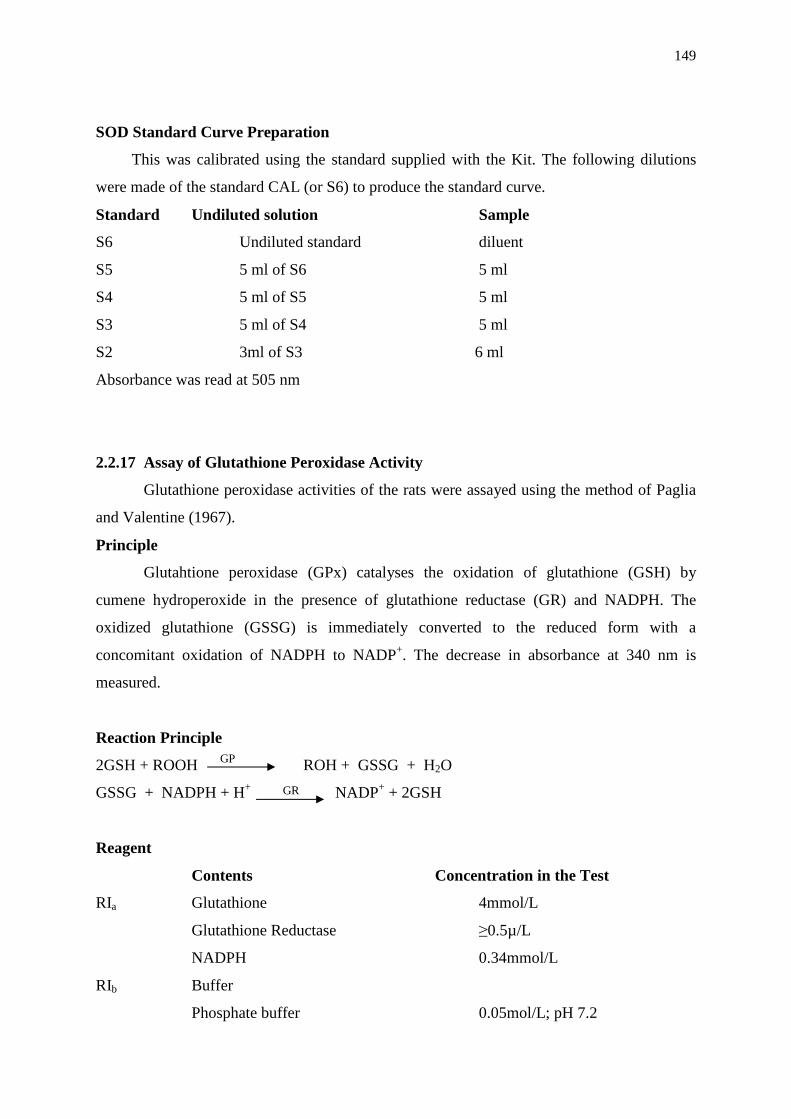
149
SOD Standard Curve Preparation
This was calibrated using the standard supplied with the Kit. The following dilutions
were made of the standard CAL (or S6) to produce the standard curve.
Standard Undiluted solution Sample
S6 Undiluted standard diluent
S5 5 ml of S6 5 ml
S4 5 ml of S5 5 ml
S3 5 ml of S4 5 ml
S2 3ml of S3 6 ml
Absorbance was read at 505 nm
2.2.17 Assay of Glutathione Peroxidase Activity
Glutathione peroxidase activities of the rats were assayed using the method of Paglia
and Valentine (1967).
Principle
Glutahtione peroxidase (GPx) catalyses the oxidation of glutathione (GSH) by
cumene hydroperoxide in the presence of glutathione reductase (GR) and NADPH. The
oxidized glutathione (GSSG) is immediately converted to the reduced form with a
concomitant oxidation of NADPH to NADP+. The decrease in absorbance at 340 nm is
measured.
Reaction Principle
2GSH + ROOH ROH + GSSG + H2O
GSSG + NADPH + H+ NADP+ + 2GSH
Reagent
Contents Concentration in the Test
RIa Glutathione 4mmol/L
Glutathione Reductase ≥0.5µ/L
NADPH 0.34mmol/L
RIb Buffer
Phosphate buffer 0.05mol/L; pH 7.2
GP
GR
150
EDTA 4.3mmol/L
R2 Cumene Hydroperoxide 0.18mmol/L
R3 Diluting Agent
Procedure
Heparinized whole blood was used. The blood sample (0.05 ml) was diluted with 2 ml
of diluting agent and mixed thoroughly. Diluted sample (0.02 ml) was pipetted into a sample
test (T) tube only. Distilled water (0.02 ml) was pipetted into the reagent blank (B) test tube
only. One milliliter (1.0 ml) of the reagent (R1) was pipetted into the sample (T) and reagent
blank (B), both were placed in water bath at 37oC. Exactly 0.04 ml of cumene hydroperoxide
was pipetted into both the sample test and reagent blank. Immediately the initial absorbance
of sample test (T) and reagent blank (B) were read after one minute and again after 1 and 2
minutes at a wavelength of 340 nm.The blank value was subtracted from the sample value.
The procedure is represented below:
Substance added Sample (T) Blank (B)
Diluted sample (ml) 0.02 -
Distilled H2O (ml) - 0.02
Reagent R1 (ml) 1.00 1.00
Cumene hydroperoxide (ml) 0.04 0.04
These reagents were mixed immediately and absorbance read at 340 nm
Manual Calculation
Glutathione Peroxidase concentration was calculated as follows:
U/L of Haemolysate = 8412 x ∆ A340 nm/minute.
The result obtained using the RANSEL kit is in unit/litre of haemolysate and must be
multiplied by the appropriate dilution factor to obtain the result in unit/litre of whole blood,
thus
R x 41 = Unit/litre (U/L) or whole blood
where R= result and 41 = dilution factor.
2.2.18 Determination of Total Cholesterol Concentration
Principle
The cholesterol is determined after enzymatic hydrolysis and oxidation. The indicator
quinoneimine is formed from hydrogen peroxide and 4-aminoantipyrine in the presence of
phenol and peroxidase.
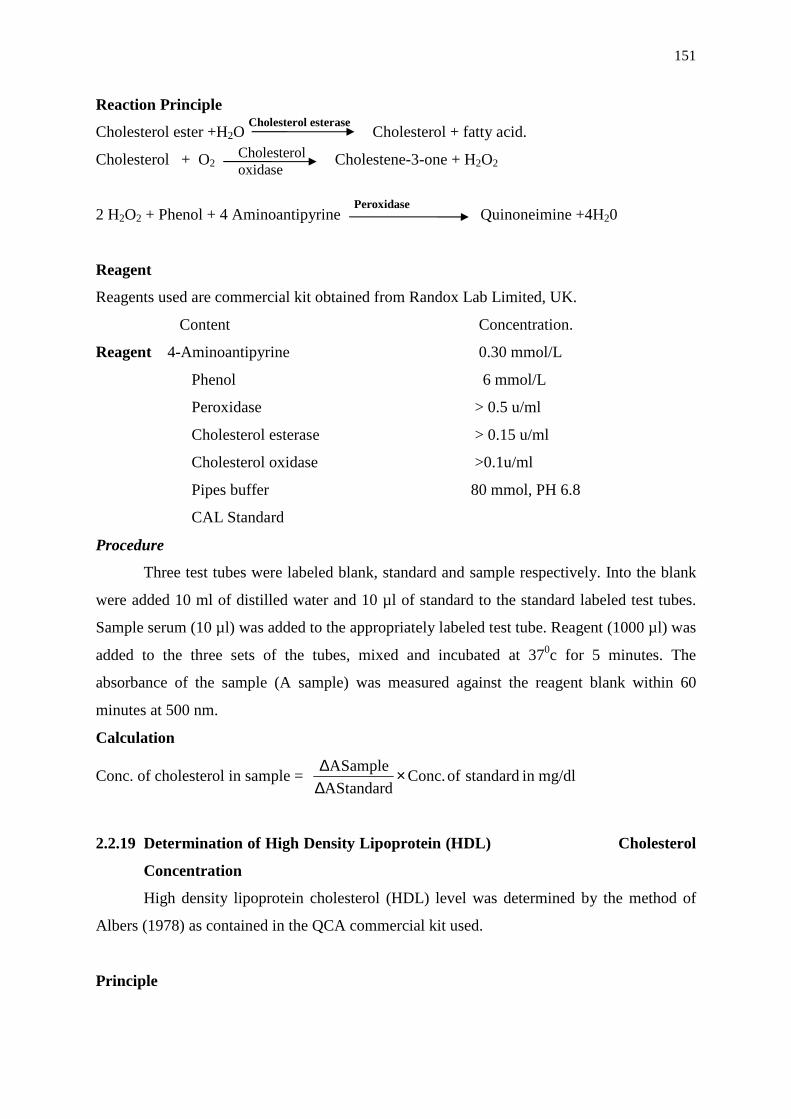
151
Reaction Principle
Cholesterol ester +H2O Cholesterol + fatty acid.
Cholesterol + O2 Cholestene-3-one + H2O2
2 H2O2 + Phenol + 4 Aminoantipyrine Quinoneimine +4H20
Reagent
Reagents used are commercial kit obtained from Randox Lab Limited, UK.
Content Concentration.
Reagent 4-Aminoantipyrine 0.30 mmol/L
Phenol 6 mmol/L
Peroxidase > 0.5 u/ml
Cholesterol esterase > 0.15 u/ml
Cholesterol oxidase >0.1u/ml
Pipes buffer 80 mmol, PH 6.8
CAL Standard
Procedure
Three test tubes were labeled blank, standard and sample respectively. Into the blank
were added 10 ml of distilled water and 10 µl of standard to the standard labeled test tubes.
Sample serum (10 µl) was added to the appropriately labeled test tube. Reagent (1000 µl) was
added to the three sets of the tubes, mixed and incubated at 370c for 5 minutes. The
absorbance of the sample (A sample) was measured against the reagent blank within 60
minutes at 500 nm.
Calculation
Conc. of cholesterol in sample = mg/dlin standard of Conc.AStandard
ASample ×∆∆
2.2.19 Determination of High Density Lipoprotein (HDL) Cholesterol
Concentration
High density lipoprotein cholesterol (HDL) level was determined by the method of
Albers (1978) as contained in the QCA commercial kit used.
Principle
Cholesterol esterase
Peroxidase
Cholesterol oxidase
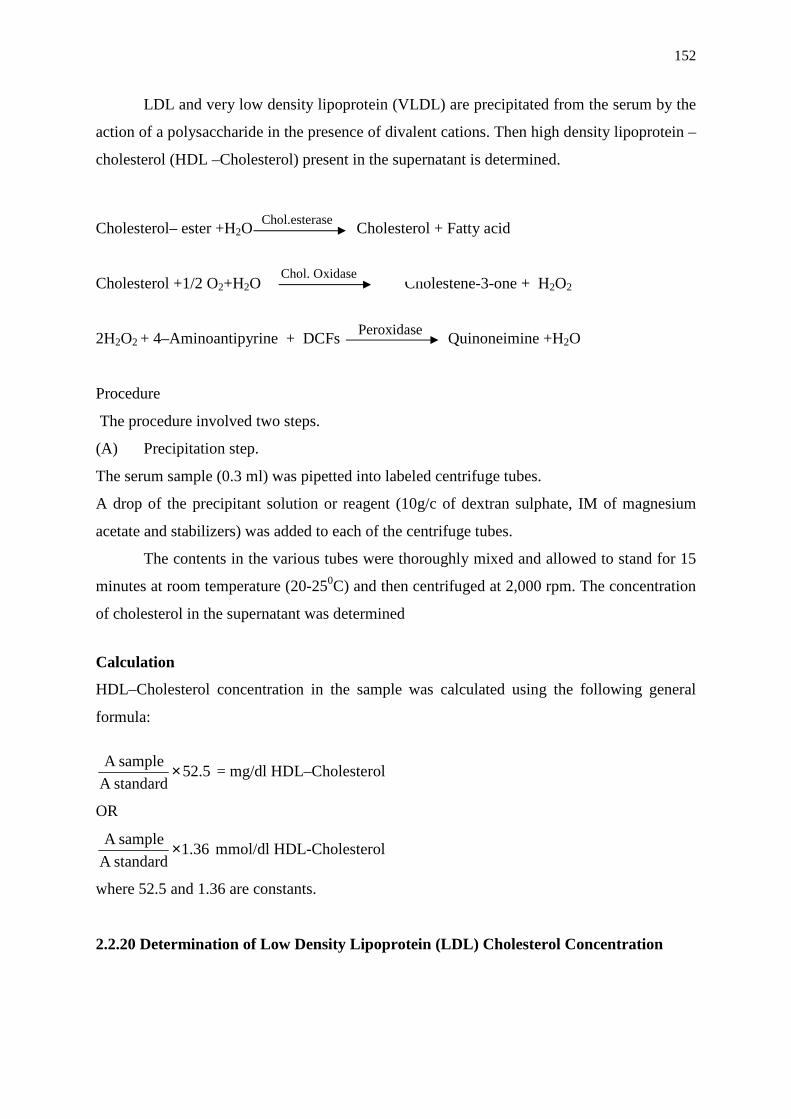
152
LDL and very low density lipoprotein (VLDL) are precipitated from the serum by the
action of a polysaccharide in the presence of divalent cations. Then high density lipoprotein –
cholesterol (HDL –Cholesterol) present in the supernatant is determined.
Cholesterol– ester +H2O Cholesterol + Fatty acid
Cholesterol +1/2 O2+H2O Cholestene-3-one + H2O2
2H2O2 + 4–Aminoantipyrine + DCFs Quinoneimine +H2O
Procedure
The procedure involved two steps.
(A) Precipitation step.
The serum sample (0.3 ml) was pipetted into labeled centrifuge tubes.
A drop of the precipitant solution or reagent (10g/c of dextran sulphate, IM of magnesium
acetate and stabilizers) was added to each of the centrifuge tubes.
The contents in the various tubes were thoroughly mixed and allowed to stand for 15
minutes at room temperature (20-250C) and then centrifuged at 2,000 rpm. The concentration
of cholesterol in the supernatant was determined
Calculation
HDL–Cholesterol concentration in the sample was calculated using the following general
formula:
5.52standardA
sampleA × = mg/dl HDL–Cholesterol
OR
36.1standardA
sampleA × mmol/dl HDL-Cholesterol
where 52.5 and 1.36 are constants.
2.2.20 Determination of Low Density Lipoprotein (LDL) Cholesterol Concentration
Chol. Oxidase
Chol.esterase
Peroxidase
153
LDL-Cholesterol can be determined as the difference between total cholesterol and
the cholesterol content of the supernatant after precipitation of the LDL fraction by polyvinyl
sulphate (PVS) in the presence of polyethylene glycol monomethyl ether.
LDL-Cholesterol = Total Cholesterol –Cholesterol in the supernatant
Reagent
Content Concentration
Precipitation Reagent
Polyvinyl Sulphate 0.7g/L
EDTA (Na2 salt) 5.0 mM
Polyethylene glycol monomethyl ether 170.g/L
Stabilizers
Procedure
1. Precipitation Reaction
The precipitation solution (3 drops or 0.1 ml) was carefully measured into test tubes
labelled accordingly. The serum (0.2 ml) was added to the labeled test tubes. The contents
were thoroughly mixed and left to stand for 15 minutes at room temperature (20-250C).Then,
the mixture was centrifuged at 2,000 rpm for 15 minutes and the cholesterol concentration in
the supernatant was determined.
2. Cholesterol Determination
The concentration of serum total cholesterol was determined according to the
QCACHOD –PAP method.
Calculations
The LDL-Cholesterol concentration in the sample was calculated using the following
general formula.
LDL-Cholesterol (mg/dl) =Total Cholesterol (mg/dl) - 1.5 × Supernatant cholesterol
(mg/dl).
2.2.21 Determination of Triacylglycerol Concentration
Triacylglycerol concentration was determined using the method of Albers et al.,
(1978).
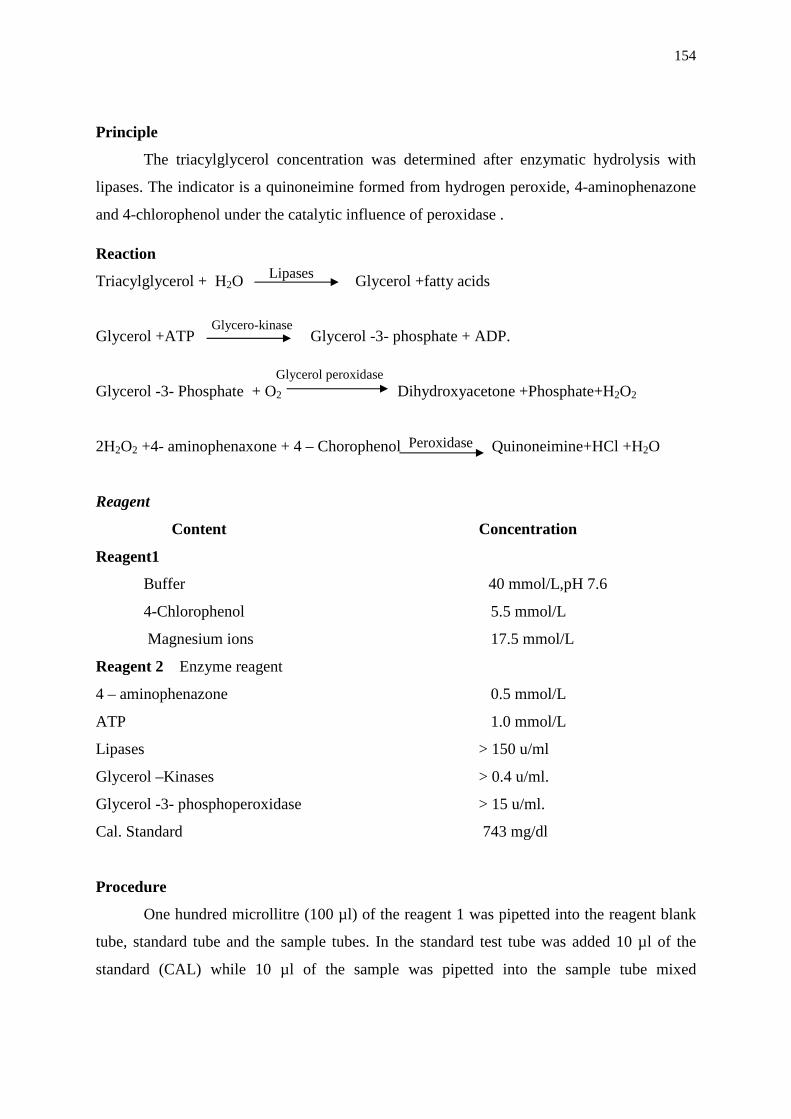
154
Principle
The triacylglycerol concentration was determined after enzymatic hydrolysis with
lipases. The indicator is a quinoneimine formed from hydrogen peroxide, 4-aminophenazone
and 4-chlorophenol under the catalytic influence of peroxidase .
Reaction
Triacylglycerol + H2O Glycerol +fatty acids
Glycerol +ATP Glycerol -3- phosphate + ADP.
Glycerol -3- Phosphate + O2 Dihydroxyacetone +Phosphate+H2O2
2H2O2 +4- aminophenaxone + 4 – Chorophenol Quinoneimine+HCl +H2O
Reagent
Content Concentration
Reagent1
Buffer 40 mmol/L,pH 7.6
4-Chlorophenol 5.5 mmol/L
Magnesium ions 17.5 mmol/L
Reagent 2 Enzyme reagent
4 – aminophenazone 0.5 mmol/L
ATP 1.0 mmol/L
Lipases > 150 u/ml
Glycerol –Kinases > 0.4 u/ml.
Glycerol -3- phosphoperoxidase > 15 u/ml.
Cal. Standard 743 mg/dl
Procedure
One hundred microllitre (100 µl) of the reagent 1 was pipetted into the reagent blank
tube, standard tube and the sample tubes. In the standard test tube was added 10 µl of the
standard (CAL) while 10 µl of the sample was pipetted into the sample tube mixed
Lipases
Glycero-kinase
Glycerol peroxidase
Peroxidase
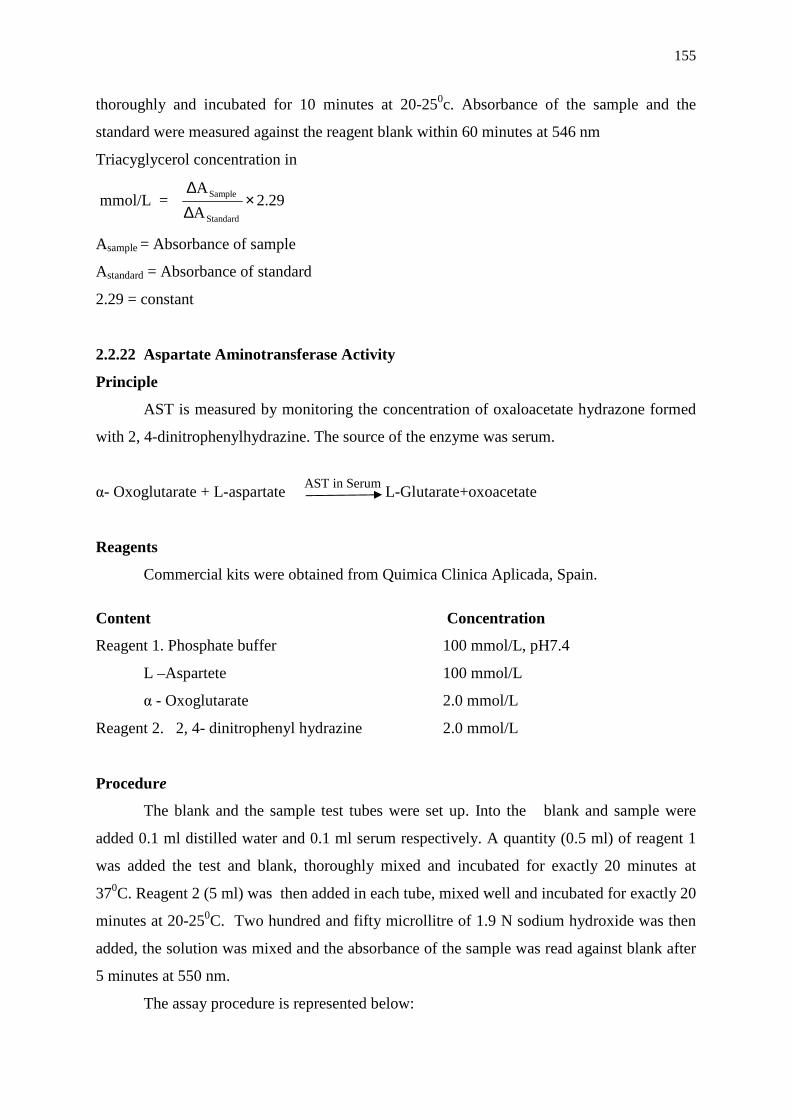
155
thoroughly and incubated for 10 minutes at 20-250c. Absorbance of the sample and the
standard were measured against the reagent blank within 60 minutes at 546 nm
Triacyglycerol concentration in
mmol/L = 29.2A
A
Standard
Sample ×∆∆
Asample = Absorbance of sample
Astandard = Absorbance of standard
2.29 = constant
2.2.22 Aspartate Aminotransferase Activity
Principle
AST is measured by monitoring the concentration of oxaloacetate hydrazone formed
with 2, 4-dinitrophenylhydrazine. The source of the enzyme was serum.
α- Oxoglutarate + L-aspartate L-Glutarate+oxoacetate
Reagents
Commercial kits were obtained from Quimica Clinica Aplicada, Spain.
Content Concentration
Reagent 1. Phosphate buffer 100 mmol/L, pH7.4
L –Aspartete 100 mmol/L
α - Oxoglutarate 2.0 mmol/L
Reagent 2. 2, 4- dinitrophenyl hydrazine 2.0 mmol/L
Procedure
The blank and the sample test tubes were set up. Into the blank and sample were
added 0.1 ml distilled water and 0.1 ml serum respectively. A quantity (0.5 ml) of reagent 1
was added the test and blank, thoroughly mixed and incubated for exactly 20 minutes at
370C. Reagent 2 (5 ml) was then added in each tube, mixed well and incubated for exactly 20
minutes at 20-250C. Two hundred and fifty microllitre of 1.9 N sodium hydroxide was then
added, the solution was mixed and the absorbance of the sample was read against blank after
5 minutes at 550 nm.
The assay procedure is represented below:
AST in Serum
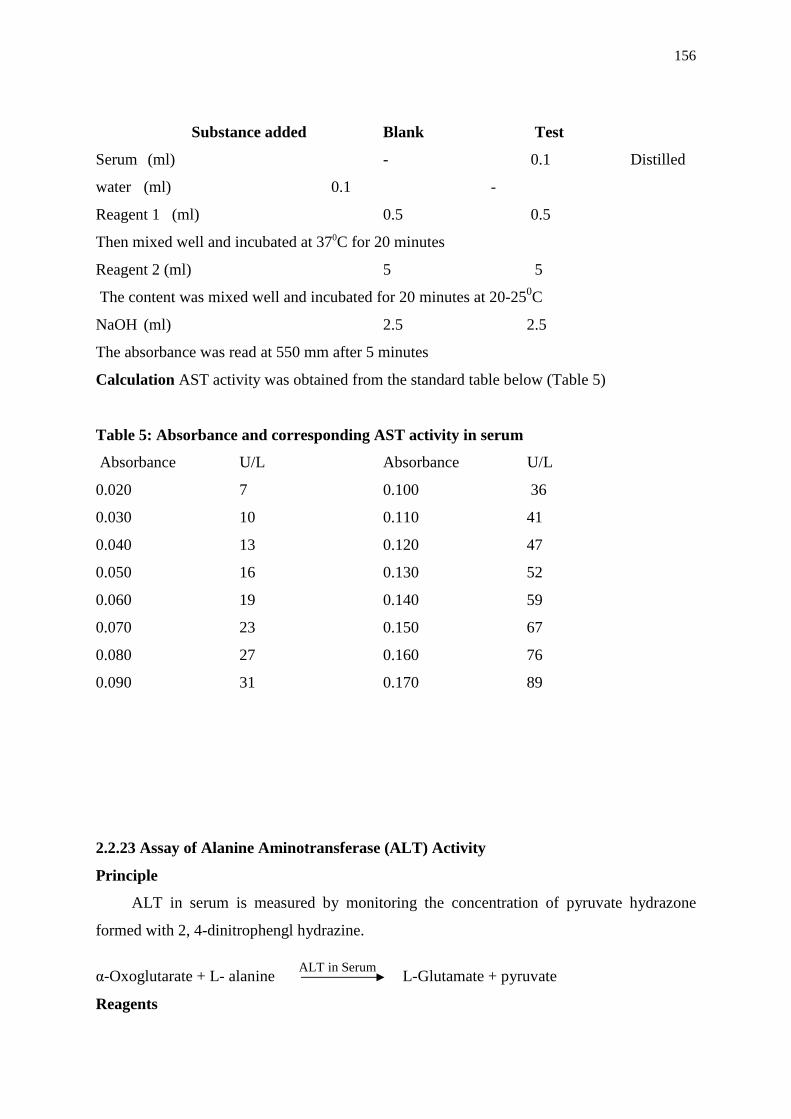
156
Substance added Blank Test
Serum (ml) - 0.1 Distilled
water (ml) 0.1 -
Reagent 1 (ml) 0.5 0.5
Then mixed well and incubated at 370C for 20 minutes
Reagent 2 (ml) 5 5
The content was mixed well and incubated for 20 minutes at 20-250C
NaOH (ml) 2.5 2.5
The absorbance was read at 550 mm after 5 minutes
Calculation AST activity was obtained from the standard table below (Table 5)
Table 5: Absorbance and corresponding AST activity in serum
Absorbance U/L Absorbance U/L
0.020 7 0.100 36
0.030 10 0.110 41
0.040 13 0.120 47
0.050 16 0.130 52
0.060 19 0.140 59
0.070 23 0.150 67
0.080 27 0.160 76
0.090 31 0.170 89
2.2.23 Assay of Alanine Aminotransferase (ALT) Activity
Principle
ALT in serum is measured by monitoring the concentration of pyruvate hydrazone
formed with 2, 4-dinitrophengl hydrazine.
α-Oxoglutarate + L- alanine L-Glutamate + pyruvate
Reagents
ALT in Serum
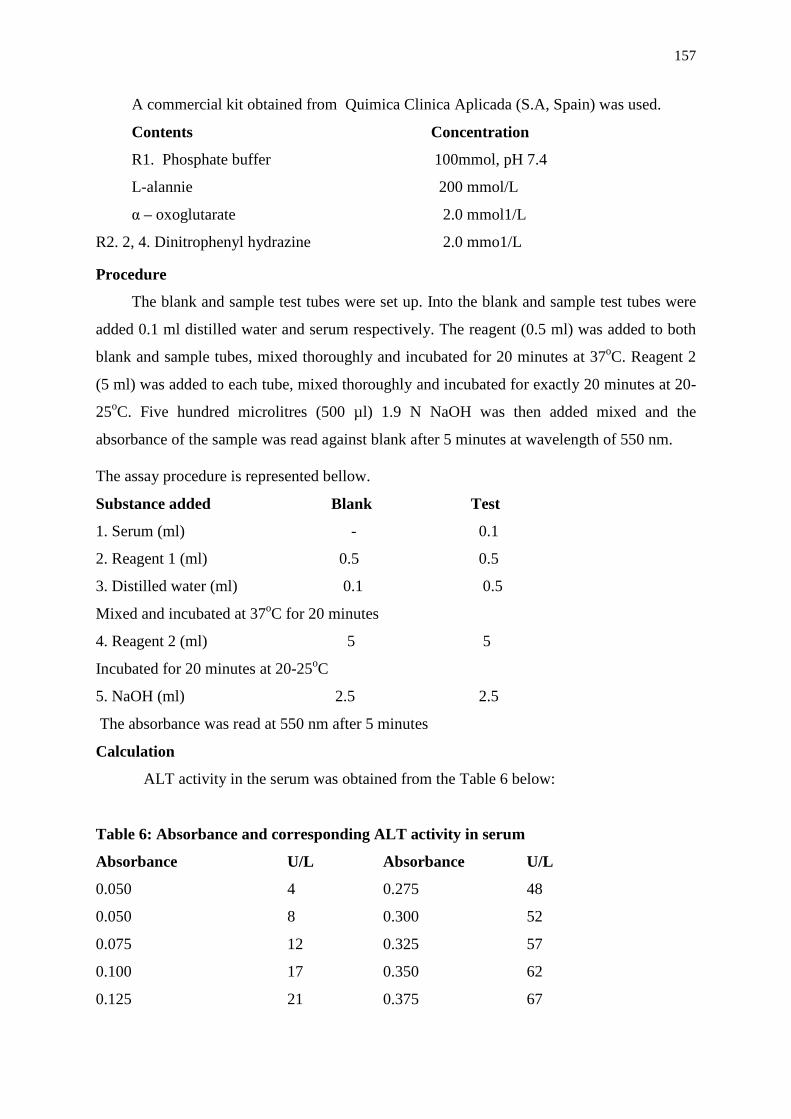
157
A commercial kit obtained from Quimica Clinica Aplicada (S.A, Spain) was used.
Contents Concentration
R1. Phosphate buffer 100mmol, pH 7.4
L-alannie 200 mmol/L
α – oxoglutarate 2.0 mmol1/L
R2. 2, 4. Dinitrophenyl hydrazine 2.0 mmo1/L
Procedure
The blank and sample test tubes were set up. Into the blank and sample test tubes were
added 0.1 ml distilled water and serum respectively. The reagent (0.5 ml) was added to both
blank and sample tubes, mixed thoroughly and incubated for 20 minutes at 37oC. Reagent 2
(5 ml) was added to each tube, mixed thoroughly and incubated for exactly 20 minutes at 20-
25oC. Five hundred microlitres (500 µl) 1.9 N NaOH was then added mixed and the
absorbance of the sample was read against blank after 5 minutes at wavelength of 550 nm.
The assay procedure is represented bellow.
Substance added Blank Test
1. Serum (ml) - 0.1
2. Reagent 1 (ml) 0.5 0.5
3. Distilled water (ml) 0.1 0.5
Mixed and incubated at 37oC for 20 minutes
4. Reagent 2 (ml) 5 5
Incubated for 20 minutes at 20-25oC
5. NaOH (ml) 2.5 2.5
The absorbance was read at 550 nm after 5 minutes
Calculation
ALT activity in the serum was obtained from the Table 6 below:
Table 6: Absorbance and corresponding ALT activity in serum
Absorbance U/L Absorbance U/L
0.050 4 0.275 48
0.050 8 0.300 52
0.075 12 0.325 57
0.100 17 0.350 62
0.125 21 0.375 67
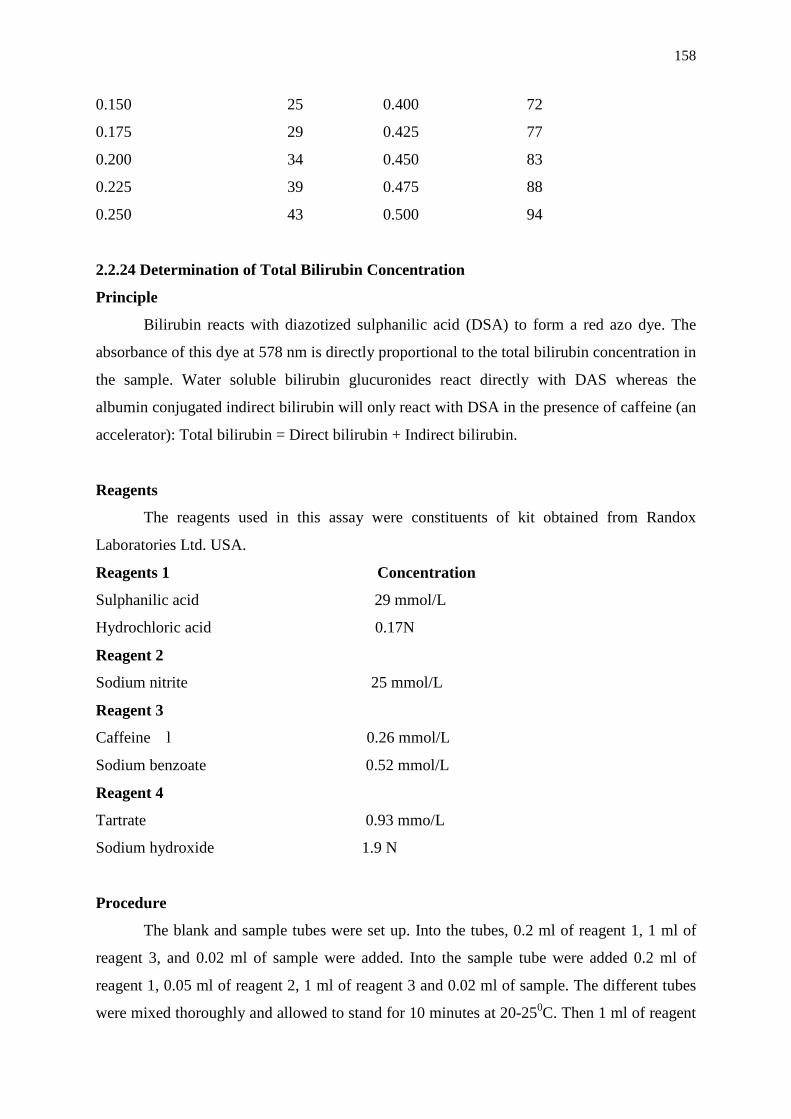
158
0.150 25 0.400 72
0.175 29 0.425 77
0.200 34 0.450 83
0.225 39 0.475 88
0.250 43 0.500 94
2.2.24 Determination of Total Bilirubin Concentration
Principle
Bilirubin reacts with diazotized sulphanilic acid (DSA) to form a red azo dye. The
absorbance of this dye at 578 nm is directly proportional to the total bilirubin concentration in
the sample. Water soluble bilirubin glucuronides react directly with DAS whereas the
albumin conjugated indirect bilirubin will only react with DSA in the presence of caffeine (an
accelerator): Total bilirubin = Direct bilirubin + Indirect bilirubin.
Reagents
The reagents used in this assay were constituents of kit obtained from Randox
Laboratories Ltd. USA.
Reagents 1 Concentration
Sulphanilic acid 29 mmol/L
Hydrochloric acid 0.17N
Reagent 2
Sodium nitrite 25 mmol/L
Reagent 3
Caffeine l 0.26 mmol/L
Sodium benzoate 0.52 mmol/L
Reagent 4
Tartrate 0.93 mmo/L
Sodium hydroxide 1.9 N
Procedure
The blank and sample tubes were set up. Into the tubes, 0.2 ml of reagent 1, 1 ml of
reagent 3, and 0.02 ml of sample were added. Into the sample tube were added 0.2 ml of
reagent 1, 0.05 ml of reagent 2, 1 ml of reagent 3 and 0.02 ml of sample. The different tubes
were mixed thoroughly and allowed to stand for 10 minutes at 20-250C. Then 1 ml of reagent
159
4 was added to each of the tubes and allowed to stand for 10 minute at 20-250C. Asorbance
(ATB) was read at 578 nm against blank.
Calculation
Total bilirubin (mg/dl) = 10.8 × ATB (578 nm)
Where 10.8 = constant.
2.3 Statistical Analysis
Data were reported as means ± SEM, where appropriate. One-way analysis of
variance (ANOVA) and One-way analysis of variance with repeated measures were used to
analyze the experimental data and Duncan multiple test range was used to compare the group
means obtained after each treatment with control measurements. Differences were considered
significant when p ≤ 0.05.
CHAPTER THREE
RESULTS
3.1 Qualitative Phytochemical Composition of Ethanol, Methanol and n-Hexane
Leaf and Fruit Extracts of Kigelia africana
Table 7 shows relative trace presence of saponins and terpeniods in all the extract
samples. In the same vein, hyhrogen cyanide and steroids were found to be present in trace
160
concentrations in extracts except methanol leaf extract which exhibited moderate presence of
these bioactive compounds. Relative moderate amount of soluble carbohydrates was found in
all the extracts except ethanol leaf, n-hexane fruit and ethanol fruit extracts which exhibited
trace amount carbohydrates. Interestingly, flavoniods was found in high concentration in the
extracts.
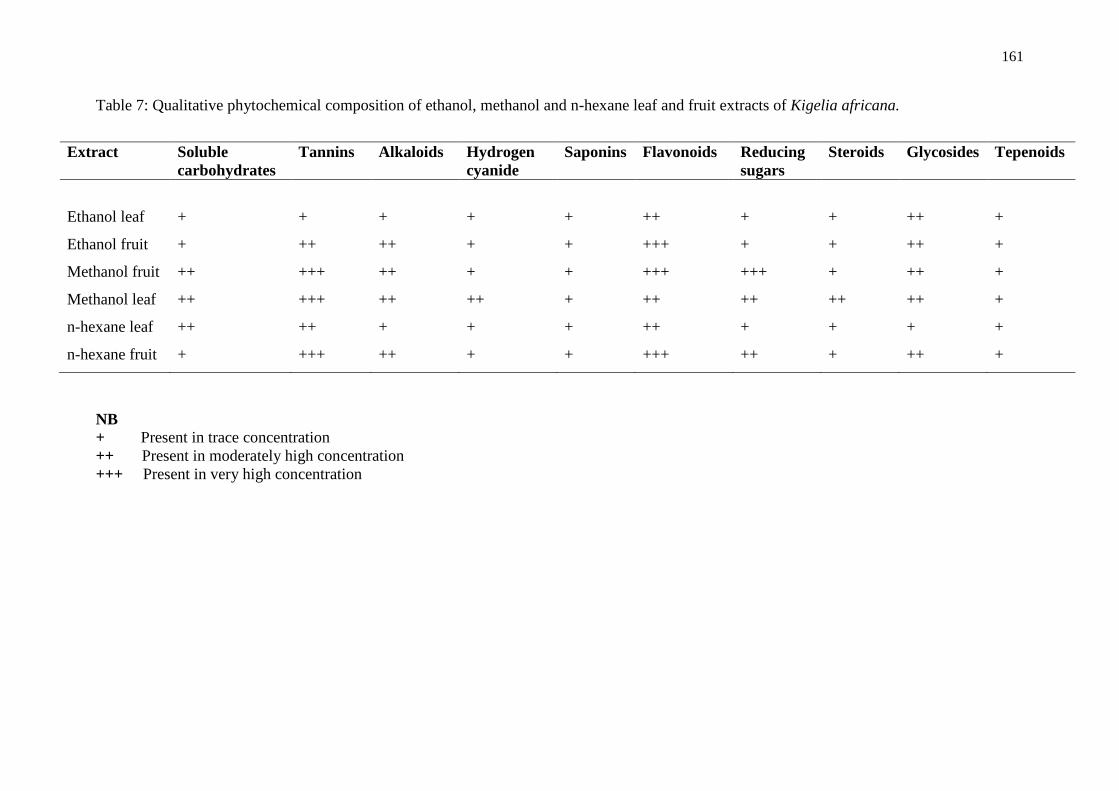
161
Table 7: Qualitative phytochemical composition of ethanol, methanol and n-hexane leaf and fruit extracts of Kigelia africana.
Extract Soluble
carbohydrates Tannins Alkaloids Hydrogen
cyanide Saponins Flavonoids Reducing
sugars Steroids Glycosides Tepenoids
Ethanol leaf + + + + + ++ + + ++ +
Ethanol fruit + ++ ++ + + +++ + + ++ +
Methanol fruit ++ +++ ++ + + +++ +++ + ++ +
Methanol leaf ++ +++ ++ ++ + ++ ++ ++ ++ +
n-hexane leaf ++ ++ + + + ++ + + + +
n-hexane fruit + +++ ++ + + +++ ++ + ++ +
NB + Present in trace concentration ++ Present in moderately high concentration +++ Present in very high concentration
162
3.2 Quantitative Phytochemical Composition of Ethanol, Methanol and n-Hexane
Leaf and Fruit Extracts of Kigelia africana
Table 8 shows the quantitative composition of bioactive compounds present at various
concentrations. Significant increased of flavoniod was recorded in ethanol fruit, methanol
fruit and n-hexane fruit extracts compared with the leaf extracts. Trace concentration of
hydrogen cyanide was found in the extracts. All the extracts contained moderate
concentration of alkaloids. Tannin level was high in all the extracts except the ethanol leaf
extract that was relatively low compared with other extracts as shown in Table 8.
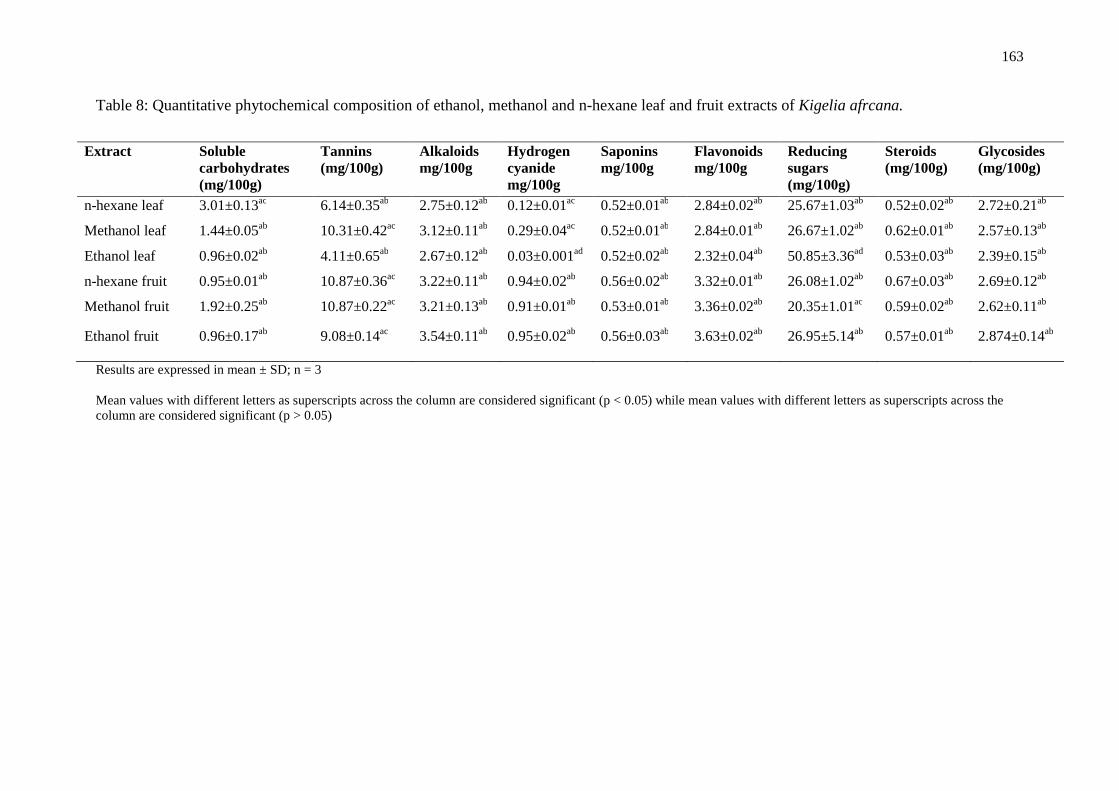
163
Table 8: Quantitative phytochemical composition of ethanol, methanol and n-hexane leaf and fruit extracts of Kigelia afrcana.
Extract Soluble
carbohydrates (mg/100g)
Tannins (mg/100g)
Alkaloids mg/100g
Hydrogen cyanide mg/100g
Saponins mg/100g
Flavonoids mg/100g
Reducing sugars (mg/100g)
Steroids (mg/100g)
Glycosides (mg/100g)
n-hexane leaf 3.01±0.13ac 6.14±0.35ab 2.75±0.12ab 0.12±0.01ac 0.52±0.01ab 2.84±0.02ab 25.67±1.03ab 0.52±0.02ab 2.72±0.21ab
Methanol leaf 1.44±0.05ab 10.31±0.42ac 3.12±0.11ab 0.29±0.04ac 0.52±0.01ab 2.84±0.01ab 26.67±1.02ab 0.62±0.01ab 2.57±0.13ab
Ethanol leaf 0.96±0.02ab 4.11±0.65ab 2.67±0.12ab 0.03±0.001ad 0.52±0.02ab 2.32±0.04ab 50.85±3.36ad 0.53±0.03ab 2.39±0.15ab
n-hexane fruit 0.95±0.01ab 10.87±0.36ac 3.22±0.11ab 0.94±0.02ab 0.56±0.02ab 3.32±0.01ab 26.08±1.02ab 0.67±0.03ab 2.69±0.12ab
Methanol fruit 1.92±0.25ab 10.87±0.22ac 3.21±0.13ab 0.91±0.01ab 0.53±0.01ab 3.36±0.02ab 20.35±1.01ac 0.59±0.02ab 2.62±0.11ab
Ethanol fruit 0.96±0.17ab 9.08±0.14ac 3.54±0.11ab 0.95±0.02ab 0.56±0.03ab 3.63±0.02ab 26.95±5.14ab 0.57±0.01ab 2.874±0.14ab
Results are expressed in mean ± SD; n = 3 Mean values with different letters as superscripts across the column are considered significant (p < 0.05) while mean values with different letters as superscripts across the column are considered significant (p > 0.05)
164
3.3 Percentage Proximate Composition of Ethanol, Methanol and n-Hexane Leaf
and Fruit Extracts of Kigelia afrcana
The percentage proximate composition of K. africana was shown on the Table 9. K. africana
leaf demonstrated high percentage protein concentration compared with the fruit. Relative
percentage of fibre content was found. Carbohydrates concentration was high in fruit as
against leaf.
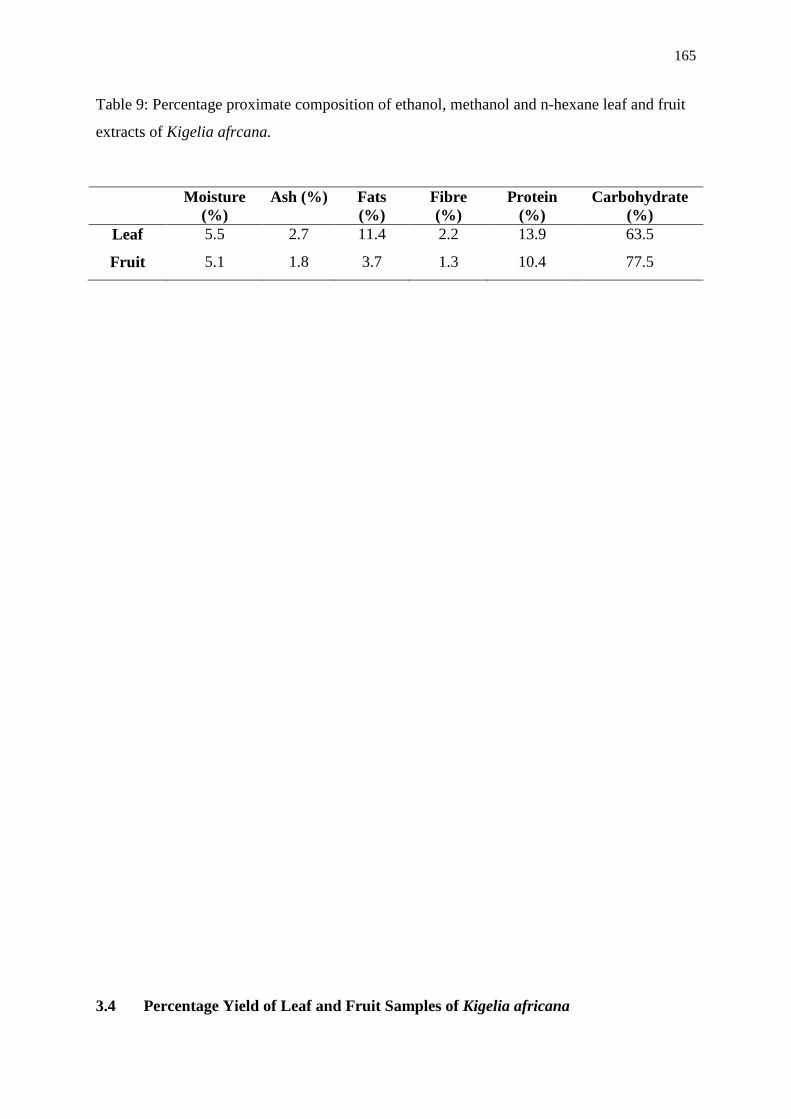
165
Table 9: Percentage proximate composition of ethanol, methanol and n-hexane leaf and fruit
extracts of Kigelia afrcana.
Moisture (%)
Ash (%) Fats (%)
Fibre (%)
Protein (%)
Carbohydrate (%)
Leaf 5.5 2.7 11.4 2.2 13.9 63.5
Fruit 5.1 1.8 3.7 1.3 10.4 77.5
3.4 Percentage Yield of Leaf and Fruit Samples of Kigelia africana
166
The percentage yield of 200 g sample of Kigelia africana leaf and fruit extracted with
ethanol, methanol and n-hexane are depicted in Table 10. Ethanol fruit extract showed
highest yield compared with other samples. In the same vein, methanol leaf gave the lowest
yield.
Table 10: Percentage yield of leaf and fruit extracts of Kigelia africana
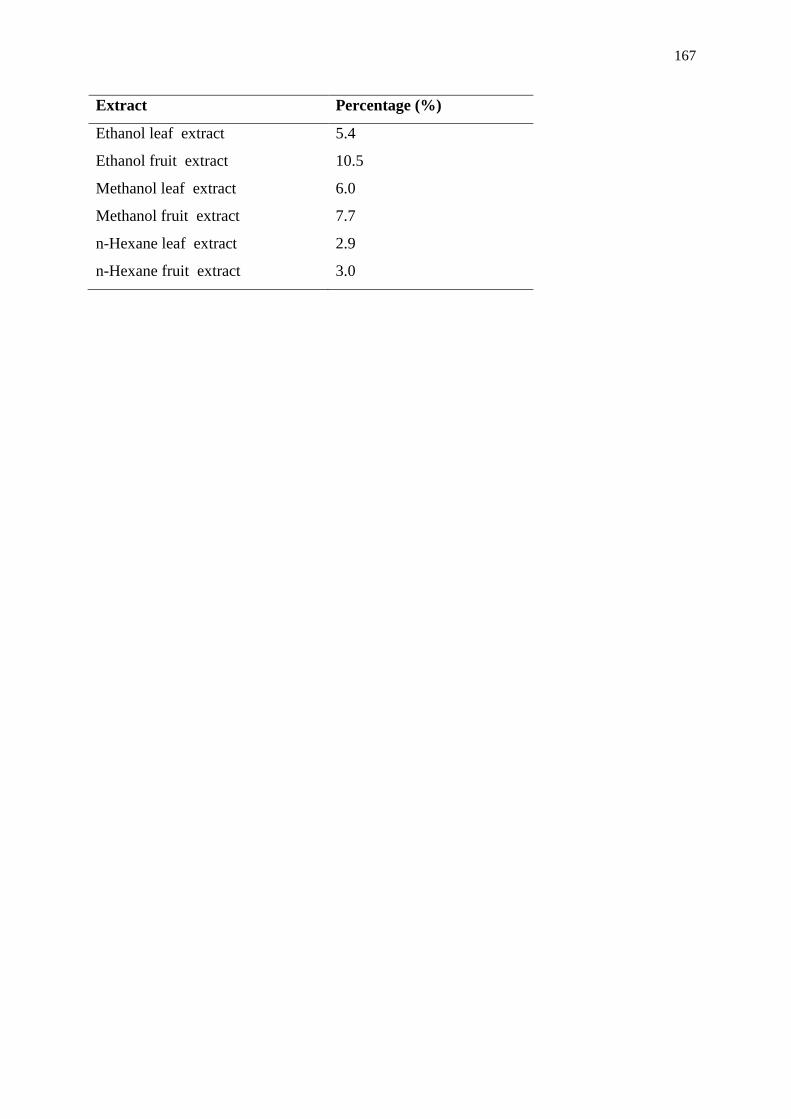
167
Extract Percentage (%)
Ethanol leaf extract 5.4
Ethanol fruit extract 10.5
Methanol leaf extract 6.0
Methanol fruit extract 7.7
n-Hexane leaf extract 2.9
n-Hexane fruit extract 3.0
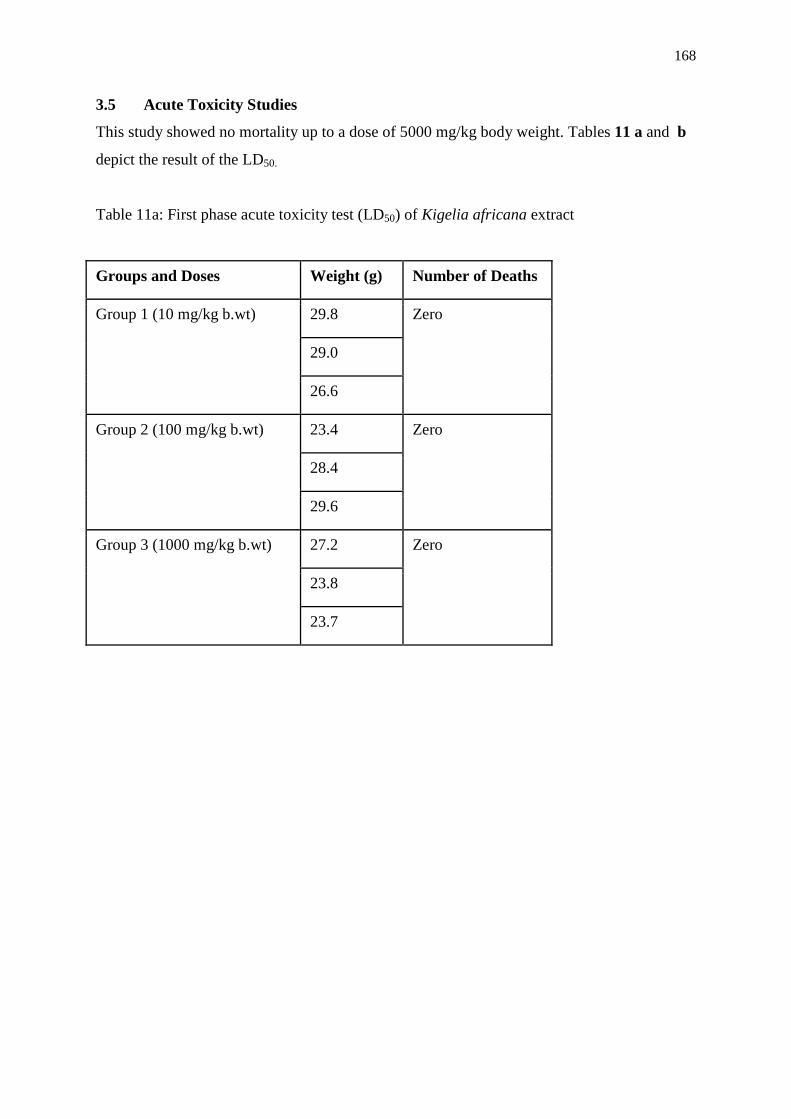
168
3.5 Acute Toxicity Studies
This study showed no mortality up to a dose of 5000 mg/kg body weight. Tables 11 a and b
depict the result of the LD50.
Table 11a: First phase acute toxicity test (LD50) of Kigelia africana extract
Groups and Doses Weight (g) Number of Deaths
Group 1 (10 mg/kg b.wt) 29.8 Zero
29.0
26.6
Group 2 (100 mg/kg b.wt) 23.4 Zero
28.4
29.6
Group 3 (1000 mg/kg b.wt) 27.2 Zero
23.8
23.7
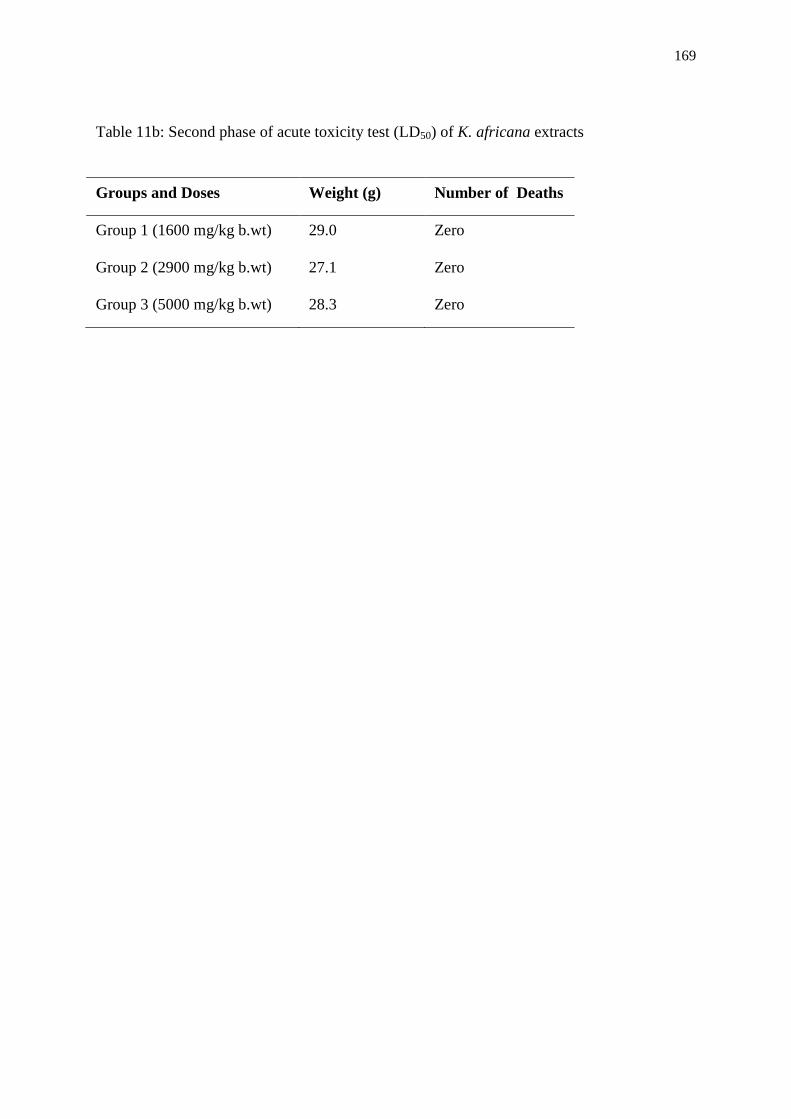
169
Table 11b: Second phase of acute toxicity test (LD50) of K. africana extracts
Groups and Doses Weight (g) Number of Deaths
Group 1 (1600 mg/kg b.wt) 29.0 Zero
Group 2 (2900 mg/kg b.wt) 27.1 Zero
Group 3 (5000 mg/kg b.wt) 28.3 Zero
170
3.6 Effects of Ethanol, n-Hexane and Methanol Extracts of Leaves and Fruits of
Kigelia africana on glucose Level of Diabetic Rats
The glucose levels of rats before the experiment in all groups were found to be non-
significant (p>0.05) compared with the glucose level of group 2 rats (diabetic untreated) as
shown in Table 12. Rats in all the groups except groups 7, 9, 10 and 11 exhibited significant
increase in glucose level (p<0.05) compared with that of group 2 rats at 72 hours after
induction. At day 21, a significant increase (p<0.05) was also observed in the glucose level of
rats in all groups compared with the glucose level of rats in group 2 (diabetic untreated).
There was no significant (p>0.05) variation in the glucose level of rats in group 1 (normal
control) at 72 hours after induction and day 21 after treatment compared with the glucose
level before the induction. The glucose level increased significantly (p<0.05) in groups 2, 3,
4, 5, 7, 9, 10, 11 and 12 rats at 72 hours after induction and day 21 after treatment compared
with the glucose level before the induction. On the other hand, the glucose level of rats in
groups 6 and 8 had a significant increase (p<0.05) at 72 hours after induction and non-
significant increase (p>0.05) at day 21 after treatment.
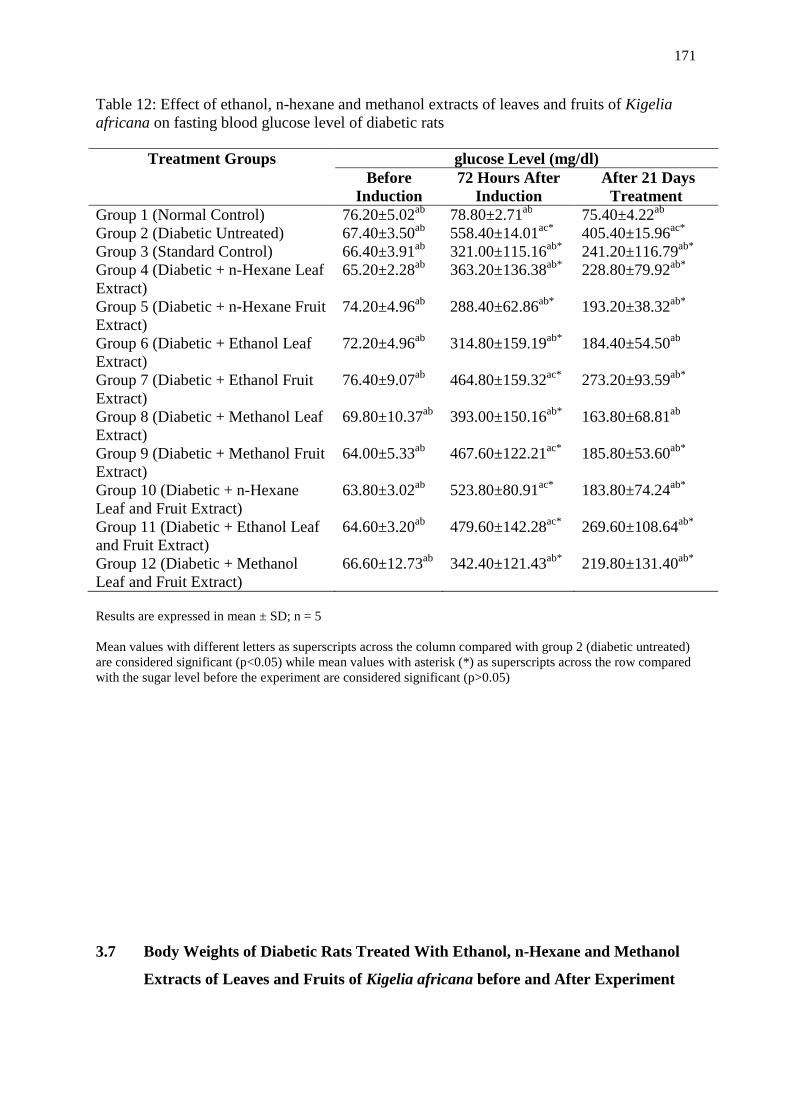
171
Table 12: Effect of ethanol, n-hexane and methanol extracts of leaves and fruits of Kigelia africana on fasting blood glucose level of diabetic rats
Treatment Groups glucose Level (mg/dl) Before
Induction 72 Hours After
Induction After 21 Days
Treatment Group 1 (Normal Control) 76.20±5.02ab 78.80±2.71ab 75.40±4.22ab Group 2 (Diabetic Untreated) 67.40±3.50ab 558.40±14.01ac* 405.40±15.96ac* Group 3 (Standard Control) 66.40±3.91ab 321.00±115.16ab* 241.20±116.79ab* Group 4 (Diabetic + n-Hexane Leaf Extract)
65.20±2.28ab 363.20±136.38ab* 228.80±79.92ab*
Group 5 (Diabetic + n-Hexane Fruit Extract)
74.20±4.96ab 288.40±62.86ab* 193.20±38.32ab*
Group 6 (Diabetic + Ethanol Leaf Extract)
72.20±4.96ab 314.80±159.19ab* 184.40±54.50ab
Group 7 (Diabetic + Ethanol Fruit Extract)
76.40±9.07ab 464.80±159.32ac* 273.20±93.59ab*
Group 8 (Diabetic + Methanol Leaf Extract)
69.80±10.37ab 393.00±150.16ab* 163.80±68.81ab
Group 9 (Diabetic + Methanol Fruit Extract)
64.00±5.33ab 467.60±122.21ac* 185.80±53.60ab*
Group 10 (Diabetic + n-Hexane Leaf and Fruit Extract)
63.80±3.02ab 523.80±80.91ac* 183.80±74.24ab*
Group 11 (Diabetic + Ethanol Leaf and Fruit Extract)
64.60±3.20ab 479.60±142.28ac* 269.60±108.64ab*
Group 12 (Diabetic + Methanol Leaf and Fruit Extract)
66.60±12.73ab 342.40±121.43ab* 219.80±131.40ab*
Results are expressed in mean ± SD; n = 5 Mean values with different letters as superscripts across the column compared with group 2 (diabetic untreated) are considered significant (p<0.05) while mean values with asterisk (*) as superscripts across the row compared with the sugar level before the experiment are considered significant (p>0.05) 3.7 Body Weights of Diabetic Rats Treated With Ethanol, n-Hexane and Methanol
Extracts of Leaves and Fruits of Kigelia africana before and After Experiment
172
Significant (p<0.05) increases in the body weights of group 1 rats (normal control) and
diabetic rat in groups 6, 8 and 9 treated with ethanol leaf, methanol leaf and methanol fruit
extracts of K. africana respectively after experiment compared with that obtained before the
experiment. Conversely, non-significant (p>0.05) decrease was observed in the body weights
of the animals in other groups after the experiment compared with the body weights of the
animals before the experiment (Table 13).
Table 13: Body weights of diabetic rats treated with ethanol, n-hexane and methanol extracts of leaves and fruits of Kigelia africana before and after experiment
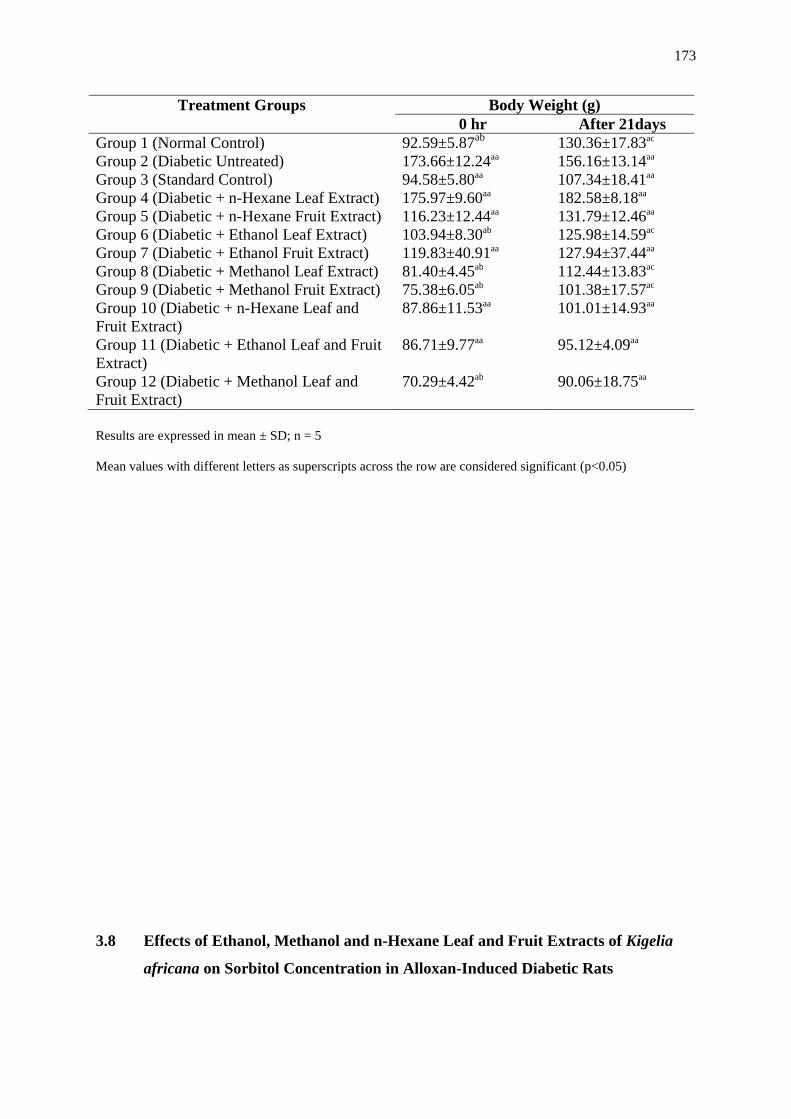
173
Treatment Groups Body Weight (g) 0 hr After 21days
Group 1 (Normal Control) 92.59±5.87ab 130.36±17.83ac Group 2 (Diabetic Untreated) 173.66±12.24aa 156.16±13.14aa Group 3 (Standard Control) 94.58±5.80aa 107.34±18.41aa Group 4 (Diabetic + n-Hexane Leaf Extract) 175.97±9.60aa 182.58±8.18aa Group 5 (Diabetic + n-Hexane Fruit Extract) 116.23±12.44aa 131.79±12.46aa Group 6 (Diabetic + Ethanol Leaf Extract) 103.94±8.30ab 125.98±14.59ac Group 7 (Diabetic + Ethanol Fruit Extract) 119.83±40.91aa 127.94±37.44aa Group 8 (Diabetic + Methanol Leaf Extract) 81.40±4.45ab 112.44±13.83ac Group 9 (Diabetic + Methanol Fruit Extract) 75.38±6.05ab 101.38±17.57ac Group 10 (Diabetic + n-Hexane Leaf and Fruit Extract)
87.86±11.53aa 101.01±14.93aa
Group 11 (Diabetic + Ethanol Leaf and Fruit Extract)
86.71±9.77aa 95.12±4.09aa
Group 12 (Diabetic + Methanol Leaf and Fruit Extract)
70.29±4.42ab 90.06±18.75aa
Results are expressed in mean ± SD; n = 5 Mean values with different letters as superscripts across the row are considered significant (p<0.05)
3.8 Effects of Ethanol, Methanol and n-Hexane Leaf and Fruit Extracts of Kigelia
africana on Sorbitol Concentration in Alloxan-Induced Diabetic Rats
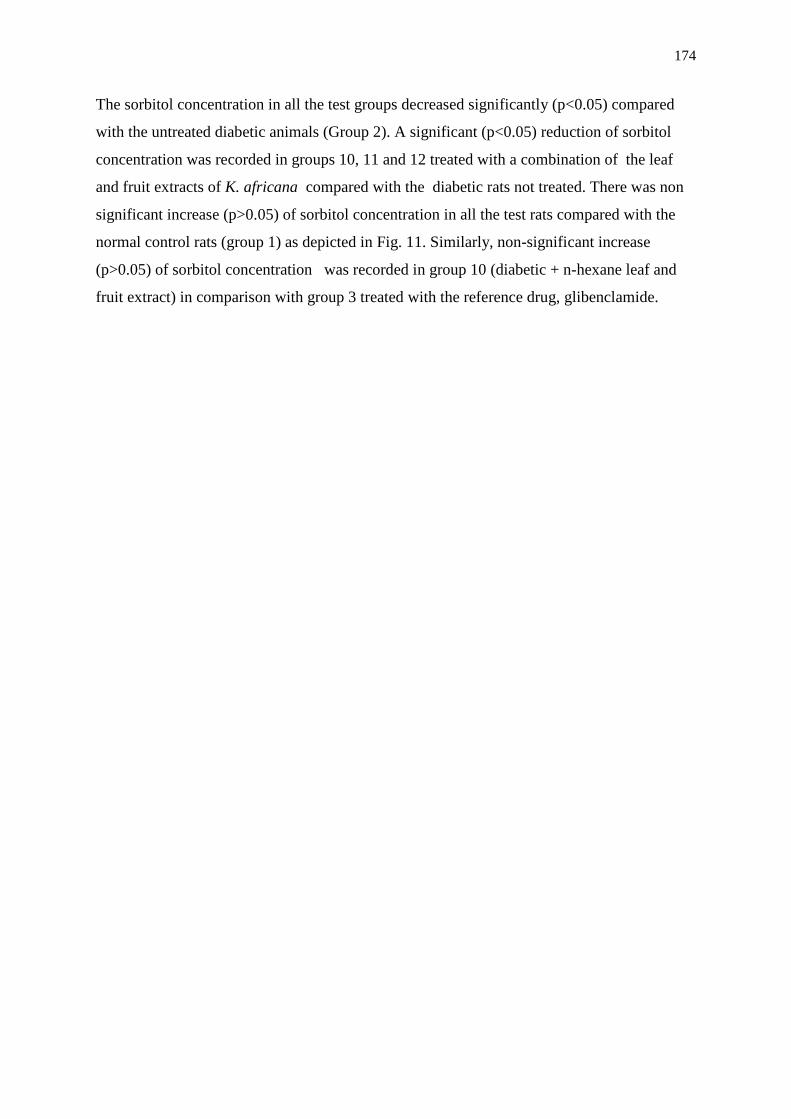
174
The sorbitol concentration in all the test groups decreased significantly (p<0.05) compared
with the untreated diabetic animals (Group 2). A significant (p<0.05) reduction of sorbitol
concentration was recorded in groups 10, 11 and 12 treated with a combination of the leaf
and fruit extracts of K. africana compared with the diabetic rats not treated. There was non
significant increase (p>0.05) of sorbitol concentration in all the test rats compared with the
normal control rats (group 1) as depicted in Fig. 11. Similarly, non-significant increase
(p>0.05) of sorbitol concentration was recorded in group 10 (diabetic + n-hexane leaf and
fruit extract) in comparison with group 3 treated with the reference drug, glibenclamide.
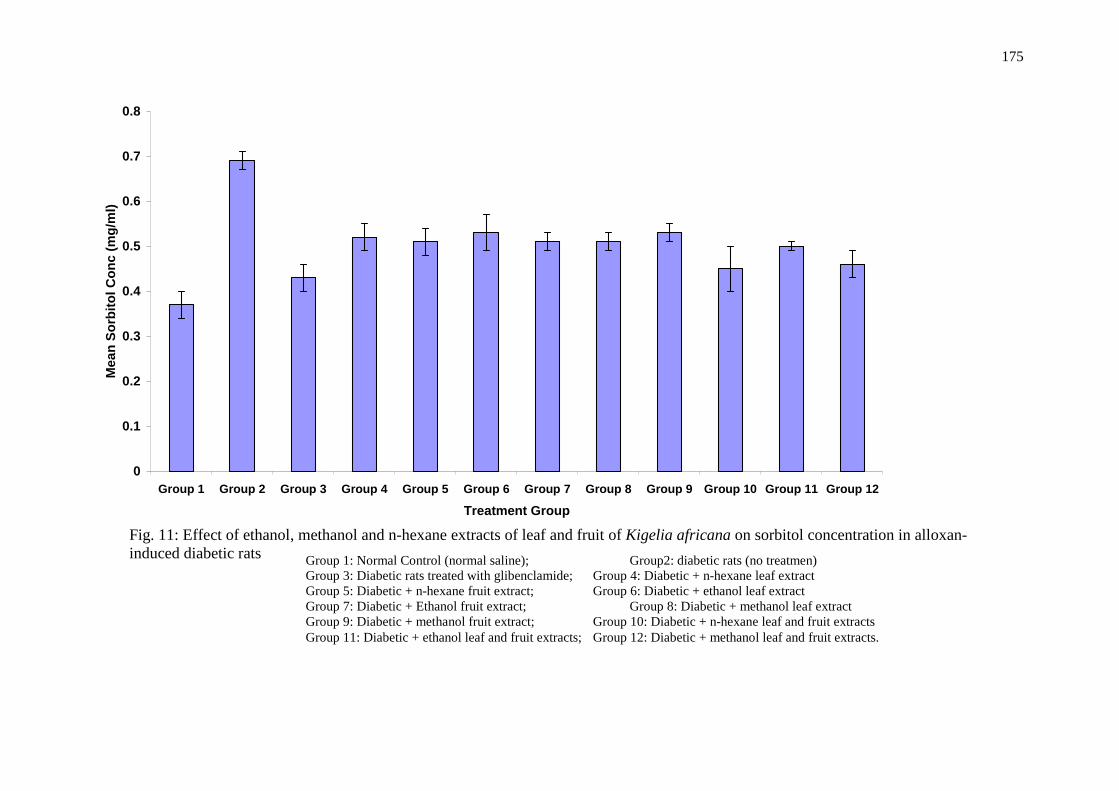
175
Fi.g. 22: Effect of ethanol, n-hexane and methanol extracts of leaf and fruit of Kigelia africana on
0
0.1
0.2
0.3
0.4
0.5
0.6
0.7
0.8
Group 1 Group 2 Group 3 Group 4 Group 5 Group 6 Group 7 Group 8 Group 9 Group 10 Group 11 Group 12
Treatment Group
Mea
n S
orb
ito
l Co
nc
(mg
/ml)
Fig. 11: Effect of ethanol, methanol and n-hexane extracts of leaf and fruit of Kigelia africana on sorbitol concentration in alloxan-induced diabetic rats
Group 1: Normal Control (normal saline); Group2: diabetic rats (no treatmen) Group 3: Diabetic rats treated with glibenclamide; Group 4: Diabetic + n-hexane leaf extract Group 5: Diabetic + n-hexane fruit extract; Group 6: Diabetic + ethanol leaf extract Group 7: Diabetic + Ethanol fruit extract; Group 8: Diabetic + methanol leaf extract Group 9: Diabetic + methanol fruit extract; Group 10: Diabetic + n-hexane leaf and fruit extracts Group 11: Diabetic + ethanol leaf and fruit extracts; Group 12: Diabetic + methanol leaf and fruit extracts.
176
3.9 Effect of Ethanol, Methanol and n-Hexane Leaf and Fruit Extract of
Kigeria africana on Total Protein Concentration in Alloxan-Induced
Diabetic Rats
Fig. 12 reveals significant increased (p>0.05) of total protein was recorded in all test
groups compared with the positive control rats (group 2). Total protein concentrations
in groups 10, 11 and 12 orally fed with a combination of the leaf and fruit extract
showed significant increase (p<0.05) compared with other test groups except group 6
administered ethanol leaf plant extract. A non-significant increase (p>0.05) of total
protein was noted across all test groups (groups 4-12) compared with the total protein
concentration of group 3 rats fed with the standard drug.
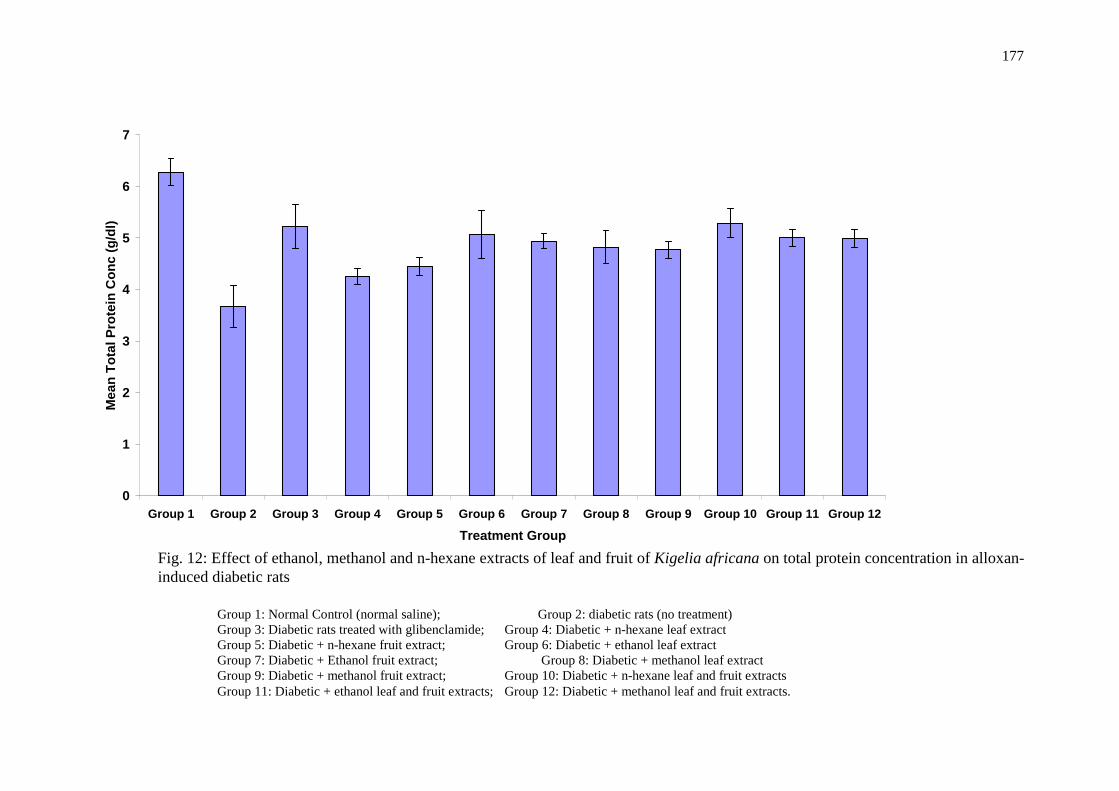
177
Fi.g. 16: Effect of ethanol, n-hexane and methanol extracts of leaf and fruit of Kigelia africana on
0
1
2
3
4
5
6
7
Group 1 Group 2 Group 3 Group 4 Group 5 Group 6 Group 7 Group 8 Group 9 Group 10 Group 11 Group 12
Treatment Group
Mea
n T
ota
l Pro
tein
Co
nc
(g/d
l)
Group 1: Normal Control (normal saline); Group 2: diabetic rats (no treatment) Group 3: Diabetic rats treated with glibenclamide; Group 4: Diabetic + n-hexane leaf extract Group 5: Diabetic + n-hexane fruit extract; Group 6: Diabetic + ethanol leaf extract Group 7: Diabetic + Ethanol fruit extract; Group 8: Diabetic + methanol leaf extract Group 9: Diabetic + methanol fruit extract; Group 10: Diabetic + n-hexane leaf and fruit extracts Group 11: Diabetic + ethanol leaf and fruit extracts; Group 12: Diabetic + methanol leaf and fruit extracts.
Fig. 12: Effect of ethanol, methanol and n-hexane extracts of leaf and fruit of Kigelia africana on total protein concentration in alloxan-induced diabetic rats
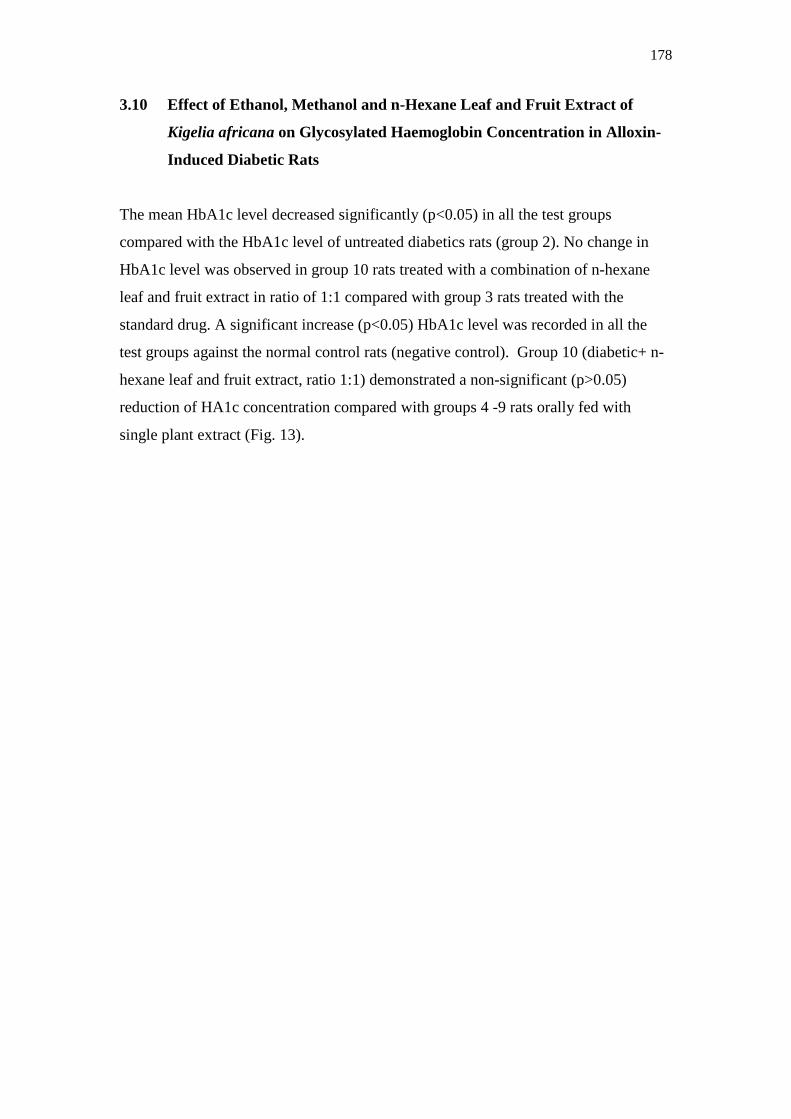
178
3.10 Effect of Ethanol, Methanol and n-Hexane Leaf and Fruit Extract of
Kigelia africana on Glycosylated Haemoglobin Concentration in Alloxin-
Induced Diabetic Rats
The mean HbA1c level decreased significantly (p<0.05) in all the test groups
compared with the HbA1c level of untreated diabetics rats (group 2). No change in
HbA1c level was observed in group 10 rats treated with a combination of n-hexane
leaf and fruit extract in ratio of 1:1 compared with group 3 rats treated with the
standard drug. A significant increase (p<0.05) HbA1c level was recorded in all the
test groups against the normal control rats (negative control). Group 10 (diabetic+ n-
hexane leaf and fruit extract, ratio 1:1) demonstrated a non-significant (p>0.05)
reduction of HA1c concentration compared with groups 4 -9 rats orally fed with
single plant extract (Fig. 13).
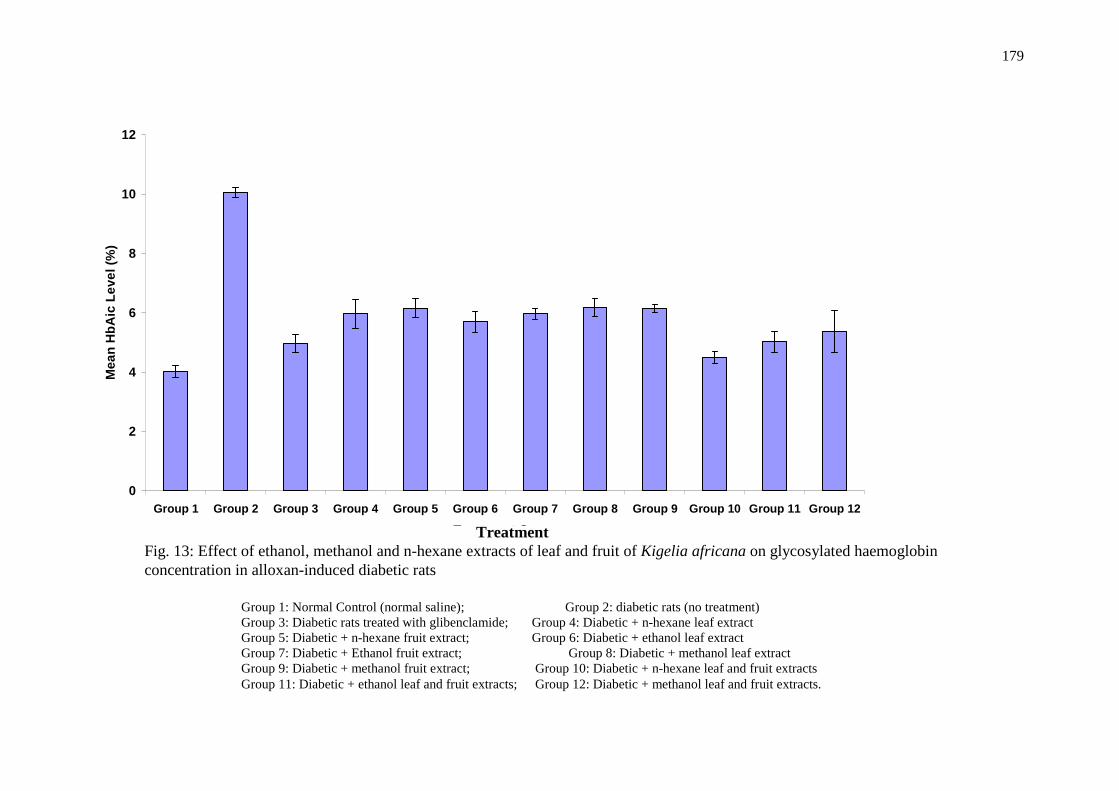
179
0
2
4
6
8
10
12
Group 1 Group 2 Group 3 Group 4 Group 5 Group 6 Group 7 Group 8 Group 9 Group 10 Group 11 Group 12
Treatment Group
Mea
n H
bA
ic L
evel
(%
)
Group 1: Normal Control (normal saline); Group 2: diabetic rats (no treatment) Group 3: Diabetic rats treated with glibenclamide; Group 4: Diabetic + n-hexane leaf extract Group 5: Diabetic + n-hexane fruit extract; Group 6: Diabetic + ethanol leaf extract Group 7: Diabetic + Ethanol fruit extract; Group 8: Diabetic + methanol leaf extract Group 9: Diabetic + methanol fruit extract; Group 10: Diabetic + n-hexane leaf and fruit extracts Group 11: Diabetic + ethanol leaf and fruit extracts; Group 12: Diabetic + methanol leaf and fruit extracts.
Fig. 13: Effect of ethanol, methanol and n-hexane extracts of leaf and fruit of Kigelia africana on glycosylated haemoglobin concentration in alloxan-induced diabetic rats
Treatment
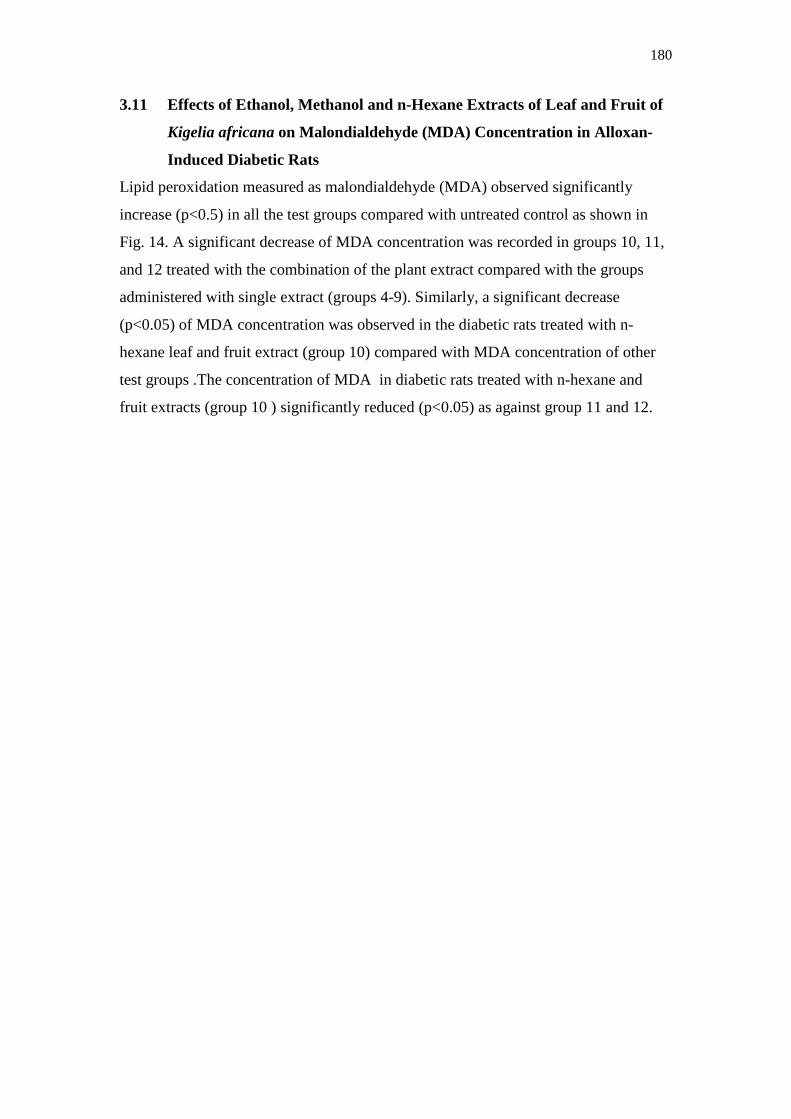
180
3.11 Effects of Ethanol, Methanol and n-Hexane Extracts of Leaf and Fruit of
Kigelia africana on Malondialdehyde (MDA) Concentration in Alloxan-
Induced Diabetic Rats
Lipid peroxidation measured as malondialdehyde (MDA) observed significantly
increase (p<0.5) in all the test groups compared with untreated control as shown in
Fig. 14. A significant decrease of MDA concentration was recorded in groups 10, 11,
and 12 treated with the combination of the plant extract compared with the groups
administered with single extract (groups 4-9). Similarly, a significant decrease
(p<0.05) of MDA concentration was observed in the diabetic rats treated with n-
hexane leaf and fruit extract (group 10) compared with MDA concentration of other
test groups .The concentration of MDA in diabetic rats treated with n-hexane and
fruit extracts (group 10 ) significantly reduced (p<0.05) as against group 11 and 12.
181
0
0.1
0.2
0.3
0.4
0.5
0.6
0.7
0.8
0.9
1
Group 1 Group 2 Group 3 Group 4 Group 5 Group 6 Group 7 Group 8 Group 9 Group 10 Group 11 Group 12
Treatment Group
Fig. 14: Effects of ethanol, methanol and n-hexane extracts of leaf and fruit of Kigelia africana on malondialdehyde concentration in alloxan-induced diabetic rats
Group 1: Normal Control (normal saline); Group 2: diabetic rats (no treatment) Group 3: Diabetic rats treated with glibenclamide; Group 4: Diabetic + n-hexane leaf extract Group 5: Diabetic + n-hexane fruit extract; Group 6: Diabetic + ethanol leaf extract Group 7: Diabetic + Ethanol fruit extract; Group 8: Diabetic + methanol leaf extract Group 9: Diabetic + methanol fruit extract; Group 10: Diabetic + n-hexane leaf and fruit extracts Group 11: Diabetic+ ethanol leaf and fruit extracts; Group 12: Diabetic + methanol leaf and fruit extracts.
Mea
n M
DA
Con
c (m
mol
/L)
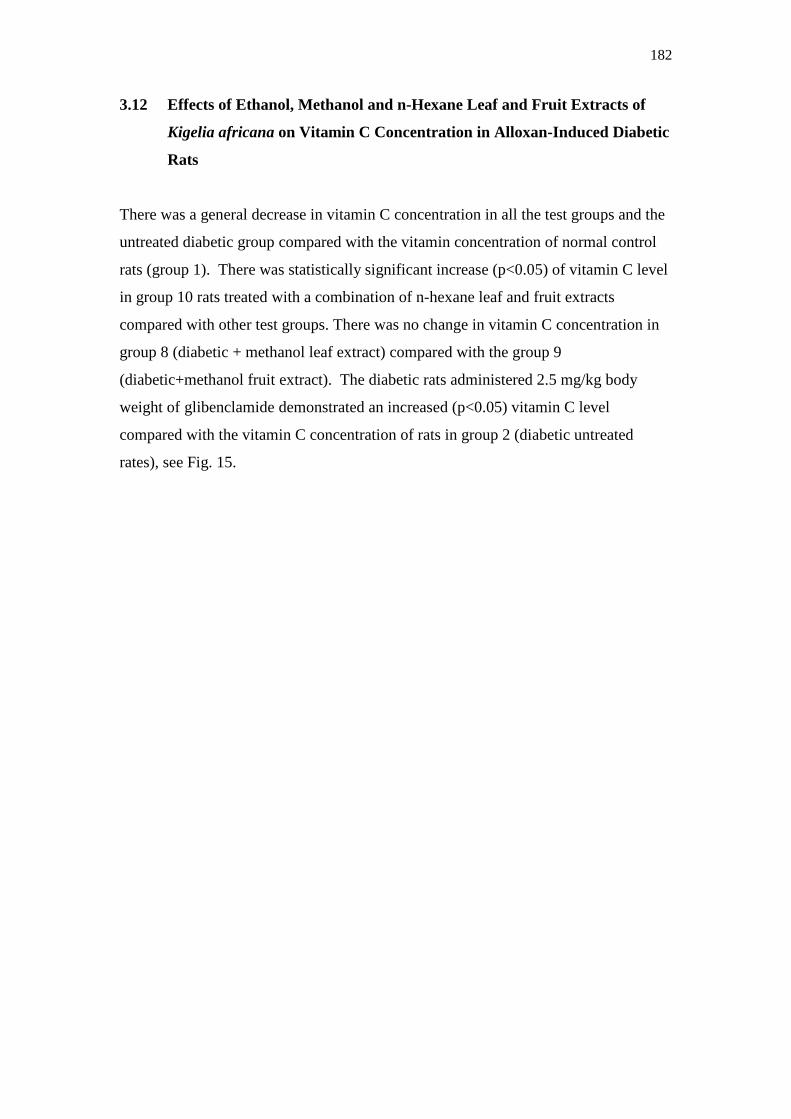
182
3.12 Effects of Ethanol, Methanol and n-Hexane Leaf and Fruit Extracts of
Kigelia africana on Vitamin C Concentration in Alloxan-Induced Diabetic
Rats
There was a general decrease in vitamin C concentration in all the test groups and the
untreated diabetic group compared with the vitamin concentration of normal control
rats (group 1). There was statistically significant increase (p<0.05) of vitamin C level
in group 10 rats treated with a combination of n-hexane leaf and fruit extracts
compared with other test groups. There was no change in vitamin C concentration in
group 8 (diabetic + methanol leaf extract) compared with the group 9
(diabetic+methanol fruit extract). The diabetic rats administered 2.5 mg/kg body
weight of glibenclamide demonstrated an increased (p<0.05) vitamin C level
compared with the vitamin C concentration of rats in group 2 (diabetic untreated
rates), see Fig. 15.
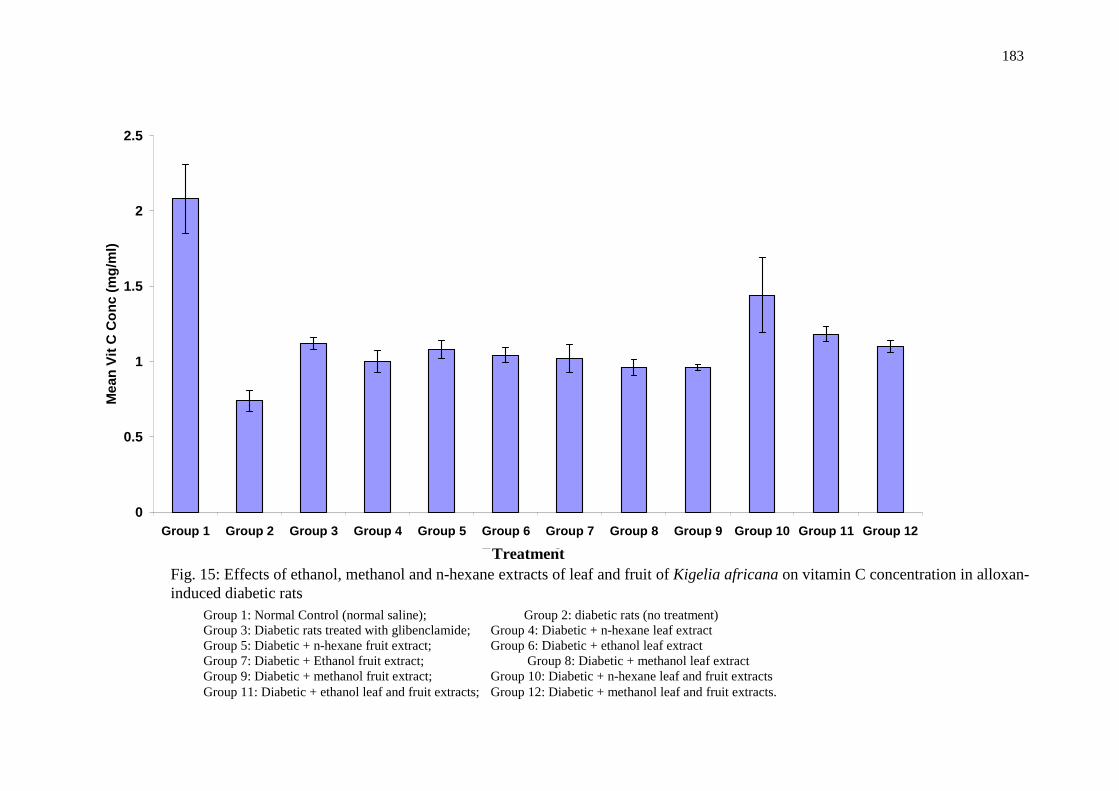
183
0
0.5
1
1.5
2
2.5
Group 1 Group 2 Group 3 Group 4 Group 5 Group 6 Group 7 Group 8 Group 9 Group 10 Group 11 Group 12
Treatment Group
Mea
n V
it C
Co
nc
(mg
/ml)
Fig. 15: Effects of ethanol, methanol and n-hexane extracts of leaf and fruit of Kigelia africana on vitamin C concentration in alloxan-induced diabetic rats
Treatment
Group 1: Normal Control (normal saline); Group 2: diabetic rats (no treatment) Group 3: Diabetic rats treated with glibenclamide; Group 4: Diabetic + n-hexane leaf extract Group 5: Diabetic + n-hexane fruit extract; Group 6: Diabetic + ethanol leaf extract Group 7: Diabetic + Ethanol fruit extract; Group 8: Diabetic + methanol leaf extract Group 9: Diabetic + methanol fruit extract; Group 10: Diabetic + n-hexane leaf and fruit extracts Group 11: Diabetic + ethanol leaf and fruit extracts; Group 12: Diabetic + methanol leaf and fruit extracts.
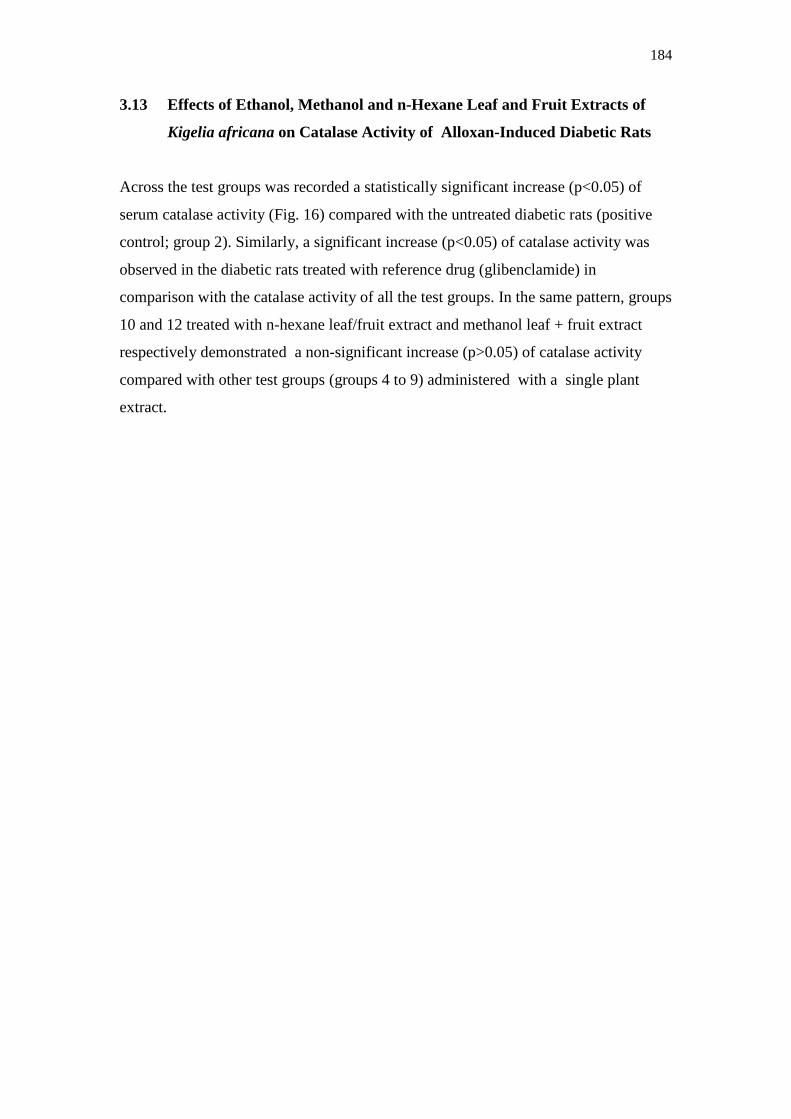
184
3.13 Effects of Ethanol, Methanol and n-Hexane Leaf and Fruit Extracts of
Kigelia africana on Catalase Activity of Alloxan-Induced Diabetic Rats
Across the test groups was recorded a statistically significant increase (p<0.05) of
serum catalase activity (Fig. 16) compared with the untreated diabetic rats (positive
control; group 2). Similarly, a significant increase (p<0.05) of catalase activity was
observed in the diabetic rats treated with reference drug (glibenclamide) in
comparison with the catalase activity of all the test groups. In the same pattern, groups
10 and 12 treated with n-hexane leaf/fruit extract and methanol leaf + fruit extract
respectively demonstrated a non-significant increase (p>0.05) of catalase activity
compared with other test groups (groups 4 to 9) administered with a single plant
extract.
185
0
1
2
3
4
5
6
7
Group 1 Group 2 Group 3 Group 4 Group 5 Group 6 Group 7 Group 8 Group 9 Group 10 Group 11 Group 12
Treatment Group
Mea
n C
atal
ase
Act
ivit
y (I
U/L
)
Fig. 16: Effects of ethanol, methanol and n-hexane extracts of leaf and fruit of Kigelia africana on catalase activity in alloxan-induced diabetic rats
Treatment
Group 1: Normal Control (normal saline); Group 2: diabetic rats (no treatment) Group 3: Diabetic rats treated with glibenclamide; Group 4: Diabetic + n-hexane leaf extract Group 5: Diabetic + n-hexane fruit extract; Group 6: Diabetic + ethanol leaf extract Group 7: Diabetic + Ethanol fruit extract; Group 8: Diabetic + methanol leaf extract Group 9: Diabetic + methanol fruit extract; Group 10: Diabetic + n-hexane leaf and fruit extracts Group 11: Diabetic + ethanol leaf and fruit extracts; Group 12: Diabetic + methanol leaf and fruit extracts.
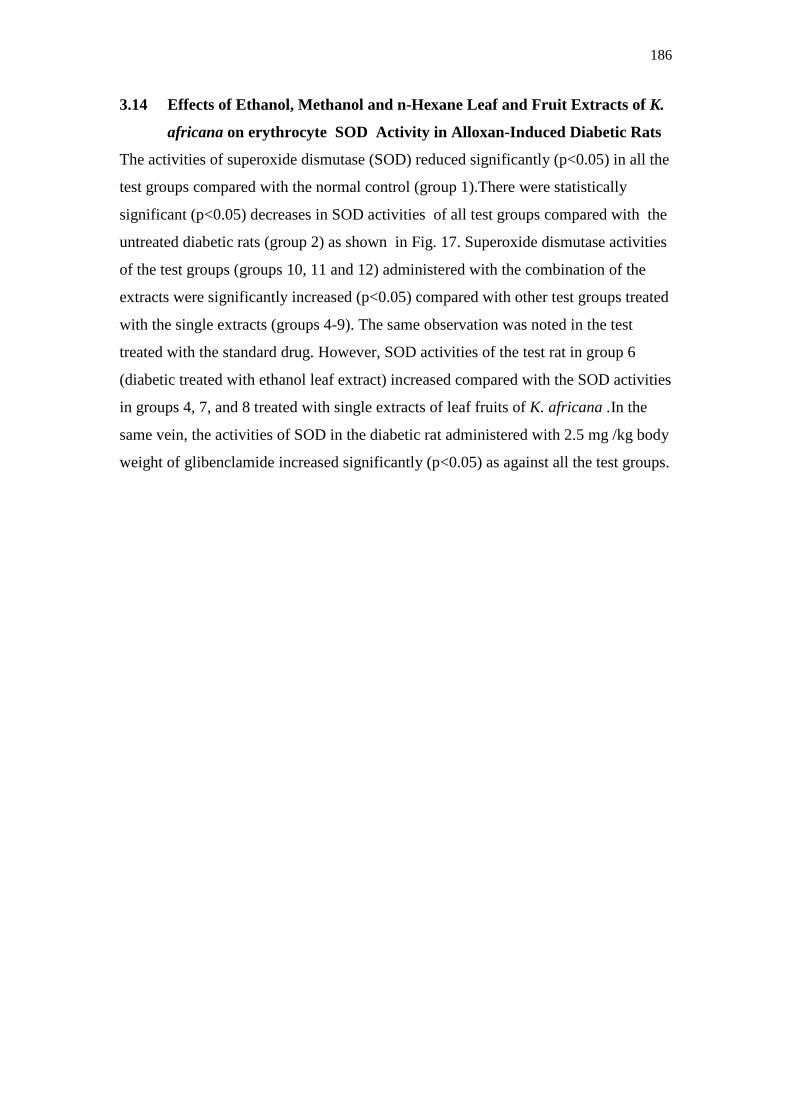
186
3.14 Effects of Ethanol, Methanol and n-Hexane Leaf and Fruit Extracts of K.
africana on erythrocyte SOD Activity in Alloxan-Induced Diabetic Rats
The activities of superoxide dismutase (SOD) reduced significantly (p<0.05) in all the
test groups compared with the normal control (group 1).There were statistically
significant (p<0.05) decreases in SOD activities of all test groups compared with the
untreated diabetic rats (group 2) as shown in Fig. 17. Superoxide dismutase activities
of the test groups (groups 10, 11 and 12) administered with the combination of the
extracts were significantly increased (p<0.05) compared with other test groups treated
with the single extracts (groups 4-9). The same observation was noted in the test
treated with the standard drug. However, SOD activities of the test rat in group 6
(diabetic treated with ethanol leaf extract) increased compared with the SOD activities
in groups 4, 7, and 8 treated with single extracts of leaf fruits of K. africana .In the
same vein, the activities of SOD in the diabetic rat administered with 2.5 mg /kg body
weight of glibenclamide increased significantly (p<0.05) as against all the test groups.
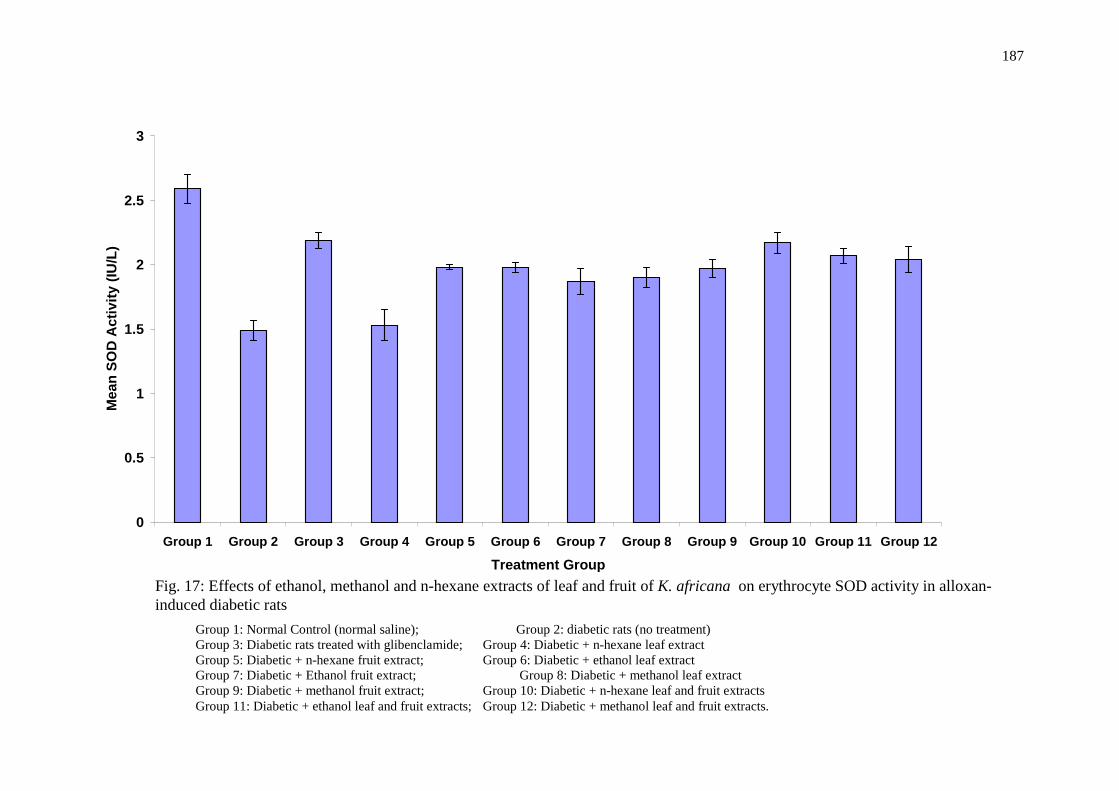
187
0
0.5
1
1.5
2
2.5
3
Group 1 Group 2 Group 3 Group 4 Group 5 Group 6 Group 7 Group 8 Group 9 Group 10 Group 11 Group 12
Treatment Group
Mea
n S
OD
Act
ivit
y (I
U/L
)
Fig. 17: Effects of ethanol, methanol and n-hexane extracts of leaf and fruit of K. africana on erythrocyte SOD activity in alloxan-induced diabetic rats
Group 1: Normal Control (normal saline); Group 2: diabetic rats (no treatment) Group 3: Diabetic rats treated with glibenclamide; Group 4: Diabetic + n-hexane leaf extract Group 5: Diabetic + n-hexane fruit extract; Group 6: Diabetic + ethanol leaf extract Group 7: Diabetic + Ethanol fruit extract; Group 8: Diabetic + methanol leaf extract Group 9: Diabetic + methanol fruit extract; Group 10: Diabetic + n-hexane leaf and fruit extracts Group 11: Diabetic + ethanol leaf and fruit extracts; Group 12: Diabetic + methanol leaf and fruit extracts.
188
3.15 Effects of Ethanol Methanol and n-Hexane Leaf and Fruit Extracts of
Kigelia africana on Percentage Inhibition of erythrocyte SOD Activity in
Alloxan-Induced Diabetic Rats
Fig. 18 demonstrates statistically significant decrease (p<0.05) of percentage
inhibition of SOD activity in the test groups compared with the normal control group.
A significant reduction (p<0.05) of percentage inhibition of SOD activity occurred in
the diabetic untreated rats (group 2) compared with the percentage inhibition of SOD
activity in normal control. Diabetic rats in groups 10, 11 and 12 treated with a
combination of leaf and fruit extracts recorded a non significantly (p>0.05) increase
of percentage inhibition of SOD activity compared with groups 4, 5, 6, 7, 8 and 9
administered monotherapically with leaf and fruit extracts of K. africana.
Conversely, group 6 treated with ethanol leaf extracts showed significant increase
(p<0.05) of percentage inhibition of SOD activity as against groups 4, 7 and 8 of the
same treatment pattern. Furthermore, non-significant reduction (p>0.05) of percentage
inhibition was observed in diabetic administered the n-hexane leaf and fruit extracts
compared with the diabetic rats treated with 2.5 mg/kg body weight of glibenclamide
(group 3).
189
0
10
20
30
40
50
60
70
80
Group 1 Group 2 Group 3 Group 4 Group 5 Group 6 Group 7 Group 8 Group 9 Group 10 Group 11 Group 12
Treatment Group
Mea
n S
OD
Inh
ibit
ion
(%
)
Fig. 18: Effects of ethanol, methanol and n-hexane extracts of leaf and fruit of Kigelia africana on % inhibition of SOD in alloxan-induced diabetic rats
Group 1: Normal Control (normal saline); Group 2: diabetic rats (no treatment) Group 3: Diabetic rats treated with glibenclamide; Group 4: Diabetic + n-hexane leaf extract Group 5: Diabetic + n-hexane fruit extract; Group 6: Diabetic + ethanol leaf extract Group 7: Diabetic + Ethanol fruit extract; Group 8: Diabetic + methanol leaf extract Group 9: Diabetic + methanol fruit extract; Group 10: Diabetic + n-hexane leaf and fruit extracts Group 11: Diabetic + ethanol leaf and fruit extracts; Group 12: Diabetic + methanol leaf and fruit extracts.
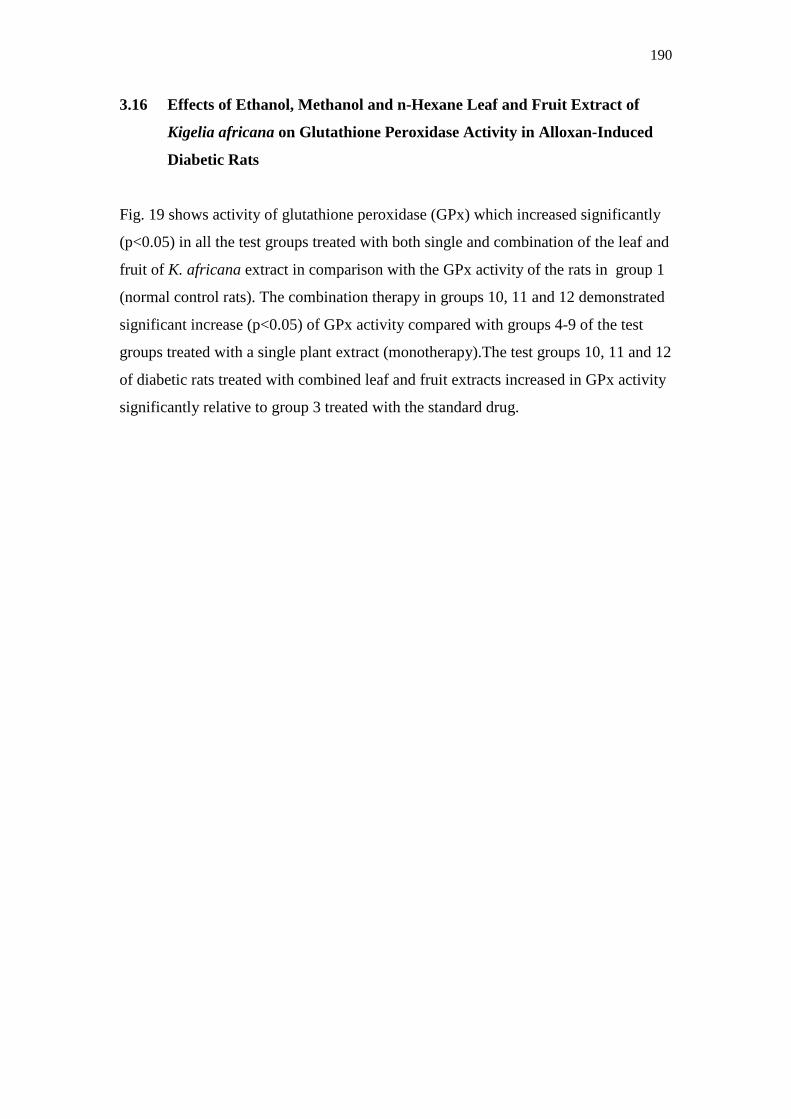
190
3.16 Effects of Ethanol, Methanol and n-Hexane Leaf and Fruit Extract of
Kigelia africana on Glutathione Peroxidase Activity in Alloxan-Induced
Diabetic Rats
Fig. 19 shows activity of glutathione peroxidase (GPx) which increased significantly
(p<0.05) in all the test groups treated with both single and combination of the leaf and
fruit of K. africana extract in comparison with the GPx activity of the rats in group 1
(normal control rats). The combination therapy in groups 10, 11 and 12 demonstrated
significant increase (p<0.05) of GPx activity compared with groups 4-9 of the test
groups treated with a single plant extract (monotherapy).The test groups 10, 11 and 12
of diabetic rats treated with combined leaf and fruit extracts increased in GPx activity
significantly relative to group 3 treated with the standard drug.
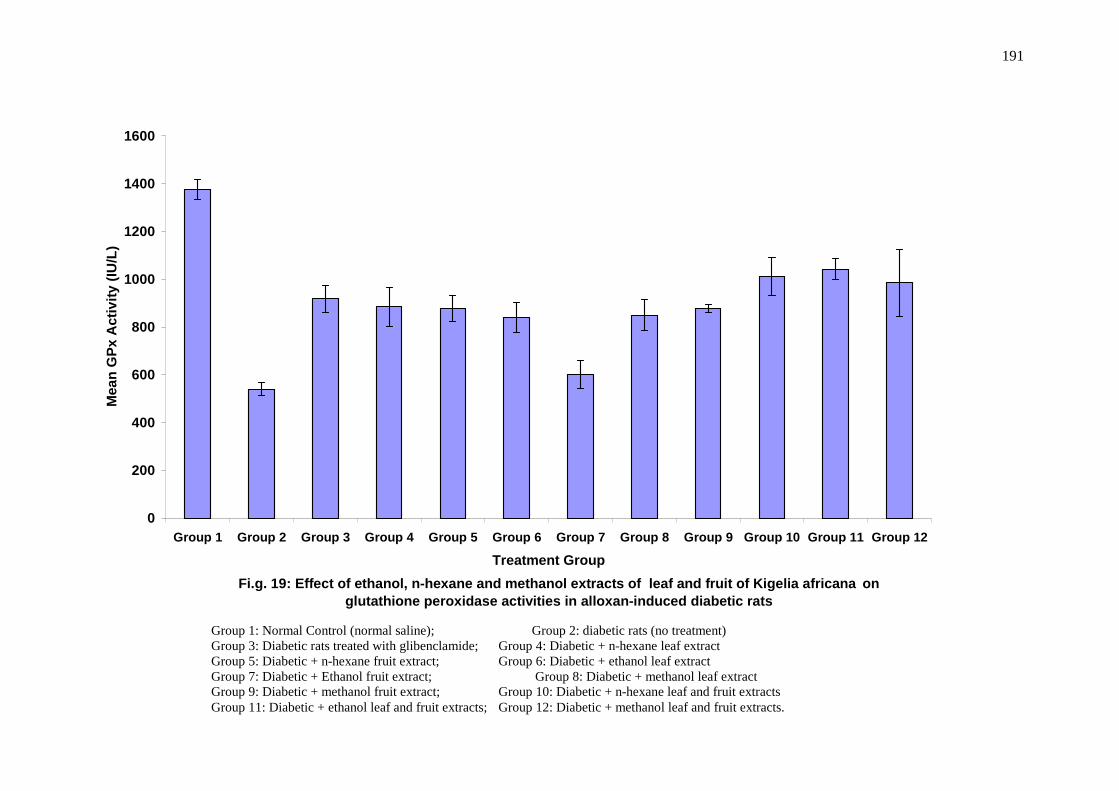
191
Fi.g. 19: Effect of ethanol, n-hexane and methanol extracts of leaf and fruit of Kigelia africana on glutathione peroxidase activities in alloxan-induced diabetic rats
0
200
400
600
800
1000
1200
1400
1600
Group 1 Group 2 Group 3 Group 4 Group 5 Group 6 Group 7 Group 8 Group 9 Group 10 Group 11 Group 12
Treatment Group
Mea
n G
Px
Act
ivit
y (I
U/L
)
Group 1: Normal Control (normal saline); Group 2: diabetic rats (no treatment) Group 3: Diabetic rats treated with glibenclamide; Group 4: Diabetic + n-hexane leaf extract Group 5: Diabetic + n-hexane fruit extract; Group 6: Diabetic + ethanol leaf extract Group 7: Diabetic + Ethanol fruit extract; Group 8: Diabetic + methanol leaf extract Group 9: Diabetic + methanol fruit extract; Group 10: Diabetic + n-hexane leaf and fruit extracts Group 11: Diabetic + ethanol leaf and fruit extracts; Group 12: Diabetic + methanol leaf and fruit extracts.
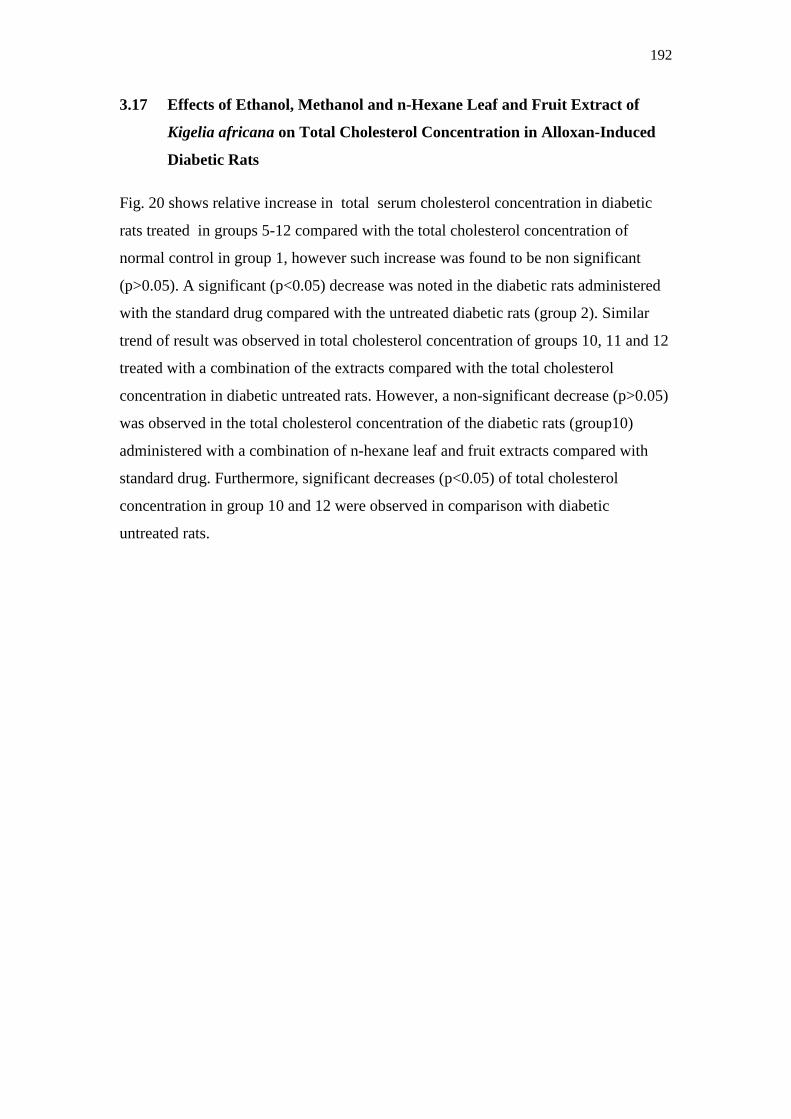
192
3.17 Effects of Ethanol, Methanol and n-Hexane Leaf and Fruit Extract of
Kigelia africana on Total Cholesterol Concentration in Alloxan-Induced
Diabetic Rats
Fig. 20 shows relative increase in total serum cholesterol concentration in diabetic
rats treated in groups 5-12 compared with the total cholesterol concentration of
normal control in group 1, however such increase was found to be non significant
(p>0.05). A significant (p<0.05) decrease was noted in the diabetic rats administered
with the standard drug compared with the untreated diabetic rats (group 2). Similar
trend of result was observed in total cholesterol concentration of groups 10, 11 and 12
treated with a combination of the extracts compared with the total cholesterol
concentration in diabetic untreated rats. However, a non-significant decrease (p>0.05)
was observed in the total cholesterol concentration of the diabetic rats (group10)
administered with a combination of n-hexane leaf and fruit extracts compared with
standard drug. Furthermore, significant decreases (p<0.05) of total cholesterol
concentration in group 10 and 12 were observed in comparison with diabetic
untreated rats.
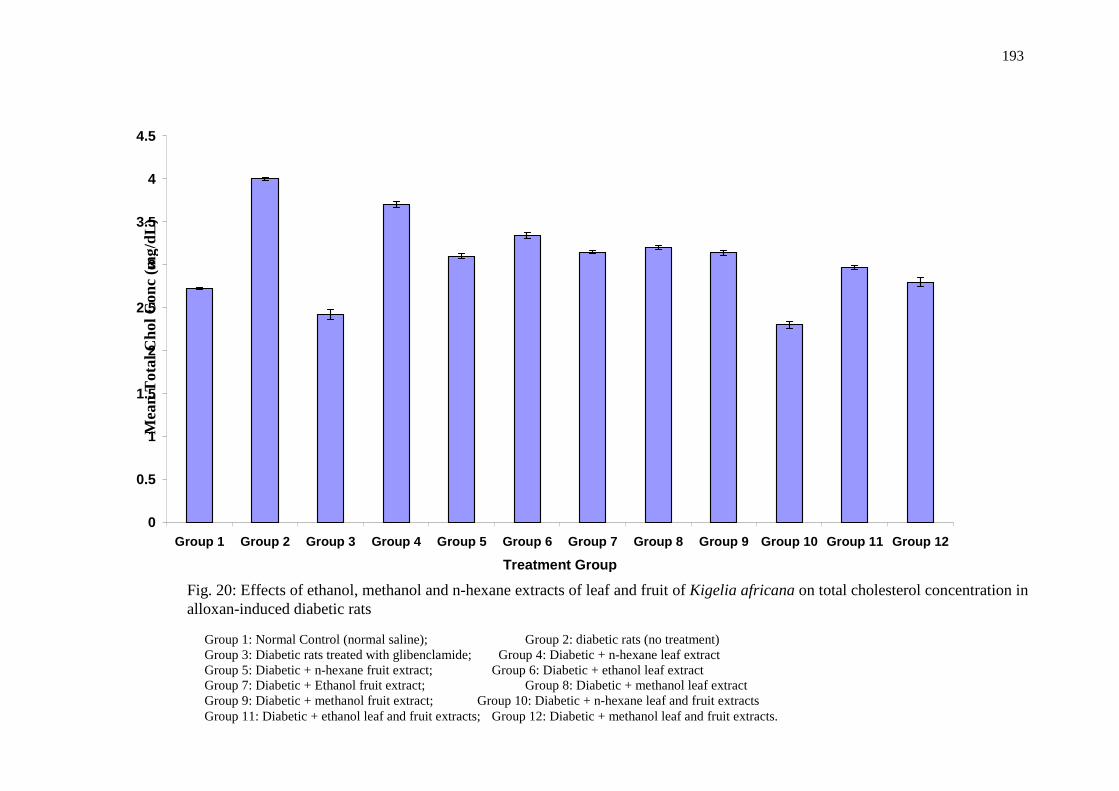
193
0
0.5
1
1.5
2
2.5
3
3.5
4
4.5
Group 1 Group 2 Group 3 Group 4 Group 5 Group 6 Group 7 Group 8 Group 9 Group 10 Group 11 Group 12
Treatment Group
Fig. 20: Effects of ethanol, methanol and n-hexane extracts of leaf and fruit of Kigelia africana on total cholesterol concentration in alloxan-induced diabetic rats
Group 1: Normal Control (normal saline); Group 2: diabetic rats (no treatment) Group 3: Diabetic rats treated with glibenclamide; Group 4: Diabetic + n-hexane leaf extract Group 5: Diabetic + n-hexane fruit extract; Group 6: Diabetic + ethanol leaf extract Group 7: Diabetic + Ethanol fruit extract; Group 8: Diabetic + methanol leaf extract Group 9: Diabetic + methanol fruit extract; Group 10: Diabetic + n-hexane leaf and fruit extracts Group 11: Diabetic + ethanol leaf and fruit extracts; Group 12: Diabetic + methanol leaf and fruit extracts.
Mea
n T
otal
Cho
l Con
c (m
g/dL
)
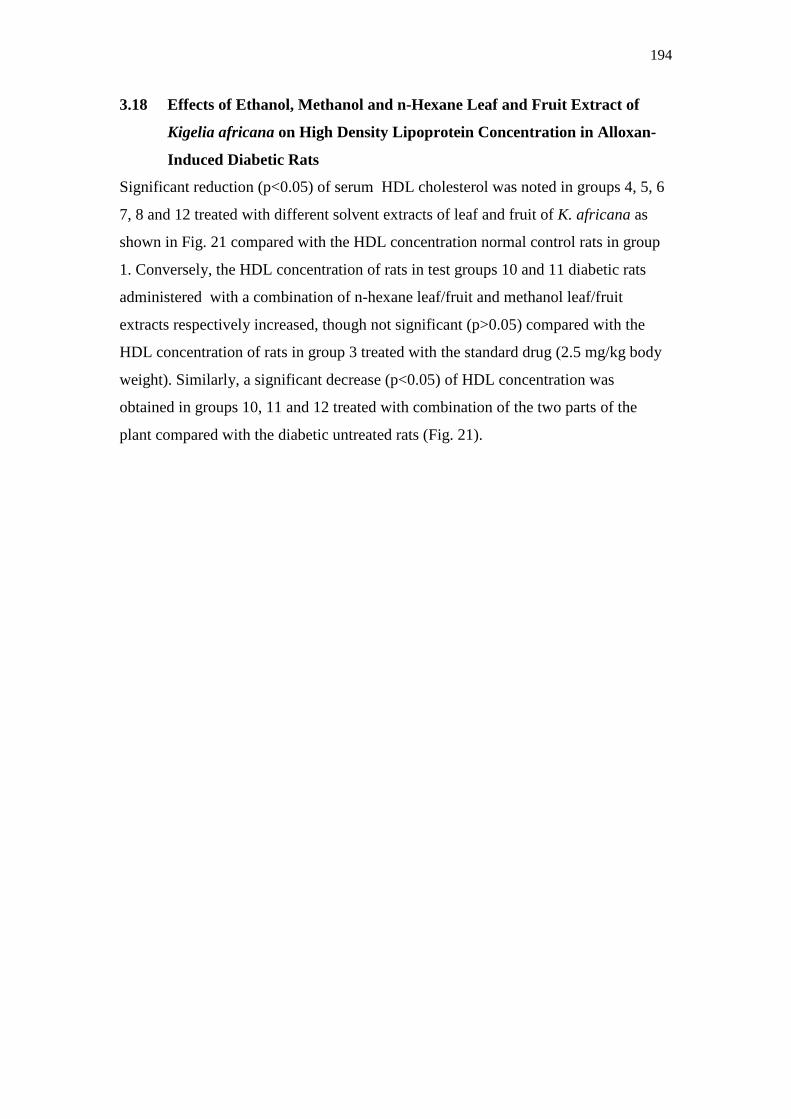
194
3.18 Effects of Ethanol, Methanol and n-Hexane Leaf and Fruit Extract of
Kigelia africana on High Density Lipoprotein Concentration in Alloxan-
Induced Diabetic Rats
Significant reduction (p<0.05) of serum HDL cholesterol was noted in groups 4, 5, 6
7, 8 and 12 treated with different solvent extracts of leaf and fruit of K. africana as
shown in Fig. 21 compared with the HDL concentration normal control rats in group
1. Conversely, the HDL concentration of rats in test groups 10 and 11 diabetic rats
administered with a combination of n-hexane leaf/fruit and methanol leaf/fruit
extracts respectively increased, though not significant (p>0.05) compared with the
HDL concentration of rats in group 3 treated with the standard drug (2.5 mg/kg body
weight). Similarly, a significant decrease (p<0.05) of HDL concentration was
obtained in groups 10, 11 and 12 treated with combination of the two parts of the
plant compared with the diabetic untreated rats (Fig. 21).
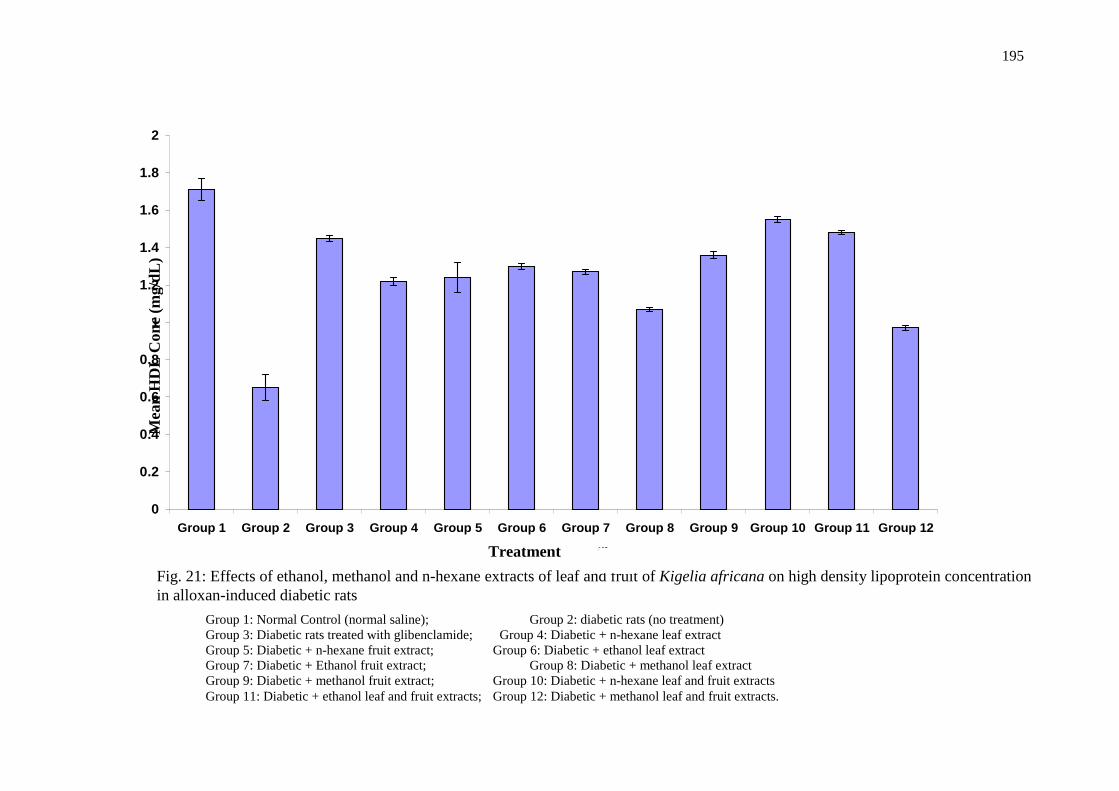
195
0
0.2
0.4
0.6
0.8
1
1.2
1.4
1.6
1.8
2
Group 1 Group 2 Group 3 Group 4 Group 5 Group 6 Group 7 Group 8 Group 9 Group 10 Group 11 Group 12
Treatment Group
Fig. 21: Effects of ethanol, methanol and n-hexane extracts of leaf and fruit of Kigelia africana on high density lipoprotein concentration in alloxan-induced diabetic rats
Treatment
Group 1: Normal Control (normal saline); Group 2: diabetic rats (no treatment) Group 3: Diabetic rats treated with glibenclamide; Group 4: Diabetic + n-hexane leaf extract Group 5: Diabetic + n-hexane fruit extract; Group 6: Diabetic + ethanol leaf extract Group 7: Diabetic + Ethanol fruit extract; Group 8: Diabetic + methanol leaf extract Group 9: Diabetic + methanol fruit extract; Group 10: Diabetic + n-hexane leaf and fruit extracts Group 11: Diabetic + ethanol leaf and fruit extracts; Group 12: Diabetic + methanol leaf and fruit extracts.
Mea
n H
DL
Con
c (m
g/dL
)
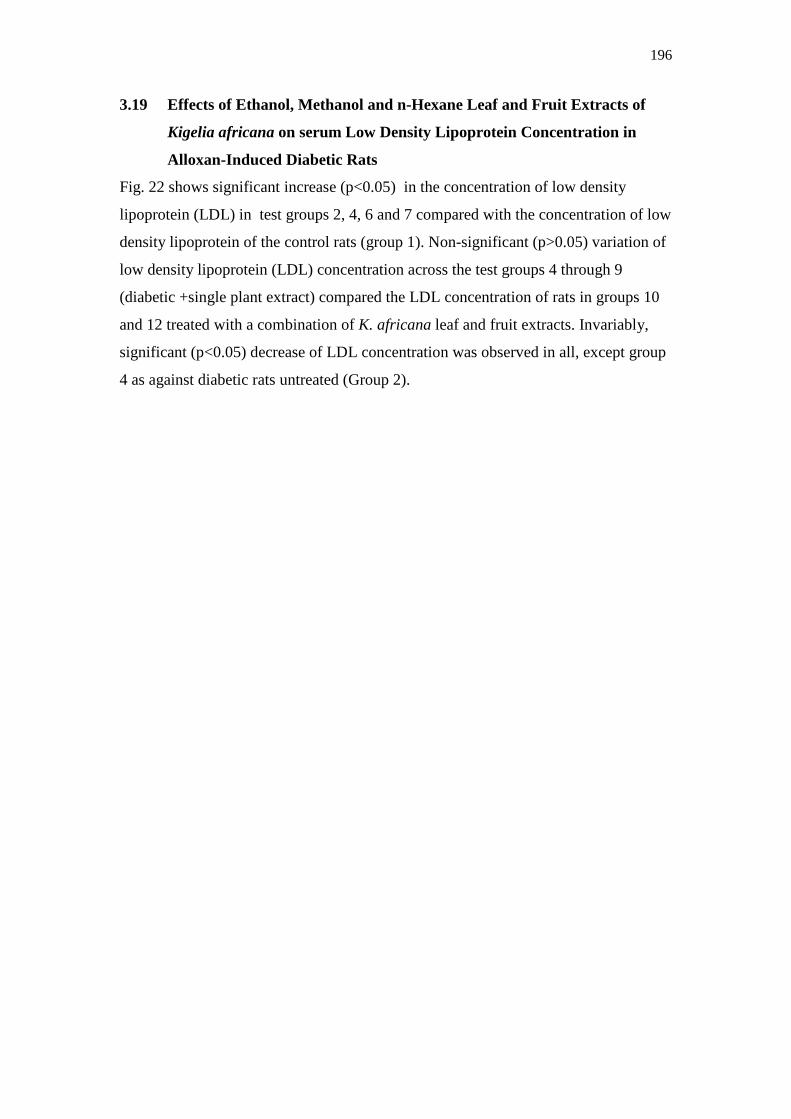
196
3.19 Effects of Ethanol, Methanol and n-Hexane Leaf and Fruit Extracts of
Kigelia africana on serum Low Density Lipoprotein Concentration in
Alloxan-Induced Diabetic Rats
Fig. 22 shows significant increase (p<0.05) in the concentration of low density
lipoprotein (LDL) in test groups 2, 4, 6 and 7 compared with the concentration of low
density lipoprotein of the control rats (group 1). Non-significant (p>0.05) variation of
low density lipoprotein (LDL) concentration across the test groups 4 through 9
(diabetic +single plant extract) compared the LDL concentration of rats in groups 10
and 12 treated with a combination of K. africana leaf and fruit extracts. Invariably,
significant (p<0.05) decrease of LDL concentration was observed in all, except group
4 as against diabetic rats untreated (Group 2).
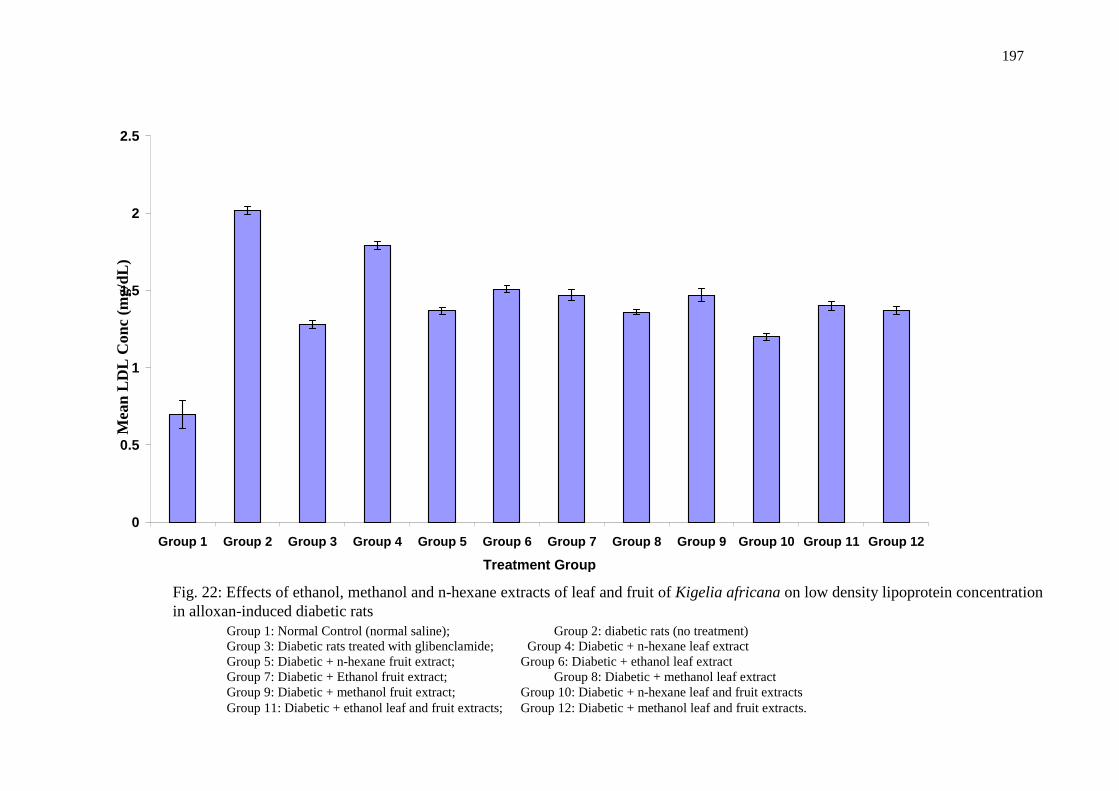
197
0
0.5
1
1.5
2
2.5
Group 1 Group 2 Group 3 Group 4 Group 5 Group 6 Group 7 Group 8 Group 9 Group 10 Group 11 Group 12
Treatment Group
Fig. 22: Effects of ethanol, methanol and n-hexane extracts of leaf and fruit of Kigelia africana on low density lipoprotein concentration in alloxan-induced diabetic rats
Group 1: Normal Control (normal saline); Group 2: diabetic rats (no treatment) Group 3: Diabetic rats treated with glibenclamide; Group 4: Diabetic + n-hexane leaf extract Group 5: Diabetic + n-hexane fruit extract; Group 6: Diabetic + ethanol leaf extract Group 7: Diabetic + Ethanol fruit extract; Group 8: Diabetic + methanol leaf extract Group 9: Diabetic + methanol fruit extract; Group 10: Diabetic + n-hexane leaf and fruit extracts Group 11: Diabetic + ethanol leaf and fruit extracts; Group 12: Diabetic + methanol leaf and fruit extracts.
Mea
n L
DL
Con
c (m
g/dL
)
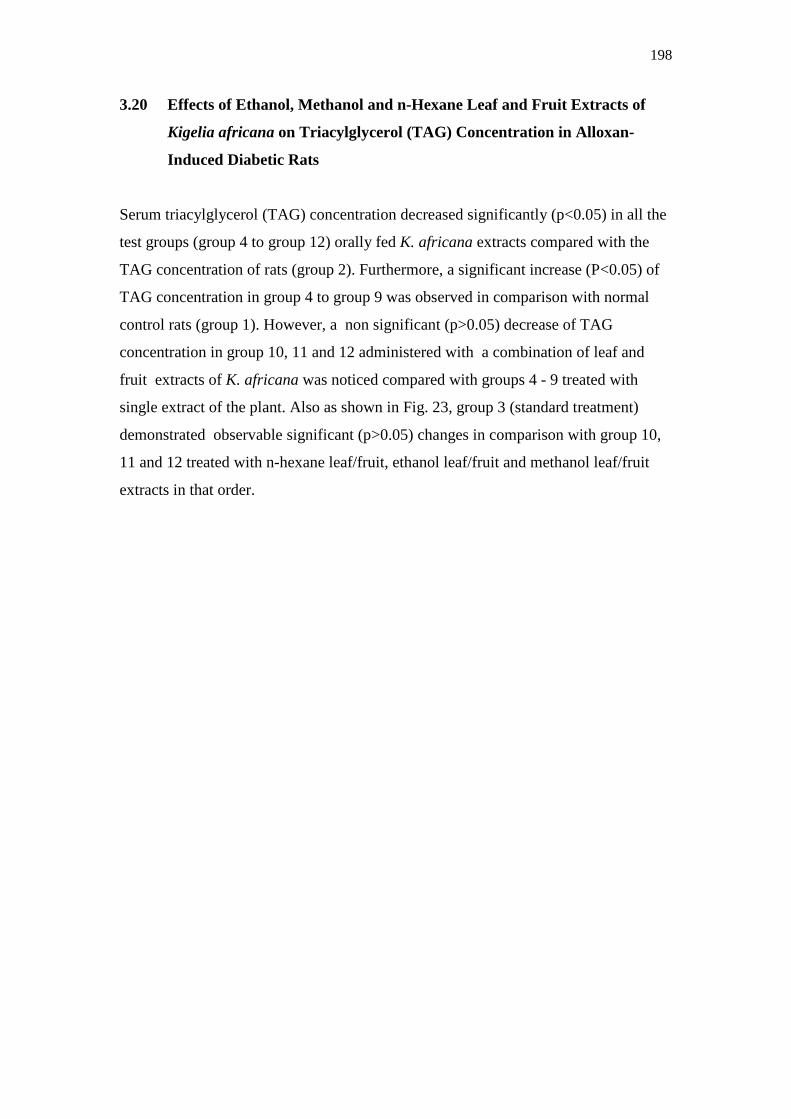
198
3.20 Effects of Ethanol, Methanol and n-Hexane Leaf and Fruit Extracts of
Kigelia africana on Triacylglycerol (TAG) Concentration in Alloxan-
Induced Diabetic Rats
Serum triacylglycerol (TAG) concentration decreased significantly (p<0.05) in all the
test groups (group 4 to group 12) orally fed K. africana extracts compared with the
TAG concentration of rats (group 2). Furthermore, a significant increase (P<0.05) of
TAG concentration in group 4 to group 9 was observed in comparison with normal
control rats (group 1). However, a non significant (p>0.05) decrease of TAG
concentration in group 10, 11 and 12 administered with a combination of leaf and
fruit extracts of K. africana was noticed compared with groups 4 - 9 treated with
single extract of the plant. Also as shown in Fig. 23, group 3 (standard treatment)
demonstrated observable significant (p>0.05) changes in comparison with group 10,
11 and 12 treated with n-hexane leaf/fruit, ethanol leaf/fruit and methanol leaf/fruit
extracts in that order.
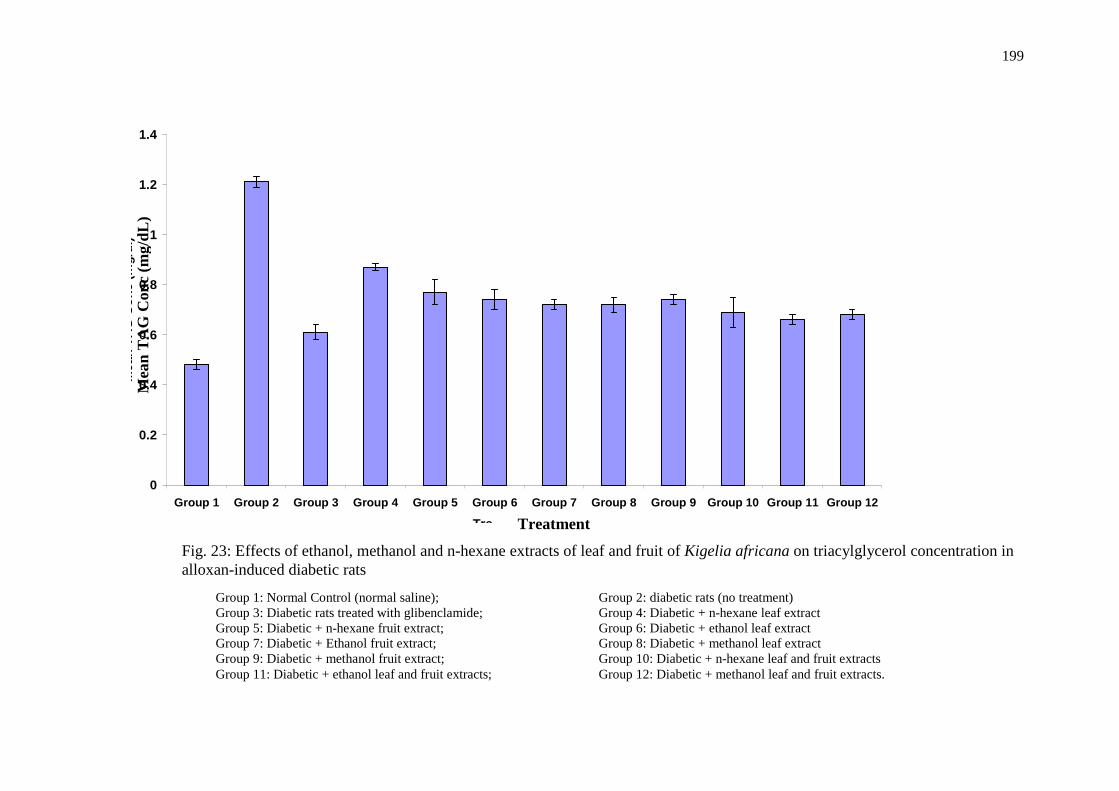
199
0
0.2
0.4
0.6
0.8
1
1.2
1.4
Group 1 Group 2 Group 3 Group 4 Group 5 Group 6 Group 7 Group 8 Group 9 Group 10 Group 11 Group 12
Treatment Group
Mea
n T
AG
Co
nc
(mg
/dl)
Fig. 23: Effects of ethanol, methanol and n-hexane extracts of leaf and fruit of Kigelia africana on triacylglycerol concentration in alloxan-induced diabetic rats
Treatment
Group 1: Normal Control (normal saline); Group 2: diabetic rats (no treatment) Group 3: Diabetic rats treated with glibenclamide; Group 4: Diabetic + n-hexane leaf extract Group 5: Diabetic + n-hexane fruit extract; Group 6: Diabetic + ethanol leaf extract Group 7: Diabetic + Ethanol fruit extract; Group 8: Diabetic + methanol leaf extract Group 9: Diabetic + methanol fruit extract; Group 10: Diabetic + n-hexane leaf and fruit extracts Group 11: Diabetic + ethanol leaf and fruit extracts; Group 12: Diabetic + methanol leaf and fruit extracts.
Mea
n T
AG
Con
c (m
g/dL
)
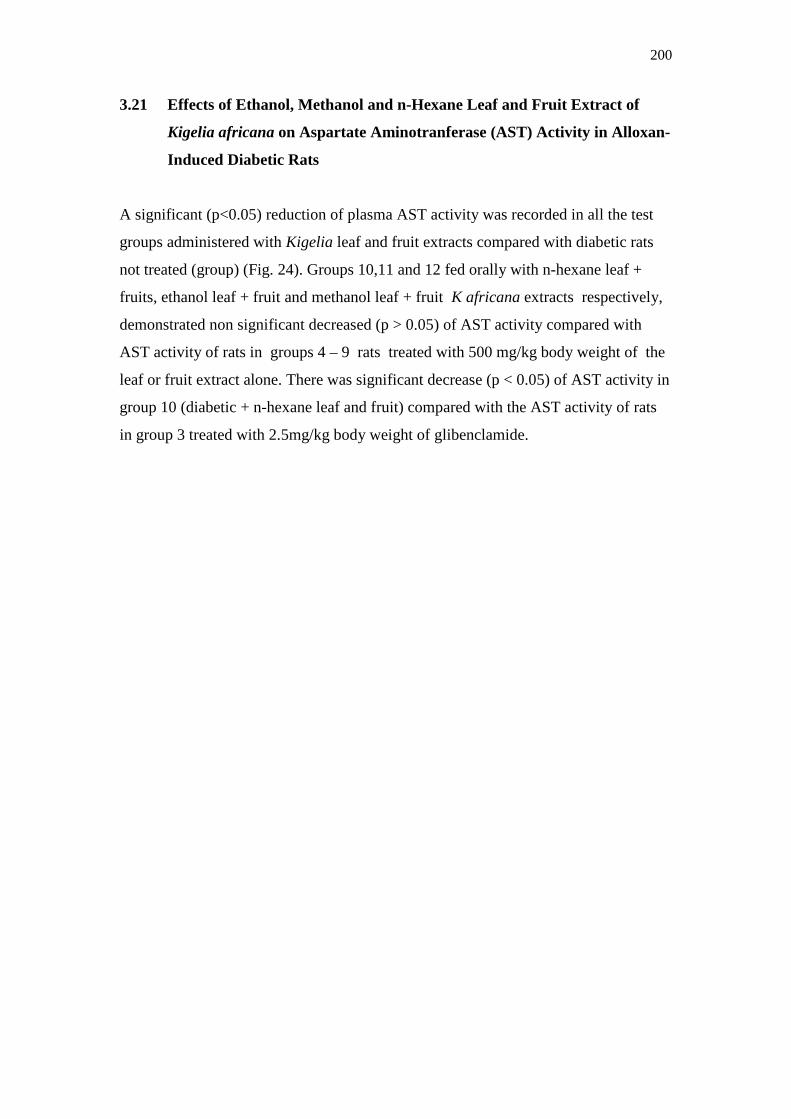
200
3.21 Effects of Ethanol, Methanol and n-Hexane Leaf and Fruit Extract of
Kigelia africana on Aspartate Aminotranferase (AST) Activity in Alloxan-
Induced Diabetic Rats
A significant (p<0.05) reduction of plasma AST activity was recorded in all the test
groups administered with Kigelia leaf and fruit extracts compared with diabetic rats
not treated (group) (Fig. 24). Groups 10,11 and 12 fed orally with n-hexane leaf +
fruits, ethanol leaf + fruit and methanol leaf + fruit K africana extracts respectively,
demonstrated non significant decreased (p > 0.05) of AST activity compared with
AST activity of rats in groups 4 – 9 rats treated with 500 mg/kg body weight of the
leaf or fruit extract alone. There was significant decrease (p < 0.05) of AST activity in
group 10 (diabetic + n-hexane leaf and fruit) compared with the AST activity of rats
in group 3 treated with 2.5mg/kg body weight of glibenclamide.
201
0
10
20
30
40
50
60
70
Group 1 Group 2 Group 3 Group 4 Group 5 Group 6 Group 7 Group 8 Group 9 Group 10 Group 11 Group 12
Treatment Group
Mea
n A
ST
Act
ivit
y (I
U/L
)
Fig. 24: Effects of ethanol, methanol and n-hexane extracts of leaf and fruit of Kigelia africana on aspartate aminotransferase activities in alloxan-induced diabetic rats
Treatment
Group 1: Normal Control (normal saline); Group 2: diabetic rats (no treatment) Group 3: Diabetic rats treated with glibenclamide; Group 4: Diabetic + n-hexane leaf extract Group 5: Diabetic + n-hexane fruit extract; Group 6: Diabetic + ethanol leaf extract Group 7: Diabetic + Ethanol fruit extract; Group 8: Diabetic + methanol leaf extract Group 9: Diabetic + methanol fruit extract; Group 10: Diabetic + n-hexane leaf and fruit extracts Group 11: Diabetic + ethanol leaf and fruit extracts; Group 12: Diabetic + methanol leaf and fruit extracts.
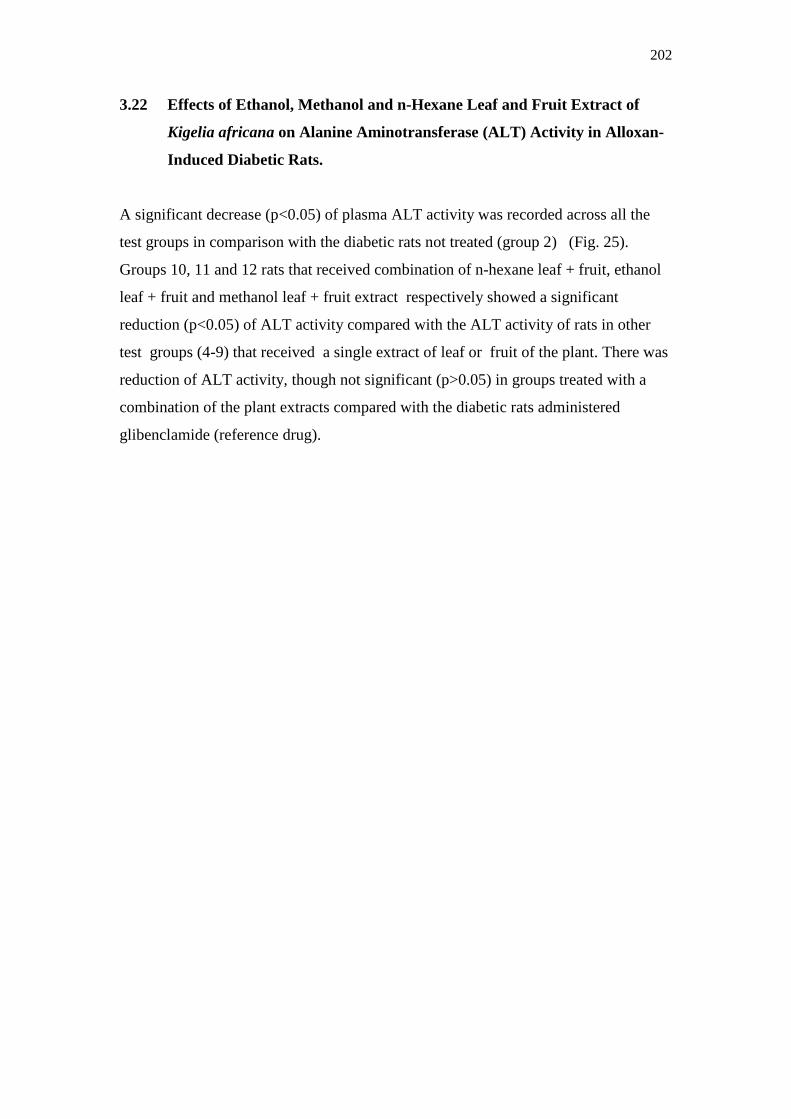
202
3.22 Effects of Ethanol, Methanol and n-Hexane Leaf and Fruit Extract of
Kigelia africana on Alanine Aminotransferase (ALT) Activity in Alloxan-
Induced Diabetic Rats.
A significant decrease (p<0.05) of plasma ALT activity was recorded across all the
test groups in comparison with the diabetic rats not treated (group 2) (Fig. 25).
Groups 10, 11 and 12 rats that received combination of n-hexane leaf + fruit, ethanol
leaf + fruit and methanol leaf + fruit extract respectively showed a significant
reduction (p<0.05) of ALT activity compared with the ALT activity of rats in other
test groups (4-9) that received a single extract of leaf or fruit of the plant. There was
reduction of ALT activity, though not significant (p>0.05) in groups treated with a
combination of the plant extracts compared with the diabetic rats administered
glibenclamide (reference drug).
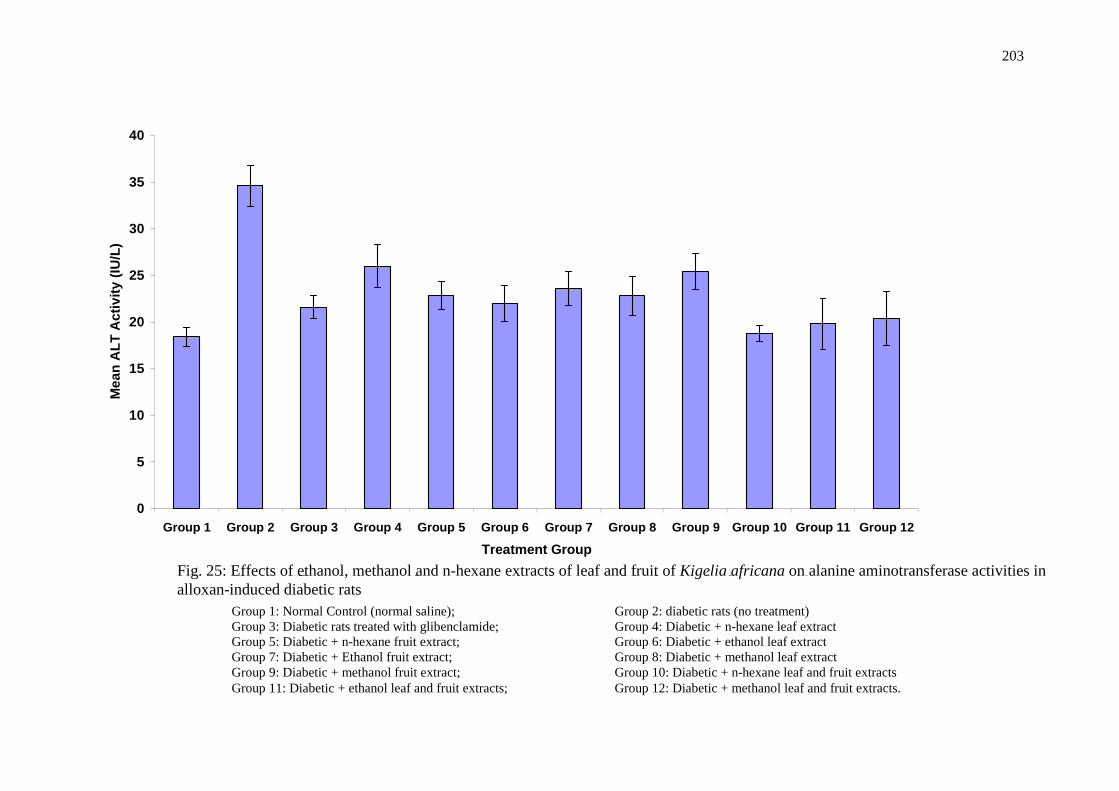
203
Fi.g. 20: Effect of ethanol, n-hexane and methanol extracts of leaf and fruit of Kigelia africana on
0
5
10
15
20
25
30
35
40
Group 1 Group 2 Group 3 Group 4 Group 5 Group 6 Group 7 Group 8 Group 9 Group 10 Group 11 Group 12
Treatment Group
Mea
n A
LT
Act
ivit
y (I
U/L
)
Fig. 25: Effects of ethanol, methanol and n-hexane extracts of leaf and fruit of Kigelia africana on alanine aminotransferase activities in alloxan-induced diabetic rats
Group 1: Normal Control (normal saline); Group 2: diabetic rats (no treatment) Group 3: Diabetic rats treated with glibenclamide; Group 4: Diabetic + n-hexane leaf extract Group 5: Diabetic + n-hexane fruit extract; Group 6: Diabetic + ethanol leaf extract Group 7: Diabetic + Ethanol fruit extract; Group 8: Diabetic + methanol leaf extract Group 9: Diabetic + methanol fruit extract; Group 10: Diabetic + n-hexane leaf and fruit extracts Group 11: Diabetic + ethanol leaf and fruit extracts; Group 12: Diabetic + methanol leaf and fruit extracts.
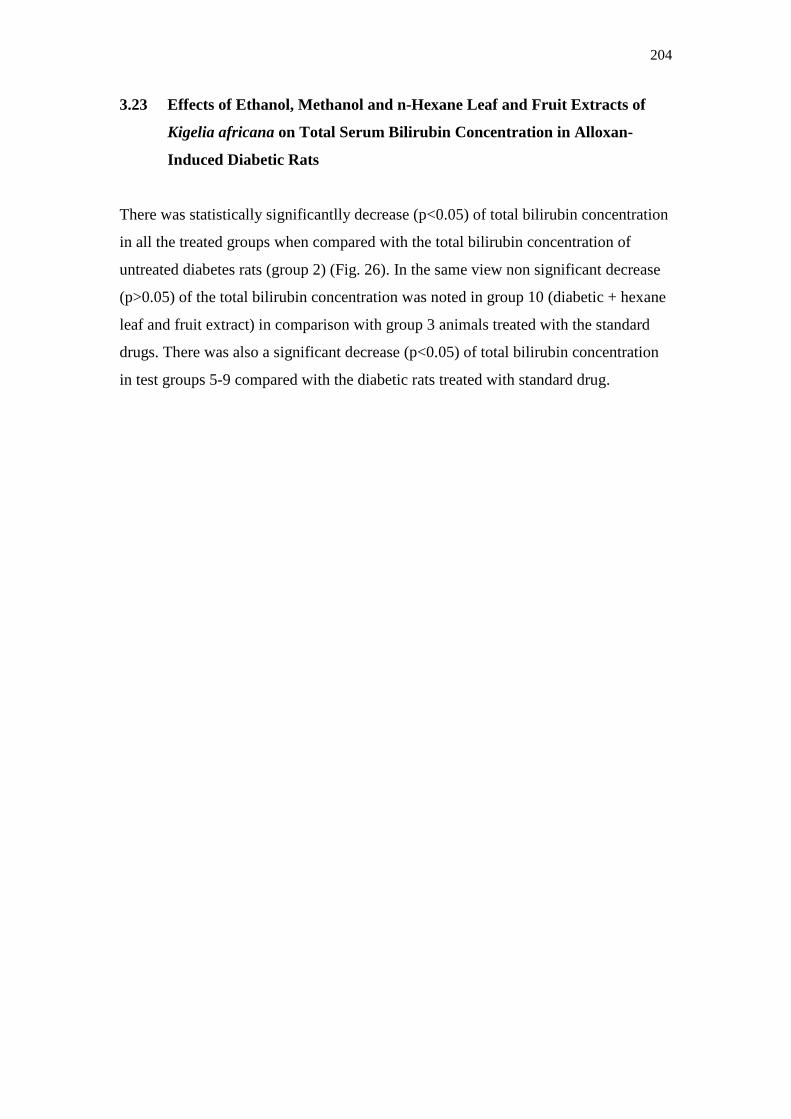
204
3.23 Effects of Ethanol, Methanol and n-Hexane Leaf and Fruit Extracts of
Kigelia africana on Total Serum Bilirubin Concentration in Alloxan-
Induced Diabetic Rats
There was statistically significantlly decrease (p<0.05) of total bilirubin concentration
in all the treated groups when compared with the total bilirubin concentration of
untreated diabetes rats (group 2) (Fig. 26). In the same view non significant decrease
(p>0.05) of the total bilirubin concentration was noted in group 10 (diabetic + hexane
leaf and fruit extract) in comparison with group 3 animals treated with the standard
drugs. There was also a significant decrease (p<0.05) of total bilirubin concentration
in test groups 5-9 compared with the diabetic rats treated with standard drug.
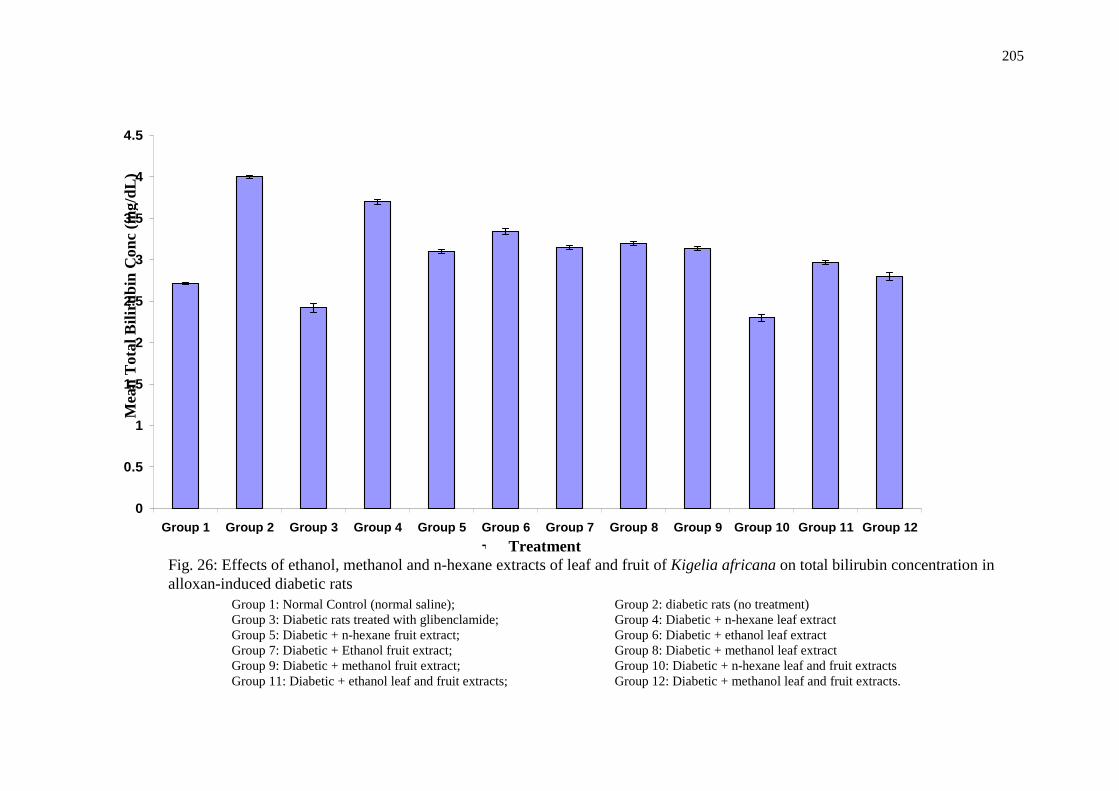
205
0
0.5
1
1.5
2
2.5
3
3.5
4
4.5
Group 1 Group 2 Group 3 Group 4 Group 5 Group 6 Group 7 Group 8 Group 9 Group 10 Group 11 Group 12
Treatment Group Treatment Fig. 26: Effects of ethanol, methanol and n-hexane extracts of leaf and fruit of Kigelia africana on total bilirubin concentration in alloxan-induced diabetic rats
Group 1: Normal Control (normal saline); Group 2: diabetic rats (no treatment) Group 3: Diabetic rats treated with glibenclamide; Group 4: Diabetic + n-hexane leaf extract Group 5: Diabetic + n-hexane fruit extract; Group 6: Diabetic + ethanol leaf extract Group 7: Diabetic + Ethanol fruit extract; Group 8: Diabetic + methanol leaf extract Group 9: Diabetic + methanol fruit extract; Group 10: Diabetic + n-hexane leaf and fruit extracts Group 11: Diabetic + ethanol leaf and fruit extracts; Group 12: Diabetic + methanol leaf and fruit extracts.
Mea
n T
otal
Bili
rubi
n C
onc
(mg/
dL)
206
206
CHAPTER FOUR
DISCUSSION
In animals, diabetes induced experimentally has provided important approach on the physiologic and biochemical derangement of the diabetic state.
Many of the derangements have been characterized in hyperglycemic animals. Significant changes in lipid metabolism and structure also occur in
diabetes.
This study evaluated the antidiabetic and antioxidative properties of Kigelia africana in alloxan-induced diabetic rats. From the results obtained diabetic
rats had much higher blood glucose level than that of the normal control. Changes in blood glucose levels reflect abnormalities in ß- cells structure and
function. Alloxan causes glucose oxidation and reduction in insulin release by the destruction of ß- cells of the islets of langerhans (Siyem et al., 2002).
In this study, rats with blood sugar level of 200 mg/dl and greater were considered diabetic. Administration of K. africana leaf and fruit extracts restored
glucose level in alloxan- induced diabetic rats near the normal level. Glibenclamide was used as a standard drug to compare the activity of K. africana
extract in reference to blood glucose reduction. The results revealed that the extracts at a dose of 500 mg/kg body weight showed significant effect at 21st
day indicating that the extracts possess hypoglycemic activities. The comparable effect of the extract (500 mg/kg) with glibenclamide (2.5 mg/kg) may
suggest similar modes of action, since the main mechanism of the action of glibenclamide is the stimulation of insulin release and the inhibition of
glucagon secretion. It has been described that glibenclamide is effective in moderate diabetic state and ineffective in severe diabetic animals where
pancreatic ß- cells are totally destroyed (Suba et al., 2004). The hypoglycemic effect of medicinal plant extracts generally depends upon the degree of ß-
cell destruction (Grover et al., 2000). The possible mechanism by which the plant extract brings about its hypoglycemic action may be by potentiating
the insulin effect by increasing pancreatic secretion of insulin from ß- cells (Stanely et al., 2000). The findings also suggest that K. africana leaf and fruit
many generate ß- cells and have protective effect on ß- cells from glucose toxicity. This report was buttressed by the results of liver marker enzymes that
were assayed in this study. As other studies showed, plant extracts might bring about their hypoglycemic effect through insulin secretion from the
207
207
remaining ß-cell and insulin sensitivity (Ko et al., 2005; Leng et al., 2004). Some plants have also been observed to exert hypoglycemic activity through
insulin stimulatory effect (Ravi et al., 2004). In general, there is little biological knowledge on the specific modes of action of plants in the treatment of
diabetics, but most of the plants have been found to contain substances like glycosides, alkaloids, terpernoids, and flavonoids that are frequently
implicated as having antidiabetic effects (Low and Kazkin, 2002). This was also buttressed by the results of the phytochemistry of K. africana which
revealed high percentage of flavonoids, glycosides, alkaloids, terperniods that are frequently implicated as having antidiabetic effects effects (Low and
Kazkin, 2002). These plant constituents can lower blood glucose level.
The alloxan-induced diabetic rats had a marked loss of body weight. This would be expected as one of the effects of diabetes is body weight loss. Free
radicals generated under hyperglycemic condition could attack major biomolecules such as proteins, DNA and lipids and which could lead to the weight
loss recorded in this work. Increased synthesis of ketone bodies coupled with increased lipolysis seen in diabetes leads to a severe body weight loss.
However, the diabetic rats orally fed with Kigelia plant extracts had a remarkable gain in body weight compared with untreated diabetic rats. Significant
increase (p<0.05) in body weight was recorded in the group administered a combination of the plant extracts in comparison with the group treated with a
single extract. In addition, the observed decrease in body weight of diabetic animals agrees with result of Torres et al., 1999, who noticed a marked
reduction in the body weight of animal with significant increase in serum triacylglycerol in STZ- induced diabetic rats.
Sorbitol concentration significantly decreased (p<0.05) across all the test animals in reference to diabetic untreated rats. This reduction is probably due to
the antioxidant contents of the plant extracts. Sorbitol is a product of polyol pathway and is a feature of diabetic complications. It could be suggested that
some of the active constituents of K. africana extracts inhibit the activity of aldose reductase, the major enzyme in the polyol pathway. An increased flux
of glucose via the polyol pathway leads to intracellular accumulation of sorbitol. Accumulation of this non-permeable sugar in cells especially the lenses
and nerves results in osmotic stress, cellular edema, redox imbalance, depletion of water soluble antioxidant and susceptibility to oxidative insult
(Cameron et al., 1996). This is implicated in the pathogenesis of long term complication in diabetes mellitus.
208
208
This study further revealed significant reduction (P<0.05) of sorbitol concentration in groups 10-12 rats treated with the combination of leaf and fruit
extracts relative to animals treated with the reference drug (2.5 mg of glibenclamde). This is in line with the fact that synthetic drugs do not restore
normal glucose homeostasis and are not free from side effect (Bandawane et al., 2011).
Throughout the circulatory life of the red cells, glycohaemoglobin is formed continuously by the addition of glucose to the N- terminal of the hemoglobin
beta chain. This process which is non-enzymatic reflects the average exposure of hemoglobin to glucose over an extended period. In a classical study,
Trivell et al., showed glycohemoglobin in diabetic subjects to be elevated 2-3 folds over the levels found in normal individuals. These support the results
of this study. A significant (p<0.05) increase in glycosylated hemoglobin level in the diabetic rats untreated with reference to the normal control animals
(group 1) was observed in this study. The increase is in accord with the report of several other researchers (Testamarian and Cohen, 1992; Langerstroer
and Pieper et al., 1993; Ting et al., 1996). The increased glycosylation may be as a result of diabetic complications caused by oxidative stress. Generally,
decreased glycoheamoglobin level was observed in diabetic rats treated with K. africana extracts as against diabetic rats not treated. Decrease in
glycoheamoglobin level could be attributed to the extracts’ ability to reduce glucose level in the blood stream with corresponding decrease in glycated
heamoglobin level.
A significantly increase (p<0.05) in serum total protein was recorded in all the test groups treated with the plant extracts in comparison with the diabetic
untreated rats. Decrease in serum total protein was observed in untreated diabetic rats with reference to test groups both single and combination of the
plant extracts. This is in tandem with the proximate composition of the plant that revealed approximate 13% protein. Invariably, the effect of free
radicals on plasma protein has been discussed as diabetic rats undergo oxidative stress.
High concentration of MDA in diabetic untreated established oxidative stress status in the animals. In hyperglyceamic condition, glucose is one of the
major sources of free radicals. Lipid peroxidation measured as malondiadehyde (MDA) significantly (p<0.05) decreased in all the test groups compared
with diabetic rats untreated (group 2). Groups 10, 11 and 12 treated with a combination of leaf and fruit extracts showed significant (p<0.05) decrease in
209
209
MDA concentration as against groups 4-9 treated with single extract. Reduction in the lipid peroxidation index in treatment groups indicates the ability of
the extracts to stem down the oxidative stress by moping up free radical that lead to lipid breakdown. The bioactive constituents of the extracts such as
flavoniods, alkaloids as revealed by phytochemistry results could be implicated in free radical scavenging properties of the extracts.
This study revealed marked increase in serum levels of triacylglycerol, total cholesterol, and low density lipoprotein cholesterol (LDL- Cholesterol) in
alloxan–induced diabetic rats. Diabetes is associated with altered lipid levels. The most commonly observed lipid abnormalities in diabetes are
hypertrigyceridemia and hypercholesterolemia (Shephened, 2005; Shirwaikar et al., 2006) and these contribute to coronary artery disease (Arvind et al.,
2002). This lends credence to the significant (P<0.05) increase of total cholesterol, triacylglycerol and low density lipoprotein in the diabetic rats used in
this study. K. africana treated rats, showed a reduction in these lipids which buttressed the hypolipidemic effect of the plant. The hypolipidemic effect
may be due to inhibition of fatty acid synthesis (Kumar et al., 2011). It could also be attributed to the increase in the reverse cholesterol transport
pathway and decreased cholesterol concentration from the intestine due to α- glucosidase inhibition. In normal metabolism insulin activates the enzymes
lipoprotein lipase and hydrolyses triacylglycerol. A deficiency in insulin results in inactivation of these enzymes thereby causing hypertriglyceridemia
(Shirwaikar et al., 2004; Maruithupandian et al., 2011). Administration of a combination of leaf and fruit extracts of K. africana (groups 10-12) resulted
in a significant (p<0.05) improvement in lipid parameters when compared with the diabetic control animals (group-2). It can be further stated that K.
africana plant extracts have the potential to correct the lipid abnormalities, thus delaying lipid peroxidtion in diabetic condition.
The reports on the status of antioxidants and antioxidant enzymes in diabetic state are very contradictory; both increase and decrease of antioxidant
activity have been reported (Matkovice et al., 1982; Kaji et al., 1985). The report on the SOD activity in diabetic state is controversial with some authors
reporting no change in SOD activity (Kesavulu et al., 2000; Sekero et al., 2000) while others reported increased (Sundaram et al., 1996; Maritin et al.,
2003) and decreased SOD activity (Sundaram et al., 1996). In the present study, significant (p<0.05) decreases in the activities of SOD, CAT and GPx
were recorded in diabetic rats not treated compared with the normal control group. An observed significant (p<0.05) increases of these antioxidant
enzymes were recorded in groups 10-12 treated with a combination of two parts of K.africana extracts as against groups 4-9 with monotherpeutic
210
210
administration of leaf and fruit extracts of the same. Reduction of the antioxidant enzymes was observed in diabetic rats not treated with reference to test
rats treated with the standard drug. This is in line with the report that products of membrane lipid peroxidation and other oxidants like H2O2 may react
with superoxide dismutase resulting in oxidative modification thereby causing loss of enzyme activity in diabetic condition (Sundaram et al., 1996). The
result, also concords with the reports that the relatively low expression of antioxidant enzymes such as catalase and superoxide dismutase, pancreatic ß-
cells may be vulnerable to reactive oxygen species (ROS) attack when the system is under oxidative stress situation (Lenzen et al., 1996; Tiedge et al.,
1997). Similarly, elevated levels of free radicals, due to insufficiency of the antioxidant defense system, may lead to disruption of cellular functions,
oxidative damages to protein, DNA, membranes and enhance their susceptibility to lipid peroxidation (Baynes, 1999) under uncontrolled diabetic
condition. Also hyperglycemia leads to glycation and inactivation of superoxide dismutase thus attributing to its decrease. In the study, the animals
treated with K. africana extracts showed increase in the activity of antioxidant enzymes as against untreated diabetic rats (group 2) and this unveiled the
extracts’ potential in mopping up or scavenging free radicals generated under oxidative stress mediated diabetes. The bioactive compound, favonoid may
be implicated in the scavenging activity of the plant extracts in oxidative condition.
The fact that normal cells are protected against peroxidative damage in vivo can be attributed to efficient antioxidant mechanisms. This antioxidant
protection is in part a function of the integrity of each cellular constituent, and in part a reflection of antioxidant system within the cell. In disease
conditions, where oxidative stress plays causative and/or exacerbating roles, this mechanism is impaired. Antioxidant vitamins, such as vitamin C and E
may be then low in such system. From the above premise, the low plasma vitamin C concentration obtained in group 2 of untreated diabetic rats
compared with the control group 1 and all the test rats (groups 4-12) is a manifestation of oxidative stress. Oxidative stress inactivates antioxidants
(Fantone and Ward, 1982), thus depletion of antioxidant vitamin C is expected. The fact that vitamin C protects against oxidative stress is now generally
accepted (Delatre and Bonnefont-Rousselot, 1998; Fakoya et al., 1998).Thus; decrease in vitamin C concentration in the present study of untreated
diabetic rats is probably a consequence of its protective roles.
211
211
Herperglyceamia induces liver damage through free radicals generated from glucose autoxidation, advanced glycation end products formation (AGEs)
and oxidation of lipid biomelecules. In this study, damage of the hepatocytes was established by increased activity of liver marker as observed in diabetic
rats not treated. The increase in serum activity of ALT, AST and the concentration of total bilirubin measured indicated severe damage to liver
hepatocytes of untreated diabetic rats as against test groups treated with K. africana extracts. Increased serum ALT and AST activity could be associated
with hepatocellular damage and was in line with the report of Lieberman et al., 1991. The statistical reduction (p<0.05) of the liver marker enzymes
observed in groups 10-12 demonstrated the synergistic effect of the combination of the plant extracts in comparison with monothererpy. Significant
decrease (p<0.05) of serum activity of ALT and AST was recorded in group 3 treated with standard drug in reference to the positive control group 2
(diabetic rats untreated). The reduction of the activity of these liver markers enzymes, ALT and AST could be attributed to the ability of the extracts to
repair and regenerate the damaged hepatocytes. The possible mechanism by which this could be achieved is by mopping up or scavenging free radical
generated under stress condition. Flavonoids and other bioactive constituents of K. africana as revealed by photochemical results could be implicated in
free radical scavenging activity of the extracts.
Bilirubin accumulates because its transfer from liver cells to the bile is inhibited. Conjugation of bilirubin in the liver in diabetic condition is impaired
probably because of liver damage. The significant (p<0.05) increase of serum bilirubin concentration was observed in diabetic untreated as against
normal control rats (Group 1). The increase could be due to inability of the liver to metabolize bilirubin formed during the break down of heamoglobin in
red cells of diabetic animals. Free radicals were implicated in these conditions because breakdown of heamoglobin can be facilitated by the oxidant
species. Hence increased bilirubin concentration correlated with extent of liver damage in hyperglyceamic condition. The diabetic groups 10-12 treated
with a combination of leaf and fruit extracts showed significant (p<0.05) decrease in bilirubin concentration compared with groups 4-9 fed with a single
extract. Generally, test groups demonstrated decreased in bilirubin concentration as against untreated diabetic rats. The reduction in the bilirubin
concentration confirmed the potency of the extracts to repair the damaged hepatocytes of the diabetic rats. K. africana extracts reduced the concentrations
of the liver markers ALT, AST and bilirubin in the test groups with reference to the untreated diabetic rats. Thus, supporting that K. africana is relatively
free from side effect as revealed by the median lethal dose (LD50)
212
212
4.2 Conclusion
From the results, it can be concluded that K. africana extracts possess anti-hyperglyceamic effect via α-glucosidase inhibition with corresponding
increase in body weight of diabetic rats treated with the extracts. Significant reduction of glycoheamogloin level and sorbitol concentration was obtained
in all the diabetic treated groups in reference to positive control, supporting glucose reduction ability of the extracts. The extracts were found to have
lipid- lowering effects through reduction of total serum cholesterol, triacyglycerol and low density lipoprotein. High density lipoprotein increased thus
increasing reverse cholesterol transport pathway. K. africana extracts exhibit antioxidant properties by reducing malondiadehyde concentration; hence
retarding lipid peroxidation. Antioxidative potential of the extracts was ascertained through increase in activities of antioxidant enzymes; CAT, SOD,
GPx and antioxidant vitamin (Vitamin C) in test animals as against positive group. The increase in the antioxidant activities was due to the ability of the
extracts to mop-up free radical generated under stress conditions. Total protein was improved in all the treatment groups. The results revealed reduction
in liver marker; ALT and AST and reduction in total bilirubin concentration and therefore confirmed the safety profile of the extracts. Furthermore,
combination of leaf and fruit extracts provided better results compared with the groups treated with single plant extract. In general, the possible
mechanisms by which K. africana brings about antidiabtic activities include: glycosidase (glucosidase) inhibitor mechanism, α-amylase inhibitor
mechanism, inhibition of hepatic glucose metabolizing enzyme mechanism, antioxidant mechanism, inhibition of glycosylation of haemoglobin
mechanism and modulation of glucose absorption from the gut. Therefore, management and prevention of diabetes complications can be achieved by use
of K. africana extracts.
213
213
REFERENCES
214
214
Albers, J.J., Warmick, G.R. and Cheng, M.C. (1978). Determination of high density lipoprotein (HDL) cholesterol. Lipids, 13:926-932. Albro, P.W., Corbelt, F. and Schroeder, J.L. (1986). Generation of hydrogen peroxide by incidental metal catalyzed autoxidation of glutathione. Journal
of Inorganic Chemistry, 27:191-203 Ahmed, N. (2005). Advanced glycation end products role in pathology of diabetic complications, Diabetes Research and Clinical Practice, 67:3-21. Akunyili, D. and Houghton, P. J. (1993). Monoterpenoids and naphthaquinones from Kigelia pinnats Bark. Phytochemistry, 32: 1015–1018. Ananda, P.K, Kumarappan, C.T., Christudas, S. and Kalaichelvan, V.K. (2012). Effects of Biophytum sensitivum on Streptozotocin and nicotinamid-
induced diabetic rats. Asian Pac Journal Tropical Biomedical, 2(1):31-35. Aseku, O.T., Olusegun, E. and Adebola, O. (2006). The volatile constituents of the leaves and flower of Kigelia africana Benth, Flva Frangr Journal, 22
(1), 21-23. Association of Official Analytical Chemistry (AOAC) (1990). Official methods of anlysis.15thEd., Washington D.C.pp.220-240. Aral, K., Iizuka, S., Tada Y., Oikawa, K. and Taniguchi, N (1987). Glycation and inactivation
of human Cu-Zn-superoxide dismutase, Journal of Biolological Chemistry. 262, 16969–16972. Bandawane, D., Juvekar, A. and Juveka, M. (2011). Antidiabetic and streptozotocin-induced diabetic rats. Indian Journal Pharmacology. Education
Research, 45 (2):114-120. Baynes, J.W. and Thorpe, S.R. (2000). Glycoxidation and lipoxidation in 6, 10, 11 athrogenesis. Free radical Biological and Medicine, 28(12): 1708-
1716. Baynes, J.W. (1991). Role of oxidative stress in development of complications in diabetes, Diabtes, 40, 405-412. Begenbardt, T.P., Thorpe, S.R. and Baynes, J.W. (1998). Chemical modification of proteins by methylglyoxal. Cell molecular Biology (Noisy-le-grand),
44: 1139 –1145. . Bergmeyer, H.U. (1974) Methods of Enzymatic Analysis. 3rd Edn. 3.Verlag Chemie Weinhein Academic Press, Inc., New York and London.pp 56-58.
215
215
Binutu, O. A. Adesogan, K. E. and Okogun, J. I. (1996). Antibacteria and antifungal components from Kigelia Pinnata, Planta Medicine, 62 (4) 352 –
353. Bohlender, J.M., Franke, S., Stein, G. and Wolf, G. (2005). Advanced glycation end products and the Kidney, America Journal of Physiology, Renal
Physiology, 289: 645-659. Boveris, A. (1984). Determination of the production of superoxide radicals and hydrogen perioxide in mitochondria. Methods of Enzymology, 105:429-
435. Brömme, H.J., Mörke, W., Peschke, D. and Ebelt, H. (2000). Scavenging effect of melatonin on hydroxyl radicals generated by alloxan. Journal Pineal
Research, 29:201–208 Brownlee, M. (2001). Biochemistry and molecular cell biology of diabetic complications. Nature, 414: 813-820. Cameron, N.E., Cotter, M.A., Jack, A.M, Basso, M.D. and Hohman , A.G. (1999). Protein kinase C effects on nerve function, perfusion, Na+, K+-ATPase
activity and glutathione content in diabetic rats. Diabetologia, 42:1120-1130. Cederberg, J., Basu, S. and Eriksson, U.J. (2001). Increased rate of lipoxidation and protein carbonylation in experimental diabetic pregnancy.
Diabetologia, 44 :766-774. Cerieilo, A., Mercuri, F., Quagliaro, L., Assaloni, R., Moez, E., Tonutti, and Taboga, C. (2001). Detection of nitrotyrosine in the diabetic plasma:
Evidence of oxidative stress. Diabetologia, 44:834-838. Cordell, G. A. (2000). Biodiversity and drug discovery: a symbiotic relationship, phytochemistry, 56, 463 – 480. Creager, M.A., Luscher, T.F., Cosentino, F. and Beckman, J.A. (2003).Diabetes and vascular disease: pathophysiology, clinical consequences and
medical therapy: part 1. Circulation, 108:1527-1532. Cullision, A.E. (1982). Feeds and Feeding. 3rd Edn. Reston Publishing Co. Inc. Virginia, USA. pp 14-33.
216
216
Dandona, P. and Aljada, A. (2002). A traditional approach to pathogenesis and treatment of type 2 diabetes mellitus insulin resistance, inflammation and arthrosclerosis, American Journal of Cardiology, 90: 27G-33G).
Davison, G.W., George, L., Jackson S.K., Young, I.S., Davies, B. and Bailey, M. (2002). Exercise free radicals and lipid peroxidation in type 1 diabetes
mellitus. Free Radical Biology Medicine, 33: 1543-1551. Dean, M., Fojo, T. and Bates, S. (2005). Tumour stem cells and drug resistance. Nature Revision Cancer, 5:275-278. Delatre, J. and Bonnefort-Rousselot, D. (1998). Oxidative stress free radical and aging. The World View. Journal for Biotechnology and life Science
Research, 3(2):3-4. Du, X., Matsumura, T., Edelstein, D., Rossetti, L., Zsengeller, Z., Szabo, C. and M. Brownlee, M. (2003). Inhibition of GAPDH activity by
poly(ADP-ribose) polymerase activates three major pathways of hyperglycemic damage in endothelial cells, Journal of Clinical Investigation. 112, 1049-1057.
Ensminger, M.E. and Olentine, C.G. (1978). Feeds and Nutrition-Complete. 1st Edn. The Ensminger Publishing Co., California. p 1057. Evans, J.L., Godfine, I.D., Maddux, B.A. and Grodsky, G.M. (2002). Oxidative stress-activated signaling pathways: A unifying hypothesis of type 2
diabetes. Endocrine Reviews, 23:599-622. Elsner, M., Gurgul-Convey, E. and Lenzen, S. (2007). Relation between triketone structure, generation of reactive oxygen species and selective toxicity
of the diabetogenic agent alloxan. Antioxidnt Redox Signal (In press). Elsner, M., Gurgul-Convey, E. and Lenzen, S. (2006). Relative importance of cellular uptake and reactive oxygen species for the toxicity of alloxan and
dialuric acid to insulin-producing cells. Free Radical Biological Medicine, 41:825–834. Fakoya, E.A.O., Osilesi, O., Ogunledian, A., Fakoya, T.A. and Odusogalo, O.I (1998). Antioxidant nutrients and disease interaction. Nigerian Journal
Nutrition Science,19:6-19. Fantone, J. C. and Ward, P.A. (1982). Role of oxy-derived free radical and metabolites in leucocyte-dependent inflammatory reactions. America Journal
Pathology, 107(3):387-418.
217
217
Fantus, I.J (2002). Pathogenesis of chronic hyperglycaemia: from reductive stress to oxidative stress. Endocrinology, Round, 2, 1. Finaud, J., Lacc, G. and Filaire, G. (2006). Oxidative stress: Relationship with exercise and training. Sports Medicine.36, 4: 327-358. Franke, S., Stein, F., Dawczynski, J., Blum. M., Kubetschka, U., Stein, G. and Stroble, J.J. (2003). Advanced glycation end-products in anterior chamber
aqueous of cataractous patients. Journal of Cataract Refraction Surgery, 29: 392–397 Frankel, E. (1995). Nutritional benefits of flavonoids. International Conference on Food Factors: Chemistry and Cancer Prevention, Hamamatsu, Japan.
Abstracts, C6-2. Fridovich, I. (1989). Superoxide dismutases. An adaptation to a paramagnetic gas. Journal of Biological Chemistry. 264, 7761-7764. Funk, C.D. and Cyrus, T. (2001). 12/15-Lipoxygenase, oxidative modification of LDL and atherogenesis. Trends Cardiovascular Medicine, 11:116-124. Gill, L.S.(1992). Ethnomedicinal uses of plant in Nigeria. Uniben Press, Benin City, pp143. Gragg, G.M. and Newman, D.J. (2001). Medicinals for millennia, Annual New York Academic Science, 953, 3-25. Gorman, R., Schreiber, L. and Kolodziej, H. (2004). Cuticular wax profile of leaves of some traditionally used African Bignoniaceae. Z Naturforsch, 59:
(9-10), 631-635. Gouda, Y.G., Abdel-Baky, A.M., Darwish, F.M., Mohamed, K.M., Kasai, R. and Yamasaki, K. (2003). Iridolds from Kigelia pinnata DC. Fruits.
Phytochemistry, 63(8): 887-892. Grace, O.M., Light, M.E., Lindsey, K.I., Mulholland, D.A., Van Staden, J. and Gagar, A.K. (2002). Antibacterial activity and isolation of active
compounds from fruit of the traditional African medicinal tree Kigelia Africana. South Africa Journal Botany, 68:220-222. Grover, J.K., Vats, V. and Rathi, S.S. (2000). Anti-hyperglycemic effect of Eugenia jambolana and Tinospora cordifolia in experimental diabetes and
their effects on key metabolic enzymes involved in carbohydrate metabolism, Journal of Ethnopharmacol, 73, 461–470. Guoda, Y. G., Abdel Barky, A. M. Mohamed, K. M. Darwish, F. M. Kaai, R. and Yamasaki, K. (2006). Phenylpropanoid and phenyl ethanoid derivatives
from Kigelia Pennata D C Frutis, Natature Product Research, 20 (10): 935 – 939.
218
218
Govondachari, T. R., Patankar S. J. and Visananthan, N. (1971). Isolation and Structure of how new Dihydroisocoumarins from Kigelis Pinnata,
Phytochemistry 10:1603 – 1606. Guigliano. D., Ceriello, A. and Paolisso, G. (1996).Oxidative stress and diabetic vascular complications. Diabetes Care, 19:257-267. Guzik, T.J., Mussa, S., Gastaldi, D., Sadowski, J., Ratnatunga, C., Pillai, R. and Channon, K.M. (2002). Mechanisms of increased vascular superoxide
production in human diabetes mellitus: role of NAD(P)H oxidase and endothelial nitric oxide synthase. Circulation, 105: 1656-1662. Harborne, J.B. (1984). Phytochemical Methods. A Guide to Modern Technology of Plant Analysis. 2nd Edn. Chapman and Hall. New York. pp 88-185. Halliwell, B. (1994). Free radicals, antioxidants and human disease: Cause or consequences? Lancet, 344:721-724. Halliwell, B. and Gutteridge, J.M.C (1999) Antioxidant Defence Enzymes: The glutathion Peroxidase Family. In: Free Radicals in Biology and
Medicine. 3rd Edn. Oxford, UK: Oxford University Press, London. pp 140–146, 170–172. Halliwell, B. and Gutteridge, J.M.C. (2007). Non-Enzymatic Glycation and Glycoxidation in Free Radicals in Biology and Medicine. Oxford University
Press. London. pp.510-514. Hoff, H.F., O’Neil, J., Wu, Z., Hoppe, G. and Solomon, R.L. (2003). Phospholipid hydroxyalkenals: Biological and chemical properties of specific
oxidized lipids presents in atherosclerotic lesions. Arteriosclerosis Thrombosis Vascular Biology, 23: 275-282. Houghton, P.J. (2002). The sausage tree (Kigelia piñata): Ethnobotany and recent scientific work, South Africa Journal Botany, 68: (1), 14-20. Hyun, D. H., Lee, M., Hattori, N., Kubo, S., Mizuno, Y. and Halliwell, B. (2002). Effect of wild-type or mutant Parkin on oxidative damage, nitric oxide,
antioxidant defenses, and the proteasome. Journal Biological Chemistry. 277: 28572–28577. Ido Y. C., Kilo, C., and Williamson, J. R. (1997). Cytosolic NADH/HAD supply, free radicals and vascular dysfunction in early diabetes mellitus.
Diabetologia, 40: (2): S115 – S117.
219
219
Inoguchi, T.P., Li, P., Umeda, H.Y., Yu, M., Kakimoto, M., Imamura, M., Aoki, T., Etoh, T., Hashimoto, M., Naruse, H., Sano, H., Utsumi, H. and Nawata, H. (2000). High glucose level and free fatty acid stimulate reactive oxygen species production through protein kinase C-dependent activities of NAD(P) H oxidase in cultured vascular cells. Diabetes, 49: 1939-1945.
Ishie, H. K., Daisuke and King, G. L. (1998). Protein kinase C activation and its role in the development of vascular complications in diabetes mellitus.
Journal of Molecular Medicine. 76: 21-31. Islam,K.N., Takahashi, M., Higashiyama, S., Myint, T., Uozumin, N., Kosaka, H. and Taniguchi, N. (1995). Fragmentation of ceruloplasmin following non-enzymatic
glycation reaction Journal of Biochemistry. 118: 1054-1059. Jain, S. K. (1989). Hyperglycemia can cause membrane lipid peroxidation and osmotic fragility in human red blood cells. Journal. Biological Chemical.
264: 21340–21345. Jakus, V. (2000). The role Dillenia indica of free radicals, oxidative stress and antioxidant systems in diabetic vascular disease. Bratisl Jorns, A., Munday, R., Tiedge, M. and Lensen, S. (1997). Comparative toxicity of alloxan, N-alkylations and ninhydrin to isolated pancreatic islets in
vitro. Journal Endocrinology, 155:283-293. Kaji, H., Jurasaki, M. and Ito, K. (1985). Increased lipoperoxide value and glutathione peroxidase activity in blood plasma of type 2 (non-
insulindependent) diabetic women. Klin Wochenschr, 63:765-768. Kaneto, H., Xu, G., Song, K.H., Suzuma, K., Bonner-Weir, S., Sharma, A. and Weir, G.C. (2001). Activation of hexomine pathway leads to deterioration
of pancreatic B-cell functions by provoking oxidative stress. Journal of Biological Chemistry, 276: 31099-31104. Keogh, R.J., Dunlop, M.E. and Larkins, R.G. (1997). Effect of inhibition of aldose reductase on glucose flux, diacyglycerol formation, protein Kinase C,
and phospholipase A2 activation. Metabolism, 46: 41-47. Kesavulu, M.M., Giri, R., Kameswara-Rao, B. and Apparao, C. (2000). Lipid peroxidation and antioxidant enzyme levels in type 2 diabetics with
microvascular complications. Diabetes Metabolism 26:387-392. Klotz, L.O. (2002). Oxidant-induced signaling: Effect of peroxynitrate and siglet oxygen, Biological Chemistry, 383:443-456.
220
220
Ko, B.S., Choi, S.B., Park, S.K., Jang, J.S., Kim, Y.E. and Park, S (2005). Insulin sensitizing and inulinotropic action of berberine from Cortidisrhizoma. Biology of Pharmacology Bull, 28 (8):1431-1437.
Kowluru, R.A. (2003). Effect of reinstitution of good glycemic control on retinal oxidative stress and nitrative stress in diabetic rats. Diabetes, 52: 818-
823. Koya, D., Jirousek, M.R., Lin, Y.W., Ishii, H., Kubola, K. and King, G.L. (1997). Characterization of protein kinase C beta isoform activation on the
gene expression of transforming growth factor-beta, extracellular matrix components, and prostanoids in the glomeruli of diabetic rats. Journal of Clinical Investigation, 100:115-126.
Kumar, S. and Kumar, R.D. (2010). Evaluation of antidiabetic activity of Euphorbia hirta Linn in streptozotocin induced diabetic mice. Indian Journal
Nature Product Resources, 1: (2):200-2003. Kumar, S., Kumar, V. and Prakash, O. (2011). Antidiabetic and hypolipidemic activities of Dillenia indica extract in diabetic rats. Zhong Xi Yi Jie HE
Xue Bao. 9(5):570-574. Kumar, S., Malhotra, R. and Kumar, D. (2010). Antidiabetic and free radicals scavenging potentials of Euphorbia hirta flower extract. Indian Journal
Pharmacology Science, 72 : (4):531-533. Kunisaki, M., Burscell, S.E., Clermont, A.C., Ishii, H., Ballas, L.M., Jirousek, M.R., Umeda, F., Naata, H. and King, G.L. (1995). Vitamin E prevents
diabeteis-induced abnormal retinal blood flow via the diacylglycerol-protein kinase pathway. American Journal of Physiology and Endocrinology Metabolism, 269: 239-246.
Kwo, V.T and Craker, I.E. (1996). Screening Cameroon medicinal plants extracts for antimicrobial activity, Acta Hortic, 426:147-155. Langerstroer, P. and Pieper, G.M. (1992). Regulation of spontaneous EARR release in diabetic rat aorta by oxygen free radical. America Journal
Physiology, 263(32): H251-H265. Lee, A.Y. and Chung, S.S. (1999). Contribution of polyol pathway to oxidative stress in diabetic cataract. FASEB Journal, 13: 23-30. Leng, S.H., Lu, F.E and Xu, L.J. (2004). Therapeutic effects of berberine in impaired glucose tolerance rats and its influence on insulin secretion. Acta
Pharmacology Sinic, 25: 496-502.
221
221
Lenzen, S. (2007). Alloxan and streptozotocin diabetes. In: Peschke E (ed) Endokrinologie IIIVorträge im Rahmen des Projektes ‘Zeitstrukturen
endokriner Systeme’. [Endocrinology III lectures within the ‘time structures of endocrine systems’ project framework]. Abhandlung der Sächs. Akad. Wiss., Mathnaturwiss Klasse, Verlag der Sächsischen Akademie der ssenschaften, Leipzig, commissioned by S. Hirzel Verlag, Stuttgart/ Leipzig, pp 119–138.
Lenzen, S., Tiedge, M., Jorns, A. and Munday, R. (1996). Alloxan Derivative as a Tool for the Elucidation Action of Alloxan. In: Shafrir E (Ed.) lessons
from animal diabetes. Birkhauser, Boston. pp 113-122. Li, Y.M., Mitsuhashi, T., Wojciechowi, Z.D., Shimizzu, N., Li, J., Stitt, A., He, C., Banerjee, D. and Vlassara, H. (1996). Protocol Nature Academic
Science, USA, 93: 11047. Lieberman, P.M., Schmidt, M.C., Kao, C.C. and Berk, A. J. (1991).Two distinct domains in the yeast transcription factor IID and evidence for a TATA
box-induced conformational change. Molecular Cell Biology, 11(1):63-74. Lorke, D. (1983). A new approach to practical acute toxicity testing. Acute Toxicity, 54:275-287. Loew, D. and Kaszkin, K. (2002). Approaching the problem of bioequivalence of harbal medicinal products. Phytotherap Research, 16:705-711. Lowry, O.H., Rosebrough, N.J., Farr, A.L. and Randall, R.J. (1951). Protein measurement with the Folin Phenol reagent. Journal of Biochemistry,
193:265-275. Lu, M., Kuroki, M. and Amano, S., Tolentino, M., Keough, K., Kim, I., Bucala, R. and Anthony, P.A. (1998). Advanced glycation end products increase
retinal vascular endothelia growth factor. Journal of Clinical Investigation, 101:129-1224. Lyons, T.J. and Jenkins, A.J. (1997). Glycation, oxidation and lipoxidation in the development of complication in diabetes. Diabetes Review, 5: 365-391. Lyons, T.J. (1991). Oxidized low density lipoproteins: A role in the pathogenesis of therosclerosis in diabetes. Diabetes Medicine, 8: 411– 419. Maisiri, M., and Gundidza, M. (1999). The effects of crude extracts of Kigelia africana and Aloe excelsa on deep wound healing, University of
Zimbabwe, Harare, Department of Pharmacy, pp.91-94.
222
222
Mark, V. and Dawson, A. (1965). Rapid stick method for determining blood glucose concentration.British Medical Journal, 1:25-29. Maria, M., Maria, G., Corina, M., Carmend, D. and Alexandra, T. (2007). The sources and the targets of oxidative stress in the etiology of diabetic
complications, Romanian Journal Biophysis, 17 : (2): 6-7. Maritim, A.C., Sanders, R.A. and Watkins, J.B. (2003). Diabetes, oxidative stress, and antioxidants: A review. Journal of Biochemical Molecular
Toxicology, 17:24-38. Marneth, L.J. (2002). Oxyradicals, lipid peroxidation and DNA damage. Toxicology, 181-182: 219-222. Masella, R., Di Benedeto, R., Vari, R., Filesi, C. and Giovannini, C. (2005). Novel mechanisms of natural antioxidant compounds in biological system:
involvement of glutathione and glutathione related enzymes. Journal of Nutritional Biochemistry, 16: 577-586. Masutani M, Suzuki H. and Kamada N, (1999). Poly(ADP-ribose) polymerase gene disruption conferred mice resistant to streptozotocininduced diabetes.
Proc Nature Academic Science, U S A 96:2301–2304 Matkovics, B., Varga, S .I. Szabó, L. and Witas, H. (1982). The effect of diabetes on the activities of the peroxide metabolic enzymes. Hormonal
Metabolic Research, 14:77-79. Maruthupandian, A. and Mohan, V.R. (2011). Antidiabetic, antihyperlipidemic and antioxidant activity of Pterocarpus marsupium Roxb in alloxan-
induced diabetic rats. International Journal Pharmacology Technology Research, 3(3): 1681-1687. McGarry, J.D. and Dobbis, R.L. (1999). Fatty acid lipotoxicity and insulin secretion, Diabetologia, 42: 128-138 Mehta, J.L., Raslouli, N., Sinha, A.K. and Molavi, B. (2006). Oxidative stress in diabetes: A mechanistic overview of its effects on atherogenesis and
myocardial dysfunction. International Journal of Biochemistry Cell Biology, 38: 794-803. Mendez, J.I., Nicholson, W.J. and Taylor, W.R. (2006). SOD isoforms and signaling in blood vessels: Evidence for the importance of ROS
compartmentalization, Arterioscler. Thromb. Vascular Biology, 25: 887-888. Mohora, M., Virgolici, B., Paveliu, F., Lixandru, D., Muscurel, C. and Greabu, M. (2006). Free radical activity in obese patients with type 2 diabetes
mellitus, Roman Journal International Medicine, 1: 69-78.
223
223
Mooradian, A.D. (1999). Glycotoxicity: Potential mechanisms: Clinical Geriatr Medicine, 15:225. Monnier, V. M. (2001). Transition metals redox: Reviving an old plot for diabetic vascular disease, Journal Clinical Investigation, 107:799 – 801. Muchova, J., Sustrova, M., Garaiova, I., Liptakova, A., Blazicek, P. and Kvasnicka, P.Z. (2001). Influence of age on activities of antioxidant enzymes
and lipid peroxidation products in erythrocytes and neutrophiles of Down syndrome patients. Free Radical Biological Medicine, 31: 499-508. Murata, M., Takahashi, A., Saito, I. and Kawanishi, S. (1999). Sitespecific DNA methylation and apoptosis: Induction by diabetogenic streptozotocin.
Biochemical Pharmacology, 57:881–887. Natarajan, R. and Nadler, J.L. (2003). Lipoxygenase and lipid signaling in vascular cell in diabetes. Front Bioscience, 8: S783-S795. Nathan, D. M. (1998). Some answers more controversy from United Kingdom Prospective study. Lancet 352: 832 – 833. Nishikawa, T., Edelstein, D., Du, X. L., Yamagishi, S., Matsumura, T and Kaneda, Y. (2000) Normalizing mitochondrial superoxide production blocks
three pathways of hyperglycaemic damage. Nature, 404: 787–790. Nourooz-Zadeh, J., Rahimi, A. and TaJaddini-Sarmadi, J. (1997).Relationships between plasma measures of oxidative stress and metabolic control in
NIDDM, Diabetologia, 40: 647–653. Oberley, L.W. (1988). Free radicals and diabetes. Free Radical Biological Medicine, 5:113–124 Oliver-Bever, B. (1986). Medicinal plants in tropical West Africa, Cambridge University Press: Cambridge, London, New York. New Rochelle,
Melbourne, Sydney. pp.240-245. Paglia, D. E. and Valentine, W. N. (1967). Determination of glutathione peroxidase. Journal of Laboratory and Clinical Medicine. 70: 158–161. Palmer, R.M.J., Ashton, D.S. and Moncada, S. (1988). Vascular endothelium cell synthesizes nitric oxide from L-arginine. Nature, 333: 664-666. Paolino, A.S. and Garner, K.M. (2005). Effects of hyperglycemia on neurologic outcome in stroke patients. Journal of Neuroscience Nursing, 37:
(3),130-135.
224
224
Pastore, A., Federici, G., Bertini, E. and Piemonte, F. (2003). Analysis of glutathione implication in redox and detoxification, Clinical Chemistry Acta, 333: 19-39.
Peschke, E., Ebelt, H., Bromme, H.J. and Peschke, D. (2000). “Classical” and “New” diabetogens- comparison of their effect on isolated rat pancreatic
islets in vitro. Cell Molecule Life Science, 57: 158-164. Pieper, A.A, Verma A., Zhang J. and Snyder, S.H (1999). Poly (ADPribose) polymerase, nitric oxide and cell death. Trends Pharmacology Science,
20:171–181. Pratico, D. (1999). F(2)-isoprostanes: Sensitive and specific non-invasive indices of lipid peroxidation in vivo. Atherosclerosis, 147: 1–10. Pratico, D., Basili, S., Vieri, M., Cordova, C., Violi, F. and Fitzgerald, G. A. (1998) Chronic obstructive pulmonary disease is associated with an increase
in urinary levels of isoprostane F2alpha-III, an index of oxidant stress. American Journal Respiration Critical Care Medicine. 158: 1709–1714. Pooley, E. (1993). The Complete Guide to Trees of Natal, Zululand and Transkei, Natal Flora Publications Trust. pp.22-24. Ramachandran, V., Mandal, D., Payyavala, U., Sagai, P.D., Muthureddy, N.S. and Shanish, A. (2011). Hypoglycemic activity of Asparagus racemosus
on streptozotocin-induced diabetic in rats. Advanced Applied Science Research, 2(3):179-185. Ravi, K., Ramchandran, B. and Subramanian, S. (2004). Effect of Eugenian jambolana seed kernel on antioxidant defense system in streptozotocin-
induced diabetic rats. Life Science, 75:2717-2731. Robertson, R, P., Harmon, J., Tran, P.O., Tanaka, Y. and Takahashi, H. (2003). Glucose toxicity in beta-cells: Type 2 diabetes, good radicals gone badly,
and the glutathione connection. Diabetes, 52: 581-587. Roberts, L. J. and Morrow, J. D. (2000) Measurement of F(2)-isoprostanes as an index of oxidative stress in vivo. Free Radical Biological Medical, 28:
505–513. Saini, S., Kaur, Verma, B, Ripudaman, and Singh, S.K. (2009). Kigelia africana Lam. (Benth.) – An Overview. Natural Product Radiance, 8: (2):190-
197.
225
225
Schalkwijk, C.G. and Stehouwer, C.D.(2005) Vascular complications in diabetes mellitus: the role of oxidative stress of endothelial dysfunction. Clinical Science (Lond) 109, (2):143-159.
Schein, P.S., Cooney, D.A. and Vernon, M.L (1967). The use of nicotinamide to modify the toxicity of streptozotocin diabetes without loss of antitumor.
Cancer Research, 27:2324-2332. Schnedl, W.J., Ferber S., Johnson, J.H. and Newgard, C.B. (1994). STZ transport and cytotoxicity. Specific enhancement in GLUT2- expressing cells.
Diabetes, 43:1326–1333. Sekero, M.R., Sahin, H., Dülger, H. and Algün, E. (2000). The effect of dietary treatment on erythrocyte lipid peroxidation, superoxide dismutase,
glutathione peroxidase, and serum lipid peroxidation in patients with type 2 diabetes mellitus. Clinical Biochemistry, 33: 669-674. Semenkovich, C. F. and Heinecke, J. W. (1997). The mystery of diabetes and artherosclerosis: Time for a New Plot. Diabetes, 49:327-334 Sharma, K. and Ziyadeh, F. N. (1997). Biochemical events and cytokine interactions linking glucose metabolism to development of diabetic nephropathy.
Seminar Nephrology, 17: 80 – 92. Sheetz, M. J. and King, G. L. (2002) Molecular understanding of hyperglycemia’s adverse effects for diabetic complications. JAMA. 288: 2579–2588. Shephered, J. (2005). Does statin monotherapy address the multiple lipid abnormalities in Type 2 diabetes? Atherosclerosis Supplementary, 6:15-19. Shirwaikar, A., Rajendra, B and Barik, R. (2006). Effect of aqueous bark extract of Garuga pinnata Roxb in Streptozotocin – nicotinamide induced type
II diabetes. Journal of Ethnopharmacology, 107:285-290. Shirwaikar, A., Rajendran, K., Kumar, C.D. and Bodla, R. (2004). Antidiabetic activity of aqeous leaf extract of Annona squamosa in streptozotocin –
nicotinamide type 2 diabetic rats. Journal Ethopharcology. 91(1):171-176. Sies, H., Stahl, W. and Sevanian, A. (2005). Nutritonal, dietary and post-prandal oxidative stress. Journal of Nutrition, 135:962-972. Siyem, D., Syngai, G., Khup, P.Z., Khongwir, B.S., Kharbuli, B. and Kayang, H. (2002). Hypogyceamic effects of Potentilla fulgens L. in normal and
alloxan diabetic mice. Journal Ethnophymarcology, 83:55-61.
226
226
Slatter, D.A., Bolton, C.H. and Bailey, A.J. (2002). The importance lipid-derived melondialdehyde in diabetes mellitus. Diabetologia, 43: 550-557. Sofowora, A. (1980). The presnt status of knowledge of the plants used in traditional medicine used in West African: A medical approach and chemical
evaluation, Journal of Ethnopharmacology, 2:109-118. Stanely, P., Prince, M. and Menon, V.P. (2000). Hypoglycaemic and other related action of Tinosporacordifolia roots in alloxan-induced diabetic rats.
Journal Ethnopharmacology, 70(1):9-15. Stem, D. M., Yan S. D., Yan, S. F. and Schmidt, A. M (2002). Receptor for advanced glycation end products. (RAGE) and the complications of
diabetes. Ageing Research Review, 1: 1 – 15. Stephens, J.W., Gable, D.R., Hurels, S.J., Miller, G.J., Cooper, J.A. and Humphries, S.E. (2006). Increased plasma markers of oxidative stress are
associated with coronary heart disease in males with diabetes mellitus and with 10-year risk in a prospective sample of males. Clinical Chemistry, 52:446-452.
Studer, R.K., Craven, P.A. and Derubertis, F.R. (1993). Role for protein kinase C in the mediation of increased fibrorectin accumulation by mesangial
cells grown in high- glucose medium, Diabetes, 42: 118-126. Subbannagounder, G., Wong J.W., Lee, H., Faull. K.F., Miller, E. and Witztuma, J.L. (2002). Epoxyisoprotane and epoxyclopentenone phospholipi ds
regulate monocytes chemostatic protein-and interleukin 8 synthesis formation of these oxidized phospholipids in response to interleukin-beta. Journal Biochemistry, 227: 7271-7281.
Suba,V., Murrugesan, T., Bhaskara, R.R., Ghosh, L.,Pal, M., Subhash, C., Mandal, S.C. and Saha, B.P. (2004). Antidiabetic potential of Barterialupulina
extract in rats. Fitoterapia, 7:1-4. Sulochana, K.N., Ramakrishnan, S., Rajesh, M., Coral, K. and Badrinath, S.S. (2001). Diabetic retinopathy: Molecular mechanisms, present regime of
treatment and future perspectives. Current Science, 80: 133-142. Sundaram, R.K., Bhaskar, A. and Vijayalingam, S. (1996). Antioxidant status and lipid peroxidation in type II diabetes mellitus with and without
complications. Clinical Science (Lond), 90:255-260.
227
227
Taniyama, Y.K. and Griendling, K.K. (2003). Reactive oxygen species in the vasculature: Molecular and cellular mechanism. Hypertension, 42: 1075-1081.
Testamarian, B. and Cohen, R.A. (1992). Free radical mediate endothelial cell dysfunction caused by elevated glucose. America Journal Physiology, 263
(32): 321-326. Tiedge, M., Lortz, S., Drinkgerm, J. and Lenzen, S. (1997). Relation between antioxidant enzyme gene expression and antioxidant defense system status
of insulin producing cells. Diaebetes, 46:1733-1742. Ting, H.H., Timimi, F.K., Boles, K.S. and Creager, S.J. (1996). Vitamin C improves endothelial cell dependent vasodilatation in patient with non-insulin
dependent diabetes mellitus. Journal of Clinical Investigation, 97(1): 22-28. Thornalley, P.J. (1998). Cell activation by glycaeted proteins AGE receptors, receptor recognition factors and functional recognition factors and
functional classification of AGEs. Cell Molecular Biology, 44: 1013-1023. Torres, M.D., Canal, J.R. and Perez, C. (1999).Oxidative stress in normal and diabetic rats. Physiology Research. 48:203-208. Traverso, N., Menini, S., Odetti, P., Pronzato, M.A., Cottalasso, D. and Marinari, U.M. (2002). Diabetes impairs the enzymatic disposal of 4-
hydroxynonenal in rat liver. Free Radical Biological Medicine, 32: 350-359. Trivelli, L.A., Ronny, P.H. and Lai, H.T.(1971).Hemoglobin components in patients with diabetes mellitus. New England Journal of Medicine, 284:353-
357. Tsilibary, E.C., Koliakos, G.G., Charonis, A.S., Vogel, A.M., Reger, L.A. and Furcht, L.T. (1988). Inhibition of laminin self-assembly and interaction.
Journal of Biochemistry, 263: 19112. Tushuizen, M.E., Diamant, M. and Heine, R.J. (2005). Postprandial dysmetabolism and cardiovascular disease in type 2 diabetes. Postgraduate Medical
Journal, 81: 1-6. Tuma, D.J. (2002). Role of malondialdehyde-acetaldehyde adducts in liver injury. Free Radical Biological Medicine, 32: 303-308. Turk, Z. (2001). Glycation and complications of diabetes. Diabetologia Croatica, 30:49-54.
228
228
Valko, M.D., Leibfritz, J., Moncola, T.D., Mark, M.T.D., Cronin, M., Mazura J. and Telser, J. (2007). Free radicals and antioxidant in normal
physiological functions and human disease. International Journal of Biochemistry & Cell Biology, 39: 44-84. Varvaroska, J., Racek, J. and Statins, R. (2004). Aspect of oxidative stress in children with type 1 diabetes mellitus, Biomedical Pharmacother, 58: 539-
545. Venkateshwarlu, E., Reddy, A.N, Sunder, A.S Kiram, G., Rao, V.J. and Madhusudhan, S. (2009). Anti-hyperglycemic activity of methanolic extract of
Salaciafruticosa leaves in alloxan-induced diabeticrats. Drug Invention Today, (1)2:95-97. Vinay, R.P., Prakash, R.P. and Sushil, S.K (2010). Antioxidant activity of some selected medicinal plants in western region of India. Advanced
Biological Rsearch, 4 (1):23-26. Vincent, A.M., Johnstone, T., Horton E. and Veves, A. (2004). Oxidative stress in the pathogenesis of diabetic neuropathy, Endocrine Review, 23: 612-
616. Walt, J. M. and Breyer-Badik, M.G. (1962). The medicinal and poisonous plants of Southern and Esthern African, Living stone, London.P.52. Wallin, B., Rosengren, B., Shertzer, H.G and Cameo, G. (1990). Lipoproien oxidation and measurement of thiobarbituric acid reactive substances
formation in a single microtitre plate. Its use foe evaluation of antioxidants. Annual Biochemistry, 208:10-15. West, I. C. (2002). Glucose 6-phosphate dehydrogenase: A candidate for diabetes. Diabetes Medicine, 19: 172 – 174. West, I.C. (2000). Radicals and oxidative stress in diabetes. Diabetic Medicine, 17: 170-180. Winterbourn, C.C. and Munday, R. (1989). Glutathione-mediated redox cycling of alloxan. Mechanisms of superoxide dismutase inhibition and of metal-
catalyzed OH formation. Biochemical Pharmacology, 38:271–277. Wolff, S.P. (1993). Diabetes mellitus and free radicals, Br Medical Bull, 49: 642-652. Yamagishi, S.I., Eldestein, D., Du, X.L. and Brownlee, M. (2001). Effect of in vitro glycation of human placental collagen (Type IV) on aggregation.
Diabetes, 50: 1491
229
229
Yamagisha, S., Fujimori, H., Yonekura, H., Yamamoto, Y. and Yamamoto, H. (1998). The AGE-RAGE system and diabetic nephropathy. Diabetologia,
41:1435 – 1441 Yim, M.B., Yim, H.S., Lee, C., Kang, S.O. and Chock, P.B. (2002). Protein glycation creation of catalytic sites for free radical generation. Annual New
York Academic Science, 928: 48-53.
APPENDICES
Appendix I
Descriptives
N Mean Std. Deviation Std. Error
95% Confidence Interval for Mean
Minimum Maximum Lower Bound Upper Bound
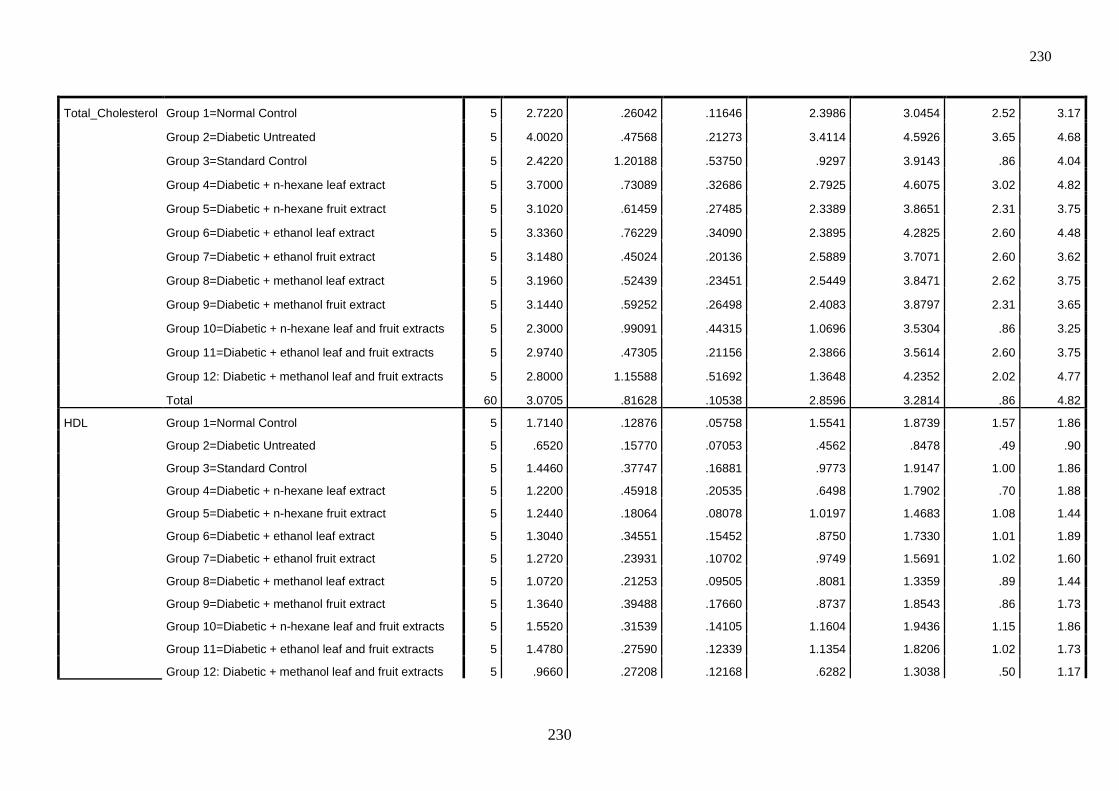
230
230
Total_Cholesterol Group 1=Normal Control 5 2.7220 .26042 .11646 2.3986 3.0454 2.52 3.17
Group 2=Diabetic Untreated 5 4.0020 .47568 .21273 3.4114 4.5926 3.65 4.68
Group 3=Standard Control 5 2.4220 1.20188 .53750 .9297 3.9143 .86 4.04
Group 4=Diabetic + n-hexane leaf extract 5 3.7000 .73089 .32686 2.7925 4.6075 3.02 4.82
Group 5=Diabetic + n-hexane fruit extract 5 3.1020 .61459 .27485 2.3389 3.8651 2.31 3.75
Group 6=Diabetic + ethanol leaf extract 5 3.3360 .76229 .34090 2.3895 4.2825 2.60 4.48
Group 7=Diabetic + ethanol fruit extract 5 3.1480 .45024 .20136 2.5889 3.7071 2.60 3.62
Group 8=Diabetic + methanol leaf extract 5 3.1960 .52439 .23451 2.5449 3.8471 2.62 3.75
Group 9=Diabetic + methanol fruit extract 5 3.1440 .59252 .26498 2.4083 3.8797 2.31 3.65
Group 10=Diabetic + n-hexane leaf and fruit extracts 5 2.3000 .99091 .44315 1.0696 3.5304 .86 3.25
Group 11=Diabetic + ethanol leaf and fruit extracts 5 2.9740 .47305 .21156 2.3866 3.5614 2.60 3.75
Group 12: Diabetic + methanol leaf and fruit extracts 5 2.8000 1.15588 .51692 1.3648 4.2352 2.02 4.77
Total 60 3.0705 .81628 .10538 2.8596 3.2814 .86 4.82
HDL Group 1=Normal Control 5 1.7140 .12876 .05758 1.5541 1.8739 1.57 1.86
Group 2=Diabetic Untreated 5 .6520 .15770 .07053 .4562 .8478 .49 .90
Group 3=Standard Control 5 1.4460 .37747 .16881 .9773 1.9147 1.00 1.86
Group 4=Diabetic + n-hexane leaf extract 5 1.2200 .45918 .20535 .6498 1.7902 .70 1.88
Group 5=Diabetic + n-hexane fruit extract 5 1.2440 .18064 .08078 1.0197 1.4683 1.08 1.44
Group 6=Diabetic + ethanol leaf extract 5 1.3040 .34551 .15452 .8750 1.7330 1.01 1.89
Group 7=Diabetic + ethanol fruit extract 5 1.2720 .23931 .10702 .9749 1.5691 1.02 1.60
Group 8=Diabetic + methanol leaf extract 5 1.0720 .21253 .09505 .8081 1.3359 .89 1.44
Group 9=Diabetic + methanol fruit extract 5 1.3640 .39488 .17660 .8737 1.8543 .86 1.73
Group 10=Diabetic + n-hexane leaf and fruit extracts 5 1.5520 .31539 .14105 1.1604 1.9436 1.15 1.86
Group 11=Diabetic + ethanol leaf and fruit extracts 5 1.4780 .27590 .12339 1.1354 1.8206 1.02 1.73
Group 12: Diabetic + methanol leaf and fruit extracts 5 .9660 .27208 .12168 .6282 1.3038 .50 1.17
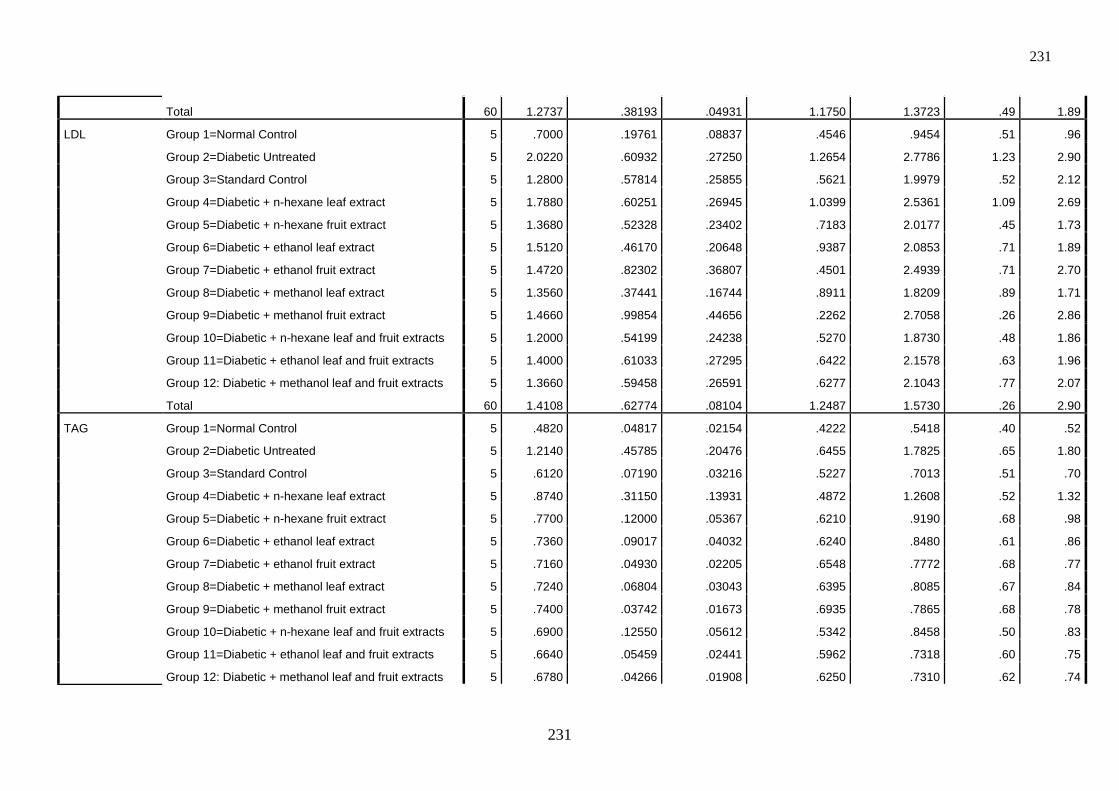
231
231
Total 60 1.2737 .38193 .04931 1.1750 1.3723 .49 1.89
LDL Group 1=Normal Control 5 .7000 .19761 .08837 .4546 .9454 .51 .96
Group 2=Diabetic Untreated 5 2.0220 .60932 .27250 1.2654 2.7786 1.23 2.90
Group 3=Standard Control 5 1.2800 .57814 .25855 .5621 1.9979 .52 2.12
Group 4=Diabetic + n-hexane leaf extract 5 1.7880 .60251 .26945 1.0399 2.5361 1.09 2.69
Group 5=Diabetic + n-hexane fruit extract 5 1.3680 .52328 .23402 .7183 2.0177 .45 1.73
Group 6=Diabetic + ethanol leaf extract 5 1.5120 .46170 .20648 .9387 2.0853 .71 1.89
Group 7=Diabetic + ethanol fruit extract 5 1.4720 .82302 .36807 .4501 2.4939 .71 2.70
Group 8=Diabetic + methanol leaf extract 5 1.3560 .37441 .16744 .8911 1.8209 .89 1.71
Group 9=Diabetic + methanol fruit extract 5 1.4660 .99854 .44656 .2262 2.7058 .26 2.86
Group 10=Diabetic + n-hexane leaf and fruit extracts 5 1.2000 .54199 .24238 .5270 1.8730 .48 1.86
Group 11=Diabetic + ethanol leaf and fruit extracts 5 1.4000 .61033 .27295 .6422 2.1578 .63 1.96
Group 12: Diabetic + methanol leaf and fruit extracts 5 1.3660 .59458 .26591 .6277 2.1043 .77 2.07
Total 60 1.4108 .62774 .08104 1.2487 1.5730 .26 2.90
TAG Group 1=Normal Control 5 .4820 .04817 .02154 .4222 .5418 .40 .52
Group 2=Diabetic Untreated 5 1.2140 .45785 .20476 .6455 1.7825 .65 1.80
Group 3=Standard Control 5 .6120 .07190 .03216 .5227 .7013 .51 .70
Group 4=Diabetic + n-hexane leaf extract 5 .8740 .31150 .13931 .4872 1.2608 .52 1.32
Group 5=Diabetic + n-hexane fruit extract 5 .7700 .12000 .05367 .6210 .9190 .68 .98
Group 6=Diabetic + ethanol leaf extract 5 .7360 .09017 .04032 .6240 .8480 .61 .86
Group 7=Diabetic + ethanol fruit extract 5 .7160 .04930 .02205 .6548 .7772 .68 .77
Group 8=Diabetic + methanol leaf extract 5 .7240 .06804 .03043 .6395 .8085 .67 .84
Group 9=Diabetic + methanol fruit extract 5 .7400 .03742 .01673 .6935 .7865 .68 .78
Group 10=Diabetic + n-hexane leaf and fruit extracts 5 .6900 .12550 .05612 .5342 .8458 .50 .83
Group 11=Diabetic + ethanol leaf and fruit extracts 5 .6640 .05459 .02441 .5962 .7318 .60 .75
Group 12: Diabetic + methanol leaf and fruit extracts 5 .6780 .04266 .01908 .6250 .7310 .62 .74
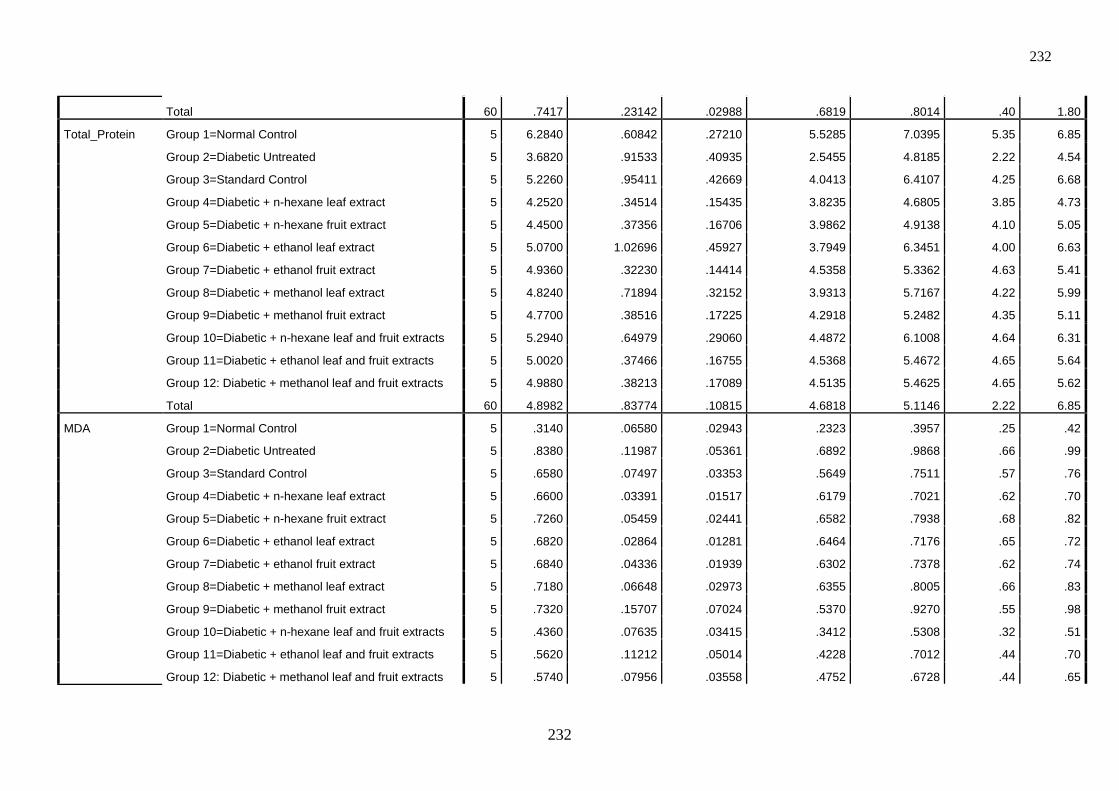
232
232
Total 60 .7417 .23142 .02988 .6819 .8014 .40 1.80
Total_Protein Group 1=Normal Control 5 6.2840 .60842 .27210 5.5285 7.0395 5.35 6.85
Group 2=Diabetic Untreated 5 3.6820 .91533 .40935 2.5455 4.8185 2.22 4.54
Group 3=Standard Control 5 5.2260 .95411 .42669 4.0413 6.4107 4.25 6.68
Group 4=Diabetic + n-hexane leaf extract 5 4.2520 .34514 .15435 3.8235 4.6805 3.85 4.73
Group 5=Diabetic + n-hexane fruit extract 5 4.4500 .37356 .16706 3.9862 4.9138 4.10 5.05
Group 6=Diabetic + ethanol leaf extract 5 5.0700 1.02696 .45927 3.7949 6.3451 4.00 6.63
Group 7=Diabetic + ethanol fruit extract 5 4.9360 .32230 .14414 4.5358 5.3362 4.63 5.41
Group 8=Diabetic + methanol leaf extract 5 4.8240 .71894 .32152 3.9313 5.7167 4.22 5.99
Group 9=Diabetic + methanol fruit extract 5 4.7700 .38516 .17225 4.2918 5.2482 4.35 5.11
Group 10=Diabetic + n-hexane leaf and fruit extracts 5 5.2940 .64979 .29060 4.4872 6.1008 4.64 6.31
Group 11=Diabetic + ethanol leaf and fruit extracts 5 5.0020 .37466 .16755 4.5368 5.4672 4.65 5.64
Group 12: Diabetic + methanol leaf and fruit extracts 5 4.9880 .38213 .17089 4.5135 5.4625 4.65 5.62
Total 60 4.8982 .83774 .10815 4.6818 5.1146 2.22 6.85
MDA Group 1=Normal Control 5 .3140 .06580 .02943 .2323 .3957 .25 .42
Group 2=Diabetic Untreated 5 .8380 .11987 .05361 .6892 .9868 .66 .99
Group 3=Standard Control 5 .6580 .07497 .03353 .5649 .7511 .57 .76
Group 4=Diabetic + n-hexane leaf extract 5 .6600 .03391 .01517 .6179 .7021 .62 .70
Group 5=Diabetic + n-hexane fruit extract 5 .7260 .05459 .02441 .6582 .7938 .68 .82
Group 6=Diabetic + ethanol leaf extract 5 .6820 .02864 .01281 .6464 .7176 .65 .72
Group 7=Diabetic + ethanol fruit extract 5 .6840 .04336 .01939 .6302 .7378 .62 .74
Group 8=Diabetic + methanol leaf extract 5 .7180 .06648 .02973 .6355 .8005 .66 .83
Group 9=Diabetic + methanol fruit extract 5 .7320 .15707 .07024 .5370 .9270 .55 .98
Group 10=Diabetic + n-hexane leaf and fruit extracts 5 .4360 .07635 .03415 .3412 .5308 .32 .51
Group 11=Diabetic + ethanol leaf and fruit extracts 5 .5620 .11212 .05014 .4228 .7012 .44 .70
Group 12: Diabetic + methanol leaf and fruit extracts 5 .5740 .07956 .03558 .4752 .6728 .44 .65
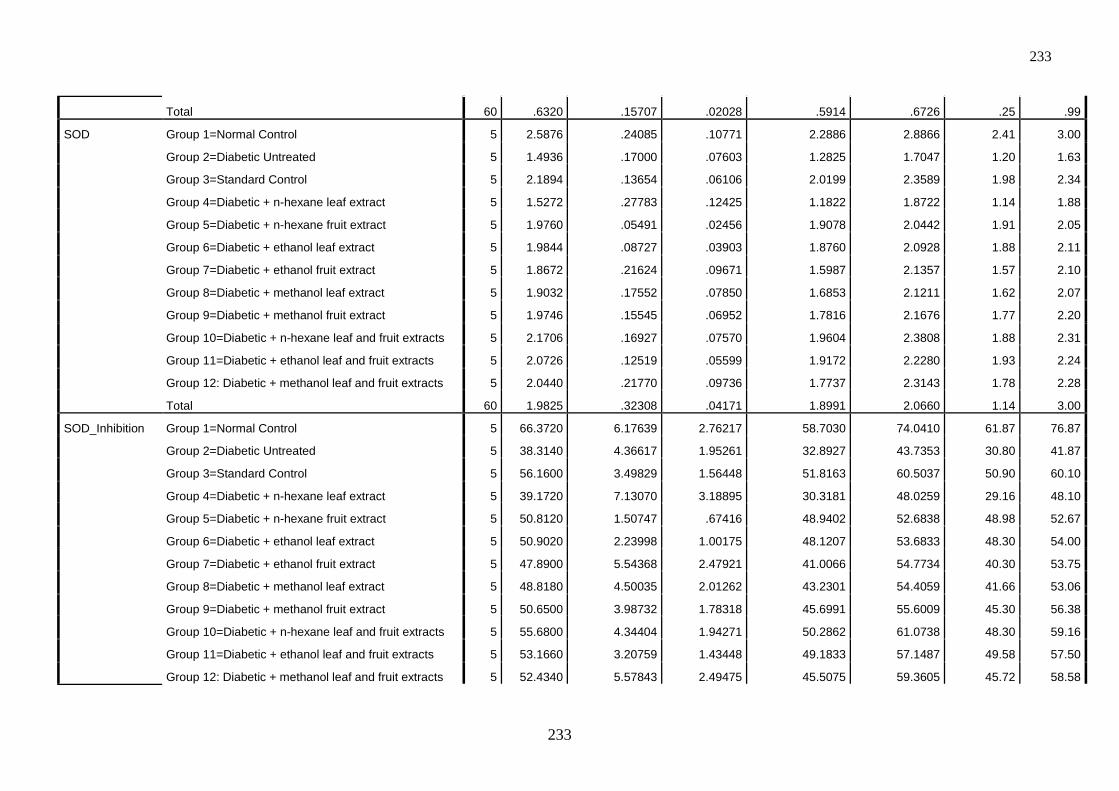
233
233
Total 60 .6320 .15707 .02028 .5914 .6726 .25 .99
SOD Group 1=Normal Control 5 2.5876 .24085 .10771 2.2886 2.8866 2.41 3.00
Group 2=Diabetic Untreated 5 1.4936 .17000 .07603 1.2825 1.7047 1.20 1.63
Group 3=Standard Control 5 2.1894 .13654 .06106 2.0199 2.3589 1.98 2.34
Group 4=Diabetic + n-hexane leaf extract 5 1.5272 .27783 .12425 1.1822 1.8722 1.14 1.88
Group 5=Diabetic + n-hexane fruit extract 5 1.9760 .05491 .02456 1.9078 2.0442 1.91 2.05
Group 6=Diabetic + ethanol leaf extract 5 1.9844 .08727 .03903 1.8760 2.0928 1.88 2.11
Group 7=Diabetic + ethanol fruit extract 5 1.8672 .21624 .09671 1.5987 2.1357 1.57 2.10
Group 8=Diabetic + methanol leaf extract 5 1.9032 .17552 .07850 1.6853 2.1211 1.62 2.07
Group 9=Diabetic + methanol fruit extract 5 1.9746 .15545 .06952 1.7816 2.1676 1.77 2.20
Group 10=Diabetic + n-hexane leaf and fruit extracts 5 2.1706 .16927 .07570 1.9604 2.3808 1.88 2.31
Group 11=Diabetic + ethanol leaf and fruit extracts 5 2.0726 .12519 .05599 1.9172 2.2280 1.93 2.24
Group 12: Diabetic + methanol leaf and fruit extracts 5 2.0440 .21770 .09736 1.7737 2.3143 1.78 2.28
Total 60 1.9825 .32308 .04171 1.8991 2.0660 1.14 3.00
SOD_Inhibition Group 1=Normal Control 5 66.3720 6.17639 2.76217 58.7030 74.0410 61.87 76.87
Group 2=Diabetic Untreated 5 38.3140 4.36617 1.95261 32.8927 43.7353 30.80 41.87
Group 3=Standard Control 5 56.1600 3.49829 1.56448 51.8163 60.5037 50.90 60.10
Group 4=Diabetic + n-hexane leaf extract 5 39.1720 7.13070 3.18895 30.3181 48.0259 29.16 48.10
Group 5=Diabetic + n-hexane fruit extract 5 50.8120 1.50747 .67416 48.9402 52.6838 48.98 52.67
Group 6=Diabetic + ethanol leaf extract 5 50.9020 2.23998 1.00175 48.1207 53.6833 48.30 54.00
Group 7=Diabetic + ethanol fruit extract 5 47.8900 5.54368 2.47921 41.0066 54.7734 40.30 53.75
Group 8=Diabetic + methanol leaf extract 5 48.8180 4.50035 2.01262 43.2301 54.4059 41.66 53.06
Group 9=Diabetic + methanol fruit extract 5 50.6500 3.98732 1.78318 45.6991 55.6009 45.30 56.38
Group 10=Diabetic + n-hexane leaf and fruit extracts 5 55.6800 4.34404 1.94271 50.2862 61.0738 48.30 59.16
Group 11=Diabetic + ethanol leaf and fruit extracts 5 53.1660 3.20759 1.43448 49.1833 57.1487 49.58 57.50
Group 12: Diabetic + methanol leaf and fruit extracts 5 52.4340 5.57843 2.49475 45.5075 59.3605 45.72 58.58
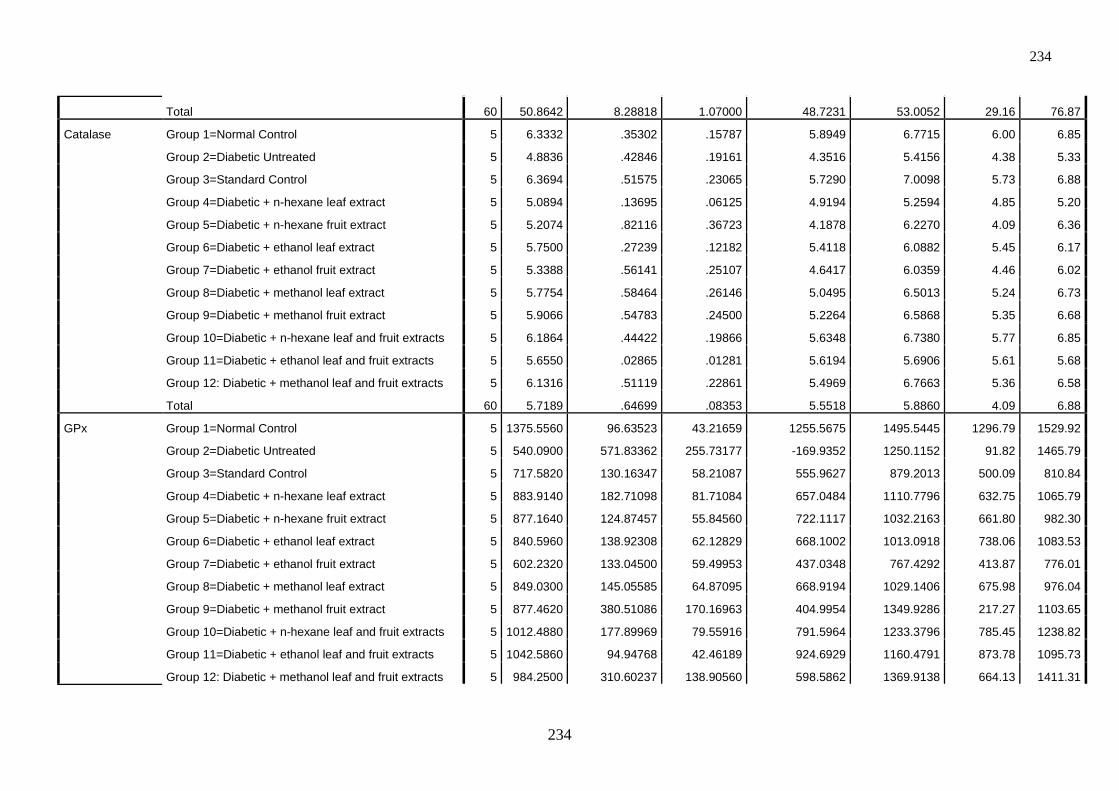
234
234
Total 60 50.8642 8.28818 1.07000 48.7231 53.0052 29.16 76.87
Catalase Group 1=Normal Control 5 6.3332 .35302 .15787 5.8949 6.7715 6.00 6.85
Group 2=Diabetic Untreated 5 4.8836 .42846 .19161 4.3516 5.4156 4.38 5.33
Group 3=Standard Control 5 6.3694 .51575 .23065 5.7290 7.0098 5.73 6.88
Group 4=Diabetic + n-hexane leaf extract 5 5.0894 .13695 .06125 4.9194 5.2594 4.85 5.20
Group 5=Diabetic + n-hexane fruit extract 5 5.2074 .82116 .36723 4.1878 6.2270 4.09 6.36
Group 6=Diabetic + ethanol leaf extract 5 5.7500 .27239 .12182 5.4118 6.0882 5.45 6.17
Group 7=Diabetic + ethanol fruit extract 5 5.3388 .56141 .25107 4.6417 6.0359 4.46 6.02
Group 8=Diabetic + methanol leaf extract 5 5.7754 .58464 .26146 5.0495 6.5013 5.24 6.73
Group 9=Diabetic + methanol fruit extract 5 5.9066 .54783 .24500 5.2264 6.5868 5.35 6.68
Group 10=Diabetic + n-hexane leaf and fruit extracts 5 6.1864 .44422 .19866 5.6348 6.7380 5.77 6.85
Group 11=Diabetic + ethanol leaf and fruit extracts 5 5.6550 .02865 .01281 5.6194 5.6906 5.61 5.68
Group 12: Diabetic + methanol leaf and fruit extracts 5 6.1316 .51119 .22861 5.4969 6.7663 5.36 6.58
Total 60 5.7189 .64699 .08353 5.5518 5.8860 4.09 6.88
GPx Group 1=Normal Control 5 1375.5560 96.63523 43.21659 1255.5675 1495.5445 1296.79 1529.92
Group 2=Diabetic Untreated 5 540.0900 571.83362 255.73177 -169.9352 1250.1152 91.82 1465.79
Group 3=Standard Control 5 717.5820 130.16347 58.21087 555.9627 879.2013 500.09 810.84
Group 4=Diabetic + n-hexane leaf extract 5 883.9140 182.71098 81.71084 657.0484 1110.7796 632.75 1065.79
Group 5=Diabetic + n-hexane fruit extract 5 877.1640 124.87457 55.84560 722.1117 1032.2163 661.80 982.30
Group 6=Diabetic + ethanol leaf extract 5 840.5960 138.92308 62.12829 668.1002 1013.0918 738.06 1083.53
Group 7=Diabetic + ethanol fruit extract 5 602.2320 133.04500 59.49953 437.0348 767.4292 413.87 776.01
Group 8=Diabetic + methanol leaf extract 5 849.0300 145.05585 64.87095 668.9194 1029.1406 675.98 976.04
Group 9=Diabetic + methanol fruit extract 5 877.4620 380.51086 170.16963 404.9954 1349.9286 217.27 1103.65
Group 10=Diabetic + n-hexane leaf and fruit extracts 5 1012.4880 177.89969 79.55916 791.5964 1233.3796 785.45 1238.82
Group 11=Diabetic + ethanol leaf and fruit extracts 5 1042.5860 94.94768 42.46189 924.6929 1160.4791 873.78 1095.73
Group 12: Diabetic + methanol leaf and fruit extracts 5 984.2500 310.60237 138.90560 598.5862 1369.9138 664.13 1411.31

235
235
Total 60 883.5792 307.48676 39.69637 804.1469 963.0114 91.82 1529.92
ALT Group 1=Normal Control 5 18.4000 2.30217 1.02956 15.5415 21.2585 16.00 22.00
Group 2=Diabetic Untreated 5 34.6000 4.97996 2.22711 28.4166 40.7834 30.00 40.00
Group 3=Standard Control 5 21.6000 2.70185 1.20830 18.2452 24.9548 19.00 26.00
Group 4=Diabetic + n-hexane leaf extract 5 26.0000 5.09902 2.28035 19.6687 32.3313 20.00 32.00
Group 5=Diabetic + n-hexane fruit extract 5 22.8000 3.34664 1.49666 18.6446 26.9554 19.00 27.00
Group 6=Diabetic + ethanol leaf extract 5 22.0000 4.41588 1.97484 16.5170 27.4830 17.00 28.00
Group 7=Diabetic + ethanol fruit extract 5 23.6000 4.15933 1.86011 18.4355 28.7645 19.00 29.00
Group 8=Diabetic + methanol leaf extract 5 22.8000 4.76445 2.13073 16.8842 28.7158 18.00 30.00
Group 9=Diabetic + methanol fruit extract 5 25.4000 4.33590 1.93907 20.0163 30.7837 20.00 32.00
Group 10=Diabetic + n-hexane leaf and fruit extracts 5 18.8000 1.92354 .86023 16.4116 21.1884 16.00 21.00
Group 11=Diabetic + ethanol leaf and fruit extracts 5 19.8000 6.01664 2.69072 12.3294 27.2706 12.00 28.00
Group 12: Diabetic + methanol leaf and fruit extracts 5 20.4000 6.46529 2.89137 12.3723 28.4277 11.00 29.00
Total 60 23.0167 5.79448 .74806 21.5198 24.5135 11.00 40.00
AST Group 1=Normal Control 5 42.4000 5.68331 2.54165 35.3432 49.4568 38.00 52.00
Group 2=Diabetic Untreated 5 60.0000 7.03562 3.14643 51.2641 68.7359 50.00 68.00
Group 3=Standard Control 5 53.8000 7.46324 3.33766 44.5332 63.0668 45.00 63.00
Group 4=Diabetic + n-hexane leaf extract 5 55.8000 5.49545 2.45764 48.9765 62.6235 48.00 62.00
Group 5=Diabetic + n-hexane fruit extract 5 55.2000 3.56371 1.59374 50.7751 59.6249 50.00 60.00
Group 6=Diabetic + ethanol leaf extract 5 53.2000 6.41872 2.87054 45.2301 61.1699 47.00 63.00
Group 7=Diabetic + ethanol fruit extract 5 53.4000 4.66905 2.08806 47.6026 59.1974 48.00 60.00
Group 8=Diabetic + methanol leaf extract 5 54.2000 4.38178 1.95959 48.7593 59.6407 48.00 60.00
Group 9=Diabetic + methanol fruit extract 5 51.0000 5.70088 2.54951 43.9214 58.0786 43.00 57.00
Group 10=Diabetic + n-hexane leaf and fruit extracts 5 45.4000 3.43511 1.53623 41.1347 49.6653 42.00 50.00
Group 11=Diabetic + ethanol leaf and fruit extracts 5 49.6000 4.61519 2.06398 43.8695 55.3305 43.00 56.00
Group 12: Diabetic + methanol leaf and fruit extracts 5 48.6000 6.65582 2.97658 40.3357 56.8643 38.00 53.00
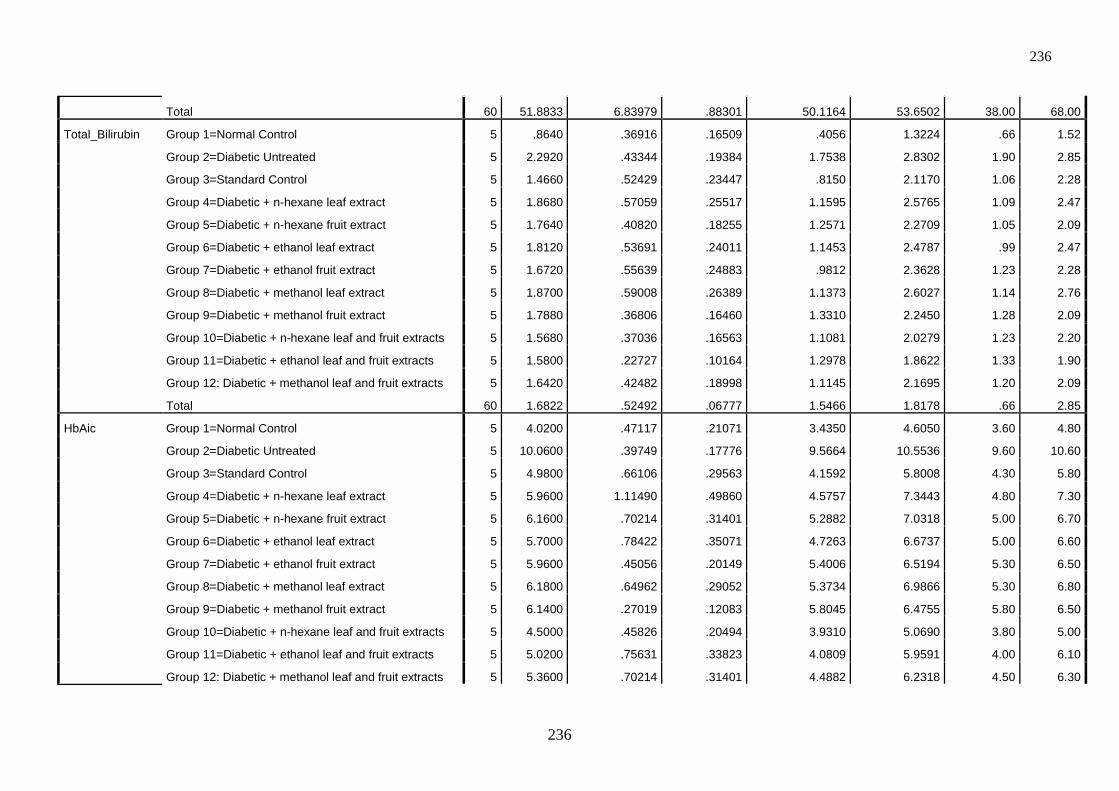
236
236
Total 60 51.8833 6.83979 .88301 50.1164 53.6502 38.00 68.00
Total_Bilirubin Group 1=Normal Control 5 .8640 .36916 .16509 .4056 1.3224 .66 1.52
Group 2=Diabetic Untreated 5 2.2920 .43344 .19384 1.7538 2.8302 1.90 2.85
Group 3=Standard Control 5 1.4660 .52429 .23447 .8150 2.1170 1.06 2.28
Group 4=Diabetic + n-hexane leaf extract 5 1.8680 .57059 .25517 1.1595 2.5765 1.09 2.47
Group 5=Diabetic + n-hexane fruit extract 5 1.7640 .40820 .18255 1.2571 2.2709 1.05 2.09
Group 6=Diabetic + ethanol leaf extract 5 1.8120 .53691 .24011 1.1453 2.4787 .99 2.47
Group 7=Diabetic + ethanol fruit extract 5 1.6720 .55639 .24883 .9812 2.3628 1.23 2.28
Group 8=Diabetic + methanol leaf extract 5 1.8700 .59008 .26389 1.1373 2.6027 1.14 2.76
Group 9=Diabetic + methanol fruit extract 5 1.7880 .36806 .16460 1.3310 2.2450 1.28 2.09
Group 10=Diabetic + n-hexane leaf and fruit extracts 5 1.5680 .37036 .16563 1.1081 2.0279 1.23 2.20
Group 11=Diabetic + ethanol leaf and fruit extracts 5 1.5800 .22727 .10164 1.2978 1.8622 1.33 1.90
Group 12: Diabetic + methanol leaf and fruit extracts 5 1.6420 .42482 .18998 1.1145 2.1695 1.20 2.09
Total 60 1.6822 .52492 .06777 1.5466 1.8178 .66 2.85
HbAic Group 1=Normal Control 5 4.0200 .47117 .21071 3.4350 4.6050 3.60 4.80
Group 2=Diabetic Untreated 5 10.0600 .39749 .17776 9.5664 10.5536 9.60 10.60
Group 3=Standard Control 5 4.9800 .66106 .29563 4.1592 5.8008 4.30 5.80
Group 4=Diabetic + n-hexane leaf extract 5 5.9600 1.11490 .49860 4.5757 7.3443 4.80 7.30
Group 5=Diabetic + n-hexane fruit extract 5 6.1600 .70214 .31401 5.2882 7.0318 5.00 6.70
Group 6=Diabetic + ethanol leaf extract 5 5.7000 .78422 .35071 4.7263 6.6737 5.00 6.60
Group 7=Diabetic + ethanol fruit extract 5 5.9600 .45056 .20149 5.4006 6.5194 5.30 6.50
Group 8=Diabetic + methanol leaf extract 5 6.1800 .64962 .29052 5.3734 6.9866 5.30 6.80
Group 9=Diabetic + methanol fruit extract 5 6.1400 .27019 .12083 5.8045 6.4755 5.80 6.50
Group 10=Diabetic + n-hexane leaf and fruit extracts 5 4.5000 .45826 .20494 3.9310 5.0690 3.80 5.00
Group 11=Diabetic + ethanol leaf and fruit extracts 5 5.0200 .75631 .33823 4.0809 5.9591 4.00 6.10
Group 12: Diabetic + methanol leaf and fruit extracts 5 5.3600 .70214 .31401 4.4882 6.2318 4.50 6.30
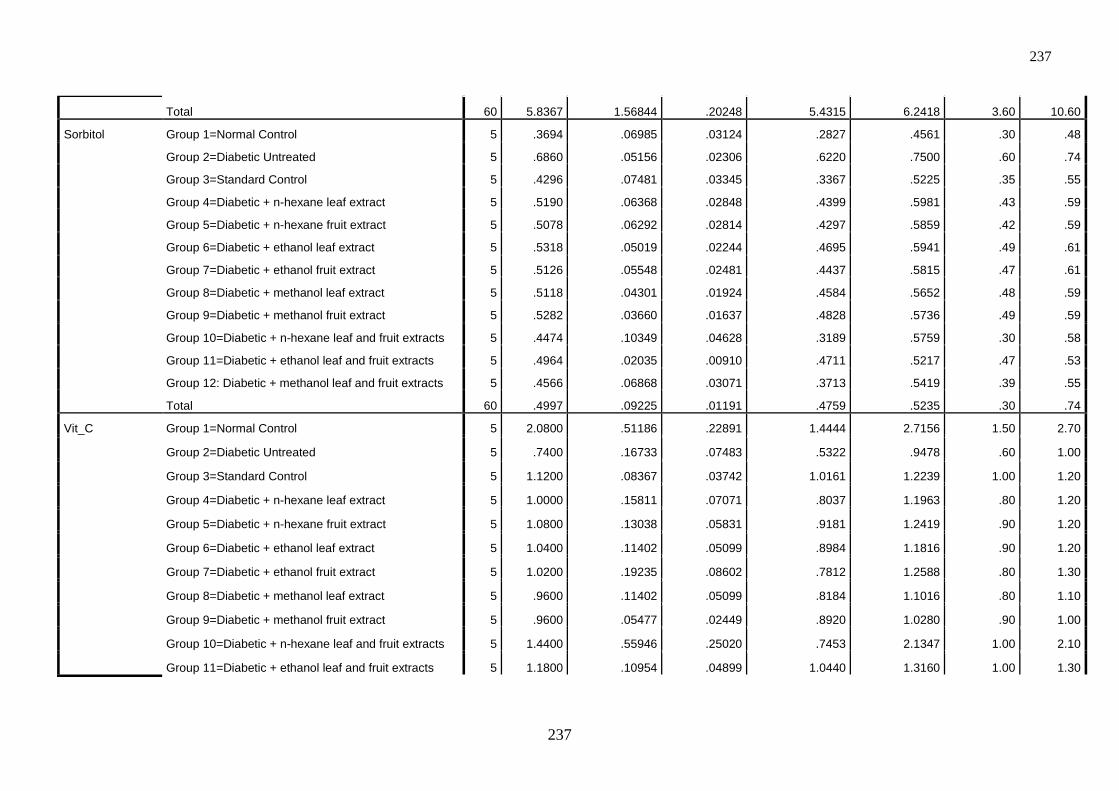
237
237
Total 60 5.8367 1.56844 .20248 5.4315 6.2418 3.60 10.60
Sorbitol Group 1=Normal Control 5 .3694 .06985 .03124 .2827 .4561 .30 .48
Group 2=Diabetic Untreated 5 .6860 .05156 .02306 .6220 .7500 .60 .74
Group 3=Standard Control 5 .4296 .07481 .03345 .3367 .5225 .35 .55
Group 4=Diabetic + n-hexane leaf extract 5 .5190 .06368 .02848 .4399 .5981 .43 .59
Group 5=Diabetic + n-hexane fruit extract 5 .5078 .06292 .02814 .4297 .5859 .42 .59
Group 6=Diabetic + ethanol leaf extract 5 .5318 .05019 .02244 .4695 .5941 .49 .61
Group 7=Diabetic + ethanol fruit extract 5 .5126 .05548 .02481 .4437 .5815 .47 .61
Group 8=Diabetic + methanol leaf extract 5 .5118 .04301 .01924 .4584 .5652 .48 .59
Group 9=Diabetic + methanol fruit extract 5 .5282 .03660 .01637 .4828 .5736 .49 .59
Group 10=Diabetic + n-hexane leaf and fruit extracts 5 .4474 .10349 .04628 .3189 .5759 .30 .58
Group 11=Diabetic + ethanol leaf and fruit extracts 5 .4964 .02035 .00910 .4711 .5217 .47 .53
Group 12: Diabetic + methanol leaf and fruit extracts 5 .4566 .06868 .03071 .3713 .5419 .39 .55
Total 60 .4997 .09225 .01191 .4759 .5235 .30 .74
Vit_C Group 1=Normal Control 5 2.0800 .51186 .22891 1.4444 2.7156 1.50 2.70
Group 2=Diabetic Untreated 5 .7400 .16733 .07483 .5322 .9478 .60 1.00
Group 3=Standard Control 5 1.1200 .08367 .03742 1.0161 1.2239 1.00 1.20
Group 4=Diabetic + n-hexane leaf extract 5 1.0000 .15811 .07071 .8037 1.1963 .80 1.20
Group 5=Diabetic + n-hexane fruit extract 5 1.0800 .13038 .05831 .9181 1.2419 .90 1.20
Group 6=Diabetic + ethanol leaf extract 5 1.0400 .11402 .05099 .8984 1.1816 .90 1.20
Group 7=Diabetic + ethanol fruit extract 5 1.0200 .19235 .08602 .7812 1.2588 .80 1.30
Group 8=Diabetic + methanol leaf extract 5 .9600 .11402 .05099 .8184 1.1016 .80 1.10
Group 9=Diabetic + methanol fruit extract 5 .9600 .05477 .02449 .8920 1.0280 .90 1.00
Group 10=Diabetic + n-hexane leaf and fruit extracts 5 1.4400 .55946 .25020 .7453 2.1347 1.00 2.10
Group 11=Diabetic + ethanol leaf and fruit extracts 5 1.1800 .10954 .04899 1.0440 1.3160 1.00 1.30
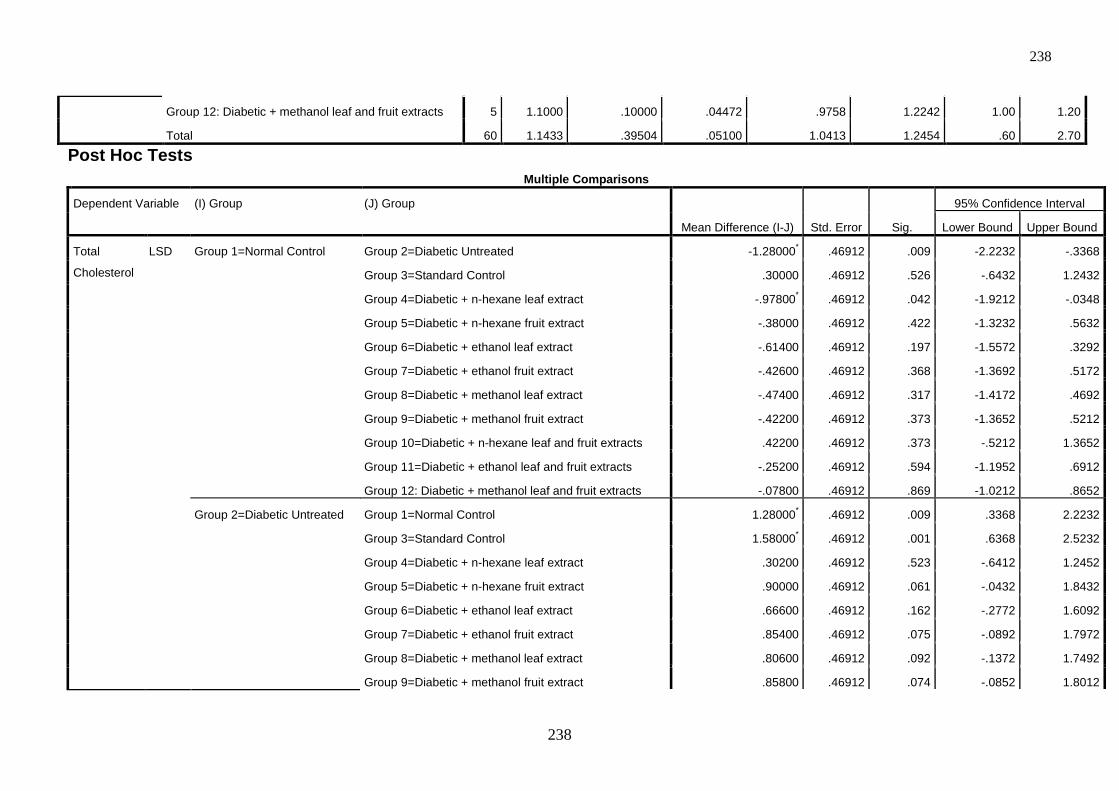
238
238
Group 12: Diabetic + methanol leaf and fruit extracts 5 1.1000 .10000 .04472 .9758 1.2242 1.00 1.20
Total 60 1.1433 .39504 .05100 1.0413 1.2454 .60 2.70
Post Hoc Tests Multiple Comparisons
Dependent Variable (I) Group (J) Group
Mean Difference (I-J) Std. Error Sig.
95% Confidence Interval
Lower Bound Upper Bound
Total
Cholesterol
LSD Group 1=Normal Control Group 2=Diabetic Untreated -1.28000* .46912 .009 -2.2232 -.3368
Group 3=Standard Control .30000 .46912 .526 -.6432 1.2432
Group 4=Diabetic + n-hexane leaf extract -.97800* .46912 .042 -1.9212 -.0348
Group 5=Diabetic + n-hexane fruit extract -.38000 .46912 .422 -1.3232 .5632
Group 6=Diabetic + ethanol leaf extract -.61400 .46912 .197 -1.5572 .3292
Group 7=Diabetic + ethanol fruit extract -.42600 .46912 .368 -1.3692 .5172
Group 8=Diabetic + methanol leaf extract -.47400 .46912 .317 -1.4172 .4692
Group 9=Diabetic + methanol fruit extract -.42200 .46912 .373 -1.3652 .5212
Group 10=Diabetic + n-hexane leaf and fruit extracts .42200 .46912 .373 -.5212 1.3652
Group 11=Diabetic + ethanol leaf and fruit extracts -.25200 .46912 .594 -1.1952 .6912
Group 12: Diabetic + methanol leaf and fruit extracts -.07800 .46912 .869 -1.0212 .8652
Group 2=Diabetic Untreated Group 1=Normal Control 1.28000* .46912 .009 .3368 2.2232
Group 3=Standard Control 1.58000* .46912 .001 .6368 2.5232
Group 4=Diabetic + n-hexane leaf extract .30200 .46912 .523 -.6412 1.2452
Group 5=Diabetic + n-hexane fruit extract .90000 .46912 .061 -.0432 1.8432
Group 6=Diabetic + ethanol leaf extract .66600 .46912 .162 -.2772 1.6092
Group 7=Diabetic + ethanol fruit extract .85400 .46912 .075 -.0892 1.7972
Group 8=Diabetic + methanol leaf extract .80600 .46912 .092 -.1372 1.7492
Group 9=Diabetic + methanol fruit extract .85800 .46912 .074 -.0852 1.8012
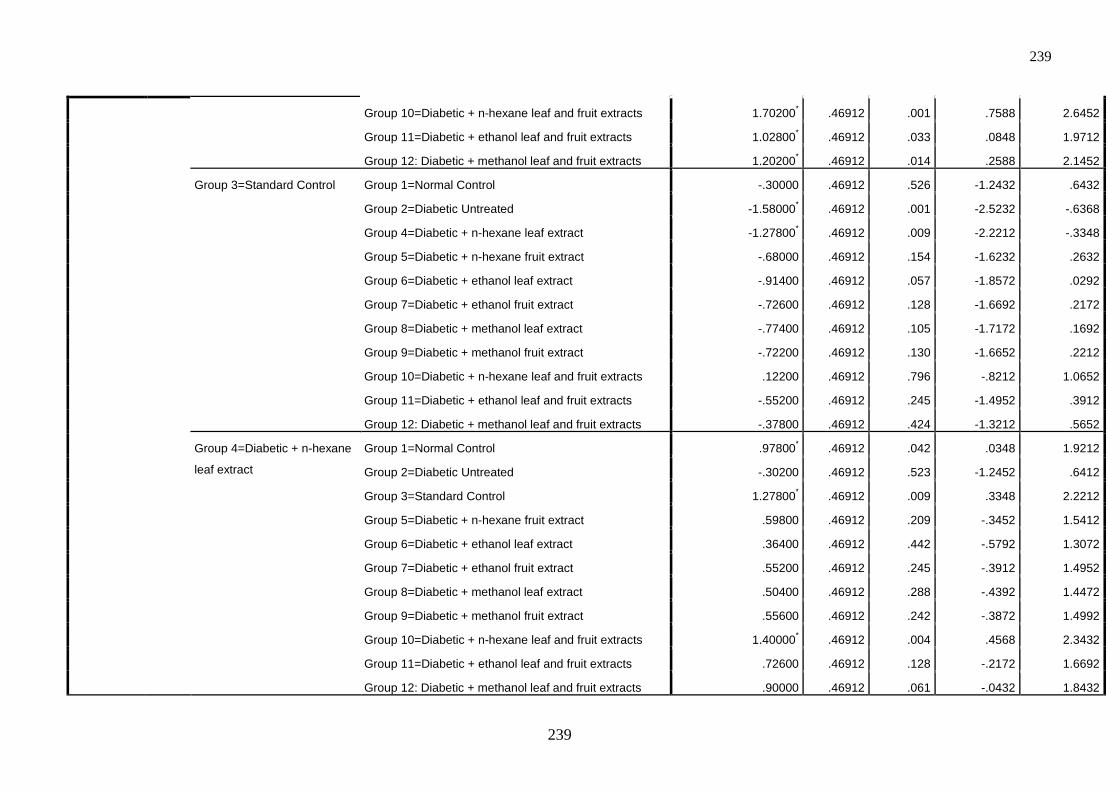
239
239
Group 10=Diabetic + n-hexane leaf and fruit extracts 1.70200* .46912 .001 .7588 2.6452
Group 11=Diabetic + ethanol leaf and fruit extracts 1.02800* .46912 .033 .0848 1.9712
Group 12: Diabetic + methanol leaf and fruit extracts 1.20200* .46912 .014 .2588 2.1452
Group 3=Standard Control Group 1=Normal Control -.30000 .46912 .526 -1.2432 .6432
Group 2=Diabetic Untreated -1.58000* .46912 .001 -2.5232 -.6368
Group 4=Diabetic + n-hexane leaf extract -1.27800* .46912 .009 -2.2212 -.3348
Group 5=Diabetic + n-hexane fruit extract -.68000 .46912 .154 -1.6232 .2632
Group 6=Diabetic + ethanol leaf extract -.91400 .46912 .057 -1.8572 .0292
Group 7=Diabetic + ethanol fruit extract -.72600 .46912 .128 -1.6692 .2172
Group 8=Diabetic + methanol leaf extract -.77400 .46912 .105 -1.7172 .1692
Group 9=Diabetic + methanol fruit extract -.72200 .46912 .130 -1.6652 .2212
Group 10=Diabetic + n-hexane leaf and fruit extracts .12200 .46912 .796 -.8212 1.0652
Group 11=Diabetic + ethanol leaf and fruit extracts -.55200 .46912 .245 -1.4952 .3912
Group 12: Diabetic + methanol leaf and fruit extracts -.37800 .46912 .424 -1.3212 .5652
Group 4=Diabetic + n-hexane
leaf extract
Group 1=Normal Control .97800* .46912 .042 .0348 1.9212
Group 2=Diabetic Untreated -.30200 .46912 .523 -1.2452 .6412
Group 3=Standard Control 1.27800* .46912 .009 .3348 2.2212
Group 5=Diabetic + n-hexane fruit extract .59800 .46912 .209 -.3452 1.5412
Group 6=Diabetic + ethanol leaf extract .36400 .46912 .442 -.5792 1.3072
Group 7=Diabetic + ethanol fruit extract .55200 .46912 .245 -.3912 1.4952
Group 8=Diabetic + methanol leaf extract .50400 .46912 .288 -.4392 1.4472
Group 9=Diabetic + methanol fruit extract .55600 .46912 .242 -.3872 1.4992
Group 10=Diabetic + n-hexane leaf and fruit extracts 1.40000* .46912 .004 .4568 2.3432
Group 11=Diabetic + ethanol leaf and fruit extracts .72600 .46912 .128 -.2172 1.6692
Group 12: Diabetic + methanol leaf and fruit extracts .90000 .46912 .061 -.0432 1.8432
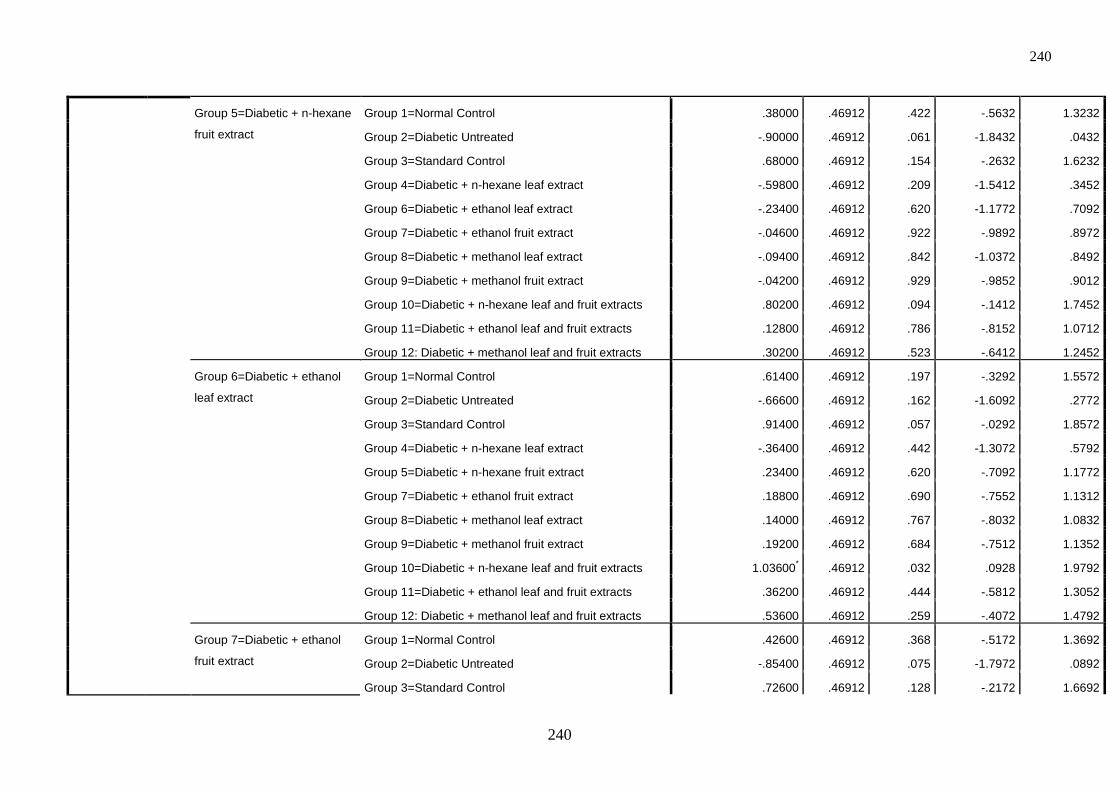
240
240
Group 5=Diabetic + n-hexane
fruit extract
Group 1=Normal Control .38000 .46912 .422 -.5632 1.3232
Group 2=Diabetic Untreated -.90000 .46912 .061 -1.8432 .0432
Group 3=Standard Control .68000 .46912 .154 -.2632 1.6232
Group 4=Diabetic + n-hexane leaf extract -.59800 .46912 .209 -1.5412 .3452
Group 6=Diabetic + ethanol leaf extract -.23400 .46912 .620 -1.1772 .7092
Group 7=Diabetic + ethanol fruit extract -.04600 .46912 .922 -.9892 .8972
Group 8=Diabetic + methanol leaf extract -.09400 .46912 .842 -1.0372 .8492
Group 9=Diabetic + methanol fruit extract -.04200 .46912 .929 -.9852 .9012
Group 10=Diabetic + n-hexane leaf and fruit extracts .80200 .46912 .094 -.1412 1.7452
Group 11=Diabetic + ethanol leaf and fruit extracts .12800 .46912 .786 -.8152 1.0712
Group 12: Diabetic + methanol leaf and fruit extracts .30200 .46912 .523 -.6412 1.2452
Group 6=Diabetic + ethanol
leaf extract
Group 1=Normal Control .61400 .46912 .197 -.3292 1.5572
Group 2=Diabetic Untreated -.66600 .46912 .162 -1.6092 .2772
Group 3=Standard Control .91400 .46912 .057 -.0292 1.8572
Group 4=Diabetic + n-hexane leaf extract -.36400 .46912 .442 -1.3072 .5792
Group 5=Diabetic + n-hexane fruit extract .23400 .46912 .620 -.7092 1.1772
Group 7=Diabetic + ethanol fruit extract .18800 .46912 .690 -.7552 1.1312
Group 8=Diabetic + methanol leaf extract .14000 .46912 .767 -.8032 1.0832
Group 9=Diabetic + methanol fruit extract .19200 .46912 .684 -.7512 1.1352
Group 10=Diabetic + n-hexane leaf and fruit extracts 1.03600* .46912 .032 .0928 1.9792
Group 11=Diabetic + ethanol leaf and fruit extracts .36200 .46912 .444 -.5812 1.3052
Group 12: Diabetic + methanol leaf and fruit extracts .53600 .46912 .259 -.4072 1.4792
Group 7=Diabetic + ethanol
fruit extract
Group 1=Normal Control .42600 .46912 .368 -.5172 1.3692
Group 2=Diabetic Untreated -.85400 .46912 .075 -1.7972 .0892
Group 3=Standard Control .72600 .46912 .128 -.2172 1.6692
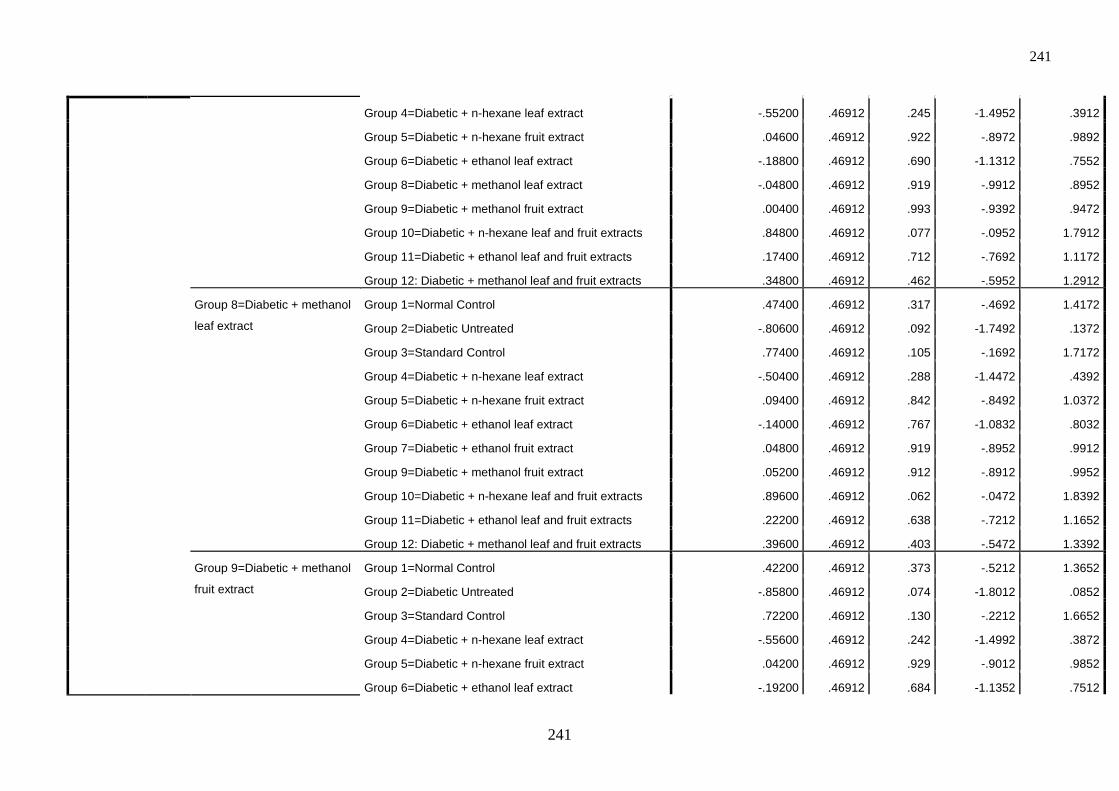
241
241
Group 4=Diabetic + n-hexane leaf extract -.55200 .46912 .245 -1.4952 .3912
Group 5=Diabetic + n-hexane fruit extract .04600 .46912 .922 -.8972 .9892
Group 6=Diabetic + ethanol leaf extract -.18800 .46912 .690 -1.1312 .7552
Group 8=Diabetic + methanol leaf extract -.04800 .46912 .919 -.9912 .8952
Group 9=Diabetic + methanol fruit extract .00400 .46912 .993 -.9392 .9472
Group 10=Diabetic + n-hexane leaf and fruit extracts .84800 .46912 .077 -.0952 1.7912
Group 11=Diabetic + ethanol leaf and fruit extracts .17400 .46912 .712 -.7692 1.1172
Group 12: Diabetic + methanol leaf and fruit extracts .34800 .46912 .462 -.5952 1.2912
Group 8=Diabetic + methanol
leaf extract
Group 1=Normal Control .47400 .46912 .317 -.4692 1.4172
Group 2=Diabetic Untreated -.80600 .46912 .092 -1.7492 .1372
Group 3=Standard Control .77400 .46912 .105 -.1692 1.7172
Group 4=Diabetic + n-hexane leaf extract -.50400 .46912 .288 -1.4472 .4392
Group 5=Diabetic + n-hexane fruit extract .09400 .46912 .842 -.8492 1.0372
Group 6=Diabetic + ethanol leaf extract -.14000 .46912 .767 -1.0832 .8032
Group 7=Diabetic + ethanol fruit extract .04800 .46912 .919 -.8952 .9912
Group 9=Diabetic + methanol fruit extract .05200 .46912 .912 -.8912 .9952
Group 10=Diabetic + n-hexane leaf and fruit extracts .89600 .46912 .062 -.0472 1.8392
Group 11=Diabetic + ethanol leaf and fruit extracts .22200 .46912 .638 -.7212 1.1652
Group 12: Diabetic + methanol leaf and fruit extracts .39600 .46912 .403 -.5472 1.3392
Group 9=Diabetic + methanol
fruit extract
Group 1=Normal Control .42200 .46912 .373 -.5212 1.3652
Group 2=Diabetic Untreated -.85800 .46912 .074 -1.8012 .0852
Group 3=Standard Control .72200 .46912 .130 -.2212 1.6652
Group 4=Diabetic + n-hexane leaf extract -.55600 .46912 .242 -1.4992 .3872
Group 5=Diabetic + n-hexane fruit extract .04200 .46912 .929 -.9012 .9852
Group 6=Diabetic + ethanol leaf extract -.19200 .46912 .684 -1.1352 .7512
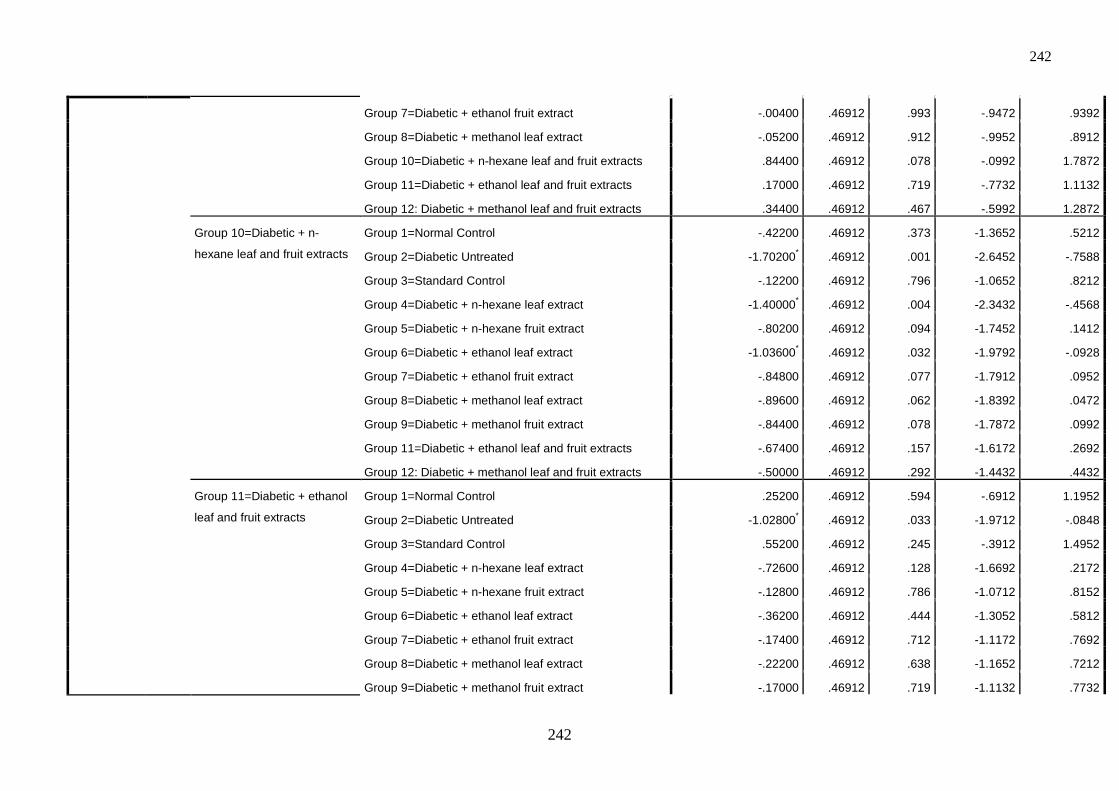
242
242
Group 7=Diabetic + ethanol fruit extract -.00400 .46912 .993 -.9472 .9392
Group 8=Diabetic + methanol leaf extract -.05200 .46912 .912 -.9952 .8912
Group 10=Diabetic + n-hexane leaf and fruit extracts .84400 .46912 .078 -.0992 1.7872
Group 11=Diabetic + ethanol leaf and fruit extracts .17000 .46912 .719 -.7732 1.1132
Group 12: Diabetic + methanol leaf and fruit extracts .34400 .46912 .467 -.5992 1.2872
Group 10=Diabetic + n-
hexane leaf and fruit extracts
Group 1=Normal Control -.42200 .46912 .373 -1.3652 .5212
Group 2=Diabetic Untreated -1.70200* .46912 .001 -2.6452 -.7588
Group 3=Standard Control -.12200 .46912 .796 -1.0652 .8212
Group 4=Diabetic + n-hexane leaf extract -1.40000* .46912 .004 -2.3432 -.4568
Group 5=Diabetic + n-hexane fruit extract -.80200 .46912 .094 -1.7452 .1412
Group 6=Diabetic + ethanol leaf extract -1.03600* .46912 .032 -1.9792 -.0928
Group 7=Diabetic + ethanol fruit extract -.84800 .46912 .077 -1.7912 .0952
Group 8=Diabetic + methanol leaf extract -.89600 .46912 .062 -1.8392 .0472
Group 9=Diabetic + methanol fruit extract -.84400 .46912 .078 -1.7872 .0992
Group 11=Diabetic + ethanol leaf and fruit extracts -.67400 .46912 .157 -1.6172 .2692
Group 12: Diabetic + methanol leaf and fruit extracts -.50000 .46912 .292 -1.4432 .4432
Group 11=Diabetic + ethanol
leaf and fruit extracts
Group 1=Normal Control .25200 .46912 .594 -.6912 1.1952
Group 2=Diabetic Untreated -1.02800* .46912 .033 -1.9712 -.0848
Group 3=Standard Control .55200 .46912 .245 -.3912 1.4952
Group 4=Diabetic + n-hexane leaf extract -.72600 .46912 .128 -1.6692 .2172
Group 5=Diabetic + n-hexane fruit extract -.12800 .46912 .786 -1.0712 .8152
Group 6=Diabetic + ethanol leaf extract -.36200 .46912 .444 -1.3052 .5812
Group 7=Diabetic + ethanol fruit extract -.17400 .46912 .712 -1.1172 .7692
Group 8=Diabetic + methanol leaf extract -.22200 .46912 .638 -1.1652 .7212
Group 9=Diabetic + methanol fruit extract -.17000 .46912 .719 -1.1132 .7732
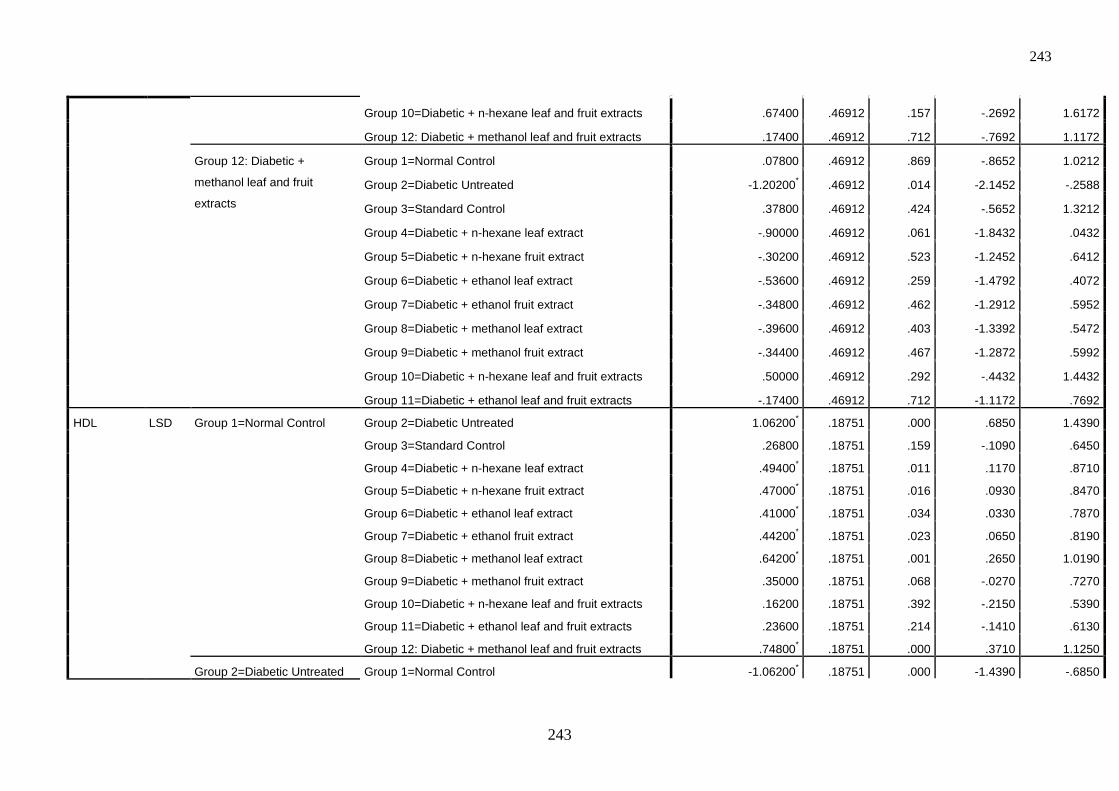
243
243
Group 10=Diabetic + n-hexane leaf and fruit extracts .67400 .46912 .157 -.2692 1.6172
Group 12: Diabetic + methanol leaf and fruit extracts .17400 .46912 .712 -.7692 1.1172
Group 12: Diabetic +
methanol leaf and fruit
extracts
Group 1=Normal Control .07800 .46912 .869 -.8652 1.0212
Group 2=Diabetic Untreated -1.20200* .46912 .014 -2.1452 -.2588
Group 3=Standard Control .37800 .46912 .424 -.5652 1.3212
Group 4=Diabetic + n-hexane leaf extract -.90000 .46912 .061 -1.8432 .0432
Group 5=Diabetic + n-hexane fruit extract -.30200 .46912 .523 -1.2452 .6412
Group 6=Diabetic + ethanol leaf extract -.53600 .46912 .259 -1.4792 .4072
Group 7=Diabetic + ethanol fruit extract -.34800 .46912 .462 -1.2912 .5952
Group 8=Diabetic + methanol leaf extract -.39600 .46912 .403 -1.3392 .5472
Group 9=Diabetic + methanol fruit extract -.34400 .46912 .467 -1.2872 .5992
Group 10=Diabetic + n-hexane leaf and fruit extracts .50000 .46912 .292 -.4432 1.4432
Group 11=Diabetic + ethanol leaf and fruit extracts -.17400 .46912 .712 -1.1172 .7692
HDL LSD Group 1=Normal Control Group 2=Diabetic Untreated 1.06200* .18751 .000 .6850 1.4390
Group 3=Standard Control .26800 .18751 .159 -.1090 .6450
Group 4=Diabetic + n-hexane leaf extract .49400* .18751 .011 .1170 .8710
Group 5=Diabetic + n-hexane fruit extract .47000* .18751 .016 .0930 .8470
Group 6=Diabetic + ethanol leaf extract .41000* .18751 .034 .0330 .7870
Group 7=Diabetic + ethanol fruit extract .44200* .18751 .023 .0650 .8190
Group 8=Diabetic + methanol leaf extract .64200* .18751 .001 .2650 1.0190
Group 9=Diabetic + methanol fruit extract .35000 .18751 .068 -.0270 .7270
Group 10=Diabetic + n-hexane leaf and fruit extracts .16200 .18751 .392 -.2150 .5390
Group 11=Diabetic + ethanol leaf and fruit extracts .23600 .18751 .214 -.1410 .6130
Group 12: Diabetic + methanol leaf and fruit extracts .74800* .18751 .000 .3710 1.1250
Group 2=Diabetic Untreated Group 1=Normal Control -1.06200* .18751 .000 -1.4390 -.6850
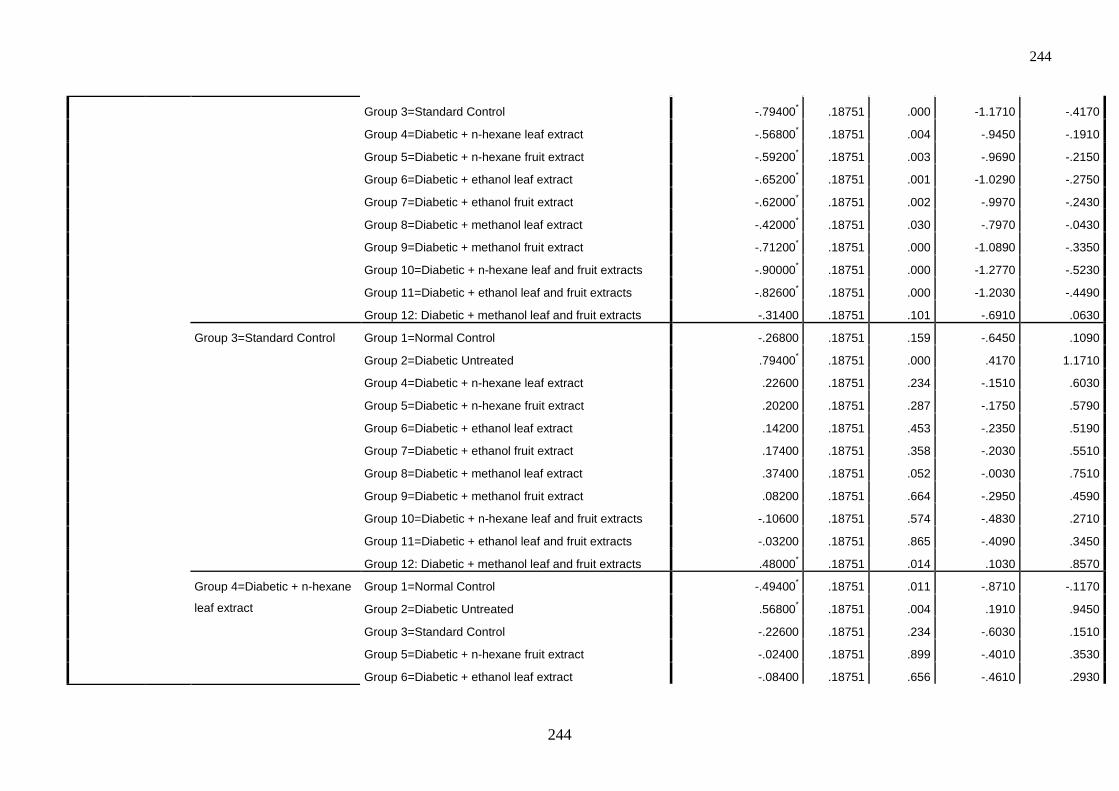
244
244
Group 3=Standard Control -.79400* .18751 .000 -1.1710 -.4170
Group 4=Diabetic + n-hexane leaf extract -.56800* .18751 .004 -.9450 -.1910
Group 5=Diabetic + n-hexane fruit extract -.59200* .18751 .003 -.9690 -.2150
Group 6=Diabetic + ethanol leaf extract -.65200* .18751 .001 -1.0290 -.2750
Group 7=Diabetic + ethanol fruit extract -.62000* .18751 .002 -.9970 -.2430
Group 8=Diabetic + methanol leaf extract -.42000* .18751 .030 -.7970 -.0430
Group 9=Diabetic + methanol fruit extract -.71200* .18751 .000 -1.0890 -.3350
Group 10=Diabetic + n-hexane leaf and fruit extracts -.90000* .18751 .000 -1.2770 -.5230
Group 11=Diabetic + ethanol leaf and fruit extracts -.82600* .18751 .000 -1.2030 -.4490
Group 12: Diabetic + methanol leaf and fruit extracts -.31400 .18751 .101 -.6910 .0630
Group 3=Standard Control Group 1=Normal Control -.26800 .18751 .159 -.6450 .1090
Group 2=Diabetic Untreated .79400* .18751 .000 .4170 1.1710
Group 4=Diabetic + n-hexane leaf extract .22600 .18751 .234 -.1510 .6030
Group 5=Diabetic + n-hexane fruit extract .20200 .18751 .287 -.1750 .5790
Group 6=Diabetic + ethanol leaf extract .14200 .18751 .453 -.2350 .5190
Group 7=Diabetic + ethanol fruit extract .17400 .18751 .358 -.2030 .5510
Group 8=Diabetic + methanol leaf extract .37400 .18751 .052 -.0030 .7510
Group 9=Diabetic + methanol fruit extract .08200 .18751 .664 -.2950 .4590
Group 10=Diabetic + n-hexane leaf and fruit extracts -.10600 .18751 .574 -.4830 .2710
Group 11=Diabetic + ethanol leaf and fruit extracts -.03200 .18751 .865 -.4090 .3450
Group 12: Diabetic + methanol leaf and fruit extracts .48000* .18751 .014 .1030 .8570
Group 4=Diabetic + n-hexane
leaf extract
Group 1=Normal Control -.49400* .18751 .011 -.8710 -.1170
Group 2=Diabetic Untreated .56800* .18751 .004 .1910 .9450
Group 3=Standard Control -.22600 .18751 .234 -.6030 .1510
Group 5=Diabetic + n-hexane fruit extract -.02400 .18751 .899 -.4010 .3530
Group 6=Diabetic + ethanol leaf extract -.08400 .18751 .656 -.4610 .2930

245
245
Group 7=Diabetic + ethanol fruit extract -.05200 .18751 .783 -.4290 .3250
Group 8=Diabetic + methanol leaf extract .14800 .18751 .434 -.2290 .5250
Group 9=Diabetic + methanol fruit extract -.14400 .18751 .446 -.5210 .2330
Group 10=Diabetic + n-hexane leaf and fruit extracts -.33200 .18751 .083 -.7090 .0450
Group 11=Diabetic + ethanol leaf and fruit extracts -.25800 .18751 .175 -.6350 .1190
Group 12: Diabetic + methanol leaf and fruit extracts .25400 .18751 .182 -.1230 .6310
Group 5=Diabetic + n-hexane
fruit extract
Group 1=Normal Control -.47000* .18751 .016 -.8470 -.0930
Group 2=Diabetic Untreated .59200* .18751 .003 .2150 .9690
Group 3=Standard Control -.20200 .18751 .287 -.5790 .1750
Group 4=Diabetic + n-hexane leaf extract .02400 .18751 .899 -.3530 .4010
Group 6=Diabetic + ethanol leaf extract -.06000 .18751 .750 -.4370 .3170
Group 7=Diabetic + ethanol fruit extract -.02800 .18751 .882 -.4050 .3490
Group 8=Diabetic + methanol leaf extract .17200 .18751 .364 -.2050 .5490
Group 9=Diabetic + methanol fruit extract -.12000 .18751 .525 -.4970 .2570
Group 10=Diabetic + n-hexane leaf and fruit extracts -.30800 .18751 .107 -.6850 .0690
Group 11=Diabetic + ethanol leaf and fruit extracts -.23400 .18751 .218 -.6110 .1430
Group 12: Diabetic + methanol leaf and fruit extracts .27800 .18751 .145 -.0990 .6550
Group 6=Diabetic + ethanol
leaf extract
Group 1=Normal Control -.41000* .18751 .034 -.7870 -.0330
Group 2=Diabetic Untreated .65200* .18751 .001 .2750 1.0290
Group 3=Standard Control -.14200 .18751 .453 -.5190 .2350
Group 4=Diabetic + n-hexane leaf extract .08400 .18751 .656 -.2930 .4610
Group 5=Diabetic + n-hexane fruit extract .06000 .18751 .750 -.3170 .4370
Group 7=Diabetic + ethanol fruit extract .03200 .18751 .865 -.3450 .4090
Group 8=Diabetic + methanol leaf extract .23200 .18751 .222 -.1450 .6090
Group 9=Diabetic + methanol fruit extract -.06000 .18751 .750 -.4370 .3170
Group 10=Diabetic + n-hexane leaf and fruit extracts -.24800 .18751 .192 -.6250 .1290
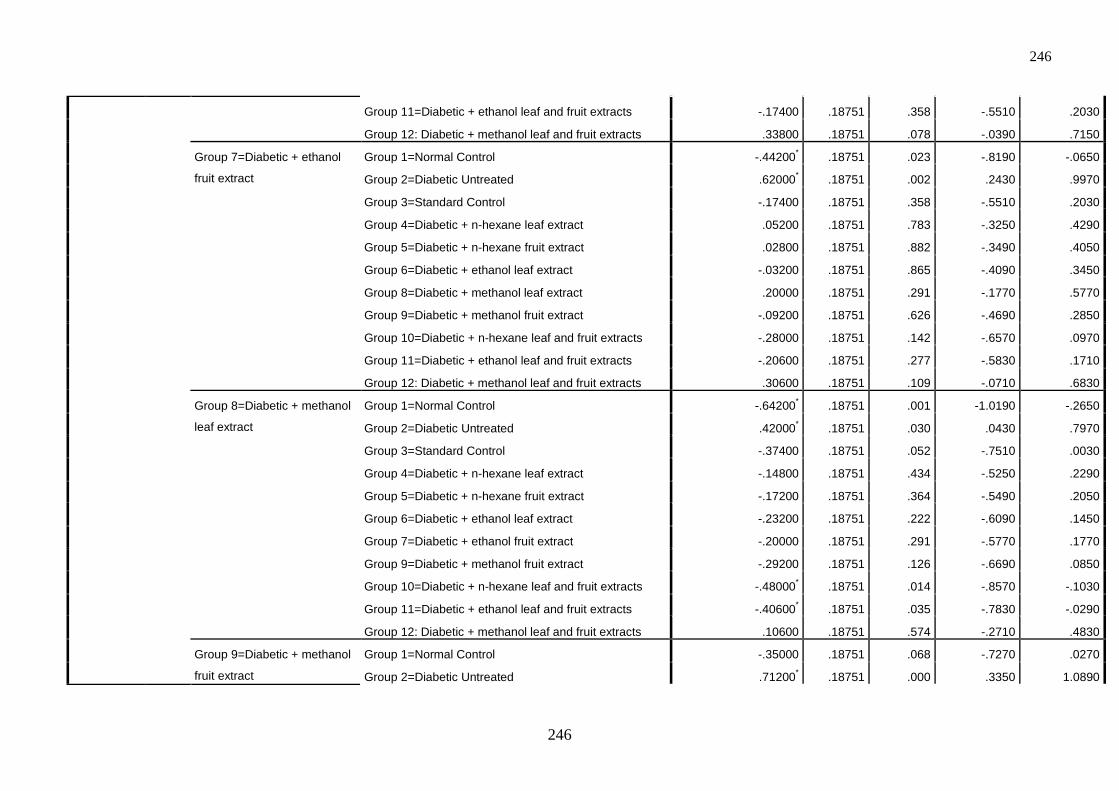
246
246
Group 11=Diabetic + ethanol leaf and fruit extracts -.17400 .18751 .358 -.5510 .2030
Group 12: Diabetic + methanol leaf and fruit extracts .33800 .18751 .078 -.0390 .7150
Group 7=Diabetic + ethanol
fruit extract
Group 1=Normal Control -.44200* .18751 .023 -.8190 -.0650
Group 2=Diabetic Untreated .62000* .18751 .002 .2430 .9970
Group 3=Standard Control -.17400 .18751 .358 -.5510 .2030
Group 4=Diabetic + n-hexane leaf extract .05200 .18751 .783 -.3250 .4290
Group 5=Diabetic + n-hexane fruit extract .02800 .18751 .882 -.3490 .4050
Group 6=Diabetic + ethanol leaf extract -.03200 .18751 .865 -.4090 .3450
Group 8=Diabetic + methanol leaf extract .20000 .18751 .291 -.1770 .5770
Group 9=Diabetic + methanol fruit extract -.09200 .18751 .626 -.4690 .2850
Group 10=Diabetic + n-hexane leaf and fruit extracts -.28000 .18751 .142 -.6570 .0970
Group 11=Diabetic + ethanol leaf and fruit extracts -.20600 .18751 .277 -.5830 .1710
Group 12: Diabetic + methanol leaf and fruit extracts .30600 .18751 .109 -.0710 .6830
Group 8=Diabetic + methanol
leaf extract
Group 1=Normal Control -.64200* .18751 .001 -1.0190 -.2650
Group 2=Diabetic Untreated .42000* .18751 .030 .0430 .7970
Group 3=Standard Control -.37400 .18751 .052 -.7510 .0030
Group 4=Diabetic + n-hexane leaf extract -.14800 .18751 .434 -.5250 .2290
Group 5=Diabetic + n-hexane fruit extract -.17200 .18751 .364 -.5490 .2050
Group 6=Diabetic + ethanol leaf extract -.23200 .18751 .222 -.6090 .1450
Group 7=Diabetic + ethanol fruit extract -.20000 .18751 .291 -.5770 .1770
Group 9=Diabetic + methanol fruit extract -.29200 .18751 .126 -.6690 .0850
Group 10=Diabetic + n-hexane leaf and fruit extracts -.48000* .18751 .014 -.8570 -.1030
Group 11=Diabetic + ethanol leaf and fruit extracts -.40600* .18751 .035 -.7830 -.0290
Group 12: Diabetic + methanol leaf and fruit extracts .10600 .18751 .574 -.2710 .4830
Group 9=Diabetic + methanol
fruit extract
Group 1=Normal Control -.35000 .18751 .068 -.7270 .0270
Group 2=Diabetic Untreated .71200* .18751 .000 .3350 1.0890

247
247
Group 3=Standard Control -.08200 .18751 .664 -.4590 .2950
Group 4=Diabetic + n-hexane leaf extract .14400 .18751 .446 -.2330 .5210
Group 5=Diabetic + n-hexane fruit extract .12000 .18751 .525 -.2570 .4970
Group 6=Diabetic + ethanol leaf extract .06000 .18751 .750 -.3170 .4370
Group 7=Diabetic + ethanol fruit extract .09200 .18751 .626 -.2850 .4690
Group 8=Diabetic + methanol leaf extract .29200 .18751 .126 -.0850 .6690
Group 10=Diabetic + n-hexane leaf and fruit extracts -.18800 .18751 .321 -.5650 .1890
Group 11=Diabetic + ethanol leaf and fruit extracts -.11400 .18751 .546 -.4910 .2630
Group 12: Diabetic + methanol leaf and fruit extracts .39800* .18751 .039 .0210 .7750
Group 10=Diabetic + n-
hexane leaf and fruit extracts
Group 1=Normal Control -.16200 .18751 .392 -.5390 .2150
Group 2=Diabetic Untreated .90000* .18751 .000 .5230 1.2770
Group 3=Standard Control .10600 .18751 .574 -.2710 .4830
Group 4=Diabetic + n-hexane leaf extract .33200 .18751 .083 -.0450 .7090
Group 5=Diabetic + n-hexane fruit extract .30800 .18751 .107 -.0690 .6850
Group 6=Diabetic + ethanol leaf extract .24800 .18751 .192 -.1290 .6250
Group 7=Diabetic + ethanol fruit extract .28000 .18751 .142 -.0970 .6570
Group 8=Diabetic + methanol leaf extract .48000* .18751 .014 .1030 .8570
Group 9=Diabetic + methanol fruit extract .18800 .18751 .321 -.1890 .5650
Group 11=Diabetic + ethanol leaf and fruit extracts .07400 .18751 .695 -.3030 .4510
Group 12: Diabetic + methanol leaf and fruit extracts .58600* .18751 .003 .2090 .9630
Group 11=Diabetic + ethanol
leaf and fruit extracts
Group 1=Normal Control -.23600 .18751 .214 -.6130 .1410
Group 2=Diabetic Untreated .82600* .18751 .000 .4490 1.2030
Group 3=Standard Control .03200 .18751 .865 -.3450 .4090
Group 4=Diabetic + n-hexane leaf extract .25800 .18751 .175 -.1190 .6350
Group 5=Diabetic + n-hexane fruit extract .23400 .18751 .218 -.1430 .6110
Group 6=Diabetic + ethanol leaf extract .17400 .18751 .358 -.2030 .5510
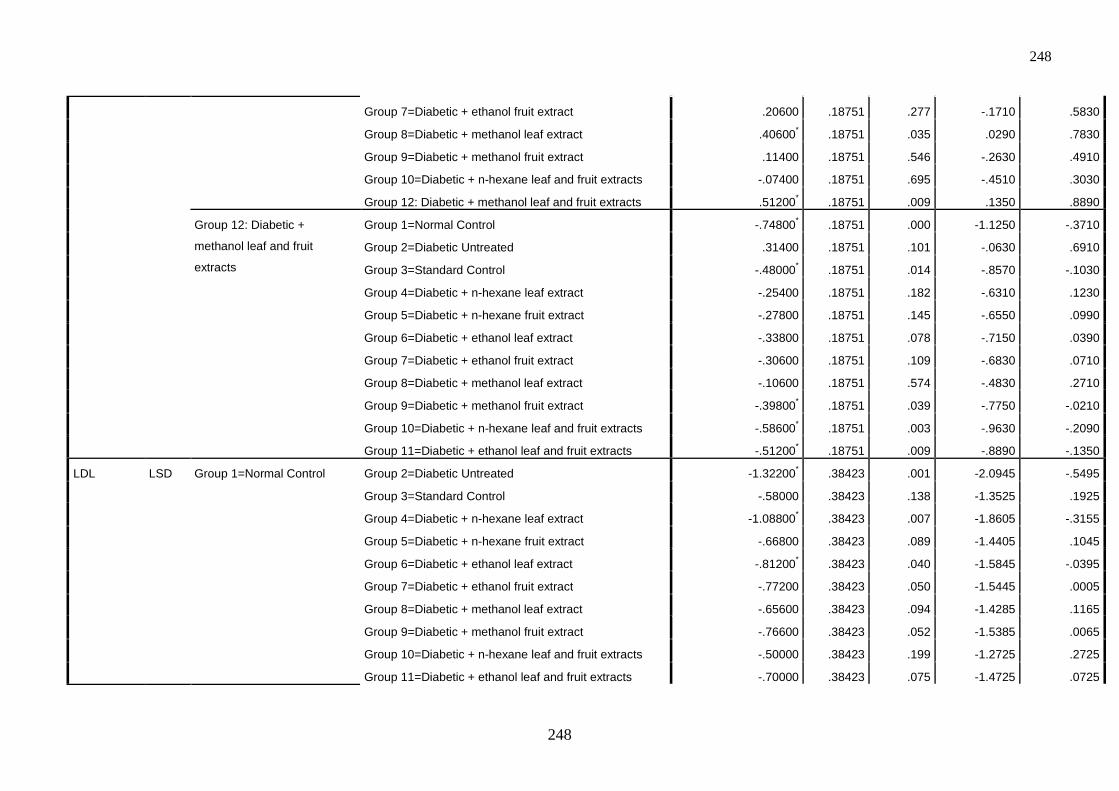
248
248
Group 7=Diabetic + ethanol fruit extract .20600 .18751 .277 -.1710 .5830
Group 8=Diabetic + methanol leaf extract .40600* .18751 .035 .0290 .7830
Group 9=Diabetic + methanol fruit extract .11400 .18751 .546 -.2630 .4910
Group 10=Diabetic + n-hexane leaf and fruit extracts -.07400 .18751 .695 -.4510 .3030
Group 12: Diabetic + methanol leaf and fruit extracts .51200* .18751 .009 .1350 .8890
Group 12: Diabetic +
methanol leaf and fruit
extracts
Group 1=Normal Control -.74800* .18751 .000 -1.1250 -.3710
Group 2=Diabetic Untreated .31400 .18751 .101 -.0630 .6910
Group 3=Standard Control -.48000* .18751 .014 -.8570 -.1030
Group 4=Diabetic + n-hexane leaf extract -.25400 .18751 .182 -.6310 .1230
Group 5=Diabetic + n-hexane fruit extract -.27800 .18751 .145 -.6550 .0990
Group 6=Diabetic + ethanol leaf extract -.33800 .18751 .078 -.7150 .0390
Group 7=Diabetic + ethanol fruit extract -.30600 .18751 .109 -.6830 .0710
Group 8=Diabetic + methanol leaf extract -.10600 .18751 .574 -.4830 .2710
Group 9=Diabetic + methanol fruit extract -.39800* .18751 .039 -.7750 -.0210
Group 10=Diabetic + n-hexane leaf and fruit extracts -.58600* .18751 .003 -.9630 -.2090
Group 11=Diabetic + ethanol leaf and fruit extracts -.51200* .18751 .009 -.8890 -.1350
LDL LSD Group 1=Normal Control Group 2=Diabetic Untreated -1.32200* .38423 .001 -2.0945 -.5495
Group 3=Standard Control -.58000 .38423 .138 -1.3525 .1925
Group 4=Diabetic + n-hexane leaf extract -1.08800* .38423 .007 -1.8605 -.3155
Group 5=Diabetic + n-hexane fruit extract -.66800 .38423 .089 -1.4405 .1045
Group 6=Diabetic + ethanol leaf extract -.81200* .38423 .040 -1.5845 -.0395
Group 7=Diabetic + ethanol fruit extract -.77200 .38423 .050 -1.5445 .0005
Group 8=Diabetic + methanol leaf extract -.65600 .38423 .094 -1.4285 .1165
Group 9=Diabetic + methanol fruit extract -.76600 .38423 .052 -1.5385 .0065
Group 10=Diabetic + n-hexane leaf and fruit extracts -.50000 .38423 .199 -1.2725 .2725
Group 11=Diabetic + ethanol leaf and fruit extracts -.70000 .38423 .075 -1.4725 .0725
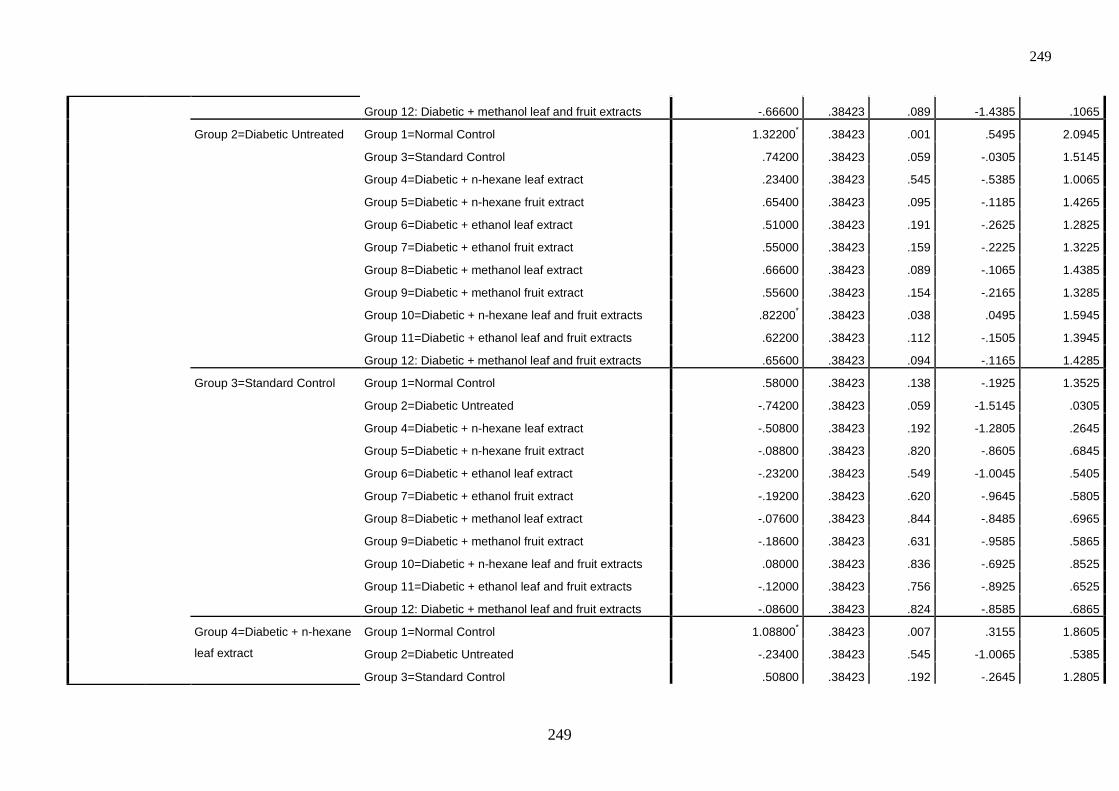
249
249
Group 12: Diabetic + methanol leaf and fruit extracts -.66600 .38423 .089 -1.4385 .1065
Group 2=Diabetic Untreated Group 1=Normal Control 1.32200* .38423 .001 .5495 2.0945
Group 3=Standard Control .74200 .38423 .059 -.0305 1.5145
Group 4=Diabetic + n-hexane leaf extract .23400 .38423 .545 -.5385 1.0065
Group 5=Diabetic + n-hexane fruit extract .65400 .38423 .095 -.1185 1.4265
Group 6=Diabetic + ethanol leaf extract .51000 .38423 .191 -.2625 1.2825
Group 7=Diabetic + ethanol fruit extract .55000 .38423 .159 -.2225 1.3225
Group 8=Diabetic + methanol leaf extract .66600 .38423 .089 -.1065 1.4385
Group 9=Diabetic + methanol fruit extract .55600 .38423 .154 -.2165 1.3285
Group 10=Diabetic + n-hexane leaf and fruit extracts .82200* .38423 .038 .0495 1.5945
Group 11=Diabetic + ethanol leaf and fruit extracts .62200 .38423 .112 -.1505 1.3945
Group 12: Diabetic + methanol leaf and fruit extracts .65600 .38423 .094 -.1165 1.4285
Group 3=Standard Control Group 1=Normal Control .58000 .38423 .138 -.1925 1.3525
Group 2=Diabetic Untreated -.74200 .38423 .059 -1.5145 .0305
Group 4=Diabetic + n-hexane leaf extract -.50800 .38423 .192 -1.2805 .2645
Group 5=Diabetic + n-hexane fruit extract -.08800 .38423 .820 -.8605 .6845
Group 6=Diabetic + ethanol leaf extract -.23200 .38423 .549 -1.0045 .5405
Group 7=Diabetic + ethanol fruit extract -.19200 .38423 .620 -.9645 .5805
Group 8=Diabetic + methanol leaf extract -.07600 .38423 .844 -.8485 .6965
Group 9=Diabetic + methanol fruit extract -.18600 .38423 .631 -.9585 .5865
Group 10=Diabetic + n-hexane leaf and fruit extracts .08000 .38423 .836 -.6925 .8525
Group 11=Diabetic + ethanol leaf and fruit extracts -.12000 .38423 .756 -.8925 .6525
Group 12: Diabetic + methanol leaf and fruit extracts -.08600 .38423 .824 -.8585 .6865
Group 4=Diabetic + n-hexane
leaf extract
Group 1=Normal Control 1.08800* .38423 .007 .3155 1.8605
Group 2=Diabetic Untreated -.23400 .38423 .545 -1.0065 .5385
Group 3=Standard Control .50800 .38423 .192 -.2645 1.2805
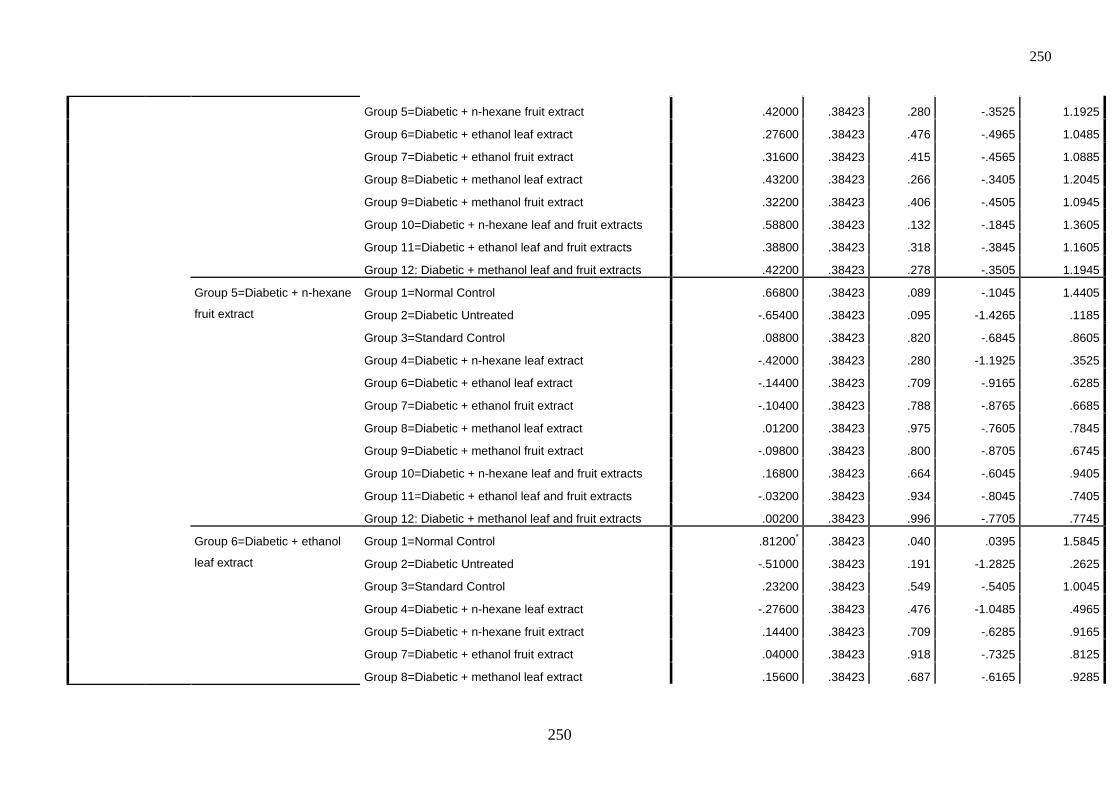
250
250
Group 5=Diabetic + n-hexane fruit extract .42000 .38423 .280 -.3525 1.1925
Group 6=Diabetic + ethanol leaf extract .27600 .38423 .476 -.4965 1.0485
Group 7=Diabetic + ethanol fruit extract .31600 .38423 .415 -.4565 1.0885
Group 8=Diabetic + methanol leaf extract .43200 .38423 .266 -.3405 1.2045
Group 9=Diabetic + methanol fruit extract .32200 .38423 .406 -.4505 1.0945
Group 10=Diabetic + n-hexane leaf and fruit extracts .58800 .38423 .132 -.1845 1.3605
Group 11=Diabetic + ethanol leaf and fruit extracts .38800 .38423 .318 -.3845 1.1605
Group 12: Diabetic + methanol leaf and fruit extracts .42200 .38423 .278 -.3505 1.1945
Group 5=Diabetic + n-hexane
fruit extract
Group 1=Normal Control .66800 .38423 .089 -.1045 1.4405
Group 2=Diabetic Untreated -.65400 .38423 .095 -1.4265 .1185
Group 3=Standard Control .08800 .38423 .820 -.6845 .8605
Group 4=Diabetic + n-hexane leaf extract -.42000 .38423 .280 -1.1925 .3525
Group 6=Diabetic + ethanol leaf extract -.14400 .38423 .709 -.9165 .6285
Group 7=Diabetic + ethanol fruit extract -.10400 .38423 .788 -.8765 .6685
Group 8=Diabetic + methanol leaf extract .01200 .38423 .975 -.7605 .7845
Group 9=Diabetic + methanol fruit extract -.09800 .38423 .800 -.8705 .6745
Group 10=Diabetic + n-hexane leaf and fruit extracts .16800 .38423 .664 -.6045 .9405
Group 11=Diabetic + ethanol leaf and fruit extracts -.03200 .38423 .934 -.8045 .7405
Group 12: Diabetic + methanol leaf and fruit extracts .00200 .38423 .996 -.7705 .7745
Group 6=Diabetic + ethanol
leaf extract
Group 1=Normal Control .81200* .38423 .040 .0395 1.5845
Group 2=Diabetic Untreated -.51000 .38423 .191 -1.2825 .2625
Group 3=Standard Control .23200 .38423 .549 -.5405 1.0045
Group 4=Diabetic + n-hexane leaf extract -.27600 .38423 .476 -1.0485 .4965
Group 5=Diabetic + n-hexane fruit extract .14400 .38423 .709 -.6285 .9165
Group 7=Diabetic + ethanol fruit extract .04000 .38423 .918 -.7325 .8125
Group 8=Diabetic + methanol leaf extract .15600 .38423 .687 -.6165 .9285
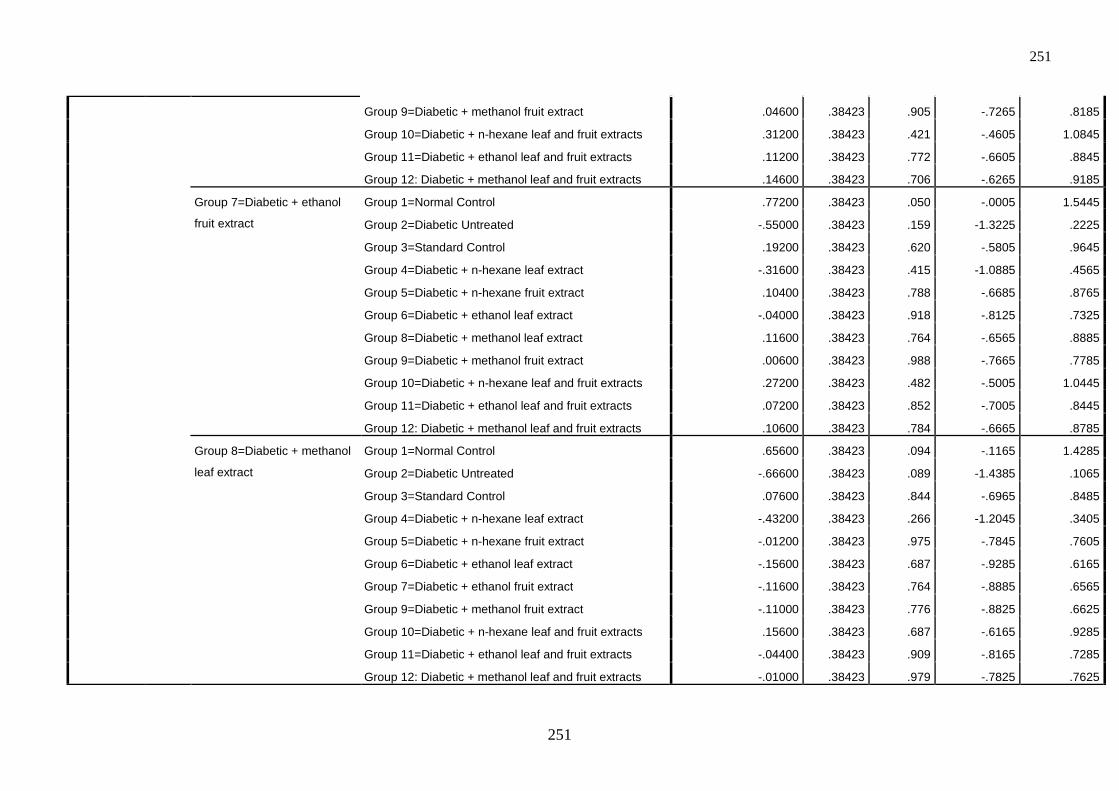
251
251
Group 9=Diabetic + methanol fruit extract .04600 .38423 .905 -.7265 .8185
Group 10=Diabetic + n-hexane leaf and fruit extracts .31200 .38423 .421 -.4605 1.0845
Group 11=Diabetic + ethanol leaf and fruit extracts .11200 .38423 .772 -.6605 .8845
Group 12: Diabetic + methanol leaf and fruit extracts .14600 .38423 .706 -.6265 .9185
Group 7=Diabetic + ethanol
fruit extract
Group 1=Normal Control .77200 .38423 .050 -.0005 1.5445
Group 2=Diabetic Untreated -.55000 .38423 .159 -1.3225 .2225
Group 3=Standard Control .19200 .38423 .620 -.5805 .9645
Group 4=Diabetic + n-hexane leaf extract -.31600 .38423 .415 -1.0885 .4565
Group 5=Diabetic + n-hexane fruit extract .10400 .38423 .788 -.6685 .8765
Group 6=Diabetic + ethanol leaf extract -.04000 .38423 .918 -.8125 .7325
Group 8=Diabetic + methanol leaf extract .11600 .38423 .764 -.6565 .8885
Group 9=Diabetic + methanol fruit extract .00600 .38423 .988 -.7665 .7785
Group 10=Diabetic + n-hexane leaf and fruit extracts .27200 .38423 .482 -.5005 1.0445
Group 11=Diabetic + ethanol leaf and fruit extracts .07200 .38423 .852 -.7005 .8445
Group 12: Diabetic + methanol leaf and fruit extracts .10600 .38423 .784 -.6665 .8785
Group 8=Diabetic + methanol
leaf extract
Group 1=Normal Control .65600 .38423 .094 -.1165 1.4285
Group 2=Diabetic Untreated -.66600 .38423 .089 -1.4385 .1065
Group 3=Standard Control .07600 .38423 .844 -.6965 .8485
Group 4=Diabetic + n-hexane leaf extract -.43200 .38423 .266 -1.2045 .3405
Group 5=Diabetic + n-hexane fruit extract -.01200 .38423 .975 -.7845 .7605
Group 6=Diabetic + ethanol leaf extract -.15600 .38423 .687 -.9285 .6165
Group 7=Diabetic + ethanol fruit extract -.11600 .38423 .764 -.8885 .6565
Group 9=Diabetic + methanol fruit extract -.11000 .38423 .776 -.8825 .6625
Group 10=Diabetic + n-hexane leaf and fruit extracts .15600 .38423 .687 -.6165 .9285
Group 11=Diabetic + ethanol leaf and fruit extracts -.04400 .38423 .909 -.8165 .7285
Group 12: Diabetic + methanol leaf and fruit extracts -.01000 .38423 .979 -.7825 .7625

252
252
Group 9=Diabetic + methanol
fruit extract
Group 1=Normal Control .76600 .38423 .052 -.0065 1.5385
Group 2=Diabetic Untreated -.55600 .38423 .154 -1.3285 .2165
Group 3=Standard Control .18600 .38423 .631 -.5865 .9585
Group 4=Diabetic + n-hexane leaf extract -.32200 .38423 .406 -1.0945 .4505
Group 5=Diabetic + n-hexane fruit extract .09800 .38423 .800 -.6745 .8705
Group 6=Diabetic + ethanol leaf extract -.04600 .38423 .905 -.8185 .7265
Group 7=Diabetic + ethanol fruit extract -.00600 .38423 .988 -.7785 .7665
Group 8=Diabetic + methanol leaf extract .11000 .38423 .776 -.6625 .8825
Group 10=Diabetic + n-hexane leaf and fruit extracts .26600 .38423 .492 -.5065 1.0385
Group 11=Diabetic + ethanol leaf and fruit extracts .06600 .38423 .864 -.7065 .8385
Group 12: Diabetic + methanol leaf and fruit extracts .10000 .38423 .796 -.6725 .8725
Group 10=Diabetic + n-
hexane leaf and fruit extracts
Group 1=Normal Control .50000 .38423 .199 -.2725 1.2725
Group 2=Diabetic Untreated -.82200* .38423 .038 -1.5945 -.0495
Group 3=Standard Control -.08000 .38423 .836 -.8525 .6925
Group 4=Diabetic + n-hexane leaf extract -.58800 .38423 .132 -1.3605 .1845
Group 5=Diabetic + n-hexane fruit extract -.16800 .38423 .664 -.9405 .6045
Group 6=Diabetic + ethanol leaf extract -.31200 .38423 .421 -1.0845 .4605
Group 7=Diabetic + ethanol fruit extract -.27200 .38423 .482 -1.0445 .5005
Group 8=Diabetic + methanol leaf extract -.15600 .38423 .687 -.9285 .6165
Group 9=Diabetic + methanol fruit extract -.26600 .38423 .492 -1.0385 .5065
Group 11=Diabetic + ethanol leaf and fruit extracts -.20000 .38423 .605 -.9725 .5725
Group 12: Diabetic + methanol leaf and fruit extracts -.16600 .38423 .668 -.9385 .6065
Group 11=Diabetic + ethanol
leaf and fruit extracts
Group 1=Normal Control .70000 .38423 .075 -.0725 1.4725
Group 2=Diabetic Untreated -.62200 .38423 .112 -1.3945 .1505
Group 3=Standard Control .12000 .38423 .756 -.6525 .8925
Group 4=Diabetic + n-hexane leaf extract -.38800 .38423 .318 -1.1605 .3845
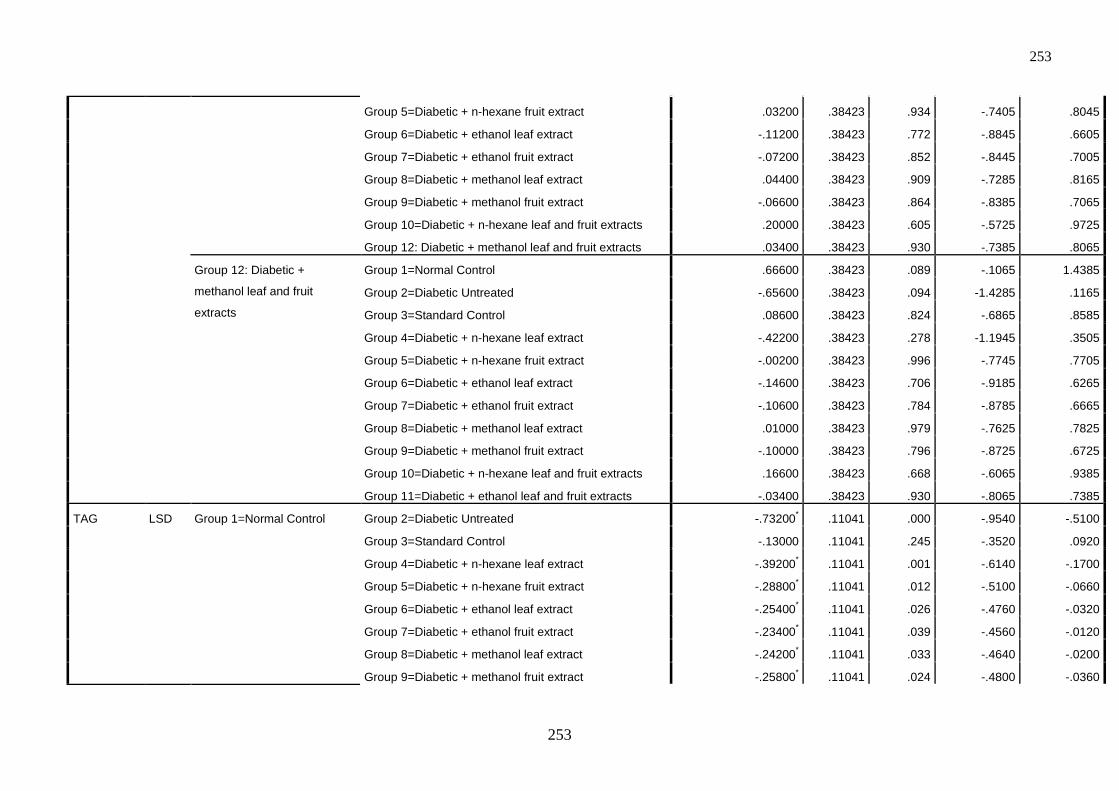
253
253
Group 5=Diabetic + n-hexane fruit extract .03200 .38423 .934 -.7405 .8045
Group 6=Diabetic + ethanol leaf extract -.11200 .38423 .772 -.8845 .6605
Group 7=Diabetic + ethanol fruit extract -.07200 .38423 .852 -.8445 .7005
Group 8=Diabetic + methanol leaf extract .04400 .38423 .909 -.7285 .8165
Group 9=Diabetic + methanol fruit extract -.06600 .38423 .864 -.8385 .7065
Group 10=Diabetic + n-hexane leaf and fruit extracts .20000 .38423 .605 -.5725 .9725
Group 12: Diabetic + methanol leaf and fruit extracts .03400 .38423 .930 -.7385 .8065
Group 12: Diabetic +
methanol leaf and fruit
extracts
Group 1=Normal Control .66600 .38423 .089 -.1065 1.4385
Group 2=Diabetic Untreated -.65600 .38423 .094 -1.4285 .1165
Group 3=Standard Control .08600 .38423 .824 -.6865 .8585
Group 4=Diabetic + n-hexane leaf extract -.42200 .38423 .278 -1.1945 .3505
Group 5=Diabetic + n-hexane fruit extract -.00200 .38423 .996 -.7745 .7705
Group 6=Diabetic + ethanol leaf extract -.14600 .38423 .706 -.9185 .6265
Group 7=Diabetic + ethanol fruit extract -.10600 .38423 .784 -.8785 .6665
Group 8=Diabetic + methanol leaf extract .01000 .38423 .979 -.7625 .7825
Group 9=Diabetic + methanol fruit extract -.10000 .38423 .796 -.8725 .6725
Group 10=Diabetic + n-hexane leaf and fruit extracts .16600 .38423 .668 -.6065 .9385
Group 11=Diabetic + ethanol leaf and fruit extracts -.03400 .38423 .930 -.8065 .7385
TAG LSD Group 1=Normal Control Group 2=Diabetic Untreated -.73200* .11041 .000 -.9540 -.5100
Group 3=Standard Control -.13000 .11041 .245 -.3520 .0920
Group 4=Diabetic + n-hexane leaf extract -.39200* .11041 .001 -.6140 -.1700
Group 5=Diabetic + n-hexane fruit extract -.28800* .11041 .012 -.5100 -.0660
Group 6=Diabetic + ethanol leaf extract -.25400* .11041 .026 -.4760 -.0320
Group 7=Diabetic + ethanol fruit extract -.23400* .11041 .039 -.4560 -.0120
Group 8=Diabetic + methanol leaf extract -.24200* .11041 .033 -.4640 -.0200
Group 9=Diabetic + methanol fruit extract -.25800* .11041 .024 -.4800 -.0360
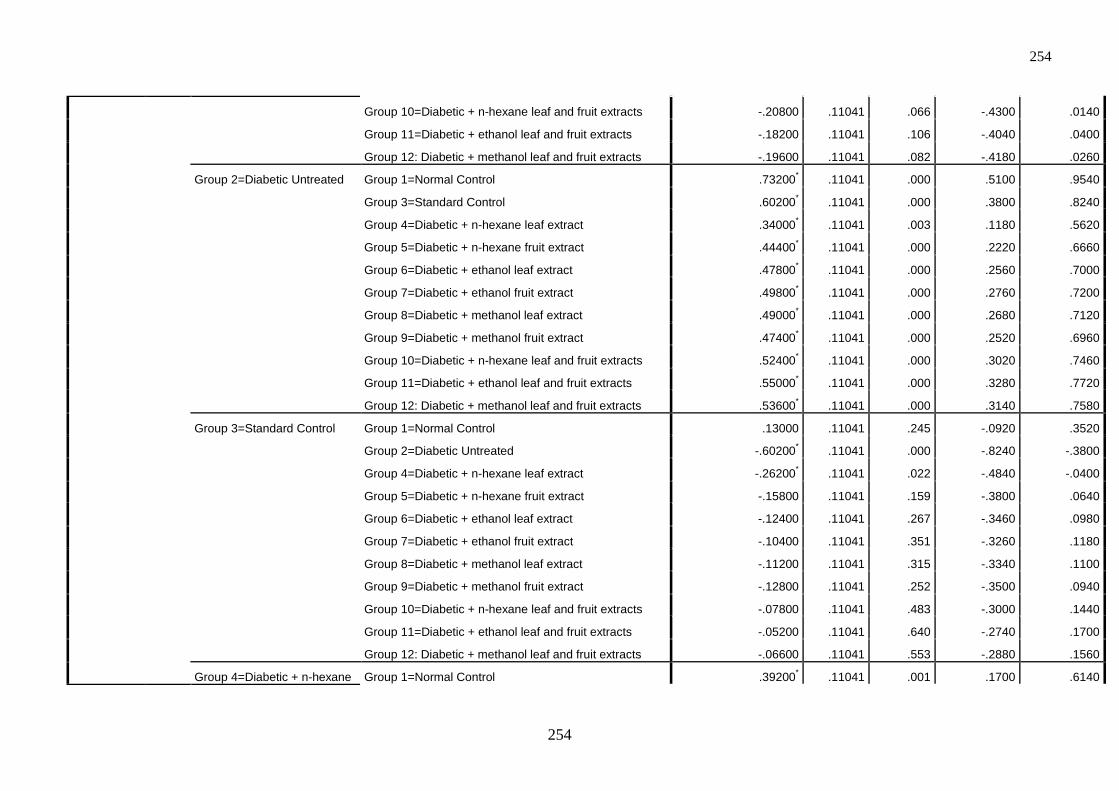
254
254
Group 10=Diabetic + n-hexane leaf and fruit extracts -.20800 .11041 .066 -.4300 .0140
Group 11=Diabetic + ethanol leaf and fruit extracts -.18200 .11041 .106 -.4040 .0400
Group 12: Diabetic + methanol leaf and fruit extracts -.19600 .11041 .082 -.4180 .0260
Group 2=Diabetic Untreated Group 1=Normal Control .73200* .11041 .000 .5100 .9540
Group 3=Standard Control .60200* .11041 .000 .3800 .8240
Group 4=Diabetic + n-hexane leaf extract .34000* .11041 .003 .1180 .5620
Group 5=Diabetic + n-hexane fruit extract .44400* .11041 .000 .2220 .6660
Group 6=Diabetic + ethanol leaf extract .47800* .11041 .000 .2560 .7000
Group 7=Diabetic + ethanol fruit extract .49800* .11041 .000 .2760 .7200
Group 8=Diabetic + methanol leaf extract .49000* .11041 .000 .2680 .7120
Group 9=Diabetic + methanol fruit extract .47400* .11041 .000 .2520 .6960
Group 10=Diabetic + n-hexane leaf and fruit extracts .52400* .11041 .000 .3020 .7460
Group 11=Diabetic + ethanol leaf and fruit extracts .55000* .11041 .000 .3280 .7720
Group 12: Diabetic + methanol leaf and fruit extracts .53600* .11041 .000 .3140 .7580
Group 3=Standard Control Group 1=Normal Control .13000 .11041 .245 -.0920 .3520
Group 2=Diabetic Untreated -.60200* .11041 .000 -.8240 -.3800
Group 4=Diabetic + n-hexane leaf extract -.26200* .11041 .022 -.4840 -.0400
Group 5=Diabetic + n-hexane fruit extract -.15800 .11041 .159 -.3800 .0640
Group 6=Diabetic + ethanol leaf extract -.12400 .11041 .267 -.3460 .0980
Group 7=Diabetic + ethanol fruit extract -.10400 .11041 .351 -.3260 .1180
Group 8=Diabetic + methanol leaf extract -.11200 .11041 .315 -.3340 .1100
Group 9=Diabetic + methanol fruit extract -.12800 .11041 .252 -.3500 .0940
Group 10=Diabetic + n-hexane leaf and fruit extracts -.07800 .11041 .483 -.3000 .1440
Group 11=Diabetic + ethanol leaf and fruit extracts -.05200 .11041 .640 -.2740 .1700
Group 12: Diabetic + methanol leaf and fruit extracts -.06600 .11041 .553 -.2880 .1560
Group 4=Diabetic + n-hexane Group 1=Normal Control .39200* .11041 .001 .1700 .6140
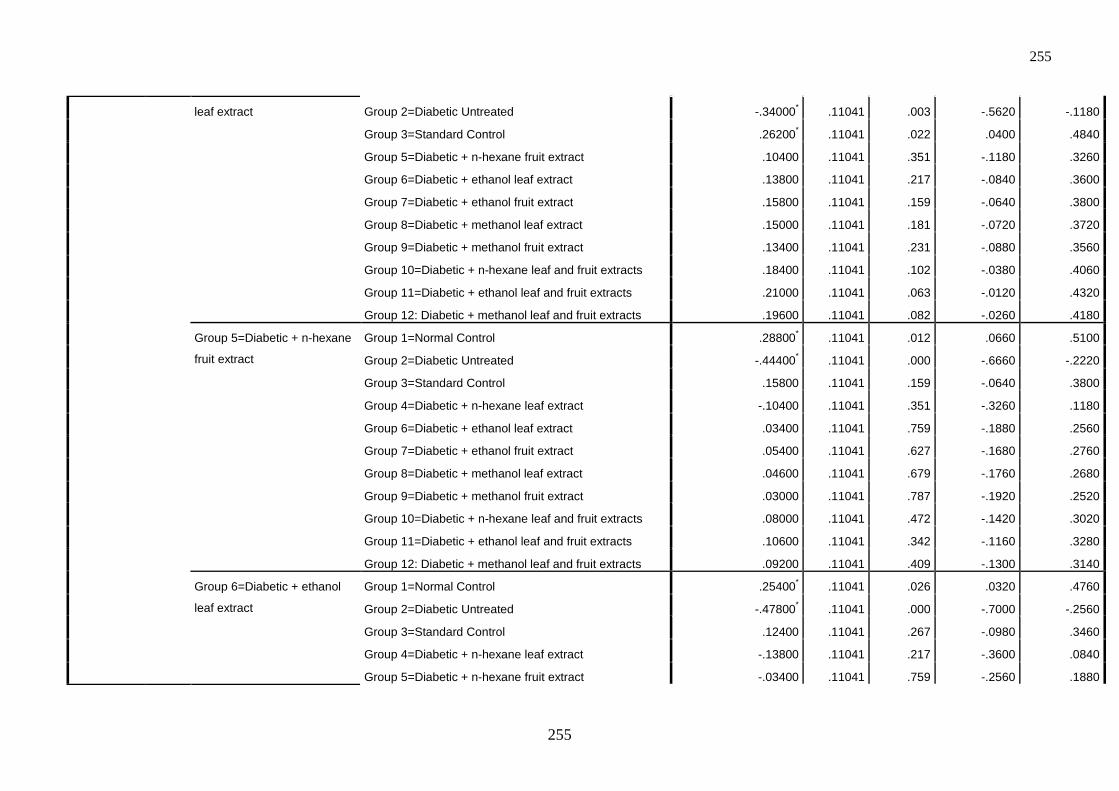
255
255
leaf extract Group 2=Diabetic Untreated -.34000* .11041 .003 -.5620 -.1180
Group 3=Standard Control .26200* .11041 .022 .0400 .4840
Group 5=Diabetic + n-hexane fruit extract .10400 .11041 .351 -.1180 .3260
Group 6=Diabetic + ethanol leaf extract .13800 .11041 .217 -.0840 .3600
Group 7=Diabetic + ethanol fruit extract .15800 .11041 .159 -.0640 .3800
Group 8=Diabetic + methanol leaf extract .15000 .11041 .181 -.0720 .3720
Group 9=Diabetic + methanol fruit extract .13400 .11041 .231 -.0880 .3560
Group 10=Diabetic + n-hexane leaf and fruit extracts .18400 .11041 .102 -.0380 .4060
Group 11=Diabetic + ethanol leaf and fruit extracts .21000 .11041 .063 -.0120 .4320
Group 12: Diabetic + methanol leaf and fruit extracts .19600 .11041 .082 -.0260 .4180
Group 5=Diabetic + n-hexane
fruit extract
Group 1=Normal Control .28800* .11041 .012 .0660 .5100
Group 2=Diabetic Untreated -.44400* .11041 .000 -.6660 -.2220
Group 3=Standard Control .15800 .11041 .159 -.0640 .3800
Group 4=Diabetic + n-hexane leaf extract -.10400 .11041 .351 -.3260 .1180
Group 6=Diabetic + ethanol leaf extract .03400 .11041 .759 -.1880 .2560
Group 7=Diabetic + ethanol fruit extract .05400 .11041 .627 -.1680 .2760
Group 8=Diabetic + methanol leaf extract .04600 .11041 .679 -.1760 .2680
Group 9=Diabetic + methanol fruit extract .03000 .11041 .787 -.1920 .2520
Group 10=Diabetic + n-hexane leaf and fruit extracts .08000 .11041 .472 -.1420 .3020
Group 11=Diabetic + ethanol leaf and fruit extracts .10600 .11041 .342 -.1160 .3280
Group 12: Diabetic + methanol leaf and fruit extracts .09200 .11041 .409 -.1300 .3140
Group 6=Diabetic + ethanol
leaf extract
Group 1=Normal Control .25400* .11041 .026 .0320 .4760
Group 2=Diabetic Untreated -.47800* .11041 .000 -.7000 -.2560
Group 3=Standard Control .12400 .11041 .267 -.0980 .3460
Group 4=Diabetic + n-hexane leaf extract -.13800 .11041 .217 -.3600 .0840
Group 5=Diabetic + n-hexane fruit extract -.03400 .11041 .759 -.2560 .1880

256
256
Group 7=Diabetic + ethanol fruit extract .02000 .11041 .857 -.2020 .2420
Group 8=Diabetic + methanol leaf extract .01200 .11041 .914 -.2100 .2340
Group 9=Diabetic + methanol fruit extract -.00400 .11041 .971 -.2260 .2180
Group 10=Diabetic + n-hexane leaf and fruit extracts .04600 .11041 .679 -.1760 .2680
Group 11=Diabetic + ethanol leaf and fruit extracts .07200 .11041 .517 -.1500 .2940
Group 12: Diabetic + methanol leaf and fruit extracts .05800 .11041 .602 -.1640 .2800
Group 7=Diabetic + ethanol
fruit extract
Group 1=Normal Control .23400* .11041 .039 .0120 .4560
Group 2=Diabetic Untreated -.49800* .11041 .000 -.7200 -.2760
Group 3=Standard Control .10400 .11041 .351 -.1180 .3260
Group 4=Diabetic + n-hexane leaf extract -.15800 .11041 .159 -.3800 .0640
Group 5=Diabetic + n-hexane fruit extract -.05400 .11041 .627 -.2760 .1680
Group 6=Diabetic + ethanol leaf extract -.02000 .11041 .857 -.2420 .2020
Group 8=Diabetic + methanol leaf extract -.00800 .11041 .943 -.2300 .2140
Group 9=Diabetic + methanol fruit extract -.02400 .11041 .829 -.2460 .1980
Group 10=Diabetic + n-hexane leaf and fruit extracts .02600 .11041 .815 -.1960 .2480
Group 11=Diabetic + ethanol leaf and fruit extracts .05200 .11041 .640 -.1700 .2740
Group 12: Diabetic + methanol leaf and fruit extracts .03800 .11041 .732 -.1840 .2600
Group 8=Diabetic + methanol
leaf extract
Group 1=Normal Control .24200* .11041 .033 .0200 .4640
Group 2=Diabetic Untreated -.49000* .11041 .000 -.7120 -.2680
Group 3=Standard Control .11200 .11041 .315 -.1100 .3340
Group 4=Diabetic + n-hexane leaf extract -.15000 .11041 .181 -.3720 .0720
Group 5=Diabetic + n-hexane fruit extract -.04600 .11041 .679 -.2680 .1760
Group 6=Diabetic + ethanol leaf extract -.01200 .11041 .914 -.2340 .2100
Group 7=Diabetic + ethanol fruit extract .00800 .11041 .943 -.2140 .2300
Group 9=Diabetic + methanol fruit extract -.01600 .11041 .885 -.2380 .2060
Group 10=Diabetic + n-hexane leaf and fruit extracts .03400 .11041 .759 -.1880 .2560
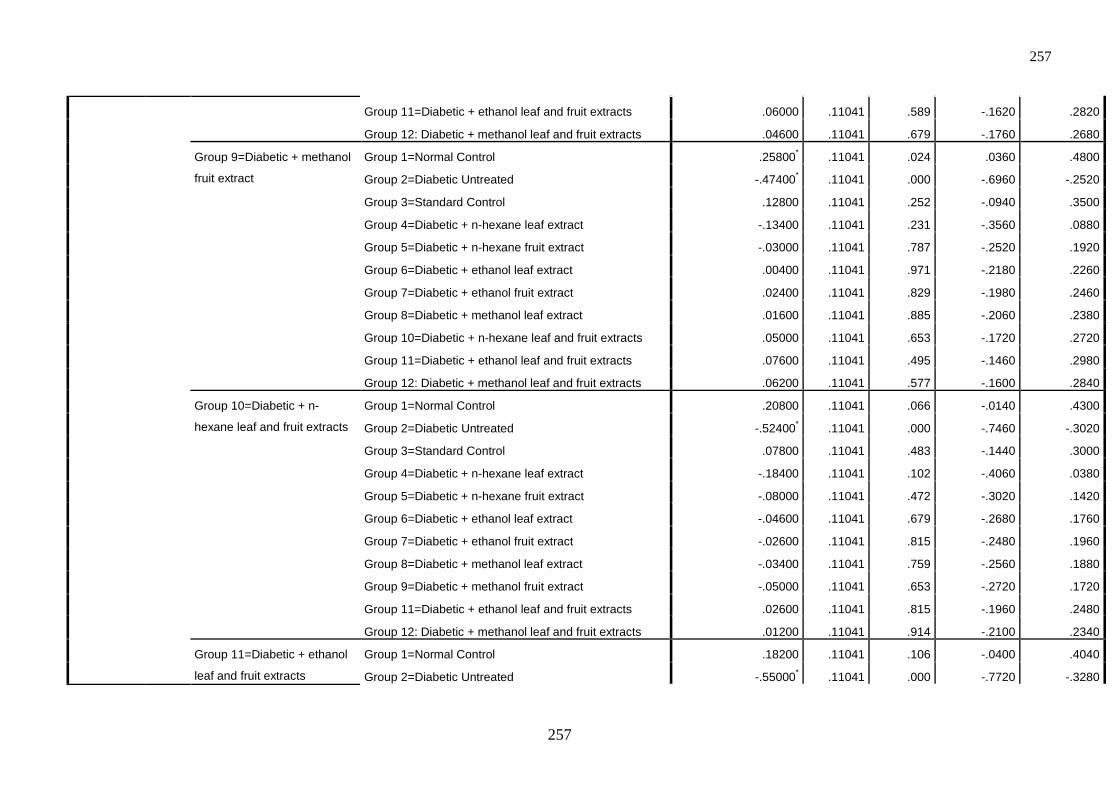
257
257
Group 11=Diabetic + ethanol leaf and fruit extracts .06000 .11041 .589 -.1620 .2820
Group 12: Diabetic + methanol leaf and fruit extracts .04600 .11041 .679 -.1760 .2680
Group 9=Diabetic + methanol
fruit extract
Group 1=Normal Control .25800* .11041 .024 .0360 .4800
Group 2=Diabetic Untreated -.47400* .11041 .000 -.6960 -.2520
Group 3=Standard Control .12800 .11041 .252 -.0940 .3500
Group 4=Diabetic + n-hexane leaf extract -.13400 .11041 .231 -.3560 .0880
Group 5=Diabetic + n-hexane fruit extract -.03000 .11041 .787 -.2520 .1920
Group 6=Diabetic + ethanol leaf extract .00400 .11041 .971 -.2180 .2260
Group 7=Diabetic + ethanol fruit extract .02400 .11041 .829 -.1980 .2460
Group 8=Diabetic + methanol leaf extract .01600 .11041 .885 -.2060 .2380
Group 10=Diabetic + n-hexane leaf and fruit extracts .05000 .11041 .653 -.1720 .2720
Group 11=Diabetic + ethanol leaf and fruit extracts .07600 .11041 .495 -.1460 .2980
Group 12: Diabetic + methanol leaf and fruit extracts .06200 .11041 .577 -.1600 .2840
Group 10=Diabetic + n-
hexane leaf and fruit extracts
Group 1=Normal Control .20800 .11041 .066 -.0140 .4300
Group 2=Diabetic Untreated -.52400* .11041 .000 -.7460 -.3020
Group 3=Standard Control .07800 .11041 .483 -.1440 .3000
Group 4=Diabetic + n-hexane leaf extract -.18400 .11041 .102 -.4060 .0380
Group 5=Diabetic + n-hexane fruit extract -.08000 .11041 .472 -.3020 .1420
Group 6=Diabetic + ethanol leaf extract -.04600 .11041 .679 -.2680 .1760
Group 7=Diabetic + ethanol fruit extract -.02600 .11041 .815 -.2480 .1960
Group 8=Diabetic + methanol leaf extract -.03400 .11041 .759 -.2560 .1880
Group 9=Diabetic + methanol fruit extract -.05000 .11041 .653 -.2720 .1720
Group 11=Diabetic + ethanol leaf and fruit extracts .02600 .11041 .815 -.1960 .2480
Group 12: Diabetic + methanol leaf and fruit extracts .01200 .11041 .914 -.2100 .2340
Group 11=Diabetic + ethanol
leaf and fruit extracts
Group 1=Normal Control .18200 .11041 .106 -.0400 .4040
Group 2=Diabetic Untreated -.55000* .11041 .000 -.7720 -.3280
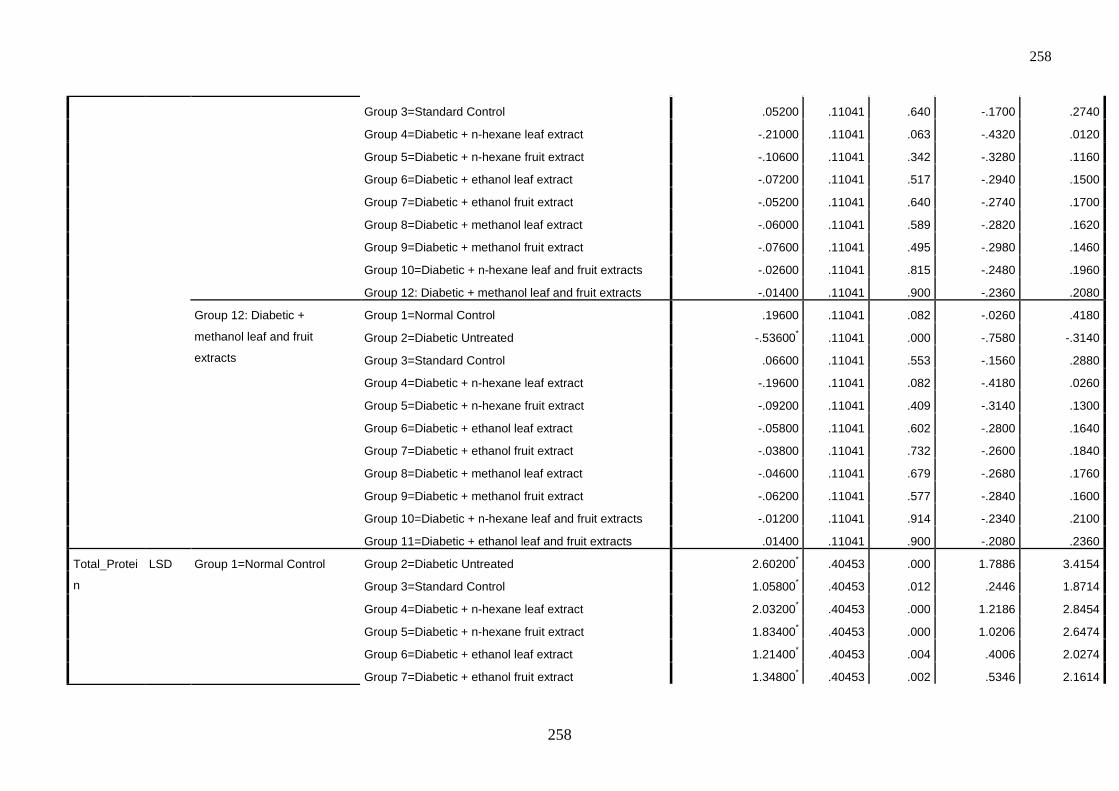
258
258
Group 3=Standard Control .05200 .11041 .640 -.1700 .2740
Group 4=Diabetic + n-hexane leaf extract -.21000 .11041 .063 -.4320 .0120
Group 5=Diabetic + n-hexane fruit extract -.10600 .11041 .342 -.3280 .1160
Group 6=Diabetic + ethanol leaf extract -.07200 .11041 .517 -.2940 .1500
Group 7=Diabetic + ethanol fruit extract -.05200 .11041 .640 -.2740 .1700
Group 8=Diabetic + methanol leaf extract -.06000 .11041 .589 -.2820 .1620
Group 9=Diabetic + methanol fruit extract -.07600 .11041 .495 -.2980 .1460
Group 10=Diabetic + n-hexane leaf and fruit extracts -.02600 .11041 .815 -.2480 .1960
Group 12: Diabetic + methanol leaf and fruit extracts -.01400 .11041 .900 -.2360 .2080
Group 12: Diabetic +
methanol leaf and fruit
extracts
Group 1=Normal Control .19600 .11041 .082 -.0260 .4180
Group 2=Diabetic Untreated -.53600* .11041 .000 -.7580 -.3140
Group 3=Standard Control .06600 .11041 .553 -.1560 .2880
Group 4=Diabetic + n-hexane leaf extract -.19600 .11041 .082 -.4180 .0260
Group 5=Diabetic + n-hexane fruit extract -.09200 .11041 .409 -.3140 .1300
Group 6=Diabetic + ethanol leaf extract -.05800 .11041 .602 -.2800 .1640
Group 7=Diabetic + ethanol fruit extract -.03800 .11041 .732 -.2600 .1840
Group 8=Diabetic + methanol leaf extract -.04600 .11041 .679 -.2680 .1760
Group 9=Diabetic + methanol fruit extract -.06200 .11041 .577 -.2840 .1600
Group 10=Diabetic + n-hexane leaf and fruit extracts -.01200 .11041 .914 -.2340 .2100
Group 11=Diabetic + ethanol leaf and fruit extracts .01400 .11041 .900 -.2080 .2360
Total_Protei
n
LSD Group 1=Normal Control Group 2=Diabetic Untreated 2.60200* .40453 .000 1.7886 3.4154
Group 3=Standard Control 1.05800* .40453 .012 .2446 1.8714
Group 4=Diabetic + n-hexane leaf extract 2.03200* .40453 .000 1.2186 2.8454
Group 5=Diabetic + n-hexane fruit extract 1.83400* .40453 .000 1.0206 2.6474
Group 6=Diabetic + ethanol leaf extract 1.21400* .40453 .004 .4006 2.0274
Group 7=Diabetic + ethanol fruit extract 1.34800* .40453 .002 .5346 2.1614
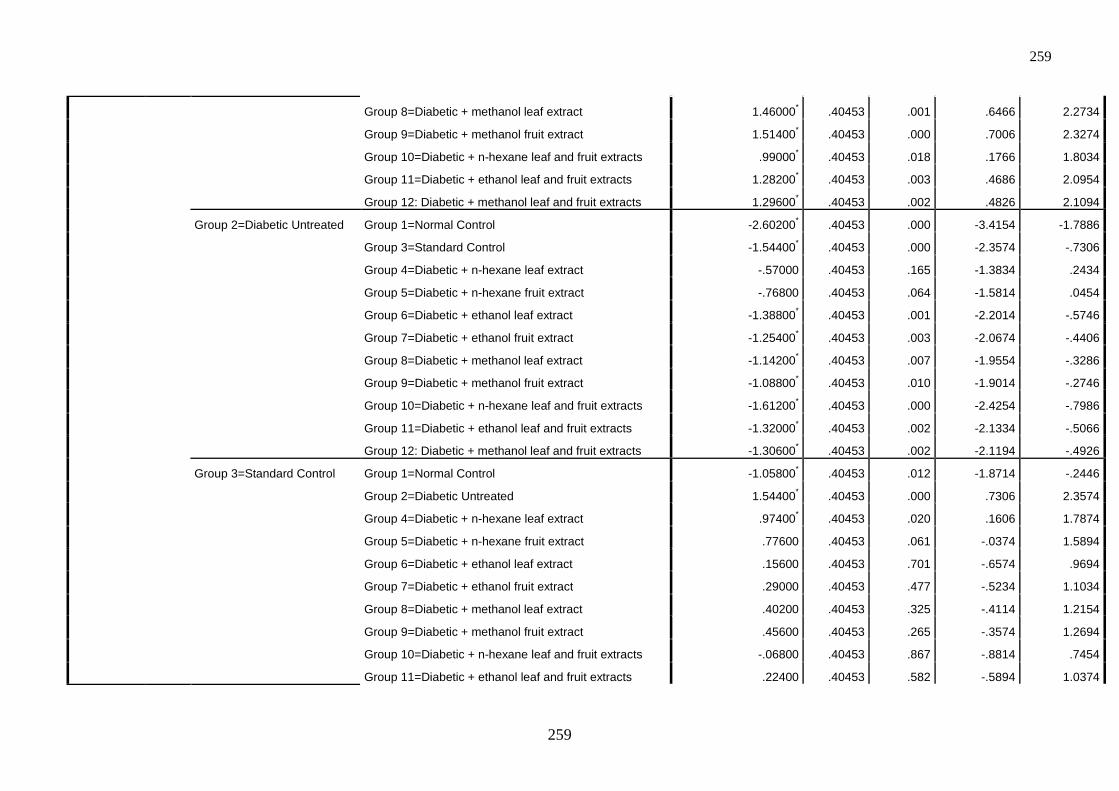
259
259
Group 8=Diabetic + methanol leaf extract 1.46000* .40453 .001 .6466 2.2734
Group 9=Diabetic + methanol fruit extract 1.51400* .40453 .000 .7006 2.3274
Group 10=Diabetic + n-hexane leaf and fruit extracts .99000* .40453 .018 .1766 1.8034
Group 11=Diabetic + ethanol leaf and fruit extracts 1.28200* .40453 .003 .4686 2.0954
Group 12: Diabetic + methanol leaf and fruit extracts 1.29600* .40453 .002 .4826 2.1094
Group 2=Diabetic Untreated Group 1=Normal Control -2.60200* .40453 .000 -3.4154 -1.7886
Group 3=Standard Control -1.54400* .40453 .000 -2.3574 -.7306
Group 4=Diabetic + n-hexane leaf extract -.57000 .40453 .165 -1.3834 .2434
Group 5=Diabetic + n-hexane fruit extract -.76800 .40453 .064 -1.5814 .0454
Group 6=Diabetic + ethanol leaf extract -1.38800* .40453 .001 -2.2014 -.5746
Group 7=Diabetic + ethanol fruit extract -1.25400* .40453 .003 -2.0674 -.4406
Group 8=Diabetic + methanol leaf extract -1.14200* .40453 .007 -1.9554 -.3286
Group 9=Diabetic + methanol fruit extract -1.08800* .40453 .010 -1.9014 -.2746
Group 10=Diabetic + n-hexane leaf and fruit extracts -1.61200* .40453 .000 -2.4254 -.7986
Group 11=Diabetic + ethanol leaf and fruit extracts -1.32000* .40453 .002 -2.1334 -.5066
Group 12: Diabetic + methanol leaf and fruit extracts -1.30600* .40453 .002 -2.1194 -.4926
Group 3=Standard Control Group 1=Normal Control -1.05800* .40453 .012 -1.8714 -.2446
Group 2=Diabetic Untreated 1.54400* .40453 .000 .7306 2.3574
Group 4=Diabetic + n-hexane leaf extract .97400* .40453 .020 .1606 1.7874
Group 5=Diabetic + n-hexane fruit extract .77600 .40453 .061 -.0374 1.5894
Group 6=Diabetic + ethanol leaf extract .15600 .40453 .701 -.6574 .9694
Group 7=Diabetic + ethanol fruit extract .29000 .40453 .477 -.5234 1.1034
Group 8=Diabetic + methanol leaf extract .40200 .40453 .325 -.4114 1.2154
Group 9=Diabetic + methanol fruit extract .45600 .40453 .265 -.3574 1.2694
Group 10=Diabetic + n-hexane leaf and fruit extracts -.06800 .40453 .867 -.8814 .7454
Group 11=Diabetic + ethanol leaf and fruit extracts .22400 .40453 .582 -.5894 1.0374

260
260
Group 12: Diabetic + methanol leaf and fruit extracts .23800 .40453 .559 -.5754 1.0514
Group 4=Diabetic + n-hexane
leaf extract
Group 1=Normal Control -2.03200* .40453 .000 -2.8454 -1.2186
Group 2=Diabetic Untreated .57000 .40453 .165 -.2434 1.3834
Group 3=Standard Control -.97400* .40453 .020 -1.7874 -.1606
Group 5=Diabetic + n-hexane fruit extract -.19800 .40453 .627 -1.0114 .6154
Group 6=Diabetic + ethanol leaf extract -.81800* .40453 .049 -1.6314 -.0046
Group 7=Diabetic + ethanol fruit extract -.68400 .40453 .097 -1.4974 .1294
Group 8=Diabetic + methanol leaf extract -.57200 .40453 .164 -1.3854 .2414
Group 9=Diabetic + methanol fruit extract -.51800 .40453 .207 -1.3314 .2954
Group 10=Diabetic + n-hexane leaf and fruit extracts -1.04200* .40453 .013 -1.8554 -.2286
Group 11=Diabetic + ethanol leaf and fruit extracts -.75000 .40453 .070 -1.5634 .0634
Group 12: Diabetic + methanol leaf and fruit extracts -.73600 .40453 .075 -1.5494 .0774
Group 5=Diabetic + n-hexane
fruit extract
Group 1=Normal Control -1.83400* .40453 .000 -2.6474 -1.0206
Group 2=Diabetic Untreated .76800 .40453 .064 -.0454 1.5814
Group 3=Standard Control -.77600 .40453 .061 -1.5894 .0374
Group 4=Diabetic + n-hexane leaf extract .19800 .40453 .627 -.6154 1.0114
Group 6=Diabetic + ethanol leaf extract -.62000 .40453 .132 -1.4334 .1934
Group 7=Diabetic + ethanol fruit extract -.48600 .40453 .235 -1.2994 .3274
Group 8=Diabetic + methanol leaf extract -.37400 .40453 .360 -1.1874 .4394
Group 9=Diabetic + methanol fruit extract -.32000 .40453 .433 -1.1334 .4934
Group 10=Diabetic + n-hexane leaf and fruit extracts -.84400* .40453 .042 -1.6574 -.0306
Group 11=Diabetic + ethanol leaf and fruit extracts -.55200 .40453 .179 -1.3654 .2614
Group 12: Diabetic + methanol leaf and fruit extracts -.53800 .40453 .190 -1.3514 .2754
Group 6=Diabetic + ethanol
leaf extract
Group 1=Normal Control -1.21400* .40453 .004 -2.0274 -.4006
Group 2=Diabetic Untreated 1.38800* .40453 .001 .5746 2.2014
Group 3=Standard Control -.15600 .40453 .701 -.9694 .6574
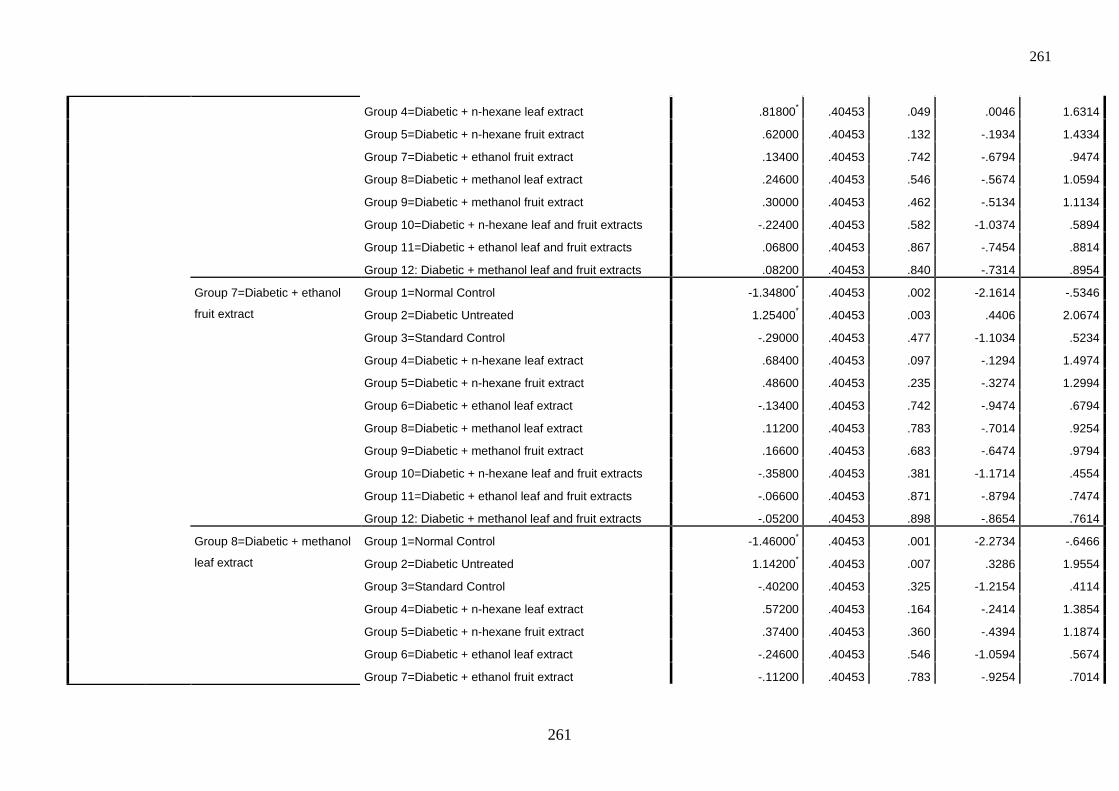
261
261
Group 4=Diabetic + n-hexane leaf extract .81800* .40453 .049 .0046 1.6314
Group 5=Diabetic + n-hexane fruit extract .62000 .40453 .132 -.1934 1.4334
Group 7=Diabetic + ethanol fruit extract .13400 .40453 .742 -.6794 .9474
Group 8=Diabetic + methanol leaf extract .24600 .40453 .546 -.5674 1.0594
Group 9=Diabetic + methanol fruit extract .30000 .40453 .462 -.5134 1.1134
Group 10=Diabetic + n-hexane leaf and fruit extracts -.22400 .40453 .582 -1.0374 .5894
Group 11=Diabetic + ethanol leaf and fruit extracts .06800 .40453 .867 -.7454 .8814
Group 12: Diabetic + methanol leaf and fruit extracts .08200 .40453 .840 -.7314 .8954
Group 7=Diabetic + ethanol
fruit extract
Group 1=Normal Control -1.34800* .40453 .002 -2.1614 -.5346
Group 2=Diabetic Untreated 1.25400* .40453 .003 .4406 2.0674
Group 3=Standard Control -.29000 .40453 .477 -1.1034 .5234
Group 4=Diabetic + n-hexane leaf extract .68400 .40453 .097 -.1294 1.4974
Group 5=Diabetic + n-hexane fruit extract .48600 .40453 .235 -.3274 1.2994
Group 6=Diabetic + ethanol leaf extract -.13400 .40453 .742 -.9474 .6794
Group 8=Diabetic + methanol leaf extract .11200 .40453 .783 -.7014 .9254
Group 9=Diabetic + methanol fruit extract .16600 .40453 .683 -.6474 .9794
Group 10=Diabetic + n-hexane leaf and fruit extracts -.35800 .40453 .381 -1.1714 .4554
Group 11=Diabetic + ethanol leaf and fruit extracts -.06600 .40453 .871 -.8794 .7474
Group 12: Diabetic + methanol leaf and fruit extracts -.05200 .40453 .898 -.8654 .7614
Group 8=Diabetic + methanol
leaf extract
Group 1=Normal Control -1.46000* .40453 .001 -2.2734 -.6466
Group 2=Diabetic Untreated 1.14200* .40453 .007 .3286 1.9554
Group 3=Standard Control -.40200 .40453 .325 -1.2154 .4114
Group 4=Diabetic + n-hexane leaf extract .57200 .40453 .164 -.2414 1.3854
Group 5=Diabetic + n-hexane fruit extract .37400 .40453 .360 -.4394 1.1874
Group 6=Diabetic + ethanol leaf extract -.24600 .40453 .546 -1.0594 .5674
Group 7=Diabetic + ethanol fruit extract -.11200 .40453 .783 -.9254 .7014
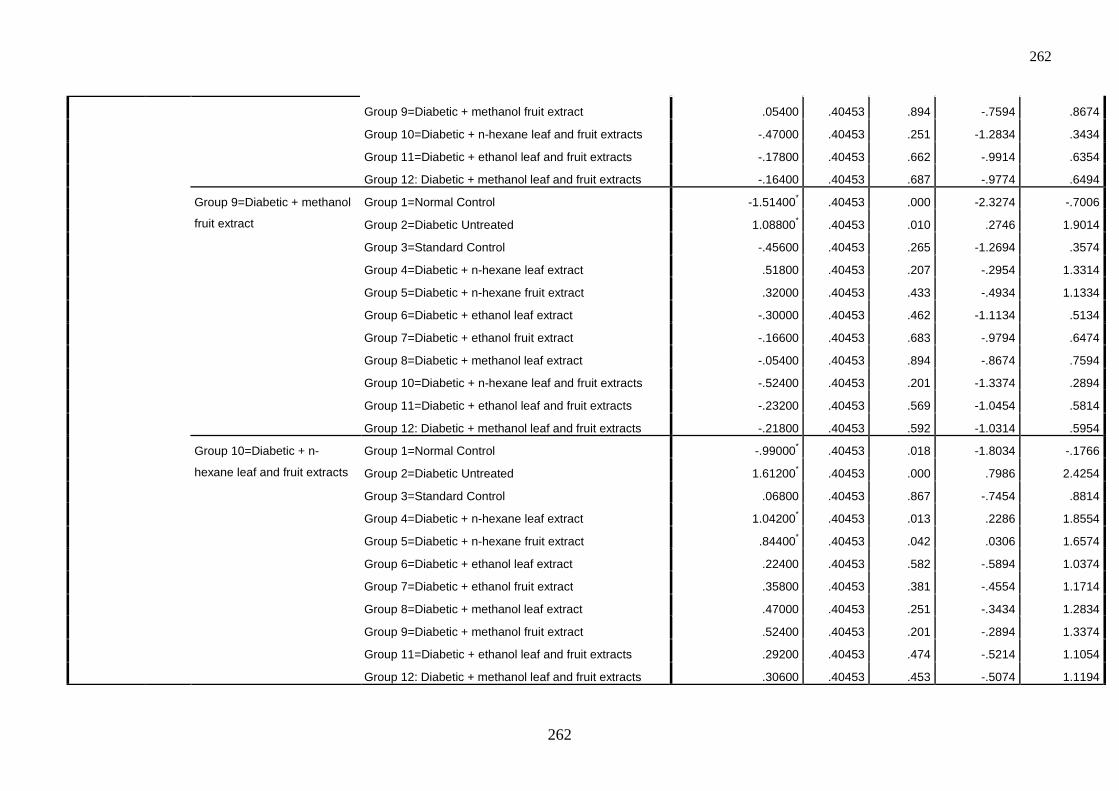
262
262
Group 9=Diabetic + methanol fruit extract .05400 .40453 .894 -.7594 .8674
Group 10=Diabetic + n-hexane leaf and fruit extracts -.47000 .40453 .251 -1.2834 .3434
Group 11=Diabetic + ethanol leaf and fruit extracts -.17800 .40453 .662 -.9914 .6354
Group 12: Diabetic + methanol leaf and fruit extracts -.16400 .40453 .687 -.9774 .6494
Group 9=Diabetic + methanol
fruit extract
Group 1=Normal Control -1.51400* .40453 .000 -2.3274 -.7006
Group 2=Diabetic Untreated 1.08800* .40453 .010 .2746 1.9014
Group 3=Standard Control -.45600 .40453 .265 -1.2694 .3574
Group 4=Diabetic + n-hexane leaf extract .51800 .40453 .207 -.2954 1.3314
Group 5=Diabetic + n-hexane fruit extract .32000 .40453 .433 -.4934 1.1334
Group 6=Diabetic + ethanol leaf extract -.30000 .40453 .462 -1.1134 .5134
Group 7=Diabetic + ethanol fruit extract -.16600 .40453 .683 -.9794 .6474
Group 8=Diabetic + methanol leaf extract -.05400 .40453 .894 -.8674 .7594
Group 10=Diabetic + n-hexane leaf and fruit extracts -.52400 .40453 .201 -1.3374 .2894
Group 11=Diabetic + ethanol leaf and fruit extracts -.23200 .40453 .569 -1.0454 .5814
Group 12: Diabetic + methanol leaf and fruit extracts -.21800 .40453 .592 -1.0314 .5954
Group 10=Diabetic + n-
hexane leaf and fruit extracts
Group 1=Normal Control -.99000* .40453 .018 -1.8034 -.1766
Group 2=Diabetic Untreated 1.61200* .40453 .000 .7986 2.4254
Group 3=Standard Control .06800 .40453 .867 -.7454 .8814
Group 4=Diabetic + n-hexane leaf extract 1.04200* .40453 .013 .2286 1.8554
Group 5=Diabetic + n-hexane fruit extract .84400* .40453 .042 .0306 1.6574
Group 6=Diabetic + ethanol leaf extract .22400 .40453 .582 -.5894 1.0374
Group 7=Diabetic + ethanol fruit extract .35800 .40453 .381 -.4554 1.1714
Group 8=Diabetic + methanol leaf extract .47000 .40453 .251 -.3434 1.2834
Group 9=Diabetic + methanol fruit extract .52400 .40453 .201 -.2894 1.3374
Group 11=Diabetic + ethanol leaf and fruit extracts .29200 .40453 .474 -.5214 1.1054
Group 12: Diabetic + methanol leaf and fruit extracts .30600 .40453 .453 -.5074 1.1194
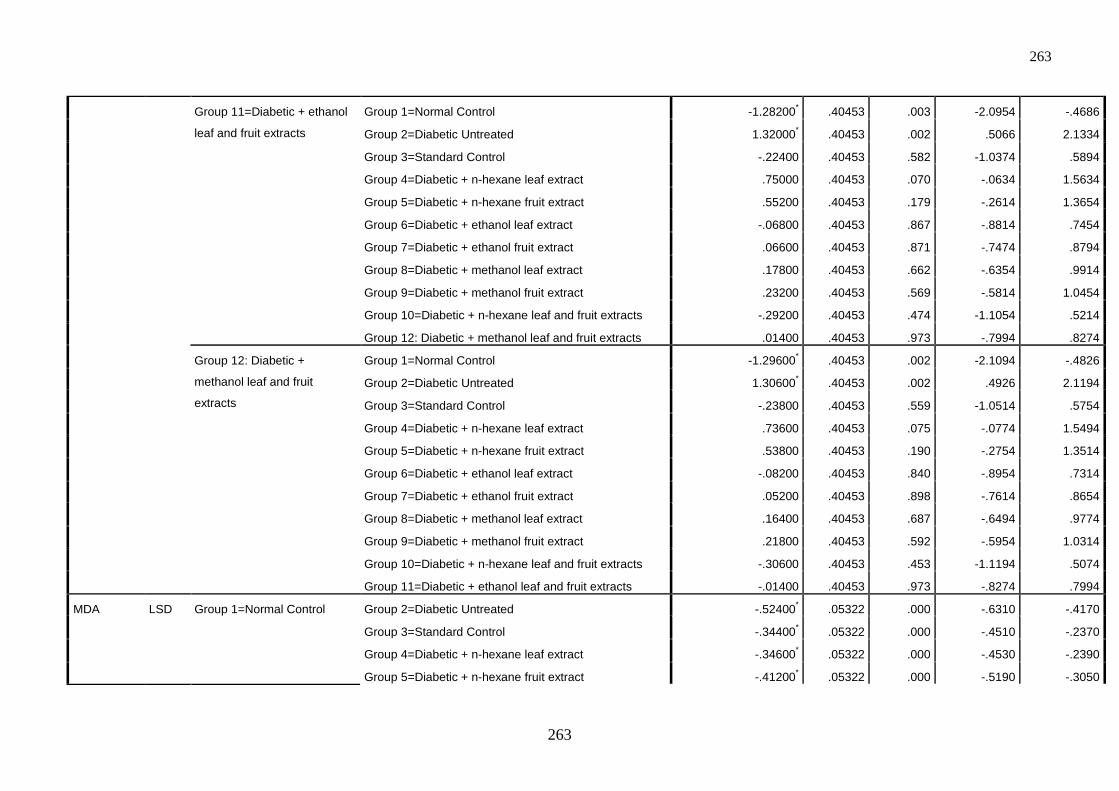
263
263
Group 11=Diabetic + ethanol
leaf and fruit extracts
Group 1=Normal Control -1.28200* .40453 .003 -2.0954 -.4686
Group 2=Diabetic Untreated 1.32000* .40453 .002 .5066 2.1334
Group 3=Standard Control -.22400 .40453 .582 -1.0374 .5894
Group 4=Diabetic + n-hexane leaf extract .75000 .40453 .070 -.0634 1.5634
Group 5=Diabetic + n-hexane fruit extract .55200 .40453 .179 -.2614 1.3654
Group 6=Diabetic + ethanol leaf extract -.06800 .40453 .867 -.8814 .7454
Group 7=Diabetic + ethanol fruit extract .06600 .40453 .871 -.7474 .8794
Group 8=Diabetic + methanol leaf extract .17800 .40453 .662 -.6354 .9914
Group 9=Diabetic + methanol fruit extract .23200 .40453 .569 -.5814 1.0454
Group 10=Diabetic + n-hexane leaf and fruit extracts -.29200 .40453 .474 -1.1054 .5214
Group 12: Diabetic + methanol leaf and fruit extracts .01400 .40453 .973 -.7994 .8274
Group 12: Diabetic +
methanol leaf and fruit
extracts
Group 1=Normal Control -1.29600* .40453 .002 -2.1094 -.4826
Group 2=Diabetic Untreated 1.30600* .40453 .002 .4926 2.1194
Group 3=Standard Control -.23800 .40453 .559 -1.0514 .5754
Group 4=Diabetic + n-hexane leaf extract .73600 .40453 .075 -.0774 1.5494
Group 5=Diabetic + n-hexane fruit extract .53800 .40453 .190 -.2754 1.3514
Group 6=Diabetic + ethanol leaf extract -.08200 .40453 .840 -.8954 .7314
Group 7=Diabetic + ethanol fruit extract .05200 .40453 .898 -.7614 .8654
Group 8=Diabetic + methanol leaf extract .16400 .40453 .687 -.6494 .9774
Group 9=Diabetic + methanol fruit extract .21800 .40453 .592 -.5954 1.0314
Group 10=Diabetic + n-hexane leaf and fruit extracts -.30600 .40453 .453 -1.1194 .5074
Group 11=Diabetic + ethanol leaf and fruit extracts -.01400 .40453 .973 -.8274 .7994
MDA LSD Group 1=Normal Control Group 2=Diabetic Untreated -.52400* .05322 .000 -.6310 -.4170
Group 3=Standard Control -.34400* .05322 .000 -.4510 -.2370
Group 4=Diabetic + n-hexane leaf extract -.34600* .05322 .000 -.4530 -.2390
Group 5=Diabetic + n-hexane fruit extract -.41200* .05322 .000 -.5190 -.3050
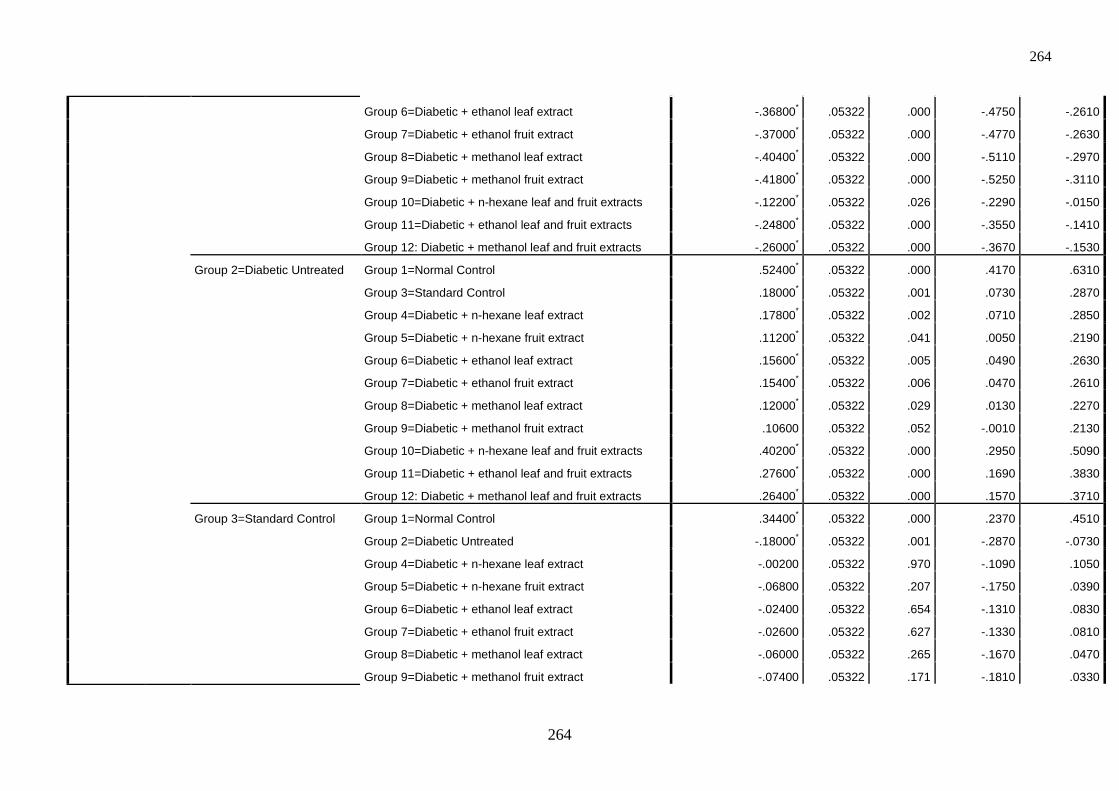
264
264
Group 6=Diabetic + ethanol leaf extract -.36800* .05322 .000 -.4750 -.2610
Group 7=Diabetic + ethanol fruit extract -.37000* .05322 .000 -.4770 -.2630
Group 8=Diabetic + methanol leaf extract -.40400* .05322 .000 -.5110 -.2970
Group 9=Diabetic + methanol fruit extract -.41800* .05322 .000 -.5250 -.3110
Group 10=Diabetic + n-hexane leaf and fruit extracts -.12200* .05322 .026 -.2290 -.0150
Group 11=Diabetic + ethanol leaf and fruit extracts -.24800* .05322 .000 -.3550 -.1410
Group 12: Diabetic + methanol leaf and fruit extracts -.26000* .05322 .000 -.3670 -.1530
Group 2=Diabetic Untreated Group 1=Normal Control .52400* .05322 .000 .4170 .6310
Group 3=Standard Control .18000* .05322 .001 .0730 .2870
Group 4=Diabetic + n-hexane leaf extract .17800* .05322 .002 .0710 .2850
Group 5=Diabetic + n-hexane fruit extract .11200* .05322 .041 .0050 .2190
Group 6=Diabetic + ethanol leaf extract .15600* .05322 .005 .0490 .2630
Group 7=Diabetic + ethanol fruit extract .15400* .05322 .006 .0470 .2610
Group 8=Diabetic + methanol leaf extract .12000* .05322 .029 .0130 .2270
Group 9=Diabetic + methanol fruit extract .10600 .05322 .052 -.0010 .2130
Group 10=Diabetic + n-hexane leaf and fruit extracts .40200* .05322 .000 .2950 .5090
Group 11=Diabetic + ethanol leaf and fruit extracts .27600* .05322 .000 .1690 .3830
Group 12: Diabetic + methanol leaf and fruit extracts .26400* .05322 .000 .1570 .3710
Group 3=Standard Control Group 1=Normal Control .34400* .05322 .000 .2370 .4510
Group 2=Diabetic Untreated -.18000* .05322 .001 -.2870 -.0730
Group 4=Diabetic + n-hexane leaf extract -.00200 .05322 .970 -.1090 .1050
Group 5=Diabetic + n-hexane fruit extract -.06800 .05322 .207 -.1750 .0390
Group 6=Diabetic + ethanol leaf extract -.02400 .05322 .654 -.1310 .0830
Group 7=Diabetic + ethanol fruit extract -.02600 .05322 .627 -.1330 .0810
Group 8=Diabetic + methanol leaf extract -.06000 .05322 .265 -.1670 .0470
Group 9=Diabetic + methanol fruit extract -.07400 .05322 .171 -.1810 .0330
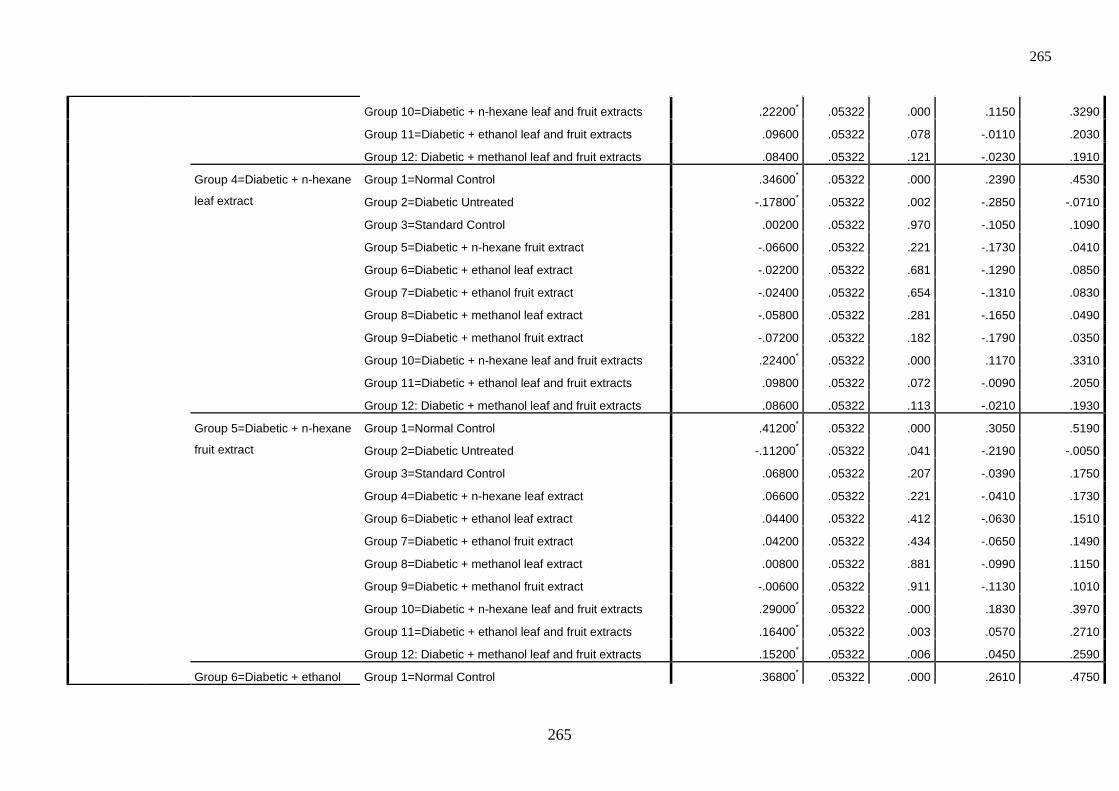
265
265
Group 10=Diabetic + n-hexane leaf and fruit extracts .22200* .05322 .000 .1150 .3290
Group 11=Diabetic + ethanol leaf and fruit extracts .09600 .05322 .078 -.0110 .2030
Group 12: Diabetic + methanol leaf and fruit extracts .08400 .05322 .121 -.0230 .1910
Group 4=Diabetic + n-hexane
leaf extract
Group 1=Normal Control .34600* .05322 .000 .2390 .4530
Group 2=Diabetic Untreated -.17800* .05322 .002 -.2850 -.0710
Group 3=Standard Control .00200 .05322 .970 -.1050 .1090
Group 5=Diabetic + n-hexane fruit extract -.06600 .05322 .221 -.1730 .0410
Group 6=Diabetic + ethanol leaf extract -.02200 .05322 .681 -.1290 .0850
Group 7=Diabetic + ethanol fruit extract -.02400 .05322 .654 -.1310 .0830
Group 8=Diabetic + methanol leaf extract -.05800 .05322 .281 -.1650 .0490
Group 9=Diabetic + methanol fruit extract -.07200 .05322 .182 -.1790 .0350
Group 10=Diabetic + n-hexane leaf and fruit extracts .22400* .05322 .000 .1170 .3310
Group 11=Diabetic + ethanol leaf and fruit extracts .09800 .05322 .072 -.0090 .2050
Group 12: Diabetic + methanol leaf and fruit extracts .08600 .05322 .113 -.0210 .1930
Group 5=Diabetic + n-hexane
fruit extract
Group 1=Normal Control .41200* .05322 .000 .3050 .5190
Group 2=Diabetic Untreated -.11200* .05322 .041 -.2190 -.0050
Group 3=Standard Control .06800 .05322 .207 -.0390 .1750
Group 4=Diabetic + n-hexane leaf extract .06600 .05322 .221 -.0410 .1730
Group 6=Diabetic + ethanol leaf extract .04400 .05322 .412 -.0630 .1510
Group 7=Diabetic + ethanol fruit extract .04200 .05322 .434 -.0650 .1490
Group 8=Diabetic + methanol leaf extract .00800 .05322 .881 -.0990 .1150
Group 9=Diabetic + methanol fruit extract -.00600 .05322 .911 -.1130 .1010
Group 10=Diabetic + n-hexane leaf and fruit extracts .29000* .05322 .000 .1830 .3970
Group 11=Diabetic + ethanol leaf and fruit extracts .16400* .05322 .003 .0570 .2710
Group 12: Diabetic + methanol leaf and fruit extracts .15200* .05322 .006 .0450 .2590
Group 6=Diabetic + ethanol Group 1=Normal Control .36800* .05322 .000 .2610 .4750
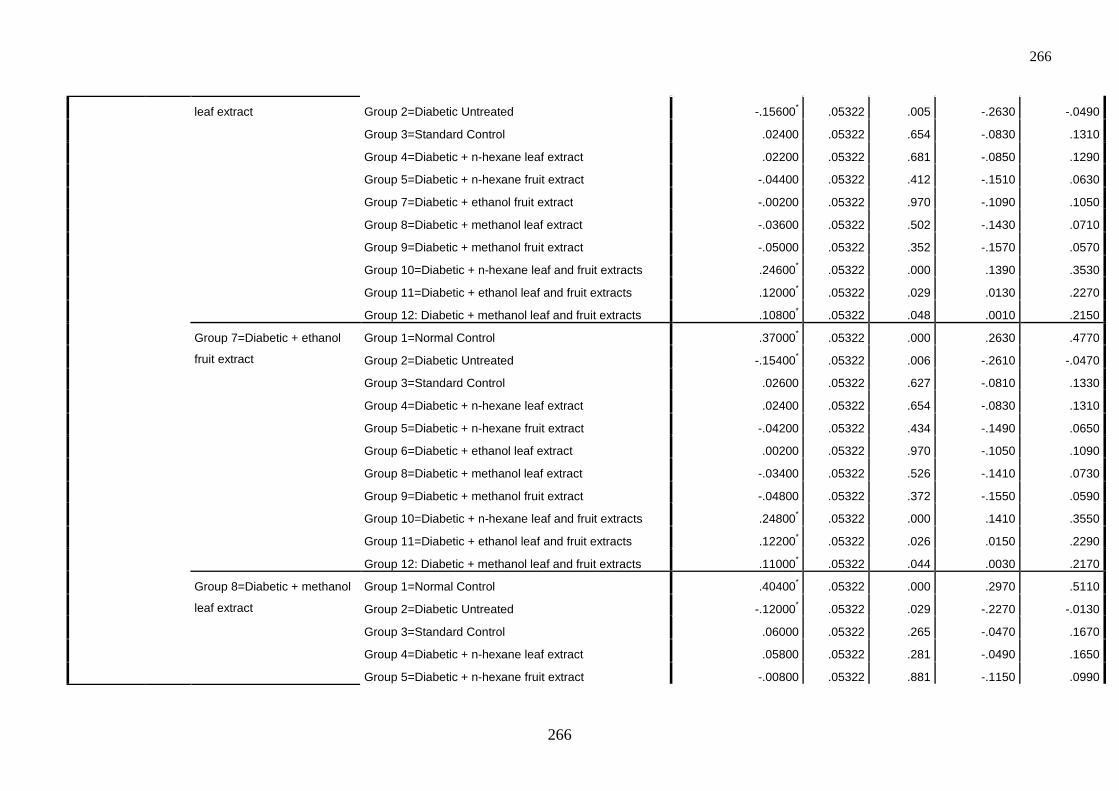
266
266
leaf extract Group 2=Diabetic Untreated -.15600* .05322 .005 -.2630 -.0490
Group 3=Standard Control .02400 .05322 .654 -.0830 .1310
Group 4=Diabetic + n-hexane leaf extract .02200 .05322 .681 -.0850 .1290
Group 5=Diabetic + n-hexane fruit extract -.04400 .05322 .412 -.1510 .0630
Group 7=Diabetic + ethanol fruit extract -.00200 .05322 .970 -.1090 .1050
Group 8=Diabetic + methanol leaf extract -.03600 .05322 .502 -.1430 .0710
Group 9=Diabetic + methanol fruit extract -.05000 .05322 .352 -.1570 .0570
Group 10=Diabetic + n-hexane leaf and fruit extracts .24600* .05322 .000 .1390 .3530
Group 11=Diabetic + ethanol leaf and fruit extracts .12000* .05322 .029 .0130 .2270
Group 12: Diabetic + methanol leaf and fruit extracts .10800* .05322 .048 .0010 .2150
Group 7=Diabetic + ethanol
fruit extract
Group 1=Normal Control .37000* .05322 .000 .2630 .4770
Group 2=Diabetic Untreated -.15400* .05322 .006 -.2610 -.0470
Group 3=Standard Control .02600 .05322 .627 -.0810 .1330
Group 4=Diabetic + n-hexane leaf extract .02400 .05322 .654 -.0830 .1310
Group 5=Diabetic + n-hexane fruit extract -.04200 .05322 .434 -.1490 .0650
Group 6=Diabetic + ethanol leaf extract .00200 .05322 .970 -.1050 .1090
Group 8=Diabetic + methanol leaf extract -.03400 .05322 .526 -.1410 .0730
Group 9=Diabetic + methanol fruit extract -.04800 .05322 .372 -.1550 .0590
Group 10=Diabetic + n-hexane leaf and fruit extracts .24800* .05322 .000 .1410 .3550
Group 11=Diabetic + ethanol leaf and fruit extracts .12200* .05322 .026 .0150 .2290
Group 12: Diabetic + methanol leaf and fruit extracts .11000* .05322 .044 .0030 .2170
Group 8=Diabetic + methanol
leaf extract
Group 1=Normal Control .40400* .05322 .000 .2970 .5110
Group 2=Diabetic Untreated -.12000* .05322 .029 -.2270 -.0130
Group 3=Standard Control .06000 .05322 .265 -.0470 .1670
Group 4=Diabetic + n-hexane leaf extract .05800 .05322 .281 -.0490 .1650
Group 5=Diabetic + n-hexane fruit extract -.00800 .05322 .881 -.1150 .0990
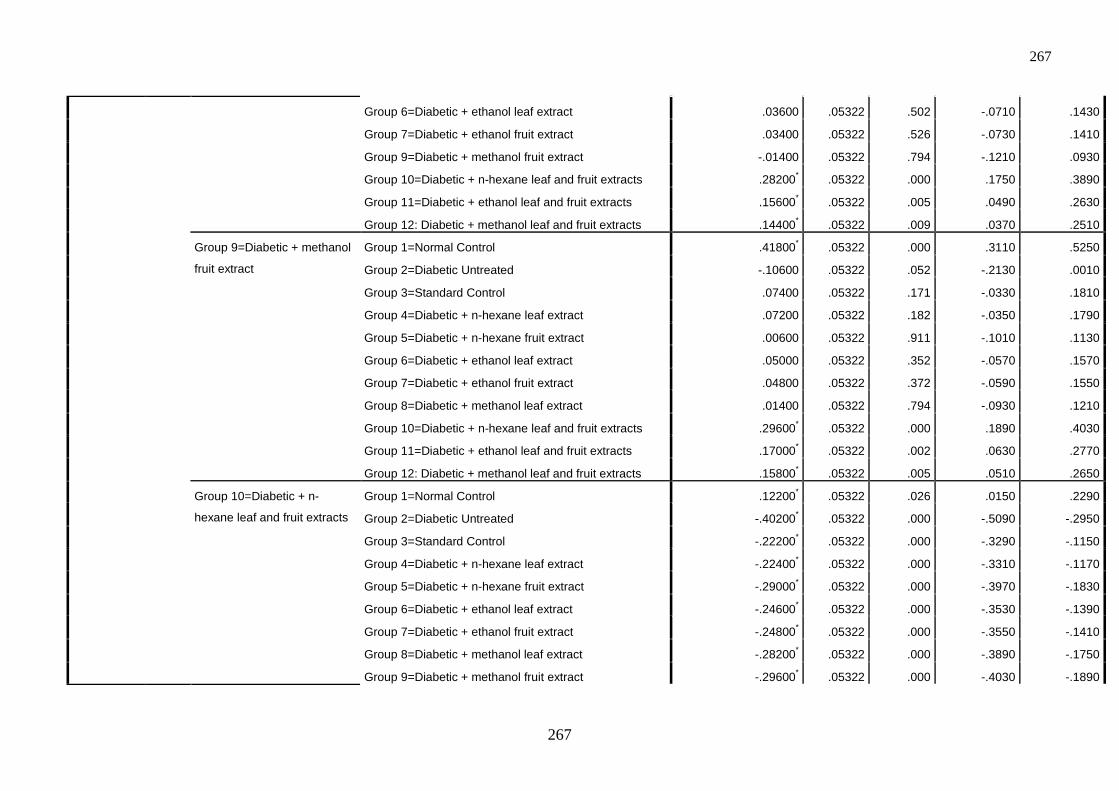
267
267
Group 6=Diabetic + ethanol leaf extract .03600 .05322 .502 -.0710 .1430
Group 7=Diabetic + ethanol fruit extract .03400 .05322 .526 -.0730 .1410
Group 9=Diabetic + methanol fruit extract -.01400 .05322 .794 -.1210 .0930
Group 10=Diabetic + n-hexane leaf and fruit extracts .28200* .05322 .000 .1750 .3890
Group 11=Diabetic + ethanol leaf and fruit extracts .15600* .05322 .005 .0490 .2630
Group 12: Diabetic + methanol leaf and fruit extracts .14400* .05322 .009 .0370 .2510
Group 9=Diabetic + methanol
fruit extract
Group 1=Normal Control .41800* .05322 .000 .3110 .5250
Group 2=Diabetic Untreated -.10600 .05322 .052 -.2130 .0010
Group 3=Standard Control .07400 .05322 .171 -.0330 .1810
Group 4=Diabetic + n-hexane leaf extract .07200 .05322 .182 -.0350 .1790
Group 5=Diabetic + n-hexane fruit extract .00600 .05322 .911 -.1010 .1130
Group 6=Diabetic + ethanol leaf extract .05000 .05322 .352 -.0570 .1570
Group 7=Diabetic + ethanol fruit extract .04800 .05322 .372 -.0590 .1550
Group 8=Diabetic + methanol leaf extract .01400 .05322 .794 -.0930 .1210
Group 10=Diabetic + n-hexane leaf and fruit extracts .29600* .05322 .000 .1890 .4030
Group 11=Diabetic + ethanol leaf and fruit extracts .17000* .05322 .002 .0630 .2770
Group 12: Diabetic + methanol leaf and fruit extracts .15800* .05322 .005 .0510 .2650
Group 10=Diabetic + n-
hexane leaf and fruit extracts
Group 1=Normal Control .12200* .05322 .026 .0150 .2290
Group 2=Diabetic Untreated -.40200* .05322 .000 -.5090 -.2950
Group 3=Standard Control -.22200* .05322 .000 -.3290 -.1150
Group 4=Diabetic + n-hexane leaf extract -.22400* .05322 .000 -.3310 -.1170
Group 5=Diabetic + n-hexane fruit extract -.29000* .05322 .000 -.3970 -.1830
Group 6=Diabetic + ethanol leaf extract -.24600* .05322 .000 -.3530 -.1390
Group 7=Diabetic + ethanol fruit extract -.24800* .05322 .000 -.3550 -.1410
Group 8=Diabetic + methanol leaf extract -.28200* .05322 .000 -.3890 -.1750
Group 9=Diabetic + methanol fruit extract -.29600* .05322 .000 -.4030 -.1890
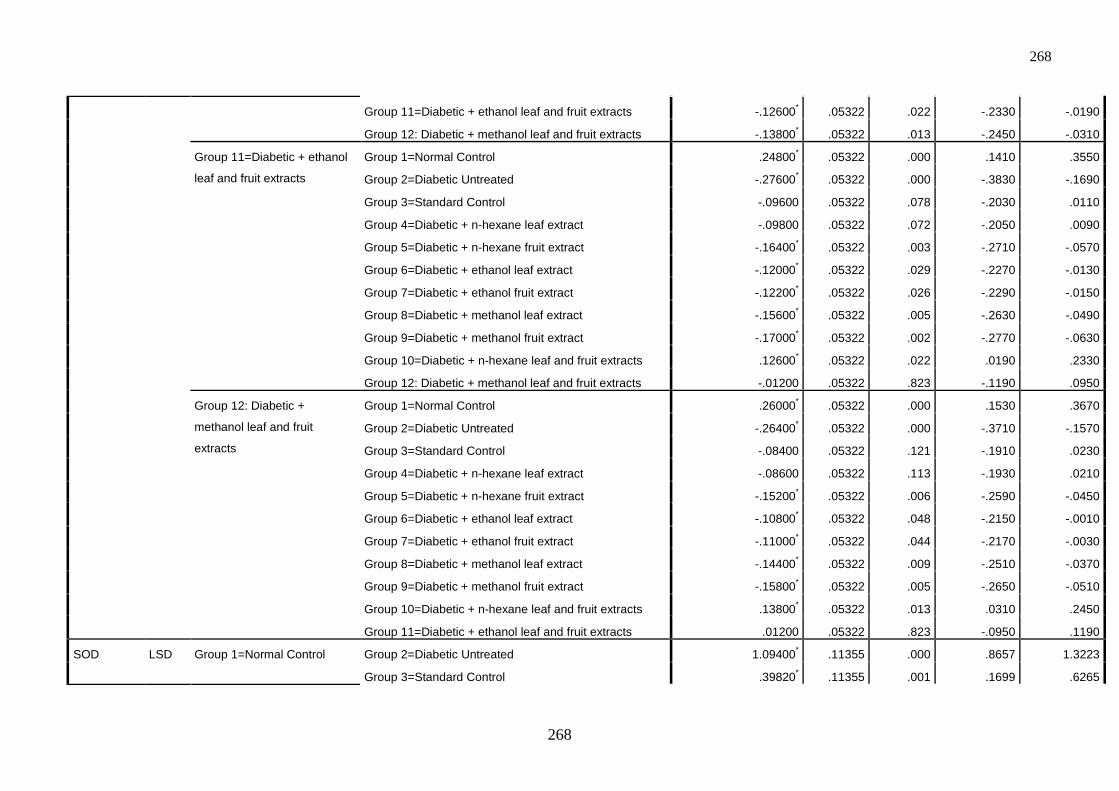
268
268
Group 11=Diabetic + ethanol leaf and fruit extracts -.12600* .05322 .022 -.2330 -.0190
Group 12: Diabetic + methanol leaf and fruit extracts -.13800* .05322 .013 -.2450 -.0310
Group 11=Diabetic + ethanol
leaf and fruit extracts
Group 1=Normal Control .24800* .05322 .000 .1410 .3550
Group 2=Diabetic Untreated -.27600* .05322 .000 -.3830 -.1690
Group 3=Standard Control -.09600 .05322 .078 -.2030 .0110
Group 4=Diabetic + n-hexane leaf extract -.09800 .05322 .072 -.2050 .0090
Group 5=Diabetic + n-hexane fruit extract -.16400* .05322 .003 -.2710 -.0570
Group 6=Diabetic + ethanol leaf extract -.12000* .05322 .029 -.2270 -.0130
Group 7=Diabetic + ethanol fruit extract -.12200* .05322 .026 -.2290 -.0150
Group 8=Diabetic + methanol leaf extract -.15600* .05322 .005 -.2630 -.0490
Group 9=Diabetic + methanol fruit extract -.17000* .05322 .002 -.2770 -.0630
Group 10=Diabetic + n-hexane leaf and fruit extracts .12600* .05322 .022 .0190 .2330
Group 12: Diabetic + methanol leaf and fruit extracts -.01200 .05322 .823 -.1190 .0950
Group 12: Diabetic +
methanol leaf and fruit
extracts
Group 1=Normal Control .26000* .05322 .000 .1530 .3670
Group 2=Diabetic Untreated -.26400* .05322 .000 -.3710 -.1570
Group 3=Standard Control -.08400 .05322 .121 -.1910 .0230
Group 4=Diabetic + n-hexane leaf extract -.08600 .05322 .113 -.1930 .0210
Group 5=Diabetic + n-hexane fruit extract -.15200* .05322 .006 -.2590 -.0450
Group 6=Diabetic + ethanol leaf extract -.10800* .05322 .048 -.2150 -.0010
Group 7=Diabetic + ethanol fruit extract -.11000* .05322 .044 -.2170 -.0030
Group 8=Diabetic + methanol leaf extract -.14400* .05322 .009 -.2510 -.0370
Group 9=Diabetic + methanol fruit extract -.15800* .05322 .005 -.2650 -.0510
Group 10=Diabetic + n-hexane leaf and fruit extracts .13800* .05322 .013 .0310 .2450
Group 11=Diabetic + ethanol leaf and fruit extracts .01200 .05322 .823 -.0950 .1190
SOD LSD Group 1=Normal Control Group 2=Diabetic Untreated 1.09400* .11355 .000 .8657 1.3223
Group 3=Standard Control .39820* .11355 .001 .1699 .6265
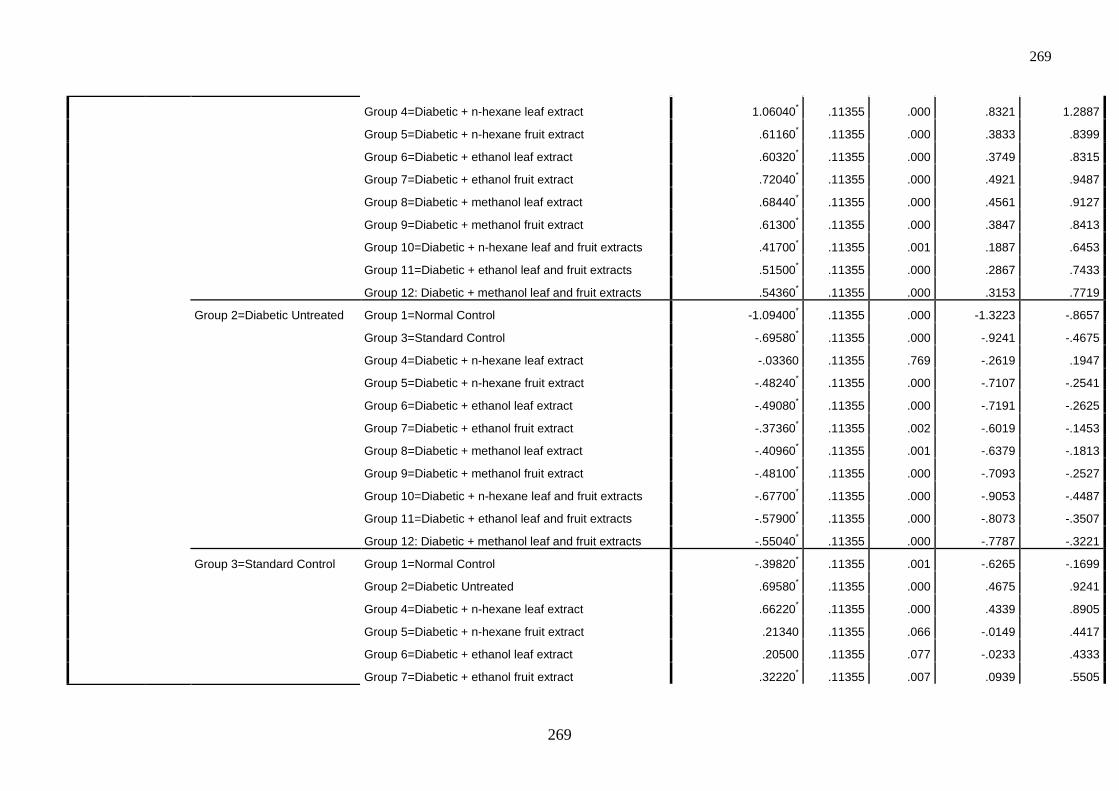
269
269
Group 4=Diabetic + n-hexane leaf extract 1.06040* .11355 .000 .8321 1.2887
Group 5=Diabetic + n-hexane fruit extract .61160* .11355 .000 .3833 .8399
Group 6=Diabetic + ethanol leaf extract .60320* .11355 .000 .3749 .8315
Group 7=Diabetic + ethanol fruit extract .72040* .11355 .000 .4921 .9487
Group 8=Diabetic + methanol leaf extract .68440* .11355 .000 .4561 .9127
Group 9=Diabetic + methanol fruit extract .61300* .11355 .000 .3847 .8413
Group 10=Diabetic + n-hexane leaf and fruit extracts .41700* .11355 .001 .1887 .6453
Group 11=Diabetic + ethanol leaf and fruit extracts .51500* .11355 .000 .2867 .7433
Group 12: Diabetic + methanol leaf and fruit extracts .54360* .11355 .000 .3153 .7719
Group 2=Diabetic Untreated Group 1=Normal Control -1.09400* .11355 .000 -1.3223 -.8657
Group 3=Standard Control -.69580* .11355 .000 -.9241 -.4675
Group 4=Diabetic + n-hexane leaf extract -.03360 .11355 .769 -.2619 .1947
Group 5=Diabetic + n-hexane fruit extract -.48240* .11355 .000 -.7107 -.2541
Group 6=Diabetic + ethanol leaf extract -.49080* .11355 .000 -.7191 -.2625
Group 7=Diabetic + ethanol fruit extract -.37360* .11355 .002 -.6019 -.1453
Group 8=Diabetic + methanol leaf extract -.40960* .11355 .001 -.6379 -.1813
Group 9=Diabetic + methanol fruit extract -.48100* .11355 .000 -.7093 -.2527
Group 10=Diabetic + n-hexane leaf and fruit extracts -.67700* .11355 .000 -.9053 -.4487
Group 11=Diabetic + ethanol leaf and fruit extracts -.57900* .11355 .000 -.8073 -.3507
Group 12: Diabetic + methanol leaf and fruit extracts -.55040* .11355 .000 -.7787 -.3221
Group 3=Standard Control Group 1=Normal Control -.39820* .11355 .001 -.6265 -.1699
Group 2=Diabetic Untreated .69580* .11355 .000 .4675 .9241
Group 4=Diabetic + n-hexane leaf extract .66220* .11355 .000 .4339 .8905
Group 5=Diabetic + n-hexane fruit extract .21340 .11355 .066 -.0149 .4417
Group 6=Diabetic + ethanol leaf extract .20500 .11355 .077 -.0233 .4333
Group 7=Diabetic + ethanol fruit extract .32220* .11355 .007 .0939 .5505
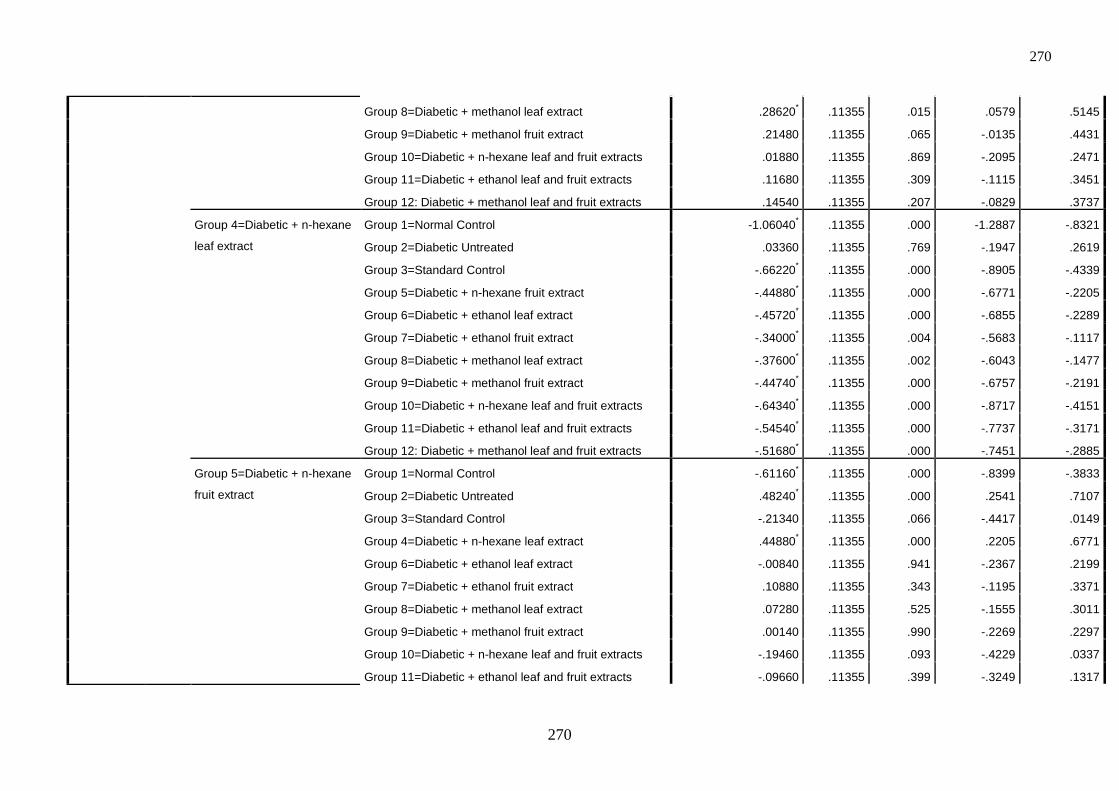
270
270
Group 8=Diabetic + methanol leaf extract .28620* .11355 .015 .0579 .5145
Group 9=Diabetic + methanol fruit extract .21480 .11355 .065 -.0135 .4431
Group 10=Diabetic + n-hexane leaf and fruit extracts .01880 .11355 .869 -.2095 .2471
Group 11=Diabetic + ethanol leaf and fruit extracts .11680 .11355 .309 -.1115 .3451
Group 12: Diabetic + methanol leaf and fruit extracts .14540 .11355 .207 -.0829 .3737
Group 4=Diabetic + n-hexane
leaf extract
Group 1=Normal Control -1.06040* .11355 .000 -1.2887 -.8321
Group 2=Diabetic Untreated .03360 .11355 .769 -.1947 .2619
Group 3=Standard Control -.66220* .11355 .000 -.8905 -.4339
Group 5=Diabetic + n-hexane fruit extract -.44880* .11355 .000 -.6771 -.2205
Group 6=Diabetic + ethanol leaf extract -.45720* .11355 .000 -.6855 -.2289
Group 7=Diabetic + ethanol fruit extract -.34000* .11355 .004 -.5683 -.1117
Group 8=Diabetic + methanol leaf extract -.37600* .11355 .002 -.6043 -.1477
Group 9=Diabetic + methanol fruit extract -.44740* .11355 .000 -.6757 -.2191
Group 10=Diabetic + n-hexane leaf and fruit extracts -.64340* .11355 .000 -.8717 -.4151
Group 11=Diabetic + ethanol leaf and fruit extracts -.54540* .11355 .000 -.7737 -.3171
Group 12: Diabetic + methanol leaf and fruit extracts -.51680* .11355 .000 -.7451 -.2885
Group 5=Diabetic + n-hexane
fruit extract
Group 1=Normal Control -.61160* .11355 .000 -.8399 -.3833
Group 2=Diabetic Untreated .48240* .11355 .000 .2541 .7107
Group 3=Standard Control -.21340 .11355 .066 -.4417 .0149
Group 4=Diabetic + n-hexane leaf extract .44880* .11355 .000 .2205 .6771
Group 6=Diabetic + ethanol leaf extract -.00840 .11355 .941 -.2367 .2199
Group 7=Diabetic + ethanol fruit extract .10880 .11355 .343 -.1195 .3371
Group 8=Diabetic + methanol leaf extract .07280 .11355 .525 -.1555 .3011
Group 9=Diabetic + methanol fruit extract .00140 .11355 .990 -.2269 .2297
Group 10=Diabetic + n-hexane leaf and fruit extracts -.19460 .11355 .093 -.4229 .0337
Group 11=Diabetic + ethanol leaf and fruit extracts -.09660 .11355 .399 -.3249 .1317
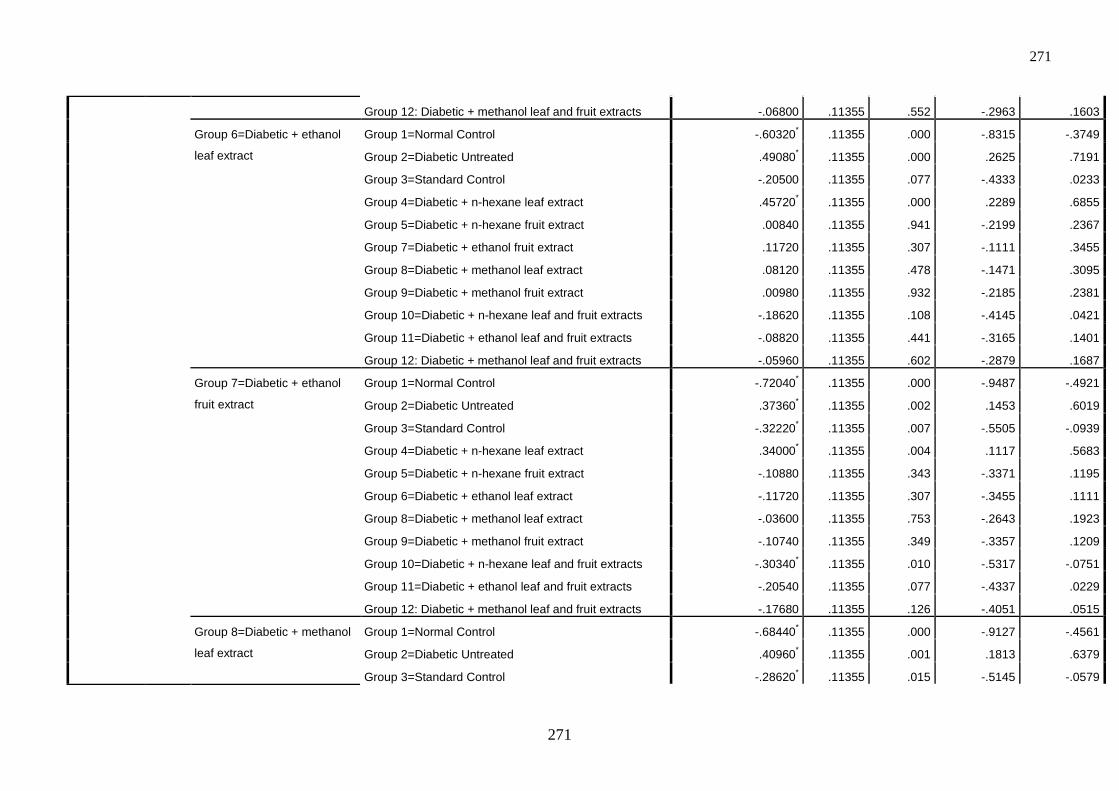
271
271
Group 12: Diabetic + methanol leaf and fruit extracts -.06800 .11355 .552 -.2963 .1603
Group 6=Diabetic + ethanol
leaf extract
Group 1=Normal Control -.60320* .11355 .000 -.8315 -.3749
Group 2=Diabetic Untreated .49080* .11355 .000 .2625 .7191
Group 3=Standard Control -.20500 .11355 .077 -.4333 .0233
Group 4=Diabetic + n-hexane leaf extract .45720* .11355 .000 .2289 .6855
Group 5=Diabetic + n-hexane fruit extract .00840 .11355 .941 -.2199 .2367
Group 7=Diabetic + ethanol fruit extract .11720 .11355 .307 -.1111 .3455
Group 8=Diabetic + methanol leaf extract .08120 .11355 .478 -.1471 .3095
Group 9=Diabetic + methanol fruit extract .00980 .11355 .932 -.2185 .2381
Group 10=Diabetic + n-hexane leaf and fruit extracts -.18620 .11355 .108 -.4145 .0421
Group 11=Diabetic + ethanol leaf and fruit extracts -.08820 .11355 .441 -.3165 .1401
Group 12: Diabetic + methanol leaf and fruit extracts -.05960 .11355 .602 -.2879 .1687
Group 7=Diabetic + ethanol
fruit extract
Group 1=Normal Control -.72040* .11355 .000 -.9487 -.4921
Group 2=Diabetic Untreated .37360* .11355 .002 .1453 .6019
Group 3=Standard Control -.32220* .11355 .007 -.5505 -.0939
Group 4=Diabetic + n-hexane leaf extract .34000* .11355 .004 .1117 .5683
Group 5=Diabetic + n-hexane fruit extract -.10880 .11355 .343 -.3371 .1195
Group 6=Diabetic + ethanol leaf extract -.11720 .11355 .307 -.3455 .1111
Group 8=Diabetic + methanol leaf extract -.03600 .11355 .753 -.2643 .1923
Group 9=Diabetic + methanol fruit extract -.10740 .11355 .349 -.3357 .1209
Group 10=Diabetic + n-hexane leaf and fruit extracts -.30340* .11355 .010 -.5317 -.0751
Group 11=Diabetic + ethanol leaf and fruit extracts -.20540 .11355 .077 -.4337 .0229
Group 12: Diabetic + methanol leaf and fruit extracts -.17680 .11355 .126 -.4051 .0515
Group 8=Diabetic + methanol
leaf extract
Group 1=Normal Control -.68440* .11355 .000 -.9127 -.4561
Group 2=Diabetic Untreated .40960* .11355 .001 .1813 .6379
Group 3=Standard Control -.28620* .11355 .015 -.5145 -.0579
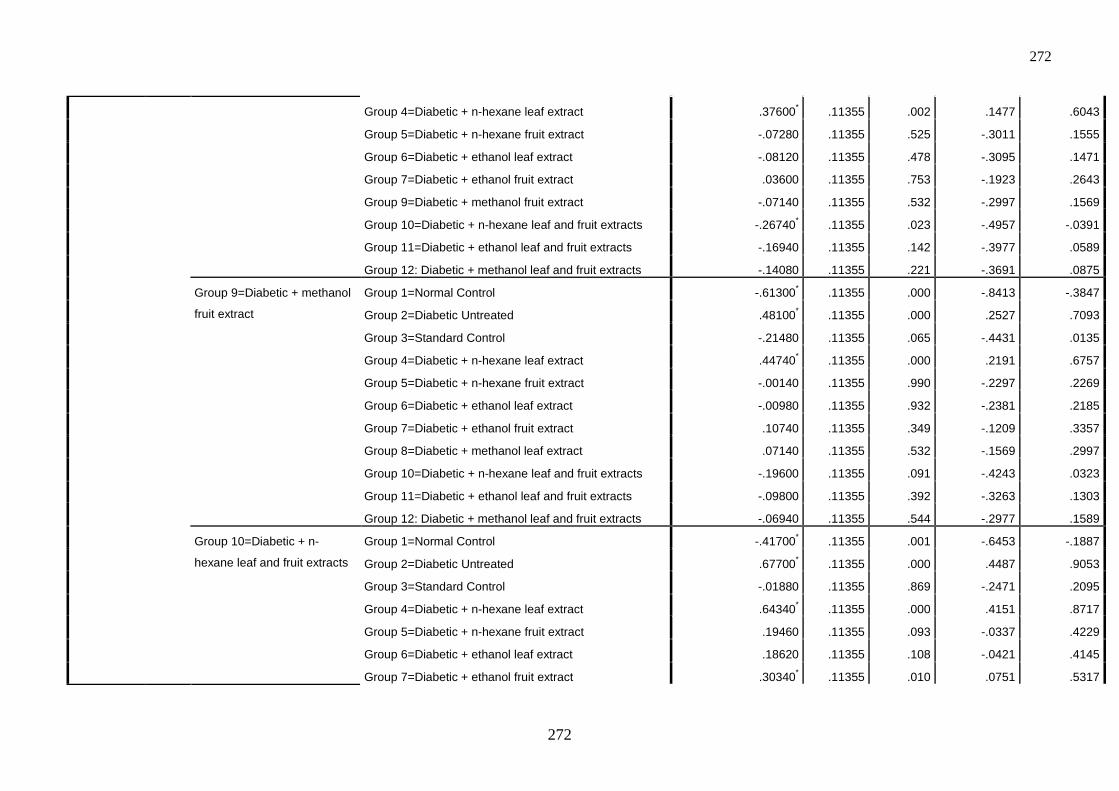
272
272
Group 4=Diabetic + n-hexane leaf extract .37600* .11355 .002 .1477 .6043
Group 5=Diabetic + n-hexane fruit extract -.07280 .11355 .525 -.3011 .1555
Group 6=Diabetic + ethanol leaf extract -.08120 .11355 .478 -.3095 .1471
Group 7=Diabetic + ethanol fruit extract .03600 .11355 .753 -.1923 .2643
Group 9=Diabetic + methanol fruit extract -.07140 .11355 .532 -.2997 .1569
Group 10=Diabetic + n-hexane leaf and fruit extracts -.26740* .11355 .023 -.4957 -.0391
Group 11=Diabetic + ethanol leaf and fruit extracts -.16940 .11355 .142 -.3977 .0589
Group 12: Diabetic + methanol leaf and fruit extracts -.14080 .11355 .221 -.3691 .0875
Group 9=Diabetic + methanol
fruit extract
Group 1=Normal Control -.61300* .11355 .000 -.8413 -.3847
Group 2=Diabetic Untreated .48100* .11355 .000 .2527 .7093
Group 3=Standard Control -.21480 .11355 .065 -.4431 .0135
Group 4=Diabetic + n-hexane leaf extract .44740* .11355 .000 .2191 .6757
Group 5=Diabetic + n-hexane fruit extract -.00140 .11355 .990 -.2297 .2269
Group 6=Diabetic + ethanol leaf extract -.00980 .11355 .932 -.2381 .2185
Group 7=Diabetic + ethanol fruit extract .10740 .11355 .349 -.1209 .3357
Group 8=Diabetic + methanol leaf extract .07140 .11355 .532 -.1569 .2997
Group 10=Diabetic + n-hexane leaf and fruit extracts -.19600 .11355 .091 -.4243 .0323
Group 11=Diabetic + ethanol leaf and fruit extracts -.09800 .11355 .392 -.3263 .1303
Group 12: Diabetic + methanol leaf and fruit extracts -.06940 .11355 .544 -.2977 .1589
Group 10=Diabetic + n-
hexane leaf and fruit extracts
Group 1=Normal Control -.41700* .11355 .001 -.6453 -.1887
Group 2=Diabetic Untreated .67700* .11355 .000 .4487 .9053
Group 3=Standard Control -.01880 .11355 .869 -.2471 .2095
Group 4=Diabetic + n-hexane leaf extract .64340* .11355 .000 .4151 .8717
Group 5=Diabetic + n-hexane fruit extract .19460 .11355 .093 -.0337 .4229
Group 6=Diabetic + ethanol leaf extract .18620 .11355 .108 -.0421 .4145
Group 7=Diabetic + ethanol fruit extract .30340* .11355 .010 .0751 .5317
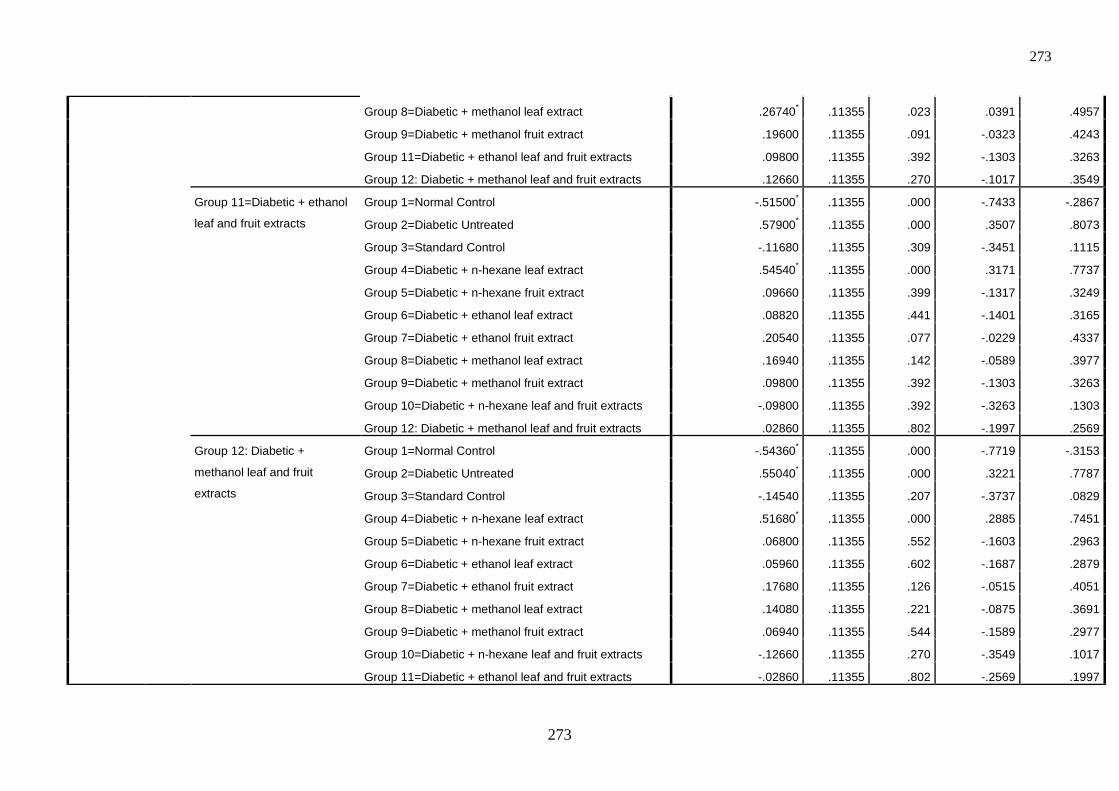
273
273
Group 8=Diabetic + methanol leaf extract .26740* .11355 .023 .0391 .4957
Group 9=Diabetic + methanol fruit extract .19600 .11355 .091 -.0323 .4243
Group 11=Diabetic + ethanol leaf and fruit extracts .09800 .11355 .392 -.1303 .3263
Group 12: Diabetic + methanol leaf and fruit extracts .12660 .11355 .270 -.1017 .3549
Group 11=Diabetic + ethanol
leaf and fruit extracts
Group 1=Normal Control -.51500* .11355 .000 -.7433 -.2867
Group 2=Diabetic Untreated .57900* .11355 .000 .3507 .8073
Group 3=Standard Control -.11680 .11355 .309 -.3451 .1115
Group 4=Diabetic + n-hexane leaf extract .54540* .11355 .000 .3171 .7737
Group 5=Diabetic + n-hexane fruit extract .09660 .11355 .399 -.1317 .3249
Group 6=Diabetic + ethanol leaf extract .08820 .11355 .441 -.1401 .3165
Group 7=Diabetic + ethanol fruit extract .20540 .11355 .077 -.0229 .4337
Group 8=Diabetic + methanol leaf extract .16940 .11355 .142 -.0589 .3977
Group 9=Diabetic + methanol fruit extract .09800 .11355 .392 -.1303 .3263
Group 10=Diabetic + n-hexane leaf and fruit extracts -.09800 .11355 .392 -.3263 .1303
Group 12: Diabetic + methanol leaf and fruit extracts .02860 .11355 .802 -.1997 .2569
Group 12: Diabetic +
methanol leaf and fruit
extracts
Group 1=Normal Control -.54360* .11355 .000 -.7719 -.3153
Group 2=Diabetic Untreated .55040* .11355 .000 .3221 .7787
Group 3=Standard Control -.14540 .11355 .207 -.3737 .0829
Group 4=Diabetic + n-hexane leaf extract .51680* .11355 .000 .2885 .7451
Group 5=Diabetic + n-hexane fruit extract .06800 .11355 .552 -.1603 .2963
Group 6=Diabetic + ethanol leaf extract .05960 .11355 .602 -.1687 .2879
Group 7=Diabetic + ethanol fruit extract .17680 .11355 .126 -.0515 .4051
Group 8=Diabetic + methanol leaf extract .14080 .11355 .221 -.0875 .3691
Group 9=Diabetic + methanol fruit extract .06940 .11355 .544 -.1589 .2977
Group 10=Diabetic + n-hexane leaf and fruit extracts -.12660 .11355 .270 -.3549 .1017
Group 11=Diabetic + ethanol leaf and fruit extracts -.02860 .11355 .802 -.2569 .1997
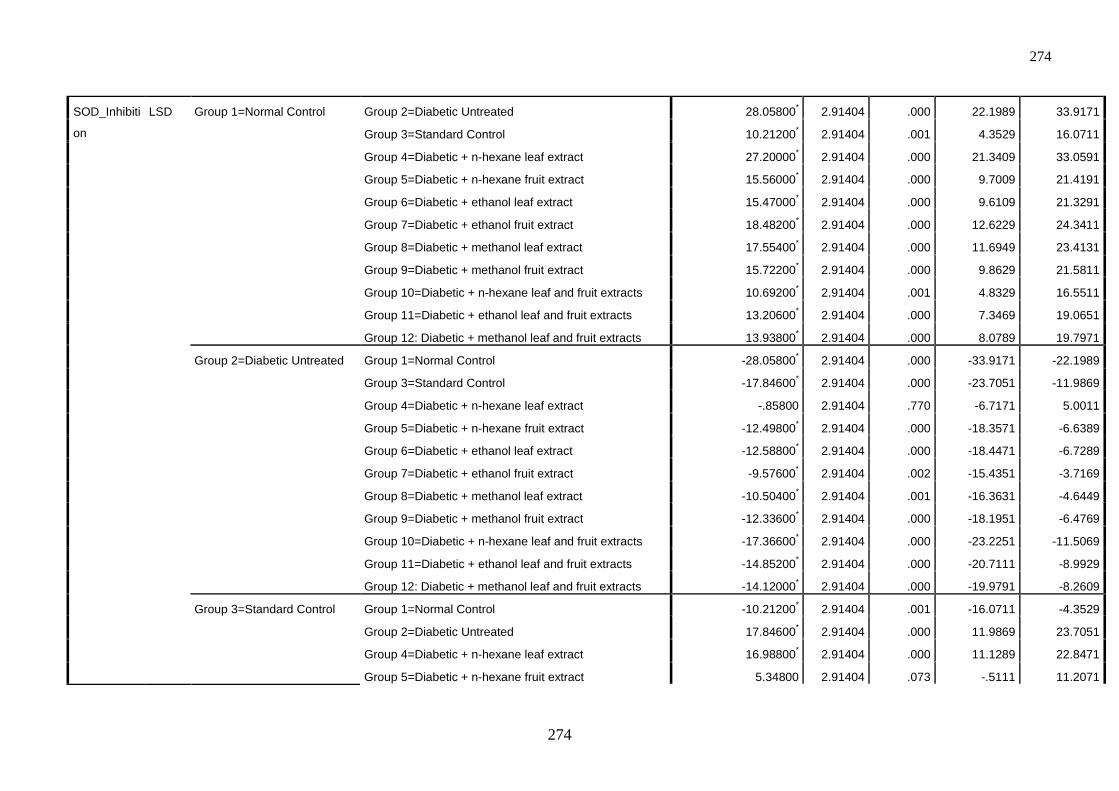
274
274
SOD_Inhibiti
on
LSD Group 1=Normal Control Group 2=Diabetic Untreated 28.05800* 2.91404 .000 22.1989 33.9171
Group 3=Standard Control 10.21200* 2.91404 .001 4.3529 16.0711
Group 4=Diabetic + n-hexane leaf extract 27.20000* 2.91404 .000 21.3409 33.0591
Group 5=Diabetic + n-hexane fruit extract 15.56000* 2.91404 .000 9.7009 21.4191
Group 6=Diabetic + ethanol leaf extract 15.47000* 2.91404 .000 9.6109 21.3291
Group 7=Diabetic + ethanol fruit extract 18.48200* 2.91404 .000 12.6229 24.3411
Group 8=Diabetic + methanol leaf extract 17.55400* 2.91404 .000 11.6949 23.4131
Group 9=Diabetic + methanol fruit extract 15.72200* 2.91404 .000 9.8629 21.5811
Group 10=Diabetic + n-hexane leaf and fruit extracts 10.69200* 2.91404 .001 4.8329 16.5511
Group 11=Diabetic + ethanol leaf and fruit extracts 13.20600* 2.91404 .000 7.3469 19.0651
Group 12: Diabetic + methanol leaf and fruit extracts 13.93800* 2.91404 .000 8.0789 19.7971
Group 2=Diabetic Untreated Group 1=Normal Control -28.05800* 2.91404 .000 -33.9171 -22.1989
Group 3=Standard Control -17.84600* 2.91404 .000 -23.7051 -11.9869
Group 4=Diabetic + n-hexane leaf extract -.85800 2.91404 .770 -6.7171 5.0011
Group 5=Diabetic + n-hexane fruit extract -12.49800* 2.91404 .000 -18.3571 -6.6389
Group 6=Diabetic + ethanol leaf extract -12.58800* 2.91404 .000 -18.4471 -6.7289
Group 7=Diabetic + ethanol fruit extract -9.57600* 2.91404 .002 -15.4351 -3.7169
Group 8=Diabetic + methanol leaf extract -10.50400* 2.91404 .001 -16.3631 -4.6449
Group 9=Diabetic + methanol fruit extract -12.33600* 2.91404 .000 -18.1951 -6.4769
Group 10=Diabetic + n-hexane leaf and fruit extracts -17.36600* 2.91404 .000 -23.2251 -11.5069
Group 11=Diabetic + ethanol leaf and fruit extracts -14.85200* 2.91404 .000 -20.7111 -8.9929
Group 12: Diabetic + methanol leaf and fruit extracts -14.12000* 2.91404 .000 -19.9791 -8.2609
Group 3=Standard Control Group 1=Normal Control -10.21200* 2.91404 .001 -16.0711 -4.3529
Group 2=Diabetic Untreated 17.84600* 2.91404 .000 11.9869 23.7051
Group 4=Diabetic + n-hexane leaf extract 16.98800* 2.91404 .000 11.1289 22.8471
Group 5=Diabetic + n-hexane fruit extract 5.34800 2.91404 .073 -.5111 11.2071
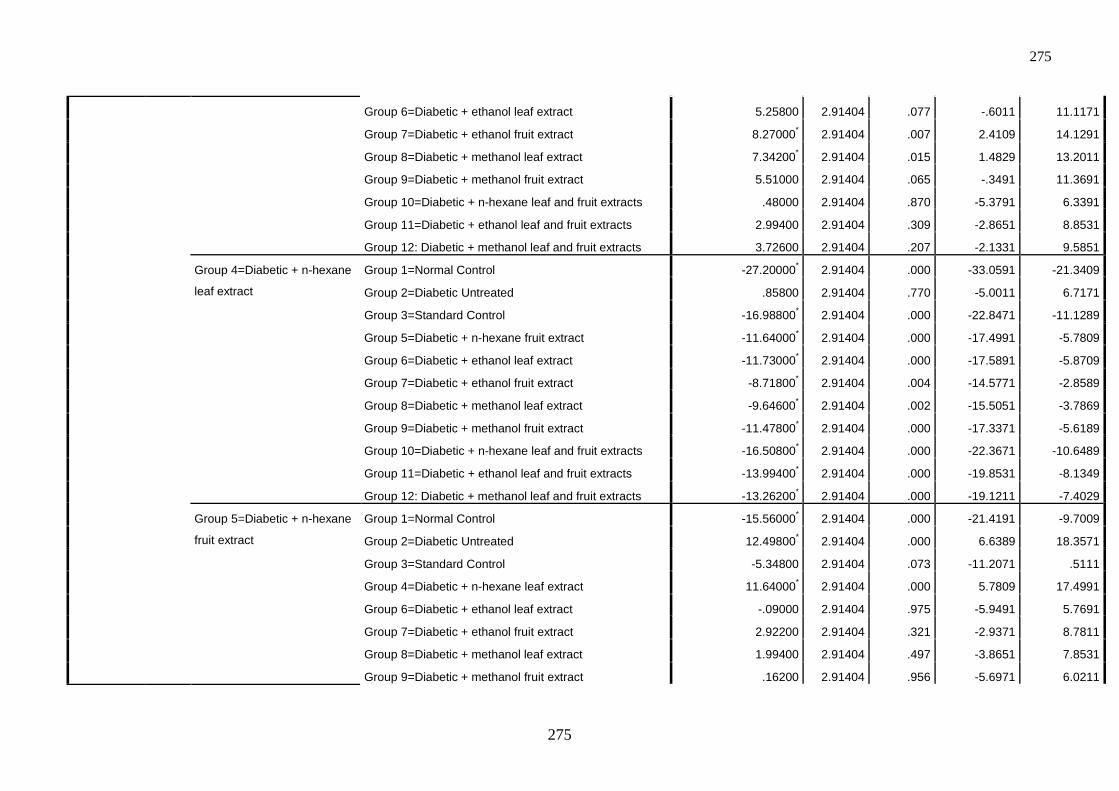
275
275
Group 6=Diabetic + ethanol leaf extract 5.25800 2.91404 .077 -.6011 11.1171
Group 7=Diabetic + ethanol fruit extract 8.27000* 2.91404 .007 2.4109 14.1291
Group 8=Diabetic + methanol leaf extract 7.34200* 2.91404 .015 1.4829 13.2011
Group 9=Diabetic + methanol fruit extract 5.51000 2.91404 .065 -.3491 11.3691
Group 10=Diabetic + n-hexane leaf and fruit extracts .48000 2.91404 .870 -5.3791 6.3391
Group 11=Diabetic + ethanol leaf and fruit extracts 2.99400 2.91404 .309 -2.8651 8.8531
Group 12: Diabetic + methanol leaf and fruit extracts 3.72600 2.91404 .207 -2.1331 9.5851
Group 4=Diabetic + n-hexane
leaf extract
Group 1=Normal Control -27.20000* 2.91404 .000 -33.0591 -21.3409
Group 2=Diabetic Untreated .85800 2.91404 .770 -5.0011 6.7171
Group 3=Standard Control -16.98800* 2.91404 .000 -22.8471 -11.1289
Group 5=Diabetic + n-hexane fruit extract -11.64000* 2.91404 .000 -17.4991 -5.7809
Group 6=Diabetic + ethanol leaf extract -11.73000* 2.91404 .000 -17.5891 -5.8709
Group 7=Diabetic + ethanol fruit extract -8.71800* 2.91404 .004 -14.5771 -2.8589
Group 8=Diabetic + methanol leaf extract -9.64600* 2.91404 .002 -15.5051 -3.7869
Group 9=Diabetic + methanol fruit extract -11.47800* 2.91404 .000 -17.3371 -5.6189
Group 10=Diabetic + n-hexane leaf and fruit extracts -16.50800* 2.91404 .000 -22.3671 -10.6489
Group 11=Diabetic + ethanol leaf and fruit extracts -13.99400* 2.91404 .000 -19.8531 -8.1349
Group 12: Diabetic + methanol leaf and fruit extracts -13.26200* 2.91404 .000 -19.1211 -7.4029
Group 5=Diabetic + n-hexane
fruit extract
Group 1=Normal Control -15.56000* 2.91404 .000 -21.4191 -9.7009
Group 2=Diabetic Untreated 12.49800* 2.91404 .000 6.6389 18.3571
Group 3=Standard Control -5.34800 2.91404 .073 -11.2071 .5111
Group 4=Diabetic + n-hexane leaf extract 11.64000* 2.91404 .000 5.7809 17.4991
Group 6=Diabetic + ethanol leaf extract -.09000 2.91404 .975 -5.9491 5.7691
Group 7=Diabetic + ethanol fruit extract 2.92200 2.91404 .321 -2.9371 8.7811
Group 8=Diabetic + methanol leaf extract 1.99400 2.91404 .497 -3.8651 7.8531
Group 9=Diabetic + methanol fruit extract .16200 2.91404 .956 -5.6971 6.0211
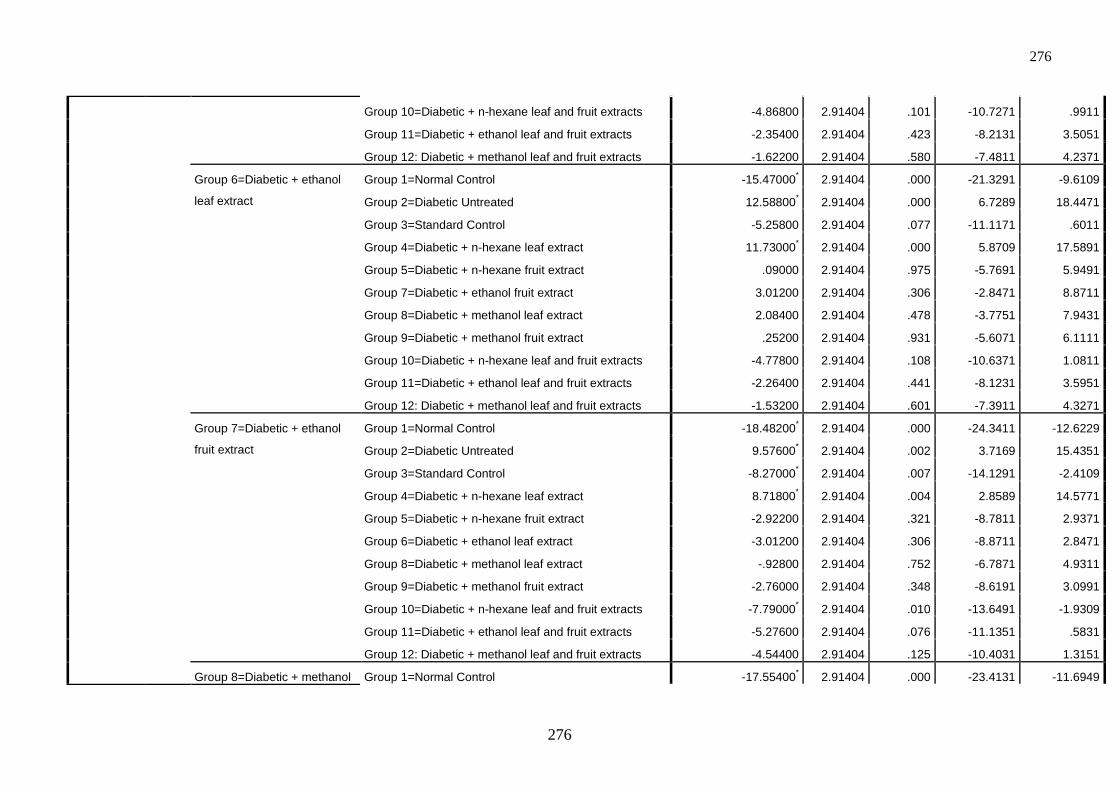
276
276
Group 10=Diabetic + n-hexane leaf and fruit extracts -4.86800 2.91404 .101 -10.7271 .9911
Group 11=Diabetic + ethanol leaf and fruit extracts -2.35400 2.91404 .423 -8.2131 3.5051
Group 12: Diabetic + methanol leaf and fruit extracts -1.62200 2.91404 .580 -7.4811 4.2371
Group 6=Diabetic + ethanol
leaf extract
Group 1=Normal Control -15.47000* 2.91404 .000 -21.3291 -9.6109
Group 2=Diabetic Untreated 12.58800* 2.91404 .000 6.7289 18.4471
Group 3=Standard Control -5.25800 2.91404 .077 -11.1171 .6011
Group 4=Diabetic + n-hexane leaf extract 11.73000* 2.91404 .000 5.8709 17.5891
Group 5=Diabetic + n-hexane fruit extract .09000 2.91404 .975 -5.7691 5.9491
Group 7=Diabetic + ethanol fruit extract 3.01200 2.91404 .306 -2.8471 8.8711
Group 8=Diabetic + methanol leaf extract 2.08400 2.91404 .478 -3.7751 7.9431
Group 9=Diabetic + methanol fruit extract .25200 2.91404 .931 -5.6071 6.1111
Group 10=Diabetic + n-hexane leaf and fruit extracts -4.77800 2.91404 .108 -10.6371 1.0811
Group 11=Diabetic + ethanol leaf and fruit extracts -2.26400 2.91404 .441 -8.1231 3.5951
Group 12: Diabetic + methanol leaf and fruit extracts -1.53200 2.91404 .601 -7.3911 4.3271
Group 7=Diabetic + ethanol
fruit extract
Group 1=Normal Control -18.48200* 2.91404 .000 -24.3411 -12.6229
Group 2=Diabetic Untreated 9.57600* 2.91404 .002 3.7169 15.4351
Group 3=Standard Control -8.27000* 2.91404 .007 -14.1291 -2.4109
Group 4=Diabetic + n-hexane leaf extract 8.71800* 2.91404 .004 2.8589 14.5771
Group 5=Diabetic + n-hexane fruit extract -2.92200 2.91404 .321 -8.7811 2.9371
Group 6=Diabetic + ethanol leaf extract -3.01200 2.91404 .306 -8.8711 2.8471
Group 8=Diabetic + methanol leaf extract -.92800 2.91404 .752 -6.7871 4.9311
Group 9=Diabetic + methanol fruit extract -2.76000 2.91404 .348 -8.6191 3.0991
Group 10=Diabetic + n-hexane leaf and fruit extracts -7.79000* 2.91404 .010 -13.6491 -1.9309
Group 11=Diabetic + ethanol leaf and fruit extracts -5.27600 2.91404 .076 -11.1351 .5831
Group 12: Diabetic + methanol leaf and fruit extracts -4.54400 2.91404 .125 -10.4031 1.3151
Group 8=Diabetic + methanol Group 1=Normal Control -17.55400* 2.91404 .000 -23.4131 -11.6949
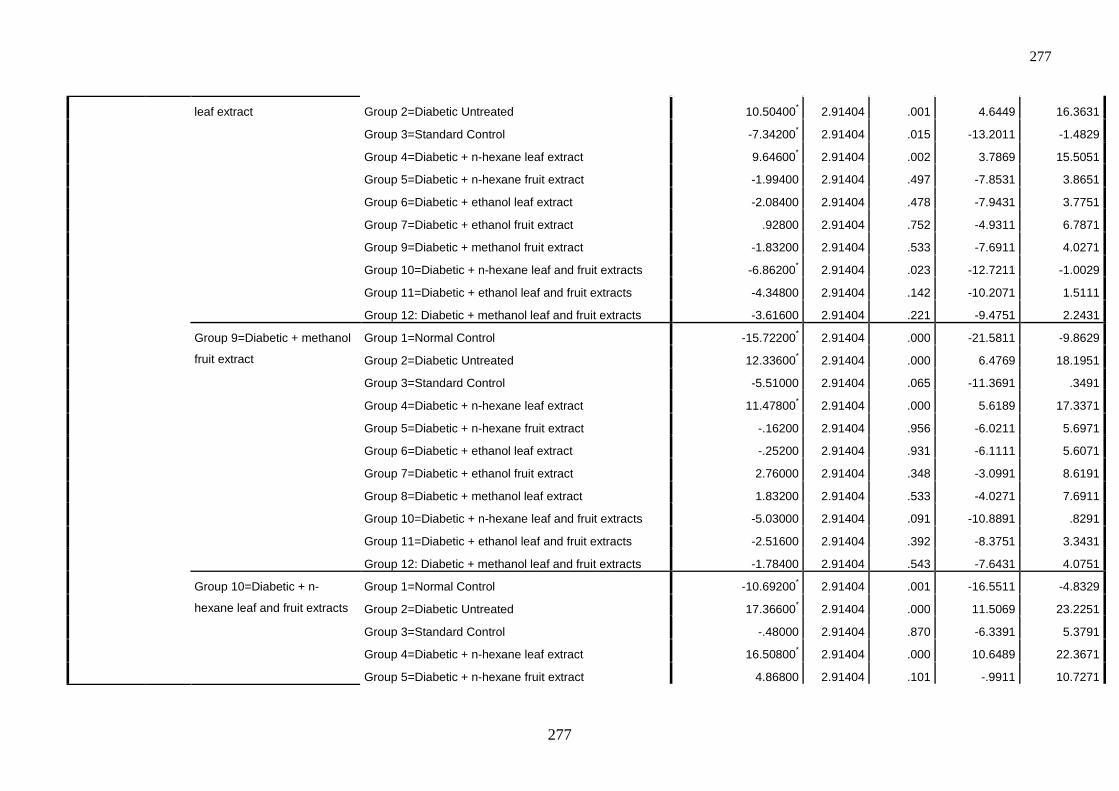
277
277
leaf extract Group 2=Diabetic Untreated 10.50400* 2.91404 .001 4.6449 16.3631
Group 3=Standard Control -7.34200* 2.91404 .015 -13.2011 -1.4829
Group 4=Diabetic + n-hexane leaf extract 9.64600* 2.91404 .002 3.7869 15.5051
Group 5=Diabetic + n-hexane fruit extract -1.99400 2.91404 .497 -7.8531 3.8651
Group 6=Diabetic + ethanol leaf extract -2.08400 2.91404 .478 -7.9431 3.7751
Group 7=Diabetic + ethanol fruit extract .92800 2.91404 .752 -4.9311 6.7871
Group 9=Diabetic + methanol fruit extract -1.83200 2.91404 .533 -7.6911 4.0271
Group 10=Diabetic + n-hexane leaf and fruit extracts -6.86200* 2.91404 .023 -12.7211 -1.0029
Group 11=Diabetic + ethanol leaf and fruit extracts -4.34800 2.91404 .142 -10.2071 1.5111
Group 12: Diabetic + methanol leaf and fruit extracts -3.61600 2.91404 .221 -9.4751 2.2431
Group 9=Diabetic + methanol
fruit extract
Group 1=Normal Control -15.72200* 2.91404 .000 -21.5811 -9.8629
Group 2=Diabetic Untreated 12.33600* 2.91404 .000 6.4769 18.1951
Group 3=Standard Control -5.51000 2.91404 .065 -11.3691 .3491
Group 4=Diabetic + n-hexane leaf extract 11.47800* 2.91404 .000 5.6189 17.3371
Group 5=Diabetic + n-hexane fruit extract -.16200 2.91404 .956 -6.0211 5.6971
Group 6=Diabetic + ethanol leaf extract -.25200 2.91404 .931 -6.1111 5.6071
Group 7=Diabetic + ethanol fruit extract 2.76000 2.91404 .348 -3.0991 8.6191
Group 8=Diabetic + methanol leaf extract 1.83200 2.91404 .533 -4.0271 7.6911
Group 10=Diabetic + n-hexane leaf and fruit extracts -5.03000 2.91404 .091 -10.8891 .8291
Group 11=Diabetic + ethanol leaf and fruit extracts -2.51600 2.91404 .392 -8.3751 3.3431
Group 12: Diabetic + methanol leaf and fruit extracts -1.78400 2.91404 .543 -7.6431 4.0751
Group 10=Diabetic + n-
hexane leaf and fruit extracts
Group 1=Normal Control -10.69200* 2.91404 .001 -16.5511 -4.8329
Group 2=Diabetic Untreated 17.36600* 2.91404 .000 11.5069 23.2251
Group 3=Standard Control -.48000 2.91404 .870 -6.3391 5.3791
Group 4=Diabetic + n-hexane leaf extract 16.50800* 2.91404 .000 10.6489 22.3671
Group 5=Diabetic + n-hexane fruit extract 4.86800 2.91404 .101 -.9911 10.7271
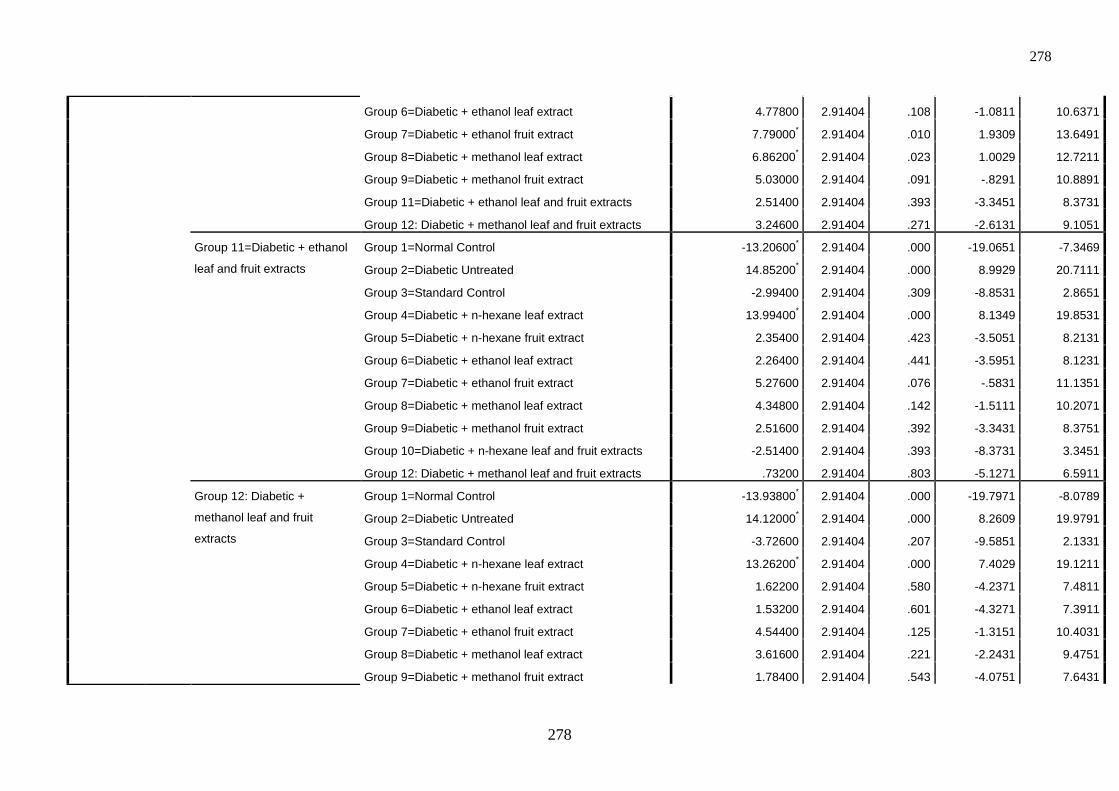
278
278
Group 6=Diabetic + ethanol leaf extract 4.77800 2.91404 .108 -1.0811 10.6371
Group 7=Diabetic + ethanol fruit extract 7.79000* 2.91404 .010 1.9309 13.6491
Group 8=Diabetic + methanol leaf extract 6.86200* 2.91404 .023 1.0029 12.7211
Group 9=Diabetic + methanol fruit extract 5.03000 2.91404 .091 -.8291 10.8891
Group 11=Diabetic + ethanol leaf and fruit extracts 2.51400 2.91404 .393 -3.3451 8.3731
Group 12: Diabetic + methanol leaf and fruit extracts 3.24600 2.91404 .271 -2.6131 9.1051
Group 11=Diabetic + ethanol
leaf and fruit extracts
Group 1=Normal Control -13.20600* 2.91404 .000 -19.0651 -7.3469
Group 2=Diabetic Untreated 14.85200* 2.91404 .000 8.9929 20.7111
Group 3=Standard Control -2.99400 2.91404 .309 -8.8531 2.8651
Group 4=Diabetic + n-hexane leaf extract 13.99400* 2.91404 .000 8.1349 19.8531
Group 5=Diabetic + n-hexane fruit extract 2.35400 2.91404 .423 -3.5051 8.2131
Group 6=Diabetic + ethanol leaf extract 2.26400 2.91404 .441 -3.5951 8.1231
Group 7=Diabetic + ethanol fruit extract 5.27600 2.91404 .076 -.5831 11.1351
Group 8=Diabetic + methanol leaf extract 4.34800 2.91404 .142 -1.5111 10.2071
Group 9=Diabetic + methanol fruit extract 2.51600 2.91404 .392 -3.3431 8.3751
Group 10=Diabetic + n-hexane leaf and fruit extracts -2.51400 2.91404 .393 -8.3731 3.3451
Group 12: Diabetic + methanol leaf and fruit extracts .73200 2.91404 .803 -5.1271 6.5911
Group 12: Diabetic +
methanol leaf and fruit
extracts
Group 1=Normal Control -13.93800* 2.91404 .000 -19.7971 -8.0789
Group 2=Diabetic Untreated 14.12000* 2.91404 .000 8.2609 19.9791
Group 3=Standard Control -3.72600 2.91404 .207 -9.5851 2.1331
Group 4=Diabetic + n-hexane leaf extract 13.26200* 2.91404 .000 7.4029 19.1211
Group 5=Diabetic + n-hexane fruit extract 1.62200 2.91404 .580 -4.2371 7.4811
Group 6=Diabetic + ethanol leaf extract 1.53200 2.91404 .601 -4.3271 7.3911
Group 7=Diabetic + ethanol fruit extract 4.54400 2.91404 .125 -1.3151 10.4031
Group 8=Diabetic + methanol leaf extract 3.61600 2.91404 .221 -2.2431 9.4751
Group 9=Diabetic + methanol fruit extract 1.78400 2.91404 .543 -4.0751 7.6431
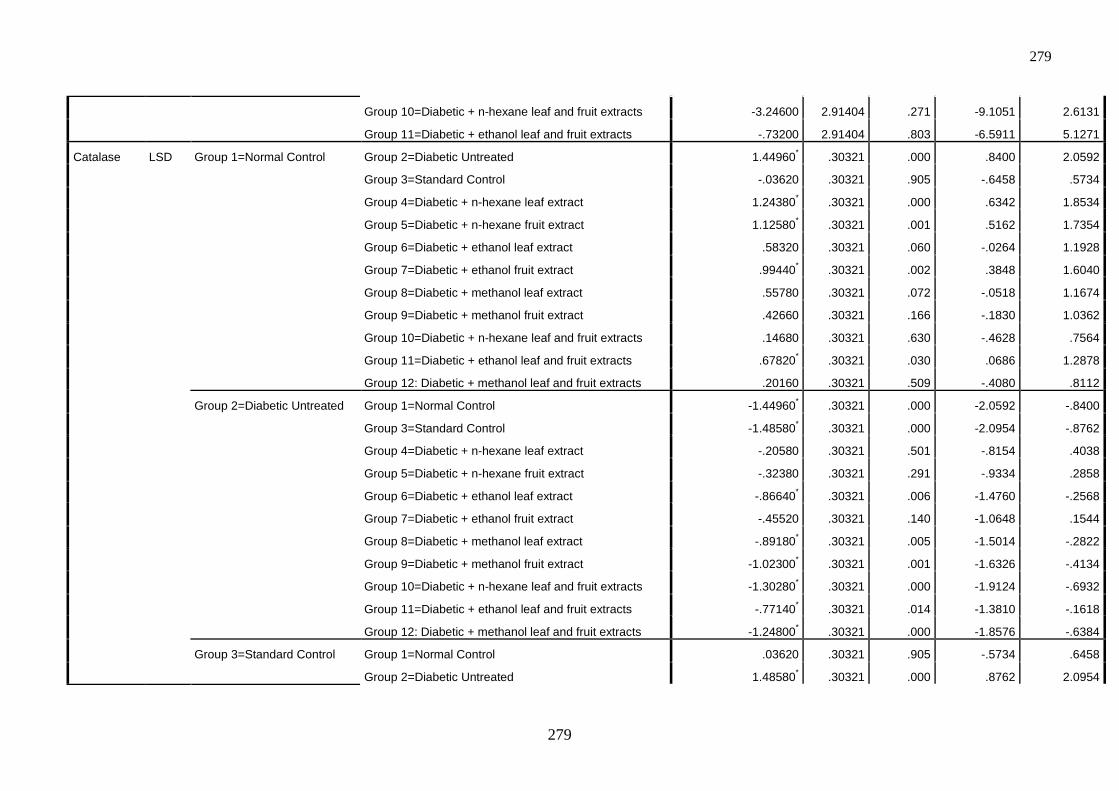
279
279
Group 10=Diabetic + n-hexane leaf and fruit extracts -3.24600 2.91404 .271 -9.1051 2.6131
Group 11=Diabetic + ethanol leaf and fruit extracts -.73200 2.91404 .803 -6.5911 5.1271
Catalase LSD Group 1=Normal Control Group 2=Diabetic Untreated 1.44960* .30321 .000 .8400 2.0592
Group 3=Standard Control -.03620 .30321 .905 -.6458 .5734
Group 4=Diabetic + n-hexane leaf extract 1.24380* .30321 .000 .6342 1.8534
Group 5=Diabetic + n-hexane fruit extract 1.12580* .30321 .001 .5162 1.7354
Group 6=Diabetic + ethanol leaf extract .58320 .30321 .060 -.0264 1.1928
Group 7=Diabetic + ethanol fruit extract .99440* .30321 .002 .3848 1.6040
Group 8=Diabetic + methanol leaf extract .55780 .30321 .072 -.0518 1.1674
Group 9=Diabetic + methanol fruit extract .42660 .30321 .166 -.1830 1.0362
Group 10=Diabetic + n-hexane leaf and fruit extracts .14680 .30321 .630 -.4628 .7564
Group 11=Diabetic + ethanol leaf and fruit extracts .67820* .30321 .030 .0686 1.2878
Group 12: Diabetic + methanol leaf and fruit extracts .20160 .30321 .509 -.4080 .8112
Group 2=Diabetic Untreated Group 1=Normal Control -1.44960* .30321 .000 -2.0592 -.8400
Group 3=Standard Control -1.48580* .30321 .000 -2.0954 -.8762
Group 4=Diabetic + n-hexane leaf extract -.20580 .30321 .501 -.8154 .4038
Group 5=Diabetic + n-hexane fruit extract -.32380 .30321 .291 -.9334 .2858
Group 6=Diabetic + ethanol leaf extract -.86640* .30321 .006 -1.4760 -.2568
Group 7=Diabetic + ethanol fruit extract -.45520 .30321 .140 -1.0648 .1544
Group 8=Diabetic + methanol leaf extract -.89180* .30321 .005 -1.5014 -.2822
Group 9=Diabetic + methanol fruit extract -1.02300* .30321 .001 -1.6326 -.4134
Group 10=Diabetic + n-hexane leaf and fruit extracts -1.30280* .30321 .000 -1.9124 -.6932
Group 11=Diabetic + ethanol leaf and fruit extracts -.77140* .30321 .014 -1.3810 -.1618
Group 12: Diabetic + methanol leaf and fruit extracts -1.24800* .30321 .000 -1.8576 -.6384
Group 3=Standard Control Group 1=Normal Control .03620 .30321 .905 -.5734 .6458
Group 2=Diabetic Untreated 1.48580* .30321 .000 .8762 2.0954
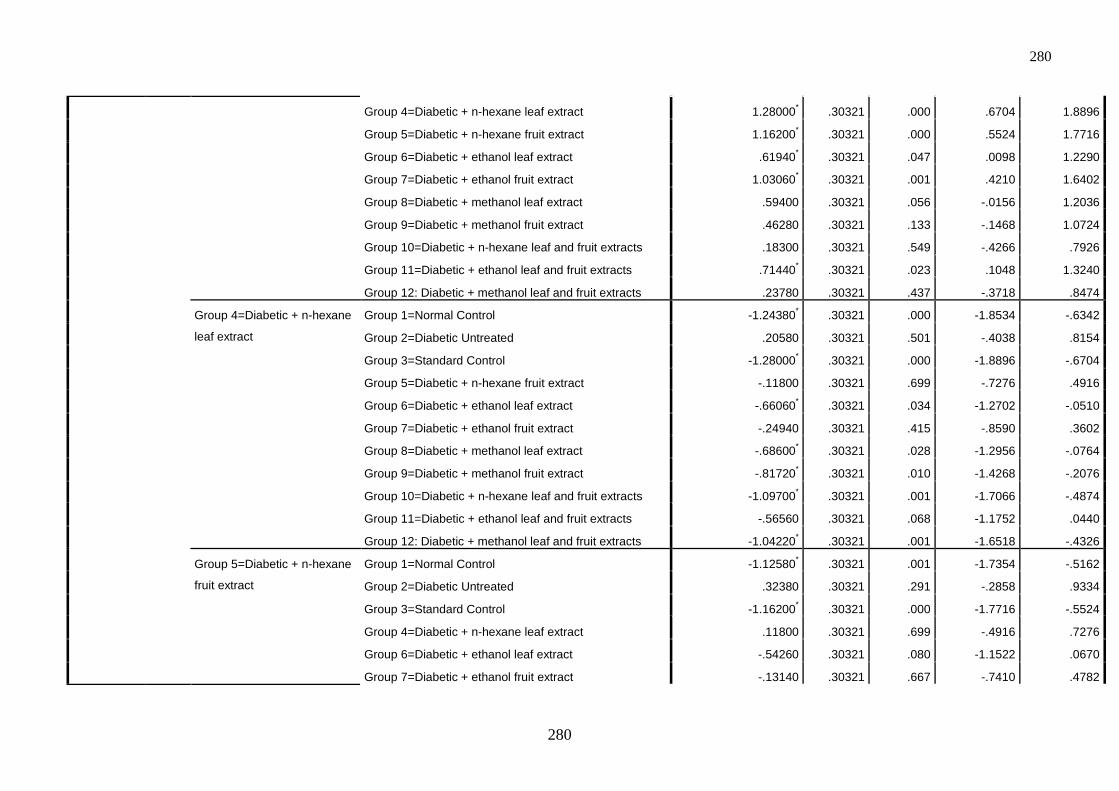
280
280
Group 4=Diabetic + n-hexane leaf extract 1.28000* .30321 .000 .6704 1.8896
Group 5=Diabetic + n-hexane fruit extract 1.16200* .30321 .000 .5524 1.7716
Group 6=Diabetic + ethanol leaf extract .61940* .30321 .047 .0098 1.2290
Group 7=Diabetic + ethanol fruit extract 1.03060* .30321 .001 .4210 1.6402
Group 8=Diabetic + methanol leaf extract .59400 .30321 .056 -.0156 1.2036
Group 9=Diabetic + methanol fruit extract .46280 .30321 .133 -.1468 1.0724
Group 10=Diabetic + n-hexane leaf and fruit extracts .18300 .30321 .549 -.4266 .7926
Group 11=Diabetic + ethanol leaf and fruit extracts .71440* .30321 .023 .1048 1.3240
Group 12: Diabetic + methanol leaf and fruit extracts .23780 .30321 .437 -.3718 .8474
Group 4=Diabetic + n-hexane
leaf extract
Group 1=Normal Control -1.24380* .30321 .000 -1.8534 -.6342
Group 2=Diabetic Untreated .20580 .30321 .501 -.4038 .8154
Group 3=Standard Control -1.28000* .30321 .000 -1.8896 -.6704
Group 5=Diabetic + n-hexane fruit extract -.11800 .30321 .699 -.7276 .4916
Group 6=Diabetic + ethanol leaf extract -.66060* .30321 .034 -1.2702 -.0510
Group 7=Diabetic + ethanol fruit extract -.24940 .30321 .415 -.8590 .3602
Group 8=Diabetic + methanol leaf extract -.68600* .30321 .028 -1.2956 -.0764
Group 9=Diabetic + methanol fruit extract -.81720* .30321 .010 -1.4268 -.2076
Group 10=Diabetic + n-hexane leaf and fruit extracts -1.09700* .30321 .001 -1.7066 -.4874
Group 11=Diabetic + ethanol leaf and fruit extracts -.56560 .30321 .068 -1.1752 .0440
Group 12: Diabetic + methanol leaf and fruit extracts -1.04220* .30321 .001 -1.6518 -.4326
Group 5=Diabetic + n-hexane
fruit extract
Group 1=Normal Control -1.12580* .30321 .001 -1.7354 -.5162
Group 2=Diabetic Untreated .32380 .30321 .291 -.2858 .9334
Group 3=Standard Control -1.16200* .30321 .000 -1.7716 -.5524
Group 4=Diabetic + n-hexane leaf extract .11800 .30321 .699 -.4916 .7276
Group 6=Diabetic + ethanol leaf extract -.54260 .30321 .080 -1.1522 .0670
Group 7=Diabetic + ethanol fruit extract -.13140 .30321 .667 -.7410 .4782

281
281
Group 8=Diabetic + methanol leaf extract -.56800 .30321 .067 -1.1776 .0416
Group 9=Diabetic + methanol fruit extract -.69920* .30321 .025 -1.3088 -.0896
Group 10=Diabetic + n-hexane leaf and fruit extracts -.97900* .30321 .002 -1.5886 -.3694
Group 11=Diabetic + ethanol leaf and fruit extracts -.44760 .30321 .146 -1.0572 .1620
Group 12: Diabetic + methanol leaf and fruit extracts -.92420* .30321 .004 -1.5338 -.3146
Group 6=Diabetic + ethanol
leaf extract
Group 1=Normal Control -.58320 .30321 .060 -1.1928 .0264
Group 2=Diabetic Untreated .86640* .30321 .006 .2568 1.4760
Group 3=Standard Control -.61940* .30321 .047 -1.2290 -.0098
Group 4=Diabetic + n-hexane leaf extract .66060* .30321 .034 .0510 1.2702
Group 5=Diabetic + n-hexane fruit extract .54260 .30321 .080 -.0670 1.1522
Group 7=Diabetic + ethanol fruit extract .41120 .30321 .181 -.1984 1.0208
Group 8=Diabetic + methanol leaf extract -.02540 .30321 .934 -.6350 .5842
Group 9=Diabetic + methanol fruit extract -.15660 .30321 .608 -.7662 .4530
Group 10=Diabetic + n-hexane leaf and fruit extracts -.43640 .30321 .157 -1.0460 .1732
Group 11=Diabetic + ethanol leaf and fruit extracts .09500 .30321 .755 -.5146 .7046
Group 12: Diabetic + methanol leaf and fruit extracts -.38160 .30321 .214 -.9912 .2280
Group 7=Diabetic + ethanol
fruit extract
Group 1=Normal Control -.99440* .30321 .002 -1.6040 -.3848
Group 2=Diabetic Untreated .45520 .30321 .140 -.1544 1.0648
Group 3=Standard Control -1.03060* .30321 .001 -1.6402 -.4210
Group 4=Diabetic + n-hexane leaf extract .24940 .30321 .415 -.3602 .8590
Group 5=Diabetic + n-hexane fruit extract .13140 .30321 .667 -.4782 .7410
Group 6=Diabetic + ethanol leaf extract -.41120 .30321 .181 -1.0208 .1984
Group 8=Diabetic + methanol leaf extract -.43660 .30321 .156 -1.0462 .1730
Group 9=Diabetic + methanol fruit extract -.56780 .30321 .067 -1.1774 .0418
Group 10=Diabetic + n-hexane leaf and fruit extracts -.84760* .30321 .007 -1.4572 -.2380
Group 11=Diabetic + ethanol leaf and fruit extracts -.31620 .30321 .302 -.9258 .2934
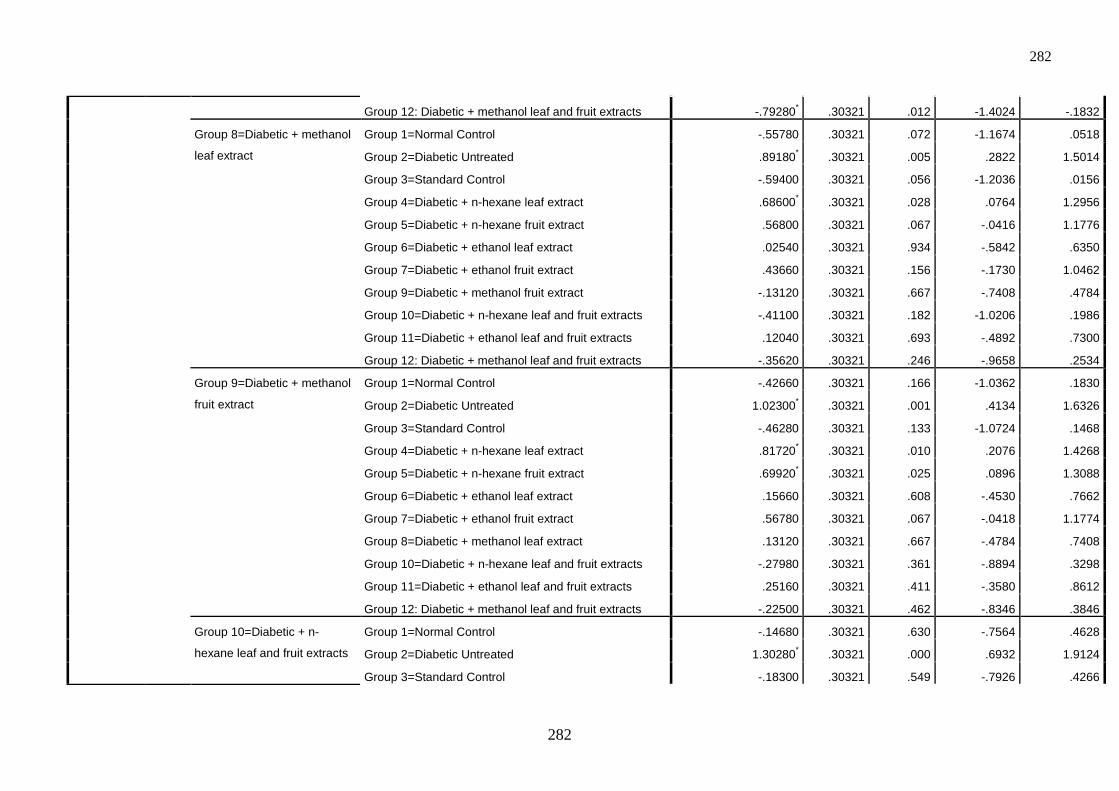
282
282
Group 12: Diabetic + methanol leaf and fruit extracts -.79280* .30321 .012 -1.4024 -.1832
Group 8=Diabetic + methanol
leaf extract
Group 1=Normal Control -.55780 .30321 .072 -1.1674 .0518
Group 2=Diabetic Untreated .89180* .30321 .005 .2822 1.5014
Group 3=Standard Control -.59400 .30321 .056 -1.2036 .0156
Group 4=Diabetic + n-hexane leaf extract .68600* .30321 .028 .0764 1.2956
Group 5=Diabetic + n-hexane fruit extract .56800 .30321 .067 -.0416 1.1776
Group 6=Diabetic + ethanol leaf extract .02540 .30321 .934 -.5842 .6350
Group 7=Diabetic + ethanol fruit extract .43660 .30321 .156 -.1730 1.0462
Group 9=Diabetic + methanol fruit extract -.13120 .30321 .667 -.7408 .4784
Group 10=Diabetic + n-hexane leaf and fruit extracts -.41100 .30321 .182 -1.0206 .1986
Group 11=Diabetic + ethanol leaf and fruit extracts .12040 .30321 .693 -.4892 .7300
Group 12: Diabetic + methanol leaf and fruit extracts -.35620 .30321 .246 -.9658 .2534
Group 9=Diabetic + methanol
fruit extract
Group 1=Normal Control -.42660 .30321 .166 -1.0362 .1830
Group 2=Diabetic Untreated 1.02300* .30321 .001 .4134 1.6326
Group 3=Standard Control -.46280 .30321 .133 -1.0724 .1468
Group 4=Diabetic + n-hexane leaf extract .81720* .30321 .010 .2076 1.4268
Group 5=Diabetic + n-hexane fruit extract .69920* .30321 .025 .0896 1.3088
Group 6=Diabetic + ethanol leaf extract .15660 .30321 .608 -.4530 .7662
Group 7=Diabetic + ethanol fruit extract .56780 .30321 .067 -.0418 1.1774
Group 8=Diabetic + methanol leaf extract .13120 .30321 .667 -.4784 .7408
Group 10=Diabetic + n-hexane leaf and fruit extracts -.27980 .30321 .361 -.8894 .3298
Group 11=Diabetic + ethanol leaf and fruit extracts .25160 .30321 .411 -.3580 .8612
Group 12: Diabetic + methanol leaf and fruit extracts -.22500 .30321 .462 -.8346 .3846
Group 10=Diabetic + n-
hexane leaf and fruit extracts
Group 1=Normal Control -.14680 .30321 .630 -.7564 .4628
Group 2=Diabetic Untreated 1.30280* .30321 .000 .6932 1.9124
Group 3=Standard Control -.18300 .30321 .549 -.7926 .4266
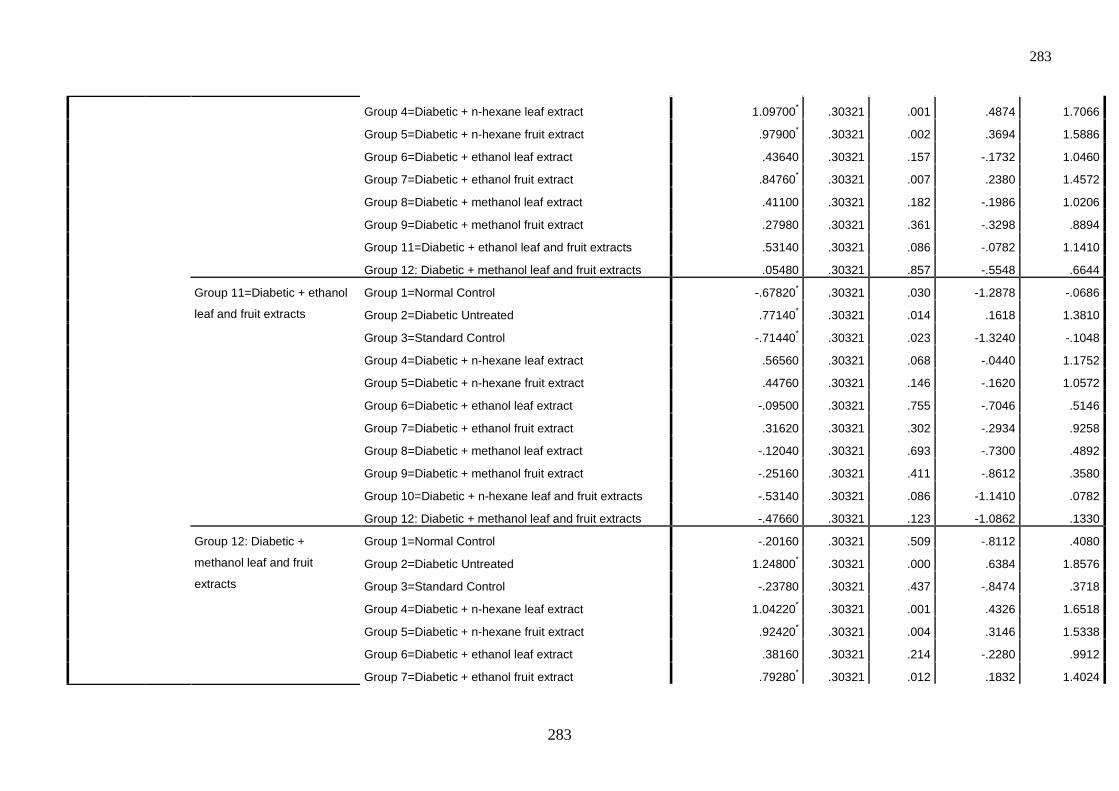
283
283
Group 4=Diabetic + n-hexane leaf extract 1.09700* .30321 .001 .4874 1.7066
Group 5=Diabetic + n-hexane fruit extract .97900* .30321 .002 .3694 1.5886
Group 6=Diabetic + ethanol leaf extract .43640 .30321 .157 -.1732 1.0460
Group 7=Diabetic + ethanol fruit extract .84760* .30321 .007 .2380 1.4572
Group 8=Diabetic + methanol leaf extract .41100 .30321 .182 -.1986 1.0206
Group 9=Diabetic + methanol fruit extract .27980 .30321 .361 -.3298 .8894
Group 11=Diabetic + ethanol leaf and fruit extracts .53140 .30321 .086 -.0782 1.1410
Group 12: Diabetic + methanol leaf and fruit extracts .05480 .30321 .857 -.5548 .6644
Group 11=Diabetic + ethanol
leaf and fruit extracts
Group 1=Normal Control -.67820* .30321 .030 -1.2878 -.0686
Group 2=Diabetic Untreated .77140* .30321 .014 .1618 1.3810
Group 3=Standard Control -.71440* .30321 .023 -1.3240 -.1048
Group 4=Diabetic + n-hexane leaf extract .56560 .30321 .068 -.0440 1.1752
Group 5=Diabetic + n-hexane fruit extract .44760 .30321 .146 -.1620 1.0572
Group 6=Diabetic + ethanol leaf extract -.09500 .30321 .755 -.7046 .5146
Group 7=Diabetic + ethanol fruit extract .31620 .30321 .302 -.2934 .9258
Group 8=Diabetic + methanol leaf extract -.12040 .30321 .693 -.7300 .4892
Group 9=Diabetic + methanol fruit extract -.25160 .30321 .411 -.8612 .3580
Group 10=Diabetic + n-hexane leaf and fruit extracts -.53140 .30321 .086 -1.1410 .0782
Group 12: Diabetic + methanol leaf and fruit extracts -.47660 .30321 .123 -1.0862 .1330
Group 12: Diabetic +
methanol leaf and fruit
extracts
Group 1=Normal Control -.20160 .30321 .509 -.8112 .4080
Group 2=Diabetic Untreated 1.24800* .30321 .000 .6384 1.8576
Group 3=Standard Control -.23780 .30321 .437 -.8474 .3718
Group 4=Diabetic + n-hexane leaf extract 1.04220* .30321 .001 .4326 1.6518
Group 5=Diabetic + n-hexane fruit extract .92420* .30321 .004 .3146 1.5338
Group 6=Diabetic + ethanol leaf extract .38160 .30321 .214 -.2280 .9912
Group 7=Diabetic + ethanol fruit extract .79280* .30321 .012 .1832 1.4024
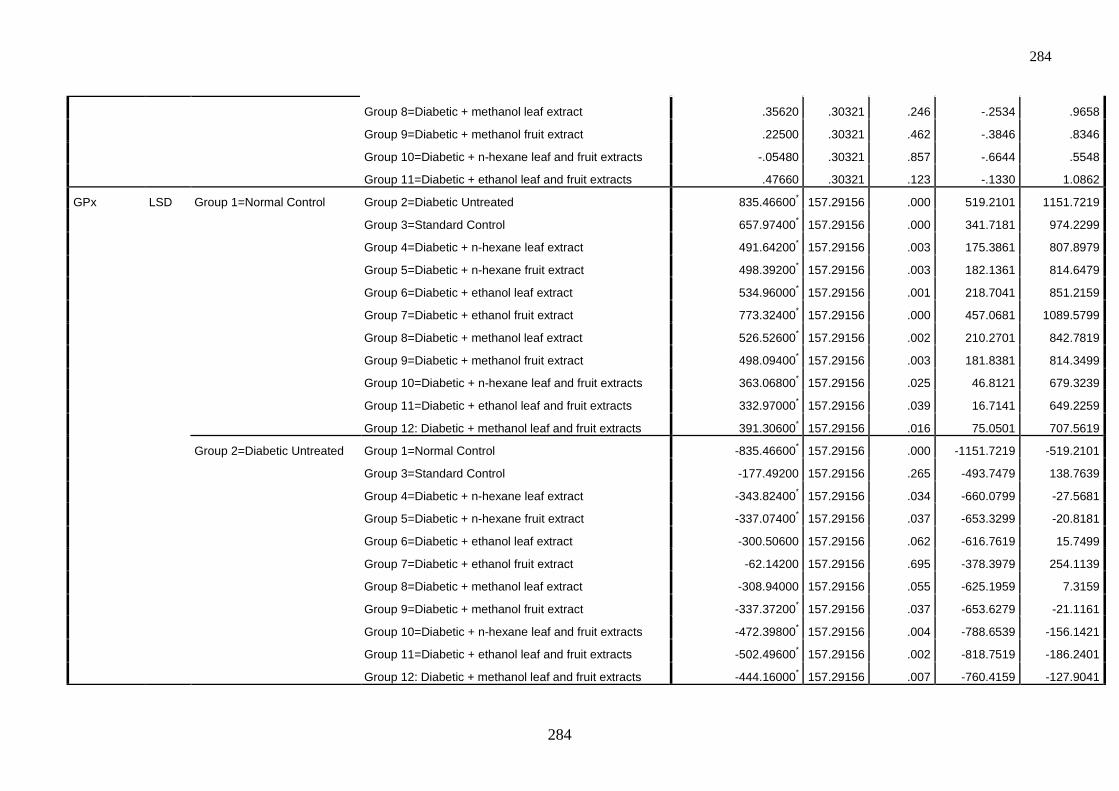
284
284
Group 8=Diabetic + methanol leaf extract .35620 .30321 .246 -.2534 .9658
Group 9=Diabetic + methanol fruit extract .22500 .30321 .462 -.3846 .8346
Group 10=Diabetic + n-hexane leaf and fruit extracts -.05480 .30321 .857 -.6644 .5548
Group 11=Diabetic + ethanol leaf and fruit extracts .47660 .30321 .123 -.1330 1.0862
GPx LSD Group 1=Normal Control Group 2=Diabetic Untreated 835.46600* 157.29156 .000 519.2101 1151.7219
Group 3=Standard Control 657.97400* 157.29156 .000 341.7181 974.2299
Group 4=Diabetic + n-hexane leaf extract 491.64200* 157.29156 .003 175.3861 807.8979
Group 5=Diabetic + n-hexane fruit extract 498.39200* 157.29156 .003 182.1361 814.6479
Group 6=Diabetic + ethanol leaf extract 534.96000* 157.29156 .001 218.7041 851.2159
Group 7=Diabetic + ethanol fruit extract 773.32400* 157.29156 .000 457.0681 1089.5799
Group 8=Diabetic + methanol leaf extract 526.52600* 157.29156 .002 210.2701 842.7819
Group 9=Diabetic + methanol fruit extract 498.09400* 157.29156 .003 181.8381 814.3499
Group 10=Diabetic + n-hexane leaf and fruit extracts 363.06800* 157.29156 .025 46.8121 679.3239
Group 11=Diabetic + ethanol leaf and fruit extracts 332.97000* 157.29156 .039 16.7141 649.2259
Group 12: Diabetic + methanol leaf and fruit extracts 391.30600* 157.29156 .016 75.0501 707.5619
Group 2=Diabetic Untreated Group 1=Normal Control -835.46600* 157.29156 .000 -1151.7219 -519.2101
Group 3=Standard Control -177.49200 157.29156 .265 -493.7479 138.7639
Group 4=Diabetic + n-hexane leaf extract -343.82400* 157.29156 .034 -660.0799 -27.5681
Group 5=Diabetic + n-hexane fruit extract -337.07400* 157.29156 .037 -653.3299 -20.8181
Group 6=Diabetic + ethanol leaf extract -300.50600 157.29156 .062 -616.7619 15.7499
Group 7=Diabetic + ethanol fruit extract -62.14200 157.29156 .695 -378.3979 254.1139
Group 8=Diabetic + methanol leaf extract -308.94000 157.29156 .055 -625.1959 7.3159
Group 9=Diabetic + methanol fruit extract -337.37200* 157.29156 .037 -653.6279 -21.1161
Group 10=Diabetic + n-hexane leaf and fruit extracts -472.39800* 157.29156 .004 -788.6539 -156.1421
Group 11=Diabetic + ethanol leaf and fruit extracts -502.49600* 157.29156 .002 -818.7519 -186.2401
Group 12: Diabetic + methanol leaf and fruit extracts -444.16000* 157.29156 .007 -760.4159 -127.9041
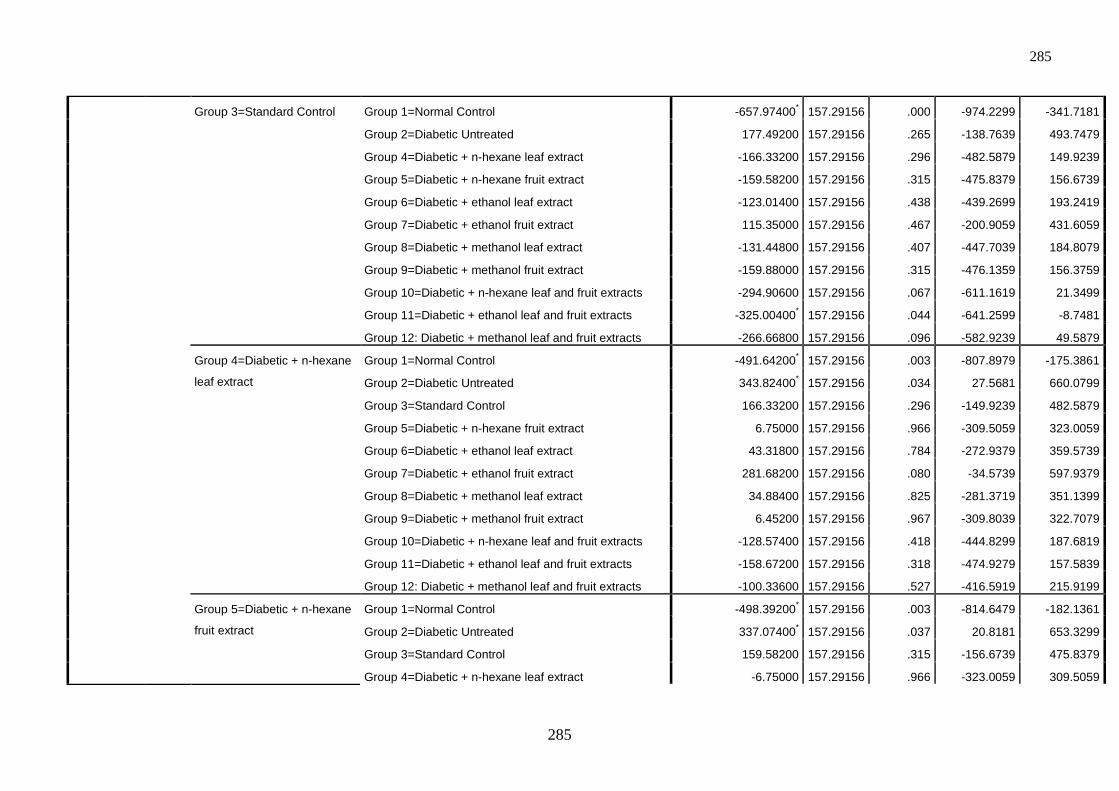
285
285
Group 3=Standard Control Group 1=Normal Control -657.97400* 157.29156 .000 -974.2299 -341.7181
Group 2=Diabetic Untreated 177.49200 157.29156 .265 -138.7639 493.7479
Group 4=Diabetic + n-hexane leaf extract -166.33200 157.29156 .296 -482.5879 149.9239
Group 5=Diabetic + n-hexane fruit extract -159.58200 157.29156 .315 -475.8379 156.6739
Group 6=Diabetic + ethanol leaf extract -123.01400 157.29156 .438 -439.2699 193.2419
Group 7=Diabetic + ethanol fruit extract 115.35000 157.29156 .467 -200.9059 431.6059
Group 8=Diabetic + methanol leaf extract -131.44800 157.29156 .407 -447.7039 184.8079
Group 9=Diabetic + methanol fruit extract -159.88000 157.29156 .315 -476.1359 156.3759
Group 10=Diabetic + n-hexane leaf and fruit extracts -294.90600 157.29156 .067 -611.1619 21.3499
Group 11=Diabetic + ethanol leaf and fruit extracts -325.00400* 157.29156 .044 -641.2599 -8.7481
Group 12: Diabetic + methanol leaf and fruit extracts -266.66800 157.29156 .096 -582.9239 49.5879
Group 4=Diabetic + n-hexane
leaf extract
Group 1=Normal Control -491.64200* 157.29156 .003 -807.8979 -175.3861
Group 2=Diabetic Untreated 343.82400* 157.29156 .034 27.5681 660.0799
Group 3=Standard Control 166.33200 157.29156 .296 -149.9239 482.5879
Group 5=Diabetic + n-hexane fruit extract 6.75000 157.29156 .966 -309.5059 323.0059
Group 6=Diabetic + ethanol leaf extract 43.31800 157.29156 .784 -272.9379 359.5739
Group 7=Diabetic + ethanol fruit extract 281.68200 157.29156 .080 -34.5739 597.9379
Group 8=Diabetic + methanol leaf extract 34.88400 157.29156 .825 -281.3719 351.1399
Group 9=Diabetic + methanol fruit extract 6.45200 157.29156 .967 -309.8039 322.7079
Group 10=Diabetic + n-hexane leaf and fruit extracts -128.57400 157.29156 .418 -444.8299 187.6819
Group 11=Diabetic + ethanol leaf and fruit extracts -158.67200 157.29156 .318 -474.9279 157.5839
Group 12: Diabetic + methanol leaf and fruit extracts -100.33600 157.29156 .527 -416.5919 215.9199
Group 5=Diabetic + n-hexane
fruit extract
Group 1=Normal Control -498.39200* 157.29156 .003 -814.6479 -182.1361
Group 2=Diabetic Untreated 337.07400* 157.29156 .037 20.8181 653.3299
Group 3=Standard Control 159.58200 157.29156 .315 -156.6739 475.8379
Group 4=Diabetic + n-hexane leaf extract -6.75000 157.29156 .966 -323.0059 309.5059
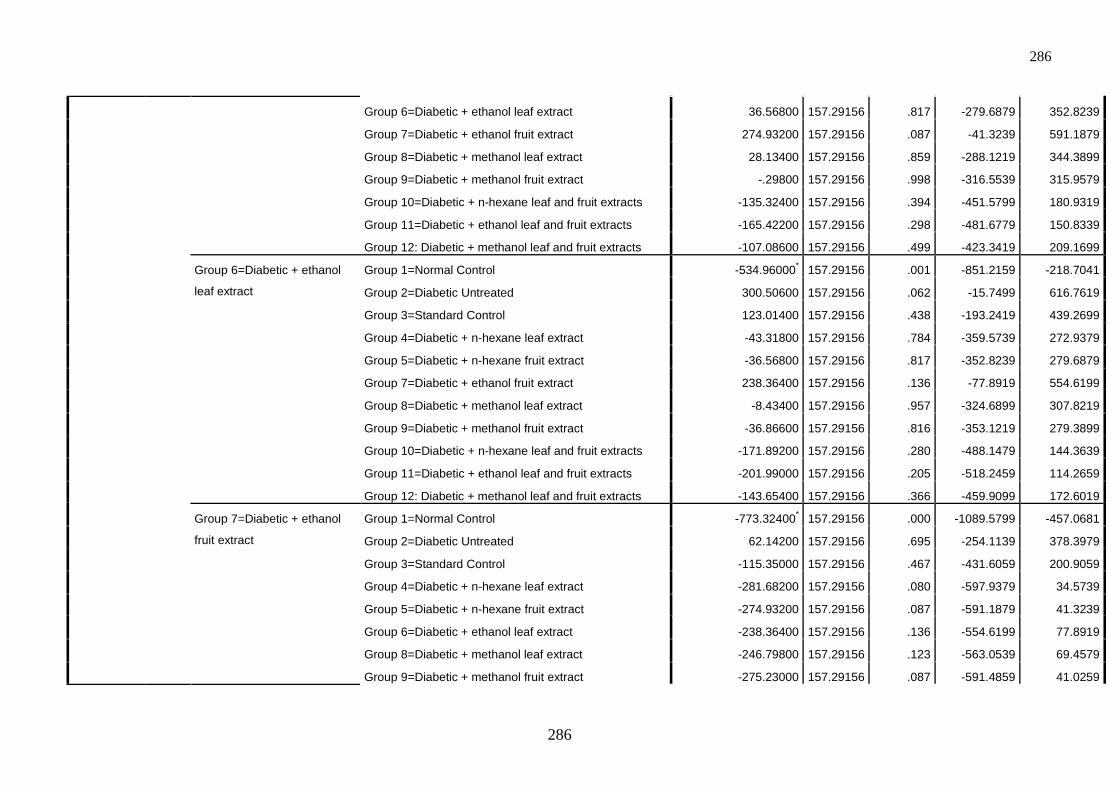
286
286
Group 6=Diabetic + ethanol leaf extract 36.56800 157.29156 .817 -279.6879 352.8239
Group 7=Diabetic + ethanol fruit extract 274.93200 157.29156 .087 -41.3239 591.1879
Group 8=Diabetic + methanol leaf extract 28.13400 157.29156 .859 -288.1219 344.3899
Group 9=Diabetic + methanol fruit extract -.29800 157.29156 .998 -316.5539 315.9579
Group 10=Diabetic + n-hexane leaf and fruit extracts -135.32400 157.29156 .394 -451.5799 180.9319
Group 11=Diabetic + ethanol leaf and fruit extracts -165.42200 157.29156 .298 -481.6779 150.8339
Group 12: Diabetic + methanol leaf and fruit extracts -107.08600 157.29156 .499 -423.3419 209.1699
Group 6=Diabetic + ethanol
leaf extract
Group 1=Normal Control -534.96000* 157.29156 .001 -851.2159 -218.7041
Group 2=Diabetic Untreated 300.50600 157.29156 .062 -15.7499 616.7619
Group 3=Standard Control 123.01400 157.29156 .438 -193.2419 439.2699
Group 4=Diabetic + n-hexane leaf extract -43.31800 157.29156 .784 -359.5739 272.9379
Group 5=Diabetic + n-hexane fruit extract -36.56800 157.29156 .817 -352.8239 279.6879
Group 7=Diabetic + ethanol fruit extract 238.36400 157.29156 .136 -77.8919 554.6199
Group 8=Diabetic + methanol leaf extract -8.43400 157.29156 .957 -324.6899 307.8219
Group 9=Diabetic + methanol fruit extract -36.86600 157.29156 .816 -353.1219 279.3899
Group 10=Diabetic + n-hexane leaf and fruit extracts -171.89200 157.29156 .280 -488.1479 144.3639
Group 11=Diabetic + ethanol leaf and fruit extracts -201.99000 157.29156 .205 -518.2459 114.2659
Group 12: Diabetic + methanol leaf and fruit extracts -143.65400 157.29156 .366 -459.9099 172.6019
Group 7=Diabetic + ethanol
fruit extract
Group 1=Normal Control -773.32400* 157.29156 .000 -1089.5799 -457.0681
Group 2=Diabetic Untreated 62.14200 157.29156 .695 -254.1139 378.3979
Group 3=Standard Control -115.35000 157.29156 .467 -431.6059 200.9059
Group 4=Diabetic + n-hexane leaf extract -281.68200 157.29156 .080 -597.9379 34.5739
Group 5=Diabetic + n-hexane fruit extract -274.93200 157.29156 .087 -591.1879 41.3239
Group 6=Diabetic + ethanol leaf extract -238.36400 157.29156 .136 -554.6199 77.8919
Group 8=Diabetic + methanol leaf extract -246.79800 157.29156 .123 -563.0539 69.4579
Group 9=Diabetic + methanol fruit extract -275.23000 157.29156 .087 -591.4859 41.0259
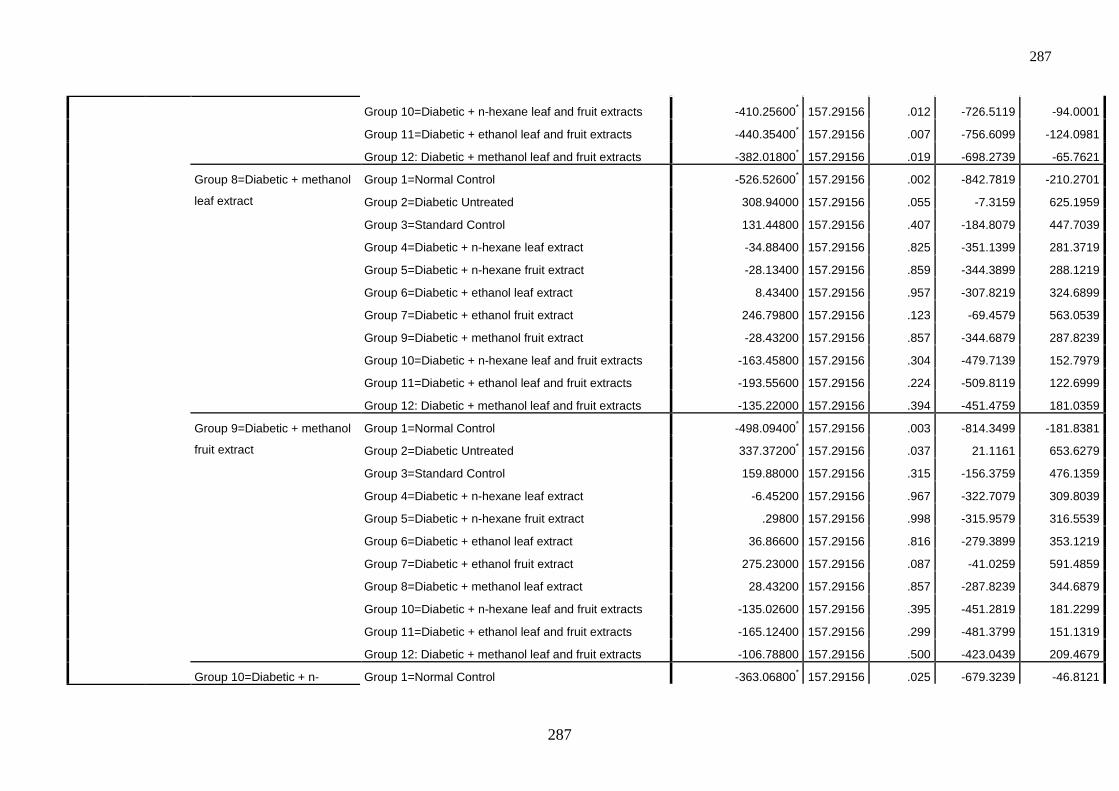
287
287
Group 10=Diabetic + n-hexane leaf and fruit extracts -410.25600* 157.29156 .012 -726.5119 -94.0001
Group 11=Diabetic + ethanol leaf and fruit extracts -440.35400* 157.29156 .007 -756.6099 -124.0981
Group 12: Diabetic + methanol leaf and fruit extracts -382.01800* 157.29156 .019 -698.2739 -65.7621
Group 8=Diabetic + methanol
leaf extract
Group 1=Normal Control -526.52600* 157.29156 .002 -842.7819 -210.2701
Group 2=Diabetic Untreated 308.94000 157.29156 .055 -7.3159 625.1959
Group 3=Standard Control 131.44800 157.29156 .407 -184.8079 447.7039
Group 4=Diabetic + n-hexane leaf extract -34.88400 157.29156 .825 -351.1399 281.3719
Group 5=Diabetic + n-hexane fruit extract -28.13400 157.29156 .859 -344.3899 288.1219
Group 6=Diabetic + ethanol leaf extract 8.43400 157.29156 .957 -307.8219 324.6899
Group 7=Diabetic + ethanol fruit extract 246.79800 157.29156 .123 -69.4579 563.0539
Group 9=Diabetic + methanol fruit extract -28.43200 157.29156 .857 -344.6879 287.8239
Group 10=Diabetic + n-hexane leaf and fruit extracts -163.45800 157.29156 .304 -479.7139 152.7979
Group 11=Diabetic + ethanol leaf and fruit extracts -193.55600 157.29156 .224 -509.8119 122.6999
Group 12: Diabetic + methanol leaf and fruit extracts -135.22000 157.29156 .394 -451.4759 181.0359
Group 9=Diabetic + methanol
fruit extract
Group 1=Normal Control -498.09400* 157.29156 .003 -814.3499 -181.8381
Group 2=Diabetic Untreated 337.37200* 157.29156 .037 21.1161 653.6279
Group 3=Standard Control 159.88000 157.29156 .315 -156.3759 476.1359
Group 4=Diabetic + n-hexane leaf extract -6.45200 157.29156 .967 -322.7079 309.8039
Group 5=Diabetic + n-hexane fruit extract .29800 157.29156 .998 -315.9579 316.5539
Group 6=Diabetic + ethanol leaf extract 36.86600 157.29156 .816 -279.3899 353.1219
Group 7=Diabetic + ethanol fruit extract 275.23000 157.29156 .087 -41.0259 591.4859
Group 8=Diabetic + methanol leaf extract 28.43200 157.29156 .857 -287.8239 344.6879
Group 10=Diabetic + n-hexane leaf and fruit extracts -135.02600 157.29156 .395 -451.2819 181.2299
Group 11=Diabetic + ethanol leaf and fruit extracts -165.12400 157.29156 .299 -481.3799 151.1319
Group 12: Diabetic + methanol leaf and fruit extracts -106.78800 157.29156 .500 -423.0439 209.4679
Group 10=Diabetic + n- Group 1=Normal Control -363.06800* 157.29156 .025 -679.3239 -46.8121
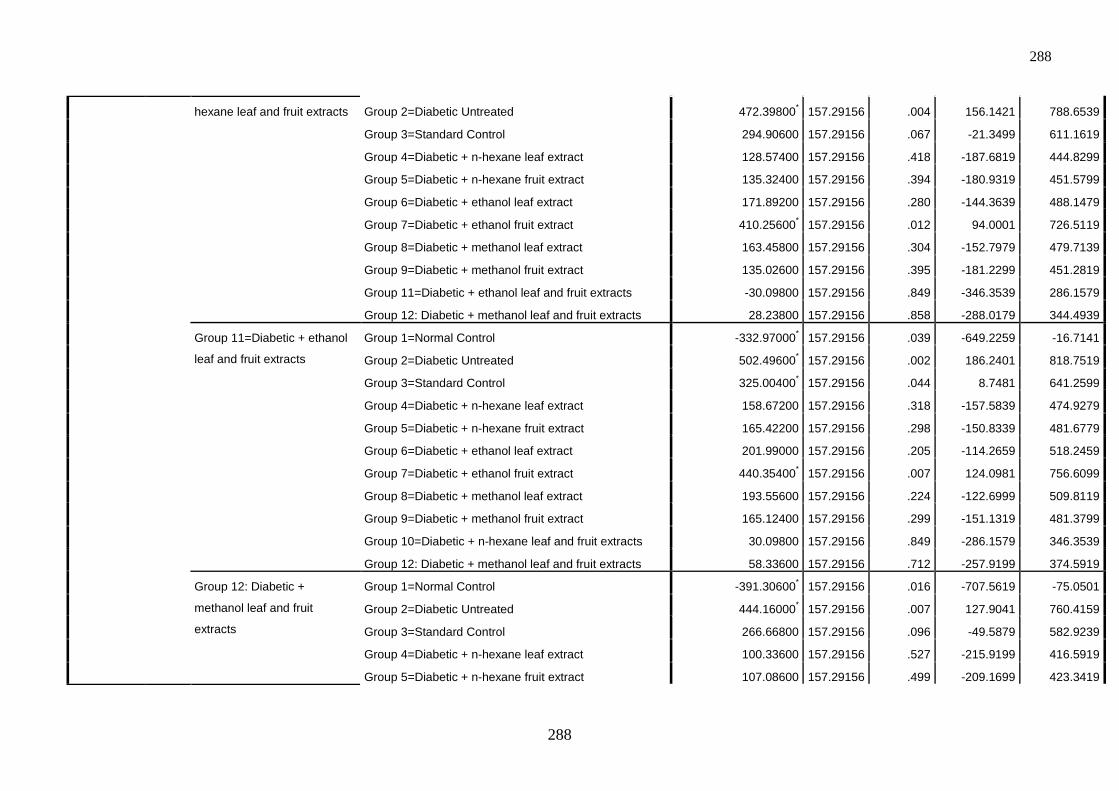
288
288
hexane leaf and fruit extracts Group 2=Diabetic Untreated 472.39800* 157.29156 .004 156.1421 788.6539
Group 3=Standard Control 294.90600 157.29156 .067 -21.3499 611.1619
Group 4=Diabetic + n-hexane leaf extract 128.57400 157.29156 .418 -187.6819 444.8299
Group 5=Diabetic + n-hexane fruit extract 135.32400 157.29156 .394 -180.9319 451.5799
Group 6=Diabetic + ethanol leaf extract 171.89200 157.29156 .280 -144.3639 488.1479
Group 7=Diabetic + ethanol fruit extract 410.25600* 157.29156 .012 94.0001 726.5119
Group 8=Diabetic + methanol leaf extract 163.45800 157.29156 .304 -152.7979 479.7139
Group 9=Diabetic + methanol fruit extract 135.02600 157.29156 .395 -181.2299 451.2819
Group 11=Diabetic + ethanol leaf and fruit extracts -30.09800 157.29156 .849 -346.3539 286.1579
Group 12: Diabetic + methanol leaf and fruit extracts 28.23800 157.29156 .858 -288.0179 344.4939
Group 11=Diabetic + ethanol
leaf and fruit extracts
Group 1=Normal Control -332.97000* 157.29156 .039 -649.2259 -16.7141
Group 2=Diabetic Untreated 502.49600* 157.29156 .002 186.2401 818.7519
Group 3=Standard Control 325.00400* 157.29156 .044 8.7481 641.2599
Group 4=Diabetic + n-hexane leaf extract 158.67200 157.29156 .318 -157.5839 474.9279
Group 5=Diabetic + n-hexane fruit extract 165.42200 157.29156 .298 -150.8339 481.6779
Group 6=Diabetic + ethanol leaf extract 201.99000 157.29156 .205 -114.2659 518.2459
Group 7=Diabetic + ethanol fruit extract 440.35400* 157.29156 .007 124.0981 756.6099
Group 8=Diabetic + methanol leaf extract 193.55600 157.29156 .224 -122.6999 509.8119
Group 9=Diabetic + methanol fruit extract 165.12400 157.29156 .299 -151.1319 481.3799
Group 10=Diabetic + n-hexane leaf and fruit extracts 30.09800 157.29156 .849 -286.1579 346.3539
Group 12: Diabetic + methanol leaf and fruit extracts 58.33600 157.29156 .712 -257.9199 374.5919
Group 12: Diabetic +
methanol leaf and fruit
extracts
Group 1=Normal Control -391.30600* 157.29156 .016 -707.5619 -75.0501
Group 2=Diabetic Untreated 444.16000* 157.29156 .007 127.9041 760.4159
Group 3=Standard Control 266.66800 157.29156 .096 -49.5879 582.9239
Group 4=Diabetic + n-hexane leaf extract 100.33600 157.29156 .527 -215.9199 416.5919
Group 5=Diabetic + n-hexane fruit extract 107.08600 157.29156 .499 -209.1699 423.3419
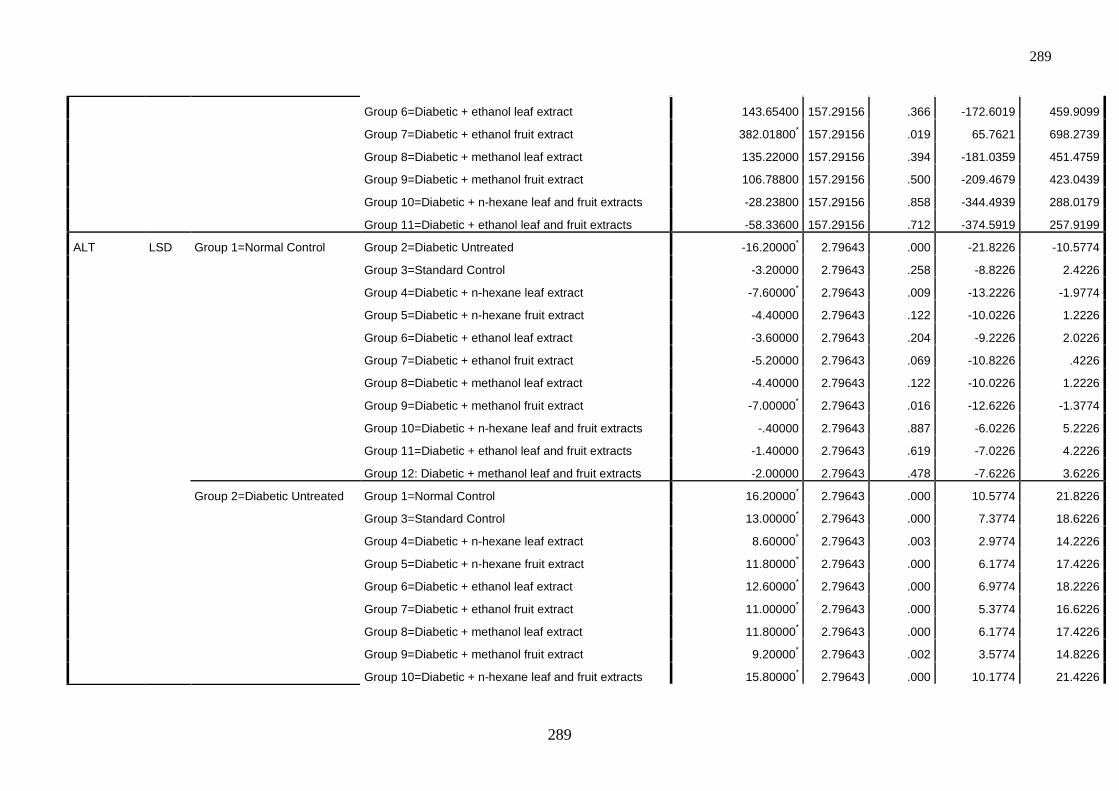
289
289
Group 6=Diabetic + ethanol leaf extract 143.65400 157.29156 .366 -172.6019 459.9099
Group 7=Diabetic + ethanol fruit extract 382.01800* 157.29156 .019 65.7621 698.2739
Group 8=Diabetic + methanol leaf extract 135.22000 157.29156 .394 -181.0359 451.4759
Group 9=Diabetic + methanol fruit extract 106.78800 157.29156 .500 -209.4679 423.0439
Group 10=Diabetic + n-hexane leaf and fruit extracts -28.23800 157.29156 .858 -344.4939 288.0179
Group 11=Diabetic + ethanol leaf and fruit extracts -58.33600 157.29156 .712 -374.5919 257.9199
ALT LSD Group 1=Normal Control Group 2=Diabetic Untreated -16.20000* 2.79643 .000 -21.8226 -10.5774
Group 3=Standard Control -3.20000 2.79643 .258 -8.8226 2.4226
Group 4=Diabetic + n-hexane leaf extract -7.60000* 2.79643 .009 -13.2226 -1.9774
Group 5=Diabetic + n-hexane fruit extract -4.40000 2.79643 .122 -10.0226 1.2226
Group 6=Diabetic + ethanol leaf extract -3.60000 2.79643 .204 -9.2226 2.0226
Group 7=Diabetic + ethanol fruit extract -5.20000 2.79643 .069 -10.8226 .4226
Group 8=Diabetic + methanol leaf extract -4.40000 2.79643 .122 -10.0226 1.2226
Group 9=Diabetic + methanol fruit extract -7.00000* 2.79643 .016 -12.6226 -1.3774
Group 10=Diabetic + n-hexane leaf and fruit extracts -.40000 2.79643 .887 -6.0226 5.2226
Group 11=Diabetic + ethanol leaf and fruit extracts -1.40000 2.79643 .619 -7.0226 4.2226
Group 12: Diabetic + methanol leaf and fruit extracts -2.00000 2.79643 .478 -7.6226 3.6226
Group 2=Diabetic Untreated Group 1=Normal Control 16.20000* 2.79643 .000 10.5774 21.8226
Group 3=Standard Control 13.00000* 2.79643 .000 7.3774 18.6226
Group 4=Diabetic + n-hexane leaf extract 8.60000* 2.79643 .003 2.9774 14.2226
Group 5=Diabetic + n-hexane fruit extract 11.80000* 2.79643 .000 6.1774 17.4226
Group 6=Diabetic + ethanol leaf extract 12.60000* 2.79643 .000 6.9774 18.2226
Group 7=Diabetic + ethanol fruit extract 11.00000* 2.79643 .000 5.3774 16.6226
Group 8=Diabetic + methanol leaf extract 11.80000* 2.79643 .000 6.1774 17.4226
Group 9=Diabetic + methanol fruit extract 9.20000* 2.79643 .002 3.5774 14.8226
Group 10=Diabetic + n-hexane leaf and fruit extracts 15.80000* 2.79643 .000 10.1774 21.4226
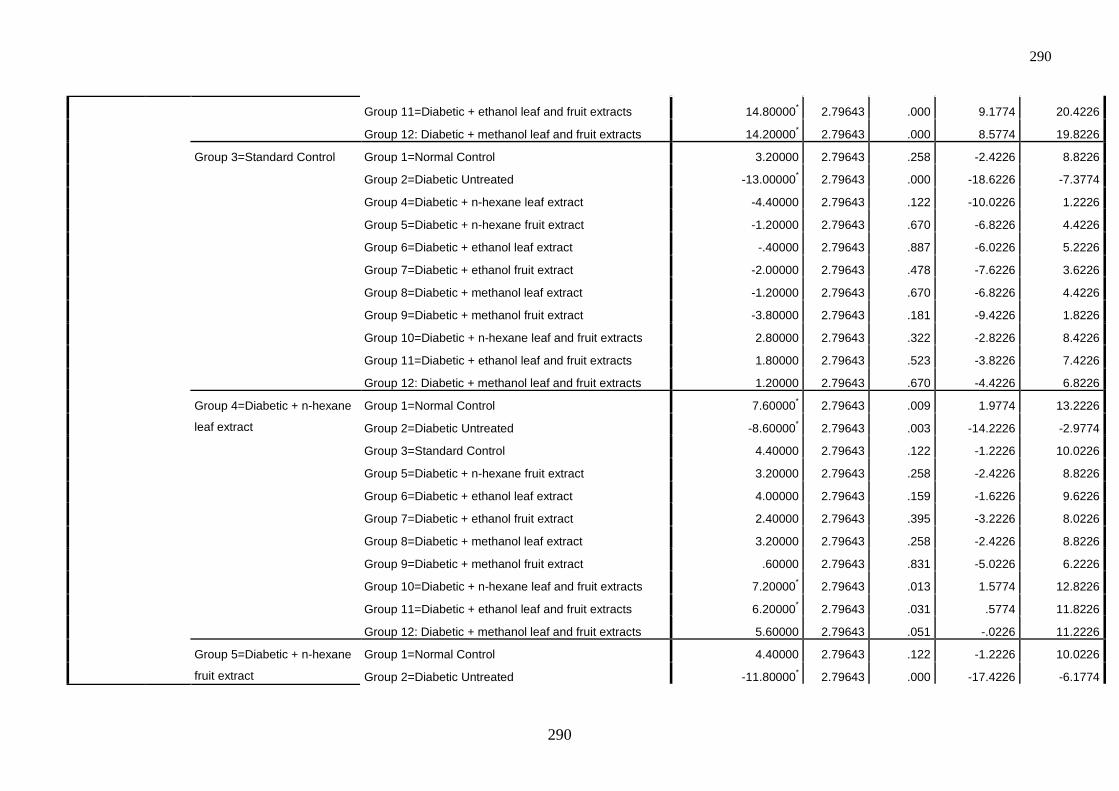
290
290
Group 11=Diabetic + ethanol leaf and fruit extracts 14.80000* 2.79643 .000 9.1774 20.4226
Group 12: Diabetic + methanol leaf and fruit extracts 14.20000* 2.79643 .000 8.5774 19.8226
Group 3=Standard Control Group 1=Normal Control 3.20000 2.79643 .258 -2.4226 8.8226
Group 2=Diabetic Untreated -13.00000* 2.79643 .000 -18.6226 -7.3774
Group 4=Diabetic + n-hexane leaf extract -4.40000 2.79643 .122 -10.0226 1.2226
Group 5=Diabetic + n-hexane fruit extract -1.20000 2.79643 .670 -6.8226 4.4226
Group 6=Diabetic + ethanol leaf extract -.40000 2.79643 .887 -6.0226 5.2226
Group 7=Diabetic + ethanol fruit extract -2.00000 2.79643 .478 -7.6226 3.6226
Group 8=Diabetic + methanol leaf extract -1.20000 2.79643 .670 -6.8226 4.4226
Group 9=Diabetic + methanol fruit extract -3.80000 2.79643 .181 -9.4226 1.8226
Group 10=Diabetic + n-hexane leaf and fruit extracts 2.80000 2.79643 .322 -2.8226 8.4226
Group 11=Diabetic + ethanol leaf and fruit extracts 1.80000 2.79643 .523 -3.8226 7.4226
Group 12: Diabetic + methanol leaf and fruit extracts 1.20000 2.79643 .670 -4.4226 6.8226
Group 4=Diabetic + n-hexane
leaf extract
Group 1=Normal Control 7.60000* 2.79643 .009 1.9774 13.2226
Group 2=Diabetic Untreated -8.60000* 2.79643 .003 -14.2226 -2.9774
Group 3=Standard Control 4.40000 2.79643 .122 -1.2226 10.0226
Group 5=Diabetic + n-hexane fruit extract 3.20000 2.79643 .258 -2.4226 8.8226
Group 6=Diabetic + ethanol leaf extract 4.00000 2.79643 .159 -1.6226 9.6226
Group 7=Diabetic + ethanol fruit extract 2.40000 2.79643 .395 -3.2226 8.0226
Group 8=Diabetic + methanol leaf extract 3.20000 2.79643 .258 -2.4226 8.8226
Group 9=Diabetic + methanol fruit extract .60000 2.79643 .831 -5.0226 6.2226
Group 10=Diabetic + n-hexane leaf and fruit extracts 7.20000* 2.79643 .013 1.5774 12.8226
Group 11=Diabetic + ethanol leaf and fruit extracts 6.20000* 2.79643 .031 .5774 11.8226
Group 12: Diabetic + methanol leaf and fruit extracts 5.60000 2.79643 .051 -.0226 11.2226
Group 5=Diabetic + n-hexane
fruit extract
Group 1=Normal Control 4.40000 2.79643 .122 -1.2226 10.0226
Group 2=Diabetic Untreated -11.80000* 2.79643 .000 -17.4226 -6.1774
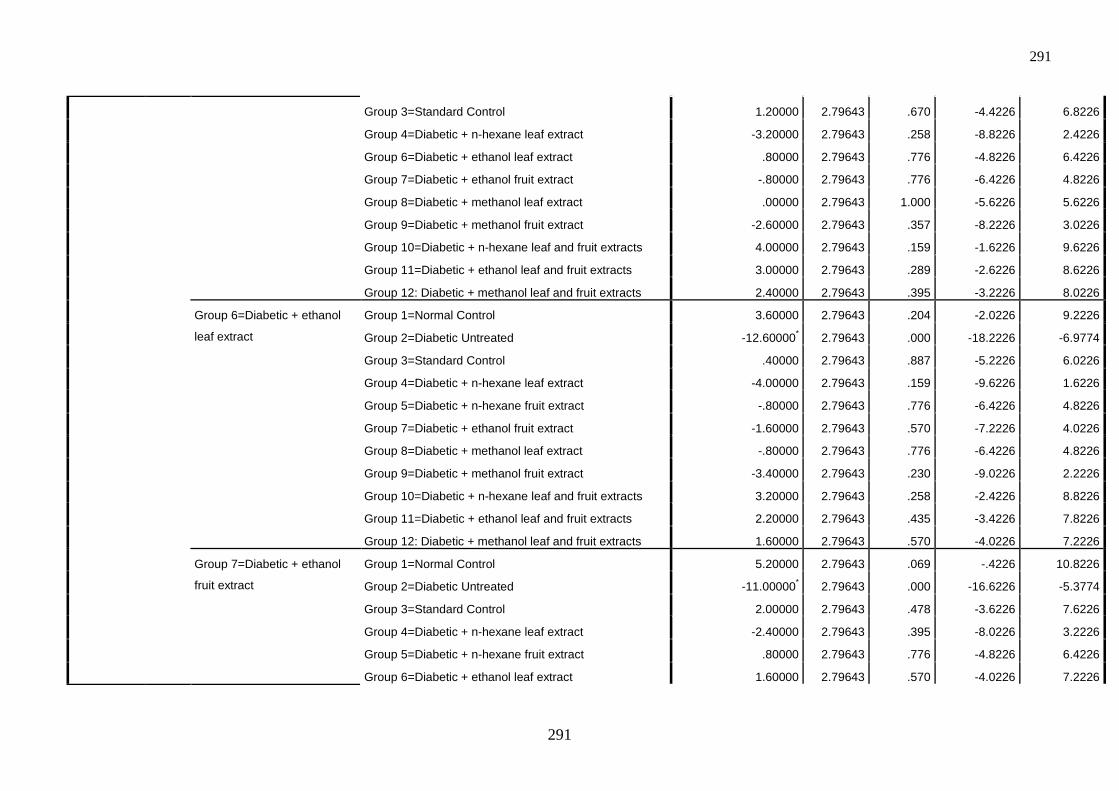
291
291
Group 3=Standard Control 1.20000 2.79643 .670 -4.4226 6.8226
Group 4=Diabetic + n-hexane leaf extract -3.20000 2.79643 .258 -8.8226 2.4226
Group 6=Diabetic + ethanol leaf extract .80000 2.79643 .776 -4.8226 6.4226
Group 7=Diabetic + ethanol fruit extract -.80000 2.79643 .776 -6.4226 4.8226
Group 8=Diabetic + methanol leaf extract .00000 2.79643 1.000 -5.6226 5.6226
Group 9=Diabetic + methanol fruit extract -2.60000 2.79643 .357 -8.2226 3.0226
Group 10=Diabetic + n-hexane leaf and fruit extracts 4.00000 2.79643 .159 -1.6226 9.6226
Group 11=Diabetic + ethanol leaf and fruit extracts 3.00000 2.79643 .289 -2.6226 8.6226
Group 12: Diabetic + methanol leaf and fruit extracts 2.40000 2.79643 .395 -3.2226 8.0226
Group 6=Diabetic + ethanol
leaf extract
Group 1=Normal Control 3.60000 2.79643 .204 -2.0226 9.2226
Group 2=Diabetic Untreated -12.60000* 2.79643 .000 -18.2226 -6.9774
Group 3=Standard Control .40000 2.79643 .887 -5.2226 6.0226
Group 4=Diabetic + n-hexane leaf extract -4.00000 2.79643 .159 -9.6226 1.6226
Group 5=Diabetic + n-hexane fruit extract -.80000 2.79643 .776 -6.4226 4.8226
Group 7=Diabetic + ethanol fruit extract -1.60000 2.79643 .570 -7.2226 4.0226
Group 8=Diabetic + methanol leaf extract -.80000 2.79643 .776 -6.4226 4.8226
Group 9=Diabetic + methanol fruit extract -3.40000 2.79643 .230 -9.0226 2.2226
Group 10=Diabetic + n-hexane leaf and fruit extracts 3.20000 2.79643 .258 -2.4226 8.8226
Group 11=Diabetic + ethanol leaf and fruit extracts 2.20000 2.79643 .435 -3.4226 7.8226
Group 12: Diabetic + methanol leaf and fruit extracts 1.60000 2.79643 .570 -4.0226 7.2226
Group 7=Diabetic + ethanol
fruit extract
Group 1=Normal Control 5.20000 2.79643 .069 -.4226 10.8226
Group 2=Diabetic Untreated -11.00000* 2.79643 .000 -16.6226 -5.3774
Group 3=Standard Control 2.00000 2.79643 .478 -3.6226 7.6226
Group 4=Diabetic + n-hexane leaf extract -2.40000 2.79643 .395 -8.0226 3.2226
Group 5=Diabetic + n-hexane fruit extract .80000 2.79643 .776 -4.8226 6.4226
Group 6=Diabetic + ethanol leaf extract 1.60000 2.79643 .570 -4.0226 7.2226
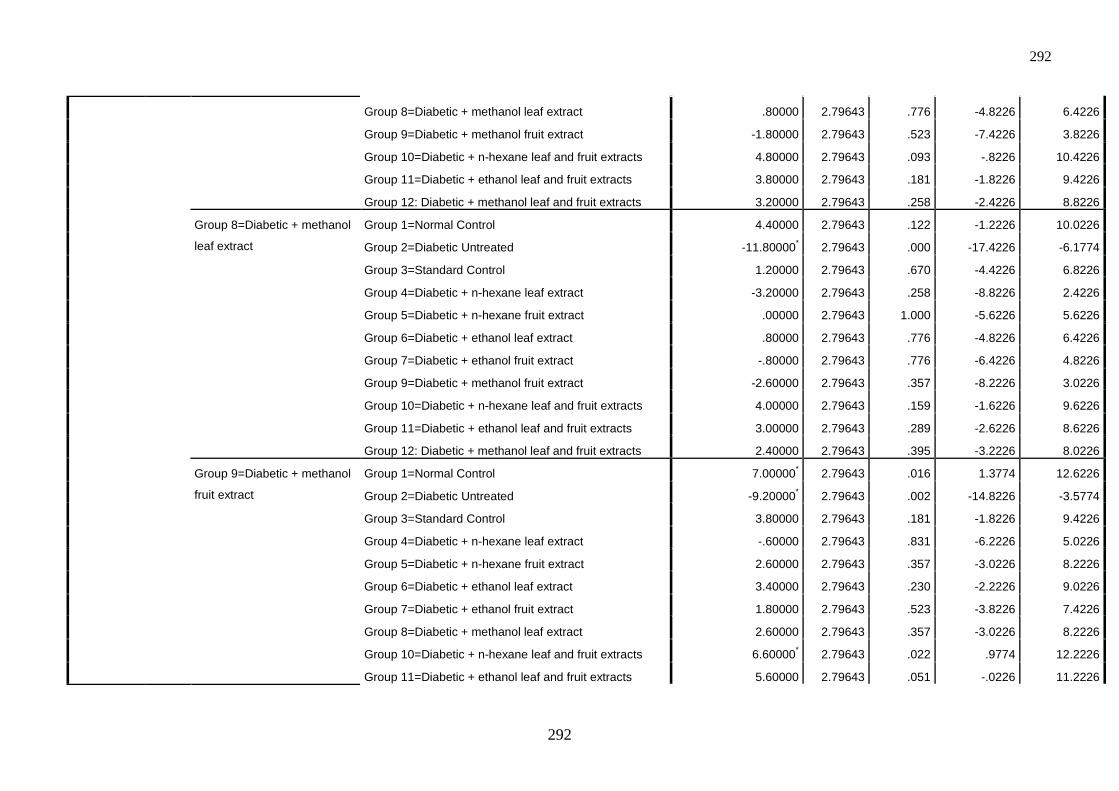
292
292
Group 8=Diabetic + methanol leaf extract .80000 2.79643 .776 -4.8226 6.4226
Group 9=Diabetic + methanol fruit extract -1.80000 2.79643 .523 -7.4226 3.8226
Group 10=Diabetic + n-hexane leaf and fruit extracts 4.80000 2.79643 .093 -.8226 10.4226
Group 11=Diabetic + ethanol leaf and fruit extracts 3.80000 2.79643 .181 -1.8226 9.4226
Group 12: Diabetic + methanol leaf and fruit extracts 3.20000 2.79643 .258 -2.4226 8.8226
Group 8=Diabetic + methanol
leaf extract
Group 1=Normal Control 4.40000 2.79643 .122 -1.2226 10.0226
Group 2=Diabetic Untreated -11.80000* 2.79643 .000 -17.4226 -6.1774
Group 3=Standard Control 1.20000 2.79643 .670 -4.4226 6.8226
Group 4=Diabetic + n-hexane leaf extract -3.20000 2.79643 .258 -8.8226 2.4226
Group 5=Diabetic + n-hexane fruit extract .00000 2.79643 1.000 -5.6226 5.6226
Group 6=Diabetic + ethanol leaf extract .80000 2.79643 .776 -4.8226 6.4226
Group 7=Diabetic + ethanol fruit extract -.80000 2.79643 .776 -6.4226 4.8226
Group 9=Diabetic + methanol fruit extract -2.60000 2.79643 .357 -8.2226 3.0226
Group 10=Diabetic + n-hexane leaf and fruit extracts 4.00000 2.79643 .159 -1.6226 9.6226
Group 11=Diabetic + ethanol leaf and fruit extracts 3.00000 2.79643 .289 -2.6226 8.6226
Group 12: Diabetic + methanol leaf and fruit extracts 2.40000 2.79643 .395 -3.2226 8.0226
Group 9=Diabetic + methanol
fruit extract
Group 1=Normal Control 7.00000* 2.79643 .016 1.3774 12.6226
Group 2=Diabetic Untreated -9.20000* 2.79643 .002 -14.8226 -3.5774
Group 3=Standard Control 3.80000 2.79643 .181 -1.8226 9.4226
Group 4=Diabetic + n-hexane leaf extract -.60000 2.79643 .831 -6.2226 5.0226
Group 5=Diabetic + n-hexane fruit extract 2.60000 2.79643 .357 -3.0226 8.2226
Group 6=Diabetic + ethanol leaf extract 3.40000 2.79643 .230 -2.2226 9.0226
Group 7=Diabetic + ethanol fruit extract 1.80000 2.79643 .523 -3.8226 7.4226
Group 8=Diabetic + methanol leaf extract 2.60000 2.79643 .357 -3.0226 8.2226
Group 10=Diabetic + n-hexane leaf and fruit extracts 6.60000* 2.79643 .022 .9774 12.2226
Group 11=Diabetic + ethanol leaf and fruit extracts 5.60000 2.79643 .051 -.0226 11.2226
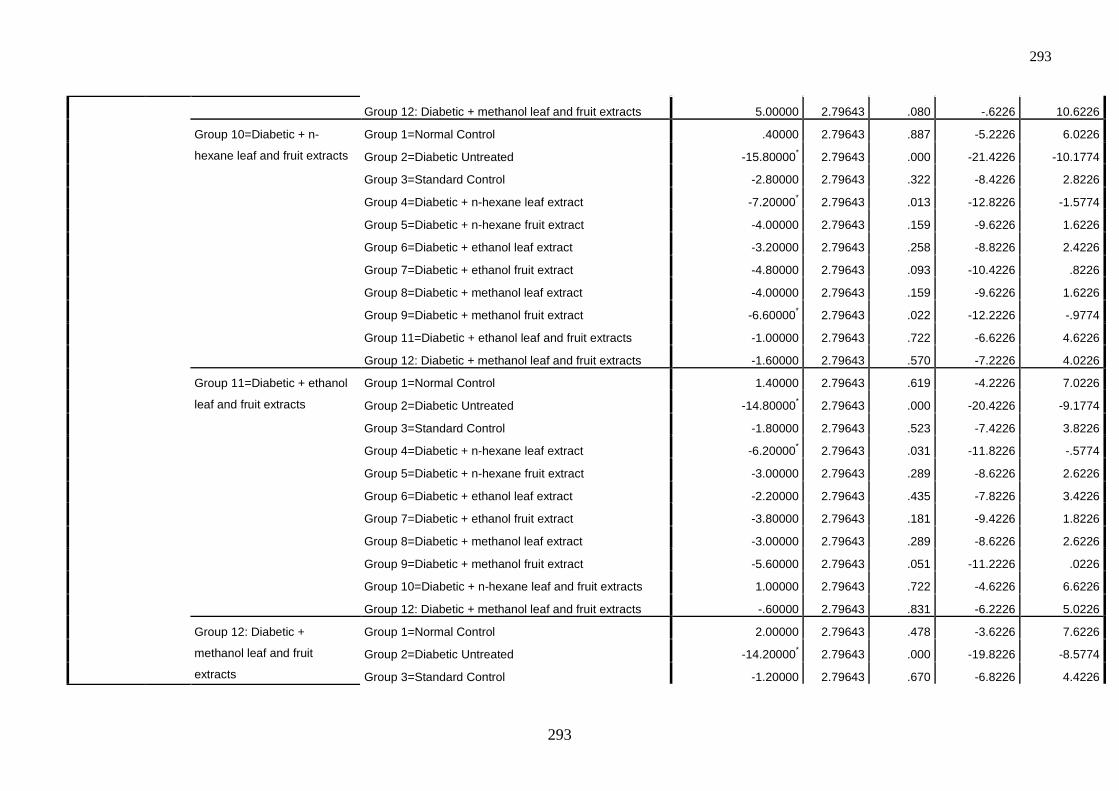
293
293
Group 12: Diabetic + methanol leaf and fruit extracts 5.00000 2.79643 .080 -.6226 10.6226
Group 10=Diabetic + n-
hexane leaf and fruit extracts
Group 1=Normal Control .40000 2.79643 .887 -5.2226 6.0226
Group 2=Diabetic Untreated -15.80000* 2.79643 .000 -21.4226 -10.1774
Group 3=Standard Control -2.80000 2.79643 .322 -8.4226 2.8226
Group 4=Diabetic + n-hexane leaf extract -7.20000* 2.79643 .013 -12.8226 -1.5774
Group 5=Diabetic + n-hexane fruit extract -4.00000 2.79643 .159 -9.6226 1.6226
Group 6=Diabetic + ethanol leaf extract -3.20000 2.79643 .258 -8.8226 2.4226
Group 7=Diabetic + ethanol fruit extract -4.80000 2.79643 .093 -10.4226 .8226
Group 8=Diabetic + methanol leaf extract -4.00000 2.79643 .159 -9.6226 1.6226
Group 9=Diabetic + methanol fruit extract -6.60000* 2.79643 .022 -12.2226 -.9774
Group 11=Diabetic + ethanol leaf and fruit extracts -1.00000 2.79643 .722 -6.6226 4.6226
Group 12: Diabetic + methanol leaf and fruit extracts -1.60000 2.79643 .570 -7.2226 4.0226
Group 11=Diabetic + ethanol
leaf and fruit extracts
Group 1=Normal Control 1.40000 2.79643 .619 -4.2226 7.0226
Group 2=Diabetic Untreated -14.80000* 2.79643 .000 -20.4226 -9.1774
Group 3=Standard Control -1.80000 2.79643 .523 -7.4226 3.8226
Group 4=Diabetic + n-hexane leaf extract -6.20000* 2.79643 .031 -11.8226 -.5774
Group 5=Diabetic + n-hexane fruit extract -3.00000 2.79643 .289 -8.6226 2.6226
Group 6=Diabetic + ethanol leaf extract -2.20000 2.79643 .435 -7.8226 3.4226
Group 7=Diabetic + ethanol fruit extract -3.80000 2.79643 .181 -9.4226 1.8226
Group 8=Diabetic + methanol leaf extract -3.00000 2.79643 .289 -8.6226 2.6226
Group 9=Diabetic + methanol fruit extract -5.60000 2.79643 .051 -11.2226 .0226
Group 10=Diabetic + n-hexane leaf and fruit extracts 1.00000 2.79643 .722 -4.6226 6.6226
Group 12: Diabetic + methanol leaf and fruit extracts -.60000 2.79643 .831 -6.2226 5.0226
Group 12: Diabetic +
methanol leaf and fruit
extracts
Group 1=Normal Control 2.00000 2.79643 .478 -3.6226 7.6226
Group 2=Diabetic Untreated -14.20000* 2.79643 .000 -19.8226 -8.5774
Group 3=Standard Control -1.20000 2.79643 .670 -6.8226 4.4226
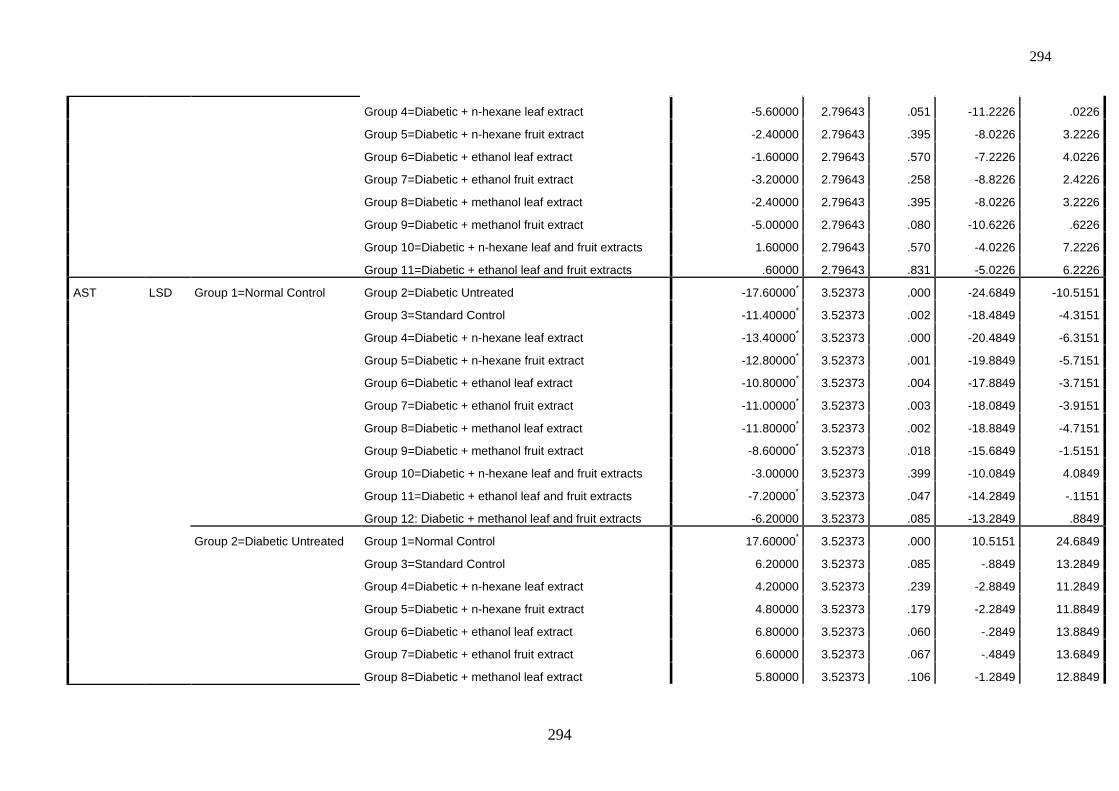
294
294
Group 4=Diabetic + n-hexane leaf extract -5.60000 2.79643 .051 -11.2226 .0226
Group 5=Diabetic + n-hexane fruit extract -2.40000 2.79643 .395 -8.0226 3.2226
Group 6=Diabetic + ethanol leaf extract -1.60000 2.79643 .570 -7.2226 4.0226
Group 7=Diabetic + ethanol fruit extract -3.20000 2.79643 .258 -8.8226 2.4226
Group 8=Diabetic + methanol leaf extract -2.40000 2.79643 .395 -8.0226 3.2226
Group 9=Diabetic + methanol fruit extract -5.00000 2.79643 .080 -10.6226 .6226
Group 10=Diabetic + n-hexane leaf and fruit extracts 1.60000 2.79643 .570 -4.0226 7.2226
Group 11=Diabetic + ethanol leaf and fruit extracts .60000 2.79643 .831 -5.0226 6.2226
AST LSD Group 1=Normal Control Group 2=Diabetic Untreated -17.60000* 3.52373 .000 -24.6849 -10.5151
Group 3=Standard Control -11.40000* 3.52373 .002 -18.4849 -4.3151
Group 4=Diabetic + n-hexane leaf extract -13.40000* 3.52373 .000 -20.4849 -6.3151
Group 5=Diabetic + n-hexane fruit extract -12.80000* 3.52373 .001 -19.8849 -5.7151
Group 6=Diabetic + ethanol leaf extract -10.80000* 3.52373 .004 -17.8849 -3.7151
Group 7=Diabetic + ethanol fruit extract -11.00000* 3.52373 .003 -18.0849 -3.9151
Group 8=Diabetic + methanol leaf extract -11.80000* 3.52373 .002 -18.8849 -4.7151
Group 9=Diabetic + methanol fruit extract -8.60000* 3.52373 .018 -15.6849 -1.5151
Group 10=Diabetic + n-hexane leaf and fruit extracts -3.00000 3.52373 .399 -10.0849 4.0849
Group 11=Diabetic + ethanol leaf and fruit extracts -7.20000* 3.52373 .047 -14.2849 -.1151
Group 12: Diabetic + methanol leaf and fruit extracts -6.20000 3.52373 .085 -13.2849 .8849
Group 2=Diabetic Untreated Group 1=Normal Control 17.60000* 3.52373 .000 10.5151 24.6849
Group 3=Standard Control 6.20000 3.52373 .085 -.8849 13.2849
Group 4=Diabetic + n-hexane leaf extract 4.20000 3.52373 .239 -2.8849 11.2849
Group 5=Diabetic + n-hexane fruit extract 4.80000 3.52373 .179 -2.2849 11.8849
Group 6=Diabetic + ethanol leaf extract 6.80000 3.52373 .060 -.2849 13.8849
Group 7=Diabetic + ethanol fruit extract 6.60000 3.52373 .067 -.4849 13.6849
Group 8=Diabetic + methanol leaf extract 5.80000 3.52373 .106 -1.2849 12.8849
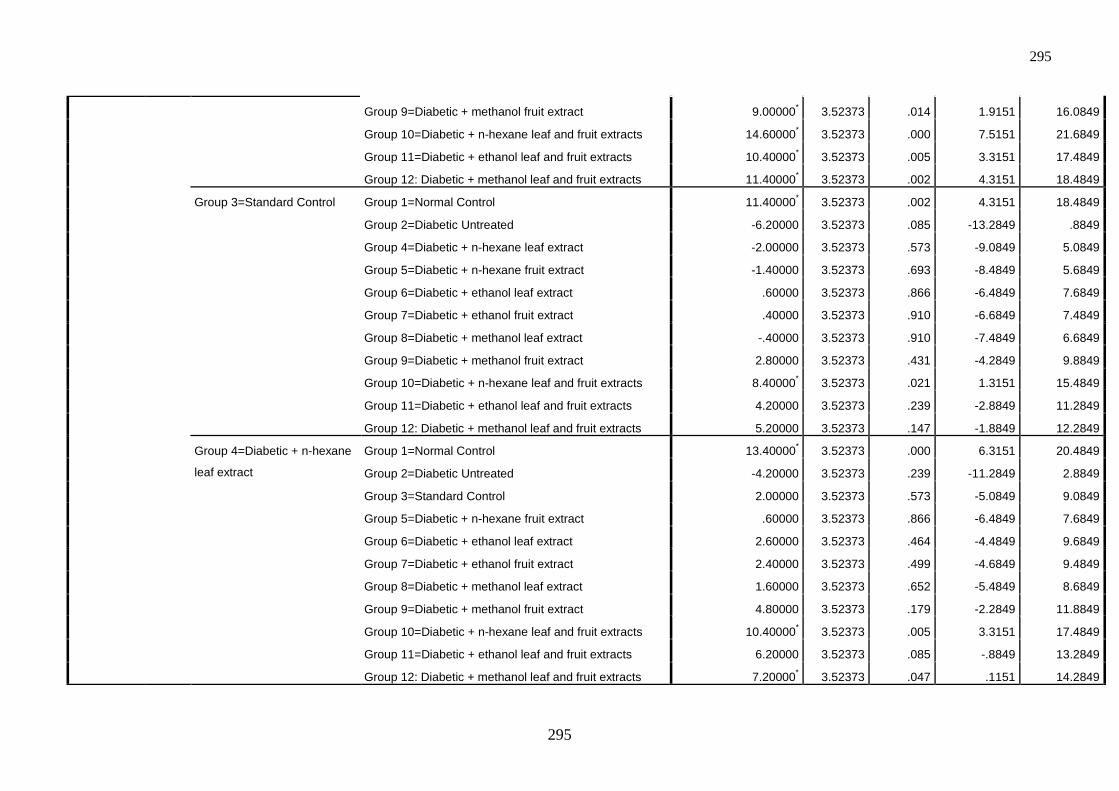
295
295
Group 9=Diabetic + methanol fruit extract 9.00000* 3.52373 .014 1.9151 16.0849
Group 10=Diabetic + n-hexane leaf and fruit extracts 14.60000* 3.52373 .000 7.5151 21.6849
Group 11=Diabetic + ethanol leaf and fruit extracts 10.40000* 3.52373 .005 3.3151 17.4849
Group 12: Diabetic + methanol leaf and fruit extracts 11.40000* 3.52373 .002 4.3151 18.4849
Group 3=Standard Control Group 1=Normal Control 11.40000* 3.52373 .002 4.3151 18.4849
Group 2=Diabetic Untreated -6.20000 3.52373 .085 -13.2849 .8849
Group 4=Diabetic + n-hexane leaf extract -2.00000 3.52373 .573 -9.0849 5.0849
Group 5=Diabetic + n-hexane fruit extract -1.40000 3.52373 .693 -8.4849 5.6849
Group 6=Diabetic + ethanol leaf extract .60000 3.52373 .866 -6.4849 7.6849
Group 7=Diabetic + ethanol fruit extract .40000 3.52373 .910 -6.6849 7.4849
Group 8=Diabetic + methanol leaf extract -.40000 3.52373 .910 -7.4849 6.6849
Group 9=Diabetic + methanol fruit extract 2.80000 3.52373 .431 -4.2849 9.8849
Group 10=Diabetic + n-hexane leaf and fruit extracts 8.40000* 3.52373 .021 1.3151 15.4849
Group 11=Diabetic + ethanol leaf and fruit extracts 4.20000 3.52373 .239 -2.8849 11.2849
Group 12: Diabetic + methanol leaf and fruit extracts 5.20000 3.52373 .147 -1.8849 12.2849
Group 4=Diabetic + n-hexane
leaf extract
Group 1=Normal Control 13.40000* 3.52373 .000 6.3151 20.4849
Group 2=Diabetic Untreated -4.20000 3.52373 .239 -11.2849 2.8849
Group 3=Standard Control 2.00000 3.52373 .573 -5.0849 9.0849
Group 5=Diabetic + n-hexane fruit extract .60000 3.52373 .866 -6.4849 7.6849
Group 6=Diabetic + ethanol leaf extract 2.60000 3.52373 .464 -4.4849 9.6849
Group 7=Diabetic + ethanol fruit extract 2.40000 3.52373 .499 -4.6849 9.4849
Group 8=Diabetic + methanol leaf extract 1.60000 3.52373 .652 -5.4849 8.6849
Group 9=Diabetic + methanol fruit extract 4.80000 3.52373 .179 -2.2849 11.8849
Group 10=Diabetic + n-hexane leaf and fruit extracts 10.40000* 3.52373 .005 3.3151 17.4849
Group 11=Diabetic + ethanol leaf and fruit extracts 6.20000 3.52373 .085 -.8849 13.2849
Group 12: Diabetic + methanol leaf and fruit extracts 7.20000* 3.52373 .047 .1151 14.2849

296
296
Group 5=Diabetic + n-hexane
fruit extract
Group 1=Normal Control 12.80000* 3.52373 .001 5.7151 19.8849
Group 2=Diabetic Untreated -4.80000 3.52373 .179 -11.8849 2.2849
Group 3=Standard Control 1.40000 3.52373 .693 -5.6849 8.4849
Group 4=Diabetic + n-hexane leaf extract -.60000 3.52373 .866 -7.6849 6.4849
Group 6=Diabetic + ethanol leaf extract 2.00000 3.52373 .573 -5.0849 9.0849
Group 7=Diabetic + ethanol fruit extract 1.80000 3.52373 .612 -5.2849 8.8849
Group 8=Diabetic + methanol leaf extract 1.00000 3.52373 .778 -6.0849 8.0849
Group 9=Diabetic + methanol fruit extract 4.20000 3.52373 .239 -2.8849 11.2849
Group 10=Diabetic + n-hexane leaf and fruit extracts 9.80000* 3.52373 .008 2.7151 16.8849
Group 11=Diabetic + ethanol leaf and fruit extracts 5.60000 3.52373 .119 -1.4849 12.6849
Group 12: Diabetic + methanol leaf and fruit extracts 6.60000 3.52373 .067 -.4849 13.6849
Group 6=Diabetic + ethanol
leaf extract
Group 1=Normal Control 10.80000* 3.52373 .004 3.7151 17.8849
Group 2=Diabetic Untreated -6.80000 3.52373 .060 -13.8849 .2849
Group 3=Standard Control -.60000 3.52373 .866 -7.6849 6.4849
Group 4=Diabetic + n-hexane leaf extract -2.60000 3.52373 .464 -9.6849 4.4849
Group 5=Diabetic + n-hexane fruit extract -2.00000 3.52373 .573 -9.0849 5.0849
Group 7=Diabetic + ethanol fruit extract -.20000 3.52373 .955 -7.2849 6.8849
Group 8=Diabetic + methanol leaf extract -1.00000 3.52373 .778 -8.0849 6.0849
Group 9=Diabetic + methanol fruit extract 2.20000 3.52373 .535 -4.8849 9.2849
Group 10=Diabetic + n-hexane leaf and fruit extracts 7.80000* 3.52373 .032 .7151 14.8849
Group 11=Diabetic + ethanol leaf and fruit extracts 3.60000 3.52373 .312 -3.4849 10.6849
Group 12: Diabetic + methanol leaf and fruit extracts 4.60000 3.52373 .198 -2.4849 11.6849
Group 7=Diabetic + ethanol
fruit extract
Group 1=Normal Control 11.00000* 3.52373 .003 3.9151 18.0849
Group 2=Diabetic Untreated -6.60000 3.52373 .067 -13.6849 .4849
Group 3=Standard Control -.40000 3.52373 .910 -7.4849 6.6849
Group 4=Diabetic + n-hexane leaf extract -2.40000 3.52373 .499 -9.4849 4.6849
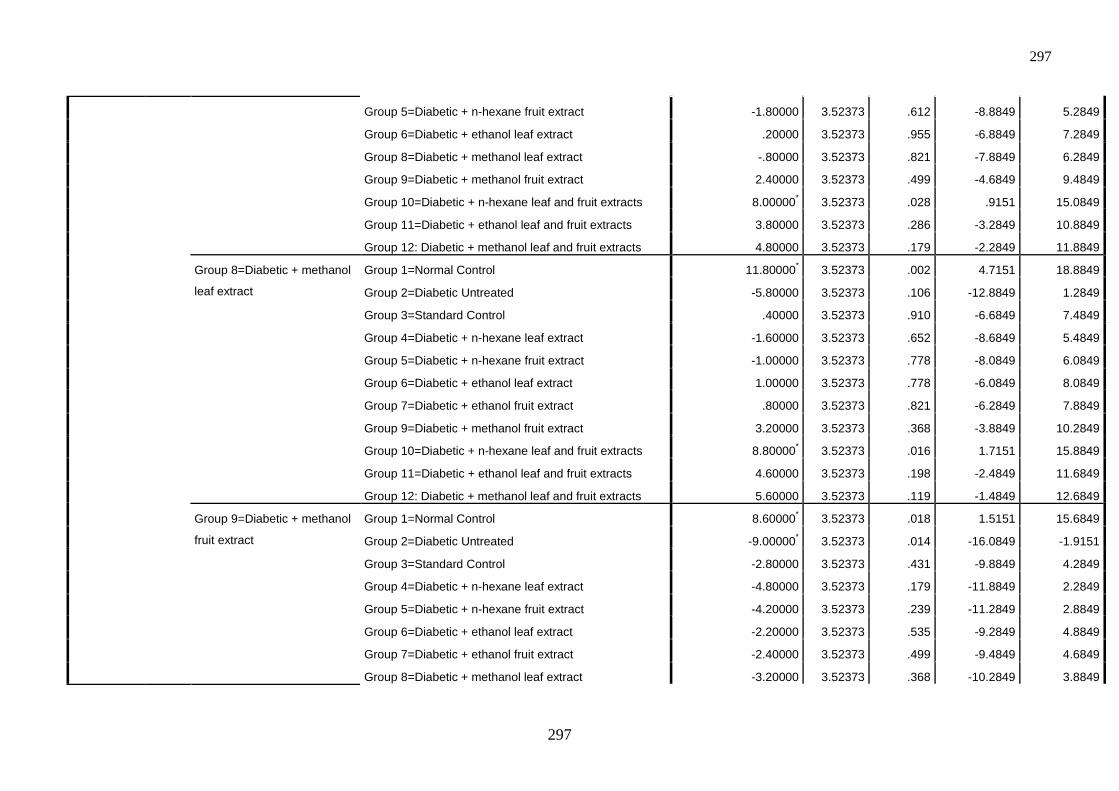
297
297
Group 5=Diabetic + n-hexane fruit extract -1.80000 3.52373 .612 -8.8849 5.2849
Group 6=Diabetic + ethanol leaf extract .20000 3.52373 .955 -6.8849 7.2849
Group 8=Diabetic + methanol leaf extract -.80000 3.52373 .821 -7.8849 6.2849
Group 9=Diabetic + methanol fruit extract 2.40000 3.52373 .499 -4.6849 9.4849
Group 10=Diabetic + n-hexane leaf and fruit extracts 8.00000* 3.52373 .028 .9151 15.0849
Group 11=Diabetic + ethanol leaf and fruit extracts 3.80000 3.52373 .286 -3.2849 10.8849
Group 12: Diabetic + methanol leaf and fruit extracts 4.80000 3.52373 .179 -2.2849 11.8849
Group 8=Diabetic + methanol
leaf extract
Group 1=Normal Control 11.80000* 3.52373 .002 4.7151 18.8849
Group 2=Diabetic Untreated -5.80000 3.52373 .106 -12.8849 1.2849
Group 3=Standard Control .40000 3.52373 .910 -6.6849 7.4849
Group 4=Diabetic + n-hexane leaf extract -1.60000 3.52373 .652 -8.6849 5.4849
Group 5=Diabetic + n-hexane fruit extract -1.00000 3.52373 .778 -8.0849 6.0849
Group 6=Diabetic + ethanol leaf extract 1.00000 3.52373 .778 -6.0849 8.0849
Group 7=Diabetic + ethanol fruit extract .80000 3.52373 .821 -6.2849 7.8849
Group 9=Diabetic + methanol fruit extract 3.20000 3.52373 .368 -3.8849 10.2849
Group 10=Diabetic + n-hexane leaf and fruit extracts 8.80000* 3.52373 .016 1.7151 15.8849
Group 11=Diabetic + ethanol leaf and fruit extracts 4.60000 3.52373 .198 -2.4849 11.6849
Group 12: Diabetic + methanol leaf and fruit extracts 5.60000 3.52373 .119 -1.4849 12.6849
Group 9=Diabetic + methanol
fruit extract
Group 1=Normal Control 8.60000* 3.52373 .018 1.5151 15.6849
Group 2=Diabetic Untreated -9.00000* 3.52373 .014 -16.0849 -1.9151
Group 3=Standard Control -2.80000 3.52373 .431 -9.8849 4.2849
Group 4=Diabetic + n-hexane leaf extract -4.80000 3.52373 .179 -11.8849 2.2849
Group 5=Diabetic + n-hexane fruit extract -4.20000 3.52373 .239 -11.2849 2.8849
Group 6=Diabetic + ethanol leaf extract -2.20000 3.52373 .535 -9.2849 4.8849
Group 7=Diabetic + ethanol fruit extract -2.40000 3.52373 .499 -9.4849 4.6849
Group 8=Diabetic + methanol leaf extract -3.20000 3.52373 .368 -10.2849 3.8849
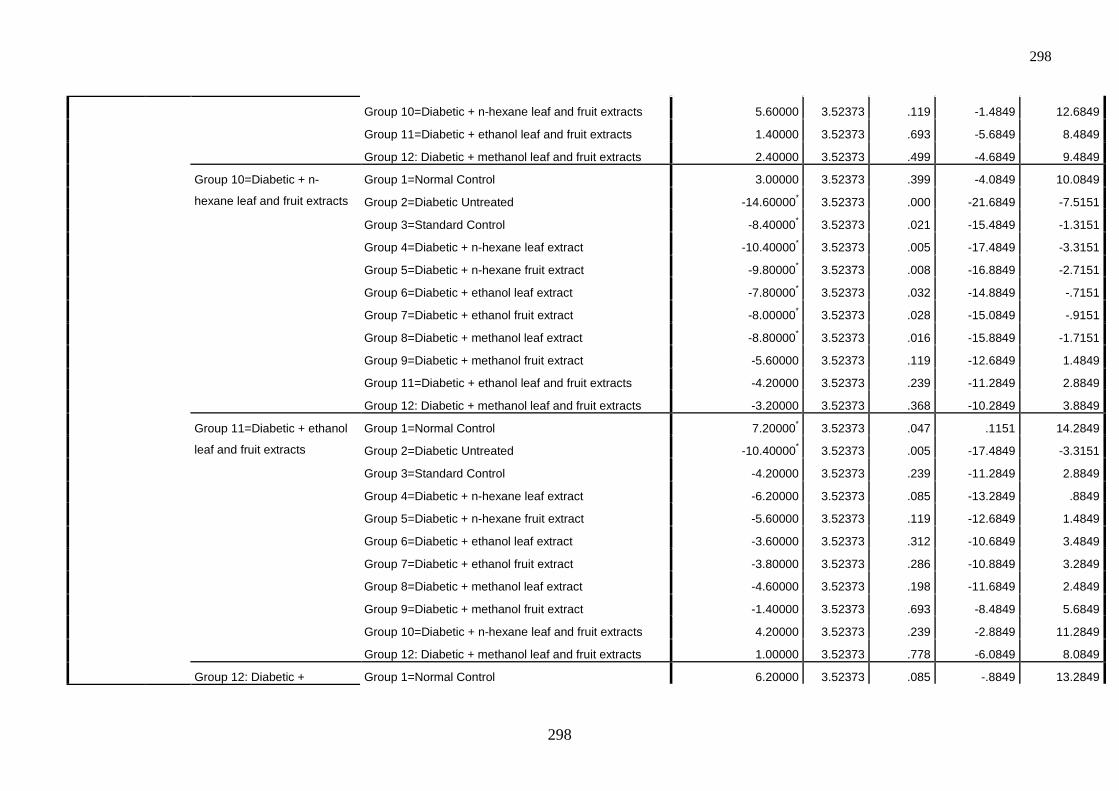
298
298
Group 10=Diabetic + n-hexane leaf and fruit extracts 5.60000 3.52373 .119 -1.4849 12.6849
Group 11=Diabetic + ethanol leaf and fruit extracts 1.40000 3.52373 .693 -5.6849 8.4849
Group 12: Diabetic + methanol leaf and fruit extracts 2.40000 3.52373 .499 -4.6849 9.4849
Group 10=Diabetic + n-
hexane leaf and fruit extracts
Group 1=Normal Control 3.00000 3.52373 .399 -4.0849 10.0849
Group 2=Diabetic Untreated -14.60000* 3.52373 .000 -21.6849 -7.5151
Group 3=Standard Control -8.40000* 3.52373 .021 -15.4849 -1.3151
Group 4=Diabetic + n-hexane leaf extract -10.40000* 3.52373 .005 -17.4849 -3.3151
Group 5=Diabetic + n-hexane fruit extract -9.80000* 3.52373 .008 -16.8849 -2.7151
Group 6=Diabetic + ethanol leaf extract -7.80000* 3.52373 .032 -14.8849 -.7151
Group 7=Diabetic + ethanol fruit extract -8.00000* 3.52373 .028 -15.0849 -.9151
Group 8=Diabetic + methanol leaf extract -8.80000* 3.52373 .016 -15.8849 -1.7151
Group 9=Diabetic + methanol fruit extract -5.60000 3.52373 .119 -12.6849 1.4849
Group 11=Diabetic + ethanol leaf and fruit extracts -4.20000 3.52373 .239 -11.2849 2.8849
Group 12: Diabetic + methanol leaf and fruit extracts -3.20000 3.52373 .368 -10.2849 3.8849
Group 11=Diabetic + ethanol
leaf and fruit extracts
Group 1=Normal Control 7.20000* 3.52373 .047 .1151 14.2849
Group 2=Diabetic Untreated -10.40000* 3.52373 .005 -17.4849 -3.3151
Group 3=Standard Control -4.20000 3.52373 .239 -11.2849 2.8849
Group 4=Diabetic + n-hexane leaf extract -6.20000 3.52373 .085 -13.2849 .8849
Group 5=Diabetic + n-hexane fruit extract -5.60000 3.52373 .119 -12.6849 1.4849
Group 6=Diabetic + ethanol leaf extract -3.60000 3.52373 .312 -10.6849 3.4849
Group 7=Diabetic + ethanol fruit extract -3.80000 3.52373 .286 -10.8849 3.2849
Group 8=Diabetic + methanol leaf extract -4.60000 3.52373 .198 -11.6849 2.4849
Group 9=Diabetic + methanol fruit extract -1.40000 3.52373 .693 -8.4849 5.6849
Group 10=Diabetic + n-hexane leaf and fruit extracts 4.20000 3.52373 .239 -2.8849 11.2849
Group 12: Diabetic + methanol leaf and fruit extracts 1.00000 3.52373 .778 -6.0849 8.0849
Group 12: Diabetic + Group 1=Normal Control 6.20000 3.52373 .085 -.8849 13.2849
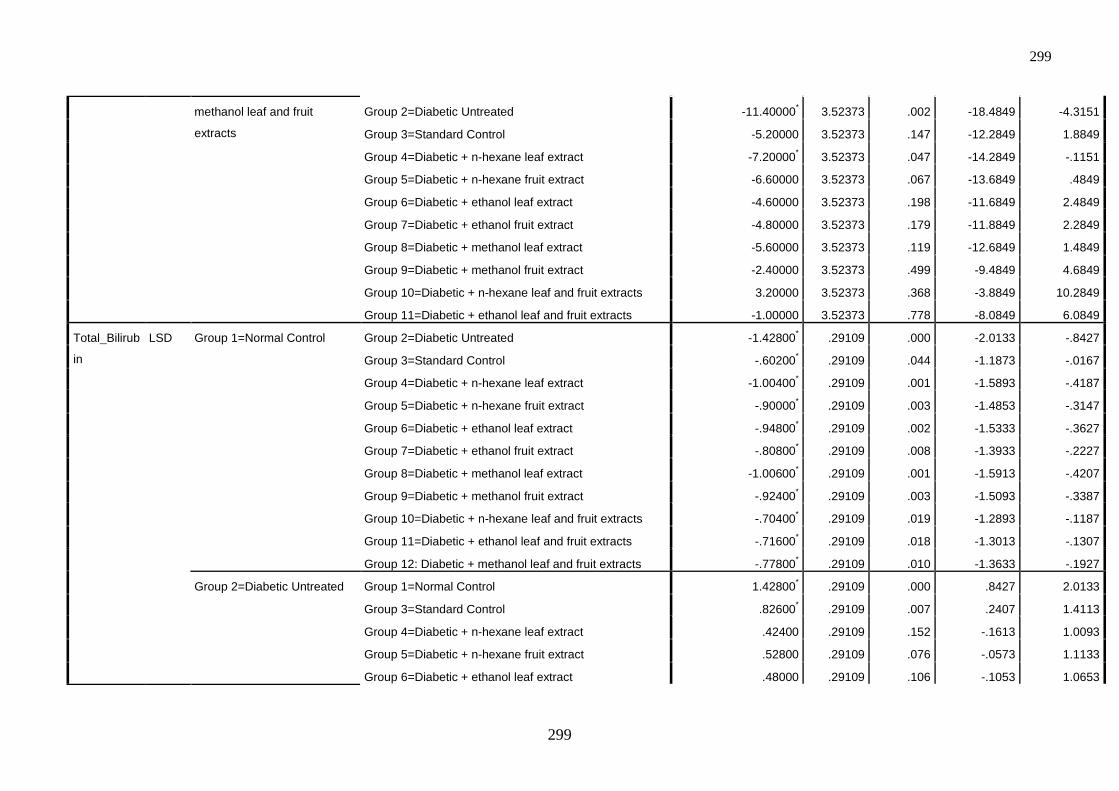
299
299
methanol leaf and fruit
extracts
Group 2=Diabetic Untreated -11.40000* 3.52373 .002 -18.4849 -4.3151
Group 3=Standard Control -5.20000 3.52373 .147 -12.2849 1.8849
Group 4=Diabetic + n-hexane leaf extract -7.20000* 3.52373 .047 -14.2849 -.1151
Group 5=Diabetic + n-hexane fruit extract -6.60000 3.52373 .067 -13.6849 .4849
Group 6=Diabetic + ethanol leaf extract -4.60000 3.52373 .198 -11.6849 2.4849
Group 7=Diabetic + ethanol fruit extract -4.80000 3.52373 .179 -11.8849 2.2849
Group 8=Diabetic + methanol leaf extract -5.60000 3.52373 .119 -12.6849 1.4849
Group 9=Diabetic + methanol fruit extract -2.40000 3.52373 .499 -9.4849 4.6849
Group 10=Diabetic + n-hexane leaf and fruit extracts 3.20000 3.52373 .368 -3.8849 10.2849
Group 11=Diabetic + ethanol leaf and fruit extracts -1.00000 3.52373 .778 -8.0849 6.0849
Total_Bilirub
in
LSD Group 1=Normal Control Group 2=Diabetic Untreated -1.42800* .29109 .000 -2.0133 -.8427
Group 3=Standard Control -.60200* .29109 .044 -1.1873 -.0167
Group 4=Diabetic + n-hexane leaf extract -1.00400* .29109 .001 -1.5893 -.4187
Group 5=Diabetic + n-hexane fruit extract -.90000* .29109 .003 -1.4853 -.3147
Group 6=Diabetic + ethanol leaf extract -.94800* .29109 .002 -1.5333 -.3627
Group 7=Diabetic + ethanol fruit extract -.80800* .29109 .008 -1.3933 -.2227
Group 8=Diabetic + methanol leaf extract -1.00600* .29109 .001 -1.5913 -.4207
Group 9=Diabetic + methanol fruit extract -.92400* .29109 .003 -1.5093 -.3387
Group 10=Diabetic + n-hexane leaf and fruit extracts -.70400* .29109 .019 -1.2893 -.1187
Group 11=Diabetic + ethanol leaf and fruit extracts -.71600* .29109 .018 -1.3013 -.1307
Group 12: Diabetic + methanol leaf and fruit extracts -.77800* .29109 .010 -1.3633 -.1927
Group 2=Diabetic Untreated Group 1=Normal Control 1.42800* .29109 .000 .8427 2.0133
Group 3=Standard Control .82600* .29109 .007 .2407 1.4113
Group 4=Diabetic + n-hexane leaf extract .42400 .29109 .152 -.1613 1.0093
Group 5=Diabetic + n-hexane fruit extract .52800 .29109 .076 -.0573 1.1133
Group 6=Diabetic + ethanol leaf extract .48000 .29109 .106 -.1053 1.0653
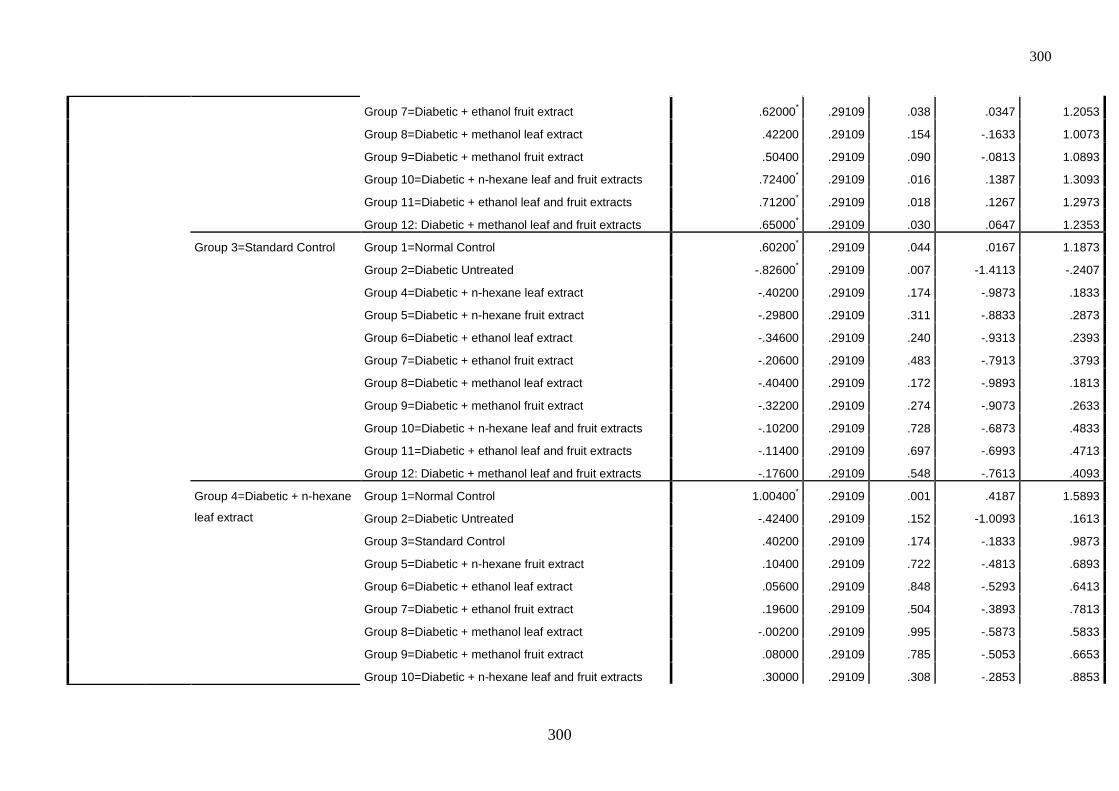
300
300
Group 7=Diabetic + ethanol fruit extract .62000* .29109 .038 .0347 1.2053
Group 8=Diabetic + methanol leaf extract .42200 .29109 .154 -.1633 1.0073
Group 9=Diabetic + methanol fruit extract .50400 .29109 .090 -.0813 1.0893
Group 10=Diabetic + n-hexane leaf and fruit extracts .72400* .29109 .016 .1387 1.3093
Group 11=Diabetic + ethanol leaf and fruit extracts .71200* .29109 .018 .1267 1.2973
Group 12: Diabetic + methanol leaf and fruit extracts .65000* .29109 .030 .0647 1.2353
Group 3=Standard Control Group 1=Normal Control .60200* .29109 .044 .0167 1.1873
Group 2=Diabetic Untreated -.82600* .29109 .007 -1.4113 -.2407
Group 4=Diabetic + n-hexane leaf extract -.40200 .29109 .174 -.9873 .1833
Group 5=Diabetic + n-hexane fruit extract -.29800 .29109 .311 -.8833 .2873
Group 6=Diabetic + ethanol leaf extract -.34600 .29109 .240 -.9313 .2393
Group 7=Diabetic + ethanol fruit extract -.20600 .29109 .483 -.7913 .3793
Group 8=Diabetic + methanol leaf extract -.40400 .29109 .172 -.9893 .1813
Group 9=Diabetic + methanol fruit extract -.32200 .29109 .274 -.9073 .2633
Group 10=Diabetic + n-hexane leaf and fruit extracts -.10200 .29109 .728 -.6873 .4833
Group 11=Diabetic + ethanol leaf and fruit extracts -.11400 .29109 .697 -.6993 .4713
Group 12: Diabetic + methanol leaf and fruit extracts -.17600 .29109 .548 -.7613 .4093
Group 4=Diabetic + n-hexane
leaf extract
Group 1=Normal Control 1.00400* .29109 .001 .4187 1.5893
Group 2=Diabetic Untreated -.42400 .29109 .152 -1.0093 .1613
Group 3=Standard Control .40200 .29109 .174 -.1833 .9873
Group 5=Diabetic + n-hexane fruit extract .10400 .29109 .722 -.4813 .6893
Group 6=Diabetic + ethanol leaf extract .05600 .29109 .848 -.5293 .6413
Group 7=Diabetic + ethanol fruit extract .19600 .29109 .504 -.3893 .7813
Group 8=Diabetic + methanol leaf extract -.00200 .29109 .995 -.5873 .5833
Group 9=Diabetic + methanol fruit extract .08000 .29109 .785 -.5053 .6653
Group 10=Diabetic + n-hexane leaf and fruit extracts .30000 .29109 .308 -.2853 .8853
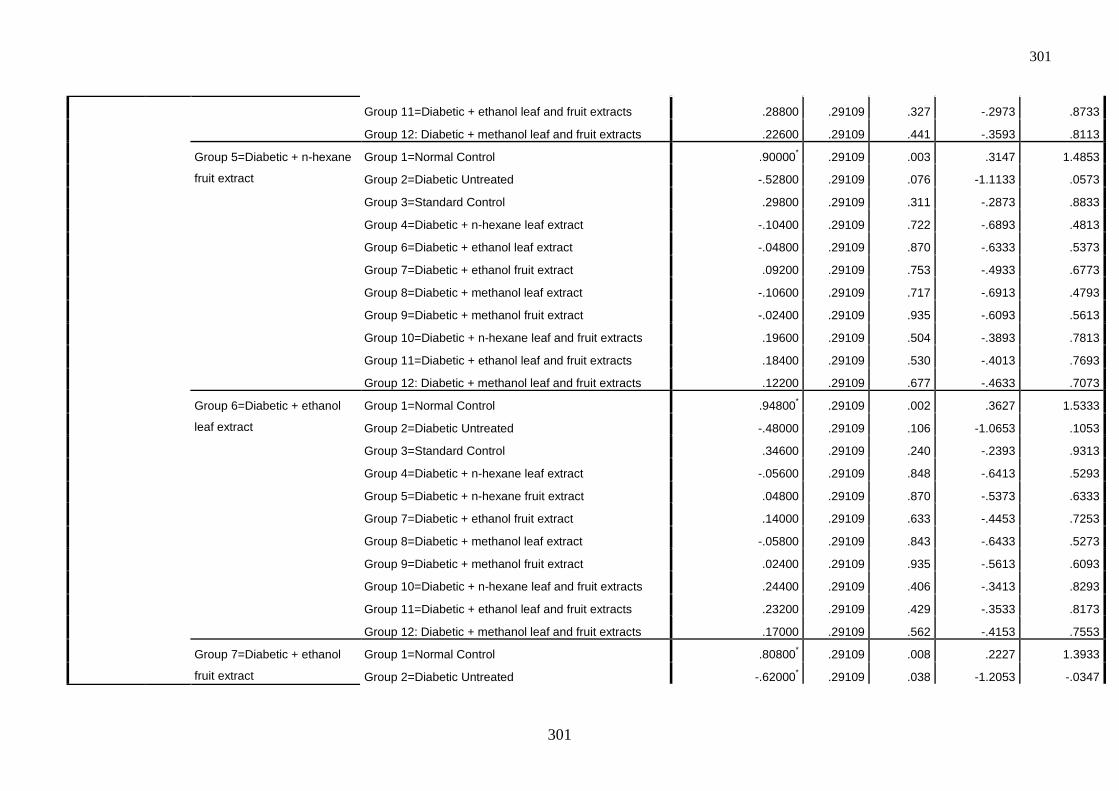
301
301
Group 11=Diabetic + ethanol leaf and fruit extracts .28800 .29109 .327 -.2973 .8733
Group 12: Diabetic + methanol leaf and fruit extracts .22600 .29109 .441 -.3593 .8113
Group 5=Diabetic + n-hexane
fruit extract
Group 1=Normal Control .90000* .29109 .003 .3147 1.4853
Group 2=Diabetic Untreated -.52800 .29109 .076 -1.1133 .0573
Group 3=Standard Control .29800 .29109 .311 -.2873 .8833
Group 4=Diabetic + n-hexane leaf extract -.10400 .29109 .722 -.6893 .4813
Group 6=Diabetic + ethanol leaf extract -.04800 .29109 .870 -.6333 .5373
Group 7=Diabetic + ethanol fruit extract .09200 .29109 .753 -.4933 .6773
Group 8=Diabetic + methanol leaf extract -.10600 .29109 .717 -.6913 .4793
Group 9=Diabetic + methanol fruit extract -.02400 .29109 .935 -.6093 .5613
Group 10=Diabetic + n-hexane leaf and fruit extracts .19600 .29109 .504 -.3893 .7813
Group 11=Diabetic + ethanol leaf and fruit extracts .18400 .29109 .530 -.4013 .7693
Group 12: Diabetic + methanol leaf and fruit extracts .12200 .29109 .677 -.4633 .7073
Group 6=Diabetic + ethanol
leaf extract
Group 1=Normal Control .94800* .29109 .002 .3627 1.5333
Group 2=Diabetic Untreated -.48000 .29109 .106 -1.0653 .1053
Group 3=Standard Control .34600 .29109 .240 -.2393 .9313
Group 4=Diabetic + n-hexane leaf extract -.05600 .29109 .848 -.6413 .5293
Group 5=Diabetic + n-hexane fruit extract .04800 .29109 .870 -.5373 .6333
Group 7=Diabetic + ethanol fruit extract .14000 .29109 .633 -.4453 .7253
Group 8=Diabetic + methanol leaf extract -.05800 .29109 .843 -.6433 .5273
Group 9=Diabetic + methanol fruit extract .02400 .29109 .935 -.5613 .6093
Group 10=Diabetic + n-hexane leaf and fruit extracts .24400 .29109 .406 -.3413 .8293
Group 11=Diabetic + ethanol leaf and fruit extracts .23200 .29109 .429 -.3533 .8173
Group 12: Diabetic + methanol leaf and fruit extracts .17000 .29109 .562 -.4153 .7553
Group 7=Diabetic + ethanol
fruit extract
Group 1=Normal Control .80800* .29109 .008 .2227 1.3933
Group 2=Diabetic Untreated -.62000* .29109 .038 -1.2053 -.0347
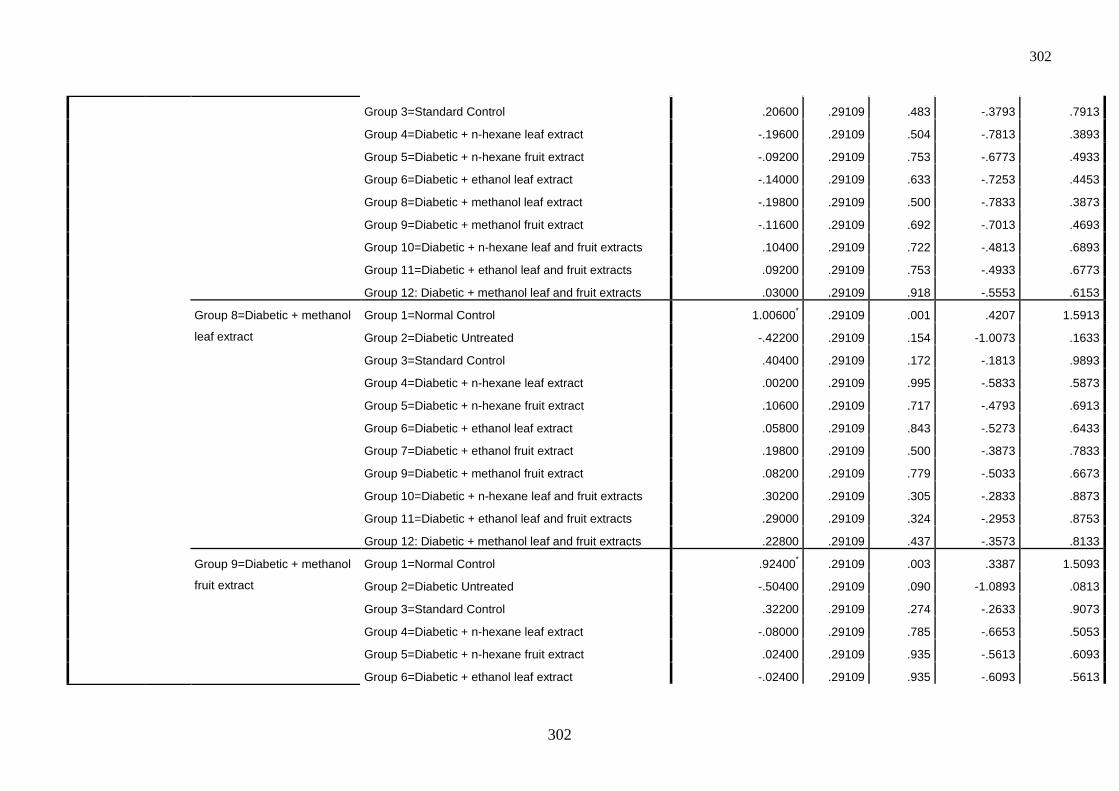
302
302
Group 3=Standard Control .20600 .29109 .483 -.3793 .7913
Group 4=Diabetic + n-hexane leaf extract -.19600 .29109 .504 -.7813 .3893
Group 5=Diabetic + n-hexane fruit extract -.09200 .29109 .753 -.6773 .4933
Group 6=Diabetic + ethanol leaf extract -.14000 .29109 .633 -.7253 .4453
Group 8=Diabetic + methanol leaf extract -.19800 .29109 .500 -.7833 .3873
Group 9=Diabetic + methanol fruit extract -.11600 .29109 .692 -.7013 .4693
Group 10=Diabetic + n-hexane leaf and fruit extracts .10400 .29109 .722 -.4813 .6893
Group 11=Diabetic + ethanol leaf and fruit extracts .09200 .29109 .753 -.4933 .6773
Group 12: Diabetic + methanol leaf and fruit extracts .03000 .29109 .918 -.5553 .6153
Group 8=Diabetic + methanol
leaf extract
Group 1=Normal Control 1.00600* .29109 .001 .4207 1.5913
Group 2=Diabetic Untreated -.42200 .29109 .154 -1.0073 .1633
Group 3=Standard Control .40400 .29109 .172 -.1813 .9893
Group 4=Diabetic + n-hexane leaf extract .00200 .29109 .995 -.5833 .5873
Group 5=Diabetic + n-hexane fruit extract .10600 .29109 .717 -.4793 .6913
Group 6=Diabetic + ethanol leaf extract .05800 .29109 .843 -.5273 .6433
Group 7=Diabetic + ethanol fruit extract .19800 .29109 .500 -.3873 .7833
Group 9=Diabetic + methanol fruit extract .08200 .29109 .779 -.5033 .6673
Group 10=Diabetic + n-hexane leaf and fruit extracts .30200 .29109 .305 -.2833 .8873
Group 11=Diabetic + ethanol leaf and fruit extracts .29000 .29109 .324 -.2953 .8753
Group 12: Diabetic + methanol leaf and fruit extracts .22800 .29109 .437 -.3573 .8133
Group 9=Diabetic + methanol
fruit extract
Group 1=Normal Control .92400* .29109 .003 .3387 1.5093
Group 2=Diabetic Untreated -.50400 .29109 .090 -1.0893 .0813
Group 3=Standard Control .32200 .29109 .274 -.2633 .9073
Group 4=Diabetic + n-hexane leaf extract -.08000 .29109 .785 -.6653 .5053
Group 5=Diabetic + n-hexane fruit extract .02400 .29109 .935 -.5613 .6093
Group 6=Diabetic + ethanol leaf extract -.02400 .29109 .935 -.6093 .5613
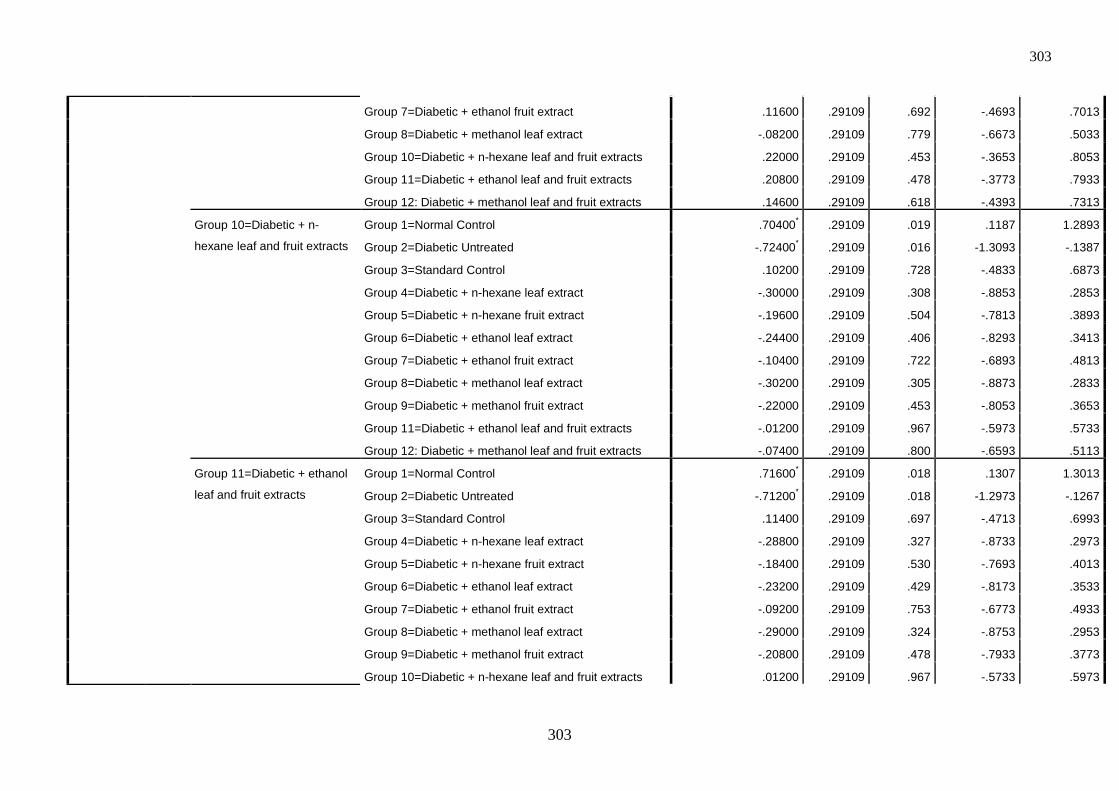
303
303
Group 7=Diabetic + ethanol fruit extract .11600 .29109 .692 -.4693 .7013
Group 8=Diabetic + methanol leaf extract -.08200 .29109 .779 -.6673 .5033
Group 10=Diabetic + n-hexane leaf and fruit extracts .22000 .29109 .453 -.3653 .8053
Group 11=Diabetic + ethanol leaf and fruit extracts .20800 .29109 .478 -.3773 .7933
Group 12: Diabetic + methanol leaf and fruit extracts .14600 .29109 .618 -.4393 .7313
Group 10=Diabetic + n-
hexane leaf and fruit extracts
Group 1=Normal Control .70400* .29109 .019 .1187 1.2893
Group 2=Diabetic Untreated -.72400* .29109 .016 -1.3093 -.1387
Group 3=Standard Control .10200 .29109 .728 -.4833 .6873
Group 4=Diabetic + n-hexane leaf extract -.30000 .29109 .308 -.8853 .2853
Group 5=Diabetic + n-hexane fruit extract -.19600 .29109 .504 -.7813 .3893
Group 6=Diabetic + ethanol leaf extract -.24400 .29109 .406 -.8293 .3413
Group 7=Diabetic + ethanol fruit extract -.10400 .29109 .722 -.6893 .4813
Group 8=Diabetic + methanol leaf extract -.30200 .29109 .305 -.8873 .2833
Group 9=Diabetic + methanol fruit extract -.22000 .29109 .453 -.8053 .3653
Group 11=Diabetic + ethanol leaf and fruit extracts -.01200 .29109 .967 -.5973 .5733
Group 12: Diabetic + methanol leaf and fruit extracts -.07400 .29109 .800 -.6593 .5113
Group 11=Diabetic + ethanol
leaf and fruit extracts
Group 1=Normal Control .71600* .29109 .018 .1307 1.3013
Group 2=Diabetic Untreated -.71200* .29109 .018 -1.2973 -.1267
Group 3=Standard Control .11400 .29109 .697 -.4713 .6993
Group 4=Diabetic + n-hexane leaf extract -.28800 .29109 .327 -.8733 .2973
Group 5=Diabetic + n-hexane fruit extract -.18400 .29109 .530 -.7693 .4013
Group 6=Diabetic + ethanol leaf extract -.23200 .29109 .429 -.8173 .3533
Group 7=Diabetic + ethanol fruit extract -.09200 .29109 .753 -.6773 .4933
Group 8=Diabetic + methanol leaf extract -.29000 .29109 .324 -.8753 .2953
Group 9=Diabetic + methanol fruit extract -.20800 .29109 .478 -.7933 .3773
Group 10=Diabetic + n-hexane leaf and fruit extracts .01200 .29109 .967 -.5733 .5973
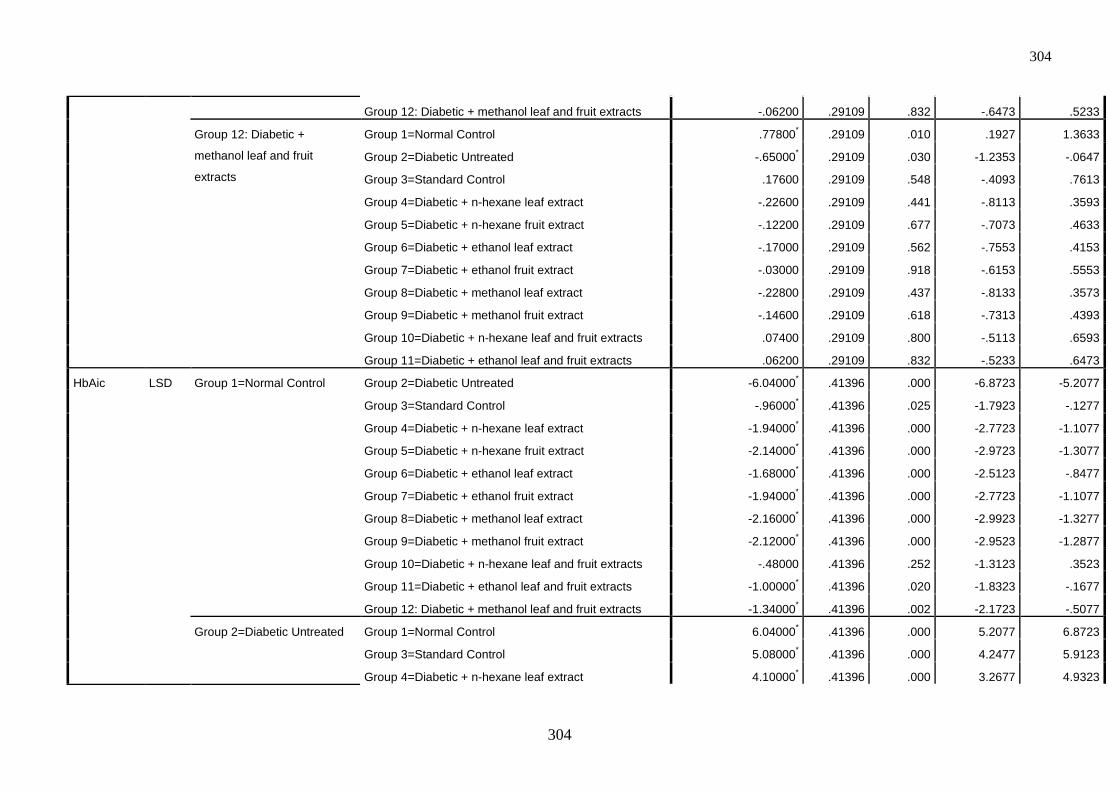
304
304
Group 12: Diabetic + methanol leaf and fruit extracts -.06200 .29109 .832 -.6473 .5233
Group 12: Diabetic +
methanol leaf and fruit
extracts
Group 1=Normal Control .77800* .29109 .010 .1927 1.3633
Group 2=Diabetic Untreated -.65000* .29109 .030 -1.2353 -.0647
Group 3=Standard Control .17600 .29109 .548 -.4093 .7613
Group 4=Diabetic + n-hexane leaf extract -.22600 .29109 .441 -.8113 .3593
Group 5=Diabetic + n-hexane fruit extract -.12200 .29109 .677 -.7073 .4633
Group 6=Diabetic + ethanol leaf extract -.17000 .29109 .562 -.7553 .4153
Group 7=Diabetic + ethanol fruit extract -.03000 .29109 .918 -.6153 .5553
Group 8=Diabetic + methanol leaf extract -.22800 .29109 .437 -.8133 .3573
Group 9=Diabetic + methanol fruit extract -.14600 .29109 .618 -.7313 .4393
Group 10=Diabetic + n-hexane leaf and fruit extracts .07400 .29109 .800 -.5113 .6593
Group 11=Diabetic + ethanol leaf and fruit extracts .06200 .29109 .832 -.5233 .6473
HbAic LSD Group 1=Normal Control Group 2=Diabetic Untreated -6.04000* .41396 .000 -6.8723 -5.2077
Group 3=Standard Control -.96000* .41396 .025 -1.7923 -.1277
Group 4=Diabetic + n-hexane leaf extract -1.94000* .41396 .000 -2.7723 -1.1077
Group 5=Diabetic + n-hexane fruit extract -2.14000* .41396 .000 -2.9723 -1.3077
Group 6=Diabetic + ethanol leaf extract -1.68000* .41396 .000 -2.5123 -.8477
Group 7=Diabetic + ethanol fruit extract -1.94000* .41396 .000 -2.7723 -1.1077
Group 8=Diabetic + methanol leaf extract -2.16000* .41396 .000 -2.9923 -1.3277
Group 9=Diabetic + methanol fruit extract -2.12000* .41396 .000 -2.9523 -1.2877
Group 10=Diabetic + n-hexane leaf and fruit extracts -.48000 .41396 .252 -1.3123 .3523
Group 11=Diabetic + ethanol leaf and fruit extracts -1.00000* .41396 .020 -1.8323 -.1677
Group 12: Diabetic + methanol leaf and fruit extracts -1.34000* .41396 .002 -2.1723 -.5077
Group 2=Diabetic Untreated Group 1=Normal Control 6.04000* .41396 .000 5.2077 6.8723
Group 3=Standard Control 5.08000* .41396 .000 4.2477 5.9123
Group 4=Diabetic + n-hexane leaf extract 4.10000* .41396 .000 3.2677 4.9323
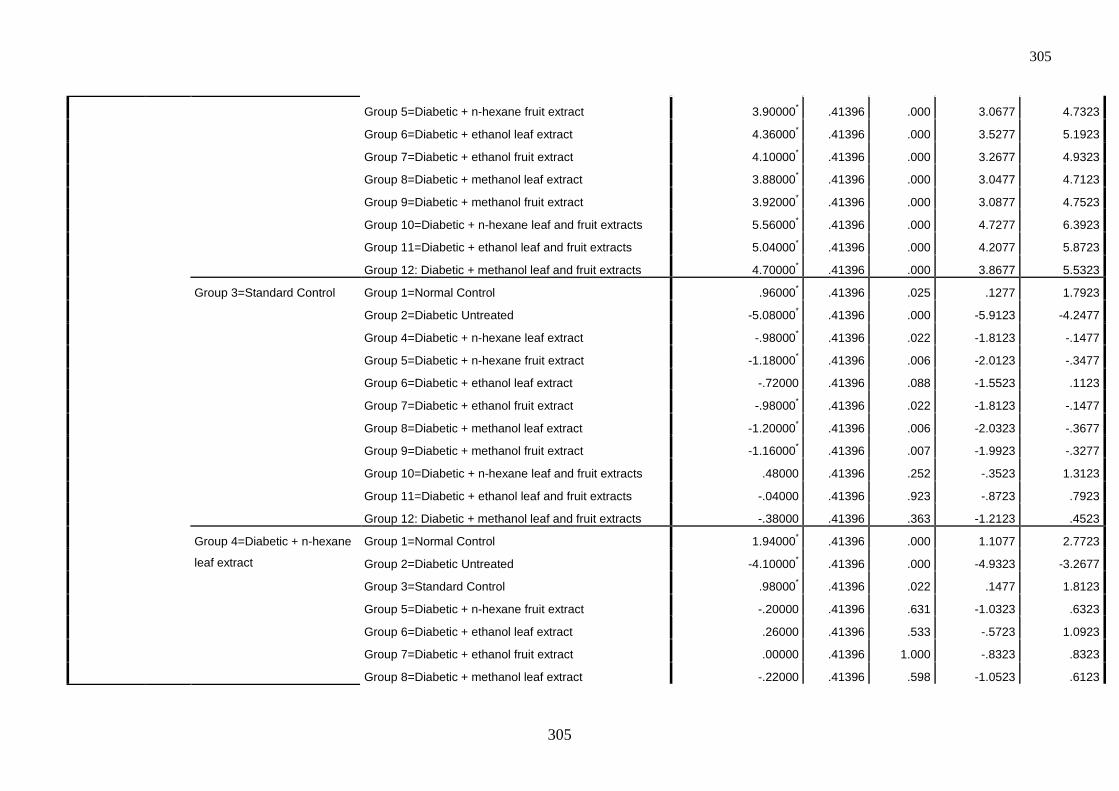
305
305
Group 5=Diabetic + n-hexane fruit extract 3.90000* .41396 .000 3.0677 4.7323
Group 6=Diabetic + ethanol leaf extract 4.36000* .41396 .000 3.5277 5.1923
Group 7=Diabetic + ethanol fruit extract 4.10000* .41396 .000 3.2677 4.9323
Group 8=Diabetic + methanol leaf extract 3.88000* .41396 .000 3.0477 4.7123
Group 9=Diabetic + methanol fruit extract 3.92000* .41396 .000 3.0877 4.7523
Group 10=Diabetic + n-hexane leaf and fruit extracts 5.56000* .41396 .000 4.7277 6.3923
Group 11=Diabetic + ethanol leaf and fruit extracts 5.04000* .41396 .000 4.2077 5.8723
Group 12: Diabetic + methanol leaf and fruit extracts 4.70000* .41396 .000 3.8677 5.5323
Group 3=Standard Control Group 1=Normal Control .96000* .41396 .025 .1277 1.7923
Group 2=Diabetic Untreated -5.08000* .41396 .000 -5.9123 -4.2477
Group 4=Diabetic + n-hexane leaf extract -.98000* .41396 .022 -1.8123 -.1477
Group 5=Diabetic + n-hexane fruit extract -1.18000* .41396 .006 -2.0123 -.3477
Group 6=Diabetic + ethanol leaf extract -.72000 .41396 .088 -1.5523 .1123
Group 7=Diabetic + ethanol fruit extract -.98000* .41396 .022 -1.8123 -.1477
Group 8=Diabetic + methanol leaf extract -1.20000* .41396 .006 -2.0323 -.3677
Group 9=Diabetic + methanol fruit extract -1.16000* .41396 .007 -1.9923 -.3277
Group 10=Diabetic + n-hexane leaf and fruit extracts .48000 .41396 .252 -.3523 1.3123
Group 11=Diabetic + ethanol leaf and fruit extracts -.04000 .41396 .923 -.8723 .7923
Group 12: Diabetic + methanol leaf and fruit extracts -.38000 .41396 .363 -1.2123 .4523
Group 4=Diabetic + n-hexane
leaf extract
Group 1=Normal Control 1.94000* .41396 .000 1.1077 2.7723
Group 2=Diabetic Untreated -4.10000* .41396 .000 -4.9323 -3.2677
Group 3=Standard Control .98000* .41396 .022 .1477 1.8123
Group 5=Diabetic + n-hexane fruit extract -.20000 .41396 .631 -1.0323 .6323
Group 6=Diabetic + ethanol leaf extract .26000 .41396 .533 -.5723 1.0923
Group 7=Diabetic + ethanol fruit extract .00000 .41396 1.000 -.8323 .8323
Group 8=Diabetic + methanol leaf extract -.22000 .41396 .598 -1.0523 .6123
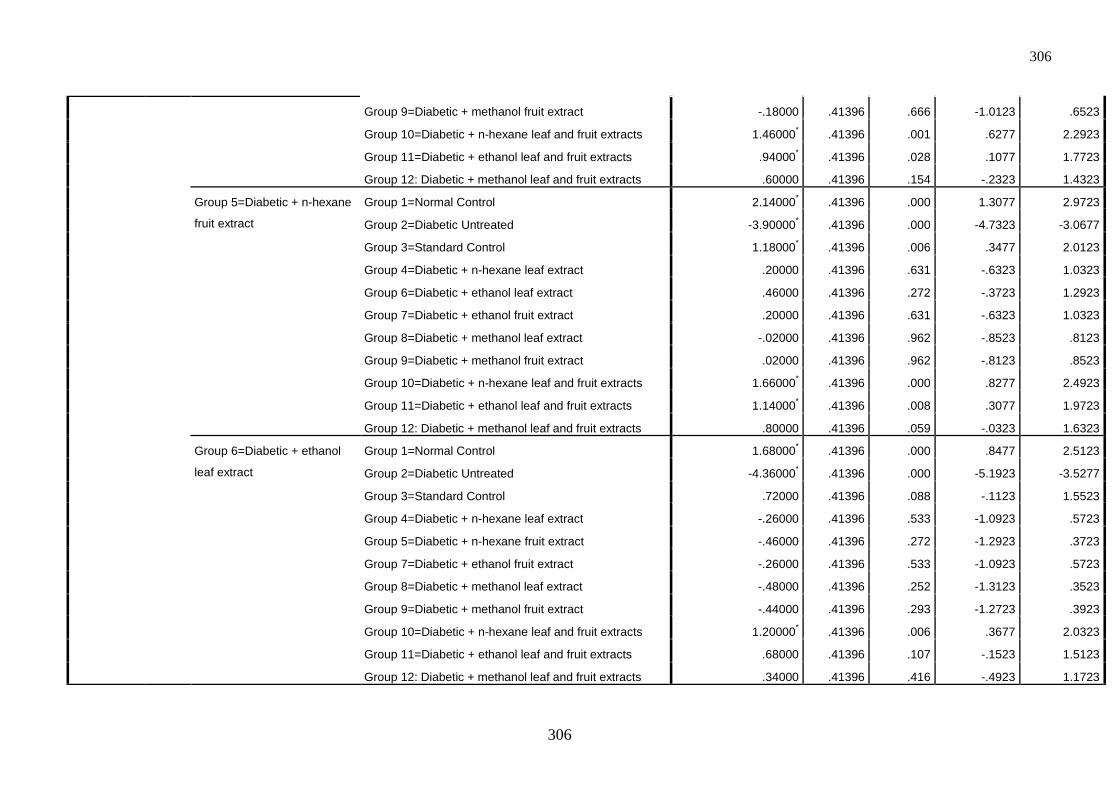
306
306
Group 9=Diabetic + methanol fruit extract -.18000 .41396 .666 -1.0123 .6523
Group 10=Diabetic + n-hexane leaf and fruit extracts 1.46000* .41396 .001 .6277 2.2923
Group 11=Diabetic + ethanol leaf and fruit extracts .94000* .41396 .028 .1077 1.7723
Group 12: Diabetic + methanol leaf and fruit extracts .60000 .41396 .154 -.2323 1.4323
Group 5=Diabetic + n-hexane
fruit extract
Group 1=Normal Control 2.14000* .41396 .000 1.3077 2.9723
Group 2=Diabetic Untreated -3.90000* .41396 .000 -4.7323 -3.0677
Group 3=Standard Control 1.18000* .41396 .006 .3477 2.0123
Group 4=Diabetic + n-hexane leaf extract .20000 .41396 .631 -.6323 1.0323
Group 6=Diabetic + ethanol leaf extract .46000 .41396 .272 -.3723 1.2923
Group 7=Diabetic + ethanol fruit extract .20000 .41396 .631 -.6323 1.0323
Group 8=Diabetic + methanol leaf extract -.02000 .41396 .962 -.8523 .8123
Group 9=Diabetic + methanol fruit extract .02000 .41396 .962 -.8123 .8523
Group 10=Diabetic + n-hexane leaf and fruit extracts 1.66000* .41396 .000 .8277 2.4923
Group 11=Diabetic + ethanol leaf and fruit extracts 1.14000* .41396 .008 .3077 1.9723
Group 12: Diabetic + methanol leaf and fruit extracts .80000 .41396 .059 -.0323 1.6323
Group 6=Diabetic + ethanol
leaf extract
Group 1=Normal Control 1.68000* .41396 .000 .8477 2.5123
Group 2=Diabetic Untreated -4.36000* .41396 .000 -5.1923 -3.5277
Group 3=Standard Control .72000 .41396 .088 -.1123 1.5523
Group 4=Diabetic + n-hexane leaf extract -.26000 .41396 .533 -1.0923 .5723
Group 5=Diabetic + n-hexane fruit extract -.46000 .41396 .272 -1.2923 .3723
Group 7=Diabetic + ethanol fruit extract -.26000 .41396 .533 -1.0923 .5723
Group 8=Diabetic + methanol leaf extract -.48000 .41396 .252 -1.3123 .3523
Group 9=Diabetic + methanol fruit extract -.44000 .41396 .293 -1.2723 .3923
Group 10=Diabetic + n-hexane leaf and fruit extracts 1.20000* .41396 .006 .3677 2.0323
Group 11=Diabetic + ethanol leaf and fruit extracts .68000 .41396 .107 -.1523 1.5123
Group 12: Diabetic + methanol leaf and fruit extracts .34000 .41396 .416 -.4923 1.1723
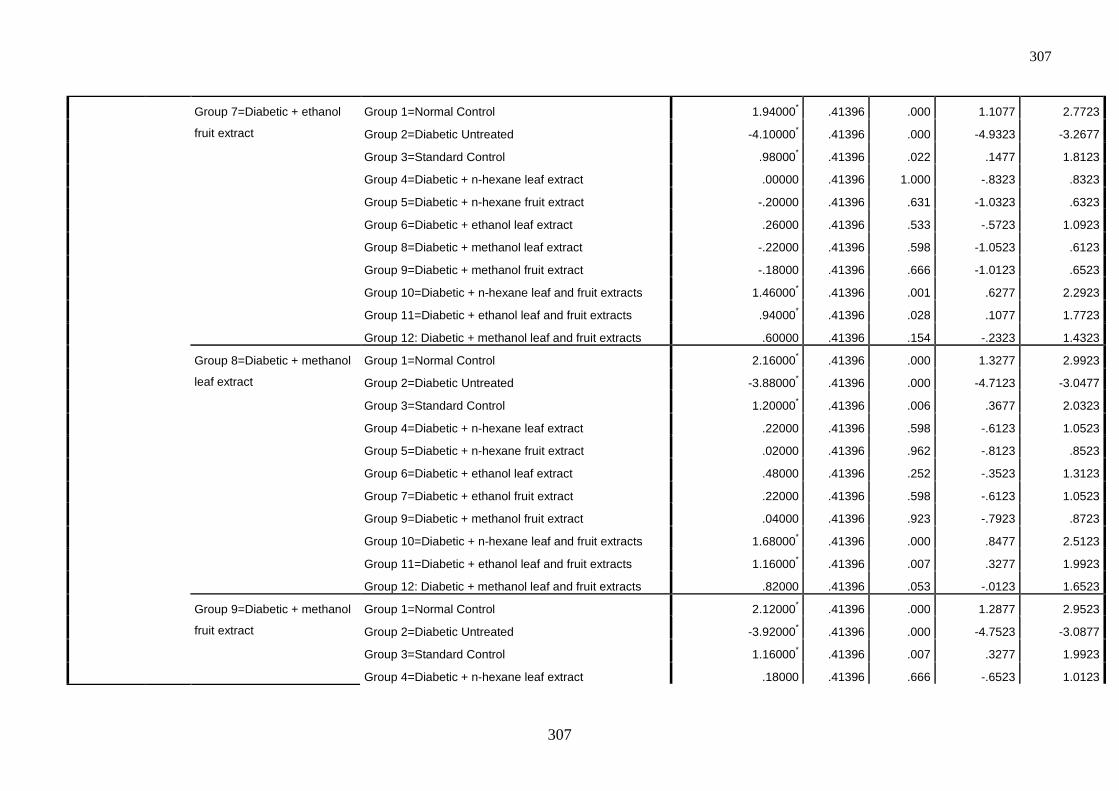
307
307
Group 7=Diabetic + ethanol
fruit extract
Group 1=Normal Control 1.94000* .41396 .000 1.1077 2.7723
Group 2=Diabetic Untreated -4.10000* .41396 .000 -4.9323 -3.2677
Group 3=Standard Control .98000* .41396 .022 .1477 1.8123
Group 4=Diabetic + n-hexane leaf extract .00000 .41396 1.000 -.8323 .8323
Group 5=Diabetic + n-hexane fruit extract -.20000 .41396 .631 -1.0323 .6323
Group 6=Diabetic + ethanol leaf extract .26000 .41396 .533 -.5723 1.0923
Group 8=Diabetic + methanol leaf extract -.22000 .41396 .598 -1.0523 .6123
Group 9=Diabetic + methanol fruit extract -.18000 .41396 .666 -1.0123 .6523
Group 10=Diabetic + n-hexane leaf and fruit extracts 1.46000* .41396 .001 .6277 2.2923
Group 11=Diabetic + ethanol leaf and fruit extracts .94000* .41396 .028 .1077 1.7723
Group 12: Diabetic + methanol leaf and fruit extracts .60000 .41396 .154 -.2323 1.4323
Group 8=Diabetic + methanol
leaf extract
Group 1=Normal Control 2.16000* .41396 .000 1.3277 2.9923
Group 2=Diabetic Untreated -3.88000* .41396 .000 -4.7123 -3.0477
Group 3=Standard Control 1.20000* .41396 .006 .3677 2.0323
Group 4=Diabetic + n-hexane leaf extract .22000 .41396 .598 -.6123 1.0523
Group 5=Diabetic + n-hexane fruit extract .02000 .41396 .962 -.8123 .8523
Group 6=Diabetic + ethanol leaf extract .48000 .41396 .252 -.3523 1.3123
Group 7=Diabetic + ethanol fruit extract .22000 .41396 .598 -.6123 1.0523
Group 9=Diabetic + methanol fruit extract .04000 .41396 .923 -.7923 .8723
Group 10=Diabetic + n-hexane leaf and fruit extracts 1.68000* .41396 .000 .8477 2.5123
Group 11=Diabetic + ethanol leaf and fruit extracts 1.16000* .41396 .007 .3277 1.9923
Group 12: Diabetic + methanol leaf and fruit extracts .82000 .41396 .053 -.0123 1.6523
Group 9=Diabetic + methanol
fruit extract
Group 1=Normal Control 2.12000* .41396 .000 1.2877 2.9523
Group 2=Diabetic Untreated -3.92000* .41396 .000 -4.7523 -3.0877
Group 3=Standard Control 1.16000* .41396 .007 .3277 1.9923
Group 4=Diabetic + n-hexane leaf extract .18000 .41396 .666 -.6523 1.0123
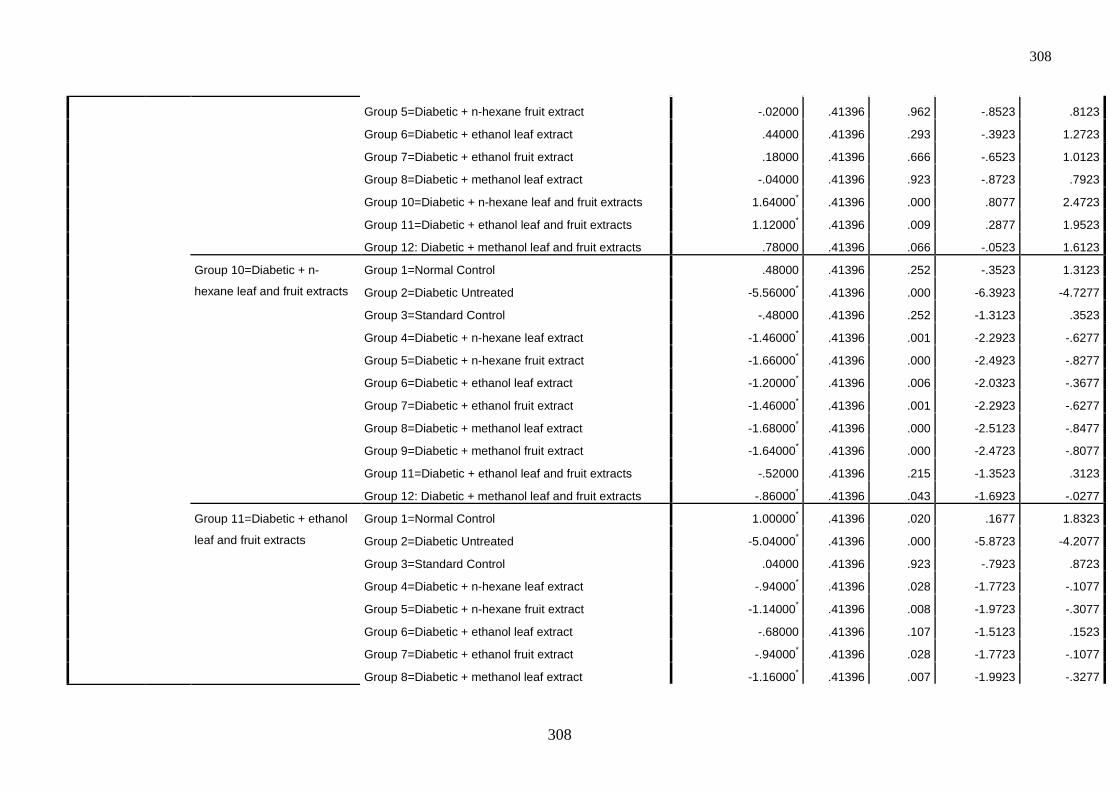
308
308
Group 5=Diabetic + n-hexane fruit extract -.02000 .41396 .962 -.8523 .8123
Group 6=Diabetic + ethanol leaf extract .44000 .41396 .293 -.3923 1.2723
Group 7=Diabetic + ethanol fruit extract .18000 .41396 .666 -.6523 1.0123
Group 8=Diabetic + methanol leaf extract -.04000 .41396 .923 -.8723 .7923
Group 10=Diabetic + n-hexane leaf and fruit extracts 1.64000* .41396 .000 .8077 2.4723
Group 11=Diabetic + ethanol leaf and fruit extracts 1.12000* .41396 .009 .2877 1.9523
Group 12: Diabetic + methanol leaf and fruit extracts .78000 .41396 .066 -.0523 1.6123
Group 10=Diabetic + n-
hexane leaf and fruit extracts
Group 1=Normal Control .48000 .41396 .252 -.3523 1.3123
Group 2=Diabetic Untreated -5.56000* .41396 .000 -6.3923 -4.7277
Group 3=Standard Control -.48000 .41396 .252 -1.3123 .3523
Group 4=Diabetic + n-hexane leaf extract -1.46000* .41396 .001 -2.2923 -.6277
Group 5=Diabetic + n-hexane fruit extract -1.66000* .41396 .000 -2.4923 -.8277
Group 6=Diabetic + ethanol leaf extract -1.20000* .41396 .006 -2.0323 -.3677
Group 7=Diabetic + ethanol fruit extract -1.46000* .41396 .001 -2.2923 -.6277
Group 8=Diabetic + methanol leaf extract -1.68000* .41396 .000 -2.5123 -.8477
Group 9=Diabetic + methanol fruit extract -1.64000* .41396 .000 -2.4723 -.8077
Group 11=Diabetic + ethanol leaf and fruit extracts -.52000 .41396 .215 -1.3523 .3123
Group 12: Diabetic + methanol leaf and fruit extracts -.86000* .41396 .043 -1.6923 -.0277
Group 11=Diabetic + ethanol
leaf and fruit extracts
Group 1=Normal Control 1.00000* .41396 .020 .1677 1.8323
Group 2=Diabetic Untreated -5.04000* .41396 .000 -5.8723 -4.2077
Group 3=Standard Control .04000 .41396 .923 -.7923 .8723
Group 4=Diabetic + n-hexane leaf extract -.94000* .41396 .028 -1.7723 -.1077
Group 5=Diabetic + n-hexane fruit extract -1.14000* .41396 .008 -1.9723 -.3077
Group 6=Diabetic + ethanol leaf extract -.68000 .41396 .107 -1.5123 .1523
Group 7=Diabetic + ethanol fruit extract -.94000* .41396 .028 -1.7723 -.1077
Group 8=Diabetic + methanol leaf extract -1.16000* .41396 .007 -1.9923 -.3277
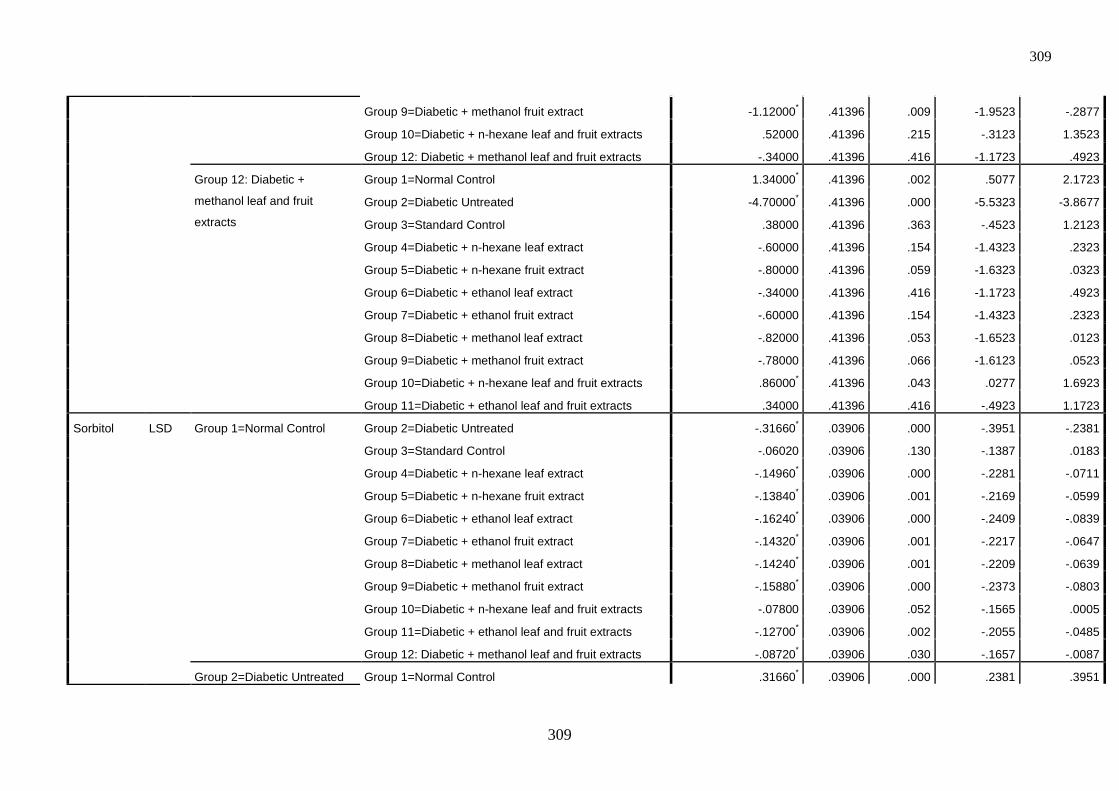
309
309
Group 9=Diabetic + methanol fruit extract -1.12000* .41396 .009 -1.9523 -.2877
Group 10=Diabetic + n-hexane leaf and fruit extracts .52000 .41396 .215 -.3123 1.3523
Group 12: Diabetic + methanol leaf and fruit extracts -.34000 .41396 .416 -1.1723 .4923
Group 12: Diabetic +
methanol leaf and fruit
extracts
Group 1=Normal Control 1.34000* .41396 .002 .5077 2.1723
Group 2=Diabetic Untreated -4.70000* .41396 .000 -5.5323 -3.8677
Group 3=Standard Control .38000 .41396 .363 -.4523 1.2123
Group 4=Diabetic + n-hexane leaf extract -.60000 .41396 .154 -1.4323 .2323
Group 5=Diabetic + n-hexane fruit extract -.80000 .41396 .059 -1.6323 .0323
Group 6=Diabetic + ethanol leaf extract -.34000 .41396 .416 -1.1723 .4923
Group 7=Diabetic + ethanol fruit extract -.60000 .41396 .154 -1.4323 .2323
Group 8=Diabetic + methanol leaf extract -.82000 .41396 .053 -1.6523 .0123
Group 9=Diabetic + methanol fruit extract -.78000 .41396 .066 -1.6123 .0523
Group 10=Diabetic + n-hexane leaf and fruit extracts .86000* .41396 .043 .0277 1.6923
Group 11=Diabetic + ethanol leaf and fruit extracts .34000 .41396 .416 -.4923 1.1723
Sorbitol LSD Group 1=Normal Control Group 2=Diabetic Untreated -.31660* .03906 .000 -.3951 -.2381
Group 3=Standard Control -.06020 .03906 .130 -.1387 .0183
Group 4=Diabetic + n-hexane leaf extract -.14960* .03906 .000 -.2281 -.0711
Group 5=Diabetic + n-hexane fruit extract -.13840* .03906 .001 -.2169 -.0599
Group 6=Diabetic + ethanol leaf extract -.16240* .03906 .000 -.2409 -.0839
Group 7=Diabetic + ethanol fruit extract -.14320* .03906 .001 -.2217 -.0647
Group 8=Diabetic + methanol leaf extract -.14240* .03906 .001 -.2209 -.0639
Group 9=Diabetic + methanol fruit extract -.15880* .03906 .000 -.2373 -.0803
Group 10=Diabetic + n-hexane leaf and fruit extracts -.07800 .03906 .052 -.1565 .0005
Group 11=Diabetic + ethanol leaf and fruit extracts -.12700* .03906 .002 -.2055 -.0485
Group 12: Diabetic + methanol leaf and fruit extracts -.08720* .03906 .030 -.1657 -.0087
Group 2=Diabetic Untreated Group 1=Normal Control .31660* .03906 .000 .2381 .3951
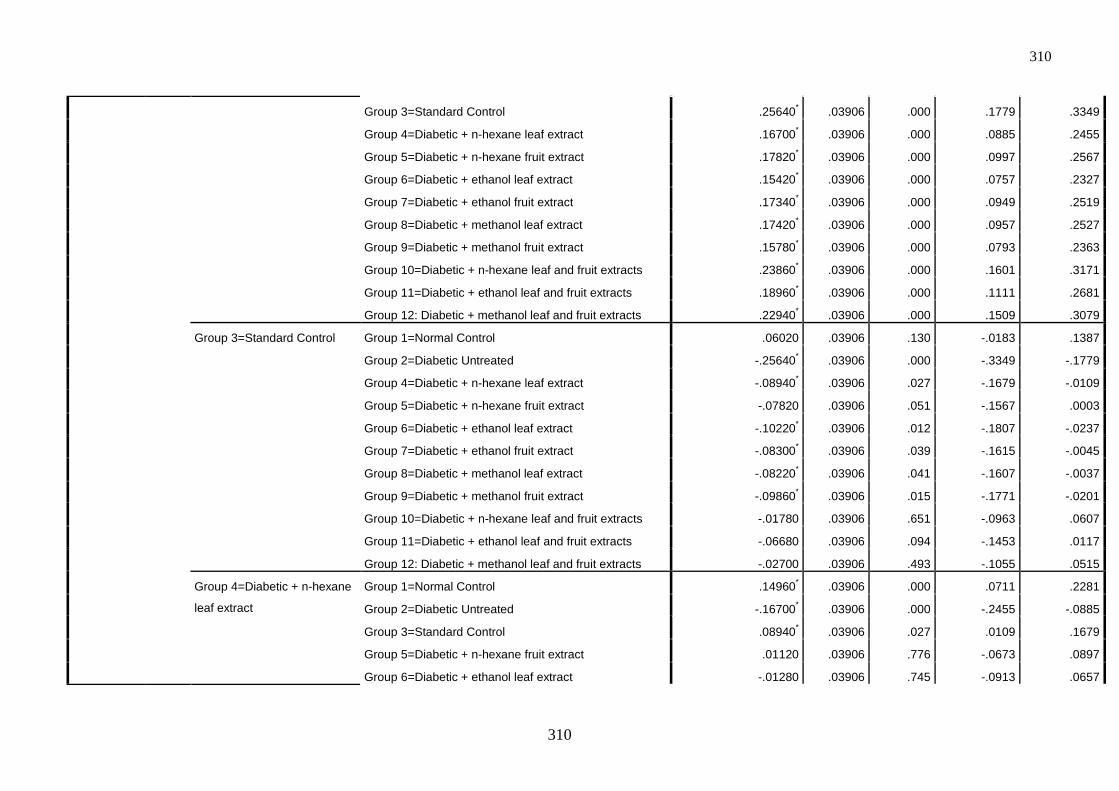
310
310
Group 3=Standard Control .25640* .03906 .000 .1779 .3349
Group 4=Diabetic + n-hexane leaf extract .16700* .03906 .000 .0885 .2455
Group 5=Diabetic + n-hexane fruit extract .17820* .03906 .000 .0997 .2567
Group 6=Diabetic + ethanol leaf extract .15420* .03906 .000 .0757 .2327
Group 7=Diabetic + ethanol fruit extract .17340* .03906 .000 .0949 .2519
Group 8=Diabetic + methanol leaf extract .17420* .03906 .000 .0957 .2527
Group 9=Diabetic + methanol fruit extract .15780* .03906 .000 .0793 .2363
Group 10=Diabetic + n-hexane leaf and fruit extracts .23860* .03906 .000 .1601 .3171
Group 11=Diabetic + ethanol leaf and fruit extracts .18960* .03906 .000 .1111 .2681
Group 12: Diabetic + methanol leaf and fruit extracts .22940* .03906 .000 .1509 .3079
Group 3=Standard Control Group 1=Normal Control .06020 .03906 .130 -.0183 .1387
Group 2=Diabetic Untreated -.25640* .03906 .000 -.3349 -.1779
Group 4=Diabetic + n-hexane leaf extract -.08940* .03906 .027 -.1679 -.0109
Group 5=Diabetic + n-hexane fruit extract -.07820 .03906 .051 -.1567 .0003
Group 6=Diabetic + ethanol leaf extract -.10220* .03906 .012 -.1807 -.0237
Group 7=Diabetic + ethanol fruit extract -.08300* .03906 .039 -.1615 -.0045
Group 8=Diabetic + methanol leaf extract -.08220* .03906 .041 -.1607 -.0037
Group 9=Diabetic + methanol fruit extract -.09860* .03906 .015 -.1771 -.0201
Group 10=Diabetic + n-hexane leaf and fruit extracts -.01780 .03906 .651 -.0963 .0607
Group 11=Diabetic + ethanol leaf and fruit extracts -.06680 .03906 .094 -.1453 .0117
Group 12: Diabetic + methanol leaf and fruit extracts -.02700 .03906 .493 -.1055 .0515
Group 4=Diabetic + n-hexane
leaf extract
Group 1=Normal Control .14960* .03906 .000 .0711 .2281
Group 2=Diabetic Untreated -.16700* .03906 .000 -.2455 -.0885
Group 3=Standard Control .08940* .03906 .027 .0109 .1679
Group 5=Diabetic + n-hexane fruit extract .01120 .03906 .776 -.0673 .0897
Group 6=Diabetic + ethanol leaf extract -.01280 .03906 .745 -.0913 .0657
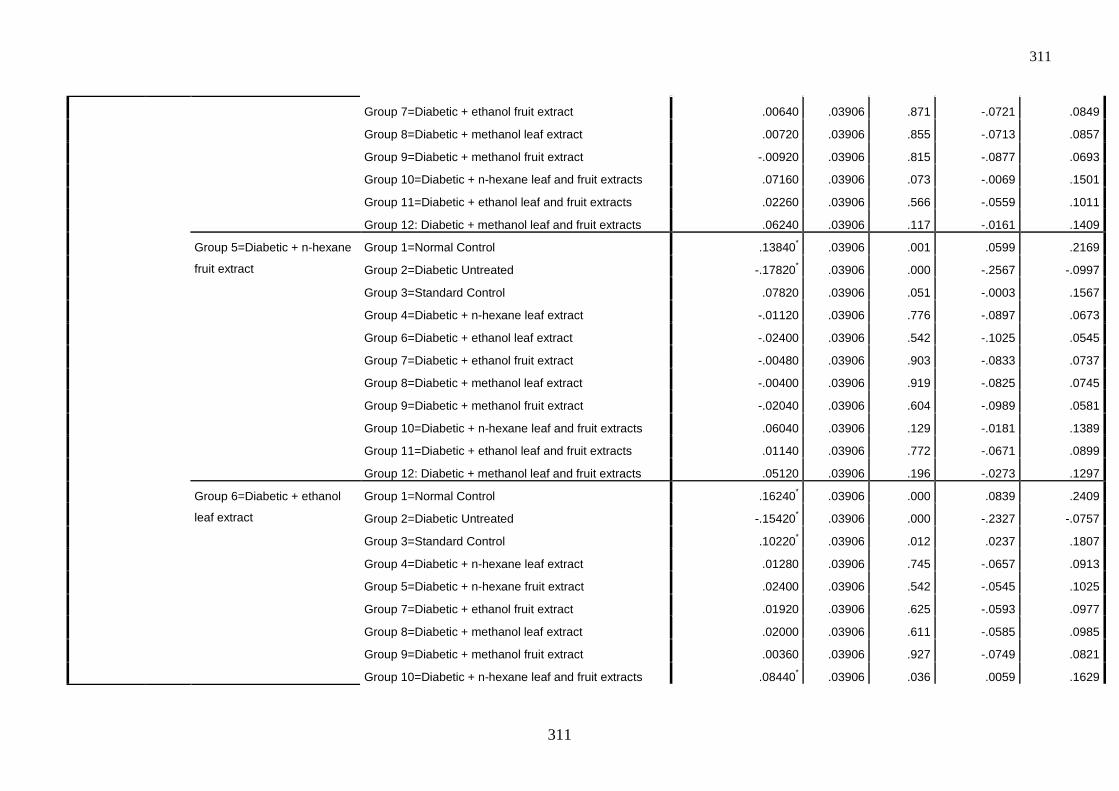
311
311
Group 7=Diabetic + ethanol fruit extract .00640 .03906 .871 -.0721 .0849
Group 8=Diabetic + methanol leaf extract .00720 .03906 .855 -.0713 .0857
Group 9=Diabetic + methanol fruit extract -.00920 .03906 .815 -.0877 .0693
Group 10=Diabetic + n-hexane leaf and fruit extracts .07160 .03906 .073 -.0069 .1501
Group 11=Diabetic + ethanol leaf and fruit extracts .02260 .03906 .566 -.0559 .1011
Group 12: Diabetic + methanol leaf and fruit extracts .06240 .03906 .117 -.0161 .1409
Group 5=Diabetic + n-hexane
fruit extract
Group 1=Normal Control .13840* .03906 .001 .0599 .2169
Group 2=Diabetic Untreated -.17820* .03906 .000 -.2567 -.0997
Group 3=Standard Control .07820 .03906 .051 -.0003 .1567
Group 4=Diabetic + n-hexane leaf extract -.01120 .03906 .776 -.0897 .0673
Group 6=Diabetic + ethanol leaf extract -.02400 .03906 .542 -.1025 .0545
Group 7=Diabetic + ethanol fruit extract -.00480 .03906 .903 -.0833 .0737
Group 8=Diabetic + methanol leaf extract -.00400 .03906 .919 -.0825 .0745
Group 9=Diabetic + methanol fruit extract -.02040 .03906 .604 -.0989 .0581
Group 10=Diabetic + n-hexane leaf and fruit extracts .06040 .03906 .129 -.0181 .1389
Group 11=Diabetic + ethanol leaf and fruit extracts .01140 .03906 .772 -.0671 .0899
Group 12: Diabetic + methanol leaf and fruit extracts .05120 .03906 .196 -.0273 .1297
Group 6=Diabetic + ethanol
leaf extract
Group 1=Normal Control .16240* .03906 .000 .0839 .2409
Group 2=Diabetic Untreated -.15420* .03906 .000 -.2327 -.0757
Group 3=Standard Control .10220* .03906 .012 .0237 .1807
Group 4=Diabetic + n-hexane leaf extract .01280 .03906 .745 -.0657 .0913
Group 5=Diabetic + n-hexane fruit extract .02400 .03906 .542 -.0545 .1025
Group 7=Diabetic + ethanol fruit extract .01920 .03906 .625 -.0593 .0977
Group 8=Diabetic + methanol leaf extract .02000 .03906 .611 -.0585 .0985
Group 9=Diabetic + methanol fruit extract .00360 .03906 .927 -.0749 .0821
Group 10=Diabetic + n-hexane leaf and fruit extracts .08440* .03906 .036 .0059 .1629
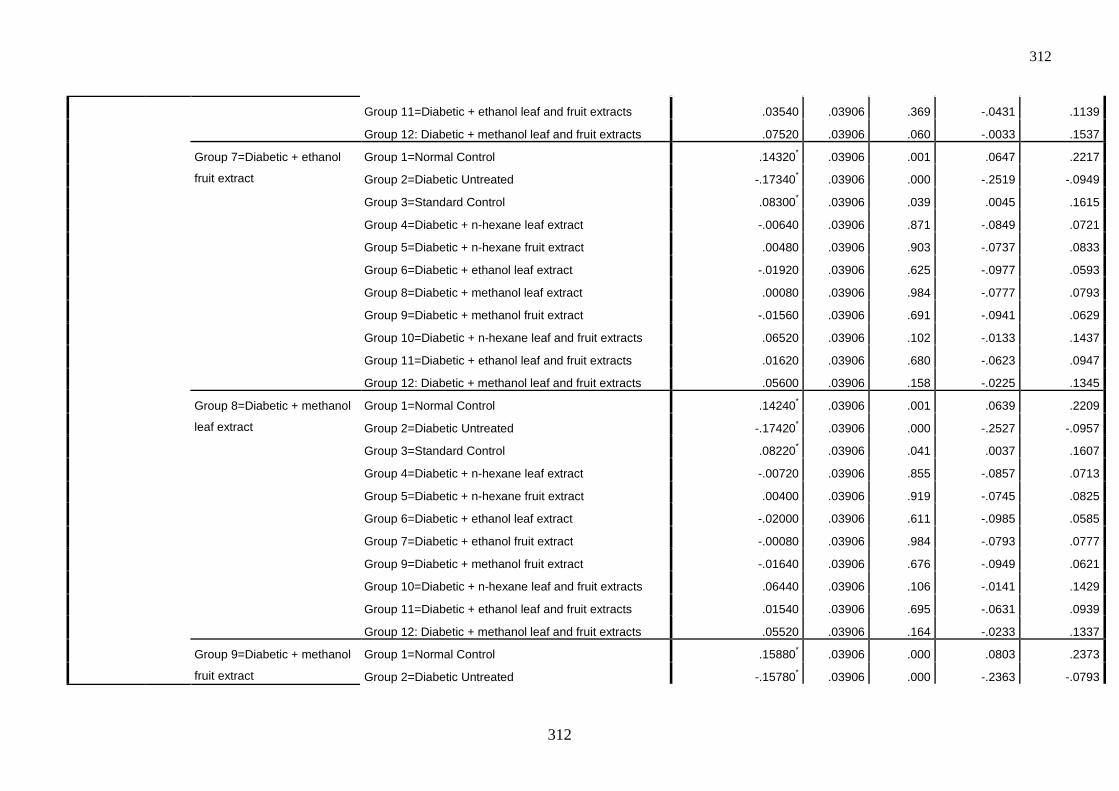
312
312
Group 11=Diabetic + ethanol leaf and fruit extracts .03540 .03906 .369 -.0431 .1139
Group 12: Diabetic + methanol leaf and fruit extracts .07520 .03906 .060 -.0033 .1537
Group 7=Diabetic + ethanol
fruit extract
Group 1=Normal Control .14320* .03906 .001 .0647 .2217
Group 2=Diabetic Untreated -.17340* .03906 .000 -.2519 -.0949
Group 3=Standard Control .08300* .03906 .039 .0045 .1615
Group 4=Diabetic + n-hexane leaf extract -.00640 .03906 .871 -.0849 .0721
Group 5=Diabetic + n-hexane fruit extract .00480 .03906 .903 -.0737 .0833
Group 6=Diabetic + ethanol leaf extract -.01920 .03906 .625 -.0977 .0593
Group 8=Diabetic + methanol leaf extract .00080 .03906 .984 -.0777 .0793
Group 9=Diabetic + methanol fruit extract -.01560 .03906 .691 -.0941 .0629
Group 10=Diabetic + n-hexane leaf and fruit extracts .06520 .03906 .102 -.0133 .1437
Group 11=Diabetic + ethanol leaf and fruit extracts .01620 .03906 .680 -.0623 .0947
Group 12: Diabetic + methanol leaf and fruit extracts .05600 .03906 .158 -.0225 .1345
Group 8=Diabetic + methanol
leaf extract
Group 1=Normal Control .14240* .03906 .001 .0639 .2209
Group 2=Diabetic Untreated -.17420* .03906 .000 -.2527 -.0957
Group 3=Standard Control .08220* .03906 .041 .0037 .1607
Group 4=Diabetic + n-hexane leaf extract -.00720 .03906 .855 -.0857 .0713
Group 5=Diabetic + n-hexane fruit extract .00400 .03906 .919 -.0745 .0825
Group 6=Diabetic + ethanol leaf extract -.02000 .03906 .611 -.0985 .0585
Group 7=Diabetic + ethanol fruit extract -.00080 .03906 .984 -.0793 .0777
Group 9=Diabetic + methanol fruit extract -.01640 .03906 .676 -.0949 .0621
Group 10=Diabetic + n-hexane leaf and fruit extracts .06440 .03906 .106 -.0141 .1429
Group 11=Diabetic + ethanol leaf and fruit extracts .01540 .03906 .695 -.0631 .0939
Group 12: Diabetic + methanol leaf and fruit extracts .05520 .03906 .164 -.0233 .1337
Group 9=Diabetic + methanol
fruit extract
Group 1=Normal Control .15880* .03906 .000 .0803 .2373
Group 2=Diabetic Untreated -.15780* .03906 .000 -.2363 -.0793
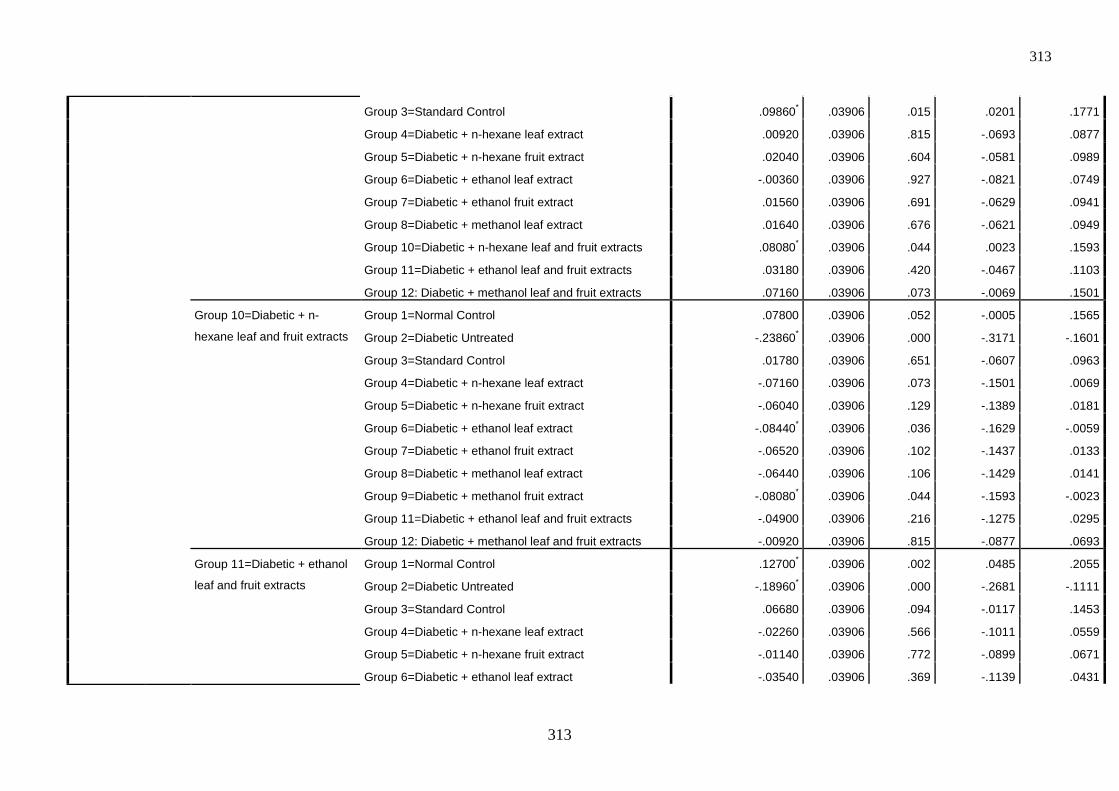
313
313
Group 3=Standard Control .09860* .03906 .015 .0201 .1771
Group 4=Diabetic + n-hexane leaf extract .00920 .03906 .815 -.0693 .0877
Group 5=Diabetic + n-hexane fruit extract .02040 .03906 .604 -.0581 .0989
Group 6=Diabetic + ethanol leaf extract -.00360 .03906 .927 -.0821 .0749
Group 7=Diabetic + ethanol fruit extract .01560 .03906 .691 -.0629 .0941
Group 8=Diabetic + methanol leaf extract .01640 .03906 .676 -.0621 .0949
Group 10=Diabetic + n-hexane leaf and fruit extracts .08080* .03906 .044 .0023 .1593
Group 11=Diabetic + ethanol leaf and fruit extracts .03180 .03906 .420 -.0467 .1103
Group 12: Diabetic + methanol leaf and fruit extracts .07160 .03906 .073 -.0069 .1501
Group 10=Diabetic + n-
hexane leaf and fruit extracts
Group 1=Normal Control .07800 .03906 .052 -.0005 .1565
Group 2=Diabetic Untreated -.23860* .03906 .000 -.3171 -.1601
Group 3=Standard Control .01780 .03906 .651 -.0607 .0963
Group 4=Diabetic + n-hexane leaf extract -.07160 .03906 .073 -.1501 .0069
Group 5=Diabetic + n-hexane fruit extract -.06040 .03906 .129 -.1389 .0181
Group 6=Diabetic + ethanol leaf extract -.08440* .03906 .036 -.1629 -.0059
Group 7=Diabetic + ethanol fruit extract -.06520 .03906 .102 -.1437 .0133
Group 8=Diabetic + methanol leaf extract -.06440 .03906 .106 -.1429 .0141
Group 9=Diabetic + methanol fruit extract -.08080* .03906 .044 -.1593 -.0023
Group 11=Diabetic + ethanol leaf and fruit extracts -.04900 .03906 .216 -.1275 .0295
Group 12: Diabetic + methanol leaf and fruit extracts -.00920 .03906 .815 -.0877 .0693
Group 11=Diabetic + ethanol
leaf and fruit extracts
Group 1=Normal Control .12700* .03906 .002 .0485 .2055
Group 2=Diabetic Untreated -.18960* .03906 .000 -.2681 -.1111
Group 3=Standard Control .06680 .03906 .094 -.0117 .1453
Group 4=Diabetic + n-hexane leaf extract -.02260 .03906 .566 -.1011 .0559
Group 5=Diabetic + n-hexane fruit extract -.01140 .03906 .772 -.0899 .0671
Group 6=Diabetic + ethanol leaf extract -.03540 .03906 .369 -.1139 .0431
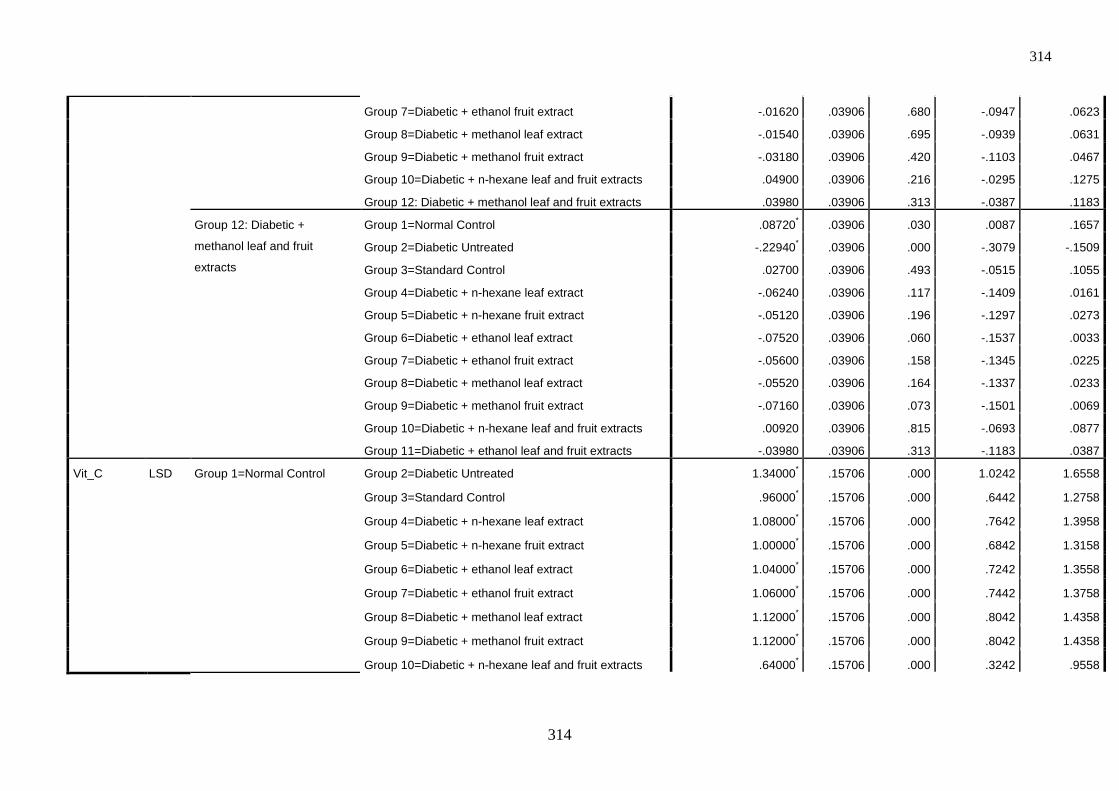
314
314
Group 7=Diabetic + ethanol fruit extract -.01620 .03906 .680 -.0947 .0623
Group 8=Diabetic + methanol leaf extract -.01540 .03906 .695 -.0939 .0631
Group 9=Diabetic + methanol fruit extract -.03180 .03906 .420 -.1103 .0467
Group 10=Diabetic + n-hexane leaf and fruit extracts .04900 .03906 .216 -.0295 .1275
Group 12: Diabetic + methanol leaf and fruit extracts .03980 .03906 .313 -.0387 .1183
Group 12: Diabetic +
methanol leaf and fruit
extracts
Group 1=Normal Control .08720* .03906 .030 .0087 .1657
Group 2=Diabetic Untreated -.22940* .03906 .000 -.3079 -.1509
Group 3=Standard Control .02700 .03906 .493 -.0515 .1055
Group 4=Diabetic + n-hexane leaf extract -.06240 .03906 .117 -.1409 .0161
Group 5=Diabetic + n-hexane fruit extract -.05120 .03906 .196 -.1297 .0273
Group 6=Diabetic + ethanol leaf extract -.07520 .03906 .060 -.1537 .0033
Group 7=Diabetic + ethanol fruit extract -.05600 .03906 .158 -.1345 .0225
Group 8=Diabetic + methanol leaf extract -.05520 .03906 .164 -.1337 .0233
Group 9=Diabetic + methanol fruit extract -.07160 .03906 .073 -.1501 .0069
Group 10=Diabetic + n-hexane leaf and fruit extracts .00920 .03906 .815 -.0693 .0877
Group 11=Diabetic + ethanol leaf and fruit extracts -.03980 .03906 .313 -.1183 .0387
Vit_C LSD Group 1=Normal Control Group 2=Diabetic Untreated 1.34000* .15706 .000 1.0242 1.6558
Group 3=Standard Control .96000* .15706 .000 .6442 1.2758
Group 4=Diabetic + n-hexane leaf extract 1.08000* .15706 .000 .7642 1.3958
Group 5=Diabetic + n-hexane fruit extract 1.00000* .15706 .000 .6842 1.3158
Group 6=Diabetic + ethanol leaf extract 1.04000* .15706 .000 .7242 1.3558
Group 7=Diabetic + ethanol fruit extract 1.06000* .15706 .000 .7442 1.3758
Group 8=Diabetic + methanol leaf extract 1.12000* .15706 .000 .8042 1.4358
Group 9=Diabetic + methanol fruit extract 1.12000* .15706 .000 .8042 1.4358
Group 10=Diabetic + n-hexane leaf and fruit extracts .64000* .15706 .000 .3242 .9558
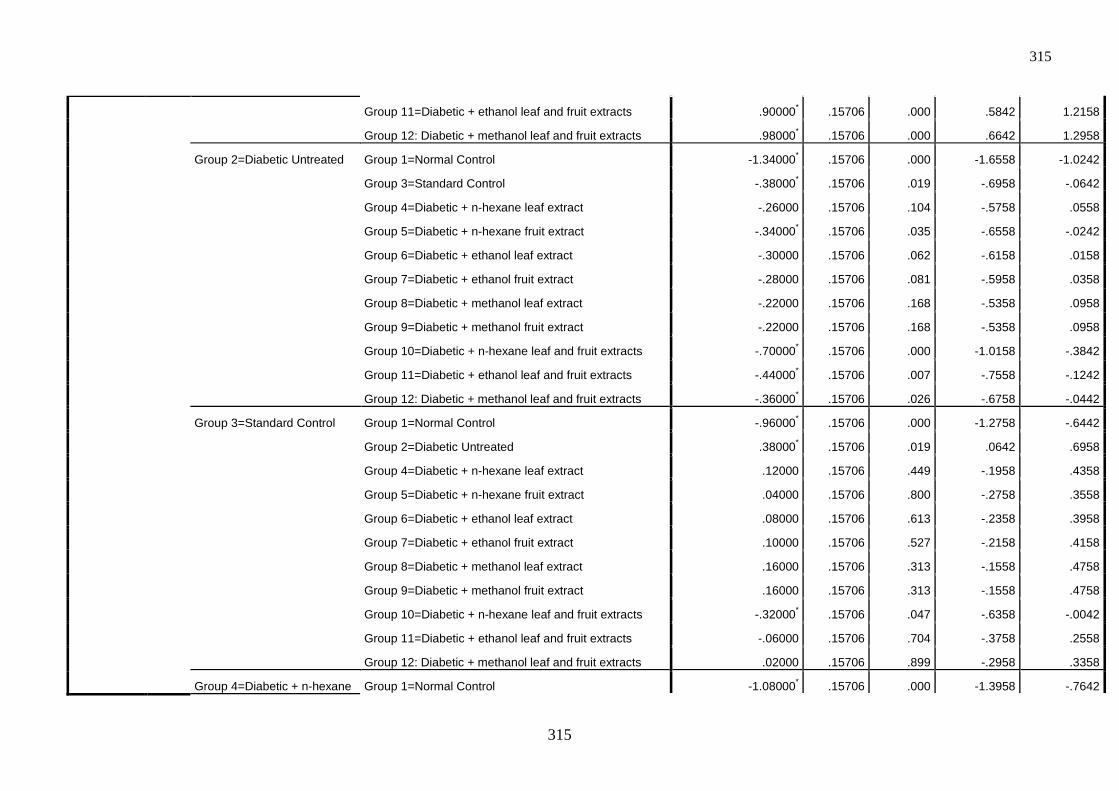
315
315
Group 11=Diabetic + ethanol leaf and fruit extracts .90000* .15706 .000 .5842 1.2158
Group 12: Diabetic + methanol leaf and fruit extracts .98000* .15706 .000 .6642 1.2958
Group 2=Diabetic Untreated Group 1=Normal Control -1.34000* .15706 .000 -1.6558 -1.0242
Group 3=Standard Control -.38000* .15706 .019 -.6958 -.0642
Group 4=Diabetic + n-hexane leaf extract -.26000 .15706 .104 -.5758 .0558
Group 5=Diabetic + n-hexane fruit extract -.34000* .15706 .035 -.6558 -.0242
Group 6=Diabetic + ethanol leaf extract -.30000 .15706 .062 -.6158 .0158
Group 7=Diabetic + ethanol fruit extract -.28000 .15706 .081 -.5958 .0358
Group 8=Diabetic + methanol leaf extract -.22000 .15706 .168 -.5358 .0958
Group 9=Diabetic + methanol fruit extract -.22000 .15706 .168 -.5358 .0958
Group 10=Diabetic + n-hexane leaf and fruit extracts -.70000* .15706 .000 -1.0158 -.3842
Group 11=Diabetic + ethanol leaf and fruit extracts -.44000* .15706 .007 -.7558 -.1242
Group 12: Diabetic + methanol leaf and fruit extracts -.36000* .15706 .026 -.6758 -.0442
Group 3=Standard Control Group 1=Normal Control -.96000* .15706 .000 -1.2758 -.6442
Group 2=Diabetic Untreated .38000* .15706 .019 .0642 .6958
Group 4=Diabetic + n-hexane leaf extract .12000 .15706 .449 -.1958 .4358
Group 5=Diabetic + n-hexane fruit extract .04000 .15706 .800 -.2758 .3558
Group 6=Diabetic + ethanol leaf extract .08000 .15706 .613 -.2358 .3958
Group 7=Diabetic + ethanol fruit extract .10000 .15706 .527 -.2158 .4158
Group 8=Diabetic + methanol leaf extract .16000 .15706 .313 -.1558 .4758
Group 9=Diabetic + methanol fruit extract .16000 .15706 .313 -.1558 .4758
Group 10=Diabetic + n-hexane leaf and fruit extracts -.32000* .15706 .047 -.6358 -.0042
Group 11=Diabetic + ethanol leaf and fruit extracts -.06000 .15706 .704 -.3758 .2558
Group 12: Diabetic + methanol leaf and fruit extracts .02000 .15706 .899 -.2958 .3358
Group 4=Diabetic + n-hexane Group 1=Normal Control -1.08000* .15706 .000 -1.3958 -.7642
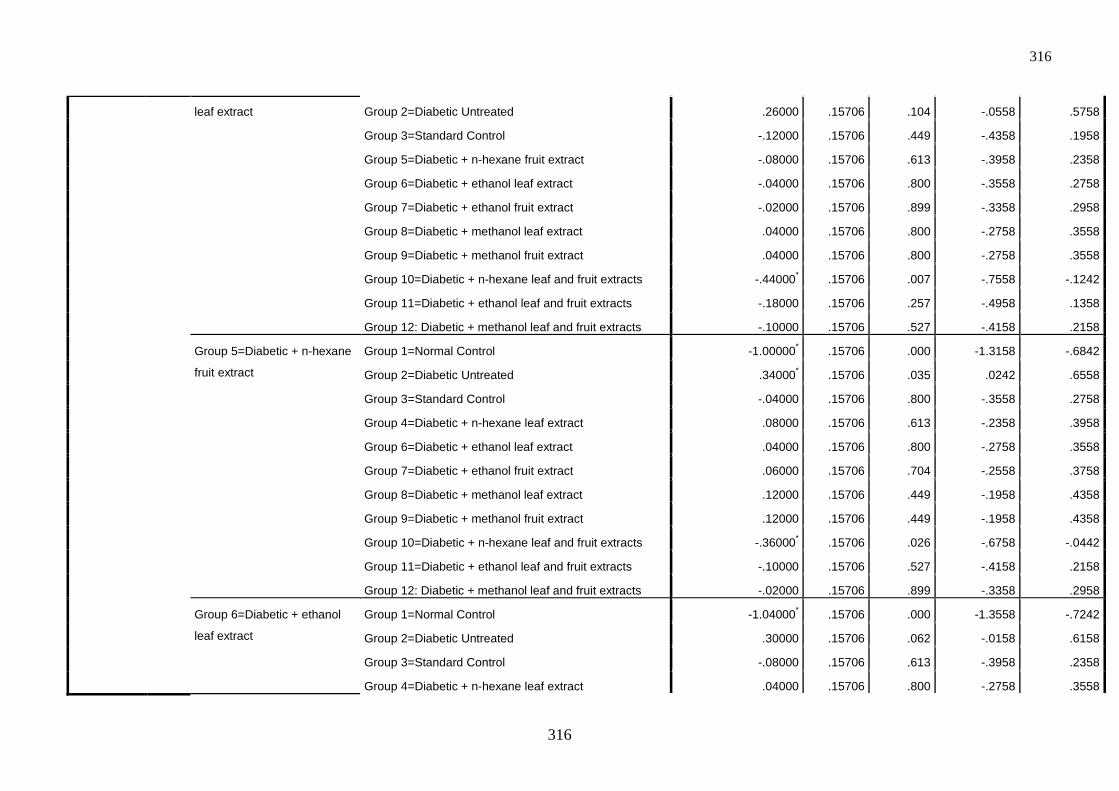
316
316
leaf extract Group 2=Diabetic Untreated .26000 .15706 .104 -.0558 .5758
Group 3=Standard Control -.12000 .15706 .449 -.4358 .1958
Group 5=Diabetic + n-hexane fruit extract -.08000 .15706 .613 -.3958 .2358
Group 6=Diabetic + ethanol leaf extract -.04000 .15706 .800 -.3558 .2758
Group 7=Diabetic + ethanol fruit extract -.02000 .15706 .899 -.3358 .2958
Group 8=Diabetic + methanol leaf extract .04000 .15706 .800 -.2758 .3558
Group 9=Diabetic + methanol fruit extract .04000 .15706 .800 -.2758 .3558
Group 10=Diabetic + n-hexane leaf and fruit extracts -.44000* .15706 .007 -.7558 -.1242
Group 11=Diabetic + ethanol leaf and fruit extracts -.18000 .15706 .257 -.4958 .1358
Group 12: Diabetic + methanol leaf and fruit extracts -.10000 .15706 .527 -.4158 .2158
Group 5=Diabetic + n-hexane
fruit extract
Group 1=Normal Control -1.00000* .15706 .000 -1.3158 -.6842
Group 2=Diabetic Untreated .34000* .15706 .035 .0242 .6558
Group 3=Standard Control -.04000 .15706 .800 -.3558 .2758
Group 4=Diabetic + n-hexane leaf extract .08000 .15706 .613 -.2358 .3958
Group 6=Diabetic + ethanol leaf extract .04000 .15706 .800 -.2758 .3558
Group 7=Diabetic + ethanol fruit extract .06000 .15706 .704 -.2558 .3758
Group 8=Diabetic + methanol leaf extract .12000 .15706 .449 -.1958 .4358
Group 9=Diabetic + methanol fruit extract .12000 .15706 .449 -.1958 .4358
Group 10=Diabetic + n-hexane leaf and fruit extracts -.36000* .15706 .026 -.6758 -.0442
Group 11=Diabetic + ethanol leaf and fruit extracts -.10000 .15706 .527 -.4158 .2158
Group 12: Diabetic + methanol leaf and fruit extracts -.02000 .15706 .899 -.3358 .2958
Group 6=Diabetic + ethanol
leaf extract
Group 1=Normal Control -1.04000* .15706 .000 -1.3558 -.7242
Group 2=Diabetic Untreated .30000 .15706 .062 -.0158 .6158
Group 3=Standard Control -.08000 .15706 .613 -.3958 .2358
Group 4=Diabetic + n-hexane leaf extract .04000 .15706 .800 -.2758 .3558
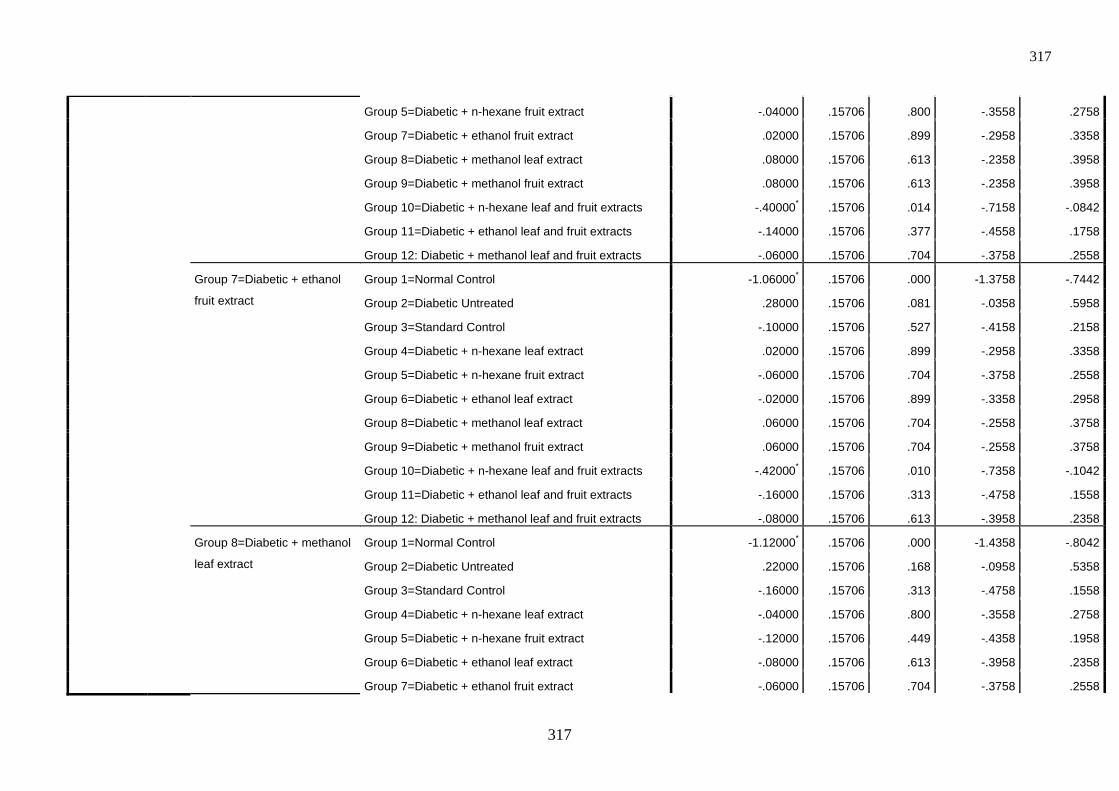
317
317
Group 5=Diabetic + n-hexane fruit extract -.04000 .15706 .800 -.3558 .2758
Group 7=Diabetic + ethanol fruit extract .02000 .15706 .899 -.2958 .3358
Group 8=Diabetic + methanol leaf extract .08000 .15706 .613 -.2358 .3958
Group 9=Diabetic + methanol fruit extract .08000 .15706 .613 -.2358 .3958
Group 10=Diabetic + n-hexane leaf and fruit extracts -.40000* .15706 .014 -.7158 -.0842
Group 11=Diabetic + ethanol leaf and fruit extracts -.14000 .15706 .377 -.4558 .1758
Group 12: Diabetic + methanol leaf and fruit extracts -.06000 .15706 .704 -.3758 .2558
Group 7=Diabetic + ethanol
fruit extract
Group 1=Normal Control -1.06000* .15706 .000 -1.3758 -.7442
Group 2=Diabetic Untreated .28000 .15706 .081 -.0358 .5958
Group 3=Standard Control -.10000 .15706 .527 -.4158 .2158
Group 4=Diabetic + n-hexane leaf extract .02000 .15706 .899 -.2958 .3358
Group 5=Diabetic + n-hexane fruit extract -.06000 .15706 .704 -.3758 .2558
Group 6=Diabetic + ethanol leaf extract -.02000 .15706 .899 -.3358 .2958
Group 8=Diabetic + methanol leaf extract .06000 .15706 .704 -.2558 .3758
Group 9=Diabetic + methanol fruit extract .06000 .15706 .704 -.2558 .3758
Group 10=Diabetic + n-hexane leaf and fruit extracts -.42000* .15706 .010 -.7358 -.1042
Group 11=Diabetic + ethanol leaf and fruit extracts -.16000 .15706 .313 -.4758 .1558
Group 12: Diabetic + methanol leaf and fruit extracts -.08000 .15706 .613 -.3958 .2358
Group 8=Diabetic + methanol
leaf extract
Group 1=Normal Control -1.12000* .15706 .000 -1.4358 -.8042
Group 2=Diabetic Untreated .22000 .15706 .168 -.0958 .5358
Group 3=Standard Control -.16000 .15706 .313 -.4758 .1558
Group 4=Diabetic + n-hexane leaf extract -.04000 .15706 .800 -.3558 .2758
Group 5=Diabetic + n-hexane fruit extract -.12000 .15706 .449 -.4358 .1958
Group 6=Diabetic + ethanol leaf extract -.08000 .15706 .613 -.3958 .2358
Group 7=Diabetic + ethanol fruit extract -.06000 .15706 .704 -.3758 .2558
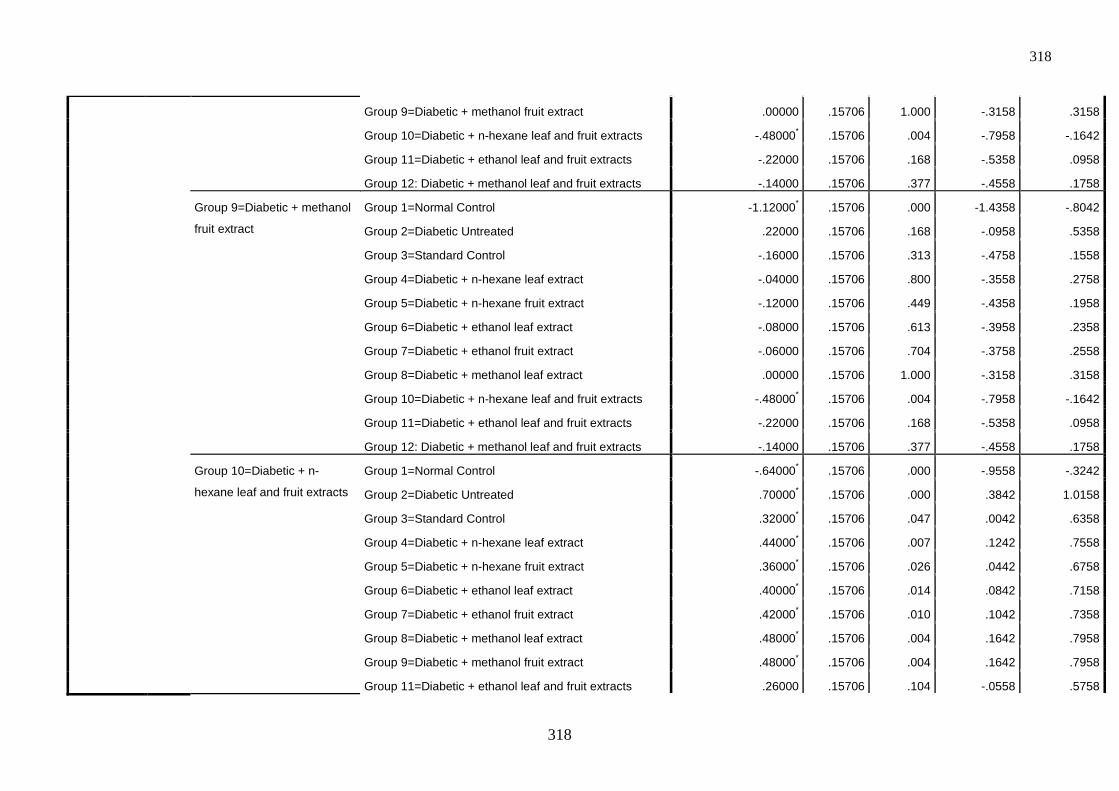
318
318
Group 9=Diabetic + methanol fruit extract .00000 .15706 1.000 -.3158 .3158
Group 10=Diabetic + n-hexane leaf and fruit extracts -.48000* .15706 .004 -.7958 -.1642
Group 11=Diabetic + ethanol leaf and fruit extracts -.22000 .15706 .168 -.5358 .0958
Group 12: Diabetic + methanol leaf and fruit extracts -.14000 .15706 .377 -.4558 .1758
Group 9=Diabetic + methanol
fruit extract
Group 1=Normal Control -1.12000* .15706 .000 -1.4358 -.8042
Group 2=Diabetic Untreated .22000 .15706 .168 -.0958 .5358
Group 3=Standard Control -.16000 .15706 .313 -.4758 .1558
Group 4=Diabetic + n-hexane leaf extract -.04000 .15706 .800 -.3558 .2758
Group 5=Diabetic + n-hexane fruit extract -.12000 .15706 .449 -.4358 .1958
Group 6=Diabetic + ethanol leaf extract -.08000 .15706 .613 -.3958 .2358
Group 7=Diabetic + ethanol fruit extract -.06000 .15706 .704 -.3758 .2558
Group 8=Diabetic + methanol leaf extract .00000 .15706 1.000 -.3158 .3158
Group 10=Diabetic + n-hexane leaf and fruit extracts -.48000* .15706 .004 -.7958 -.1642
Group 11=Diabetic + ethanol leaf and fruit extracts -.22000 .15706 .168 -.5358 .0958
Group 12: Diabetic + methanol leaf and fruit extracts -.14000 .15706 .377 -.4558 .1758
Group 10=Diabetic + n-
hexane leaf and fruit extracts
Group 1=Normal Control -.64000* .15706 .000 -.9558 -.3242
Group 2=Diabetic Untreated .70000* .15706 .000 .3842 1.0158
Group 3=Standard Control .32000* .15706 .047 .0042 .6358
Group 4=Diabetic + n-hexane leaf extract .44000* .15706 .007 .1242 .7558
Group 5=Diabetic + n-hexane fruit extract .36000* .15706 .026 .0442 .6758
Group 6=Diabetic + ethanol leaf extract .40000* .15706 .014 .0842 .7158
Group 7=Diabetic + ethanol fruit extract .42000* .15706 .010 .1042 .7358
Group 8=Diabetic + methanol leaf extract .48000* .15706 .004 .1642 .7958
Group 9=Diabetic + methanol fruit extract .48000* .15706 .004 .1642 .7958
Group 11=Diabetic + ethanol leaf and fruit extracts .26000 .15706 .104 -.0558 .5758
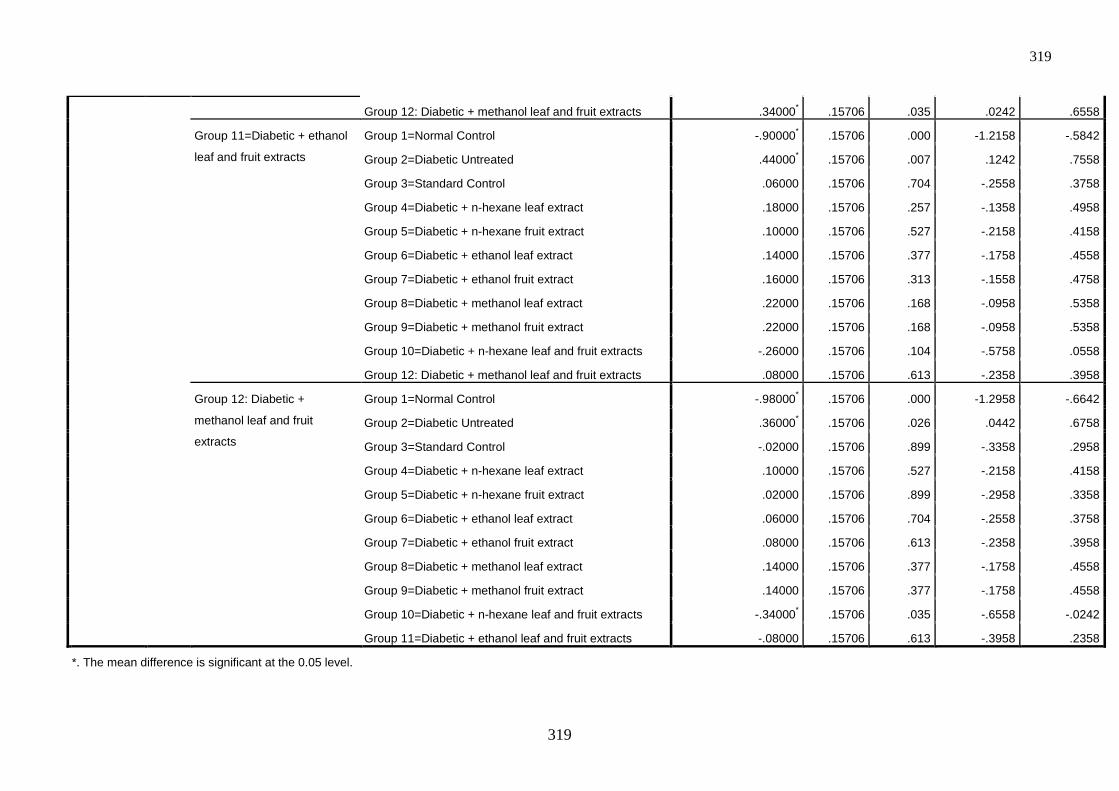
319
319
Group 12: Diabetic + methanol leaf and fruit extracts .34000* .15706 .035 .0242 .6558
Group 11=Diabetic + ethanol
leaf and fruit extracts
Group 1=Normal Control -.90000* .15706 .000 -1.2158 -.5842
Group 2=Diabetic Untreated .44000* .15706 .007 .1242 .7558
Group 3=Standard Control .06000 .15706 .704 -.2558 .3758
Group 4=Diabetic + n-hexane leaf extract .18000 .15706 .257 -.1358 .4958
Group 5=Diabetic + n-hexane fruit extract .10000 .15706 .527 -.2158 .4158
Group 6=Diabetic + ethanol leaf extract .14000 .15706 .377 -.1758 .4558
Group 7=Diabetic + ethanol fruit extract .16000 .15706 .313 -.1558 .4758
Group 8=Diabetic + methanol leaf extract .22000 .15706 .168 -.0958 .5358
Group 9=Diabetic + methanol fruit extract .22000 .15706 .168 -.0958 .5358
Group 10=Diabetic + n-hexane leaf and fruit extracts -.26000 .15706 .104 -.5758 .0558
Group 12: Diabetic + methanol leaf and fruit extracts .08000 .15706 .613 -.2358 .3958
Group 12: Diabetic +
methanol leaf and fruit
extracts
Group 1=Normal Control -.98000* .15706 .000 -1.2958 -.6642
Group 2=Diabetic Untreated .36000* .15706 .026 .0442 .6758
Group 3=Standard Control -.02000 .15706 .899 -.3358 .2958
Group 4=Diabetic + n-hexane leaf extract .10000 .15706 .527 -.2158 .4158
Group 5=Diabetic + n-hexane fruit extract .02000 .15706 .899 -.2958 .3358
Group 6=Diabetic + ethanol leaf extract .06000 .15706 .704 -.2558 .3758
Group 7=Diabetic + ethanol fruit extract .08000 .15706 .613 -.2358 .3958
Group 8=Diabetic + methanol leaf extract .14000 .15706 .377 -.1758 .4558
Group 9=Diabetic + methanol fruit extract .14000 .15706 .377 -.1758 .4558
Group 10=Diabetic + n-hexane leaf and fruit extracts -.34000* .15706 .035 -.6558 -.0242
Group 11=Diabetic + ethanol leaf and fruit extracts -.08000 .15706 .613 -.3958 .2358
*. The mean difference is significant at the 0.05 level.
320
320


![Chico Xavier-Emmanuel [Emmanuel]](https://img.pdfslide.net/doc/110x75/577d2d361a28ab4e1ead223d/chico-xavier-emmanuel-emmanuel.jpg)