Embed Size (px)
Citation preview

UI PERFORMS PY 2006 Annual Report April 1, 2005 to March 31, 2006
U.S. Department of LaborEmployment and Training Administration Office of Workforce Security
February 2007
Unemployment Insurance
UI PERFORMS PY 2006 Annual Report April 1, 2005 to March 31, 2006
U.S. Department of LaborElaine Chao, Secretary
Employment and Training Administration Emily DeRocco, Assistant Secretary
Office of Workforce Security Cheryl Atkinson, Administrator
February 2007
UI PERFORMS ANNUAL REPORT PY 2006TABLE OF CONTENTS
INTRODUCTION .................................................................................................. 4
Benefit Accuracy Measurement ........................................................................................ 8Benefits Timeliness and Quality ....................................................................................... 9Tax Performance System ................................................................................................. 10Benefit Payment Control ................................................................................................. 11Data Validation ................................................................................................................ 12
NATIONAL REPORT ......................................................................................... 13
APPENDIX A: DATA VALIDATION ................................................................... 50
APPENDIX B: UNEMPLOYMENT INSURANCE DATA ................................... 51

UI PERFORMS ANNUAL REPORT PY 2006INTRODUCTION
This report is the ninth comprehensive UI Performs Annual Report. It is intended to give an overview of Unemployment Insurance operational performance at the national level for the
12 months ending March 31, 2006. Thus, it presents the results of key indicators of the full range of UI operational performance—benefits, appeals, tax and cash management. At various times, the Department may supplement this report with reports in greater depth on individual areas, or present the same material using a different format. Individual state data are no longer presented in this report, as they can be found on-line. Refer to Appendix B for the website URLs and a list of reports that are available. The technical definitions of key performance measures are now posted to the Office of Workforce Security (OWS) website at http://www.ows.doleta.gov/ unemploy/performance.asp.
The time period marks a change from previous reports. All previous UI Performs reports had been for calendar years, reflecting their development from the Benefit Accuracy Measurement annual reports. This report presents data aggregated for the year ending March 31. The period April 1 through March 31 defines both the performance year used for UI Performs State Quality Service Plan (SQSP) and also the “Validation year” used for UI Data Validation.
UI PERFORMS
UI Performs is the umbrella term adopted to designate the Department’s closed-loop system for promoting continuous improvement in UI operational performance. The goal of UI Performs is to ensure that the system’s ultimate customers—UI beneficiaries and subject employers—receive ever-increasing quality of services. Under UI Performs, states’ performance is evaluated largely on the basis of performance on key indicators, which have criteria that define acceptable minimum performance. States performing below a criterion during a “performance year” are expected to include a corrective action plan in their annual SQSP for the upcoming fiscal year. Three measurement systems provide most of the system’s key performance indicators: the Tax Performance System (TPS), which assesses the timeliness, accuracy, and completeness of the major tax functions; the Benefit Accuracy Measurement (BAM) program, which assesses the accuracy of benefit payments and of decisions to deny; and the Benefits Timeliness and Quality (BTQ) system, which provides measurements of the timeliness and quality of benefit claims, payment and appeals operations. The TPS and BTQ measures are compiled from a combination of aggregate counts data—mostly from UI required reports—and samples; BAM measures are all based on BAM samples. This report draws on the performance indicators from those systems.
The UI Performs system dates from 1999, and initially judged performance primarily using sixteen key measures, called Tier I measures, each of which had one or two criteria that defined acceptable minimum performance. In December 2002, ETA began a review of UI Performs which addressed: (a) the performance measures; (b) the criteria used to gauge success against the measures; and (c) the administration of UI Performs. The review included substantial consultation directly with State Workforce Agencies (SWAs) and indirectly through the National Association of State Workforce Agencies’ (NASWA) Subcommittee for UI Performs. Mathematica Policy Research, Inc., provided data analyses.
4
UI PERFORMS ANNUAL REPORT PY 2006INTRODUCTION
The consensus of the review was that the original UI Performs design was too complex for efficient administration. The large number of measures for which the SWAs were held accountable diffused management attention and excessively burdened the SWAs. In response, UI Performs was streamlined by:
§ Reducing the number of measures with performance criteria from 16 Tier I measures to 11 Core Measures. Unlike some of the Tier I measures, each Core Measure has only one criterion at which performance is measured.
§ Recognizing remaining measures as management information for which no performance goals will be set.
§ Streamlining the State Quality Service Plan (SQSP) narrative.
These changes are detailed in UIPL No. 14-05. The UIPL explains other changes made as a result of the 5-year review. These include the following changes in Core Measures:
Appeals Timeliness. Appeals timeliness is now measured by determining the average age of pending (undecided) appeals. States began reporting this measure in 2005; criteria for both lower authority and higher authority appeals will be set after sufficient data have been collected and analyzed. The standard for the percentage of cases decided within a time interval remains in regulation and the data will continue to be collected.
Detection of Overpayments. The Detection of Overpayments measure, developed as a Government Performance and Results Act (GPRA) indicator, is added as a Core Measure. To assure that the sample size is adequate to gauge individual state performance, the Core Measure is based on a three-year average. A criterion of 50% was announced in UIPL 14-05 Change 1 (October 12, 2005), to be effective in PY 2008 and with Corrective Action Plans (CAPs) for FY 2009. The measure also has an upper limit of 95% to flag potential reporting issues.
Facilitation of Beneficiary Reemployment. A new measure for facilitating reemployment of UI beneficiaries will be added. It will be based on a crossmatch of persons receiving first payments in one quarter with wage records for the following quarter. The first data were reported in Spring 2006. The criterion will be set after sufficient experience has accumulated and reporting issues have been resolved.
Nonmonetary Determinations. The nonmonetary determinations timeliness and quality measures were modified. There is now one measure for timeliness, the percentage of all determinations made within 21 days of date of detection, but there are separate quality measures for separation and nonseparation determinations.
5

UI PERFORMS ANNUAL REPORT PY 2006
States must still meet Secretary’s Standards criteria for first payment timeliness and lower authority appeals timeliness because these are included in regulation.
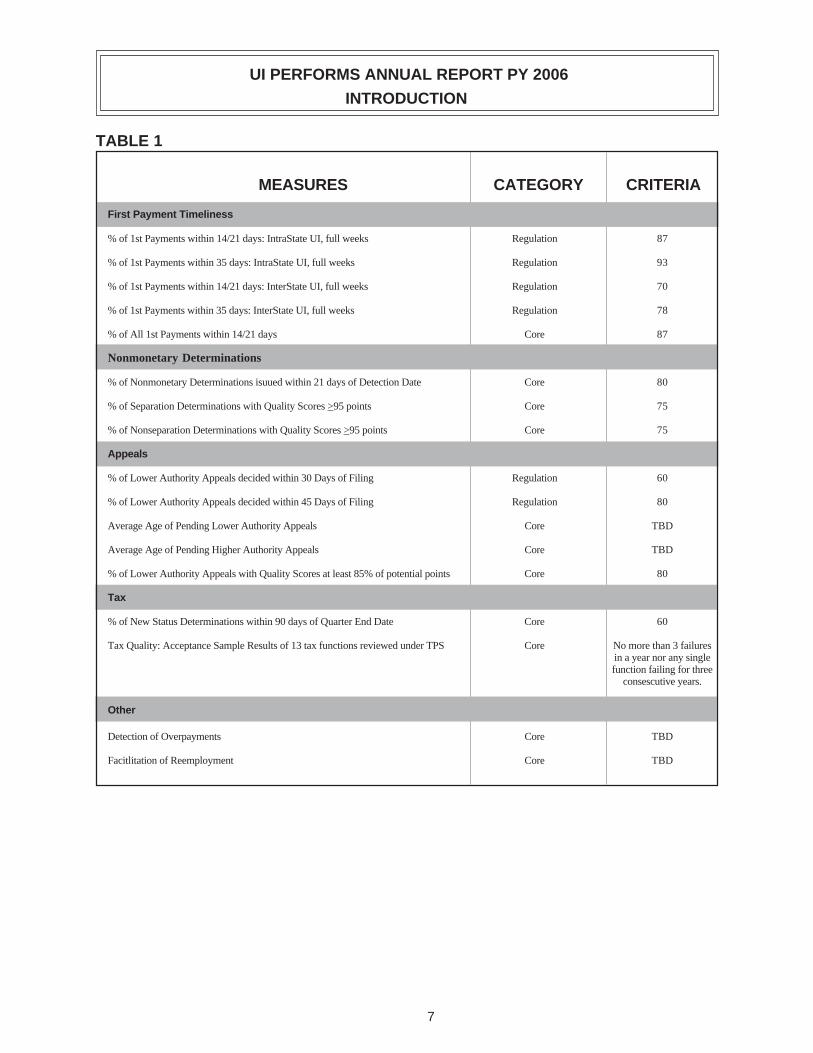
Table 1 (page 7) lists the resulting measures and criteria that were in effect during the 2006 performance year.
THE MAIN UNEMPLOYMENT INSURANCE MEASUREMENT SYSTEMS
Most of the UI performance measures use data from one of three measurement subsystems: Benefits Timeliness and Quality, Benefit Accuracy Measurement, and Tax Performance System. These were all developed to give a fuller view of state performance and thus better to permit the Department to exercise its role as a partner in ensuring that claimants and employers receive high-quality UI services.
The Department of Labor has the responsibility by law, as mandated in Title III of the Social Security Act, for assuring that State Workforce Agencies (SWAs) operate an effective and efficient unemployment insurance program. Various provisions of Federal law require that certain UI activities be performed promptly and accurately. Section 303(a)(1) of the Social Security Act requires, as a condition of a State’s receiving UI administrative grants, “[s]uch methods of administration . . . as are found by the Secretary of Labor to be reasonably calculated to insure full payment of unemployment compensation when due.”
The UI Performs measures computed using data from the BTQ, BAM, TPS and other administrative data systems represent the Department’s continuing effort to provide ever more accurate and useful information on the functioning of all UI program activities. These systems are designed and managed with certain considerations in mind, primarily:
Uniformity. Performance data are a major vehicle for program oversight. Thus the Department tries to ensure that all states adhere to standard methodologies and definitions so that results are statistically valid, are comparable from one state to another where possible, and present a consistent picture of state performance over time.
State and Federal Responsibilities. The states have the primary responsibility not only for conducting UI operations but also for efficiently implementing and administering measurement systems. The Federal responsibility is to ensure data integrity and consistency through the establishment of definitions and procedures; approve any changes in measurement methodology; establish monitoring procedures and operations; review samples of the cases investigated by the states; provide assistance and training to states; provide standard formats for data release; and evaluate results. The Federal responsibility also includes the analysis of data to diagnose problems with national implications or remedies and maintenance of a national database. The Federal partner provides technical assistance to states in case investigations, statistical theory, data analysis and use of applications software.
6
UI PERFORMS ANNUAL REPORT PY 2006
INTRODUCTION
TABLE 1
MEASURES CATEGORY CRITERIA
First Payment Timeliness
% of 1st Payments within 14/21 days: IntraState UI, full weeks Regulation 87
% of 1st Payments within 35 days: IntraState UI, full weeks Regulation 93
% of 1st Payments within 14/21 days: InterState UI, full weeks Regulation 70
% of 1st Payments within 35 days: InterState UI, full weeks Regulation 78
% of All 1st Payments within 14/21 days Core 87
Nonmonetary Determinations
% of Nonmonetary Determinations isuued within 21 days of Detection Date Core 80
% of Separation Determinations with Quality Scores >95 points
% of Nonseparation Determinations with Quality Scores >95 points
Core
Core
75
75
Appeals
% of Lower Authority Appeals decided within 30 Days of Filing Regulation 60
% of Lower Authority Appeals decided within 45 Days of Filing Regulation 80
Average Age of Pending Lower Authority Appeals Core TBD
Average Age of Pending Higher Authority Appeals Core TBD
% of Lower Authority Appeals with Quality Scores at least 85% of potential points Core 80
Tax
% of New Status Determinations within 90 days of Quarter End Date Core 60
Tax Quality: Acceptance Sample Results of 13 tax functions reviewed under TPS Core No more than 3 failures in a year nor any single function failing for three
consescutive years.
Other
Detection of Overpayments Core TBD
Facitlitation of Reemployment Core TBD
7
UI PERFORMS ANNUAL REPORT PY 2006INTRODUCTION
Program Improvement Orientation. The major value of performance data is their usefulness in improving UI operations. They are designed to support state program improvement strategies and help states evaluate the effects of previous attempts to improve operations by identifying where and why errors occur, and their extent. Reported data frequently need to be supplemented by other information if program improvements are to be structured. For this reason, the Department has encouraged states to undertake program improvement studies—analyses and/or data gathering studies intended to lead to program improvement actions.
Benefit Accuracy Measurement
BAM is a diagnostic tool based on random samples of UI payments that is used to identify and measure payment errors and measure the effect of previously initiated corrective actions. BAM’s premise is that dollars overpaid and underpaid can be estimated by projecting the results from a state’s BAM sample to its entire population of payments. The BAM program gathers information to assist states in developing program improvement plans to correct problems in their UI benefit payment systems and to enable them to measure the effects of implementing those plans. States also use this information in implementing policies to ensure accurate administration of their laws, regulations, and operating procedures. A complete description of the BAM program can be viewed at http://www.ows.doleta.gov/unemploy/bam/2005/bam-facts.asp.
Combined, the states completed investigations of 24,349 paid claims; 7,516 monetary denials; 7,797 separation denials; and 7,800 nonseparation denials in CY 2005.
The Operational Overpayment Rate
As part of its efforts to devise a payment accuracy measure for the (GPRA) goal of making accurate UI payments, in 2002 ETA developed the Operational Overpayment rate as an alternative to the “Annual Report” rate in constant use since 1987. The Operational rate was designed to provide an estimate of the overpayments that states could expect to detect and establish with normal integrity procedures. This estimate could then be related to overpayments actually established for recovery. The operational measure is calculated by removing from the annual report measure all non-recoverable overpayments as well as certain recoverable overpayments that are unlikely to be detectable with normal integrity procedures. The most important of the latter are those due to base period wage errors, work search, and failure to register with the Employment Service. The “detectable and recoverable” overpayments that remain are in some respects the most tangible and least “technical” overpayments. Studies have shown that they are the overpayments states can deal with most cost-effectively—mostly by more intensive efforts to detect and establish, but also to prevent, e.g., through crossmatches with the State and National Directories of New Hires.
8
UI PERFORMS ANNUAL REPORT PY 2006INTRODUCTION
Benefits Timeliness and Quality
Time lapse is calculated from special reports that provide counts of payments, nonmonetary determinations, and appeals decisions by time-lapse intervals. Measures based on samples are used to track the quality of SWA nonmonetary determinations and lower authority appeals.
BTQ Quality Reveiw Methodology
� The universe of determinations includes all issues with the potential to affect the claimant’s present or future benefit eligibility.
� The quality samples of nonmonetary determinations and lower authority appeals are drawn by computer program from time-lapse report universes, ensuring that the samples are drawn randomly from universes that include all determinations and appeals.
� In addition to the decision, the review instrument for assessing the quality of nonmonetary determinations gives additional weight to the quality of the written determination.
� The database for the quality scores is a micro database—enabling analysis of individual cases and individual quality elements.
� Nonmonetary adjudications are subjected to a tripartite review each quarter. The third party serves as a tie-breaker if the other two reviewers disagree.
� The state’s automated system furnishes information about the records selected for review, including the date of the nonmonetary determination, the program, and the issue. The quality reviewer adds further information during the review process, including scores for quality criteria and the date that the result of the nonmonetary determination or appeal decision was applied to the claim. Completed review data are entered into the UI automated data base, from which scores for individual records and overall scores for quarterly state performance are computed.
� State sample sizes for quality reviews are based on the activity levels reported in the preceding calendar year. For nonmonetary determinations, the cutoff is 100,000: States reporting fewer than 100,000 determinations draw quality samples of at least 60 (30 separations, 30 nonseparations) each quarter; for others samples are 100 (50/50) each quarter. For the lower authority appeals quality review, states with 40,000 or more appeals decisions in the previous calendar year sample 40 appeals per quarter; other sample 20 decisions. States may draw larger samples if they wish.
9
UI PERFORMS ANNUAL REPORT PY 2006INTRODUCTION
Tax Performance System
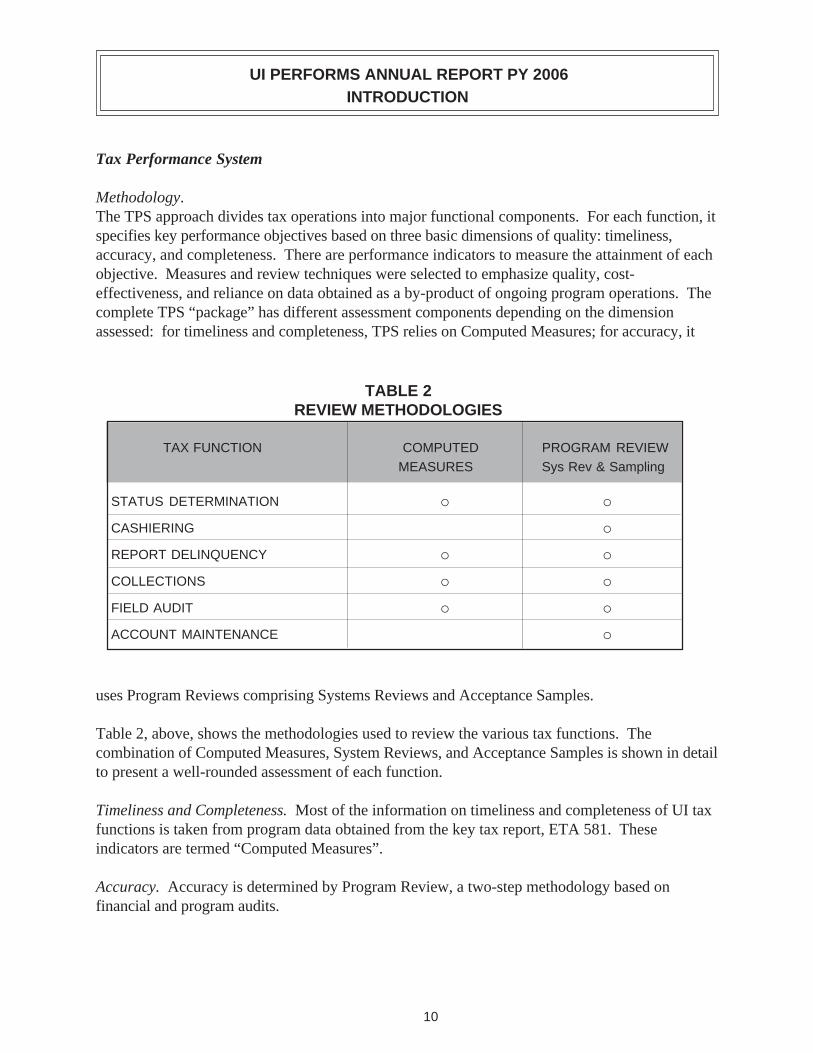
Methodology. The TPS approach divides tax operations into major functional components. For each function, it specifies key performance objectives based on three basic dimensions of quality: timeliness, accuracy, and completeness. There are performance indicators to measure the attainment of each objective. Measures and review techniques were selected to emphasize quality, cost-effectiveness, and reliance on data obtained as a by-product of ongoing program operations. The complete TPS “package” has different assessment components depending on the dimension assessed: for timeliness and completeness, TPS relies on Computed Measures; for accuracy, it
TABLE 2 REVIEW METHODOLOGIES
TAX FUNCTION COMPUTED PROGRAM REVIEW MEASURES Sys Rev & Sampling
STATUS DETERMINATION o o
CASHIERING o
REPORT DELINQUENCY o o
COLLECTIONS o o
FIELD AUDIT o o
ACCOUNT MAINTENANCE o
uses Program Reviews comprising Systems Reviews and Acceptance Samples.
Table 2, above, shows the methodologies used to review the various tax functions. The combination of Computed Measures, System Reviews, and Acceptance Samples is shown in detail to present a well-rounded assessment of each function.
Timeliness and Completeness. Most of the information on timeliness and completeness of UI tax functions is taken from program data obtained from the key tax report, ETA 581. These indicators are termed “Computed Measures”.
Accuracy. Accuracy is determined by Program Review, a two-step methodology based on financial and program audits.
10
UI PERFORMS ANNUAL REPORT PY 2006
INTRODUCTION
Systems Review. Staff first review each tax function thoroughly to ensure that all internal controls are in place. Unless a problem is indicated, or a program change has been initiated, these reviews only take place once every four years.
Acceptance Sample. To ensure that the internal controls are operating as intended to produce timely and accurate outputs, every year a sample of completed work is examined.
The reviewer extracts a small “Acceptance Sample” of sixty cases from each tax function’s output and examines it for accuracy. Failure of three or more cases out of the sample will cause the entire sample to fail, leading to the conclusion that there is not “reasonable assurance” that the function is operating with acceptable accuracy.
The combination of a thorough front-end review and a small acceptance sample efficiently establishes a reasonable assurance of accuracy, directly identifies any areas of program weakness, and immediately indicates where program improvements are needed. If there is a need to know the actual level of a particular tax function’s problem, the Acceptance Sample can be readily expanded into a much larger Estimation Sample.
Benefit Payment Control
As discussed under “The Operational Overpayment Rate” section above, as part of the UI Performs review that began in 2002, ETA developed a performance indicator which uses the BAM operational rate as a component. It measures the detection of recoverable overpayments, which is one of four UI performance goals for GPRA. This measure, detection of overpayments, is also a Core Measure for UI Performs, the UI performance management system.
The detection of overpayments measure is the percentage of recoverable, detectable overpayments estimated by BAM that state Benefit Payment Control (BPC) operations establish for recovery.
Overpayment Detection Measure = Overpayments Established (BPC) Estimated Overpayments (BAM)
The operational rate represents that portion of total overpayments that typical state BPC operations should be able to detect and establish for recovery. The operational rate was defined following an extensive analysis of BAM overpayment data.
11
UI PERFORMS ANNUAL REPORT PY 2006INTRODUCTION
Data Validation
During the mid-1990s, as part of the Performance Measurement Review project, the Department of Labor began developing a Data Validation (DV) system to validate key benefit reports data. Its methodology was built on concepts used since the 1970s in the Workload Validation system that validated the “workload” report elements used to allocate UI administrative resources. The DV system was expanded in the late 1990s to include validation of tax report data. Unemployment Insurance Program Letter (UIPL) 22-05 (April 28, 2005) established a “validation year” (VY) cycle for the completion of UIDV. To facilitate the introduction of the new cycle, all DV results of UI reports for periods through March 31, 2005, were considered part of VY 2005, the first validation year under the new cycle.
New DV software that runs on the state Sun machines used for UI reporting was released in early 2005. The validation software is being updated and states have been instructed not to submit results using the software during VY 2007 when the software revision is being developed and tested. Because of software glitches, states were also given the option not to submit VY 2006 results. Many did submit results, however. This Annual Report gives the cumulative UI DV status through VY 2006.
12

UI PERFORMS ANNUAL REPORT PY 2006NATIONAL REPORT
This chapter is divided into four main sections. The first section presents a brief overview of the recent economic conditions and the resultant movement in certain UI tax and
benefit activities. The second shows the movement of major benefit payment activities and then reviews the national pattern of selected key benefit payment performance indicators. The third section approaches tax activities in the same way. The fourth section examines the data validation program.
ECONOMIC ACTIVITY AND MAJOR PROGRAM ACTIVITIES
In PY 2006 the total unemployment rate (TUR) dropped to an average of 4.9%. The insured unemployment rate (IUR) experienced a similar down shift to 2.1%. Since the most recent recession high of 7.4% in PY 1993 the TUR had been in a steady decline, until experiencing an upswing in PY 2002. The movement in the IUR, which peaked in 1992, has been similar but less pronounced.
Benefit payments continued to recede from their 2003 high of nearly $40 billion to $29 billion in 2006. Contributions continued to climb as states worked to offset the dramatic rise in benefits paid since 2002. States collected $1.21 for every dollar paid in benefits.
ECONOMIC CONDITIONS PYs 1991 - 2006
Billions
0%
2%
4%
6%
8%
$5
$15
$25
$35
$45
1 2 3 4 5 6 7 8 9 0 1 2 3 4 5 69 9 9 9 9 9 9 9 9 0 0 0 0 0 0 09 9 9 9 9 9 9 9 9 0 0 0 0 0 0 01 1 1 1 1 1 1 1 1 2 2 2 2 2 2 2
Total Unemployment Rate (%) Insured Unemployment Rate (%)
UI Contributions ($) UI Benefits ($)
13
UI PERFORMS ANNUAL REPORT PY 2006 NATIONAL REPORT
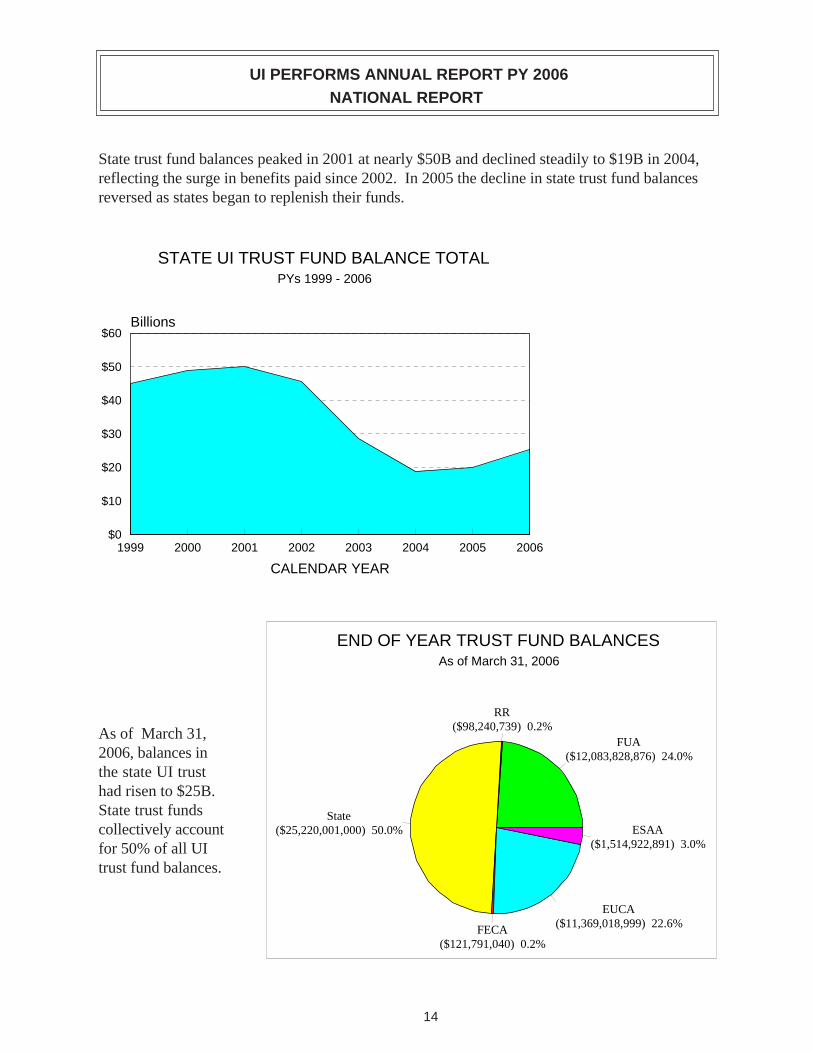
State trust fund balances peaked in 2001 at nearly $50B and declined steadily to $19B in 2004, reflecting the surge in benefits paid since 2002. In 2005 the decline in state trust fund balances reversed as states began to replenish their funds.
STATE UI TRUST FUND BALANCE TOTAL PYs 1999 - 2006
$0
$10
$20
$30
$40
$50
$60 Billions
1999 2000 2001 2002 2003 2004 2005 2006
CALENDAR YEAR
As of March 31, 2006, balances in the state UI trust had risen to $25B. State trust funds collectively account for 50% of all UI trust fund balances.
24.0%
RR 0.2%
50.0%
FECA 0.2%
EUCA 22.6%
3.0%
END OF YEAR TRUST FUND BALANCES As of March 31, 2006
FUA ($12,083,828,876)
($98,240,739)
State ($25,220,001,000)
($121,791,040)
($11,369,018,999)
ESAA ($1,514,922,891)
14

UI PERFORMS ANNUAL REPORT PY 2006NATIONAL REPORT
BENEFIT PAYMENT ACTIVITY
In 2006, unemployment insurance offices handled approximately 10.6 million new initial claims under the regular State UI, UCFE, and UCX programs. Approximately 2.8 million claimants were determined to be ineligible for monetary or separation reasons, or found new jobs before filing a first week claimed, so that ultimately about 7.8 million claimants actually received a first payment. Additional initial claims, over the same period, track first payments closely because they represent occasions when claimants’ benefit payment series were broken by intervening spells of employment. Each additional initial claim filed to resume benefit payments requires the agency to review the reason for separation (but not the monetary eligibility) and may lead to the identification and adjudication of a separation issue.
More striking than the movement in initial claims has been the path of continued weeks claimed. The level of continued weeks claimed depends both on the number of first payments and on the average number of claims filed per benefit year. Economic conditions drive both components of weeks claimed. After remaining fairly level from 1998 to 2001, the number rose sharply in 2002 and peaked at 167 million in 2003. Since then the number of continued weeks claimed has continued to decline, dropping to 121 million in 2006, but still well above the 1998-2001 level.
CLAIMS ACTIVITY PYs 1998 - 2006
0
4
8
12
16 Millions
0
50
100
150
200 Millions
8 9 0 1 2 3 4 5 69 9 0 0 0 0 0 0 09 9 0 0 0 0 0 0 01 1 2 2 2 2 2 2 2
Additional Initial Claims
laims
i
First Payments
New Initial C
Continued Weeks Paid (r ght axis)
15
UI PERFORMS ANNUAL REPORT PY 2006 NATIONAL REPORT
AVERAGE WEEKS OF DURATION PYs 1998 - 2006
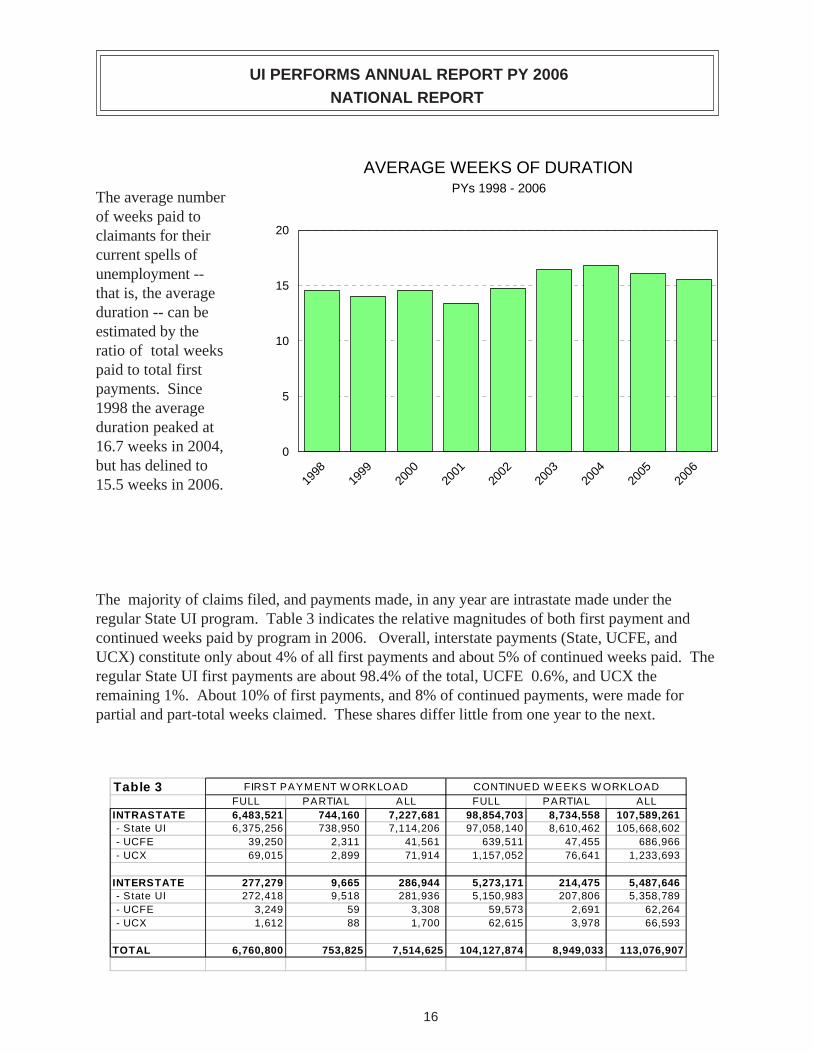
The average number of weeks paid to claimants for their 20
current spells of unemployment -that is, the average 15
duration -- can be estimated by the
10ratio of total weeks paid to total first payments. Since 5 1998 the average duration peaked at 16.7 weeks in 2004, 0 but has delined to 15.5 weeks in 2006.
8 9 0 1 2 3 4 59 9 0 0 0 0 0 09 9 0 0 0 0 0 01 1 2 2 2 2 2 2 2
The majority of claims filed, and payments made, in any year are intrastate made under the regular State UI program. Table 3 indicates the relative magnitudes of both first payment and continued weeks paid by program in 2006. Overall, interstate payments (State, UCFE, and UCX) constitute only about 4% of all first payments and about 5% of continued weeks paid. The regular State UI first payments are about 98.4% of the total, UCFE 0.6%, and UCX the remaining 1%. About 10% of first payments, and 8% of continued payments, were made for partial and part-total weeks claimed. These shares differ little from one year to the next.
Table 3 FIRST PAYMENT W ORKLOAD CONTINUED W EEKS W ORKLOAD FULL PARTIAL ALL FULL PARTIAL ALL
INTRASTATE 6,483,521 744,160 7,227,681 98,854,703 8,734,558 107,589,261 - State UI 6,375,256 738,950 7,114,206 97,058,140 8,610,462 105,668,602 - UCFE 39,250 2,311 41,561 639,511 47,455 686,966 - UCX 69,015 2,899 71,914 1,157,052 76,641 1,233,693
INTERSTATE 277,279 9,665 286,944 5,273,171 214,475 5,487,646 - State UI 272,418 9,518 281,936 5,150,983 207,806 5,358,789 - UCFE 3,249 59 3,308 59,573 2,691 62,264 - UCX 1,612 88 1,700 62,615 3,978 66,593
TOTAL 6,760,800 753,825 7,514,625 104,127,874 8,949,033 113,076,907
16
006
orm
UI PERFORMS ANNUAL REPORT PY 2006
NATIONAL REPORT
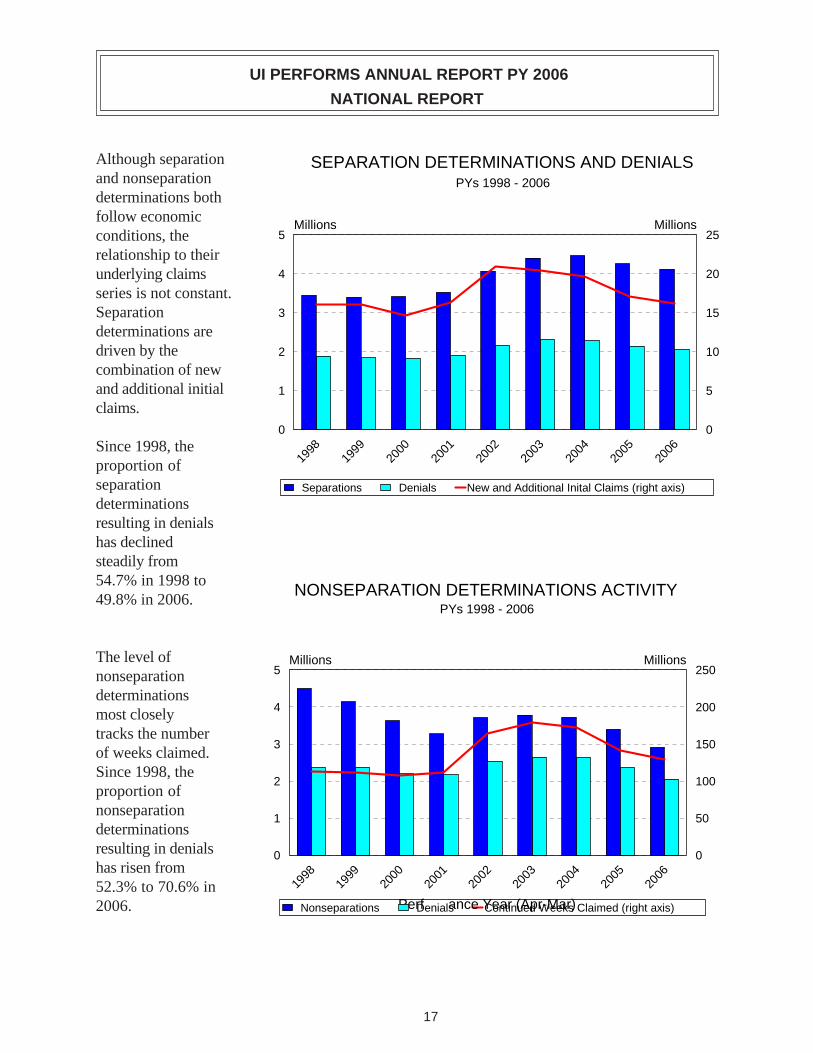
Although separation SEPARATION DETERMINATIONS AND DENIALS and nonseparation PYs 1998 - 2006 determinations both follow economic conditions, the 5
Millions Millions25
relationship to their underlying claims 4 20
series is not constant. Separation 3 15
determinations are driven by the 2 10
combination of new and additional initial 1 5
claims. 0 0
8 9 0 1 2 3 4 5 6Since 1998, the proportion of separation determinations resulting in denials has declined steadily from 54.7% in 1998 to
ions i i i i Separat Denials New and Addit onal In tal Claims (r ght ax s)
9 9 0 0 0 0 0 0 09 9 0 0 0 0 0 0 01 1 2 2 2 2 2 2 2
NONSEPARATION DETERMINATIONS ACTIVITY 49.8% in 2006.
PYs 1998 - 2006
The level of Millions Millionsnonseparation determinations most closely tracks the number of weeks claimed. Since 1998, the proportion of nonseparation determinations resulting in denials 0
1
2
3
4
5
0
50
100
150
200
250
has risen from 52.3% to 70.6% in
8 9 0 1 2 3 4 5 69 9 0 0 0 0 0 0 09 9 0 0 0 0 0 0 01 1 2 2 2 2 2 2 2
2006. Perfions Conti i iance Year (Apr-Mar) Nonseparat Denials nued Weeks Claimed (r ght ax s)
17

UI PERFORMS ANNUAL REPORT PY 2006
NATIONAL REPORT
Most appeals are filed by claimants, upon receiving a denial for either separation or nonseparation reasons. Historically, more than half of all nonmonetary determinations result in a denial. In 2006, 4.1million nonmonetary determinations, about 58% of the total, were denied. Almost 30% of those denials went to a first-level appeal, and of those about 14% went to a higher-authority appeal. Between 1998 and 2001 the number of lower-authority appeals filed had been declining yearly. The number of lower-authority appeals in 2004 was 53% higher than in 2001, reflecting the rise in nonmonetary deteminations.
APPEALS ACTIVITY Number of Single and Multi-Claimant Appeals Filed
PYs 1998 - 2006
Thousands
0
200
400
600
800
1000
1200
1400
1600
8 9 0 1 2 3 4 5 69 9 0 0 0 0 0 0 09 9 0 0 0 0 0 0 01 1 2 2 2 2 2 2 2i i Lower Author ty Appeals Higher Author ty Appeals
BENEFIT PAYMENT PERFORMANCE
First Payment Timeliness
One of the UI system’s critical measures is first payment time lapse. Criteria, set on a measure of the timeliness of full weeks of unemployment only, have been established to implement the Secretary’s Standards for first payments made within 14/21 days and 35 days for both intrastate and interstate payments since 1978. The 14/21 day level national timeliness performance has experienced a general down trend since 1998. Interstate performance on the other hand, had been on a rising trend since 1998 only to decline significantly in 2006.
18
UI PERFORMS ANNUAL REPORT PY 2006
NATIONAL REPORT
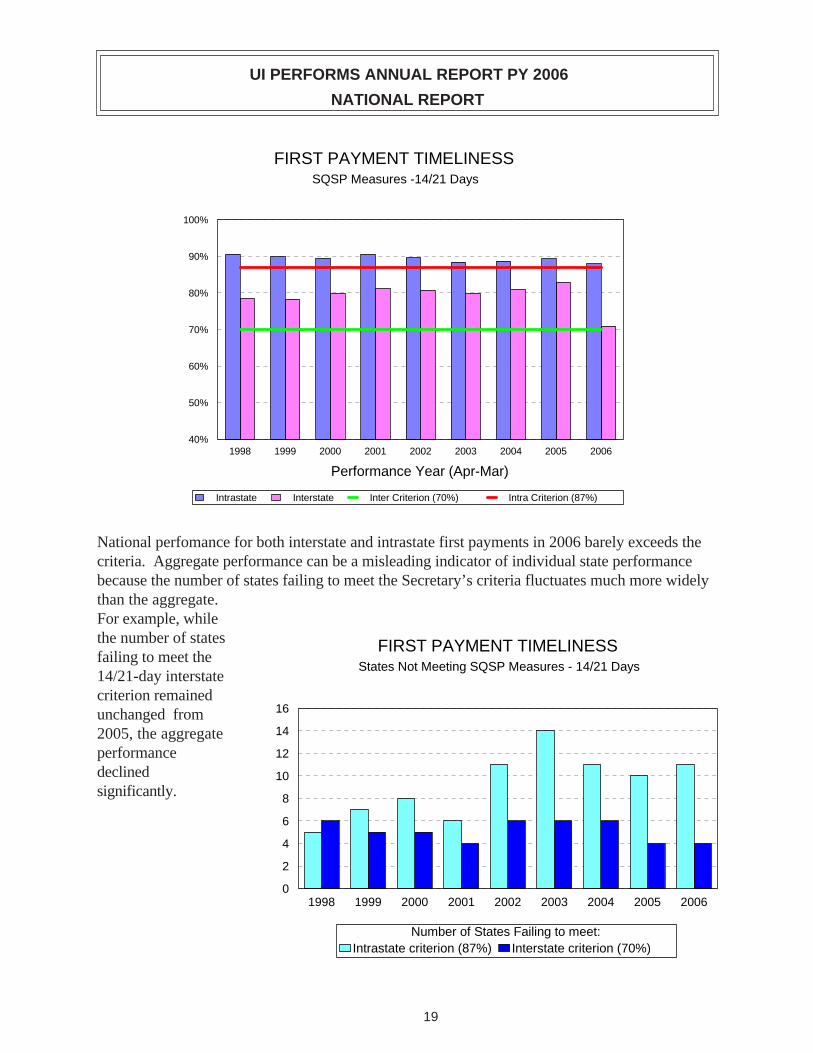
FIRST PAYMENT TIMELINESS SQSP Measures -14/21 Days
100%
90%
80%
70%
60%
50%
40% 1998 1999 2000 2001 2002 2003 2004 2005 2006
Performance Year (Apr-Mar)
i i i i Intrastate Interstate Inter Cr ter on (70%) Intra Cr ter on (87%)
National perfomance for both interstate and intrastate first payments in 2006 barely exceeds the criteria. Aggregate performance can be a misleading indicator of individual state performance because the number of states failing to meet the Secretary’s criteria fluctuates much more widely than the aggregate. For example, while the number of states FIRST PAYMENT TIMELINESS failing to meet the 14/21-day interstate
States Not Meeting SQSP Measures - 14/21 Days
criterion remained unchanged from 16
2005, the aggregate 14
performance 12
declined 10 significantly. 8
6
4
2
0 1998 1999 2000 2001 2002 2003 2004 2005 2006
Number of States Failing to meet: Intrastate criterion (87%) Interstate criterion (70%)
19
UI PERFORMS ANNUAL REPORT PY 2006
NATIONAL REPORT
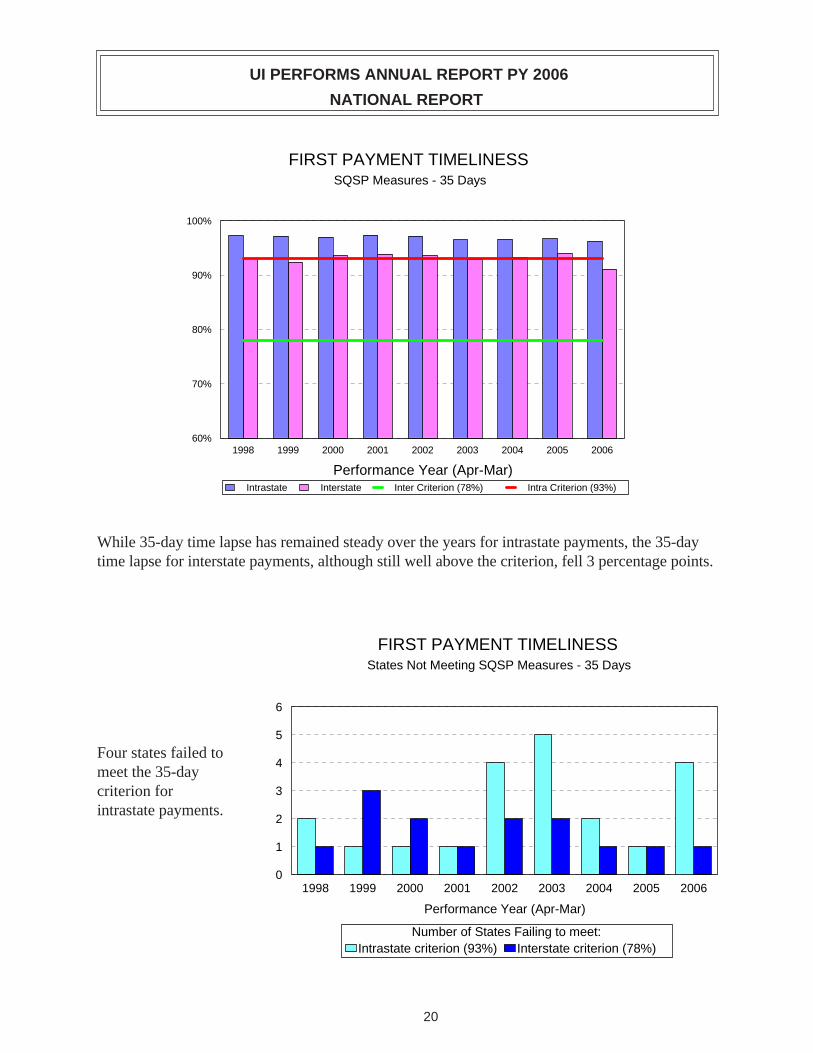
FIRST PAYMENT TIMELINESS SQSP Measures - 35 Days
100%
90%
80%
70%
60% 1998 1999 2000 2001 2002 2003 2004 2005 2006
Performance Year (Apr-Mar) i i i i Intrastate Interstate Inter Cr ter on (78%) Intra Cr ter on (93%)
While 35-day time lapse has remained steady over the years for intrastate payments, the 35-day time lapse for interstate payments, although still well above the criterion, fell 3 percentage points.
FIRST PAYMENT TIMELINESS States Not Meeting SQSP Measures - 35 Days
6
5
Four states failed to 4
meet the 35-day criterion for 3
intrastate payments. 2
1
01998 1999 2000 2001 2002 2003 2004 2005 2006
Performance Year (Apr-Mar)
Number of States Failing to meet: Intrastate criterion (93%) Interstate criterion (78%)
20

UI PERFORMS ANNUAL REPORT PY 2006
NATIONAL REPORT
National performance in the timeliness of UCFE first payments continues to climb from its low point in 2004. UCX payment timeliness has trended downward since 1998.
FIRST PAYMENT TIMELINESS PYs 1998-2006 Trend, 14/21 Days
100%
90%
80%
70%
60% 1998 1999 2000 2001 2002 2003 2004 2005 2006
Performance Year (Apr-Mar)
The Core measure for Timeliness of First Payments is a combined measure including interstate, intrastate, UCX, UCFE and state payments, partial and full weeks. The 2006 measure at 87.2% barely surpassed the Acceptable Level of Performance (ALP) of 87%.
All UCFE First Payments All UCX First Payments
FIRST PAYMENT TIMELINESS All Payments
100%
95%
90%
85%
80% 1998 1999 2000 2001 2002 2003 2004 2005 2006
14/21 Days 35 Days Acceptable Level of Performance (87%)
21

UI PERFORMS ANNUAL REPORT PY 2006
NATIONAL REPORT
Continued Weeks Timeliness
CONTINUED PAYMENT TIMELINESS PY 2006
7 days
14 days
Intrastate
Interstate
Overall, states paid 21 days about 65% of
intrastate continued claims within 7 days in
28 days
35 days 2006, and over 93%
42 days within two weeks.
49 days Interstate 56 days performance is a bit 63 days higher at the 7-day
interval at 67%, but lower after 14 days at
70 days
>70 days 89%.
60% 70% 80% 90% 100%
CONTINUED PAYMENT TIMELINESS PYs 1998 - 2006
100%
80% National timelapseperformance for all 60%continued paymentshas drifted upward 40%
from 1998 to 2006in the 7-day 20%
category.0%
1998 1999 2000 2001 2002 2003 2004 2005 2006
Performance Year (Apr-Mar)
% of Continued Weeks Paid within: 7 days 8-14 days 15-21 days over 21 days
22

UI PERFORMS ANNUAL REPORT PY 2006
NATIONAL REPORT
Nonmonetary Determinations Timeliness
Aggregate nonmonetary determination timeliness performance--the percent of separation and nonseparation determinations made within 21 days of the date the state detected an issue--has been below the 80% criterion since 1999. National NONMONETARY DETERMINATIONS performance in 2006 DECISION TIMELINESS at 73.3% was over 6 Separations and Nonseparations - 21 Days percentage points below the criterion. 100% The next chart shows the pattern of
80% decision time lapse for issuing both kinds of 60%
determinations at different intervals in 40%
2006. Over 35% of nonseparation issues 20% were decided within the first week after
0% detection, versus 1998 1999 2000 2001 2002 2003 2004 2005 2006 only 8.7% of separations (nearly
Performance Year (Apr-Mar)
all separations require NONMONETARY DETERMINATIONS DECISION TIMELINESS obtaining information
PY 2006 from employers). The percentages of nonseparation
100%
determinations issued, at both the 14-day and 21
80%
day intervals, exceeded those for separations.
60%
At 28 days and longer, however, states had
40%
issued a higher percentage of separation
20%
than nonseparation0% 7 Days 14 Days 21 Days 28 Days 35 Days 42 Days determinations.
ions ions Nonseparat Separat
23
UI PERFORMS ANNUAL REPORT PY 2006
NATIONAL REPORT
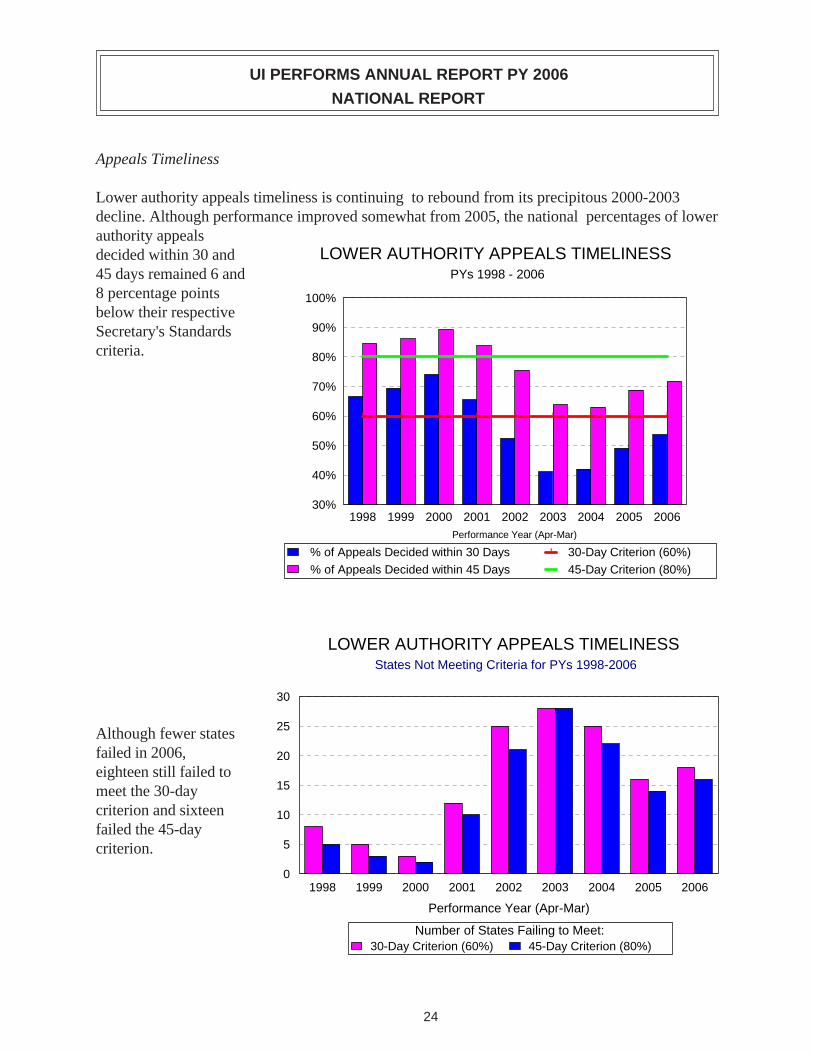
Appeals Timeliness
Lower authority appeals timeliness is continuing to rebound from its precipitous 2000-2003 decline. Although performance improved somewhat from 2005, the national percentages of lower authority appeals decided within 30 and LOWER AUTHORITY APPEALS TIMELINESS 45 days remained 6 and PYs 1998 - 2006
8 percentage points below their respective Secretary's Standards criteria.
100%
90%
80%
70%
60%
50%
40%
30%
' '' ' ' ' ' ' '
1998 1999 2000 2001 2002 2003 2004 2005 2006 Performance Year (Apr-Mar)
i
i' % of Appeals Decided w thin 30 Days 30-Day Criterion (60%)
% of Appeals Decided w thin 45 Days 45-Day Criterion (80%)
LOWER AUTHORITY APPEALS TIMELINESS States Not Meeting Criteria for PYs 1998-2006
30
Although fewer states 25
failed in 2006, 20 eighteen still failed to meet the 30-day 15
criterion and sixteen 10 failed the 45-day criterion. 5
0 1998 1999 2000 2001 2002 2003 2004 2005 2006
Performance Year (Apr-Mar)
iliNumber of States Fa ng to Meet: 30-Day Criterion (60%) 45-Day Criterion (80%)
24

UI PERFORMS ANNUAL REPORT PY 2006
NATIONAL REPORT
A new core measure, the average age of pending appeals, addresses the performance issue of states maintaining significant appeals backlogs. This appears to be more of an issue with higher authority appeals (HAA) than lower authority appeals Average Age of Pending Appeals
(LAA). Ten PY 2006 states have an NUMBER OF STATES
average age of i
Hi iLower Author ty Appeals
gher Author ty Appeals
23
over 60 days for 21
HAA, compared to 18
4 states for LAA. The average age of pending lower authority appeals
10is 20 days or less for 23 states, and 7 7
40 days or less in 41 states. 3
2 1 1
0
measures of how Supplementing the
0-20 days 21-40 days 41-60 days 61-80 days 81-100 days >100 days
quickly states Average Age
decide appeals is the age of undecided or LOWER AUTHORITY APPEALS CASE AGING pending Age of Appeals Pending at End of Calendar Year appeals at the end of the year. The next chart shows that at the end of 2006, over 54% of all undecided Lower Authority appeals were less than 25 days old (and
100%
80%
60%
40%
20%
0%
<= 25 Days
26-40 Days
41-90 Days
91-120 Days
121-180 Days
181-360 Days
> 360 Days
hence were 1998 1999 2000 2001 2002 2003 2004 2005 2006 still likely to Performance Year (Apr-Mar)
25
7
UI PERFORMS ANNUAL REPORT PY 2006 NATIONAL REPORT
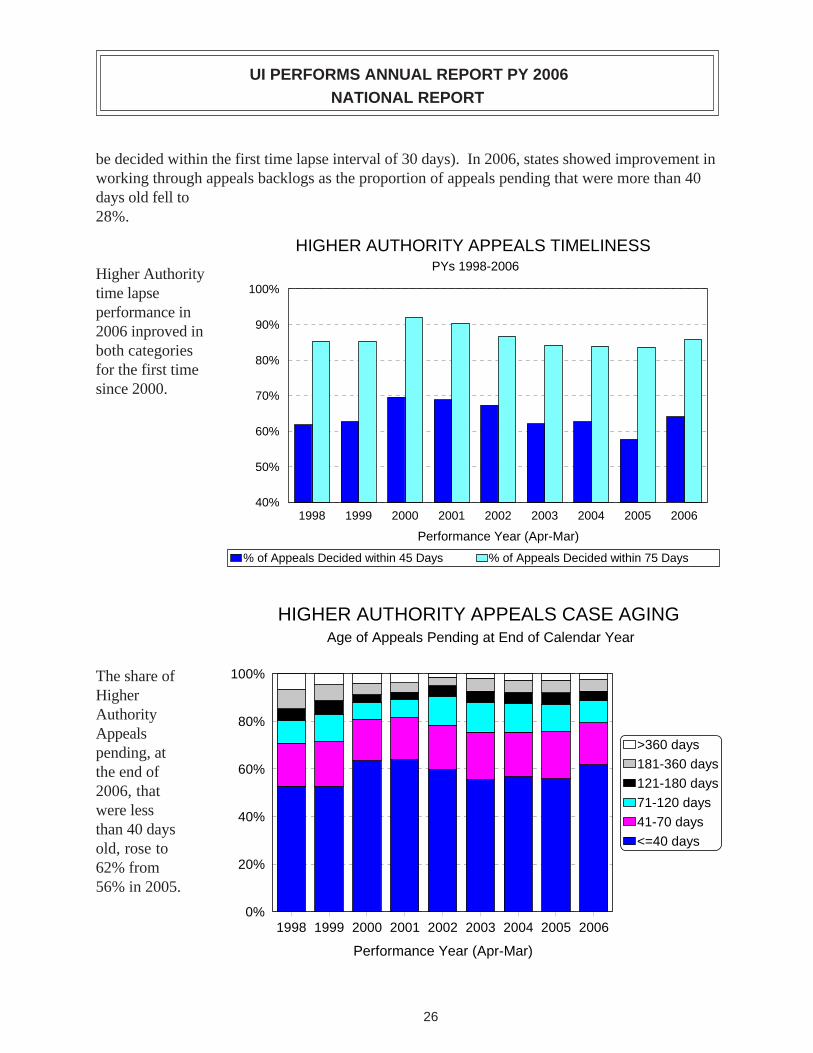
be decided within the first time lapse interval of 30 days). In 2006, states showed improvement in working through appeals backlogs as the proportion of appeals pending that were more than 40 days old fell to 28%.
HIGHER AUTHORITY APPEALS TIMELINESS
Higher Authority PYs 1998-2006
time lapse 100%
performance in2006 inproved in 90%
both categories80%
for the first time since 2000. 70%
60%
50%
40% 1998 1999 2000 2001 2002 2003 2004 2005 2006
Performance Year (Apr-Mar)
i i% of Appeals Decided w thin 45 Days % of Appeals Decided w thin 75 Days
HIGHER AUTHORITY APPEALS CASE AGING Age of Appeals Pending at End of Calendar Year
The share of Higher Authority Appeals pending, at the end of 2006, that were less than 40 days old, rose to 62% from 56% in 2005.
100%
80%
60%
40%
20%
0%
<=40 days
41-70 days
71-120 days
121-180 days
181-360 days
>360 days
1998 1999 2000 2001 2002 2003 2004 2005 2006
Performance Year (Apr-Mar)
26
UI PERFORMS ANNUAL REPORT PY 2006NATIONAL REPORT
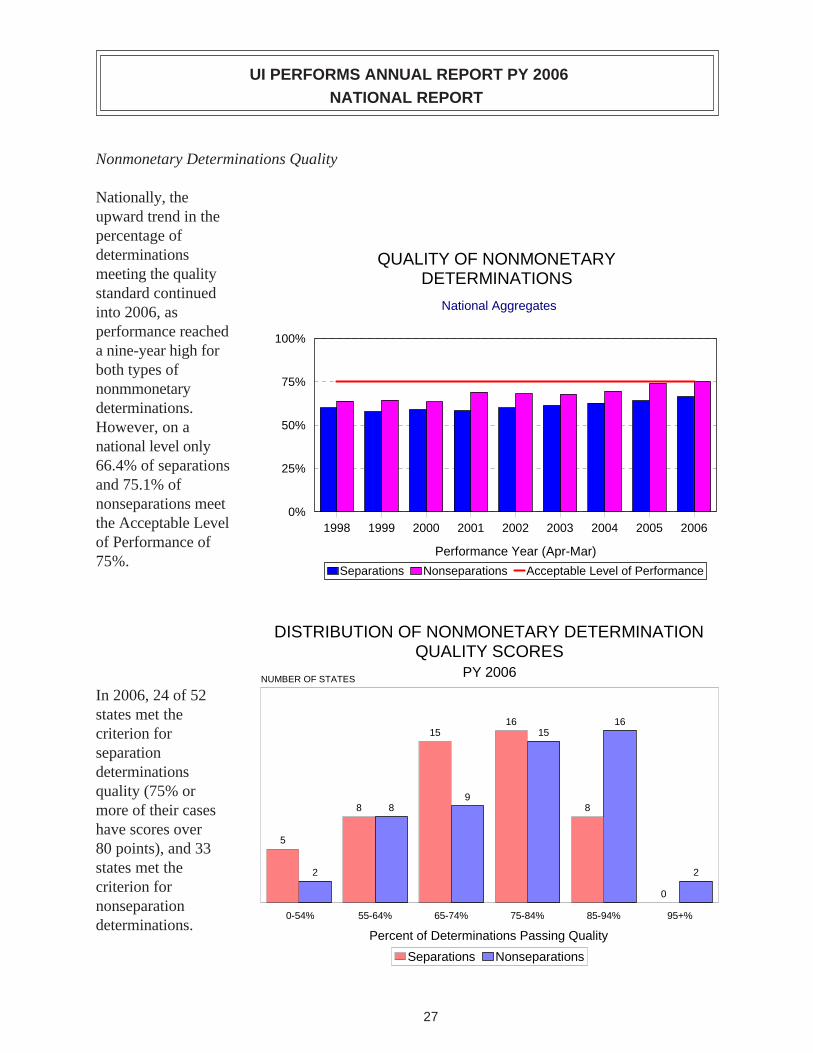
Nonmonetary Determinations Quality
Nationally, the upward trend in the percentage of determinations QUALITY OF NONMONETARY meeting the quality DETERMINATIONS standard continued into 2006, as National Aggregates
performance reached 100%a nine-year high forboth types of
75%nonmmonetarydeterminations.However, on a 50%
national level only66.4% of separations 25%and 75.1% ofnonseparations meet
0%the Acceptable Level 1998 1999 2000 2001 2002 2003 2004 2005 2006 of Performance of
Performance Year (Apr-Mar) 75%.
Separations Nonseparations Acceptable Level of Performance
DISTRIBUTION OF NONMONETARY DETERMINATION QUALITY SCORES
PY 2006 NUMBER OF STATES
In 2006, 24 of 52 states met the criterion for separation determinations quality (75% or more of their cases have scores over 80 points), and 33 states met the criterion for nonseparation
5
8
15 16
8
0
2
8 9
15 16
2
0-54% 55-64% 65-74% 75-84% 85-94% 95+% determinations.
Percent of Determinations Passing Quality
Separations Nonseparations
27
UI PERFORMS ANNUAL REPORT PY 2006NATIONAL REPORT
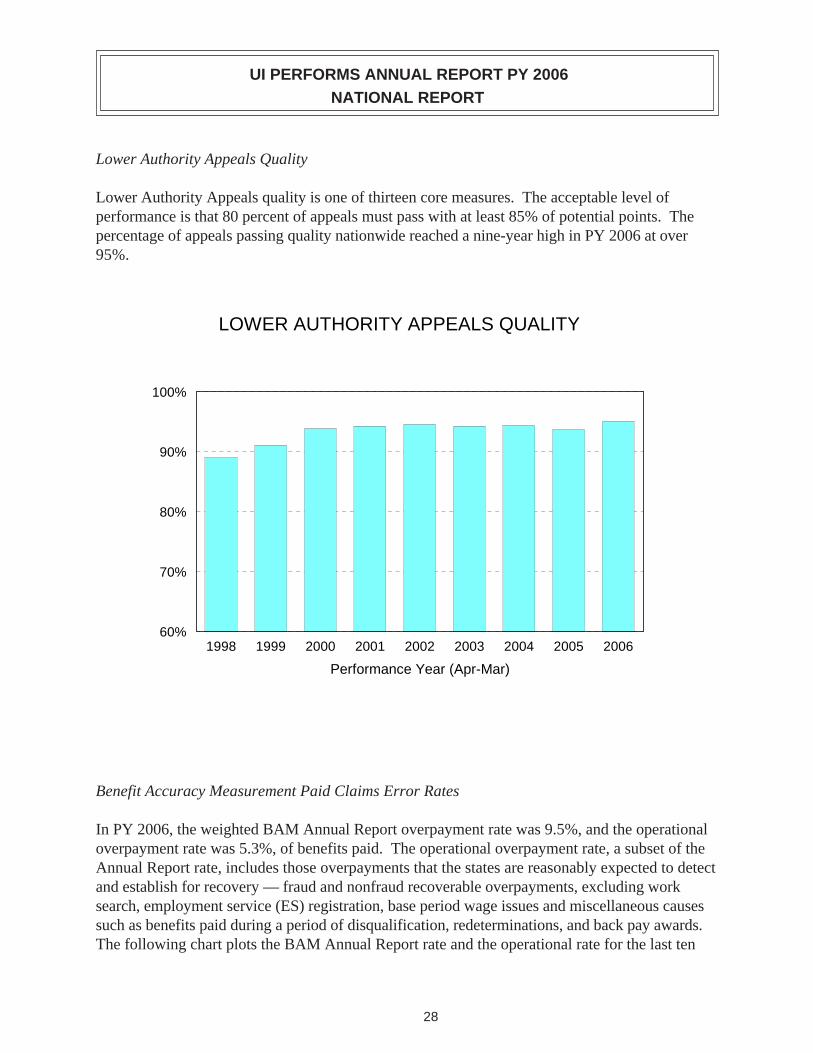
Lower Authority Appeals Quality
Lower Authority Appeals quality is one of thirteen core measures. The acceptable level of performance is that 80 percent of appeals must pass with at least 85% of potential points. The percentage of appeals passing quality nationwide reached a nine-year high in PY 2006 at over 95%.
LOWER AUTHORITY APPEALS QUALITY
100%
90%
80%
70%
60% 1998 1999 2000 2001 2002 2003 2004 2005 2006
Performance Year (Apr-Mar)
Benefit Accuracy Measurement Paid Claims Error Rates
In PY 2006, the weighted BAM Annual Report overpayment rate was 9.5%, and the operational overpayment rate was 5.3%, of benefits paid. The operational overpayment rate, a subset of the Annual Report rate, includes those overpayments that the states are reasonably expected to detect and establish for recovery — fraud and nonfraud recoverable overpayments, excluding work search, employment service (ES) registration, base period wage issues and miscellaneous causes such as benefits paid during a period of disqualification, redeterminations, and back pay awards. The following chart plots the BAM Annual Report rate and the operational rate for the last ten
28

UI PERFORMS ANNUAL REPORT PY 2006NATIONAL REPORT
years. Because the operational rate is more narrowly focused than the Annual Report rate, it is less likely to fluctuate from year to year. Since 2002 the operational overpayment rate has trended upward to a highpoint of 5.3% in 2006, while dollars overpaid fell to $1.6B.
BENEFIT ACCURACY MEASUREMENT National Estimates PYs 1998 - 2006
Billions12% 4
9% 3
6% 2
3% 1
0% 0
8 9 0 1 2 3 4 5 69 9 0 0 0 0 0 0 09 9 0 0 0 0 0 0 01 1 2 2 2 2 2 2 2
ll ll
Annual Report Overpayment Rate Operational Overpayment Rate
Do ars Overpaid (AR Rate) Do ars Overpaid (OP Rate)
DISTRIBUTION OF BAM OPERATIONAL OVERPAYMENT RATES
PY 2006
NUMBER OF STATES
In 2006, twenty of fifty-two states reported operational overpayment rates of less than 4%.
1
19
10
15
3 3
1
0-1.9% 2-3.9% 4-5.9% 6-7.9% 8-9.9% 10-11.9% 12%+
Operational Overpayment Rate
29
UI PERFORMS ANNUAL REPORT PY 2006
NATIONAL REPORT
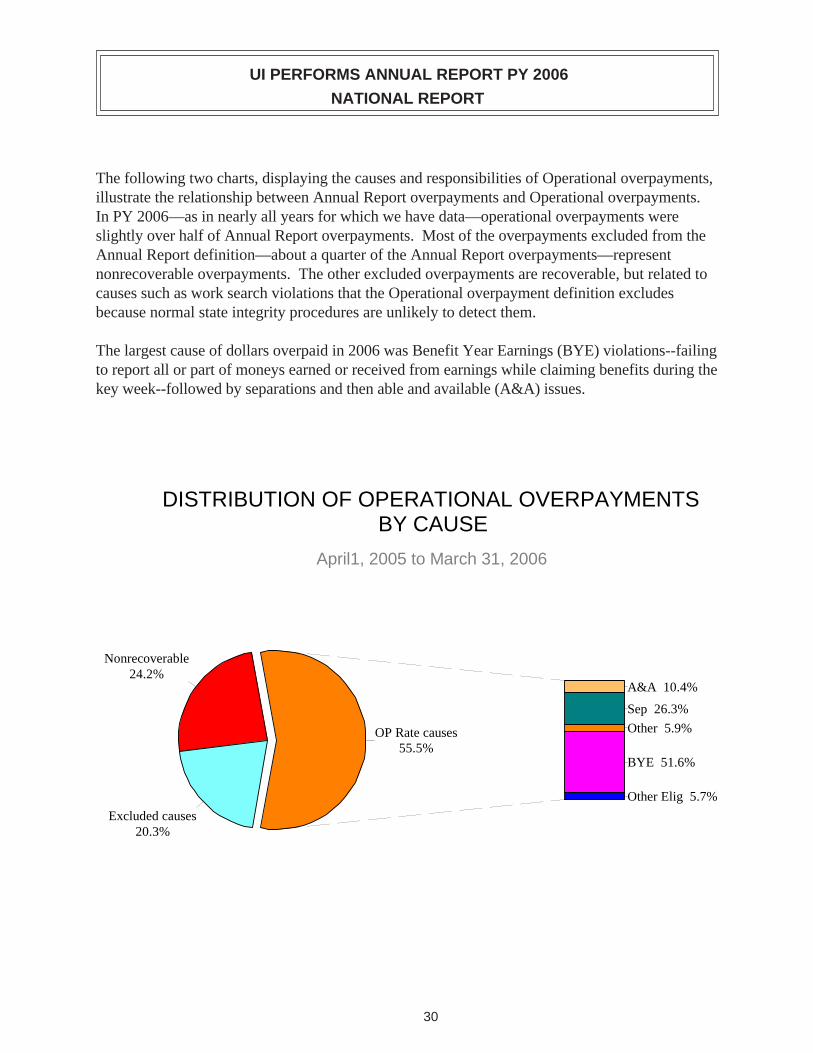
The following two charts, displaying the causes and responsibilities of Operational overpayments, illustrate the relationship between Annual Report overpayments and Operational overpayments. In PY 2006—as in nearly all years for which we have data—operational overpayments were slightly over half of Annual Report overpayments. Most of the overpayments excluded from the Annual Report definition—about a quarter of the Annual Report overpayments—represent nonrecoverable overpayments. The other excluded overpayments are recoverable, but related to causes such as work search violations that the Operational overpayment definition excludes because normal state integrity procedures are unlikely to detect them.
The largest cause of dollars overpaid in 2006 was Benefit Year Earnings (BYE) violations--failing to report all or part of moneys earned or received from earnings while claiming benefits during the key week--followed by separations and then able and available (A&A) issues.
DISTRIBUTION OF OPERATIONAL OVERPAYMENTS BY CAUSE
April1, 2005 to March 31, 2006
24.2%
20.3%
55.5%
5.7%
BYE 51.6%
5.9%
26.3%
10.4%
Nonrecoverable
Excluded causes
OP Rate causes
Other Elig
Other
Sep
A&A
30
UI PERFORMS ANNUAL REPORT PY 2006
NATIONAL REPORT
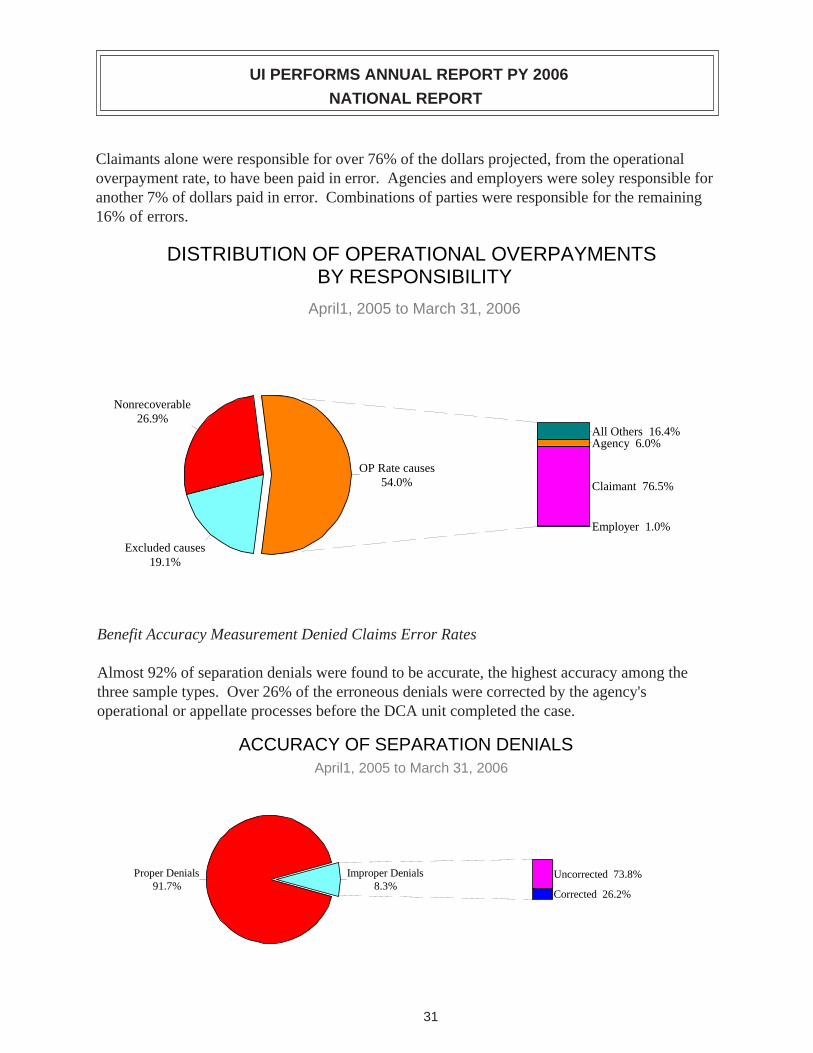
Claimants alone were responsible for over 76% of the dollars projected, from the operational overpayment rate, to have been paid in error. Agencies and employers were soley responsible for another 7% of dollars paid in error. Combinations of parties were responsible for the remaining 16% of errors.
DISTRIBUTION OF OPERATIONAL OVERPAYMENTS BY RESPONSIBILITY
April1, 2005 to March 31, 2006
26.9%
19.1%
54.0%
1.0%
76.5%
Agency 6.0% All Others 16.4%
Nonrecoverable
Excluded causes
OP Rate causes
Employer
Claimant
Benefit Accuracy Measurement Denied Claims Error Rates
Almost 92% of separation denials were found to be accurate, the highest accuracy among the three sample types. Over 26% of the erroneous denials were corrected by the agency's operational or appellate processes before the DCA unit completed the case.
ACCURACY OF SEPARATION DENIALS April1, 2005 to March 31, 2006
Proper Denials 91.7%
Improper Denials 8.3%
Corrected 26.2%
Uncorrected 73.8%
31
UI PERFORMS ANNUAL REPORT PY 2006
NATIONAL REPORT
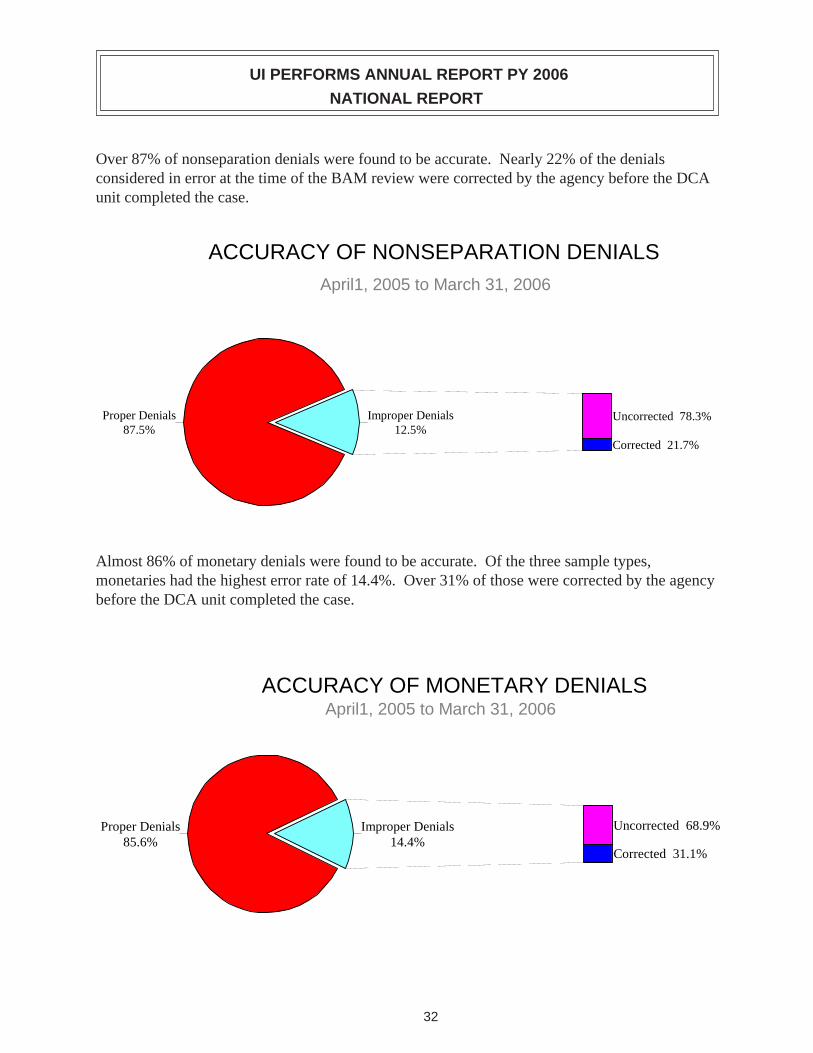
Over 87% of nonseparation denials were found to be accurate. Nearly 22% of the denials considered in error at the time of the BAM review were corrected by the agency before the DCA unit completed the case.
ACCURACY OF NONSEPARATION DENIALS April1, 2005 to March 31, 2006
Proper Denials 87.5%
Improper Denials 12.5%
Corrected 21.7%
Uncorrected 78.3%
Almost 86% of monetary denials were found to be accurate. Of the three sample types, monetaries had the highest error rate of 14.4%. Over 31% of those were corrected by the agency before the DCA unit completed the case.
ACCURACY OF MONETARY DENIALS April1, 2005 to March 31, 2006
P85.6% 14.4%
31.1%
68.9%roper Denials Improper Denials
Corrected
Uncorrected
32
1998
1999
2000
2001
2002
2003
2004
2005
2006
0
Contributory Employers Reimbursing Employers
UI PERFORMS ANNUAL REPORT PY 2006
NATIONAL REPORT
TAX PROGRAM ACTIVITY AND PERFORMANCE
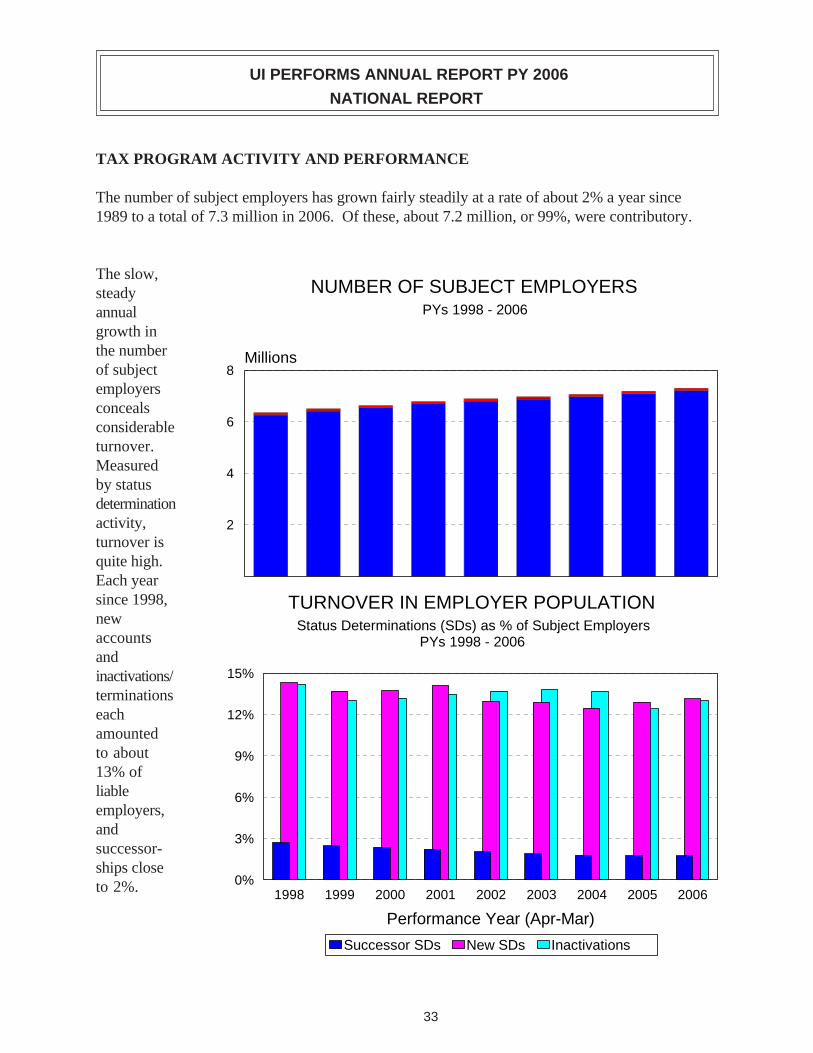
The number of subject employers has grown fairly steadily at a rate of about 2% a year since 1989 to a total of 7.3 million in 2006. Of these, about 7.2 million, or 99%, were contributory.
The slow, steady NUMBER OF SUBJECT EMPLOYERS annual PYs 1998 - 2006
growth in the number Millions of subject 8 employers conceals considerable 6
turnover. Measured 4 by status determination activity, 2 turnover is quite high. Each year since 1998, TURNOVER IN EMPLOYER POPULATION new Status Determinations (SDs) as % of Subject Employers accounts PYs 1998 - 2006andinactivations/ 15%
terminationseach 12%
amountedto about 9%13% ofliable 6%employers,and
3% successor-ships close to 2%. 0%
1998 1999 2000 2001 2002 2003 2004 2005 2006
Performance Year (Apr-Mar)
Successor SDs New SDs Inactivations
33
UI PERFORMS ANNUAL REPORT PY 2006
NATIONAL REPORT
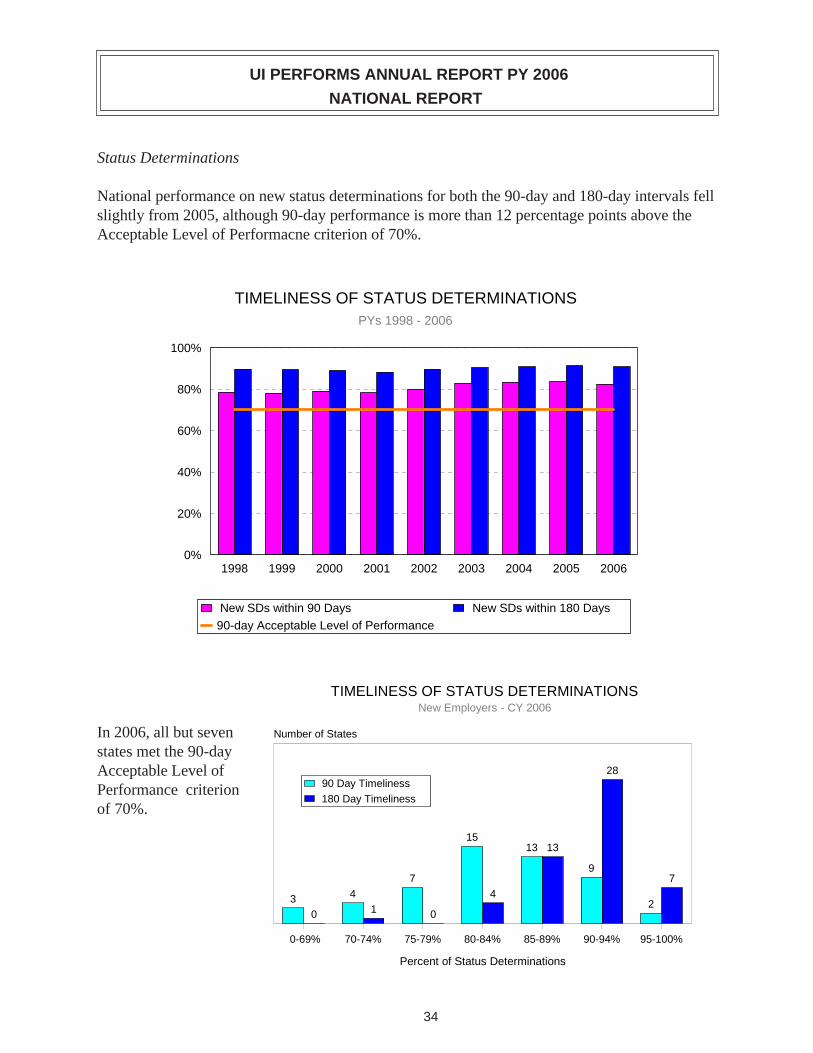
Status Determinations
National performance on new status determinations for both the 90-day and 180-day intervals fell slightly from 2005, although 90-day performance is more than 12 percentage points above the Acceptable Level of Performacne criterion of 70%.
TIMELINESS OF STATUS DETERMINATIONS PYs 1998 - 2006
100%
80%
60%
40%
20%
0% 1998 1999 2000 2001 2002 2003 2004 2005 2006
i i New SDs w thin 90 Days New SDs w thin 180 Days
90-day Acceptable Level of Performance
TIMELINESS OF STATUS DETERMINATIONS New Employers - CY 2006
In 2006, all but seven Number of States
states met the 90-day Acceptable Level of Performance criterion of 70%.
3 4
7
15 13
9
2 0 1 0
4
13
28
7
li
li
90 Day Time ness
180 Day Time ness
0-69% 70-74% 75-79% 80-84% 85-89% 90-94% 95-100%
Percent of Status Determinations
34
UI PERFORMS ANNUAL REPORT PY 2006
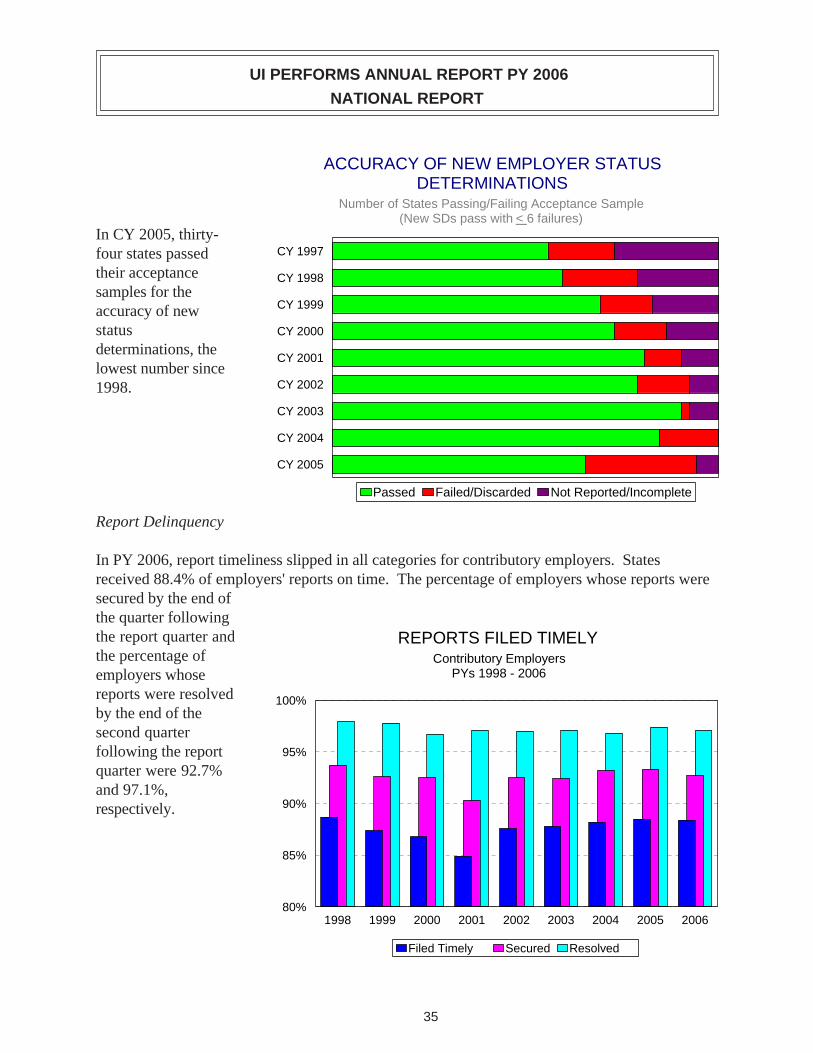
NATIONAL REPORT
In CY 2005, thirty-four states passed their acceptance samples for the accuracy of new status determinations, the lowest number since 1998.
ACCURACY OF NEW EMPLOYER STATUS DETERMINATIONS
Number of States Passing/Failing Acceptance Sample (New SDs pass with < 6 failures)
CY 1997
CY 1998
CY 1999
CY 2000
CY 2001
CY 2002
CY 2003
CY 2004
CY 2005
led/Di lPassed Fai scarded Not Reported/Incomp ete
Report Delinquency
In PY 2006, report timeliness slipped in all categories for contributory employers. States received 88.4% of employers' reports on time. The percentage of employers whose reports were secured by the end of the quarter following the report quarter and REPORTS FILED TIMELY the percentage of Contributory Employers employers whose PYs 1998 - 2006
reports were resolved by the end of the second quarter following the report quarter were 92.7% and 97.1%, respectively.
100%
95%
90%
85%
80% 1998 1999 2000 2001 2002 2003 2004 2005 2006
Filed Timely Secured Resolved
35

UI PERFORMS ANNUAL REPORT PY 2006
NATIONAL REPORT
RESOLUTION OF REPORT DELINQUENCIES Number of States Passing/Failing Acceptance Sample
The number of states passing the
CY 1997 acceptance sample for quality in
CY 1998 delinquent reports
CY 1999 operations reached an all-time high ofCY 2000 40. States'
CY 2001 completion rates CY 2002 have improved
dramatically from theCY 2003 program's inception
CY 2004 in 1997 when 20 states failed to submit results.
CY 2005
Passed Failed/Discarded Not Reported/Incomplete
Collections
The proportion of total contributory employers' taxes due that were paid timely fell below 90% for the first time since 2001.
AMOUNTS PAID TIMELY Contributory Employers
PYs 1998 - 2006
100%
95%
90%
85%
80% 1998 1999 2000 2001 2002 2003 2004 2005 2006
36
UI PERFORMS ANNUAL REPORT PY 2006
NATIONAL REPORT
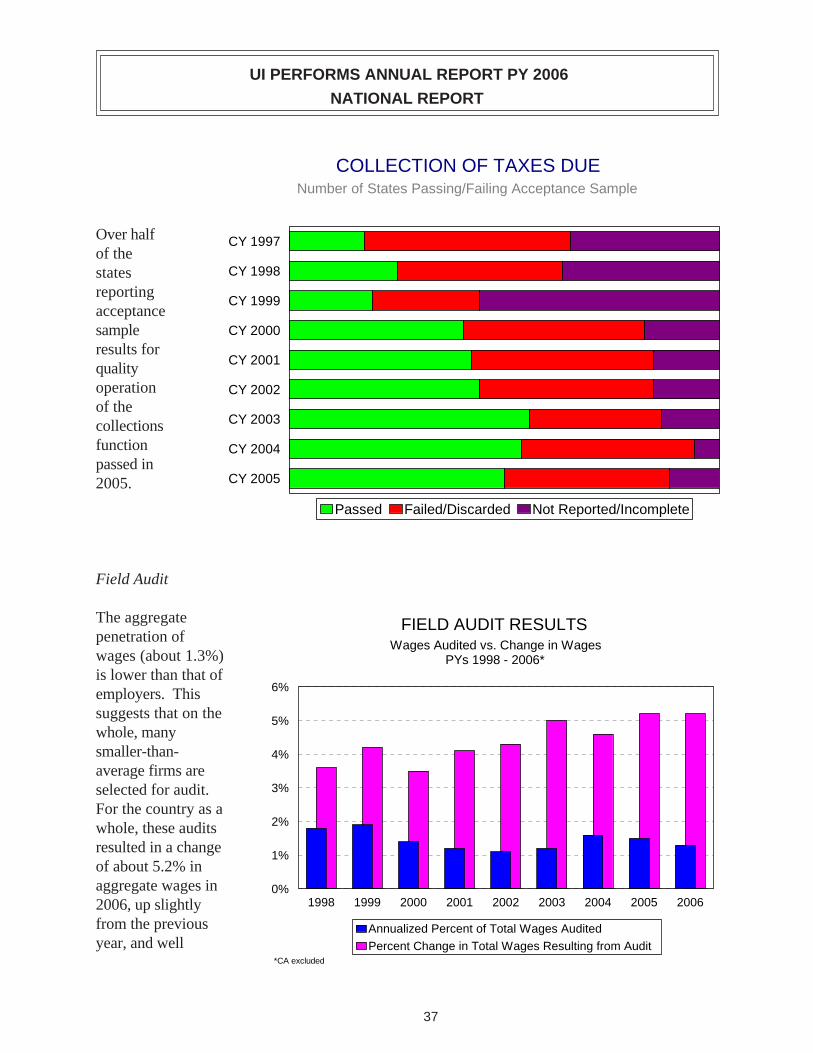
Over half of the states reporting acceptance sample results for quality operation of the collections function passed in 2005.
Field Audit
The aggregate penetration of wages (about 1.3%) is lower than that of employers. This suggests that on the whole, many smaller-than-average firms are selected for audit. For the country as a whole, these audits resulted in a change of about 5.2% in aggregate wages in 2006, up slightly from the previous year, and well
COLLECTION OF TAXES DUE Number of States Passing/Failing Acceptance Sample
CY 1997
CY 1998
CY 1999
CY 2000
CY 2001
CY 2002
CY 2003
CY 2004
CY 2005
l lPassed Fai ed/Discarded Not Reported/Incomp ete
FIELD AUDIT RESULTS Wages Audited vs. Change in Wages
PYs 1998 - 2006*
6%
5%
4%
3%
2%
1%
0% 1998 1999 2000 2001 2002 2003 2004 2005 2006
Annualized Percent of Total Wages Audited
Percent Change in Total Wages Resulting from Audit *CA excluded
37
UI PERFORMS ANNUAL REPORT PY 2006
NATIONAL REPORT
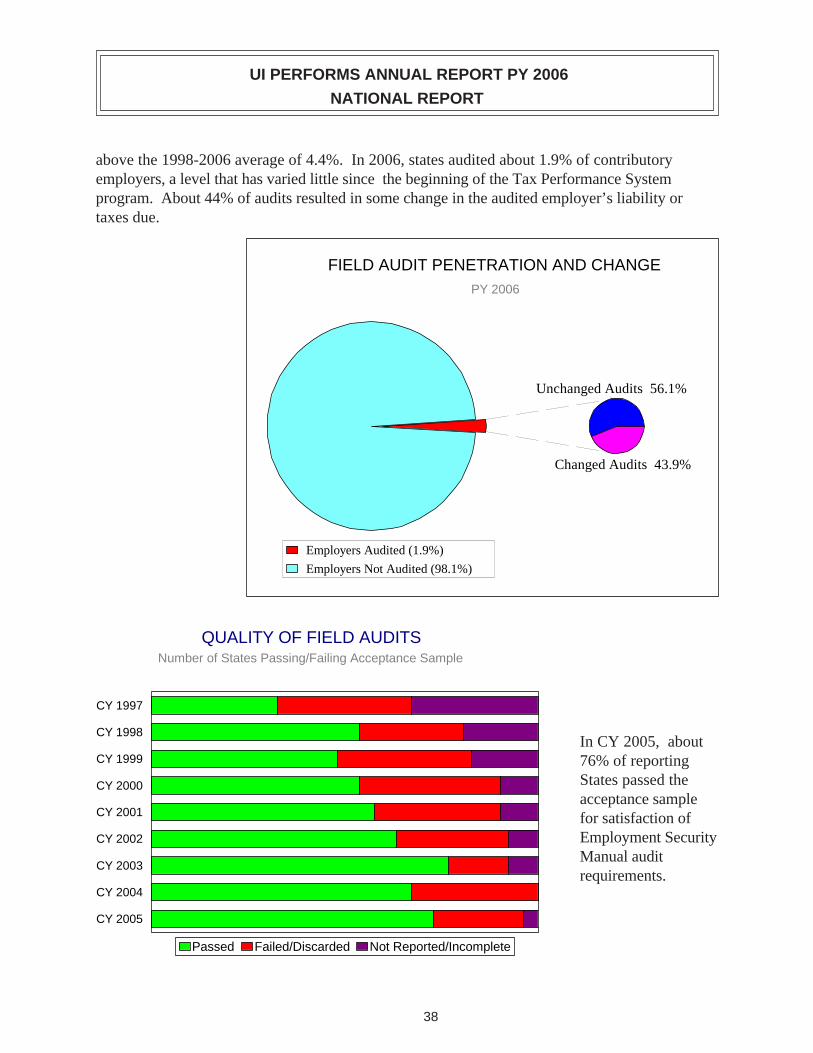
above the 1998-2006 average of 4.4%. In 2006, states audited about 1.9% of contributory employers, a level that has varied little since the beginning of the Tax Performance System program. About 44% of audits resulted in some change in the audited employer’s liability or taxes due.
FIELD AUDIT PENETRATION AND CHANGE PY 2006
Unchanged Audits 56.1%
Changed Audits 43.9%
Employers Audited (1.9%)
Employers Not Audited (98.1%)
QUALITY OF FIELD AUDITS Number of States Passing/Failing Acceptance Sample
CY 1997
CY 1998
CY 1999
CY 2000
CY 2001
CY 2002
CY 2003
CY 2004
CY 2005
In CY 2005, about 76% of reporting States passed the acceptance sample for satisfaction of Employment Security Manual audit requirements.
Passed Failed/Discarded Not Reported/Incomplete
38
UI PERFORMS ANNUAL REPORT PY 2006
NATIONAL REPORT
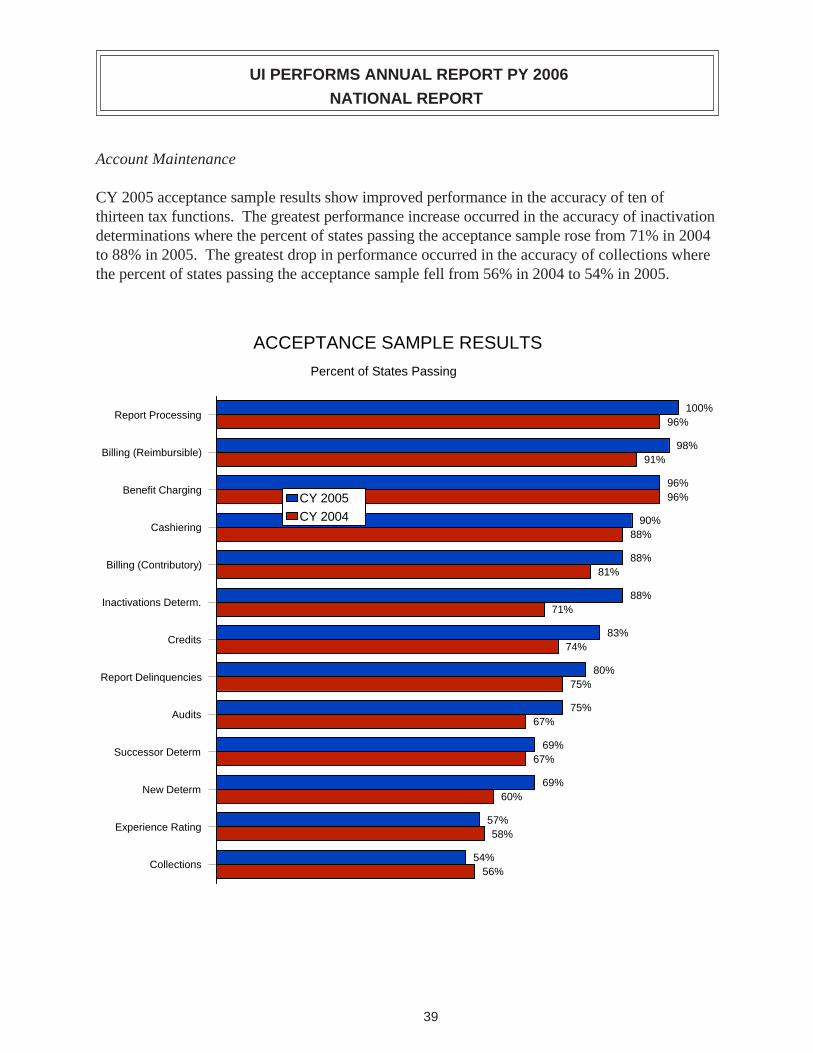
Account Maintenance
CY 2005 acceptance sample results show improved performance in the accuracy of ten of thirteen tax functions. The greatest performance increase occurred in the accuracy of inactivation determinations where the percent of states passing the acceptance sample rose from 71% in 2004 to 88% in 2005. The greatest drop in performance occurred in the accuracy of collections where the percent of states passing the acceptance sample fell from 56% in 2004 to 54% in 2005.
ACCEPTANCE SAMPLE RESULTS
Percent of States Passing
100%Report Processing
98%Billing (Reimbursible)
Benefit Charging
Cashiering
Billing (Contributory)
Inactivations Determ.
Credits
Report Delinquencies
Audits
Successor Determ
New Determ
Experience Rating
Collections
96%
90%
88%
88%
83%
80%
75%
69%
69%
57%
54%
96%
91%
96%
88%
81%
71%
74%
75%
67%
67%
60%
58%
56%
CY 2005 CY 2004
39
UI PERFORMS ANNUAL REPORT PY 2006
NATIONAL REPORT
STATUS OF DATA VALIDATION
Introduction During the mid-1990s, as part of the Performance Measurement Review project, the Department of Labor began developing a Data Validation (DV) system to validate key benefit reports data. Its methodology was built on concepts used since the 1970s in the Workload Validation system that validated the “workload” report elements used to allocate UI administrative resources. The DV system was expanded in the late 1990s to include validation of tax report data. By 2005, the DV system had undergone several revisions including software and structure redesign, and the establishment of a “validation year” cycle for the completion of UIDV (see Unemployment Insurance Program Letter (UIPL) 22-05). The UIPL also emphasized the requirement for states to validate the samples used in the Benefits Timeliness and Quality (BTQ) program and the Tax Performance System (TPS) to assess operational quality or accuracy, and to validate the number of Wage Items reported on the ETA 581 report.
In early 2005, new web-based DV software was released to the states, to replace the PC-based software used for DV activities. The new DV software runs on the same state Sun machines that are used for UI reporting. As state validators began using it to perform regular validation activities and to transmit results to the National Office, various deficiencies became apparent. These were in the software itself, the data transmission, and the structure of the database that stores DV summary results, from which the National Office determines compliance. As a result, states have been instructed not to submit results using the software during the VY 2007 when the software revision is being developed and tested. Because the software deficiencies might have erroneously indicated a failure, states were also given the option not to submit VY 2006 results. Many did submit results, however. This annual report gives the cumulative UI DV status through VY 2006.
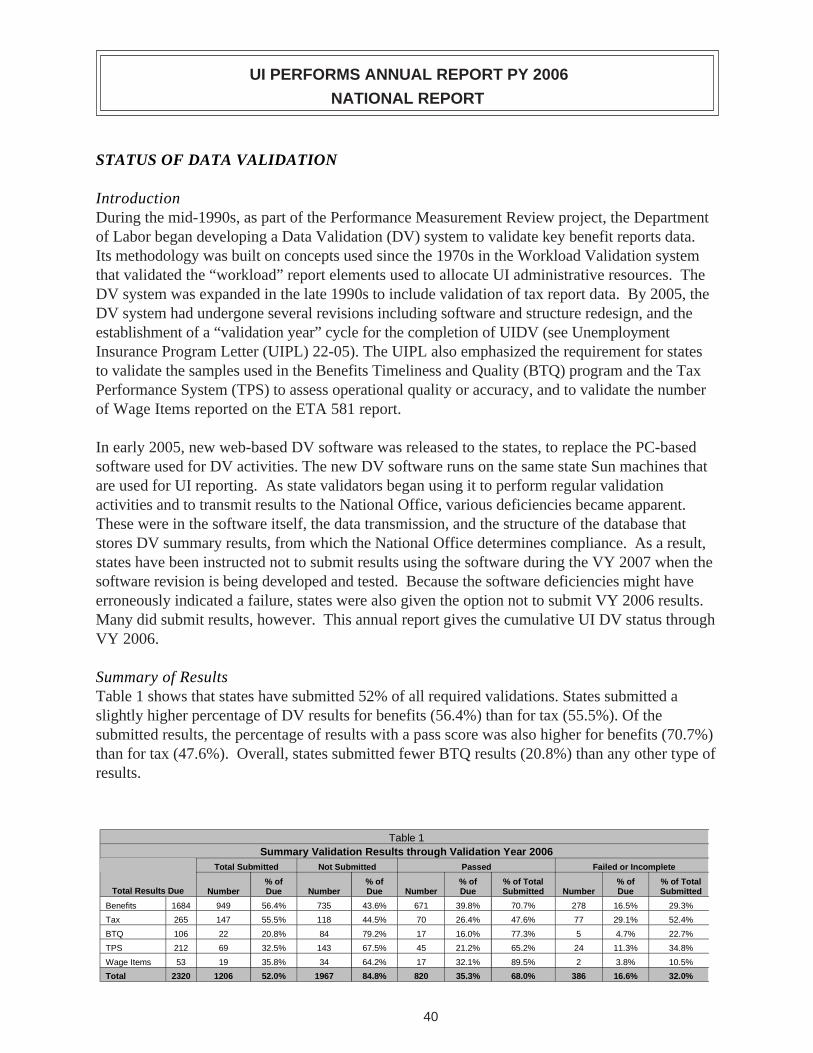
Summary of Results Table 1 shows that states have submitted 52% of all required validations. States submitted a slightly higher percentage of DV results for benefits (56.4%) than for tax (55.5%). Of the submitted results, the percentage of results with a pass score was also higher for benefits (70.7%) than for tax (47.6%). Overall, states submitted fewer BTQ results (20.8%) than any other type of results.
Due
949
Tax 147 70 77
22 84 5
69
53 19 34 2
Table 1 Summary Validation Results through Validation Year 2006
Total Submitted Not Submitted Passed Failed or Incomplete
Total Results Due Number % of Due Number
% of Due Number
% of Due
% of Total Submitted Number
% of % of Total Submitted
Benefits 1684 56.4% 735 43.6% 671 39.8% 70.7% 278 16.5% 29.3%
265 55.5% 118 44.5% 26.4% 47.6% 29.1% 52.4%
BTQ 106 20.8% 79.2% 17 16.0% 77.3% 4.7% 22.7%
TPS 212 32.5% 143 67.5% 45 21.2% 65.2% 24 11.3% 34.8%
Wage Items 35.8% 64.2% 17 32.1% 89.5% 3.8% 10.5%
Total 2320 1206 52.0% 1967 84.8% 820 35.3% 68.0% 386 16.6% 32.0%
40
UI PERFORMS ANNUAL REPORT PY 2006
NATIONAL REPORT
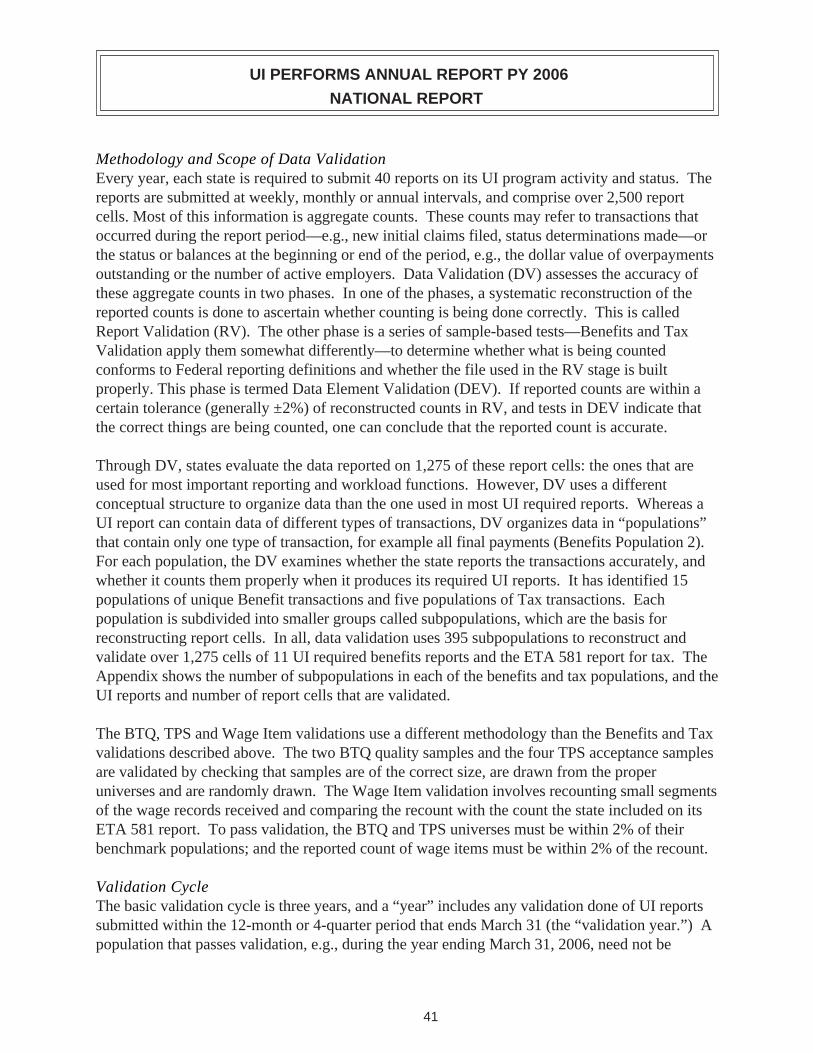
Methodology and Scope of Data Validation Every year, each state is required to submit 40 reports on its UI program activity and status. The reports are submitted at weekly, monthly or annual intervals, and comprise over 2,500 report cells. Most of this information is aggregate counts. These counts may refer to transactions that occurred during the report period—e.g., new initial claims filed, status determinations made—or the status or balances at the beginning or end of the period, e.g., the dollar value of overpayments outstanding or the number of active employers. Data Validation (DV) assesses the accuracy of these aggregate counts in two phases. In one of the phases, a systematic reconstruction of the reported counts is done to ascertain whether counting is being done correctly. This is called Report Validation (RV). The other phase is a series of sample-based tests—Benefits and Tax Validation apply them somewhat differently—to determine whether what is being counted conforms to Federal reporting definitions and whether the file used in the RV stage is built properly. This phase is termed Data Element Validation (DEV). If reported counts are within a certain tolerance (generally ±2%) of reconstructed counts in RV, and tests in DEV indicate that the correct things are being counted, one can conclude that the reported count is accurate.
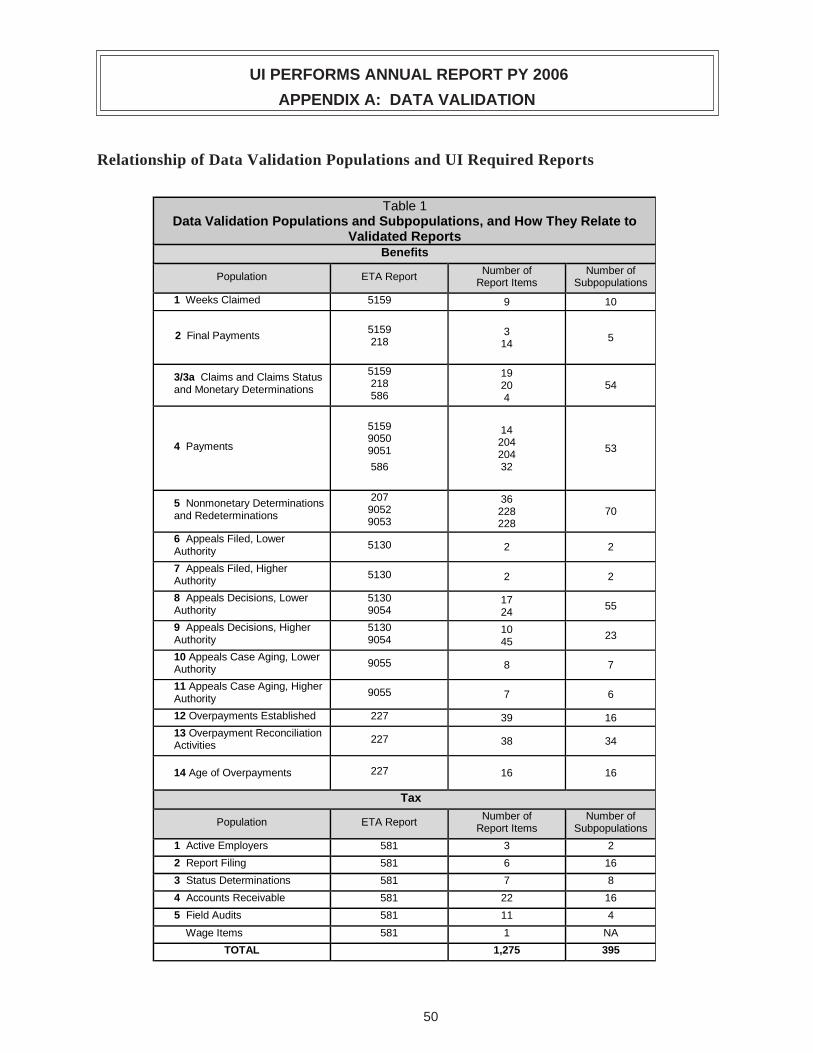
Through DV, states evaluate the data reported on 1,275 of these report cells: the ones that are used for most important reporting and workload functions. However, DV uses a different conceptual structure to organize data than the one used in most UI required reports. Whereas a UI report can contain data of different types of transactions, DV organizes data in “populations” that contain only one type of transaction, for example all final payments (Benefits Population 2). For each population, the DV examines whether the state reports the transactions accurately, and whether it counts them properly when it produces its required UI reports. It has identified 15 populations of unique Benefit transactions and five populations of Tax transactions. Each population is subdivided into smaller groups called subpopulations, which are the basis for reconstructing report cells. In all, data validation uses 395 subpopulations to reconstruct and validate over 1,275 cells of 11 UI required benefits reports and the ETA 581 report for tax. The Appendix shows the number of subpopulations in each of the benefits and tax populations, and the UI reports and number of report cells that are validated.
The BTQ, TPS and Wage Item validations use a different methodology than the Benefits and Tax validations described above. The two BTQ quality samples and the four TPS acceptance samples are validated by checking that samples are of the correct size, are drawn from the proper universes and are randomly drawn. The Wage Item validation involves recounting small segments of the wage records received and comparing the recount with the count the state included on its ETA 581 report. To pass validation, the BTQ and TPS universes must be within 2% of their benchmark populations; and the reported count of wage items must be within 2% of the recount.
Validation Cycle The basic validation cycle is three years, and a “year” includes any validation done of UI reports submitted within the 12-month or 4-quarter period that ends March 31 (the “validation year.”) A population that passes validation, e.g., during the year ending March 31, 2006, need not be
41
UI PERFORMS ANNUAL REPORT PY 2006
NATIONAL REPORT
revalidated for three years, i.e., within the year ending March 31, 2009. A revalidation must be performed within the following year if: (1) there is a validation failure within the population; or (2) the state installs new reporting software or significantly revises an automated system; or (3)the population includes the data from which Government Employment and Results Act (GPRA) indicators are calculated. The GPRA indicators are produced using data from Benefits Population 4 (Payments) and 12 (Overpayments Established); and Tax Population 3 (Status Determinations.) These populations must be validated annually.
Pass-Fail Criteria Report Validation (RV). Passing and failing for both Tax and Benefits is determined by whether or not the reported values for a group of report cells (a pass/fail group) are within the set tolerance limits of the reconstructed “validation” count for that group. This tolerance is ±1% for GPRA groups and ±2% for other groups. If any group of report cells within a population fails this test, the population must be revalidated in the next year.
Data Element Validation (DEV). (a) States are expected to submit Benefits DEV results for 17 random samples (16 random samples are expected from HI, NE, MN, DC, and VI, which lack Higher Authority Appeals). If any random sample fails—i.e., it indicates that more than 5% of the transactions in the underlying universe do not meet Federal reporting standards—the sample fails and must be repeated and resubmitted within the following year, along with the RV for the population. Benefits validation has many small analytical samples as well but these are not statistically valid for making pass and fail decisions. (b) The tax validation design has no random samples but applies a variety of DEV tests, including “File Integrity Validation” samples of size two for each subpopulation, to determine whether the files used for Tax RV are built properly. Although passing and failing of Tax populations is determined formally on the basis of the RV results, unless the files used for RV have passed all DEV tests, the population cannot pass and must be revalidated within the following year.
Benefits Timeliness and Quality (BTQ) Validation. States are expected to submit reviews for two BTQ quality samples: nonmonetary determinations and lower authority appeals. If all BTQ validation components pass, then the results are valid for three years. If a sample does not pass the test for randomness, the sample must be redrawn before the BTQ sample can be used. If the universe from which the sample is drawn is not within 2% of the reference population, the validation must be repeated the following year.
Tax Performance System (TPS) Validation. States are expected to submit reviews for four TPS acceptance samples: new status determinations, successor status determinations, inactivations/ terminations, and field audits. As in BTQ validation, if all TPS validation components pass, then the results are valid for three years. If a sample does not pass the test for randomness, the sample must be redrawn before the TPS sample can be used. If the universe from which the sample is drawn is not within 2% of the reference population, the validation must be repeated the following year.
42

UI PERFORMS ANNUAL REPORT PY 2006
NATIONAL REPORT
Wage Items Validation. States are expected to submit a wage item validation report that includes all modes they use to collect data. Wage Item validation must be repeated the following year if at least one mode does not pass with an error rate of 2% or less.
STATUS OF BENEFITS VALIDATION
Tables 2 and 3 show summaries of Benefits validation results by state for Validation Year 2006.
Table 2 shows a summary for Report Validation results. Most states must validate 15 benefits populations. Five states— Hawaii, District of Columbia, Minnesota, Nebraska, and Virgin Islands—have no Higher Authority Appeals and thus have no reports or validations for populations 7 (Higher Authority Appeals Filed), 9 (Higher Authority Appeals Decisions), and 11 (Higher Authority Appeals Case Aging).
Seventeen states have submitted RV results for all populations, and nine states submitted none. Delaware had the greatest number of populations that obtained a pass score (13), followed by Florida (12), but Hawaii had the greatest percentage of populations that obtained a pass score (91.7%). For states that submitted results, the average number of populations submitted per state was approximately eleven.
2006
15 10 5 15 0 15 11 3 14 1 15 9 6 15 0 15 4 4 8 7 15 7 8 15 0 15 0 0 0 15 15 4 0 4 11 12 0 0 0 12 15 13 2 15 0 15 12 3 15 0 15 11 3 14 1 12 11 1 12 0 15 6 5 11 4 15 4 2 6 9 15 9 3 12 3 15 0 0 0 15 15 6 0 6 9 15 0 0 0 15
LA 15 6 3 9 6 15 9 6 15 0 15 4 5 9 6 15 7 8 15 0 15 1 4 5 10 12 5 9 14 1 15 9 3 12 3 15 5 2 7 8 15 6 9 15 0 15 8 4 12 3 15 10 4 14 1 12 9 3 12 0 15 7 8 15 0 15 3 9 12 3 15 0 0 0 15
Table 2
Status of Benefits Report Validation by State through Validation Year
Results
State Due Pass Fail or
Incomplete Total
Submitted Not
Submitted
AKALARAZCACOCTDCDEFLGAHIIAIDILINKSKY
MAMDMEMIMNMOMSMTNCNDNENHNJNM
43
UI PERFORMS ANNUAL REPORT PY 2006
NATIONAL REPORT
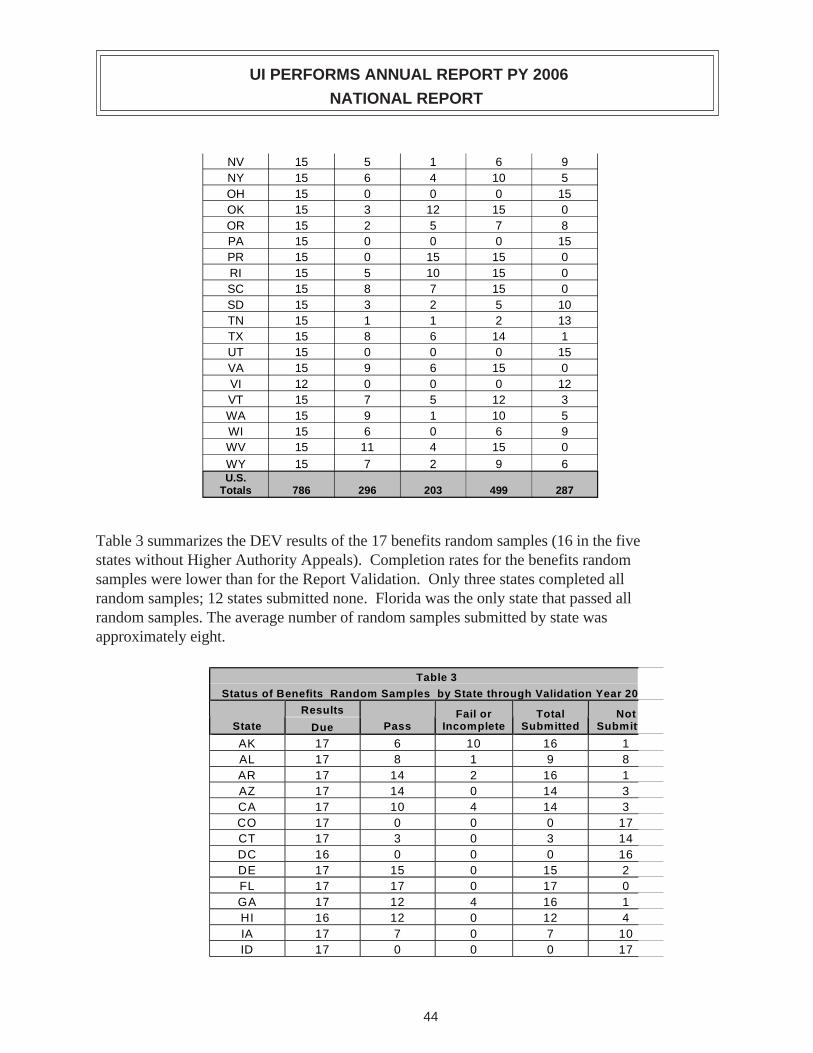
NV 15 5 1 6 9 NY 15 6 4 10 5 OH 15 0 0 0 15 OK 15 3 12 15 0 OR 15 2 5 7 8 PA 15 0 0 0 15 PR 15 0 15 15 0 RI 15 5 10 15 0 SC 15 8 7 15 0 SD 15 3 2 5 10 TN 15 1 1 2 13 TX 15 8 6 14 1 UT 15 0 0 0 15 VA 15 9 6 15 0 VI 12 0 0 0 12 VT 15 7 5 12 3 WA 15 9 1 10 5 WI 15 6 0 6 9 WV 15 11 4 15 0 WYU.S.
Totals
15
786
7
296
2
203
9
499
6
287
Table 3 summarizes the DEV results of the 17 benefits random samples (16 in the five states without Higher Authority Appeals). Completion rates for the benefits random samples were lower than for the Report Validation. Only three states completed all random samples; 12 states submitted none. Florida was the only state that passed all random samples. The average number of random samples submitted by state was approximately eight.
t
17 6 10 16 1 17 8 1 9 8 17 14 2 16 1 17 14 0 14 3 17 10 4 14 3 17 0 0 0 17 17 3 0 3 14 16 0 0 0 16 17 15 0 15 2 17 17 0 17 0 17 12 4 16 1 16 12 0 12 4 17 7 0 7 10 17 0 0 0 17
Table 3
Status of Benefits Random Samples by State through Validation Year 200
Results
State Due Pass Fail or
Incomplete Total
Submitted Not
Submit
AKALARAZCACOCTDCDEFLGAHIIAID
44
UI PERFORMS ANNUAL REPORT PY 2006
NATIONAL REPORT
INIL
17 17
0 14
0 0
0 14
17 3
KS 17 0 2 2 15 KY 17 0 0 0 17 LA 17 4 2 6 11 MA 17 10 4 14 3 MD 17 13 1 14 3 ME 17 14 3 17 0 MI 17 6 3 9 8 MN 16 3 0 3 13 MO 17 11 1 12 5 MS 17 8 1 9 8 MT 17 14 0 14 3 NC 17 9 1 10 7 ND 17 12 0 12 5 NE 16 12 0 12 4 NH 17 10 7 17 0 NJ 17 14 0 14 3 NM 17 0 0 0 17 NV 17 0 1 1 16 NY 17 7 2 9 8 OH 17 0 0 0 17 OK 17 11 2 13 4 OR 17 3 1 4 13 PA 17 0 0 0 17 PR 17 3 0 3 14 RI 17 14 0 14 3 SC 17 11 5 16 1 SD 17 1 0 1 16 TN 17 0 0 0 17 TX 17 8 2 10 7 UT 17 0 0 0 17 VA 17 4 12 16 1 VI 16 0 0 0 16 VT 17 12 1 13 4 WA 17 7 2 9 8 WI 17 0 0 0 17 WV 17 14 1 15 2 W YU.S.
Totals
17
898
8
375
0
75
8
450
9
448
STATUS OF TAX VALIDATION
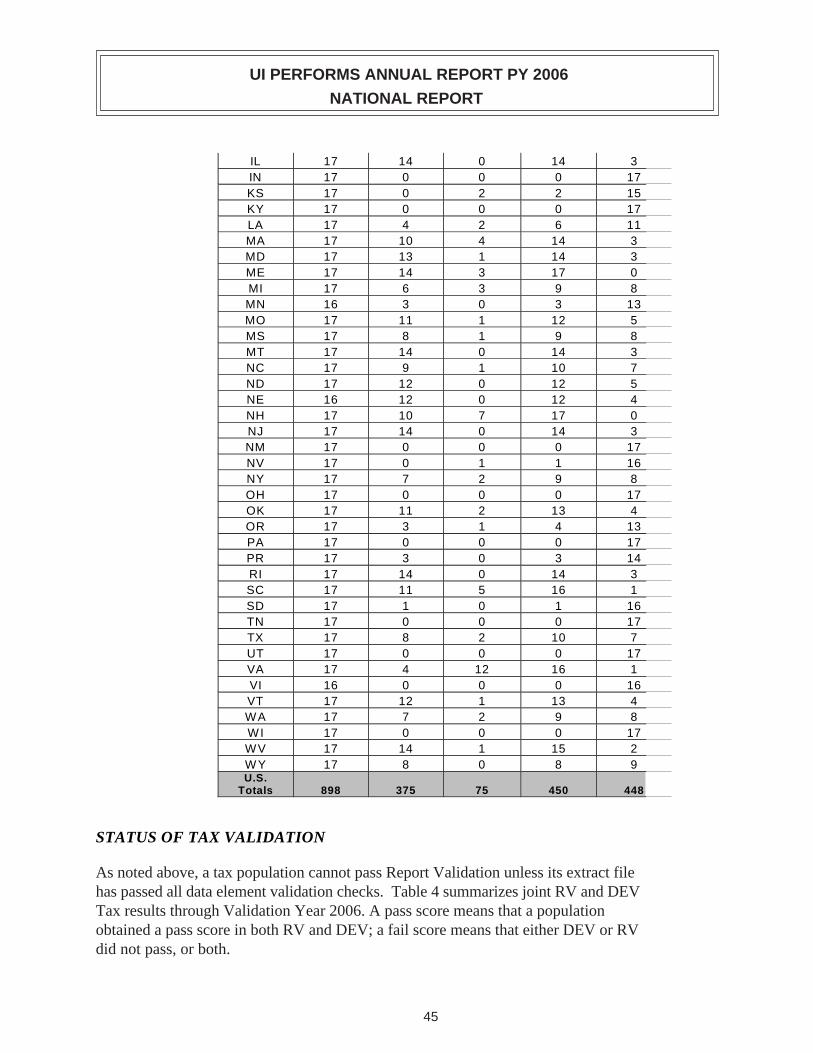
As noted above, a tax population cannot pass Report Validation unless its extract file has passed all data element validation checks. Table 4 summarizes joint RV and DEV Tax results through Validation Year 2006. A pass score means that a population obtained a pass score in both RV and DEV; a fail score means that either DEV or RV did not pass, or both.
45
UI PERFORMS ANNUAL REPORT PY 2006
NATIONAL REPORT
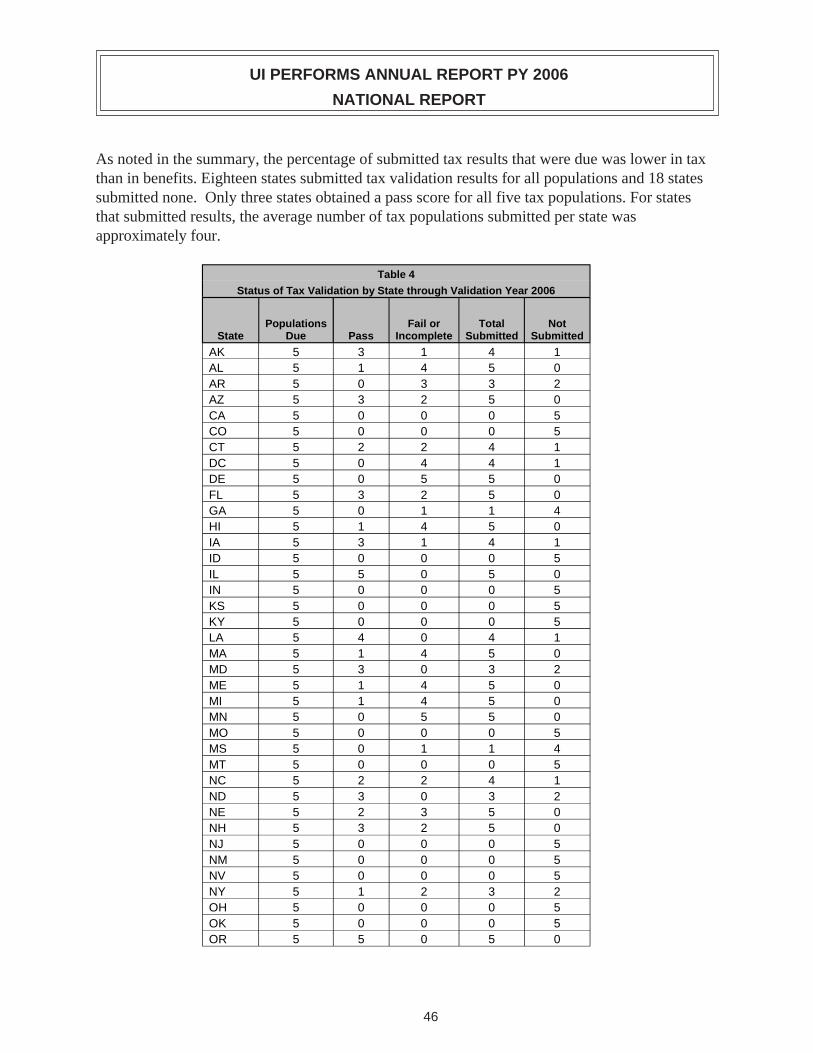
As noted in the summary, the percentage of submitted tax results that were due was lower in tax than in benefits. Eighteen states submitted tax validation results for all populations and 18 states submitted none. Only three states obtained a pass score for all five tax populations. For states that submitted results, the average number of tax populations submitted per state was approximately four.
Table 4
Status of Tax Validation by State through Validation Year 2006
Populations Fail or Total Not State Due Pass Incomplete Submitted Submitted
AK 5 3 1 4 1 AL 5 1 4 5 0 AR 5 0 3 3 2 AZ 5 3 2 5 0 CA 5 0 0 0 5 CO 5 0 0 0 5 CT 5 2 2 4 1 DC 5 0 4 4 1 DE 5 0 5 5 0 FL 5 3 2 5 0 GA 5 0 1 1 4 HI 5 1 4 5 0 IA 5 3 1 4 1 ID 5 0 0 0 5 IL 5 5 0 5 0 IN 5 0 0 0 5 KS 5 0 0 0 5 KY 5 0 0 0 5 LA 5 4 0 4 1 MA 5 1 4 5 0 MD 5 3 0 3 2 ME 5 1 4 5 0 MI 5 1 4 5 0 MN 5 0 5 5 0 MO 5 0 0 0 5 MS 5 0 1 1 4 MT 5 0 0 0 5 NC 5 2 2 4 1 ND 5 3 0 3 2 NE 5 2 3 5 0 NH 5 3 2 5 0 NJ 5 0 0 0 5 NM 5 0 0 0 5 NV 5 0 0 0 5 NY 5 1 2 3 2 OH 5 0 0 0 5 OK 5 0 0 0 5 OR 5 5 0 5 0
46
UI PERFORMS ANNUAL REPORT PY 2006
NATIONAL REPORT
5 0 0 0 5 5 0 4 4 1 5 2 2 4 1 5 0 0 0 5 5 1 4 5 0 5 2 1 3 2 5 2 3 5 0 5 4 1 5 0 5 2 2 4 1 5 0 0 0 5 5 1 3 4 1 5 5 0 5 0 5 0 0 0 5 5 4 1 5 0 5 0 0 0 5
U.S. 70 77 118
PA PR RI SC SD TN TX UT VA VI VT WA WI WV WY
Totals 265 147
STATUS OF BTQ VALIDATION
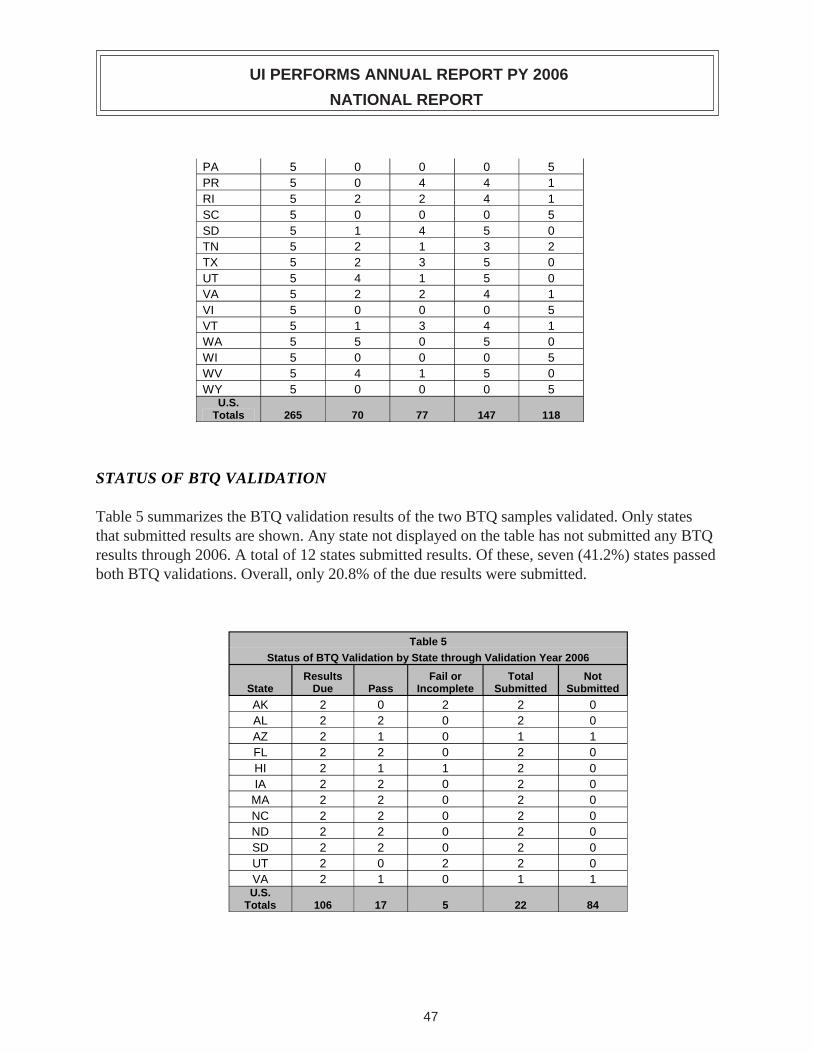
Table 5 summarizes the BTQ validation results of the two BTQ samples validated. Only states that submitted results are shown. Any state not displayed on the table has not submitted any BTQ results through 2006. A total of 12 states submitted results. Of these, seven (41.2%) states passed both BTQ validations. Overall, only 20.8% of the due results were submitted.
Table 5
Status of BTQ Validation by State through Validation Year 2006
State Results
Due Pass Fail or
Incomplete Total
Submitted Not
Submitted
AK 2 0 2 2 0 AL 2 2 0 2 0 AZ 2 1 0 1 1 FL 2 2 0 2 0 HI 2 1 1 2 0 IA 2 2 0 2 0
MA 2 2 0 2 0 NC 2 2 0 2 0 ND 2 2 0 2 0 SD 2 2 0 2 0 UT 2 0 2 2 0 VA 2 1 0 1 1 U.S.
Totals 106 17 5 22 84
47

UI PERFORMS ANNUAL REPORT PY 2006
NATIONAL REPORT
STATUS OF TPS VALIDATION
Table 6 summarizes the TPS validation results of the four TPS samples validated. Only states that submitted results are shown. Any state not displayed on the table has not submitted any TPS results through 2006. A total of 19 states submitted results. Of these, eight (42.1%) states passed all TPS validations. Overall, 32.5% of the due results were submitted.
Table 6
Status of TPS Validation by State through Validation Year 2006
State Results
Due Pass Fail or
Incomplete Total
Submitted Not
Submitted
AK 4 4 0 4 0 AL 4 2 2 4 0 AZ 4 4 0 4 0 CT 4 0 1 1 3 FL 4 4 0 4 0 HI 4 1 3 4 0 MA 4 2 2 4 0 MI 4 0 1 1 3 NC 4 4 0 4 0 ND 4 2 2 4 0 NE 4 4 0 4 0 NH 4 4 0 4 0 OR 4 0 3 3 1 RI 4 4 0 4 0 SD 4 2 2 4 0 TN 4 2 2 4 0 UT 4 1 3 4 0 VA 4 4 0 4 0 WV 4 1 3 4 0 U.S.
Totals 212 45 24 69 143
STATUS OF WAGE ITEM VALIDATION
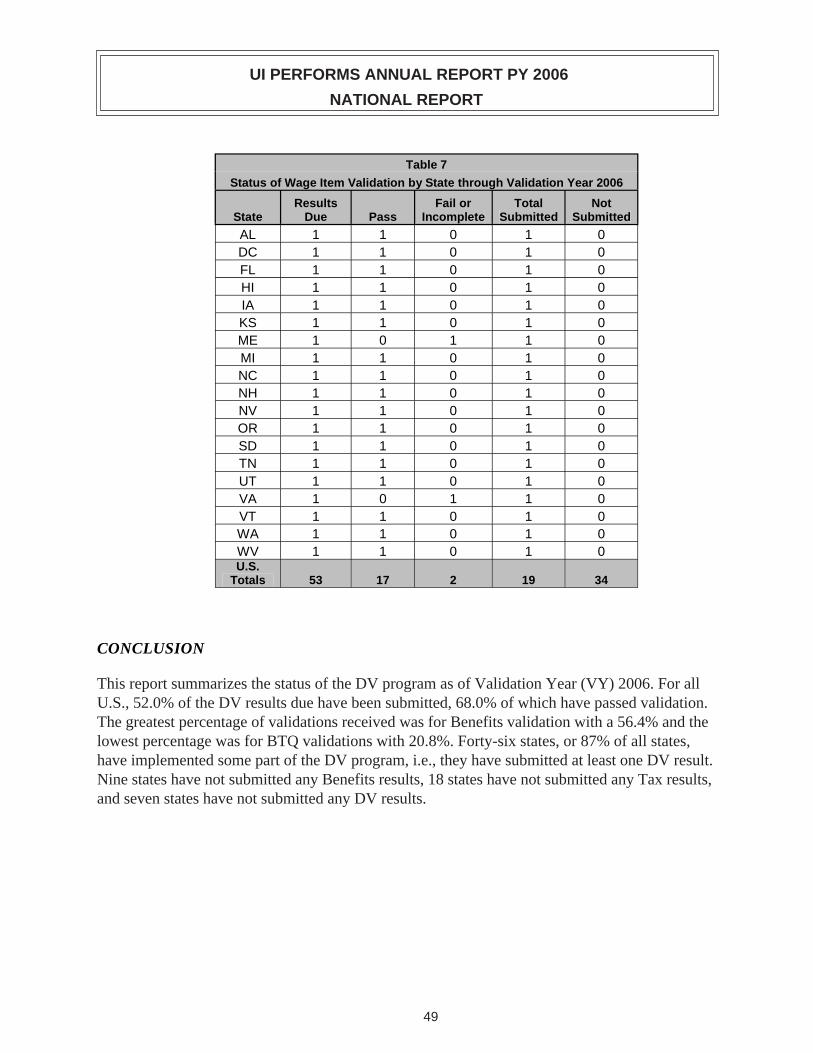
Table 7 summarizes the Wage Item validation results. Only states that submitted results are shown. Any state not displayed on the table has not submitted any Wage Item results through 2006. A total of 19 states submitted results. Of these, 17 states (89.5%) passed validation. Overall, 35.8% of the due results were submitted.
48
UI PERFORMS ANNUAL REPORT PY 2006
Due Pass Fail or Total
Submitted Not
Submitted
AL 1 1 0 1 0 DC 1 1 0 1 0
1 1 0 1 0 HI 1 1 0 1 0 IA 1 1 0 1 0 KS 1 1 0 1 0 ME 1 0 1 1 0 MI 1 1 0 1 0 NC 1 1 0 1 0 NH 1 1 0 1 0 NV 1 1 0 1 0
1 1 0 1 0 SD 1 1 0 1 0
1 1 0 1 0 UT 1 1 0 1 0 VA 1 0 1 1 0 VT 1 1 0 1 0
1 1 0 1 0 1 1 0 1 0
U.S. 53 17 2 19 34
NATIONAL REPORT
Table 7
Status of Wage Item Validation by State through Validation Year 2006
State Results
Incomplete
FL
OR
TN
WAWV
Totals
CONCLUSION
This report summarizes the status of the DV program as of Validation Year (VY) 2006. For all U.S., 52.0% of the DV results due have been submitted, 68.0% of which have passed validation. The greatest percentage of validations received was for Benefits validation with a 56.4% and the lowest percentage was for BTQ validations with 20.8%. Forty-six states, or 87% of all states, have implemented some part of the DV program, i.e., they have submitted at least one DV result. Nine states have not submitted any Benefits results, 18 states have not submitted any Tax results, and seven states have not submitted any DV results.
49
UI PERFORMS ANNUAL REPORT PY 2006
APPENDIX A: DATA VALIDATION
Relationship of Data Validation Populations and UI Required Reports
Table 1 Data Validation Populations and Subpopulations, and How They Relate to
Validated Reports Benefits
Population ETA Report Number of Report Items
Number of Subpopulations
1 Weeks Claimed 5159 9 10
2 Final Payments 5159 218
3 14 5
3/3a Claims and Claims Status and Monetary Determinations
5159 218 586
19 20 4
54
4 Payments
5159 9050 9051
586
14 204 204 32
53
5 Nonmonetary Determinations and Redeterminations
207 9052 9053
36 228 228
70
6 Appeals Filed, Lower Authority
5130 2 2
7 Appeals Filed, Higher Authority 5130 2 2
8 Appeals Decisions, Lower Authority
5130 9054
17 24
55
9 Appeals Decisions, Higher Authority
5130 9054
10 45
23
10 Appeals Case Aging, Lower Authority 9055 8 7
11 Appeals Case Aging, Higher Authority
9055 7 6
12 Overpayments Established 227 39 16 13 Overpayment Reconciliation Activities 227 38 34
14 Age of Overpayments 227 16 16
Tax
Population ETA Report Number of Report Items
Number of Subpopulations
1 Active Employers 581 3 2
2 Report Filing 581 6 16
3 Status Determinations 581 7 8
4 Accounts Receivable 581 22 16
5 Field Audits 581 11 4
Wage Items 581 1 NA
TOTAL 1,275 395
50
UI PERFORMS ANNUAL REPORT PY 2006
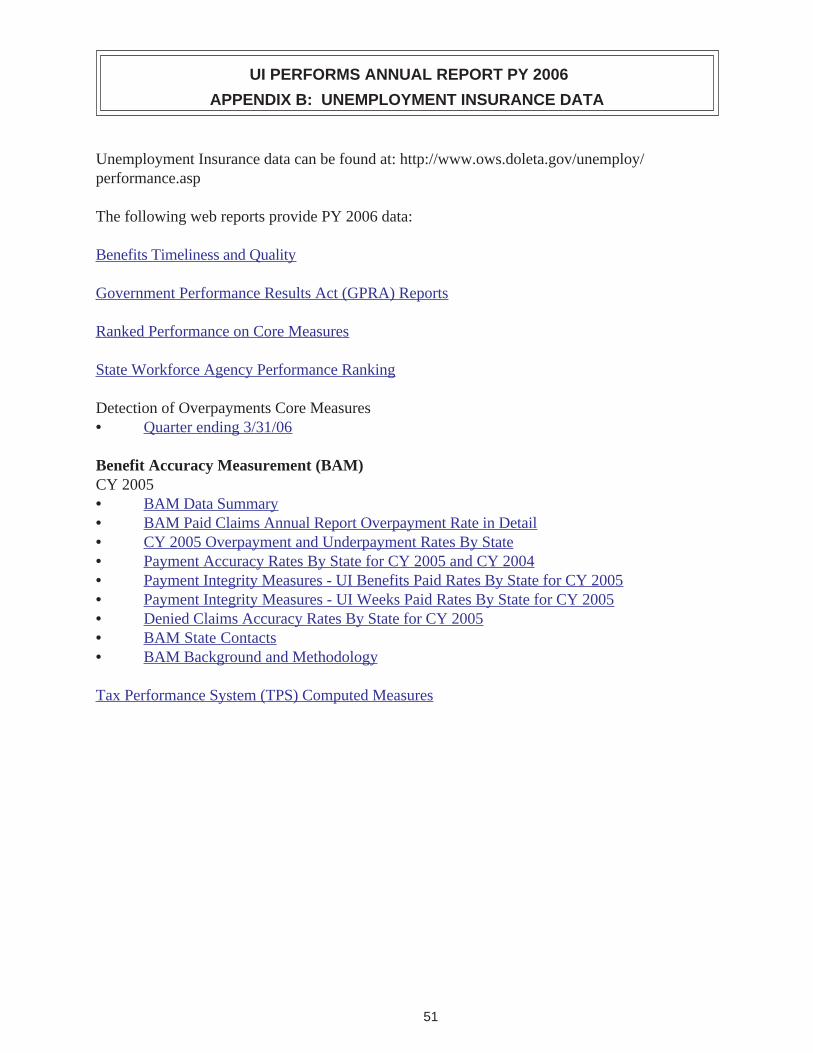
APPENDIX B: UNEMPLOYMENT INSURANCE DATA
Unemployment Insurance data can be found at: http://www.ows.doleta.gov/unemploy/ performance.asp
The following web reports provide PY 2006 data:
Benefits Timeliness and Quality
Government Performance Results Act (GPRA) Reports
Ranked Performance on Core Measures
State Workforce Agency Performance Ranking
Detection of Overpayments Core Measures • Quarter ending 3/31/06
Benefit Accuracy Measurement (BAM) CY 2005 • BAM Data Summary • BAM Paid Claims Annual Report Overpayment Rate in Detail • CY 2005 Overpayment and Underpayment Rates By State • Payment Accuracy Rates By State for CY 2005 and CY 2004 • Payment Integrity Measures - UI Benefits Paid Rates By State for CY 2005 • Payment Integrity Measures - UI Weeks Paid Rates By State for CY 2005 • Denied Claims Accuracy Rates By State for CY 2005 • BAM State Contacts • BAM Background and Methodology
Tax Performance System (TPS) Computed Measures
51


![University of Waterloo | University of Waterloo - Jamie Yip, Jean … · 2013. 11. 7. · [Py] loc = k q `Pyrene The Birks’ Scheme 8 hν+ Py + Py Py*+ Py (PyPy)* 1/τ M 1/τ E k-1](https://img.pdfslide.net/doc/110x75/5ff9f5e9ba754a16700ad4ff/university-of-waterloo-university-of-waterloo-jamie-yip-jean-2013-11-7.jpg)