Embed Size (px)
Citation preview

1
This project has received funding from the European Union’s Seventh Framework Programmefor research, technological development and demonstration under grant agreement no 266800
FESSUDFINANCIALISATION, ECONOMY, SOCIETY AND SUSTAINABLE DEVELOPMENT
Studies in Financial Systems
No 14
The Financial System in the U.K.
Mimoza Shabani, Judith Tyson, Jan Toporowski,Terry McKinley
ISSN 2052-8027

1
This project has received funding from the European Union’s Seventh Framework Programmefor research, technological development and demonstration under grant agreement no 266800
THE FINANCIAL SYSTEM IN THE UK
Mimoza Shabani, Judith Tyson, Jan Toporowski, Terry McKinley
Affiliations of authors: The School of Oriental and African Studies, University of
London
Executive Summary: Chapter 1 of this Report explains the Political Economic and
Macroeconomic Context of UK Financialization. This dates back to the Bretton Woods
Period when the UK financial system was highly regulated and capital controls brought
cross-border capital flows onto the balance sheet of the Bank of England, allowing the
central bank to insulate the UK financial system from macroeconomic imbalances and
unstable capital flows. However, the largest UK banks always had significant overseas
interests, principally in the British Empire, but also in regions such as Latin America. Already
in 1957, a small opening in this system of cross-border regulation was opened up with
certain London banks being granted the right to operate dollar accounts, not subject to UK
foreign exchange controls for non-UK residents. These dollar accounts, in which foreign
exchange could be bought and sold, and borrowed and lent for activities and at rates of
exchange and interest that were outside the regulations and ceilings imposed on domestic
residents. The rapid expansion of transactions in these accounts, known as Euro-markets,
eventually undermined the credit and foreign exchange controls affecting UK residents. A
key shift occurred when sterling was devalued in 1967, which, far from causing a flight of
overseas depositors as was argued by key bankers at the time, actually accelerated the
internationalisation of UK financial markets, as measured by the presence of foreign banks
in London. From 1970 this coincided with exchange rate instability, culminating in the
elimination of foreign exchange regulation in 1979. In 1986 trading on the London Stock
Exchange and banking markets were liberalised. Instability of exchange rates, asset prices,

2
This project has received funding from the European Union’s Seventh Framework Programmefor research, technological development and demonstration under grant agreement no 266800
and interest rates led to a proliferation of futures markets and forward agreements that
lasted through until the crisis of 2007 dampened activity in the markets.
Chapter 2 looks in greater detail at what the report calls ‘empirical’, or observed,
financialization: the rising scale, complexity and proliferation of finance, from the rise of
globalised banking in the 1970s through to the increasing specialisation and financial
innovation of the twenty-first century. A key consequence of growing internationalisation
was deregulation, which was deemed central to the maintenance of a stabilising capital
balance. With growing specialisation in financial markets, and efforts by banks to secure
presence in different markets, the share of banking and financial services in GDP rises
inexorably, up to the present financial crisis. This is shown by the growth and expansion of
pension funds, insurance companies, investment funds, and retail and investment banks.
Deregulation then gives rise to instability, culminating in the 1987 stock market crash. Rapid
recovery from this seemed to confirm the fundamental wisdom of deregulation and a new
stage of financialization emerges in the 1990s with new institutions spun off from
investment banking, in the form of hedge funds and private equity firms. These, together
with off-shore and non-bank subsidiaries of banks, then come to constitute the shadow
banking system. From 1988 capital requirements as promoted by the Basel Committee on
Banking Supervision of the Bank for International Settlements, come to regarded as a global
template for banking regulation.
Chapter 3 examines in detail key issues in the financialization of the UK economy. While
the growth and deregulation of banking and finance was promoted as a way of creating a
more balanced economy, in fact, despite the oil boom of the 1980s and 1990s, the economy
succumbs to deindustrialisation and continuing low rates of investment in fixed capital and
industrial (as opposed to information) technologies. Paramount in this is the process of
privatization, applied to pensions and state industries in the 1980s and 1990s. This was
associated with the promotion of ‘light touch’ regulation, and growing competition between
financial intermediaries, such competition being deemed a sufficient condition for the
efficiency of the financial system. This process was associated with an expansion of the

3
This project has received funding from the European Union’s Seventh Framework Programmefor research, technological development and demonstration under grant agreement no 266800
range of financial markets accessible to large and multinational companies with limited
benefit for small and medium-sized enterprises, despite the largely cyclical growth of
venture capital funds, the unlisted securities market, and alternative investment
opportunities associated with the stock market. Financing possibilities have been reduced
since the financial crisis that started in the UK in 2007 and has been exacerbated by the
exposure of UK banks to the crisis in the Euro-zone. Following the Vickers Report the
fragmentation of financial regulation and its separation from lender of last resort facilities
has been reduced, with regulation being returned to the Bank of England. Capital and
gearing requirements are being raised. There is also greater coordination of banking
regulation in the European Union, as a response to the difficulties in the European
Monetary Union.
Finally, Chapter 4 examines issues in ‘structural’ financialization: the role of developments
in the financial system in creating financial insecurity and economic inequality, in particular
growing inequalities of wealth and income. Here a key political factor has been the
promotion of finance and debt as alternatives to the welfare state, in the form of privatised
pensions and consumer debt and the popularisation of shareholding through privatisation.
Far from concentrating risk in the financial markets, and transferring it to those most
capable of bearing it, as is cheerfully assumed in the financial textbooks, households are
increasingly bearing the risks of a less stable financial system and economy. Poverty and
economic marginalisation exist in stark contrast to an investment bank culture of large
bonuses, underpinning conspicuous consumption by a small financial elite. The association
this bonus culture was exposed in the financial crisis since 2007, when bankers’ super-sized
incomes appeared to be guaranteed by the government with tax-payers’ money. This was
temporarily checked by the financial crisis since 2007, and bonus conditions have been
made less generous. Nevertheless, the dependence of the economy and consumers on
inflating asset markets remains.
Key words: Banking, capital markets, household debt , derivatives, risk

4
This project has received funding from the European Union’s Seventh Framework Programmefor research, technological development and demonstration under grant agreement no 266800
Date of publication as FESSUD Study: February 2015
Journal of Economic Literature classification E44, G01, G21, G22, G23, G28
Contact details: Jan Toporowski ([email protected])
Acknowledgments: The research leading to these results has received funding from the
European Union Seventh Framework Programme (FP7/2007-2013) under grant agreement
n° 266800.
We are grateful to Andrew Brown, Malcolm Sawyer and David Spencer who commented on
earlier drafts of this paper.
Website: www.fessud.eu
5
This project has received funding from the European Union’s Seventh Framework Programmefor research, technological development and demonstration under grant agreement no 266800
Contents
List of abbreviations........................................................................................... 6
1 The Political Economic & Macroeconomic Context of UK Financialization .... 91.1 The Decline of the Bretton Woods Era (1970-1990) .......................................... 91.2 Liberalising the Financial Markets (1990-2007)............................................... 161.3 Post Crisis Economic Conditions & Policy (2007 to date)................................. 20
2 Empirical Financialization: The Rising Scale, Complexity & Proliferation ofFinance ............................................................................................................ 26
2.1 Introduction ..................................................................................................... 242.2 The Rise of Globalised Banking in the UK (1975-1990) .................................... 25
2.2.1 1980s & Early 1990s Financial Instability & Regulatory Responses ................. 292.3 The Deepening & Proliferation of Empirical Financialization (1990-2010) ...... 34
2.3.1 The Growth of Financial Services within the Economy: Share of GNP. BankingAssets & Employment ...................................................................................................... 342.3.2 Increasing Scale of Financial Markets in “Vanilla” Products............................ 422.3.3 Increasing Complexity of Financial Markets & Products .................................. 452.3.4 Increasing Scale of the “Shadow Banking” System .......................................... 50
2.4 The Global Financial Crisis and the UK (2007 - 2012) ...................................... 532.4.1 Events & Regulatory Responses to the Crisis in the UK (2007-2011) ............... 542.4.2 Regulatory Responses in the UK ....................................................................... 69
2.5 UK Financial Institutions & Their Roles in Financialization............................. 722.5.1 Introduction: Financial Intermediation and the Role of Intermediaries............ 722.5.2 Introduction to the Main Types of Intermediaries ............................................. 782.5.3 Investment Banking ........................................................................................... 832.5.4 Retail Banking.................................................................................................... 972.5.5 Investment Institutions .................................................................................... 1092.5.6 Hedge Funds and Private Equity Funds........................................................... 113
3 Detailed Issues in UK Financialization ..................................................... 1173.1 The Financial Sector and Restructuring of the Economy ............................... 1173.2 The Creation of an Unbalanced Economy ...................................................... 1223.3 The Evolution of “Light Touch” Regulation .................................................... 1283.4 Key Changes in Regulation since 1980s......................................................... 138
3.4.1 The Breakdown of Informal Regulation........................................................... 1383.4.2 Deregulation of Financial Markets in the UK .................................................. 1393.4.3 Post 2007-08 Financial Crisis Regulation and the Vickers report................... 141
3.5 Degree and Nature of Competition between Financial Institutions ............... 1453.6 Privatization as Ideology ................................................................................ 1503.7 Changing Sources of Funds ........................................................................... 159

6
This project has received funding from the European Union’s Seventh Framework Programmefor research, technological development and demonstration under grant agreement no 266800
3.8 Sources of Funds and the Financial Crisis..................................................... 1693.8.1 Sources of Funds for SMEs.............................................................................. 177
3.9 Currency Markets & Financialization............................................................. 1863.10 The UK Financial System and European Integration .................................. 198
4 Structural Financialization ....................................................................... 2044.1 Introduction ................................................................................................... 2044.2 The “Construction of Consent”: Culture & Norms of the Financial System ... 2044.3 The Ubiquitous Rise in Household and Corporate Debt ................................. 2174.4 Accompanying Surges in Debt and Asset Inflation......................................... 2204.5 Consumption, Savings & Borrowing in the Household Sector ....................... 2004.6 Financial Fragility & Production in the Corporate Sector .............................. 2274.7 Rising Inequality in the UK............................................................................. 228
4.7.1 Introduction...................................................................................................... 2284.7.2 Income Inequality: Labour Share, “Waged” Elites and Bonuses..................... 2314.7.3 The Role & Extent of Bonuses in Inequality..................................................... 2364.7.4 Asset Inequality................................................................................................ 237
4.8 The Assumption of Risk by Households ......................................................... 2424.9 Political Economy of Inequality and Insecurity .............................................. 244
5 Bibliography............................................................................................. 246

7
This project has received funding from the European Union’s Seventh Framework Programmefor research, technological development and demonstration under grant agreement no 266800
List of abbreviationsABS Asset-backed Securities
ATM Automated Teller Machine
AUM Assets under management
BCCI Bank of Credit and Commerce International
BIS Bank for International Settlements
BoE Bank of England
BT British Telecom
CC Competition Commission
CD Certificate of deposit
CDO Collateralised debt obligations
CP Commercial paper
DTI The Department of Trade and Industry
ECB European Central Bank
FCA Financial Conduct Authority
FIRE Finance, Insurance and Real Estate
FPC Financial Policy Committee
FRN Floating rate note
FSA Financial Services Authority
FSB Financial Stability Board
FSR Financial Stability Report
FTSE Financial Times Stock Exchange
FX Foreign exchange
G10 The Group of 10 financially advanced economies, of which, confusingly,

8
This project has received funding from the European Union’s Seventh Framework Programmefor research, technological development and demonstration under grant agreement no 266800
there are eleven: Belgium, Canada, France, Germany, Italy, Japan, theNetherlands, Sweden Switzerland, the United Kingdom, the UnitedStates of America.
GNP Gross National Product
HSBC Hong Kong and Shanghai Banking Corporation
ICB Independent Commission for Banking
IPO Initial Public Offering
IIP International Investment Position
ISA Individual Savings Account
ISDA International Swap Dealers Association
LIBOR London Inter-Bank Offered Rate
LSE London Stock Exchange
LIFFE London International Financial Futures & Options Exchange
LTI Loan to Income Ratio
M&A Mergers and acquisitions
MBS Mortgage backed securities
OEIC Open-ended Investment Company
OFT Office of Fair Trading
OTC Over the Counter
PFI Act Prevention of Fraud (Investment) Act of 1958
PNFC Private Non-financial Corporations
PRA Prudential Regulatory Authority
QE Quantitative Easing
RBS Royal Bank of Scotland
RoR Receiver of Rent

9
This project has received funding from the European Union’s Seventh Framework Programmefor research, technological development and demonstration under grant agreement no 266800
SIB Securities and Investment Board
SIV Special investment vehicle
SME Small and Medium-sized Enterprises
SPV Special purpose vehicle
SRO Self-Regulatory Organisation
SRR Special Resolution Regime
UK United Kingdom
US United States of America
VaR Value at Risk

10
This project has received funding from the European Union’s Seventh Framework Programmefor research, technological development and demonstration under grant agreement no 266800
1 The Political Economic & Macroeconomic Context of UKFinancialization
1.1 The Decline of the Bretton Woods Era (1970-1990)The main centre of British financial markets is the City of London. For centuries the
City has been a global trade centre, serving British industry’s international trade
and commerce. However, it was during the 1960s and 1970s that the City’s profits
and growth started to become “disconnected” from British industry. Profits
generated by the financial businesses in the City were less reliant on the investment
and trade related to industrial goods and services, as London adopted a new
international position by becoming a leading centre in the lending and borrowing of
the US dollar. Tight US regulations, such as Regulation Q of the Federal Reserve
Bank, limited the rates of interest payable on US deposits. This change in itself
increased the desire of those that held dollars to deposit them in banks that were
free from US controls, and thus allowing them to earn higher interest.
This change gave rise to the Eurodollar business, with the City of London becoming
the centre of such transactions. Its established role as an international trade centre,
and the relaxed regulation of offshore transactions allowed the City to become the
world’s leading centre for the borrowing and lending of dollars. The term
“Eurodollars” was used for the dollar deposits placed in European banks, which
offered more competitive deposit and loan interest rates and, most importantly,
were not under the jurisdiction of US authorities, that is, they were outside US
political jurisdiction and restrictions on interest payments. The City became an
intermediary for channelling those dollars as loans to foreign governments and
multinational corporations.
The origins of the Eurodollar market can be traced back to 1958, i.e., to the banking
facilities that London offered to the countries of the Soviet bloc at that time. These
countries, which had acquired US dollars from their export of raw materials, were
disinclined to deposit them in US banks, due to the risk that these deposits might be

11
This project has received funding from the European Union’s Seventh Framework Programmefor research, technological development and demonstration under grant agreement no 266800
frozen or seized in a diplomatic conflict between the world’s two superpowers, the
US and the Soviet Union. Also at the time, Bank of England restricted the external
use of sterling, which induced UK banks to turn to the US dollar as a means of
securing the City’s leading role in the financing of the trade of the world (Pilbeam
2010).
As a result of the hike in oil prices in 1973-1974, the trade surpluses of the oil
exporting countries also contributed to the rise of the Eurodollar market, as those
countries deposited their accumulated surpluses in non-US banks. The importance
of the City of London with regard to Eurodollar business was reflected in the use of
the London Interbank Offered Rate (LIBOR) as the pivotal rate for the Eurodollar
markets.
In addition to holding the reserves of the commercial international banks, London
was also host to the official reserves of many foreign governments. After the UK left
the gold standard in 1931, and due to the country’s pre-eminence in trade and
finance, other governments that had also abandoned the gold standard pegged their
currencies to sterling and kept their foreign exchange reserves in London. These
countries had preferential access to the London’s capital market. The value of
sterling was perceived to have been stable in the period following the abandonment
of the link to gold and, most importantly, it was a currency that was widely
acceptable. The result was the formation of the sterling area, in which member
countries enjoyed, to some extent, free access to one another’s capital markets
because they were able to make cross-border payments through London. The
sterling area, which lasted until the late 1970s, was the focus of the City’s export of
capital and bolstered its role as an international financial centre.
However, Coakley and Harris (1983) suggest that it was 1967 that marked the
beginning of a “new and uniquely fruitful international position” for London. Under
the Bretton Woods system of fixed exchange rates established in 1944, member
countries, including Britain, defined the value of their currency in US dollars , and
the US tied the value of its currency to gold. During the decades after the Second

12
This project has received funding from the European Union’s Seventh Framework Programmefor research, technological development and demonstration under grant agreement no 266800
World War, the UK experienced balance of payment deficits, which made it difficult
for the government to defend the pound without heavy drains on its foreign exchange
reserves. On 19 November 1967, the British government spent £200m to ensure that
sterling’s exchange rate did not fall. However, on the very same day, the Labour
government at the time decided to devalue the pound from $2.80 to $2.40, aiming to
tackle thereby the “root cause” of British economic problems.1
The then prime minister of the UK, Harold Wilson, defended the devaluation by
stating that “it does not mean, of course, that the pound here in Britain, in your
pocket or purse or in your bank, had been devalued” but it meant that the UK’s
exports were to become more competitive. The City at the time opposed the idea of
the devaluation of the pound, claiming that it would hurt foreign investors whose
deposits and investments were held in sterling. However, the sterling devaluation
heralded a new role for the City as a multilateral offshore centre. The Eurodollar
business increased from £1 billion in 1959 to around £800 billion in 1978 (Bernstein
2011). Due to the substantial growth of this market, foreign banks established new
branches in London, which reinforced its further expansion. The number of foreign
banks in London grew from 113 in 1967 to 395 in 1978 (Bernstein 2011).
After three years of pleading with the government not to devalue the pound, the City
found out in the years that followed 1967 that not only could it cope with a
depreciated sterling but also such a depreciation gave it the incentive to expand its
operations and gain a leading role as an international financial centre. However, the
foreign exchange controls, which limited overseas investment, damaged the City’s
international role and hampered its competitiveness. These exchange controls
limited the ability of businesses and individuals resident in the UK to acquire foreign
currency for overseas investment purposes. The Eurodollar markets were open only
to non-residents of the UK.
1http://news.bbc.co.uk/onthisday/hi/dates/stories/november/19/newsid_3208000/3208396.stmaccessed 20 December 2012

13
This project has received funding from the European Union’s Seventh Framework Programmefor research, technological development and demonstration under grant agreement no 266800
The City of London lobbied persistently for the removal of such restrictions in order
to have the freedom to export capital to the most profitable countries of the world
(Coakley and Harris 1983). In 1979, the newly elected Conservative government
abolished UK’s exchange controls. Following this move, British institutional
investors, such as pension funds, insurance companies, unit trusts and investment
trusts, significantly increased their overseas investment. Within the first six months
after abolishing capital control, pension funds and insurance companies invested
£146 million in foreign equities. By mid-1980 this figure had risen to £663 million
(Coakley and Harris 1983).
The abolition of foreign exchange controls had a huge impact on the UK’s overseas
investment. The UK financial system experienced substantial capital outflows in the
early 1980s. The outflow at that time was accelerating at a much higher rate than
investment in British equity. This trend raised concerns about the impact of the City
on the domestic economy. The main issue was whether British industry was getting
the financial support it needed from the City. To defend their role and support their
right to place funds globally, the City argued that the huge outflows were an
adjustment process in balancing overseas and domestic assets. However,
institutional investors’ overseas investment continued to be high in the subsequent
years.
Figure 1-1 shows net investment by pension funds in UK corporate securities
(ordinary shares) and in overseas securities (ordinary shares) in the period between
1975 and 2011. Net investment in overseas corporate securities in 1979 was £459
million, and by 1982 it amounted to around £2.4 billion. Net overseas investment
continued to increase further, and has dominated UK corporate securities
investment since the early 1990s. There has been substantial net disinvestment in
UK equities by British pension funds since the early 1990s. This trend might have
been affected by the pension reforms of the time, requiring pension funds to switch
towards larger holdings of bonds. But the disinvestment in British equities contrasts
with the positive net investment in overseas equities until 2005.

14
This project has received funding from the European Union’s Seventh Framework Programmefor research, technological development and demonstration under grant agreement no 266800
Figure 1-1 Net Investment by Pension Funds 1975-2011
The investment in overseas equities by British insurance companies’ grew at a
slower rate than that of pension funds. Nevertheless, the insurance companies have
still been running down their UK corporate investment portfolios since the early
2000s. Figure 1-2 shows the trend of investment by insurance companies in UK
corporate securities (ordinary shares) and overseas corporate securities (ordinary
shares) from 1975 to 2011. The record of equity investment by British-based
insurance companies is similar to that of the pension funds, except that the
insurance companies started their net UK disinvestment approximately ten years
after the pension funds started theirs.
-30000
-25000
-20000
-15000
-10000
-5000
0
5000
10000
15000
20000
£millions
Source:ONS
UK corporate securities
Overseas corporatesecurities

15
This project has received funding from the European Union’s Seventh Framework Programmefor research, technological development and demonstration under grant agreement no 266800
Figure 1-2 Net Investment by Insurance Companies 1975-2011
Both Figure 1-1 and 1-2 do not support the balancing argument raised by the City’s
advocates in the years following the abolition of exchange controls. In fact, by 1981,
as overseas portfolio investment boomed, domestic investment in new plant and
machinery slumped, accounting in that year for only 12.9% of GDP (Coakley and
Harris 1983). As discussed below (see Section 3.7) both inward and outward
investment increased significantly following the removal of exchange controls in
1979. However, portfolio outflows were by far greater than portfolio inflows.
Outward investment increased from an average £258 million during the period 1975-
1978 to £4,890 million in the period 1980-83 (an increase of 1,800%), whereas inward
flows of portfolio investment increased by 57%.(Taylor and Tonks, 1989)2 In
particular, the overseas investment of financial institutions increased from £1 billion
in 1978 to £7 billion in 1983. Overseas bank lending in sterling rose from around £6
million a month in 1979 to some £300 million per month in 1981.
-20000
-15000
-10000
-5000
0
5000
10000
15000
20000£millions
Source:ONS
UK corporate securities
Overseas corporate securities

16
This project has received funding from the European Union’s Seventh Framework Programmefor research, technological development and demonstration under grant agreement no 266800
1.2 Liberalising the Financial Markets (1990-2007)
In the UK the election of Margaret Thatcher in May 1979 marked the death- knell of
the post-war consensus based on regulated financial markets and the use of a large
public sector to secure high employment. This consensus, which had existed until
the early 1970s, had delivered stable economic growth and employment. The socio-
political zeitgeist associated with that consensus supported the deepening of the
welfare state and the dominance of labour over capital. However, during the 1970s,
increasing economic and political instability, driven by oil price shocks and strains
upon the Bretton Woods international system of capital and exchange rate controls,
caused prolonged stagflation and this consensus finally collapsed in “the winter of
discontent” of 1978.
The Thatcher Government ushered in a new era of British politics with a series of
policies that came to be known as ‘neo-liberalism’. The policies and the ideas behind
them affected not only economic policy and policy-making, but also social and
political norms and ideals. Neo-liberalism is defined by Harvey as “in the first
instance a theory of political economic practises that proposes that human wellbeing
can best be advanced by liberating entrepreneurial freedoms and skills within an
institutional framework characterised by strong private property rights, free
markets and free trade” (Harvey, 2005, p2). Economically this was to manifest itself
in the UK as deregulation of economic activity, withdrawal of the state from
industrial planning and enterprise and the weakening and dismantling of the welfare
state. The economic policies of neo-liberalism included restrictions on organised
and protected labour and the privatization of state industries, including public
utilities such as energy, water and transport, coal mining, car manufacturing and
ship building, many of which subsequently suffered significant decline in the UK as
private investment in those industries collapsed.
Where decline did not take place, such as in the privatised utilities, it was often at the
expense of high prices charged to consumers and continuing, sometimes even
increased, government subsidies. Monetary policy focused on taming the very high

17
This project has received funding from the European Union’s Seventh Framework Programmefor research, technological development and demonstration under grant agreement no 266800
rates of inflation experienced in the 1970s through high interest rates and attempts
to restrict the growth of credit by reducing the fiscal deficit caused by the economic
recession of the early 1980s. Little regard was paid to the resulting very high levels
of unemployment. (Then, as now, the attempt to reduce the fiscal deficit by fiscal
austerity failed since it drove the economy even deeper into recession). Socially and
politically, the era was to be characterised by an idealization of individualism and
conspicuous consumption, justified by meritocracy-driven elitism.
However, as illustrated in Figure 1-3, below, by the early 1990s, the harsh neo-
liberal economic medicine of the 1980s seemed to be working. After another sharp
recession in the early 1990s economic conditions eventually improved and ushered
in a period of positive economic conditions and stability. Retrospectively termed “The
Great Moderation”, the conventional macroeconomic fundamentals were strong,
with low inflation, low unemployment and stable, steady economic growth. Equally
important, earlier expectations of a negative relationship between price inflation and
unemployment were not realised, so that economic growth was characterised by
both rising employment and low inflation, a ‘Goldilocks’ scenario in which the
economy was neither too hot (inflationary) nor too cold (deflationary), but just right.

18
This project has received funding from the European Union’s Seventh Framework Programmefor research, technological development and demonstration under grant agreement no 266800
Figure 1-3 The "Goldilocks" Indicators for the UK (1975-2011)
Source: Bank of England, Datastream.
Just how unprecedented the Great Moderation3 was can also been seen byexamining long term data, as illustrated for the UK in Figures 1-4 and 1-5 below.
Figure 1-4 shows inflation for the period 1993-2007 against 150 years of data and
illustrates the exceptionally low levels of both inflation and its volatility. Similarly,
Figure 1-5 shows GDP growth for 5 year periods from 1958 to 2007 and illustrates
that during the Great Moderation, GNP growth was lower but stable and constantly
positive. Some commentators went as far as to declare the business cycle dead. For
example, Lucas (2003) commented that “macroeconomics... has succeeded: its
central problem of depression-prevention has been solved, for all practical
purposes" (p. 1).
3 This term originates from Stock and Watson (2002) .
-6.0%
-1.0%
4.0%
9.0%
14.0%
19.0%
24.0%
19
76
19
78
19
80
19
82
19
84
19
86
19
88
19
90
19
92
19
94
19
96
19
98
20
00
20
02
20
04
20
06
20
08
20
10
GDP growth
Interest Rate
Inflation
Unemployment

19
This project has received funding from the European Union’s Seventh Framework Programmefor research, technological development and demonstration under grant agreement no 266800
Figure 1-4 UK Growth and Inflation over 150
Years
Source: Barwell and Burrows, 2010
Figure 1-5: Quarterly Nominal GDP in UK*4
Source: Barwell and Burrows, 2010
In political circles the successes of this period5, and the general impression of
prosperity in the UK, were attributed to the success of the neo-liberal agenda and,
4 Post 2007 data not available from the secondary source.5 In economics there is no firm consensus on the underlying causes of the Great Moderation.Explanations vary widely and broad categories of explanation include (i) structural change ineconomic institutions, including increased depth and sophistication of financial markets andderegulation in many industries; (ii) improved performance of macroeconomic policies, particularly
-20
-15
-10
-5
0
5
10
15
20
25
30
-10 -5 0 5 10
RP
Iin
fla
tio
n(p
erce
nt)
Real GDP growth (per cent)
1858-1992
1993-2007
4
2
0
2
4
6
8
10
1958- 62
1963- 67
1968- 72
1973- 77
1978- 82
1983- 87
1988- 92
1993- 97
1998- 02
2003- 07
-
+
Per cent

20
This project has received funding from the European Union’s Seventh Framework Programmefor research, technological development and demonstration under grant agreement no 266800
despite the transfer of power to Blair’s “New Labour” in 1997, there was a
continuum of essentially neo-liberal economic and social policy throughout this
whole period.
This broad political economy was nowhere more apparent than in the financial
sector. Rapid and extensive liberalisation and globalization of the financial markets
resulted in huge increases in their scale, depth and complexity. London became a
global centre for financial activity, and the channelling of international credit through
its markets became an important means by which financial markets in other
countries were activated. Supported by policy favouring ‘wealth-creators’ the leading
participants in the financial sector exemplified the “greed is good”6 ethos of
materialistic individualism of the period, but such proponents also took up leading
positions in economic policy-making.
However, and as this report will also discuss in depth, beneath the apparent good
times, economic stability and prosperity were being undermined. In particular, credit
in all forms increased hugely, including in the government, household and corporate
sectors, creating highly leveraged and indebted balance sheets. Equally, asset
markets, most notably in the UK in housing but also stock and commercial real
estate, experienced prolonged and unprecedented inflation. Credit and asset
inflation were closely interrelated with the funnelling of credit into asset markets in
a Minsky cycle.
1.3 Post Crisis Economic Conditions & Policy (2007 to date)
The pathological conditions underlying the financial boom were to be exposed in
2007 when the global financial crisis broke. In the UK financial markets seized up
monetary policy; and (iii) the “good luck” explanation of a random reduction in economic shocks and(iv) the impact of cheap Chinese imports on inflationary pressures.
6 From “Wall Street”, the 1997 film in which the lead fictional character, Gordon Gecko declared,“Greed is good”, as well as “Lunch is for wimps”.

21
This project has received funding from the European Union’s Seventh Framework Programmefor research, technological development and demonstration under grant agreement no 266800
and institutions required publically funded bailouts to prevent banking failures.
Public debt expanded further. Asset markets, including housing, fell sharply.
Following the onset of the crisis, the “Goldilocks” scenario, namely, the combination
of economic growth with low inflation and low unemployment, came to an abrupt
end. As illustrated in Figure 1-6 below, broad economic conditions rapidly
deteriorated, first with a sharp contraction in growth in 2008 and a cumulative fall in
output of almost 6% by 2009 (Inflation Report, November, 2009). By 2012, the UK had
experienced a double-dip recession, with a contraction in the third quarter of 2012
threatening a triple-dip recession. This sharp recession was accompanied by sharply
rising unemployment and a growing output gap. The rate of unemployment
deteriorated to around 8% from 2009 onwards. However, this ratio does not include
underemployment: those looking for additional work but being unable to find it
accounted for a further 10-15% of the workforce. Output declined and, by 2012,
remained significantly below its pre-crisis level. Output was also affected by the
problems in the euro area, which is the UK’s largest trading partner. The continuing
crisis in that area after 2009 inevitably had an impact on UK exports and production
levels.
Figure 1-6 UK Economic Indicators, 2000 to the 2nd Quarter of 2012
Source: IMF
-6.0%
-4.0%
-2.0%
0.0%
2.0%
4.0%
6.0%
8.0%
10.0%
GNP
Output gap
Inflation
Unemployment
22
This project has received funding from the European Union’s Seventh Framework Programmefor research, technological development and demonstration under grant agreement no 266800
In addition, inflation, which is measured by the consumer price index, increased
from below 2%, the central bank inflation-target, to 4.5% in 2011 and peaked at 5.2%
in September 2012. Throughout the period since 2007, the Bank of England
repeatedly attributed such inflation to “temporary” factors ( Bank of England Annual
Report, 2012) or “shocks” (Bank of England Annual Report 2011), including high
energy prices, high food prices, increases in the rate of VAT, rising student fees,
higher import prices and so on. The policy response was very limited because
forecasts indicated that inflation would fall back below the 2% target in the medium
term. However, such a stance was complacent in the face of much lower wage
inflation, indicating falling demand in the economy.
In response to criticism that this kind of policy response was inappropriate the
Governor of the Bank of England defended it, commenting, “Meet (ing) the inflation
target... has been particularly challenging ... (But) Despite its volatility, inflation
remains low by historic standards and on track to meet the target in the medium
term” (BoE Annual Report, 2010, p3). Again in 2011, the Governor commented that
“Inflation was above the (2%) target throughout the year... Three large shocks have
helped to push up the price level during the past four years: the depreciation of
sterling during 2007 and 2008; sharp increases in commodity prices; and changes in
the standard rate of VAT. The most likely outcome is that these factors will not
continue to push up the price level in the future ... It would have been unwise to have
tightened policy sharply during 2010 in order to bring inflation back to the target
rapidly. If the MPC had raised Bank Rate significantly, inflation might well have
started to fall, but only because the recovery would have been even slower and
unemployment higher than now” (Bank of England Annual Report, 2011, p.2).
Policy responses effectively abandoned inflation targeting by the Bank of England, in
favour of policies focused on improving broad macroeconomic conditions and
financial stability. Measures to address financial stability are discussed in section 2.4
in detail. Initially, the monetary policy response was a sharp reduction of interest
23
This project has received funding from the European Union’s Seventh Framework Programmefor research, technological development and demonstration under grant agreement no 266800
rates. From October 2008, central banks around the world cut interest rates in a
coordinated process. The Bank of England maintained the interest rate cuts, holding
its official repo rate at the historically low level of 0.5% from March 2009 onwards.
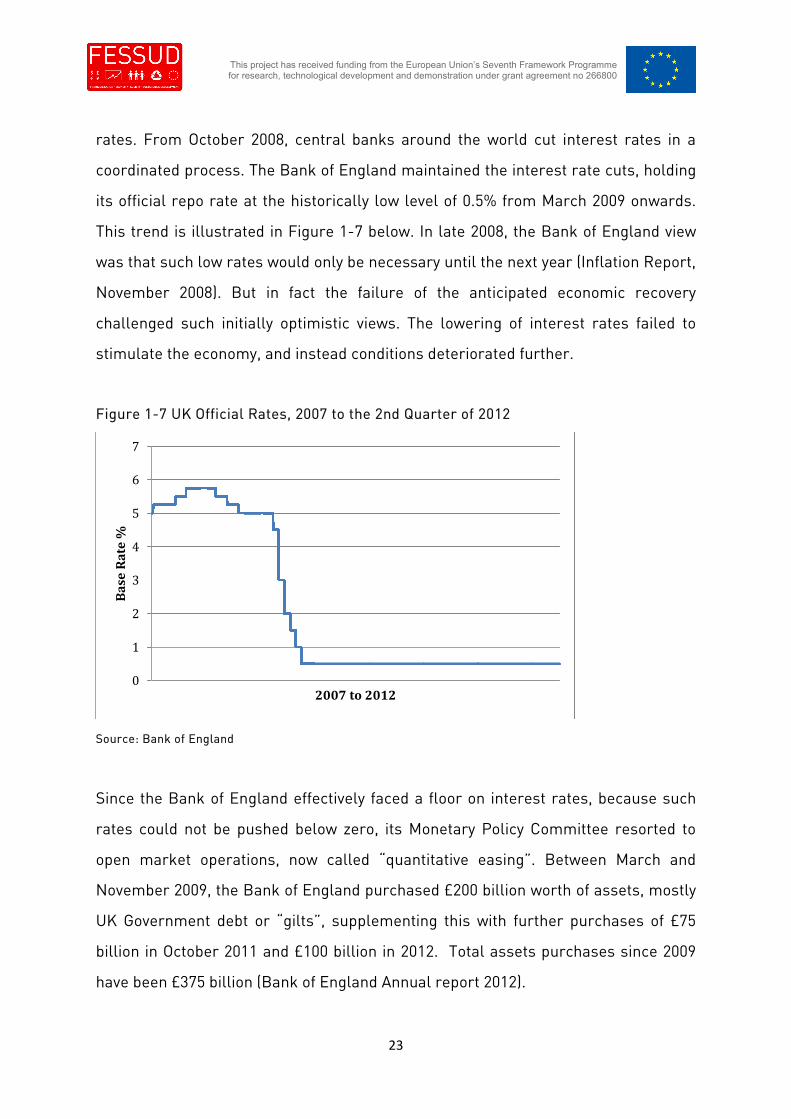
This trend is illustrated in Figure 1-7 below. In late 2008, the Bank of England view
was that such low rates would only be necessary until the next year (Inflation Report,
November 2008). But in fact the failure of the anticipated economic recovery
challenged such initially optimistic views. The lowering of interest rates failed to
stimulate the economy, and instead conditions deteriorated further.
Figure 1-7 UK Official Rates, 2007 to the 2nd Quarter of 2012
Source: Bank of England
Since the Bank of England effectively faced a floor on interest rates, because such
rates could not be pushed below zero, its Monetary Policy Committee resorted to
open market operations, now called “quantitative easing”. Between March and
November 2009, the Bank of England purchased £200 billion worth of assets, mostly
UK Government debt or “gilts”, supplementing this with further purchases of £75
billion in October 2011 and £100 billion in 2012. Total assets purchases since 2009
have been £375 billion (Bank of England Annual report 2012).
0
1
2
3
4
5
6
7
Ba
seR
ate
%
2007 to 2012

24
This project has received funding from the European Union’s Seventh Framework Programmefor research, technological development and demonstration under grant agreement no 266800
The policy goal was to inject money directly into the economy in order to boost
nominal demand (Source: Bank of England Inflation Report 2012/3). However, the
immediate impact of such open market operations is invariably on the balance
sheets of the commercial banks that sell bonds to the central bank. Those
commercial banks obtain in exchange reserves at the Bank of England. Whether
anyone else actually receives any more money depends on the amount of lending by
commercial banks. However, far from increasing, the amount of lending by retail
banks has fallen since the crisis began (see Section 2.4). Quantitative easing
therefore remains controversial as an instrument for stimulating demand in the
economy, given the continued poor economic performance in the UK. But it is
difficult to assess the extent of its failure given the lack of any obvious counterfactual
sequence of economic evolution.
Clearly, the lack of economic recovery was partially due to the balance sheet
adjustment that began following the financial crisis in both banking institutions and
households. The banking system has reduced its leverage from extraordinarily high
levels (See 3.7 below) and this has appeared as a contraction in the supply of credit
to households and businesses. In addition, consumer and business confidence has
been damaged by the financial crisis, and both employment and real wages have
fallen. After the crisis broke, consumption and investment were further impaired by
the credit squeeze and the collapse in the housing markets, partly because housing
remains the main security for retail loans. From late 2009, the situation in the UK
was exacerbated by the euro zone crisis. While not directly affecting the UK financial
system, the euro zone crisis reduced demand in the UK’s major trading partner and
depressed confidence further in both the financial system and the economy more
broadly.
However, the sharp decline in the economy, as inflation peaked, was also affected by
government policy. Under the Conservative government elected in 2010, the policy
was to contract government spending and reduce the fiscal deficit. In 2009-10, the
UK's budget deficit was about 11 per cent of GDP. Following the general election of

25
This project has received funding from the European Union’s Seventh Framework Programmefor research, technological development and demonstration under grant agreement no 266800
May 2010, the new Government announced fiscal consolidation measures, raising
taxes and reducing government expenditure, amounting together to a total of 7.4 per
cent of GDP over the fiscal years 2011–12 to 2016–17. Subsequently, additional fiscal
contraction was announced. Under normal circumstances a tightening in fiscal
policy would be counterbalanced by a relaxation in monetary policy. However, with
interest rates at exceptionally low levels already, there was no offsetting monetary
policy response, apart from quantitative easing, whose impact on the economy has
yet to be seen. Keynesian commentators saw this fiscal consolidation as a policy
likely to prolong recession. An estimate of the impact of the policy was a cumulative
loss of output over the period 2011-21 of about £239 billion in 2010 prices, or about
16 per cent of 2010 GDP (Bagaria et al., 2012).
By the end of 2012 the Office for Budgetary Responsibility, the statutory body
charged with monitoring government policy, was forecasting a reduction in the
economy of 0.1 per cent in 2012 with an economic growth forecast for 2013 of a
meagre 1.2 per cent. Meanwhile, the IMF forecast that the economy would shrink by
0.4 per cent in 2012 and would achieve economic growth of only 1.1 per cent in 2013.
This report will now proceed to discuss financialization in the context of this broad
political and economic background.

26
This project has received funding from the European Union’s Seventh Framework Programmefor research, technological development and demonstration under grant agreement no 266800
2 Empirical Financialization: The Rising Scale, Complexity &
Proliferation of Finance
2.1 Introduction
The partial FESSUD definition of ‘financialization’ is large scale expansion and
proliferation of financial markets, deregulation and new financial institutions and
markets, with finance penetrating deep into social and economic processes (see
below)7. However, as Toporowski (2012) has pointed out, an increase in financial
operations, by itself, is not proof of a change in the role of finance in the economy:
‘increased financial turnover that is routinely advanced as evidence of
“financialization” may arise simply because transactions in the real or non-financial
sector entail more credit operations than in the past and need not necessarily mean
that real transactions are now in the service of financial markets ...’ (Toporowski,
2012, p2). This report will use this critique and term the simple expansion and
proliferation of finance as ‘empirical financialization’.
In this section, the report examines empirical financialization as it has manifested
itself in the UK, describing the process and nature of the evolution of the UK banking
sector from a relatively moribund and declining position in the 1970s to its position
today as the major international market for global financial transactions in its time
zone. This section of the report covers both macro-level indicators and detailed
discussion of markets, institutional structures and profitability.
In chapter 5, the report goes on to discuss in detail what will be defined as
‘structural financialization’. Structural financialization is defined as a process that
goes beyond a simple observable expansion of finance to examine the relationship of
finance with aspects of the real economy. It draws on the FESSUD definition of
financialization8 of “the penetration of financing into a widening range of both
economic and social reproduction” including the “dominance of finance over
7 See Terms of Reference for Work Package 28 ibid.
27
This project has received funding from the European Union’s Seventh Framework Programmefor research, technological development and demonstration under grant agreement no 266800
industry” and consumption sustained by credit. The discussion in chapter 5 puts
forward initial thoughts on whether finance has created new structures within the
economy and what those structures might be, including new structures that link
finance to economic instability and to changes in production and consumption. Such
new structures include asset, debt and balance sheet inflation. That chapter will also
examine the role of the rise of finance in creating income- and capital-based
inequality and the subsequent feedback mechanisms of that inequality to the further
deepening of structural financialization.
The UK banking system today differs significantly from the systems that operate in
other European financial centres, and represents an importantly different taxonomy.
This is due to the UK system’s international nature and scale relative to the country’s
domestic economy. This position has a long historical background, dating from the
emergence of London as an international financial centre in the 19th Century and
culminating from the 2000s onwards in its current position as the dominant centre
for international financial markets and activity within the European time zone. As
such it joins New York and Asian financial markets in Tokyo and Hong Kong in
creating a globalised 24-hour financial market.
In the UK the main concentration of international banking institutions and non-
banking financial institutions, including ‘shadow banking’, is in London. These
markets and institutions in London offer important functions for financial markets
such as exchanges, legal jurisdiction and risk management facilities for global over-
the-counter trading.
This report now examines the rise of London to this position from the 1980s onwards
and reviews the empirical indicators of this process.
2.2 The Rise of Globalised Banking in the UK (1975-1990)
Prior to the 1980s British banking had retained its pre-war position as a centre for
multinational trade and commercial banking. However, this was in the context of the
Bretton Woods institutional arrangements, which included strong regulatory control

28
This project has received funding from the European Union’s Seventh Framework Programmefor research, technological development and demonstration under grant agreement no 266800
on capital flows and currency convertibility, limited integration of international
banking operations and constraints on innovation.
From the 1970s onwards, international banking underwent a transformation due to
the development of the Eurodollar market, and the collapse of the Bretton Woods
system of fixed exchange rates, supported by its system of controls on cross-border
capital transfers. The rise of the Eurodollar market was driven by restrictive
regulations in the United States that drove activity offshore and was led by non-UK,
mainly American, banking institutions that used the UK as the host for the new
markets for off-shore dollar deposits (see Chapter 1). Banks engaged in this
process, described by some commentators as the start of the “competition in laxity”
(Franklin, 2001)9, in order to arbitrage regulatory regimes. Such arbitrage gave them
easier and cheaper terms for financing expanded balance sheets. This process made
the UK a preferred host location for international banks because of regulation that
did not require foreign branches to have separate capitalization, maturity constraints
or reserves, as well as because of flexible foreign currency operations for non-
residents and no Glass-Steagal style segregation of commercial from investment
banking.
However, these new markets also precipitated the loss of pre-eminence by British
banks, which were overshadowed by the international expansion of the American
banks that had the advantage of direct access to clearing facilities in New York for
international payments in US dollars, as well as the expansion of Japanese and
continental European banks that could lend on a larger scale. For example, in 1984
British banks held only 7.5% of total international banking assets, representing
fourth place behind the Americans, Japanese and French banks. By 1990 this share
had fallen further to only 4.6% and represented sixth place (Jones, 1993).
9 However, Mullineux (1997) also points out that the various Basle Accords sought to rebalance theseproblems through establishing international standards for capital and similar measures that wereapplied equally to all jurisdictions within the Accord.

29
This project has received funding from the European Union’s Seventh Framework Programmefor research, technological development and demonstration under grant agreement no 266800
This relative decline in UK banking was also part of the overall decline in the
economic significance of the UK and the severe recession that engulfed the UK
economy in 1979-81 under the Thatcher policies of fiscal austerity. British banks’
core business was in serving UK industry and trade but the country lost a fifth of its
manufacturing capacity in the 1979-81 recession and in 1983 Britain suffered its first
trade deficit in manufactured goods for 200 years (Jones, 1993). This meant that
despite the removal of foreign exchange controls on UK residents in 1979, UK banks
suffered a decline in their traditional corporate UK client base while also failing to
acquire new international clients in the face of competition from international banks
that were better able to offer to newly globalising multinationals greater access to
global foreign exchange, money and capital markets.
Many of the UK banks in the 1980s also suffered from a number of ill-judged
management decisions that led to declining profitability and incoherent strategies.
These included extensive cross border lending, which had reached 16% of
developing country debt and 45% of British banks lending portfolios by 1985. But this
lending led to huge debt write offs that continued through the 1980s following the
Mexican default of 1982 and the ensuing developing country debt crisis (Jones, 1993).
These credit losses were then repeated through overexposure of banks to the UK
housing market, which collapsed after a significant bubble in the late 1980s. In
anticipation of events that were to occur in 2007, the banks at that time were
criticised for their risk management failures, namely, prioritising revenues and
asset expansion over prudence and succumbing to ‘herd’ behaviour (Bird, 1989) that
resulted in lending practises that were only ‘loosely related’ to underlying credit
risks (Jones, 1993).
British banks also embarked on international expansion strategies, notably making
acquisitions and establishing new branches in the United States in response to the
perceived competitive threats of international expansion by US banks. The US
banking assets of British banks rose from $25.1 billion in 1980 to $57.0 billion by
1985 (Damanpour, 1990), based on operations including consumer finance and

30
This project has received funding from the European Union’s Seventh Framework Programmefor research, technological development and demonstration under grant agreement no 266800
commercial banking. Acquisition of smaller US banks and the opening of US
branches and representative offices were undertaken by Barclays, Hong Kong and
Shanghai Bank, Midland Bank, Standard Chartered Bank, National Westminster
Bank and the Royal Bank of Scotland. However, this expansionary strategy was short
lived. Poor financial performance—partially due to the economic recession and
housing market collapse in the US during the 1980s and a lack of strategy in markets
that were increasingly driven by asset price cycles and, often, repeated capital
injections—led to divestments of US assets of $44.1 billion in 1990 (Damanpour,
1990; Jones, 1993).
These bold but ultimately unsuccessful attempts to enter US markets were in
contrast to the reticence of UK banks in operating in continental Europe during the
1980s, particularly given the UK’s accession to the European Community in 1973 and
the imminent creation of the 1992 single market. Prior to the single market, UK
banks were constrained by local regulations that made it difficult to acquire
domestic banks in most European markets because UK banks could only buy limited
shareholdings (Jones, 1993). However, responses to the single market included
disposals of European assets to continental European banks. For example, HSBC
sold all of its continental European branches to Westdeutsche Bank and Midland
Bank. Hence, direct investment in continental Europe by UK banks remained small.
Overall the 1980s for UK banking could be summarised as a period of moribund
performance and the dominance of their own domestic markets by international,
notably US, competitors.
However, despite these overall trends the seeds of a huge renaissance for banking in
the UK, if not UK banks, were being sown in the form of regulatory reform. Detailed
discussion of the regulatory environment in the period under discussion is included
in Section 3.2. However, in anticipation of such a discussion, note that prior to the
mid-1980s, regulations for UK remained restraining, including a strict demarcation
of institutions and activities. For example, there was strict demarcation of activities
among types of institutions (such as clearing banking, bill-discounting, stock broking

31
This project has received funding from the European Union’s Seventh Framework Programmefor research, technological development and demonstration under grant agreement no 266800
and mortgage provision) as well as pricing controls, such as fixed commission
systems and cartel based interest rates (Buckle & Thompson, 2004). However, in the
mid-1980s the Thatcher government focused its deregulating zeal on the financial
sector and a number of significant deregulating events, including legislation, were
enacted. The ideology behind these reforms was undoubtedly neo-liberal.
Nevertheless, many observers welcomed them as a way to dismantle the ‘old boys’
clubs that assured a comfortable income for the directors and managers of banks,
without the need for any strenuous activity10. Their markets were opened to the
innovation and competition that was believed to be essential for the revival of the
British economy.
There were a number of liberalising measures throughout the 1980s, but the most
significant was the voluntary decision of the London Stock Exchange to abolish fixed
rates of commission; to allow its members to act in a ‘dual capacity’ as brokers and
as market-makers (when stock market firms had traditionally been allowed to
operate only as either brokers or market-makers); and to allow membership by
corporate bodies. The latter reform brought additional new capital into the market,
as partnerships were replaced by joint stock members of the stock exchange. The
changes in the functioning of the stock exchange were forced through by the
Government, which had threatened to refer the Stock Exchange’s rule book to the
Monopolies Commission11.
The key legislation of the time was the 1986 Building Society Act and the 1987
Banking Act. The former removed restrictions on building society activities. The
societies, hitherto mutually-owned savings associations that used deposits to
advance mortgages to members of the societies, were now allowed to engage in
banking activity, borrow in the interbank market, and even convert themselves into
joint stock banks. The Banking Act set the regulatory framework for the “Big Bang”
10 It also represented a change in the culture of the City of London from an elite industry run by well-connected and typically upper class men to a culture that valued fierce competition and meritocracy,as will be discussed in the section on the culture of financialization.11 N. Hewlett and J. Toporowski, All Change in the City: Recent Changes and Future Prospects inLondon’s Financial Markets, London: Economist Publications, 1985.

32
This project has received funding from the European Union’s Seventh Framework Programmefor research, technological development and demonstration under grant agreement no 266800
deregulation of the City of London in October 1986. Both of the above deregulating
pieces of legislation facilitated the construction of universal banking models offering
all businesses and activities, in direct competition with other institutions. In addition,
the Securities and Investment Board (later renamed the Financial and Securities
Authority or ‘FSA’) was established in 1985 as a regulatory Authority for financial
services, separated from the Bank of England.12
2.2.1 1980s & Early 1990s Financial Instability & Regulatory Responses
Financial instability manifested itself in a number of instances in the 1980s. Firstly,
the international debt crisis that started in 1982 (referred to above) impacted many
international banks with loans outstanding to governments and firms in developing
countries. The crisis was felt especially strongly in international banking centres
such as London. The origins of this crisis are generally assigned to excess liquidity
from oil price inflation during the 1970s. The resultant trade surpluses of oil
producing countries were recycled through the international banking system into
developing country sovereign debt. The loans to governments of developing
countries were then extended beyond their realistic debt servicing capacity, and this
development was exacerbated by economic mismanagement within many developing
nations (Davis, 1992). Sharp rises in developed country interest rates (The ‘Volcker
Shock’) from late 1979 rapidly exposed the inability of many indebted governments to
service debts on which payments were fixed, usually at some margin above the US
dollar LIBOR (the London Inter-Bank Offered Rate). Defaults began, starting in 1982
in Mexico and followed by multiple defaults in Latin America and Africa. Many banks
were left technically insolvent (Davis, 1992) and this condition was only resolved by
multiple-year provisioning of rescue funds throughout the 1980s and by the Brady
Plan in 1989, when debt was restructured and forgiven in return for conversion to
securities collateralised by US treasuries.
12 In addition to international banking regulation such as the Basle Convergence Accord of 1987

33
This project has received funding from the European Union’s Seventh Framework Programmefor research, technological development and demonstration under grant agreement no 266800
Following this prolonged episode of banking losses, further crises also occurred.
Firstly, the floating-rate note (‘FRN’) market collapsed in 1986 and then, more
materially, in 1987 the equity market crashed. As illustrated in Figure 2-1 below,
after a prolonged period of moderate stock market appreciation, equity markets rose
very rapidly in 1987, before trading was brought to a halt on ‘Black Monday’ in
October 1987, with market-makers unable to cope with the high volume of sales
orders. The pre-conditions of this crash included concerns relating to
macroeconomic imbalances and the build-up of a speculative bubble in equity
markets13. However, panic selling, including through the relatively recent innovation
of computerised programme trading techniques at investment banks, was among
the major drivers of the market crash.
Figure 2-1: FTSE All Share Index (1980-1990), highlighting 1987 (In red)
Source: Datastream14
Financial instability also affected commercial banks and the changing nature of
problems that caused banking collapses is illustrative of the way in which financial
markets were now operating in more open, less regulated markets. In 1984 Johnson
13 Although evidence for such pre-conditions is strongest in Japan compared to the UK and USA.14 Post 1990 data provided in subsequent sections.
0
200
400
600
800
1000
1200
1400
FTSE
All
Shar
eIn
de
x

34
This project has received funding from the European Union’s Seventh Framework Programmefor research, technological development and demonstration under grant agreement no 266800
Matthey Bank collapsed and was rescued by the Bank of England, which feared
contagion effects, including in the London centred gold bullion markets, in which
Johnson Matthey was a major dealer. The Bank rescued Johnson Matthey by
providing indemnities to other banks, although those banks generally objected to
their coercion in the rescue by the Bank of England. Commentators also argue that
the rescue introduced moral hazard into the banking system since the fundamental
underlying cause of Johnston Matthey’s collapse was internal failures, including
incompetent management and auditing and failure to comply with regulatory
requirements (Bank of England Annual Report, 1985).
In 1991 another banking failure occurred at the Bank of Credit and Commerce
International (‘BCCI’), which was closed by the Bank of England after a long history
of problems, dating back to the early 1980s, such as fraud, money laundering and
auditor failure. Following the failure of BCCI, there was criticism of the Bank of
England for having exacerbated the failure by its public handling of the problems at
BCCI. This tactic in effect contaminated other banks that were dealing with BCCI at
the time of its failure and made it more difficult to realise the assets that BCCI held.
Many considered that the affair became a factor in the decision by the subsequent
Labour Government to remove supervisory responsibilities from the Bank of England
and give them to the FSA.
A particular issue to highlight for this report is the manner in which BCCI sought to
avoid regulatory scrutiny by relocating operations to regimes in the Middle East that
were more lenient than the UK government, following regular investigation of
emerging problems by UK authorities. The then Chancellor, Nigel Lawson, who
reported on the findings of the Bingham inquiry into the BCCI affair to Parliament,
commented at this time that ‘the most important lesson of the affair is that banking
group structures which deny supervisors a clear view of how business is conducted
should be outlawed... we need better communication and co-operation between
supervisors internationally. Few substantial banks now operate only in one country,
or even on one continent. It is vital that all the supervisors concerned with a single

35
This project has received funding from the European Union’s Seventh Framework Programmefor research, technological development and demonstration under grant agreement no 266800
group should communicate openly, co-ordinate their efforts, and impose similar
standards.’ (Hansard, HC Deb 22 October 1992 vol. 212 cc574-576). As this report will
discuss in subsequent sections, this type of regulatory arbitrage and lack of
transparency was, in fact, to become commonplace in the subsequent period of
financialization. International regulatory coordination and harmonization relating to
it remained minimal.
In addition, subsequent to the BCCI failure, wholesale funding of banks contracted in
the UK and led to a period in the early 1990s when a quarter of all smaller UK banks
would ‘in some sense fail’ (Logan, 2001, p13), with a ‘pronounced boom and bust
cycle in lending growth’. The rapid growth of property related loans in the late 1980s
housing market bubble was the leading indicator of failure (Logan, 2001). Again,
these failures, due to excessive reliance on wholesale funding and unrestricted
lending into booming property markets, were to be repeated, but on a much larger
scale, in the subsequent period of financialization.
Finally, failure of another individual bank occurred in 1995 with the collapse of
Barings Bank. Its failure was driven by losses of £827 million, exceeding the bank’s
capital, due to ‘unauthorised’ trading in futures and options by a single ‘rogue trader’
and the absence of adequate internal controls. The bank was subsequently rescued
by the Bank of England and sold to ING for a nominal sum. The subsequent
Parliamentary investigations blamed ‘serious failures of controls and managerial
confusion’ as well as failures of communication among regulators and auditors in
Singapore, Japan and the UK (Hansard, HC Deb 18 July 1995 vol. 263 cc1454-57).
However, the future Chancellor of the Exchequer and Prime Minster, Gordon Brown
–who was to mastermind the UK’s light-touch regulatory environment –commented
“Is it not symptomatic of the whole culture of complacency that the Governor (of the
Bank of England) said... that there was no need to worry about the derivatives
market.. These failures reflect not just incompetence, but a flawed structure of
regulation. Is it not time to... ensure that the regulatory system, nationally and
internationally, matches the realities of global trading in the 1990s?... We must do

36
This project has received funding from the European Union’s Seventh Framework Programmefor research, technological development and demonstration under grant agreement no 266800
far more ... to ensure effective supervision, and... ensure that there is far greater
confidence in the integrity of our financial system” (Hansard, ditto, p1459).
Notable from the perspective of this report is both the role of derivatives and the
failure of localised regulation of what had become a global industry. Although gross
internal failures occurred in Barings Bank, derivatives allowed enormous leverage
to be created unnoticed. In turn, the leverage multiplied losses incurred in a very
short period of time, and the fragmentised regulatory system failed to identify and
control them. When the bank collapsed in 1995, more than 65,000 trades on
Japanese and Singaporean exchanges from the Singapore office of this London-
based bank were active, with the majority of the £827 million of losses being made in
the two week period prior to the bank’s collapse.
As illustrated above, by the mid-1990s many of the problems that were to emerge in
2007 were already present, although to a lesser degree. They included herd-driven
exposures to credit sectors, giving rise to boom-and-bust cycles, speculative asset
price booms15 driven by bank speculation and credit flows, failures of regulation and
internal control over globalised businesses, regulatory arbitrage by banks, moral
hazard within the banking system, and risks materialising in relation to innovation,
especially in derivatives. However, from the mid-1980s major concerns were being
raised regarding the possibility of increasing financial fragility from innovation,
including derivatives and leveraged buy-outs, as well as from the globalization of
finance and the mis-pricing of credit (e.g., BIS, 1986, 1991 and 1992; Davis, 1992).
Thus, an interesting point to consider is why, despite these problems and the related
concerns being raised by authoritative bodies such as BIS and the UK parliament,
these glaring problems in financial markets were not addressed. Various reasons
can be put forward. Firstly, there appeared to be little transmission of such financial
difficulties, as opposed to the problems in trade and industry, to the non-financial
sector, including the household and corporate sectors. There were some exceptions,
15 The housing boom and the role of the banks in providing underlying credit during this period will bediscussed in subsequent sections.

37
This project has received funding from the European Union’s Seventh Framework Programmefor research, technological development and demonstration under grant agreement no 266800
such as the funding of bank rescues, losses for investors and depositors16 and short
term liquidity constraints for corporate borrowers17. But it appears that either the
impact of financial difficulties was limited or the problems were contained by central
bank actions (Davis, 1992).
Secondly, financial markets soon stabilised after initial upheaval, including after
bank failures and market crashes. Both of these factors created complacency
among regulators that issues could be contained within the broader financial
system, without affecting the economy at large. This belief together with moral
hazard ensured that banks and financial institutions were not obliged to adopt
prudent procedures in the way that they might have been if they had been required to
bear full responsibility for recorded losses or outright collapse. In addition, the
major changes in the banking industry and the full extent of deregulation, both of
which were to later exacerbate these problems, had not yet developed.
However, thirdly, and perhaps most critically, the political zeitgeist was continuing to
move towards further deepening of the neo-liberal dogma of anti-regulation and
‘pro-market’ policies. In the light of such dogma, concerns and problems relating to
potential financial instability were simply swept aside as politically inconvenient.
2.3 The Deepening & Proliferation of Empirical Financialization (1990-
2010)
As discussed in the previous section, the 1980s in the UK saw relatively little
development of empirical financialization. However, the foundations had been
created in the 1980s through deregulation and the initial concentration of
international banking institutions in the UK. In the 1990s these foundations were
rapidly built upon to transform London into the global banking centre that it is today.
In this section, the macro-level empirical indicators that illustrate the huge scale
16 Such as in BCCI.17 Such as after the 1987 stock market crash
38
This project has received funding from the European Union’s Seventh Framework Programmefor research, technological development and demonstration under grant agreement no 266800
and extent of the empirical financialization of the UK economy from 1990 to 2010 will
be examined.
2.3.1 The Growth of Financial Services within the Economy: Share of GNP,
Banking Assets & Employment
The most obvious indicator of the growth of financial intermediation is the scale of
financial services within the economy. This scale increased rapidly from 1990
onwards, both in absolute and relative terms. As with other indicators that this
report will be examining, there was a particularly rapid acceleration of growth in
financial services from 2000 until the crisis of 2007. Figure 2-2 below illustrates this
trend at the macroeconomic level, where the value of financial services grew from
$15.7 billion in 1997 to a peak of $66.9 billion in 2009, representing, respectively,
1.9% and 4.8% of GNP. This huge growth represented both increases in the scale of
financial services within the UK but also, as will be illustrated further on in this
report, an increase in profitability. Although these figures suggest that the
significance of banking and finance in the economy was small, the gross expansion
of balance sheets extended the influence of financial activities into all sectors of the
economy.

39
This project has received funding from the European Union’s Seventh Framework Programmefor research, technological development and demonstration under grant agreement no 266800
Figure 2-2 Financial Services, $ Value and Share of GNP (1997-2010)
Source: ONS
This growth, and its acceleration from 2000 to 2007, can also been seen in UK
banking assets, as illustrated in Figure 2-3 below. Such assets grew five-fold from
£1.2 trillion in 1990 to a peak of £6.9 trillion in 2007. The active factor in this growth
included huge increases in domestic assets, including household and corporate
sector borrowing (as will be discussed further in following sections), the continued
entry of foreign banks into the UK and the growth in foreign assets of UK banks. By
2007, half of all UK banking sector assets related to non-UK activities, a much larger
proportion than in most other developed economies (Barwell and Burrows, 2010)(see
Sections 1.1 and 2.2).
0.0%
1.0%
2.0%
3.0%
4.0%
5.0%
6.0%
0
10
20
30
40
50
60
70
80
19
97
19
98
19
99
20
00
20
01
20
02
20
03
20
04
20
05
20
06
20
07
20
08
20
09
20
10

40
This project has received funding from the European Union’s Seventh Framework Programmefor research, technological development and demonstration under grant agreement no 266800
Figure 2-3 UK Banking Sector Assets (1990-2010) ($ billions) 18
Source: Bankstats, Bank of England
This trend can also be seen in employment data. Employment in finance, insurance
and real estate (the ‘FIRE’ sector) grew from 1.0 million in 1980 to 1.6 million in 2010
and from 3.9% of UK employees to 5.0% of employees. These trends are illustrated
in Figure 2-4 and Figure 2-5 below.
As the figures show, however, while the importance of FIRE as an employer rose
numerically, the rise was not as dramatic as the growth of this sector’s balance
sheet in relation to GNP or banking assets. This point is discussed further in section
5. The real significance of employment is not just the number of employees but their
18 In considering these figures, note that for derivatives, a particularly rapid sector of growth, assets inthe figures below only include on-balance sheet assets, which are typically represented by the mark-to-market, or net profit or loss, on a derivative contract and exclude shadow banking assets, whichare not booked within legal entities regulated by UK banking institutions. Hence these figures fromthe Bank of England are highly likely to be understated.
-
1,000
2,000
3,000
4,000
5,000
6,000
7,000
8,000
1990 1995 2000 2007 2010
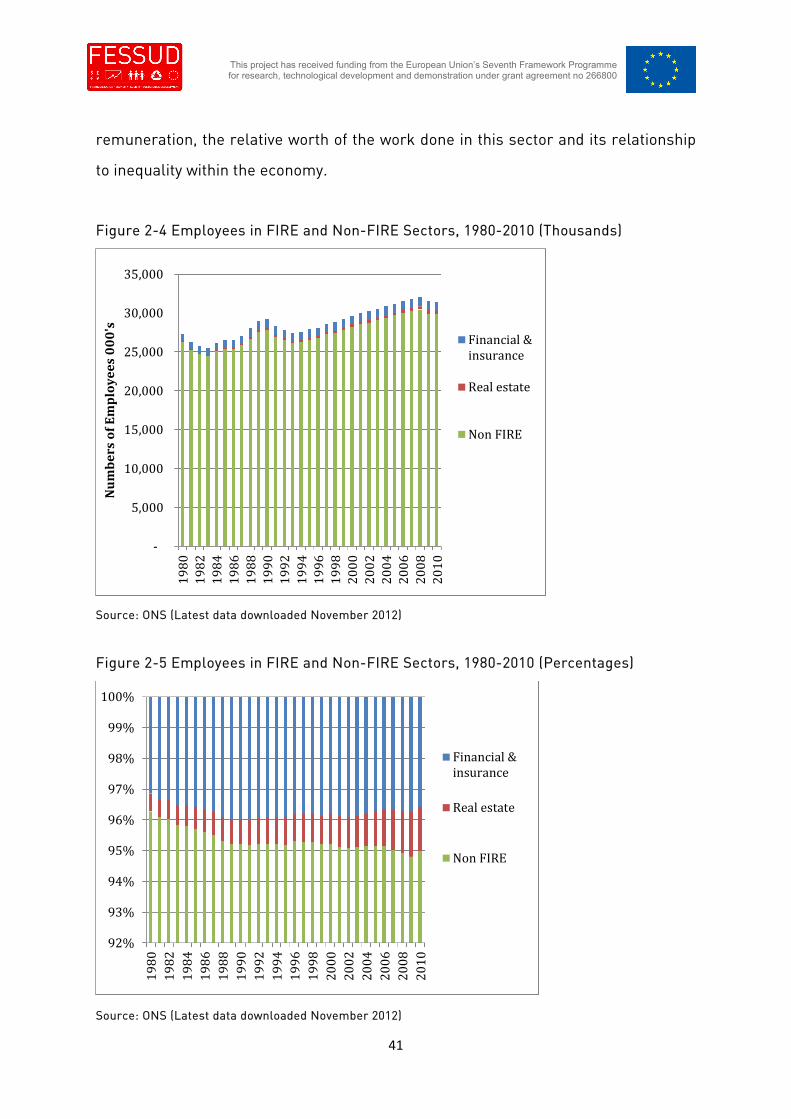
41
This project has received funding from the European Union’s Seventh Framework Programmefor research, technological development and demonstration under grant agreement no 266800
remuneration, the relative worth of the work done in this sector and its relationship
to inequality within the economy.
Figure 2-4 Employees in FIRE and Non-FIRE Sectors, 1980-2010 (Thousands)
Source: ONS (Latest data downloaded November 2012)
Figure 2-5 Employees in FIRE and Non-FIRE Sectors, 1980-2010 (Percentages)
Source: ONS (Latest data downloaded November 2012)
-
5,000
10,000
15,000
20,000
25,000
30,000
35,000
19
80
19
82
19
84
19
86
19
88
19
90
19
92
19
94
19
96
19
98
20
00
20
02
20
04
20
06
20
08
20
10
Nu
mb
ers
of
Em
plo
ye
es
00
0's
Financial &insurance
Real estate
Non FIRE
92%
93%
94%
95%
96%
97%
98%
99%
100%
19
80
19
82
19
84
19
86
19
88
19
90
19
92
19
94
19
96
19
98
20
00
20
02
20
04
20
06
20
08
20
10
Financial &insurance
Real estate
Non FIRE

42
This project has received funding from the European Union’s Seventh Framework Programmefor research, technological development and demonstration under grant agreement no 266800
2.3.2 Increasing Scale of Financial Markets in “Vanilla” Products
As well as being notable for the expansion in the scale of financial markets,
financialization is also marked by the proliferation and creation of new markets in
financial instruments and innovations in those markets and instruments. The UK
market, as the dominant financial market for the Euro zone, has seen a particularly
notable deepening of financialization.
The new instruments that were developed and new markets that emerged in the
post 2000 period gave rise to increasing complexity. But the instruments themselves
can be split into simple (or “vanilla” products) and more complex products. Vanilla
products are typically characterised as having simple risk profiles, for example,
exhibiting linear risk (that is, risk that is proportionate to the value of the product).
Such products are not, or are only relatively lightly, leveraged. They are typically
traded on either exchanges or electronic platforms or, if traded over-the-counter
(“OTC”), use standardised industry terms and conditions. Common examples include
equity, bonds, commercial paper, futures and options, and vanilla derivatives.
Transparency of the activity in such products is also typically high since public
disclosures are made via the various exchanges and trade organizations, such as the
International Swaps Dealer Association (ISDA).
The City of London hosts a number of globally important exchanges for vanilla
products, including the London Stock Exchange (LSE) and the London International
Financial Futures and Options Exchange (LIFFE). The LSE, once an open outcry
market, is now a fully electronic equity market for both primary and secondary
equity and for mainstream companies and small companies. It hosts more than
3,000 listed companies from over 70 countries with a market capitalization of £3.8
trillion (Source: LSE January 2012). LIFFE is one of the major global markets for
listed derivatives, including multi-currency interest rate and FX derivatives. The UK
also hosts a number of smaller electronic exchanges such as for government bonds,
corporate bonds and commodities.

43
This project has received funding from the European Union’s Seventh Framework Programmefor research, technological development and demonstration under grant agreement no 266800
London is also a major centre for capital market issuances, as illustrated in Figure2-6 and
Figure 2-7. These figures show capital market issues on a net basis and a grossbasis, respectively. As can be seen, net issuance was continually and steadilyincreasing up until the financial crisis of 2007 and gross issuances for allinstruments followed a similar pattern, with issuances peaking in 2007-08 beforefalling back during the financial crisis.
Figure 2-7 also illustrates the relative importance of debt (with bonds and
commercial paper representing approximately 95% of issuances in this period) over
equity in UK capital markets.
Figure 2-6 Net Capital Market Issuances in the UK Banking System (2003 to
2011)
-60,000
-40,000
-20,000
-
20,000
40,000
60,000
80,000
100,000
120,000
140,000
1/1
/03
6/1
/03
11
/1/0
3
4/1
/04
9/1
/04
2/1
/05
7/1
/05
12
/1/0
5
5/1
/06
10
/1/0
6
3/1
/07
8/1
/07
1/1
/08
6/1
/08
11
/1/0
8
4/1
/09
9/1
/09
2/1
/10
7/1
/10
12
/1/1
0
5/1
/11
10
/1/1
1
£m
illio
ns
2003 to 2011

44
This project has received funding from the European Union’s Seventh Framework Programmefor research, technological development and demonstration under grant agreement no 266800
Source: Calculated from Bankstats, Bank of England.
Figure 2-7 Gross Capital Market Issuances in the UK Banking System (2003 to
2011)
Source: Bankstats, Bank of England.
However, importantly, the UK’s dominance has been driven by growth in its OTC
derivative markets and activities as the global deepening of financialization was
concentrated in these instruments. As illustrated in Figure 2-8, the volume of basic
derivatives grew hugely in absolute terms, with nearly a five-fold increase in
turnover from 1998 to 2010. As a percentage of global turnover, the UK accounted
for 37% of foreign exchange derivatives and 46% of interest rate derivatives by 2010,
with daily average foreign exchange market turnover reaching $4 trillion by 2010
(Source: BIS 2012).
According to BIS, this business was attributable to ‘other financial institutions’,
which contributed 85% of the higher turnover in foreign exchange markets. The most
-
20,000
40,000
60,000
80,000
100,000
120,000
140,000
1/1
/03
8/1
/03
3/1
/04
10
/1/0
4
5/1
/05
12
/1/0
5
7/1
/06
2/1
/07
9/1
/07
4/1
/08
11
/1/0
8
6/1
/09
1/1
/10
8/1
/10
3/1
/11
10
/1/1
1
STG
Mill
ion
s
2003 to 2011
SHARES ISSUANCE
CP ISSUANCE
BOND ISSUANCE

45
This project has received funding from the European Union’s Seventh Framework Programmefor research, technological development and demonstration under grant agreement no 266800
active part of ‘other financial institutions’ have been high-frequency traders and
banks trading as clients of the biggest dealers. Electronic trading has been
instrumental in causing this increase, particularly algorithmic trading (Source: BIS
2012). This reflects increased turnover among financial intermediaries, a key factor
differentiating empirical financialization from structural financialization, as identified
by Toporowski (2012).
Figure 2-8 UK Interest Rate & Foreign Exchange Derivatives Turnover
Source: BIS (Secondary source: No 2011 data available)
2.3.3 Increasing Complexity of Financial Markets & Products
However, the UK’s dominance, as a centre for trading derivatives and the deepening
of financialization, was not characterised by simple derivatives, but by complex ones.
As illustrated in Figure 2-9 below, the UK became a centre for growth in derivatives,
with outstanding market values peaking at £7.5 trillion in 2008, which represented a
0%
5%
10%
15%
20%
25%
30%
35%
40%
45%
50%
-
200.00
400.00
600.00
800.00
1,000.00
1,200.00
1,400.00
1,600.00
1998 2001 2004 2007 2010
%o
fG
lob
al
Tu
rno
ve
r
Tu
rno
ve
r($
Bil
lio
ns)
Interest Rates
FX
Interest Rates
FX

46
This project has received funding from the European Union’s Seventh Framework Programmefor research, technological development and demonstration under grant agreement no 266800
nine-fold increase since 1998, and with values outstanding stabilizing in the post-
crisis period in the £4 to £5 trillion range19.
Figure 2-9 Derivatives Outstanding in the UK Banking System (1998 to 2011)
Source: Bankstats, Bank of England20.
These trend increases in derivatives activity reflect a number of factors.
Firstly, there was a huge increase in the sheer volume of financial activity and
balance sheet restructuring in the UK. The latter factor provided opportunities on an
unprecedented scale for hedging through derivatives. In addition to the impact of
domestic activities, many international investment banks sought to build London as
the global centre for complex derivatives, including structuring, marketing and
trading. This trend was initially driven by the relatively lax regulatory system (as
19 Some of this decrease from the 2007 peak does not represent a decline in outstanding derivativesbut a decline in their mark-to-market value, as market values fell very significantly during thefinancial crisis. This is particularly true of credit derivatives when very material losses on creditportfolios were incurred by UK banks. However, the approximately £2-3 million decline in valuecannot be disaggregated into a decline in outstanding contracts and simply a fall in the market valueof those contracts.20 Notes: (i) Values are UK£ market value (ii) UK resident banks only (iii) Include equity, interest rateand credit derivatives, and (iv) Credit derivatives were only fully reported from 2007 onwards and arelikely to be materially understated prior to this date.
0
1000000
2000000
3000000
4000000
5000000
6000000
7000000
8000000
01
-Ju
n-9
8
01
-Feb
-99
01
-Oct
-99
01
-Ju
n-0
0
01
-Feb
-01
01
-Oct
-01
01
-Ju
n-0
2
01
-Feb
-03
01
-Oct
-03
01
-Ju
n-0
4
01
-Feb
-05
01
-Oct
-05
01
-Ju
n-0
6
01
-Feb
-07
01
-Oct
-07
01
-Ju
n-0
8
01
-Feb
-09
01
-Oct
-09
01
-Ju
n-1
0
01
-Feb
-11

47
This project has received funding from the European Union’s Seventh Framework Programmefor research, technological development and demonstration under grant agreement no 266800
discussed in detail in Section 3.2), where the ‘light touch’ approach and weaker
standards of prudential regulation allowed product innovation to be unfettered. It
was also supported by a favourable legal jurisdiction, which was regarded as flexible
and fairly enforced, and that became the standard jurisdiction for derivative
contracts issued globally under ISDA standards.
However, these fundamental factors then created secondary effects that further
accelerated the trend. Specifically, from the 1990s onwards, the UK became the
global centre for complex derivatives for the majority of investment banks. This
change was driven by the risk management practises of investment banks, which
sought to consolidate risk from similar types of derivatives in single global trading
“books” based in the UK. This drove the development of the practise of global
locations executing trades with international clients, and then “booking” the trade in
a UK legal entity. By 2011 80% of all outstanding derivatives in the London markets
were with non-UK counterparties (Source: BIS 2012). This critical mass then
attracted further players, both regulated and unregulated, to London, further
accelerating these trends.
As shall be discussed below, such vast increases in the scale of activities can be
considered only a form of empirical financialization, insofar as additional
transactions and balance sheet expansion are confined to the financial sector.
However, the increased scale of such activities also creates the conditions for the
build-up of systemic risk within the financial system and this increase in risk, which
also affects other sectors, is arguably a defining feature of structural
financialization. For example, the high volume and consolidation of such derivative
activity in London enabled the development of highly complex trading books and new
instruments within investment banks such as ‘hybrids’ and correlation trading.
These innovations merged risk from traditionally separate markets, such as credit,
debt and equity, and used mathematically based risk and trading techniques. This
type of activity, according to the Independent Commission on Banking report,
created ‘misplaced reliance on sophisticated maths’ and ‘ended up, not containing
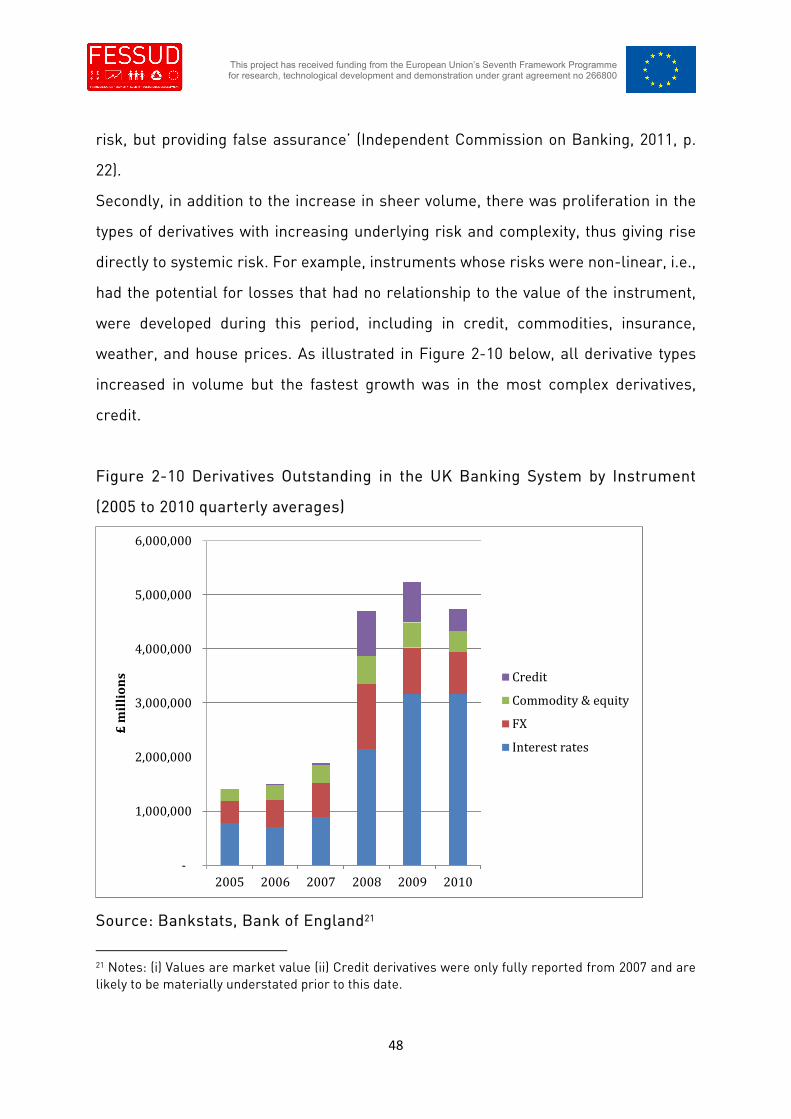
48
This project has received funding from the European Union’s Seventh Framework Programmefor research, technological development and demonstration under grant agreement no 266800
risk, but providing false assurance’ (Independent Commission on Banking, 2011, p.
22).
Secondly, in addition to the increase in sheer volume, there was proliferation in the
types of derivatives with increasing underlying risk and complexity, thus giving rise
directly to systemic risk. For example, instruments whose risks were non-linear, i.e.,
had the potential for losses that had no relationship to the value of the instrument,
were developed during this period, including in credit, commodities, insurance,
weather, and house prices. As illustrated in Figure 2-10 below, all derivative types
increased in volume but the fastest growth was in the most complex derivatives,
credit.
Figure 2-10 Derivatives Outstanding in the UK Banking System by Instrument
(2005 to 2010 quarterly averages)
Source: Bankstats, Bank of England21
21 Notes: (i) Values are market value (ii) Credit derivatives were only fully reported from 2007 and arelikely to be materially understated prior to this date.
-
1,000,000
2,000,000
3,000,000
4,000,000
5,000,000
6,000,000
2005 2006 2007 2008 2009 2010
£m
illi
on
s Credit
Commodity & equity
FX
Interest rates

49
This project has received funding from the European Union’s Seventh Framework Programmefor research, technological development and demonstration under grant agreement no 266800
The increase in credit derivatives was driven by the search for yield by investors in
the face of historically low interest rates, and the belief that such instruments
offered a new method for risk mitigation by re-distributing risk within the economy.
This increase was also driven by the opportunities for large profits for investment
banks that were able to use credit derivatives to improve the ratings of the complex
securities that they sold (Tett, 2012). From the 1990s onwards, there was a surge in
volumes and innovation in credit instruments away from vanilla bonds to structured
credit products and credit derivatives (Independent Commission on Banking, 2011).
The cycle of activity was initiated typically by credit origination which, as the decade
proceeded, became a source product for the creation of tradable credit securities of
increasing complexity. Typical products were securitised instruments that gained in
complexity from securitization of single credit to named credit portfolios to complex
structures, such as tranched securitizations, including CDOs and CDOs-Squared,
which lacked transparency with regard to underlying credit risk and relied on credit
rating for risk assessments. Figure 2-11 below shows this surge in activity, i.e., a
nine-fold increase from 2000 to 2007, for securitizations in the UK.
Figure 2-11 Securitization Issuances in the UK (2000-2007)
Source: Vickers 2009 (Secondary source: post 2007 data not available)
0
20
40
60
80
100
120
140
160
180
200
2000 2001 2002 2003 2004 2005 2006 2007
£B
illi
on
s

50
This project has received funding from the European Union’s Seventh Framework Programmefor research, technological development and demonstration under grant agreement no 266800
With the increased issuance of these securities, markets in credit derivatives and
structured products deepened, including secondary markets and associated hedging
and liquidity activities. Many of these increased activities occurred within the inter-
bank market. Banks and financial intermediaries used such derivatives to manage
their credit portfolios and on-balance sheet credit exposures. New types of trading
and instruments also proliferated as investment banks and shadow banking players
focused on proprietary trading and inter-bank activity. The latter included, most
notably, hedge funds, private equity and venture capital funds (Independent
Commission on Banking, 2011). Banks also sought to use credit derivatives to reduce
capital requirements. Since regulations allowed offset for credit exposure that had
been apparently reduced through derivative hedging, banks were able to leverage
their capital significantly.
The cycle of innovation and increasing complexity was also driven by the heavy
marketing by banks of complex products, since margins were higher on innovative
structured products. The impact of such a ‘product cycle’ and how it encouraged
increasing and valueless complexity, whose opaqueness created high margins for
banks, will be discussed further below.
2.3.4 Increasing Scale of the “Shadow Banking” System
The increasing scale of credit products also gave rise to both a new problem and its
apparent solution. Credit products, when booked on balance sheet, create
materialbalance sheet and asset risks and hence require capital and liquidity to be
held against those risks.22 However, securitization proved a solution to this problem
by taking risk assets ‘off balance sheet’. Commercial and investment banks were
able to create specialised legal entities separate from their regulated entities.
Manipulation of regulatory and accounting rules then allowed these entities to be
22 The exact degree of such risk depends upon the credit risk of the underlying counterparty and canvary significantly.
51
This project has received funding from the European Union’s Seventh Framework Programmefor research, technological development and demonstration under grant agreement no 266800
deemed ‘off balance sheet’, meaning that the legal entity was not consolidated or
considered part of the group of companies composing the regulated bank. The
assets and liabilities contained within the newly-created legal entities were excluded
from both legal recognition and regulatory control, including capital requirements.
These non-regulated and dedicated legal entities are termed special purpose
vehicles (SPV) or special investment vehicles (‘SIV’). The assets contained within
such vehicles can be as simple as a single bond or as complex as huge portfolios of
credit instruments with complex related derivatives and collateral arrangements.
However, their essential function is to create credit intermediation, maturity or
liquidity transformation, and leverage outside the regulated banking system. They
also typically rely on short-term funding through repos or asset backed paper or
interbank borrowing for funding (Source: FSB 2012).
Empirically, measuring such an activity is extremely difficult because it falls outside
all reporting requirements, both listing and regulatory; and where it has been
measured, typically it has only been done in the post 2005 period. There are,
however, a number of indicators to support the reasonable conclusion that the scale
of such activities is very large and expanded rapidly after 2000. For example,
Standard and Poor, a common rating agency used in the creation of SIVs and SPVs
and thus an agency that has access to confidential information, reported that assets
in SIVs globally reached $300 billion by 2007, but it gave no UK breakdown
(Independent Commission on Banking, 2011).
Similarly, the Financial Stability Board (FSB) estimates that global23 assets in the
shadow banking system had grown from $27 trillion in 2002 to $60 trillion in 2007
and remained at similar levels through to 2010, and that in the UK the share of all
banking assets within the shadow banking system was 10% (or $2 million) in 2005
and 13% in 2010 (or $5 trillion) (FSB, 2012). Certainly they have become an important
source of revenue for investment banks. In addition, many investment banks use the
UK as a global hub for trading, risk management and operational support of SPVs.
23 Based on proxy measures in Australia, Canada, Japan, Korea, UK, Euro-zone and US.

52
This project has received funding from the European Union’s Seventh Framework Programmefor research, technological development and demonstration under grant agreement no 266800
Such hubs typically have specialist departments for both marketing and
management of SPVs. They include teams of highly paid specialists, who market,
trade and advise on the compliance of proposed trades to established arbitrage
techniques, and operation departments that support and manage the ongoing
activities of SPVs.
However, such vehicles also have a number of implications for financial sector
stability. For example, they often depend upon short-term funding and as such are
vulnerable to liquidity runs. They are also typically highly leveraged and this leverage
increased during the 2000s as asset prices were buoyant and margins and haircuts
on financing low. In addition, such vehicles form part of the credit intermediation
chain and so have significant interconnectedness with the regulated banking sector.
Finally, they are unregulated and have been used to avoid regulations relating to
leverage and capital (FSB 2012). Such evasion of prudential controls was an
important source of instability during the financial crisis of 2007.
In addition, new unregulated investment vehicles began to be created, most notably
hedge funds and private equity firms24. These vehicles proved very attractive to
professional and high-net worth investors because they were unregulated and, since
they were organised as partnerships, they did not formally engage in banking or
investment business on behalf of the public. Such funds could be used for highly
leveraged and unrestricted risk taking. London, with its ‘light touch’ regulatory
system, became a global centre for hedge funds and private equity firms, which also
became major clients of investment banks. The latter provided them with funding,
including highly leveraged funding from UK banks, and brokerage services and
clients. By 2011 the FSA estimated, through a survey of the UK’s 100 largest hedge
funds, that such assets under management totalled £390 billion, representing 20%
of global hedge funds’ assets. Such funds also became important in asset markets
as a source of speculative liquidity and as clients of major investment banks. These
24 Also sovereign wealth funds. However, SWFs are less prominent in the UK, except as inwardinvestors.

53
This project has received funding from the European Union’s Seventh Framework Programmefor research, technological development and demonstration under grant agreement no 266800
funds represented significant credit risk to investment banks through their
wholesale funding and counterparty exposure during the financial crisis.
2.4 The Global Financial Crisis and the UK (2007 - 2012)
At the beginning of 2007 global financial markets were continuing the activities
established in the previous two decades. Even though some banks started to notice
rising defaults in US sub-prime mortgages and rising credit spreads in some
securities, many remained bullish and confident, agreeing with the statement of the
Chief Executive Officer of Citibank, Chuck Prince, in probably the most quoted and
least well-judged remark of the crisis, that ‘as long as the music is playing... we’re
still dancing’ (NYTimes.com, 9 July 2007)25.
However, by the summer of 2007 ‘the initial crack in confidence’ in global markets
(Independent Commission on Banking, 2011, p27) had appeared. Through the
following year, the global financial system continued to be under intensifying strain
as housing markets slowed down in economies that had experienced house price
booms, including in the UK, and mark-to-market losses and liquidity strains
escalated. In September 2008, after Lehman went bankrupt, there was an almost
total freeze of activity in interbank money markets and a collapse in asset prices.
Major banks across the world required support from central banks in order to
prevent further failures. Following these events there were massive government-
backed and funded recapitalizations of banks, and central banks provided
unprecedented liquidity support. Base rates were pushed to historical lows and
substantial quantitative easing was implemented. As economies fell into recession,
government deficits widened. As this report is being written, the majority of
governments in Europe have responded with efforts of fiscal contraction, developed
countries’ economies remain weak and in recession and the euro crisis remains
25 http://dealbook.nytimes.com/2007/07/10/citi-chief-on-buyout-loans-were-still-dancing/

54
This project has received funding from the European Union’s Seventh Framework Programmefor research, technological development and demonstration under grant agreement no 266800
unresolved. A fuller review of the global crisis is beyond the scope of this report but
the next section examines in more detail UK-specific events and policy responses.
2.4.1 Events & Regulatory Responses to the Crisis in the UK (2007-2011)
The UK crisis followed the global crisis in two stages: an acute phase from mid 2007
to 2008 and then a more chronic phase that included deepening problems within the
euro zone. Both macroeconomic events and policy responses also coincided with
these two phases. In this section the report reviews the main events of the crisis,
including the regulatory and industry responses, the changing macroeconomic
environment since 2007 and the changes in segments of the financial system since
2007. These are all examined in both the acute and chronic phases of the crisis.
Figure 2-12 below illustrates the initial stages of the crisis, as related by the Bank of
England’s Financial Stability Report in October 2007, a few months after the crisis
broke. As discussed further below, the crisis originated in the sub-prime markets in
the US but rapidly spread, first into global Asset-backed Securities (ABS) markets,
and then more broadly throughout the global financial system, including the UK’s
banking system.

55
This project has received funding from the European Union’s Seventh Framework Programmefor research, technological development and demonstration under grant agreement no 266800
Figure 2-12 The Phases of the Crisis, October 2007
Source: Financial Stability report, Bank of England, October 2007.
As can be seen in the figure, the trigger was the realisation in the markets that sub-
prime mortgage arrears were increasing. This effect then aroused fears of losses on
related structured products within the market. The sub-prime market was in fact
small in relation to the global financial system. But there had been concerns about
the manner in which the search for yield amongst investors globally had boosted
demand for increasingly risky products and leverage and had stimulated a wave of
opaque and complex innovation in financial instruments with high embedded
leverage. Market rumours had been spreading about the under-pricing of the risk in
these products for some time. But, despite this underlying unease, market
sentiment, in the form of buying by hedge funds, had been driven by increasingly low
risk premiums.
Rising sub-prime mortgage arrears
Losses and downgrades on related asset-backedsecurities (ABS) and other structured instruments
Loss of confidence in the value of ABS globally
Wider flight from risk in credit and other markets
Risks flow back to banks’ balance sheets
Money markets tighten as liquidity is hoarded
Funding problems at some banks

56
This project has received funding from the European Union’s Seventh Framework Programmefor research, technological development and demonstration under grant agreement no 266800
In addition, there was an increasing emphasis on the ‘originate and distribute’
business model, in which banks felt relieved of responsibility for due diligence on
new loans because of the securitisation of the loans through obscure credit
derivatives that assured the value of the loans. The resort to such a business model
made financial institutions’ risk increasingly opaque and their funding reliant on
sustained demand for credit instruments in capital markets. Although this model
had boosted credit supply, it also dispersed risk widely throughout the system and
increased linkages between institutions in an opaque and unregulated manner. All
parties involved in the transfer of loans between balance sheets came to believe that
the risk from monitoring, as opposed to origination, has been avoided. As a result,
monitoring had been weakened, and the location of risk became obscured.
Prior to 2007 the benign economic conditions and the high levels of market liquidity
had encouraged complacency about such concerns. But, by the summer of 2007,
these anxieties were emerging and spreading and general credit spreads in
interbank markets were rising and liquidity constraints were appearing. Many
market observers were surprised at the speed at which this process took place. The
Bank of England assigned this to ‘information problems (that) led to huge
uncertainties about the nature and source of losses’ (FSR, October 2007, p7). The
Bank of England itself contributed to the uncertainty when it refused to assist
Northern Rock, which was in financial difficulties as a result of being unable to sell
securitised loans from its loan book. News leaked out that a bank had been refused
emergency assistance, but no-one in the markets knew which institution had been
so refused. (The case of Northern Rock is further discussed below).
This situation bred suspicions of every borrower in the money markets. Valuation
uncertainty rose sharply and from July 2007 credit spreads widened substantially
across the globe. Ratings downgrades and changes in agencies’ methodologies
further undermined investor confidence and promoted further waves of selling. By
August 2007 the primary markets for asset-backed securities were “effectively
closed” (Ibid. p7) and secondary markets suffered significant price falls. Problems

57
This project has received funding from the European Union’s Seventh Framework Programmefor research, technological development and demonstration under grant agreement no 266800
were compounded as investors sought to reduce leveraged positions and sell assets
to repay debt that they could not now roll over. As prices of asset-backed securities
fell, issuance volumes collapsed as a result.
The result was a hoarding of liquidity and increased risk aversion in relation to
counterparty risks. Corporate and financial intermediaries credit spreads rose
sharply across the board. A spiral of losses started on assets related to mortgages
and increasingly other credit assets. Throughout the summer of 2007, this process
worsened, and by October 2007 the Bank of England commented that the “resilience
of the United Kingdom and international financial system has been severely tested”
(FSR, October 2007, p5). Globally a series of problems emerged at various
institutions. At Bear Sterns in the US two associated hedge funds became bankrupt
due to illiquidity problems associated with structured credit instruments. In
Germany problems emerged at IKB and Sachsen Banks due to the illiquidity of
structured credit products that had long maturities but short-dated funding; and in
France BNP Paribas suspended fund redemptions for some funds due to illiquidity
and valuation difficulties. Such events led to a further hoarding of liquidity by banks
in order to increase self-funding and as precautions against redemptions and future
liquidity concerns. The Bank of England commented at the time that this
“Snowballing of increasing day-to-day funding needs has then further increased
liquidity and counterparty risks” (FSR Oct. 2007. p9).
In the UK this crisis reached a critical point at Northern Rock. This bank was formed
from a demutualised building society in 1997 and had undertaken growth in its
mortgage portfolios, trebling its market share in eight years. Rather than fund
through deposits, it had relied on wholesale funding and balance sheet management
through securitizations to achieve its huge expansion. By the first half of 2007,
Northern Rock’s securitizations accounted for over 17% of UK MBS issuances and it
was highly reliant both on its ability to continue to securitize mortgages and on its
access to wholesale funding, which was becoming increasingly difficult. In addition,
the huge expansion of its balance sheet and the use of securitization to do so had

58
This project has received funding from the European Union’s Seventh Framework Programmefor research, technological development and demonstration under grant agreement no 266800
caused lending spreads to widen within the institution in both absolute terms and
relative to other lenders.
Rating agencies had in fact identified liquidity as a relative weakness at Northern
Rock, but it had remained well-capitalised and had good quality mortgages. Indeed,
as late as August 2006 Standard and Poor’s and, in April 2007, Moody raised
Northern Rock’s credit ratings. In fact, the risk of its funding model was to become
crystallised during the crisis with “unexpected ferocity” (FSR 2007, Oct. p6).
Following accelerating credit losses and liquidity problems at another mortgage
institution, Countrywide26, in the United States, market speculation started to
intensify about Northern Rock. In fact, prior to the summer of 2007, Northern Rock
had, throughout 2007, raised finance, including £10.7 billion through its principal
securitization programme and a further £2.2 billion through covered bonds. As news
spread, Northern Rock’s credit spread started to increase and it share price
weakened. Thus, it began to have trouble raising funding and sought a buyer for the
company as a whole. By September 2007 the long-term funding markets were
closed to Northern Rock and it had to seek an assurance of liquidity support from
the Bank of England. The earlier events at Countrywide, and its very similar funding
model, eventually persuaded tripartite monitors at the Bank of England, FSA and HM
Treasury that contagion risks from Northern Rock were potentially sufficient to
warrant support from the Bank as lender of last resort. However, the subsequent
announcement of support was too late to prevent panic and a bank-run on Northern
Rock by retail depositors.
In order to stem the run, the Government was eventually obliged to guarantee all
retail deposits. The guarantee was then extended to wholesale funding for Northern
Rock in order to prevent contagion spreading to other banks (FSR, Bank of England,
October 2007). In early 2008 the bank was nationalised (FSB, Bank of England,
September 2009). The issues at Northern Rock might appear to be unique to their
26 Acquired by Bank of America in January 2008

59
This project has received funding from the European Union’s Seventh Framework Programmefor research, technological development and demonstration under grant agreement no 266800
business model for expansion. However, this appearance was deceptive. By 2007,
48% of all UK banks’ funding was wholesale, making them highly reliant for liquidity
on the interbank markets. By late 2007, many commentators thought that the worst
of the crisis had passed. The Bank of England, for example, commented on the need
for some limited reforms such as “greater focus on liquidity management” but it
stated that “action... and the continuing strong capital positions of the UK banking
system should anchor confidence as risk is repriced” (FSR, October 2007, p1).
However, by the spring of 2008 it was clear that the dislocation in the financial
markets was continuing, based on increasing illiquidity and higher credit spreads in
many markets. In mid-March 2008, the US investment bank Bear Sterns collapsed
following a wholesale funding run in which it had been unable not only to access
unsecured funding but also to secure funding against high quality collateral. Bear
Stearns was sold at fire-sale prices, in a deal facilitated by the Federal Reserve Bank
of New York, to JP Morgan Chase. This event intensified disquiet in the highly
internationalised London markets. Market participants started to deleverage. In
credit markets, in particular, dislocation was extensive, with very little liquidity and a
lack of pricing transparency. Asset-backed securities and leveraged markets were
effectively closed.
These events were created by a lack of confidence by financial participants in pricing
and rating within markets as well as by institutions seeking to sell assets and hoard
liquidity in order to improve their individual positions. Institutions valuing their
portfolios on a mark-to-market basis began to recognise increasing losses as
markets fell and thus accelerated this process. Between August 2007 and March
2008, UK based banks wrote off $49 billion on structured credit exposures (FSR,
April 2008). Some institutions that retained risk appetite, such as hedge funds, were
unable to obtain leverage to buy assets because of very sharp tightening of credit
conditions such as collateral requirements by prime brokers. The aggregate impact
of the actions of such individual institutions, which were “unprepared for such
prolonged disruption to core funding markets ... particularly for firms that have built

60
This project has received funding from the European Union’s Seventh Framework Programmefor research, technological development and demonstration under grant agreement no 266800
their business around the origination and distribution of risk” (FSR, April 2008, p8),
was to accelerate deteriorating conditions and “added to the mood of uncertainty
and pessimism” (FSR, April 2008, p8), creating thereby an accelerating cycle of
declining confidence and markets indicators.
Central banks, including the Bank of England, responded by lowering interest rates
and providing longer-term funding based on increasingly low quality collateral. The
Bank of England in December 2007 and in April 2008 followed through on the
“Special Liquidity Scheme”, a new schemes to extend funding beyond three months
and to enter into asset swaps of illiquid assets, including MBS, in return for UK
Treasury bills in order to assist banks with liquidity.
However, the crisis was to worsen still further when over the summer of 2008 the
two largest US mortgage corporations and Lehman’s Brothers, a US based broker
dealer, collapsed and the impact spilled over into international markets, placing
severe strain on global interbank funding markets and causing widespread
institutional distress. Liquidity and credit conditions in the UK entered a new, even
more acute phase. Investor appetite for risky assets collapsed.
As illustrated in Figure 2-13 below, UK bank credit spreads exploded in late 2008
and pressures in the UK banking system were “arguably as severe as at any time
since the beginning of the First World War” (FSR, October 2008, p2). Lending
maturities in the interbank market became very short, with many institutions only
able to borrow on an overnight basis. Three-month Libor spreads over official rates
hit new highs. Money withdrawn from the market was reinvested in assets perceived
to be a safe haven, such as government bonds. There was a high demand for US
Treasury bills as their yields briefly reached zero, an occurrence last seen during the
Second World War.

61
This project has received funding from the European Union’s Seventh Framework Programmefor research, technological development and demonstration under grant agreement no 266800
Figure 2-13 Major UK Bank Credit Default Swap Premiums
Source: FSR, October, 2008
The Bank of England responded by announcing a package of measures, including
raising capital for UK banks, extension of the Special Liquidity Scheme and
guarantees for UK debt issuances. There was a government-supported
recapitalisation scheme for UK banks and building societies, in which major UK
institutions participated, including Abbey, Barclays, HBOS, HSBC Bank PLC, Lloyds
TSB, Nationwide Building Society, Royal Bank of Scotland, and Standard Chartered.
These institutions committed to increase their Tier 1 capital and accept government
funded capital in the form of preference shares or ordinary equity. In addition,
participants in the program were given a Government guarantee for senior
unsecured debt instruments for terms up to three years, Commercial paper and
certificates of deposit. The Bank of England’s Special Liquidity Scheme was extended

62
This project has received funding from the European Union’s Seventh Framework Programmefor research, technological development and demonstration under grant agreement no 266800
to include £200 billion to banks and again allowable collateral was extended,
including debt issues guaranteed by the Government.
However, these measures proved inadequate for some institutions and there was a
wave of nationalizations across the globe, including in the UK. Bradford & Bingley
was partly nationalised, Alliance & Leicester was taken over by Banco Santander and
Lloyds TSB undertook an acquisition of HBOS. The UK Government was also forced
to support UK retail depositors in Icelandic banks following the institutional
collapses in Iceland. However, there was renewed concern that the focus in
regulation on capital and liquidity requirements had not been adequate as a
regulatory approach. Indeed, signally that it had recognised a structural change in
financial markets from prior years, the Bank of England commented that events
have “highlighted the need for a fundamental rethink of internationally appropriate
safeguards against systemic risk, including through the development of macro
prudential polices to dampen the financial cycle” (FSR, October 2008, p1).
As these measures started to impact markets in late 2008, conditions eased, but only
compared to the most acute phase of the crisis following Lehman’s collapse.
However, despite these extensive measures, spillover effects continued in UK
markets. As illustrated in Figure 2-14 and Figure 2-15 below, liquidity constraints
and mark-to-market losses worsened in 2009, depleting capital bases and
threatening banking collapse through a wave of illiquidity. Losses were also only
those reported by banks to the Bank of England. Huge losses were also made in
hedge funds, especially credit-based ones, and there were a number of bankruptcies
and closures of funds. Similarly, fund managers suffered severe losses, both
immediately in terms of asset price collapses and then as they struggled to adjust to
the new low interest rate environment.

63
This project has received funding from the European Union’s Seventh Framework Programmefor research, technological development and demonstration under grant agreement no 266800
Figure 2-14 Financial Market Liquidity (1992-2009)
Source: FSR, Bank of England, June 2009
Note: The liquidity index is a simple unweighted average of nine liquidity measures and shows the number of standard
deviations from the mean. normalised on the period 1999–2004. The measures are sourced from theBank of England,
Bloomberg, Chicago Board Options Exchange, Debt Management Office, London Stock Exchange, Merrill Lynch, Thomson
Datastream and Bank calculations. The series shown is an exponentially weighted moving average. The indicator is more
reliable after 1997, as it is based on a greater number of underlying measures.

64
This project has received funding from the European Union’s Seventh Framework Programmefor research, technological development and demonstration under grant agreement no 266800
Figure 2-15 Cumulative Loss of Market Value of Major UK Banks' Book Assets (2007-
2009)
Source: FSR, Bank of England, June 2009
Sources: Bank of England, Bloomberg, JPMorgan Chase & Co., Merrill Lynch, UBS Delta, published accounts
and Bank calculations. Based on weekly moving average prices of traded instruments as proxies for market
value of similar banking book exposures. (a) Group comprises Banco Santander, Barclays, HSBC, Lloyds
Banking Group, Nationwide, Northern Rock and RBS. (b) First UK support package announced (8 October 2008).
(c)Second UK package of measures announced (19 January 2009).
The absence of liquidity throughout 2009 resulted in the need for further government
intervention and central bank support. There was a wave of consolidations and
acquisitions and capital raising in the UK financial sector, several of these initiatives
sponsored by the Bank of England and the UK government. These included, in 2008
and 2009, the Alliance and Leicester acquisition by Banco Santander, the
nationalization of Bradford and Bingley and the merger of Lloyds and HBOS (FSR,
Bank of England, and October 2008). Capital raising was also required but the

65
This project has received funding from the European Union’s Seventh Framework Programmefor research, technological development and demonstration under grant agreement no 266800
inability of banks to do this during crisis conditions precipitated government bail-
outs, amounting to nationalization, including £76 billion in share capital to the “too
big to fail” banks of Royal Bank of Scotland and the Lloyds Banking Group.
In the United Kingdom, the implied mark-to-market losses on major banks’ loan
portfolios roughly doubled between October 2008 and end-January 2009, exceeding
the new capital raised during that period. By the end of March 2009, financial losses
on debt securities and equities since the start of the crisis had reached around
US$25 trillion in the UK banking market (FSR, June 2009). Banks in the UK sought to
conserve capital by further tightening credit conditions. The growth of lending to
households and corporates fell sharply and even became negative, with loan
repayments exceeding new loans. The macro-economic implication of this sharp
contraction in credit was severe for the UK economy. Against this backdrop, interest
rates were cut and central bank lending to the financial system rose to around 15%
of GDP in the United Kingdom. Together with further liquidity insurance, additional
capital investment and asset protection brought the total value of actual and
contingent support to the equivalent of about 50% of annual GDP.
By the end of 2009 the acute phase of the crisis in financial markets had abated and
financial markets were calming, underpinned by the massive provision of liquidity in
all the important banking markets of the world. Funding and liquidity concerns
eased and asset markets stabilized. In fact UK equity markets experienced a
significant rally in late 2009, rising 40% from March lows. During the second half of
2009, UK banks were therefore able to raise £50 billion in fresh capital. UK bank
credit default risk premia declined, although they remained 15 times higher than at
the start of the crisis.
However although by late 2009, financial markets were starting to stabilise and the
acute phase of the crisis was coming to an end, a chronic phase was beginning, with
the transformation of the banking crisis into a crisis of state finances, in large part
because of the additional financial burdens taken on by governments as a result of
the initial banking crisis. Few observers in 2009 anticipated the problems that were

66
This project has received funding from the European Union’s Seventh Framework Programmefor research, technological development and demonstration under grant agreement no 266800
to arise during the Euro crisis that was to emerge in 2010. In April 2010, problems
relating to Greek sovereign risk spilled over to other European countries and there
was a rapid retreat in markets followed by renewed liquidity strains for banks. UK
banks with improved capital and liquidity fared better than European banks but they
nevertheless were impacted by the problems. These issues are reflected in Figure
2-16 below, showing European sovereign credit spreads from 2008 to mid-2010. As
can be seen some countries’ spreads increased considerably, but the UK was
relatively unaffected by events. The problems in the euro zone continued throughout
2010 and up to the present day, requiring significant refinancing and support
programmes from the ECB and the IMF for various European countries. In the UK
the financial markets and banks remained relatively stable but there was an ongoing
trend for a shift into safe assets and further deleveraging throughout the period.
Figure 2-16 European sovereign spreads
Source: FSR, June 2010.
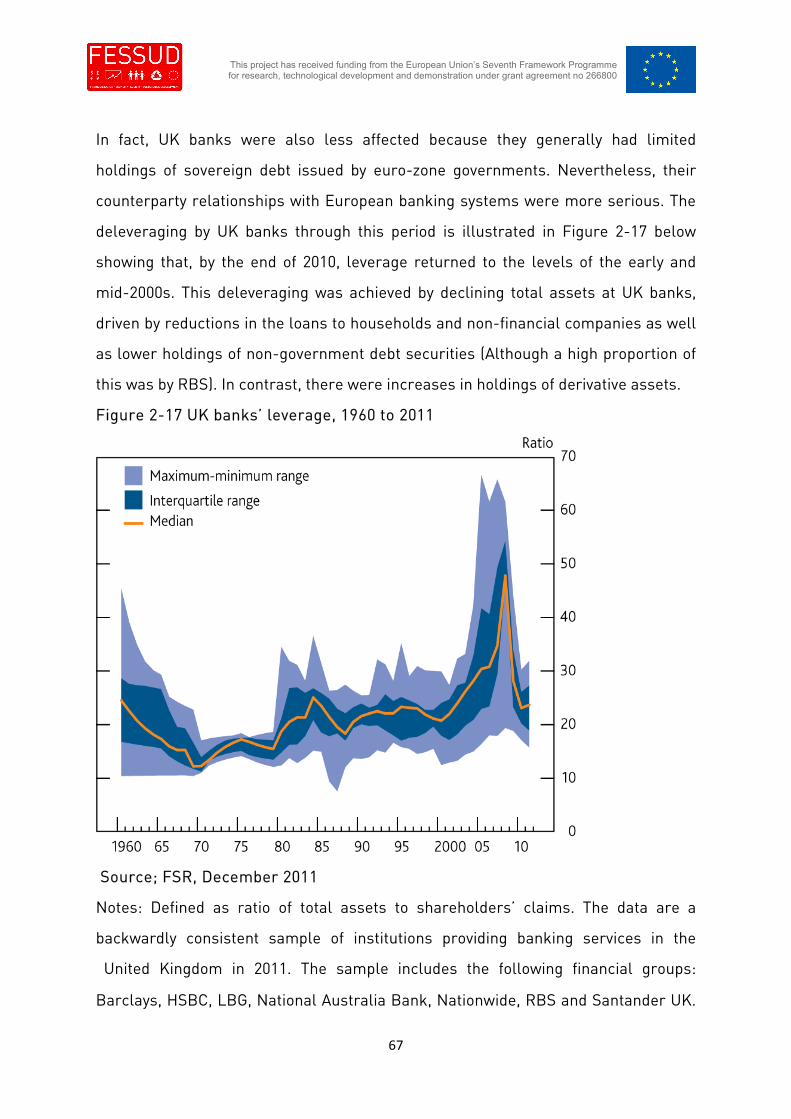
67
This project has received funding from the European Union’s Seventh Framework Programmefor research, technological development and demonstration under grant agreement no 266800
In fact, UK banks were also less affected because they generally had limited
holdings of sovereign debt issued by euro-zone governments. Nevertheless, their
counterparty relationships with European banking systems were more serious. The
deleveraging by UK banks through this period is illustrated in Figure 2-17 below
showing that, by the end of 2010, leverage returned to the levels of the early and
mid-2000s. This deleveraging was achieved by declining total assets at UK banks,
driven by reductions in the loans to households and non-financial companies as well
as lower holdings of non-government debt securities (Although a high proportion of
this was by RBS). In contrast, there were increases in holdings of derivative assets.
Figure 2-17 UK banks’ leverage, 1960 to 2011
Source; FSR, December 2011
Notes: Defined as ratio of total assets to shareholders’ claims. The data are a
backwardly consistent sample of institutions providing banking services in the
United Kingdom in 2011. The sample includes the following financial groups:
Barclays, HSBC, LBG, National Australia Bank, Nationwide, RBS and Santander UK.

68
This project has received funding from the European Union’s Seventh Framework Programmefor research, technological development and demonstration under grant agreement no 266800
Where data are consistently available for the UK component of the banking group,
these have been used.
In addition to continued deleveraging, the overall capital position of the major UK
banks improved, with issuances of substantial amounts of term debt in 2010 and
2011. However the rebuilding of capital strength continued to be impaired by losses
or weak profits. By the end of 2010, core Tier 1 capital ratios, on a Basel II basis,
rose by 0.85 percentage points to 9.9% in 2010, the highest level since 1992, although
there was notable divergences between banks.
In addition lending by banks remained impaired, as illustrated in Figure 2-18 below.
The macroeconomic implications of this will be discussed in the section on
macroeconomic policy.
Figure 2-18 Lending to UK households and private non-financial corporations
Source; FSR, December 2011

69
This project has received funding from the European Union’s Seventh Framework Programmefor research, technological development and demonstration under grant agreement no 266800
During 2011 market conditions again worsened as the Euro-zone crisis deepened
with no apparent sign of any imminent resolution. Nevertheless, despite these
concerns, the UK banks strengthened with a relative return to stability within the UK
financial system. However, at the time of writing, concerns remain over the
resolution of the Euro zone crisis, the trend in UK banking relating to forbearance,
especially in the household sector, and the macroeconomic outlook in which UK
banks operate.
2.4.2 Regulatory Responses in the UK
Following the crisis, and preliminary inquiries by the G20 and the International
Monetary Fund, the European Union and the Basle Committee of the Bank for
International Settlements undertook a review of banking regulation. The Basle
Committee recommended reform of the capital requirements for banks with
increased capital and decreased leverage under Basle III. EU proposals included
more comprehensive regulatory controls, to include for the first time non-banking
institutions such as hedge funds.
In the UK various post-crisis initiatives sought to review financial sector regulation.
In 2010, the Independent Commission for Banking recommended reforms whose
stated goal was a ‘stable and competitive’ financial sector that would ‘reconcile the
UK’s position as an international financial centre with stable banking in the UK’ and
create ‘greater resilience against future financial crises and remove risk from banks
to the public finances’ (Independent Commission on Banking Final Report 2011, p7).
However, given the Commission’s focus on regulation, as opposed to structural
reform of banking, the proposed reforms, were modest. They included adoption of
Basle III and ring fencing retail banking from wholesale banking, but no fundamental
reform of investment banking.
In publishing proposed legislation for these changes in 2011, HM Treasury
commented that the crisis was ‘caused both by failures in the financial sector, and by
failures in regulation of the financial sector. Financial institutions did not manage

70
This project has received funding from the European Union’s Seventh Framework Programmefor research, technological development and demonstration under grant agreement no 266800
their business prudently and, in particular did not understand the risks inherent in
the business they were conducting. Regulators and supervisors failed to provide the
robust scrutiny... needed... firms have become so large, interconnected and complex
that their failure posed a serious threat to the financial system and the regulatory
system lacked the tools to deal within this “too big to fail” problem’ (HM Treasury,
2011 p5). Proposals included restructuring of the UK regulatory responsibilities. This
included assigning responsibility for financial stability to the Bank of England with
two new bodies, the Financial Policy Committee and the Prudential Regulatory
Authority being responsible for macro and micro stability respectively (HM Treasury,
2011) plus a regulatory authority for business conduct. The central aim was to
ensure that the failure of institutions should be at the expense of private sector
stakeholders rather than public bailouts. But again, no fundamental reform was
proposed.
Overall, the reforms, whilst reasonable, fail to address many of the fundamental
problems that the period of financialization has created. Foremost among these
problems is that the scale, complexity and global nature of finance is, in itself,
destabilising to the economy. It is unlikely that any national regime can substantially
change this situation in the highly internationalised UK financial system with
effective international harmonization and coordination of regulation unlikely for the
foreseeable future. Here, it should be noted that the UK government’s hostile
attitude towards EU regulation is clearly an obstacle to greater international
regulation. Secondly, the culture of financialization as it manifests itself in the
financial sector remains fundamentally unchanged and neo-liberal. Characteristics
such as elitist individualism, risk taking, short term-ism and fundamental
detachment from the real impact of banks, apart from the enrichment of bankers,
remain unchanged. ‘New’ innovations are likely to appear to replace the old, but
their risk, elitism and destabilizing nature seem likely to remain the same. This is
further discussed below and in section 2.5.

71
This project has received funding from the European Union’s Seventh Framework Programmefor research, technological development and demonstration under grant agreement no 266800
Finally, the political will and ability to execute substantive reform is questionable. A
number of factors are responsible for this problem. Firstly, one of the cultural
characteristics of financialization is the hegemony of financial elites, including in
political influence and control. Acting in their own best interest, financial elites have
sought to prevent reform, including of the operational structures and activities of
banks and of pay and incentives. Fierce anti-regulation lobbying by the financial
services industry has continued throughout the period of review of regulation with a
determination to prevent any substantive regulation and reversal of the processes of
financialization that has enriched those elites27. General public anger at these
blatant self-interested attempts to prevent reform has been however largely docile
and muted, evoking surprise from the Governor of the Bank of England.28
Secondly, reformists had to address the issue of confidence in the banking system
and that the fear of reform during crisis could potentially deepen such a crisis in the
short term and thus undermine the long-term intent of reforms. Such a possibility
was advanced by anti-reform lobbying and reforms won limited interest from
political parties and the public. During the period of stability and market optimism
that preceded the crisis, the pressure from the various interest parties for financial
reform was weak, despite, as discussed earlier, many calls for it to take place.
During the crisis, alarms were raised that any radical reforms would undermine the
fragile confidence remaining in the markets, and thereby make the crisis worse. In
this way reform efforts were effectively neutered.
27 Even within the UK establishment there has been criticism of the actions of vested interests withinthe financial industry who have sought to prevent or minimise reform. Melvyn King, Governor of theBank of England, for example, commented that “Already we see vested interests rise up to defendtheir bonuses and profits” in August 2012(http://news.bbc.co.uk/today/hi/today/newsid_9718000/9718062.stm)28 This will be discussed further in the section on the culture of financialization. However, again, thiswas the view from members of the UK establishment, for example, in March 2011, Melvyn Kingcommented to the Treasury Select Committee that “The price of this financial crisis is being borne bypeople who absolutely did not cause it... I'm surprised that the degree of public anger has not beengreater than it has” (http://www.guardian.co.uk/business/2011/mar/01/mervyn-king-blames-banks-cuts). Although, in contrast, in July 2012, The Economist comments “public opinion continues to behighly critical of the lack of banking reform “ (The Economist, July 7th, 2012).

72
This project has received funding from the European Union’s Seventh Framework Programmefor research, technological development and demonstration under grant agreement no 266800
2.5 UK Financial Institutions & Their Roles in Financialization
The institutional structure of the UK financial market has changed in a number of
important ways in the period under study. These changes in institutional structure
are a fundamental part of the evolution of financialization in the UK and this section
of the report will review those changes. The section will first review the overall
changes in structure before discussing the main types of institutions in more depth,
including their function and patterns of profitability.
2.5.1 Introduction: Financial Intermediation and the role of Intermediaries
This section will provide a framework setting out the structure of the financial sector
and the nature of financial intermediation common in developed economies such as
the UK, and setting the framework for the subsequent more detailed review of
financial intermediaries in the UK.
In developed market economies decisions to invest and save are taken separately
and implemented by different economic agents at different times and with varying
surpluses and deficits. It is a fundamental feature of the financial system that allows
savings and investment to be intermediated across this temporal and surplus-deficit
mismatch. A financial system, and the intermediation it performs, consists of both
financial markets and institutions and in this section the paper will examine the role
and nature of institutions.
In a simplified financial system, as illustrated in Figure 2-19 below, non-financial
corporations finance investments from borrowing funds from households via
financial intermediaries and households accumulate deposit claims against
intermediaries in return. For households, deposits can be made for both short term
and long term savings. But often deposits require availability, including immediate
access. In addition depositors seek certainty of the safe keeping of their assets.
Conversely, investments by non-financial corporates are typically long term in
nature, such as physical plant or machinery and loans to finance these have long

73
This project has received funding from the European Union’s Seventh Framework Programmefor research, technological development and demonstration under grant agreement no 266800
maturities that match repayment capacity from income from such long term
investments. In addition returns are uncertain, given that income from investments
is reliant on future events, such as individual business success, product demand or
cost, as well as macroeconomic uncertainties such as business cycles. Finally
investors require larger amounts of finance than that which individual depositors are
typically able or willing to lend.
The role of financial intermediaries is to intermediate so as to overcome the risk
arising from pooling of funds, uncertainty and maturity mismatch. They also provide
important functions and assume certain cost that would be involved in the absence
of intermediaries. These include search and verification costs, which are the cost of
seeking out potential depositors and borrowers and assessing them, monitoring
cost, which are the monitoring of borrowers’ behaviour and credit worthiness, and
enforcement costs, which are the costs of enforcing contracts in the absence of
compliance such as in the case of non-payment by borrowers. Such functions
overcome the problems of asymmetric information including adverse selection and
moral hazard. The assumption by financial intermediaries of both transaction costs
and information asymmetries are the basic functions that allow them to create an
effective financial system.
In this role, financial intermediaries also perform two basic functions, maturity
transformation and risk transformation. The liabilities of bank are typically much
shorter than its assets. Indeed approximately 50% of UK retail deposits are
repayable on demand (Buckle & Thomson, 2004). Banks are thus termed to be
lending ‘long’ and borrowing ‘short’. Such maturity mismatch exposes banks to
liquidity risk which, as the report will discuss, can be a critical risk during banking
failures and crisis. However under normal financial market conditions, only a small
proportion of depositors require repayment at a particular time and their demands
can also be offset against those making new deposits. This means that an
intermediary can satisfy their requirements by holding limited liquidity assets and
use the remaining asset for longer term lending. Similarly in relation to risk,

74
This project has received funding from the European Union’s Seventh Framework Programmefor research, technological development and demonstration under grant agreement no 266800
financial intermediaries’ loan portfolios are subject to default risk making the
borrower’s future creditworthiness uncertain. Banks manage these risks by
selecting, pooling and diversifying their lending portfolio, as well as the holding of
capital reserves to meet unexpected losses. In addition, intermediaries act to
overcome scale constraints that would otherwise exist by pooling the relative small
funds of households into the large scale sums required for investment by non-
financial corporates.
The implications of this intermediation is to enable the creation of financial systems
which allow both households and non-financial corporate to both meet their needs
for savings and investment as well as serving the economic function of complete and
perfecting what would otherwise be market gaps and failures in financial markets.
Figure 2-19 Intermediated finance in a simplified financial system
Source: Buckle & Thomson, 2004.
In the UK financial system, these basic agents and functions are performed by a different
types of institutions and end users. Prior to the 1990s the intermediaries were largely
banking intermediaries plus participants in financial markets, including capital markets and
their agents. Figure 2-20 expands the Figure 2-19 taking the basic structure of a financial
system to a more complex one that is representative of the structure of the UK financial
system.
FinancialIntermediary
Non financialcorporates
Households
Funds lent Funds lent
Financial claim(loans)
Financial claim(deposits)

75
This project has received funding from the European Union’s Seventh Framework Programmefor research, technological development and demonstration under grant agreement no 266800
As can be seen, the essential intermediation between households and non-financial
corporate remains at the core of the financial system. However, the government also
becomes an important user of the financial system, primarily for the financing of
government debt, but also for savings. In addition, the services provided to the household
sector are separated into short and long term finance. Short term finance includes basic
retail banking services, such as current accounts, short term deposit accounts and
payments system, including cheques and electronic payments. Long term services include
the provision of long term savings and borrowing mechanisms. Long terms savings include
pensions, mutual funds, long term deposits and insurance, including life and housing
insurance.
Figure 2-20 Intermediated finance in a complex financial system
The different users and types of functions are served by differentiated financial
intermediaries. The short term banking needs of households are served primarily by
retail (commercial) banks. In the UK there are four major retail banks, RBS,
Barclays, HSBC and Lloyds - who, together with Nationwide and Santander,
dominate banking markets. (Davies et al, 2010). The retail banks provide payment,
settlement and transaction services, including the provision of deposit and custody
• Households(Long termfinance)
• Large nonfinancialcorporates
• Governments
• Households(Short termfinance)
• SMEs
Retail(commercial)
banks
Investmentbanks
Shadowbanking
(Hedge funds,private equity
funds)
Retailinvestment
vehicles(Insurance
funds, pensionfunds)

76
This project has received funding from the European Union’s Seventh Framework Programmefor research, technological development and demonstration under grant agreement no 266800
accounts, intermediation services, pooling household savings into deposits account,
personal loans, mortgages and SME lending. Retail banks are regulated institutions
and are subject to extensive legislation including relating to consumer protection.
They are discussed in more detail in section 2.5.2.
Households seek long term financial investments including pension funds, mutual
funds (called unit or investment trusts in the UK) and similar investment vehicles for
the accumulation of long term savings and assets. They also seek short-term loans
and longer-term mortgages for house purchases. Again, these are provided by the
retail banks and building societies. However in addition there are specialist
providers of financial services such as dedicated pension funds and insurers and
other investment institutions. These financial institutions enable the pooling of small
investors individual funds into collective investments funds. The principal
advantages are that they allow participating investors to diversify into a large
portfolio of assets combined with access to short term liquidity and professional
management for investors with relatively small savings. Such investment funds have
grown to become the dominant investment form for small investors and are
dominant investors in many financial markets today. There are four main types of
investment funds; Pension funds, life assurance companies, investment trusts and
unit trusts and open-ended investment companies. Many of these are affiliated to
retail and investment banks, and often sell products originated and transacted by
these banks, and managed by investment banks. Insurance companies and pension
funds are regulated institutions in particular in relation to their interaction with
consumers. These investment institutions are discussed in more detail in section
2.5.3.
However within the financial system, investment banks, formerly known in the UK as
‘merchant’ banks have become important intermediaries. As illustrated in the above
figure, they do not interact with the household sector but operate on a wholesale
basis with other banks, including retail banks and other investment banks, and with
large, sophisticated end users, such as large corporations and governments. In their

77
This project has received funding from the European Union’s Seventh Framework Programmefor research, technological development and demonstration under grant agreement no 266800
wholesale function they are critical intermediaries for primary markets for fixed
income and equity securities, in secondary market trading and in the interbank
markets. For governments they act as ‘primary dealers’ for the primary issuance
and secondary trading of government debt. Investment banks advise corporations on
the restructuring of those corporations’ balance sheets and issue securities for
them. With significance presence in inter-bank markets to maintain the liquidity of
their operations, investment banks have been the source of innovation in financial
products and markets and, in particular, of complex innovation. As such, they have
driven the core processes of financialization including expansion in the scale and
complexity of financial systems as well as their internationalization. Critically for
London, investment banks act as global intermediaries and reinforce the importance
of London as a key international market in the globalized financial system.
Investment banks are regulated institutions. Investment Banks are discussed in
more detail in section 2.5.1.
Finally an important and recent development in financial intermediaries has been
institutions within the ‘shadow banking’ system, most notably hedge funds and
private equity firms. Such institutions are varied and fall outside the regulation of
financial institutions and hence, by nature, are not transparent. They typically
function as investment vehicles for private individuals with large investment sums,
or for regulated intermediaries such as pension funds that wish to invest more
speculatively. Shadow banking institutions pool assets to invest in either direct
investments in companies or other non-financial assets or for investment in
speculation in financial assets. Alternatively, such vehicles can be spin-off activities
by commercial or investment banks that are designed to fall outside of regulatory
jurisdictions. Such vehicle are termed ‘special investment vehicles’ (SIVs) or ‘special
purpose vehicles’ (SPVs) and have been widely used for securitizations and similar.
Shadow banking institutions have been held responsible as important sources of
speculation and volatility in a number of financial markets including equity, fixed
income and commodity markets. SIVs and SPVs are discussed in more detail in

78
This project has received funding from the European Union’s Seventh Framework Programmefor research, technological development and demonstration under grant agreement no 266800
section 2.5.1., in relation to investment banks. Hedge funds and private equity funds
are discussed in more detail in section 2.5.4.
Overall each of these financial institutions have acted in the financial system as
intermediaries as described in the introduction as part of the fundamental aspects of
the functioning of a financial system. However in addition, they have also been
integral to financialization, with some types of activities, notably investment banks
and shadow banking, acting as primary driving agents of financialization. This
section of the report will now discuss each institutional type in more detail, including
details of their activities and their evolution since 1980, details of profitability and the
role each type of institution has played in financialization.
2.5.2 Introduction to the Main Types of Intermediaries
Overall, the number and size of financial institutions has proliferated. Table 2-1
below illustrates the huge growth in the assets, with a 67 times increase from 1980
to 2010. It is also notable that this growth accelerated hugely after the mid-2000s.
The greatest growth has been in banks and building societies which dominate
throughout the period on both an absolute and relative basis. Assets for banks and
building societies grew from £0.2 trillion to £12 trillion in this period. However
equally important is growth in other institutional types. Insurance and pension funds’
assets also grew hugely from £0.1 trillion to £2.6 trillion. Drivers for this include the
vast inflows in funds as privatization of pension funds inflated the UK capital market.
The impact of this structural change will be discussed in following sections. Finally
“other” institutions assets also grew and while smaller in absolute terms, their
growth rates were the fastest. These institutions cover a variety of institutions but
most importantly include hedge funds and private equity.

79
This project has received funding from the European Union’s Seventh Framework Programmefor research, technological development and demonstration under grant agreement no 266800
Table 2-1 Growth of Assets of UK Financial Institutions for selected years (1980-
2010)
£ Billions 1980 1992 1996 2001 2004 2008 2010 Growth
Banks &
Building
Societies
171 819 1,118 3,535 4,887 15,97
6
12,19
6
71x
Insurance Co.
& Pension
Funds
106 710 1,094 1,525 1,723 2,161 2,595 25x
Other 12 93 182 1,196 1,607 4,628 4,444 370x
Total Assets 289 1,622 2,394 6,256 8,217 22,76
5
19,23
5
67x
Source: Buckle & Thompson (2004), Financial Statistics, ONS (Growth defined
as multiple of original 1990 assets).
In addition to asset growth, the number of institutions within the UK has grown. By
2012, the Financial Services Authority (FSA) regulated over 29,000 firms of various
sorts29 (FSA website 2012). This figure excludes those firms outside its regulatory
remit which would further add to the total. Interestingly, however, for banks,
although numbers increased to 2001 to 480 banks, by 2010 numbers had declined to
only 380 (Source BIS 201230). This was due largely to consolidation in the sector,
which will be discussed further below.
In terms of profitability, for the sector overall, the share of financial intermediaries
in total profits in both absolute and percentage terms saw huge growth. As
29 The exact definition of regulated entities, individuals and activities is legislated for under TheFinancial Services and Markets Act 2000 (Regulated Activities). It includes a comprehensive list offinancial services activities including activities that may be undertaken by small firms such asmarketing, advisory and management services.30 Foreign ownership of those banks remained relatively stable during this period of consolidationwith, in 2001 231 (48%) and in 2010, 173 (46%) being foreign owned (Source BIS 2012).

80
This project has received funding from the European Union’s Seventh Framework Programmefor research, technological development and demonstration under grant agreement no 266800
illustrated in Figure 2-21 below, between 2004 and 2007 net income averaged £32
billion, before collapsing in the wake of the financial crisis in 2008 with an increasing
percentage of revenues from trading income, which represented 31% of net income
in the 2004 to 2007 period.
Figure 2-21 UK Annual gross income & profits of UK resident monetary
financial institutions.
Source: Bankstats, Bank of England.
-100,000
-50,000
-
50,000
100,000
150,000
200,000
2004 2005 2006 2007 2008 2009 2010
Retained Profit
Net Income (Pre tax)
Gross Income

81
This project has received funding from the European Union’s Seventh Framework Programmefor research, technological development and demonstration under grant agreement no 266800
Figure 2-22 Income of UK resident monetary financial institutions
Source: Bankstats, Bank of England.
Figure 2-23 Net profitability of the manufacturing, financial services and non-
financial service sectors, 2004 to 2011
Source: ONS, Bank of England
-100,000
-50,000
-
50,000
100,000
150,000
£M
illi
on
s Income (Non Trading)
Provisions
Trading Income
-20%
0%
20%
40%
60%
80%
100%
2004 2005 2006 2007 2008 2009 2010 2011
Financial Services
Manafacturing
Non-Financial Services

82
This project has received funding from the European Union’s Seventh Framework Programmefor research, technological development and demonstration under grant agreement no 266800
It is also useful to compare the profitability of the financial services sector with that
of other sectors, particularly manufacturing and non-financial services. Figure 2-23
above presents net operating income for these three sectors. As can be seen the
non-financial services sector dominates the other two sectors with an average profit
of £155 billion annually and a share of 75% of all sector net income between 2004
and 2011. Its income has varied only moderately throughout the period.
Manufacturing is also important with an average profit of £40 billion annually and a
share of 19% of all sector income from 2004 to 2011 but, significantly, very little
variation in annual income throughout the period. By contrast, financial services
have, from 2004 to 2011, an average annual net income of $14 billion, or 6% of all
sectors’ income. However, there is a very large variation between periods. From
2004 to 2007, the average annual income is £20 billion with a share of total income of
15%, but from 2008 to 2011, the average annual income is a £4 billion loss with a
share of the net income of the three sectors of minus 3%. These figures indicate that
financial services are an important sector in the economy. However, the figures also
show profits in this sector have been extremely volatile in the period around the
financial crisis, as illustrated in the figures showing profitability for the financial
sector alone.
For the purposes of the discussion, the different types of institutions can be
classified into four broad categories: Wholesale or investment banks (including their
orbital SPVs); retail banks; investment funds; and the “shadow banking” institutions
of as hedge funds and private equity funds. These categories have been chosen since
each has followed an important but different path of evolution and role in
financialization. However it should be noted that significant overlaps developed
between the four categories with the proliferation of a ‘universal banking’ model in
UK financial services.

83
This project has received funding from the European Union’s Seventh Framework Programmefor research, technological development and demonstration under grant agreement no 266800
2.5.3 Investment Banking
The traditional business of investment banks has been the issuing of new securities
and trading in financial securities. Such trading gives liquidity to markets in
securities. More recently investment banks31 have found themselves at the core of
the financialization of the UK as the institutions which have most radically evolved in
terms of their internal activities and their impact on financial markets and products.
This is due to two main factors. Firstly, the traditional activities of investment banks
in capital markets have extended to take in operations and support functions for all
financial markets and participants. To their control over primary markets for fixed
income and equity securities has been added a dominant role in subsequent
secondary market trading, Paradoxically, this has happened as a result of the
‘opening up to competition’ of secondary market trading in 1986. Since it is also in
this secondary market that commercial banks operate to maintain their liquidity,
through buying and selling of their portfolios of longer-term securities, this control
over secondary markets has brought investment banks to the core of financial
intermediation, acting as leaders in increasing levels of intermediation and in the
interbank markets. Secondly, and most importantly, they have been the source of
innovation in financial products and markets and, in particular, of complex
innovation.
2.5.3.1 Pre 1987 Traditional Investment Banks
Prior to the 1990s investment banks were, however, much more staid institutions.
Their primary role was to arrange the issue of new securities in the capital market
for large institutions, corporations and governments. These capital markets
activities included advising investment institutions on the structure of their portfolios
of financial assets. In addition to arranging the issue of new securities, investment
banks engaged in underwriting and merger and acquisition advice, and acting as
31 Also sometimes referred to as wholesale banks.

84
This project has received funding from the European Union’s Seventh Framework Programmefor research, technological development and demonstration under grant agreement no 266800
‘primary dealers’ for the central bank. During this period the majority of the risk held
by investment banks was in their credit portfolios, which were held on-balance sheet
with risk largely concentrated in credit and liquidity. The latter was higher than for
other financial institutions because of investment banks’ willingness to hold long
term securities, financed by short term liabilities in the interbank market, and
market-based deposits (Buckle and Thompson, 2004). However, their risk was
rendered more manageable because the credit risk was related directly to the
credit-worthiness of the firm or institution whose long-term securities were being
held as assets, and the notional value of the securities. This did not reduce risk
entirely, as the sovereign debt crisis of the 1980s, discussed in the previous section,
illustrated starkly where on-balance sheet credit portfolios generated enormous
credit losses. But the risks were relatively simple, transparent and linear.
However the seeds of the hubris of investment banks were already being sown in the
late 1980s as the banks sought to take over the management of sovereign debt and
assets, and practises such as secondary market trading of debt and debt swaps
developed. The Basle Accord of 1988 established the principle that banks should
hold capital in proportion to their risk-weighted loans. This ratio became a key factor
in banks’ management, in their credit rations, and hence in the cost of their capital,
i.e., their share price. The ability of banks to raise capital, as well as to unload their
loans into the capital market as bonds, became crucial for banks in their
management of their capital ratios. In addition, bond markets started to develop and
gain dominance over lending in capital markets as the Eurobond markets deepened.
In the US, but not yet the UK, securitization32 and repo markets began to be used to
manage capital ratios battered by sovereign debt losses.
32 Securitization dates back pre 1980 in the US but was primarily used in housing and auto loanmarkets.

85
This project has received funding from the European Union’s Seventh Framework Programmefor research, technological development and demonstration under grant agreement no 266800
2.5.3.2 Post “Big Bang” Merger and Acquisitions: The Rise of UK “Bulge
Bracket” Firms
However following the ‘big bang’ reform of 1987, investment banks started to evolve
rapidly in the newly deregulated markets. There was a surge in mergers and
acquisitions among financial institutions, as they all moved towards a ‘universal
banking’ business model. The model emerged with the deregulation of the Glass-
Steagall regulations in the US and, in the UK, the 1986 capital market reforms which,
by allowing commercial or retail banks to buy capital and money market brokerage
companies, effectively removed the distinction between retail and wholesale
banking. The vision of the eager senior managers was to create a ‘one-stop shop’ for
banking that would provide comprehensive services to global clients. On the one
hand it would allow a particular bank to monopolise a client’s financial service
provision. On the other hand, it was believed that this would create internal
‘synergy’. The latter was supposed to arise from alleged cost savings from
economies of scale and ‘cross selling’ of products into merged client bases.
This universal banking ambition was nicely captured by a quotation from a BIS
discussion of UK banking sector consolidation33:
‘In investment banking, a few of the biggest players have a global strategic focus.
Firms in this category believe they can do any kind of deal anywhere in the world that
a customer desires. The market gives special rewards to firms in this “bulge
bracket” in terms of much higher trading volumes ... (and the) desire by the bulge-
bracket firms to offer any service to any firm’ (BIS, 2005 p42).
‘Managerial empire building’ was an important motivation behind this ambition (BIS,
2005 p42). Mergers and acquisitions were seen as both an offensive and a defensive
mechanism in the race for the top. By 2001 BIS reported the industry had
concentrated into ten leading global firms (BIS, 2001, p276).
These global trends in investment banking were also apparent in the UK. In the
decade from 1990 to 1999, 685 merger and acquisition (M&A) transactions had been
33 http://www.bis.org/publ/gten05ch2.pdf

86
This project has received funding from the European Union’s Seventh Framework Programmefor research, technological development and demonstration under grant agreement no 266800
conducted in the financial services industry with a total value of $80.7 trillion. Of
these 244 were in banking, 156 in insurance and 285 in securities. Of the 685
transactions, 525 were cross border transactions. The number of UK banks had
reduced by 20% (Source: BIS, 2005).
Some individual UK banks sought to be acquirers and to compete in international
markets as firms with global reach. Those banks that managed to establish
themselves in this category had a truly extraordinary run of acquisitions. Table
2.5.1.2-1 below shows the string of acquisitions of two of the UK’s main banks. HSBC
in particular made a number of badly-judged acquisitions including the Trojan horse
of sub-prime risk, Household Finance Corporation and the disastrously over-priced
takeover by Royal Bank of Scotland of ABN Amro. By 2010 UK-originated banks had
been concentrated into four major banking conglomerates, Barclays, HSBC, Lloyds
and the Royal Bank of Scotland.

87
This project has received funding from the European Union’s Seventh Framework Programmefor research, technological development and demonstration under grant agreement no 266800
Table 2-2 Major mergers and acquisitions for Barclays RBS and HSBC
Acquirer Date Target
Barclays 1996 Wells Fargo Nikko Investment Advisors
2000 Woolwich plc (formerly the Woolwich Building Society)
2003 Juniper Bank (American credit card company),
2003 Banco Zaragozano (11th Spanish bank)
2005 Absa Group Limited, South Africa's largest retail bank
2006 HomEq Servicing Corporation (US mortgage subsidiary)
HSBC 2000 Credit Commercial de France
2001 Demirbank, (Turkish bank)
2002 Grupo Financiero Bital (Mexico's 3rd largest retail bank)
2003 Household Finance Corp. (US credit card & subprime lender)
2003 Polski Kredyt Bank
2004 Bank of Communications of Shanghai
2004 Marks & Spencer Retail Financial Services
2005 Metris Inc, (US credit card issuer)
2005 Dar es Salaam Investment Bank of Iraq
2006 Argentina of Banca Nazionale del Lavoro
2007 Chinese Bank (Taiwan)
2008 IL&FS Investment
RBS 2007 ABN Amro
Source: Annual reports
However many UK banks were acquisition targets. This was especially the case for
smaller, niche banks, insurance companies, asset managers and brokers with
attractive client relationships with major UK companies, but with limited ambitions
or access to global capital markets. Firms acquired by foreign banks included
Mercury Asset Management, bought by Merrill Lynch in 1997, Schroder Investment
88
This project has received funding from the European Union’s Seventh Framework Programmefor research, technological development and demonstration under grant agreement no 266800
Bank, bought by Citigroup in 2000, Robert Fleming, bought by Chase Manhattan in
2000, and Cazenove, bought by JPMorgan in 2004.
This extraordinary level of M&A activity led to UK banks becoming part of huge
globalised conglomerates. The activity resulted in a radical restructuring of the UK
institutional structure. Interestingly as early as 2001 doubts about the impact on
financial stability of this massive consolidation and internationalization of the UK
financial system were being raised. The Bank for International Settlements, for
example, in a report on the international consolidation of international banking,
commissioned by the Group of 10 finance ministers and central bank governors of
the leading international financial centres, commented on ‘the possibility for
international banking contagion following the weakening or failure of UK operating
banks, and that banks operating in the United Kingdom are susceptible to shocks
occurring to banks in other countries’ (BIS 2001 p155).
2.5.3.3 Increasing Complexity & Risk of Investment Banks Activities
However equally important to the changing institutional structure was radical and
prolonged change in the nature of the activities of investment banks. From the 1990s
they moved away from traditional on-balance sheet lending and capital markets
activities into innovative activities. This was driven by a highly competitive
marketplace, a continual drive for growth in profits and market share and a
misplaced faith in the value of the innovations being created. There were a number
of important aspects to these changes.
Firstly, investment banks expanded market-making – the making of secondary
markets in securities with holding of an ‘own book’ inventory of stocks on-balance
sheet – into increasing numbers of new ‘products’. Vanilla derivatives including
futures and options, warrant trading, interest rate swaps and similar became
common place and an increasing part of banks profitability. However over the period
to the mid-2000s, market-making margins were rapidly compressed to negligible
levels through fierce competition as the products were standardised, and hence

89
This project has received funding from the European Union’s Seventh Framework Programmefor research, technological development and demonstration under grant agreement no 266800
replicable by competitors, traded by larger numbers of market participants, and
margins became transparent to customers who commonly ‘shopped around’
between banks. Investment banks responded by seeking to maximise market share
and minimise cost in a high-volume, low-margin business model. This included the
development of highly sophisticated electronic trading facilities, or ‘platforms’ as
they came to be known, for products such as listed equities, foreign exchange and
vanilla swaps. Many platforms evolved to allow clients to execute trading directly via
the platform in their own premises. In addition achieving a high volume, low cost
operating model led to the development of ‘straight though processing’ technology
that accepted client orders from their direct communications’ links with a bank’s
dealing room, executed the orders on the relevant exchanges or internal trading
platforms and then processed the trade through the banks internal system without
any manual intervention. These technical innovations concentrated trading in a small
number of firms, called ‘flow monsters’, who could use technology as their
competitive advantage with success. Amongst UK banks only Barclays was
successful in this competitive field.
To avoid such low margin business many banks invested in more complex securities
that would afford some modicum of at least temporary monopoly rent. In particular,
securitization techniques were being developed by the US banks and became rapidly
incorporated into the practises of UK banks, leading to ‘explosive growth in both
scale and complexity’ (Independent Commission on Banking, 2011, p14). As noted
earlier, this was driven by external factors including the huge scale of balance sheet
expansion among UK banks, the search for yield by the investor clients of the banks
and the need to intermediate these flows in off-balance sheet forms that would
economise on the capital requirements laid down by the regulators.
Although increasing complexity in credit markets has been the focus of most
mainstream discussion (e.g. the Independent Commission on Banking Report, 2011),
credit was far from unique in being subject to radical innovation, increasing
complexity and increasing levels of internal trading and interbank activity. In equity

90
This project has received funding from the European Union’s Seventh Framework Programmefor research, technological development and demonstration under grant agreement no 266800
and fixed income markets increasingly complex structured ‘products’, or derivative
contracts, were developed, tailoring risk to clients appetites such as packing of
multi-product risk (for example, combining individual equities, indexes or bonds),
introducing very high levels of leverage into structured notes through leveraged
payout formulae, or tailored to specific market bets such as range trading or those
with structured payoffs. As noted earlier, innovation often combined these
instruments into SPVs.
Complexity also deepened through products and internal trading desks developing
activities based on non-linear risks. For example, trading of market volatility or the
volatility of the volatility became commonplace. Gamma trading and instruments,
whose value depended upon rates of change in market parameters, also became
common. Such products developed using firms’ internal evaluations of risk, under
permissive internal control systems for trading desks that were allowed to value
these mathematical measures of both risk and profit, applying new ‘Value at Risk’
techniques, which are discussed further below. As noted in the earlier section,
trading desks were established to deal in hybrids instruments, valuing multiple
different traditional categories of products such as equity, FX and interest rates, and
correlations between markets.
This wave of innovation was also driven by the search for higher margins as profit
margins on vanilla ‘flow’ products became compressed by competition, and as
individual banks sought competitive advantages for client business. Innovations in
structured products were ideal to meet these criteria as they offered both an ability
to offer a unique product to a client, with corresponding monopoly profits, and
opaqueness of pricing. Both allowed margins to be high. The opaqueness arose
because clients are quoted a single price for a deal, as opposed to a transparent
percentage brokerage or transaction fee plus market price for vanilla instruments.
The single price for a whole deal was based on confidential internal valuations which
determined profit margins, but to which the client did not have access.

91
This project has received funding from the European Union’s Seventh Framework Programmefor research, technological development and demonstration under grant agreement no 266800
Such opaque pricing of structured products, however, brought only temporary
profits. Due to the lack of any form of intellectual property rights in innovative
products, the products rapidly diffused through the industry via clients and as
employees moved between firms, often being hired specifically for this purpose by
competitors. Any monopoly over a new product was therefore short lived and
eventually margin compression would resume. This resulted in a shortening of
product life-cycle in order to retain profitability at banks, further innovation became
an imperative. Banks increasingly heavily marketed complex products despite
diminishing value to end-users.
By the mid-1990s however, client activities alone in both vanilla market making and
complex structured products failed to prevent a levelling of profits. Instead banks
were also increasing betting on price changes in markets, using information
obtained from within market making businesses, from market flows and from client
activities. In markets where oligopolistic market structure arose dominant players
had a competitive advantage in this type of speculation. In addition, investment banks
were noting the rise of hedge funds and private equity funds and the huge profits
they were making, if only because investment banks were losing significant numbers
of staff to these shadow banking players. These pressures led to the rapid increase
in outright proprietary trading activities within banks. Such activities included
dedicated proprietary trading desks and ‘internal’ hedge funds that were allocated
large chunks of capital. The capital allowed investment banks to leverage positions
(that is to enhance the scale of speculative activities by borrowing additional capital).
Senior traders were given very high levels of discretion. Speculative positions ranged
in strategies from placing huge one-way bets on macro ‘views’ – for example,
directional bets on changes in exchange rates, or equity market indices – to complex
trading strategies, such as arbitrage between two or more markets. Desks also
proliferated across markets such as credit and commodity markets. As will be
discussed below, revenue generation at investment banks became increasingly
dependent upon the success of proprietary trading.

92
This project has received funding from the European Union’s Seventh Framework Programmefor research, technological development and demonstration under grant agreement no 266800
Finally, investment banks’ activities changed fundamentally in relation to their client
base. Traditional end-user clients in the real economy, such as corporations,
governments and traditional investors (such as pension funds and insurance
companies) continued to be served. However such clients predominantly dealt in low
margin, less complex products, and traded infrequently (to avoid transactions costs)
and hence offered limited profit growth for banks. However new client sectors arose
which had a greater risk appetite for speculation and complex and diverse trading
strategies, such as hedge funds, private equity funds and sovereign wealth funds.
These client sectors were highly attractive to investment bank since they provided an
increasingly large client base with higher trading volumes in multiple products
including high margin, high risk structured products, and, in some instances, fee-
based business. The investment banks actively courted such institutions and they
became an important part of their client base. As well as products, services to such
clients proliferated. For example, a number of investment banks set up departments
that provided risk management services to small asset managers and hedge funds
using their internal technology platforms and subject to fixed fees known as ‘prime
brokerage’. In addition, ‘high net worth individuals’ – typically defined as individuals
with £50 million in liquid assets for investment – became important clients for
private banking and special divisions were set up to serve them. More traditional
clients, such as pension funds or insurance companies, would also be served in this
way, but through the participation of such clients in hedge funds or private equity
funds, rather than directly as pension funds or insurance companies.
Derivatives and structured products were also developed to arbitrage accounting
and regulatory rules with the specific intention of circumventing the spirit of those
rules, while strictly adhering to legal forms. The scale of the activity, in relation to
tax, was revealed when new disclosure requirements were introduced by the Inland
Revenue requiring disclosure of legal tax avoidance schemes of this type. Between
2004 and 2011, more than 2,000 different schemes and instruments were disclosed
(Source: HM Treasury, 2012). In a particularly flagrant example, Barclays

93
This project has received funding from the European Union’s Seventh Framework Programmefor research, technological development and demonstration under grant agreement no 266800
manipulated the buy-back of its own bonds and tax credits on interest to avoid over
£500 million in UK corporate tax until this scheme was retrospectively stopped by
the UK Inland revenue in 2012 (ibid.).
Similarly, in relation to accounting, banks sought to manipulate accounting rules in
relation to capital by seeking to book the vast majority of instruments in trading,
rather than banking books, where capital levels are lower (Independent Commission
on Banking, 2011, p. 19) and then to reverse this in 2008 and 2009 in order to avoid
accounting for mark-to-market losses during the financial crash. For example, in
2008, HSBC reclassified £7.6 billion of assets out of trading accounts into accounts
not requiring market valuations, to avoid recognition of losses on them. There was
also widespread manipulation of valuation of required reserves for structured
products that smoothed or accelerated profit recognition. As these practises became
commonplace the fundamental integrity of many UK banks financial statements and
disclosures was distorted.
2.5.3.4 The Increasing Reliance on Mathematically Based Risk and Valuation
Techniques
As banks expanded the geographical range of markets in which they operated, there
was significant knowledge transfer between the major financial centres. Market
practises and techniques, known as ‘best practise’, rapidly spread to and from the
UK for many areas of banking. In particular, from 2000, as the complexity of
transactions expanded, banks increasingly relied on internal mathematical models
for internal risk management and financial measurement.
Risk management increasingly adopted Value-At-Risk (VaR) models as ‘best
practice’ for all market players. These determined internal assessments of the
levels of risk on bank balance sheets, and were used by senior management in their
supervision of risk and internal risk control processes such as, for example, the
setting of risk limits for trading desk or market parameters. VaR was also
subsequently adopted as the basis for capital adequacy assessment as part of Basle

94
This project has received funding from the European Union’s Seventh Framework Programmefor research, technological development and demonstration under grant agreement no 266800
II. However VaR was heavily flawed. For example, it assumed a normal statistical
distribution of market movements and ignored the possibility of ‘tail events’ – low
probability but high value events such as financial crisis. It also relied on
extrapolation from historical data, typically over an annual period. These flaws were
widely known about by many of the sophisticated mathematicians who were
recruited by banks to develop mathematical models to value and manage the risks in
these instruments, and portfolios containing such instruments. However, the flaws
were widely ignored. The consensus within the industry as to what constituted ‘best
practice’ ensured that VaR models were widely accepted and dissenters ignored
(Independent Commission on Banking, 2011, 2010; Tett 2012).
In valuations of complex financial securities, values became detached from market
based valuations, known as ‘mark-to-market’. ‘Mark-to-market’ uses values that
depend on the current state of market liquidity. However, VaR valuations relied
almost exclusively on internal mathematical modelling based on parameters such as
ratings and historical trading patterns, with no direct reference to traded liquid
instruments, let alone any possibility of selling at a model-based price. This was
important because instruments such as Collateralised Debt Obligations (“CDOs”)
were not only being created and sold, but were also being sliced into tranches with
unsalable tranches being held on-balance sheet by banks. In the financial crisis the
mark-to-market approach failed because it relied on liquid markets that became
completely illiquid. However, by then, mark-to-model techniques ceased to have any
credibility because they ignored the ‘extreme events’ that were occurring and were
detached from any actual market benchmarks.
From the mid-1990s, clients who brought these instruments, including many in the
financial sector such as asset managers, hedge funds and investors, were often
provided with valuations by investment banks for instruments which had no
independent market value ‘soft’ agreements or assurances that the banks would
trade the instruments at or about these levels. This resulted in a number of frauds
95
This project has received funding from the European Union’s Seventh Framework Programmefor research, technological development and demonstration under grant agreement no 266800
where, typically, losses were hidden from clients34. ‘Best practice’ evolved to provide
internal valuations directly to clients. Many investment banks set up dedicated
departments to provide these valuations. Consequently when the severe
shortcomings of these models were revealed during the financial crisis, the assets of
the whole industry were infected by them.
These trends also meant that the competitive advantages of investment banks were
based not only on traditional aspects such as capital or credit ratings but also on
staff and technology platforms. In particular, many of the above activities were
completely reliant on highly complex and vast technology platforms which could
consolidate risk from hundreds of thousands of individual transactions and provide
instant risk information. Risk and valuations of such hugely complex risk books were
completed at least daily, and often many times during a trading day, and trading staff
were highly reliant upon them. Such platforms were almost always developed in-
house by each investment banks and were considered a critical competitive
advantage. Staff too became a factor in competitive advantage, as increasingly
specialist technical staff was required to manage the trading and back office
operations of banks. Competition for such staff in turn inflated terms of
compensation in investment banking.
Overall, as the Independent Commission on Banking report comments,
“Mathematical sophistication ended up not containing risk, but providing false
assurance that other prima facie indicators ... could be ... ignored” (Independent
Commission on Banking, 2011, p. 22)
2.5.3.5 Profitability Trends in UK Investment Banking
In the UK now, because of the range, if the not the scale, of capital markets, there
are a large number of investment banks, many major subsidiaries of international
‘universal banks’. The top UK based investment banks are Barclays Capital, HSBC,
34 Such as for example in the US Banker Trust and Gibson Greetings.

96
This project has received funding from the European Union’s Seventh Framework Programmefor research, technological development and demonstration under grant agreement no 266800
Lloyds and Royal Bank of Scotland (“RBS”). US banks JP Morgan, Morgan Stanley
and Goldman Sachs also have large UK-based investment banking subsidiaries.
Figure 2-24, below, presents the profits of the top four UK investment banks. As can
been seen between 2005 and 2007 average total revenues were £7.5 billion annually
and represented 32% of group revenue. The scale and growth of these revenues
reflect many of the trends discussed above, including the high level of transactions
in structured products as well as high levels of trading income from proprietary
trading.
Figure 2-24 Profitability of the Top 4 UK Investment Banks
Source: Annual Reports35
35 Figures are profit before tax as reported in each year’s audited annual financial statements by the
relevant bank. Some banks report consolidated results for the group of companies which include a
number of business lines. For these institutions, the investment banking division, as identified in the
business segments disclosures in the audited statements, has been included in the above figures.
This is as follows (i) “Lloyds” is “Wholesale Banking” within the Lloyds Group; (ii) “RBS” is “Global
Banking & Markets” within the RBS Group (iii) “HSBS” is “Global Banking & Markets” within the HSBS
Group; and (iv) “Barclays” is “Barclays Capital”.
-15,000
-10,000
-5,000
-
5,000
10,000
15,000
2005 2006 2007 2008 2009 2010 2011
£m
illi
on
s
Lloyds
Royal Bank of Scotland
HSBC
Barclays

97
This project has received funding from the European Union’s Seventh Framework Programmefor research, technological development and demonstration under grant agreement no 266800
However in 2008 and 2009, following the collapse of both levels of market
transactions and asset prices, profitability declined very sharply for UK investment
banks, with a net loss in 2008 for the sector of £400 million. This was repeated in
2009, although losses were concentrated in Lloyds. In both years the majority of
losses related to credit risk including the write down of structured credit products
such as senior tranches of CDOs and similar. In addition, in 2010, all banks were
affected by the fall in the value of Eurozone debt.
Of the four top UK banks, only Barclays have had a track record of making profits
every year since 2005. However its investment banking division revenues was later
found to have been inflated by tax avoidance that was described in the UK parliament
as ‘highly aggressive and highly abusive’36 in an example of ‘innovation’ to arbitrage
tax and accounting rules referred to earlier.
2.5.4 Retail Banking
Retail banks are institutions offering banking services in the UK and are
differentiated from investment banks in two main respects. Firstly, their client base
is concentrated among individual consumers and small businesses and, as such, is
characterised by a high volume, low margin business model. Secondly, the products
they offer are related to this client base and fall into three main categories. Firstly
they provide payment, settlement and transaction services, including the provision of
deposit and custody accounts. Secondly, they provide intermediation services,
pooling household savings into deposits accounts, pension funds and similar
investment vehicles and investment and lending services, such as personal loans,
mortgages and SME lending. Thirdly, they provide risk transfer and insurance for
households and companies.
In this section the paper will review the evolution of retail banking in the UK from
1980 to 2010 and consider its role in both the financial system and in financialization.
36 http://www.bbc.co.uk/news/business-17199273

98
This project has received funding from the European Union’s Seventh Framework Programmefor research, technological development and demonstration under grant agreement no 266800
2.5.4.1 The Evolution of UK Retail Banking
In 1980 the retail banking sector was composed of a large number of banks and
building societies, although with payments services concentrated in the four large
clearing banks, the National Westminster Bank, Lloyds Bank, Midland Bank and
Barclays Bank. Their services were narrowly focused on basic banking services and
their funding base was largely composed of deposits. However from the 1980s, there
were two major changes to this structure. Firstly, there was consolidation through
mergers and acquisitions reducing the competition to the ‘Big Four’ retail banks. By
2010, although there remained more than 300 recognized deposit taking institutions
in the UK, retail banking had consolidated to four main banks – Royal Bank of
Scotland, Barclays, HSBC and Lloyds37. Together with Nationwide and Santander,
these banks dominated retail markets. (Davies et al, 2010). Further concentration
took place during the financial crisis when 14 mergers took place, including between
Lloyds TSB and HBOS (Treasury Committee, 2011). Figures for market share in
different products are given in Table 2-3 below.
Table 2-3 Market share in 2011 of the Top 4 UK retail banks Plus Nationwide &
Santander
Category Market Share
Personal current accounts 85%
SME lending 80%
Business current accounts 78%
Mortgages 63%
Savings accounts 62%
Unsecured personal loans 60%
Source: Treasury Committee, 2010 (Secondary source: 2011 data not available)
37 As for investment banking.

99
This project has received funding from the European Union’s Seventh Framework Programmefor research, technological development and demonstration under grant agreement no 266800
Secondly, the building society sector, which traditionally had dominated the
residential mortgage market, had expanded into banking services during the 1980s
and 1990s. The sector itself contracted sharply in the 1990s when many societies
demutualised and became joint stock banks, to be taken over subsequently by
commercial banks. This was facilitated by the Building Society Act in 1986 which
progressively deregulated building societies and facilitated moves to
demutualisation. However during the financial crisis, building societies were further
consolidated and, by 2010, only a handful survived as independent entities (Bailey,
2011).
The emergence of banking oligopoly was partly motivated by greater competition for
market share to allow economies of scale38 especially since technological innovation
in the sector has been an important factor in achieving both low cost provision and
improved client services. The latter includes the emergence of Automated Teller
Machines (ATMs), and internet and telephone banking, which have transformed both
the economics of retail banking and the services expected by customers.
Interestingly, by the mid 2000s this had also created new entrants into retail banking
offering internet or telephone only services, such as First Direct, owned by HSBC,
and Citibank. However, smaller banks remained dependent upon the biggest banks
for payment services and cash withdrawal systems. Concerns have been repeatedly
raised regarding competition within the retail banking. In 2000 the UK government
commissioned the Cruickshank Report which reported that ‘competition problems
were found in all markets investigated’ (Treasury Committee, 2010). Since then there
have been over twenty inquiries into competition in retail banking by the Office of
Fair Trading (OFT) and the Competition Commission (CC) including into personal
current accounts, cash ISAs, credit cards and SME banking as well as barrier to
38 Although a number of academic studies have found that the scale of banks in the UK is now beyondthe optimum for achieving economies of scale (Davies et al 2010)

100
This project has received funding from the European Union’s Seventh Framework Programmefor research, technological development and demonstration under grant agreement no 266800
entry and exit in the market. These have had little effect on the growing
consolidation in banking markets.
Equally important was the deregulation of the industry which allowed retail banking
to be merged with wholesale and investment banking into universal banks. Such
mergers sought to gain retail deposits in order to provide cheap funding for
wholesale lending activities, cross-selling opportunities for new products, and new
possibilities for balance sheet management. By 2007 deposits in retail banks
averaged £97 billion (OFT, 2008).Today in the UK all the market leaders with the
exception of Lloyds are part of universal banks.
In the Independent Commission on Banking Report, however, one of the key
recommendations was a ring-fencing of retail banks and wholesale banking. This
was in order to provide protection for deposits from possible losses from investment
banking and to reduce the ‘too big to fail’ problem that had been created by
oligopolistic, universal banks.
2.5.4.2 Profitability of UK Retail Banking
Prior to 2006 many universal banks considered retail banking business to be a low
risk ‘annuity’ business that brought steady but unremarkable returns. Strategy was
focused on expanding the client base and the range of products, particularly high
margin products. An analysis of 2006 profits, immediately prior to the financial crisis,
in Figure 2-25 below, shows that the majority of revenues were obtained from
current accounts where, despite ‘free’ banking, there are heavy charges on
overdrafts and transactions with insufficient funds, and high margins due to the
prevalence of high nominal interest rates for borrowing in the period before the
financial crisis39. In addition other major sources of income were fees from
‘origination’, or arranging credit or financial services, and interest income on
mortgages and credit cards.
39 It was concerns relating to these charges that was the subject of the HM Treasury report fromwhich this data is sourced.

101
This project has received funding from the European Union’s Seventh Framework Programmefor research, technological development and demonstration under grant agreement no 266800
Figure 2-25 Revenue sources of UK retail banks, 2006
Source: Treasury Committee, 2010 (Secondary source: post 2006 data not
available)
However the crisis revealed the risks, and related volatile profitability of retail
business. As shown in Figure 2-26 below, profits prior to the financial crisis were
strong and totalled £8.9 billion for 2005 for the Top 4 UK retail banks. However this
profitability was sharply reduced with the financial crisis, as total profits dropped to
a low of £3.2 billion in 2009. This was because, firstly, all banks had to make
significant impairment provisions for their retail lending portfolios, especially in
relation to mortgage and consumer credit businesses where credit problems were
multiplying. High margins on retail deposits disappeared as interest rates came
down from 5% in April 2008 (the Bank of England’s official repo rate) to 0.5% a year
later. Faced with huge losses in their investment banking and other divisions and
severe liquidity constraints, RBS and Lloyds were partially privatised with over £75
billion being injected into them by the government in return for, in the case of RBS,
an 84%, and, in the case of Lloyds, a 40%, ownership stake. Problems described in
Mortgages19%
Currentaccounts
31%Savings
accounts17%
Credit cards13%
Loans10%
Investments4%
Insurance4%
Other2%

102
This project has received funding from the European Union’s Seventh Framework Programmefor research, technological development and demonstration under grant agreement no 266800
the subsequent FSA investigation included significant weaknesses in capital
positions, risky short-term wholesale funding, poor asset quality and substantial
trading losses, as well as, in the case of RBS, an acquisition of ABN Amro which
‘proceeded without appropriate heed to the risk involved and without adequate due
diligence’ (FSA, 12 December, 2011). Restructuring losses and write offs continued
to impair the bank’s profitability.
Figure 2-26 Profitability of the Top 4 UK Retail Banks40
Source: Annual Reports41
2.5.4.3 Retail Banking’s Role in “The Financialization of Daily Life”
When examining the role of retail banks in the period of financialization of the UK
(that is from the 1980s) and comparing it to the role of investment banks it would be
40 Figures are profit before tax as reported in each year’s audited annual financial statements by therelevant bank. Some banks report consolidated results for the group of companies which include anumber of business lines. For these institutions, the retail banking division, as identified in thebusiness segments disclosures in the audited statements, has been included in the above figures.This is as follows (i) “Lloyds” is “UK Retail Banking” within the Lloyds Group; (ii) “RBS” is “UK RetailBanking” within the RBS Group (iii) “HSBS” is “UK Retail Banking” within the HSBS Group; and (iv)“Barclays” is “UK Retail Banking and Barclaycard”.41 Figures are profit before tax as reported in each year’s audited annual financial statements by therelevant bank. Some banks report consolidated results for the group of companies which include anumber of business lines. For these institutions, the retail banking division, as identified in thebusiness segments disclosures in the audited statements, has been included in the above figures.This is as follows (i) “Lloyds” is “UK Retail Banking” within the Lloyds Group; (ii) “RBS” is “UK RetailBanking” within the RBS Group (iii) “HSBS” is “UK Retail Banking” within the HSBS Group; and (iv)“Barclays” is “UK Retail Banking and Barclaycard.
-
1,000
2,000
3,000
4,000
5,000
6,000
7,000
8,000
9,000
10,000
2005 2006 2007 2008 2009 2010 2011
Lloyds
Royal Bank of Scotland
HSBC
Barclays

103
This project has received funding from the European Union’s Seventh Framework Programmefor research, technological development and demonstration under grant agreement no 266800
easy to consider it benign. This is because it lacks many of the characteristics
described in the prior section in relation to investment banking. For example, the
increase in scale of assets and transactions was relatively modest, there was a
much smaller increase in complexity and banks risk remained, while increasing in
scale.
However it would be a mistake to consider the situation in retail banking as
satisfactory. Retail banks have played a critical role in financialization. In particular,
they have been the conduits for the transmission of financialization from the
financial sector to the household sector. In doing so they have been instrumental to
‘the financialization of daily life’ (Martin, 2002). This refers to the increasing intrusion
of finance into ordinary individuals’ daily lives including the assignment of financial
risk. This concept will be discussed in more detail in a subsequent section in
considering households and their balance sheets.
However, in this section, the report will consider two specific aspects that relate to
retail banking, firstly, the facilitation of a huge expansion in household credit and,
secondly, the facilitation of greater participation in personal investments and the
privatization of pensions.
2.5.4.4 Household Credit Expansion
The transmission of financialisation to households has taken the form of facilitation
of a huge expansion of credit to the household sector, mainly through mortgages and
consumer debt, with accompanying rises in household debt-income ratios reviewed
in the section on households below.
In mortgage lending, as illustrated in Figure 2-27 below, the scale of this increase
was enormous. Between 1997 and 2008, mortgage lending in the UK increased
almost twenty fold from £9 billion to £193 billion. This was driven by retail banks
expanding lending for mortgages as the housing market boomed. A Minsky cycle of
expanding credit and asset price inflation in housing markets was apparent
throughout the 2000s (Toporowski, 2010a). The boom in securitization required

104
This project has received funding from the European Union’s Seventh Framework Programmefor research, technological development and demonstration under grant agreement no 266800
mortgages to be continually originated to maintain the liquidity of the housing
market as well as to provide the loans needed to incorporate into new securitized
products.
Figure 2-27 UK Outstanding Mortgage Lending (1997-2008)
Source: Bankstats, Bank of England.
This expansion was largely to borrowers whose fundamental credit risk was sound.
However as the housing and securitization booms proceeded additional customers
were needed to prevent the collapse of the booms and, as in the US, lending
standards declined in order to allow for this. Towards the peak of the cycle in 2008
practices such as mortgages for 100% or more of housing values, buy-to-let
mortgages for speculators and the rise of the “self-certification” mortgage, which
required no proof of income by borrowers, were common. This is illustrated in
Figure 2-28 below showing the sharp declines in loan-to-income ratios (LTI) from
2000 onwards. Critically too, many borrowers “withdrew equity” often for
consumption, where credit was given against the unrealised gains in housing
0
20000
40000
60000
80000
100000
120000
140000
160000
180000
200000
ST
GM
illi
on
s

105
This project has received funding from the European Union’s Seventh Framework Programmefor research, technological development and demonstration under grant agreement no 266800
Figure 2-28 UK Loan to Income Ratios (1993-2007)
Source: Borrows et al (2011) (Secondary source: post 2007 data not available;
LTI stands for Loan to Income Ratio.)
When the economy and housing market started to weaken from 2007 the
combination of huge exposures, falling house prices and fundamentally weak credit
risk amongst these marginal borrowers resulted in a surge in arrears. As illustrated
in Figure 2-29 below, by 2009, 3.5% of mortgage borrowers were in arrears. In
addition, estimates of borrowers with negative equity, where the value of the house
is below the outstanding mortgage, surged to approximately one million by 2009
(Council of Mortgage Lenders 2009) and other borrowers were only being kept
solvent by the historically low interest rates. This collapse in credit quality of retail
banks’ portfolios resulted in substantial increases in bad debt provisions and
continues to affect the profitability of banks.
0
10
20
30
40
50
60
70
80
93 95 97 99 01 03 05 07
LTI > 2.5%
LTI > 3.5%
LTI > 4.5%
Per cent of new mortgages for housepurchase

106
This project has received funding from the European Union’s Seventh Framework Programmefor research, technological development and demonstration under grant agreement no 266800
Figure 2-29 Mortgages Arrears
Source: Council of Mortgage Lenders. Note: Arrears defined as more than 3
months outstanding. BTL stands for Buy-to-let. RoR refers to Receiver of Rent,
where a lender has appointed a Receiver to take rent directly from tenants of an
owner in arrears in arrears on a Buy-to-let mortgage.
The expansion of credit and decline in lending standards also occurred in consumer
credit with similar consequences for retail banks credit portfolios. As illustrated in
Figure 2-30 below, consumer credit grew from £50 billion in 1990 to peak at nearly
£250 billion in 2008. The expansion was financed through retail banks, primarily
through credit cards and overdrafts with lending growth from 2000 to 2005 averaging
over 20% annually (Borrows et al, 2011). Retail banks also contributed to the
growing use of credit cards acting as wholesale financiers for non-bank store cards
and card retailers.

107
This project has received funding from the European Union’s Seventh Framework Programmefor research, technological development and demonstration under grant agreement no 266800
Figure 2-30 UK Outstanding Consumer Credit (1987-2010)
Source: DataStream
Factors feeding this expansion included heightened competition in credit markets.
Resulting practices, such as zero interest charges with balances that could be
rotated through different borrowers and laxity in credit limits, encouraged over
indebtedness. In 2005, however, the credit cycle turned, banks reversed their lax
lending policies, and there was a sharp upturn in arrears and write-offs, as
illustrated in Figure 2-31 below. Arrears were also concentrated in low-income
groups where unsecured credit card borrowing has been most common. However
there appeared to have been a relatively small impact on consumer demand and
bank profitability from this contraction (Borrows et al, 2011). The implication of this
contraction for the culture of financialization however is discussed further in
following sections.
-
50,000
100,000
150,000
200,000
250,0003
0/1
/19
87
29
/1/1
98
8
31
/1/1
98
9
31
/1/1
99
0
31
/1/1
99
1
31
/1/1
99
2
29
/1/1
99
3
31
/1/1
99
4
31
/1/1
99
5
31
/1/1
99
6
31
/1/1
99
7
30
/1/1
99
8
29
/1/1
99
9
31
/1/2
00
0
31
/1/2
00
1
31
/1/2
00
2
31
/1/2
00
3
30
/1/2
00
4
31
/1/2
00
5
31
/1/2
00
6
31
/1/2
00
7
31
/1/2
00
8
30
/1/2
00
9
29
/1/2
01
0
31
/1/2
01
1
31
/1/2
01
2
STG
Mill
ion
s

108
This project has received funding from the European Union’s Seventh Framework Programmefor research, technological development and demonstration under grant agreement no 266800
Figure 2-31 Credit Card Arrears (1990-2009)
Proportion of UK lenders credit card balances in arrears by 3 or more payments
(%)
Source: Borrows (2011) (Secondary source: post 2009 data nota available)
2.5.4.5 Facilitation of the Privatization of Investments and Pensions
Against the background of the neo-liberal agenda of pension privatization and
shifting risk onto individuals, retail banks in the UK responded by marketing new
products to retail customers in order to meet the needs of households faced with
new dilemmas in balance sheet management, including new possibilities of saving,
and drawing cash flow from assets. Products proliferated as customers sought
advice and methods to invest and banks sought to expand their profitability by adding
new business lines. Retail banks started to offer a broad range of products including
insurance, share and fund dealing services, tax-based products such as ISAs and
private pensions. As these activities expanded, financial products became
increasingly complex in order to replicate the high margin cycle discussed in
relation to investment banking. This complexity was also promoted because of its
opacity. Retail clients found it difficult to evaluate margins on high risk products, or
0
2
4
6
8
10
12
14
16
90 92 94 96 98 00 02 04 06 08
109
This project has received funding from the European Union’s Seventh Framework Programmefor research, technological development and demonstration under grant agreement no 266800
benefits from such contracts. Products included derivatives, although often risk
limited by features such as guarantee on capital or returns in order to provide
compliance with FSA client suitability regulations.
However these transactions often were simply a marketing front for the expanding
asset management arms of universal banks, who managed the funds sold through
retail banks. The report will now discuss these institutions in more detail.
2.5.5 Investment Institutions
Investment institutions are a class of financial institutions that enable the pooling of
small investors individual funds into collective investments funds. They have two
principal advantages. Firstly, they allow participating investors to diversify into a
large portfolio of assets combined with access to short term liquidity. Secondly, the
funds provide professional management of the collective fund for those investors.
Such investment funds have grown to become the dominant investment form for
small investors in capital markets and, as such, investment funds are dominant
investors in many financial markets today.
There are four main types of investment funds; Pension funds, life assurance
companies, investment trusts and unit trusts and open-ended investment companies
(OEICs). As shown in Figure 2-32 below, the funds invested in these institutions have
shown huge increases, from £181 million in 1982 to over £3.4 trillion in 2010.
Pension and insurance funds account for 90% of those assets.

110
This project has received funding from the European Union’s Seventh Framework Programmefor research, technological development and demonstration under grant agreement no 266800
Figure 2-32 Assets of Investment Institutions (Selected years)
Source: ONS, Buckle (1992)
Over the period since 2000, as well as growth in total assets, there has also been a
shift in types of assets, as illustrated in Figure 2-33 below. The most notable change
has been the shift from UK to overseas securities reflecting the increasing
importance of emerging markets in financial markets especially in Asia and the
diversification by funds into them. ‘Other’ has also increased, but this was largely
due to the growth of holdings of short-term liquid assets in 2010, in response to the
financial crisis and resulting risk aversion amongst institutional investors.
-
500
1,000
1,500
2,000
2,500
3,000
3,500
4,000
1982 1990 2000 2005 2010
ST
GB
illi
on
s
Unit Trusts &OEIC
Investment trusts
Private Pensions
Insurance Funds

111
This project has received funding from the European Union’s Seventh Framework Programmefor research, technological development and demonstration under grant agreement no 266800
Figure 2-33 Assets Types held by Investment Institutions (Selected years)
Source: ONS, Buckle (1992)
The pattern of growing intermediation in these funds reflects a number of aspects of
the period of financialization in the UK. Firstly, there has been active neo-liberal
government policy to eliminate pension provision by the state and move that
provision into the private sector and to individuals in particular. As part of this policy,
from 1988 legislation was passed to encourage this shift. This included increasing
tax relief for individuals and corporations for pension schemes. The business lost by
insurance companies when tax relief on life assurance contributions was eliminated
in the 1990s was made up for by allowing more providers, including insurance
companies, to offer pension schemes and annuities ostensibly to encourage
competition. In addition, following scandals when company funds were stolen or
mis-invested by those companies in the instances of Belling and Maxwell, the 1995
Pension Act was enacted with stronger legislation to separate funds from employers
including providing pensions which could be transferred between employers, known
as ‘portable pensions’, and to improve regulation. This further encouraged funds to
flow into independent fund managers.
Secondly, the culture of financialization and the rising equity markets of the 1990s
encouraged individual speculation through these investment funds. The flow of funds
0%
10%
20%
30%
40%
50%
60%
70%
80%
90%
100%
2001 2005 2010
Other
UK Mortgages &Property
Overseas Assets
UK Corporate Securities
UK GovernmentSecurities
112
This project has received funding from the European Union’s Seventh Framework Programmefor research, technological development and demonstration under grant agreement no 266800
into bull equity markets was itself however problematic as the increasing capital
flows probably inflated markets over the long term. These trends had serious
implications for the culture of financialization in general and households and
inequality in particular.
In terms of profitability, insurance companies and pension funds have had
reasonable profitability throughout the 1990s and 2002, especially as they were
active in assets markets. However the risks of this strategy became apparent
following the crisis, as illustrated but Figure 2-34 below. As can been seen large
capital losses were made during the period, impairing the asset base of insurance
and pension funds which ensure their long term viability. In addition, and echoing
problems in Japan since the 1990s, the low interest rate environment in the UK since
2008 creates a problem as low risk income is greatly reduced in an environment
when risk appetite for higher yielding, risky asset is also low. As low interest rates
and risky asset markets have continued to affect the profitability of these companies,
including their ability to finance their liabilities to households, there has been a
growing tendency to invest part of their portfolios of assets in risky hedge fund and
private equity.

113
This project has received funding from the European Union’s Seventh Framework Programmefor research, technological development and demonstration under grant agreement no 266800
Figure 2-34 UK insurance company net income and financial indicators
Source: FSR, October, 2008
2.5.6 Hedge Funds and Private Equity Funds
As noted earlier, from the mid-2000s, hedge funds and private equity funds
congregated in London. For hedge funds, by 2011, £390 billion in assets and 20% of
global assets were under management in unregulated, UK-based firms42. The origin
of such firms came from a number of sources. Firstly such funds were initially active
in the US where the out-sized profits they made attracted interest. As private funds
started to increasingly flow into them they expanded beyond the US. In London many
US firms established satellite operations and increasing numbers of new firms were
set-up, often by former employees of investment banks. They were joined by spin-
42 Earlier data on hedge fund and private equity firms is largely not collated. From approximately 2005some information was collated by the UK FSA and commercial sources. This is used in this paper.However these surveys only partially cover the industry on a voluntary basis and therefore may not befully representative.

114
This project has received funding from the European Union’s Seventh Framework Programmefor research, technological development and demonstration under grant agreement no 266800
offs from investment banks proprietary trading activities. Such funds attracted
significant inflows of investment funds from an increasingly broad range of sources
as a period of conspicuous returns to 2007 attracted growing inflows. Major investor
types include pension funds with 18% of investor capital, banks and financial
institutions with 20% and high net worth individuals with 15% (Financial Services
Authority, 2011).
As illustrated in Table 2-4 below, global assets under management (‘AUM’) rose
from $0.9 trillion in 2004 to peak at $2.0 trillion in 2007 before falling back due to
sharp redemptions and losses in 2008 and 2009.
Table 2-4 Hedge Fund Indicators
2004 2005 2006 2007 2008 2009 2010 2011
Annual Return %
(a)
n/a n/a n/a 12.1 -19.1 18.6 9.4 -2.5
Global AUM $tr (a) 0.9 1.1 1.6 2.0 1.5 1.5 1.7 1.7
Global Asset Flows
$bn (a)
n/a n/a n/a n/a -
149.0
-72.0 82.6 14.7
UK AUM STGtr (b) n/a n/a n/a n/a n/a 0.32 0.34 0.39
UK Leverage (b) n/a n/a n/a n/a n/a 328% 399% 400%
Source: (a) Dow Jones Credit Suisse Hedge Fund Index (b)FSA hedge Fund
Survey for 2011 (ii) Return is Core Hedge Fund Index (ii) AUM and asset flows
are all fund.
These asset flows are consistent with the returns to hedge funds, illustrated for
global hedge funds below in Figure 2-35. The financial crisis severely dented hedge
fund returns and in fact net losses were made in 2007 and 2008. This is unsurprising
given the risk taking and heightened leverage typical of many hedge funds that
resulted in severely impaired returns during the financial crisis.

115
This project has received funding from the European Union’s Seventh Framework Programmefor research, technological development and demonstration under grant agreement no 266800
Figure 2-35 Hedge fund returns and net capital inflows
Source; FSR, October 2008
The activities of hedge funds are difficult to determine due to their operating as
investment partnerships rather than financial intermediaries open to the public. As
partnerships there are only limited public disclosure requirements. However the
majority are involved in either arbitrage or directional trading in major asset
markets, primarily long-dated G10 fixed income securities and derivatives. Listed
equities and credit derivatives and UK funds43 remain relatively limited players in
these markets with less than 1% of market assets and so are unlikely to disrupt
markets (Source FSA 2011). However some hedge funds are specialists in specific
markets and represent large proportions of outstanding. For example, the FSA
estimate that UK hedge funds held 6.1% and 3.5% of commodity and interest rate
43 Representing only 20% of the global AUM in hedge funds

116
This project has received funding from the European Union’s Seventh Framework Programmefor research, technological development and demonstration under grant agreement no 266800
derivatives respectively in 2011. In commodity markets, in particular, hedge funds
have been blamed for creating not only disruption in financial markets, but food
price inflation which impacted the poor in developing countries (For example, by
Oxfam 2011, and Christian Aid, 2011).
Private Equity funds are also private unregulated funds that typically provide
investment or debt funds to selected partners. Typical activities include financing
private companies, merger and acquisition finance, buy-outs and acquisition and
work-out of distressed assets. The most common distressed assets are real-estate
assets and distressed debt. Funds are typically highly leveraged. Funds flowing into
private equity funds prior to the financial crisis were significant because of the high
returns they generated through leverage. By 2006 funds raised in private equity
totalled $430 billion, up 38% from 2005, and were driven by the ‘intensification of the
search for yield’ (Bank of England, 2007, p17). They exceeded funds entering the UK
listed equity markets and were largely being used for leveraged buyouts. Pension
funds and financial institutions were major investors (FSA, 2006). Private equity was
also increasing leverage in the corporate sector, including through defensive
leverage of takeover targets (Bank of England, 2007).
For the purposes of this report, key aspects of financialization through hedge fund
and private equity funds, and their huge growth in the UK from approximately 2005
onwards, are their links both to pension funds and other financial institutions as
investors and to investment banks via borrowing, counterparty exposure and prime
brokerage. Other factors are their encouragement of leverage, including in non-
invested corporations seeking defensive leverage, and through market dominance,
in some instances setting off cycles of liquidity and asset price volatility in those
markets.

117
This project has received funding from the European Union’s Seventh Framework Programmefor research, technological development and demonstration under grant agreement no 266800
3 Detailed Issues in UK Financialization
3.1 The Financial Sector and Restructuring of the Economy
The UK financial sector has grown phenomenally in the last 30 years. In terms of
turnover, it is now the largest contributor to the export and export flows in the
balance of payments and represents a significant share of employment and GDP. In
statistical terms, the financial sector value added has grown at more than twice the
rate of the economy as a whole. UK bank assets have grown five fold (relative to
GDP) since the 1970s; they were about 100% of GDP in the late 1970s, amounting to
520% of GDP in 201044. At the same time the UK economy has shown a substantial
de-industrialisation over the last 30 years, with the share of manufacturing in GDP
falling from 30% to 12% of GDP. While the switch to a service based economy is
rather common in many other advanced industrial economies, de-industrialisation in
UK is greater than in any other nation45.
As explained below (Section 3.6) the resilience of the British economy and its
relatively free capital market has led to a considerable foreign investment flowing
into the country, with many companies relocating to the UK. Also the deregulation of
the financial services sector during the 1980s witnessed the arrival of US investment
banks in the City of London, bringing with them, amongst other things, their
expertise and techniques in the areas of mergers and acquisitions (Sundarsanam
2003). This in turn made the hostile bids more aggressive compared to those in the
past. The new financing techniques, such as highly leveraged buyouts, that were
transplanted from the US investment banks contributed to an increase in the
number and value of mergers and acquisition over the late 1980s. In 1989 the value
of merger and takeover was £26 billion, an increase of 50% from 1986(Buckle and
Thompson 2004).
However this raised widespread concerns, including from the Bank of England and
DTI Innovation Advisory Board, over the efficiency of UK business and the move
44 TheCityUK, (2012), Financial markets series, Banking45 http://www.guardian.co.uk/business/2011/nov/16/why-britain-doesnt-make-things-manufacturing
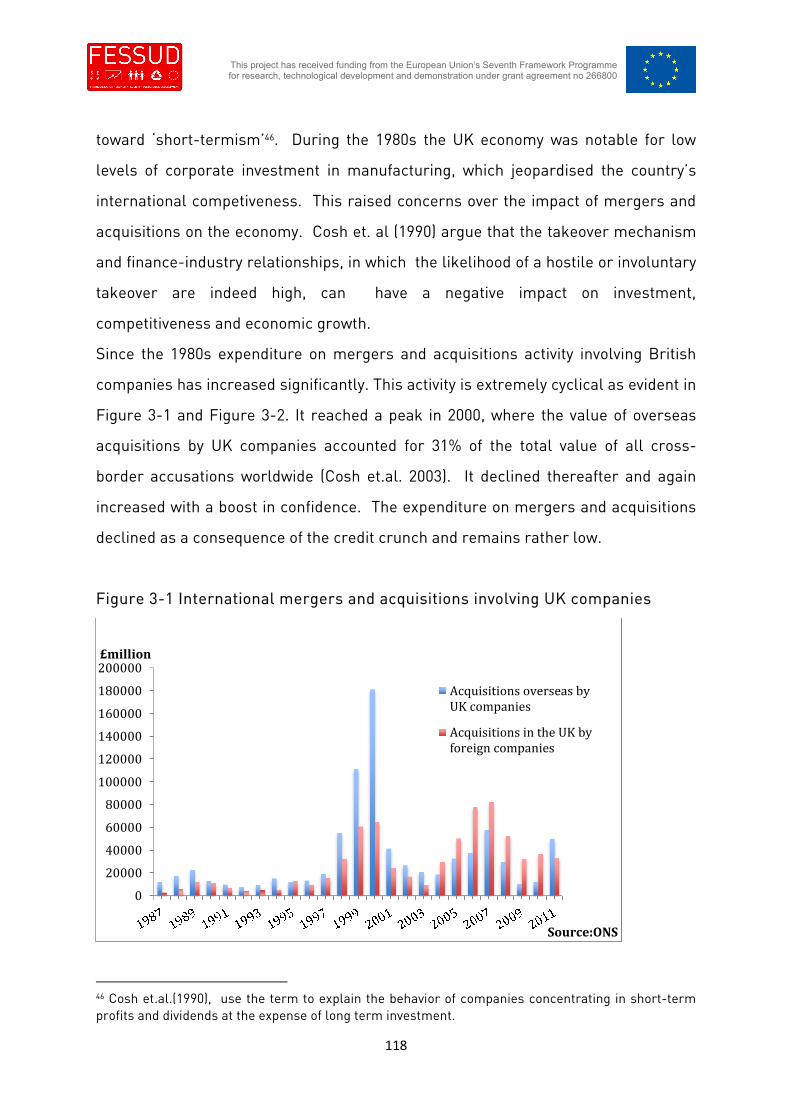
118
This project has received funding from the European Union’s Seventh Framework Programmefor research, technological development and demonstration under grant agreement no 266800
toward ‘short-termism’46. During the 1980s the UK economy was notable for low
levels of corporate investment in manufacturing, which jeopardised the country’s
international competiveness. This raised concerns over the impact of mergers and
acquisitions on the economy. Cosh et. al (1990) argue that the takeover mechanism
and finance-industry relationships, in which the likelihood of a hostile or involuntary
takeover are indeed high, can have a negative impact on investment,
competitiveness and economic growth.
Since the 1980s expenditure on mergers and acquisitions activity involving British
companies has increased significantly. This activity is extremely cyclical as evident in
Figure 3-1 and Figure 3-2. It reached a peak in 2000, where the value of overseas
acquisitions by UK companies accounted for 31% of the total value of all cross-
border accusations worldwide (Cosh et.al. 2003). It declined thereafter and again
increased with a boost in confidence. The expenditure on mergers and acquisitions
declined as a consequence of the credit crunch and remains rather low.
Figure 3-1 International mergers and acquisitions involving UK companies
46 Cosh et.al.(1990), use the term to explain the behavior of companies concentrating in short-termprofits and dividends at the expense of long term investment.
0
20000
40000
60000
80000
100000
120000
140000
160000
180000
200000£million
Source:ONS
Acquisitions overseas byUK companies
Acquisitions in the UK byforeign companies

119
This project has received funding from the European Union’s Seventh Framework Programmefor research, technological development and demonstration under grant agreement no 266800
The value of foreign firms investing in UK acquisition reached a record high in 2007,
at £82 billion (Figure 3-1). However this value could reflect the high scale
accusations of large corporations such as Alliance Boots and AstraZeneca’s
takeover47. The proportion of expenditure in takeovers involving large corporations
also dominated the market during 1984 and 1988 where 326 takeovers had a value of
over £25 million compared with 3,457 smaller ones.
Figure 3-2 Domestic mergers and acquisitions by value
47 http://www.investmentmarkets.co.uk/20070904-771.html
0
20000
40000
60000
80000
100000
120000
£million
Source:ONS

120
This project has received funding from the European Union’s Seventh Framework Programmefor research, technological development and demonstration under grant agreement no 266800
Figure 3-3: Number of domestic and cross-border acquisitions
However, the Bank of England reports that during that period the larger takeovers
accounted for 81.5% of total expenditure. The concentration on large takeovers
appears to be the same in the year 2000, where the value of acquisitions was at its
highest, whereas the number of acquisitions remained rather constant in the
previous year as evident in Figure 3-3.
The method of financing of UK merger and acquisition by domestic companies is
shown in Figure 3-4. Cash has been the most preferred method of payment in all
years but 1972, 1983, 1985 to 1987, 1997, 2000 and 2009 when the UK stock market
was in a bull phase. Use of fixed-interest securities during the last two decades has
been below 5%, the highest use being 23% in 1972.
0
500
1000
1500
2000
2500
Nu
mb
er
of
acq
usa
tio
ns
Source:ONS
Cross-border acqusations
Domestic acqusations
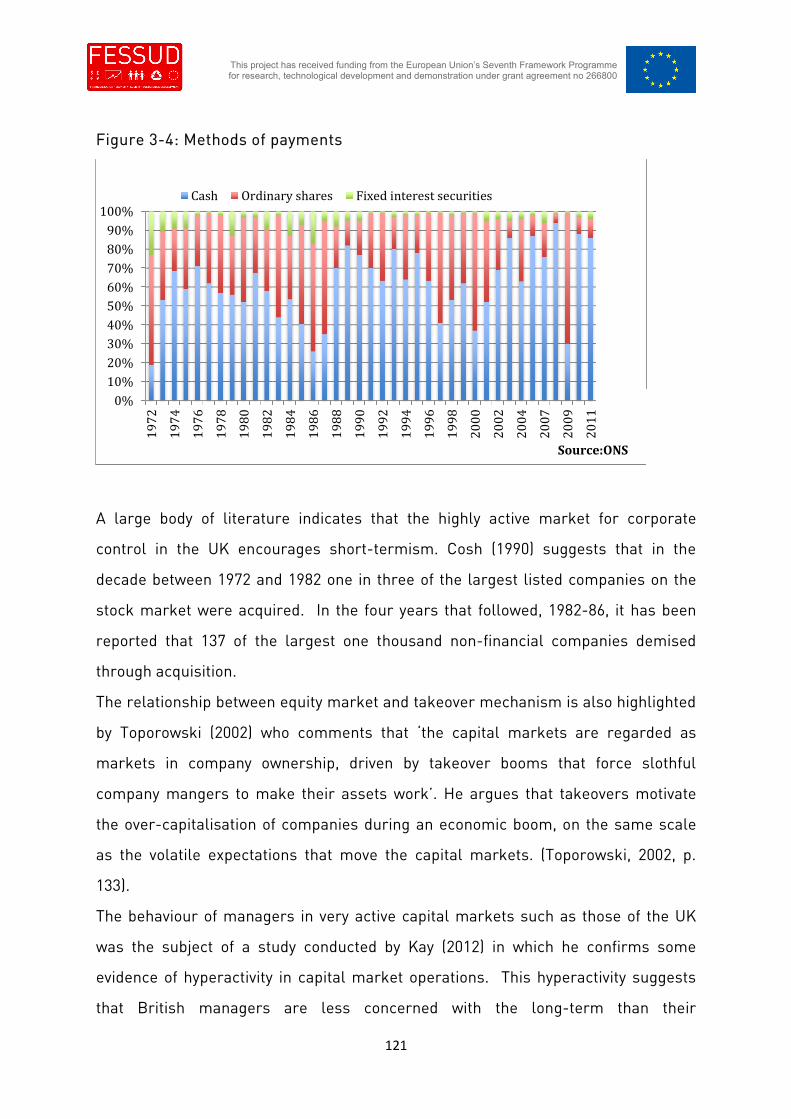
121
This project has received funding from the European Union’s Seventh Framework Programmefor research, technological development and demonstration under grant agreement no 266800
Figure 3-4: Methods of payments
A large body of literature indicates that the highly active market for corporate
control in the UK encourages short-termism. Cosh (1990) suggests that in the
decade between 1972 and 1982 one in three of the largest listed companies on the
stock market were acquired. In the four years that followed, 1982-86, it has been
reported that 137 of the largest one thousand non-financial companies demised
through acquisition.
The relationship between equity market and takeover mechanism is also highlighted
by Toporowski (2002) who comments that ‘the capital markets are regarded as
markets in company ownership, driven by takeover booms that force slothful
company mangers to make their assets work’. He argues that takeovers motivate
the over-capitalisation of companies during an economic boom, on the same scale
as the volatile expectations that move the capital markets. (Toporowski, 2002, p.
133).
The behaviour of managers in very active capital markets such as those of the UK
was the subject of a study conducted by Kay (2012) in which he confirms some
evidence of hyperactivity in capital market operations. This hyperactivity suggests
that British managers are less concerned with the long-term than their
0%
10%
20%
30%
40%
50%
60%
70%
80%
90%
100%
19
72
19
74
19
76
19
78
19
80
19
82
19
84
19
86
19
88
19
90
19
92
19
94
19
96
19
98
20
00
20
02
20
04
20
07
20
09
20
11
Source:ONS
Cash Ordinary shares Fixed interest securities
122
This project has received funding from the European Union’s Seventh Framework Programmefor research, technological development and demonstration under grant agreement no 266800
predecessors or their competitors. The review compares the frenzy with that of the
boardroom, where companies compete in search for mergers and acquisition with
that of the trading floor (Kay 2012).
There is also the case where some UK companies damaged their long-term success
by their focus on growth through mergers and acquisitions. Typical examples are ICI
and GEC, the largest industrial companies in the early 1990. GEC emerged in the
late 1960s, sponsored by the government’s Industrial Reorganisation Corporation,
established in 1964 with the objective of increasing the competiveness of UK
companies internationally. GEC was merged with its’ two competitors at the time,
English Electric and AEI. In 1996 the company, under a new management team,
decided to reposition the company by an aggressive programme of acquisitioned
disposals. The programme drove the share price of the company to collapse, and
after a major debt for equity swap the company was broken up. Another example is
the other British company ICI which was established through mergers in the 1920s.
Driven by market demand the company has changes its business activity becoming
successful in the pharmaceutical industry. In 1990, the company decided to float its
pharmaceutical division as the company began a programme of business disposal
and acquisition, with the objective to re-establish the company as a speciality
chemical business. This strategy turned out to be unsuccessful and eventually ICI
was acquired by AkzoNobel in 2007. These two examples illustrate the
financialisation of large UK corporations in the last two decades. Under stock
market pressure, influenced by market perception of business performance as
reflected in the rating of their stock, companies diverged from trading in their
specialised products to trading in company ownership with devastating results.
3.2 The creation of an unbalanced economy
A common objective of UK governments throughout the years has been to promote
and maintain the role of the City of London as a leading global financial centre. And
this objective has perhaps been at the core of most political and economic decision
undertaken by them. For example, in devaluation of the pound debate in mid 1960s,

123
This project has received funding from the European Union’s Seventh Framework Programmefor research, technological development and demonstration under grant agreement no 266800
the City of London pledged, with the then Labour government, not to lower the
exchange rate, even though it seemed economically beneficial to do so in the sense
that not only it would have reduced the strain on foreign reserves but also the British
industry would have benefited from it by increasing sales and profits. The City
pledged with the government not to devalue the pound, amid worries that it would
harm their international position by imposing major losses on those foreign
investors that held sterling deposits and investment in London. Eventually in 1967,
the government decided to devaluate the pound; a decision from which the City not
only did not suffer any major losses but it marked the beginning of a new role as a
multilateral offshore centre (See Section 1.1 for more details).
Since then, and through the deregulation and Big Bang reforms in the 1980s,
governments have indeed succeeded in promoting the position of UK’s financial
sector as a leading international centre. However, its growth has evolved in such
way that some believe to have created an “unbalanced economy”. While the financial
sector has increased enormously in the last 30 years the UK manufacturing sector
on the other hand has deteriorated markedly over the same period. Williams et al
(2011), state that the output of manufacturing sector has remained nearly at the
same level as that of 1979 whereas employment in the sector has declined from 6
million in 1979 to just 2.5 million in 2011. This is because the UK’s manufacturing
sector has lost a significant export market share whist import penetration has risen
sharply. Whereas, the financial sector has increased by three times since 1979, the
number of workers employed by the financial sector has remained in the one million
range48. And even so, the employment figures represent, to some large extent,
workers employed in London (where financial services companies are concentrated),
rather than any other city in the UK which job creation has proved to be more difficult
with a declining manufacturing industry. This is despite the fact that financial retail
48Williams et al(2009), report that the number employed in the financial sector in 1992 was 986k and1,054k in 2007.

124
This project has received funding from the European Union’s Seventh Framework Programmefor research, technological development and demonstration under grant agreement no 266800
finance employment is spread across the UK, London still accounts for the largest
concentration of employment in finance.
Even though the growth of the financial sector is perceived to be important to the UK
economy, mainly by means of tax contribution and employment, -in the so-called
“great moderation” period it was labelled as the jewel in the crown of the UK
economy- in the wake of the 2007 financial crisis, this apparent success turned out
to be misleading. As argued above, the employment figures are clustered in the
London region rather than throughout the nation. In terms of tax revenues received
from the financial sector, it is true to some degree that the financial sector is a great
tax contributor but only when evaluated on the corporate tax proportion rather than
the overall contribution to all government tax revenues. A report form CRESC
(Centre for Research on Social Cultural Change CRESC 2009) suggests that the
finance sector has paid less tax than the manufacturing sector in all years through
2002-2008. For example in 2005-06, the finance sector’s contribution to all
government tax revenue accounted for 7.1% of this revenue, whereas the
contribution from manufacturing accounted for 12.9%. The reason as to why such a
large and profitable sector contributes so little to tax receipts is based on the
exemption from taxes (such as Value Added Tax and Stamp Duty) that the majority of
traded financial instruments, in the City of London, enjoy. Financial transactions in
London have the option of going off-shore, since the first Eurobond issue in 1963.
The creation of the Eurobond market, which was initiated by Seigmund Warburg49,
provided an alternative way in which corporations could raise finance and
circumvent the restrictions of national exchange controls that existed at the time.
This initiative contributed positively to the role of the City as an offshore financial
centre and was seen as a step toward European economic integration50. The
Eurobond market grew considerably in the 1980s, even though exchange controls
49 Seigmund Warburg, was a UK based banker that launched the first Eurobond issue50 http://www.telegraph.co.uk/culture/books/7890369/High-Financier-The-Lives-and-Time-of-Siegmund-Warburg-by-Niall-Ferguson-review.html

125
This project has received funding from the European Union’s Seventh Framework Programmefor research, technological development and demonstration under grant agreement no 266800
were lifted in 1979 and continue to prosper because such bonds are issued free of
withholding taxes.
The deregulation of the financial market industry during the 1980s was associated
with a range of tax breaks that contributed greatly to the growth of finance. Amongst
others, the UK government increased indirect taxes on goods and services, but
financial products were excluded from such taxes, and in turn made them more
attractive (Pilbeam, 2010)
Williams et al (2011) state that, “the City of London has a power like that of a City
State within the national economy”. This statement shows how economic policy
priorities have come to protect and defend to some degree the City of London, as
evident in the aftermath of the financial crisis. The decision to save the financial
sector in the 2007-08 crises has been at the expense of the taxpayers, in which the
UK government spend hundreds of billions of pounds in an attempt to stabilise a
complex financial system. This by itself casts doubts over the effectiveness of the
financial sector in generating social value. Turning again to the tax contribution
argument, it is estimated51 that the amount of total tax paid by the financial sector
over the period 2002-2007 was £203 billion (source???). This figure combines £101
billion of taxes borne and £102 billion taxes collected my means of income tax and
national insurance. However, Williams at el (2009), argue that this was mainly
because of a bubble effect in which government tax receipts from the financial
sector increased by nearly 50% after 2002. Nevertheless, when considering the
bailout costs, which in 2009 are estimated to have been a total of £289 billion, but
when including the amounts of loans and guarantees provided by the Bank of
England and the HM Treasury, the bailout costs could be as high as £1,183 billions
(Williams et al 2009). This provides clear evidence that the tax contributions
outweigh the bailout costs considerably.
51 Because total tax paid by the financial sector is not recorded by any official source, CRESC providesestimated figures, which are used in this report.

126
This project has received funding from the European Union’s Seventh Framework Programmefor research, technological development and demonstration under grant agreement no 266800
The growth of the financial sector, which is associated with financial innovation in
wholesale finance, has to some large degree, changed the conventional role of
banking in the economy. Banks no longer focus on their traditional role as a
financial intermediary in channelling savings from household to firms that invest, but
rather their role – where the core of its business became proprietary trading- is “ to
manage and transform risk for an outside corporate customer” (Williams et al 2009).
The business model created by the financial sector was one in which retail services
joined with wholesale through complex securitization and as a consequence banking
became a “giant transaction-generating machine”, from which the finance sector
was able to create, the much anticipated, high amounts of shareholders value. The
latter was imperative to generate and maintain in the years before the 2007-08
crises, as the interaction of large companies with the stock market was based on the
ability of such firms to meet the increasing demand for shareholder value. Hence,
such system imposed new priorities- to meet the demand of the stock market for
shareholder value- or face same fate as the British manufacturing sector, which left
the stock market (Williams et al 2009). Prioritization for shareholder value leaves
little incentive to deliver social value and instead makes the banking sector work for
itself.
In 2006, a report from CRESC, raised concerns about the impact of the new
managerial capitalism role in the present capitalism. The paper examines the role of
capital market participants, such as corporate lawyers, private equity fund
managers, investment bankers, and hedge funds managers who not only provide
services to large corporations and encourage activities such as mergers and
acquisitions, but also operate and innovate within the capital market. However, such
managers, which form a class of elites pursuing their own interest, benefits from
financial activities such as M&A have not been at full potential. For example, the
fees that are charged from investment bankers on M&A are believed to be around
1.5% of the total deal. As a consequence, in the Mannesmann takeover, Vodafone

127
This project has received funding from the European Union’s Seventh Framework Programmefor research, technological development and demonstration under grant agreement no 266800
had to pay a total of $640 million in fees, out of which Goldman Sachs and Warburg
Dillon read were reported to have earned $75 million each (Williams et al 2006).
In general the UK may be said to have entered the financial crisis with too much
(private sector) debt and this is perceived to be the major factor exacerbating the
problem. However, in reality rising high debt levels should not be a major concern if
applied to productive use, such that it generates enough resources, not only to meet
its financial obligations but also to contribute to economic growth52 and welfare.
However, high levels of debt became an issue, when the credits provided by the
financial sector induce instability by inflating asset price bubbles rather than
facilitating productive investment with more stable income and liquidity benefits.
Indeed, in the UK, between 1996 and 2008 the proportion of productive business
investment as a percentage of GDP remained constant at 10%, whilst bank lending to
productive investment fell from 30% to 10% over the same period.
At this point it is worth noting the views of those economists, who did to some extent
foresee the outcome of asset price inflation on economic activity, but were
neglected by policy makers of advanced capitalist economies. In the twentieth
century a number of economists have argued that the financial system can cause
economic crisis53. From the early 1990s, Toporowski has argued that inflation in the
capital market induces financial fragility in the economy by encouraging equity
finance, which leads to the overcapitalization of companies, and by limiting the role
of banks as financial intermediaries. At the core of this theory is the suggestion that
when capital markets are driven by asset price inflation, the demand for long-term
securities increases as investors are attracted by additional returns of capital gains.
An excess demand for long-term securities results in changes on the structure of
balance sheet operation of companies. They find it easier to increase profits by
52 By means of increasing employment, infrastructure, profits, improve productivity etc.53 Such as Minsky’s views on the instability of modern capitalism and Hobson’s prediction thatcollateralize lending could lead to asset inflation.

128
This project has received funding from the European Union’s Seventh Framework Programmefor research, technological development and demonstration under grant agreement no 266800
substituting debt finance with equity in takeover and/or mergers and acquisition,
than through productive investment. In addition, the substitution of debt finance with
equity, makes the banking system more fragile, in which banks lose their best and
safest customers, corporations and governments, and are forced to lend to less
financially secure borrowers, carrying greater risks.
The fact that the UK corporate sector drew little credit, under conditions for which
bank credit was cheap and easy to obtain, to fund any productive investment,
provides support to Toporwski’s theory. Furthermore, the house price inflation that
was encouraged by the deregulation of housing credit since the 1980s and bank
lending, illustrates the foundations of asset inflation with collateralized lending
(Toporowski 2009) and is discussed in more details in section 5.2.
Williams et al (2009), state that the demand of UK non-financial corporate firms for
bank debt was at very low levels, because they found operations in capital market,
such as M&A activities; share buybacks and debt/equity swaps, a more effective way
to achieve shareholder value. Instead, bank lending supported household house
purchases, by providing mortgages, and other financial firms, such a private equity.
Even though house price inflation could lead to unproductive GDP growth, UK
governments since the 1970s have encouraged home ownership. GDP growth
induced by asset inflation becomes unproductive as credit for home purchases leads
to an increase in equity withdrawals, which in turn makes credit a consumption
demand function. So that when credit is easily obtainable, house prices increase and
equity withdrawals contribute to higher consumption levels that fuel economic
growth. In fact a study conducted by the Bank of England in 2004, reports that
around 40-50% of equity withdrawals were used to finance consumption (Williams et
al 2011).
3.3 The Evolution of “Light Touch” Regulation
The traditional system of informal regulation broke down in financial crises of 1970s,
specifically the 1974 secondary banking crisis, which resulted in the enactment of

129
This project has received funding from the European Union’s Seventh Framework Programmefor research, technological development and demonstration under grant agreement no 266800
the Banking Act 1979. Before this Act the British banking sector was not under
prudential regulation or supervision. Because of the overall stability of the industry,
explicit legislation was not considered important. The system was based on ‘moral
suasion’ an informal approach to bank supervision taken by the Bank of England in
discussions with and general recommendations for banks (Petters, 1986/87).
However during the late 1960s and early 1970s the UK banking industry underwent a
major structural change. The informality of banking regulation, and the rise of the
Euro-dollar market in London, had attracted a number of foreign banks, which
operated as branches or subsidiaries. This faced the Bank of England, as the main
regulatory authority for the banking system, with a dilemma over how to make
banking regulation more effective without making it more formal. Not for the first
time, the attractions of allowing competition in markets to do the job of regulation,
were promoted as an alternative to direct regulation of credit (the recommendation
of the Radcliffe Committee on the Working of the Monetary System in 1959) in the
form of Competition and Credit Control, inaugurated in 1971. There followed a rapid
expansion of consumer credit, and the rise of the so-called secondary banks, so-
called because they conducted banking business, funded from the inter-bank market
and not from public deposits. Hence they were not recognised or regulated as banks.
With the expansion of consumer credit, there emerged in the wholesale money
market, the inter-bank market, a number of innovations, such as markets in
certificates of deposit (CD) in sterling and dollars.
In 1974 the Bank of England launched the ‘lifeboat’ operation as a number of
secondary banks, e.g. London and County Securities, but also at least one major
clearing bank, the National Westminster Bank, faced liquidity problems. In response
to this secondary banking crisis, the Banking Act 1979 gave supervisory powers over
all deposit taking institutions, but not over the building societies, to the Bank of
England. The two-tier system of authorisation distinguished clearing banks from
licenced deposit taking. The latter were more strictly regulated than the recognised
banks (clearing banks). The institutions under supervision were required to

130
This project has received funding from the European Union’s Seventh Framework Programmefor research, technological development and demonstration under grant agreement no 266800
maintain minimum managerial and financial requirements and to provide regular
statements in regards to their conditions with the Bank. The Banking Act 1979 also
created the first deposit protection scheme.
In this regulatory system banks extended their traditional lending activities into
more complex securities to manage their balance sheet. In 1984 the Bank of
England had to rescue Johnson Mathew Bankers, an important participant in the
London bullion market. This attracted the attention of the government and aroused
concerns about the close and opaque relationship between regulated banks and the
Bank of England. In December 1985 a White Paper on Banking Supervision was
published, proposing new legislation in which a Board of Banking Supervision was to
assist the Governor of the Bank of England in supervising banks. The result was the
Banking Act 1987, which changed the framework for the Bank to conduct its
supervision of the banking sector. This Act, abolished the distinction between
clearing banks and licence deposit takers, and brought them all into a single
category of ‘authorised institutions’ which were all subject to common rules and
regulation. The Bank of England had the power to licence all deposit taking business
in the United Kingdom and directors of such businesses.
Building societies in the UK were formed mostly in the 19th century as mutual
societies with its members making periodic payment to finance both building and
purchases of houses. The main distinction between building societies and banks is
that the former have no shareholders but members who would lend to the society by
purchasing shares, through making deposits. However, they were not able to offer
overdrafts facilities to deposit accounts, hence were not permitted to offer
‘checkable’ current accounts. The societies were not subject to the same regulation
rules as banks, and thus were not supervised by the Bank for England but by the
Registrar of Friendly Societies. The Building Societies Act 1986, allowed the societies
to become more similar to and also more competitive with banks in that they
expanded their retail banking services including providing loans other than
mortgages. They were now able to offer products such as current bank accounts and

131
This project has received funding from the European Union’s Seventh Framework Programmefor research, technological development and demonstration under grant agreement no 266800
life assurance. Under this Act, building societies were given the option to convert
into public limited companies. This Act also gave power to the Building Societies
Commission to regulate the societies.
Prior to the Financial Services Act 1986, the regulatory framework of investment
business was based on the Prevention of Fraud (Investment) (PFI) Act 1958. All
individuals and firms that carried out financial services business were required to
obtain a licence issued by the Board of Trade. It became an offence to operate
outside this rule and the licence was subject to annual renewal. The Board of Trade
exempted a number of institutions from the requirements to hold a licence. Under
the PFI Act, the members of the Stock Exchange and those institutions where
securities’ dealing was not their main business activity, were not required to obtain a
licence to deal in securities. Hence the system was based on self-regulation, the
Stock Exchange was the regulator for its members, with no or little supervision.
After the PFI Act 1958 was implemented, during the 1960s and 1970s the number of
participant in the financial services market grew significantly. But as long as their
main business did not involve dealing in securities, they could operate without a
licence. This made the number of institutions subject to the PFI Act relatively small.
In addition to the perceived loopholes of this Act, the financial regulation framework
was under scrutiny again in the wake of the industry’s rapid changes and
transformation. The securities industry becoming international and the trading in
foreign countries increased as a result of the lifting of exchange control in 1979 and
changes in telecommunications technology that facilitated cross-border trading of
securities. A number of scandals, involving conflicts of interest between firms and
their clients, and trading abroad in fraudulent investment funds, made a review of
investor protection legislation inevitable.
In July 1981 Professor Jim Gower was commissioned by the Secretary of State for
Trade to review investor protection. The purpose of the review was to examine the
statutory protection required by private and business investors in securities (broadly
defined to include unit trusts and investment trusts); the need for statutory control of

132
This project has received funding from the European Union’s Seventh Framework Programmefor research, technological development and demonstration under grant agreement no 266800
security’ dealers as well as investment management advice and finally to suggest a
new legislation framework. He published a Discussion Document in which he
proposed the establishment of self-regulatory agencies subject to Government
supervision; hence giving the Government a residual role. The system of the time
lacked a single authority with adequate responsibilities for the overall financial
regulation (Robb, 1997). The self-regulatory agencies were considered to best
suited for day-to-day regulation. He also proposed, to replace the PFI Act with a
Securities Act, with the scope to widen the definition of ‘Investment’ and ‘Investment
Business’ so as to include contracts for commodity, financial futures and options and
life policies. The main concern in the report was to provide better regulation of
securities dealing and most importantly to improve the protection of investors.
However, it was only after consulting other advisory parties that the government
proposed new legislation, drafted in its White Paper published in January 1985. The
Governor of the Bank of England consulted an advisory group of senior City
practitioners under the chairmanship of Sir Martin Jacob, to give advice on a
structure and operations of a practitioner-based system. Furthermore, the
Department of Trade and Industry (DTI, the successor to the Board of Trade)
appointed the chair of the Life Office Association, Marshall Field, to advice on the
prospects for practitioner-based regulation of the marketing of life assurance and
unit trusts. The White Paper provided the overall objectives of the government in
creating a new framework as being: efficiency, competitiveness, confidence and
flexibility. The release of the Governments White Paper was followed by the
publication of the Financial Services Bill in November 1985, which concluded its
progress through parliament in 1986. Prior to this, in March 1985, the Secretary of
State for Trade and Industry set up the Marketing of Investment Board Organising
Committee (MIBOG) and the Securities and Investment Board (SIB) in June 1985.
However in mid-1986 the two were merged together into one overall body, the SIB.
The Financial Services Act 1986 came into effect from 29 April 1988. It provided a
two-tier regulatory structure for investment business operating in the UK. The SIB

133
This project has received funding from the European Union’s Seventh Framework Programmefor research, technological development and demonstration under grant agreement no 266800
retained powers to set the overall regulatory structure but did not directly regulate
most investment firms. The second tier regulators the authorized self-regulation
organisations (SROs) were given responsibility to provide prudential and conduct of
business rules for firms and individuals that were within their domain. Operating
without a licence from a relevant SRO and providing false and misleading
information, was considered a criminal offence under this Act.
The original five SROs were reduced to three during the 1990s: the Personal
Investment Authority (PIA) was a result of the merging of the Life Assurance and
Unit Trust Regulatory Organization (LAUTRO) and the Financial Intermediaries
Managers and Brokers Regulatory Association (FIMBRA) in 1995, the Investment
Management Regulatory Organization (IMRO) and the Securities and Futures
Authority (SFA).
At the same time as the Financial Services Act 1986, the UK witnessed the opening of
Stock Exchange to new competition, a reform of securities market referred to at the
time as ‘Big Bang’. Prior to Big Bang member firms of the Exchange - membership
was restricted to private partnerships and had to be UK owned - operated under a
single capacity in which they had to act either as a dealer or so-called jobbers, or as
broker that advised investors and arranged deals on their behalf for a fixed
commission (Fell 2000). These elements were supposed to protect the poorly
capitalized firms from competition with foreign firms, in particular the highly-
capitalised US brokerage companies. Pressured by the Government the Stock
Exchange agreed to reform itself voluntarily. The Stock Exchange changed
ownership rules. Admission to the Exchange was opened up to both domestic and
foreign companies. The reform also abolished the fixed commissions and replaced
the single capacity operation with the dual capacity, which allowed firms to be both
market makers in shares and brokers (Pilbeam 2010).
The Department of Trade and Industry (DTI) has had powers to regulate the
insurance industry in the UK since 1973 by the Insurance Companies Amendment
Act 1973. Legislation was strengthened by the Insurance Companies Act followed in

134
This project has received funding from the European Union’s Seventh Framework Programmefor research, technological development and demonstration under grant agreement no 266800
1974, which imposed stricter rules for insurers to obtain authorisation from the DTI.
The failure of Nation Life in the same year resulted in the Policyholders Protection
Act 1975, which established a compensation scheme. The Insurance Companies Act
of 1982, gave the DTI responsibility for the supervision of insurance companies, and
the Government Actuary’s Department provided technical support.
In 1991, Bank of Credit and Commerce International (BCCI) collapsed. The bank was
closed due to fraud and misconduct. The Bank of England was criticised as being an
inadequate regulator, due to its inability to detect early signs of fraud and
mismanagement by BCCI. This became apparent after an inquiry by Sir Thomas
Bingham, appointed by the Chancellor of the Exchequer and the Governor of the
Bank of England, into the regulation of BCCI under the Banking Act 1987. Following
this, the Bank of England set up a special investigation unit to look into suspected
cases of fraud or criminal activities. A legal section was created in the Bank of
England to advise it on its legal obligations under this Act.
In 1995, the Bank’s regulatory responsibilities were under review once again,
following the collapse of Baring bank, as a result of large losses on futures and
option trading by its Singapore subsidiary. A review of the Bank’ supervision and
surveillance effectiveness was carried out by Arthur Andersen. Even though its
report and proposals did not change the legislative framework of banking
supervision, it contributed to changes within the current framework. The main
important change was a more systematic regulatory approach by the Bank by
introducing a risk-assessment approach. But the collapses of BCCI and Barings had
already raised uncomfortable questions about the competence of the Bank of
England as a banking regulator in a complex and, by now, highly-internationalised,
banking system.
When the Labour Party came into power in 1997, it implemented radical changes in
financial sector legislation. The changes involved replacing the self-regulation
framework to a direct regulation by merging all of the self-regulatory organisations
with the SIB which, in October 1997, was renamed as the Financial Services

135
This project has received funding from the European Union’s Seventh Framework Programmefor research, technological development and demonstration under grant agreement no 266800
Authority (FSA). The Bank of England was stripped of its banking supervision role by
the Bank of England Act 1998. Almost as a sop to its dignity Bank of England was
granted operational responsibility for the conduct of monetary policy, independent of
the Treasury. The supervision of the insurance industry passed from the DTI to the
Treasury. This was the first stage in the process of the FSA becoming a single
regulator. It gained full power as a result of the Financial Services and Markets Act
of 2000, as a financial regulator over prudential, conduct for business and market
conduct regulation including banking, insurance, securities and investment
business. The Building Societies Commission, which was the regulator of the
building societies, was subsumed by the FSA.
The Financial Services and Markets Act of 2000 set four statutory objectives for the
FSA: maintaining confidence in the financial system; public awareness and
promoting public understanding of the financial system; consumer protection and
the reduction of financial crime. The Regulated Activities Act Order 2001, set out all
the activities that are carried out by the FSA.
As part of maintaining financial stability, the FSA co-operated closely and exchanged
information with the Bank of England and the Treasury. This framework established
under the 1997 Memorandum of Understanding, sets out roles for each institution
co-operating together towards a common objective of financial stability. Each of the
three parties is given responsibilities based on four principles: accountability for
each of them in that it makes them responsible for their actions; transparency so
that Parliament and the public have full knowledge of who is responsible for what;
avoidance of duplication and regular information exchange. The Bank of England
was responsible for ensuring the effectiveness of monetary policy, and supervising
the infrastructure of the financial system in the UK, in particular payment systems
and also reducing systematic risk. The Bank also had representation on the FSA
Board, through the Deputy Governor. The Bank was allowed to undertake official
operations in exceptional circumstances, in order to mitigate the spread of problems
to other parts of the financial system.

136
This project has received funding from the European Union’s Seventh Framework Programmefor research, technological development and demonstration under grant agreement no 266800
The FSA was responsible for the authorisation and prudential supervision of banks,
building societies, insurance companies and brokers, credit union and friendly
societies. Furthermore, it was the supervisor of financial markets, securities listings
and of clearing and settlements systems. The Treasury had operational
responsibility for the activities of the FSA and the Bank of England. However the FSA
and the Bank of England were required to inform the Treasury about possible
problems. The Treasury was responsible for governing the overall institutional
structure of financial regulation and the legislation that governs it. This ‘tripartite’
regulatory system gave the Bank of England, the Treasury and the Financial Services
Authority combined responsibility for regulating the UK financial system.
The new system lasted for only a few years before the Northern Rock crisis emerged
in 2007 and exposed the flaws in a divided regulatory system. In the aftermath of the
2007-08 financial crisis the Banking Act 2009 came into force, strengthening the
ability of the regulatory framework to deal with banks facing financial stress, such as
lack of liquidity and capital. This Act established a new special resolution regime
(SRR), which provided the three regulatory bodies with various options to deal more
effectively with banks’ and building societies’ failure. The failure of Northern Rock,
and other institutions, such as Bradford and Bingley, Heritable Bank and Kaupthing
Singer and Friedlander -which were UK subsidiaries of the Iceland banks- resulted
in the introduction of Banking Special Provisions Act (BSPA) 2008. This Act permitted
the UK government to bring these failing institution under State ownership. The SRR
builds on and improves the measures used under the BSPA with the core objectives
to protect the interest of retail depositors, maintaining financial stability, protecting
public funds and preserving property right as well as enhancing confidence in the
banking system.
However, after the Labour Party lost the general election in 2010, the Conservative-
Liberal Democrat coalition administration that was formed proposed, once again, to
change fundamentally the UK financial regulatory framework. Much of the blame
for the handling of the 2007-08 crises had been borne by the “tripartite” regulatory
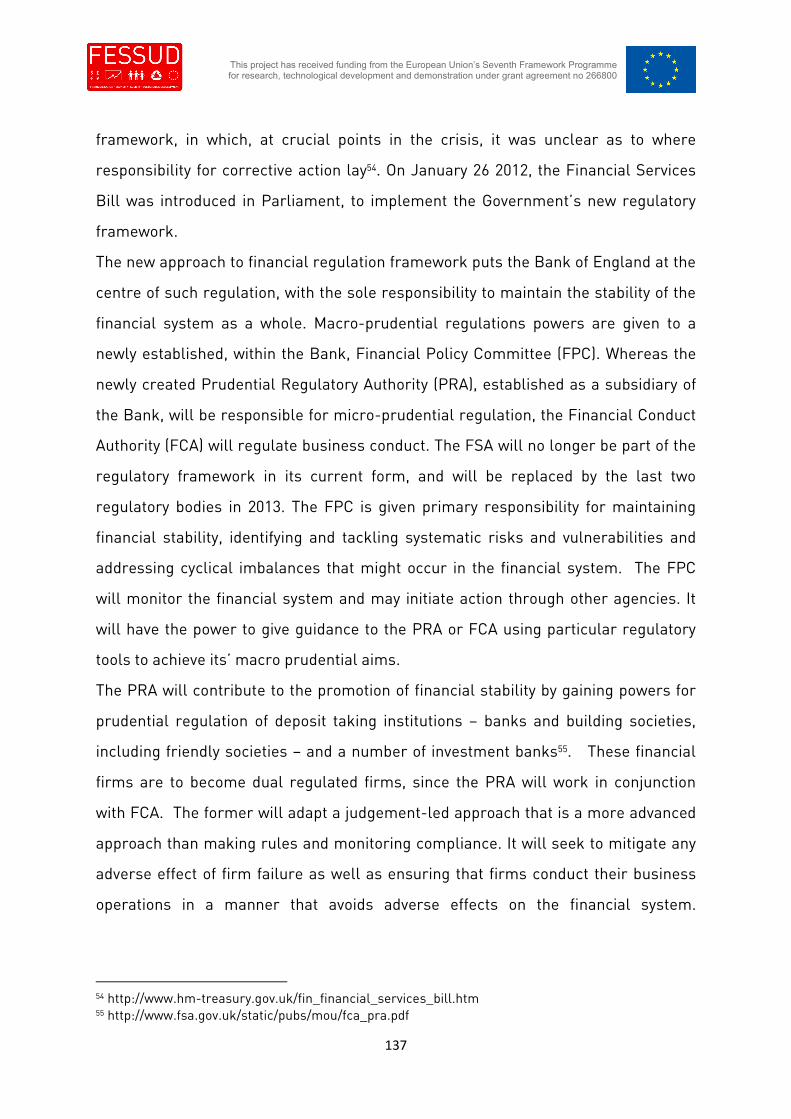
137
This project has received funding from the European Union’s Seventh Framework Programmefor research, technological development and demonstration under grant agreement no 266800
framework, in which, at crucial points in the crisis, it was unclear as to where
responsibility for corrective action lay54. On January 26 2012, the Financial Services
Bill was introduced in Parliament, to implement the Government’s new regulatory
framework.
The new approach to financial regulation framework puts the Bank of England at the
centre of such regulation, with the sole responsibility to maintain the stability of the
financial system as a whole. Macro-prudential regulations powers are given to a
newly established, within the Bank, Financial Policy Committee (FPC). Whereas the
newly created Prudential Regulatory Authority (PRA), established as a subsidiary of
the Bank, will be responsible for micro-prudential regulation, the Financial Conduct
Authority (FCA) will regulate business conduct. The FSA will no longer be part of the
regulatory framework in its current form, and will be replaced by the last two
regulatory bodies in 2013. The FPC is given primary responsibility for maintaining
financial stability, identifying and tackling systematic risks and vulnerabilities and
addressing cyclical imbalances that might occur in the financial system. The FPC
will monitor the financial system and may initiate action through other agencies. It
will have the power to give guidance to the PRA or FCA using particular regulatory
tools to achieve its’ macro prudential aims.
The PRA will contribute to the promotion of financial stability by gaining powers for
prudential regulation of deposit taking institutions – banks and building societies,
including friendly societies – and a number of investment banks55. These financial
firms are to become dual regulated firms, since the PRA will work in conjunction
with FCA. The former will adapt a judgement-led approach that is a more advanced
approach than making rules and monitoring compliance. It will seek to mitigate any
adverse effect of firm failure as well as ensuring that firms conduct their business
operations in a manner that avoids adverse effects on the financial system.
54 http://www.hm-treasury.gov.uk/fin_financial_services_bill.htm55 http://www.fsa.gov.uk/static/pubs/mou/fca_pra.pdf

138
This project has received funding from the European Union’s Seventh Framework Programmefor research, technological development and demonstration under grant agreement no 266800
Furthermore, in the case of insurance supervision, the PRA will seek to secure an
appropriate degree of protection for policyholders.
The FCA will have responsibilities to regulate the conduct of all firms, including
those regulated for prudential matters by the PRA, to ensure firms function well in
the relevant markets. It will also be responsible for licencing and supervising all
financial firms, with the operational objectives to protect consumers; ensuring
market integrity in the UK financial system and to promote effective competition
better suited for consumers.
In anticipation of the implementation of this regulatory reform, in early 2013, the
FSA, as from 2 April 2012, introduced a ‘twin peaks’ regulatory model to be adopted
by the FCA and PRA.
3.4 Key Changes in Regulation since 1980s
3.4.1 The Breakdown of Informal Regulation
In the UK various post-crisis initiatives have sought to review financial sector
regulation. As shown in the previous sections, during the 1970s the traditional
system of informal regulation broke down in the secondary banking crisis. During
the 1980s, financial instability manifested itself in a number of instances. Firstly the
international debt crisis that started in 1982, which was discussed above in relation
to UK banks, raised concerns over the viability of a number of banks. The origins of
this crisis are generally assigned to excess liquidity from oil price inflation during
the 1970s. The resultant trade surpluses of oil producing countries were recycled
through the international banking system into developing country sovereign debt
beyond their realistic debt servicing capacity, exacerbated by economic
mismanagement within many developing nations (Davis, 1992). Sharp rises in
developed country interest rates (The “Volcker Shock”) from late 1979 crystallised
the basic servicing incapacity and defaults begun, starting in 1982 in Mexico,
followed by multiple defaults in Latin America and Africa. Many banks were left
technically insolvent (Davis, 1992) and this was only resolved by multiple year
provisioning throughout the 1980s and by the Brady Plan in 1989 when debt was

139
This project has received funding from the European Union’s Seventh Framework Programmefor research, technological development and demonstration under grant agreement no 266800
restructured and forgiven in return for conversion to securities collateralised by US
treasuries. The UK responded to this crisis by implementing a new legislation, the
Banking Act 1987. Under this Act all deposit taking institutions were subject to
common rules and regulation.
Financial instability also occurred among commercial banks and the changing
nature of problems that caused banking collapses is illustrative of the changing
broader nature of financial markets. In 1984 Johnson Matthey Bank collapsed and
was rescued by the Bank of England who feared contagion effects, including in the
London centred gold bullion markets, in which Johnson Matthey was a major dealer.
The Bank rescued Johnson Matthey by providing indemnities to other banks,
although those banks generally objected to their coercion in the rescue by the Bank
of England. Commentators also argue that the rescue introduced moral hazard into
the banking system given that the fundamental underlying cause of Johnston
Matthey’s collapse was internal failures including incompetent management &
auditors and failure to comply with regulatory requirements (Bank of England
Annual Report, 1985).
3.4.2 Deregulation of Financial Markets in UK
Following several instances of fraud that had occurred since the 1970s, and in an
attempt to maintain investors’ confidence in the financial system, the Financial
Services Act 1986 was introduced. The philosophy that underlay much of the
financial reform efforts since the 1960s, was centred around the notion that
competition is the means of ensuring high standards of conduct, so that market
participants would naturally shun and avoid financial intermediaries and brokers
whose business standards fell significantly short of the best. Accordingly, under the
Financial Services Act the financial services industry was subject to some statutory
requirements but supervision responsibilities, to a large extent, were left to the
industry itself (Pilbeam 2010). At the same time as the Financial Services Act 1986,
the financial markets in the UK were deregulated. The Conservative government

140
This project has received funding from the European Union’s Seventh Framework Programmefor research, technological development and demonstration under grant agreement no 266800
introduced the so-called ‘Big Bang’ reforms to maintain the City’s role as an
international financial centre and to increase competition in the financial industry.
However, self-regulation did not stem the tide of fraud and scandal. In 1991 a further
banking failure occurred at the Bank of Credit and Commerce International (BCCI)
which was closed by the Bank of England after a long history of problems, dating
back to the early 1980s, including fraud, money laundering and auditor failure. In
addition, subsequent to the BCCI failure, wholesale funding of banks contracted in
the UK and led to a period in the early 1990s when a quarter of all smaller UK banks
would ‘in some sense fail’ (Logan, 2001, p13) with a ‘pronounced boom and bust
cycle in lending growth’. The rapid growth of property related loans in the late 1980s’
housing market bubble, was the leading indicator of failure (Logan, 2001). Finally,
failure of an individual bank occurred in 1995 with the collapse of Barings Bank. Its
failure was driven by losses of £827 million, exceeding the bank’s capital, due to
unauthorised trading in futures and options by a single ‘rogue trader’ and the
absence of adequate internal controls. The bank was subsequently rescued by the
Bank of England and sold to ING for a nominal sum.
Following the sale of Barings there was significant criticism of the Bank of England.
Many observers considered that the affair became a factor in the decision by the
subsequent Labour Government to remove supervisory responsibilities from the
Bank of England to the FSA. The Financial Services Act 2000 granted power to the
FSA in becoming a single regulator. In 1998, the Bank of England was stripped of its
banking supervision role, and was made independent of the Treasury. Under the
Financial Services Act 2000, the Bank was made responsible for ensuring the
stability of the monetary policy, and for supervising the infrastructure of the financial
system in the UK. Under this Act, the Treasury had operational responsibility for the
activities of the FSA and the Bank of England. The ‘tripartite’ regulatory system
gave three authorities, the Bank of England, the Treasury and the Financial Services
Authority, combined authority for regulating the UK financial system.

141
This project has received funding from the European Union’s Seventh Framework Programmefor research, technological development and demonstration under grant agreement no 266800
3.4.3 Post 2007-08 Financial Crisis Regulation and Independent Commission on
Banking Report
In the aftermath of the 2007-08 banking crisis, the Banking Act 2009 came into force,
strengthening the ability of the regulatory framework to deal with banks facing
financial stress, such as lack of liquidity and capital. This Act established a new
special resolution regime (SRR), which provided the three regulatory authorities with
various options to better deal with banks’ and building societies’ failure.
In publishing proposed legislation for these changes in 2011, HM Treasury
commented that the crisis was ‘caused both by failures in the financial sector, and by
failures in regulation of the financial sector. Financial institutions did not manage
their business prudently and, in particular did not understand the risks inherent in
the business they were conducting. Regulators and supervisors failed to provide the
robust scrutiny... needed... firms have become so large, interconnected and complex
that their failure posed a serious threat to the financial system and the regulatory
system lacked the tools to deal within this “too big to fail” problem.’ (HM Treasury,
2012, p.5). Proposals included restructuring of the UK regulatory responsibilities.
This included assigning responsibility for financial stability to the Bank of England
with two new authorities, the Financial Policy Committee and the Prudential
Regulatory Authority being responsible for macro and micro stability respectively
(HM Treasury, 2011) plus a regulatory authority for business conduct. The central
aim was to ensure that the failure of institutions should be at the expense of private
sector stakeholders rather than public bailouts.
At the same time as the 2009 Banking Act was going through Parliament, an
Independent Commission for Banking under Sir John Vickers, an economist and
Warden of Nuffield College Oxford. In 2010 the Commission put forward for
consultation reforms whose stated goal was a ‘stable and competitive’ financial
sector that would ‘reconcile the UKs positions as an international financial centre
with stable banking in the UK’ and create ‘greater resilience against future financial
crises and remove risk from banks to the public finances.’ (Independent Commission

142
This project has received funding from the European Union’s Seventh Framework Programmefor research, technological development and demonstration under grant agreement no 266800
on Banking, 2011, p. 7). In 2011, the Independent Commission on Banking (ICB)’s
final report was published proposing fundamental changes in the way banks are
organised. The main proposition of the report is that British retail banks should be
‘ring-fenced’, meaning that banks should separate deposit and lending functions
from investment and corporate finance activities. The report also proposed other
measures including improving banks’ loss-absorbency and increasing competition in
the banking sector, but offers no fundamental reform of investment banking.
The purpose of ring fencing is to protect retail-banking operations from complex and
risky financial activities, and to ensure the continuous provision of banking services.
This would require the establishment of a separate legal entity by UK retail banks to
carry out their activities. Within this fence banks are subject to limits on activities in
which they may engage. For example, ring-fenced banks should provide mandated
services – take deposits from individual customers and SMEs along with providing
overdrafts to them – but should not be allowed to engage in trading or other
investment activities, provide services to financial companies and services to
customers outside the European Economic Area (the European Union, plus Iceland,
Lichtenstein) and Switzerland.
In sum, the ICB’s final report, known as the ‘Vickers report’, recommends that UK
retail banking services should be inside the ring-fence whereas investment banking
should be outside. However, the report is vague on whether the provision of banking
services to large non-financial corporations should be in or outside the ring fence.
But, it suggests that between one sixth and one third of the £6 trillion of UK bank
assets should be held within the ring-fence.
The report also provides a number of recommendations aiming to make UK banks
better able to absorb losses. The ratio of equity to risk-weighted assets should be at
least 10% for ring-fenced banks. This is higher than the Basel III requirement of at
least 7% of risk-weighted assets. (In response to the latest financial crisis the
European Union and Basle Committee undertook a review of the need for regulatory
reform. The Basle Committee recommended reform of the capital requirements for

143
This project has received funding from the European Union’s Seventh Framework Programmefor research, technological development and demonstration under grant agreement no 266800
banks with increased capital and decreased leverage under Basle III, which will be
effective in full by 2019.) Furthermore, the report recommends that large banking
groups should have a total loss-absorbing capacity of at least 17%-20%. This could
include equity and other capital as well as ‘bail-in bonds’. The latter are long-term
unsecured debt to bear losses in resolution and contingent capital (‘cocos’) or bonds
that are converted to equity in the event of financial difficulties.
The Independent Commission on Banking Report, also proposes further reforms to
tackle UK retail banking’s ‘long-standing’ competition issues. Firstly, the report
suggests that a new bank should be established, from the Lloyds Banking Group
divestment, to compete with the shrinking number of existing high street clearing
banks. The European Commission took up the matter and ordered Lloyds Banking
Group to sell at least 600 branches by November 2013, as a consequence of the
bailout money it received from UK government during the crisis. The sale of Lloyd’s
branches, which is known as ‘Project Verde’, should have at least 6% of the personal
current accounts held by UK banks. This is supposed to create a more balanced and
competitive banking market.
Secondly, a new industry-wide switching service is proposed, which aims to smooth
the process of transferring bank accounts from one provider to another. Customers
wishing to switch their accounts should be able to redirect all their in and out
payments of the old account into the new one with seven working days. The new
redirecting service should operate for 13 months to ‘catch annual payments’. It is
supposed to be free to customers who also should not bear any costs in the event of
errors or wrong-doing in the switching process. The third idea proposed in an
attempt to enhance competition of UK retail banks is to promoting transparency.
Banks should report interest foregone on interest-free accounts by incorporating it
on annual statements so that consumers know the price of having a current account
rather than a savings account.
The report has received a mixed response in the way it recommends the
achievement of a more stable and competitive banking sector. British banks were

144
This project has received funding from the European Union’s Seventh Framework Programmefor research, technological development and demonstration under grant agreement no 266800
quick to respond with fears that tighter regulation could harm their international
competitiveness. The recommendation could increase lending costs to UK
businesses, thus making overseas competitors more desirable56. Indeed, UK banks
could be forced to relocate overseas to escape the reforms.
The rationale for the proposal to ring-fence retail banking is because this is the part
of that is most systemically important, in the sense that it contains public deposits
and carries out the ‘public utility’ function of making payments for customers. As
became apparent during the last crisis, and also previous banking crises, retail
banking is the part of the business that has to be maintained to prevent potentially
economy-wide illiquidity. Throughout the discussions on banking reform, fears have
been raised that if retails banks believe that government will always bail them out,
they might engage in riskier activities, for example provide mortgages to riskier
borrowers and increase the volume of over-extended personal loans, or loans to
speculative investment banking activities57. Toporowski 2010b argues that ring
fencing will not necessarily promote stability since banks would have an incentive to
structure balance sheet to minimise the cost of compliance. This in turn would make
their balance sheet more opaque. The easiest way to restructure their balance
sheets would be through overseas holding companies. This will exacerbate the long-
standing orientation British banking towards international business, to the neglect of
domestic business, except as a speculative activity. In relation to higher capital
requirements, Toporowski argues that such reform harms non-financial companies
by ‘crowding them out’ of the capital market and increasing their cost of capital.
Instead banks should be required to hold larger reserves in the form of deposits at
the central banks or government bonds. Furthermore, banks should be taxed on the
value of their balance sheet as well as the balance sheet of their subsidiaries. He
argues that this would reduce the cost of regulating larger banks and it mitigates the
56 http://www.ft.com/cms/s/0/7321c692-dd16-11e0-b4f2-00144feabdc0.html#axzz2EEf0oLMp
57 http://www.ft.com/cms/s/0/7321c692-dd16-11e0-b4f2-00144feabdc0.html#axzz2EEf0oLMp

145
This project has received funding from the European Union’s Seventh Framework Programmefor research, technological development and demonstration under grant agreement no 266800
problems associated with balance sheet restructuring. By imposing a 1% tax on the
value of all banks’ balance sheet, Toporowski estimates that the current public
sector borrowing requirements would fall by some 4.5% of GDP. In order to avoid tax
arbitrage, all financial institutions should be subject to this tax (Toporowski 2010b).
3.5 Degree and nature of competition between financial institutions
As discussed in section 2.3.1, from the late 2000s, the value of financial assets as a
proportion of GNP and in absolute terms grew hugely in the UK. However the overall
growth in finance was not matched by increasing numbers of institutions. In fact,
institutions initially proliferated after the “big bang” of 1987 but then there was a
significant period of consolidation in financial services as institutions started a long
period of mergers and acquisitions into consolidated “universal banking” groups
which then intensified under forced consolidations during the financial crisis. These
trends are discussed in detailed in section 2.5.1.2.
The impact of these changes on market concentration is illustrated in Figure 3-5
below, detailing banking concentration. As can be seen, the initial trend to 2000 was
one of declining concentration, reflecting the proliferation of institutions as a result
of the “big bang” deregulation. However, there was then a stabilization in
concentration as the mergers and acquisitions activities consolidated the numbers
of institutions and the universal banking model became the predominant
institutional structure. This was then further accelerated by the forced mergers
following the banking crisis in 2008 onwards.

146
This project has received funding from the European Union’s Seventh Framework Programmefor research, technological development and demonstration under grant agreement no 266800
Figure 3-5 Bank concentration58, 1990-2009
Source: FESSUD team databank supplied by Marco Passarello.
It should also be noted that, compared to other European countries, the UK banking
sector appears relatively unconcentrated, because of London’s position as an
international financial centre, attracting the presence of many foreign banks to its
money markets. However there are also some important differences between
competition in European markets and the UK. For example, the UK had very high
market share in European syndicated loans markets and had high levels of stock
market capitalization, consumer loans and mortgage lending relative to GNP
(European Commission, 2005). Such concentration represent the high level of
internationalization of UK financial markets and the financialization of the UK
economy through mortgage and consumer lending, as discussed in subsequent
sections.
However, these trends need to also be examined by institutional type. As noted the
UK is a global hub for investment banks and as such there are very large numbers of
active investment banks in the UK. Competition is therefore intense, reflecting
58 Share of band deposits of ten largest banks in the UK market.
0.0000
0.1000
0.2000
0.3000
0.4000
0.5000
0.6000
0.7000
0.8000
0.9000
1.00001
99
0
19
91
19
92
19
93
19
94
19
95
19
96
19
97
19
98
19
99
20
00
20
01
20
02
20
03
20
04
20
05
20
06
20
07
20
08
20
09

147
This project has received funding from the European Union’s Seventh Framework Programmefor research, technological development and demonstration under grant agreement no 266800
competition between the large global investment banks for global business in
markets and corporate and fund business. However such competition could be
considered not UK-based competition, but global competition, between such
investment banks. This international aspect of the UK markets also explains the
comparative levels of market share in European syndicated loans markets and high
levels of stock market capitalization relative to GNP. However, for the UK this
market structure also resulted in creating a “too big to fail” institutions relative to
GNP. Indeed, as the size of banks and banking concentration increased
“dramatically” it created expectations of state support that materialised during the
financial crisis (Haldane, 2012).
In relation to retail banking, and as discussed in section 2.5.2, there is a notable
concentration in the retail banking markets with an oligopoly structure to the
market. By 2010, UK retail banking had consolidated to four main banks - RBS,
Barclays, HSBC and Lloyds, now including HBOS, plus Nationwide and Santander.
(Davies et al, 2010). Further concentration took place from 2008 in response to the
financial crisis, including government forced mergers between Lloyds TSB and
HBOS (Treasury Committee, 2011) and between a number of building societies
(Bailey, 2011) which, whilst generally considered necessary for financial stability,
further increased concentration. The Office of Fair Trading in its 2010 review of
barriers to entry, expansion and exit in retail banking concluded that "the financial
crisis has had a major impact on retail banking in the UK", outlining that "one very
visible effect has been the consolidation of a number of well-known banking brands
resulting in greater concentration across the sector", (OFT, 2010, p146). In fact, by
2011, the top 5 retail banks had 80% of branch networks, 70% of deposits, 65% of
mortgages and 55% of unsecured lending (Qarry et al., 2012). Such concerns were
heightened by the scandal relating to mis-selling to consumers of Payment
Protection Insurance (PPI) which emerged in 2011 and 2012 and which required the
Big 5 banks to make £11 billion in provision for compensation (Financial Times, 2012)
and which was described by the ICB (2011), as “misdirected competition”.

148
This project has received funding from the European Union’s Seventh Framework Programmefor research, technological development and demonstration under grant agreement no 266800
Oligopoly has been a feature of retail banking since the First World War. However,
the dominant banks have changed as new competition has arisen. A number of
factors have contributed to the evolution of oligopoly in retail banking in addition to
mergers and acquisitions. The institutional structure captures economies of scale,
especially since technological innovation in the sector has been an important factor
in achieving both low cost provision and improved client services, the latter due to
the active uptake of electronic banking by UK customers including ATMs, internet
and telephone banking (Quarry et al., 2012). However it should be noted that
economies of scale appear to have a maximum threshold. Haldane, for example,
comments once an allowance is made for the implicit subsidy, there is no evidence
of economies of scale at bank sizes above $100 billion: “...implicit subsidies may
have artificially boosted the privately-optimal bank size. Subtracting this subsidy,
removing the state crutch, would suggest a dramatically lower socially-optimal
banking scale” (Haldane, 2012). In addition, there have also been important
structural issues in the market, including the low level of retail customers who
switch accounts, especially current accounts with 57% of customers having been
with their main bank or building society for 11 or more years (Quarry et al., 2012) and
the average personal account being held for 26 years (ICB, 2011).
Concerns have been expressed about the degree of concentration and competition
within the retail banking sector. The 2000 Cruickshank Report reported that
“competition problems were found in all markets investigated” (Treasury
Committee, 2010). After the financial crisis, in 2011, the Treasury sought
consultations on changes to the regulation of competition in financial services as
part of its wider reform in the “Competition and choice in retail banking”
consultations and report. The Committee concluded “There has been a clear
increase in concentration levels in parts of the retail market... particularly in the
personal current account and SME markets. The five large banks—Lloyds Banking
Group, RBS, Barclays, HSBC and Santander—have an overwhelming 85% share of
the personal current account market. In 2008 the market for SME liquidity services

149
This project has received funding from the European Union’s Seventh Framework Programmefor research, technological development and demonstration under grant agreement no 266800
was dominated by just four firms who shared 80% of the market... Whilst the level of
concentration is just one measure of competition in a market, it is important... the
bulk of our evidence argued that the banking market was not competitive” (Treasury
Committee, 2010, paragraphs 38,39,50). The report also discussed how to decrease
the “stickiness” of customers, that is the reluctance of account holders to change
their clearing bank. Such stickiness is supposed to hold back competition. The report
also expressed concerns relating to price transparency and consumer protection as
well as competition. Relating to the latter, the report comments that an important
aspect of competition is consumer protection, but reported failings in this area,
including in particular in mortgage markets and personal current account markets.
Overall regulation was seen as an important factor in controlling competition,
dealing with such competitor issues as barriers to entry, expansion and exit in retail
banking. But that control of competition was the primary responsibility of the Office
of Fair Trading and not the FSA. Similar findings were reported by the Office of Fair
Trading (OFT) and the Competition Commission (CC) in separate reports. Various
measures have been under discussion. For example, there has been discussion of
sale of portfolios acquired through forced acquisitions during the financial crisis,
ring-fencing of retail banks, changing the remit of regulators to include customer
protection and legislation to reduce barriers for customers to current account
switching and thereby drive higher switching rates. However, as at the time of
writing, none have been enacted.
Overall the UK banking markets remain competitive for investment banking but with
“too big to fail” institutions relative to the size of the economy – although the
relationship between competition and stability remains “complex” and “ambiguous”
(BoE, 2011) - and an oligopolistic structure in retail banking. However, despite
significant discussions and consultation, little concrete legislation or regulation has
been enacted to restructure the competitive landscape.

150
This project has received funding from the European Union’s Seventh Framework Programmefor research, technological development and demonstration under grant agreement no 266800
3.6 Privatization as Ideology
Privatization as a policy in the UK made its mark in the Thatcher era, which started
the systematic sale by government of state-owned enterprises. Initially the
privatization programmes were a means for the UK government to reduce its fiscal
deficit, since sale of assets is recorded as revenue, at the end of the 1970s. A
common way employed by the UK government to privatize state companies has been
through their conversion into public limited companies and the sale of shares in
those companies by flotation. Other methods were used such as concessions and
trade sale. However, the flotation of shares was the method most widely used and
perhaps the most complex one. There are many steps involved in companies’ shares
being sold by flotation and they require the services of professional advisors such as
financial, accounting and legal advisors, together with global coordinators and public
relations. The City of London has benefited greatly from privatization in terms of
increasing business as well as profitability. As the traditional arrangers of stock and
share flotations, investment banks profited from each privatization since they valued
the assets, and arranged the sale and underwriting of the new shares. Lawyers also
received lucrative work preparing all the contracts and other legal documents
needed. Management consultancies benefited from advising privatised companies on
management programmes. By the time the bulk of the privatisation programme had
been completed, in 1994, with the sale of gas, electricity, telephone and water
companies, the national airline, British Airways, and government stakes in
companies such as British Petroleum, the fees, commissions and other benefits
gained by the financial sector in the UK amounted approximately to £780m59.
Even though the sale of state–owned assets such as shares in British Petroleum,
British Aerospace and Cable & Wireless, started in the early 1980s, it was the sale of
the 51% stake in British Telecom (BT) in November 1984 that was regarded as the
59 Parker, D.,(2004) UK’s Privatization Experiment: The Passage of Time Permits a Sober Assessment,CESifo Working Paper No 1126

151
This project has received funding from the European Union’s Seventh Framework Programmefor research, technological development and demonstration under grant agreement no 266800
world’s first mass privatization60. At the time the sale was the largest Initial Public
Offering (IPO) in the history of the UK stock market. When it was first announced
that BT was to be privatized, concerns grew about the ability of the City to absorb a
sale of that size. The government relied heavily on its City advisors, and it took two
years of collaboration to place this unprecedented amount of shares in the market.
The sale of BT attracted 2.3 million small investors and on the first day of trading
capital gains amounted to 33 percent on the full price and 86 percent on a partly paid
basis61. As well as raising funds for the government, this flotation made the telecom
market more competitive that benefited the customers by providing a greater choice
and better prices, and most importantly attracted a large number of investors into
private share ownership. By 1992 the number of people in the UK holding shares
directly, as opposed though pension funds and other institutional savings, had risen
by 18% in comparison 1979 (Hodge 2006). However, most of these private
shareholders held small portfolios with only a few shares, hardly constituting either
a balanced portfolio, or amounts that could be traded with small transaction costs.
Over time, many private shareholders were happy to sell out when an opportunity
arose and return to indirect share-ownership through mutual funds or investment
trusts. This trend has increased significantly in the recent decades with the rise of
institutional investors such as pension funds, insurance companies and mutual
funds, which have made it possible for household/investors to trust professional
portfolio managers rather than invest directly in the securities markets. Financial
institutions therefore advanced in being the main holders of the total shares in the
UK, which was reflected in the decrease by 10% in the proportion of shares held by
small investors in the 1980s (see Section 3.6 for more details).
Nevertheless, the successful sale of state assets in the stock market was vital to the
launch of privatization as policy, which also attracted investors with the prospects of
obtaining capital gains. When British Aerospace was first floated in the stock
60 Hawkins, N., (2008), Privatization- Reviving the Momentum, Adam Smith Institute61 Vickers, J., and Yarrrow, G., (1991) Economic Perspectives on privatization, Journal of EconomicPerspectives, Vol 5, No 2 pg 111-132

152
This project has received funding from the European Union’s Seventh Framework Programmefor research, technological development and demonstration under grant agreement no 266800
market, the value of shares sold amounted to £150m, from which investors benefited
from a capital appreciation when shares increases by 21p by the end of the first day’s
trading. In the case of Cable & Wireless privatization in 1981, investors demand for
shares was 5.6 times more than were on offer62. Another share issue sale example
which investor benefited greatly was that of National Freight Corporation (NFC)
which was sold to its employees in 1982. When the company was listed in the stock
market in 1989, those who had bought shares in it became significantly wealthier.
The average employee who invested £600 in purchasing shares, saw his or her
shareholding increase to a spectacular amount, around £60,000.
In 1987, the government offered 801 million shares of Rolls Royce at 170 pence each.
Around two million people applied for shares, and on the first day of trading the
shares went to a premium of 62 pence or 73 percent over the partly paid share
price63. British Gas made its stock market debut in 1986. On the first day of trading,
some 800m shares changed hands, the highest volume of equity trading the London
market had recorded within an entire day. The partly paid share price of 50p rose to
67p, ending at 62.5p giving a premium of 12.5p64.
62 Hodge, A., G., (2006), Privatization and Market Development: Global Movements in Public PolicyIdeas, Edward Elgar Publishing63 Vickers, J., and Yarrow, G., (1988) Privatization: An Economic Analysis, MIT Press.64 http://www.ft.com/cms/s/0/51ccaa1c-20c2-11e1-816d-00144feabdc0.html#axzz1uc2dYA3r

153
This project has received funding from the European Union’s Seventh Framework Programmefor research, technological development and demonstration under grant agreement no 266800
Figure 3-6 FTSE share index 1984-2011
Source: Datastream
In the process of transferring public services to private ownership, in 1988 the
government announced the privatisation of Girobank, a subsidiary of the Post Office
since 1985. The Girobank purchase by Alliance & Leicester Building Society was
finalised in July 1990.
Trustee Savings Bank (TSB) was privatized in 1986. However, the sale of TSB was
might not be considered as privatization because the government did not own its’
assets (in fact no one owned it). The TSB had been providing savings facilities for the
working classes for about 200 years and were managed by unpaid trustees. They
were established on a local basis and were constituted as friendly societies,
supervised by the Trustee Savings Bank Central Board65.
TSB had 1600 branches in the UK generating a profit of GDP 77 million in 1982 and
provided banking services, including credit cards, unit trusts and insurance66. When
the government decided to sell TSB, the buyers received not only the assets of the
bank but also the money they bought those assets with. September 1986 witnessed
65 Bank and Banking Business, available from:http://www.oup.com/uk/orc/bin/9780199232093/ellinger5e_ch01.pdf66 http://www.solhaam.org/articles/tsb.html
0
1000
2000
3000
4000
5000
6000
7000
19
84
19
85
19
86
19
87
19
88
19
89
19
90
19
91
19
92
19
93
19
94
19
95
19
96
19
97
19
98
19
99
20
00
20
01
20
02
20
03
20
04
20
05
20
06
20
07
20
08
20
09
20
10
20
11
Privatisation ofBritish Telecom
"Big Bang" Deregulation ofUK securities industry
Bank of England becomesIndependent
Baringcollapses
Financial crisis2007-08

154
This project has received funding from the European Union’s Seventh Framework Programmefor research, technological development and demonstration under grant agreement no 266800
the disposal of the TSB assets by the TSB Central Board of 1.5 billion shares at a
100pence per share. Including the costs of fees to the City-London’s financial
businesses- of about GDP 50 million, the final sale price of TSB was around GDP 226
million67.
The privatisation programmes together with the deregulation of the financial
markets in the UK, was accompanied by the demutualisation of many (but not all) of
the building societies abandoning their traditional mutual status and converting
themselves into public limited companies. They were able to obtain joint stock bank
status by stock market flotation or by merging with an existing company. There
were many benefits for building societies wanting to convert to ‘plc status’ some of
which were that competition would be more effective in the mortgage market and
they could issue shares to raise capital. Most importantly it would gaie them greater
access to finding through the wholesale markets. Because building societies had no
effective share capital and did not therefore distribute dividends, except as interest
to depositors, the societies had built up substantial reserves. These reserves were
effectively transferred to the new shareholders of the demutualising building
societies, making the conversion of building societies into joint stock companies a
very attractive proposition for shareholders and managers alike.
The first demutualisation was that of Abbey National in 1989. In 1996 National and
Provincial building society merged with the new established Abbey National bank. In
2004, Abbey National bank was acquired by Banco Santander and rebranded as
Santander in 2011. In 1995 Cheltenham and Gloucester building society joined
Lloyd’s Bank. In 1997, in the space of five months, there were five building societies
that converted from mutual to a stock ownership. Alliance and Leicester, the fourth
largest building society at the time, was the first of these and floated on the 21 April
1997. But, by far the most significant was the demutualisation of the biggest building
society, the Halifax on 2 June 1997, which was listed as the eighth biggest company
67 http://www.solhaam.org/articles/tsb.html

155
This project has received funding from the European Union’s Seventh Framework Programmefor research, technological development and demonstration under grant agreement no 266800
and the thirds biggest bank in UK68. Following this on 7 July 1997, Woolwich, the
third biggest building society at the time was incorporated as a bank together with
Bristol and West on 28 July on the same year. Northern Rock was demutualised on
1 October 1997. Birmingham Midshires merged with Halifax bank in 1999, whilst
Bradford & Bingley incorporated as a bank in 2000.
Investment banks are widely believed to have earned tens of millions of pounds in
advising building societies and taking them public on the London Stock exchange69.
However, no specific amount is reported. However, according to Building Societies
Organisation the direct cost – that is legal, public relation, accounting etc. – of the
demutualisation process was around £550 million for the UK building society
sector70.
In the aftermath of the financial crisis 2007-08, none of the demutualised building
societies, Alliance and Leicester, Bradford &Bingley, HBOS and Northern Rock, now
exists as a stand-alone bank in its own right. Five of the nine FTSE 100 banks in
March 2007, Bradford &Bingley, HBOS, Lloyds TSB, Northern Rock and RBS, were
taken partly or wholly into public ownership (House of Commons Treasury
Committee 2009).
Northern Rock was the first to be taken into temporary public ownership in 2008
after it got into financial difficulties at the onset of the crisis. After the bank was
nationalised the government divided it into two separate parts; Northern Rock plc
and Northern Rock Asset Managements. In November 2011, the British
Government announced the sale of Northern Rock plc to Virgin money. The
government provided £1.4b in capital support to Northern Rock but sold it for
£747m.
68 Martin, R and Turner, D.,(2000) Demutualisation and the Remapping of Financial Landscapes,Transaction of the institute of British Geographers, New Series, Vol 25, No 269 B&B and the perils of demutualization, Financial news: http://www.efinancialnews.com/story/2008-06-09/b-and-b-and-the-perils-of-demutualisation70 Windfalls and Shortfalls? The true cost of demutualization,(2006), The All-Party ParliamentaryGroup for Building Societies and Mutual Funds
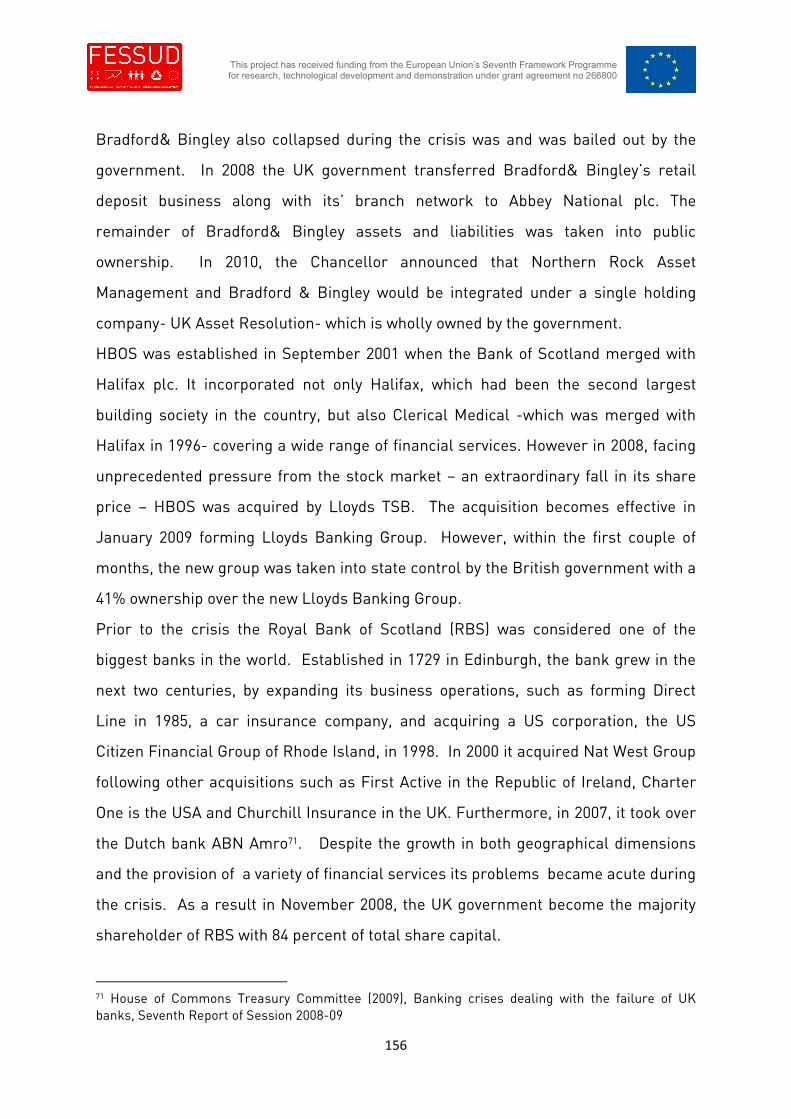
156
This project has received funding from the European Union’s Seventh Framework Programmefor research, technological development and demonstration under grant agreement no 266800
Bradford& Bingley also collapsed during the crisis was and was bailed out by the
government. In 2008 the UK government transferred Bradford& Bingley’s retail
deposit business along with its’ branch network to Abbey National plc. The
remainder of Bradford& Bingley assets and liabilities was taken into public
ownership. In 2010, the Chancellor announced that Northern Rock Asset
Management and Bradford & Bingley would be integrated under a single holding
company- UK Asset Resolution- which is wholly owned by the government.
HBOS was established in September 2001 when the Bank of Scotland merged with
Halifax plc. It incorporated not only Halifax, which had been the second largest
building society in the country, but also Clerical Medical -which was merged with
Halifax in 1996- covering a wide range of financial services. However in 2008, facing
unprecedented pressure from the stock market – an extraordinary fall in its share
price – HBOS was acquired by Lloyds TSB. The acquisition becomes effective in
January 2009 forming Lloyds Banking Group. However, within the first couple of
months, the new group was taken into state control by the British government with a
41% ownership over the new Lloyds Banking Group.
Prior to the crisis the Royal Bank of Scotland (RBS) was considered one of the
biggest banks in the world. Established in 1729 in Edinburgh, the bank grew in the
next two centuries, by expanding its business operations, such as forming Direct
Line in 1985, a car insurance company, and acquiring a US corporation, the US
Citizen Financial Group of Rhode Island, in 1998. In 2000 it acquired Nat West Group
following other acquisitions such as First Active in the Republic of Ireland, Charter
One is the USA and Churchill Insurance in the UK. Furthermore, in 2007, it took over
the Dutch bank ABN Amro71. Despite the growth in both geographical dimensions
and the provision of a variety of financial services its problems became acute during
the crisis. As a result in November 2008, the UK government become the majority
shareholder of RBS with 84 percent of total share capital.
71 House of Commons Treasury Committee (2009), Banking crises dealing with the failure of UKbanks, Seventh Report of Session 2008-09

157
This project has received funding from the European Union’s Seventh Framework Programmefor research, technological development and demonstration under grant agreement no 266800
Private public partnerships (PPP) are a major mechanism to promote collaborations
which are supposed to yield mutual benefit between the public and private sector.
PPP is an umbrella term that includes a variety of financial and organisational forms
such as joint ventures between the public and private sector, partial privatisation,
sale and leaseback arrangements as well as PFI.72
PPPs involve clearly defined projects financed by the private sector, which is
supposed to share the rewards and risks with the public sector. Typically the public
sector enters into a long-term arrangement with the private sector, in which the
latter procures the delivery of support services.
PPPs are considered to be an alternative form of privatisation but the partnership
agreements under PPPs offer more flexible financing methods and operating
facilities and/or services. The most common form of PPP in the UK is the Private
Finance Initiative (PFI), which was first introduced in 1992 by the Conservative
government. PFI is a particular method of introducing the private sector into the
production process for government services. Under the PFI the public enters into
long-term contracts with the private sector to design, build, finance and operate new
facilities. Since the launch in 1992, till 2011 631 PFI projects have been signed in the
UK with an estimated capital value of $52.8b73 in areas such as health, education,
defence, transport and water infrastructure.
Under PFI, the public sector procures by means of a contract with a private
consortium, which typically comprises a construction company, a facility manager,
lenders and investors. On signing the contract the consortium typically creates a
Special Purpose Vehicle (SPV)-usually a limited liability company- to deliver the
asset and services in accordance with the contract for the project in question. The
SPV is responsible for both construction and operation and once the project is
operational the SPV is paid an agreed monthly fee known as the Unitary Charge. The
72 Edwards, P, et.al. Evaluating the operations of PFI in roads and hospitals, Research report No 84,Certified Accountants Educational Trust73 Learning the lesson of PFI securing lifecycle finance for public services , European Policy Forum2011

158
This project has received funding from the European Union’s Seventh Framework Programmefor research, technological development and demonstration under grant agreement no 266800
SPV enters into subcontracts with firms, usually an asset provider (construction
companies) and a service provider (facilities managers). The SPV also raises the
finance required for the project, which is a combination of equity and debt. Equity,
provided from the primary investors, account for 7-10% of the capital expenditure
and debt, obtained by bank loans or bonds, account for 90-93% of the required
capital74. The interest charged by banks or bond holders reflects the risk of the
project. For example, banks will charge an interest, which is combined by the
reference rate (usually the interbank rate) and the loan margin. The former reflects
the general market risks whereas the later reflects the project specific risks. Bond
finance is a loan spilt into many identical bonds which then can be traded in the
capital market by savings institutions. At this point, the role of credit rating agencies
comes as an influential guide to investors. Their role is to analyse individual projects
and finance structure risks and then publish a rating associated to each investment
project. Bond financing has been the dominant financing method in the UK especially
for large project over £200 million in capital value.
The monoline credit insurers have been active and important players in the provision
of cheap long-term finance as an alternative to bank lending. Before the financial
crisis, the purchase of credit insurance improved the rating of the bonds, hence
making the risk acceptable to non-specialised investors such as institutional
investors (pension funds and insurance companies). Monolines are insurance
companies who issue guarantee of timely payment of principal and interest to
investor in exchange for a fee. This enables the bonds to be more marketable, as
they are effectively “wrapped” in the security of a AAA-rated company. The
monolines have been active in assisting the financing and giving the project access to
the capital market. When insurers were unsure about the long term risk associated
with such initiatives, wrapping that risk through monolines made them more
comfortable in investing PFI/PPP projects. However, the credit crisis had a severe
impact on monolines. They were perceived to have taken on risks in sectors other
74 The role of private finance in public investment, a briefing by UNISON, 2011

159
This project has received funding from the European Union’s Seventh Framework Programmefor research, technological development and demonstration under grant agreement no 266800
than PFI, and their credit rating were significantly reduced. Since 2007, out of six,
four monolines insurers with triple A grading have fallen below investment grade.
The remaining two have merged into one company with a spilt Aa3/AAA rating. The
demise of the monolines has had a great impact on the funding of PFI project in the
UK, increasing government intervention in the provision of alternative sources of
funds in those projects75.
3.7 Changing Sources of Funds
One of the most important developments in the UK financial sector has been the
growth of institutional investors such as pension funds, insurance companies and
trust and unit trust. In 1963, individual investors owned more than half of UK equities
whereas institutional investors held less than 20%. By 1999, the proportion of UK
equities owned by institutional investors increased significantly, from nearly 18% to
44% and individual ownership decreased to 15%. The decline in individual ownership
happened despite the British government privatization programmes during the
1980s. One of the main objectives of the privatization programmes undertaken by
the Thatcher government was to promote individual share ownership. Indeed, from
the time it was implemented to mid 1990s the number of individual shareholding
increased from 3 million to 12 million. However, 9 million of them held shares in
three or fewer companies (Richards 2008).
75 Encinas, J., and Farquharson, E., (2010), Public private partnerships solutions, The InternationalBank for Reconstruction and Development.

160
This project has received funding from the European Union’s Seventh Framework Programmefor research, technological development and demonstration under grant agreement no 266800
Table 3-1 Ownership of UK shares, 1963-2010(%)
1963 1975 1989 1999 2004 2008 2010
Individuals 54 37.5 20.6 15.3 14.1 10.2 11.5
Insurance
companies
10 15.9 18.6 21.6 17.2 13.4 8.6
Pension
funds
6.4 16.8 30.6 19.6 15.7 12.8 5.1
Unit Trusts 1.3 4.1 5.9 1.6 1.4 1.8 6.7
Investment
Trusts
0 0 1.6 1.2 2.5 1.9 2.1
Overseas 7 5.6 12.8 33 36.3 41.5 41.2
Other76 10 9.6 8.8 4.6 4.5 8.4 8.8
Source: ONS
The proportion of equities held by institutional investors declined in the 2000s mainly
because of the change in the composition of UK pension funds asset portfolio, from
equities to bonds.
Institutional funds under management accounted for nearly two thirds of total UK
funds under management at the end of 2010. Pension funds have grown
substantially since the 1980s. Amongst other reasons that contributed to this growth
is the favourable tax treatments compared to other savings products.
The UK pension systems constitutes of schemes run by both the state and private
sector. The former offers pension all people that reach retirement age. They are
eligible for a flat rate payment from the government funded from general taxation.
The private sector pension schemes differ for the state schemes in that the amount
that pensioner will receive is uncertain. Except for the few remaining Defined Benefit
76 Charities, non-financial institutions, public sector, banks.

161
This project has received funding from the European Union’s Seventh Framework Programmefor research, technological development and demonstration under grant agreement no 266800
schemes, the occupational private pension schemes receive contributions from both
employees and employers and invest these funds with the aim to paying out
retirement income in the future. The fund is legally separate from the company’s
finances making the contributions safe in the event of bankruptcy or liquidation.
Self-administrated pension funds were created in the beginning of the 20th century
and since 1929 the contributions and the stream of investment income received by
them are exempted from taxation (Richards 2008).
The UK pension assets multiplied by more than 150 fold between 1963 and early
2000s as seen in Figure 3-7.
Figure 3-7 Pension fund assets
The market value of pension funds has increased significantly from early 1980s
reaching a pre-crisis peak of £1 trillion in 2007. The value of assets of self-
administrated pension funds is second to that of long-term insurance funds. Since
pension funds have long-term liabilities their investment has been mainly in
equities. In 1962 UK pension funds invested equally in equity and bonds, accounting
each for 40%, and by early 1990s the proportion of asset held in equities was
significantly higher than in bonds, with more than 75% in equities and only 12% in
0
200000
400000
600000
800000
1000000
1200000
1400000£million
Source: ONS

162
This project has received funding from the European Union’s Seventh Framework Programmefor research, technological development and demonstration under grant agreement no 266800
bonds77. However recent data show that there has been a shift towards overseas
securities and mutual funds as shown in Figure 3-8. Investment in government
securities has decreased to 10% from more than 20% in 1975. Investment in short-
term assets has been relatively low for both pension funds and insurance companies
as the returns gained from them are rather lower than other assets held by them.
Insurance assets accounted for 20% of GDP in 1980, increasing enormously over the
years and in 2009 were equivalent to 100% of GDP in 2009. Insurance companies are
financial intermediaries that provide insurance against financial loss. They do this
by collecting regular premiums from people in return for an agreement to
compensate the policyholder should an insured-against event occur whilst insured.
Figure 3-8 Self-administrated pension funds asset allocation
Insurance companies are the source of almost half of the assets of UK institutional
investors. Insurance companies engage in two types of business: long term and
general. They are in a way differentiated by the form of business in which they
specialise, however some of the largest firms deal in both types of business. Long
term insurance deals mainly with life insurance whilst general insurance deals with
77 http://www.telegraph.co.uk/finance/comment/tom-stevenson/9261802/Reports-of-the-death-of-the-equity-are-greatly-exaggerated.html.
0%
10%
20%
30%
40%
50%
60%
70%
80%
90%
100%
1975 1986 1995 2000 2005 2009
Source:ONS
UK Unit trust
UK mutual funds
UK corporate bonds
Short-term asset
Overseas
UK company shares
UK government securities
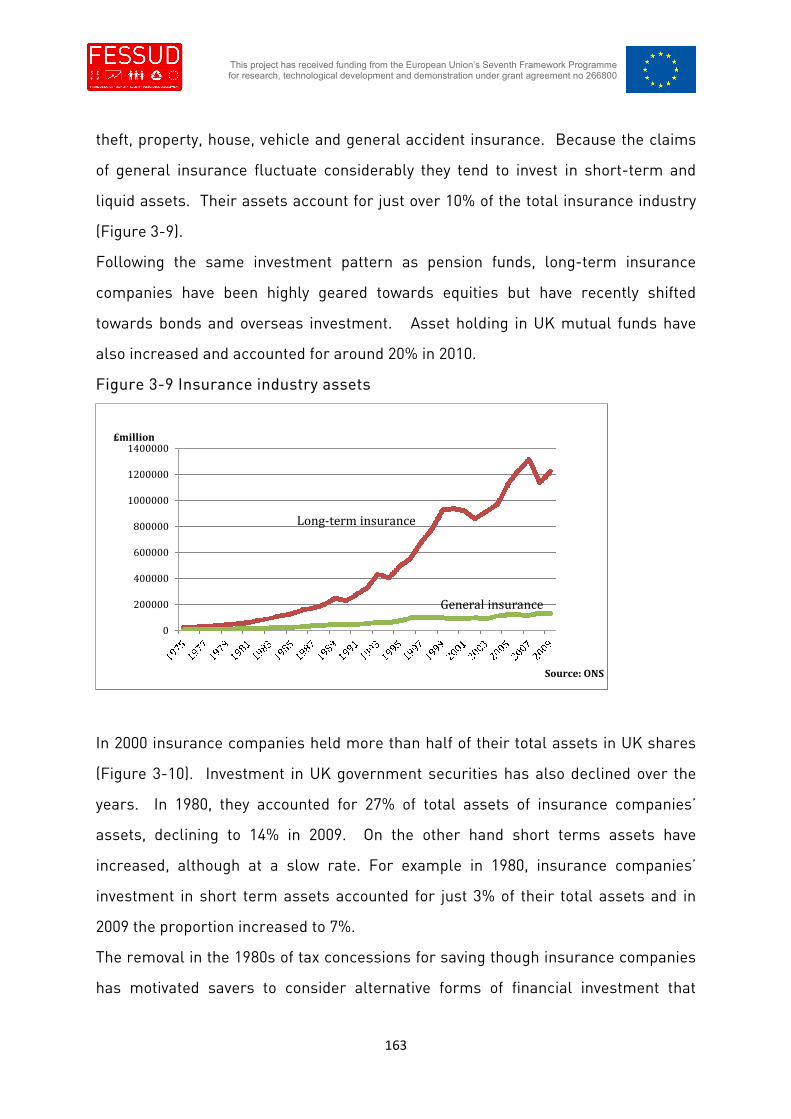
163
This project has received funding from the European Union’s Seventh Framework Programmefor research, technological development and demonstration under grant agreement no 266800
theft, property, house, vehicle and general accident insurance. Because the claims
of general insurance fluctuate considerably they tend to invest in short-term and
liquid assets. Their assets account for just over 10% of the total insurance industry
(Figure 3-9).
Following the same investment pattern as pension funds, long-term insurance
companies have been highly geared towards equities but have recently shifted
towards bonds and overseas investment. Asset holding in UK mutual funds have
also increased and accounted for around 20% in 2010.
Figure 3-9 Insurance industry assets
In 2000 insurance companies held more than half of their total assets in UK shares
(Figure 3-10). Investment in UK government securities has also declined over the
years. In 1980, they accounted for 27% of total assets of insurance companies’
assets, declining to 14% in 2009. On the other hand short terms assets have
increased, although at a slow rate. For example in 1980, insurance companies’
investment in short term assets accounted for just 3% of their total assets and in
2009 the proportion increased to 7%.
The removal in the 1980s of tax concessions for saving though insurance companies
has motivated savers to consider alternative forms of financial investment that
0
200000
400000
600000
800000
1000000
1200000
1400000£million
Source: ONS
Long-term insurance
General insurance

164
This project has received funding from the European Union’s Seventh Framework Programmefor research, technological development and demonstration under grant agreement no 266800
allowed other institutional companies such as Unit Trusts and Investment trusts to
grow. Unit trusts raise money from individuals or companies and invest them in a
variety of financial assets. Investors of the trust receive a share in the proportion of
income and capital appreciation of the underlying assets of the fund. Unit trusts
grew significantly in both the number and value of assets under management in the
1980 and 1990s. Their assets have grown from £5 billion in 1980 to £649.2 billion in
2010.
Figure 3-10 Asset allocation of insurance companies
Investment trusts on the other hand are considered to be “closed” funds as new
savers can only invest in the trust by purchasing stock from existing shareholders of
the company. Nevertheless, they are considered as financial intermediaries and
have been active participant in the financial markets, investing in a variety of
financial securities. Table 3-2 and Table 3-3 show the asset allocations of both Unit
trust and Property unit trust and Investment trusts. The two conspicuous features
are the large holdings of UK company shares, accounting for 39.6% and 33.5%
respectively in 2010, and overseas securities accounting for nearly 40% and 53.8%
respectively on the same year.
0% 20% 40% 60% 80% 100%
20002001200220032004200520062007200820092010
Source: ONS
UK corporate bonds
UK shares
Overseas corporate bonds
Overseas shares
UK mutual funds
Overseas mutual funds

165
This project has received funding from the European Union’s Seventh Framework Programmefor research, technological development and demonstration under grant agreement no 266800
Table 3-2 Investment Trusts asset allocation (% of total)
Investment Trusts 198
0
198
8
1995 199
8
200
2
200
5
200
8
2010
Short-term assets 4.6 4.8 3.9 8.6 6.5 5.4 8 3.7
UK government
securities
3 1.8 2.6 1.6 1.2 1.4 1.5 0.8
UK company shares 54.
3
47.8 44.8 50.
7
50.
6
45.
7
35.
7
33.5
Unit trust 0.6 0.9 0.7 0.3 0.1 0.2 0.1 0.1
Overseas securities 36.
1
43.6 45.5 37.
3
37.
3
42.
9
45.
7
53.5
Land and property 0.3 0.5 0.3 0.1 1.3 0.2 0.3 0.3
Other 0.4 1.9 1.6 2.4 4.2 8.7 8
Table 3-3 Unit Trusts and Property Unit Trusts asset allocation (% of total)
Unit trusts and Property
Unit trusts
198
0
198
8
1995 1998 200
2
2005 200
8
201
0
Short term assets 17.
9
5.9 4.8 4.5 4.4 4.4 8.2 7.5
UK government
securities
1 1.1 1.6 2.2 3.5 6.7 7.8 5.1
UK company shares 48.
1
57.
2
56.1 59.6 51.
3
49.4 40.
3
39.
6
Overseas securities 15.
5
32.
9
35.3 31.6 35.
7
33.1 34.
8
39.
8
Land and property 14.
2
2.1 1.6 1.6 2 2.6 2 1.5
Other 3.3 0.8 0.6 0.5 3.1 3.9 7 6.5

166
This project has received funding from the European Union’s Seventh Framework Programmefor research, technological development and demonstration under grant agreement no 266800
Sovereign Wealth Funds (SWFs) are defined as “ special investment funds created or
owned by government to hold foreign assets for long- term purposes”78. Sovereign
Wealth Funds is a relatively new term79, although the first SFW was the Kuwait
Investment Office set up in London in 1953, for the purpose of investing some of
Kuwait’s surplus oil reserves. In fact, the UK is the leading international location for
other major SWEs with London servings as a clearing house from where some of
these funds are managed. SMFs such as Brunei Investment Agency, Abu Dhabi
Investment and Temasek/General Investment Corporation of Singapore have
representative offices in London. Furthermore, between 2005 and 2011 the UK was
the second leading destination80, for SWFs money accounting for 17% of their total
global investment81. The Chinese SAFE sovereign wealth fund in 2011 was reported
to hold UK stocks worth £13.8 billion representing 0.74% of the FTSE 100 index’s
market capitalisation. According to the Economist82, SAFE has stakes in 63 of the
index companies. The two main industries that attracted SAFEs money were energy
and basic material. The size of holding varies, for example in the energy sector the
fund held 1.19% and 1.26% stakes in BP and Royal Dutch Shell, respectively.
Whereas investment in the basic material sector included 1.23% and 1.21% holdings
in Anglo American and BHP Billiton respectively. The biggest investment in value
was in the Royal Dutch Shell at £1,753,749,900. (£1.7bn) The other Chinese SWF,
China Investment Corporation, in early 2012, purchased nearly 9% stake in Thomas
Water. Other SWFs have invested in UK companies such as the Qatari Investment ity
holding include a 27% stake in Sainsbury-a leading UK supermarket-20% stake in
Chelsfield Partner LPP; 15.1% stake in London Stock Exchange and 6% holdings in
Barclays Bank. SWF have recently been an important source of capita in the UK
78 IMF, Global Financial Stability Report, 2007,http://www.imf.org/external/pubs/ft/gfsr/2007/02/pdf/annex12.pdf79 Pilbeam(2010) suggests that the term was first used in an article by Andrew Razonov(2005), Whoholds the Wealth of Nations?
80 The US was the leading recipient of funds accounting for 19% of SWFs overall investment.81 The CityUK(2012), Sovereign Wealth Funds82 The Economist, China’s investment in the FTSE 100, March 14 2011

167
This project has received funding from the European Union’s Seventh Framework Programmefor research, technological development and demonstration under grant agreement no 266800
property market, and in particular London. In 2012 the Government of Singapore
Investment Corporation SWF is reported to invest in 15 properties in the next two
years with a value of £15-£50 million83. This is not the funds’ first UK investment, as
it already owns a 15% stake of Bluewater shopping centre in Kent.
The Investment Management Association (IMA)84 reports that in 2008, SWFs assets
account for 1.6% of total asset under management in UK. Although this is a relative
small overall proportion it slowly increased to 1.8% in 2009(Figure 3-12).
Figure 3-11 Assets managed in the UK 2009-client type
Source: IMA 2009
Private clients account for 1.5% of asset under management in UK in 2009.
Furthermore, investment from high wealth individuals is of a significance
importance especially in terms of funding new and small medium companies. The so
called Business Angels are defined as high net worth individual who invest directly
83 http://www.telegraph.co.uk/finance/newsbysector/constructionandproperty/9207297/Singapore-sovereign-wealth-fund-targets-UK-property.html84 IMA is the trade body for UK-based investment management industry. It has 185 membersrepresenting over 90% of the industry in the UK.
Retail, 21.3%
Private client,1.5%
Corporate PensionFunds, 28.5%
Otherinstitutional,
17.7%
Insurance, 22.8%
SWF, 1.8%Local Authority,
1.1%
Charity, 1.1%

168
This project has received funding from the European Union’s Seventh Framework Programmefor research, technological development and demonstration under grant agreement no 266800
into unquoted businesses with which there is no family connection85. They invest in
the hope of achieving a capital gain mainly through an IPO.
Hedge funds have also increased substantially after the 1980s as an alternative form
of investment. A hedge fund is a privately owned company, usually attracting only
high wealth individuals or professional investors. The fund objective is to make
money under all market conditions, by using a variety of strategies at reduced risk.
The Hedge fund global industry asset holding in 2010 amounted to $1,920 billion,
19% of which were managed in London86. The proportion has almost doubled since
2000 when hedge funds asset managed in London accounted for less than 10%.
There were 700 hedge funds in 2010 located in London managing nearly 70% of
European hedge funds’ assets.
Asset finance is an alternative lending option to traditional bank finance. In general,
asset finance provides funds to businesses and the public sector as means to meet
their asset purchasing needs. In the UK the term “asset finance” combines invoice
finance, leasing and hire and purchases and asset-based lending. Invoice finance
will typically come in to help those firms that have outstanding invoice payments,
which could potentially threaten their business activity. The company will buy the
invoices from the business at a discount and then it proceeds to obtain the value of
the invoice from the client to which it was sent. Invoice finance industry grew
enormously by over 300% in the period between 1993 and 2002.
Leasing and hire purchases is another form of finance available to UK business. A
leasing company enters into a contract with firms, where the former purchases an
asset and gives the lessee (business owner) the right to use the asset for a specified
period of time in return for regular payments. In such agreement the lessee does not
become the legal owner when the lease terminates. A hire purchase contract on the
other hand gives the lessee the right to purchase the asset at the end of the rental
period.
85 Mason, C, and Harrison, R., (2010), Annual Report on the Business Angel Market in the UnitedKingdom: 2008/2009, BIS.86 TheCityUK(2011), Hedge Funds, Financial Market Series.

169
This project has received funding from the European Union’s Seventh Framework Programmefor research, technological development and demonstration under grant agreement no 266800
The leasing industry has been subject to changes in taxation and accounting
standards. These changes encouraged the growth of the industry from 1984 to 1989,
with the penetration ratio87 amounting to 31% in 1989. Following the recovery in the
mid-1990’s after the negative impact of the recession in early 1990s, the leasing
industry declined in 1998- 2002. This declined happened mainly as the government
imposed stricter tax allowances in 1996 (Hewitt, Bank of England 2003)
As of 2011 the Finance & Leasing Association88 members investment to UK business
and public services amounted to £20.8 billion, accounting for nearly 25% of all fixed
capital investment. However, the proportion of the amount of funds invested has
declined significantly from 2007 when the total amount invested stood at £30.6
billion.
The importance of asset finance as a source of funds for small and medium
enterprises is discussed further in the section below.
3.8 Sources of Funds and the Financial Crisis
Finance requirements and options available to businesses vary by firm size and
nature as well as the investment quality. All firms use internal finance such as
retained earnings and cash flow to finance working capital and investment purposes.
However many use external finance in the form of bank lending, equity finance or
corporate debt. Even though the UK has one of the most sophisticated global
financial centres the primary source for the majority of UK businesses is bank debt.
Since the mid 1990s, bank lending to UK businesses has grown significantly. The
most buoyant period was between 2003 up until the financial crisis of 2007-08. By
early 2009, net lending started to decline as businesses started cut back on
inventories and capital investment and repay existing debt.
87 The proportion of domestic fixed capital formation financed through leasing.88 Is the leading trade association for the UK’s asset finance industry in the UK.

170
This project has received funding from the European Union’s Seventh Framework Programmefor research, technological development and demonstration under grant agreement no 266800
Although a small number of UK companies use public bonds and equity those that do
account for a relatively large share of domestic investment and employment. Bank of
England reports that public equity issuers investment in 2007 was around £30 billion,
accounting for approximately 47% of total UK domestic financial investment. As a
result of the financial crisis, companies have dramatically reduced their spending,
which resulted in their reduction of investment by 20% between 2007 and 2009 (Bank
of England 2011). This is also evident in the amount of cash balances on PNFC
balance sheet, which amounted at £731.4 billion in the third quarter of 2011, the
highest level on record (BIS 2012).
The stock of bank lending to small medium enterprises89 (SMEs) in 1992 was £39.5bn
and reached a peak in November 2009 at £55.6bn but has fallen in the subsequent
years. In 2010, the level of outstanding bank debt stood at £52bn, a decrease of 5%
from 2009 but an increase of 11% compared to 200690. The decline of lending for
small SMEs, with a turnover less than £1 million, accelerated after 2009. Corporate
lending peaked in 2008 but declined more sharply than lending for SMEs91 in 2009
(Figure 3-12). Lending growth has been negative since late 2009 for all businesses,
but SMSs negative growth has been below that for Private Non Financial
Corporations (PNFC) as a whole since March 2011.
Prior to the financial crises, access to bank debt was easy and at extremely low
price, so bank lending was advantageous for the corporate sector as their main
source of finance. However, in the adverse economic condition following the crisis,
stock lending to UK businesses has contracted even further into 2012 declining by
£4bn in February.
89 There is no set definition of an SME. The most wide definition used by the literature is that of theEuropean Commission which defines SMEs on a combination of turnover, number of employees andtotal size firms’ balance sheet. This report uses a range of sources of data and consequently usesmore than one definition.90 The stock of bank lending in 2006 for SMEs was £46bn; http://www.bba.org.uk/download/1253.91 SMEs with a turnover smaller than £25 million.

171
This project has received funding from the European Union’s Seventh Framework Programmefor research, technological development and demonstration under grant agreement no 266800
Figure 3-12: Percentage change in stock lending to SMEs and PNFC
Source: BIS 201292
Gross lending to private non-financial corporate (PNFC) as of December 1997 was
£214bn93, increasing steadily throughout the years up until 2009. It reached a peaked
at £657bn in December 2008 but since then the stock of lending to UK PNFC
businesses has declined by £163bn, reaching £494bn in March 2012 as evident in
Figure 3-13.
Figure 3-13 UK Business Investment and PNFC Lending
Source: BIS 2012 94
92 BIS(2012), SME Access to External Finance.93 Data obtained from Bank of England Statistical Database. Amount outstanding of UK residentmonetary financial institutions in all currencies, non-seasonally adjusted.94 BIS (2012), Boosting Finance Options for Business.

172
This project has received funding from the European Union’s Seventh Framework Programmefor research, technological development and demonstration under grant agreement no 266800
Bank debt is considered to be a flexible source of finance and can be arranged much
more quickly than equity or bonds. As a result bank loans accounted for over 65% of
UK corporate debt with a total of £722 billion loans outstanding in 2010. (Bank of
England 2011).
The Engineers Employers Federation (EEF), reports that business investment and
lending to UK firms are closely correlated (Small Business Taskforce 2012). This
correlation is evident in Figure 3-13. The weak economic conditions as a
consequence of the recent financial crises are associated with low levels of
investment. However, the report suggests that the reason is not the demand for
investment is low but because of a shortage in the supply of finance to UK firms.
An alternative source to bank financing is equity financing or corporate debt.
However, SMEs historically have faced long-standing challenges in accessing both
bank and equity finance. In general larger firms can obtain funds more easily than
smaller firms.
As of 2010 there were nearly 10,000 mid-sized companies95 and 760 large
companies96, in the UK. The majority of mid-sized companies rely on bank debt for
external finance. In 2009, approximately 10% used equity markets to raise capital
and the largest 5% had access to debt capital markets as well97. This is because of
the strict criteria firms have to meet for a London Stock Exchange (LSE) listing, and
the costs associated with it are too high for the majority of businesses as well as
SMEs. For example, the minimum issuance of corporate bond is around £100
million to £200 million, which excludes the majority of firms from the wholesale
corporate bond market. Large companies have direct access to debt capital market
through securities such as commercial paper and corporate bonds and the majority
of them are listed on London Stock Exchange (LSE). As of 2010, there were nearly
1300 of the almost 1.2 million UK private sector enterprises raise public external
finance, either issuing equity or bonds. Only 1000 of PNFC issued only equity and
95 Defined here as companies with a turnover greater than £25 million to £500 million.96 With a turnover of over £500 million.97 HMT and BIS(2010), Financing a private sector recovery.

173
This project has received funding from the European Union’s Seventh Framework Programmefor research, technological development and demonstration under grant agreement no 266800
116 of them issued bonds. Some 141 of firms used a financing mix of bonds and
equity issuing. Bank of England claims that public corporate bonds and equity each
accounted for around 25% of total external finance of UK’s PNFC in 2010, with an
estimated £338 billion and £346 billion outstanding, respectively. Activities in the
domestic corporate bond market by UK firms are also reported to be considerably
low in comparison with other major economies. A recent research by BIS, estimates
that only 61% of FTSE 100 companies issue public bonds (BIS 2012)
The private placements market, where companies arrange bespoke lending
agreements directly with institutional investors such as investment funds and
insurance and pension companies, has grown significantly in the last few years as
firms face bank lending difficulties. The US is the leading global market for private
placement finance and as of 2012 the market reached a record high of $50.4 billion98.
UK issuers account for 20% of the global private placement market. However, the
majority of these issues are placed with US based investors and the smallest
issuance by a UK firm is estimated to be around £20 million (BIS 2012)
The size of a company is reported to be a key factor in explaining the relative small
number of companies using the capital market to raise finance. Indeed, the Bank of
England’s recording suggests that 90% of bonds issuers are larger than £60 million
and 90% of issuers have more than 2,500 employees. This indicates that only larger
companies make use of the public corporate bond market. However, further
research conducted by the Bank found that 5% of first-time bond issuers were
medium-sized companies with less than 500 employees.
Loans accounted for the majority of funds raised by UK PNFCs up until 2008 and has
increased substantially since 2003. After this many large companies have switched
their borrowing to the bond market as evident in Figure 3-14. UK non-financial
corporate firms issued on average £42 billion of bonds in 2008 and 2009, compared
with £17 billion per annum between 2002 and 2007. At the same time, during 2009-
98 http://www.ft.com/cms/s/0/53bdfe08-28ea-11e2-9591-00144feabdc0.html#axzz2Eg3JXrHn
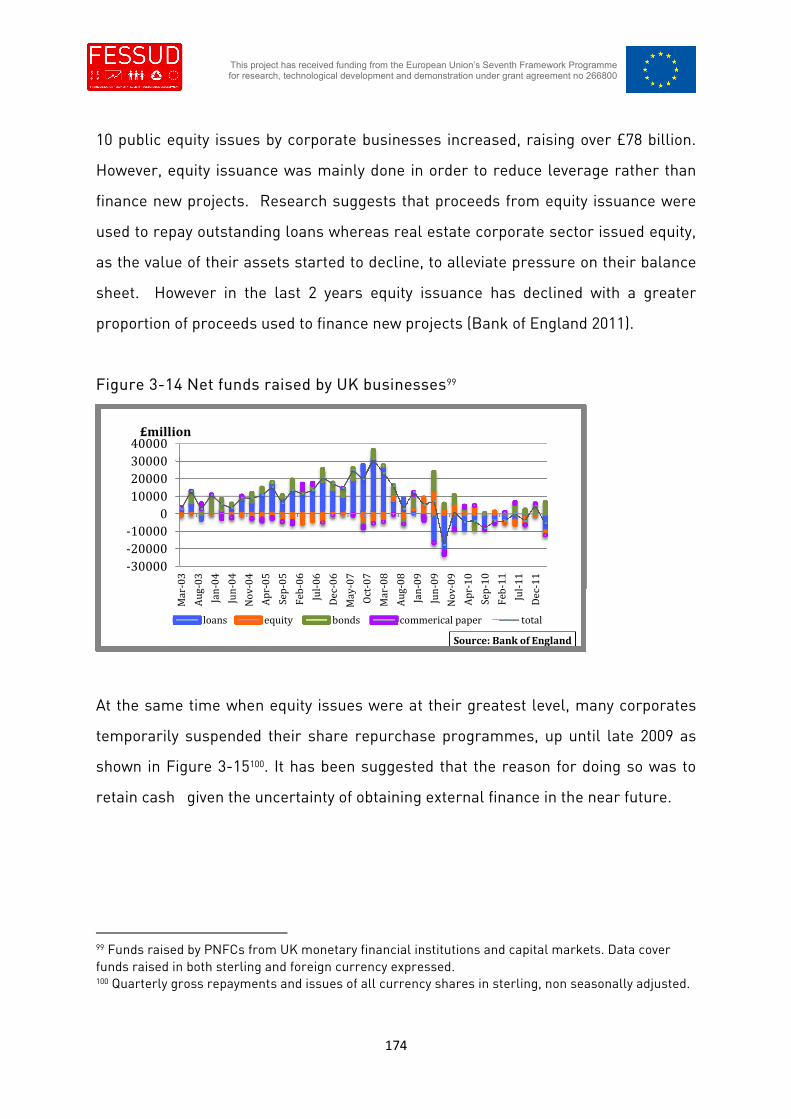
174
This project has received funding from the European Union’s Seventh Framework Programmefor research, technological development and demonstration under grant agreement no 266800
10 public equity issues by corporate businesses increased, raising over £78 billion.
However, equity issuance was mainly done in order to reduce leverage rather than
finance new projects. Research suggests that proceeds from equity issuance were
used to repay outstanding loans whereas real estate corporate sector issued equity,
as the value of their assets started to decline, to alleviate pressure on their balance
sheet. However in the last 2 years equity issuance has declined with a greater
proportion of proceeds used to finance new projects (Bank of England 2011).
Figure 3-14 Net funds raised by UK businesses99
At the same time when equity issues were at their greatest level, many corporates
temporarily suspended their share repurchase programmes, up until late 2009 as
shown in Figure 3-15100. It has been suggested that the reason for doing so was to
retain cash given the uncertainty of obtaining external finance in the near future.
99 Funds raised by PNFCs from UK monetary financial institutions and capital markets. Data coverfunds raised in both sterling and foreign currency expressed.100 Quarterly gross repayments and issues of all currency shares in sterling, non seasonally adjusted.
-30000
-20000
-10000
0
10000
20000
30000
40000
Mar
-03
Au
g-0
3
Jan
-04
Jun
-04
No
v-0
4
Ap
r-0
5
Sep
-05
Feb
-06
Jul-
06
Dec
-06
May
-07
Oct
-07
Mar
-08
Au
g-0
8
Jan
-09
Jun
-09
No
v-0
9
Ap
r-1
0
Sep
-10
Feb
-11
Jul-
11
Dec
-11
£million
Source: Bank of England
loans equity bonds commerical paper total

175
This project has received funding from the European Union’s Seventh Framework Programmefor research, technological development and demonstration under grant agreement no 266800
Figure 3-15 Equity issuance and repurchases by UK PNFC
Another important source of finance for UK large companies is the syndicated loan
market. The loan made by a syndicate of banks is larger than an individual bank
could provide. The interest rate of such loans is based on a spread over LIBOR.
Syndicated loans are medium term credits as the borrower agrees to repay them
within a fixed period, usually between three to eight years.
Syndicated lending, where a group of banks join together to lend to a borrower, is
one of the main activities in the City of London going back to the rise of the
Eurodollar business in the 1970s. As of 2007, the global syndicated loan market
amounted to more than $4.5 trillion, with US being the leading country in loan
activity. The UK was second largest market, with a total loan volume of $376.3
billion (DTCC 2008).
The Bank of England reports that up until the financial crisis, the volume of
syndicate loan issues was significantly high, providing finance mainly, amongst other
factors, to mergers and acquisition and leverage buyouts activity (Bank of England,
Trends in Lending 2009). As Figure 3-16 shows, the syndicate flows to UK
companies declined sharply in the period of the recent financial crises101.
101 Bank of England estimated trends in syndicated lending by data collected from commercial dataprovider such as Dealogic.
-10000
-5000
0
5000
10000
15000
2003 2004 2005 2006 2007 2008 2009 2010 2011 2012
£ million
Source: Bank of England
Issued
Repurchased

176
This project has received funding from the European Union’s Seventh Framework Programmefor research, technological development and demonstration under grant agreement no 266800
Figure 3-16 Net lending to corporate and bond issuance
With uncertain market condition, UK resident foreign lending to UK business has
also declined sharply, starting in early 2008, but has slightly recovered as shown in
Figure 3-17. Foreign lenders tend to focus on lending to larger firms, by means of
syndicated loans. However, the amount of syndicated lending remains still relatively
low. The Bank of England, report that given a number of European lenders switched
their lending activates from UK syndicated loans into their domestic market, the
volume of syndicated loans is expected to remain low.
-80
-60
-40
-20
0
20
40
60
80
100£billions
Sources: Bank of England, monthly BIS survey, Dealogic and Bankcalculations.
PNFCs
All SMEs
Corporate bond issuance
Syndicated loans

177
This project has received funding from the European Union’s Seventh Framework Programmefor research, technological development and demonstration under grant agreement no 266800
Figure 3-17 Contribution to growth in lending to UK businesses102
3.8.1 Sources of Funds for SMEs
The importance of UK SMEs to the economy has grown significantly since the mid
1970s (Small Business Taskforce 2012). They contribute greatly to the economy
especially in terms of enterprise, innovation and growth. There are an estimated 4.8
million enterprise in the UK, forming 99.9% of all businesses and accounting for over
half of private sector employment and turnover. Nearly all of these business (97.0%)
were micro or small with 0-48 employees; only 2.2% were medium sized have
between 50-249 employees and just 0.5% were considered large with more than 250
employees (BIS 2011).
SMEs accounted for nearly 99% of the total 2,152,400 registered businesses in
2008. The greatest contribution, particularly in terms of job creation, comes from
high growth SMEs even though their represent a small proportion of all SMEs. In
2005 there were 11,369 high- growth firms in the UK, representing 6.3 per cent of all
102 Lending by UK monetary financial institutions to PNFC. Twelve-month rate of growth in the stock oflending. Data cover lending in both sterling and foreign currency, expressed in sterling term. Datafor major lenders are seasonally adjusted, are seasonally adjusted and data for foreign and otherlenders are not seasonally adjusted.
-15.0
-10.0
-5.0
0.0
5.0
10.0
15.0
20.0
25.0
Jan
07
Ap
r0
7
Jul0
7
Oct
07
Jan
08
Ap
r0
8
Jul0
8
Oct
08
Jan
09
Ap
r0
9
Jul0
9
Oct
09
Jan
10
Ap
r1
0
Jul1
0
Oct
10
Jan
11
Ap
r1
1
Jul1
1
Oct
11
Jan
12
Twelve-month growth
Source: Bank of England
Other lenders
Foreign lenders

178
This project has received funding from the European Union’s Seventh Framework Programmefor research, technological development and demonstration under grant agreement no 266800
firms employing ten employees or more (NESTA 2009). They created more than
double the number of jobs compare to slower-growing firms between 2002 and 2005.
The other element by which SMEs contribute to economic growth is by creating a
process known as “productive churn” and by encouraging competition. External
finance is vital in funding new businesses with fresh and creative ideas to become
more efficient in the productive process, which replaces older less efficient
businesses103. An estimated 47% of SMEs were reported to have introduced new or
improved products or services in 2010, with the proportion remaining nearly the
same in the previous years. However, the most innovative businesses were those
that sought finance, around 52% (BIS 2011).
Around half of SMEs are self-financed, either through personal savings or retained
profits (BIS 2012). Those that seek external finance, bank funding is the primary
source in the form of loans, credit cards or overdrafts. In 2010, BIS104 reported that
26% of SMEs had sought finance in the 12 preceding months105 an increase by 3%
form 2007-08. Figure 3-18 shows the different sources of finance sought in 2010 and
2006. Even though banking finance remained the primary source in those periods,
loans provided by banks declined from 46% in 2006 to 40% in 2010.
103 The entry and exit of firms in the market is based on the Schumpeterian “creative destruction”.104 The Department for Business, Innovation and Skills(BIS), define SMEs as having less than 250employees.105 The survey was conducted between July 2nd and 7th September 2010.

179
This project has received funding from the European Union’s Seventh Framework Programmefor research, technological development and demonstration under grant agreement no 266800
Figure 3-18 SMEs type of finance sought
Source: BIS 2010
Only a minority of SMEs, 1% in 2010, use equity finance, one reason for which may be
that firms are reluctant to cede ownership. Those that seek equity finance can obtain
it through venture capital funds, business angels and or through Initial Public
Offering on a public market like AIM and PLUS. Between 1980 and 1995, the Unlisted
Securities Marked (USM) was an alternative route (apart from the main market, LSE)
through which UK companies raised public equity. The market, characterised by
lower requirement and floating costs, was substituted by the Alternative Investment
Market (AIM) in 1995. This was because the EU directives lowered the criteria for
access to LSE, track record for full listing was reduced from 5 years to 3 years,
making it the same as USM. Since its’ launch in 1980 the market nurtured nearly
900 companies, raising around £6bn106. Because the LSE is unable to provide finance
to smaller companies, and the need for a subsidiary market with simplified
requirement criteria and lower entry costs, encouraged the launch of AIM in 1995.
106 http://www.independent.co.uk/news/business/usm-replacement-is-revealed-companies-with-sixmonth-track-record-will-be-eligible-to-join-new-exchange-1372807.html.
40%
35%
9% 9%
2% 3% 2% 1%
10%
2%
46%
22%
6%
11%
2% 1% 1% 2%
12%
4%
0%5%
10%15%20%25%30%35%40%45%50%
2010 2006
180
This project has received funding from the European Union’s Seventh Framework Programmefor research, technological development and demonstration under grant agreement no 266800
Since then the market has attracted over 3,000 companies raising more than £78
billion of which £35 billion was at admission107. As at May 2012, there were 1,114
companies, of which 890 were UK companies, quoted on AIM. At the same period,
£165 million new funds have been raised and £1.4 billion have been raised through
further fundraising.
The PLUS market, formerly known as OFEX, gained credibility in the market when it
was granted recognised investment exchange status in July 2007. The market is
tailored for smaller companies, typically capitalized at less than £50 million. In 2010,
194 companies were listed on PLUS stock exchange with a market value of £2.5
million (URS 2010). In the period between 2006 and 09 companies raised £88.6
million on the PLUS market. In 2010 alone, PLUS issues raised a total £25.3
million108. The cost of joining via an IPO and maintaining a quotation is lower than on
AIM, making PLUS a significant source of equity finance for SMEs in the UK.
Venture capital is a subset of private equity, which provides finance by investing in
early stage businesses in return for an equity stake. The term private equity covers
the whole industry both Management Buy Out (MBO) and venture capital. The latter
invests mainly in start-up to expansion stages in highly potential businesses and the
former provides expansion capital for larger businesses. The provision of funds by
venture capital investors not only allows the business to grow and expand but may
also improve the level of innovation within the business. Despite the fact that the UK
has one of largest private equity industry, second after the US, it does not fully serve
the needs of SMEs. For example in 2005, there were £27bn raised from investors,
but only 6% of these funds were invested in start-up and early -stage companies
(NESTA 2007). In 1998, venture capital funds invested nearly £5bn in 1,300
companies, with only £288m received by start-up and early stage businesses.
MBO/MBI were the major recipient of venture capital funds. However, investment
into start-up and early stage companies in 1998 was 2.2 times greater than a decade
107AIM Statistics May 2010, London Stock Exchange.108 City of London(2011) Creating jobs, powering growth, Financial Services in the UK.

181
This project has received funding from the European Union’s Seventh Framework Programmefor research, technological development and demonstration under grant agreement no 266800
earlier and 81% higher than in 1997. (Bank of England 2000). In 2010 BVCA
members109 invested £313m into 397 UK venture capital stage companies. Whereas,
investment of expansion capital amounted to £1.65 million, plunging by nearly half a
million from 2008.
Venture capital accounted for nearly 3% of small business finance in the period of
1987-90(Figure 3-19).
Figure 3-19 Sources of external finance for SMEs, 1987-90
Source: Bank of England (1999), The financing of small firms in the United
Kingdom
Business angels are an important source of finance for SMEs particularly in the
start-up stage. These wealthy individuals invest in the range between £50,000 and
£500,000 in new firms and also bring with them their business expertise. Business
Angels investment activities in funding UK businesses has grown over the last
decade. In late 1990s there were between 20,000 and 40,000 business angels
investing between £0.5 billion and £1 billion per annum in between 3,000 and 6,000
109 British Private Equity & Venture Capital Association (BVCA) is the industry body for the venturecapital and private equity firms operating investment funds based in the UK. The activity surveycovered 97% of BVCA members, representing nearly all major UK based private equity firms.
Venture Capital2.9%
Partenrs/workingshareholders
7.6%
Factoring/suppliers/customers
5.7%Other sources7.2%
Banks60.6%
Hp/leasing16%

182
This project has received funding from the European Union’s Seventh Framework Programmefor research, technological development and demonstration under grant agreement no 266800
businesses110. In 2009/10 the amount of investment was in a range from £318 million
up to £1bn111.
The ability of businesses to raise external finance could be a major barrier for
innovation as well as potential growth. In general SMEs have difficulties is raising
both bank and equity finance. The literature provides evidence that there is an
“equity gap”112 in the shortage of equity finance to SMEs. This may be due to
asymmetric information between investors and the businesses. Assessing the risk
and profitability of investment proposals by SMEs is difficult and costly to investors.
The cost of due diligence for investors is generally fixed- between £20,000 to
£50,000- regardless of the size of investment. Thus, these transaction costs are high
as a proportion of the investment deal size for a smaller investment, making only
larger investments viable for equity finance. The boundaries of equity gap have
increased over time. The Department for Trade in 1990 estimated the equity gap as
affecting investments up to £500,000 (BIS 2012). In 2003, this gap affected
businesses seeking investments of between £250,000 and £1 million but extended up
to £2million for innovative businesses at an early stage of growth. Recent research
suggests that the structural equity gap still exists for the majority of SMEs seeking
funds in the amount between £250,000 and £5million (Small Business Task Force
2012). Whereas for sectors which require complex research and development or
large capital expenditure the gap may extend up to £15 million. There is also a
financing gap affecting most high growth SMEs. The most recent study, The Rowland
Review (2009), identified a gap in the supply of finance in the region of £2 million and
£10 million, and this is likely to have risen since the economy entered the recession
that followed the financial crisis of 2008-2009.
There is also evidence on the existence of market imperfection in bank financing in
the UK (Ibid.). It is argued that asymmetric information between banks and SMEs,
which may lead to credit rationing, impacts on the supply of loans by the banking
110 URS(2010), The City’s Role in Providing for the Public Equity Financing Needs of UK SMEs.111 City of London(2011), Creating jobs, powering growth.112 The term relates to the inability of businesses to access the finance they need.

183
This project has received funding from the European Union’s Seventh Framework Programmefor research, technological development and demonstration under grant agreement no 266800
sector. When banks cannot distinguish “bad” borrowers from “good” ones, the price
mechanism is unable to allocate funds efficiently. Therefore instead, lending is
rationed rather than increasing the interest rate.
On an international level, the UK has the highest SME loan rejection rates in Europe
with recent data showing 33% of applications being rejected (BIS 2012). Institute of
Directors research show that a quarter of the 1000 companies included in the
survey, sought bank finance, out of which 57% were rejected in 2010. A research
conducted from the Warwick Business School in 2004, reports that rejection rates
were lower at 11% out of the 44% of SMEs that sought finance in the previous 3
years. A follow up survey113 from them in 2008, found that the overall rejection rates
increased, with bank loans affected more than overdrafts. The rejection rates for
overdraft applications increased to 10.9% in the period of 2005-08, from 4.2% in
2001-04. Among those that applied in 2008 the rejection rate was as high as 15.3%.
Whereas, term loan rejection rate in 2005-08 was 9.4% and 16.3% for those applying
in 2008 alone (Frazer 2009)
Since 2008 the availability of finance for SMEs has worsened. In 2010, BIS reports
that 35% of the SMEs that sought finance were unable to obtain any from the first
source they approached (BIS 2011). The overall proportion of SMEs that faced
difficulties114 in obtaining finance more than doubled from 2007-08. Furthermore,
24% of the sources approached by SMEs in 2010 gave no reason for rejecting their
applications. Again this is twice as much as in 2008. As a result, this was a major
issue in terms of the success of SMEs business. The figures associates with
difficulties in rising finance in 2010 are significantly higher compare to 2006 and
2008.
Traditional bank lending has fallen slowly but significantly throughout the years, as
SMEs have diversified their sources of finance. In the period 1995-97 out of 39% of
113 Surveys are based on 2,500 representative sample of 2,500 UK businesses with less than 250employees.114 Includes those SMEs that obtained some finance but not the all the amount required and those thatgot the amount needed but with great difficulties, bringing the total of SMEs in difficulties in obtainingfinance to 51%.

184
This project has received funding from the European Union’s Seventh Framework Programmefor research, technological development and demonstration under grant agreement no 266800
SMEs that sought finance, bank debt declined from over 60% in 1987-90115(Figure
3-19) to nearly 48%, Figure 3-20. This is partly reflected on the shift towards
factoring and asset-based finance, such as hiring and leasing, accounting for 27.1%
of SMEs finance in 1995-97. (The leasing industry increased rapidly in the 1970’s due
to its tax advantages)
Venture capital accounted for only 3% of all SMEs external finance in 1995-97, and
was used as an additional source for finance by only 5.2% of respondents.
Furthermore by 1998, the number of SMEs on the same year is reported to have
been 3.7million, business reduced their debt significantly with research showing that
the ratio of bank deposits to lending amounted to 86% 1998, compared with 56% in
1992 (Lund et al 1999, Bank of England).
Figure 3-20: Sources of external finance for SMESs 1995-97
Source: Bank of England (1999), Finance for small firms, A Sixth Report
Another potential source of internal finance is loans provided family and friends,
which increased from 9.8% in 2001-05 to 14.4% in 2005-08 (Figure 3-21).
115 In 1987-90, 65% of SMEs were reliant on external finance.
Venture Capital,3%
Banks, 47.4%
Others,7%Factoring, 6.1%
HP/Leasing,27.1%
Trade customers,1.4%
Partners, 6.1%
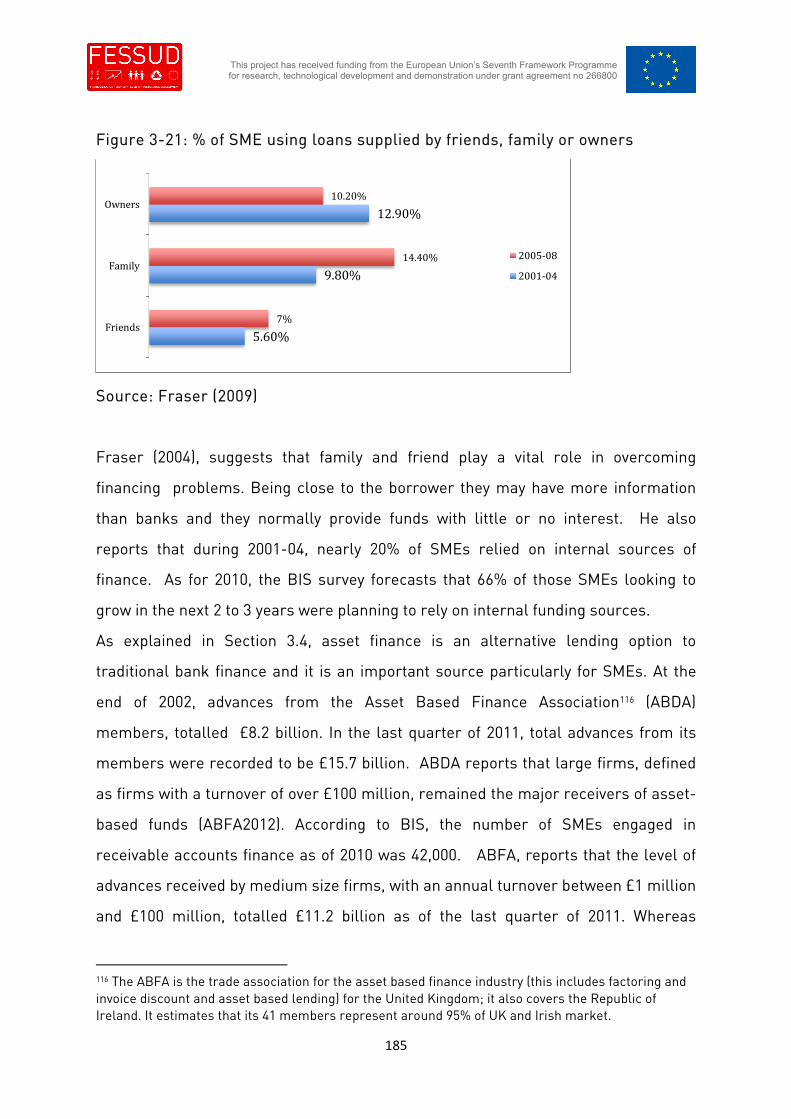
185
This project has received funding from the European Union’s Seventh Framework Programmefor research, technological development and demonstration under grant agreement no 266800
Figure 3-21: % of SME using loans supplied by friends, family or owners
Source: Fraser (2009)
Fraser (2004), suggests that family and friend play a vital role in overcoming
financing problems. Being close to the borrower they may have more information
than banks and they normally provide funds with little or no interest. He also
reports that during 2001-04, nearly 20% of SMEs relied on internal sources of
finance. As for 2010, the BIS survey forecasts that 66% of those SMEs looking to
grow in the next 2 to 3 years were planning to rely on internal funding sources.
As explained in Section 3.4, asset finance is an alternative lending option to
traditional bank finance and it is an important source particularly for SMEs. At the
end of 2002, advances from the Asset Based Finance Association116 (ABDA)
members, totalled £8.2 billion. In the last quarter of 2011, total advances from its
members were recorded to be £15.7 billion. ABDA reports that large firms, defined
as firms with a turnover of over £100 million, remained the major receivers of asset-
based funds (ABFA2012). According to BIS, the number of SMEs engaged in
receivable accounts finance as of 2010 was 42,000. ABFA, reports that the level of
advances received by medium size firms, with an annual turnover between £1 million
and £100 million, totalled £11.2 billion as of the last quarter of 2011. Whereas
116 The ABFA is the trade association for the asset based finance industry (this includes factoring andinvoice discount and asset based lending) for the United Kingdom; it also covers the Republic ofIreland. It estimates that its 41 members represent around 95% of UK and Irish market.
5.60%
9.80%
12.90%
7%
14.40%
10.20%
Friends
Family
Owners
2005-08
2001-04

186
This project has received funding from the European Union’s Seventh Framework Programmefor research, technological development and demonstration under grant agreement no 266800
smaller firms, with an annual turnover less than £1 million received £1.33 of asset
based funds (ABFA 2012).
Even though mezzanine finance, which is a form of debt that is similar to equity
finance but is ranked below senior debt, in another method by which UK SMEs can
raise finance, only 1% of SMEs used this type of finance in 2010. The main barrier in
using mezzanine finance is the lack of knowledge of how such finance really works.
3.9 Currency Markets & Financialization
After 40 years of foreign exchange controls, Britain abolished capital controls in
October 1979. Even though the restrictions were lifted after abandoning the Bretton
Wood system in 1972, the intention was not to influence the exchange rate but
mainly to improve the functioning of the capital market. The abolition of
international capital controls and the reregulation of financial markets contributed
greatly to the UKs apparently efficient and highly integrated capital market
(Helleiner 1997).
As a consequence both inward and outward investment increased significantly.
However portfolio outflows were by far greater than portfolio inflows. Outflows
increased from an average £ 258 million during the period 1975-78 to £4,890 million
in the period 1980-83, an increase of 1,800% whereas inward flows of portfolio
investment increased by 57%117. In particular, the overseas investment of financial
institutions increased from £1 billion in 1978 to £7 billion in 1983. Sterling bank
lending overseas rose from around £6 million a month in 1979 to some £300 million
per month in 1981.
During the late 1980s and the 1990s the UK witnessed a substantial increase in the
inflow of investment. The UK continues to have large inward and outward flows of
direct investment and is a leading international financial center. This international
position is of great importance to the global economy, contributing to the flow of
117 Taylor, M, and Tonks, I., (1989), The internationalization of Stock Markets and the Abolition of U.K.Exchange Control, The Review of Economics and Statistics, Vol. 71, No.2, pp.332-336

187
This project has received funding from the European Union’s Seventh Framework Programmefor research, technological development and demonstration under grant agreement no 266800
capital around the world, as well as its domestic economy. The next section provides
empirical development of the integration of the UK in the international financial market.
The UK has run a current account balance of payment deficit in every year since 1984 to 2011
(Figure 3-22). During this period, 2006 records the highest deficit in nominal terms with £39
billion. However, as a percentage of GDP the deficits in late 1980s were larger. In 1989 the
current account deficit was 4.6 percent of GDP with a diminishing effect in middle of the
1990s. As of 2011, the UK records a current account deficit of 1.9 percent of GDP, financed
almost wholly by capital flows.
Figure 3-22 UK current account 1975-2011
Looking at UK’s International Investment Position (IIP) it is evident (Figure 3-23) that
both gross foreign assets held by UK residents and gross liabilities which are UK
assets held by foreign residents have grown significantly over the last two decades.
In 1990 the UK external assets were 180% of GDP, by 1999 these figures accounted
for 260% of GDP. The size of both assets and liabilities are large but similar.
Between 2000 and 2008 the UK gross liabilities grew by 266% and assets grew by
275%. In 2008 and 2009 both UK assets and liabilities fell as a consequence of the
financial crisis.
-5
-4
-3
-2
-1
0
1
2
3
19
75
19
77
19
79
19
81
19
83
19
85
19
87
19
89
19
91
19
93
19
95
19
97
19
99
20
01
20
03
20
05
20
07
20
09
20
11
Pe
rce
nta
ge
so
fG
DP
Source: ONS

188
This project has received funding from the European Union’s Seventh Framework Programmefor research, technological development and demonstration under grant agreement no 266800
Figure 3-23 UK gross external assets and liabilities
The net UK balance sheet is relatively small compared to its gross position. From
1980 up to 1994 the UK recorded a net asset position in every year except 1990,
largely due to the large private sector holdings of financial assets denominated in
foreign currencies.
Exchange rate effects occur as the majority of UK external liabilities are
denominated in sterling, and assets are denominated in foreign currency. In fact
during 2000-04 the depreciation of the sterling against the euro led to a positive
revaluation of UK external assets. The same positive impact was seen in the early
1990s when the sterling depreciated following the UK’s exit from the exchange rate
mechanism. In contrary the appreciation of sterling during 2005-06 led to a
deterioration of the UK’s IIP by £60 billion. (Whittard 2012)
The second type of revaluation is the price effect that is a result of a change in price
in the value of the asset and liabilities that are traded in stock markets.
In 2008 the overall net effect of price changes and exchange rate changes was
positive at £82.4 billion. This was due to the UK’s larger stock of portfolio investment
assets than liabilities. The same positive price effect happened in 1996, when the
0
2000000
4000000
6000000
8000000
10000000
12000000
19
80
19
82
19
84
19
86
19
88
19
90
19
92
19
94
19
96
19
98
20
00
20
02
20
04
20
06
20
08
20
10
£million
Source:ONS
External assets External liabilities Annual GDP

189
This project has received funding from the European Union’s Seventh Framework Programmefor research, technological development and demonstration under grant agreement no 266800
value of UK holding of foreign equities increased more than the value of foreign
holding of UK equities (Senior et al 2000, Bank of England).
The net asset position peaked in the third quarter of 1986 at around £88 billion,
equivalent to 23% of GDP. The net liability position fell between 1994 and 2006
mainly due to the current account deficit over this period which was financed by an
increase in inward foreign investment thus increasing the UK’s net liability
position118. By 2006, the UK’s net liability position was equivalent to 27% of GDP119.
Following the depreciation in sterling in 2007-08, the UK’s net liability position
reduced substantially reaching £83 billion in at the end of 2008. This reduction
continued at the beginning of 2009 reaching £36.8 billion in the first quarter.
However from the second quarter of 2009 the net liability position expanded once
again as sterling appreciated and the world stock markets recovered in the
aftermath of the financial crisis.
Figure 3-24 UK net external balance sheet
118 Whittard,D., and Khan, J., (2010), The UK’s international investment position, Economic & LabourMarket Review, Vol4, No. 6119 The UK’s net liability position in 2006 Q4 was £352.5 billion, 27% of GDP
-500000
-400000
-300000
-200000
-100000
0
100000
200000£million
Source:ONS

190
This project has received funding from the European Union’s Seventh Framework Programmefor research, technological development and demonstration under grant agreement no 266800
At this point it worth noting that even though the UK runs a current account deficit,
which increases the UK’s liabilities with the rest of the world, its’ net liability position
improved during 2007 and 2008. A study conducted ONS states that the reduction in
the net liability position was due to currency and price effect and other volume
changes, as shown in Figure 3-25 (Whithart et al 2010).
Figure 3-25 Revaluations of the UK's net IIP
Table 3-4 shows the expansion of UK external balance sheet according to the main
four components: direct investment, portfolio investment, other investment and
reserves.
At the end of 1990, approximately 11% of gross UK external assets and around 13%
of gross liabilities were in direct investment. Portfolio investment accounted for one
fifth of UK gross external assets and liabilities. In 2000 some 50% of both external
asset and liabilities were in other investment. This proportion has increased slightly
at the end of 2011 accounting for more than half. The increase in other investments
reflects the development of the UK financial sector at the international level.
-400
-200
0
200
400
600
800
2000 2001 2002 2003 2004 2005 2006 2007 2008 2009 2010
£ billion
Source:ONS
Flows Exchange rate effects Price effects Other changes in volume

191
This project has received funding from the European Union’s Seventh Framework Programmefor research, technological development and demonstration under grant agreement no 266800
Table 3-4 UK external balance sheet
Assets in £billion
1980 1990 2000 2006 2008 2009 2010 2011
Direct
Investment
33 123 618 733 1,068 975 1,039 1,119
Portfolio Investment
Debt 6 105 476 837 1099 1208 1319 1391
Equity 13 101 429 693 565 666 750 691
Other
Investment
168 549 1,379 2,916 4,180 3,511 3,780 4,066
Liabilities in £billion
Direct
Investment
22 121 310 577 660 681 742 775
Portfolio Investment
Debt 25 130 393 922 1,374 1,551 1,572 1,606
Equity 4 59 673 780 605 845 936 840
Other
Investment
n.a 597 1,651 3,269 4,518 3,791 4,047 4,362
Source: ONS
By 2011, direct investment in external assets has increased slightly, accounting for
some 15% and gross liabilities have decreased accounting for around 10% of UK
external gross balance sheet.
Figure 3-26 shows the component of UK’s net International Investment Position (IIP)
by instrument type. The UK ran a small net asset position in equity portfolio
investment and direct investment up until 1997. Net direct investment assets
increased whereas net equity investment shifted into net liabilities. This shift can be
explained by the large increase in mergers and acquisition activities during late
1990s. The purchase of overseas companies increases direct investment assets.

192
This project has received funding from the European Union’s Seventh Framework Programmefor research, technological development and demonstration under grant agreement no 266800
However this increase tends to be offset by an increase in equity liabilities issued to
finance the acquisition.
Figure 3-26 Net external position by instrument type
Other investment, including short-term bank capital, has been in a steadily net
liability position during the period of 1980-2011 as evident in Figure 3-26.
The UK has a very large amount of foreign debt, amounting to £ 6,463.6 billion in
2001, equivalent to 420% of GDP (Figure 3-27). By far the biggest component of this
foreign debt is the banking sector with a debt to GDP ratio of nearly 250% of GDP,
reflecting the international character of London’s money markets. The UK’s active
financial sector and large capital movements explain the high level of debt of this
sector. The UK’s external debt reached a peak in 2008, accounting for nearly 440% of
GDP, in the event of the recent financial crisis. Direct investment debt, which
combines debt liabilities to affiliated enterprise and direct investors, is rather small
but has relatively increased in the last decade.
-500000
-400000
-300000
-200000
-100000
0
100000
200000
300000
400000
500000
£million
Source: ONS
Direct Investment
Portfolio investmentequity
Portfolioinvestment debt
Other invesment

193
This project has received funding from the European Union’s Seventh Framework Programmefor research, technological development and demonstration under grant agreement no 266800
The other sectors have the second highest proportion of total UK foreign debt. These
include households, the non-banking sector and non-financial corporations.
Figure 3-27 External Debt
0
50
100
150
200
250
300
350
400
450
500
% of GDP
Source:ONS
General Governement
Banks
Other Sectors
Monetary Authority
Affiliated enterprises
Direct Investors
TOTAL

194
This project has received funding from the European Union’s Seventh Framework Programmefor research, technological development and demonstration under grant agreement no 266800
Figure 3-28 shows the movements in nominal interest rates and real interest rates
during 1975-2011. After a period of fluctuations, explained below, the UK’s interest
rates were rather steady until the sharp decline in the aftermath of the global
financial crisis in 2008.
Figure 3-28 Nominal and Real Interest Rates
-15
-10
-5
0
5
10
15
20
25
30
%
Source: ONS ; Bank of England
Inlfation(CPI)
Nominal interest
Real interest

195
This project has received funding from the European Union’s Seventh Framework Programmefor research, technological development and demonstration under grant agreement no 266800
Figure 3-29 shows movements in sterling since 1980120. The drop in value of sterling
during the early 1990s is the result of the UK leaving the exchange rate mechanism
in 1992. The second major drop in sterling value is in the period associated with the
financial crises 2007-08.
Figure 3-29 Effective exchange rate index
The real exchange rate index has moved approximately in line with the nominal
exchange rate index since the 1990s. This is because the differences in inflation
rates have been reduced across other major economies during this period (Bank of
England 2008).
In 1971 the fixed exchange rate with the dollar was abandoned and the sterling
floated -at first it appreciated and then it depreciated against most other major
currencies until 1976. The depreciation of the sterling was a result of an economic
growth policy the UK government implemented in 1972. It deliberately allowed the
120 Nominal effective exchange rate are obtained from the Bank of England whereas the real effectiveexchange rate index from the World Bank.
0
20
40
60
80
100
120
140Jan 2005=100
Source: Bank of England ; World Bank
Nominal exchange rate
Real exchange rate
196
This project has received funding from the European Union’s Seventh Framework Programmefor research, technological development and demonstration under grant agreement no 266800
sterling to depreciate as long as it achieved its’ growth target. Another reason for
the depreciation of the sterling at the time was the increase in oil prices, from $3 a
barrel in 1973 to $12 per barrel in 1974, which led to a massive balance of payment
deficit. Furthermore in 1975 the UK inflation reached 24.2%. All these factors
contributed to the sterling crisis of 1976, in June that year the sterling fell by 23%
against the US dollar, which forced the government to apply to the International
Monetary Fund (IMF) for a loan of around $4billion and to undertake a tight monetary
and fiscal policy. In early 1980 the high interest rates and the North Sea oil caused
sterling to appreciate damaging the export sector and subsequently leading to a
current account deficit. The removal of capital control in late 1970s made the
problem worse, with the government being afraid to intervene in the exchange rate
market121. The UK government had to dramatically increase interest rate in
response to a weak sterling against the dollar. Despite a high interest rate and tight
monetary policy the UK economy grew strongly between 1985 and 1988. During the
period it grew at over 4% year and unemployment fell from a high level of over 3
million in 1986 to 1.2 million in 1989. By 1988 interest rates were reduced by nearly
half, from 14% in 1985 to 7.5% in May 1988. The low interest rates and a credit
boom, encouraged by financial deregulation, helped fuel a housing boom, and by
1988 the UK economy was operating above at an estimated 5.5% above capacity. On
the same year the government realised that the economy was overheated, and that it
had to act against an expected inflation. Interest rates increased to 15% by October
1988. This reduced consumers spending and the housing market collapsed. Also the
high interest policy kept sterling high, negatively impacting exports.
In October 1990 the UK became a full member of the Exchange Rate Mechanism
(ERM) of the European Monetary System, with sterling pegged to a rate of 2.95
German deutschemark to the pound. It operated with a 6% band on either side.
121 Lowering the exchange rate would have increased money supply though cutting interest rate orhaving a net inflow from abroad.

197
This project has received funding from the European Union’s Seventh Framework Programmefor research, technological development and demonstration under grant agreement no 266800
The ERM was established with the objective to reduce exchange rate variation and
achieve monetary stability within its’ member countries. The central bank had to
intervene in the foreign exchange market as required to maintain the sterling within
its set band.
This proved difficult to maintain and eventually on 16 September 1992 the UK was
forced to leave ERM. The UK joined the ERM in order to cut inflationary pressure on
the economy and enable the government to cut interest rates by linking them to
Germany’s, which were 7% lower than the UK’s 122. However, by 1992, the mark
strengthened and Germany’s economy boomed. With the pressure of high inflation,
the Germany’s central bank raised interest rates making the deutschmark more
attractive to investors that led to an increase in its value. By that time the UK
economy was in deep recession and the government came under pressure, as a
higher interest rate was required to keep sterling within its band. The UK
government intervened heavily in the market as the pound dropped towards
DM2.77123 but the British currency continued to fall. At the same time the sterling
exchange rate was under speculation attack. Currency speculators were convinced
that sterling was overvalued decided to bet against the pound by selling sterling.
The UK government spent billions of foreign exchange to buy sterling which was
being sold frantically in the currency markets. 16 September 1992 the Bank of
England raised interest rates from 10% to 12% and then to 15%. However, the UK
was unable to keep the pound within its band and announced its exits form the ERM
on the very same day. Interest rates were reduced to 10% and the sterling was
allowed to depreciate which in turn boosted internal and external demand and
allowed the economy to recover quite quickly. It also improved the net foreign
liability position.
122 http://www.telegraph.co.uk/news/1399693/A-history-of-sterling.html123 http://www.guardian.co.uk/business/2012/sep/13/black-wednesday-bad-day-conservatives

198
This project has received funding from the European Union’s Seventh Framework Programmefor research, technological development and demonstration under grant agreement no 266800
Since 1992 the sterling has floated freely in the foreign exchange market. The monetary
policy framework of the Bank of England since 1997 sets an inflation target in which the
sterling exchange rate is no longer the cornerstone of monetary policy.
3.10 The UK Financial System and European Integration
The process of European integration has initiated since the Treaty of Rome in 1957,
setting up the European Economic Community, forerunner of the Europe Union (EU),
which introduced targets to abolish custom duties and tariffs amongst European
countries. Even though such targets were achieved in 1968, there remained many
non-tariff barriers that prevented free trade between member states. A new impetus
to implement free movement of labour and capital and to reduce or remove the
existing non-tariff barriers was introduced in the Single European Act 1987, set to
create a Single Market by the end of 1992. By 1 January 1993, around 90% of the
reforms set in the Act had been completed, including full liberalisation of capital
markets, free movements of goods and significant progress on free movements of
services through harmonisation and mutual recognition. Since then the single
market has gradually developed and is still progressing.
The Single Market plays a vital role in producing growth in the UK economy. The
market, which is the largest in the world comprising 500 million people and as of
2011 generated nearly £11 trillions economic activity, is an important source of
funding for UK businesses. The European markets accounts for nearly half of total
UK exports of goods and services. Eight out of the ten main British export markets
are in the EU. In addition EU countries are both the primary source and destination
of FDI both in and from the UK. The proportion of inward FDI coming from EU
countries has increased significantly since 1999, accounting for 35% of the total to
49% in 2008. The EU countries received 44% of the total UK FDI flows in 2008.
The enlargement of the EU in 2004 and 2007 has further contributed to the growth of
UK’s trade in creating new export markets for UK companies. Subsequently, exports
to the 12 new member states amounted to £16.6 billion in 2009 that is nearly three

199
This project has received funding from the European Union’s Seventh Framework Programmefor research, technological development and demonstration under grant agreement no 266800
times more than in 1999, in which exports to the EU were worth only £4.5 billion.
Since 2004 the UK has run a trade surplus with the EU in services, reaching a peak of
£15.9 billion in 2011. Exports to the original 15 EU member countries were worth a
total of £216 billion in 2011. The Business Department in the UK estimates that
around 3.5 million jobs are linked to the exports of goods and services to the EU.
Furthermore, it estimates that the Single Market generates between 2% and 6% in
income gains in the UK, that is equivalent to between £1100 and £3300 a year per UK
household (BIS and CEPR 2012).
Trade within the EU countries is estimated to be twice as much as it would have been
in the absence of the single market. However, because non-tariff barrier that still
exists, BIS estimates that the trade levels between the UK and the EU could
potentially run 45% below potential (BIS and CEPR 2012).
The UK entered the European Economic Community in 1973 but did not join the
European Monetary System’s Exchange Rate Mechanism in 1979 a decision made by
the Labour government and also affirmed by the Thatcher government which came
to power on the same year. However in October 1990 the UK became a full member
of the ERM but it was forced to exist in 1992, the UK finally joined the ERM, but its
membership was suspended in 1992 in the aftermath of the speculative attack on
sterling. At the same time Maastricht Treaty was signed in 1992, which heralded the
creation of the Economic and Monetary Union (EMU). The Treaty also laid the
structure in creating a single European currency, the Euro, which came in effect in
1999. In 1992 the UK was granted an opt-out clause, meaning that it left the decision
whether to join the monetary union or not to the country itself. However, the UK did
not join the euro and it still remains outside of the euro area.
Nevertheless, the City of London is the main centre for Euro trading. In 2003 nearly
48% of the over the counter derivatives transactions in the City of London involved
the euro. In 2007 the UK traded 70% of total EU interest rates derivatives and 71% of
all EU foreign exchange derivatives.

200
This project has received funding from the European Union’s Seventh Framework Programmefor research, technological development and demonstration under grant agreement no 266800
The introduction of the euro also strengthened the City’s position in the foreign
exchange market. Prior to this, the City’s share in this market had been historically
lower than other centres such as Paris or Frankfurt. However, with the removal of
foreign exchange transactions between the euro legacy currencies and with the
creation of the euro, the City dominated in the foreign exchange market. As of 2007,
the UK accounted for 34.7% of the total foreign exchange market daily turnover. This
accounts for 70% of all EU27 dealings in foreign exchange124.
The creation of the single market has been gradual and is still progressing. The EU
has implemented further policies and adapted a number of regulatory measures
since the European Single Act 1987, to achieve deeper EU financial integration. After
the ratification of the Second Banking Directive 1989, which established recognition
of home country supervision with a single passport, problems in creating a single
market in financial services were still apparent. In 1999, the European Commission
introduced the Financial Services Action Plan (FSAP), consisting a set of 42
measures in removing remaining barriers by 2005 so as to create a truly integrated
financial market. The objectives of the FSAP were to develop a more competitive
and dynamic financial services industry by establishing a single market in wholesale
financial services; making retail financial services market more open and secure
and strengthening prudential rules and supervision (Balling 2009). The UK
authorities- HM Treasury, the Bank of England and the FSA- worked closely with the
financial sector to ensure that FSAP was implemented effectively and on transparent
and planed basis. By 2006 the UK adopted 41 out of the 42 measures set in the FSAP
(House of Commons 2006).
Financial integration has developed at a different pace depending on the products
and market sectors. For example the wholesale financial markets are more
integrated that the retail market. The UK wholesale financial services sector is the
largest in the EU27, accounting for 36% of the total EU’s wholesale market in 2008
and the sector accounts for nearly 5% of UK GDP. Between 2000 and 2008 the UK
124 The EU as a whole accounted for 48.9% of the total worldwide daily turnover.

201
This project has received funding from the European Union’s Seventh Framework Programmefor research, technological development and demonstration under grant agreement no 266800
wholesale financial sector experienced an annual growth rate of 12.4%. As of 2008,
the sector accounted for nearly 5% of GDP.
As a consequence of the financial crisis, the size of the wholesale financial sector
has declined. Indeed, UK banks have come to be less reliant on wholesale funding
since 2008. Subsequently, the customer funding gap – the difference between
consumer lending and consumer deposits – has fallen to under £200 million (Figure
3-30).
Figure 3-30 Major UK banks’ customer funding gap
Source: Bank of England, Financial Stability Report (2012)
The City’s importance in the EU economy has been growing over time. Its share of
the EU international finance has consistently remained above 50% since 1995.
Research conducted by the City of London in 2004, suggests that in 2003 it made a
total contribution of 31 billion to EU GDP. Without London, the EU would lose some

202
This project has received funding from the European Union’s Seventh Framework Programmefor research, technological development and demonstration under grant agreement no 266800
18% of financial business conducted in the City to non-European competitors and a
further 12% would be lost altogether as higher costs hamper transaction activity
(CEBR 2004).
The creation of the single market has increased the ability of UK companies to raise
international finance through equity issue. In 2002 out of the total international
equity annual turnover of $4,170 billion, $2,950 million or 71% originated in the EU.
In 1995, this proportion accounted for 62% of total foreign equity turnover. In 2008
the LSE remained the main market for equity trading accounting for 25.7% of total
trading turnover on stock exchanges in Europe.
Net issues of international bonds have increased steadily from £265.3 billion in 2005
to £482.8 billion in 2008. In 2002 the UK was the third largest issuer, after the US
and Germany of such instruments by nationality of issuers. In 2002 the UK share in
this market accounted for 10%, increasing to 23% in 2005125 and as of 2008 it
accounted for 44% of total EU net issues.
In response to the financial crisis the EU has taken further steps towards completing
the creation of a single market. The European Union and Basle Committee
undertook a review of the need for regulatory reform. The Basle Committee
recommended reform of the capital requirements for banks with increased capital
and decreased leverage under Basle III. EU proposals included more comprehensive
regulatory controls such as for hedge funds. Furthermore, the in 2011 the European
Commission adopted the Single Market Act, which launched 12 projects to revive the
single market.
In the aftermath of the Euro-zone crisis, the EU has undertaken major changes to its
treaties in an attempt to save the Euro and subsequently the single market.
However, in 2011, at a summit meeting in Brussels, the UK’s relationship with
Europe came under strain when the prime minister used his veto to block a new EU
treaty to set up the fiscal compact, reducing this to an intergovernmental
agreement. The British Prime Minister’s objection was that the new plans did not
125 In 2005 Germany accounted for 22% of total EU international debt securities.

203
This project has received funding from the European Union’s Seventh Framework Programmefor research, technological development and demonstration under grant agreement no 266800
provide safeguards on financial regulation and that he could not allow a treaty within
the current European treaty as it changes the nature of the arrangements, and most
importantly it undermines the UK’s position in the single market126. It is the first
time, since 1973 when Britain first joined the European Community that a major EU
treaty will go ahead without the consent of the UK.
It has been twenty years since the launch of the single market and the process in
achieving full potential still remains challenging. The recent euro-zone crises have
exacerbated the process of achieving a truly integrated financial market. The
outcome of the on-going problems remains uncertain which puts the future of the
single European market at risk.
126 http://www.guardian.co.uk/world/2011/dec/09/david-cameron-blocks-eu-treaty.

204
This project has received funding from the European Union’s Seventh Framework Programmefor research, technological development and demonstration under grant agreement no 266800
4 Structural Financialization
4.1 Introduction
As discussed, examination of financialization as a phenomena needs to go beyond
descriptive study of simple “increased financial turnover” (Toporowski, 2012, p2),
termed in this paper empirical financialization, to consider the deeper and broader
phenomena of “structural financialization”. In this section we will consider structural
financialization as it relates to the UK. It will examine the “penetration of financing
into a widening range of both economic and social reproduction” (FESSUD ToR).
This will include the impact of financialization on households and corporations from
an economic perspective. In particular the section will examine the huge rises in
debt levels in the UK in these sectors and related asset market inflation, balance
sheet distortions and disruption of consumption and savings patterns. It will then
examine the consequence of these changes, most notably the huge rise of inequality
and insecurity.
However in examining these economic aspects of structural financialization, it is
critical to understand the social and cultural background in which they have arisen
and, in particular, the “construction of consent” (Harvey 2005), and it is this topic that
this section of paper will start with.
4.2 The “Construction of Consent”: Culture & Norms of the financial system
One of the critical issues in understanding the rise of neoliberalism which
underpinned the financialization of the UK economy is how the “construction of
consent” (Harvey, 2005) of the majority of the electoral was achieved. This is
especially the case in the UK where the pre-1980s was dominated by the norms and
culture of a liberal welfare state, which are diametrically opposed to neo-liberalism.
The financialization literature incorporates definitions and measures of
financialization, as well as analysis of the drivers and consequences of
financialization . The literature includes a negative view of the process and social-
economic consequences of financialization including “the passing of risk to
205
This project has received funding from the European Union’s Seventh Framework Programmefor research, technological development and demonstration under grant agreement no 266800
households amidst rising inequality and the threatened macro instability” (Erturk,
2008, p.164). Financialization is defined as a “multi-faceted, general tendency of
capitalism in our time” (I Erturk, 2008) or, more somewhat concretely, “the
increasing role of financial motives, financial markets, financial actors and financial
institutions in the operation of the domestic and international economies” (Epstein,
2005, p.3). Other theorists have however preferred to focus on measuring
financialization in terms of innovation within financial wholesale markets and then
consider the broader implications of this innovation within the economy. Often using
narrative rather than strictly empirical approaches, writers such as Susan Strange in
“Mad Money” (1998) and “Casino Capitalism” (1986), the neo-Marxist David Harvey
(2005), Sassen (2001), Peck and Tickell (1994) or Montgomerie (2006) have
highlighted innovations such as free flow of capital, the explosion of financial trading
unrelated to non-financial transactions, and the development of new financial
instruments and players. These academic writers have also been supplemented by
journalistic and non-academic economists and commentators that have also drawn
attention, often in a more populist mode, especially since the Global Financial Crisis,
to these trends (Tett, 2012).
Ideas relating to “financial innovation and its consequences” (Isturk et al, 2008, p166)
have also become increasing generalized, especially as socio-economic
consequences are examined. For example, Phillips defines financialization as “in
essence making everything into finance or financial instruments, of securitizing
income streams, of reselling participation in loans for everything” (Isturk et al, 2008,
p166). This is particularly true of the neo-Marxists who seek to embed class conflict
into the definition of financialization. For example, Blackburn suggests that
financialization “permeates everyday life, with more products that arise from the
increasing commoditization of the life course …Financialization can most simply be
defined as the growing and systemic power of finance and financial engineering…no
account of contemporary capitalist development can ignore the scale of the financial
sector’s recent expansion” (Blackburn, 2006, pp. 39-40). In addition, neo-Marxist

206
This project has received funding from the European Union’s Seventh Framework Programmefor research, technological development and demonstration under grant agreement no 266800
definitions of financialization include the consequences of it in increasing inequality
and embedding the power of financialized elites, “Financialized techniques have lent
themselves to an extraordinary enrichment of financial intermediaries and of the
corporate elite …(Financialization) has registered large potential gains in dealing
with risk; but most of this gain has been swallowed by the rising costs of financial
intermediation … as well as extravagant remuneration … (by) the fourth-dimensional
operations of hedge funds, private equity, investment banks and pension funds” (ibid.
p40-41). Similarly, “The actual and potential costs of the credit crunch are already
huge, and “(the) wider distemper of financialized capitalism, with its yawning
inequalities, stagnant wages and loss of social protection”. (Blackburn 2008, p106).
In addition some comment that Financialization is not a negative process but one
where “While benefits of Financialization are recognized, they are seen to have been
appropriated by these elites that also threaten systemic stability.” “Financialization
is defined by the use of sophisticated mathematical techniques to distribute and
hedge risk, so it might be thought that these instruments are themselves a major
part of the problem of ‘grey capitalism’. But this would be an error. The
improvements in risk calculation are often genuine enough, but the problems arise
from the ‘grey capitalist’ structure within which they are embedded. In today’s highly
financialized world, a potentially systemic threat on the scale of LTCM could easily
reappear. (Blackburn, 2006, p67).
As the literature has deepened, it has also broadened to encompass cultural
political economy and the way in which it shares a broadly critical view of the
financial system and its cultural significance. Cultural Economics is to some
economists controversial. However it seeks to examine issues within economic
behaviour that highlight contradiction and discrepancy. This is especially so in
examining particular areas of everyday life and then seeking to observe and examine
discrepancies between narratives, openly disclosed information and undisclosed or
unrecognized actions and facts. Here the economy is seen as “running on new
stories and performances” (Erturk, 2008 p240). Often the discourse incorporates

207
This project has received funding from the European Union’s Seventh Framework Programmefor research, technological development and demonstration under grant agreement no 266800
traditional political economy narratives, such as those mentioned above including
instability and inequality, but in this more radical approach. Thrift (2008), for
example, uses the approach to examine the rise and fall of the new economy and the
roles played not only by direct participants but by other stakeholders such as the
media, management consultants and business schools who define the narrative in
terms of innovation and entrepreneurialism, creating “the cultural circuit of
capitalism”. Thrift comments: this circuit “worked – partly because of the power the
various stakeholders had to define what the facts consisted of, partly because of the
ability a number of stakeholders had to train up bodies whose stance assumed this
world and partly because of the provision of measures … that offered confirmation …
rhetoric’s and frames produced practices and knowledge which have consequences
… the new market culture was therefore better interpreted as a material-rhetorical
flourish intended to produce continuous asset price inflation”. Thrift also comments
on key points such as the need for “visions and goals” to engage managers,
identities governments and inter-governmental bodies as stakeholders in the new
economy as well as the enormous benefits which accrued to the few. Thrift also
focus on this latter point describing the new economy as “a new received economic
doctrine of the elite masquerading as a democratic even aesthetic impulse” (p428)
and that the new economy is “a ramp for the financial markets, proving the narrative
raw material to fuel a speculative asset price bubble” (pp422).
Langley (2007) similarly takes an approach of examining “how specific discourses of
the economy (are) … constituting the ongoing financialization of Anglo American
capitalism” (p540) and “the neo-liberal welfare discourse” (p540) which seeks to
move welfare provisions such as pensions into the private sector (Langley, 2004).
However Langley also looks internally to financialized organizations and adds to the
definition of financialization “the tendency for financial disciplines to come to
dominate in corporate management and governance, the shaping and performance
of corporate management subjects and disciplines (Langley, 2008, p134). In another
example, Martin seeks to examine the spread of Financialization into daily life for the

208
This project has received funding from the European Union’s Seventh Framework Programmefor research, technological development and demonstration under grant agreement no 266800
masses as a means not only to manage risk or assets but to acquire identity through
wealth and entering the elite while highlighting the reality that the elite, especially
within the US, has become ever more concentrated and social mobility ever lower
during the post Fordism era (Martin, 2002).
Many of these theoretical conceptualizations of the culture of financialization can be
found in the events in the UK. In particular, the concepts of the role of dialogues and
culture elites are highlighted. During the 1970s, within Thatcherite circles,
neoliberal philosophy and culture was being developed, drawing inspiration from
philosophers such as Rand and Hayek who idealised individualism and laissez faire
capitalism. Rands' philosophy, for example, is summarised by “The pursuit of
(Man’s) own rational self-interest ... is the highest moral purpose of his life” and
“The ideal political-economic system is laissez-faire capitalism. It is a system where
men deal with one another, not as victims and executioners, nor as masters and
slaves, but as traders” 127. Such rhetoric which, at the start of the 1980s peripheral to
mainstream thinking, established an ethos in Britain that allowed the Conservative
government to build a power base by attaching a dialogue to the popular discontent
with the proceeding liberal welfarism128.
In parallel throughout the 1980s there was a growing rhetoric building the culture of
neo-liberalism using simplified neoliberal virtues that appealed to the majority
middle classes, such as individualism, entrepreneurship and property ownership.
Polices, such as the sale to tenants of social housing and individual participation in
privatizations, also directly and cynically created popular support for these ideals by
putting money into individual’s pockets. The image also promoted the ideals of the
aspirational middle class, representing themselves as upwardly mobile ordinary
127 Source: http://www.aynrand.org/site/PageServer?pagename=objectivism_intro128 Internationally as well, this was accompanied by important historical events including the boldliberalising reforms of Deng in China from 1987 onwards, the fall of the Berlin Wall and thesubsequent reunification of Germany in 1989 and the collapse of the Soviet Union in 1991. WhilstFukuyamas' statement that these events “Constitute evidence (for)... a common evolutionary patternfor all human societies – in history, something like a universal history of mankind into the direction ofliberal democracy” (Fukuyama 1992, p48) might be hyperbolic, in the final years of the 1980s in the UKthere existed a new political zeitgeist that neo-liberalism was to fill.

209
This project has received funding from the European Union’s Seventh Framework Programmefor research, technological development and demonstration under grant agreement no 266800
folkBy the late 1980s, as the long boom of 1990s and 2000s began, neoliberal policies
also became dominant as a populist explanation for the reviving economic prosperity
and there was a gradual absorption and acceptance of these previously radical ideas
into mainstream culture. This led to the repeated election of the Conservative Party.
(Ismail et al, 2011). This cultural change fostered social acceptance of financial
excess as means of enrichment through financial operations.
This shift in mainstream culture was also assisted by a vacuum in political thinking
on the left. During the 1980s the Labour Party was led by a series of establishment
figures from the 1970s, most of whom lacked charisma and a credible alternative to
the failures of that period. A political vacuum opened up that was filled by “new
labour” that shifted policies to increase electability and that were little more than
neo-liberalism with a greater social welfare agenda attached. This shift by the left
allowed the election of Labour governments, led by Tony Blair, from 1997 in three
consecutive election victories but also was considered by many to be a betrayal of
socialism. Central to the New Labour programme promoted by the Blair and Brown
administrations was the notion that the government should represent the interests
of finance (notably, for example, in the five ‘tests’ that were to be satisfied for joining
the European Monetary Union) and that income inequalities were the result of
enterprise rather than rents.
Against this background of political shifts, there were also important broader social
changes taking place creating a dominant and consensual culture for financialization
(Montgomerie, 2012). In particular the growing emphasis on individual consumption
underpinned by debt and consumer finance affected social and personal values in
which finance and markets appeared as benign forces (McFall, 2010). This relates
closely to branding and advertising which has become ubiquitous and, in conjunction
with media, drove the increasing consumption and the linking of consumption
choices to personal identity and value. Various indicators of a culture driven by
media and consumption can be found. Statistically, for example, watching TV is the
UKs top leisure activity with the average daily time spent watching TV being 2.6

210
This project has received funding from the European Union’s Seventh Framework Programmefor research, technological development and demonstration under grant agreement no 266800
hours, representing 47% of free time129. The second most popular leisure activity is
shopping at 42% of leisure time. A mere 11% of leisure time is spent on activities,
including socialising, other than TV and shopping. More eloquently, Koolhaus
comments on the manner in which consumption has come to dominate both
individual’s and society’s identify and culture: “Shopping has infiltrated, colonised,
and even replaced, almost every aspect of ... life” (Koolhaus et al, 2002, p2) and “Not
only is shopping melting into everything but everything is melting into shopping ... it
is now arguably the defining aspect of public life... it is synonymous with ... the
unfettered growth and acceptance of the market economy” (ibid, p129). The rise of
consumer culture was very compatible with the values of neo-liberalism -
Individualism, the pursuit of personal over collective happiness and consumption as
freedom and identity – and effectively became a popularised, de-philosophized form
of neoliberalism. However the human desire for “conspicuous consumption” (Veblen,
1899), is hardly novel. Veblen comments that “conspicuous consumption of valuable
goods is a means of reputability to the gentlemen of leisure... (And) in order to be
reputable, it must be wasteful” (Veblen, 1899, p75 and 96). However the novel and
intimate link between consumer culture and financialization was the provision of
finance to households?, mainly through uncontrolled leverage and extension of
credit to sustain it combined with the socialization of debt (Langley, 2004; Blackburn
2008). As noted previously, debt levels such as credit cards liabilities and mortgages
surged. From a social perspective, the previous norm was that debt was only
appropriate for conservative purposes, such as mortgages, and that debt levels
should be moderate compared to repayment capacity. However the combination of
rising expectations of consumption and increasing availability of easy debt drove
changing social attitudes that accepted and trivialised both high debt levels and debt
for trivial purposes. An aspect of the superficial competition in banking was the
multiplication of sources and types of debt multiplied. From the 1990s newspapers
reported the use of multiple credit cards, store cards and overdrafts and the
129 Source: National Statistics Office “Time Use Survey, 2005”.

211
This project has received funding from the European Union’s Seventh Framework Programmefor research, technological development and demonstration under grant agreement no 266800
management of debt repayments by short-term, Ponzi methods, such as switching
debts between providers or using different sources of debt to repay others.
As the housing market inflated, mortgages as a multiple of income grew to record
levels and the “withdrawal of equity” - that is increasing mortgages against the
increase value of property to finance consumption - became common place
(Reinhold, 2012). The “delusion of successful thrift amongst the middle classes”
(Toporowski, 2012, p.93) as asset markets created paper gains for property owing
classes encouraged a classic Minsky cycle of speculative fervour. Houses
transformed from homes to investments and many households maximised leverage
to speculate in the housing market including in buy-to-let properties and in the rapid
turnover of houses as “speculative poker chips for profitable resale” (Kindelberger,
2005, p39). There was a widespread belief that house prices would “never” decline.
Referring to the widespread psychological feeling that there was an increase in real
wealth, Toporowski comments “the propertied classes succumbed to the comforting
delusion... that their foresight and financial acumen have secured them their gains”
(Toporowski 2012, p94). Popular culture encouraged such high leveraging and
increasing speculative activity with much cultural engagement in “the property
ladder” as a one-way bet to capital gains. Reminiscent of the “Boiler shops that
hustled untutored investors with promises of quick sure-fire gains” (Kindelberger,
2005, p40), there was an endless series of daytime TV programmes with titles such
as “Location, location, location”, “Grand Designs” or “Escape to the Country” which
became some of the most popular TV shows with superficial, chatty hosts promoting
a fantasy of exquisite homes with vast and certain financial gains thrown in (Thrift,
2008).
Within these political and social changes, there was to emerge a culture that
personified the heroic ideal of neo-liberalism, that of finance and the financier
(Langley 2004; Thrift, 2001; Thrift, 2008). Emerging in the late 1980s, and far
removed from the staid, conservative and bowler-hated image of earlier

212
This project has received funding from the European Union’s Seventh Framework Programmefor research, technological development and demonstration under grant agreement no 266800
generations, the new financier was young, flash and brash, and the “winner” in the
neo-liberal inspired competition for power, wealth and status.
This culture, and the money that accompanied it, increasingly attracted individuals
typified by an extreme A-type personality - characterised by being highly competitive,
aggressive, driven and with a lack of compassion or empathy for others - who were
very successful in this culture. There was a culture of a complete prioritisation of
work over family or personal life. Conspicuous consumption conferring status was
critical to competing, very much in the mode of Veblen’s “wasteful” consumption.
Personal lives were dominated by status in a culture where the possessions, looks of
your wife, your postcode and your children school were subject to competitive
scrutiny and define social status. Dysfunctional behaviours such the recreational use
of prostitutes, drugs and alcohol were common. This was accompanied by an ever
inflating sense of entitlement and elitism amongst financiers (Thrift, 2001). Many felt
themselves to be “Masters of the Universe” (Wolfe, 1987) and members of an elite
whose personal superiority and brilliance was the cause of their ever increasing
wealth. The financiers saw society as fitting well into a “Brave New Worlds”
categorization of Alpha, Betas and Epsilon-semi morons, with themselves as, of
course, the Alphas (Thrift, 2001).
Underwriting this culture was ever expanding pay levels within the industry. Until the
early 1990s bonuses were a limited part of financial services pay. However as profits
within the industry expanded130, accompanied by ever increasing competiveness
between individual and firms within it, the culture of bonuses started to develop. As
the profits of firms grew the bonuses also grew. Senior employees started to receive
huge bonuses that were multiples of their salary. Bonuses in excess of £1 million
became common for successful traders and senior executives. Top performers
regularly received tens of millions in a single year.
130 See earlier discussion for drivers of this at the firm level such as cycle of product profitability.

213
This project has received funding from the European Union’s Seventh Framework Programmefor research, technological development and demonstration under grant agreement no 266800
Bonuses allocation within firms was the subject of considerable internal politics and
strife due to the subjective nature of many firms’ allocation methods, Bonuses were
awarded based on complex, internal assessment systems such as complex
management accounting for sales and trading profits or systems of ranking and
rating employees. Individual traders and salespersons often had individual revenues
assigned to them which they would monitor on a daily basis. Significant internal
resources were dedicated to managing and developing these systems, not to
mention extensive political gaming. Indeed, from September when bonus
negotiations typically began, to December when bonus allocations were agreed,
there was an expectation of a lull in revenue generation due to the distraction of staff
by the bonus process. There was also huge internal competition for promotion within
the corporate hierarchy that then gave access to control and manipulation of bonus
pools and compensation policies (Thrift 2008; Engelden, 2008).
Such assessment and promotion systems were very rarely assessed by any factor
other than revenues. For example, resource usage, such as leverage or market risk,
or ethical standards, such as ethics or customer service, were largely ignored or
given lip-service only. This culture expressed itself in increasing contempt for
customers and the instances of fraud or poor sales practises became common at
many large players in the industry. For example, Goldman Sachs was revealed in
2012 to refer to clients as “muppets”. However typically banks liked to keep
problems out of the press and were eager to settle with clients out of court and to
fire fraudsters quietly. Some firms actually sought to allow fraudsters to “resign” so
they would be reemployed by rival firms. Instances of major fraud and mis-selling
are discussed in earlier sections, but more minor instances were just regular events
in investments banks.
In addition, the time period and form of bonuses before the crisis did not recognise
the longer-term consequences of the work for which bonuses were awarded. Firstly
the allocation of bonuses was on made based on annual revenue. There was no
mechanism for a longer term assessment. This encouraged and promoted short-

214
This project has received funding from the European Union’s Seventh Framework Programmefor research, technological development and demonstration under grant agreement no 266800
termism amongst those employees whose primary concern was maximising their
individual bonuses. Any consideration of the long-term impact on a firm was
jettisoned. The impact of this incentive can be seen, for example, in the method of
accounting and valuation, as discussed above, which maximised immediate profit
recognition whilst creating unknown and long term high risk positions within banks.
Also, firms increasing paid bonuses in allocation of the firms’ own shares. This was
particularly common amongst senior executives and was intended to align the
overall performance of the share price to the incentive structure for those
executives. However it also added to the short-termism of the industry as the focus
increasingly was on short term share price movements. Such focus was also driven
by institutional shareholders, such as those with pension and mutual funds, whose
own bonuses also came to depended upon the short term valuations of the portfolios
they managed. This was particularly problematic when many of the funds they
managed represented the very long term savings vehicles of their customers. Such
issues ensured that employees were incentivised simply to maximise short-term
profits and, in order to do so, to take any level of leverage or risk or ethical
compromise that such maximization required (Engleden, 2008).
Few, if any internal, controls moderated these problems. Stop losses, where traders
were subject to a requirement to close positions after a loss threshold was reached,
existed, but they had little internal impact in reality. Employees who spoke out about
concerns about risk and leverage were ignored and marginalised and during the bull
years not to take risk was indeed to be wrong and to underperform in the ever
inflating markets. Those who raised concerns relating to unethical behaviour were
seen as not being “team players”. Many firms had explicit policies of firing
underperforming or disliked staff. Goldman Sachs for example fired the bottom 10%
of their staff annually. Not to generate sufficient profits or to be one of those
marginalised was to be on that list of annual firings. Increasingly there were
“dysfunctional internal silos” (Tett, 2012, p300) that was unable to critique
themselves internally and this was identified as a key factor in the failures of the

215
This project has received funding from the European Union’s Seventh Framework Programmefor research, technological development and demonstration under grant agreement no 266800
industry that led to the financial crisis (For example, Independent Commission on
Banking, 2011).
Subsequent to the public bail out of banks and in the face of public anger over the
continuation of bonus payouts after 2007, there was a great deal of criticism of the
bonus culture. The Turner Report commented that “Remuneration policies... have
created incentives for some executives and traders to take excessive risks and have
resulted in large payments in reward for activities which seemed profit making at
the time but subsequently proved harmful to the institution, and in some cases to the
entire system” (FSA, 2009) and called for regulatory reform. Criticism came from
within the industry too. For example, Nicastro of Unicredit comments, “we need to
listen less to the market when they ask for short term performance...short term
pressures may push banks to be over ambitious in business mix, organizational
structure and risk taking ... everybody now has regrets: paying too much for, and
doing too many deal”, Jim Freeman comments “The mark to market nature of
transactions had a secondary effect .... you show a big profit in year one ... people get
paid on that profit ...you risk paying out short term for a long term risk” or Simon
Samuels, comments, “There’s an extraordinary tension between short term profit
maximisation and long term value”. However, despite this pious handwringing by
bankers over their failures, as at the time of writing, in reality no substantive
regulatory reform has been made and the bonus bandwagon rolls on (CRESC, 2009).
As well as the absolute amount of bonuses, financiers also then created a virtuous
circle of money-making as the huge bonuses for industry leaders could not be
consumed but were reinvested. With a circle of insiders financiers set up non-
regulated funds with large amounts of pooled capital and exclusive knowledge and
access. This then circulated capital from bonuses into asset markets of various
types and further accelerated the vast gains in wealth by these elites (Engelden,
2008).
Finally, financiers also increasingly sought to seek political and ideological
dominance with values directly taken from neoliberalism, neatly closing the circle on

216
This project has received funding from the European Union’s Seventh Framework Programmefor research, technological development and demonstration under grant agreement no 266800
the ideology that had served the elite so well. As Tett comments, “Elites try to
maintain their power not simply by garnering wealth, but by dominating mainstream
ideologies” (Tett, 2012, p298). Political influence was sought through lobbying and
funding of political parties. In the UK both the Labour and Tory parties were
significant recipients of party funding from the financial services industry, both from
individuals and from firms. For example, the Tory party received over 50% of its 2012
funding from the City including donations from individuals of up to £4 million131. In
addition, London financiers were active in the international circles of the industry,
where relationships with politicians and policy-makers are forged in backrooms, and
in funding opinion-forming bodies such as research institutes and universities.
Similarly links between those political elites, financiers and the media have also
been forged to dominate mainstream media with a neoliberal agenda, as has been
revealed in the ongoing phone-tapping scandal in the UK, at the time of writing
(Ismail et al, 2011; Froud et al, 2011).
In conclusion, these last aspects of the culture and norms of finance are the most
important, closing as they do the circle of neoliberal philosophy and providing the
means through the wealth and influence of the elite to dominate the much broader
mainstream culture of UK society. Wealth had been transformed into exceptional
political power that has not only ensured the minimisation of regulation and
constraints on finance, but suppressed any public mainstream debate outside of the
neoliberal rhetoric of individualism and entrepreneurship. During recent decades, a
number of alternative political and interest groups have arisen, and since the
financial crisis protests and riots have taken place. However they have been largely
ineffective, partially due to a lack of a mainstream media platform, but also because
of a lack of a unifying philosophy and politics that offers an alternative to neo-
liberalism.
131 Source: http://www.guardian.co.uk/politics/2011/feb/08/tory-funds-half-city-banks-financial-sector

217
This project has received funding from the European Union’s Seventh Framework Programmefor research, technological development and demonstration under grant agreement no 266800
4.3 The Ubiquitous Rise in Household and Corporate Debt
As noted in the previous section, the culture of the period of financialization
encouraged increasing levels of debt which was funnelled into the housing market
and consumption and that became a socialised norm. Similarly within the corporate
sector, debt levels rose. This is illustrated in Figure 4-1 below, where the levels of
debt within the UK household and non-financial corporate sectors132, as measured as
a ratio against GNP, accelerated continually from the mid 1990s, from approximately
50% to 100% of GNP .
Figure 4-1 UK household & corporate (Non-financial) debt as a ratio to GNP
Source: Barwell and Burrows (2010)
The reasons behind this huge surge in borrowing by households can be seen in the
changes in household balance sheets. In Figure 4-2 below, the balance sheets of
households are shown for selected years from 1994 to 2007. As can been seen,
household net worth increases. This increase, however is primarily due to increases
132 Which mirrors rising lending in the banking sector as discussed in the prior section.
30
40
50
60
70
80
90
100
110
19
87
19
88
19
89
19
90
19
91
19
92
19
93
19
94
19
95
19
96
19
97
19
98
19
99
20
00
20
01
20
02
20
03
20
04
20
05
20
06
20
07
20
08
Ra
tio
of
De
bt:
GN
P
Households

218
This project has received funding from the European Union’s Seventh Framework Programmefor research, technological development and demonstration under grant agreement no 266800
in the value of the housing stock, which grew from £1.4 trillion to £4.9 trillion and
from 53% to 66% of net assets between 1994 and 2007. Pensions and deposits also
increased in value but remained relatively constant percentages of net worth.
Mirroring these changes in housing assets were increases in debt which tripled from
£0.5 trillion to £1.5 trillion in the same period. Burrows of the Bank of England, from
whom this data is drawn, comments “The household sector took on bank loans,
predominantly to finance house purchases. House prices began a long march
upwards, boosting net worth for house owners through revaluation effects” (Barwell
and Burrows 2010, p11). Although less clear in this analysis, as discussed earlier,
credit card debt also grew rapidly.
Figure 4-2 Household Balance Sheets (1994-2007) £billions
Source: Barwell and Burrows (2011)
In the corporate sector, balance sheets also significantly restructured during this
period, as illustrated in Figure 4-3 below. Until 2000 balance sheets of corporations
expanded modestly and expansion was not through bank credit but through equity.
Burrows comments, “The key developments (in the nineties) were in equity markets.
0
1,000
2,000
3,000
4,000
5,000
6,000
7,000
8,000
9,000
10,000
1994 1996 2000 2003 2007
Net Worth
Debt
Other financial assets
Deposits
Pensions
Houses
£

219
This project has received funding from the European Union’s Seventh Framework Programmefor research, technological development and demonstration under grant agreement no 266800
The UK corporate sector brought in a lot of foreign equity133 during this period,
dominated by a number of high-profile deals, and revaluations effects were very
large, as equity prices rose around 70% between 1996 and 1999”. (Barwell and
Burrows, 2010, p11). This period reflects the market hubris of that time around new
technology and the “productivity miracle” as well as frenzied M&A activity especially
in the TMT sector134. However, following the dotcom bust, corporate investment was
more subdued and was covered by corporate savings (Barwell and Burrows, 2010).
Figure 4-3 Non-financial corporate balance sheets (1994-2007) (£billions)
Source: Barwell and Burrows (2011)
However as the 2000s progressed bank borrowing by the corporate sector increased.
Critically, the nature of that financing changed with bank borrowing increasing and
133 Note that equity financed M&A between two UK resident companies leads to zero expansion of UKcorporate balance sheets as they simply swap equity between them but no new funds are raisedalthough both companies’ balance sheets are inflated in equal and offsetting amounts.134 Notably in the UK, Vodafone’s takeover of Mannesmann in 2000.
-1,000
-500
0
500
1,000
1,500
2,000
2,500
3,000
3,500
4,000
1994 1996 2000 2003 2007
Net WorthOtherEquity and DIDebt SecuritiesLoansOtherEquity and DIDepositsTangible Capital
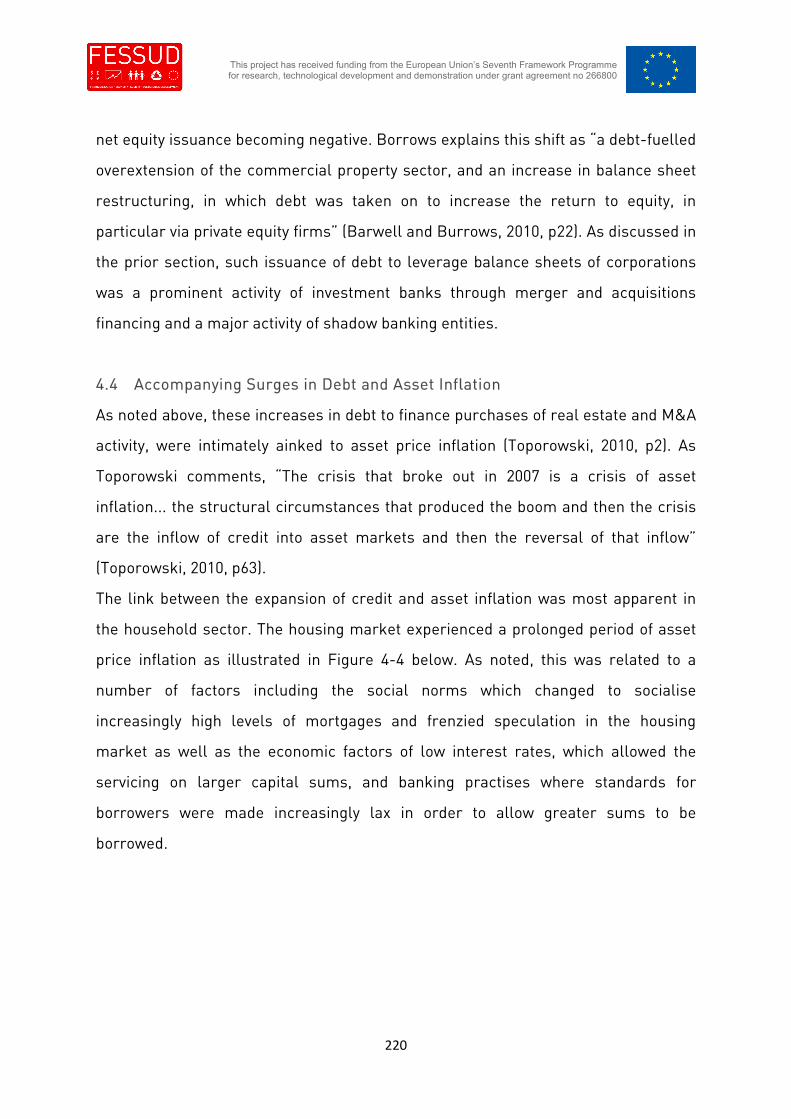
220
This project has received funding from the European Union’s Seventh Framework Programmefor research, technological development and demonstration under grant agreement no 266800
net equity issuance becoming negative. Borrows explains this shift as “a debt-fuelled
overextension of the commercial property sector, and an increase in balance sheet
restructuring, in which debt was taken on to increase the return to equity, in
particular via private equity firms” (Barwell and Burrows, 2010, p22). As discussed in
the prior section, such issuance of debt to leverage balance sheets of corporations
was a prominent activity of investment banks through merger and acquisitions
financing and a major activity of shadow banking entities.
4.4 Accompanying Surges in Debt and Asset Inflation
As noted above, these increases in debt to finance purchases of real estate and M&A
activity, were intimately ainked to asset price inflation (Toporowski, 2010, p2). As
Toporowski comments, “The crisis that broke out in 2007 is a crisis of asset
inflation... the structural circumstances that produced the boom and then the crisis
are the inflow of credit into asset markets and then the reversal of that inflow”
(Toporowski, 2010, p63).
The link between the expansion of credit and asset inflation was most apparent in
the household sector. The housing market experienced a prolonged period of asset
price inflation as illustrated in Figure 4-4 below. As noted, this was related to a
number of factors including the social norms which changed to socialise
increasingly high levels of mortgages and frenzied speculation in the housing
market as well as the economic factors of low interest rates, which allowed the
servicing on larger capital sums, and banking practises where standards for
borrowers were made increasingly lax in order to allow greater sums to be
borrowed.

221
This project has received funding from the European Union’s Seventh Framework Programmefor research, technological development and demonstration under grant agreement no 266800
Figure 4-4 UK House Prices (Absolute & Annual Inflation (Non-Inflation
Adjusted)
Source: Nationwide Building Society
However, none of these factors would have been effective in creating house price
inflation without the basic underlying flow of credit into the sector. As illustrated in
Figure 4-5, there is a close correlation between household credit and house prices
over a number of years and this is the fundamental link between the household
sector and the financial sector.
-20.00%
-10.00%
0.00%
10.00%
20.00%
30.00%
40.00%
0
20,000
40,000
60,000
80,000
100,000
120,000
140,000
160,000
180,000
200,000
1975 to 2011
Price £
AnnualChange%
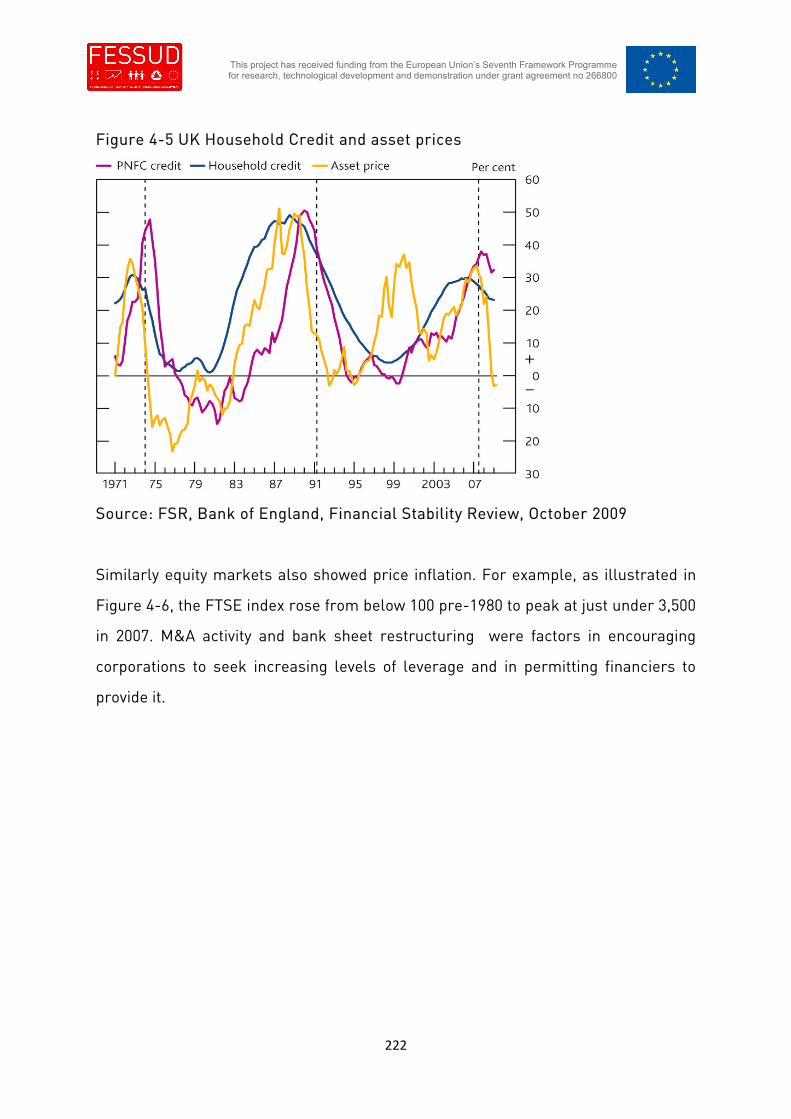
222
This project has received funding from the European Union’s Seventh Framework Programmefor research, technological development and demonstration under grant agreement no 266800
Figure 4-5 UK Household Credit and asset prices
Source: FSR, Bank of England, Financial Stability Review, October 2009
Similarly equity markets also showed price inflation. For example, as illustrated in
Figure 4-6, the FTSE index rose from below 100 pre-1980 to peak at just under 3,500
in 2007. M&A activity and bank sheet restructuring were factors in encouraging
corporations to seek increasing levels of leverage and in permitting financiers to
provide it.
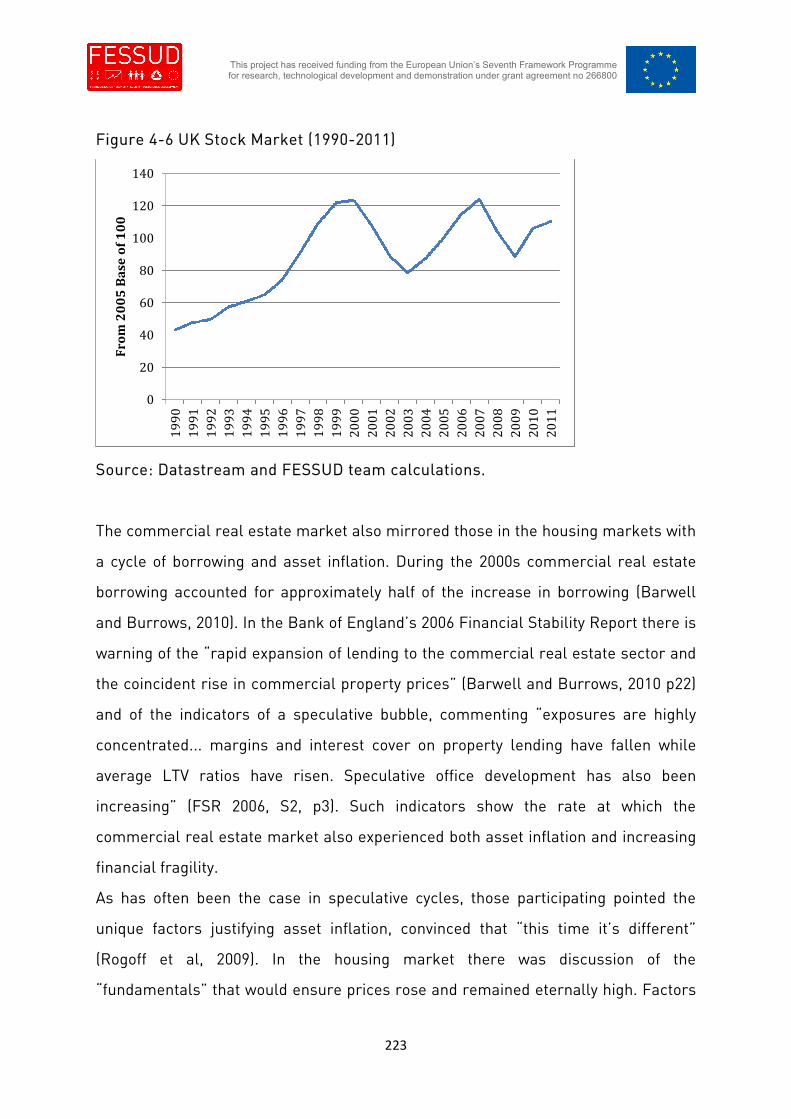
223
This project has received funding from the European Union’s Seventh Framework Programmefor research, technological development and demonstration under grant agreement no 266800
Figure 4-6 UK Stock Market (1990-2011)
Source: Datastream and FESSUD team calculations.
The commercial real estate market also mirrored those in the housing markets with
a cycle of borrowing and asset inflation. During the 2000s commercial real estate
borrowing accounted for approximately half of the increase in borrowing (Barwell
and Burrows, 2010). In the Bank of England’s 2006 Financial Stability Report there is
warning of the “rapid expansion of lending to the commercial real estate sector and
the coincident rise in commercial property prices” (Barwell and Burrows, 2010 p22)
and of the indicators of a speculative bubble, commenting “exposures are highly
concentrated... margins and interest cover on property lending have fallen while
average LTV ratios have risen. Speculative office development has also been
increasing” (FSR 2006, S2, p3). Such indicators show the rate at which the
commercial real estate market also experienced both asset inflation and increasing
financial fragility.
As has often been the case in speculative cycles, those participating pointed the
unique factors justifying asset inflation, convinced that “this time it’s different”
(Rogoff et al, 2009). In the housing market there was discussion of the
“fundamentals” that would ensure prices rose and remained eternally high. Factors
0
20
40
60
80
100
120
1401
99
0
19
91
19
92
19
93
19
94
19
95
19
96
19
97
19
98
19
99
20
00
20
01
20
02
20
03
20
04
20
05
20
06
20
07
20
08
20
09
20
10
20
11
Fro
m2
00
5B
ase
of
10
0

224
This project has received funding from the European Union’s Seventh Framework Programmefor research, technological development and demonstration under grant agreement no 266800
such as population growth, immigration, lack of housing supply, and increase in
small households and so on were discussed to justify this belief in the media and in
popular culture. Since the end of the long house price boom, prices have fallen by
14% (Source: The Economist, August 18th, 2012135) but many are still waiting for the
housing market to return to its “normal” pattern136 of unceasing rises in what might
be described as the “borderline case (of individual rationality) hanging on in hope of
some improvement or failing to take a specific sort of action in the face of changed
circumstances” (Kindelberger, 2005. P44). Similarly, in the corporate market, the
discussion about the “new productivity” and about the value of M&A activities and
new financing techniques creating “shareholder value” was common. In fact,
academic studies137 suggest that the a majority of mergers and acquisition actually
created little of the promised synergy or value and, in fact, most only create short
term value for the targets shareholders based on share price inflation at acquisition
(Kaplan, 2006).
4.5 Consumption, Savings & Borrowing in the Household Sector
However, as noted, empirical financialization, where finance has simply increased in
size and complexity, is not a particularly novel economic phenomena. Neither is the
associated expansion of credit and asset price boom and busts. As Kindelberger
comments, “Speculative manias gather speed through expansion of money and
credit... every mania has been associated with the expansions of credit”
(Kindelberger, 2005, p55). Similarly, Minsky links asset booms and increasingly
135 http://www.economist.com/node/21560599136 The end of the UK housing market remains unknown but since the market peak in 2007 prices havefallen by 14% (Although buoyed largely by central London) which is relatively modest compared toother markets such as the US, Spain and Ireland. However the UK currently most closely resemblesJapan where prices fell modestly each year, with occasional rises, from the peak in 1990 to thecurrent date, meaning long term prices in housing collapsed in a slow motion manner to 20% of theirpeak (Saxon house et al, 2004).137 Although studies have founded variable results due to different methodology and time series aswell as factors that vary by deals, such as the balance of equity & debt.
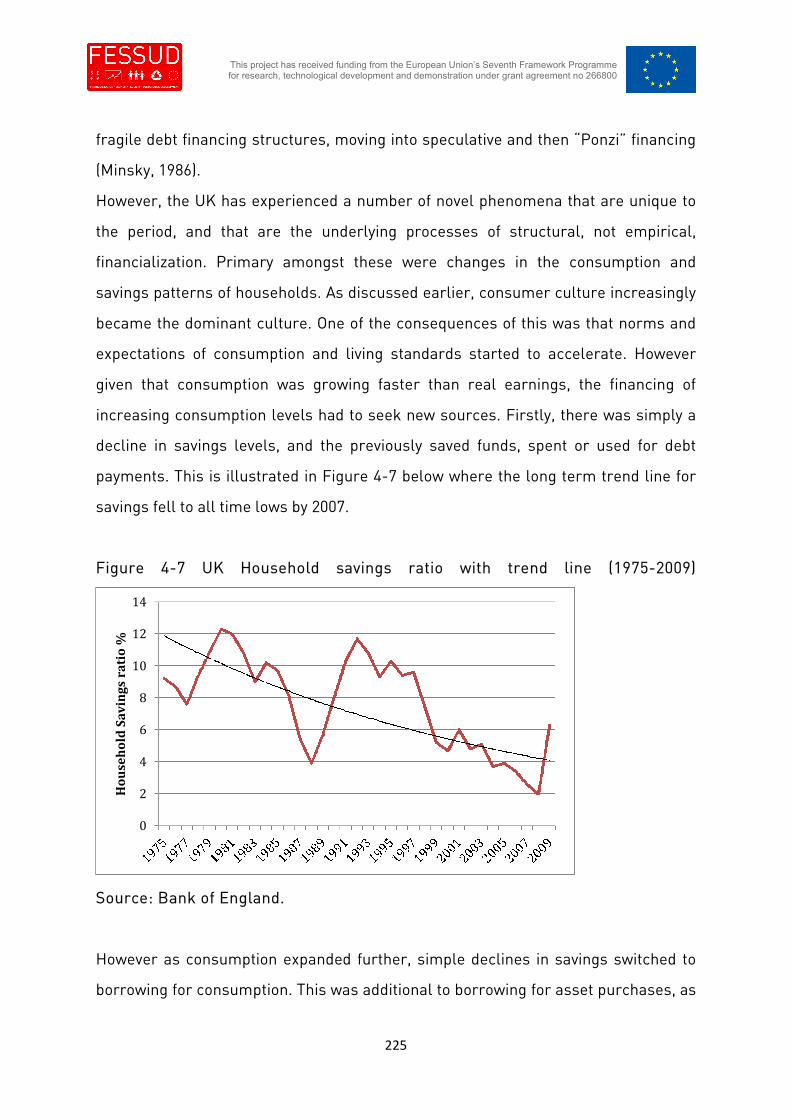
225
This project has received funding from the European Union’s Seventh Framework Programmefor research, technological development and demonstration under grant agreement no 266800
fragile debt financing structures, moving into speculative and then “Ponzi” financing
(Minsky, 1986).
However, the UK has experienced a number of novel phenomena that are unique to
the period, and that are the underlying processes of structural, not empirical,
financialization. Primary amongst these were changes in the consumption and
savings patterns of households. As discussed earlier, consumer culture increasingly
became the dominant culture. One of the consequences of this was that norms and
expectations of consumption and living standards started to accelerate. However
given that consumption was growing faster than real earnings, the financing of
increasing consumption levels had to seek new sources. Firstly, there was simply a
decline in savings levels, and the previously saved funds, spent or used for debt
payments. This is illustrated in Figure 4-7 below where the long term trend line for
savings fell to all time lows by 2007.
Figure 4-7 UK Household savings ratio with trend line (1975-2009)
Source: Bank of England.
However as consumption expanded further, simple declines in savings switched to
borrowing for consumption. This was additional to borrowing for asset purchases, as
0
2
4
6
8
10
12
14
Ho
use
ho
ldS
av
ing
sra
tio
%
226
This project has received funding from the European Union’s Seventh Framework Programmefor research, technological development and demonstration under grant agreement no 266800
discussed in the prior section, and the extent of it was one of the most important
aspects of structural financialization. Amongst wealthier, property owning classes,
the source of this borrowing became secured borrowing against unrealised gains in
housing stock. Termed “equity withdrawal”, such borrowing grew every year from
1997 to 2007, peaking at £140 billion annually in 2006 before sharply declining during
the financial crisis (Reinhold, 2012). Similarly, as discussed in the prior section,
unsecured borrowing through credit cards also expanded.
The rises in financial market assets also created a comfort amongst those with stock
portfolio or private pension plans and the “delusion of thrift” (Toporowski, 2010a,
p89). As Toporowski comments, “Capital gains are therefore “naturally” attributed to
provident and well-calculated asset purchase... rather than generalised asset
inflation. In this way the propertied classes succumb to the comforting illusion... that
their foresight and financial acumen have secured them their gains” (Ditto, p93-94).
This further encouraged a lack of savings from income and, as shall be discussed
below, changes in social and political attitudes.
The cumulative effects of these “wealth effects” and related financing for
consumption was a major factor in the long boom of the 2000s where consumption,
which composed the dominant share of GDP, grew at a rapid rate. However, by 2011,
this cycle of inflated consumption was collapsing and was a major cause of the
prolonged recession that occurred in the UK post 2007138 (Kamath et al, 2011).
Overall the flood of credit into the housing market, and hence indirectly via “equity
withdrawal” into consumption, as well as lending directly for consumption were
critical and fundamentally new processes that created increased instability in the
economy, a key characteristic of the UK's financialization.
138 In addition to unemployment and high inflation driving falls in real wages which were alsoimportant (Kamath et al, 2011).

227
This project has received funding from the European Union’s Seventh Framework Programmefor research, technological development and demonstration under grant agreement no 266800
4.6 Financial Fragility and Production in the Corporate Sector
The impact in the corporate sector of heightened leverage and asset prices is more
diverse and less clearly linked to consumption. As noted, commercial property
prices experienced considerable inflation and while this encouraged speculative
flows into the sector these were largely limited to heavily leveraged real estate
companies.
However there were important impacts from the new methods of financing and
balance sheet restructuring and leverage. As Toporowski comments, “Financial
inflation changes the way in which the economy works though the impact of this
inflation on corporations or companies financing themselves in these capital
markets... (with an) extended festival of merger and acquisition activity and balance
sheet restructuring” (Toporowski, 2010a, p65). This shift in financing created two
important impacts. Firstly, corporation’s financial structure became more fragile
and reliant on the future income flows of those corporations (Toporowski, 2010;
Barwell and Burrows, 2010). Secondly, the shifts encouraged a shift in focus from
production to financing methodologies. Such a shift fundamentally undermined
investment in both ongoing production and future innovation by corporations. Whilst
financial fragility certainly has important implications, critically the implied increase
in financial fragility of the banking sector with exposure to corporations, it is not a
new phenomenon. However, the shift from production to finance as the fundamental
activity of non-financial corporation’s is a new phenomena and, again, important new
process that characterises the UK's financialization, as well as having significant
long term negative implications for the overall economic structure of the UK139.
139 In conjunction with the shift of investment into “off-shore” low cost production in non-UK countriessuch as Asia and Eastern Europe.
228
This project has received funding from the European Union’s Seventh Framework Programmefor research, technological development and demonstration under grant agreement no 266800
4.7 Rising Inequality in the UK
4.7.1 Introduction
The period of financialization, and particularly since 2000, has reinforced the
inequalities that had set in during the Thatcher administration in the 1980s.
Inequality has also further accelerated since the 2007 crisis. Indeed, a popular
interpretation of this is that the structural changes within the economy that
financialization has created a power shift away from labour to capital and that this
has resulted in increasing inequality within the UK through reducing wage incomes.
However in order to examine the changes that have taken place within the UK in
relation to income distribution a nuanced view needs to be taken that examines not
only income between labour and capital but income between different class
segments of the population. In addition the impact of financialization on inequality
also needs to examine asset inequality, with its feedback mechanisms into both
income and security. This will be examined in more detail below.
Inequality has two aspects, asset inequality and income inequality (Joyce and Sibieta
2013). Income inequality is commonly measured by the Gini coefficient, a standard
measure of income inequality that ranges from 0 (when everybody has identical
incomes) to 1 (when all income goes to only one person). In the UK the Gini
coefficient has consistently risen since the early 1980s from 3.0 to 3.4 by 2005. By
2010 the average income of the richest 10% of the population was twelve times that
of the poorest 10%. This disparity was even greater when examining the top 1% who,
by 2010, earns 15% and the top 0.1%, 5% of total national income (Source: OECD,
2011). According to the OECD “Increases in household income inequality have been
largely driven by changes in the distribution of wages and salaries...Top earners saw
their incomes rise particularly rapidly. Earners in the top 10% have been leaving the
middle earners behind more rapidly than the lowest earners have been drifting away
from the middle” (OECD, 2011, p22). In the UK these trends manifested themselves
as average growth rates for the 1980s to 2000s of 2.1% in real income, but 2.5% for
the top 10% and only 0.9% for the bottom 10%. In addition this trend has been

229
This project has received funding from the European Union’s Seventh Framework Programmefor research, technological development and demonstration under grant agreement no 266800
repeated in non-wage income where, “inequality in the distribution of... capital
income, and returns from savings increased... (And) income taxes and cash transfers
became less effective in reducing high levels of income inequality” (Ditto, p23).
These issues will be discussed in more detail below.
Such rising inequality has been attributed to globalization and technical change, both
arguably accompaniments to financialization, although evidence to support this
remains ambiguous. However there is a consistent finding that institutional and
regulatory structures are critical to income disparity (OECD 2011). In the UK, a
number of such factors can be considered in relation to financialization. Firstly,
clearly within finance itself and in the selected corporations, wages accelerated and
provided high-skilled, high wage employment. This was particularly marked for the
top earners.
At the bottom end of earners, and especial for the low skilled, protective structures
have been destroyed and replaced by neoliberal employment conditions. This
included the breakdown of traditional labour unions during the Thatcherite
governments and the development of “flexible labour markets” under successive
government legislation which removed protection for employees. The latter included
removable of restrictions on hiring and firing of employees, the introduction of
short-term temporary contract work and attacks on the minimum wage140. Overall
those at the bottom became increasing insecure in their work and subject to low
wages with little bargaining power to increase wages and improve conditions.
The second aspect of inequality is asset inequality. Assets not only given immediate
use value, but also provide a form of long term security and savings. As illustrated in
Figure 4-8 below, which shows the dispersion of net assets in the UK, asset
inequality has increased, and largely relates to house price inflation. Asset
inequality has also been increased by those able to invest in financial investments
and pensions and, as share markets surged, these provided further capital gains.
140 Introduced by the Labour Government in 1998.
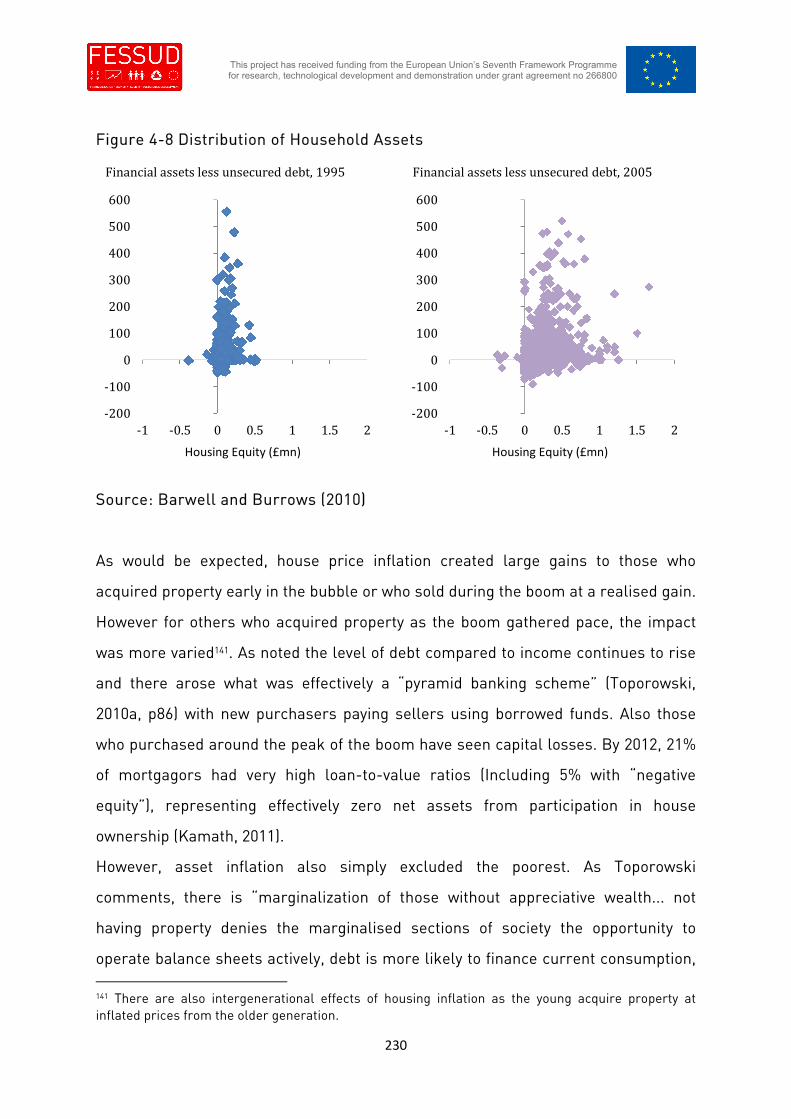
230
This project has received funding from the European Union’s Seventh Framework Programmefor research, technological development and demonstration under grant agreement no 266800
Figure 4-8 Distribution of Household Assets
Source: Barwell and Burrows (2010)
As would be expected, house price inflation created large gains to those who
acquired property early in the bubble or who sold during the boom at a realised gain.
However for others who acquired property as the boom gathered pace, the impact
was more varied141. As noted the level of debt compared to income continues to rise
and there arose what was effectively a “pyramid banking scheme” (Toporowski,
2010a, p86) with new purchasers paying sellers using borrowed funds. Also those
who purchased around the peak of the boom have seen capital losses. By 2012, 21%
of mortgagors had very high loan-to-value ratios (Including 5% with “negative
equity”), representing effectively zero net assets from participation in house
ownership (Kamath, 2011).
However, asset inflation also simply excluded the poorest. As Toporowski
comments, there is “marginalization of those without appreciative wealth... not
having property denies the marginalised sections of society the opportunity to
operate balance sheets actively, debt is more likely to finance current consumption,
141 There are also intergenerational effects of housing inflation as the young acquire property atinflated prices from the older generation.
-200
-100
0
100
200
300
400
500
600
-1 -0.5 0 0.5 1 1.5 2
Financial assets less unsecured debt, 1995
Housing Equity (£mn)
-200
-100
0
100
200
300
400
500
600
-1 -0.5 0 0.5 1 1.5 2
Financial assets less unsecured debt, 2005
Housing Equity (£mn)

231
This project has received funding from the European Union’s Seventh Framework Programmefor research, technological development and demonstration under grant agreement no 266800
rather than acquisition of inflatable assets... An unequal distribution of income is
thus enhanced by a growing distinction between the “balance sheet” rich and the
“balance sheet” poor”. (Toporowski, 2010a, p95). This marginalization is further
deepened by the shift in the distribution and amount of debt in the 200s, with those in
lower socio-economic groups, not only failing to acquire inflating assets, but seeing
rising levels of debt. By 2005, 9% of renters had unsecured debts in excess of their
pre-tax annual incomes and 50% of them reported their debt repayments to be a
burden. (Waldron & Young, 2006). Thus asset inequality was double edged for the
poor who both failed to acquire inflating assets and who incurred disproportional
debt. Asset inequality is also discussed further below.
4.7.2 Income Inequality: Labour Share, “Waged” Elites and Bonuses
The basic argument proposed, that declining labour power relative to capital has
resulted in increasing inequality, can be examined by examining patterns of national
income split between labour, capital and “other”, where the later represents mainly
unearnt income such as rents and dividends. This data is, in fact, consistent with
this, as illustrated in Figure 4-9 and Figure 4-10 below for 1970 to 2009. As can be
seen, all income sources grew with total national income over the period. However
shares of national income shifted with labours share declining from an average of
60% in the 1970s to an average of 52% in the 2000s. Comparative increases were
seen in both corporate income and other income which has average shares of 29%
and 11% respectively in the 1970s, increasing to an average of 35% and 12% in the
2000s.

232
This project has received funding from the European Union’s Seventh Framework Programmefor research, technological development and demonstration under grant agreement no 266800
Figure 4-9 Share of national income by income components (1970-2011):
Absolute terms
Source: ONS
Figure 4-10 Share of national income by income components: (1970-
2011)Percentage terms
Source: ONS
-
200,000
400,000
600,000
800,000
1,000,000
1,200,000
1,400,000
1,600,000
1,800,0001
97
0
19
73
19
76
19
79
19
82
19
85
19
88
19
91
19
94
19
97
20
00
20
03
20
06
20
09
£m
illi
on
s
Other income
GOS of corporations
Compensation of employees
0%
10%
20%
30%
40%
50%
60%
70%
80%
90%
100%
£m
illi
on
s
Other income
GOS of corporations
Compensation of employees

233
This project has received funding from the European Union’s Seventh Framework Programmefor research, technological development and demonstration under grant agreement no 266800
However ever within this shift in income distribution away from labour, income
within labour also undertook significant changes during the period of
financialization. Firstly overall basic income inequality increased. This is illustrated
in Figure 4-11 below, showing the Gina coefficient, the standard measure of income
inequality, for the UK. Overall, the Gini coefficient, has risen since 1980. The period
of accelerating inequality was, however, concentrated in the 1980s and peaked in
1999, declined slightly to 2004 before again increasing. Notable, therefore, is that
most of the increase in the Gini coefficient took place prior to 1994, and thus did not
take place during the most intense period of financialization.
Figure 4-11 UK Gini coefficients 1977-2011
Source: ONS
This trend is at odds with the expectation that financialization is closely associated
with rising inequality. However, when a more detailed breakdown of trends is
examined a different pattern emerges. Firstly, within the bottom and top deciles an
42.0
44.0
46.0
48.0
50.0
52.0
54.0
19
81
19
82
19
83
19
84
19
85
19
86
19
87
19
88
19
89
19
90
19
91
19
92
19
93
/94
19
94
/95
19
95
/96
19
96
/97
19
97
/98
19
98
/99
19
99
/00
20
00
/01
20
01
/02
20
02
/03
20
03
/04
20
04
/05
20
05
/06
20
06
/07
20
07
/08
20
08
/09
20
09
/10
20
10
/11

234
This project has received funding from the European Union’s Seventh Framework Programmefor research, technological development and demonstration under grant agreement no 266800
extreme pattern of rising inequality has emerged. As illustrated below in Figure
4-12142, from 1970, throughout the period of financialization, there has been a
continual increase in the share of wages accruing to the top decile and a continual
decline in that accruing to the bottom decile. In 1970 the top received 22.4% of labour
income and this then rose consistently throughout the period, reaching 29.6% by
2008. For the bottom decile, however, its share of labour income consistently fell
from 3.4% in 1970 to 2.5% by 1990 before becoming broadly stable for the remaining
years to 2008. Overall the bottom deciles share of national income declined and then
stagnated. By contrast the top deciles share continually grew, accelerating away
from both the bottom and the middle deciles.
Figure 4-12 Shares in total wages for top and bottom decile earners
Source: Bell & Reenen, 2010 (Secondary source: Post 2008 not available)
This pattern of rising inequality driven by increasing share of income accruing to the top
earners can be further analysis to see the pattern of change within the top decile. Figure
4-13 below shows how the huge gains of the top decile, in fact, are even more concentrated
142 Figures are based on tax return and are pre-tax income on an annual basis.

235
This project has received funding from the European Union’s Seventh Framework Programmefor research, technological development and demonstration under grant agreement no 266800
within that decile, with the top 1% and top 0.1% continually increasing their share of national
income (With a slight drop during the financial crisis). As illustrated in Figure 4-13, the end
result of these trends is that, by 2008, the top 1% and 0.1% of earners were receiving 15%
and 6% of all national income respectively.
Figure 4-13 Share of National Income of Top 1% and Top 0.1% of Earners (ONS
basis)
Source: Alveredo et al, 2011. (Secondary source: 2011 not available)
In considering these trends, it is clear that in examining the impact of financialization
on shares of national income, it is necessary to differentiate between “labour” within
the economy. As noted, the situation for those in the bottom was a decline and then
stagnation of their share of income. In examining the argument that financialization
has reduced the power of labour, it is these workers where this argument seems
most relevant as, typically, low paid jobs are low skilled jobs and it is these workers
who have been most impacted by issue related to financialization and neoliberalism,
such as decline and destruction of trade unions and the rise of unregulated and
casualised labour markets.
2
4
6
8
10
12
14
16
1990199219941996199820002002200420062008
%o
fN
ati
on
al
Inco
me
Top 1%
Top 0.1%

236
This project has received funding from the European Union’s Seventh Framework Programmefor research, technological development and demonstration under grant agreement no 266800
However at the very top end of “labour” are in fact workers who have been highly
successful in capturing an increasing share of national income. When this top decile
is then decomposed by industry, it is shown that these workers are highly
concentrated in financial services and related business services143. Tax based
studies show that 72% of gains in national income by the top decile from 1998 to
2007 were captured by finance workers with a further 53% being captured by related
business services. Thus a total of 125%144 of the gains in income in this top decile
accrued to those workers involved in financialization.
4.7.3 The Role and Extent of Bonuses in Inequality
This trend of rising inequality was accentuated by bonuses and particularly bonuses
in financial services and related industries. Bonuses are made across the wage
distribution, with on average 38% of workers receiving one in 2008. However in the
top of the distribution 63% of workers received a bonus in 2008 and a huge 82% for
the top percentile. Of this, 25% of all earning to top decile finance workers was in the
form of a bonus but 51% of earnings of top 1% finance workers was received as
bonuses. By the end of the decade to 2008, the top decile received £20 billion more
over and above a proportional increase of the total wages and, of this £12bn was
received by financial sector workers. The vast majority of this was received as bonus
payments (Bell & Reenan, 2010; Bell & Reenan completed a detail study of wage
inequality, calculating the bonus component from samples of tax returns, which
gives a more accurate figure that other sources as it includes, for example, share
option elements).
This bonus culture is largely focused in the financial services and related industries
plus top executives at some large corporations. Bell and Rennan comment “almost
the entire increase in wage inequality over the last decade is a result of increased
143 Mainly accounting, law and management consulting, whose major UK client are within the financialservices industry.144 The figure is above 100% as a number of industries saw falls in shares of national income withinthe top decile. This included public administration, education and manufacturing.

237
This project has received funding from the European Union’s Seventh Framework Programmefor research, technological development and demonstration under grant agreement no 266800
bonuses going to workers at the top of the wage distribution... (and) large bonus
payments are almost the exclusive preserve of the financial sector” (Ditto, p10). In
fact they found 60% of the rise in the income share of the top decile was received by
finance workers who represented 12% of the workforce numerically. Further the
Bank of England also commented on the trend, “Of course the growth in those
bonuses is contributing to the widening inequality... This is not just true of the City ...
The average CEO in the United Kingdom earns around 100 times more than the
average worker” (Gieve, 2007, Bank of England speech).
4.7.4 Asset Inequality
These trends for income are also repeated in asset ownershipwith similar trends –
rising inequality and extreme tails of wealth in the upper 1% - apparent in asset
inequality. In 2010, aggregate total wealth of all private households in the UK was
£10.3 trillion and the Gini coefficient for wealth was 0.61. As the Gini coefficient
indicates, wealth was highly unequally distributed. The top decile of households held
£4.5 trillion or 44% of wealth, making them was 4.3 times wealthier than the bottom
50 per cent of households combined. The top two deciles owned 62 per cent of all
wealth or £6.4 trillion and held 92 times the wealth of the bottom two deciles which
amounted to a mere £0.06 trillion. (Source: ONS). These figures are illustrated in
Figure 4-14 below.

238
This project has received funding from the European Union’s Seventh Framework Programmefor research, technological development and demonstration under grant agreement no 266800
Figure 4-14 Total aggregate wealth: by deciles, 2010 £ Million
Source: Wealth and Assets Survey (Latest 2010 shown), Office for National
Statistics
In fact by 2011, the median value for household total wealth was £232,000, with the
wealthiest averaging net worth of £2,870,000 and the bottom 10% less than £13,000,
making the average assets of the a individual in the top 10% 12 time richer than the
median and 216 times the average in the bottom decile. These figures are illustrated
in Table 4-1 below.
-500,000
0
500,000
1,000,000
1,500,000
2,000,000
2,500,000
3,000,000
3,500,000
4,000,000
4,500,000
5,000,0002
00
8/1
0
20
08
/10
20
08
/10
20
08
/10
20
08
/10
20
08
/10
20
08
/10
20
08
/10
20
08
/10
20
08
/10
1st 2nd3rd 4th 5th 6th 7th 8th 9th10th
Private pension wealth
Physical wealth
Financial wealth (net)
Property wealth (net)

239
This project has received funding from the European Union’s Seventh Framework Programmefor research, technological development and demonstration under grant agreement no 266800
Table 4-1 Wealth: averages for individuals within deciles, 2012 £ Million
Household Total Wealth Thresholds, Great Britain,
2008/10
Wealth Band Total Wealth (£)
Bottom 10% 13,000
50% 232,000
Top 10% 967,000
Top 1% 2,807,000
Source: Wealth and Assets Survey (Latest 2010 shown), Office for National
Statistics
In addition, and masked by the above aggregates, in 2010 nearly a quarter (24.3 per
cent) of households had negative net financial wealth. This included 13 per cent of
those individuals who belonged to the highest socio-economic group (Large
employers and higher managerial) and who were apparently income-rich but asset-
poor. However negative net worth was again concentrated in the lower socio-
economic groups with 33 per cent of individuals, who were in the ‘never worked or
long term unemployed’ socio-economic group having not just nothing, but negative
net worth. (Source: ONS)
As noted in the UK Country study, a major factor in these high levels of asset
inequality have been the property price inflation and related borrowing and
unsecured, typically consumer, borrowing which have been fundamental structural
aspects of financialization. In the lower socio-economic class where unsecured
borrowing is concentrated, borrowing against zero assets can obviously lead to
negative net worth, especially in situations where low absolute income makes
repayment of debt difficult. In the upper classes however, negative net worth is likely
to relate to borrowing including mortgages and consumer credit. In relation to
mortgages, 21% of all mortgagors had low or negative loan-to-value ratios by 2012
as property prices declined (Source: Kamath, 2011). In addition those with high
incomes are also able to access high levels of unsecured borrowing based upon
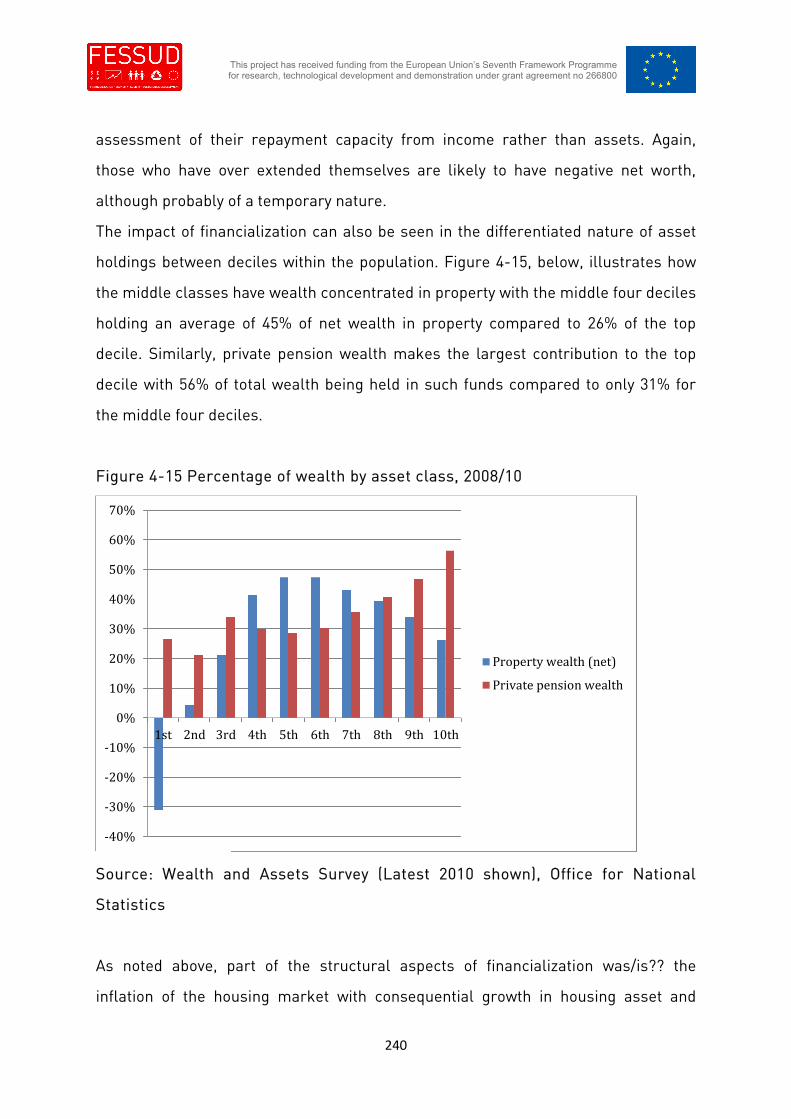
240
This project has received funding from the European Union’s Seventh Framework Programmefor research, technological development and demonstration under grant agreement no 266800
assessment of their repayment capacity from income rather than assets. Again,
those who have over extended themselves are likely to have negative net worth,
although probably of a temporary nature.
The impact of financialization can also be seen in the differentiated nature of asset
holdings between deciles within the population. Figure 4-15, below, illustrates how
the middle classes have wealth concentrated in property with the middle four deciles
holding an average of 45% of net wealth in property compared to 26% of the top
decile. Similarly, private pension wealth makes the largest contribution to the top
decile with 56% of total wealth being held in such funds compared to only 31% for
the middle four deciles.
Figure 4-15 Percentage of wealth by asset class, 2008/10
Source: Wealth and Assets Survey (Latest 2010 shown), Office for National
Statistics
As noted above, part of the structural aspects of financialization was/is?? the
inflation of the housing market with consequential growth in housing asset and
-40%
-30%
-20%
-10%
0%
10%
20%
30%
40%
50%
60%
70%
1st 2nd 3rd 4th 5th 6th 7th 8th 9th 10th
Property wealth (net)
Private pension wealth

241
This project has received funding from the European Union’s Seventh Framework Programmefor research, technological development and demonstration under grant agreement no 266800
related mortgages. In addition private pensions replaced social welfare provisions of
pensions. The asset holdings of different deciles of wealth probably reflect the
prioritising of the acquisition of property in rapidly inflating markets by the middle
classes. This can be seen not only in the high level of primary home ownership with
68% of the population owing their own homes but, especially amongst the middle
classes, increasing levels of secondary holdings of property with 10.1% owing
secondary properties in the UK by 2010 including 6% with second UK or foreign
home and 3.6% owing buy-to-let properties (Source: ONS). Indeed the lack of
acquisition of pension funds by the middle classes may not only reflect the
prioritisation of property and frenzied leveraging in inflating markets prior to 2007,
but a culture that promoted a belief in an eternally inflating housing market which
would provide long term security including and replacing a pension.
However for those with huge surplus incomes such as in the top decile and
especially the top 1%, diversification away from property into pension and other
financial assets becomes possible and desirable and this then take surplus funds. It
should be noted too that for top tax payer’s pension funds provided huge tax breaks
with assets being able to be fully sheltered from tax when directed to pension funds.
This includes funds whose primary asset is property. This for the top earners
pension funds were very attractive vehicles for storing assets and avoiding taxation.
Finally however, both asset, but particularly income, inequality, needs to consider
the impact of distributive policy including taxation and welfare provisions. Obviously
such polices can be significantly redistributive. However in the period of
financialization from 1980 to 2010 there is little impact. Taxation was broadly neutral
in relation to redistribution, with direct taxes reducing inequality, as measured by
the Gini coefficient, by an average of 3 percentage points and indirect taxes
increasing inequality by an average of 4 percentage points during the period. There
was a positive impact caused by the effects of cash benefits which reduced
inequality, as measured by the Gini coefficient, by an average of 15 percentage points
over the period. However the study also found that, from 2004, the impact of benefits

242
This project has received funding from the European Union’s Seventh Framework Programmefor research, technological development and demonstration under grant agreement no 266800
was significantly reduced and that the reduction in inequality was highly
concentrated in the retired due to their receipt of state pensions and other benefits
(Source: Anyaegbu, 2011). Overall taxation and social welfare effects acted to
increase inequality, leaving behind those in non-retired, low income groups.
Overall, to summarise the pattern of inequality in the UK during the period of
financialization, it would be characterised by rising income and asset inequality.
However this rising inequality is most distinguished by the rise, within this broad
pattern of rising inequality between the lower and middle classes, by a very level of
highly concentration of wealth and income in not only the top 10% of the population
but the top 1%. This is true both of income and assets. Factors that link this rising
inequality to financialization and neoliberalism include the stagnation of wages gains
in the lower classes with the destruction of trade unions and protective legislation
and the impact of inflated housing markets and the middle classes passion to
acquire them. However it is also characterised by the simple factor of the huge
levels of compensation in the financial services industry including the rise of the
bonus culture, and the secondary effects of such huge levels of income into asset
acquisition. It’s this rise of a new elite capturing an ever greater share of national
income that is the essence of inequality driven by financialization.
4.8 The Assumption of Risk by Households
In addition to inequality, the UK has also seen rising insecurity during the period of
financialization, with the shift of risk from the state to individuals and households.
Underlying increasing insecurity has been “the financialization of daily life” (Martin,
2002). As discussed above , debt-financed consumption and asset speculation have
become a central activity of households. Martin comments that households have
begun “to think like capitalists” (p9-10). In the UK, family homes and pensions, once
the source of long term savings and security, have been objects for speculation and
for the generation of gains to finance both short and long term consumption.

243
This project has received funding from the European Union’s Seventh Framework Programmefor research, technological development and demonstration under grant agreement no 266800
In the short-term such behaviour has created financial insecurity with the huge
increases in household indebtedness creating “elevated distress levels” (Kamath,
2011, p309). For example, by 2010, 12% of the population reported financial
problems, including paying for basic needs such as accommodation and household
bills, and 7.5% were behind on bill and credit commitments. Distress also was far
higher in lower socio-economic groups. (Kamath, 2011). As illustrated in Figure 4-16
below, this is reflected in the surge in personal bankruptcies in the UK. Such
widespread, basic financial insecurity affected the wellbeing of individuals and
households.
Figure 4-16 Personal bankruptcies in the UK
Source: Bank of England.
However long-term insecurity has also been created, including in the provision of
pensions and health care. As part of the financialization of daily life, asset owning
classes are relying on inflation in long-term asset markets. However such reliance
is, in fact, the assumption of the long-term speculative risk of those markets. Should
inflation not continue or, as in Japan since 1990, long-term asset prices deflate,
debts may need to be serviced from income rather than credit operations with
0
20000
40000
60000
80000
100000
120000
19
90
19
91
19
92
19
93
19
94
19
95
19
96
19
97
19
98
19
99
20
00
20
01
20
02
20
03
20
04
20
05
20
06
20
07
Nu
mb
ers
of
Pe
rso
ns

244
This project has received funding from the European Union’s Seventh Framework Programmefor research, technological development and demonstration under grant agreement no 266800
assets. Long-term insecurity is, however, greatest for those marginalised from asset
ownership as not only do they have no speculative assets but the safety net provided
by the state, such as the National Health Service and state pensions, are being
minimised or dismantled by the neoliberal government (discussed further below).
Indeed by 2009, only 6.4 million people out of a UK population of 63 million, or about
10%, had a private pension plan (Source: ONS) and the proportion of the young able
to purchase property has declined.
4.9 Political Economy of Inequality and Insecurity
Inequality and instability have increased in the UK and have been the primary
processes in the “construction of consent” to neoliberalism. Firstly the wealthier
classes have become alienated from the welfare state. The previous welfare
functions of government to provide them with education, health care and pension
provision have been replaced by the “emergence of inflated property and financial
asset markets as a “welfare state of the middle classes... (which) socialise the
financial liabilities of those owning such assets” (Toporowski, 2010, p.94). Property
owing classes cross-insure themselves through asset markets and the liquidity and
inflation of those markets for their welfare and future consumption needs. “This has
had the political consequence of alienating those with property from a welfare state
system for which they pay but from which they derive little benefit. This
disconnection lies behind the middle class taxpayers demand to reduce the cost of
that welfare state by concentrating state benefits more narrowly on “those in need”.
In its turn such constriction reinforces that middle classes alienation from the state
system” (ibid). The political consequence has been acceptance of the neoliberal
agenda of dismantling the welfare state currently being enacted by the Tory
government.
In addition it has allowed the development of “state-administered social welfare as a
system for prosecuting the poor” (Toporowski, 2010a, p95) where “minimum income
is increasingly delivered with a degree of institutional bullying and hectoring,

245
This project has received funding from the European Union’s Seventh Framework Programmefor research, technological development and demonstration under grant agreement no 266800
ostensibly to make welfare claimants more active in securing their financial
independence”. Reminiscence of the Victorian poor houses, it has become
acceptable to punish the poor through provision of apparent assistance. “The
selective penalization of those without property or income is a natural consequence
of a state welfare system that is no longer comprehensive because the middle class
is increasingly opting out of it” (ibid).
Summarising Toporowski (2010a, p.96) comments, “Financial inflation is therefore
no mere temporary departure from equilibrium in a standardised model of
capitalism. It changes the character of capitalism and the range of choices that
firms, individuals and households face. An enhanced option to consume without
income is brought at the cost of financial instability, industrial decadence and
regressive social values”.
Three decades ago it was noted that the peculiarity of British capitalism is its
combination with a position as a financial intermediary in the international financial
system (Coakley and Harris 1983). This created not only an unique relationship with
British non-financial businesses, but also British asset-owning households. The
result is not so much a financial system that serves British people and British
enterprise, but a British economy that is perhaps more vulnerable than any other
one to the conjuncture in its financial markets.

246
This project has received funding from the European Union’s Seventh Framework Programmefor research, technological development and demonstration under grant agreement no 266800
5 Bibliography
ABFA(2012), Economic Report, Issue No 8, (2011Q3-2011Q4)
Allen, G., (2001), The Private Finance Initiative (PFI), Economic Policy and Statistical
Section, Research Paper 01/117
Anyaegbu, G. (2010), The effects of taxes and benefits on income inequality, 1980–
2009/10, Office for National Statistics
Arestis, P. (2011), The Financial Crisis: Origins and Implications Palgrave Macmillan:
Basingstoke.
Allen, G., (2001), The Private Finance Initiative (PFI), Economic Policy and Statistical
Section, Research Paper 01/117
Bailey, A., (2011), Promoting a prudent and stable financial system, s.l.:
http://www.bankofengland.co.uk/publications/Documents/speeches/2011/speech53
4.pdf.
Bagaria N., et al, (2012), Fiscal Consolidation During A Depression [Report]. -
London School of Economics, Centre for Economic Performance, 2012.
www.lse.ac.uk
Bain, K., and Howells, P.,(2007), Financial Markets and Institutions, Prentice Hall, 5th
edition.
Balling, M., (2009), Productivity in the Financial Services Sector, SUERF STUDIES
2009/4
Bank for International Settlements, Quarterly reviews, various, http://www.bis.org/
Bank for International Settlements, (2002), The Transformation of the Financial
Services Industry, s.l.: http://www.bis.org/fsi/fsipapers02.pdf.
Bank for International Settlements, (2001), G10 Report on Consolidation in the
Financial Sector, s.l.: http://www.bis.org/publ/gten05.pdf.
Bank for International Settlements (BIS), (2005), Report on Consolidation in the
Financial Sector, s.l.: http://www.bis.org/publ/gten05ch2.pdf.

247
This project has received funding from the European Union’s Seventh Framework Programmefor research, technological development and demonstration under grant agreement no 266800
Bank of England, (2011), Papers for “Workshop for heads of financial stability:
challenges to financial stability - 23 to 25 March 2011”:
http://www.bankofengland.co.uk/.
Bank of England, Various. Annual Report, s.l.: http://www.bankofengland.co.uk/.
Bank of England, Various. Financial Stability Report, s.l.:
http://www.bankofengland.co.uk/.
Bank of England, Various. Inflation Report, s.l.: http://www.bankofengland.co.uk/.
Bank of England (2012), Financial Stability Report June 2012,
http://www.bankofengland.co.uk/publications/Pages/fsr/2012/fsr31.aspx
Bank of England (2003), The EU Financial Services Action Plan: a guide, Quarterly
Bulletin Autumn 2003
Bank of England (2008), Does sterling still matter for monetary policy? , Quarterly
Bulletin 2008 Q2
Bank of England (2000), Finance for small firms, A Seventh Report, London
Bank of England (1999), Finance for small firms, A Sixth Report, London
Bank of England, (2009), Trends in Lending, August.
Barwell R., and Burrows, O. (2010), ‘Growing Fragilities? Balance Sheets in the Great
Moderation’, Bank of England Financial Stability Paper No. 10, London.
Bell, B. & Reenan, J. (2010), Bankers pay and extreme wage inequality in the UK,
http://eprints.lse.ac.uk/28780/1/cepsp21.pdf
Bernanke, B. (2004). The Great Moderation , s.l.: FDR Remarks by Governor Ben S.
Bernanke at the meetings of the Eastern Economic Association, Washington, DC .
Bernstein, G., (2011), The Myth of Decline: The Rise of Britain since 1945, Random
House
BDRC Continental.(2011), SME Finance Monitor Survey, November 2011
Bird, G., (1989), Commercial Bank Lending and Third World Debt. London:
MacMillan.
BIS (2005), ‘Fundamental Causes of Consolidation’ Bank for International
Settlements 2005 Basle.

248
This project has received funding from the European Union’s Seventh Framework Programmefor research, technological development and demonstration under grant agreement no 266800
BIS(2011), The UK and the Single Market, Trade and Investment Analytical Papers,
Topic 4 and 18, Department for international Development
BIS and CEPR (2012), Twenty Years On, The UK and the Future of the Single Market,
HM Government
BIS, (2009), The Supply of equity finance to SMES: Revisiting the "equity gap", A
Report to the Department for Business, Innovations and Skills (BIS), SWQ
Consulting
BIS., (2012a), SME Access to External Finance, BIS Economic Paper No.16
BIS., (2012b), Boosting Finance Options for Business Basle
BIS., (2011), BIS Small Business Survey 2010, IFF Research
Briault, C., (1999), The Rationale for a Single National Financial Services Regulator,
Occasional Paper Series 2, FSA
Blackburn, R. (2006), ‘Finance and the Fourth Dimension’, The New Left Review,
Volume 39 pp. 39-70.
Blackburn, R. (2008), The Sub-Prime Crisis. The New Left Review, Volume 50 pp. 63-
106.
Brancaccio, E. &. G.Fontana, (2011). The conventional views of the financial crisis: A
critical assessment. In: P. Arestis, R. Sobreira and J.L. Oreiro (eds.), The Financial
Crisis: Origins and Implications. Basingstoke: Palgrave Macmillan, pp. p39-62.
Buckle, M & Thompson, J. (2004), The UK Financial System: Theory and Practise.
Manchester: Manchester University Press.
Burgess, S., (2011), ‘Measuring financial sector output and its contribution to UK
GDP’, Bank of England Quarterly Bulletin September.
Cao, J., (2012), Banking Regulation and the Financial Crisis. London & New York:
Routledge.
CEBR (2004), The City’s Importance to the EU Economy 2004, Corporation of London
Christian Aid, 2011. Christian Aid Week report, s.l.:
http://www.christianaid.org.uk/resources/policy/christian-aid-week-report-
2011.aspx.

249
This project has received funding from the European Union’s Seventh Framework Programmefor research, technological development and demonstration under grant agreement no 266800
City of London (2010), The City’s Role in Providing for the Public Equity Financing
Needs of UK SMEs, URS
City of London (2011) Creating jobs, powering growth, Financial Services in the UK.
Coakley, J and Harris, L., (1983), The City of Capital, Basil Blackwell
Cosh, A., Hughes, A, Singh, A., Carty, J. and Plender, J. (1990) "Takeovers and short-
termism in the UK." Institute for Public Policy Research, Industrial Policy Paper No.3
Cosh, A.D., Conn, R, & Guest, P.M. & Hughes, A. (2003) 'The Impact on U.K. Acquirers
of Domestic, Cross-border, Public and Private Acquisitions', Centre for Business
Research Working Paper 276.
Cooper, I. P. &. S., (2000). Private Equity: implications for financial efficiency and
stability, s.l.: Bank of England.
Council of Mortgage Lenders (2009), Homeowner housing equity through the
downturn, CML Housing Finance Issue 01 2009.
http://www.cml.org.uk/cml/publications/research
CRESC, (2009), An Alternative Report on UK Banking Reform, University of
Manchester: CRESC.
Folkman, P., Froud, J., Johal, S., and Karel, W., (2009), An alternative report on UK
banking reform, CRESC
Folkman, P., Froud, J., Johal, S., and Karel, W., (2006), Working for themselves?:
Capital market intermediaries and present day capitalism, CRESC , Working Paper
No. 25
Franklin, A et al, (2001), Comparing Financial Systems. Cambridge : MIT Press.
Damanpour, F. (1990), The Evolution of Foreign Banking Institutions in the United
States, Greenwood Publishing Group
Davies, R. Et al, (1992). "Output, Productivity and Externalities - the Case of
Banking," Bank of England working papers 3, Bank of England.
www.bankofengland.co.uk

250
This project has received funding from the European Union’s Seventh Framework Programmefor research, technological development and demonstration under grant agreement no 266800
Davies, R. Et al., (2010), Evolution of the UK Banking Sector, s.l.:
http://www.bankofengland.co.uk/publications/Documents/quarterlybulletin/qb10040
7.pdf.
Davis, S. (2009). Banking in Turmoil: Strategies for Sustainable Growth. Basingstoke:
Basingstoke: Palgrave Macmillan.
Depository Trust and Clearing Corporation,(2008), Transforming the Syndicated Loan
Market, A White Paper to the Industry New York
EEF(2012), Finance For Growth: Increasing Competition in SME Banking London.
Edwards, P, et.al.(2004), Evaluating the operations of PFI in roads and hospitals,
Research report No 84, Certified Accountants Educational Trust
European Policy Forum (2011), Learning the lesson of PFI securing lifecycle finance
for public services, The Infrastructure Forum
Epstein, G., (2005), Financialization and the World Economy Cheltenham: Edward
Elgar.
Erturk, I., (2008), Cultural Economy: Narrative and Performative Discrepancies New
York: Routledge.
Erturk, I., (2008), ‘Political Economy: Accumulation and Innovation’ in I. Erturk, J.
Froud, S. Johal and A. Leaver (eds.) Financialization at Work New York: Routledge.
Erturk, I., Froud J., Johal, S., Leaver, A, Moran, M., and Williams, K, (2011), City State
against national settlement; UK economic policy and politics after the financial
crisis, CRESC, Working Paper No. 101
Engelen, I. Et al., (2008), Financial Innovation: Frame, Conjuncture and Bricolage,
University of Manchester: CRESC Working Paper No. 59.
Engelen, I. Et al., (2011), Misrule of Experts? The Financial Crisis as Elite Debacle,
University of Manchester: CRESC Working Paper No. 94.
European Commission, 2005, Report on EU Banking Structures:
http://www.ecb.int/pub/pdf/other/eubankingstructure102005en.pdf
Fell, L., (2000), An Introduction to Financial Products and Markets, Cengage
Learning EMEA

251
This project has received funding from the European Union’s Seventh Framework Programmefor research, technological development and demonstration under grant agreement no 266800
Financial Services Authority, (2006), Private Equity: A Discussion of Risk and
Regulatory Engagement, s.l.: http://www.fsa.gov.uk/pubs/discussion/dp06_06.pdf.
London: Financial Services Authority.
Financial Services Authority, (2009), The Turner Review: A regulatory response to the
Global Banking Crisis, London: Financial Services Authority.
Financial Services Authority, (2011), Assessing the possible sources of systemic risk
from hedge funds, London: Financial Services Authority.
Financial Stability Board, (2011), Shadow Banking: Strengthening Oversight and
Regulation, s.l.: http://www.financialstabilityboard.org/publications/r_111027a.pdf.
Financial Times, December 14, 2012, “Lloyds hires FSA general council”,
www.ft.com
Fine, B., (2011). Economic Imperialism. In: Elgar Companion to Radical Political
Economy. Cheltenham: Edward Elgar.
Frazer, S., (2008), Small firms in the Credit Crisis: Evidence form the UK Survey of
SME Finances. Economic and Social Research Council, University of Warwick
Frazer, S., (2004), Finance for Small and Medium Enterprises, A Report on the 2004
UK Survey of SME Finance, University of Warwick
Froud, J., et al. (2011), Groundhog Day: elite power, democratic disconnects and the
failure of financial reform in the UK, University of Manchester: CRESC Working
Paper No. 108.
Fukuyama, F., (1992), The End of History and the Last Man. London: Penguin Group.
Glover, R., (2010), The Financialization of Social Life and the Socialization of Finance,
s.l.: http://richardrglover.files.wordpress.com/2011/03/financialization-of-social-
life-and-the-socialization-of-finance-2010.pdf.
Haldane, A. (2012), “On Being the Right Size, Speech,
http://www.bankofengland.co.uk/publications/Pages/news/2012/100.aspx
Hansard, n.d. s.l.: http://hansard.millbanksystems.com/.
Harvey, D., (2005), A Brief History of Neoliberalism. Oxford: Oxford University Press.
Hawkins, N., (2008), Privatization- Reviving the Momentum, Adam Smith Institute

252
This project has received funding from the European Union’s Seventh Framework Programmefor research, technological development and demonstration under grant agreement no 266800
Heffernan, Sh., (2009), Modern Banking, Wiley
Helleiner, K. G., (1997), Promoting Private Capital Flows and Handling Volatility: Role
of National and International Policies, Issue 35, Commonwealth Secretariat
Hewitt, A.,(2003), Asset Finance, Bank of England
HM Treasury, 2011. A New Approach to Financial Regulation: A Blueprint for Reform,
s.l.: http://www.hm-
treasury.gov.uk/d/consult_finreg__new_approach_blueprint.pdf.
HM Treasury and BIS(2010), Financing a private sector recovery.
http://www.bis.gov.uk/assets/BISCore/corporate/docs/F/10-1081-financing-private-
sector-recovery.pdf
HM Treasury, (2012), A new approach to financial regulation: securing stability,
protecting consumers
Hodge, A., G., (2006), Privatization and Market Development: Global Movements in
Public Policy Ideas, Edward Elgar Publishing
House of Commons, Treasury Committee, (2011), Competition and choice in retail
banking, s.l.:
http://www.publications.parliament.uk/pa/cm201011/cmselect/cmtreasy/612/612i.p
df.
House of Commons, Treasury Committee (2006), European financial services
regulation: seventh report of session 2005-06
House of Commons Treasury Committee (2009), Banking crises dealing with the
failure of UK banks, Seventh Report of Session 2008-09
Independent Commission on Banking, (2011). Final Report: Recommendations, s.l.:
http://bankingcommission.s3.amazonaws.com/wp-content/uploads/2010/07/ICB-
Final-Report.pdf.
Investment Management Association (IMA), (2010), Asset Management in the UK
2009-2010, The IMA Annual Survey
IMF, (2007), Global Financial Stability Report, Washington: International Monetary
Fund.

253
This project has received funding from the European Union’s Seventh Framework Programmefor research, technological development and demonstration under grant agreement no 266800
Jones, G., (1993), British Multinational Banking 1830-1990. Oxford: Clarenden Press.
Joyce, R. and Sibieta, L. (2013) ‘An assessment of Labour’s record on income
inequality and poverty’ Oxford Review of Economic Policy vol. 29, No. 1, pp. 178-202.
Kamath, K., et al. (2011), ‘The financial position of British households: evidence from
the 2011 NMG Consulting survey’ Bank of England Quarterly Bulletin, December.
Kay, J.,(2012), The Kay review of UK equity markets and long-terms decision making,
Final Report, BIS
Kindelberger, C. (2005), Manias, Panics and Crashes: A History of Financial Crises,
John Wiley & Sons
Koolhaus, R. Et al, (2002), Harvard Guide to Shopping. New York: Taschen.
Langley, P., (2004), ‘In the Eye of the Perfect Storm: The Final Salary Pensions Crisis
and the Financialization of Anglo-American Capitalism’. New Political Economy Vol.
9 No 4 pp. 539-58.
Langley, P., (2007). ‘Uncertain Subjects of Anglo-American Financialization’. Cultural
Critique Vol. 65 pp. 67-91.
Langley, P., (2008), ‘Financialization and the Consumer Credit Boom’. Competition
and Change Vol. 12 No 2 pp. 133-147.
Logan, A., (2001), ‘The United Kingdom's Small Bank's Crisis of the Early 1990s:
What were the leading indicators of failure?’, Bank of England Working Paper No.
139, June.
London Economics, (2009)., The Importance of Wholesale Financial Services to the
EU Economy London.
Lucas, R., (2003), ‘Macroeconomic Priorities’, American Economic Review Vol. 93,
No.1, pp. 1-14.
Lund, M and Wright, J.,(1999), The financing of small firms in the United Kingdom,
Bank of England
Martin, R., (2002), The Financialization of Daily Life. Philadelphia: Temple University
Press.

254
This project has received funding from the European Union’s Seventh Framework Programmefor research, technological development and demonstration under grant agreement no 266800
Martin, R and Turner, D.,(2000) ‘Demutualisation and the Remapping of Financial
Landscapes’, Transactions of the Institute of British Geographers, New Series, Vol
25, No 2, pp. 221-241.
Mason, C, and Harrison, R., (2010), Annual Report on the Business Angel Market in
the United Kingdom: 2008/2009, Bank for International Settlements.
Meschi, M., (1997), Analytical Perspectives on Mergers and Acquisitions. A Survey,
Research Papers in International Business, Paper Number 5-97, South Bank
University
Min, W. E., and Elliot, J., (2004), The external balance sheet of the United Kingdom:
recent developments, Bank of England Quarterly Bulletin Winter 2004
Minsky, H. (2008), Stabilizing an unstable economy: McGraw-Hill Professional
Minsky, H. (1986), Global consequences of financial deregulation: The Marcus
Wallenberg papers on international finance
Mcfall, L., (2010), ‘Following the line of least resistance?: advertising, agencements
and crashes’, University of Manchester: CRESC Working Paper No. 84.
Mullineaux D. and Roten, I. (2000), Debt Underwriting by Commercial Bank-
Affiliated Firms and Investment Banks: More Evidence. http://papers.ssrn.com/
Michell, J. & Toporowski, J., (2012), ‘The Stock-flow Consistent Approach with Active
Financial Markets’ in D.B. Papadimitriou and G. Zezza (eds.) Contributions in Stock
Flow Modelling: Essays in Honor of Wynne Godley. Chippenham & Eastbourne:
Palgrave Macmillan, pp. p173-195.
Mongomerie, J., (2012), ‘Owning the Consumer—getting to the core of the Apple
business model’, University of Manchester, CRESC Working Paper No. 116.
Mongomerie, J., (2006), Financialization of the American Credit Card Industry,
Competition and Change, 10(3), 310-319
NESTA, (2007), Making money at early-stage: the challenge for venture capital in the
UK http://www.nesta.org.uk/library/documents/making-money-at-the-early-
stage.pdf

255
This project has received funding from the European Union’s Seventh Framework Programmefor research, technological development and demonstration under grant agreement no 266800
Nier, E., and Gondat-Larralde, C., (2004), ‘The Economics of Retail Banking - An
Empirical Analysis of the UK Market for Personal Current Accounts’, Bank of
England Quarterly Review No. 1, pp. 153-159.
OECD, (2011), An Overview of Growing Income Inequality in OECD Countries: Main
Findings, Paris: OECD.
Office of Fair Trading, (2008), Personal current accounts in the UK: An OFT market
study, s.l.:
http://www.oft.gov.uk/shared_oft/reports/financial_products/OFT1005.pdf.
Office of Fair Trading, (2010), Review of barriers to entry, expansion and exit in retail
banking, s.l.: http://www.oft.gov.uk/shared_oft/reports/
Oxfam, (2011), Averting Tomorrows Food Crisis: The European Union’s Role in
Delivering Food Justice in a Resource Constrained World, s.l.:
http://www.oxfam.org/sites/www.oxfam.org/files/bn-averting-tomorrows-global-
food-2005, crisis-010611-en_0.pdf.
Palley, T., (2007), ‘Financialization: What It Is and Why It Matters’, Working Paper No.
525, New York: The Levy Economics Institute at Bard College.
Pattani, A., Vera, G., and Wackett, J., (2011), Going public: UK companies’ use of
capital markets, Bank of England
Parker, D.,(2004), UK’s Privatization Experiment: The Passage of Time Permits a
Sober Assessment, CESifo Working Paper No 1126
Peck, J & Tickell A, (1994), Searching for a New Institutionalist Fix: The after‐Fordist
Crisis and the Global‐Local Disorder. In Amin, Ash. Ed. Post‐Fordism: A Reader.
Oxford: Blackwell
Petters, J.,(1986-87), Re-regulation of the financial services industry in the United
Kingdom,
https://www.law.upenn.edu/journals/jil/articles/volume10/issue3/Peeters10U.Pa.J.I
nt'lBus.L.371(1988).pdf
Pierrakis, Y, and Westlake, S., (2009), Reshaping the UK economy, The role of public
investment in financing growth, NESTA

256
This project has received funding from the European Union’s Seventh Framework Programmefor research, technological development and demonstration under grant agreement no 266800
Pilbeam, K., (2010), Finance and Financial Markets, 3d edition, Palgrave Macmillan
Senior, S., and Westwood, R.,( 2000), The external balance sheet of the United
Kingdom: implications for financial stability?, Bank of England, Quarterly Bulletin
November 2000
Quarry, J. et al. (2012), Perspectives on the UK retail banking market New York:
Oliver Wyman.
Reinold, K., (2011), Housing Equity Withdrawal Since the Financial Crisis, Bank of
England Quarterly Bulletin No. 2, pp. 127-133.
Reserve Bank of Australia, (1995), ‘Implications of the Barings Collapse for Bank
Supervisors’, Reserve Bank of Australia Bulletin November.
Robert, R, (2008), The City: A guide to London Global Financial Center, John Wiles &
Son, 2nd Edition
Robb, V., (1997), The Genesis of Regulation, Bank of England, Financial Stability
Review, Autumn 1997
Rogers, D., (1999), The Big Four British Banks: Organization, Strategy & the Future.
London: Macmillan Press.
Sassen S (2001), The Global City: New York, London, Tokyo, revised edition
(Princeton University Press, Princeton)
Schachter, B., (1997). Derivatives, Regulation and Banking. Amsterdam: Elsevier
Science.
Shaikh, A., (2012). ‘Three Balances & Twin Deficits: Godley vs Ruggles & Ruggles’ in
in D.B. Papadimitriou and G. Zezza (eds.) Contributions in Stock Flow Modelling:
Essays in Honor of Wynne Godley. Chippenham & Eastbourne: Palgrave Macmillan
pp. p125-135.
Stern, R et al, (2004), Japans lost decade: Origins, consequences and prospects for
recovery. Oxford: Blackwell Publishing.
Singh, D., (2007), Banking and Regulation of UK and US Financial Markets, Ashgate

257
This project has received funding from the European Union’s Seventh Framework Programmefor research, technological development and demonstration under grant agreement no 266800
Small Business Task Force (2012) An Enterprising Nation, Final Report London:
Labour Party.
Strange, S. (1980), Mad Money. Manchester: Manchester University Press
Strange, S. (1986), Casino Capitalism. Manchester: Manchester University Press,
1998
Stock J & M.Watson, J. (2002). Has the business cycle changed and why? NBER
Macroeconomics Annual, Vol 17.
Sudarsanam, S. (1995), ‘The Essence of Mergers and Acquisitions’, in Buckley, A.
(ed.), Prentice Hall International (UK) Limited, Hertfordshire.
Sudarsanam, S. (2003), Creating Value from Mergers and Acquisitions – The
Challenges, Pearson Education Group, Essex.
Taylor, M, and Tonks, I., (1989), The internationalization of Stock Markets and the
Abolition of U.K. Exchange Control, The Review of Economics and Statistics, Vol. 71,
No.2, pp.332-336
Tett, G., (2012), Fool's Gold: How Unrestrained Greed Corrupted a Dream, Shattered
Global Markets and Unleashed a Catastrophe. s.l.:Abacus.
TheCityUK(2012), Sovereign Wealth Funds,
www.thecityuk.com/assets/Uploads/SWF-2012.pdf
TheCityUK(2011), Hedge Funds, Financial Market Series
TheCityUK, (2012), Financial Market Series, Banking,
http://www.huntswood.com/documents/banking-2012.pdf
The All-Party Parliamentary Group for Building Societies and Mutual Funds, (2006),
Windfalls and Shortfalls? The true cost of demutualization,
http://www.bsa.org.uk/docs/consumerpdfs/windfallsorshortfalls.pdf
Thompson, M. B. (1998). The UK Financial System: Theory and Practise. Manchester:
Manchester University Press.
Thrift, N., (2001). ‘It’s the Romance, not the Finance, That Makes the Business Worth
Pursuing: Disclosing a New Market Culture’ Economy and Society Vol. 30 No. 4 pp.
412-432.

258
This project has received funding from the European Union’s Seventh Framework Programmefor research, technological development and demonstration under grant agreement no 266800
Thrift, N., (2008) ‘The New Economy and a new market Culture’ in I. Erturk, J. Froud,
S. Johal and A. Leaver (eds.) Financialization at Work. New York: Routledge.
Toporowski, J., (2005), Theories of Financial Disturbance. Cheltenham: Edward
Elgar.
Toporowski, J., (2008), ‚The Economics and Culture of Financialization’, SOAS
Department of Economics Working Paper No.158.
Toporowski, J., (2009). How the Global Crisis is Transmitted to Developing Countries.
24, Development Viewpoint.
Toporowski, J., (2010a). Why the World Economy Needs a Financial Crash and Other
Critical Essays on Finance and Financial Economics. London: Anthem Press.
Toporowski, J., (2012). ‘Neologism as Theoretical Innovation in Economics: The Case
of "Financialization"’. SOAS Department of Economics Working Paper No.171.
Toporowski, J., (2002), The End of Finance, Capital market inflation, financial
derivatives and pension fund capitalism, Routledge Frontiers of Political Economy
Toporowski, J.,(2009), Excess debt and asset inflation in S. Kates (ed.)
Macroeconomic Theory and its Failings Alternative Perspective on the Global
Financial Crisis, Cheltenham U.K. , Edward Elgar, pp. 221-234
Toporowski, J. (2010b) ‘Response to Consultation’ Independent Commission on
Banking.
UNISON, (2011), The role of private finance in public investment, A briefing by
UNISON, 2011
Veblen, T. (1899), The Theory of the Leisured Classes, MacMillan, New York
Vickers, J., and Yarrrow, G., (1991) ‘Economic Perspectives on privatization’, Journal
of Economic Perspectives, Vol. 5, No 2 pg. 111-132
Vickers, J., and Yarrow, G., (1998), Privatization: An Economic Analysis, MIT Press.
Vittas, D., (1997), Thrift Deposit Institutions in Europe and the United States. In:
Reforming Financial Systems: Historical Implications for Policy. Cambridge:
Cambridge University Press, pp.141-179.
259
This project has received funding from the European Union’s Seventh Framework Programmefor research, technological development and demonstration under grant agreement no 266800
Waldron M., and Young, G. (2006) ‘The state of British household finances: results
from the 2006 NMG research survey’ Bank of England Quarterly Bulletin No. 4.
Waldron, M and Zampolli, F. (2010), ‘Household debt, house prices and consumption
in the United Kingdom: a quantitative theoretical analysis’ Working Paper No. 379,
Bank of England
Wolfe, T., (1987), The Bonfire of the Vanities. New York: Vintage.
Westwood, R and Young, J.,(2002), The external balance sheet of the United
Kingdom: recent developments, Bank of England Quarterly Bulletin Winter 2002
Westwood, R., and Senior, S., (2000), ‘The external balance sheet of the United
Kingdom: implications for financial stability?’, Bank of England, Quarterly Bulletin
November 2000
Whittard,D., and Khan, J., (2010), ‘The UK’s international investment position’,
Economic & Labour Market Review, Vol.4, No. 6
Whittard, D., (2012), ‘The UK’s external balance sheet- the international investment
position (IIP)’, Office for National Statistics,
Wrigh, M., Speller, W., and Thwaites, G.,(2011), The future of international capital
flows, Bank of England, Financial Stability Paper No.12

260
This project has received funding from the European Union’s Seventh Framework Programmefor research, technological development and demonstration under grant agreement no 266800
Financialisation, Economy, Society and Sustainable Development (FESSUD) is a 10 million
euro project largely funded by a near 8 million euro grant from the European Commission
under Framework Programme 7 (contract number : 266800). The University of Leeds is the
lead co-ordinator for the research project with a budget of over 2 million euros.
THE ABSTRACT OF THE PROJECT IS:
The research programme will integrate diverse levels, methods and disciplinary traditions
with the aim of developing a comprehensive policy agenda for changing the role of the
financial system to help achieve a future which is sustainable in environmental, social and
economic terms. The programme involves an integrated and balanced consortium involving
partners from 14 countries that has unsurpassed experience of deploying diverse
perspectives both within economics and across disciplines inclusive of economics. The
programme is distinctively pluralistic, and aims to forge alliances across the social
sciences, so as to understand how finance can better serve economic, social and
environmental needs. The central issues addressed are the ways in which the growth and
performance of economies in the last 30 years have been dependent on the characteristics
of the processes of financialisation; how has financialisation impacted on the achievement of
specific economic, social, and environmental objectives?; the nature of the relationship
between financialisation and the sustainability of the financial system, economic
development and the environment?; the lessons to be drawn from the crisis about the
nature and impacts of financialisation? ; what are the requisites of a financial system able to
support a process of sustainable development, broadly conceived?’

261
This project has received funding from the European Union’s Seventh Framework Programmefor research, technological development and demonstration under grant agreement no 266800
THE PARTNERS IN THE CONSORTIUM ARE:
Participant Number Participant organisation name Country
1 (Coordinator) University of Leeds UK
2 University of Siena Italy
3 School of Oriental and African Studies UK
4 Fondation Nationale des Sciences Politiques France
5 Pour la Solidarite, Brussels Belgium
6 Poznan University of Economics Poland
7 Tallin University of Technology Estonia
8 Berlin School of Economics and Law Germany
9 Centre for Social Studies, University of Coimbra Portugal
10 University of Pannonia, Veszprem Hungary
11 National and Kapodistrian University of Athens Greece
12 Middle East Technical University, Ankara Turkey
13 Lund University Sweden
14 University of Witwatersrand South Africa
15 University of the Basque Country, Bilbao Spain
The views expressed during the execution of the FESSUD project, in whatever form and or bywhatever medium, are the sole responsibility of the authors. The European Union is notliable for any use that may be made of the information contained therein.
Published in Leeds, U.K. on behalf of the FESSUD project.