Embed Size (px)
Citation preview

LCP ACCOUNTING FOR PENSIONS 2014
2014 has ushered in a new era for UK pensions. Our 21st annual survey looks at how FTSE 100 companies are managing their pension liabilities and highlights opportunities for the future.

2
For further information please contact Bob Scott, Nick Bunch or the partner
who normally advises you.
This report may be reproduced in whole or in part, without permission,
provided prominent acknowledgement of the source is given. The report
is not intended to be an exhaustive analysis of IAS19. Although every
effort is made to ensure that the information in this report is accurate,
Lane Clark & Peacock LLP accepts no responsibility whatsoever for any
errors, or the actions of third parties. Information and conclusions are
based on what an informed reader may draw from each company’s
annual report and accounts. None of the companies have been contacted
to provide additional explanation or further details.
View a full list of our services at www.lcp.uk.com
© Lane Clark & Peacock LLP August 2014
We would like to thank those from LCP who have made this report possible:
Catriona Armstrong
Nick Bunch
Emma Colpus
Sophie Dapin
Laura Davies
Jeremy Dell
Catherine Drummond
David Everett
Charlie Finch
David Fink
Emma Ingham
Andrew Keenan
Holly Moffat
Simon Perera
David Poynton
Ella Purkiss
Charlotte Quarmby
Rebeccah Robinson
Max Root
Bob Scott
Natalie Stimpson
Alex Waite
Rachel Walton
Ken Willis
Charlotte Woods
Chris Wragg
2

LCP Accounting for Pensions 2014
p4 Foreword
p6 1. Main findingsp8 1.1 Deficits persist
p8 1.2 Major longevity swap and
buy-in transactions
p8 1.3 Companies continue to seek alternatives
to straight cash funding
p8 1.4 The 2014 Budget – a retirement revolution
p9 1.5 Collective defined
contribution schemes?
p9 1.6 More companies move to DC schemes
p10 1.7 Pension contributions down,
despite auto-enrolment
p10 1.8 After a pause, the flight from
equities continues
p11 1.9 Further challenges and
opportunities lie ahead
p12 2. A remarkable year for pensionsp14 2.1 The March 2014 Budget
p17 2.2 The defined ambition project
p20 3. Summary of main findingsp22 3.1 Introduction
p22 3.2 FTSE 100 pension liabilities exceed half a
trillion pounds
p23 3.3 Pension scheme funding
p25 3.4 More reductions in DB pension
provision
p27 3.5 De-risking
p30 3.6 Challenges and opportunities on the
horizon
p34 4. Accounting standards p36 4.1 New version of IAS19
p36 4.2 Disclosures overhauled
p37 4.3 Tail wagging the dog?
p38 5. Analysis of pension disclosuresp40 5.1 Introduction
p40 5.2 Analysis of results
p46 5.3 Key assumptions
p54 Appendix 1 - FTSE 100 accounting
disclosure listing
p58 Appendix 2 - FTSE 100 accounting
risk measures
p63 Appendix 3 - Summary of disclosed
non-cash funding arrangements
3

LCP Accounting for Pensions 2014
Foreword4
In some ways the pensions outlook – for individuals as well as companies – is as bright as it has been for many years.
Bob ScottPARTNER, LCP

5LCP Accounting for Pensions 2014
Foreword
The past 12 months have seen wider
pension coverage as “auto-enrolment”
takes effect for medium sized companies.
However, most new entrants have joined
defined contribution (DC) arrangements
and many have had no more than the
statutory minimum contributions from
their employers. With pension taxation
becoming ever more complex and with
companies facing additional costs when
“contracting-out” ends in 2016 this trend
is likely to continue.
Our survey shows that, despite FTSE 100
companies pumping more than
£100 billion into their pension schemes
over the past five years, most schemes
still do not have enough money to cover
their pension liabilities.
Yet in some ways the pensions outlook –
for individuals as well as companies – is
as bright as it has been for many years.
Following the 2014 Budget, people will
no longer be forced to use their
retirement savings to purchase an
annuity. And this change could benefit
companies who sponsor defined benefit
(DB) schemes if retiring individuals
decide to cash in their DB benefits to
take account of the new flexibilities.
This year has seen “buy-in” and longevity
swap transactions at levels not previously
contemplated. Most recently, BT Group
announced it had implemented a
£16 billion longevity swap. And a few
months earlier, the ICI Pension Fund
completed a £3.6 billion buy-in of
pensioner liabilities.
Finally, this year also saw a fall in the
level of cash contributions to FTSE 100
pension schemes, with the number of
companies adopting innovative ways
of providing security to their pension
schemes increasing markedly.
38 FTSE 100 companies disclosed some
form of security arrangement in their
2013 accounts.
So we see that members of pension
schemes can be better served whilst
companies find that their pension
scheme is less of a burden.
We hope that you find our analysis of
recent accounts useful and that, as we
go through 2014 and towards a general
election next year, things continue to
look up for the pensions industry as a
whole.
Fore
wo
rd
Welcome to our 21st annual survey of FTSE 100 companies’ pension disclosures.
Bob Scott

6
Contentp6 1. Main findingsp8 1.1 Deficits persist
p8 1.2 Major longevity swap and
buy-in transactions
p8 1.3 Companies continue to seek
alternatives to straight cash
funding
p8 1.4 The 2014 Budget – a
retirement revolution
p9 1.5 Collective defined
contribution schemes?
p9 1.6 More companies move to DC
schemes
p10 1.7 Pension contributions down,
despite auto-enrolment
p10 1.8 After a pause, the flight from
equities continues
p11 1.9 Further challenges and
opportunities lie ahead

Mai
n fi
ndin
gs
FTSE 100 pension contributions fell by £1.7bn in 2013 as a growing number of companies made use of alternative funding methods. 38 companies disclosed such arrangements in their 2013 accounts.
Bob Scott
Partner LCP
0
5
10
15
20
25
2007 2008 2009 2010 2011 2012 2013
£ b
illio
n
Employer contributions to pension schemes
Deficit contributions (DB schemes)
Employer service cost (DB schemes)
Employer DC costs

LCP Accounting for Pensions 2014
1. Main findings8
1.1 Deficits persist � We estimate that at the end of June 2014 the total UK IAS19 pension
deficit for FTSE 100 companies was £37 billion, compared to £43 billion
a year earlier.
� This reflects total assets of £475 billion, which represent about 93% of
liabilities valued at £512 billion.
1.2 Major longevity swap and buy-in transactions � Several companies have hedged some or all of their pension risk through
insurance contracts during the last year. For example, InterContinental Hotels Group insured all of its pension liabilities in July 2013 and the
ground breaking £3.6 billion ICI Pension Fund buy-in transaction has
demonstrated the market's capacity to undertake much larger buy-in
transactions than we have seen in the past.
� In March 2014 Aviva entered into a (then) record-breaking swap that
hedges longevity risk for around £5 billion of pension liabilities. In
July 2014 this was surpassed by BT Group announcing that it has
removed 25% of its longevity risk by setting up its own insurance
company and reinsuring the risk for liabilities valued at £16 billion.
1.3 Companies continue to seek alternatives to straight cash funding � Around 1 in 5 of the FTSE 100 companies that sponsor DB pension
schemes, including Capita and Johnson Matthey, have now disclosed
having put in place an asset backed contribution arrangement to fund
their pension scheme.
� These arrangements can provide additional security to the pension
scheme whilst avoiding the risk of a trapped surplus for the employer.
� Other companies have provided security in different ways. For example,
International Airlines Group has provided its pension schemes with
security over aircraft and Whitbread has provided security over
property.
1.4 The 2014 Budget – a retirement revolution � On 19 March 2014 George Osborne introduced major changes to the UK
pension system that have been hailed as the biggest reforms in nearly a
century.
� The main policy change – full flexibility in how pension savings built up
in DC pension plans are drawn – marks a major shift from the position
that has applied since 1921, when annuitisation was introduced as a
requirement to receive generous tax relief on pension savings.
� Already there is evidence that this has encouraged greater pensions
saving as individuals no longer perceive a pension plan as inflexible and
poor value.
20%The proportion of FTSE
100 companies with an
asset backed contribution
arrangement in place.

9LCP Accounting for Pensions 2014
1. Main findings
� The change is also likely to impact DB schemes as we expect to see an
increase in the number of retiring members transferring their benefits to
a DC scheme in order to take advantage of the new flexibilities.
� This will potentially reduce company pension liabilities and, over time,
may increase the number of schemes that can be bought out with an
insurance company.
� Several commentators have expressed concern that individuals will not
be able to manage their finances under the new regime. Some have
suggested that people will underestimate how long they will live and so
are likely to run out of money. Others have pointed to the high cost of
care in old age.
� To address this, the government has committed to providing free
guidance for all DC pension scheme members at the point of retirement.
� Determining exactly how this will work is one of the biggest challenges
the coalition faces before the election next year.
1.5 Collective defined contribution schemes? � A further change to the UK pension system announced in the Queen’s
speech on 4 June was that employers will be able to establish collective
pension schemes where investment (and other) risks are pooled across
the membership.
� Similar schemes have operated successfully in the Netherlands and
Denmark.
� With many UK companies having recently undertaken auto-enrolment
exercises, we are unlikely to see widespread adoption of such schemes
in the UK in the foreseeable future.
� However, this legislation does signify the government’s recognition that
collective schemes have a role to play in pension provision. Perhaps,
over time, we will see a reversal of the trend which, for many years, has
been away from collective provision.
1.6 More companies move to DC schemes � Nevertheless, for now, the trend is still away from collective schemes and
towards DC arrangements where there is no pooling of risks.
� During 2013 GKN closed its “hybrid” pension scheme – which offers a
combination of DB and DC benefits – to new recruits. This leaves only
four FTSE 100 companies providing any form of DB pension provision to
new employees.
� In addition, four more companies, BG Group, InterContinental Hotels Group, Sainsbury’s and Wolseley closed their DB pension schemes to
future benefit accrual. A further three companies, including HSBC and
Severn Trent, have reached agreement to do the same in the near future.
4FTSE 100 companies
providing any form of DB
pension provision to new
employees.
Mai
n fi
ndin
gs

LCP Accounting for Pensions 2014
1. Main findings10
� However, all large employers are now required to automatically enrol
employees into a work-based pension scheme. Whilst membership of
DB schemes has been declining, membership of DC pension schemes
has been increasing rapidly.
� Scottish & Southern Energy reports an employee participation rate in
its DC scheme of over 90% and Travis Perkins has said that only 2% of
employees have opted out of its pension arrangements.
� As a result, significantly greater numbers of employees are now
members of workplace pension schemes. The next challenge will be to
find ways of encouraging (or compelling) employers and employees to
pay contributions at a level sufficient to provide members with decent
outcomes in retirement.
1.7 Pension contributions down, despite auto-enrolment � This year has seen total pension contributions paid by FTSE 100
employers fall from £21.9 billion in 2012 to £20.2 billion in 2013.
� The decrease is largely due to a significant reduction in deficit
contributions for a small number of companies, such as BT Group, BAE Systems and Barclays that made very large contributions in previous
years.
� However, it also reflects the lower value of benefits currently being
provided to employees through DC schemes than were previously
provided in DB schemes.
1.8 After a pause, the flight from equities continues � Last year we saw an overall increase in the proportion of pension scheme
assets invested in equities. However, the long-term trend of switching
into assets that more closely match pension liabilities has been seen
again this year with a modest reduction in the overall equity allocation.
� A few companies made more significant changes to their pension
scheme investments during 2013 – for example, BG Group moved 23%
of its pension scheme assets from equities to bonds. Going against the
general trend, G4S increased its pension scheme’s allocation to equities
from 15% to 26%.
� Many companies, such as Bunzl and Rexam, have disclosed that they
have pre-agreed “triggers” in place with their pension schemes, with
assets automatically being switched from equities to bonds as the
funding level increases. We can therefore expect to see a continued
movement out of equities and into bonds in future years, as and when
funding positions improve.
£20.2bnof company pension
contributions in 2013, down
from £21.9 bn in 2012.

11LCP Accounting for Pensions 2014
1. Main findings
1.9 Further challenges and opportunities lie ahead Inflation measures � In November 2013 a new measure of inflation, RPIJ – which is
systematically lower than conventional RPI inflation – was granted the
status of "National Statistic".
� This increases the opportunity for companies to consider which measure
of inflation should be used in their pension schemes – and the potential
savings from making a change.
Scottish independence � Scottish independence could cause a pensions headache for some
companies.
� A "yes" vote on 18 September could result in pension schemes
operating "cross border" and being subject to more stringent funding
requirements.
� In addition, the attractiveness of Scottish Limited Partnerships, used for
most asset backed contribution arrangements, could reduce.
Pension taxation � Should we have a new government following next year’s general election
we could see further changes to pension scheme taxation.
� We wait to see what the various parties put in their manifestos but, over
recent months:
– Spokesmen for the Labour party have proposed that tax relief on
pension contributions should be limited to 20% and that the Annual
Allowance should be reduced from £40,000 to the level of national
average earnings (about £26,000).
– The Liberal Democrats have proposed that the Lifetime Allowance
– the maximum value of pension savings that can be made without
incurring additional tax charges – should be reduced from £1.25 million
to £1 million.
– Separately Steve Webb has indicated that he would like to see a
uniform level of pension tax relief – perhaps 30%.
Legislative changes � The ability to contract out of the state pension system comes to an end
in 2016. This will result in higher national insurance contributions for the
majority of employers that continue to provide a DB pension scheme
to their employees. This may result in further levelling down of pension
provision and more closures of schemes to future accrual.
� With a new European pension directive in the pipeline, UK schemes
could be subject to much more onerous governance and reporting
requirements in coming years.
2016The ability to contract out
of the state pension system
comes to an end.
Mai
n fi
ndin
gs

12
Contentp12 2. A remarkable year for pensionsp14 2.1 The March 2014 Budget
p17 2.2 The defined ambition project

No caps. No drawdown limits. Let me be clear: no one will have to buy an annuity.
George Osborne
19 March 2014
A r
emar
kab
le y
ear
for
pen
sio
ns

LCP Accounting for Pensions 2014
2. A remarkable year for pensions14
2. A remarkable year for pensionsGiven the volume of legislative and regulatory change already seen since
2010, companies might have hoped for some respite. Nevertheless, the
past 12 months have seen further significant changes and developments,
including:
� the elevation of RPIJ to the status of National Statistic;
� material risk transfers including the £3.6 billion ICI Pension Fund buy-in
and the £16 billion longevity swap by BT Group;
� a new funding code of practice;
� legislation enabling collective defined contribution schemes; and
� a proposal for a new European pensions directive.
We discuss these below and in greater detail in the following sections.
2.1 The March 2014 BudgetThe biggest single event in the past 12 months – possibly even in the
past 100 years – was George Osborne’s 19 March Budget. At a stroke, he
managed to deliver:
� a popular Budget which gives people the freedom to choose what they
do with their retirement savings;
� a boost to the pensions industry by making pension savings more
attractive; and
� a solution to the “annuity issue” which had been rumbling on for some
time.
All this with the prospect of accelerated payments to the Treasury if
people take their retirement savings as cash and therefore pay tax on the
proceeds.
No more compulsory annuitiesThe main policy change – full flexibility in how pension savings built up in
DC pension plans are drawn, marks a major shift from the position that has
applied since 1921, when annuitisation was introduced as a requirement to
receive generous tax relief on pension savings.
Whilst annuities will not disappear completely, it is uncertain how widely
they will be used in future. Evidence from overseas suggests that
relatively few individuals will continue to purchase annuities.

15LCP Accounting for Pensions 2014
2. A remarkable year for pensions
The requirement to purchase an annuity was at odds with many other
developed countries – such as the US and Australia – where individuals are
able to take their pension pot in full as cash. As a result the UK had the
largest annuity market in the world, with some statistics indicating that
over half of worldwide annuities are purchased here.
Insurers who saw their captive market shrinking materially overnight were
therefore hit particularly hard by the Budget announcements.
Variable retirement incomeThe Budget changes could, therefore, mark a turning point in how later
life is viewed. The concept of a single point of retirement, with a steady
income thereafter, may well become outdated.
Instead, we may see individuals making a gradual transition into full
retirement, whereby they steadily decrease the number of hours worked,
and use their pension pot to top up their income. In the middle years of
retirement, the individual’s income needs may well fall before rising again
due to care costs in old age.
Accessing pension savingsThe government has confirmed that members of DB schemes will be able
to benefit from the new flexibilities – albeit they may have to transfer to a
DC scheme to do so.
This is to be welcomed as restricting transfers from DB schemes – and
so denying DB scheme members the flexibility available to DC members
– would have introduced an unnecessary divide between those in DB
schemes and those in DC schemes.
Impact on DB schemesFor sponsors of DB pension schemes, the Budget changes raise the
possibility that certain members may want, or can be encouraged, to
transfer to a DC scheme. This could result in a significant change in the
profile of the scheme’s liabilities.
Most transfers are likely to take place close to retirement, as there seems
little reason for an individual to take on investment risk prior to retirement
by transferring at a younger age. However, where there is concern about
the ongoing viability of a pension scheme, and there is a risk that it will
end up in the Pension Protection Fund with lower levels of compensation
being provided, we can expect to see increased numbers of transfers at all
ages.
A r
emar
kab
le y
ear
for
pen
sio
ns

LCP Accounting for Pensions 2014
2. A remarkable year for pensions16
The charts below illustrate:
1. The typical profile of benefit payments from a pension scheme prior to
the March Budget announcements; and
2. The possible revised profile of benefit payments if half of the members
take a transfer value at retirement.
0
10
20
30
40
50
60
70
80
90
£ m
illio
n
Active
Deferred
Pensioner
Existing typical DB cashflow “shape”
2015 2030 2045 2060 2075 2090
70
80
90Active
Deferred
Pensioner
0
10
20
30
40
50
60
£ m
illio
n
Possible DB cashflow “shape” following March Budget
2015 2030 2045 2060 2075 2090
If transfers occurred at these levels, companies would need to consider the
impact on their scheme’s investment strategy – for example, in relation to
liquidity requirements – as payments would be accelerated.
It would also have an impact on funding strategy as, under current
legislation, the payment of a transfer value generally improves a scheme’s
funding position.

17LCP Accounting for Pensions 2014
2. A remarkable year for pensions
The guidance guaranteeSome commentators have expressed concern that individuals may run out
of income in old age – either because they spend their whole pension pot
as soon as possible, or because they underestimate how long they will live
and how much money they will need in later life.
To address these concerns, George Osborne announced that everyone
who retires with a DC pension will be offered “free, impartial, face-to-face
advice”. This has since been relabelled as “guidance” and the government
has stated it may not be “face-to-face”, but nonetheless it will be no
simple task to provide guidance to as many as 400,000 people each year.
Putting everything in place before April 2015 – when the changes come
fully into force – is one of the biggest challenges the coalition faces before
the election next year.
2.2 The defined ambition projectLegislation to enable collective DC schemes – and other defined ambition
pensions – is currently contained within the Pension Schemes Bill before
Parliament. However, many people feel that the government has missed
the opportunity to make defined ambition schemes a reality.
One option already available to companies that want to provide retirement
benefits with more risk sharing than DC schemes is to set up a “cash
balance” pension scheme.
Under this type of scheme employees accrue a cash pot at retirement,
based on the level of their salary and length of employment. Pre-
retirement investment risk is therefore retained by the employer, with the
employee taking on all post retirement risk.
Prior to the Budget announcements the main downside of a cash balance
scheme was the employees’ risk that annuities would be particularly
expensive at the point of retirement. However, with the new flexibilities
meaning that pension pots can be taken as cash this is now much less of
an issue. Johnson Matthey, Morrisons and Diageo all currently have cash
balance schemes which are open to new employees.
A r
emar
kab
le y
ear
for
pen
sio
ns

It's been a remarkable year for pensions.
21 July 2014Announcement that transfer values from private sector
DB schemes to DC schemes can continue to proceed
4 July 2014BT Group announces that it has removed £16 billion of
longevity risk
10 June 2014The Pensions Regulator issues a new code of practice
on scheme funding
4 June 2014Announcement in Queen’s speech that the government
will legislate for collective defined contribution pensions
29 May 2014PPF issues consultation on the next triennium of levies
– running from 2015/16 to 2017/18
4 April 2014High Court rules against IBM in scheme closure case
27 March 2014Proposal for new European pension directive published
26 March 2014The ICI Pension Fund announces that it has insured
£3.6 billion of liabilities with Legal & General and Prudential
19 March 2014March 2014 Budget
6 March 2014Aviva enters into a £5 billion longevity swap
21 November 2013The Pensions Regulator issues a new code of practice
relating to the governance of occupational DC pensions
21 November 2013RPIJ and CPIH inflation indices are designated
“National Statistics”
19 November 2013The Pensions Regulator issues guidance on asset
backed contributions
2014
2013
Amid concerns that too much value is being placed on asset backed
contributions, the Regulator sets out the standards it expects of
pension trustees when entering into these arrangements
The Regulator continues to increase its focus on DC
issues, given the large number of individuals now being
auto-enrolled into these schemes
Fundamental changes to the UK pensions landscape are announced by George Osborne
Whilst more stringent funding requirements are off the table for
the time being, this could introduce significant new governance
and disclosure requirements for UK pension schemes
Some schemes will see a significant increase in the level
of their PPF levies following the change in insolvency risk
provider from Dun & Bradstreet to Experian
A more employer friendly version of the code reflecting
the Regulator’s new statutory objective to “minimise any
adverse impact on the sustainable growth of an employer”
The elevation in status of these inflation indices increases
the potential for companies to consider changes to the
level of indexation in their pension schemes
Brokered directly with the reinsurance market,
this marks a major increase in the size of longevity
swaps taken out by pension schemes
This represents a significant increase in the size of
transaction undertaken in the buy-in/buy-out market
IBM is held to have breached its duty of good faith
to its employees when closing its pension schemes to
future accrual in 2011
With discontent over this type of pension scheme in
the Netherlands, and new flexibilities for existing DC
schemes, questions remain over the level of take up
Another massive increase in the amount of
longevity risk removed by a pension scheme, with
a new insurance company set up in order to have
direct access to reinsurance markets
18

The most significant change to UK pensions in almost a century.
Bob Scott
Partner LCP
19
A r
emar
kab
le y
ear
for
pen
sio
ns

20
Contentp20 3. Summary of main findingsp22 3.1 Introduction
p22 3.2 FTSE 100 pension liabilities
exceed half a trillion pounds
p23 3.3 Pension scheme funding
p25 3.4 More reductions in DB pension
provision
p27 3.5 De-risking
p30 3.6 Challenges and opportunities
on the horizon

As scheme closures continue, only 4 FTSE 100 companies disclosed any form of DB pension for new employees.
Bob Scott
Partner LCP
Sum
mar
y o
f m
ain
find
ing
s
Type of pension benefit provided for existing employees of FTSE 100 companies
No UK DB scheme
DB scheme closed to accrual
DB scheme - final salary, with cap on salary increases
DB scheme - final salary, no cap on salary increases
DB scheme - non final salary
14
23
11
38
14

LCP Accounting for Pensions 2014
3. Summary of main findings22
3. Summary of main findings
3.1 IntroductionThe following sections provide an insight into the disclosure of pension
scheme costs in companies’ 2013 accounts, comparing the different
practices adopted by the largest UK companies and highlighting the
financial implications.
By analysing their pension disclosures we aim to measure the exposure
that companies have to their pension liabilities and deficits, particularly in
the context of their market capitalisations, and we identify the steps that
companies are taking to address their pensions issues.
FTSE 100 companies scrutinisedAll of the companies analysed have reported under international
accounting standards (IAS19 for pension costs) as required under EU
regulations.
The information and conclusions of this report are based solely on detailed
analysis of the information that companies have disclosed in their annual
report and accounts and other publicly available information. We do
not approach companies or their advisers for additional information or
explanation.
Of the companies in the FTSE 100 at the end of 2013, 89 sponsored at
least one material DB scheme, either in the UK or overseas. The remaining
11 companies provide DC pensions and have no legacy DB scheme on their
balance sheet.
3.2 FTSE 100 pension liabilities exceed half a trillion poundsWe estimate that the combined FTSE 100 pension deficit in respect of UK
liabilities was £37 billion at the end of June 2014, reflecting total IAS19
liabilities of £512 billion against assets of £475 billion.
Strong investment returns over the year to June 2014 – particularly on
equities – have increased asset values, although this has been largely
offset by an increase in IAS19 liabilities resulting from a fall in corporate
bond yields.
The chart on the following page shows how the accounting deficit has
developed over the past five years. Our figures include unfunded pension
promises but exclude, where possible, the overseas pension schemes
sponsored by FTSE 100 companies and any employee benefits other than
pensions.
£37bnThe combined accounting
deficit for FTSE 100
companies at the end of
June 2014.

23LCP Accounting for Pensions 2014
3. Summary of main findings
Estimated IAS19 position for UK schemes of FTSE 100 companies
-100
-80
-60
-40
-20
0
20
Jun
200
9
Dec
20
09
Jun
2010
Dec
20
10
Jun
2011
Dec
20
11
Jun
2012
Dec
20
12
Jun
2013
Dec
20
13
Jun
2014
£ b
illio
n
The highest level of cover disclosed during 2013 was 133% for Royal Mail, which entered the FTSE 100 in December 2013 following privatisation.
Royal Mail previously had one of the largest pension schemes in the UK, with
a significant deficit. But after the European Commission approved the use of
state aid in March 2012, the majority of its pension liabilities – and the entire
pension deficit – was transferred to a new government pension scheme.
As noted below, the surplus increased by a further £1.35 billion in
September 2013 following an agreement to increase accrued pensions in
line with RPI inflation rather than salaries. This has taken the IAS19 funding
level up to 183% at 31 March 2014.
3.3 Pension scheme fundingContributions to DB schemes totalled £14.8 billion, of which we estimate
that £7.6 billion went towards removing deficits rather than towards the
cost of additional benefit accrual for current employees.
The highest level of DB contributions during the year was £1.65 billion paid
by Royal Dutch Shell. This was the only company to pay over £1 billion
this year – in 2012 two other companies – BAE Systems and BT Group –
also paid more than £1 billion into their pension schemes.
Five companies – International Airlines Group, Lloyds Banking Group,
RBS, Royal Mail and Sports Direct – paid more to their pension schemes
during their 2013 accounting year than they paid in dividends to
shareholders.
Sum
mar
y o
f m
ain
find
ing
s
183%The funding level of the
Royal Mail pension scheme at
the end of March 2014.

LCP Accounting for Pensions 2014
3. Summary of main findings24
The chart below shows how company payments into pension schemes
have changed since 2007.
0
5
10
15
20
25
2007 2008 2009 2010 2011 2012 2013
£ b
illio
n
Employer contributions to pension schemes
Deficit contributions (DB schemes)
Employer service cost (DB schemes)
Employer DC costs
This year the total pension contributions paid by FTSE 100 companies
reduced from £21.9 billion to £20.2 billion.
In particular, contributions to DB schemes have reduced from £16.8 billion
in 2012 to £14.8 billion in 2013. This largely reflects a significant reduction
in deficit contributions for a small number of companies, such as
BT Group, BAE Systems and Barclays that made very large contributions
in the previous year.
Payments to DC pension schemes are likely to increase further in coming
years as companies continue to close their DB schemes and the minimum
required contributions under the auto-enrolment regime are increased
over the period to 2018.
Non-cash fundingIncreased use of alternate funding methods and security arrangements
may be one reason for the decrease in cash contributions to DB pension
schemes. These can take various forms, including:
� Asset backed contribution arrangements. Usually the company transfers
assets to a Scottish Limited Partnership which then provides income to
the scheme and recourse to the underlying assets in certain pre-defined
circumstances.
� A charge over specific company assets.
� A pledge of additional funding in certain circumstances (for example,
following a disposal or when profits exceed a certain level).
� A parent company or intra-group guarantee.
25LCP Accounting for Pensions 2014
3. Summary of main findings
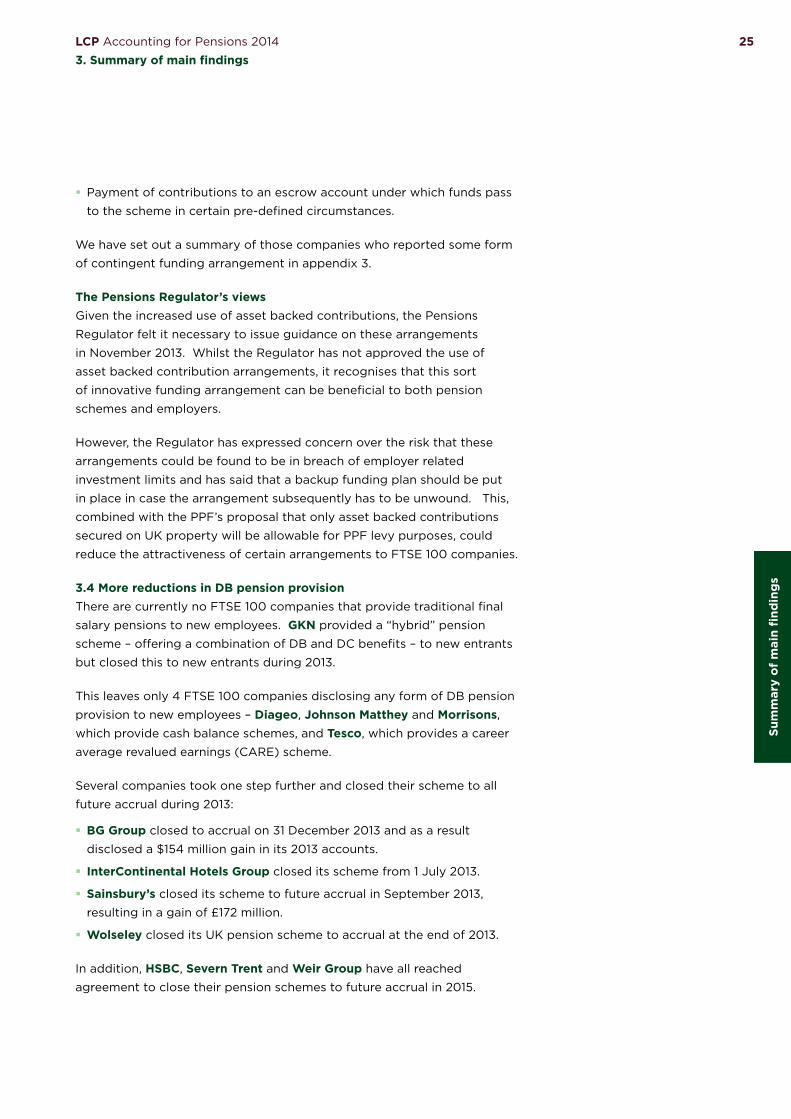
� Payment of contributions to an escrow account under which funds pass
to the scheme in certain pre-defined circumstances.
We have set out a summary of those companies who reported some form
of contingent funding arrangement in appendix 3.
The Pensions Regulator’s viewsGiven the increased use of asset backed contributions, the Pensions
Regulator felt it necessary to issue guidance on these arrangements
in November 2013. Whilst the Regulator has not approved the use of
asset backed contribution arrangements, it recognises that this sort
of innovative funding arrangement can be beneficial to both pension
schemes and employers.
However, the Regulator has expressed concern over the risk that these
arrangements could be found to be in breach of employer related
investment limits and has said that a backup funding plan should be put
in place in case the arrangement subsequently has to be unwound. This,
combined with the PPF’s proposal that only asset backed contributions
secured on UK property will be allowable for PPF levy purposes, could
reduce the attractiveness of certain arrangements to FTSE 100 companies.
3.4 More reductions in DB pension provisionThere are currently no FTSE 100 companies that provide traditional final
salary pensions to new employees. GKN provided a “hybrid” pension
scheme – offering a combination of DB and DC benefits – to new entrants
but closed this to new entrants during 2013.
This leaves only 4 FTSE 100 companies disclosing any form of DB pension
provision to new employees – Diageo, Johnson Matthey and Morrisons,
which provide cash balance schemes, and Tesco, which provides a career
average revalued earnings (CARE) scheme.
Several companies took one step further and closed their scheme to all
future accrual during 2013:
� BG Group closed to accrual on 31 December 2013 and as a result
disclosed a $154 million gain in its 2013 accounts.
� InterContinental Hotels Group closed its scheme from 1 July 2013.
� Sainsbury’s closed its scheme to future accrual in September 2013,
resulting in a gain of £172 million.
� Wolseley closed its UK pension scheme to accrual at the end of 2013.
In addition, HSBC, Severn Trent and Weir Group have all reached
agreement to close their pension schemes to future accrual in 2015.
Sum
mar
y o
f m
ain
find
ing
s

LCP Accounting for Pensions 2014
3. Summary of main findings26
At the same time, companies are making changes that reduce the
employer cost of their remaining DB pensions:
� Lloyds Banking Group previously limited increases in pensionable pay
to 2% per annum in 2010, but has now decided to freeze increases to
pensionable pay completely from April 2014. It has been reported that
this will result in a gain of £1 billion being disclosed in its December 2014
accounts.
� Johnson Matthey has increased employee contributions for those who
remain in its CARE scheme.
� National Grid has capped increases in pensionable salary to the lower of
RPI inflation and 3% per annum.
� Royal Mail reached agreement to increase accrued pensions in line with
RPI inflation (up to a maximum 5%) rather than in line with salaries.
This resulted in a £1.35 billion gain, taking the IAS19 funding level of its
pension scheme up to 183% at 31 March 2014.
The chart below shows the numbers of companies providing any
continuing DB pension provision after allowing for the changes listed
above.
Type of pension benefit provided for existing employees of FTSE 100 companies
No UK DB scheme
DB scheme closed to accrual
DB scheme - final salary, with cap on salary increases
DB scheme - final salary, no cap on salary increases
DB scheme - non final salary
14
23
11
38
14
With auto enrolment requirements now applying for all large companies,
membership of DC schemes is on the increase. Sainsbury’s disclosed
that it has auto-enrolled 57,000 employees into its DC scheme with an
opt-out rate of only 6%. Similarly, Scottish & Southern Energy reported
a participation rate in its pension scheme of over 90% and Travis Perkins
had only a 2% opt-out rate following the auto-enrolment of 9,200
employees into its pension scheme.

27LCP Accounting for Pensions 2014
3. Summary of main findings
Nevertheless, enrolling individuals in a pension scheme is only the first
stage. Even once all companies have completed auto-enrolment, the
minimum required level of contributions (8% of relevant earnings) is not
sufficient to provide a decent outcome in retirement. The next challenge
will be to find ways of encouraging (or compelling) employers and
employees to pay contributions at a level sufficient to provide members
with meaningful levels of retirement income.
Auto-escalation of employee contributions – which has worked well in the
United States – might be one way of addressing this. This would involve
automatically increasing an employee’s rate of pension contribution
whenever a salary increase is granted.
Although the employee would be able to opt out of paying the increased
level of contributions, inertia is likely to mean that many will continue
paying the higher rate, particularly as the increase in salary would avoid
any fall in take home pay.
3.5 De-riskingAs pension schemes mature and the time horizon for payment of benefits
decreases, companies and pension scheme trustees have typically looked
to reduce the risks posed by the pension scheme.
Last year we saw an overall increase in the allocation of assets to equities.
This year, the general trend has been restored with a modest movement
of assets out of equities and into bonds and other asset classes. This is in
the context of a period when equities significantly outperformed bonds,
and so if no rebalancing had been undertaken, the equity allocation would
have increased by around 4%.
December 2013 December 2012
Equities33.2%
Bonds43.3%
Other 23.5% Equities
34.5%
Bonds42.5%
Other23.0%
Su
mm
ary
of
mai
n fi
ndin
gs
33%The overall proportion of
pension scheme assets
invested in equities.

LCP Accounting for Pensions 2014
3. Summary of main findings28
Some companies made significant changes to their schemes’ investment
strategies during 2013 – for example, BG Group moved 23% of its pension
scheme assets from equities to bonds and Babcock undertook a hedging
programme which resulted in a 17% reduction in its schemes’ allocation to
equities.
However, not all pension schemes reduced their exposure to equities
during the year. G4S states that the asset strategy for its UK pension
schemes is managed dynamically rather than against a fixed asset
allocation. During 2013 the proportion of assets held in bonds in its
UK pension schemes decreased from 22% to 4%, with the allocation to
equities increasing from 15% to 26%.
As part of the new disclosure rules under the revised version of the
international accounting standard IAS19, companies are required to
provide increased detail on their pension schemes’ investment strategies.
Several companies, such as Bunzl, GlencoreXstrata, Meggitt and Rexam,
have disclosed that pre-agreed investment triggers have been put in place,
under which assets will be switched from equities to bonds when the
scheme’s funding level improves.
This type of mechanism potentially enables schemes to de-risk without
any additional contributions being required from the sponsoring employer.
Given the relatively wide-spread use of such triggers we can expect to see
further moves out of equities in future years as and when equity markets
rise and funding levels improve.
Many companies have also looked to remove other risks within their
pension schemes. Longevity risk – the risk that pension scheme members
live longer than expected (and therefore the cost of providing their
pension is higher than expected) – can be removed by entering into a
“longevity swap” or buy-in with an insurance company. Under a longevity
swap the counterparty would make payments to the pension scheme if
individuals live longer than anticipated. An increasing number of FTSE 100
companies have taken out this type of contract:
� AstraZeneca reports that its pension scheme entered into a longevity
swap during 2013 to hedge against the longevity risk in respect of around
10,000 pensioners, which covers $3.8 billion of the scheme’s liabilities.
� In March 2014 one of Aviva’s pension schemes entered into a longevity
swap covering approximately £5 billion of pensioner liabilities.
� BAE Systems reports that one of its main pension schemes entered
into an arrangement to insure longevity risk for its current pensioner
population, covering £2.7 billion of pension scheme liabilities. This
was followed in December 2013 with similar contracts for two of the
company’s other pension schemes, covering £0.9 billion and £0.8 billion
of pension scheme liabilities in each case.
8FTSE 100 companies that
have now entered into a
longevity swap.

29LCP Accounting for Pensions 2014
3. Summary of main findings
Babcock, International Airlines Group, ITV and Rolls-Royce have all
previously disclosed entering into longevity swaps. In July 2014 BT Group announced that it has removed the longevity risk applying for £16 billion
of pension liabilities by setting up its own insurance company and then
reinsuring the risk.
We have also seen a number of companies purchasing “buy-in” contracts,
under which the risks relating to a section of their pension scheme
liabilities – including longevity risk – are hedged by an insurance company:
� GKN disclosed that a £123 million buy-in was completed in early 2014.
� Following the closure of its pension scheme to future accrual in July
2013, InterContinental Hotels Group completed a buy-in transaction in
August which covers all of its pension scheme liabilities.
� Resolution reports that it has purchased an additional tranche of buy-in
contracts covering benefits for pensions in payment up to 30 June 2013.
� Smith & Nephew purchased an insurance contract to cover a subset of
the pensioner liabilities in its UK pension scheme.
� In September 2013 Smiths Group invested around £160 million in
annuities to match specific liabilities of one of its UK pension schemes.
� Tate & Lyle reports that in December 2012 the trustee of its main UK
pension scheme agreed a £347 million partial pensioner buy-in, covering
approximately 43% of the scheme’s pensioner liabilities. In its 2014
accounts, it discloses that one of its smaller pension schemes agreed a
buy-in for £82 million in September 2013, covering all of its liabilities.
The chart below shows how pensioner buy-in pricing has changed in recent
years compared to the cost of holding gilts to meet pension liabilities.
December 2007
June 2008
December 2008
June 2009
December 2009
June 2010
December 2010
June 2011
December 2011
June 2012
December 2012
June 2013
December 2013
Pre-bankingcrisis
Bankingcrisis Early quantitative easing Return to economic growthEurozone uncertainties
Val
ue o
f g
ilts
rela
tive
to
buy
-in
pri
ce
Buy-inpricing lessfavourablethan gilt
valuations
Buy-in pricing morefavourablethan gilt
valuations
Source: LCP analysis of the relative value of gilts against pensioner buy-in prices based on middle-of-the-road longevity assumptions for a UK pension plan. Buy-in pricing depends on a range of factors such as transaction size, benefit structure, membership profile and insurer appetite.
-10%
-8%
-6%
-4%
-2%
0%
2%
4%
6%
8%
How buy-in pricing has changed in recent years compared to the cost of holding gilts
Sum
mar
y o
f m
ain
find
ing
s

LCP Accounting for Pensions 2014
3. Summary of main findings30
Pensioner buy-in pricing remains relatively attractive at the current time
– allowing longevity risk to be transferred at little or no cost compared to
holding gilts – and this is reflected in the number and size of transactions
seen in the last year.
A growing pool of global reinsurers has significantly increased capacity for
buy-ins and longevity swaps in recent years. The UK is seen as the leading
market for longevity risk transfers and that has attracted a number of
overseas participants.
In addition, with UK-based insurers looking to make up for the decline
in individual annuity sales following the March Budget announcements,
additional competitiveness is likely to keep pricing keen for longevity risk
transfers in coming months.
3.6 Challenges and opportunities on the horizonLooking forward there are plenty of challenges – and also opportunities –
for companies sponsoring DB pension schemes.
A new inflation measure – RPIJThree years ago many companies looked at whether CPI inflation – which
had replaced RPI as the measure of inflation applying for statutory
increases to pensions – should apply for increases granted in their pension
scheme.
With RPIJ being granted the status of "National Statistic" by the UK
Statistics Authority in November 2013, we understand that a number of
companies are again looking at the measure of inflation their pension
schemes use.
Due to the way the indices are constructed, increases in RPIJ are expected
to be consistently lower than increases in RPI – with an average expected
difference in the region of 0.7% pa. Therefore, to the extent that schemes
can switch to RPIJ, employers would benefit from an immediate reduction
in pension cost – albeit at the expense of pension scheme members who
would be left with lower expected future pensions.
If all of the FTSE 100 companies that still use RPI inflation in their pension
schemes were to move to using RPIJ, then we estimate that the combined
pension deficit could fall by up to £20 billion.
Scottish independence?On 18 September Scottish residents will vote on whether Scotland should
separate from the rest of the UK and become an independent country.
£20bnThe potential impact of
adopting RPIJ inflation.

31LCP Accounting for Pensions 2014
3. Summary of main findings
If the referendum produces a "yes" result then there will be many
transitional issues that need to be addressed, including those relating to
pensions.
At present a pension scheme that operates across more than one EU state
has to register as “cross-border” and is subject to much more stringent
funding requirements than apply for schemes operating solely within the
UK. In particular, cross-border schemes must carry out annual actuarial
valuations and there is a requirement to be fully funded at all times.
This extra burden means that there are currently very few cross-border
schemes within the EU, with the majority operating between the UK and
Ireland. However, if Scottish independence goes ahead, and Scotland
becomes a new member of the EU, then the number of cross-border
schemes can be expected to increase dramatically, with many of those run
by FTSE 100 companies affected.
Scottish independence could also affect the attractiveness of Scottish
Limited Partnerships, which underlie the asset backed contribution
arrangements used by an increasing number of FTSE 100 companies.
PPF leviesThe PPF is currently consulting on the structure of its levies for the three
year period from 2015/16 to 2017/18. One major change is the replacement
of Dun & Bradstreet with Experian as the PPF’s insolvency risk provider.
Differences in the way in which the likelihood of a sponsoring employer’s
insolvency is assessed could result in significant changes to schemes’ PPF
levies. The PPF has suggested that the changes will generally be good
news for manufacturing and finance companies, but bad news for service
and not-for-profit organisations.
For some companies current PPF levies are significant – for example, International Airlines Group disclosed that costs in relation to PPF levies
were €6 million during 2013.
Sum
mar
y o
f m
ain
find
ing
s

LCP Accounting for Pensions 2014
3. Summary of main findings32
Further tax changes?With a general election on the horizon there is the potential for more
changes to the taxation applying on pension savings. The table below
illustrates the changes that have already been made since the current
regime – originally known as “tax simplification” – came into force in 2006.
Date Change
April 2006 New taxation regime comes into force
A new Lifetime Allowance – the maximum amount of total pension
savings that can be made without additional taxation – applies
and is set at £1.5 million. A new Annual Allowance – the maximum
amount of pension savings that can be made in one year without
additional taxation – applies and is set at £215,000
April 2009 Cuts in Annual Allowance and Lifetime Allowance from 2011
announced with immediate anti-forestalling rules impacting anyone
earning over £150,000 pa
December 2009 Anti-forestalling rules extended to anyone earning over £130,000 pa
April 2010 With inflationary increases the Lifetime Allowance reaches a peak of
£1.8 million and the Annual Allowance reaches a peak of £255,000
April 2011 Annual Allowance slashed to £50,000. With a sharp increase in the
number of individuals in DB schemes – including many on moderate
earnings – that face annual tax bills, the government introduces a
facility for pension schemes to pay tax on their members’ behalf in
return for a reduction in scheme pension (known as “scheme pays”).
April 2012 Lifetime Allowance reduced to £1.5 million
April 2014 Lifetime Allowance reduced to £1.25 million and Annual Allowance
reduced to £40,000
Further changes to the pension taxation system may be inevitable
regardless of which party is in power at the end of next year.
In March 2014 Labour announced a policy of limiting tax relief on pension
contributions made by high earners to 20%. This would effectively result
in double taxation of pension contributions, with those earning over
£150,000 being taxed at 25% on earnings paid into a pension scheme,
with the resulting pension then subject to income tax again when this is
drawn in retirement. Labour is also considering removing the existing
right for individuals to take 25% of their pension pot tax free and has
indicated an intention to reduce the Annual Allowance to the level of
National Average Earnings.

33LCP Accounting for Pensions 2014
3. Summary of main findings
The Liberal Democrats have proposed reducing the Lifetime Allowance to
£1 million. Separately, Steve Webb has indicated that he would like to see a
uniform level of pension tax relief set between 20% and 30%.
All of these measures would be complex to introduce and would further
increase the number of individuals subject to additional taxation on their
pension savings. As a result, they may reverse some of the benefits of the
March Budget changes and deter individuals (and their employers) from
providing adequately for their retirement.
The end of contracting outThe ability to contract out of the state pension system finally comes to an
end in 2016. This will result in higher national insurance contributions for
the majority of employers that continue to provide DB pensions to their
employees, as the rebate they currently receive will disappear. The value
of this annual rebate is dependent on earnings but can be worth over
£1,000 per employee.
In order to compensate for this additional cost employers are able to
reduce the level of benefits provided or increase members’ contributions,
but this will introduce administrative complexity. Instead we are likely to
see many employers using the end of contracting out as a reason to close
their pension scheme to future accrual.
More European legislationOn 27 March 2014 the European Commission put forward a new proposed
pension directive. As a result of lobbying from the UK and other affected
EU member states the stringent funding requirements that had previously
been put forward have been removed, and so the new directive focuses
solely on governance and reporting requirements.
The directive is intended to come into force in 2017 and is likely to require
an increase in standards of governance and disclosure, as it brings
pension scheme requirements in these areas more into line with those
applying for insurance companies. Schemes will be required to have a risk
management function, an internal audit function, and will need to provide
prescribed information to all of their members each year.
The costs associated with the new requirements are expected to be
significant and may encourage employers to wind up legacy DB pension
schemes.
Sum
mar
y o
f m
ain
find
ing
s

34
Contentp34 4. Accounting standards p36 4.1 New version of IAS19
p36 4.2 Disclosures overhauled
p37 4.3 Tail wagging the dog?

The new IAS19 accounting standard has increased the level of detail disclosed in relation to investment strategies.
Nick Bunch
Partner LCP
Acc
oun
ting
sta
ndar
ds

LCP Accounting for Pensions 2014
4. Accounting standards36
4. Accounting standards
4.1 New version of IAS19 For the first time in 2013 companies must report their results under a
revised version of the international pensions accounting standard IAS19. In
particular, two changes that we have flagged in previous surveys have now
come into force:
� the option of only recognising gains and losses that fall outside
a “corridor” (which was followed by a small minority of FTSE 100
companies) has been removed; and
� the “expected return on assets” has been abolished, replaced by a net
interest item calculated using the IAS19 discount rate.
4.2 Disclosures overhauledAs we have commented in previous surveys, the information given by
companies on their pension schemes in the past has not always been
commensurate with the pension risks that they run.
For example, lengthy pension disclosure notes have often lacked key
information needed to understand companies’ pension obligations, with
important messages obscured by unnecessary clutter and detail.
The new version of the accounting standard IAS19 is intended to remedy
this by introducing new, principles based, disclosure requirements that ask
companies to identify the key risks and figures that matter.
This year we have seen additional disclosure of items such as the
sensitivity of the pension figures to different assumptions and financial
conditions; and the average term to payment, or “duration”, of the
liabilities.
These are important improvements given that changes in financial
conditions can lead to huge changes in the pensions figures disclosed.
For example, a 0.5% increase in assumed future inflation would increase
FTSE 100 pension liabilities by over £35 billion.
As an example of changes that the new standard has brought,
Reckitt Benckiser did not mention pensions risk at all in its 2012 accounts.
However, it has included several paragraphs in its 2013 accounts as well as
quantifying the impact that changes in financial conditions might have on
its pension deficit.

37LCP Accounting for Pensions 2014
4. Accounting standards
Similarly, in its 2013 accounts AstraZeneca includes details of hedging
strategies put in place by its pension scheme to protect against falls
in equity markets, currency movements, changes in interest rates and
increases in inflation. No mention was made of any such strategies in
previous years’ accounts.
In general, the new accounting standard has increased the level of
detail disclosed in relation to investment strategies. This is a welcome
improvement given the sophisticated strategies that are now in place for
many pension schemes sponsored by FTSE 100 companies.
4.3 Tail wagging the dog?With all the extra words and figures that companies are now required to
provide about their pension arrangements, there is a danger that some will
start to believe that the accounting numbers are “real” and so use them as
the basis for strategic decisions.
This is unwelcome as, in our view, decisions should be based on sound
advice and information rather than on the technical treatment of a
particular transaction under the accounting rules. Basing decisions on
accounting numbers seems to us to be a classic case of the accounting
“tail” wagging the strategic “dog”.
Acc
oun
ting
sta
ndar
ds

38
Contentp38 5. Analysis of pension disclosuresp40 5.1 Introduction
p40 5.2 Analysis of results
p46 5.3 Key assumptions

Ana
lysi
s o
f p
ensi
on
dis
clo
sure
s
21 FTSE 100 companies disclosed a surplus in 2013 compared to just 15 of these companies in 2012.
Nick Bunch
Partner LCP
Ratio of assets to IAS19 liabilities at end of December (%)
December 2012
December 2013
0
5
10
15
20
Under 60 60 to 69 70 to 79 80 to 89 90 to 99 100 to 109 110 or over
Num
ber
of
com
pan
ies
LCP Accounting for Pensions 2014
5. Analysis of pension disclosures40
5. Analysis of pension disclosures
5.1 IntroductionIn this section we have analysed 89 FTSE 100 companies reporting in
2013. 11 companies have been excluded as they do not sponsor a material
DB pension scheme either in the UK or overseas. A full list and summary
details of the 89 companies’ key pension disclosures are set out in
appendix 1.
We have concentrated on the financial position of the DB schemes in
which the companies’ employees and former employees participate. Some
companies offer post-retirement healthcare, which we have excluded from
our analysis where possible. Overseas pension arrangements have been
included, except where otherwise indicated.
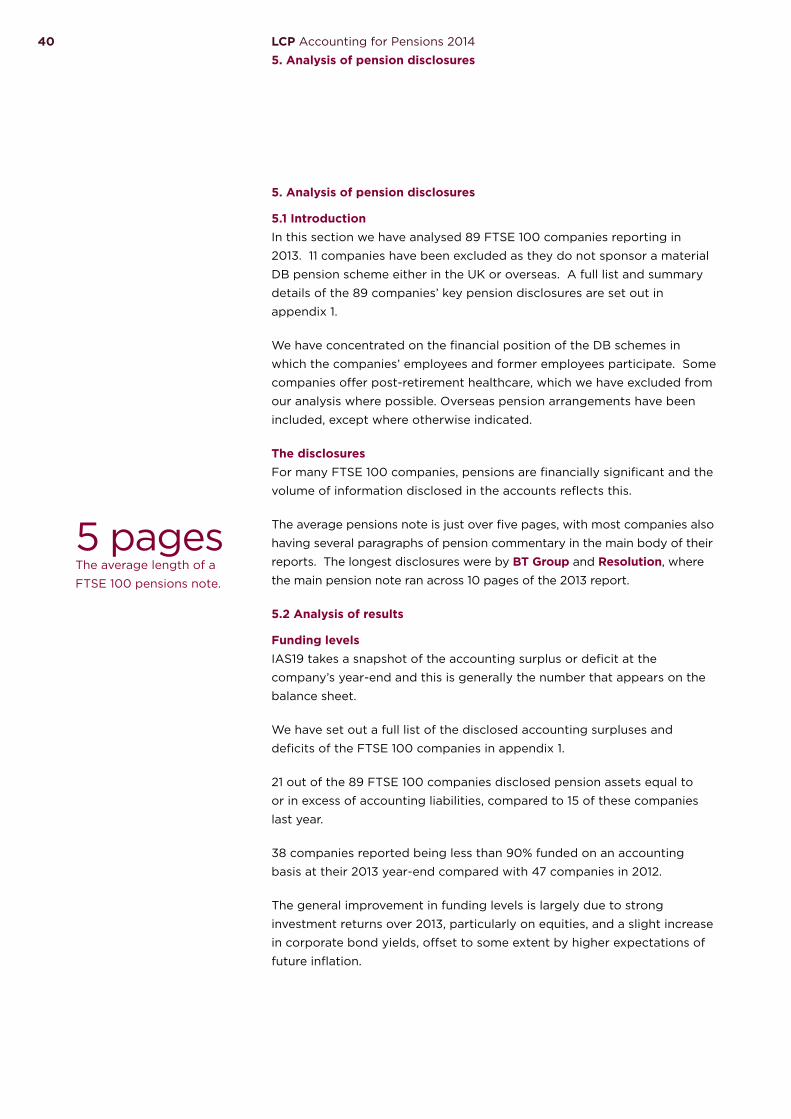
The disclosuresFor many FTSE 100 companies, pensions are financially significant and the
volume of information disclosed in the accounts reflects this.
The average pensions note is just over five pages, with most companies also
having several paragraphs of pension commentary in the main body of their
reports. The longest disclosures were by BT Group and Resolution, where
the main pension note ran across 10 pages of the 2013 report.
5.2 Analysis of results
Funding levelsIAS19 takes a snapshot of the accounting surplus or deficit at the
company’s year-end and this is generally the number that appears on the
balance sheet.
We have set out a full list of the disclosed accounting surpluses and
deficits of the FTSE 100 companies in appendix 1.
21 out of the 89 FTSE 100 companies disclosed pension assets equal to
or in excess of accounting liabilities, compared to 15 of these companies
last year.
38 companies reported being less than 90% funded on an accounting
basis at their 2013 year-end compared with 47 companies in 2012.
The general improvement in funding levels is largely due to strong
investment returns over 2013, particularly on equities, and a slight increase
in corporate bond yields, offset to some extent by higher expectations of
future inflation.
5 pagesThe average length of a
FTSE 100 pensions note.

41LCP Accounting for Pensions 2014
5. Analysis of pension disclosures
Changes over 2013The chart below shows how worldwide funding levels have changed
over the year for the 54 FTSE 100 companies in our report which have
December 2013 year-ends.
Ratio of assets to IAS19 liabilities at end of December (%)
December 2012
December 2013
0
5
10
15
20
Under 60 60 to 69 70 to 79 80 to 89 90 to 99 100 to 109 110 or over
Num
ber
of
com
pan
ies
The average reported IAS19 funding level for companies with December
year-ends was 90% in 2013, compared to 87% in 2012.
We have shown a similar chart for companies with March year-ends below.
0
2
4
6
8
10
12
Under 80 80 to 89 90 to 99 100 to 109 110 or over
Num
ber
of
com
pan
ies
March 2012
March 2013
March 2014
Ratio of assets to IAS19 liabilities at end of March (%)
Ana
lysi
s o
f p
ensi
on
dis
clo
sure
s

LCP Accounting for Pensions 2014
5. Analysis of pension disclosures42
The average reported IAS19 funding level for these companies was 98% at
March 2014 compared with 94% in 2013 and 92% in 2012. Notably, Royal Mail was 183% funded on an IAS19 basis at 31 March 2014 (compared to
133% funded at 31 March 2013) and this change has had a material impact
on the overall average.
Sources of deficits and surplusesFor the 54 companies with December year-ends, worldwide deficits
decreased by £11.7 billion over 2013. This is illustrated in the chart below.
IAS19 sources of deficits and surpluses for companies with December year-ends only (£ billion)
Benefits earned
Net interest chargedInvestment experience & exchange rate dierences
New assumptions & experience
Overall movement in the deficit
15 10 5 0 5 10 15
Factors increasing deficit Factors decreasing deficit
Contributions
Our analysis shows that contributions paid (£10.8 billion) more than
covered the net IAS19 value of benefits earned over the year (£5.5 billion)
and the total net interest charge (£0.6 billion). In addition, positive
investment experience (£12.6 billion) outweighed increases in IAS19
liability values (£5.6 billion) that arose due to higher inflation assumptions.
Overall, this has led to a decrease in deficits of £11.7 billion for these
companies.

43LCP Accounting for Pensions 2014
5. Analysis of pension disclosures
Pension schemes in relation to their sponsoring companiesThe chart below shows the size of accounting liabilities relative to
companies’ market capitalisations. The average FTSE 100 pension liability
was 37% of market capitalisation, compared to 45% in 2012. This decrease
was largely due to increases in equity markets which increased the market
capitalisation of many companies.
Nevertheless, pension schemes still pose a very significant risk for certain
companies. For example, International Airlines Group’s accounting
liabilities were more than double the size of its market capitalisation.
However, due to the company’s share price increasing by over 100% during
2013 this represents a significant improvement from the position at the
end of 2012 when the accounting liabilities were over five times its market
capitalisation.
0
5
10
15
20
Num
ber
of
com
pan
ies
Accounting liabilities as a proportion of market capitalisation (%)
2012
2013
Under5
5to 14
15to 24
25to 49
50to 74
75to 99
100to 149
150to 199
200or over
For some companies, even the size of the IAS19 pension scheme deficit
is significant compared to the value of the company itself. For example,
BT Group’s accounting deficit was over 25% of the value of its market
capitalisation at its 2013 accounting year-end. We have highlighted the
six companies with largest liabilities compared to market capitalisation in
appendix 2.
Ana
lysi
s o
f p
ensi
on
dis
clo
sure
s

LCP Accounting for Pensions 2014
5. Analysis of pension disclosures44
On average, pension scheme deficits were 4% of market capitalisation,
compared to 5% in 2012 and 2011.
What have companies done to tackle their deficits?FTSE 100 companies paid contributions totalling £14.8 billion to their DB
schemes in 2013. This follows £16.8 billion of contributions paid in 2012,
£16.9 billion paid in 2011 and £17 billion paid in 2010. Slightly fewer than
half paid higher contributions during 2013 than in 2012, although a few, for
example BT Group, paid significantly less as a result of having paid large
contributions in the previous year.
The six companies that paid the highest contributions are shown in
appendix 2. Royal Dutch Shell was the only company to pay more than
£1 billion into its schemes over its 2013 accounting year. Three companies
paid more than £1 billion in 2012.
Most companies pay contributions at a rate greater than the IAS19 value
of benefits earned over the year. If IAS19 assumptions were borne out in
reality, this excess would reduce the IAS19 deficit.
However, seven companies paid contributions lower than or equal to
the IAS19 value of benefits promised over the year. These were Amec,
Barclays, Intertek Group, London Stock Exchange Group, Mondi, Sage Group and Standard Life.
The chart below shows the length of time it would take for companies to
remove their IAS19 deficits based on the contributions paid during 2013.
0
5
10
15
20
25
30
In surplus Less than 5 years
5 to 10 years
10 to 15 years
15 to 20 years
Over 20 years
Num
ber
of
com
pan
ies
Expected time to pay o� IAS19 deficits
2012
2013

45LCP Accounting for Pensions 2014
5. Analysis of pension disclosures
Pension schemes versus shareholdersThe following chart shows how pension deficits compare to dividends
paid. Of the 68 FTSE 100 companies that disclosed a pension deficit
in 2013, 22 disclosed a deficit that was greater than or equal to the
dividends paid to their shareholders in 2013. However, in 28 cases, the
2013 dividend was more than double the deficit at the 2013 financial year-
end, suggesting that these companies could pay off their pension scheme
deficit relatively easily if they wanted to.
0
5
10
15
20
25
Num
ber
of
com
pan
ies
Percentage of deficit that could be paid o� with one year's declared dividends (%)
Under50
50to 99
100to 149
150to 199
200to 249
250to 299
300to 349
350to 399
400or over
2012
2013
The chart below shows the company contributions paid over the 2013 and
2012 accounting years as a percentage of dividends distributed over these
periods and therefore illustrates the amount of cash paid to the pension
scheme in preference to the shareholders. In 2013, five companies paid
more contributions into their pension schemes than they distributed in
dividends during their accounting year, compared to eleven in 2012.
0
5
10
15
20
25
30
Num
ber
of
com
pan
ies
Contributions paid as a proportion of dividends paid (%)
Under 10 10to 19
20to 29
30to 39
40to 49
50to 59
60to 69
70to 79
80to 89
90to 99
100 orover
2012
2013
Ana
lysi
s o
f p
ensi
on
dis
clo
sure
s
5FTSE 100 companies that paid
more in pension contributions
than dividends.

LCP Accounting for Pensions 2014
5. Analysis of pension disclosures46
5.3 Key assumptionsWe consider below the various assumptions used to place an IAS19 value
on pension benefits. Where a company operates pension schemes in more
than one country, we have considered the assumptions used for the UK if
separately given. Where a company has disclosed a range of assumptions,
we have taken the mid-point.
Life expectancyUnder the IAS19 standard, companies are required to disclose any
“significant actuarial assumptions”. The revised version of IAS19 places
a greater emphasis on demographic assumptions than previously, with
mortality now explicitly brought out. Following the adoption of the new
IAS19 standard the number of companies disclosing some detail on this
assumption has increased.
74 of 89 companies have provided sufficient information in their 2013
accounts for us to derive basic mortality statistics – specifically a male life
expectancy at age 65 in the UK. This compares to 65 out of 86 in 2012.
Of the remaining 15, all but Coca Cola HBC have provided either non-UK
life expectancies, a range of life expectancies or narrative description of
their mortality assumptions.
The following charts show the range of life expectancies assumed
under IAS19 by FTSE 100 companies for males aged 65 on the balance
sheet date.
0
5
10
15
20
25
30
86 87 88 89 90 or above
Num
ber
of
com
pan
ies
Life expectancy (rounded to nearest age)
Life expectancy assumptions reported in 2013UK males aged 65 on the accounting date
2012
2013

47LCP Accounting for Pensions 2014
5. Analysis of pension disclosures
The average assumed life expectancy was 87.9 years – up from 87.7 years
in the same companies’ 2012 accounts.
Last year we noted that the rate of increase in assumed life expectancy
appeared to be slowing and this trend has continued in 2013. Although
49 companies disclosed higher life expectancy assumptions in 2013,
adding 0.3 years on average, 8 companies disclosed lower life expectancy
assumptions for some or all of their membership. For example, Aviva
reduced its assumed life expectancy for a 60 year old male in its main UK
pension scheme by 0.5 years, from 90.1 to 89.6 in 2013.
Standard Life has adopted the strongest mortality assumption, stating
in their 2013 accounts that male pensioners currently aged 60 will live on
average to age 91.
Research has shown that two of the main factors influencing life
expectancies are socio-economic group and income. In this respect it is
interesting to analyse the FTSE 100 companies’ assumed life expectancies
by the sector in which the company operates.
In the chart below the horizontal bars show the average life expectancy for
a male aged 65 in the UK for each sector, for which we have followed the
Industry Classification benchmark as published by FTSE. The vertical lines
show the extent of the variation within each sector, which in most cases
increases the greater the number of companies within the sector.
80
82
84
86
88
90
92
Fin
anci
als
Hea
lthc
are
Oil
& G
as
Tel
eco
mm
unic
atio
ns
Co
nsum
er S
ervi
ces
Uti
litie
s
Ind
ustr
ials
Co
nsum
er G
oo
ds
Bas
ic m
ater
ials
Ag
e at
dea
th
Life expectancy assumptions reported in 2013 split by sectorUK males aged 65 on accounting date
15 33 2 4518 16
Companies in each sector at 31 December 2013
8
2013
2012
Ana
lysi
s o
f p
ensi
on
dis
clo
sure
s87.9The average assumed life
expectancy for a 65 year old
man.

LCP Accounting for Pensions 2014
5. Analysis of pension disclosures48
This chart shows that the highest average assumed life expectancies are
found in the financials and healthcare sectors, as last year. The lowest
average assumed life expectancies are found in the basic materials and
consumer goods sectors.
The biggest change was in healthcare where the average increased from
88.2 to 88.7.
Future improvements in mortalityAs well as setting assumptions to estimate how long current pensioners
will live on average, companies must also decide how life expectancies for
future pensioners will change as a result of improvements in mortality.
Allowing for future improvements can result in a significant increase in
the IAS19 value of pension scheme liabilities, and hence deficits.
65 companies disclosed enough information in their accounts to analyse
how their allowance for future improvements in mortality has changed
compared to 2013. The following chart shows the allowance that these
companies have made for increases to longevity over the next 20 years.
0
5
10
15
20
25
30
Num
ber
of
com
pan
ies
Additional life expectancy improvements reported in 2013Improvements for UK male members aged 65 now versus aged 65 in 2033
Increase in life expectancy over next 20 years
Under0.5 years
0.5 to0.99 years
1 to1.49 years
1.5 to1.99 years
2 to2.49 years
2.5 to2.99 years
3 to3.49 years
3.5 yearsor over
2012
2013
On average, these companies assumed that UK pensioners retiring at
age 65 in 20 years’ time will live for 1.8 years longer, on average, than a
pensioner retiring today. This compares to 1.9 years in 2012. British Land Company and Capita have the weakest assumption –
appearing to make no allowance for improvements in life expectancy for
their male pension scheme members.
Overall, these companies increased their average assumption for the life
expectancy of a 65 year old in 2033 by 0.1 years, from 89.6 years in their
2012 accounts to 89.7 years in 2013.

49LCP Accounting for Pensions 2014
5. Analysis of pension disclosures
Discount rates and inflationThe discount rate is used to calculate a present value of the projected
pension benefits. A lower discount rate means a higher IAS19 value of
pension liabilities and vice versa.
A typical FTSE 100 company has pension liabilities that are linked to price
inflation. A decrease in the price inflation assumption will lead to a lower
level of projected benefit payments, and hence a lower IAS19 value being
placed on those benefits, all other things being equal.
We have analysed the discount rates used by 48 companies and the RPI
inflation assumption of 44 companies with a December year-end, together
with the assumption for CPI inflation disclosed by 19 of these companies.
Similarly, we have analysed the discount rates used by 15 companies and
the RPI inflation assumption of 15 companies with a March 2014 year-end,
together with the assumption for CPI inflation disclosed by 9 of these
companies. The results are summarised in the charts below.
Discount ratesUnder IAS19 the discount rate should be based on “high quality” corporate
bonds and the duration of the corporate bonds should be consistent with
the estimated duration of the pension obligations.
The yields on high quality corporate bonds, and hence the discount rates,
will fluctuate from day to day in line with market conditions. The chart
below shows the discount rates adopted by companies reporting at the
end of December 2012, December 2013 and March 2014.
December 2012
December 2013
March 2014
Under 4.1 4.1 to 4.29 4.3 to 4.49 4.5 to 4.69 4.7 or over0
5
10
15
20
25
30
Num
ber
of
com
pan
ies
Discount rates used in December 2012, December 2013 and March 2014 (% pa)
Ana
lysi
s o
f p
ensi
on
dis
clo
sure
s

LCP Accounting for Pensions 2014
5. Analysis of pension disclosures50
The average discount rate increased slightly over the year to December
2013, from 4.4% pa in December 2012 to 4.5% pa in December 2013.
The average discount rate used by FTSE 100 companies with a March 2014
year-end was 4.4% pa. The spread of discount rates used by FTSE 100
companies with a December 2013 year-end has decreased compared to
December 2012.
Travis Perkins and William Hill disclosed the highest discount rates for
a FTSE 100 company with a December year-end in their 2013 accounts
(4.7% pa in 2013 compared to 4.6% pa and 4.5% pa respectively in 2012).
GKN adopted the lowest assumption, using an average discount rate of
4.35% pa across its two UK pension schemes.
The new version of IAS19 requires companies to disclose the duration
of their pension liabilities for the first time, allowing us to compare the
discount rates used against the duration of the scheme. The chart below
shows that the yield on AA rated corporate bonds is relatively level at
terms of more than 12 years and the spread of discount rates adopted by
FTSE 100 companies reflects this.
0%
1%
2%
3%
4%
5%
6%
7%
0 5 10 15 20 25 30
Yie
ld
Term/duration (years)
31.12.13 - AA bond yieldsDiscount rates
Discount rates by duration used in 2013
Source: Merrill Lynch
Inflation - RPI assumptionsThe chart overleaf compares average long-term inflation assumptions as
measured by the Retail Prices Index (RPI). This shows that the average
RPI assumption increased from 3.0% pa in December 2012 to 3.4% pa in
December 2013. In March 2014 the average assumption was 3.4% pa.
4.5% paThe average discount rate
adopted at the end of
December 2013.

51LCP Accounting for Pensions 2014
5. Analysis of pension disclosures
0
5
10
15
20
25
30
35
Under 2.7 2.7 to 2.89 2.9 to 3.09 3.1 to 3.29 3.3 to 3.49 3.5 to 3.69 3.7 or over
Num
ber
of
com
pan
ies
RPI inflation used in December 2012, December 2013 and March 2014 (% pa)
December 2012
December 2013
March 2014
For December 2013 year-ends, the highest RPI inflation assumption was
3.7% pa, adopted by Aggreko, Schroders and Standard Life. At the
other extreme Reed Elsevier, who reported at the same date, adopted an
assumption of 3.25% pa. The December 2013 RPI inflation assumptions had
a similar spread to those used in 2012, but are generally higher.
The Bank of England publishes statistics for future price inflation implied
by gilt spot rates. These showed that long-term RPI inflation implied by
20-year gilt spot rates was around 3.7% pa at the end of December 2013.
This suggests that, for a typical company to justify an assumption much
lower than this for future RPI inflation, a significant “inflation risk premium”
would need to be allowed for. This represents the theoretical return that
investors are willing to forgo when investing in index-linked gilts, in return
for the inflation protection that these assets provide.
In practice, it is the discount rate net of assumed future price inflation
which is the key assumption.
The chart overleaf shows the difference between the discount rate and
the assumption for RPI inflation (the net discount rate) for companies
reporting as at 31 December 2012, 31 December 2013 and 31 March 2014.
It shows that the net discount rate has reduced since December 2012, from
an average of 1.5% pa to 1.1% pa at 31 December 2013.
Ana
lysi
s o
f p
ensi
on
dis
clo
sure
s
3.4% paThe average RPI assumption
adopted at the end of
December 2013.

LCP Accounting for Pensions 2014
5. Analysis of pension disclosures52
December 2012
December 2013
March 2014
0
5
10
15
20
Under 0.9 0.9 to 1.09 1.1 to 1.29 1.3 to 1.49 1.5 to 1.69 1.7 to 1.89 1.9 or over
Num
ber
of
com
pan
ies
Discount rates in excess of RPI inflation used in December 2012, December 2013 and March 2014 (% pa)
Inflation - CPI assumptionsSince 2010 the statutory minimum increases that pension schemes must
provide has been linked to the Consumer Prices Index (CPI) rather than the
RPI. Historically CPI has generally increased at a lower rate than RPI and is
expected to do so in the future due to the different ways in which the two
inflation indices are constructed.
As no significant market in CPI-linked securities currently exists, market
practice is to derive an assumption for future CPI inflation by deducting
a margin from the assumed future level of RPI inflation. The chart below
shows the range of margins used by companies in their December
2012, December 2013 and March 2014 year-end accounts, where such
information was available.
0
2
4
6
8
10
12
Under 0.6 0.7 0.8 0.9 1.0 Over 1.0
Num
ber
of
com
pan
ies
Di�erence in RPI and CPI inflation assumptions used in December 2012, December 2013and March 2014 (% pa)
December 2012
December 2013
March 2014

53LCP Accounting for Pensions 2014
5. Analysis of pension disclosures
At 31 December 2013 the average margin was 0.9% pa compared to
0.7% pa at 31 December 2012. The margin at 31 December 2012 may
have been artificially low as market expectations at that time were that
the Office for National Statistics (ONS) would announce a change in the
method of calculating RPI which would have the effect of moving RPI
closer to CPI. However, the ONS announced in January 2013 that there
would be no change in the calculation of RPI.
At 31 December 2013, Aviva used a long-term CPI inflation assumption
of 1.1% pa below its RPI inflation assumption, the largest margin at that
accounting date.
Increases in pensionable payFor schemes that still relate benefits to pay close to retirement, the
assumed rate of growth in pensionable pay affects the disclosed IAS19
liability and the cost of benefits being earned. A lower assumption
produces a lower projected pension and hence lower pension liabilities as
well as a lower charge to operating income.
The average assumption for increases in pensionable pay (in excess of
the RPI inflation assumption) has remained at 0.5% pa in 2013. In recent
years a number of companies have introduced caps on, or even frozen,
increases in pensionable salary and as a result disclosed a salary increase
assumption lower than RPI inflation.
0
5
10
15
20
25
30
Under -0.75 -0.75 to -0.01 0 to 0.74 0.75 to 1.49 1.5 to 2.24 2.25 or over
Num
ber
of
com
pan
ies
Pensionable pay growth rates used in excess of RPI inflation (% pa)
2012
2013
As the number of active members in final salary pension schemes has
reduced, the assumption for salary growth has become less significant.
Ana
lysi
s o
f p
ensi
on
dis
clo
sure
s

Thi
s ta
ble
sho
ws
the
key
dis
clo
sure
s m
ade
by
the
com
pan
ies
in t
he F
TS
E 1
00
as
at 3
1 D
ecem
ber
20
13 t
hat
rep
ort
ed IA
S19
fig
ures
in t
heir
20
13 a
cco
unts
. The
so
urce
of
the
dat
a
is e
ach
com
pan
y’s
annu
al r
epo
rt a
nd a
cco
unts
fo
r th
e ac
coun
ting
per
iod
end
ing
in 2
013
. The
mar
ket
valu
e o
f as
sets
and
sur
plu
s/(d
efici
t) fi
gur
es e
xclu
de
po
st r
etir
emen
t m
edic
al
ben
efits
whe
re p
oss
ible
and
rel
ate
to t
he w
orl
dw
ide
po
siti
on
of
each
co
mp
any,
no
t ju
st t
he U
K p
ensi
on
sche
mes
. F
igur
es s
how
n ar
e b
efo
re d
efer
red
tax
and
bef
ore
any
bal
ance
shee
t as
set
limit
s ha
ve b
een
app
lied
. All
fig
ures
are
ro
und
ed t
o t
he n
eare
st m
illio
n p
oun
ds.
The
dis
coun
t ra
te a
nd p
rice
infl
atio
n as
sum
pti
ons
ref
er t
o t
hose
dis
clo
sed
fo
r th
e
com
pan
ies’
mai
n U
K s
chem
es w
here
ava
ilab
le. “
ND
” m
eans
no
UK
sp
ecifi
c fi
gur
es w
ere
dis
clo
sed
.
2013
Surp
lus/
(defi
cit)
Co
mp
any
Year
-en
dM
arke
t va
lue
of
asse
ts
£m
Tota
l£m
Fund
ed
sche
mes
£m
Dis
coun
t ra
te%
pa
Infla
tion1
% p
aD
iscl
ose
d
mo
rtal
ity?
2
Ab
erd
een
Ass
et M
anag
emen
tS
ep18
0(4
)(4
)4
.50
3.4
0Y
Ag
gre
koD
ec78
(6)
(6)
4.5
03.
70Y
Am
ecD
ec1,7
83
40
40
4.6
03.
30Y
Ang
lo A
mer
ican
Dec
3,18
9(2
15)
(85)
4.4
03.
40
Y
Ash
tead
Gro
upA
pr
780
14
.20
3.4
0Y
Ass
oci
ated
Bri
tish
Fo
od
sS
ep3,
233
(32)
324
.70
3.50
Y
Ast
raZ
enec
aD
ec6
,223
(1,3
70)
(1,0
54)
4.5
03.
50Y
Avi
vaD
ec12
,39
823
935
74
.40
3.4
0Y
Bab
cock
Inte
rnat
iona
l Gro
upM
ar3,
205
(26
1)(2
61)
4.4
02.
80
N
BA
E S
yste
ms3
Dec
21,3
74(3
,54
0)
(3,3
57)
4.5
03.
40
N
Bar
clay
sD
ec25
,74
3(1
,66
4)
(1,6
64
)4
.46
3.4
2Y
BG
Gro
upD
ec1,1
63
(10
1)(5
7)4
.50
3.4
0Y
BH
P B
illit
on
Jun
1,24
8(4
0)
344
.50
3.6
0Y
BP
Dec
26,0
83
(3,4
86
)58
14
.60
3.30
Y
Bri
tish
Am
eric
an T
ob
acco
Dec
5,76
7(3
77)
(138
)4
.40
3.4
0Y
Bri
tish
Lan
d C
oM
ar12
01
14
.103.
20Y
BT
Gro
upM
ar4
1,56
6(5
,856
)(5
,78
4)
4.2
03.
30Y
Bun
zlD
ec33
6(4
5)(3
0)
ND
ND
N
Cap
ita
Dec
84
8(1
18)
(118
)4
.50
3.30
Y
Car
niva
lN
ov33
0(6
)(6
)4
.40
3.4
0Y
Cen
tric
aD
ec5,
68
34
08
24
.60
3.30
Y
Co
ca-C
ola
HB
CD
ec25
3(9
1)(1
0)
ND
ND
N
Co
mp
ass
Gro
upS
ep2,
149
(20
9)
(24
)4
.40
3.4
0Y
CR
HD
ec1,9
29(3
30)
(29
1)4
.60
3.30
Y
Dia
geo
Jun
7,12
0(5
47)
(30
8)
4.6
03.
30Y
Exp
eria
nM
ar6
5423
534
.50
3.4
0Y
2012
Surp
lus/
(defi
cit)
Mar
ket
valu
e o
f as
sets
£m
Tota
l£m
Fund
ed
sche
mes
£m
Dis
coun
t ra
te%
pa
Infla
tion1
% p
aD
iscl
ose
d
mo
rtal
ity?
2
154
(15)
(15)
4.6
02.
80
Y
70(4
)(4
)4
.50
3.30
Y
1,64
5(7
)(7
)4
.50
2.9
0Y
3,30
3(3
32)
(19
8)
4.3
02.
80
Y
67
34
4.8
03.
20Y
3,0
03
(87)
(30
)4
.60
3.10
Y
6,18
0(1
,40
4)
(1,0
65)
4.5
03.
10Y
12,2
81
60
673
34
.50
3.0
0Y
2,78
3(2
57)
(257
)4
.80
2.70
N
19,4
54(4
,555
)(4
,36
0)
4.5
02.
90
N
25,0
75(1
,06
5)(1
,06
5)4
.31
2.9
3Y
98
3(1
77)
(134
)4
.60
3.0
0Y
1,238
(179
)(1
08
)4
.20
3.4
0Y
23,9
72(6
,630
)(2
,372
)4
.40
3.10
Y
5,54
7(8
73)
(64
9)
4.10
2.9
0Y
109
22
4.6
03.
20Y
38,5
41
(2,4
48
)(2
,38
0)
4.9
53.
05
Y
304
(76
)(5
9)
ND
ND
N
675
(10
8)
(10
8)
4.5
02.
90
Y
283
(21)
(21)
4.4
03.
00
Y
5,13
38
812
54
.80
3.20
Y
222
(119
)(3
2)N
DN
DN
1,89
9(3
62)
(16
8)
4.5
02.
70Y
1,74
8(5
21)
(48
3)4
.50
3.0
0Y
6,16
5(1
,08
4)
(88
1)4
.50
2.9
0Y
598
568
15.
203.
30Y
LCP Accounting for Pensions 2014
Appendix 1: FTSE 100 accounting disclosure listing54

5555LCP Accounting for Pensions 2014
Appendix 1: FTSE 100 accounting disclosure listing
2013
Surp
lus/
(defi
cit)
Co
mp
any
Year
-en
dM
arke
t va
lue
of
asse
ts
£m
Tota
l£m
Fund
ed
sche
mes
£m
Dis
coun
t ra
te%
pa
Infla
tion1
% p
aD
iscl
ose
d
mo
rtal
ity?
2
Fre
snill
oD
ec14
(7)
(2)
ND
ND
N
G4
SD
ec1,6
60
(50
4)
(472
)4
.40
3.4
0Y
GK
ND
ec2,
532
(1,2
71)
(76
3)4
.35
3.28
Y
Gla
xoS
mit
hKlin
eD
ec15
,225
(613
)(2
07)
4.5
03.
40
Y
Gle
nco
re X
stra
taD
ec2,
207
(59
0)
(59
0)
ND
ND
N
Ham
mer
son
Dec
58(3
3)(2
1)4
.60
3.4
0Y
HS
BC
Ho
ldin
gs
Dec
24,5
769
410
64
.45
3.6
0Y
IMI
Dec
1,29
4(1
58)
(79
)4
.45
3.50
Y
Imp
eria
l To
bac
co G
roup
Sep
3,34
9(1
,054
)(2
17)
4.3
03.
30Y
Inte
rCo
ntin
enta
l Ho
tels
Gro
upD
ec4
45
(91)
(11)
4.6
03.
60
Y
Inte
rnat
iona
l Air
lines
Gro
upD
ec19
,109
(3)
65
4.5
53.
28Y
Inte
rtek
Gro
upD
ec11
3(1
3)(1
3)4
.50
ND
Y
ITV
Dec
2,8
70(4
45)
(40
1)4
.53
3.38
Y
John
son
Mat
they
Mar
1,413
(19
5)(1
78)
4.5
03.
40
Y
Kin
gfi
sher
Feb
2,0
87
00
4.6
03.
30Y
Land
Sec
urit
ies
Gro
upM
ar19
36
64
.30
3.50
Y
Leg
al &
Gen
eral
Gro
up4
Dec
1,64
6(4
64
)(4
64
)4
.40
3.50
Y
Lloy
ds
Ban
king
Gro
upD
ec32
,56
8(7
87)
(78
7)4
.60
3.30
Y
Lond
on
Sto
ck E
xcha
nge
Gro
upM
ar27
4(2
6)
(18
)4
.50
3.4
0Y
Mar
ks &
Sp
ence
r G
roup
Mar
6,9
3020
520
64
.30
3.4
0Y
Meg
git
tD
ec6
88
(19
0)
(177
)4
.60
3.4
0Y
Mel
rose
Ind
ustr
ies
Dec
1,071
(219
)(1
17)
4.4
03.
40
Y
Mo
ndi G
roup
Dec
89
(129
)(3
4)
ND
ND
N
Mo
rris
on
(Wm
) S
uper
mar
kets
Feb
2,8
39(2
0)
(20
)4
.85
3.70
Y
Nat
iona
l Gri
dM
ar21
,770
(1,9
06
)(1
,64
0)
4.3
03.
40
Y
Nex
tJa
n6
09
66
744
.50
3.38
Y
Old
Mut
ual
Dec
573
83
83
4.5
03.
60
N
2012
Surp
lus/
(defi
cit)
Mar
ket
valu
e o
f as
sets
£m
Tota
l£m
Fund
ed
sche
mes
£m
Dis
coun
t ra
te%
pa
Infla
tion1
% p
aD
iscl
ose
d
mo
rtal
ity?
2
13(7
)(2
)N
DN
DN
1,58
9(4
71)
(436
)4
.50
3.0
0Y
2,75
9(9
78)
(44
6)
4.0
52.
85
Y
13,8
79(1
,312
)(9
10)
4.4
03.
00
Y
213
(174
)(1
74)
ND
ND
N
55(3
1)(1
8)
4.5
03.
00
Y
23,5
88
324
44
.50
3.10
Y
1,211
(232
)(1
47)
4.2
53.
00
Y
3,0
99
(1,0
46
)(2
62)
4.3
02.
80
Y
523
178
94
.50
3.0
0Y
17,5
38(9
85)
(753
)4
.30
2.8
8Y
105
(17)
(17)
4.5
0N
DY
2,6
93
(551
)(5
10)
4.2
02.
90
Y
1,226
(129
)(1
15)
5.10
3.4
0Y
1,94
7(1
5)(1
5)4
.50
3.0
0Y
162
(2)
(2)
4.8
03.
50Y
1,56
0(3
30)
(330
)4
.40
2.8
0Y
30,3
67
(957
)(9
57)
4.6
02.
90
Y
264
(17)
(10
)5.
00
3.4
0Y
6,18
69
19
14
.60
3.10
Y
635
(24
1)(2
27)
4.5
03.
00
Y
1,04
3(2
61)
(14
3)4
.50
3.0
0Y
86
(136
)(3
3)N
DN
DN
2,58
9(1
1)(1
1)4
.75
3.30
Y
19,9
57(1
,429
)(1
,186
)4
.80
3.20
Y
540
354
55.
00
3.10
Y
60
639
394
.40
3.20
N

56 LCP Accounting for Pensions 2014
Appendix 1: FTSE 100 accounting disclosure listing
2013
Surp
lus/
(defi
cit)
Co
mp
any
Year
-en
dM
arke
t va
lue
of
asse
ts
£m
Tota
l£m
Fund
ed
sche
mes
£m
Dis
coun
t ra
te%
pa
Infla
tion1
% p
aD
iscl
ose
d
mo
rtal
ity?
2
Pea
rso
nD
ec2,
509
5171
4.4
03.
40
Y
Per
sim
mo
nD
ec4
5724
244
.40
3.4
0Y
Pru
den
tial
4D
ec6
,94
46
46
64
64
.40
3.30
Y
Rec
kitt
Ben
ckis
er G
roup
Dec
1,458
(134
)(2
3)4
.40
3.6
0Y
Ree
d E
lsev
ier
Dec
3,9
81
(379
)(2
19)
4.6
03.
25Y
Res
olu
tio
n L
imit
edD
ec1,4
10(4
)(4
)4
.41
ND
Y
Rex
amD
ec2,
89
9(3
07)
(221
)4
.50
3.50
Y
Rio
Tin
toD
ec9
,410
(1,3
16)
(710
)4
.40
3.4
0Y
Ro
lls-R
oyce
Ho
ldin
gs
Dec
10,2
80
93
676
4.4
03.
50Y
RB
SD
ec28
,48
8(2
,99
6)
(2,8
41)
4.6
53.
30Y
Roy
al D
utch
She
llD
ec51
,732
(2,18
3)4
52N
DN
DN
Roy
al M
ail
Mar
3,34
38
308
304
.80
3.30
Y
RS
A In
sura
nce
Gro
upD
ec6
,56
6(1
11)
(44
)4
.60
3.30
Y
SA
BM
iller
Mar
299
(79
)4
9N
DN
DN
Sag
e G
roup
(T
he)
Sep
17(1
3)(1
3)N
DN
DN
Sai
nsb
ury
(J)
Mar
5,8
41
(76
6)
(753
)4
.60
3.50
Y
Sch
rod
ers
Dec
84
96
46
44
.50
3.70
Y
Sco
ttis
h &
So
uthe
rn E
nerg
yM
ar3,
118
(517
)(5
17)
4.10
3.20
Y
Sev
ern
Tren
tM
ar1,7
24(3
84
)(3
74)
4.4
03.
20Y
Sm
ith
& N
ephe
wD
ec8
17(1
10)
(86
)4
.40
3.4
0Y
Sm
iths
Gro
upJu
l3,
69
6(2
33)
(14
6)
4.4
03.
40
N
Sp
ort
s D
irec
t A
pr
47
(20
)(2
0)
4.0
03.
30Y
Sta
ndar
d C
hart
ered
Dec
1,56
3(1
90
)(8
8)
4.5
0N
DY
Sta
ndar
d L
ife
Dec
3,24
456
16
324
.60
3.70
Y
Tate
& L
yle
Mar
1,40
7(1
85)
(132
)4
.20
3.50
Y
Tesc
oF
eb7,
206
(2,3
78)
(2,2
87)
ND
ND
Y
Trav
is P
erki
nsD
ec1,0
270
04
.70
3.4
0Y
2012
Surp
lus/
(defi
cit)
Mar
ket
valu
e o
f as
sets
£m
Tota
l£m
Fund
ed
sche
mes
£m
Dis
coun
t ra
te%
pa
Infla
tion1
% p
aD
iscl
ose
d
mo
rtal
ity?
2
2,32
7(7
4)
(50
)4
.40
3.0
0Y
40
2(4
)(4
)4
.60
3.10
Y
7,19
71,1
381,1
384
.40
2.70
Y
1,28
1(2
71)
(157
)4
.30
3.0
0Y
3,8
06
(46
6)
(30
6)
4.6
52.
85
Y
1,34
46
26
24
.51
ND
Y
2,9
41
(39
3)(3
01)
4.4
03.
10Y
9,0
56(2
,96
4)
(2,3
11)
4.3
02.
90
Y
10,3
289
80
1,150
4.4
03.
00
Y
26,3
70(3
,74
0)
(3,5
72)
4.5
02.
90
Y
45,
220
(5,4
01)
(2,9
63)
ND
ND
N
28,6
16(2
,716
)(2
,716
)5.
103.
30Y
6,2
18(2
15)
(138
)4
.30
2.6
0Y
270
(97)
17N
DN
DN
17(1
4)
(14
)N
DN
DN
5,19
2(4
71)
(46
2)5.
00
3.30
Y
777
67
67
4.6
03.
30Y
2,6
95
(430
)(4
30)
4.6
03.
20Y
1,557
(34
6)
(337
)4
.90
3.10
Y
753
(132
)(1
10)
4.5
03.
00
Y
3,34
8(5
97)
(516
)4
.102.
80
N
40
(19
)(1
9)
4.6
03.
20Y
1,523
(29
3)(1
82)
4.5
0N
DY
2,8
91
391
46
84
.50
3.30
Y
1,36
2(3
6)
105.
103.
30Y
6,16
9(1
,872
)(1
,812
)N
DN
DY
910
(58
)(5
8)
4.6
03.
00
Y

5757
No
tes:
1 W
e ha
ve li
sted
RP
I as
the
mea
sure
of
infl
atio
n an
d e
xclu
ded
CP
I whe
re it
co
uld
be
iden
tifi
ed in
the
acc
oun
ts.
2 T
his
colu
mn
ind
icat
es c
om
pan
ies
that
dis
clo
sed
suffi
cien
t in
form
atio
n to
cal
cula
te t
heir
ass
ump
tio
n fo
r lif
e ex
pec
tanc
y fo
r a
mal
e p
ensi
one
r in
the
UK
.
3 T
he fi
gur
es f
or
BA
E S
yste
ms
excl
ude
£1,0
29m
of
its
2013
defi
cit
(£1,1
48
m in
20
12)
whi
ch is
allo
cate
d t
o e
qui
ty a
cco
unte
d in
vest
men
ts a
nd o
ther
par
tici
pat
ing
em
plo
yers
.
4 L
egal
& G
ener
al a
nd P
rud
enti
al h
old
gro
up in
sura
nce
po
licie
s in
res
pec
t o
f so
me
of
thei
r o
blig
atio
ns. W
e ha
ve in
clud
ed t
he v
alue
of
thes
e p
olic
ies
in t
he fi
gur
es s
tate
d a
bov
e, a
s fo
llow
s: L
egal
& G
ener
al: £
64
6m
(2
012
: £6
36m
) an
d P
rud
enti
al: £
257m
(20
12: £
292m
).
5 T
he m
ost
rec
ent
acco
unts
fo
r W
eir
Gro
up c
over
the
53
wee
k p
erio
d e
ndin
g o
n 3
Janu
ary
2014
(th
e p
revi
ous
acc
oun
ts c
over
ed t
he 5
2 w
eek
per
iod
end
ing
on
31 D
ecem
ber
20
12).
Fo
r th
e p
urp
ose
s o
f th
is r
epo
rt w
e ha
ve in
clud
ed t
he 3
Jan
uary
20
14 a
cco
unts
wit
h th
e 31
Dec
emb
er 2
013
yea
r-en
d a
cco
unts
of
oth
er F
TS
E 1
00
co
mp
anie
s.
6 W
illia
m H
ill p
rod
uced
acc
oun
ts c
over
ing
the
52
wee
k p
erio
d e
ndin
g o
n 31
Dec
emb
er 2
013
and
the
53
wee
k p
erio
d e
ndin
g o
n 1
Janu
ary
2013
. The
fig
ures
sho
wn
rela
te t
o t
he a
cco
unts
fo
r th
e p
erio
d e
ndin
g o
n
31
Dec
emb
er 2
013
.
The
20
13 fi
gur
es a
re a
s at
the
end
of
the
acco
unti
ng p
erio
ds
end
ing
in 2
013
. T
he 2
012
fig
ures
are
as
at t
he s
tart
of
the
acco
unti
ng p
erio
d.
All
fig
ures
sho
wn
abov
e w
ere
take
n fr
om
IAS
19 d
iscl
osu
res.
Fig
ures
hav
e b
een
conv
erte
d t
o p
oun
ds
ster
ling
whe
re a
co
mp
any
has
rep
ort
ed fi
gur
es in
its
acco
unts
in a
diff
eren
t cu
rren
cy.
Trad
itio
nally
, so
me
com
pan
ies
wit
h ov
erse
as p
ensi
on
pla
ns d
o n
ot
fund
the
m v
ia a
n ex
tern
al s
chem
e, in
stea
d b
acki
ng t
he p
ensi
on
pla
n w
ith
com
pan
y as
sets
, whi
ch m
ay r
esul
t in
a la
rger
defi
cit
bei
ng d
iscl
ose
d. W
here
d
iscl
ose
d, t
he s
urp
lus/
(defi
cit)
att
rib
utab
le t
o f
und
ed s
chem
es is
als
o s
how
n ab
ove.
The
dis
coun
t ra
te a
nd in
flat
ion
assu
mp
tio
n re
fer
to t
hose
dis
clo
sed
fo
r th
e co
mp
anie
s’ m
ain
UK
sch
eme(
s). W
here
a c
om
pan
y ha
s d
iscl
ose
d a
ran
ge
of
assu
mp
tio
ns, w
e ha
ve t
aken
the
mid
-po
int.
Whe
re a
co
mp
any
op
erat
es p
ensi
on
sche
mes
in m
ore
tha
n o
ne c
oun
try,
we
have
co
nsid
ered
the
ass
ump
tio
ns u
sed
fo
r th
e U
K if
sep
arat
ely
giv
en. “
ND
” m
eans
no
UK
fig
ures
wer
e d
iscl
ose
d.
We
have
exc
lud
ed f
rom
our
sur
vey
the
follo
win
g 1
1 co
mp
anie
s w
ho h
ad n
o e
vid
ence
of
sig
nifi
cant
defi
ned
ben
efit
pro
visi
on:
Ad
mir
al G
roup
, Ant
ofa
gas
ta, A
RM
Ho
ldin
gs,
Bri
tish
Sky
Bro
adca
stin
g, B
urb
erry
Gro
up,
Eas
yjet
, Har
gre
aves
Lan
sdo
wn,
Pet
rofa
c, R
and
go
ld R
eso
urce
s, S
hire
and
Tul
low
Oil.
The
fo
llow
ing
fo
ur c
om
pan
ies
have
ent
ered
the
FT
SE
10
0 in
dex
sin
ce 3
1 D
ecem
ber
20
13 a
nd h
ence
are
no
t in
clud
ed in
our
sur
vey:
3i G
roup
, Bar
ratt
Dev
elo
pm
ents
, Int
u P
rop
erti
es a
nd S
t Ja
mes
's P
lace
. The
fo
llow
ing
fo
ur c
om
pan
ies
have
exi
ted
the
FT
SE
10
0 in
dex
sin
ce 3
1 D
ecem
ber
20
13: A
mec
, Mel
rose
Ind
ustr
ies,
Tat
e &
Lyl
e an
d W
illia
m H
ill.
2013
Surp
lus/
(defi
cit)
Co
mp
any
Year
-en
dM
arke
t va
lue
of
asse
ts
£m
Tota
l£m
Fund
ed
sche
mes
£m
Dis
coun
t ra
te%
pa
Infla
tion1
% p
aD
iscl
ose
d
mo
rtal
ity?
2
TU
I Tra
vel
Sep
1,322
(66
1)(4
41)
4.4
03.
30Y
Uni
leve
rD
ec15
,28
3(1
,20
6)
(337
)4
.50
3.30
Y
Uni
ted
Uti
litie
s G
roup
Mar
2,4
42
1515
4.6
03.
30Y
Vo
daf
one
Gro
upM
ar3,
723
(577
)(5
15)
ND
ND
Y
Wei
r G
roup
(T
he)
Dec
56
81
(70
)(6
3)4
.40
3.4
0Y
Whi
tbre
adF
eb1,4
80
(54
2)(5
42)
4.6
03.
35Y
Will
iam
Hill
6D
ec31
0(1
8)
(18
)4
.70
3.4
0Y
Wo
lsel
eyJu
l1,3
06
(133
)(6
3)4
.50
3.4
0Y
WP
PD
ec72
6(2
47)
(10
4)
4.5
0N
DY
2012
Surp
lus/
(defi
cit)
Mar
ket
valu
e o
f as
sets
£m
Tota
l£m
Fund
ed
sche
mes
£m
Dis
coun
t ra
te%
pa
Infla
tion1
% p
aD
iscl
ose
d
mo
rtal
ity?
2
1,34
3(6
48
)(4
62)
4.5
02.
70Y
14,3
09
(2,4
36)
(1,2
99
)4
.30
2.6
0Y
2,11
3(9
2)(9
2)5.
00
3.25
Y
1,60
4(3
06
)(2
48
)N
DN
DY
650
(90
)(8
2)4
.30
2.9
0Y
1,34
1(5
99
)(5
99
)4
.65
3.15
Y
296
(21)
(21)
4.5
03.
00
Y
96
1(3
58)
(28
7)4
.60
2.9
0Y
710
(334
)(1
76)
4.2
0N
DY
LCP Accounting for Pensions 2014
Appendix 1: FTSE 100 accounting disclosure listing

58
These tables show the key results of
analysis of the disclosures made by the
companies in the FTSE 100 as at
31 December 2013 that were reported
in their 2013 accounts.
The figures relate to the worldwide
position of each company (not just the
UK disclosure) but exclude healthcare
and defined contribution pension
arrangements where possible.
The source of the data is each
company's annual report and accounts
for the accounting period ending in
2013. The surplus/(deficit) figures are
before allowing for deferred tax and
before any balance sheet asset limit
has been applied.
Traditionally, some companies with
overseas pension schemes do not fund
them via an external scheme, instead
backing the pension scheme with
company assets, which may result in a
larger deficit being disclosed.
The source of market capitalisation
figures is the FTSE All-Share Index
Series reports as at the companies'
year-ends (where available).
All figures shown here have been
calculated using unrounded numbers.
Therefore, some metrics shown may
differ to those calculated using the
rounded figures.
Largest liabilities
Company2013
Liabilities £m2012
Liabilities £m
Royal Dutch Shell 53,914 50,621
BT Group 47,422 40,989
Lloyds Banking Group 33,355 31,324
RBS 31,484 30,110
BP 29,569 30,602
Barclays 27,407 26,140
Largest deficits
Company2013
Deficit £m2012
Deficit £m
BT Group 5,856 2,448
BAE Systems1 3,540 4,555
BP 3,486 6,630
RBS 2,996 3,740
Tesco 2,378 1,872
Royal Dutch Shell 2,183 5,401
1 The figures for BAE Systems exclude £1,029m of its 2013 deficit (£1,148m in 2012) allocated to
equity accounted investments and other participating employers.
Largest liabilities compared to market capitalisation
Company Liabilities £m Market cap £m
2013Liabilities/
Market cap %
2012Liabilities/
Market cap %
International Airlines Group 19,112 8,172 234 540
BT Group 47,422 21,889 217 234
RSA Insurance Group 6,677 3,341 200 143
BAE Systems2 25,943 14,112 184 230
RBS 31,484 20,838 151 154
Marks & Spencer Group 6,725 6,267 107 101
2 The figures for BAE Systems include all liabilities of the multi-employer plans that the group participates in.
LCP Accounting for Pensions 2014
Appendix 2: FTSE 100 accounting risk measures

5959
Largest deficit compared to market capitalisation
Company Deficit £m Market cap £m
2013Deficit/
Market cap %
2012Deficit/
Market cap %
BT Group 5,856 21,889 27 14
BAE Systems1 3,540 14,112 25 42
GKN 1,271 6,080 21 26
TUI Travel 661 4,111 16 25
RBS 2,996 20,838 14 19
G4S 504 4,073 12 13
3 Prudential holds group insurance policies in respect of some of its obligations. We have included the value of these policies in the asset
and liability figures stated above, which was £257m for 2013 (2012: £292m).
Highest funding level
Company Assets £m Liabilities £m
2013Assets/
Liabilities %
2012Assets/
Liabilities %
Royal Mail 3,343 2,513 133 91
Standard Life 3,244 2,683 121 116
Old Mutual 573 490 117 107
Next 609 543 112 107
Prudential3 6,944 6,298 110 119
Schroders 849 786 108 109
Lowest funding level
Company Assets £m Liabilities £m
2013Assets/
Liabilities %
2012Assets/
Liabilities %
Mondi Group 89 218 41 39
Sage Group 17 30 57 54
Hammerson 58 91 64 64
Fresnillo 14 21 66 66
GKN 2,532 3,803 67 74
TUI Travel 1,322 1,983 67 67
LCP Accounting for Pensions 2014
Appendix 2: FTSE 100 accounting risk measures

LCP Accounting for Pensions 2014
Appendix 2: FTSE 100 accounting risk measures60
Largest service cost4
Company2013
Service cost £m2012
Service cost £m
Royal Dutch Shell 1,212 982
BP 663 698
Tesco 482 492
Royal Mail 412 384
Barclays 375 377
RBS 373 4494 The service cost (representing the value of benefits earned over the accounting period) includes the value of any past service benefits
awarded to members during the year.
Largest employer contributions
Company2013
Contributions £m2012
Contributions £m
Royal Dutch Shell 1,649 1,452
RBS 821 977
BP 814 803
Lloyds Banking Group 804 669
Tesco 666 457
BAE Systems5 646 1,157
5 The figures for BAE Systems do not include contributions by the employer in respect of employee salary sacrifice arrangements.
Largest increase in employer contributions
Company
2013Employer
contributions£m
2012Employer
contributions£m
Increase inemployer
contributions£m
Diageo 593 190 403
Tesco 666 457 209
Royal Dutch Shell 1,649 1,452 197
HSBC Holdings 601 450 151
Lloyds Banking Group 804 669 135
Glencore Xstrata 113 24 89

6161LCP Accounting for Pensions 2014
Appendix 2: FTSE 100 accounting risk measures
Largest employer contributions compared to service cost4
CompanyContributions
£mService cost
£m
2013Contributions less service
cost £m
2012Contributions less service
cost £m
HSBC Holdings 601 71 530 97
Diageo 593 103 490 195
International Airlines Group 479 30 449 302
RBS 821 373 448 528
Lloyds Banking Group 804 356 448 293
Royal Dutch Shell 1,649 1,212 437 470
Highest equity allocation
Company
2013Equity allocation %
2012Equity allocation %
Ashtead Group 67 67
BP 66 67
Wolseley 66 62
Whitbread 59 54
Tesco 56 55
Travis Perkins 55 56
6 International Airlines Group, Royal Mail and Sports Direct did not pay a dividend in 2012 or 2013 but contributed £503m (2012: £479m),
£435m (2012: £429m) and £3m (2012: £3m) to their pension schemes respectively.
Highest employer contributions compared to dividends paid6
CompanyContributions
£mDividends
£m
2013Contributions /Dividends %
2012Contributions /Dividends %
Lloyds Banking Group 804 25 3,216 1,195
RBS 821 403 204 325
BAE Systems5 646 649 100 183
Babcock International Group 78 87 90 115
BT Group 542 683 79 369
RSA Insurance Group 122 162 75 46

LCP Accounting for Pensions 2014
Appendix 2: FTSE 100 accounting risk measures62
Lowest equity allocation
Company2013
Equity allocation %2012
Equity allocation %
Fresnillo 0 0
London Stock Exchange Group 3 15
InterContinental Hotels Group 4 14
Prudential 5 4
IMI 8 8
Aviva 9 9
Largest % increase in funding level
Company
2013Funding level
%
2012Funding level
%
Increase infunding level
%
Accounting date
Royal Mail 133 91 42 Mar
Glencore Xstrata 79 55 24 Dec
Wolseley 91 73 18 Jul
Rio Tinto 88 75 13 Dec
Old Mutual 117 107 10 Dec
BP 88 78 10 Dec
Largest % decrease in funding level
Company
2013Funding level
%
2012Funding level
%
Decrease infunding level
%
Accounting date
InterContinental Hotels Group 83 103 -20 Dec
Rolls-Royce Holdings 101 110 -9 Dec
Tate & Lyle 88 97 -9 Mar
Prudential 110 119 -9 Dec
GKN 67 74 -7 Dec
Experian 104 110 -6 Mar
Highest gain on assets7
Company2013
Gain %2012
Gain %
BG Group 14 14
BP 13 12
Old Mutual 13 11
Standard Life 13 5
GlaxoSmithKline 12 8
Rio Tinto 12 11
7 Figures calculated as a percentage of assets at the start of the accounting year (December year-ends only).

6363LCP Accounting for Pensions 2014
Appendix 3: Summary of disclosed non-cash funding arrangements
Company guarantee
Contributions to escrow account/trust
Charge over assets/ other security
Contributions based on company performance
Contributions contingent on other events
Asset backed funding arrangement
Notes
Ab
erd
een
Ass
et M
anag
emen
t
Ag
gre
ko
Am
ec
Ang
lo A
mer
ican
Ash
tead
Gro
up
Ass
oci
ated
Bri
tish
Fo
od
s
Ast
raZ
enec
a
Co
ntri
but
ions
to
esc
row
acc
oun
t p
ayab
le in
ag
reed
cir
cum
stan
ces
- fo
r ex
amp
le in
the
eve
nt o
f a
chan
ge
to t
he
long
-ter
m in
vest
men
t st
rate
gy
Avi
va
Bab
cock
Inte
rnat
iona
l Gro
up
BA
E S
yste
ms
Bar
clay
s
BG
Gro
up
Ass
et b
acke
d c
ont
rib
utio
n ar
rang
emen
t us
ing
loan
s se
cure
d o
n fo
ur li
qui
d g
as t
rans
po
rt s
hip
s
BH
P B
illit
on
BP
C
om
mit
men
t to
pay
ad
dit
iona
l ann
ual c
ont
rib
utio
ns d
epen
din
g o
n fu
ndin
g le
vel o
f p
ensi
on
sche
me
Bri
tish
Am
eric
an T
ob
acco
C
om
pan
y g
uara
ntee
Bri
tish
Lan
d C
o
BT
Gro
up
Ag
reed
tha
t o
ne t
hird
of
any
net
pro
ceed
s fr
om
dis
po
sals
or
acq
uisi
tio
ns in
exc
ess
of
£1
bill
ion
dur
ing
any
yea
r
to 3
0 J
une
will
be
pai
d in
to it
s p
ensi
on
sche
me
Has
pro
mis
ed t
hat
cont
rib
utio
ns w
ill b
e at
leas
t as
larg
e as
pay
men
ts m
ade
to s
hare
hold
ers
over
the
per
iod
fro
m 1
Mar
ch 2
012
to
30
Jun
e 20
15
Bun
zl
Cap
ita
A
sset
bac
ked
co
ntri
but
ion
arra
ngem
ent
usin
g in
telle
ctua
l pro
per
ty r
ight
s fo
r so
ftw
are
Car
niva
l

64 LCP Accounting for Pensions 2014
Appendix 3: Summary of disclosed non-cash funding arrangements
Company guarantee
Contributions to escrow account/trust
Charge over assets/ other security
Contributions based on company performance
Contributions contingent on other events
Asset backed funding arrangement
Notes
Cen
tric
a
A
£59
0 m
illio
n ch
arg
e ov
er t
he H
umb
er p
ow
er s
tati
on
has
bee
n p
led
ged
as
secu
rity
Ass
et b
acke
d c
ont
rib
utio
n ar
rang
emen
t us
ing
loan
s to
gro
up c
om
pan
ies
Co
ca-C
ola
HB
C
Co
mp
ass
Gro
up
CR
H
Dia
geo
Has
ag
reed
to
mak
e co
ntri
but
ions
into
an
escr
ow
acc
oun
t d
epen
din
g o
n d
efici
t at
the
nex
t tw
o t
rien
nial
valu
atio
ns
Ass
et b
ack
cont
rib
utio
n ar
rang
emen
t us
ing
mat
urin
g w
hisk
y
Exp
eria
n
Par
ent
com
pan
y g
uara
ntee
Fre
snill
o
G4
S
A s
hare
of
any
pro
ceed
s fr
om
mat
eria
l dis
po
sals
will
be
pai
d t
o t
he p
ensi
on
sche
me
Ad
dit
iona
l co
ntri
but
ions
if d
ivid
end
pay
men
ts b
etw
een
2013
and
20
15 e
xcee
d a
sp
ecifi
ed le
vel
GK
N
C
om
mit
men
t to
mak
e ad
dit
iona
l co
ntri
but
ions
dep
end
ing
on
asse
t p
erfo
rman
ce
Ass
et b
acke
d c
ont
rib
utio
n ar
rang
emen
t us
ing
pro
per
ty a
nd a
lice
nce
over
tra
dem
arks
Gla
xoS
mit
hKlin
e
Gle
nco
re X
stra
ta
Ham
mer
son
HS
BC
Ho
ldin
gs
IMI
A
sset
bac
ked
co
ntri
but
ion
arra
ngem
ent
- no
det
ails
of
und
erly
ing
ass
ets
dis
clo
sed
Imp
eria
l To
bac
co G
roup
Inte
rCo
ntin
enta
l Ho
tels
Gro
up
Inte
rnat
iona
l Air
lines
Gro
up
Pen
sio
n sc
hem
es h
ave
acce
ss t
o le
tter
s o
f cr
edit
to
talli
ng €
274
mill
ion
whi
ch a
re s
ecur
ed o
n ai
rcra
ft
Inte
rtek
Gro
up
ITV
Ad
dit
iona
l co
ntri
but
ions
of
10%
of
EB
ITA
ove
r a
thre
sho
ld le
vel,
sub
ject
to
an
annu
al c
ap o
f £
70m
, ove
r th
e
per
iod
fro
m 2
015
to
20
20
Ass
et b
acke
d c
ont
rib
utio
n ar
rang
emen
t us
ing
inve
stm
ent
in a
gro
up c
om
pan
y
John
son
Mat
they
A
sset
bac
ked
co
ntri
but
ion
arra
ngem
ent
usin
g t
hird
par
ty c
orp
ora
te b
ond
s

65LCP Accounting for Pensions 2014
Appendix 3: Summary of disclosed non-cash funding arrangements
Company guarantee
Contributions to escrow account/trust
Charge over assets/ other security
Contributions based on company performance
Contributions contingent on other events
Asset backed funding arrangement
Notes
Kin
gfi
sher
A
sset
bac
ked
co
ntri
but
ion
arra
ngem
ent
usin
g U
K p
rop
erty
Land
Sec
urit
ies
Gro
up
Leg
al &
Gen
eral
Gro
up
Co
mp
any
gua
rant
ee
Lloy
ds
Ban
king
Gro
up
Ass
et b
acke
d c
ont
rib
utio
n ar
rang
emen
t us
ing
no
tes
in g
roup
's s
ecur
itis
atio
n p
rog
ram
mes
Lond
on
Sto
ck E
xcha
nge
Gro
up
Mar
ks &
Sp
ence
r G
roup
A
sset
bac
ked
co
ntri
but
ion
arra
ngem
ent
usin
g p
rop
erty
Meg
git
t
Mel
rose
Ind
ustr
ies
Mo
ndi G
roup
C
om
pan
y g
uara
ntee
Mo
rris
on
(Wm
) S
uper
mar
kets
A
sset
bac
ked
co
ntri
but
ion
arra
ngem
ent
usin
g p
rop
erty
Nat
iona
l Gri
d
S
ecur
ity
acco
unt
wit
h a
char
ge
in f
avo
ur o
f th
e p
ensi
on
sche
me
esta
blis
hed
Has
ag
reed
to
mak
e p
aym
ents
of
up t
o £
220
mill
ion
to o
ne o
f it
s p
ensi
on
sche
mes
sho
uld
cer
tain
tri
gg
ers
be
bre
ache
d, r
elat
ing
to
a lo
ss o
f lic
ence
or
its
cred
it r
atin
g f
allin
g b
elo
w a
gre
ed le
vels
Nex
t
Old
Mut
ual
Pea
rso
n
Acc
eler
ated
co
ntri
but
ions
if c
erta
in c
ond
itio
ns a
re m
et
Per
sim
mo
n
Ass
et b
acke
d c
ont
rib
utio
n ar
rang
emen
t us
ing
bo
nds
secu
red
on
gro
up a
sset
s
Pru
den
tial
Rec
kitt
Ben
ckis
er G
roup
C
om
pan
y g
uara
ntee
Ree
d E
lsev
ier
Res
olu
tio
n Li
mit
ed
Rex
am
C
ont
rib
utio
ns t
o e
scro
w a
cco
unt
Pen
sio
n sc
hem
e ha
s a
char
ge
over
can
ning
fac
iliti
es a
nd m
achi
nery
, enf
orc
eab
le u
p t
o 3
1 D
ecem
ber
20
17 in
the
even
t o
f a
def
ault
on
cont
rib
utio
ns t
o t
he s
chem
e o
r a
mat
eria
l dec
line
in t
he s
tren
gth
of
the
emp
loye
r’s
cove
nant
Rio
Tin
to
Co
mp
any
gua
rant
ee
Ro
lls-R
oyce
Ho
ldin
gs
RB
S
Roy
al D
utch
She
ll

66 LCP Accounting for Pensions 2014
Appendix 3: Summary of disclosed non-cash funding arrangements
Company guarantee
Contributions to escrow account/trust
Charge over assets/ other security
Contributions based on company performance
Contributions contingent on other events
Asset backed funding arrangement
Notes
Roy
al M
ail
RS
A In
sura
nce
Gro
up
SA
BM
iller
Sag
e G
roup
(T
he)
Sai
nsb
ury
(J)
A
sset
bac
ked
co
ntri
but
ion
arra
ngem
ent
usin
g p
rop
erty
Sch
rod
ers
Sco
ttis
h &
So
uthe
rn E
nerg
y
Co
mp
any
gua
rant
ee
Sev
ern
Tren
t
Ass
et b
acke
d c
ont
rib
utio
n ar
rang
emen
t -
no d
etai
ls o
f un
der
lyin
g a
sset
s d
iscl
ose
d
Sm
ith
& N
ephe
w
Co
mp
any
gua
rant
ee
Sm
iths
Gro
up
C
om
pan
y g
uara
ntee
Sp
ort
s D
irec
t
Sta
ndar
d C
hart
ered
Sta
ndar
d L
ife
C
om
pan
y g
uara
ntee
Tate
& L
yle
Tesc
o
Trav
is P
erki
ns
Ass
et b
acke
d c
ont
rib
utio
n ar
rang
emen
t us
ing
pro
per
ty
TU
I Tra
vel
Co
ntri
but
ions
to
esc
row
acc
oun
t
Ass
et b
acke
d c
ont
rib
utio
n ar
rang
emen
t us
ing
co
mp
any
bra
nds
Uni
leve
r
Uni
ted
Uti
litie
s G
roup
A
dd
itio
nal c
ont
rib
utio
ns p
ayab
le in
per
iod
s w
here
infl
atio
n ex
ceed
s 3%
pa
Vo
daf
one
Gro
up
P
aren
t co
mp
any
gua
rant
ee
Cha
rge
over
UK
gov
ernm
ent
bo
nds
held
by
the
com
pan
y
Wei
r G
roup
(T
he)
Whi
tbre
ad
Cha
rge
over
pro
per
ty
Co
mm
itm
ent
to p
ay a
dd
itio
nal c
ont
rib
utio
ns s
houl
d d
ivid
end
s in
crea
se b
y m
ore
tha
n R
PI
Ass
et b
acke
d f
und
ing
arr
ang
emen
t us
ing
pro
per
ty
Will
iam
Hill
Wo
lsel
ey
WP
P


LCP Accounting for Pensions 2014
Bob Scott
+44 (0)20 7439 2266
Nick Bunch
+44 (0)20 7439 2266
UK
c0
814
/08
14
All rights to this document are reserved to Lane Clark & Peacock LLP (“LCP”). This document may be reproduced in whole or in part, provided prominent acknowledgement of the source is given.
We accept no liability to anyone to whom this document has been provided (with or without our consent). Lane Clark & Peacock LLP is a limited liability partnership registered in England and
Wales with registered number OC301436. LCP is a registered trademark in the UK (Regd. TM No 2315442) and in the EU (Regd. TM No 002935583). All partners are members of Lane Clark &
Peacock LLP. A list of members’ names is available for inspection at 95 Wigmore Street, London W1U 1DQ, the firm’s principal place of business and registered office. The firm is regulated by the
Institute and Faculty of Actuaries in respect of a range of investment business activities. The firm is not authorised under the Financial Services and Markets Act 2000 but we are able in certain
circumstances to offer a limited range of investment services to clients because we are licensed by the Institute and Faculty of Actuaries. We can provide these investment services if they are an
incidental part of the professional services we have been engaged to provide. Lane Clark & Peacock UAE operates under legal name “Lane Clark & Peacock Belgium – Abu Dhabi, Foreign Branch of
Belgium”. © Lane Clark & Peacock LLP 2014.
Lane Clark & Peacock LLP
London, UK
Tel: +44 (0)20 7439 2266
Lane Clark & Peacock LLP
Winchester, UK
Tel: +44 (0)1962 870060
Lane Clark & Peacock Belgium CVBA
Brussels, Belgium
Tel: +32 (0)2 761 45 45
Lane Clark & Peacock Ireland Limited
Dublin, Ireland
Tel: +353 (0)1 614 43 93
Lane Clark & Peacock UAE
Abu Dhabi, UAE
Tel: +971 (0)2 658 7671
Lane Clark & Peacock Netherlands B.V.
Utrecht, Netherlands
Tel: +31 (0)30 256 76 30
LCP is a firm of financial, actuarial and business consultants, specialising in the areas of pensions, investment,
insurance and business analytics.