Embed Size (px)
Citation preview
8/3/2019 uk trading & value indicator 20120106
http://slidepdf.com/reader/full/uk-trading-value-indicator-20120106 1/25
06 January 2012
UK Trading &
ValueIndicator
8/3/2019 uk trading & value indicator 20120106
http://slidepdf.com/reader/full/uk-trading-value-indicator-20120106 2/25
Intellisys www.intellisys.uk.com 06 January 2012
Page 2 of 25 ©Intellisys 06 January 2012
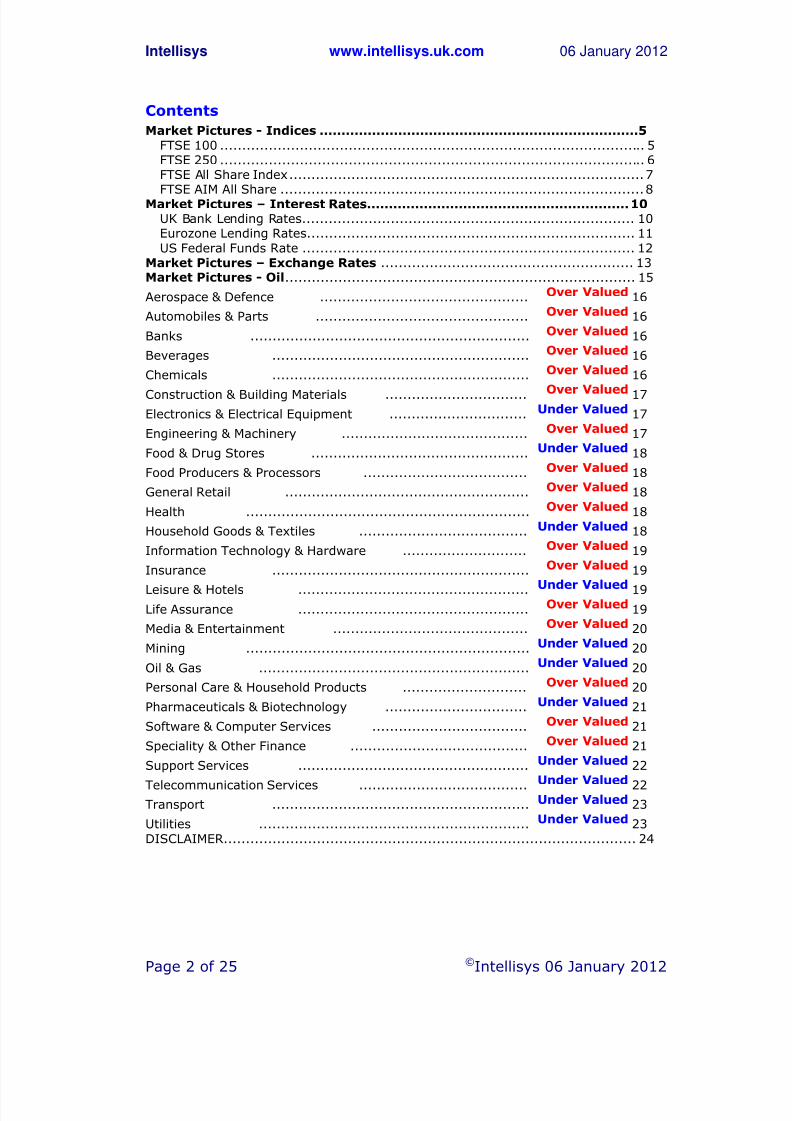
Contents
Market Pictures - Indices .........................................................................5
FTSE 100 ................................................................................................ 5 FTSE 250 ................................................................................................ 6 FTSE All Share Index................................................................................7 FTSE AIM All Share ..................................................................................8
Market Pictures – Interest Rates............................................................10 UK Bank Lending Rates........................................................................... 10 Eurozone Lending Rates.......................................................................... 11 US Federal Funds Rate ........................................................................... 12
Market Pictures – Exchange Rates ......................................................... 13 Market Pictures - Oil............................................................................... 15 Aerospace & Defence ............................................... Over Valued 16 Automobiles & Parts ................................................ Over Valued 16 Banks ............................................................... Over Valued 16 Beverages .......................................................... Over Valued 16 Chemicals .......................................................... Over Valued 16 Construction & Building Materials ................................ Over Valued 17 Electronics & Electrical Equipment ............................... Under Valued 17 Engineering & Machinery .......................................... Over Valued 17 Food & Drug Stores ................................................. Under Valued 18 Food Producers & Processors ..................................... Over Valued 18 General Retail ....................................................... Over Valued 18 Health ................................................................ Over Valued 18 Household Goods & Textiles ...................................... Under Valued 18 Information Technology & Hardware ............................ Over Valued 19 Insurance .......................................................... Over Valued 19 Leisure & Hotels .................................................... Under Valued 19 Life Assurance .................................................... Over Valued 19 Media & Entertainment ............................................ Over Valued 20 Mining ................................................................ Under Valued 20 Oil & Gas ............................................................. Under Valued 20 Personal Care & Household Products ............................ Over Valued 20 Pharmaceuticals & Biotechnology ................................ Under Valued 21 Software & Computer Services ................................... Over Valued 21 Speciality & Other Finance ........................................ Over Valued 21 Support Services .................................................... Under Valued 22 Telecommunication Services ...................................... Under Valued 22 Transport .......................................................... Under Valued 23 Utilities ............................................................. Under Valued 23 DISCLAIMER............................................................................................. 24
8/3/2019 uk trading & value indicator 20120106
http://slidepdf.com/reader/full/uk-trading-value-indicator-20120106 3/25
Intellisys www.intellisys.uk.com 06 January 2012
Page 3 of 25 ©Intellisys 06 January 2012
IntroductionThe overriding purpose of this daily report is to provide users with a quick guidethat will identify those shares that merit their investment attention in anincreasingly time critical and information noisy trading environment.
The report is published daily and delivered to the subscriber’s personal email box,typically, before the official open of the London Stock Markets.
Putting aside luck, Intellisys recognises that the timing and value of an
investment are the two primary drivers behind a successful portfolio performance.
TimingIntellisys has invested considerably in identifying what it believes are the keyfactors that influence investment timing. Having identified the key parameters,these have been established as rules that reflect market dynamics and cutthrough the daily investment noise.
Through this discipline, Intellisys has removed the emotional and sentimentalfactors as well as the daily pressures exerted upon primary stock promoters
(analysts and traders) to find stories for their investment meetings.
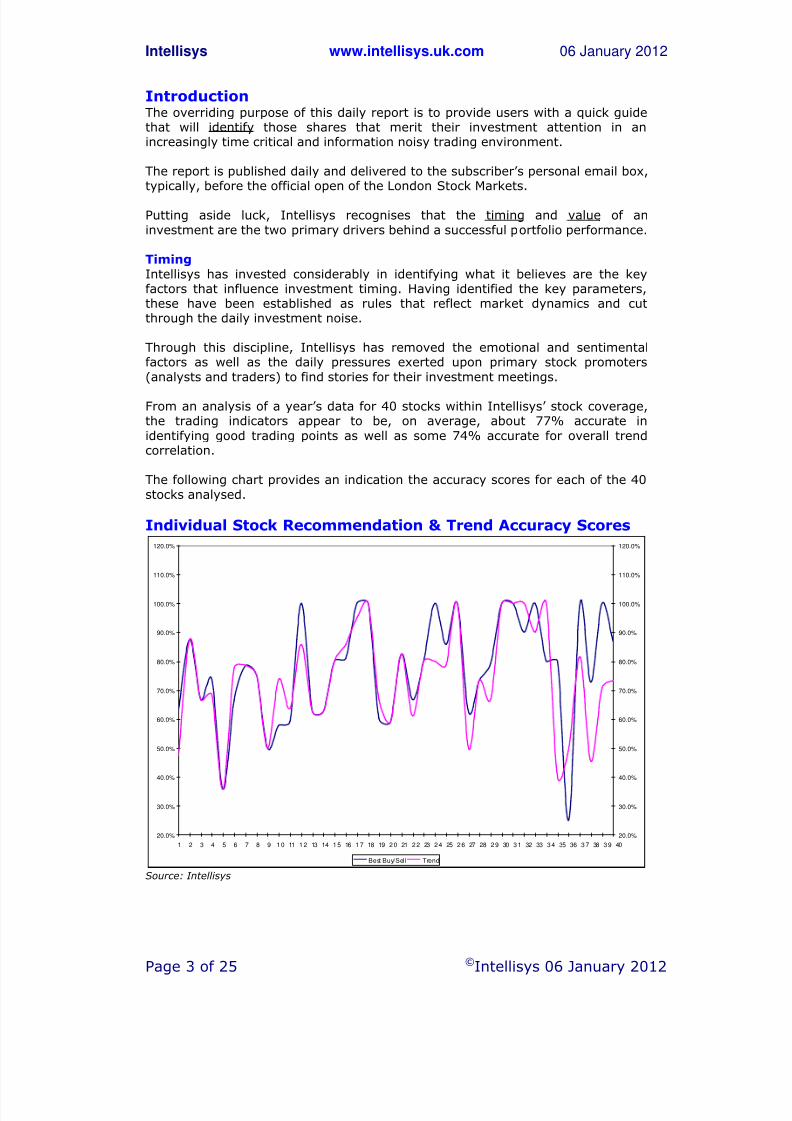
From an analysis of a year’s data for 40 stocks within Intellisys’ stock coverage,the trading indicators appear to be, on average, about 77% accurate in
identifying good trading points as well as some 74% accurate for overall trendcorrelation.
The following chart provides an indication the accuracy scores for each of the 40
stocks analysed.
Individual Stock Recommendation & Trend Accuracy Scores
20.0%
30.0%
40.0%
50.0%
60.0%
70.0%
80.0%
90.0%
100.0%
110.0%
120.0%
1 2 3 4 5 6 7 8 9 10 11 12 13 14 15 16 17 18 19 20 21 22 23 24 25 26 27 28 29 30 31 32 33 34 35 36 37 38 39 40
20.0%
30.0%
40.0%
50.0%
60.0%
70.0%
80.0%
90.0%
100.0%
110.0%
120.0%
Best Buy/Sell Trend
Source: Intellisys
8/3/2019 uk trading & value indicator 20120106
http://slidepdf.com/reader/full/uk-trading-value-indicator-20120106 4/25
8/3/2019 uk trading & value indicator 20120106
http://slidepdf.com/reader/full/uk-trading-value-indicator-20120106 5/25
Intellisys www.intellisys.uk.com 06 January 2012
Page 5 of 25 ©Intellisys 06 January 2012
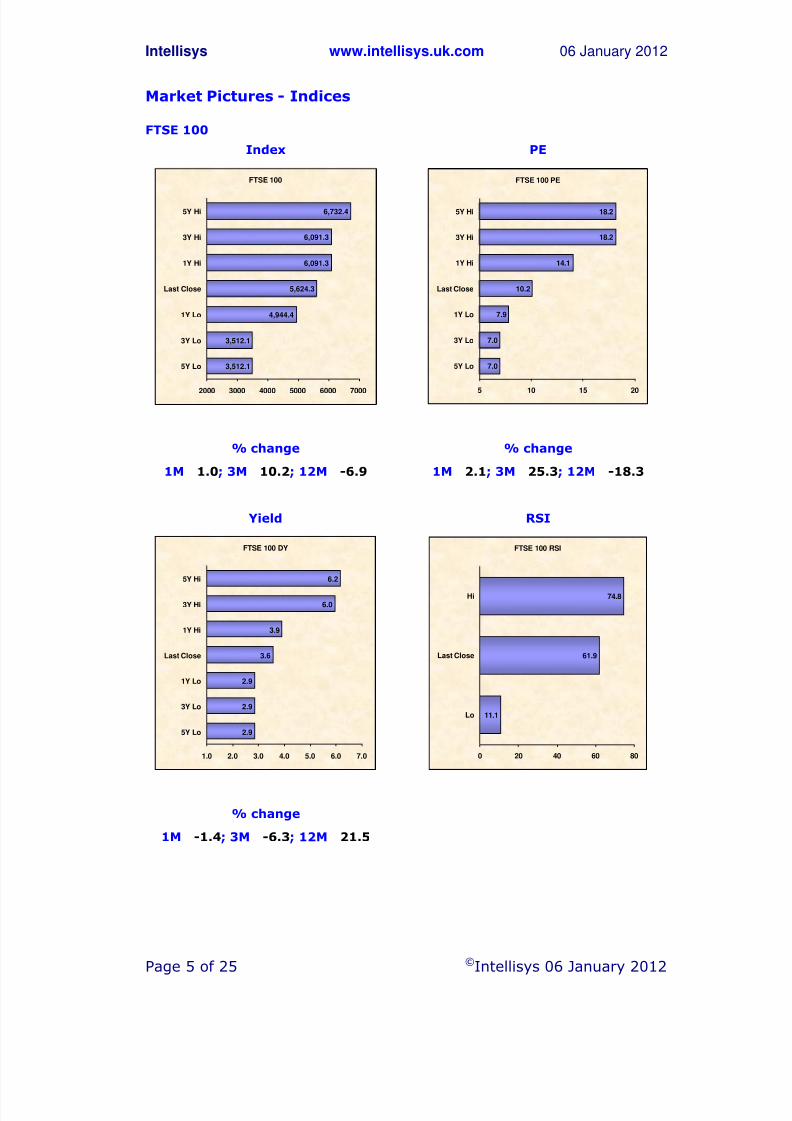
Market Pictures - Indices
FTSE 100
Index PE
FTSE 100
3,512.1
3,512.1
4,944.4
6,091.3
6,091.3
6,732.4
5,624.3
2000 3000 4000 5000 6000 7000
5Y Lo
3Y Lo
1Y Lo
Last Close
1Y Hi
3Y Hi
5Y Hi
FTSE 100 PE
7.0
7.0
7.9
10.2
14.1
18.2
18.2
5 10 15 20
5Y Lo
3Y Lo
1Y Lo
Last Close
1Y Hi
3Y Hi
5Y Hi
% change % change
1M 1.0; 3M 10.2; 12M -6.9 1M 2.1; 3M 25.3; 12M -18.3
Yield RSI
FTSE 100 DY
2.9
2.9
2.9
3.6
3.9
6.0
6.2
1.0 2.0 3.0 4.0 5.0 6.0 7.0
5Y Lo
3Y Lo
1Y Lo
Last Close
1Y Hi
3Y Hi
5Y Hi
FTSE 100 RSI
11.1
61.9
74.8
0 20 40 60 80
Lo
Last Close
Hi
% change
1M -1.4; 3M -6.3; 12M 21.5
8/3/2019 uk trading & value indicator 20120106
http://slidepdf.com/reader/full/uk-trading-value-indicator-20120106 6/25
Intellisys www.intellisys.uk.com 06 January 2012
Page 6 of 25 ©Intellisys 06 January 2012
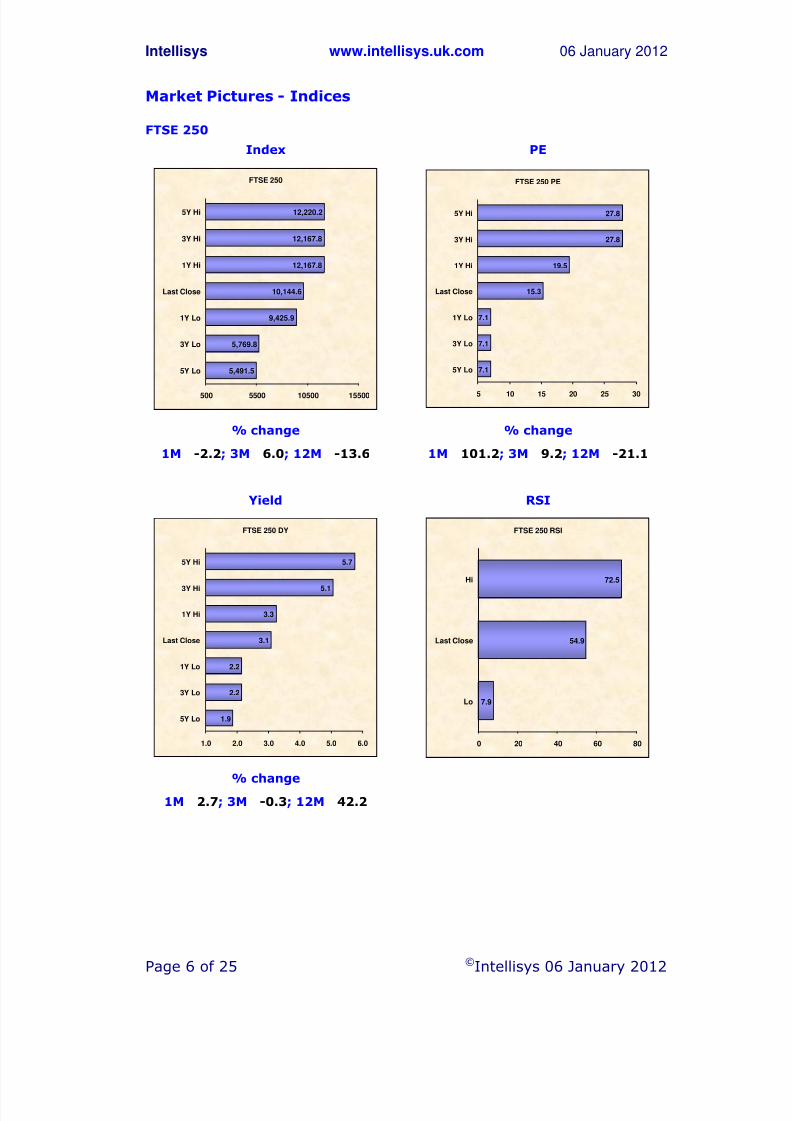
Market Pictures - Indices
FTSE 250
Index PE
FTSE 250
5,491.5
5,769.8
9,425.9
10,144.6
12,167.8
12,167.8
12,220.2
500 5500 10500 15500
5Y Lo
3Y Lo
1Y Lo
Last Close
1Y Hi
3Y Hi
5Y Hi
FTSE 250 PE
7.1
7.1
7.1
15.3
19.5
27.8
27.8
5 10 15 20 25 30
5Y Lo
3Y Lo
1Y Lo
Last Close
1Y Hi
3Y Hi
5Y Hi
% change % change
1M -2.2; 3M 6.0; 12M -13.6 1M 101.2; 3M 9.2; 12M -21.1
Yield RSI
FTSE 250 DY
1.9
2.2
2.2
3.1
3.3
5.1
5.7
1.0 2.0 3.0 4.0 5.0 6.0
5Y Lo
3Y Lo
1Y Lo
Last Close
1Y Hi
3Y Hi
5Y Hi
FTSE 250 RSI
7.9
54.9
72.5
0 20 40 60 80
Lo
Last Close
Hi
% change
1M 2.7; 3M -0.3; 12M 42.2
8/3/2019 uk trading & value indicator 20120106
http://slidepdf.com/reader/full/uk-trading-value-indicator-20120106 7/25
Intellisys www.intellisys.uk.com 06 January 2012
Page 7 of 25 ©Intellisys 06 January 2012
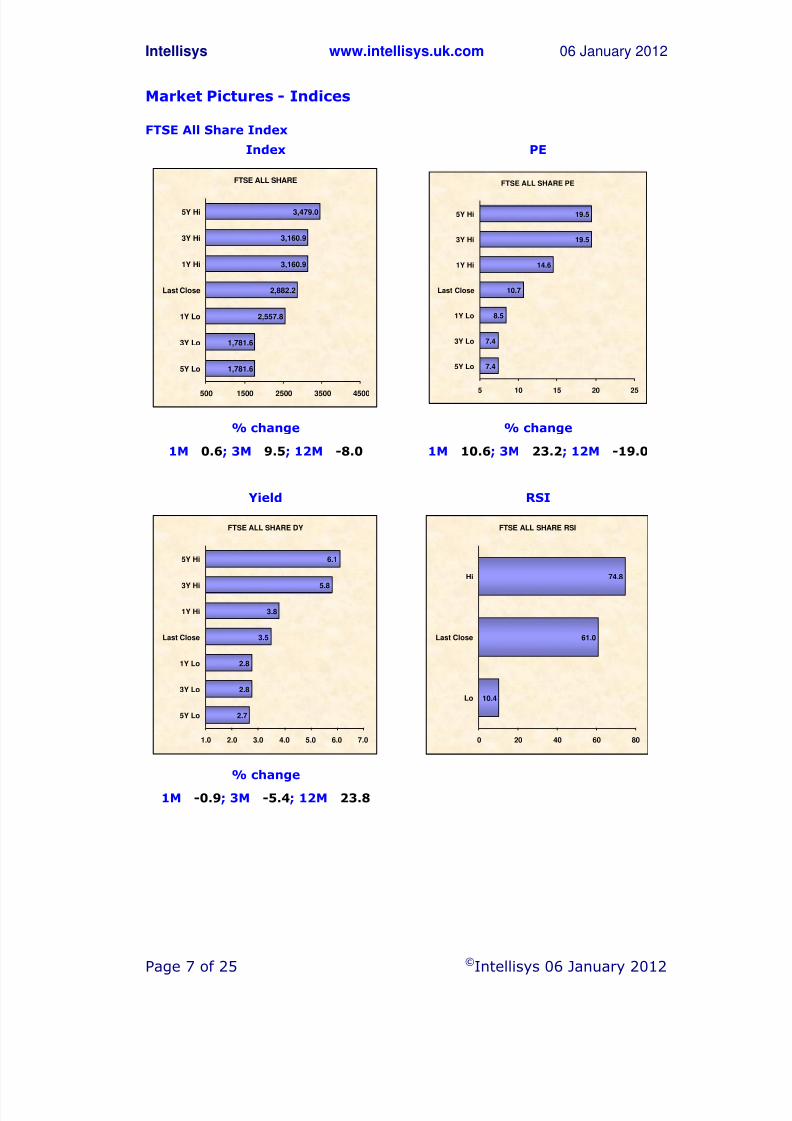
Market Pictures - Indices
FTSE All Share Index
Index PE
FTSE ALL SHARE
1,781.6
1,781.6
2,557.8
2,882.2
3,160.9
3,160.9
3,479.0
500 1500 2500 3500 4500
5Y Lo
3Y Lo
1Y Lo
Last Close
1Y Hi
3Y Hi
5Y Hi
FTSE ALL SHARE PE
7.4
7.4
8.5
10.7
14.6
19.5
19.5
5 10 15 20 25
5Y Lo
3Y Lo
1Y Lo
Last Close
1Y Hi
3Y Hi
5Y Hi
% change % change
1M 0.6; 3M 9.5; 12M -8.0 1M 10.6; 3M 23.2; 12M -19.0
Yield RSI
FTSE ALL SHARE DY
2.7
2.8
2.8
3.5
3.8
5.8
6.1
1.0 2.0 3.0 4.0 5.0 6.0 7.0
5Y Lo
3Y Lo
1Y Lo
Last Close
1Y Hi
3Y Hi
5Y Hi
FTSE ALL SHARE RSI
10.4
61.0
74.8
0 20 40 60 80
Lo
Last Close
Hi
% change
1M -0.9; 3M -5.4; 12M 23.8
8/3/2019 uk trading & value indicator 20120106
http://slidepdf.com/reader/full/uk-trading-value-indicator-20120106 8/25
Intellisys www.intellisys.uk.com 06 January 2012
Page 8 of 25 ©Intellisys 06 January 2012
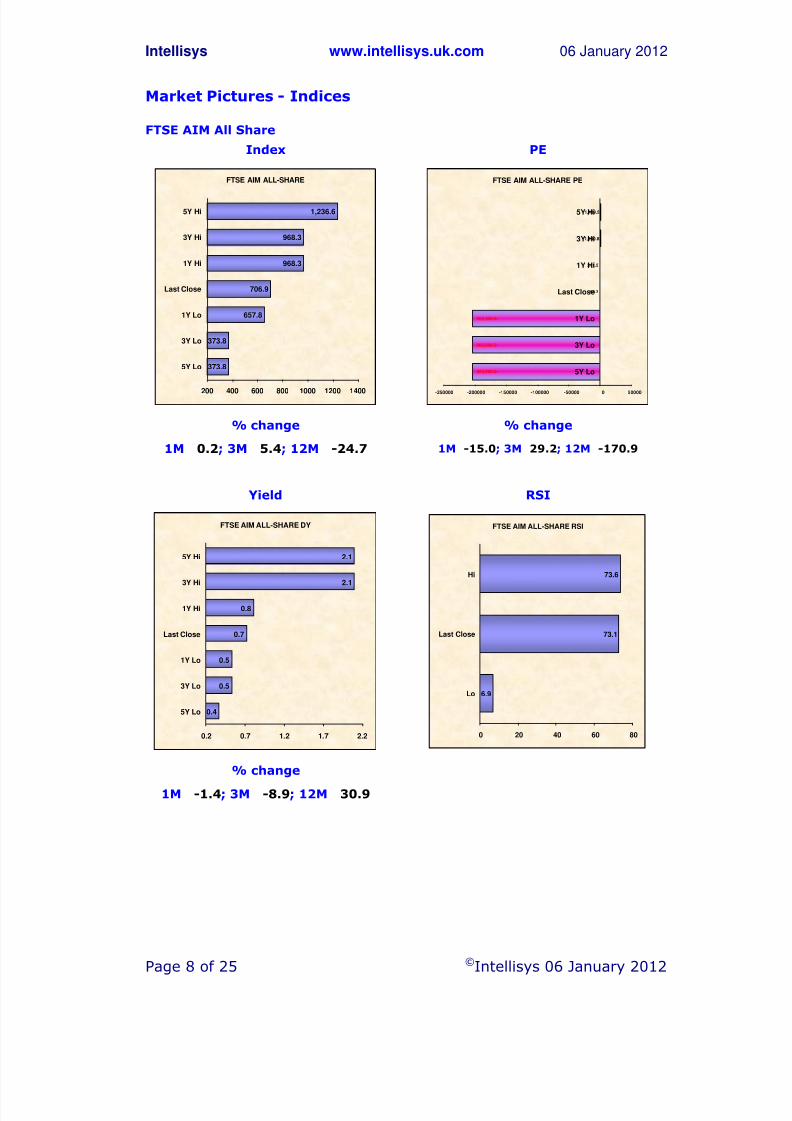
Market Pictures - Indices
FTSE AIM All Share
Index PE
FTSE AIM ALL-SHARE
373.8
373.8
657.8
706.9
968.3
968.3
1,236.6
200 400 600 800 1000 1200 1400
5Y Lo
3Y Lo
1Y Lo
Last Close
1Y Hi
3Y Hi
5Y Hi
FTSE AIM ALL-SHARE PE
203,906.0-
203,906.0-
203,906.0-
98.3
211.5
1,240.8
1,439.5
-250000 -200000 -150000 -100000 -50000 0 50000
5Y Lo
3Y Lo
1Y Lo
Last Close
1Y Hi
3Y Hi
5Y Hi
% change % change
1M 0.2; 3M 5.4; 12M -24.7 1M -15.0; 3M 29.2; 12M -170.9
Yield RSI
FTSE AIM ALL-SHARE DY
0.4
0.5
0.5
0.7
0.8
2.1
2.1
0.2 0.7 1.2 1.7 2.2
5Y Lo
3Y Lo
1Y Lo
Last Close
1Y Hi
3Y Hi
5Y Hi
FTSE AIM ALL-SHARE RSI
6.9
73.1
73.6
0 20 40 60 80
Lo
Last Close
Hi
% change
1M -1.4; 3M -8.9; 12M 30.9
8/3/2019 uk trading & value indicator 20120106
http://slidepdf.com/reader/full/uk-trading-value-indicator-20120106 9/25
Intellisys www.intellisys.uk.com 06 January 2012
Page 9 of 25 ©Intellisys 06 January 2012
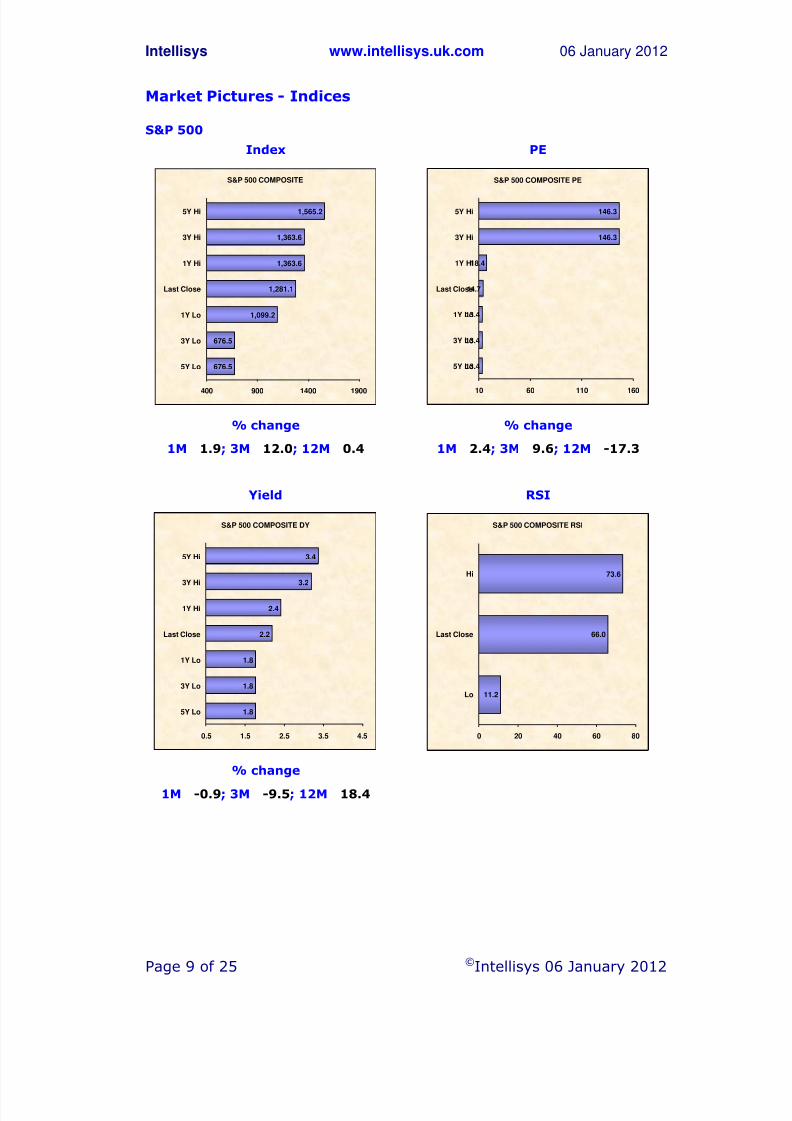
Market Pictures - Indices
S&P 500
Index PE
S&P 500 COMPOSITE
676.5
676.5
1,099.2
1,281.1
1,363.6
1,363.6
1,565.2
400 900 1400 1900
5Y Lo
3Y Lo
1Y Lo
Last Close
1Y Hi
3Y Hi
5Y Hi
S&P 500 COMPOSITE PE
13.4
13.4
13.4
14.7
18.4
146.3
146.3
10 60 110 160
5Y Lo
3Y Lo
1Y Lo
Last Close
1Y Hi
3Y Hi
5Y Hi
% change % change
1M 1.9; 3M 12.0; 12M 0.4 1M 2.4; 3M 9.6; 12M -17.3
Yield RSI
S&P 500 COMPOSITE DY
1.8
1.8
1.8
2.2
2.4
3.2
3.4
0.5 1.5 2.5 3.5 4.5
5Y Lo
3Y Lo
1Y Lo
Last Close
1Y Hi
3Y Hi
5Y Hi
S&P 500 COMPOSITE RSI
11.2
66.0
73.6
0 20 40 60 80
Lo
Last Close
Hi
% change
1M -0.9; 3M -9.5; 12M 18.4
8/3/2019 uk trading & value indicator 20120106
http://slidepdf.com/reader/full/uk-trading-value-indicator-20120106 10/25
Intellisys www.intellisys.uk.com 06 January 2012
Page 10 of 25 ©Intellisys 06 January 2012
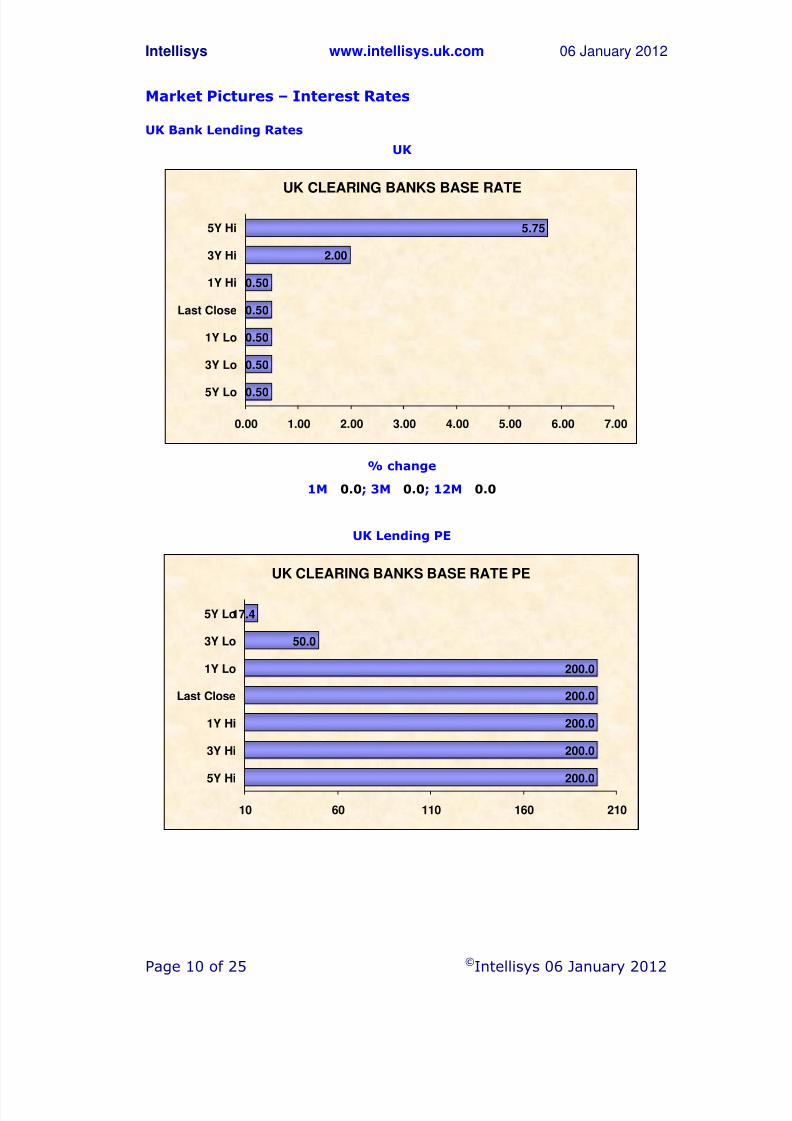
Market Pictures – Interest Rates
UK Bank Lending Rates
UK
UK CLEARING BANKS BASE RATE
0.50
0.50
0.50
0.50
0.50
2.00
5.75
0.00 1.00 2.00 3.00 4.00 5.00 6.00 7.00
5Y Lo
3Y Lo
1Y Lo
Last Close
1Y Hi
3Y Hi
5Y Hi
% change
1M 0.0; 3M 0.0; 12M 0.0
UK Lending PE
UK CLEARING BANKS BASE RATE PE
200.0
200.0
200.0
200.0
200.0
50.0
17.4
10 60 110 160 210
5Y Hi
3Y Hi
1Y Hi
Last Close
1Y Lo
3Y Lo
5Y Lo
8/3/2019 uk trading & value indicator 20120106
http://slidepdf.com/reader/full/uk-trading-value-indicator-20120106 11/25
Intellisys www.intellisys.uk.com 06 January 2012
Page 11 of 25 ©Intellisys 06 January 2012
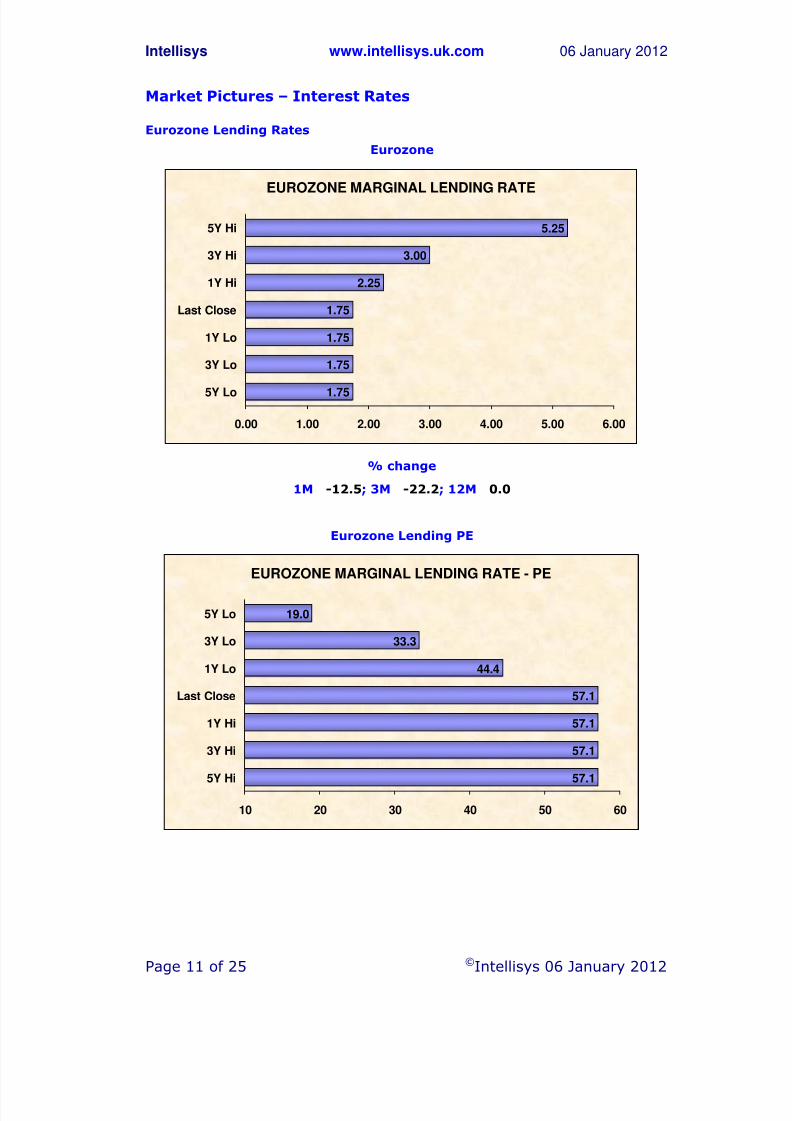
Market Pictures – Interest Rates
Eurozone Lending Rates
Eurozone
EUROZONE MARGINAL LENDING RATE
1.75
1.75
1.75
1.75
2.25
3.00
5.25
0.00 1.00 2.00 3.00 4.00 5.00 6.00
5Y Lo
3Y Lo
1Y Lo
Last Close
1Y Hi
3Y Hi
5Y Hi
% change
1M -12.5; 3M -22.2; 12M 0.0
Eurozone Lending PE
EUROZONE MARGINAL LENDING RATE - PE
57.1
57.1
57.1
57.1
44.4
33.3
19.0
10 20 30 40 50 60
5Y Hi
3Y Hi
1Y Hi
Last Close
1Y Lo
3Y Lo
5Y Lo
8/3/2019 uk trading & value indicator 20120106
http://slidepdf.com/reader/full/uk-trading-value-indicator-20120106 12/25
Intellisys www.intellisys.uk.com 06 January 2012
Page 12 of 25 ©Intellisys 06 January 2012
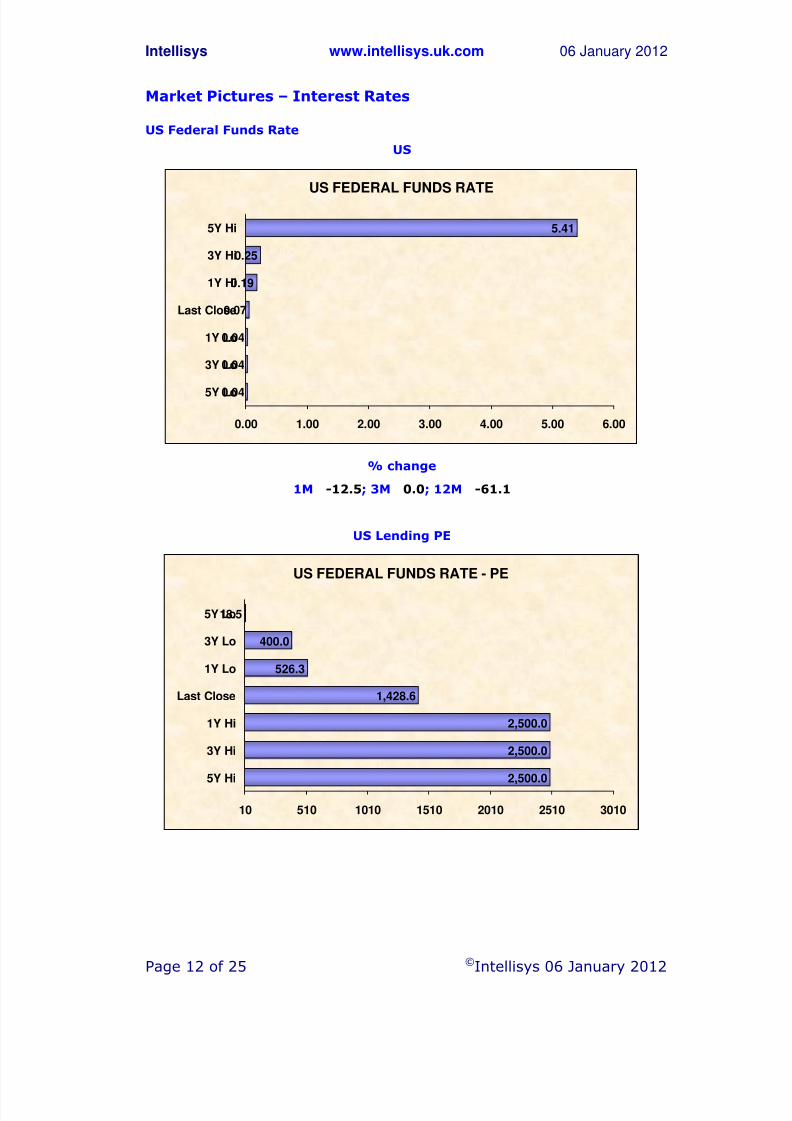
Market Pictures – Interest Rates
US Federal Funds Rate
US
US FEDERAL FUNDS RATE
0.04
0.04
0.04
0.07
0.19
0.25
5.41
0.00 1.00 2.00 3.00 4.00 5.00 6.00
5Y Lo
3Y Lo
1Y Lo
Last Close
1Y Hi
3Y Hi
5Y Hi
% change
1M -12.5; 3M 0.0; 12M -61.1
US Lending PE
US FEDERAL FUNDS RATE - PE
2,500.0
2,500.0
2,500.0
1,428.6
526.3
400.0
18.5
10 510 1010 1510 2010 2510 3010
5Y Hi
3Y Hi
1Y Hi
Last Close
1Y Lo
3Y Lo
5Y Lo
8/3/2019 uk trading & value indicator 20120106
http://slidepdf.com/reader/full/uk-trading-value-indicator-20120106 13/25
Intellisys www.intellisys.uk.com 06 January 2012
Page 13 of 25 ©Intellisys 06 January 2012
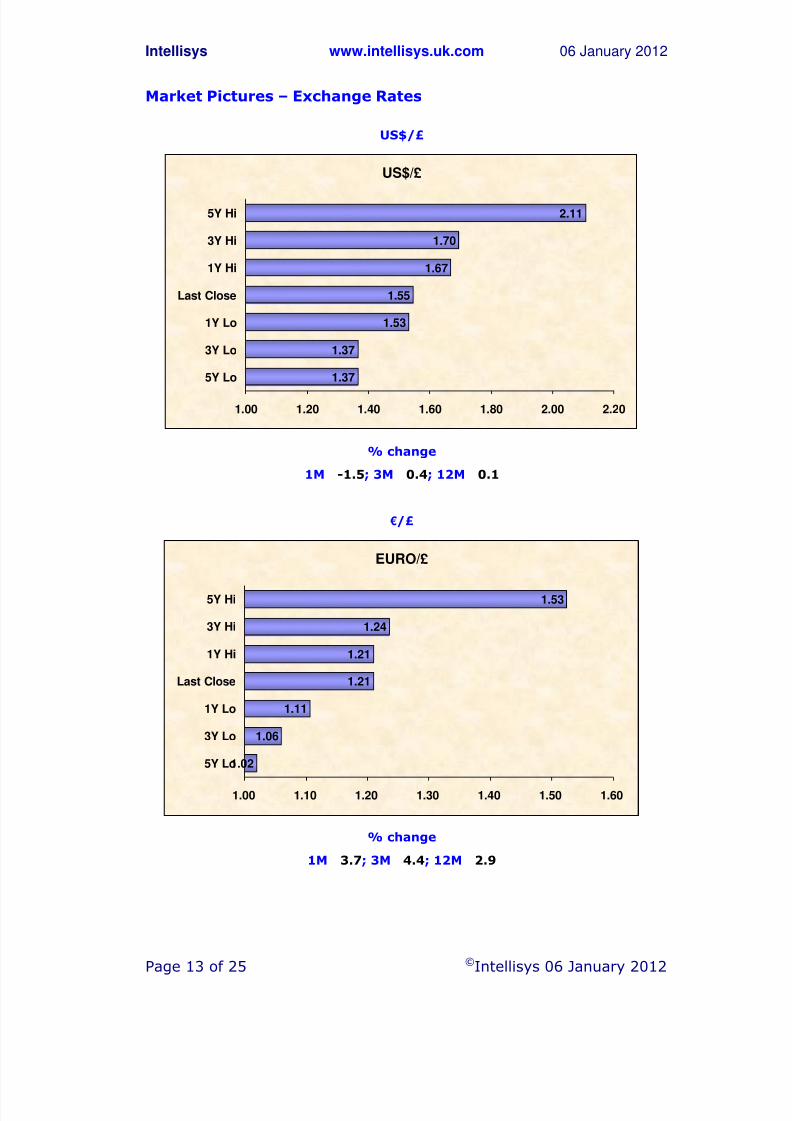
Market Pictures – Exchange Rates
US$/£
US$/£
1.37
1.37
1.53
1.55
1.67
1.70
2.11
1.00 1.20 1.40 1.60 1.80 2.00 2.20
5Y Lo
3Y Lo
1Y Lo
Last Close
1Y Hi
3Y Hi
5Y Hi
% change
1M -1.5; 3M 0.4; 12M 0.1
€/£
EURO/£
1.02
1.06
1.11
1.21
1.21
1.24
1.53
1.00 1.10 1.20 1.30 1.40 1.50 1.60
5Y Lo
3Y Lo
1Y Lo
Last Close
1Y Hi
3Y Hi
5Y Hi
% change
1M 3.7; 3M 4.4; 12M 2.9
8/3/2019 uk trading & value indicator 20120106
http://slidepdf.com/reader/full/uk-trading-value-indicator-20120106 14/25
Intellisys www.intellisys.uk.com 06 January 2012
Page 14 of 25 ©Intellisys 06 January 2012
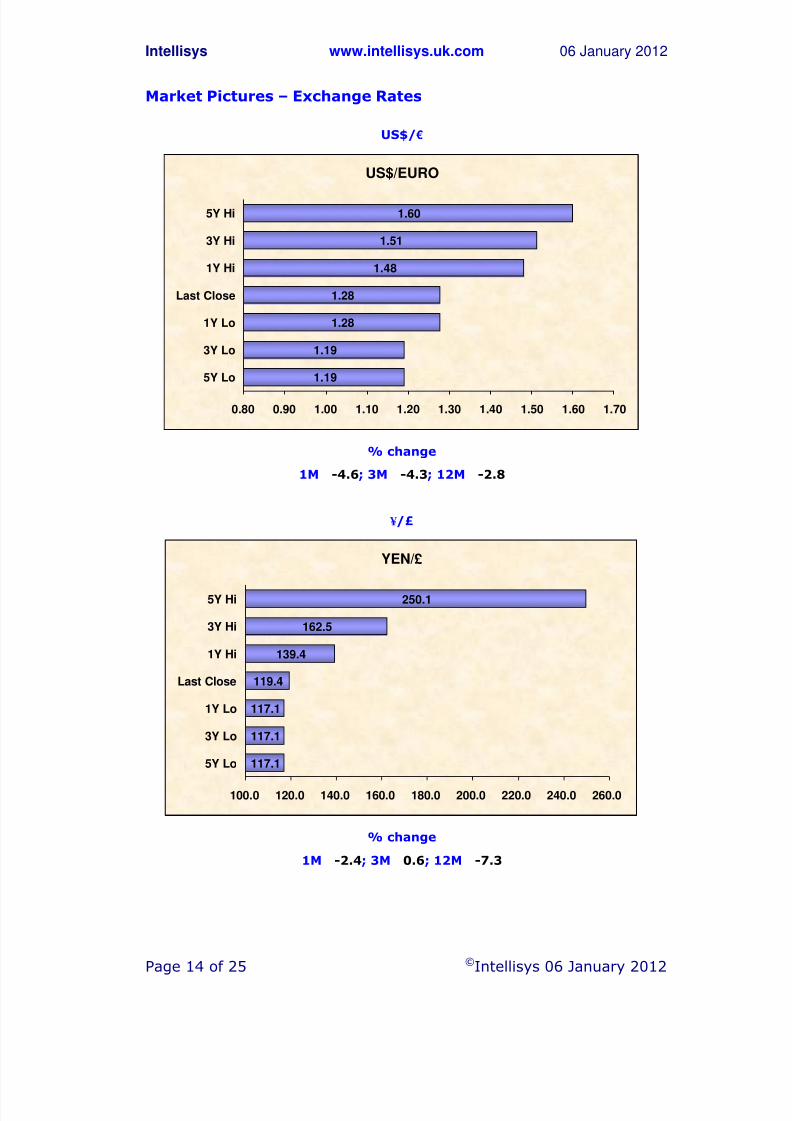
Market Pictures – Exchange Rates
US$/€
US$/EURO
1.19
1.19
1.28
1.28
1.48
1.51
1.60
0.80 0.90 1.00 1.10 1.20 1.30 1.40 1.50 1.60 1.70
5Y Lo
3Y Lo
1Y Lo
Last Close
1Y Hi
3Y Hi
5Y Hi
% change
1M -4.6; 3M -4.3; 12M -2.8
¥ /£
YEN/£
117.1
117.1
117.1
119.4
139.4
162.5
250.1
100.0 120.0 140.0 160.0 180.0 200.0 220.0 240.0 260.0
5Y Lo
3Y Lo
1Y Lo
Last Close
1Y Hi
3Y Hi
5Y Hi
% change
1M -2.4; 3M 0.6; 12M -7.3
8/3/2019 uk trading & value indicator 20120106
http://slidepdf.com/reader/full/uk-trading-value-indicator-20120106 15/25
Intellisys www.intellisys.uk.com 06 January 2012
Page 15 of 25 ©Intellisys 06 January 2012
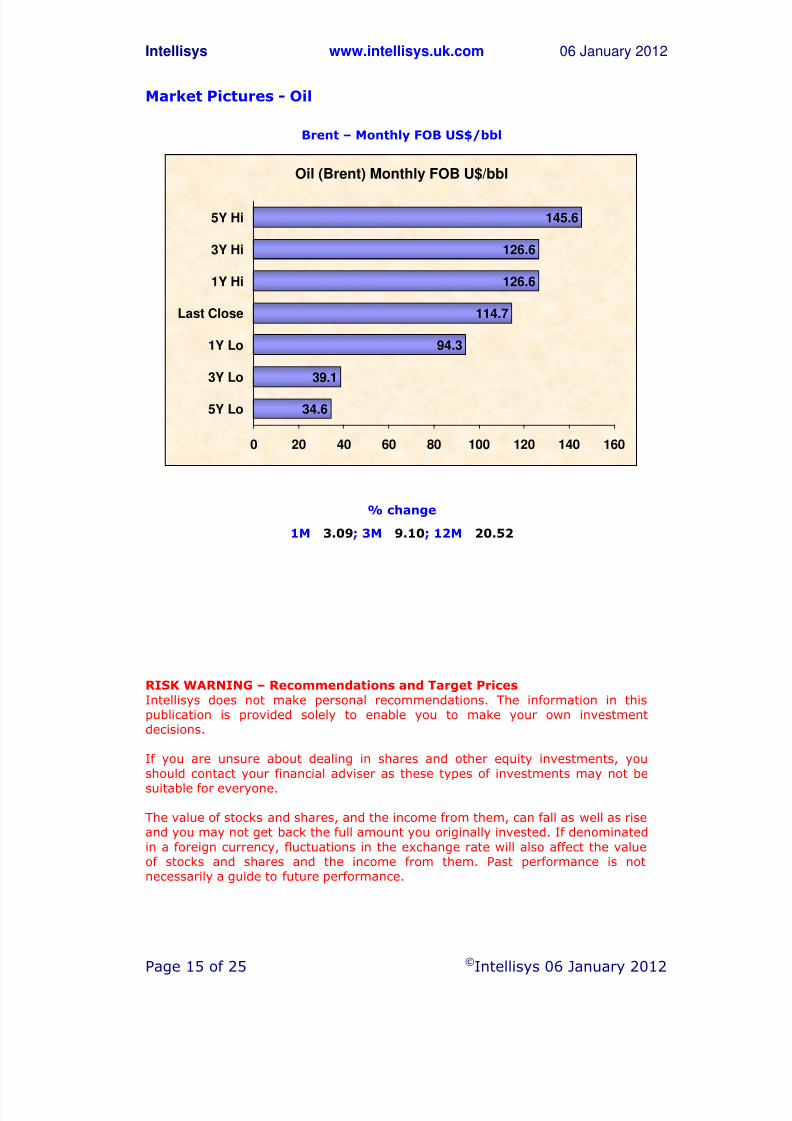
Market Pictures - Oil
Brent – Monthly FOB US$/bbl
Oil (Brent) Monthly FOB U$/bbl
34.6
39.1
94.3
114.7
126.6
126.6
145.6
0 20 40 60 80 100 120 140 160
5Y Lo
3Y Lo
1Y Lo
Last Close
1Y Hi
3Y Hi
5Y Hi
% change
1M 3.09; 3M 9.10; 12M 20.52
RISK WARNING – Recommendations and Target PricesIntellisys does not make personal recommendations. The information in thispublication is provided solely to enable you to make your own investmentdecisions.
If you are unsure about dealing in shares and other equity investments, you
should contact your financial adviser as these types of investments may not be
suitable for everyone.
The value of stocks and shares, and the income from them, can fall as well as riseand you may not get back the full amount you originally invested. If denominated
in a foreign currency, fluctuations in the exchange rate will also affect the valueof stocks and shares and the income from them. Past performance is notnecessarily a guide to future performance.
8/3/2019 uk trading & value indicator 20120106
http://slidepdf.com/reader/full/uk-trading-value-indicator-20120106 16/25
Intellisys www.intellisys.uk.com 06 January 2012
Page 16 of 25 ©Intellisys 06 January 2012
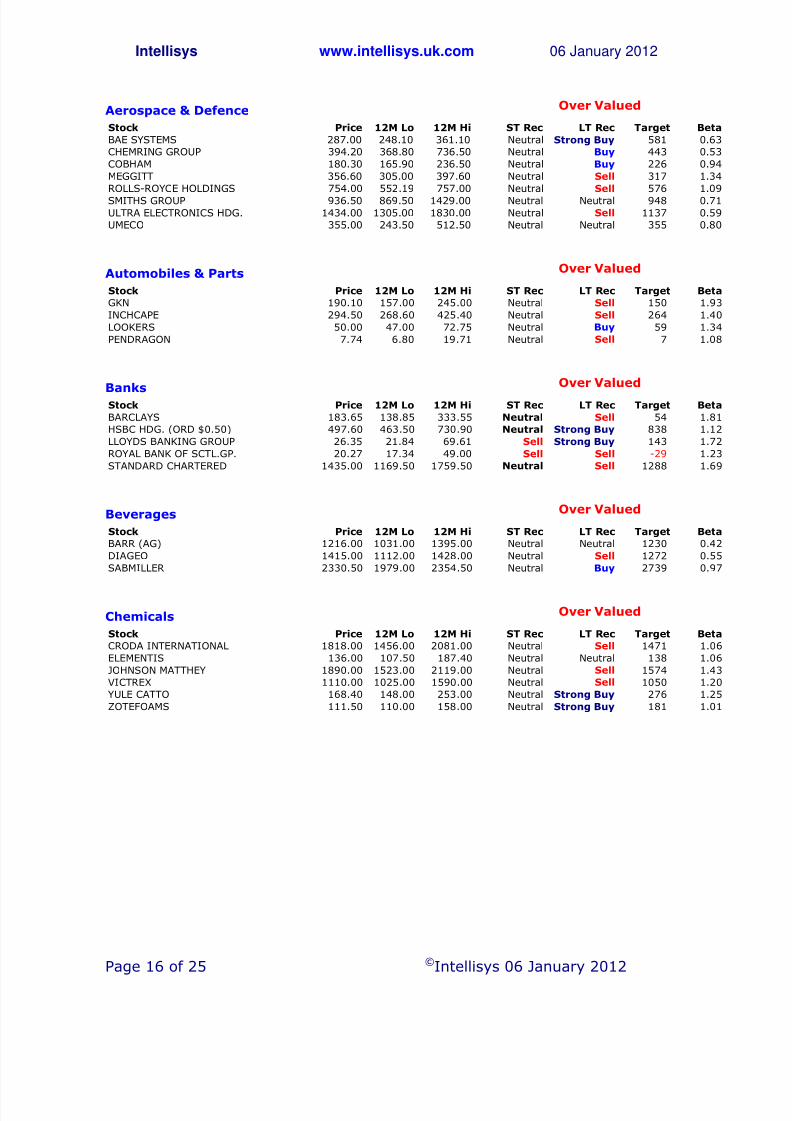
Aerospace & Defence Over Valued
Stock Price 12M Lo 12M Hi ST Rec LT Rec Target Beta
BAE SYSTEMS 287.00 248.10 361.10 Neutral Strong Buy 581 0.63
CHEMRING GROUP 394.20 368.80 736.50 Neutral Buy 443 0.53
COBHAM 180.30 165.90 236.50 Neutral Buy 226 0.94
MEGGITT 356.60 305.00 397.60 Neutral Sell 317 1.34
ROLLS-ROYCE HOLDINGS 754.00 552.19 757.00 Neutral Sell 576 1.09
SMITHS GROUP 936.50 869.50 1429.00 Neutral Neutral 948 0.71
ULTRA ELECTRONICS HDG. 1434.00 1305.00 1830.00 Neutral Sell 1137 0.59
UMECO 355.00 243.50 512.50 Neutral Neutral 355 0.80
Automobiles & Parts Over Valued
Stock Price 12M Lo 12M Hi ST Rec LT Rec Target Beta
GKN 190.10 157.00 245.00 Neutral Sell 150 1.93
INCHCAPE 294.50 268.60 425.40 Neutral Sell 264 1.40
LOOKERS 50.00 47.00 72.75 Neutral Buy 59 1.34
PENDRAGON 7.74 6.80 19.71 Neutral Sell 7 1.08
Banks
Over Valued
Stock Price 12M Lo 12M Hi ST Rec LT Rec Target Beta
BARCLAYS 183.65 138.85 333.55 Neutral Sell 54 1.81
HSBC HDG. (ORD $0.50) 497.60 463.50 730.90 Neutral Strong Buy 838 1.12
LLOYDS BANKING GROUP 26.35 21.84 69.61 Sell Strong Buy 143 1.72
ROYAL BANK OF SCTL.GP. 20.27 17.34 49.00 Sell Sell -29 1.23
STANDARD CHARTERED 1435.00 1169.50 1759.50 Neutral Sell 1288 1.69
Beverages Over Valued
Stock Price 12M Lo 12M Hi ST Rec LT Rec Target Beta
BARR (AG) 1216.00 1031.00 1395.00 Neutral Neutral 1230 0.42
DIAGEO 1415.00 1112.00 1428.00 Neutral Sell 1272 0.55
SABMILLER 2330.50 1979.00 2354.50 Neutral Buy 2739 0.97
Chemicals Over Valued
Stock Price 12M Lo 12M Hi ST Rec LT Rec Target Beta
CRODA INTERNATIONAL 1818.00 1456.00 2081.00 Neutral Sell 1471 1.06
ELEMENTIS 136.00 107.50 187.40 Neutral Neutral 138 1.06
JOHNSON MATTHEY 1890.00 1523.00 2119.00 Neutral Sell 1574 1.43
VICTREX 1110.00 1025.00 1590.00 Neutral Sell 1050 1.20
YULE CATTO 168.40 148.00 253.00 Neutral Strong Buy 276 1.25
ZOTEFOAMS 111.50 110.00 158.00 Neutral Strong Buy 181 1.01
8/3/2019 uk trading & value indicator 20120106
http://slidepdf.com/reader/full/uk-trading-value-indicator-20120106 17/25
Intellisys www.intellisys.uk.com 06 January 2012
Page 17 of 25 ©Intellisys 06 January 2012
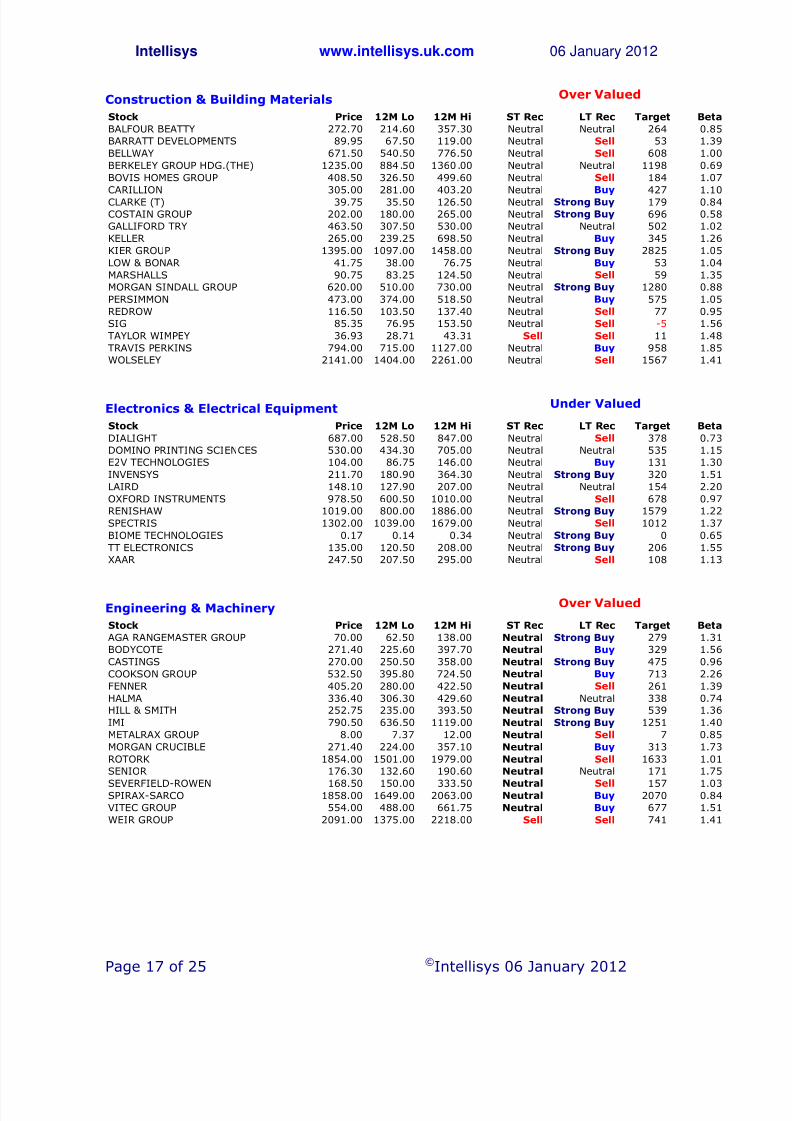
Construction & Building Materials Over Valued Stock Price 12M Lo 12M Hi ST Rec LT Rec Target Beta
BALFOUR BEATTY 272.70 214.60 357.30 Neutral Neutral 264 0.85
BARRATT DEVELOPMENTS 89.95 67.50 119.00 Neutral Sell 53 1.39
BELLWAY 671.50 540.50 776.50 Neutral Sell 608 1.00
BERKELEY GROUP HDG.(THE) 1235.00 884.50 1360.00 Neutral Neutral 1198 0.69
BOVIS HOMES GROUP 408.50 326.50 499.60 Neutral Sell 184 1.07
CARILLION 305.00 281.00 403.20 Neutral Buy 427 1.10
CLARKE (T) 39.75 35.50 126.50 Neutral Strong Buy 179 0.84
COSTAIN GROUP 202.00 180.00 265.00 Neutral Strong Buy 696 0.58
GALLIFORD TRY 463.50 307.50 530.00 Neutral Neutral 502 1.02
KELLER 265.00 239.25 698.50 Neutral Buy 345 1.26
KIER GROUP 1395.00 1097.00 1458.00 Neutral Strong Buy 2825 1.05
LOW & BONAR 41.75 38.00 76.75 Neutral Buy 53 1.04
MARSHALLS 90.75 83.25 124.50 Neutral Sell 59 1.35
MORGAN SINDALL GROUP 620.00 510.00 730.00 Neutral Strong Buy 1280 0.88
PERSIMMON 473.00 374.00 518.50 Neutral Buy 575 1.05
REDROW 116.50 103.50 137.40 Neutral Sell 77 0.95
SIG 85.35 76.95 153.50 Neutral Sell -5 1.56
TAYLOR WIMPEY 36.93 28.71 43.31 Sell Sell 11 1.48
TRAVIS PERKINS 794.00 715.00 1127.00 Neutral Buy 958 1.85
WOLSELEY 2141.00 1404.00 2261.00 Neutral Sell 1567 1.41
Electronics & Electrical Equipment Under Valued
Stock Price 12M Lo 12M Hi ST Rec LT Rec Target Beta
DIALIGHT 687.00 528.50 847.00 Neutral Sell 378 0.73
DOMINO PRINTING SCIENCES 530.00 434.30 705.00 Neutral Neutral 535 1.15
E2V TECHNOLOGIES 104.00 86.75 146.00 Neutral Buy 131 1.30
INVENSYS 211.70 180.90 364.30 Neutral Strong Buy 320 1.51
LAIRD 148.10 127.90 207.00 Neutral Neutral 154 2.20
OXFORD INSTRUMENTS 978.50 600.50 1010.00 Neutral Sell 678 0.97
RENISHAW 1019.00 800.00 1886.00 Neutral Strong Buy 1579 1.22
SPECTRIS 1302.00 1039.00 1679.00 Neutral Sell 1012 1.37
BIOME TECHNOLOGIES 0.17 0.14 0.34 Neutral Strong Buy 0 0.65
TT ELECTRONICS 135.00 120.50 208.00 Neutral Strong Buy 206 1.55
XAAR 247.50 207.50 295.00 Neutral Sell 108 1.13
Engineering & Machinery Over Valued
Stock Price 12M Lo 12M Hi ST Rec LT Rec Target Beta
AGA RANGEMASTER GROUP 70.00 62.50 138.00 Neutral Strong Buy 279 1.31
BODYCOTE 271.40 225.60 397.70 Neutral Buy 329 1.56
CASTINGS 270.00 250.50 358.00 Neutral Strong Buy 475 0.96
COOKSON GROUP 532.50 395.80 724.50 Neutral Buy 713 2.26
FENNER 405.20 280.00 422.50 Neutral Sell 261 1.39
HALMA 336.40 306.30 429.60 Neutral Neutral 338 0.74
HILL & SMITH 252.75 235.00 393.50 Neutral Strong Buy 539 1.36
IMI 790.50 636.50 1119.00 Neutral Strong Buy 1251 1.40
METALRAX GROUP 8.00 7.37 12.00 Neutral Sell 7 0.85
MORGAN CRUCIBLE 271.40 224.00 357.10 Neutral Buy 313 1.73
ROTORK 1854.00 1501.00 1979.00 Neutral Sell 1633 1.01
SENIOR 176.30 132.60 190.60 Neutral Neutral 171 1.75
SEVERFIELD-ROWEN 168.50 150.00 333.50 Neutral Sell 157 1.03SPIRAX-SARCO 1858.00 1649.00 2063.00 Neutral Buy 2070 0.84
VITEC GROUP 554.00 488.00 661.75 Neutral Buy 677 1.51
WEIR GROUP 2091.00 1375.00 2218.00 Sell Sell 741 1.41
8/3/2019 uk trading & value indicator 20120106
http://slidepdf.com/reader/full/uk-trading-value-indicator-20120106 18/25
Intellisys www.intellisys.uk.com 06 January 2012
Page 18 of 25 ©Intellisys 06 January 2012
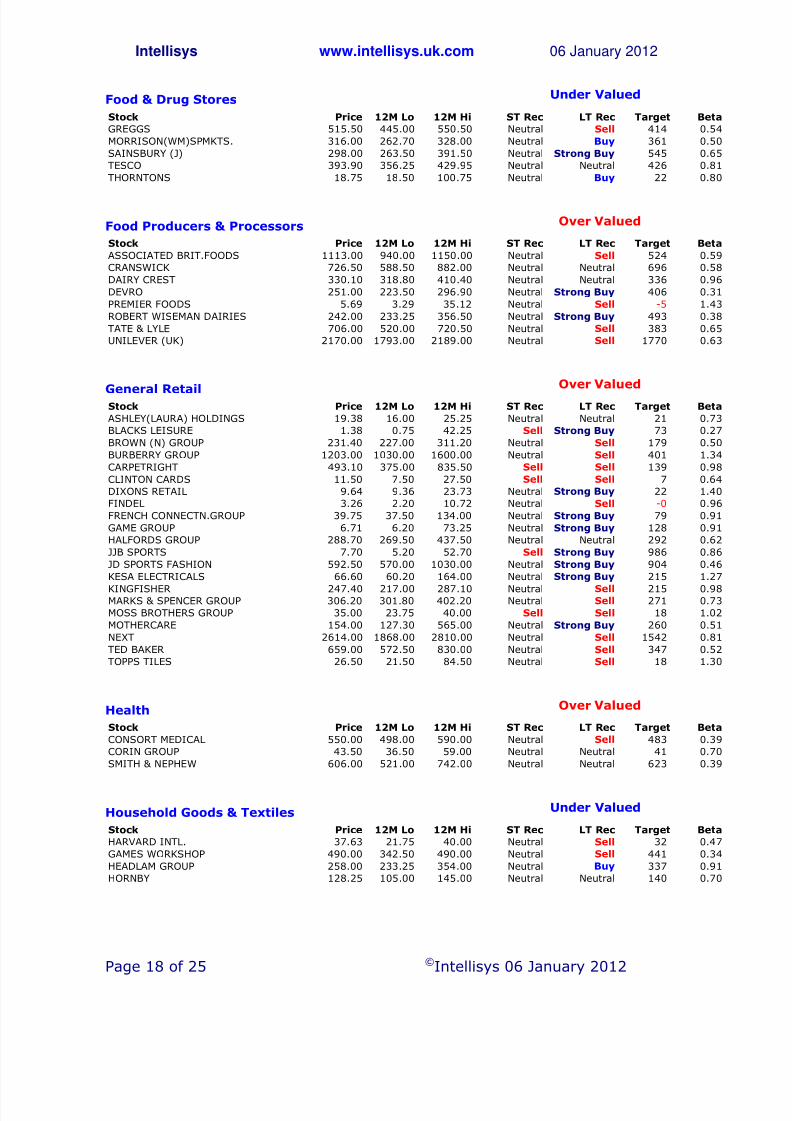
Food & Drug Stores Under Valued
Stock Price 12M Lo 12M Hi ST Rec LT Rec Target Beta
GREGGS 515.50 445.00 550.50 Neutral Sell 414 0.54
MORRISON(WM)SPMKTS. 316.00 262.70 328.00 Neutral Buy 361 0.50
SAINSBURY (J) 298.00 263.50 391.50 Neutral Strong Buy 545 0.65
TESCO 393.90 356.25 429.95 Neutral Neutral 426 0.81
THORNTONS 18.75 18.50 100.75 Neutral Buy 22 0.80
Food Producers & Processors Over Valued
Stock Price 12M Lo 12M Hi ST Rec LT Rec Target Beta
ASSOCIATED BRIT.FOODS 1113.00 940.00 1150.00 Neutral Sell 524 0.59
CRANSWICK 726.50 588.50 882.00 Neutral Neutral 696 0.58
DAIRY CREST 330.10 318.80 410.40 Neutral Neutral 336 0.96
DEVRO 251.00 223.50 296.90 Neutral Strong Buy 406 0.31
PREMIER FOODS 5.69 3.29 35.12 Neutral Sell -5 1.43
ROBERT WISEMAN DAIRIES 242.00 233.25 356.50 Neutral Strong Buy 493 0.38
TATE & LYLE 706.00 520.00 720.50 Neutral Sell 383 0.65
UNILEVER (UK) 2170.00 1793.00 2189.00 Neutral Sell 1770 0.63
General RetailOver Valued
Stock Price 12M Lo 12M Hi ST Rec LT Rec Target Beta
ASHLEY(LAURA) HOLDINGS 19.38 16.00 25.25 Neutral Neutral 21 0.73
BLACKS LEISURE 1.38 0.75 42.25 Sell Strong Buy 73 0.27
BROWN (N) GROUP 231.40 227.00 311.20 Neutral Sell 179 0.50
BURBERRY GROUP 1203.00 1030.00 1600.00 Neutral Sell 401 1.34
CARPETRIGHT 493.10 375.00 835.50 Sell Sell 139 0.98
CLINTON CARDS 11.50 7.50 27.50 Sell Sell 7 0.64
DIXONS RETAIL 9.64 9.36 23.73 Neutral Strong Buy 22 1.40
FINDEL 3.26 2.20 10.72 Neutral Sell -0 0.96
FRENCH CONNECTN.GROUP 39.75 37.50 134.00 Neutral Strong Buy 79 0.91
GAME GROUP 6.71 6.20 73.25 Neutral Strong Buy 128 0.91
HALFORDS GROUP 288.70 269.50 437.50 Neutral Neutral 292 0.62
JJB SPORTS 7.70 5.20 52.70 Sell Strong Buy 986 0.86
JD SPORTS FASHION 592.50 570.00 1030.00 Neutral Strong Buy 904 0.46
KESA ELECTRICALS 66.60 60.20 164.00 Neutral Strong Buy 215 1.27
KINGFISHER 247.40 217.00 287.10 Neutral Sell 215 0.98MARKS & SPENCER GROUP 306.20 301.80 402.20 Neutral Sell 271 0.73
MOSS BROTHERS GROUP 35.00 23.75 40.00 Sell Sell 18 1.02
MOTHERCARE 154.00 127.30 565.00 Neutral Strong Buy 260 0.51
NEXT 2614.00 1868.00 2810.00 Neutral Sell 1542 0.81
TED BAKER 659.00 572.50 830.00 Neutral Sell 347 0.52
TOPPS TILES 26.50 21.50 84.50 Neutral Sell 18 1.30
Health Over Valued
Stock Price 12M Lo 12M Hi ST Rec LT Rec Target Beta
CONSORT MEDICAL 550.00 498.00 590.00 Neutral Sell 483 0.39
CORIN GROUP 43.50 36.50 59.00 Neutral Neutral 41 0.70
SMITH & NEPHEW 606.00 521.00 742.00 Neutral Neutral 623 0.39
Household Goods & Textiles Under Valued
Stock Price 12M Lo 12M Hi ST Rec LT Rec Target Beta
HARVARD INTL. 37.63 21.75 40.00 Neutral Sell 32 0.47
GAMES WORKSHOP 490.00 342.50 490.00 Neutral Sell 441 0.34
HEADLAM GROUP 258.00 233.25 354.00 Neutral Buy 337 0.91
HORNBY 128.25 105.00 145.00 Neutral Neutral 140 0.70
8/3/2019 uk trading & value indicator 20120106
http://slidepdf.com/reader/full/uk-trading-value-indicator-20120106 19/25
Intellisys www.intellisys.uk.com 06 January 2012
Page 19 of 25 ©Intellisys 06 January 2012
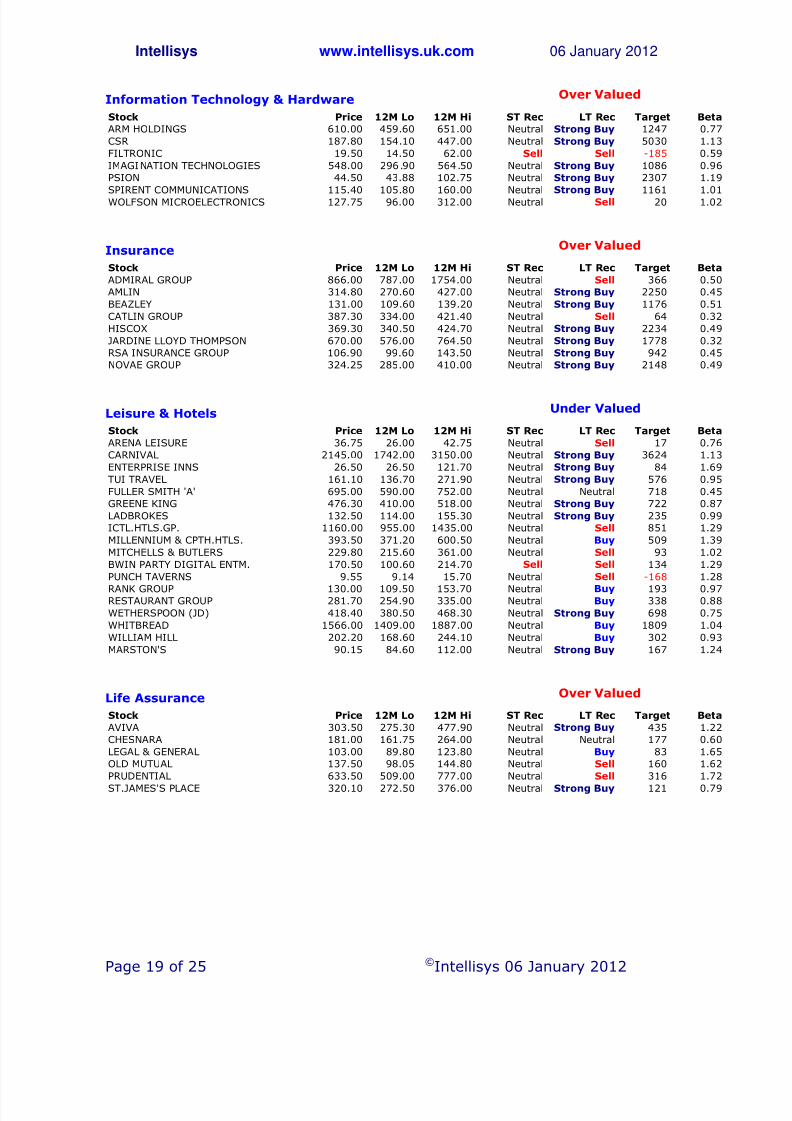
Information Technology & Hardware Over Valued
Stock Price 12M Lo 12M Hi ST Rec LT Rec Target Beta
ARM HOLDINGS 610.00 459.60 651.00 Neutral Strong Buy 1247 0.77
CSR 187.80 154.10 447.00 Neutral Strong Buy 5030 1.13
FILTRONIC 19.50 14.50 62.00 Sell Sell -185 0.59
IMAGINATION TECHNOLOGIES 548.00 296.90 564.50 Neutral Strong Buy 1086 0.96
PSION 44.50 43.88 102.75 Neutral Strong Buy 2307 1.19
SPIRENT COMMUNICATIONS 115.40 105.80 160.00 Neutral Strong Buy 1161 1.01
WOLFSON MICROELECTRONICS 127.75 96.00 312.00 Neutral Sell 20 1.02
Insurance Over Valued
Stock Price 12M Lo 12M Hi ST Rec LT Rec Target Beta
ADMIRAL GROUP 866.00 787.00 1754.00 Neutral Sell 366 0.50
AMLIN 314.80 270.60 427.00 Neutral Strong Buy 2250 0.45
BEAZLEY 131.00 109.60 139.20 Neutral Strong Buy 1176 0.51
CATLIN GROUP 387.30 334.00 421.40 Neutral Sell 64 0.32
HISCOX 369.30 340.50 424.70 Neutral Strong Buy 2234 0.49
JARDINE LLOYD THOMPSON 670.00 576.00 764.50 Neutral Strong Buy 1778 0.32
RSA INSURANCE GROUP 106.90 99.60 143.50 Neutral Strong Buy 942 0.45
NOVAE GROUP 324.25 285.00 410.00 Neutral Strong Buy 2148 0.49
Leisure & Hotels Under Valued
Stock Price 12M Lo 12M Hi ST Rec LT Rec Target Beta
ARENA LEISURE 36.75 26.00 42.75 Neutral Sell 17 0.76
CARNIVAL 2145.00 1742.00 3150.00 Neutral Strong Buy 3624 1.13
ENTERPRISE INNS 26.50 26.50 121.70 Neutral Strong Buy 84 1.69
TUI TRAVEL 161.10 136.70 271.90 Neutral Strong Buy 576 0.95
FULLER SMITH 'A' 695.00 590.00 752.00 Neutral Neutral 718 0.45
GREENE KING 476.30 410.00 518.00 Neutral Strong Buy 722 0.87
LADBROKES 132.50 114.00 155.30 Neutral Strong Buy 235 0.99
ICTL.HTLS.GP. 1160.00 955.00 1435.00 Neutral Sell 851 1.29
MILLENNIUM & CPTH.HTLS. 393.50 371.20 600.50 Neutral Buy 509 1.39
MITCHELLS & BUTLERS 229.80 215.60 361.00 Neutral Sell 93 1.02
BWIN PARTY DIGITAL ENTM. 170.50 100.60 214.70 Sell Sell 134 1.29
PUNCH TAVERNS 9.55 9.14 15.70 Neutral Sell -168 1.28
RANK GROUP 130.00 109.50 153.70 Neutral Buy 193 0.97RESTAURANT GROUP 281.70 254.90 335.00 Neutral Buy 338 0.88
WETHERSPOON (JD) 418.40 380.50 468.30 Neutral Strong Buy 698 0.75
WHITBREAD 1566.00 1409.00 1887.00 Neutral Buy 1809 1.04
WILLIAM HILL 202.20 168.60 244.10 Neutral Buy 302 0.93
MARSTON'S 90.15 84.60 112.00 Neutral Strong Buy 167 1.24
Life Assurance Over Valued
Stock Price 12M Lo 12M Hi ST Rec LT Rec Target Beta
AVIVA 303.50 275.30 477.90 Neutral Strong Buy 435 1.22
CHESNARA 181.00 161.75 264.00 Neutral Neutral 177 0.60
LEGAL & GENERAL 103.00 89.80 123.80 Neutral Buy 83 1.65
OLD MUTUAL 137.50 98.05 144.80 Neutral Sell 160 1.62
PRUDENTIAL 633.50 509.00 777.00 Neutral Sell 316 1.72
ST.JAMES'S PLACE 320.10 272.50 376.00 Neutral Strong Buy 121 0.79
8/3/2019 uk trading & value indicator 20120106
http://slidepdf.com/reader/full/uk-trading-value-indicator-20120106 20/25
Intellisys www.intellisys.uk.com 06 January 2012
Page 20 of 25 ©Intellisys 06 January 2012
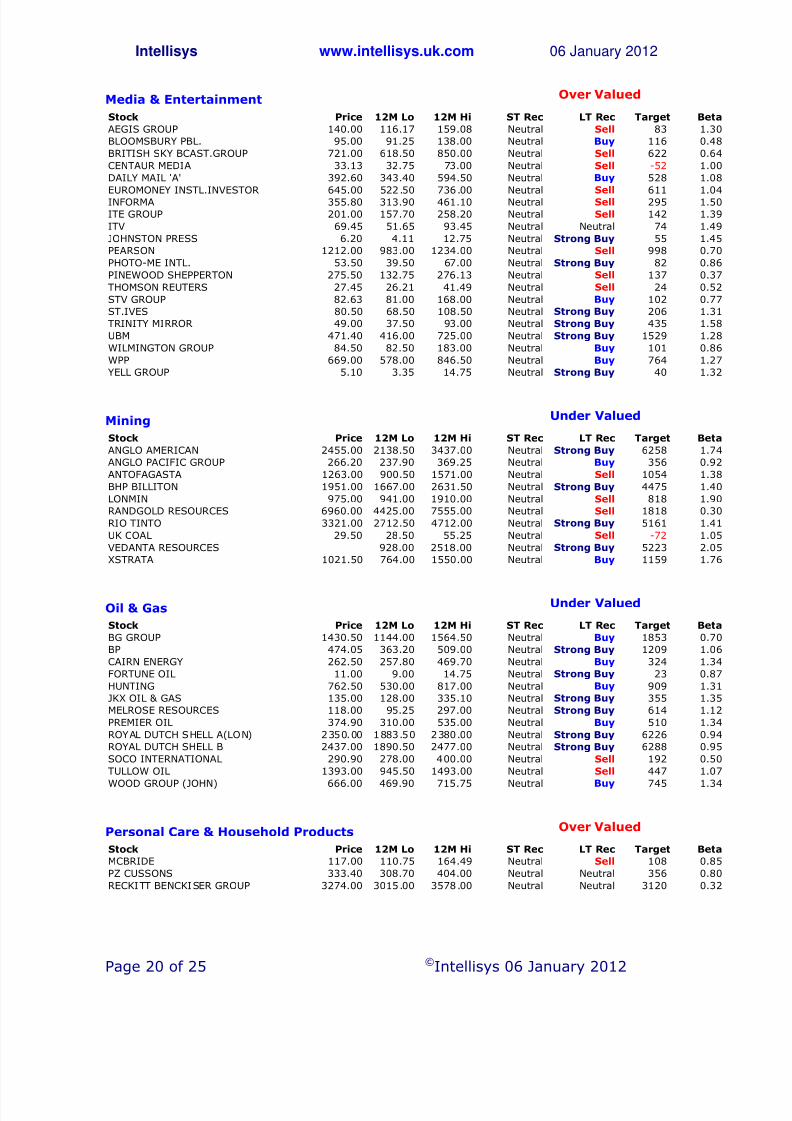
Media & Entertainment Over Valued
Stock Price 12M Lo 12M Hi ST Rec LT Rec Target Beta
AEGIS GROUP 140.00 116.17 159.08 Neutral Sell 83 1.30
BLOOMSBURY PBL. 95.00 91.25 138.00 Neutral Buy 116 0.48
BRITISH SKY BCAST.GROUP 721.00 618.50 850.00 Neutral Sell 622 0.64
CENTAUR MEDIA 33.13 32.75 73.00 Neutral Sell -52 1.00
DAILY MAIL 'A' 392.60 343.40 594.50 Neutral Buy 528 1.08
EUROMONEY INSTL.INVESTOR 645.00 522.50 736.00 Neutral Sell 611 1.04
INFORMA 355.80 313.90 461.10 Neutral Sell 295 1.50
ITE GROUP 201.00 157.70 258.20 Neutral Sell 142 1.39
ITV 69.45 51.65 93.45 Neutral Neutral 74 1.49
JOHNSTON PRESS 6.20 4.11 12.75 Neutral Strong Buy 55 1.45
PEARSON 1212.00 983.00 1234.00 Neutral Sell 998 0.70
PHOTO-ME INTL. 53.50 39.50 67.00 Neutral Strong Buy 82 0.86
PINEWOOD SHEPPERTON 275.50 132.75 276.13 Neutral Sell 137 0.37
THOMSON REUTERS 27.45 26.21 41.49 Neutral Sell 24 0.52
STV GROUP 82.63 81.00 168.00 Neutral Buy 102 0.77
ST.IVES 80.50 68.50 108.50 Neutral Strong Buy 206 1.31
TRINITY MIRROR 49.00 37.50 93.00 Neutral Strong Buy 435 1.58
UBM 471.40 416.00 725.00 Neutral Strong Buy 1529 1.28
WILMINGTON GROUP 84.50 82.50 183.00 Neutral Buy 101 0.86
WPP 669.00 578.00 846.50 Neutral Buy 764 1.27
YELL GROUP 5.10 3.35 14.75 Neutral Strong Buy 40 1.32
Mining Under Valued
Stock Price 12M Lo 12M Hi ST Rec LT Rec Target Beta
ANGLO AMERICAN 2455.00 2138.50 3437.00 Neutral Strong Buy 6258 1.74
ANGLO PACIFIC GROUP 266.20 237.90 369.25 Neutral Buy 356 0.92
ANTOFAGASTA 1263.00 900.50 1571.00 Neutral Sell 1054 1.38
BHP BILLITON 1951.00 1667.00 2631.50 Neutral Strong Buy 4475 1.40
LONMIN 975.00 941.00 1910.00 Neutral Sell 818 1.90
RANDGOLD RESOURCES 6960.00 4425.00 7555.00 Neutral Sell 1818 0.30
RIO TINTO 3321.00 2712.50 4712.00 Neutral Strong Buy 5161 1.41
UK COAL 29.50 28.50 55.25 Neutral Sell -72 1.05
VEDANTA RESOURCES 928.00 2518.00 Neutral Strong Buy 5223 2.05
XSTRATA 1021.50 764.00 1550.00 Neutral Buy 1159 1.76
Oil & Gas Under Valued
Stock Price 12M Lo 12M Hi ST Rec LT Rec Target Beta
BG GROUP 1430.50 1144.00 1564.50 Neutral Buy 1853 0.70
BP 474.05 363.20 509.00 Neutral Strong Buy 1209 1.06
CAIRN ENERGY 262.50 257.80 469.70 Neutral Buy 324 1.34
FORTUNE OIL 11.00 9.00 14.75 Neutral Strong Buy 23 0.87
HUNTING 762.50 530.00 817.00 Neutral Buy 909 1.31
JKX OIL & GAS 135.00 128.00 335.10 Neutral Strong Buy 355 1.35
MELROSE RESOURCES 118.00 95.25 297.00 Neutral Strong Buy 614 1.12
PREMIER OIL 374.90 310.00 535.00 Neutral Buy 510 1.34
ROYAL DUTCH SHELL A(LON) 2350.00 1883.50 2380.00 Neutral Strong Buy 6226 0.94
ROYAL DUTCH SHELL B 2437.00 1890.50 2477.00 Neutral Strong Buy 6288 0.95
SOCO INTERNATIONAL 290.90 278.00 400.00 Neutral Sell 192 0.50
TULLOW OIL 1393.00 945.50 1493.00 Neutral Sell 447 1.07
WOOD GROUP (JOHN) 666.00 469.90 715.75 Neutral Buy 745 1.34
Personal Care & Household Products Over Valued
Stock Price 12M Lo 12M Hi ST Rec LT Rec Target Beta
MCBRIDE 117.00 110.75 164.49 Neutral Sell 108 0.85
PZ CUSSONS 333.40 308.70 404.00 Neutral Neutral 356 0.80
RECKITT BENCKISER GROUP 3274.00 3015.00 3578.00 Neutral Neutral 3120 0.32
8/3/2019 uk trading & value indicator 20120106
http://slidepdf.com/reader/full/uk-trading-value-indicator-20120106 21/25
Intellisys www.intellisys.uk.com 06 January 2012
Page 21 of 25 ©Intellisys 06 January 2012
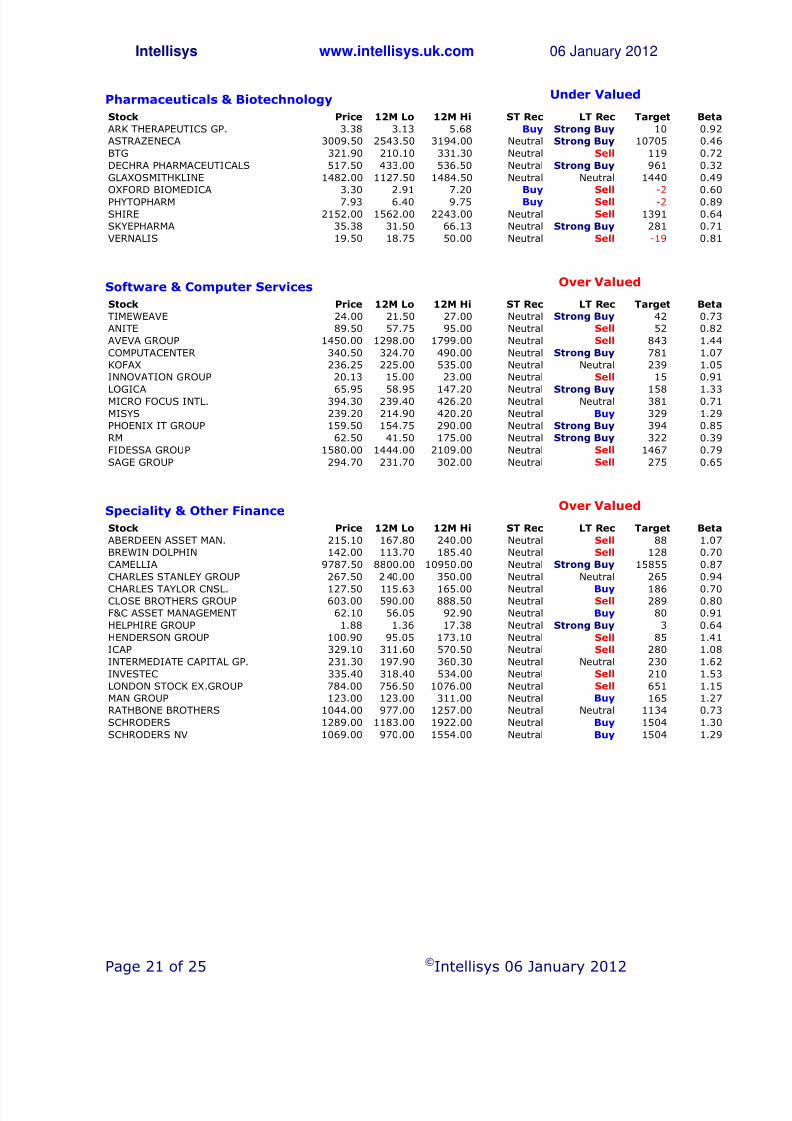
Pharmaceuticals & Biotechnology Under Valued
Stock Price 12M Lo 12M Hi ST Rec LT Rec Target Beta
ARK THERAPEUTICS GP. 3.38 3.13 5.68 Buy Strong Buy 10 0.92
ASTRAZENECA 3009.50 2543.50 3194.00 Neutral Strong Buy 10705 0.46
BTG 321.90 210.10 331.30 Neutral Sell 119 0.72
DECHRA PHARMACEUTICALS 517.50 433.00 536.50 Neutral Strong Buy 961 0.32
GLAXOSMITHKLINE 1482.00 1127.50 1484.50 Neutral Neutral 1440 0.49
OXFORD BIOMEDICA 3.30 2.91 7.20 Buy Sell -2 0.60
PHYTOPHARM 7.93 6.40 9.75 Buy Sell -2 0.89
SHIRE 2152.00 1562.00 2243.00 Neutral Sell 1391 0.64
SKYEPHARMA 35.38 31.50 66.13 Neutral Strong Buy 281 0.71
VERNALIS 19.50 18.75 50.00 Neutral Sell -19 0.81
Software & Computer Services Over Valued
Stock Price 12M Lo 12M Hi ST Rec LT Rec Target Beta
TIMEWEAVE 24.00 21.50 27.00 Neutral Strong Buy 42 0.73
ANITE 89.50 57.75 95.00 Neutral Sell 52 0.82
AVEVA GROUP 1450.00 1298.00 1799.00 Neutral Sell 843 1.44
COMPUTACENTER 340.50 324.70 490.00 Neutral Strong Buy 781 1.07
KOFAX 236.25 225.00 535.00 Neutral Neutral 239 1.05
INNOVATION GROUP 20.13 15.00 23.00 Neutral Sell 15 0.91
LOGICA 65.95 58.95 147.20 Neutral Strong Buy 158 1.33MICRO FOCUS INTL. 394.30 239.40 426.20 Neutral Neutral 381 0.71
MISYS 239.20 214.90 420.20 Neutral Buy 329 1.29
PHOENIX IT GROUP 159.50 154.75 290.00 Neutral Strong Buy 394 0.85
RM 62.50 41.50 175.00 Neutral Strong Buy 322 0.39
FIDESSA GROUP 1580.00 1444.00 2109.00 Neutral Sell 1467 0.79
SAGE GROUP 294.70 231.70 302.00 Neutral Sell 275 0.65
Speciality & Other Finance Over Valued
Stock Price 12M Lo 12M Hi ST Rec LT Rec Target Beta
ABERDEEN ASSET MAN. 215.10 167.80 240.00 Neutral Sell 88 1.07
BREWIN DOLPHIN 142.00 113.70 185.40 Neutral Sell 128 0.70
CAMELLIA 9787.50 8800.00 10950.00 Neutral Strong Buy 15855 0.87
CHARLES STANLEY GROUP 267.50 240.00 350.00 Neutral Neutral 265 0.94
CHARLES TAYLOR CNSL. 127.50 115.63 165.00 Neutral Buy 186 0.70CLOSE BROTHERS GROUP 603.00 590.00 888.50 Neutral Sell 289 0.80
F&C ASSET MANAGEMENT 62.10 56.05 92.90 Neutral Buy 80 0.91
HELPHIRE GROUP 1.88 1.36 17.38 Neutral Strong Buy 3 0.64
HENDERSON GROUP 100.90 95.05 173.10 Neutral Sell 85 1.41
ICAP 329.10 311.60 570.50 Neutral Sell 280 1.08
INTERMEDIATE CAPITAL GP. 231.30 197.90 360.30 Neutral Neutral 230 1.62
INVESTEC 335.40 318.40 534.00 Neutral Sell 210 1.53
LONDON STOCK EX.GROUP 784.00 756.50 1076.00 Neutral Sell 651 1.15
MAN GROUP 123.00 123.00 311.00 Neutral Buy 165 1.27
RATHBONE BROTHERS 1044.00 977.00 1257.00 Neutral Neutral 1134 0.73
SCHRODERS 1289.00 1183.00 1922.00 Neutral Buy 1504 1.30
SCHRODERS NV 1069.00 970.00 1554.00 Neutral Buy 1504 1.29
8/3/2019 uk trading & value indicator 20120106
http://slidepdf.com/reader/full/uk-trading-value-indicator-20120106 22/25
Intellisys www.intellisys.uk.com 06 January 2012
Page 22 of 25 ©Intellisys 06 January 2012
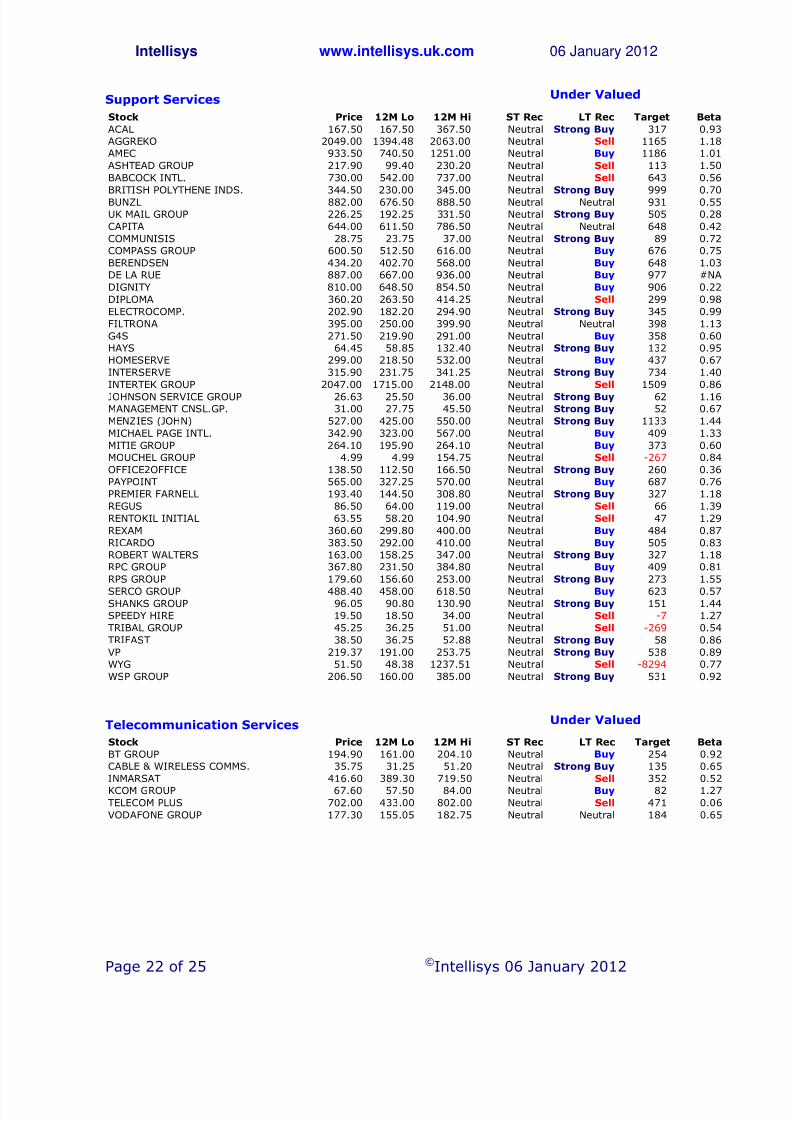
Support Services Under Valued
Stock Price 12M Lo 12M Hi ST Rec LT Rec Target Beta
ACAL 167.50 167.50 367.50 Neutral Strong Buy 317 0.93
AGGREKO 2049.00 1394.48 2063.00 Neutral Sell 1165 1.18
AMEC 933.50 740.50 1251.00 Neutral Buy 1186 1.01
ASHTEAD GROUP 217.90 99.40 230.20 Neutral Sell 113 1.50
BABCOCK INTL. 730.00 542.00 737.00 Neutral Sell 643 0.56
BRITISH POLYTHENE INDS. 344.50 230.00 345.00 Neutral Strong Buy 999 0.70
BUNZL 882.00 676.50 888.50 Neutral Neutral 931 0.55
UK MAIL GROUP 226.25 192.25 331.50 Neutral Strong Buy 505 0.28
CAPITA 644.00 611.50 786.50 Neutral Neutral 648 0.42
COMMUNISIS 28.75 23.75 37.00 Neutral Strong Buy 89 0.72
COMPASS GROUP 600.50 512.50 616.00 Neutral Buy 676 0.75
BERENDSEN 434.20 402.70 568.00 Neutral Buy 648 1.03
DE LA RUE 887.00 667.00 936.00 Neutral Buy 977 #NA
DIGNITY 810.00 648.50 854.50 Neutral Buy 906 0.22
DIPLOMA 360.20 263.50 414.25 Neutral Sell 299 0.98
ELECTROCOMP. 202.90 182.20 294.90 Neutral Strong Buy 345 0.99
FILTRONA 395.00 250.00 399.90 Neutral Neutral 398 1.13
G4S 271.50 219.90 291.00 Neutral Buy 358 0.60
HAYS 64.45 58.85 132.40 Neutral Strong Buy 132 0.95
HOMESERVE 299.00 218.50 532.00 Neutral Buy 437 0.67
INTERSERVE 315.90 231.75 341.25 Neutral Strong Buy 734 1.40
INTERTEK GROUP 2047.00 1715.00 2148.00 Neutral Sell 1509 0.86
JOHNSON SERVICE GROUP 26.63 25.50 36.00 Neutral Strong Buy 62 1.16
MANAGEMENT CNSL.GP. 31.00 27.75 45.50 Neutral Strong Buy 52 0.67
MENZIES (JOHN) 527.00 425.00 550.00 Neutral Strong Buy 1133 1.44
MICHAEL PAGE INTL. 342.90 323.00 567.00 Neutral Buy 409 1.33
MITIE GROUP 264.10 195.90 264.10 Neutral Buy 373 0.60
MOUCHEL GROUP 4.99 4.99 154.75 Neutral Sell -267 0.84
OFFICE2OFFICE 138.50 112.50 166.50 Neutral Strong Buy 260 0.36
PAYPOINT 565.00 327.25 570.00 Neutral Buy 687 0.76
PREMIER FARNELL 193.40 144.50 308.80 Neutral Strong Buy 327 1.18
REGUS 86.50 64.00 119.00 Neutral Sell 66 1.39
RENTOKIL INITIAL 63.55 58.20 104.90 Neutral Sell 47 1.29
REXAM 360.60 299.80 400.00 Neutral Buy 484 0.87
RICARDO 383.50 292.00 410.00 Neutral Buy 505 0.83
ROBERT WALTERS 163.00 158.25 347.00 Neutral Strong Buy 327 1.18
RPC GROUP 367.80 231.50 384.80 Neutral Buy 409 0.81
RPS GROUP 179.60 156.60 253.00 Neutral Strong Buy 273 1.55
SERCO GROUP 488.40 458.00 618.50 Neutral Buy 623 0.57SHANKS GROUP 96.05 90.80 130.90 Neutral Strong Buy 151 1.44
SPEEDY HIRE 19.50 18.50 34.00 Neutral Sell -7 1.27
TRIBAL GROUP 45.25 36.25 51.00 Neutral Sell -269 0.54
TRIFAST 38.50 36.25 52.88 Neutral Strong Buy 58 0.86
VP 219.37 191.00 253.75 Neutral Strong Buy 538 0.89
WYG 51.50 48.38 1237.51 Neutral Sell -8294 0.77
WSP GROUP 206.50 160.00 385.00 Neutral Strong Buy 531 0.92
Telecommunication Services Under Valued
Stock Price 12M Lo 12M Hi ST Rec LT Rec Target Beta
BT GROUP 194.90 161.00 204.10 Neutral Buy 254 0.92
CABLE & WIRELESS COMMS. 35.75 31.25 51.20 Neutral Strong Buy 135 0.65
INMARSAT 416.60 389.30 719.50 Neutral Sell 352 0.52
KCOM GROUP 67.60 57.50 84.00 Neutral Buy 82 1.27
TELECOM PLUS 702.00 433.00 802.00 Neutral Sell 471 0.06
VODAFONE GROUP 177.30 155.05 182.75 Neutral Neutral 184 0.65
8/3/2019 uk trading & value indicator 20120106
http://slidepdf.com/reader/full/uk-trading-value-indicator-20120106 23/25
Intellisys www.intellisys.uk.com 06 January 2012
Page 23 of 25 ©Intellisys 06 January 2012
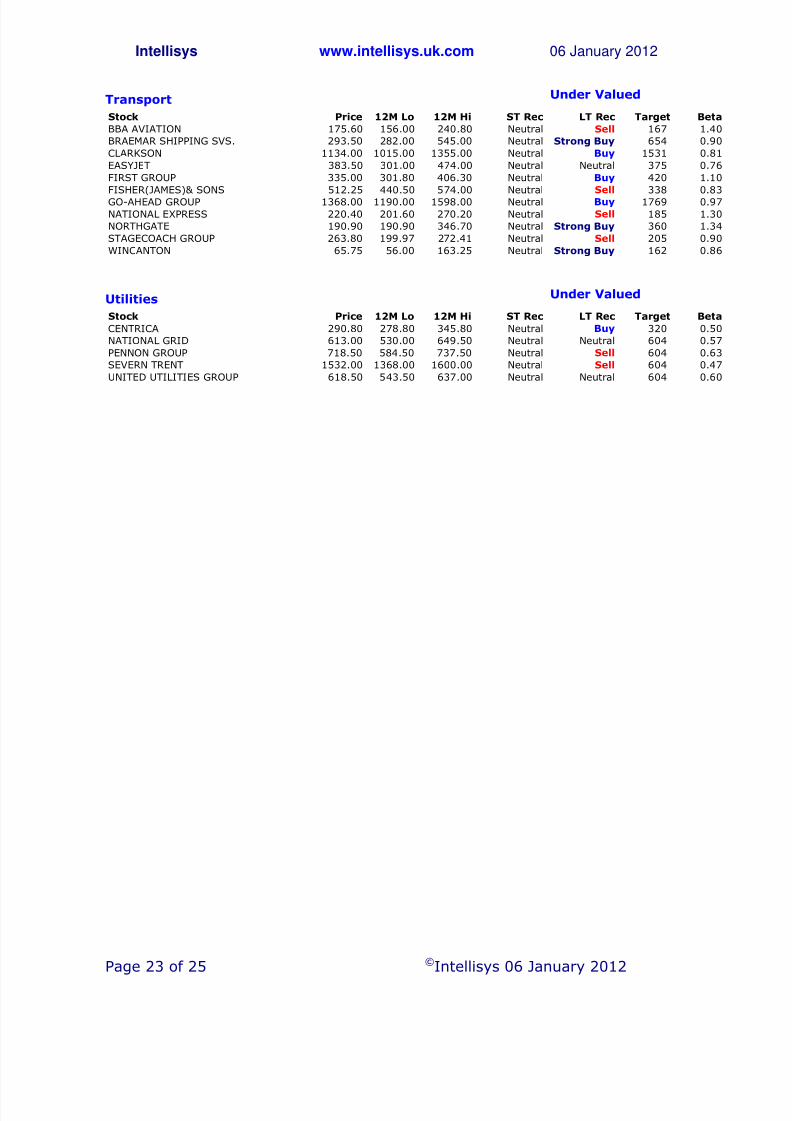
Transport Under Valued
Stock Price 12M Lo 12M Hi ST Rec LT Rec Target Beta
BBA AVIATION 175.60 156.00 240.80 Neutral Sell 167 1.40
BRAEMAR SHIPPING SVS. 293.50 282.00 545.00 Neutral Strong Buy 654 0.90
CLARKSON 1134.00 1015.00 1355.00 Neutral Buy 1531 0.81
EASYJET 383.50 301.00 474.00 Neutral Neutral 375 0.76
FIRST GROUP 335.00 301.80 406.30 Neutral Buy 420 1.10
FISHER(JAMES)& SONS 512.25 440.50 574.00 Neutral Sell 338 0.83
GO-AHEAD GROUP 1368.00 1190.00 1598.00 Neutral Buy 1769 0.97
NATIONAL EXPRESS 220.40 201.60 270.20 Neutral Sell 185 1.30
NORTHGATE 190.90 190.90 346.70 Neutral Strong Buy 360 1.34
STAGECOACH GROUP 263.80 199.97 272.41 Neutral Sell 205 0.90
WINCANTON 65.75 56.00 163.25 Neutral Strong Buy 162 0.86
Utilities Under Valued
Stock Price 12M Lo 12M Hi ST Rec LT Rec Target Beta
CENTRICA 290.80 278.80 345.80 Neutral Buy 320 0.50
NATIONAL GRID 613.00 530.00 649.50 Neutral Neutral 604 0.57
PENNON GROUP 718.50 584.50 737.50 Neutral Sell 604 0.63
SEVERN TRENT 1532.00 1368.00 1600.00 Neutral Sell 604 0.47
UNITED UTILITIES GROUP 618.50 543.50 637.00 Neutral Neutral 604 0.60
8/3/2019 uk trading & value indicator 20120106
http://slidepdf.com/reader/full/uk-trading-value-indicator-20120106 24/25
8/3/2019 uk trading & value indicator 20120106
http://slidepdf.com/reader/full/uk-trading-value-indicator-20120106 25/25
Intellisys www.intellisys.uk.com 06 January 2012
the information and no responsibility or liability is accepted for the accuracy or sufficiency of any of the information, for any errors, omissions or mis-statements, negligent or otherwise.
Intelligent Analysis Limited (including its Directors, employees and representatives) or aconnected person may have positions in or options or other financial instruments on any of the
securities mentioned within a report, and may buy, sell or offer to purchase or sell suchsecurities from time to time, subject to restrictions imposed by internal rules.
Subscribers, and casual reader, are reminded that the value of shares in any company may goup or down and that past performance is not necessarily a guide to future performance.
Intelligent Analysis Limited is not registered with or regulated by any financial regulatoryauthority and does not offer, provide or purport to provide or offer investment advice.
RISK WARNING – Recommendations and Target PricesIntellisys does not make personal recommendations. The information in this publication is
provided solely to enable you to make your own investment decisions.
If you are unsure about dealing in shares and other equity investments, you should contactyour financial adviser as these types of investments may not be suitable for everyone.
The value of stocks and shares, and the income from them, can fall as well as rise and youmay not get back the full amount you originally invested. If denominated in a foreign currency,fluctuations in the exchange rate will also affect the value of stocks and shares and the incomefrom them. Past performance is not necessarily a guide to future performance.


![Trading Central Indicator for MetaTrader4 TRADER / USER ... · Trading Central Indicator for MetaTrader4 TRADER / USER SET UP & CONFIGURATION Upgrade process 6 t Z v v Á À ] } v](https://img.pdfslide.net/doc/110x75/5f0385927e708231d4097888/trading-central-indicator-for-metatrader4-trader-user-trading-central-indicator.jpg)


![[20120106] HFE0704_Greb_Load](https://img.pdfslide.net/doc/110x75/577d22ee1a28ab4e1e988bef/20120106-hfe0704grebload.jpg)