Embed Size (px)
Citation preview
Smart Structures and Systems, Vol. 6, No. 5-6 (2010) 675-687 675
Ultra low-power active wireless sensor for structuralhealth monitoring
Dao Zhou1, Dong Sam Ha1* and Daniel J. Inman2
1Center for Embedded Systems for Critical Applications (CESCA), Department of Electrical and Computer
Engineering, Virginia Polytechnic Institute and State University, Blacksburg, VA, USA2Center for Intelligent Material Systems and Structures (CIMSS), Department of Mechanical Engineering,
Virginia Polytechnic Institute and State University, Blacksburg, VA, USA
(Received October 14, 2009, Accepted February 20, 2010)
Abstract. Structural Health Monitoring (SHM) is the science and technology of monitoring and assessingthe condition of aerospace, civil and mechanical infrastructures using a sensing system integrated into thestructure. Impedance-based SHM measures impedance of a structure using a PZT (Lead Zirconate Titanate)patch. This paper presents a low-power wireless autonomous and active SHM node called Autonomous SHMSensor 2 (ASN-2), which is based on the impedance method. In this study, we incorporated three methods tosave power. First, entire data processing is performed on-board, which minimizes radio transmission time.Considering that the radio of a wireless sensor node consumes the highest power among all modules, reductionof the transmission time saves substantial power. Second, a rectangular pulse train is used to excite a PZTpatch instead of a sinusoidal wave. This eliminates a digital-to-analog converter and reduces the memoryspace. Third, ASN-2 senses the phase of the response signal instead of the magnitude. Sensing the phase ofthe signal eliminates an analog-to-digital converter and Fast Fourier Transform operation, which not only savespower, but also enables us to use a low-end low-power processor. Our SHM sensor node ASN-2 is implementedusing a TI MSP430 microcontroller evaluation board. A cluster of ASN-2 nodes forms a wireless network.Each node wakes up at a predetermined interval, such as once in four hours, performs an SHM operation,reports the result to the central node wirelessly, and returns to sleep. The power consumption of our ASN-2 is0.15 mW during the inactive mode and 18 mW during the active mode. Each SHM operation takes about 13seconds to consume 236 mJ. When our ASN-2 operates once in every four hours, it is estimated to run forabout 2.5 years with two AAA-size batteries ignoring the internal battery leakage.
Keywords: structural health monitoring; SHM; wireless sensor node; impedance-based method; temper-ature compensation.
1. Introduction
Structural Health Monitoring (SHM) is the science and technology of monitoring and assessing
the condition of aerospace, civil and mechanical infrastructures using a sensing system integrated
into the structure. SHM is capable of detecting, locating and quantifying various types of damage
such as cracks, holes, corrosion, collusions, delimitations, and loose joints, and can be applied to
various kinds of infrastructures such as buildings, railroads, windmills, bridges and aircrafts. A
*Corresponding Author, Professor, E-mail: [email protected]
676 Dao Zhou, Dong Sam Ha and Daniel J. Inman
variety of approaches for SHM have been proposed and investigated. The impedance method based
on using piezoelectric wafers, such as PZT (Lead Zirconate Titanate), is proven to be effective for
in-situ local damage detection. Unlike passive sensing methods, the impedance-based method
combines sensing with actuation, which sweeps a certain frequency range to measure the impedance
profile of a structure. In spite of its effectiveness, the PZT based SHM approach still has not been
deployed in large-scale applications.
Major roadblocks for field deployment include high hardware complexity and high installation
cost (including laying out cables for power supply and data collection). High hardware complexity
is attributed to the need for generation of an excitation signal, collection of the response signal, and
processing of the collected data. Existing SHM prototypes rely on expensive instruments and/or
high-speed DSP chips. High hardware complexity incurs high power consumption, a large form
factor and high cost. Among them, power consumption is especially problematic for many SHM
applications, where line power is unavailable (such as a blade of a windmill) or laying out cables is
undesirable (such as wings of an airplane). Even if line power is available (such as a bridge with
street lights), drawing a cable to a sensor node is costly. Ideally, an SHM node/system dissipates
extremely low power, so that it can run on a small-size battery for several years or run on energy
harvested from ambient sources, such as solar, thermal or vibration. In such a case, wireless
transmission of the SHM data to the host computer is essential to remove wires from the node to
the host.
In this paper, we present a low-power wireless autonomous and active SHM node called ASN-2,
which is based on the impedance method. Our system incorporates three methods for reduction of
power, and experimental results show our system is highly efficient in power. It should be noted
that the focus of the paper is low-power design of our SHM system, not wireless networking nor
the impedance method itself. The paper is organized as follows: Section 2 provides background and
preliminaries necessary to understand our work. We also review a few existing SHM systems
relevant to our system. Section 3 presents three power saving methods, which are incorporated into
ASN-2. Section 4 describes details about ASN-2 such as its architecture, system operation, temperature
compensation and wireless networking. Section 5 presents experimental results including a power
dissipation profile. Finally, we conclude the paper in Section 6.
2. Preliminaries
We describe the impedance-based method and review a few relevant SHM systems in this section.
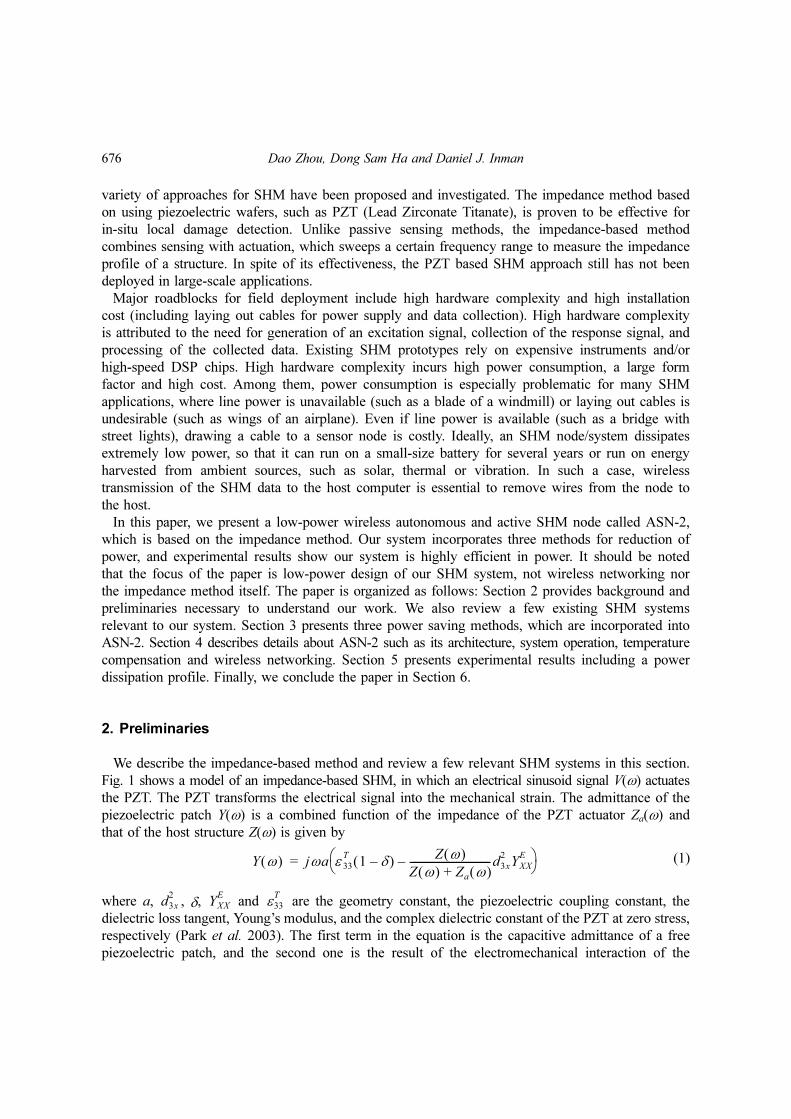
Fig. 1 shows a model of an impedance-based SHM, in which an electrical sinusoid signal V(ω) actuates
the PZT. The PZT transforms the electrical signal into the mechanical strain. The admittance of the
piezoelectric patch Y(ω) is a combined function of the impedance of the PZT actuator Za(ω) and
that of the host structure Z(ω) is given by
(1)
where a, , δ, and are the geometry constant, the piezoelectric coupling constant, the
dielectric loss tangent, Young’s modulus, and the complex dielectric constant of the PZT at zero stress,
respectively (Park et al. 2003). The first term in the equation is the capacitive admittance of a free
piezoelectric patch, and the second one is the result of the electromechanical interaction of the
Y ω( ) jωa ε 33
T1 δ–( ) Z ω( )
Z ω( ) Za ω( )+---------------------------------d3x
2YXX
E–⎝ ⎠
⎛ ⎞=
d3x
2YXX
Eε33
T
Ultra low-power active wireless sensor for structural health monitoring 677
piezoelectric patch with the host structure (Sun et al. 1995).
Previous studies indicate that the real part of the admittance given in (1) is more sensitive to
damage of the structure, while the imaginary part to the temperature variation (Park et al. 1999).
Hence, it is desirable for an SHM system to be sensitive to the real part and to suppress the side
effect caused by the imaginary part. Krishnamurthy et al. (1996) showed through experiments that
the magnitude of impedance peaks shrink as the temperature increases, while peaks of the
imaginary part shift towards a lower frequency. Consequently, an impedance-based SHM requires a
mechanism to compensate the temperature variation.
Conventional impedance-based SHM methods rely on impedance analyzers. Such instruments
provide high precision measurements for a large frequency range, but they are bulky and, hence, not
suitable for in-situ applications. Analog Device, Inc. introduced an impedance analyzer chip
AD5933, which dissipates about 30 mW. The chip includes a digital-to-analog converter to generate
an excitation signal up to 100 kHz, a 12-bit analog-to-digital converter, and supports on-chip Fast
Fourier Transform (FFT) operation. Park et al. (2008a, b, 2009) integrated this chip with a microcontroller
ATMega128 and an XBee wireless transceiver. They showed that the system could be applicable for
various SHM applications, but high-power consumption is a major issue. Researchers from Los
Alamos National Lab have worked on a series of wireless SHM sensor systems embedded with
Analog Device’s impedance analyzer chips AD5933 for years and developed the third generation of the
sensor system called Wireless Impedance Device (WID-3) in 2009 (Overly et al. 2008, Mascarenas et al.
2007, Taylor et al. 2009a). The power consumption of WID-3 is around 70 mW during measurement
and wireless transmission (Farinholt et al. 2009, Taylor et al. 2009b). Our team also developed an
impedance-based SHM system using a Texas Instrument DSP evaluation board. The SHM system
verifies effectiveness of rectangular pulse trains as the excitation signal, but consumes about 800
mW due to unnecessary chips and components embedded on the evaluation board (Kim et al.
2007a, b).
3. Proposed methods for low-power system design
In this section, we present three methods employed for low-power design of our wireless SHM
sensor node. The first method is on-board data processing to reduce the radio transmission time,
which substantially reduces the power dissipated by the radio. The second method is elimination of
a digital-to-analog converter (DAC) for excitation signal generation, and the third one is elimination
of an analog-to-digital converter (ADC) for response sensing.
Fig. 1 Model of an impedance-based SHM
678 Dao Zhou, Dong Sam Ha and Daniel J. Inman
3.1 On-board data processing
The major source of power consumption for a wireless sensor node is the radio. For example, a
microcontroller unit TI MSP430 from Texas Instruments used for our SHM sensor node dissipates 3
mW under a low-power operation mode, while a low-end radio CC2500 from Texas Instruments
embedded in the sensor node dissipates 651 mW during transmission. So, it is essential to reduce
the radio transmission time for a low-power wireless SHM sensor node. We adopt an on-board data
processing approach for our SHM sensor node, which processes the data on the board and sends
only the final outcome (healthy or damaged) of the SHM operation to the control center. So, the
radio for our sensor node transmits only three bytes of data, including the outcome of the SHM
operation and the ambient temperature.
3.2 Elimination of a DAC for generation of an excitation signal
A sinusoidal signal sweeping a certain frequency range is usually used to excite a PZT patch for
the impedance method. Generation of a sinusoidal signal usually relies on a DAC. Sampled values
of a sinusoidal signal are pre-stored in a memory, and a processor reads the pre-stored data and
applies it to a DAC to generate the corresponding analog signal. This method is straightforward, but
it requires a DAC and a large memory space for a large-frequency sweeping range.
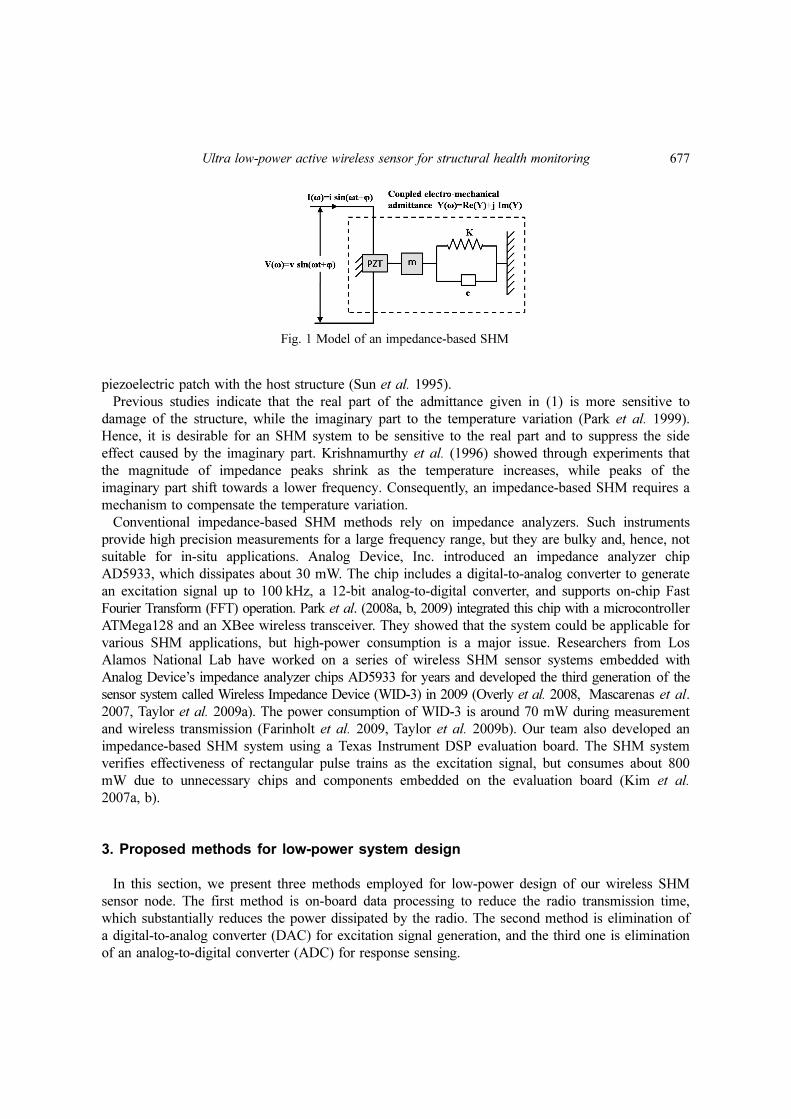
Our method is to employ a rectangular pulse train rather than a sinusoidal signal. A rectangular
pulse train illustrated in Fig. 2(a) has the duty cycle of 0.5, and its fundamental frequency (which is
given as 1/tp, where tp is the pulse period) sweeps a certain desired frequency range. The Fourier
transform of a pulse train with a pulse period tp and a duty cycle of 0.5 has odd harmonics kfo, k=1,
3, 5…, where fo=1/tp. Fig. 2(b) illustrates frequency components of a pulse train with the fundamental
frequency ranging from 40 kHz to 50 kHz. The magnitude of the third harmonic is about 33 percent
of the fundamental frequency, and the fifth one about 20 percent.
A rectangular pulse train is digital, and hence a processor can directly generate such a signal.
Since generation of a rectangular pulse train does not require a DAC, it reduces power consumption
of an SHM sensor node. One potential issue is existence of harmonics on the signal. Note that our
1This value is from the data sheet.
Fig. 2 Rectangular pulse train
Ultra low-power active wireless sensor for structural health monitoring 679
interest is to detect the difference between the baseline impedance profile and a currently measured
one. Since both profiles are under the subject of the same frequency terms, the sensitivity for detecting
the difference may not be affected by harmonics. Further, harmonic terms decrease rapidly, and
some harmonic terms may be out of the interested frequency range. Our experimental results reveal
that use of a rectangular pulse train does not incur any noticeable deterioration of the performance
for the impedance method (Kim et al. 2007a).
3.3 Elimination of an ADC for response signal sensing
Existing methods such as Analog Device’s impedance analyzer chips sample the response signal
using an ADC and performs a Fast Fourier Transform (FFT) to extract the impedance component of
the frequency. A typical ADC used for an SHM system consumes large power, possibly next to a
radio and a processor, and FFT is also computationally intensive to increase power dissipation. Our
method is to eliminate an ADC and the FFT operation by sensing the phase, not the magnitude, of
the response signal.
The electrical admittance is expressed as Y( jf ) = G( f ) + jB( f ), where G( f ) and B( f ) are
conductance and susceptance terms, respectively. It is known that the conductance term of a PZT
patch is more sensitive to damage (Park et al. 2003). Let Gbase( f ) denote the baseline conductance
obtained from a healthy structure and GSUT( f ) be the conductance of a structure under test (SUT).
The difference of the two conductance terms Gbase( f ) - GSUT( f ) is used for existing impedance-
based SHM systems to detect damage. Our earlier work showed that
(2)
where C is a constant, assuming all parameters other than the two impedance terms or Za(ω) and Z(ω)
in expression (1) are constant, and φbase( f ) and φSUT( f ) are the phase of the baseline admittance and the
SUT admittance, respectively. Expression (2) suggests that difference of the phases, instead of the
conductance G( f )’s, can be sensed for the impedance method.
The phase of an admittance φ( f ) for a frequency f can be expressed as in (3), where Td( f ) is the
time difference between the voltage and the current
(3)
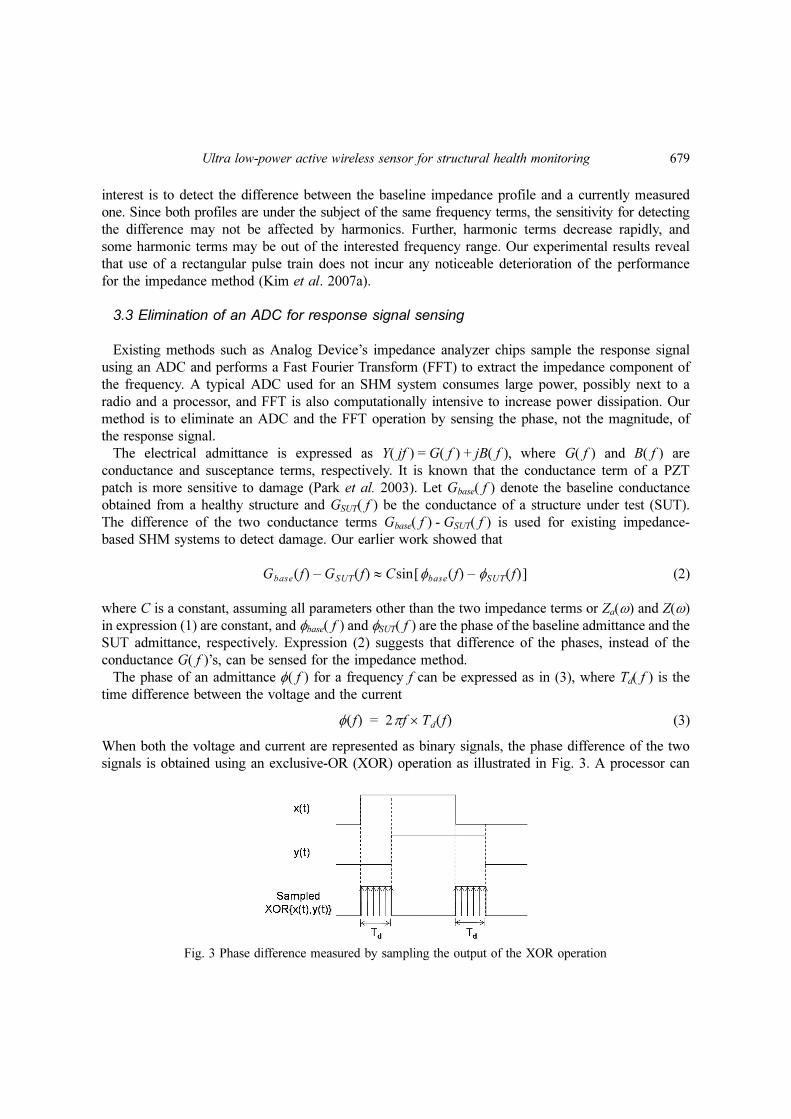
When both the voltage and current are represented as binary signals, the phase difference of the two
signals is obtained using an exclusive-OR (XOR) operation as illustrated in Fig. 3. A processor can
Gbase f( ) GSUT f( ) Csin φbase f( ) φSUT f( )–[ ]≈–
φ f( ) 2πf Td f( )×=
Fig. 3 Phase difference measured by sampling the output of the XOR operation
680 Dao Zhou, Dong Sam Ha and Daniel J. Inman
measure the time delay by sampling the output of the XOR operation at a system clock frequency,
where the system clock frequency is typically much higher than the frequency f of the admittance under
consideration.
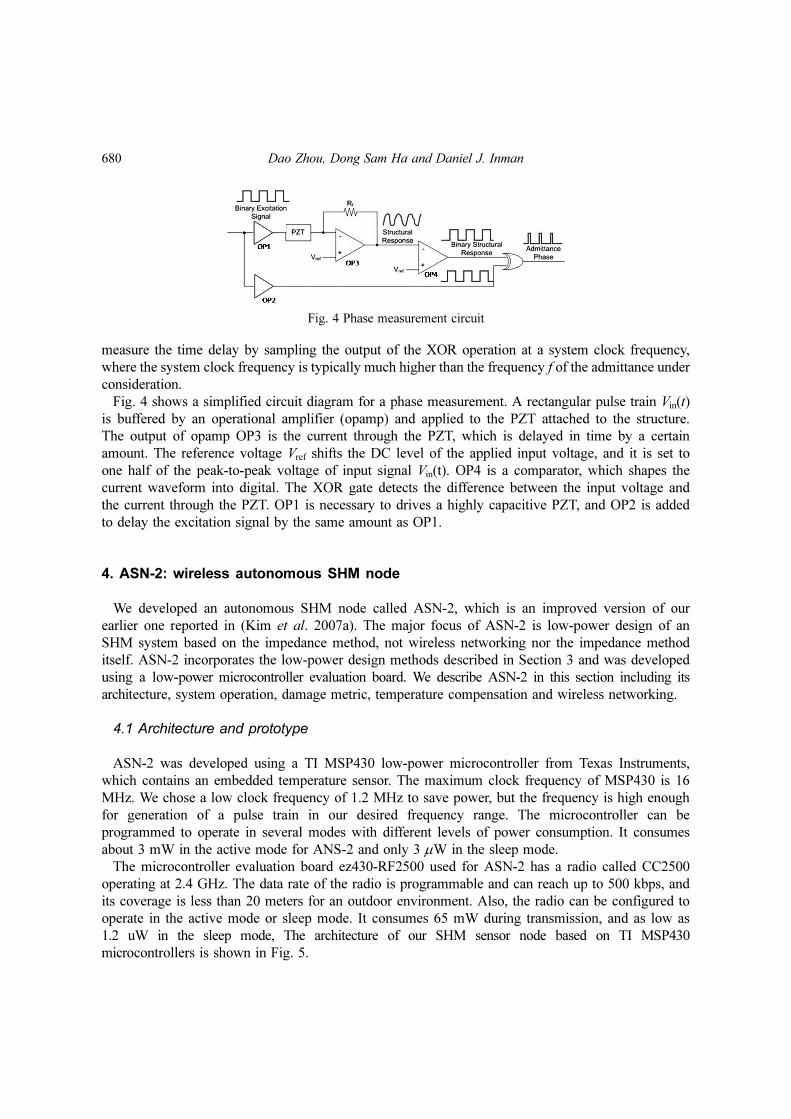
Fig. 4 shows a simplified circuit diagram for a phase measurement. A rectangular pulse train Vin(t)
is buffered by an operational amplifier (opamp) and applied to the PZT attached to the structure.
The output of opamp OP3 is the current through the PZT, which is delayed in time by a certain
amount. The reference voltage Vref shifts the DC level of the applied input voltage, and it is set to
one half of the peak-to-peak voltage of input signal Vin(t). OP4 is a comparator, which shapes the
current waveform into digital. The XOR gate detects the difference between the input voltage and
the current through the PZT. OP1 is necessary to drives a highly capacitive PZT, and OP2 is added
to delay the excitation signal by the same amount as OP1.
4. ASN-2: wireless autonomous SHM node
We developed an autonomous SHM node called ASN-2, which is an improved version of our
earlier one reported in (Kim et al. 2007a). The major focus of ASN-2 is low-power design of an
SHM system based on the impedance method, not wireless networking nor the impedance method
itself. ASN-2 incorporates the low-power design methods described in Section 3 and was developed
using a low-power microcontroller evaluation board. We describe ASN-2 in this section including its
architecture, system operation, damage metric, temperature compensation and wireless networking.
4.1 Architecture and prototype
ASN-2 was developed using a TI MSP430 low-power microcontroller from Texas Instruments,
which contains an embedded temperature sensor. The maximum clock frequency of MSP430 is 16
MHz. We chose a low clock frequency of 1.2 MHz to save power, but the frequency is high enough
for generation of a pulse train in our desired frequency range. The microcontroller can be
programmed to operate in several modes with different levels of power consumption. It consumes
about 3 mW in the active mode for ANS-2 and only 3 µW in the sleep mode.
The microcontroller evaluation board ez430-RF2500 used for ASN-2 has a radio called CC2500
operating at 2.4 GHz. The data rate of the radio is programmable and can reach up to 500 kbps, and
its coverage is less than 20 meters for an outdoor environment. Also, the radio can be configured to
operate in the active mode or sleep mode. It consumes 65 mW during transmission, and as low as
1.2 uW in the sleep mode, The architecture of our SHM sensor node based on TI MSP430
microcontrollers is shown in Fig. 5.
Fig. 4 Phase measurement circuit
Ultra low-power active wireless sensor for structural health monitoring 681
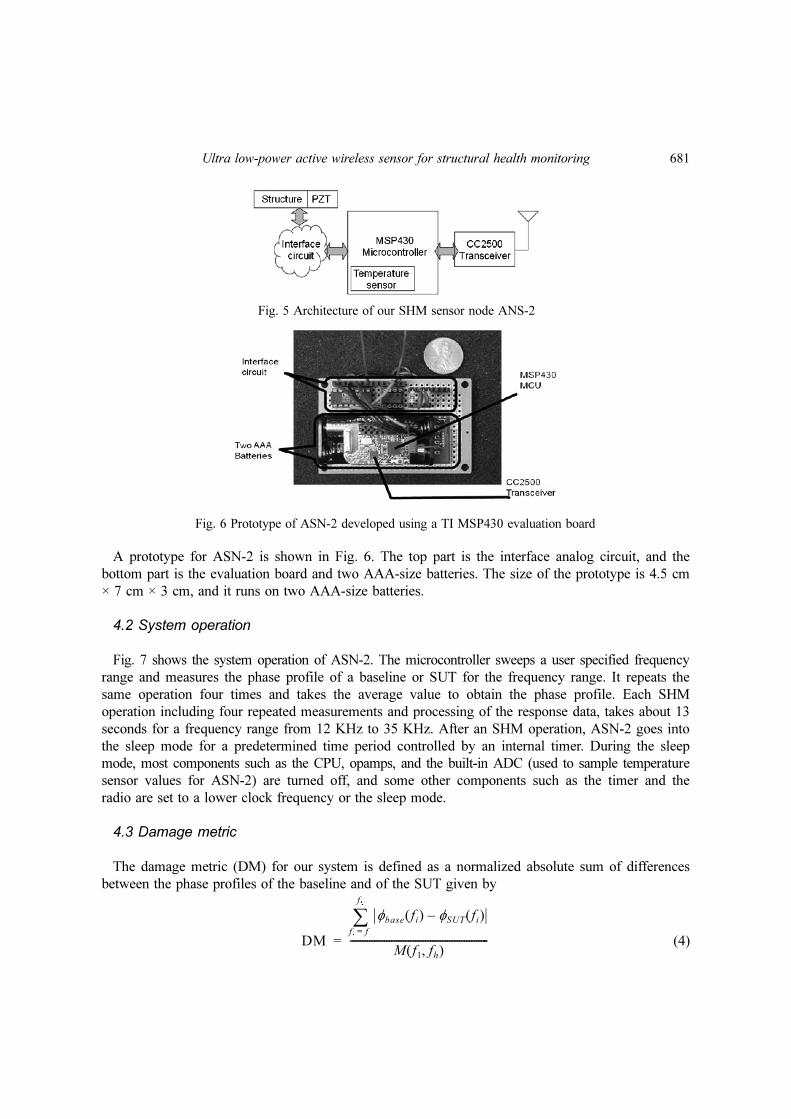
A prototype for ASN-2 is shown in Fig. 6. The top part is the interface analog circuit, and the
bottom part is the evaluation board and two AAA-size batteries. The size of the prototype is 4.5 cm
× 7 cm × 3 cm, and it runs on two AAA-size batteries.
4.2 System operation
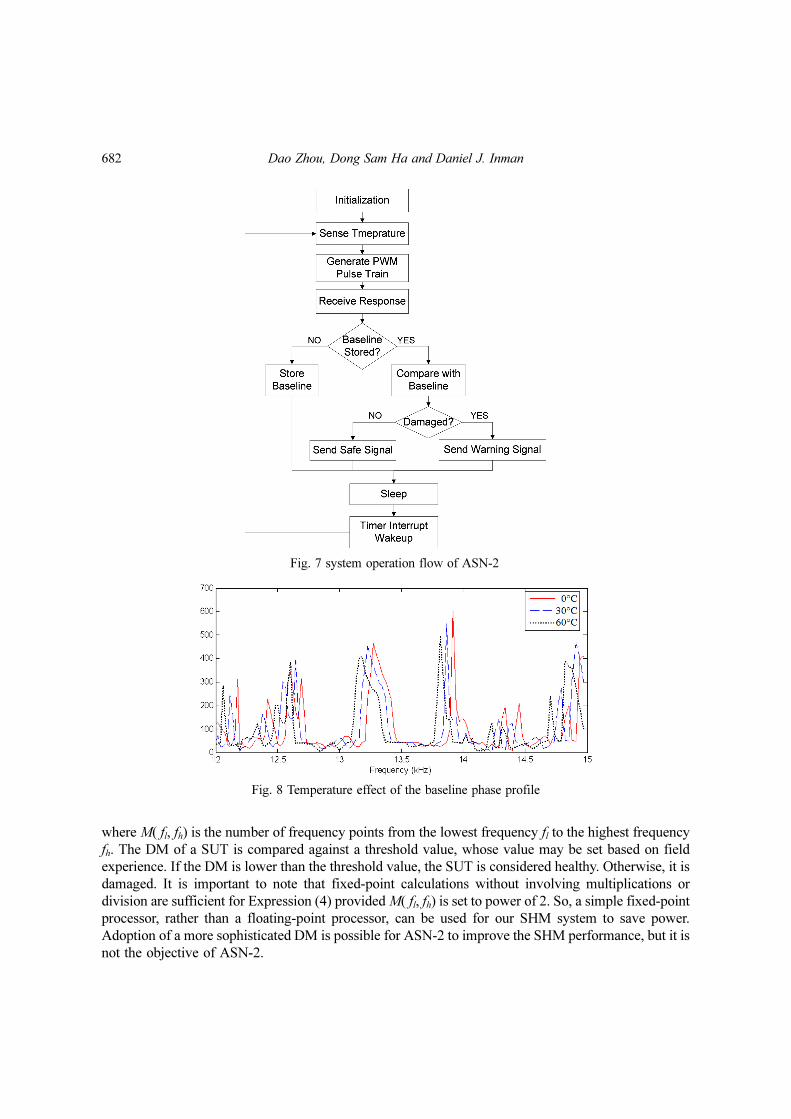
Fig. 7 shows the system operation of ASN-2. The microcontroller sweeps a user specified frequency
range and measures the phase profile of a baseline or SUT for the frequency range. It repeats the
same operation four times and takes the average value to obtain the phase profile. Each SHM
operation including four repeated measurements and processing of the response data, takes about 13
seconds for a frequency range from 12 KHz to 35 KHz. After an SHM operation, ASN-2 goes into
the sleep mode for a predetermined time period controlled by an internal timer. During the sleep
mode, most components such as the CPU, opamps, and the built-in ADC (used to sample temperature
sensor values for ASN-2) are turned off, and some other components such as the timer and the
radio are set to a lower clock frequency or the sleep mode.
4.3 Damage metric
The damage metric (DM) for our system is defined as a normalized absolute sum of differences
between the phase profiles of the baseline and of the SUT given by
(4)DM
φbase fi( ) φSUT fi( )–fi
f1
=
fh
∑
M f1 fh,( )---------------------------------------------------------=
Fig. 5 Architecture of our SHM sensor node ANS-2
Fig. 6 Prototype of ASN-2 developed using a TI MSP430 evaluation board
682 Dao Zhou, Dong Sam Ha and Daniel J. Inman
where M( fl, fh) is the number of frequency points from the lowest frequency fl to the highest frequency
fh. The DM of a SUT is compared against a threshold value, whose value may be set based on field
experience. If the DM is lower than the threshold value, the SUT is considered healthy. Otherwise, it is
damaged. It is important to note that fixed-point calculations without involving multiplications or
division are sufficient for Expression (4) provided M( fl, fh) is set to power of 2. So, a simple fixed-point
processor, rather than a floating-point processor, can be used for our SHM system to save power.
Adoption of a more sophisticated DM is possible for ASN-2 to improve the SHM performance, but it is
not the objective of ASN-2.
Fig. 7 system operation flow of ASN-2
Fig. 8 Temperature effect of the baseline phase profile

Ultra low-power active wireless sensor for structural health monitoring 683
4.4 Temperature compensation
A PZT is sensitive to temperature variations, and Fig. 8 presents our measurements showing the
phase sensitivity of the PZT admittance to temperature (Zhou et al. 2009a). The Y-axis is the cumulative
number of system clock samples for a given frequency f, which represents the phase of the PZT
admittance. (Refer to Fig. 3). The trend observed from the measurements is that as temperature
increases (i) the magnitude of a peak shrinks and (ii) the frequency shifts toward a lower frequency.
A straightforward solution to the temperature dependency is to store all baseline profiles for the
entire temperature range with a small increment of the temperature. During an SHM operation, the
ambient temperature is measured, and the baseline profile corresponding to the temperature is
referenced for the SHM operation. The solution requires a large memory, which is undesirable for
low-end processors with a limited memory space such as microcontrollers. Another approach is to
compensate temperature variations. It assumes a linear relationship between a baseline and its
temperature variations (Krishnamurthy et al. 1996, Park et al. 1999), but a linear relationship is
overly simplified and results in large errors. We proposed a new method, in which a few baseline
profiles at critical temperatures are judiciously selected and used to construct baseline profiles at
other temperatures (Zhou et al. 2009a). A new baseline is constructed based on a linear interpolation
between two baseline profiles at neighbor temperatures. Our method reduces the total number of
baseline profiles stored by more than 40 percent, which makes it suitable for a microcontroller with
a small memory apace. Refer to (Zhou et al. 2009a) for details on our experimental results.
4.5 Wireless networking
The radio included in ASN-2 is a low-power wireless transceiver CC2500 developed by Texas
Instruments. It operates in the band of 2400 MHz to 2483.5 MHz with power dissipation of 65 mW
during transmission. The maximum number of sensor nodes supported by current prototype of
ASN-2 is ten, and the maximum communication distance between a node and a control center is 10
meters indoors.
A network protocol SimplicTI developed by Texas Instruments targets low-power wireless sensor
networks and is adopted for ASN-2. There are three major layers defined for the protocol, the data
link/PHY layer, the network layer, and the application layer. ASN-2 adopts a star network topology
and a token-based algorithm to avoid conflicts. The control center node assigns a token with a
sensor node ID number, and the sensor node with the matching ID number grabs the token,
synchronizes its clock with that of the control center, and transmits the data. The data is three bytes
long, including the outcome of the SHM operation and the ambient temperature. The transmission
data rate is set to 250 kbps for ASN-2, and transmission of one message takes about 30 msec.
5. Experimental results
In this section, we present experimental results and a power dissipation profile of ASN-2 during
an SHM operation.
5.1 Test structure and environment
The test structure for our experiments is an aluminum beam with a PZT patch attached at one
684 Dao Zhou, Dong Sam Ha and Daniel J. Inman
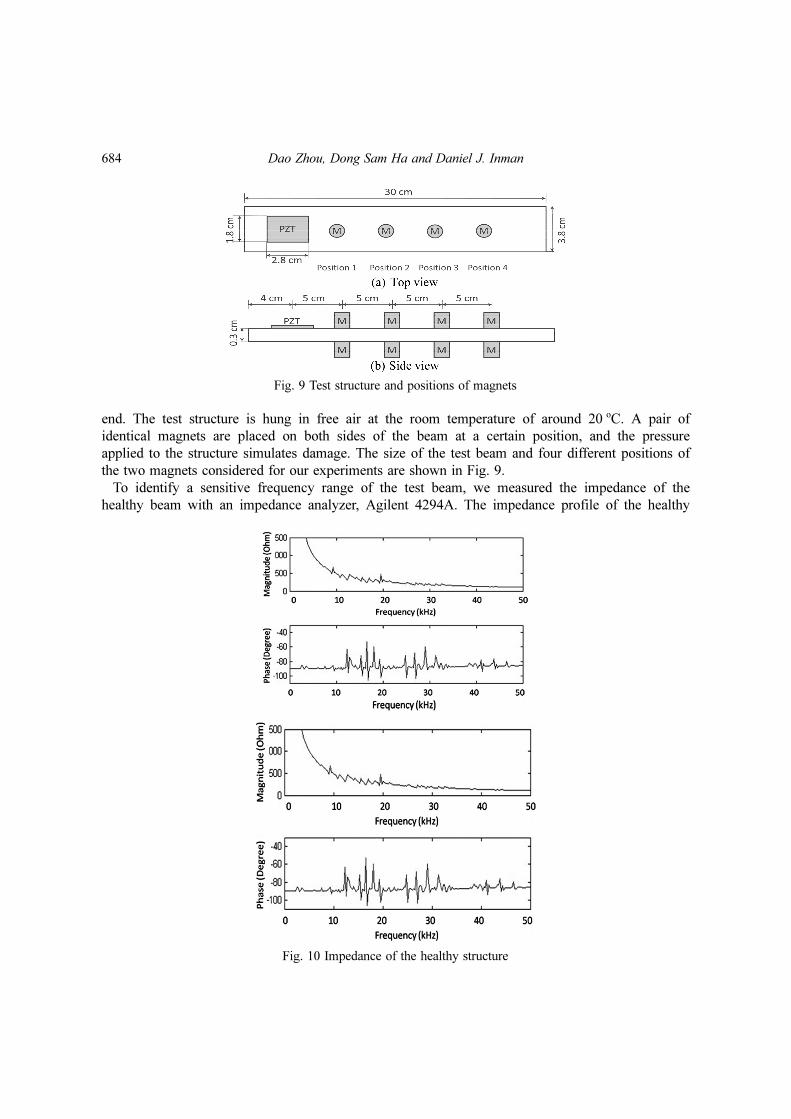
end. The test structure is hung in free air at the room temperature of around 20 oC. A pair of
identical magnets are placed on both sides of the beam at a certain position, and the pressure
applied to the structure simulates damage. The size of the test beam and four different positions of
the two magnets considered for our experiments are shown in Fig. 9.
To identify a sensitive frequency range of the test beam, we measured the impedance of the
healthy beam with an impedance analyzer, Agilent 4294A. The impedance profile of the healthy
Fig. 9 Test structure and positions of magnets
Fig. 10 Impedance of the healthy structure
Ultra low-power active wireless sensor for structural health monitoring 685
beam is shown in Fig. 10. As shown in the figure, the phase of the measured impedance is sensitive
in the frequency range from 12 kHz to 35 kHz, and hence the range is set for our experiments.
5.2 SHM performance
We performed SHM operations with ASN-2, in which the excitation pulse train sweeps from 12
KHz to 35 KHz. Since the phase profile of a SUT changes from one measurement to the next due
to noise or other environment changes, we conducted 20 experiments for the baseline and for each
damage, i.e., each position of the magnets, and computed the DM values using expression (4).
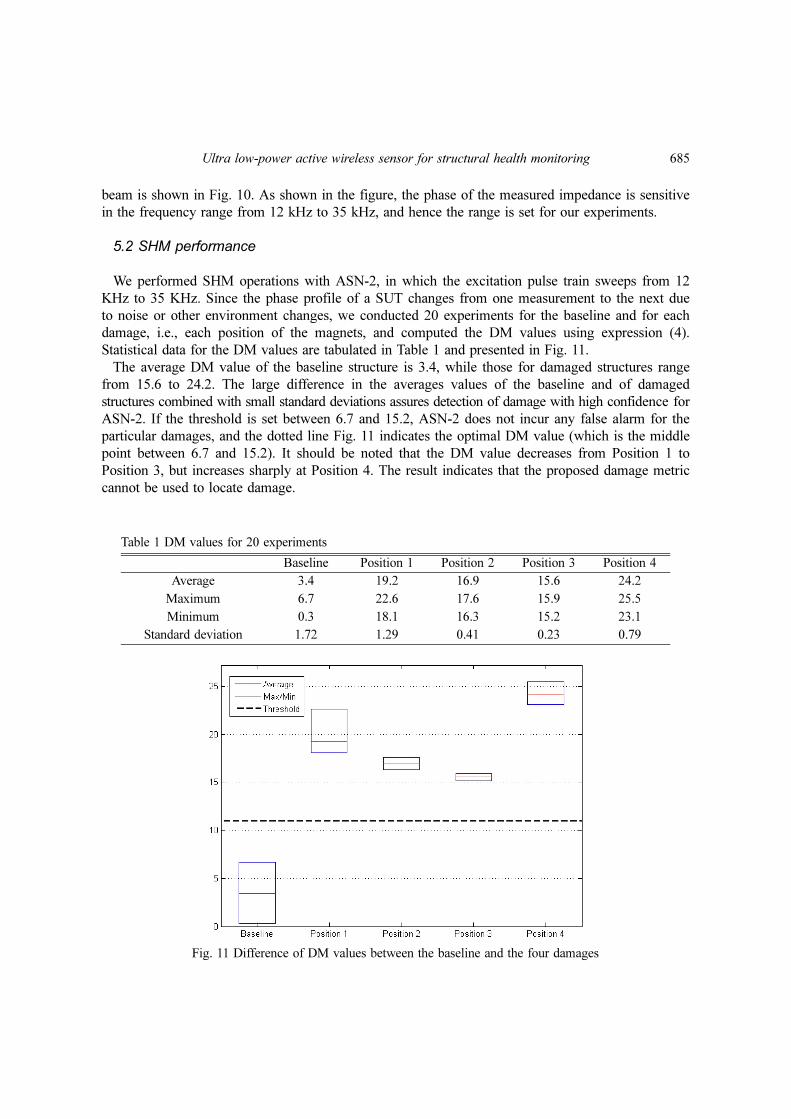
Statistical data for the DM values are tabulated in Table 1 and presented in Fig. 11.
The average DM value of the baseline structure is 3.4, while those for damaged structures range
from 15.6 to 24.2. The large difference in the averages values of the baseline and of damaged
structures combined with small standard deviations assures detection of damage with high confidence for
ASN-2. If the threshold is set between 6.7 and 15.2, ASN-2 does not incur any false alarm for the
particular damages, and the dotted line Fig. 11 indicates the optimal DM value (which is the middle
point between 6.7 and 15.2). It should be noted that the DM value decreases from Position 1 to
Position 3, but increases sharply at Position 4. The result indicates that the proposed damage metric
cannot be used to locate damage.
Table 1 DM values for 20 experiments
Baseline Position 1 Position 2 Position 3 Position 4
Average 3.4 19.2 16.9 15.6 24.2
Maximum 6.7 22.6 17.6 15.9 25.5
Minimum 0.3 18.1 16.3 15.2 23.1
Standard deviation 1.72 1.29 0.41 0.23 0.79
Fig. 11 Difference of DM values between the baseline and the four damages
686 Dao Zhou, Dong Sam Ha and Daniel J. Inman
5.3 Power profile
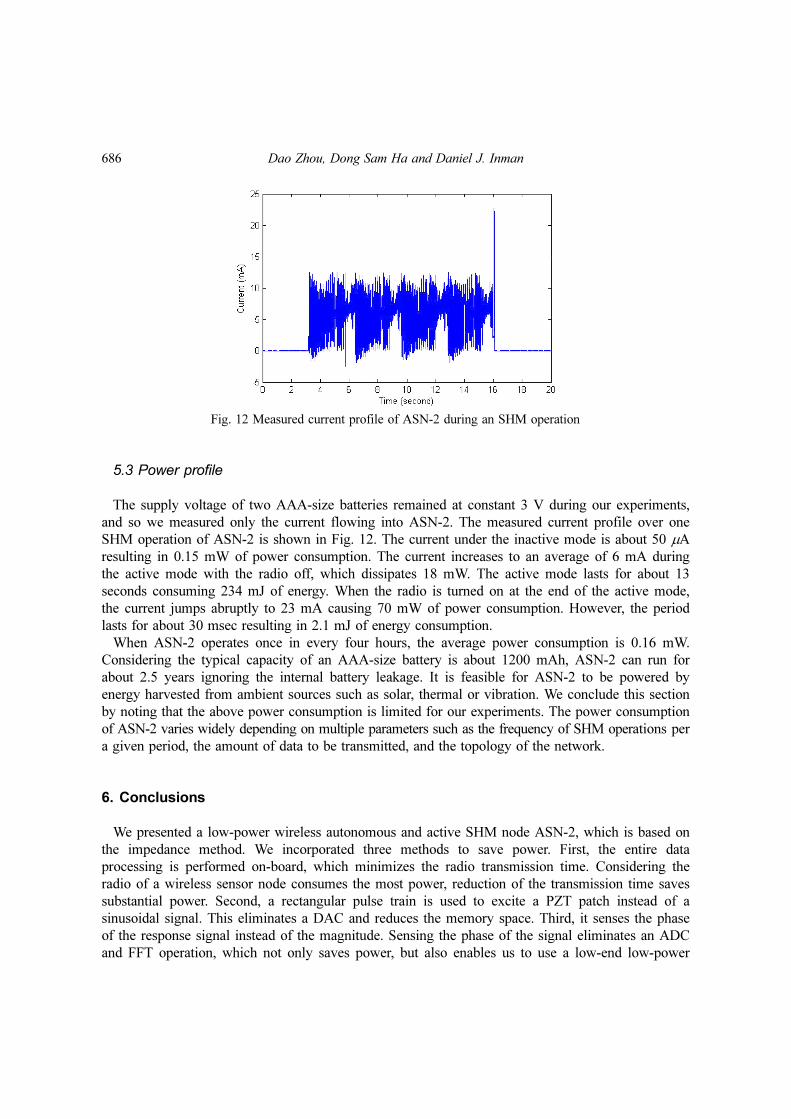
The supply voltage of two AAA-size batteries remained at constant 3 V during our experiments,
and so we measured only the current flowing into ASN-2. The measured current profile over one
SHM operation of ASN-2 is shown in Fig. 12. The current under the inactive mode is about 50 µA
resulting in 0.15 mW of power consumption. The current increases to an average of 6 mA during
the active mode with the radio off, which dissipates 18 mW. The active mode lasts for about 13
seconds consuming 234 mJ of energy. When the radio is turned on at the end of the active mode,
the current jumps abruptly to 23 mA causing 70 mW of power consumption. However, the period
lasts for about 30 msec resulting in 2.1 mJ of energy consumption.
When ASN-2 operates once in every four hours, the average power consumption is 0.16 mW.
Considering the typical capacity of an AAA-size battery is about 1200 mAh, ASN-2 can run for
about 2.5 years ignoring the internal battery leakage. It is feasible for ASN-2 to be powered by
energy harvested from ambient sources such as solar, thermal or vibration. We conclude this section
by noting that the above power consumption is limited for our experiments. The power consumption
of ASN-2 varies widely depending on multiple parameters such as the frequency of SHM operations per
a given period, the amount of data to be transmitted, and the topology of the network.
6. Conclusions
We presented a low-power wireless autonomous and active SHM node ASN-2, which is based on
the impedance method. We incorporated three methods to save power. First, the entire data
processing is performed on-board, which minimizes the radio transmission time. Considering the
radio of a wireless sensor node consumes the most power, reduction of the transmission time saves
substantial power. Second, a rectangular pulse train is used to excite a PZT patch instead of a
sinusoidal signal. This eliminates a DAC and reduces the memory space. Third, it senses the phase
of the response signal instead of the magnitude. Sensing the phase of the signal eliminates an ADC
and FFT operation, which not only saves power, but also enables us to use a low-end low-power
Fig. 12 Measured current profile of ASN-2 during an SHM operation

Ultra low-power active wireless sensor for structural health monitoring 687
processor. Our SHM sensor node ASN-2 is implemented using a TI MSP430 microcontroller evaluation
board. A cluster of ASN-2 nodes forms a wireless network. Each node wakes up at a predetermined
interval such as once in four hours, performs an SHM operation, reports the result to the central
node wirelessly, and returns to sleep. The power consumption of our ASN-2 is 0.15 mW during the
inactive mode and 18 mW during the active mode. Each SHM operation takes about 13 seconds to
consume 236 mJ. When our ASN-2 operates once in every four hours, it can run for about 2.5 years
with two AAA-size batteries ignoring the internal battery leakage.
References
Farinholt, K.M., Park, G. and Farrar, C.R. (2009), “Energy harvesting and wireless energy transmission for powerSHM sensor nodes”, Proceedings of the 7th International Workshop for Structural Health Monitoring, PaloAlto, CA, September.
Kim, J., Grisso, B.L., Ha, D.S. and Inman, D.J. (2007a), “An all-digital low-power structural health monitoringsystem”, Proceedings of the IEEE Conference on Technologies for Homeland Security.
Kim, J., Grisso, B.L., Ha, D.S. and Inman, D.J. (2007b), “A System-On-Board approach for Impedance-basedStructural Health Monitoring”, Proc. SPIE, 6529, 65290O.1-65290O.9.
Krishnamurthy, K., Lalande, F. and Rogers, C.A. (1996), “Effects of temperature on the electrical impedance ofpiezoelectric sensors”, Proc. SPIE, 2717, 302-310.
Mascarenas, D.L., Todd, M.D, Park, G. and Farrar, C.R. (2007), “Development of an impedance-based wirelesssensor node for structural health monitoring”, Smart Mater. Struct., 16(6), 2137-2145.
Overly, T.G., Park, G., Farinholt, K.M. and Farrar, C.R. (2008), “Development of an extremely compactimpedance-based wireless sensing device”, Smart Mater. Struct., 17(6).
Park, G., Sohn, H., Farrar, C.R. and Inman, D.J. (2003), “Overview of piezoelectric impedance-based healthmonitoring and path forward”, Shock Vib. Digest, 35, 451-463.
Park, G., Kabeya, K., Cudney, H.H. and Inman, D.J. (1999), “Impedance-based structural health monitoring fortemperature varying applications”, JSME Int. J. A-Solid M., 42, 249-258.
Park, S., Shin, H. and Yun, C.B. (2009), “Wireless impedance sensor nodes for functions of structural damageidentification and sensor self-diagnosis”, Smart Mater. Struct., 18(5).
Park, S., Yun, C.B., Inman, D.J. and Park, G. (2008a), “Wireless structural health monitoring for critical membersof civil infrastructures using piezoelectric active sensors”, Proc. SPIE, 6935.
Park, S., Lee, J., Yun, C.B. and Inman, D.J. (2008b), “Electro-mechanical impedance-based wireless structuralhealth monitoring using PCA-data compression and k-means clustering algorithms”, J. Intel. Mat. Syst. Str.,19(4), 509-520.
Sun, F.P., Chaudhry, Z., Liang, C. and Rogers, C.A. (1995), “Truss structure integrity identification using PZTsensor-actuator”, J. Intel. Mat. Syst. Str., 6(1), 134-139.
Taylor, S.G., Farinholt, K.M., Park, G. and Farrar, C.R. (2009a), “Impedance-based wireless sensor node forSHM, sensor diagnostics, and low-frequency vibration data acquisition”, Proceedings of the 7th InternationalWorkshop for Structural Health Monitoring, Palo Alto, CA, September.
Taylor, S.G., Farinholt, K.M., Flynn, E.B., Figueiredo, E., Mascarenas, D.L., Park, G., Todd, M.D. and Farrar,C.R. (2009b), “A mobile agent-based wireless sensing network for SHM study at the Alamos Canyon Bridge”,Proceedings of the 7th International Workshop for Structural Health Monitoring, Palo Alto, CA, September.
Zhou, D., Kim, J.K., Ha, D.S., Quesenberry, J.D. and Inman, D.J. (2009a), “A system approach for temperaturedependency of impedance-based structural health monitoring”, Proc. SPIE, 7293, 72930U-72930U-10.
Zhou, D., Kim, J.K., Bilé, J.L.K., Shebi, A.B., Ha, D.S. and Inman, D.J. (2009b), “Ultra low-power autonomouswireless structural health monitoring node”, Proceedings of the 7th International Workshop for StructuralHealth Monitoring, Palo Alto, CA, September.