Embed Size (px)
Citation preview
1
Ultra-Sensitive Chip-Based Photonic Temperature Sensor
Using Ring Resonator Structures
Haitan Xu1, Mohammad Hafezi
1, J. Fan
1, J. M. Taylor
1,2 and G. F. Strouse
3, Zeeshan
Ahmed3
1Joint Quantum Institute, University of Maryland, College Park, MD 20742
2National Institute of Standards and Technology, Gaithersburg, MD 20899
3Thermodynamic Metrology Group, Sensor Science Division, Physical Measurement
Laboratory, National Institute of Standards and Technology, Gaithersburg, MD 20899
ABSTRACT
Resistance thermometry provides a time-tested method for taking temperature
measurements. However, fundamental limits to resistance-based approaches has
produced considerable interest in developing photonic temperature sensors to leverage
advances in frequency metrology and to achieve greater mechanical and environmental
stability. Here we show that silicon-based optical ring resonator devices can resolve
temperature differences of 1 mK using the traditional wavelength scanning methodology.
An even lower noise floor of 80 μK for measuring temperature difference is achieved in
the side-of-fringe, constant power mode measurement.
Temperature measurements play a central role in modern life ranging from
process control in manufacturing1, physiological monitoring
2 and tissue ablation
3 in
2
medicine, and environmental control and monitoring in buildings4 and automobiles
5.
Despite the ubiquity of thermometers, the underlying technology has been slow to
advance over the last century.6 The standard bearer for accurate temperature
measurement, the standard platinum resistance thermometer (SPRT) was initially
developed over a century ago.6,7
Furthermore, many modern temperature sensors still rely
on resistance measurements of a thin metal film or wire whose resistance varies with
temperature.6 Though resistance thermometers can routinely measure temperature with
uncertainties of 10 mK, they are sensitive to mechanical shock which causes the
resistance to drift over time requiring frequent off-line, expensive, and time consuming
calibrations.7
In recent years there has been considerable interest in developing photonic
devices as an alternative to resistance thermometers8-10
as they have the potential to
provide greater temperature sensitivity while being robust against mechanical shock and
electromagnetic interference. Furthermore, the low weight, small form factor photonic
devices might be multiplexed to provide a low-cost sensing solutions.
Photonic temperature sensors exploit temperature dependent changes in a
material’s properties – typically, a combination of thermo-optic effect and thermal
expansion.11-13
For example, one of us (Strouse14
) has demonstrated that the intrinsic
temperature dependence of a synthetic sapphire’s refractive index can be exploited for
highly sensitive temperature measurement by measuring microwave frequency shifts of
monocrystalline sapphire’s resonant whispering gallery modes, with measurement
uncertainties of 10 mK from 273.15 K to 373 K.14
An optical analog of this, using
infrared light to probe strain-free fiber Bragg gratings (FBG), exhibits temperature
3
dependent shifts in resonant wavelength of 10 pm/K.8,9,11,12
This sensitivity has been
exploited in commercially available photonic temperature sensors.8,11,12
However, FBGs are susceptible to strain and are relatively large. Instead, we
consider the use of ring resonators. In recent years, ring resonator15
based devices have
been exploited for bio-chemical sensing applications.16
In these sensors, temperature
induced shifts in resonance frequency have been a complicating variable or feature that
can adversely impact sensor sensitivity and specificity. Indeed, development of an
athermal ring resonator is an active area of research.17
Here, we examine their use as
thermal sensors, extending the concepts from a recent study Kim et al18
that demonstrated
that silicon ring resonator devices respond rapidly to small temperature variations (in
about 6 μs).
The temperature dependence of the ring resonator arises from temperature-
induced changes in refractive index (n) and in the physical dimensions of the ring. A
qualitative analysis of a ring resonator yields a resonance wavelength for a single ring
resonator of:
( ) ( ) (1)
where m is the vacuum wavelength, neff is the effective refractive index, m is the mode
number, L is the ring perimeter, and T is the temperature. Thus, the temperature-induced
shift in wavelength is given by:
{[(
) (
)(
)]
} ( ) (2)
Where the group index is ng = [ (
) . The variation in the refractive index due
to the thermal expansion coefficient for silicon (3.57 x 10⁻⁶
/K) is a factor of 100 smaller
4
than that of the estimated thermo-optic effect (2 x 10⁻⁴
/K) of the silicon waveguide and
thus not included in our analysis of the performance of ring resonator devices.
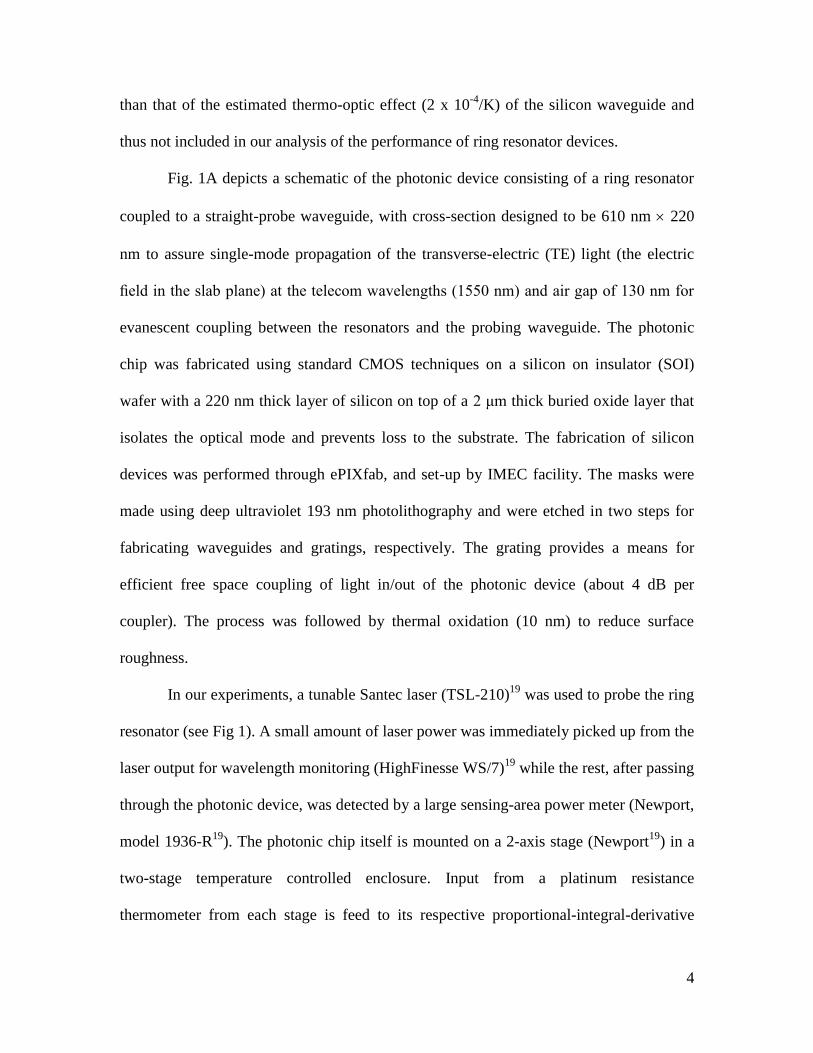
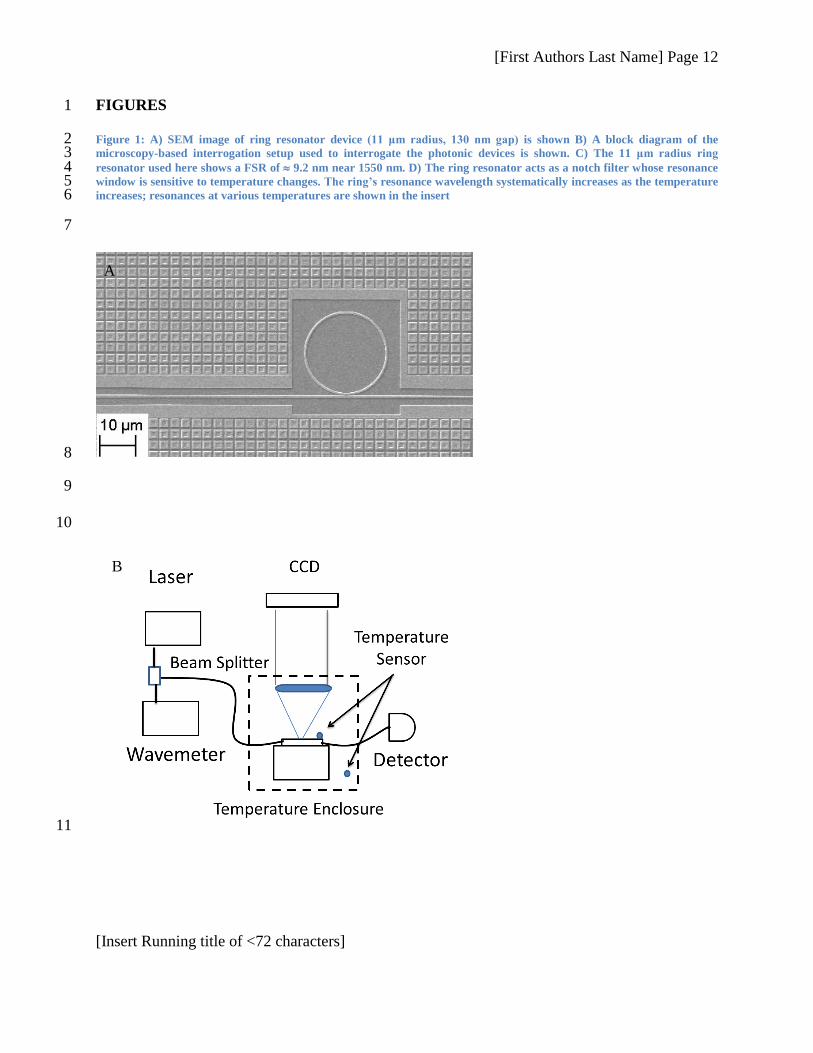
Fig. 1A depicts a schematic of the photonic device consisting of a ring resonator
coupled to a straight-probe waveguide, with cross-section designed to be 610 nm 220
nm to assure single-mode propagation of the transverse-electric (TE) light (the electric
field in the slab plane) at the telecom wavelengths (1550 nm) and air gap of 130 nm for
evanescent coupling between the resonators and the probing waveguide. The photonic
chip was fabricated using standard CMOS techniques on a silicon on insulator (SOI)
wafer with a 220 nm thick layer of silicon on top of a 2 μm thick buried oxide layer that
isolates the optical mode and prevents loss to the substrate. The fabrication of silicon
devices was performed through ePIXfab, and set-up by IMEC facility. The masks were
made using deep ultraviolet 193 nm photolithography and were etched in two steps for
fabricating waveguides and gratings, respectively. The grating provides a means for
efficient free space coupling of light in/out of the photonic device (about 4 dB per
coupler). The process was followed by thermal oxidation (10 nm) to reduce surface
roughness.
In our experiments, a tunable Santec laser (TSL-210)19
was used to probe the ring
resonator (see Fig 1). A small amount of laser power was immediately picked up from the
laser output for wavelength monitoring (HighFinesse WS/7)19
while the rest, after passing
through the photonic device, was detected by a large sensing-area power meter (Newport,
model 1936-R19
). The photonic chip itself is mounted on a 2-axis stage (Newport19
) in a
two-stage temperature controlled enclosure. Input from a platinum resistance
thermometer from each stage is feed to its respective proportional-integral-derivative
5
controller that drives a thermoelectric cooler (Laird Technologies19
). The first stage
minimizes global temperature fluctuations inside the enclosure to better than ± 1 K, while
the second stage minimizes temperature variations at the chip to 17 mK over 24 hours.
The relative humidity (%RH) levels inside the temperature enclosure were monitored
using a portable humidity meter (Vaisala19
). Relative humidity levels were varied inside
the enclosure by varying the flow rate of water saturated air.
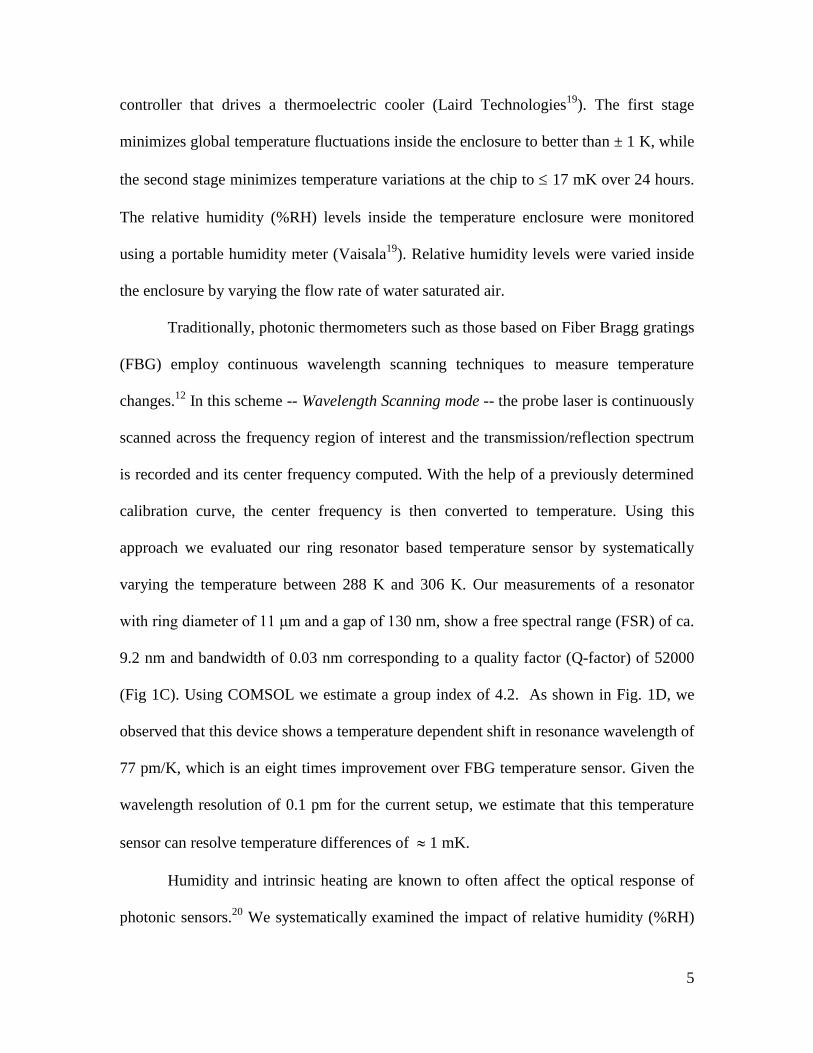
Traditionally, photonic thermometers such as those based on Fiber Bragg gratings
(FBG) employ continuous wavelength scanning techniques to measure temperature
changes.12
In this scheme -- Wavelength Scanning mode -- the probe laser is continuously
scanned across the frequency region of interest and the transmission/reflection spectrum
is recorded and its center frequency computed. With the help of a previously determined
calibration curve, the center frequency is then converted to temperature. Using this
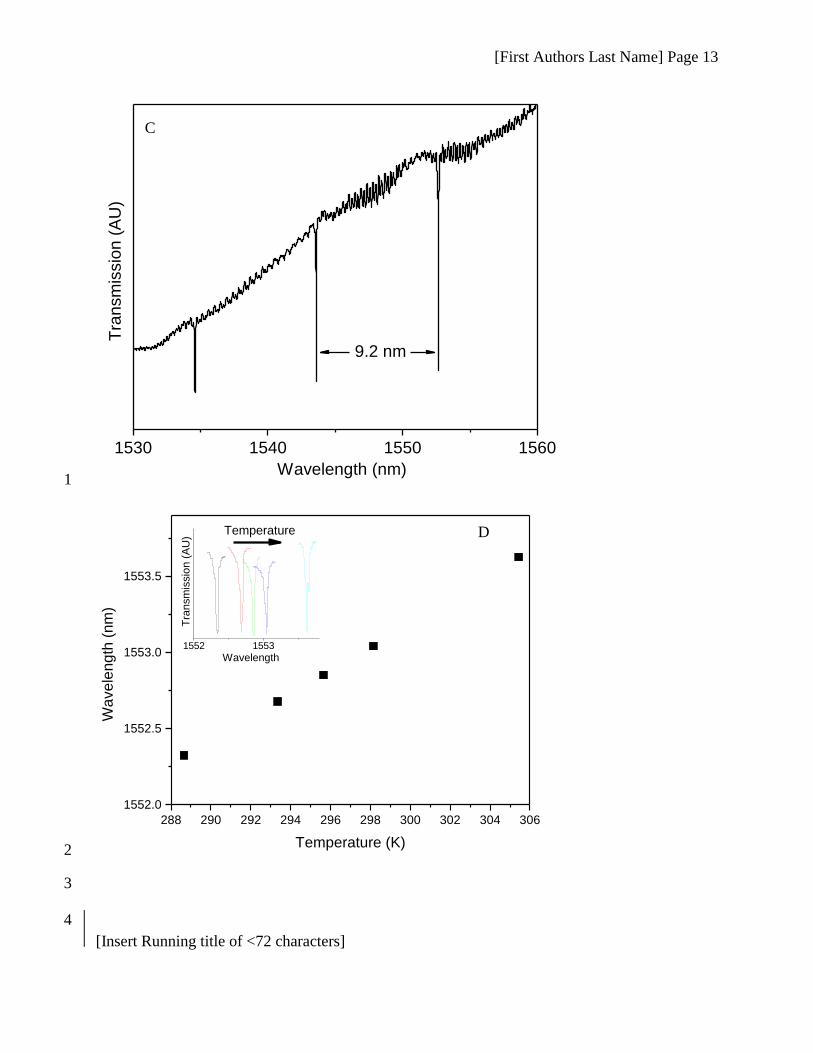
approach we evaluated our ring resonator based temperature sensor by systematically
varying the temperature between 288 K and 306 K. Our measurements of a resonator
with ring diameter of 11 μm and a gap of 130 nm, show a free spectral range (FSR) of ca.
9.2 nm and bandwidth of 0.03 nm corresponding to a quality factor (Q-factor) of 52000
(Fig 1C). Using COMSOL we estimate a group index of 4.2. As shown in Fig. 1D, we
observed that this device shows a temperature dependent shift in resonance wavelength of
77 pm/K, which is an eight times improvement over FBG temperature sensor. Given the
wavelength resolution of 0.1 pm for the current setup, we estimate that this temperature
sensor can resolve temperature differences of 1 mK.
Humidity and intrinsic heating are known to often affect the optical response of
photonic sensors.20
We systematically examined the impact of relative humidity (%RH)
6
changes on resonance frequency by varying humidity levels from 17 %RH to 26 %RH at
294.15 K. Our measurements indicate humidity does not have any significant impact on
the resonance frequency (data not shown). The insensitivity of our device to changes in
humidity likely derives from the passivating SiO2 layer deposited on-top of the ring
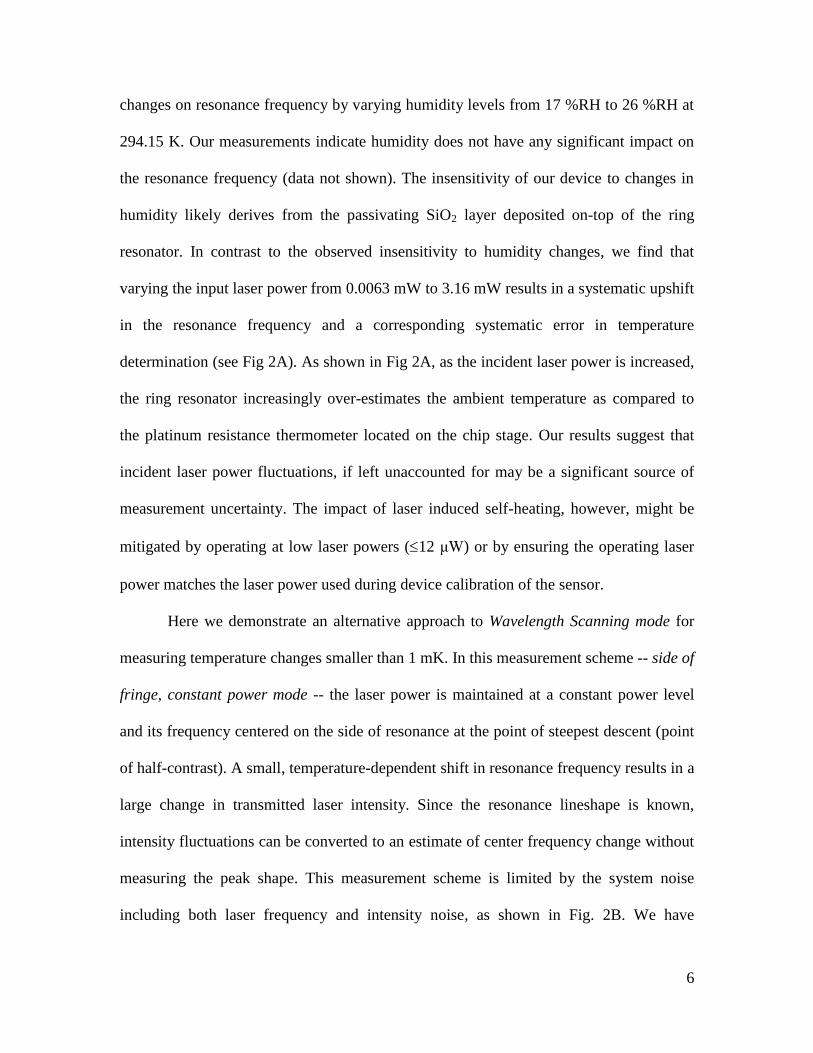
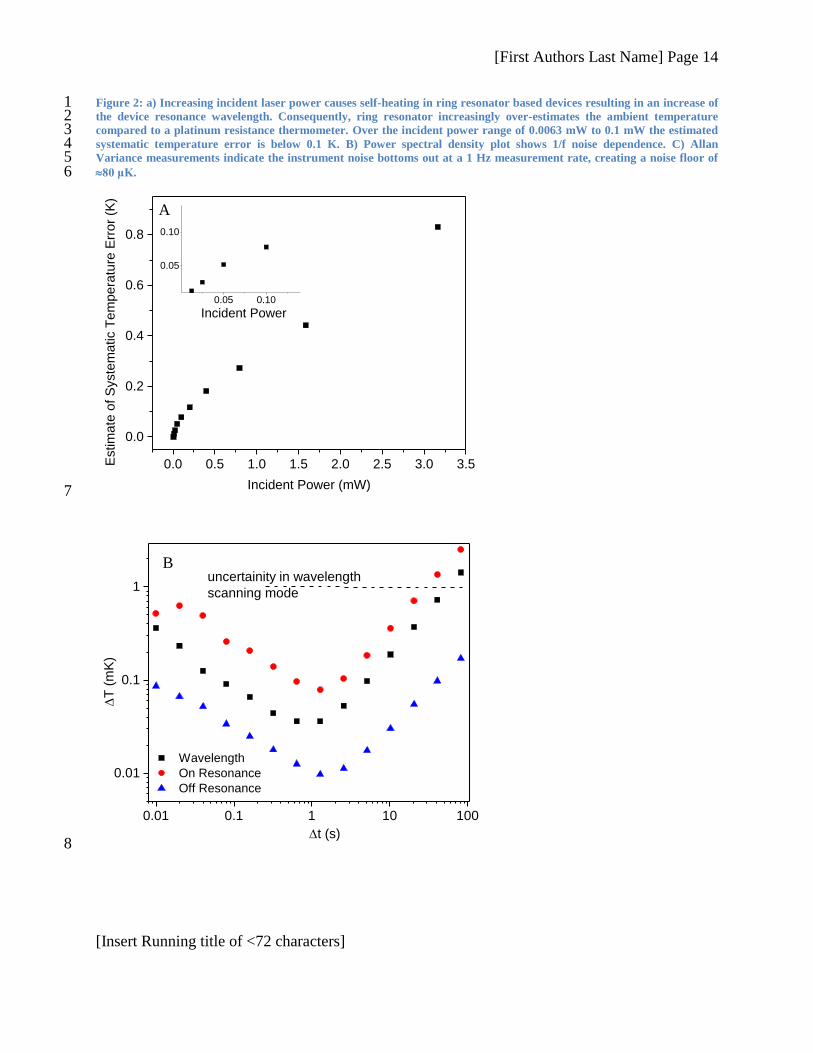
resonator. In contrast to the observed insensitivity to humidity changes, we find that
varying the input laser power from 0.0063 mW to 3.16 mW results in a systematic upshift
in the resonance frequency and a corresponding systematic error in temperature
determination (see Fig 2A). As shown in Fig 2A, as the incident laser power is increased,
the ring resonator increasingly over-estimates the ambient temperature as compared to
the platinum resistance thermometer located on the chip stage. Our results suggest that
incident laser power fluctuations, if left unaccounted for may be a significant source of
measurement uncertainty. The impact of laser induced self-heating, however, might be
mitigated by operating at low laser powers (12 μW) or by ensuring the operating laser
power matches the laser power used during device calibration of the sensor.
Here we demonstrate an alternative approach to Wavelength Scanning mode for
measuring temperature changes smaller than 1 mK. In this measurement scheme -- side of
fringe, constant power mode -- the laser power is maintained at a constant power level
and its frequency centered on the side of resonance at the point of steepest descent (point
of half-contrast). A small, temperature-dependent shift in resonance frequency results in a
large change in transmitted laser intensity. Since the resonance lineshape is known,
intensity fluctuations can be converted to an estimate of center frequency change without
measuring the peak shape. This measurement scheme is limited by the system noise
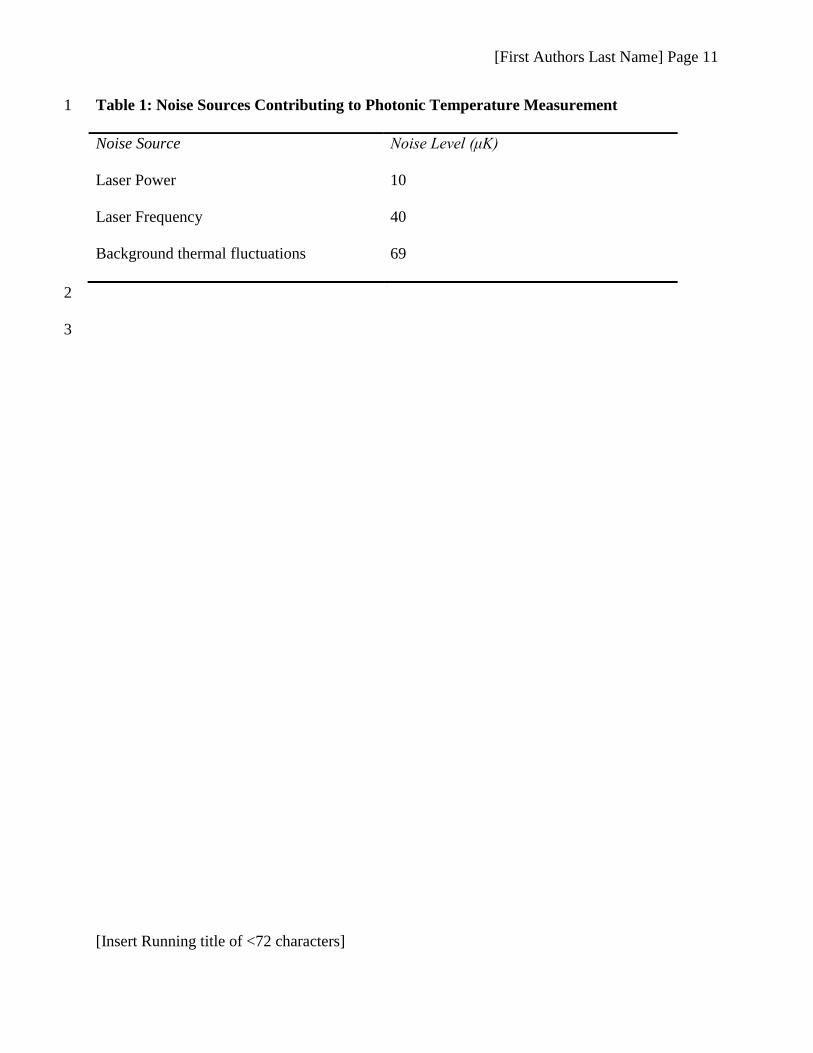
including both laser frequency and intensity noise, as shown in Fig. 2B. We have
7
quantified the system noise by systematically measuring the output power of the ring
resonator as a function of time with laser wavelength set on- and off-resonance (Table 1).
The laser frequency was simultaneously monitored during these measurements to
quantify laser frequency noise which primarily derives from long term drift in laser
frequency. To quantify this, we performed a control, off-resonance measurement in
which the laser is tuned in between two resonance peaks; transmitted intensity
corresponds to light travelling through the entire optical train except the on-chip
resonator. This control measurement allows us to estimate noise sources deriving from
fluctuations in laser power and light coupling. The side-of-fridge approach is estimating
the resonance frequency by local inversion of the expected lineshape, and thus contains
additional contributions from background thermal fluctuations and laser frequency noise.
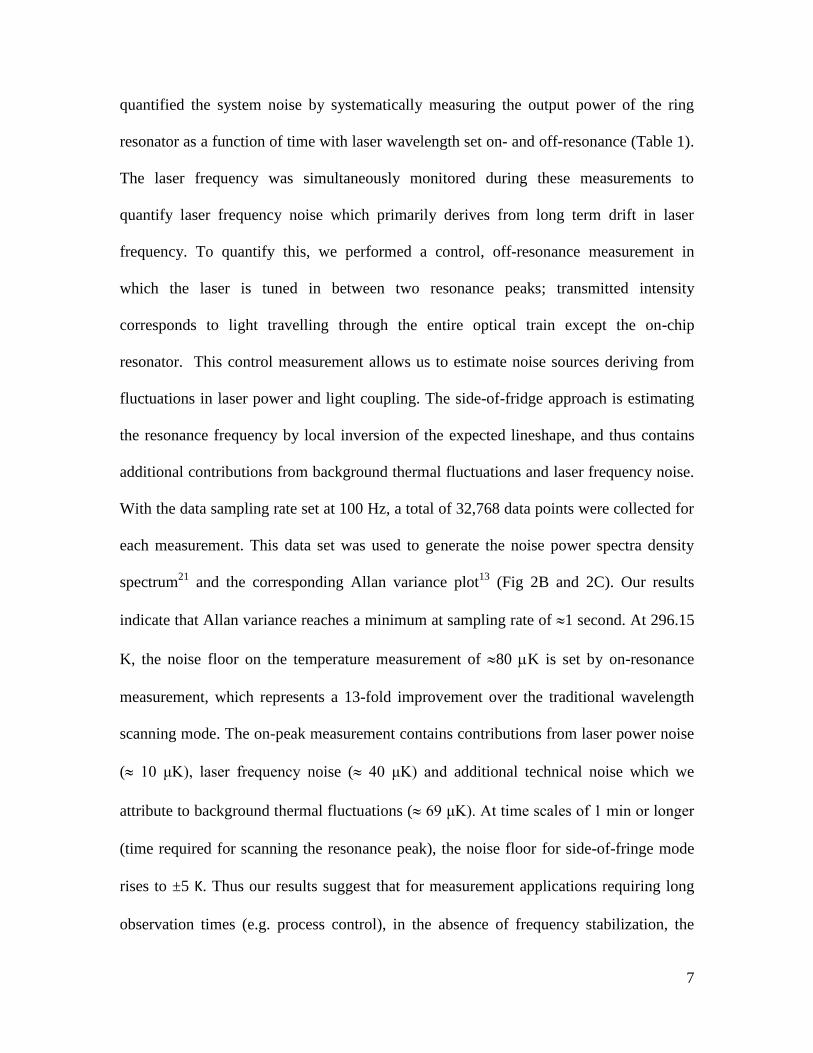
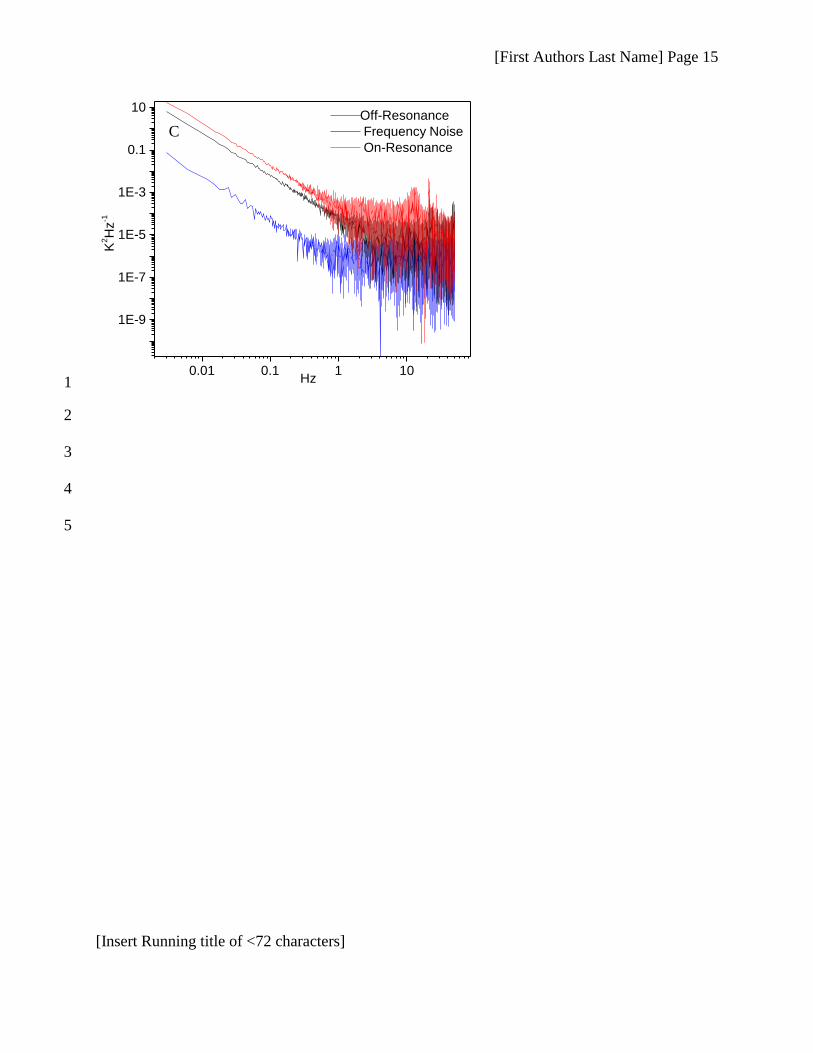
With the data sampling rate set at 100 Hz, a total of 32,768 data points were collected for
each measurement. This data set was used to generate the noise power spectra density
spectrum21
and the corresponding Allan variance plot13
(Fig 2B and 2C). Our results
indicate that Allan variance reaches a minimum at sampling rate of 1 second. At 296.15
K, the noise floor on the temperature measurement of 80 K is set by on-resonance
measurement, which represents a 13-fold improvement over the traditional wavelength
scanning mode. The on-peak measurement contains contributions from laser power noise
( 10 μK), laser frequency noise ( 40 μK) and additional technical noise which we
attribute to background thermal fluctuations ( 69 μK). At time scales of 1 min or longer
(time required for scanning the resonance peak), the noise floor for side-of-fringe mode
rises to ±5 K. Thus our results suggest that for measurement applications requiring long
observation times (e.g. process control), in the absence of frequency stabilization, the
8
classic wavelength scanning mode provides lower measurement uncertainty. The side of
fringe constant power mode is best suited for dynamic temperature measurements.
In summary, we have demonstrated that ring resonators can be used for
temperature sensing with sub-mK resolution. The noise level of these devices can be
further reduced by laser frequency and power stabilization techniques. The low noise
levels of these photonic sensors along with their low thermal mass and immunity to
electro-magnetic interference make them attractive choice for applications in aerospace
and microfluidics. However, key systematic errors induced by laser power and laser
intensity noise remain to be addressed over a wider range of temperature and operating
environments.
9
ACKNOWLEDGEMENTS
We thank Kevin Douglass, Stephen Maxwell, Howard Yoon, Joe Hodges for helpful comments.
This work was supported in part by DARPA QuASAR and by the NSF-funded Physics Frontier
Center at the JQI.
10
REFERENCES
1 Xing Woo, Yi; Nagy, Z. K.; Tan, R. B. H.; Braatz, R. D., Crystal Growth & Design 9
(1), 182 (2009). 2 M. R. Pinsky, L. Brochard, J. Mancebo, and G. Hedenstierna, (Springer, New York,
2009); Karl Reinhold August Wunderlich, On the Temperature in Diseases: AManual of
Medical Thermometry. (The New Sydenham Society, London, 1868). 3 Ferenc A. Jolesz, Annual Review of Medicine 60, 417 (2009).
4 Herbert W. Standford III, HVAC Water Chillers and Cooling Towers. (CRC Press Taylor
& Francis Group, Boca Raton, 2012 ). 5 John Turner, in Sensors Technology, edited by Joe Watson (Momentum Press LLC, New
York, 2009). 6 Rodney Price, Platinum Metals Rev. 3 (3), 78 (1959).
7 G. F. Strouse, NIST Special Publication 250-250-81 (2008).
8 Stephen J. Mihailov, Sensors 12 (2), 1898 (2012).
9 A. D. Kersey and T. A. Berkoff, Photonics Technology Letters, IEEE 4 (10), 1183
(1992). 10
Rao Yun-Jiang, D. J. Webb, D. A. Jackson, Zhang Lin, and I. Bennion, Lightwave
Technology, Journal of 15 (5), 779 (1997). 11
J. Hecht, Understanding Fiber Optics 4th ed. (Prentice Hall, 2002). 12
D. A. Krohn, Fiber Optic Sensors: Fundamentals and Applications 3ed. (ISA, 2000). 13
F. L. Walls and David W. Allan, Proceeding of the IEEE 74 (1), 162 (1986). 14
G. F. Strouse, International Journal of Thermophysics 28 (6), 1812 (2007). 15
W. W. Rigrod, The Bell System Technical Journal, 907 (1965); Liron Stern, Ilya
Goykhman, Boris Desiatov, and Uriel Levy, Opt. Lett. 37 (8), 1313 (2012). 16
Xiaoguang Tu, Junfeng Song, Tsung-Yang Liow, Mi Kyoung Park, Jessie Quah Yiying,
Jack Sheng Kee, Mingbin Yu, and Guo-Qiang Lo, Opt. Express 20 (3), 2640 (2012);
Min-Suk Kwon and William H. Steier, Opt. Express 16 (13), 9372 (2008). 17
Biswajeet Guha, Bernardo B. C. Kyotoku, and Michal Lipson, Opt. Express 18 (4), 3487
(2010); Biswajeet Guha, Kyle Preston, and Michal Lipson, Opt. Lett. 37 (12),
2253 (2012). 18
Gun-Duk Kim, Hak-Soon Lee, Chang-Hyun Park, Sang-Shin Lee, Boo Tak Lim, Hee
Kyoung Bae, and Wan-Gyu Lee, Opt. Express 18 (21), 22215 (2010). 19
Disclaimer: Certain equipment or materials are identified in this paper in order to specify
the, experimental procedure adequately. Such identification is not intended to imply, nor
is it intended to endorsement by the National Institute of Standards and Technology, and
imply that the materials or equipment identified are necessarily the best available. 20
K. Tiefenthaler and W. Lukosz, Optics Letters 10, 137 (1984); K. Tiefenthaler and
W. Lukosz, Thin Solid Film 126, 205 (1985). 21
L. D. Turner, K. P. Weber, C. J. Hawthorn, and R. E. Scholten, Optics Communications
201 (4–6), 391 (2002).
[First Authors Last Name] Page 11
[Insert Running title of <72 characters]
Table 1: Noise Sources Contributing to Photonic Temperature Measurement 1
Noise Source Noise Level (μK)
Laser Power 10
Laser Frequency 40
Background thermal fluctuations 69
2
3
[First Authors Last Name] Page 12
[Insert Running title of <72 characters]
FIGURES 1
Figure 1: A) SEM image of ring resonator device (11 μm radius, 130 nm gap) is shown B) A block diagram of the 2 microscopy-based interrogation setup used to interrogate the photonic devices is shown. C) The 11 μm radius ring 3 resonator used here shows a FSR of 9.2 nm near 1550 nm. D) The ring resonator acts as a notch filter whose resonance 4 window is sensitive to temperature changes. The ring’s resonance wavelength systematically increases as the temperature 5 increases; resonances at various temperatures are shown in the insert 6
7
8
9
10
11
A
B
[First Authors Last Name] Page 13
[Insert Running title of <72 characters]
1
2
3
4
1530 1540 1550 1560
Tra
nsm
issio
n (
AU
)
Wavelength (nm)
9.2 nm
288 290 292 294 296 298 300 302 304 306
1552.0
1552.5
1553.0
1553.5
Tra
nsm
issio
n (
AU
)
Wa
ve
len
gth
(n
m)
Temperature (K)
1552 1553
Wavelength
Temperature
C
D
[First Authors Last Name] Page 14
[Insert Running title of <72 characters]
Figure 2: a) Increasing incident laser power causes self-heating in ring resonator based devices resulting in an increase of 1 the device resonance wavelength. Consequently, ring resonator increasingly over-estimates the ambient temperature 2 compared to a platinum resistance thermometer. Over the incident power range of 0.0063 mW to 0.1 mW the estimated 3 systematic temperature error is below 0.1 K. B) Power spectral density plot shows 1/f noise dependence. C) Allan 4 Variance measurements indicate the instrument noise bottoms out at a 1 Hz measurement rate, creating a noise floor of 5 80 μK. 6
7
8
0.0 0.5 1.0 1.5 2.0 2.5 3.0 3.5
0.0
0.2
0.4
0.6
0.8
Estim
ate
of S
yste
matic T
em
pera
ture
Err
or
(K)
Incident Power (mW)
0.05 0.10
0.05
0.10
Incident Power
0.01 0.1 1 10 100
0.01
0.1
1
Wavelength
On Resonance
Off Resonance
T
(m
K)
t (s)
uncertainity in wavelength
scanning mode
A
B
[First Authors Last Name] Page 15
[Insert Running title of <72 characters]
1
2
3
4
5
0.01 0.1 1 10
1E-9
1E-7
1E-5
1E-3
0.1
10K
2H
z-1
Hz
Off-Resonance
Frequency Noise
On-Resonance
C