Embed Size (px)
Citation preview
Ultrafast time-resolved X-ray diffraction
using an optimized laser-plasma based
X-ray source
Von der Fakultaumlt fuumlr Physik
der Universitaumlt Duisburg-Essen genehmigte
Dissertation
zur Erlangung des akademischen Grades eines Doktors der
Naturwissenschaften
(Dr rer nat)
von
Wei Lu
aus
Guangzhou (China)
Referent Prof Em Dr Dietrich von der Linde
Korreferent Prof Dr Uwe Bovensiepen
Vorsitzender des Pruumlfungsausschusses Prof Dr Peter Kratzer
Tag der muumlndlichen Pruumlfung 09 Juli 2013
I
For Xi Shen
Acknowledgments
II
Acknowledgments
The works of this thesis would not have been possible to present here without the
helps assistances and supports of many people At this point I would like to thank all
those who have contributed to this work through any kind of activity
First of all I would like to thank my supervisor Prof em Dr Dietrich von der
Linde for providing me the opportunity to carry out my PhD study in the exciting
research flied of ultrafast time-resolved X-ray diffraction at the University Duisburg-
Essen and also his support for accomplishing this thesis
A very special thank also to my advisor Dr Klaus Sokolowski-Tinten whom it
was indeed an honor and a pleasure for me to work with during my PhD study
Without his intensive cares supports and guidance this work could not be presented
here
A thank to Prof Dr Ulrich Teubner for taking care of me at the initial stage of
my PhD studies and also a thank to Priv-Doz Dr Paul Gibbon for his help in the X-
ray production project
I am very grateful to Prof Dr Uwe Bovensiepen and Prof Dr Peter Kratzer for
their agreement to evaluate this work and the related efforts
I want to thank Dr Alexander Tarasevitch for his support by maintaining the 10
Hz laser system for all the experiments in this work and also for many discussions
and advices concerning laser ndash plasma physics
I also want to thank Dr Ping Zhou for his valuable helps and advices for both
my study and life in Germany
Acknowledgments
III
To Dr Uladzimir Shymanovich and Dr Matthieu Nicoul who are my closest
colleagues and also my best friends in Germany I will never forget the days and
nights we spend together in the lab measuring driving me home many times
especially at the midnight after the experiments giving me advices to improve my
skills in both study and lifehellipThanks for everything you have done for me
Special thanks to our group secretaries Kay Eibl and Christina Boese for their
helps in dealing with all the various paperwork and administration issues
To our technical staffs I want to thank Michael Bieske for making all the
mechanical components Doris Steeger for all the support cornering electronic
devices and Roland Kohn for all the computer related issues
I thank Dr Nicolas Bergeard and Carla Streubuumlhr for their helpful suggestions
and comments on this work
Many thanks go to all the former and current members working in AG von der
Linde and AG Bovensiepen Dr Nikola Stojanovic Dr Ivan Rajkovic Dr Manuel
Ligges Dr Stephan Kaumlhle Dr Konstantin Lobov Dr Oliver Heinz Jan Goumlhre Jens
Wieczorek Michael Vattilana and Florian Quirin and all of the diploma students and
the student assistants who contributed to the wonderful working atmosphere in the
groups I enjoyed all our exchanges very much
Finally I want to thank my parents and my wife Xi Shen for their unlimited
encouragement and assistance during my PhD studies I could not have succeeded
without their supports I dedicate this work to them
Contents
IV
Contents
Acknowledgments II
Contents IV
1 Introduction 1 11 Introduction and motivation 1
12 Overview and structure of the thesis 4
2 Optimization of a laser-plasma based X-ray source 5
21 Generation of ultrashort X-ray pulses from laser-produced plasma 6
22 Laser system 8
23 Experimental setup 11
24 Optimization of Kα X-ray emission by adjusting the laser intensity 13
25 Optimization of Kα X-ray emission by using a controlled pre-plasma 16
251 The resonance absorption (RA) and its optimum condition 17
252 Experimental results 20
253 Discussion 24
26 Comparison of the experimental results with simulations 30
27 Summary 32
3 Improvements of the modular setup for time-resolved X-ray
diffraction experiments 34
31 The fundamental components of the current setup 35
32 Improvements of the modular setup 39
321 Controlled pre-pulse to enhance the X-ray production 40
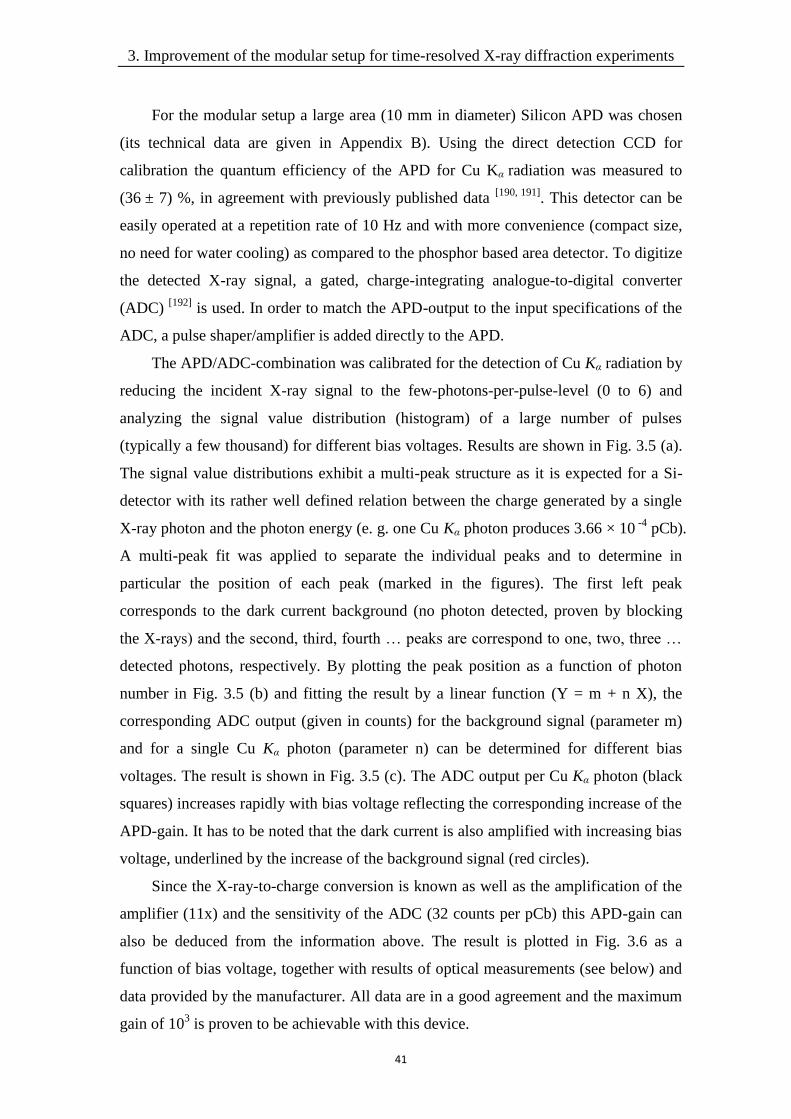
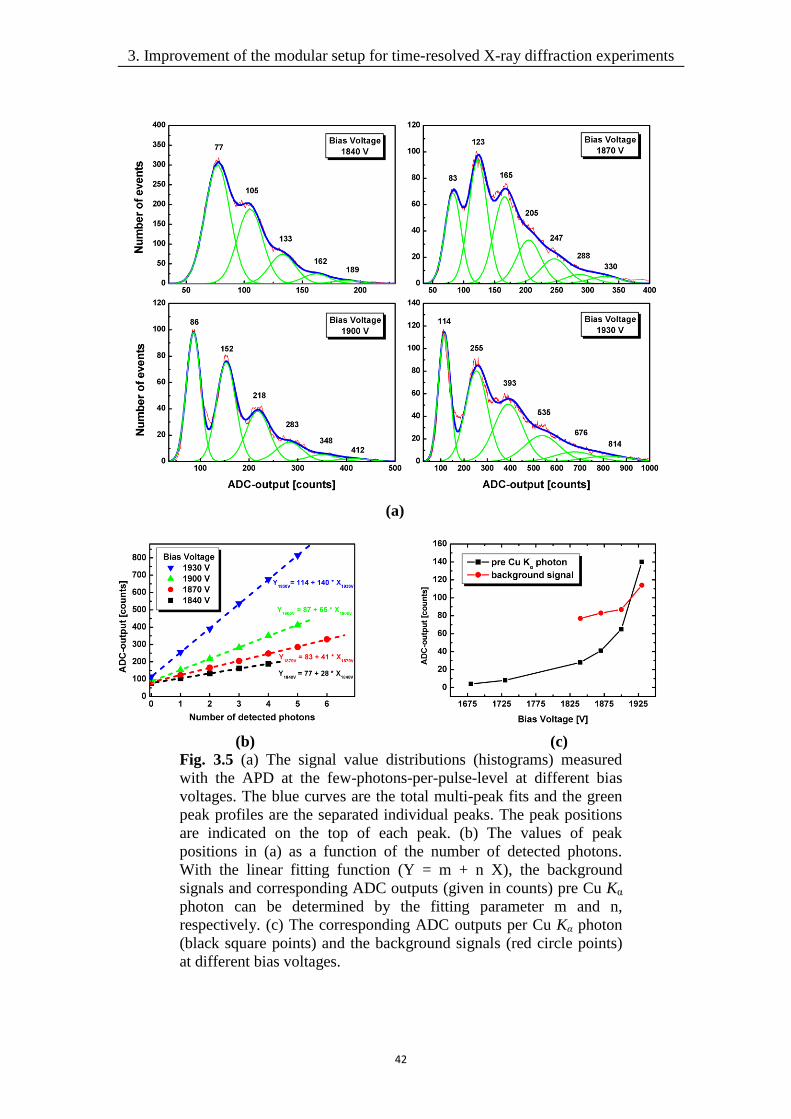
322 Avalanche photodiode (APD) 40
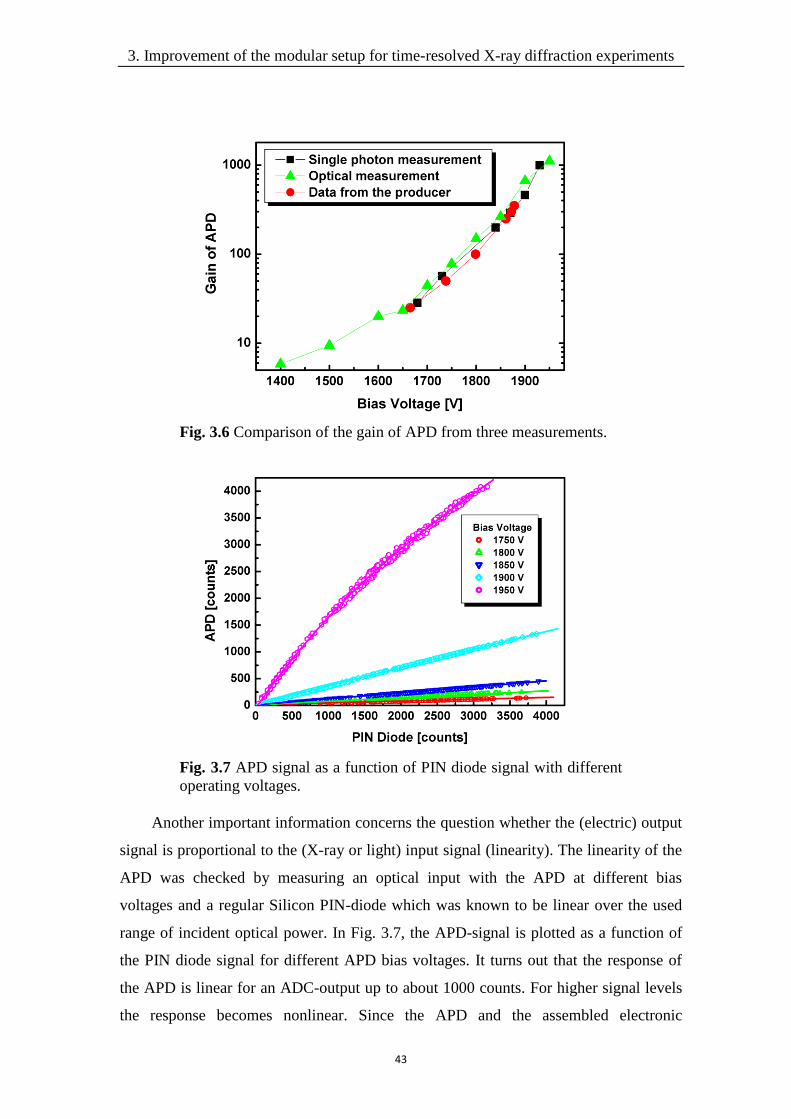
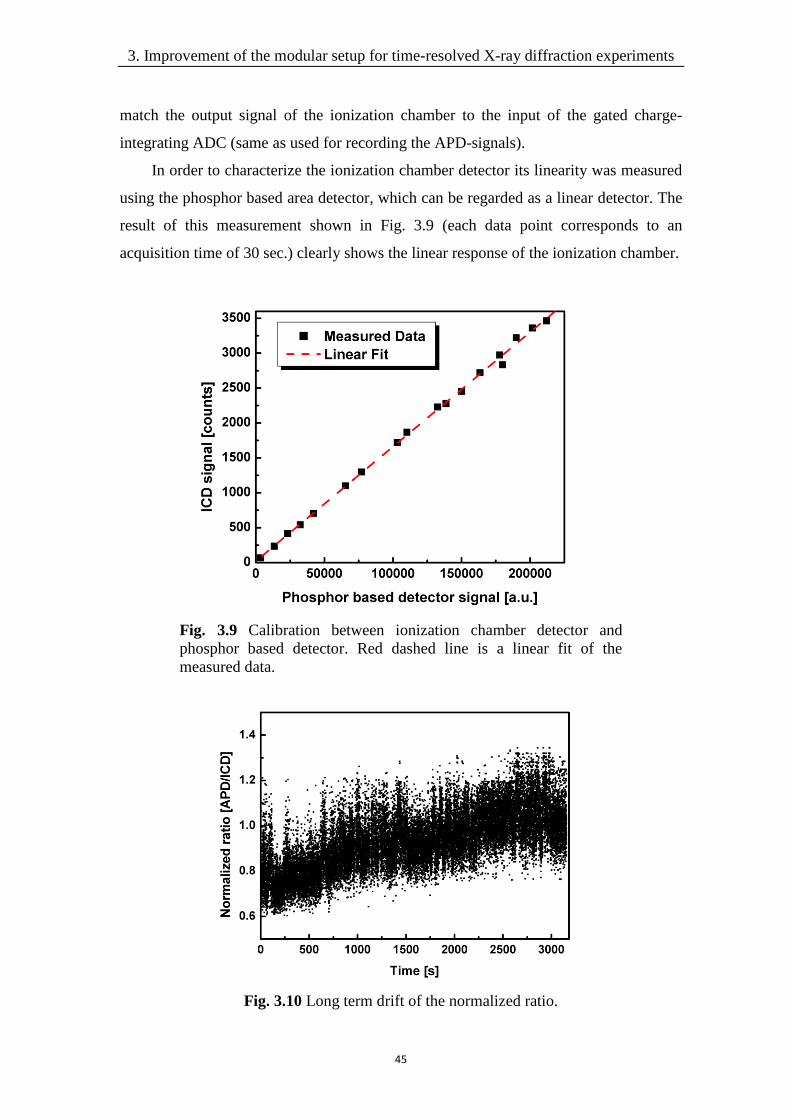
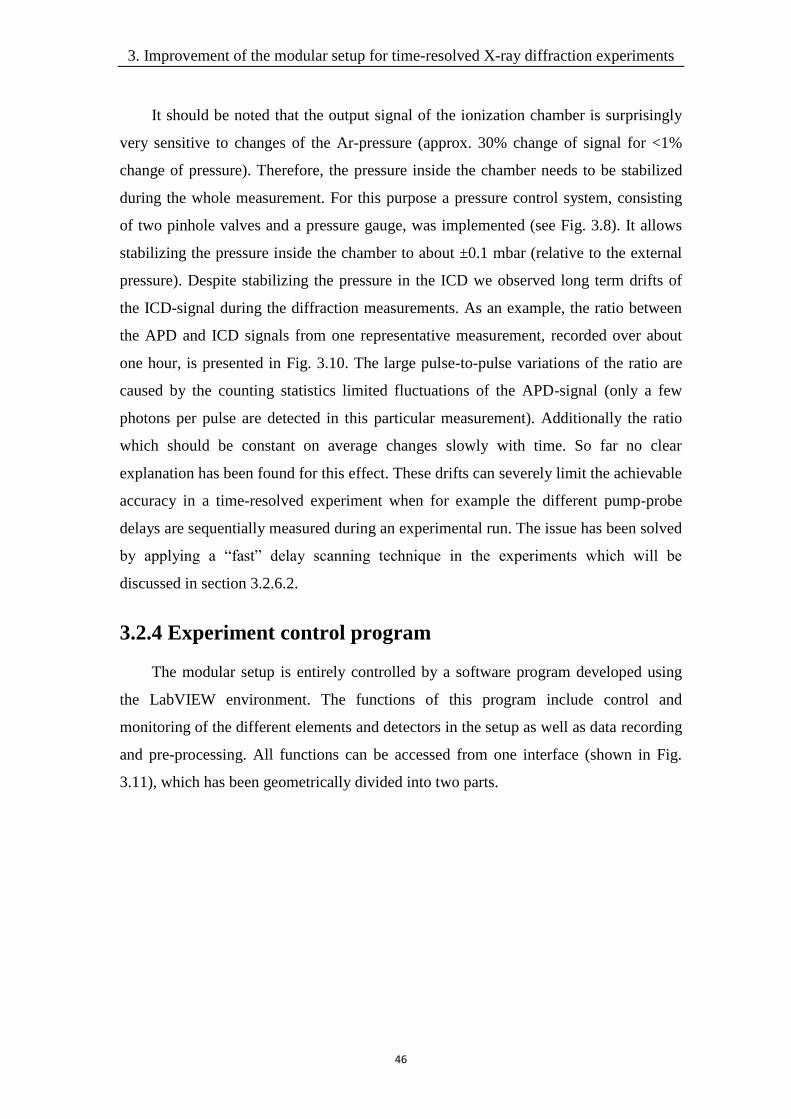
323 Ionization chamber detector (ICD) 44
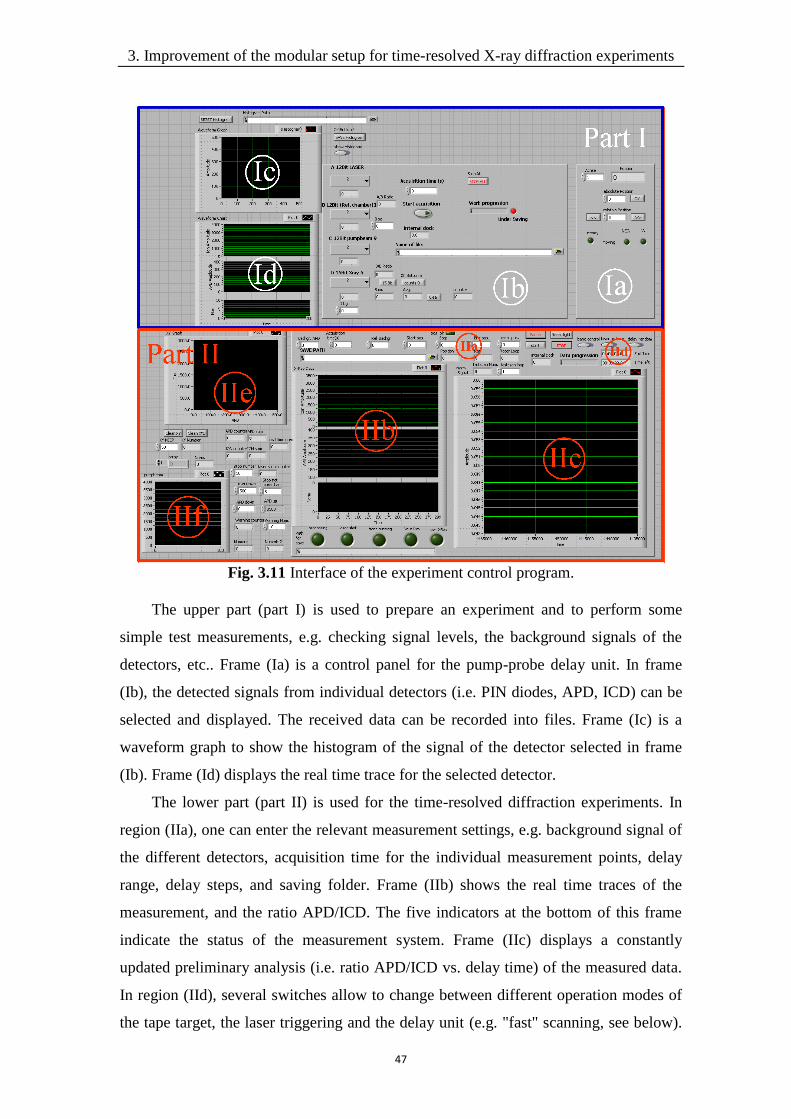
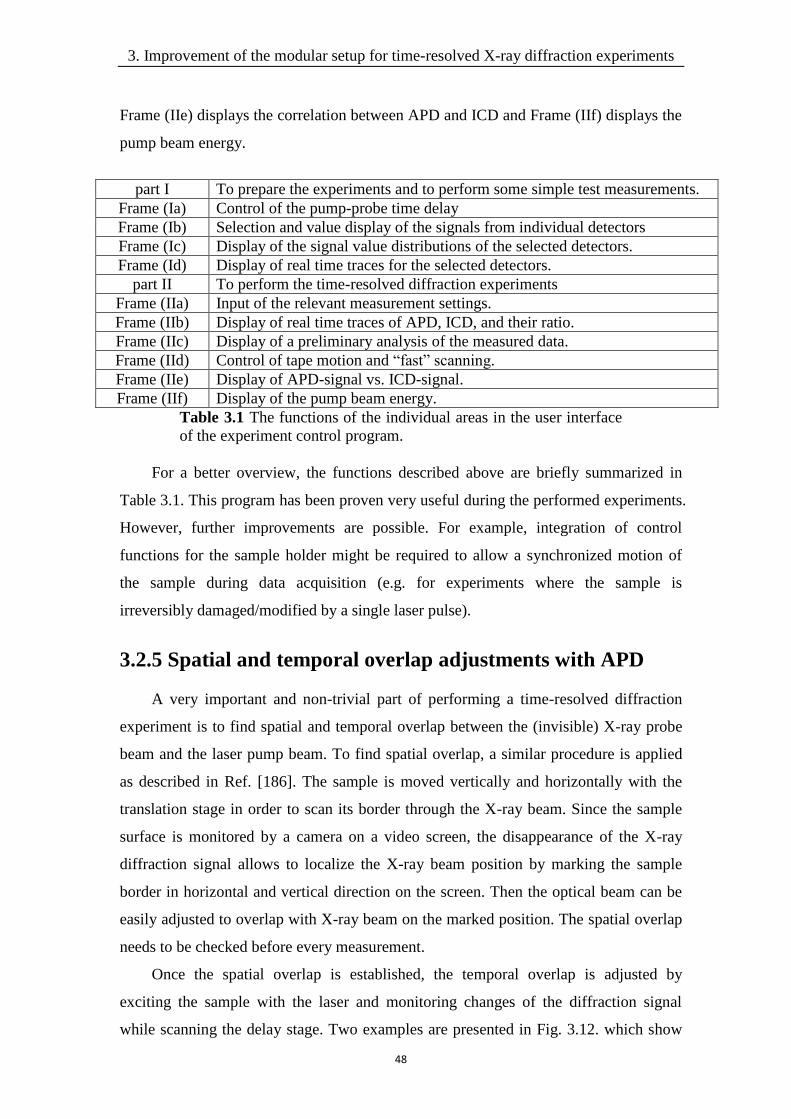
324 Experiment control program 46
325 Spatial and temporal overlap adjustments with APD 48
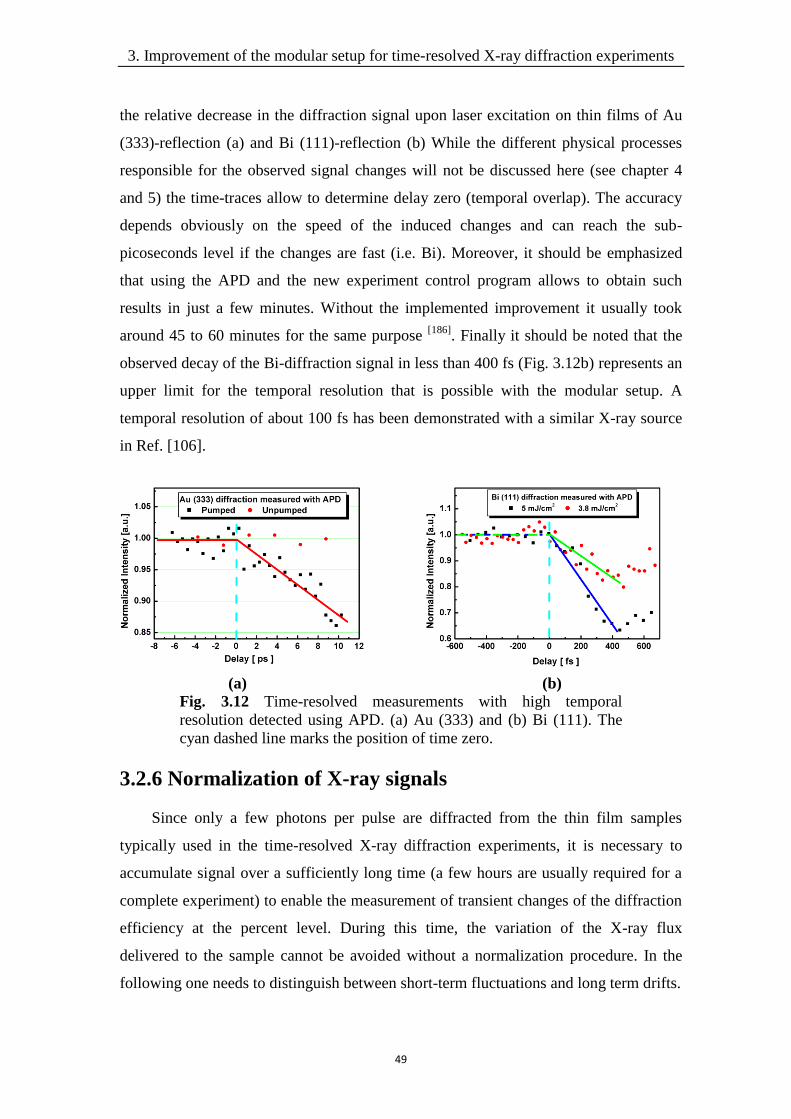
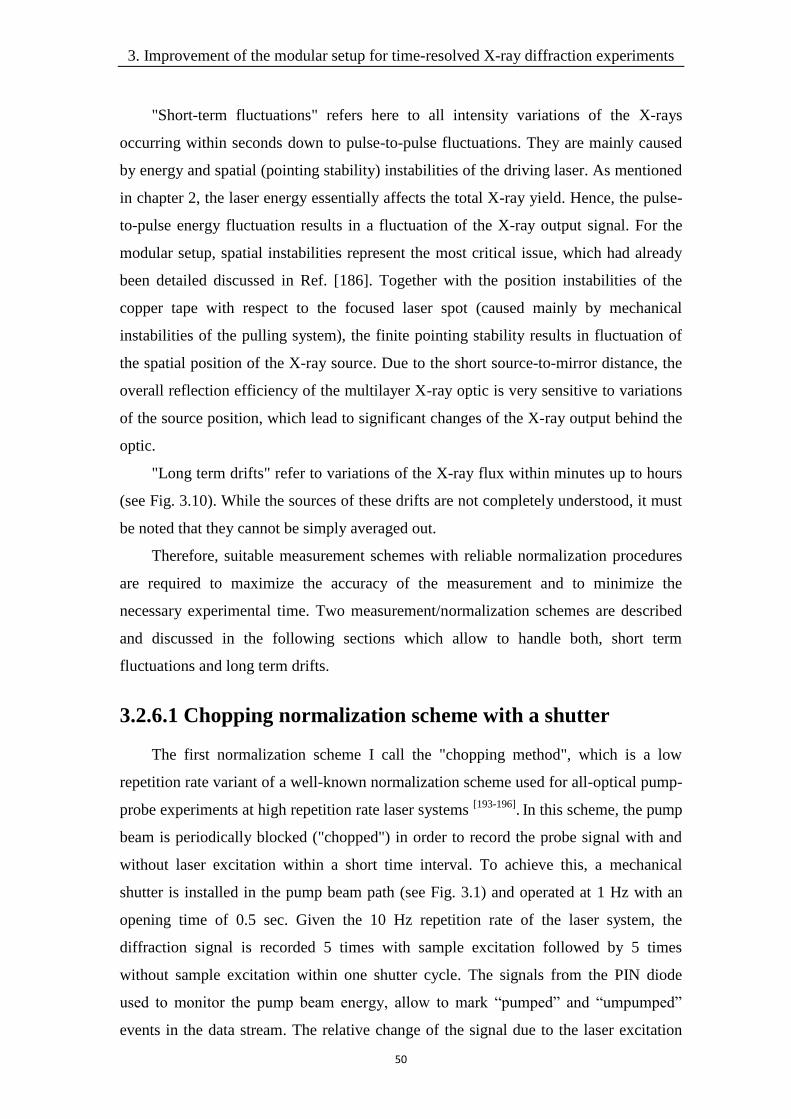
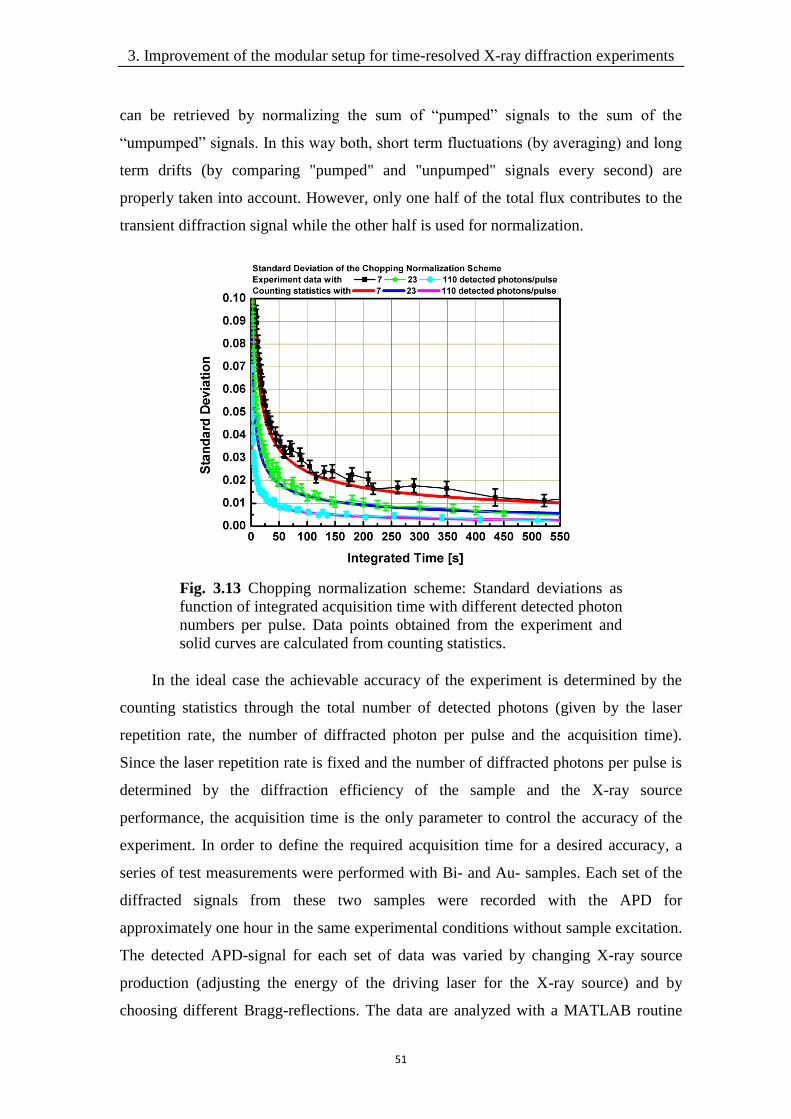
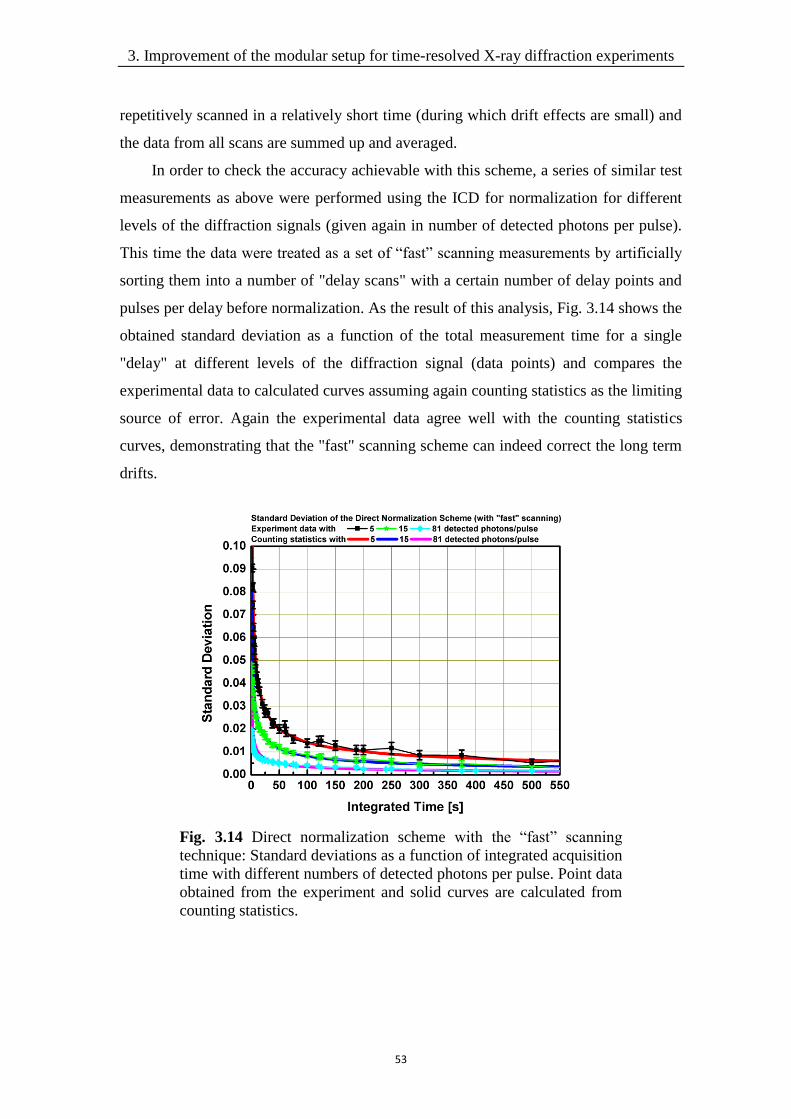
326 Normalization of X-ray signals 49
3261 Chopping normalization scheme with a shutter 50
3262 Direct normalization scheme with the ionization chamber
detector 52
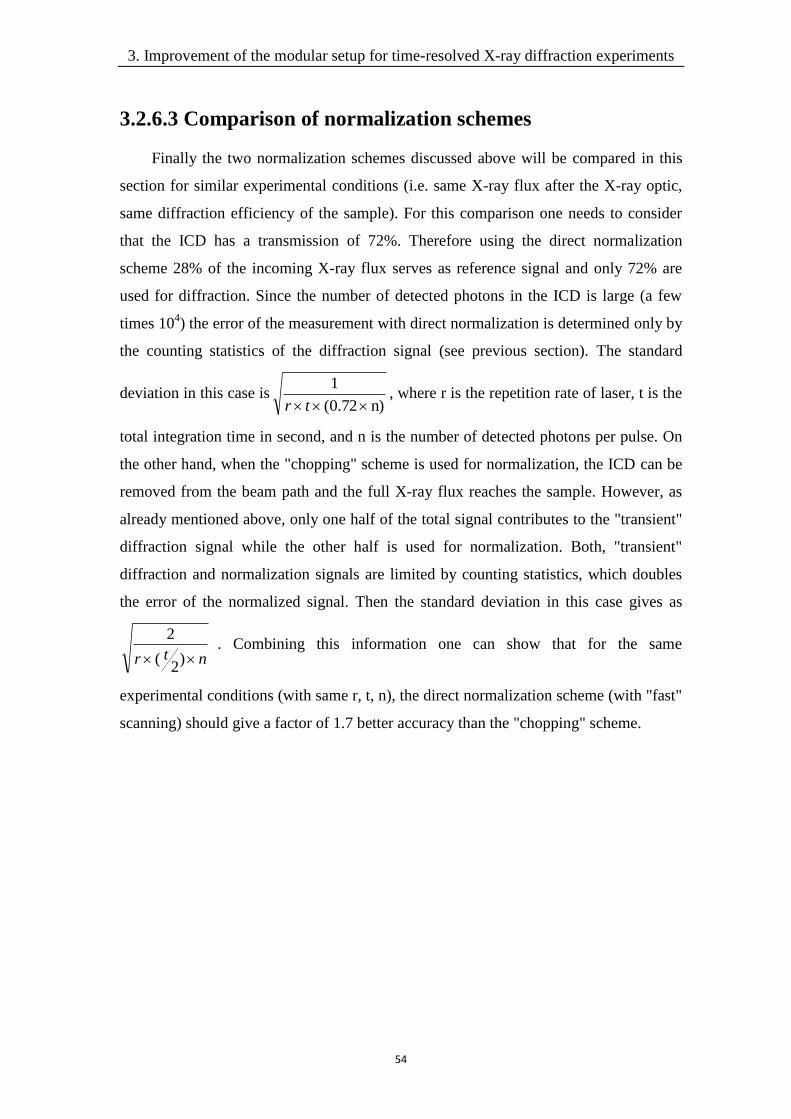
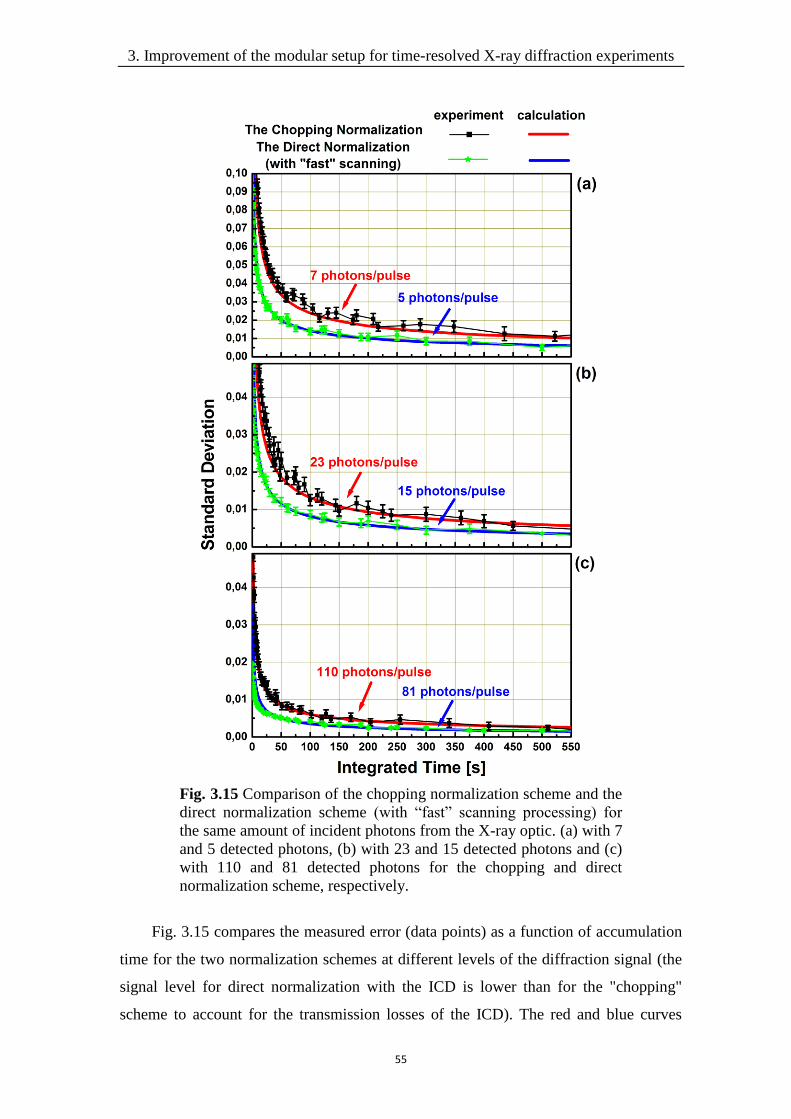
3263 Comparison of normalization schemes 54
33 Summary 56
4 Observation of the Debye -Waller effect in Au 57
41 Au sample 57
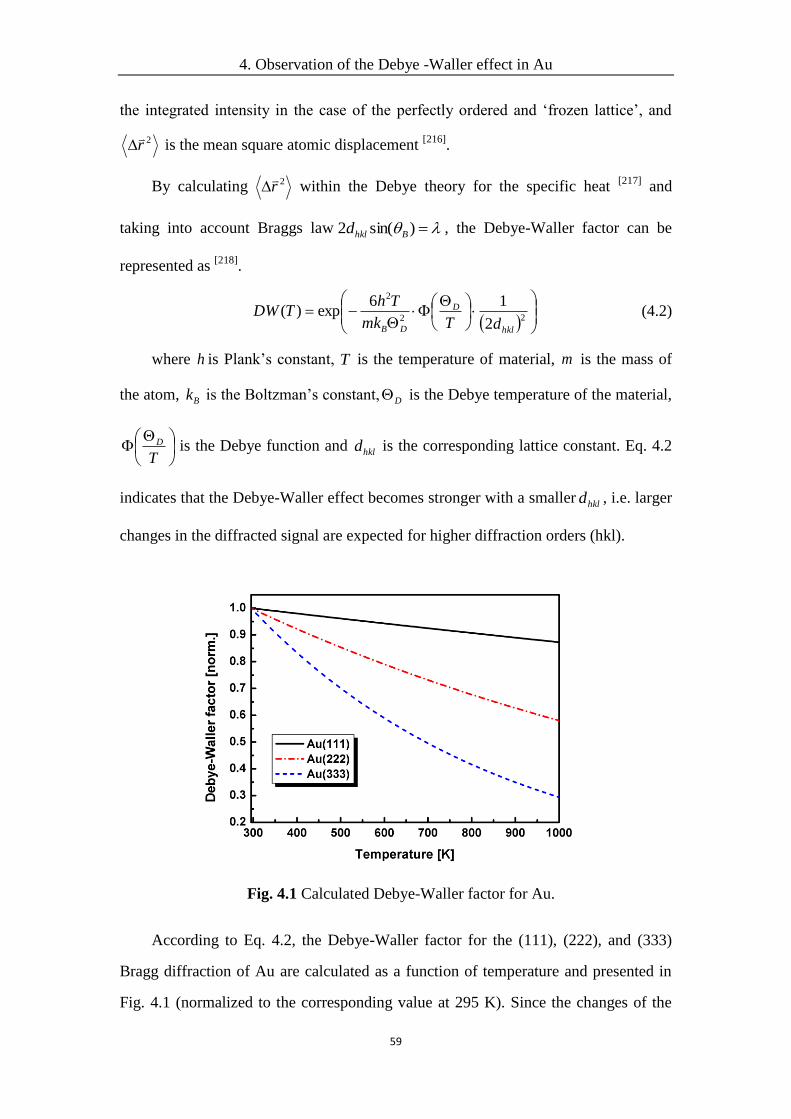
42 Debye ndashWaller effect 58
43 Time-resolved X-ray diffraction experiments on Au 60
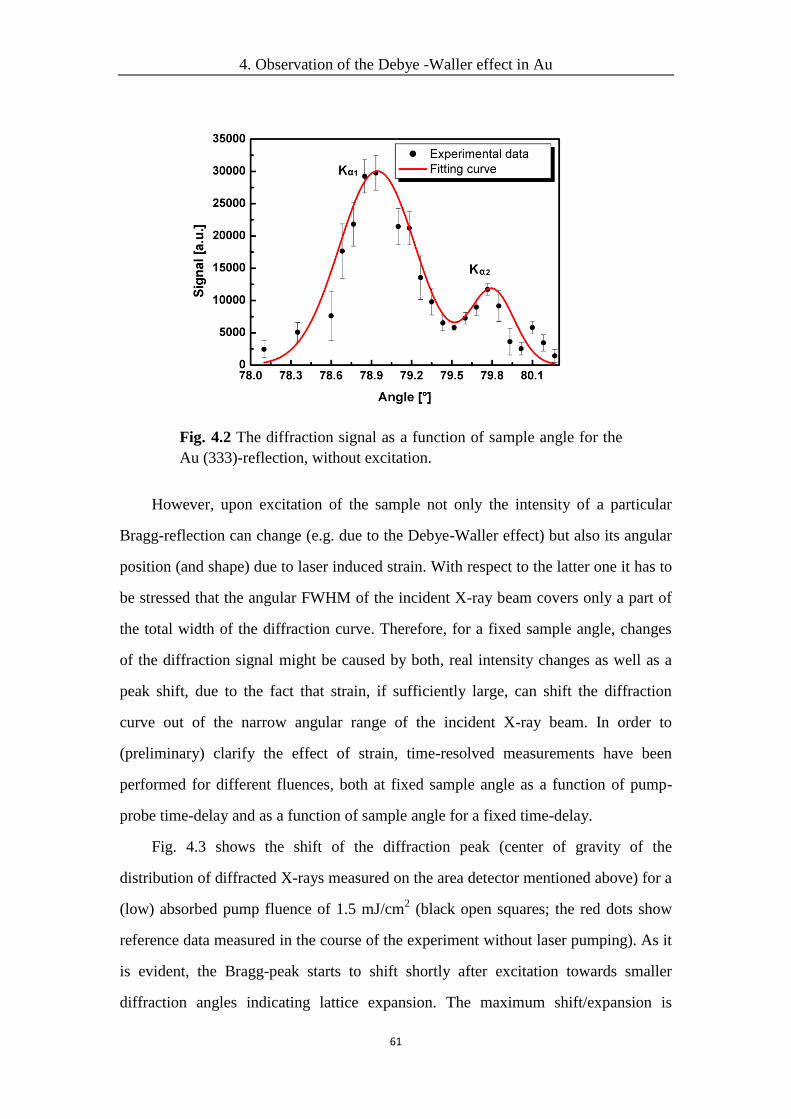
431 Bragg diffraction of Au 60
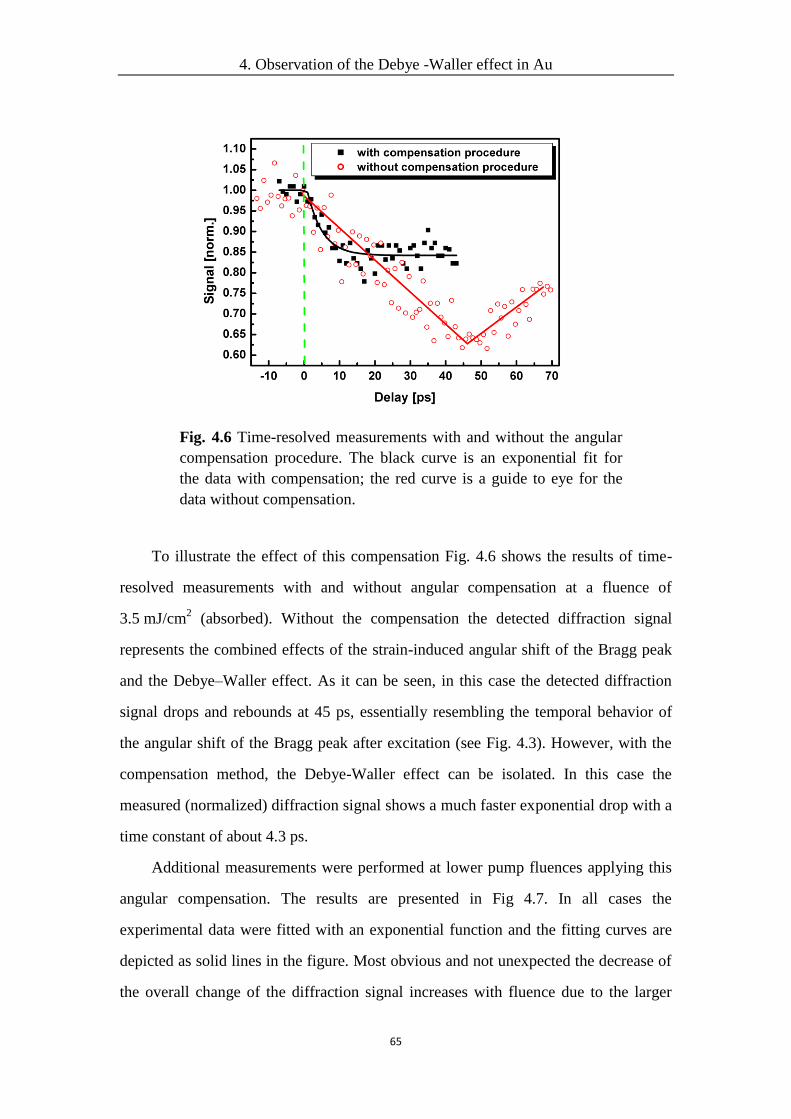
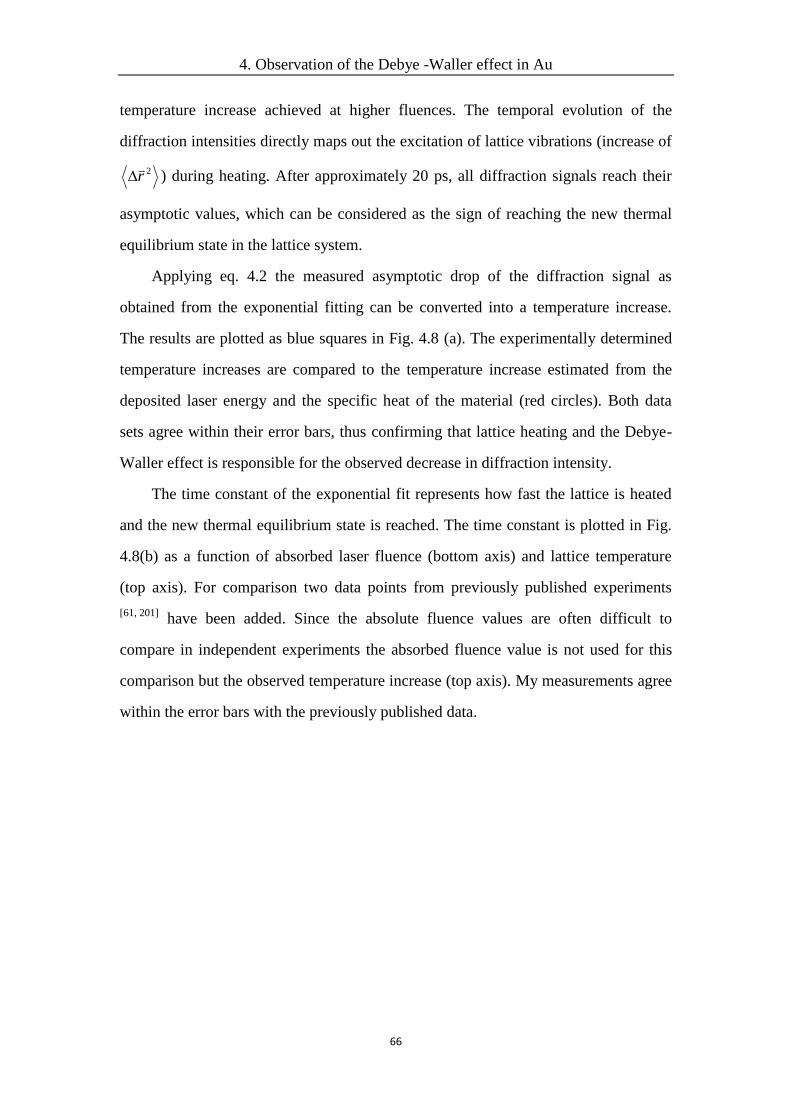
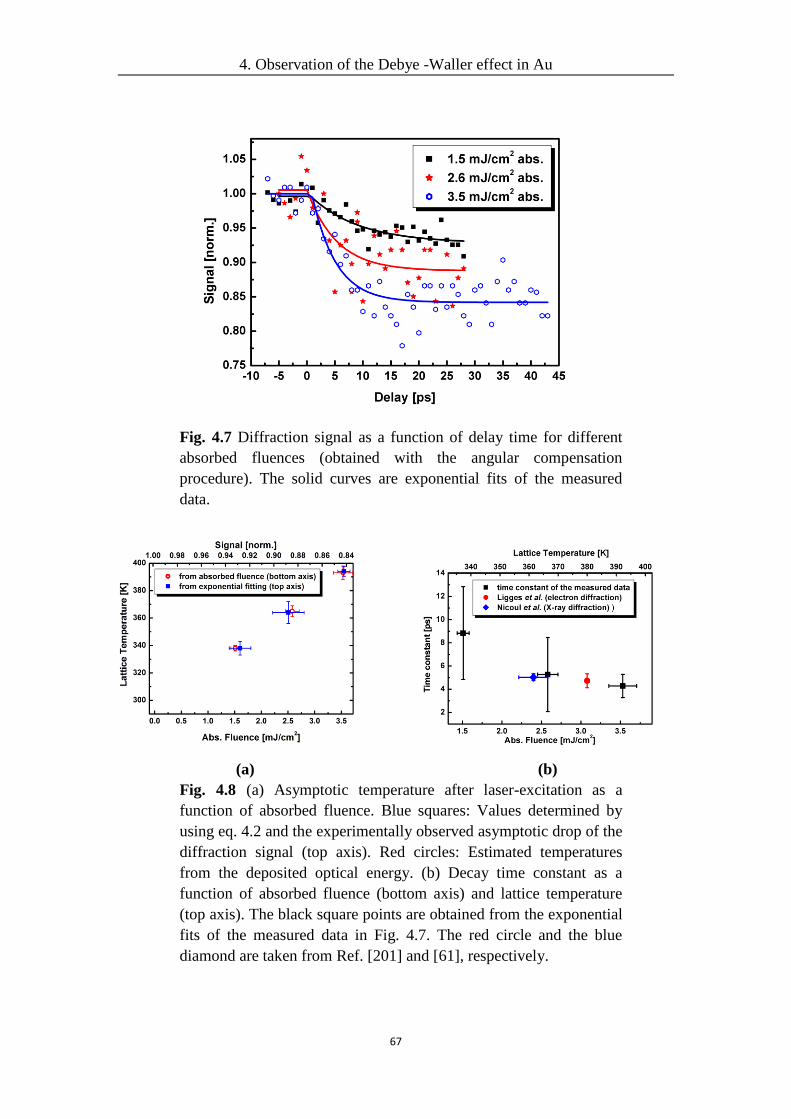
432 Observation of Debye ndashWaller effect on Au 64
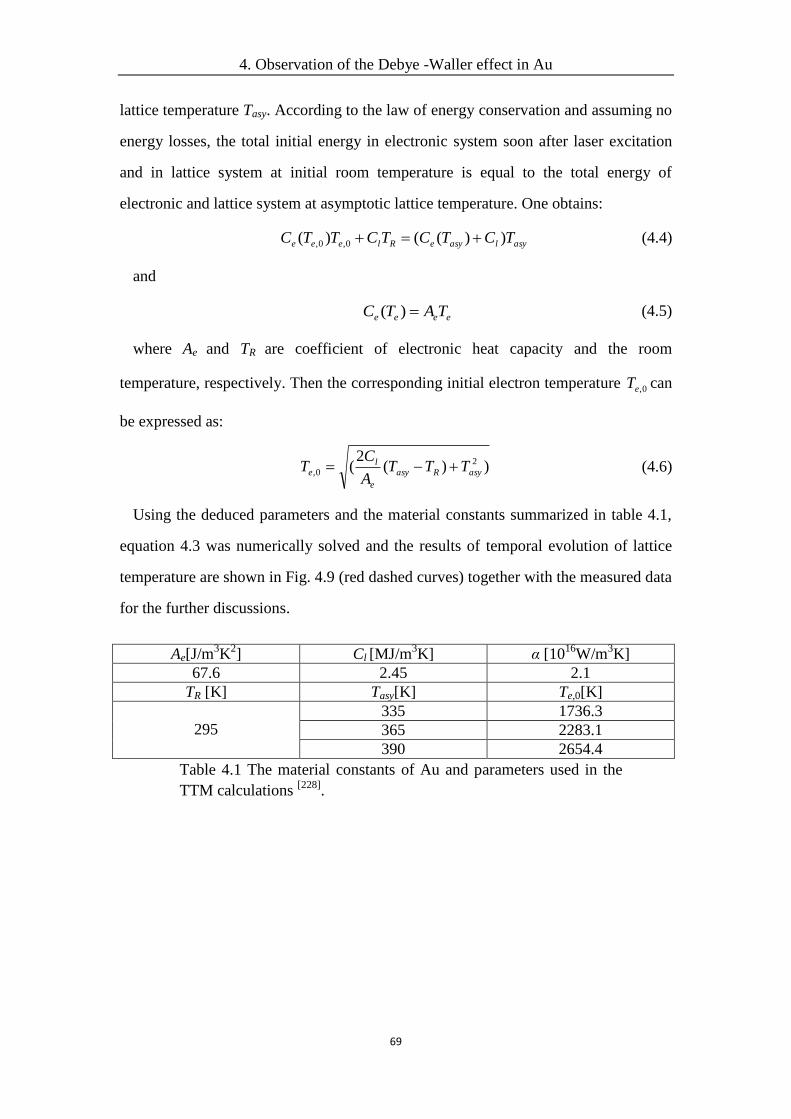
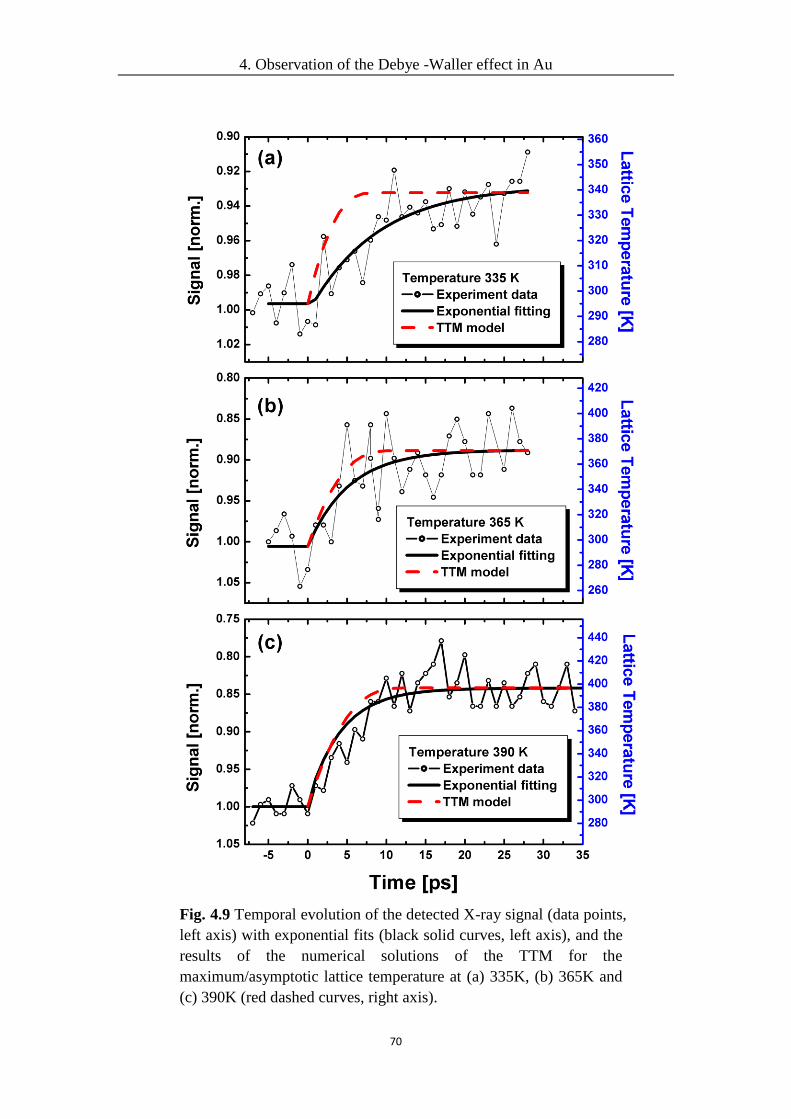
44 Comparison with the Two ndash Temperature Model (TTM) and discussion 68
45 Summary and conclusion 71
Contents
V
5 Extreme phonon softening in laser-excited Bi 73
51 Research background 75
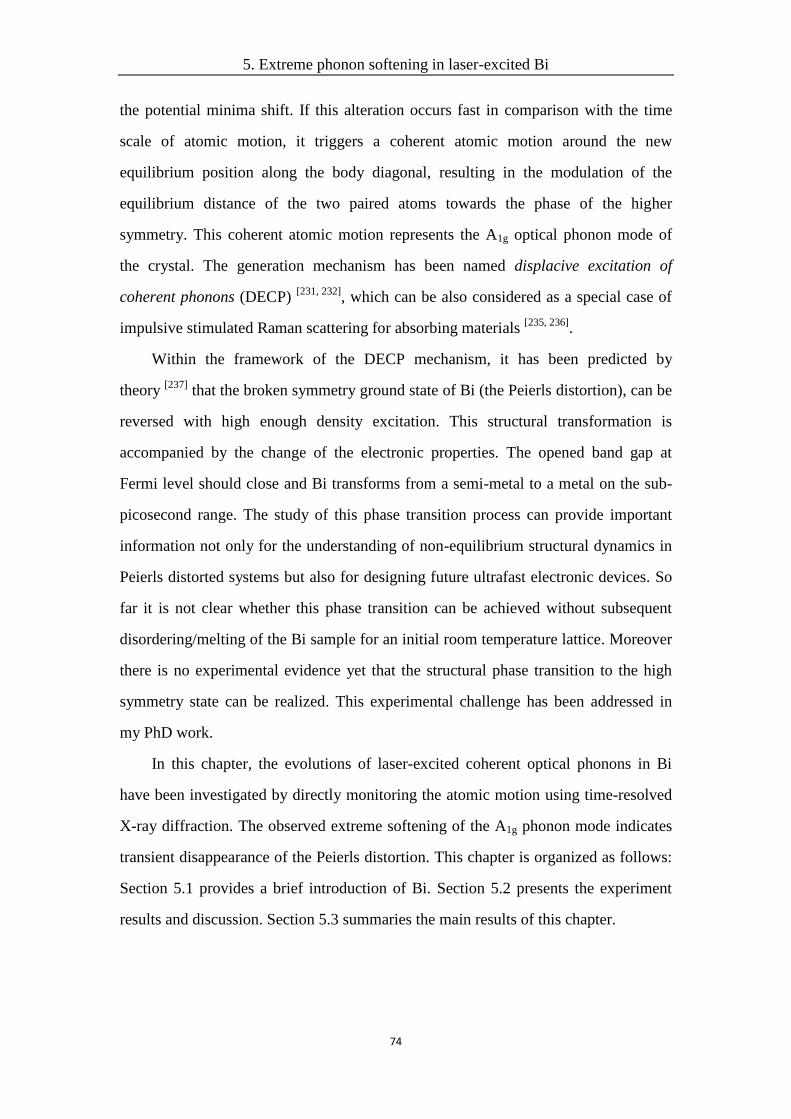
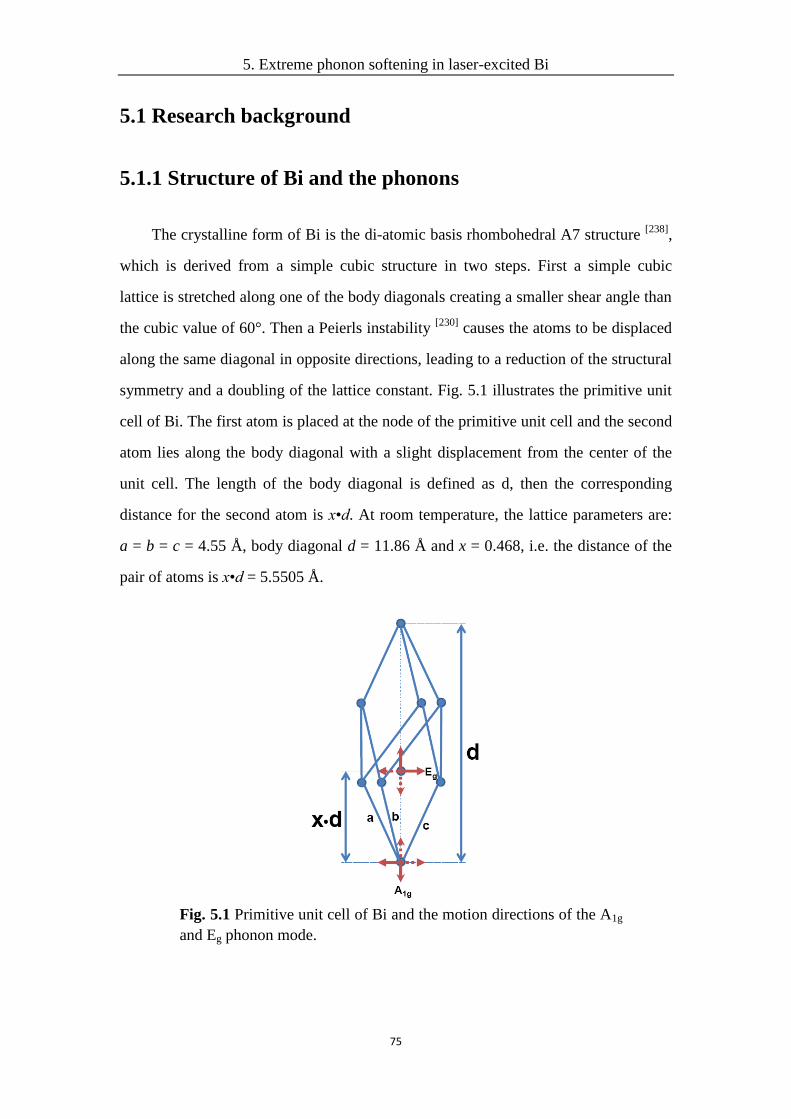
511 Structure of Bi and the phonons 75
512 Previous works 76
52 Experiments and discussion 81
521 Method 81
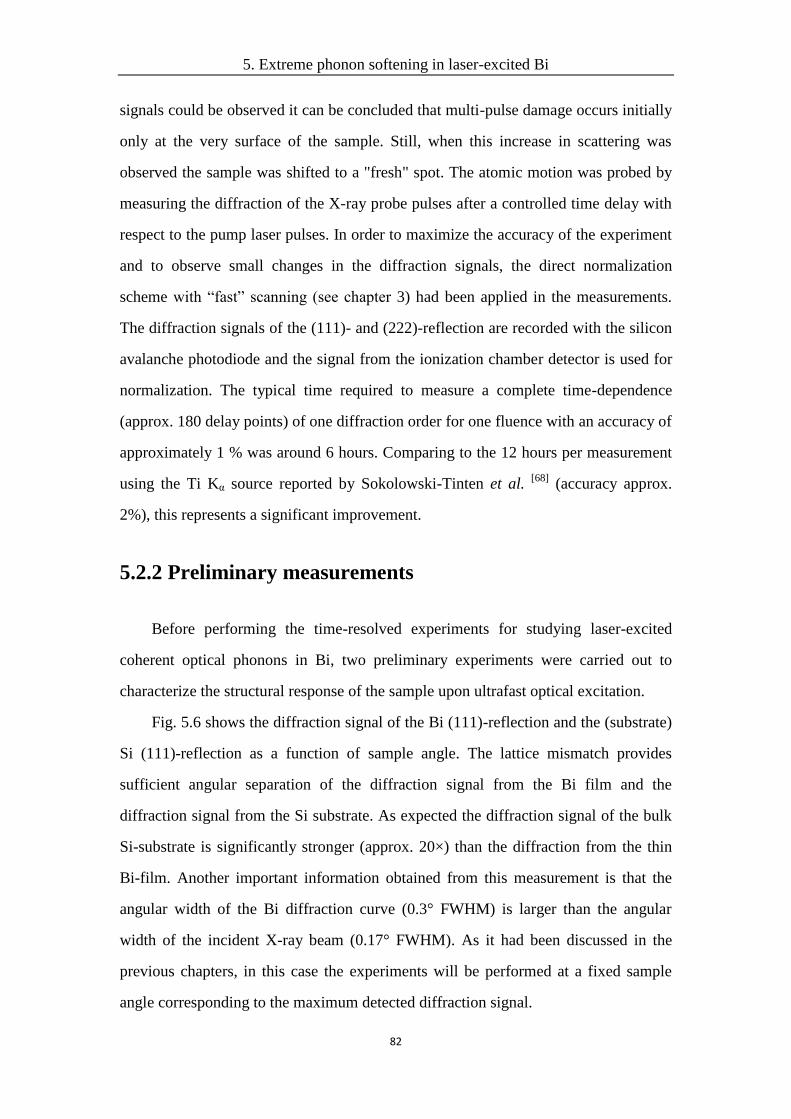
522 Preliminary measurements 82
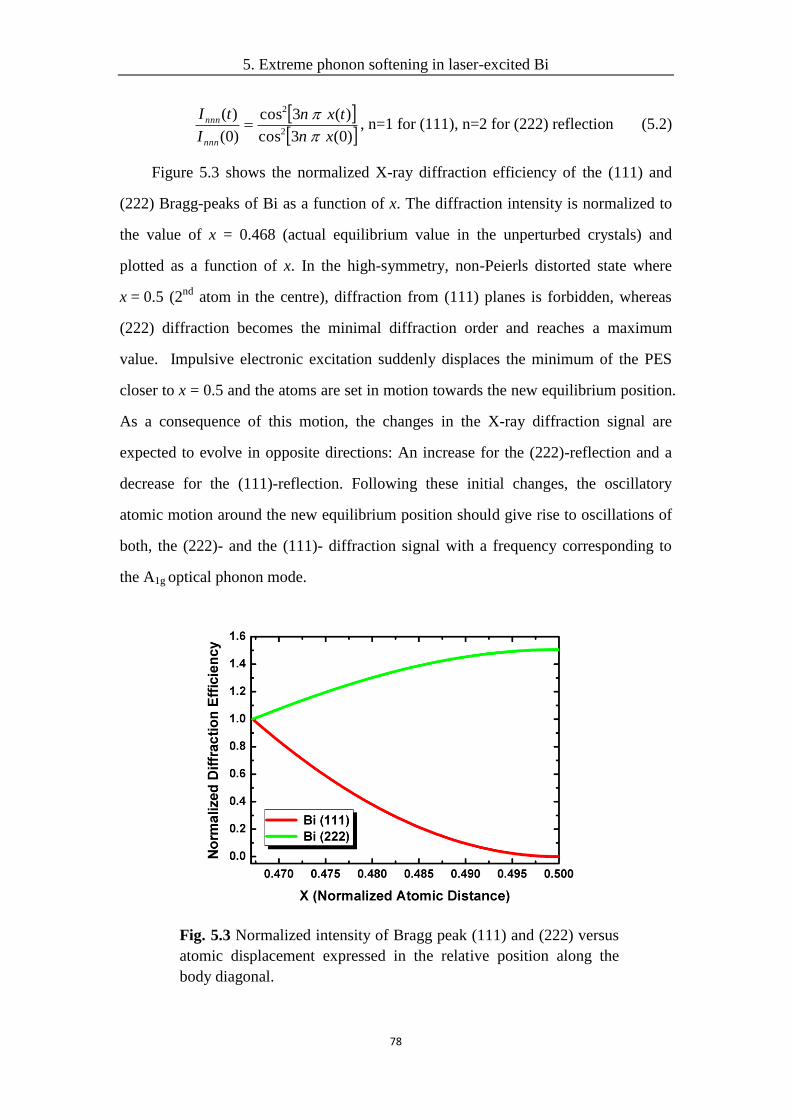
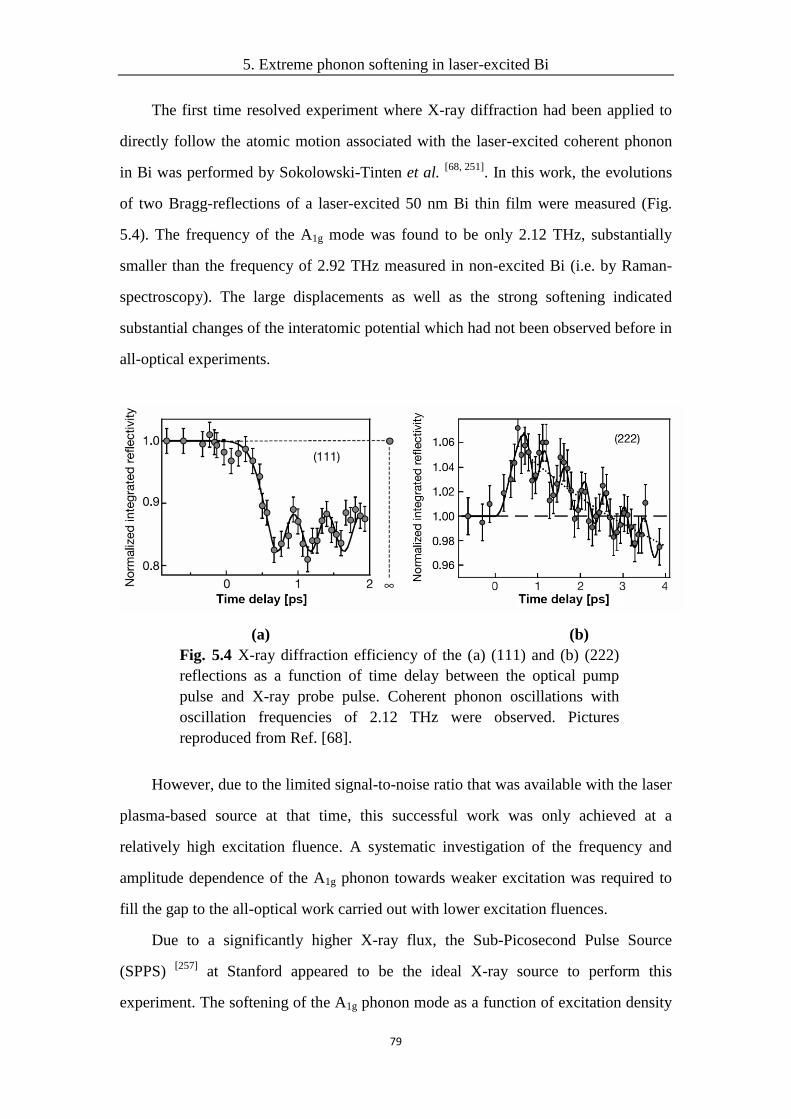
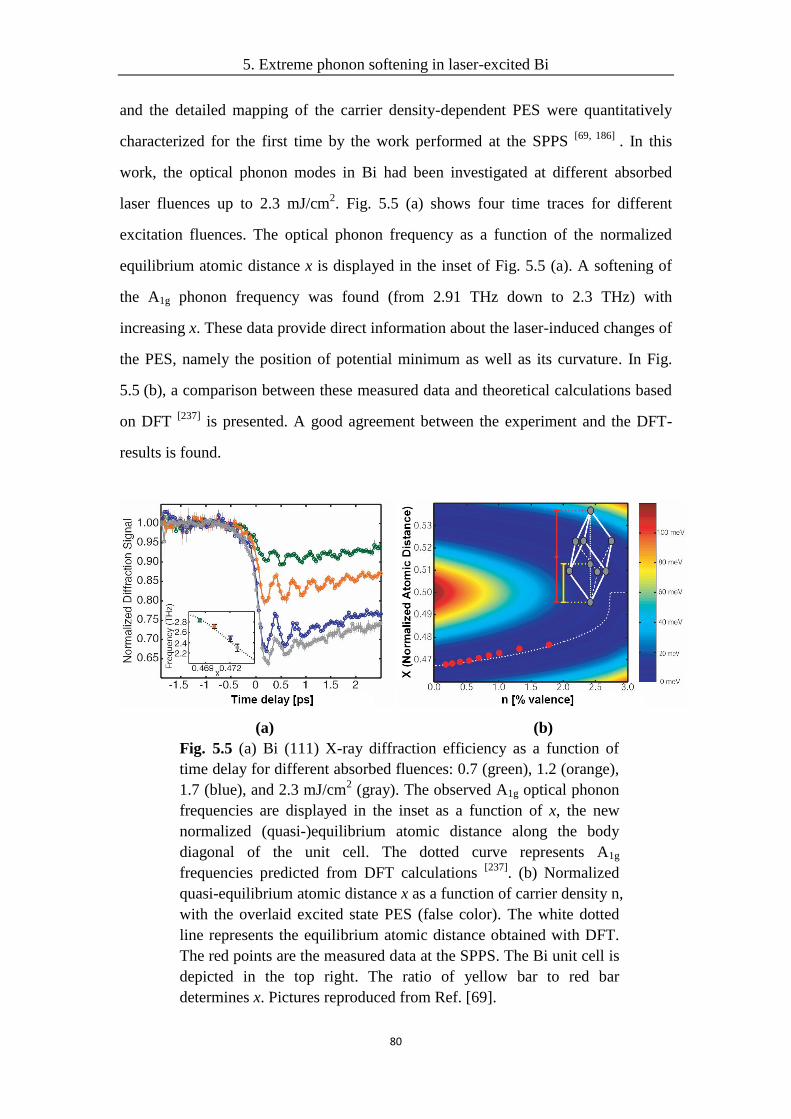
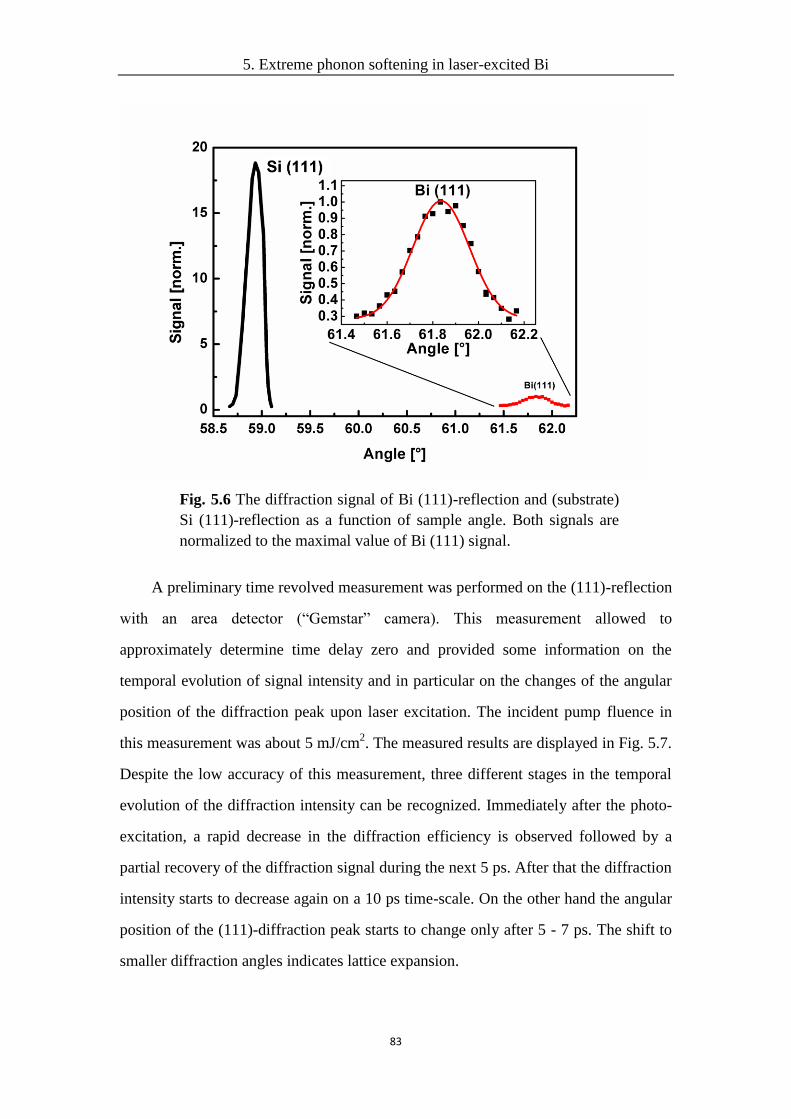
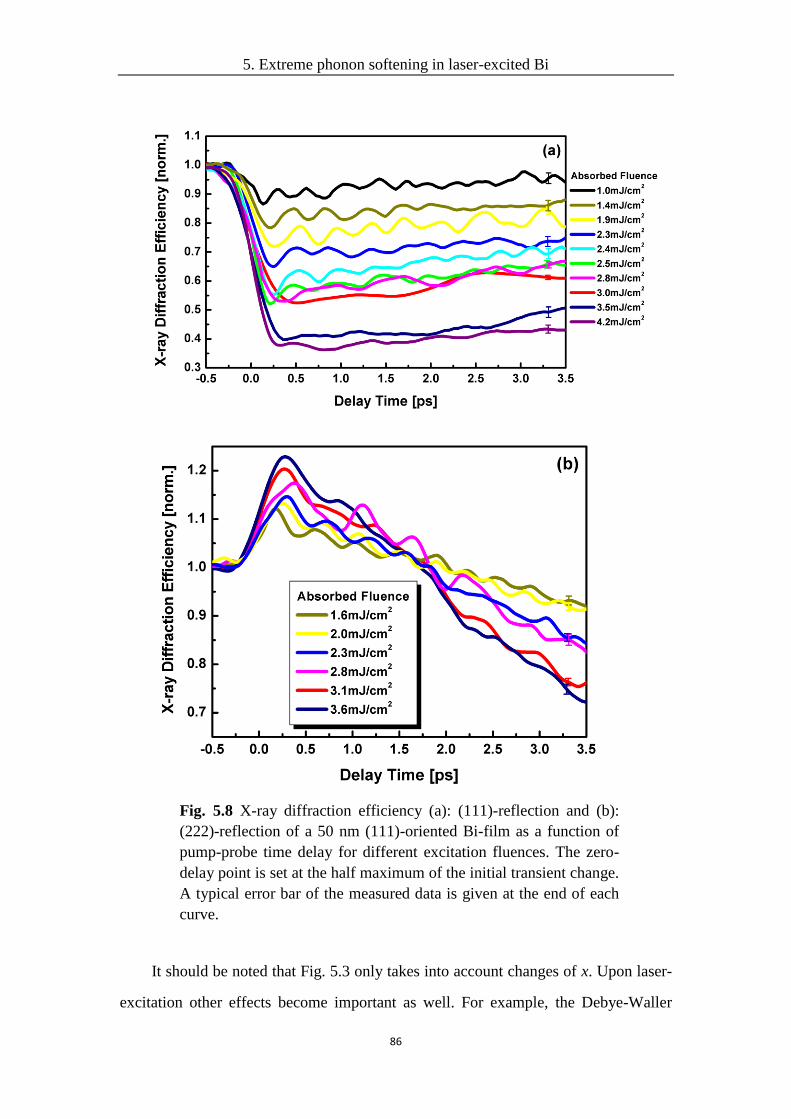
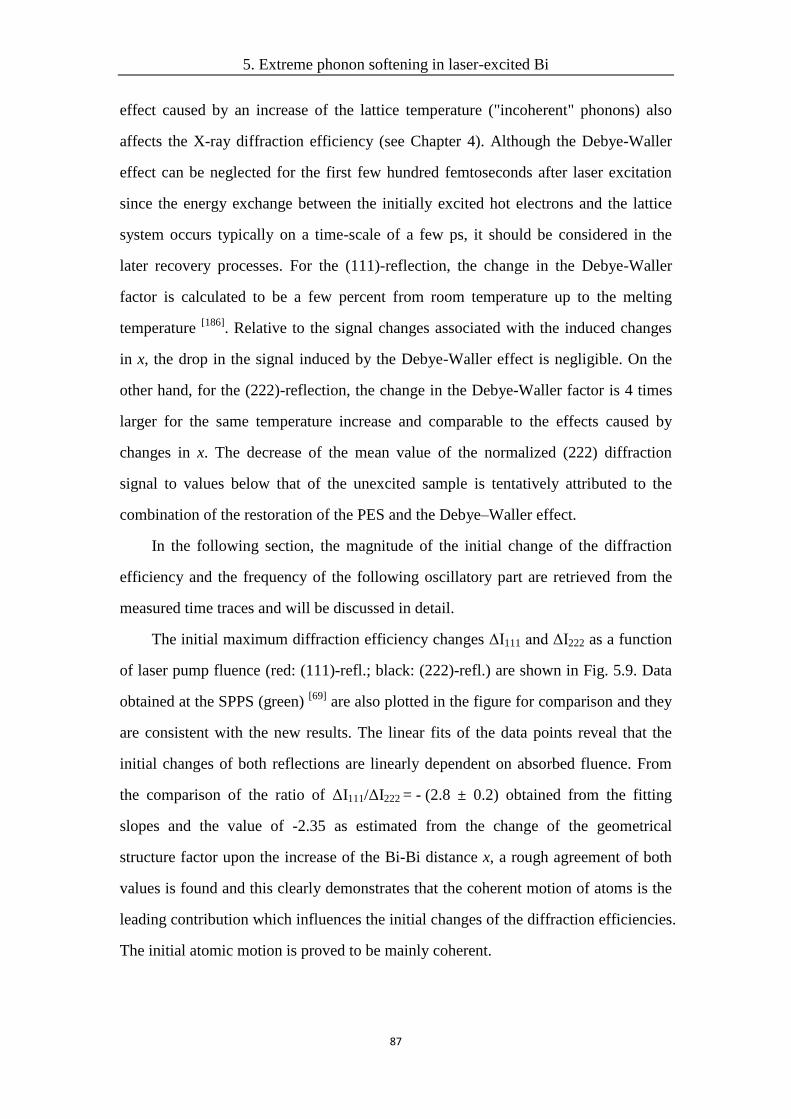
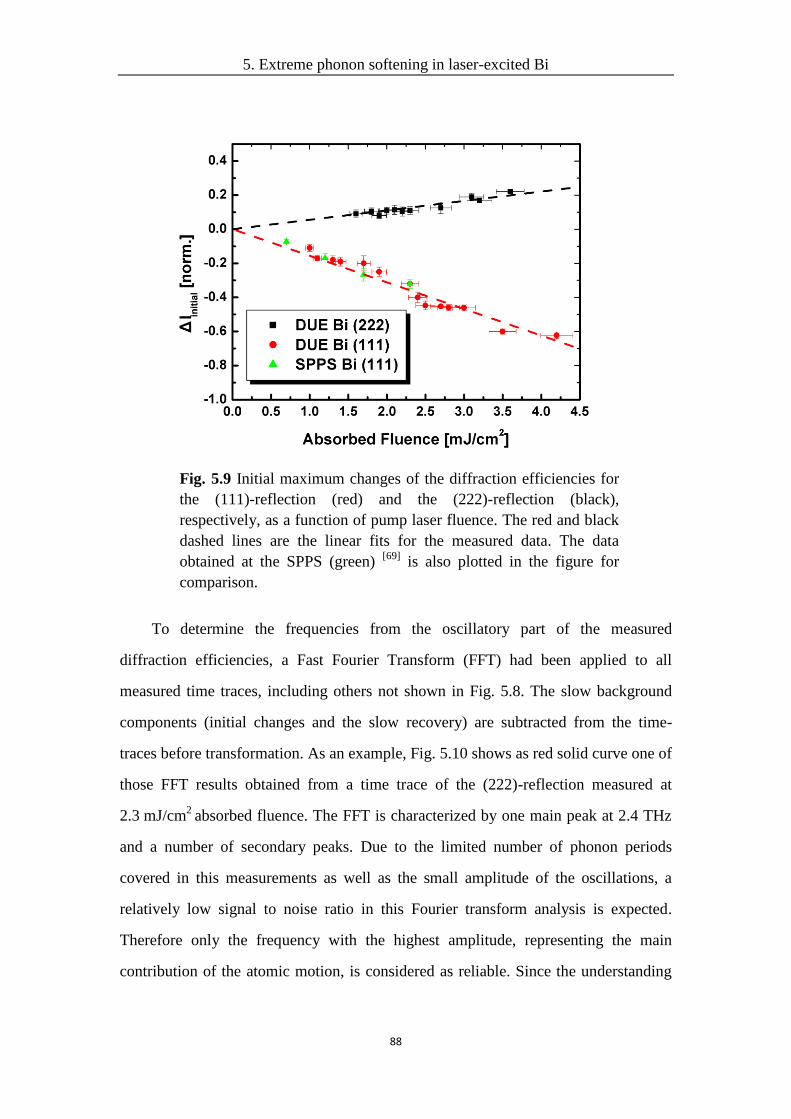
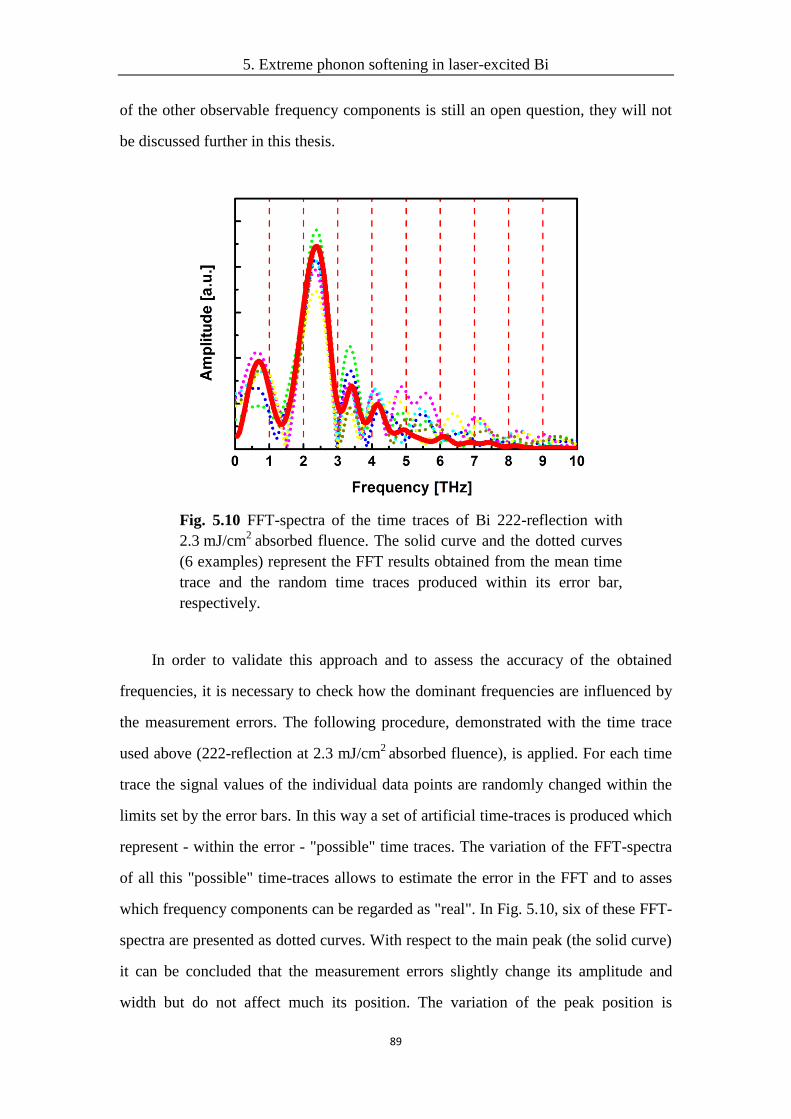
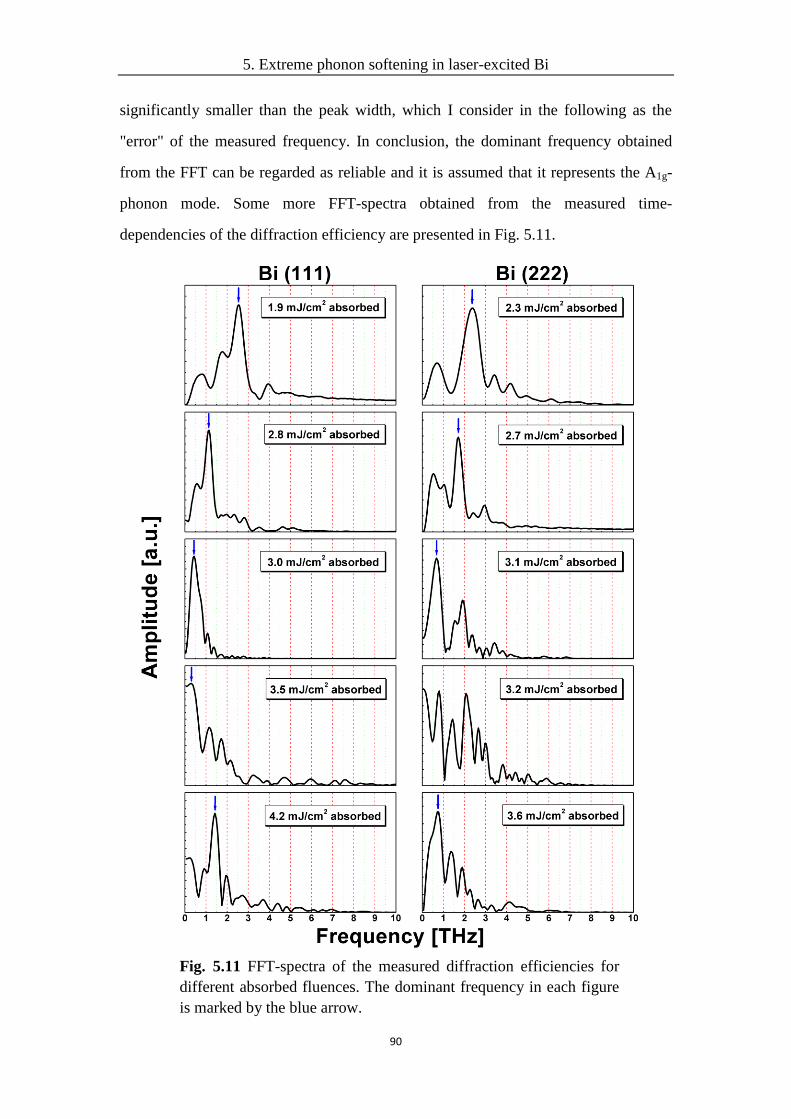
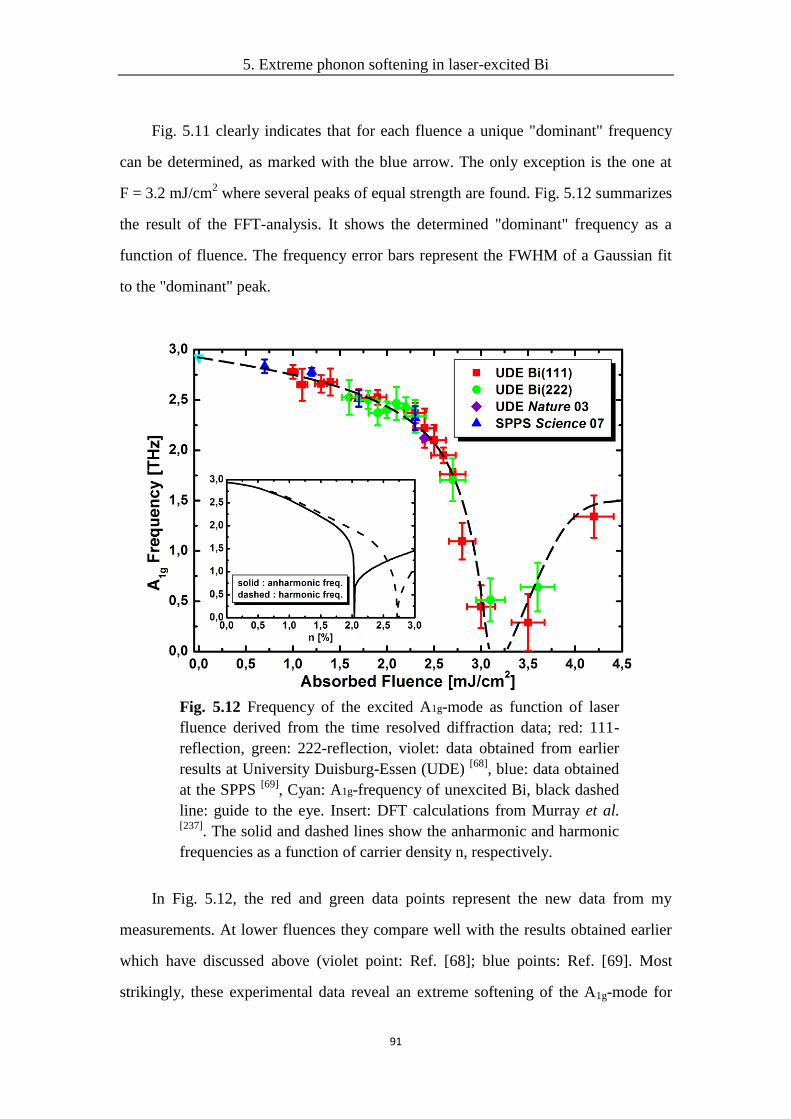
523 Results of time resolved measurements and discussion 85
53 Summary 96
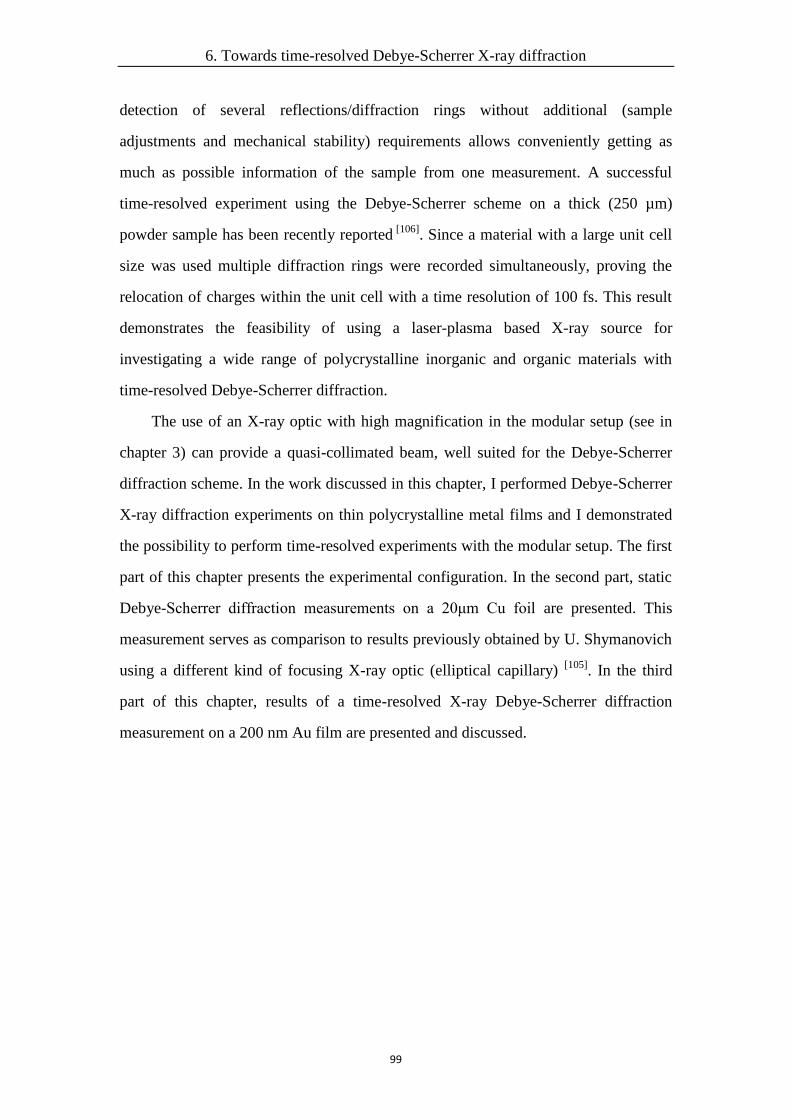
6 Towards time-resolved Debye-Scherrer X-ray diffraction 98
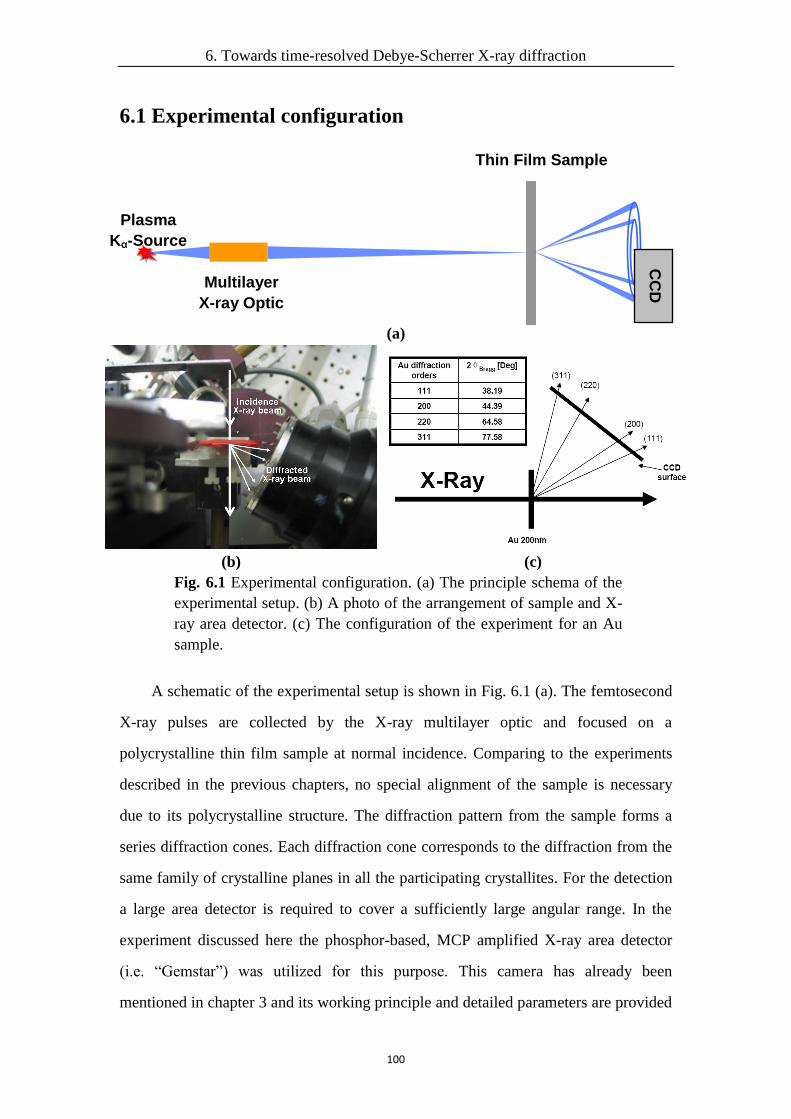
61 Experimental configuration 100
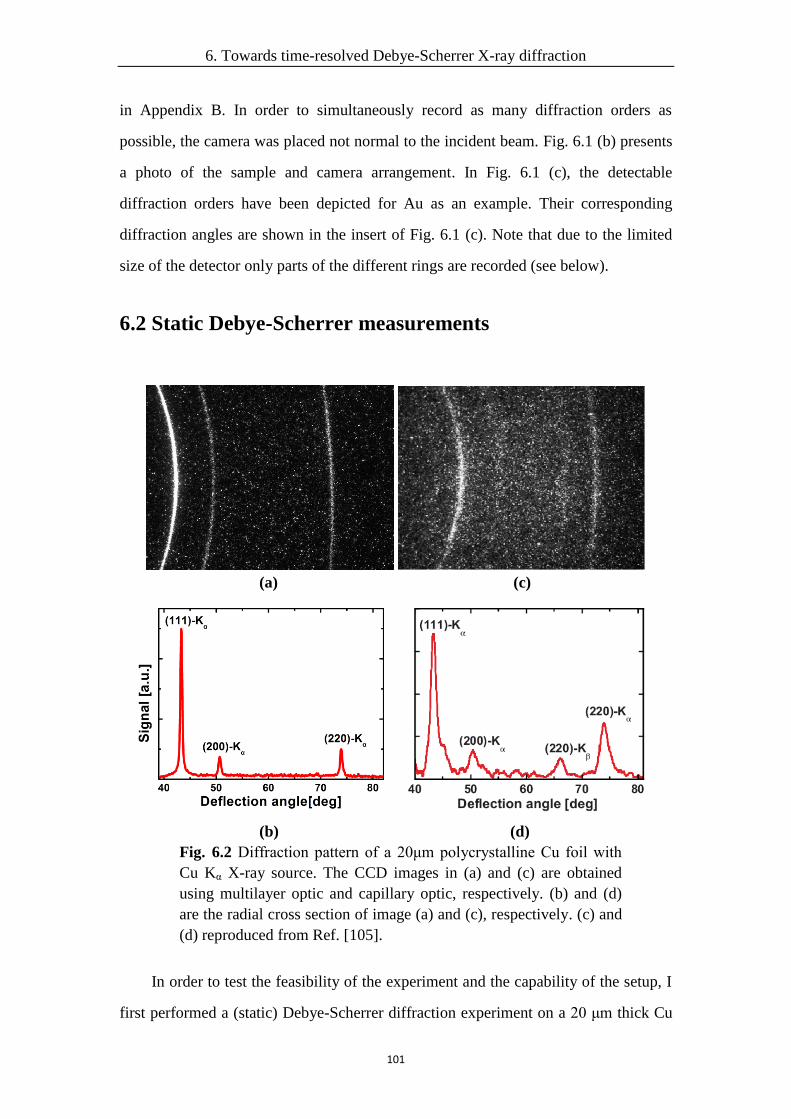
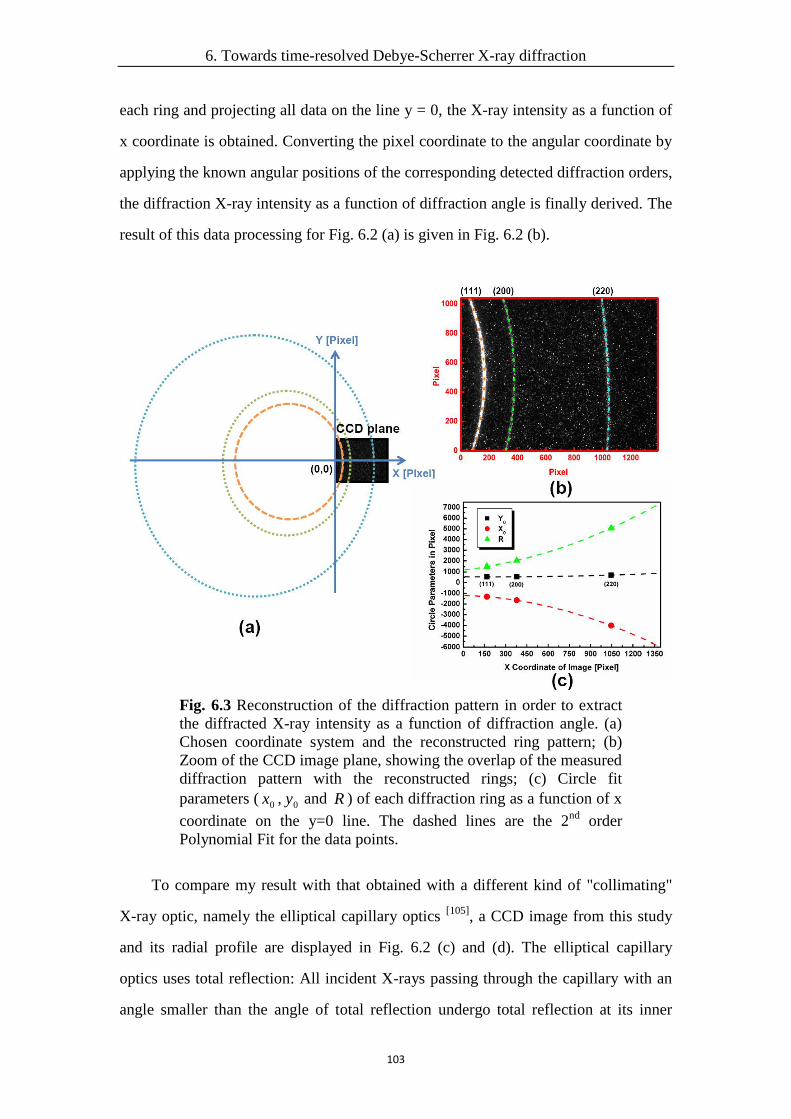
62 Static Debye-Scherrer measurements 101
63 Time-resolved Debye-Scherrer experiment 104
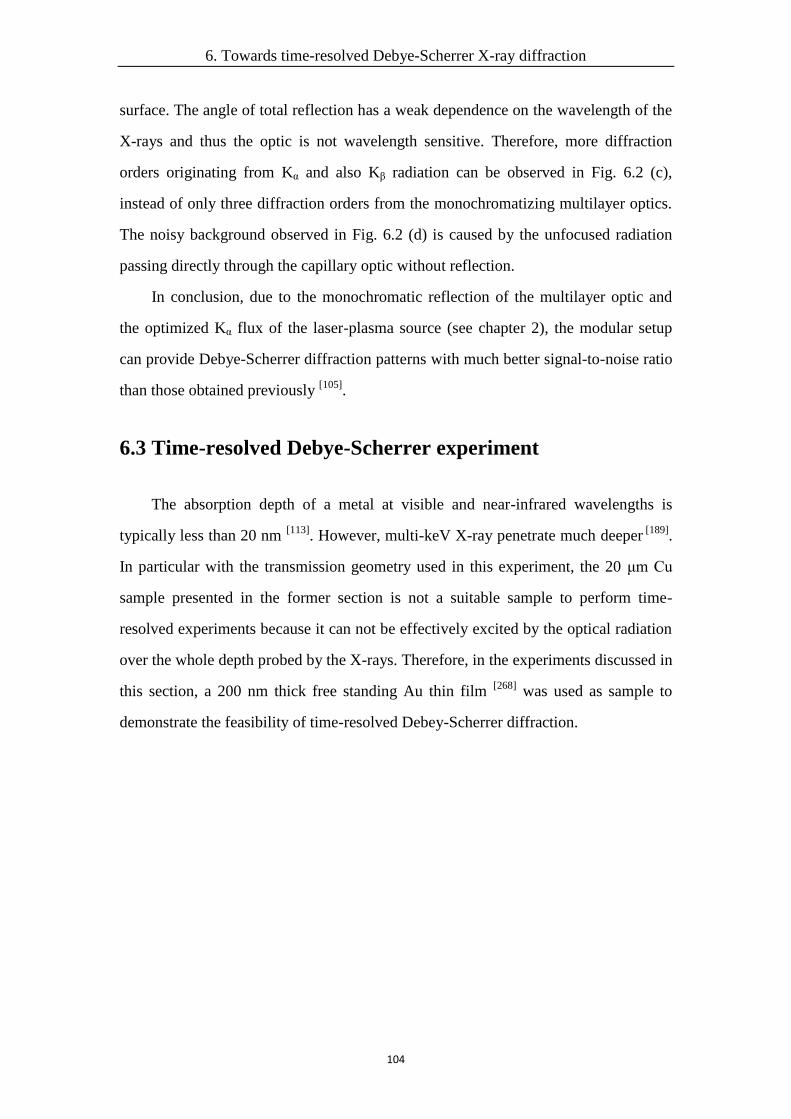
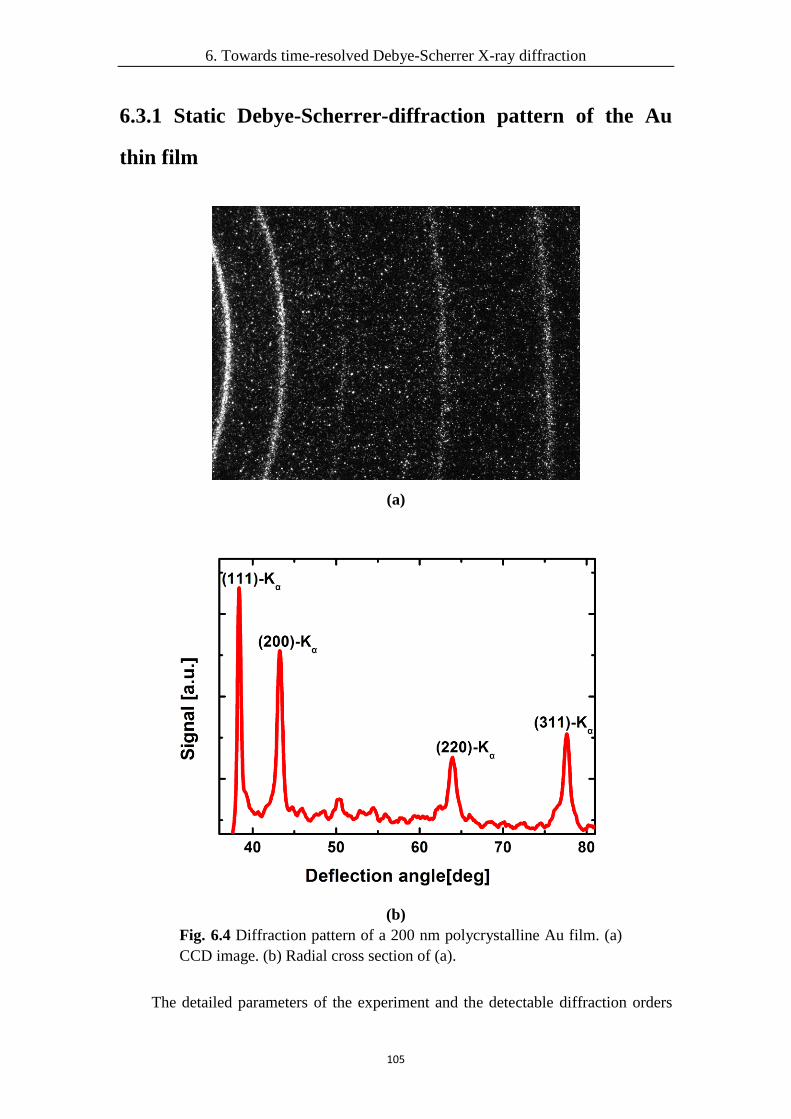
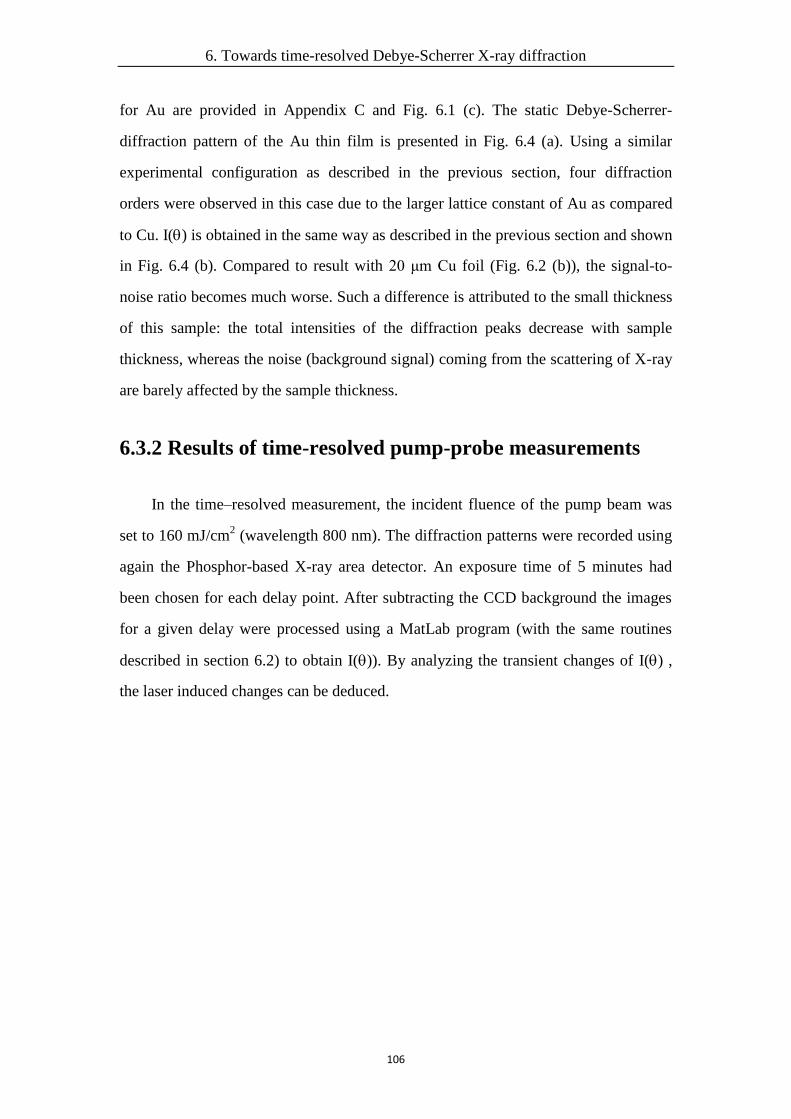
631 Static Debye-Scherrer-diffraction pattern of the Au thin film 105
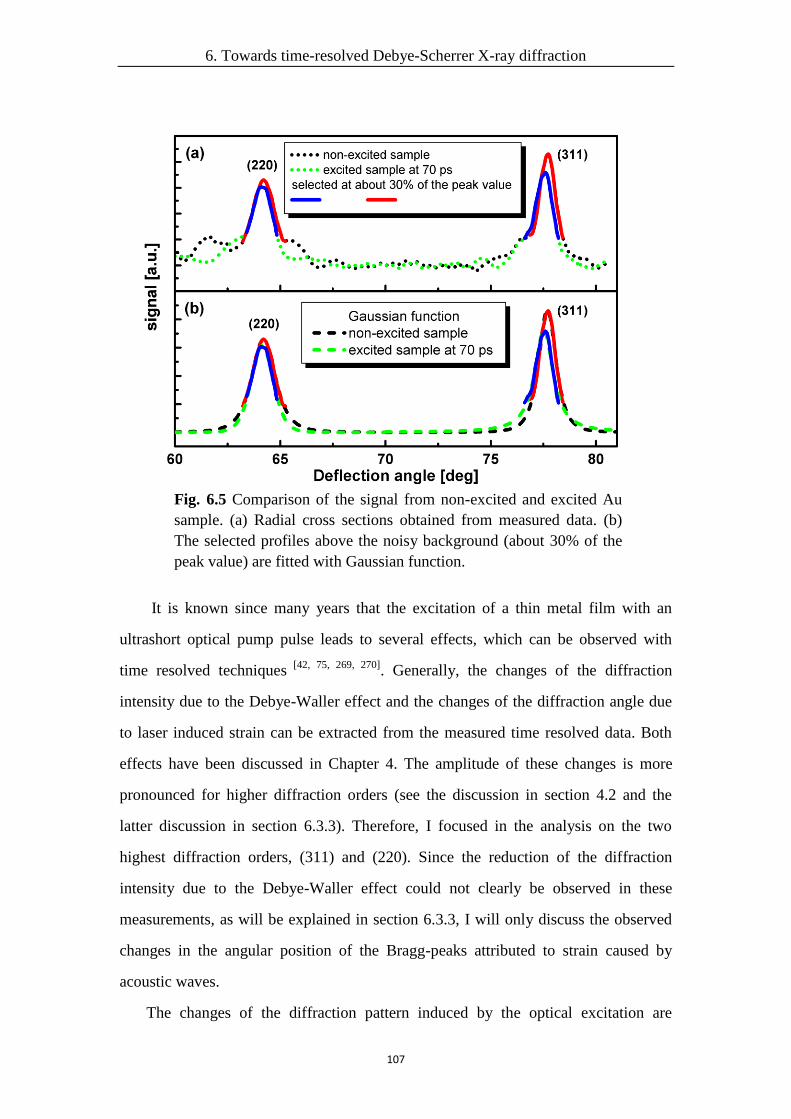
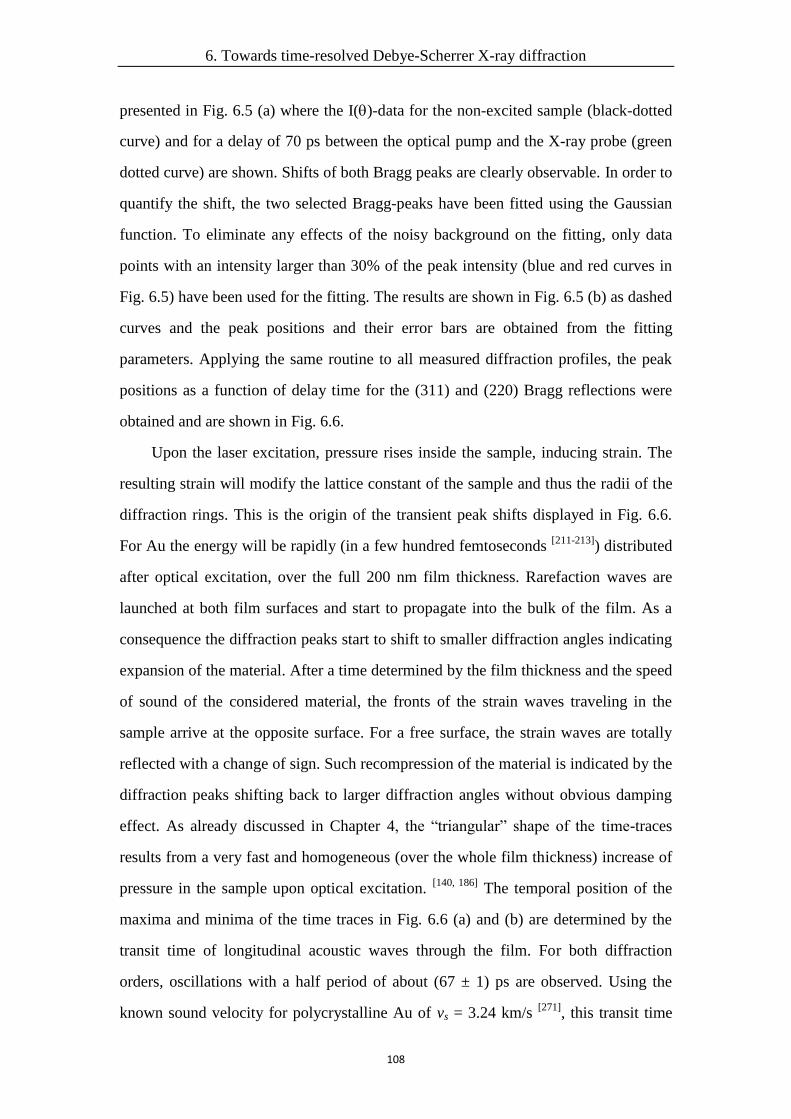
632 Results of time-resolved pump-probe measurements 106
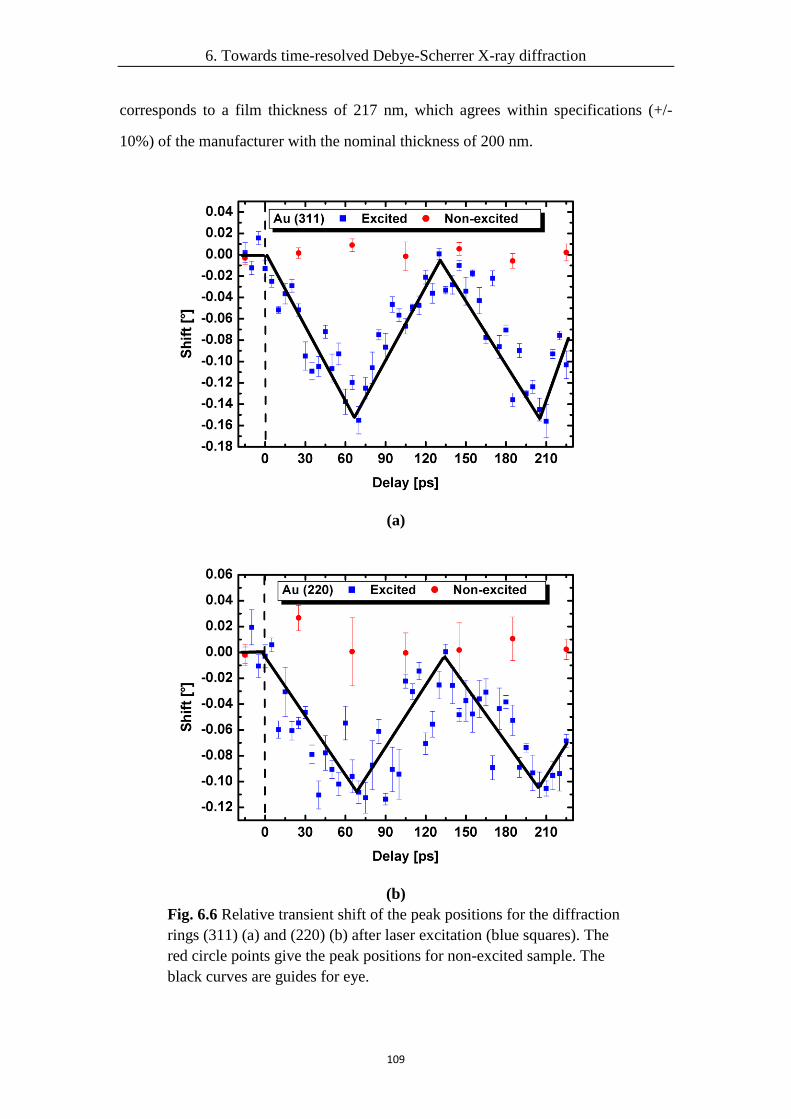
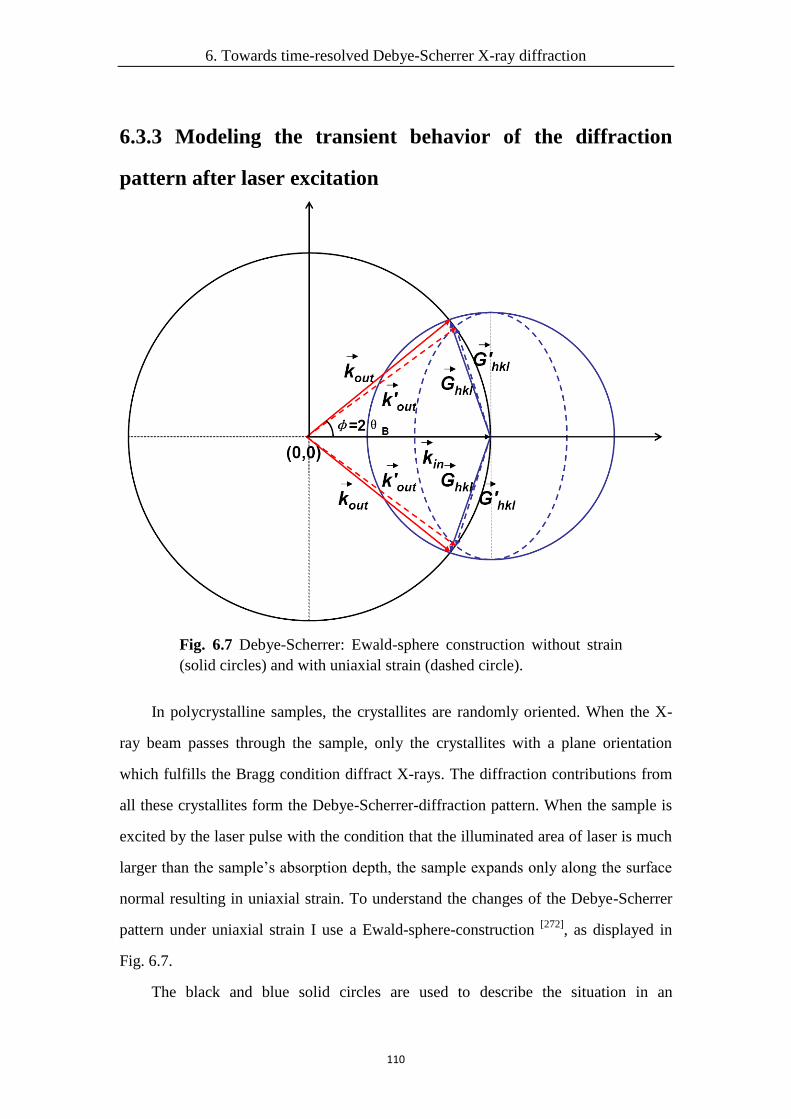
633 Modeling the transient behavior of the diffraction pattern after laser
excitation 110
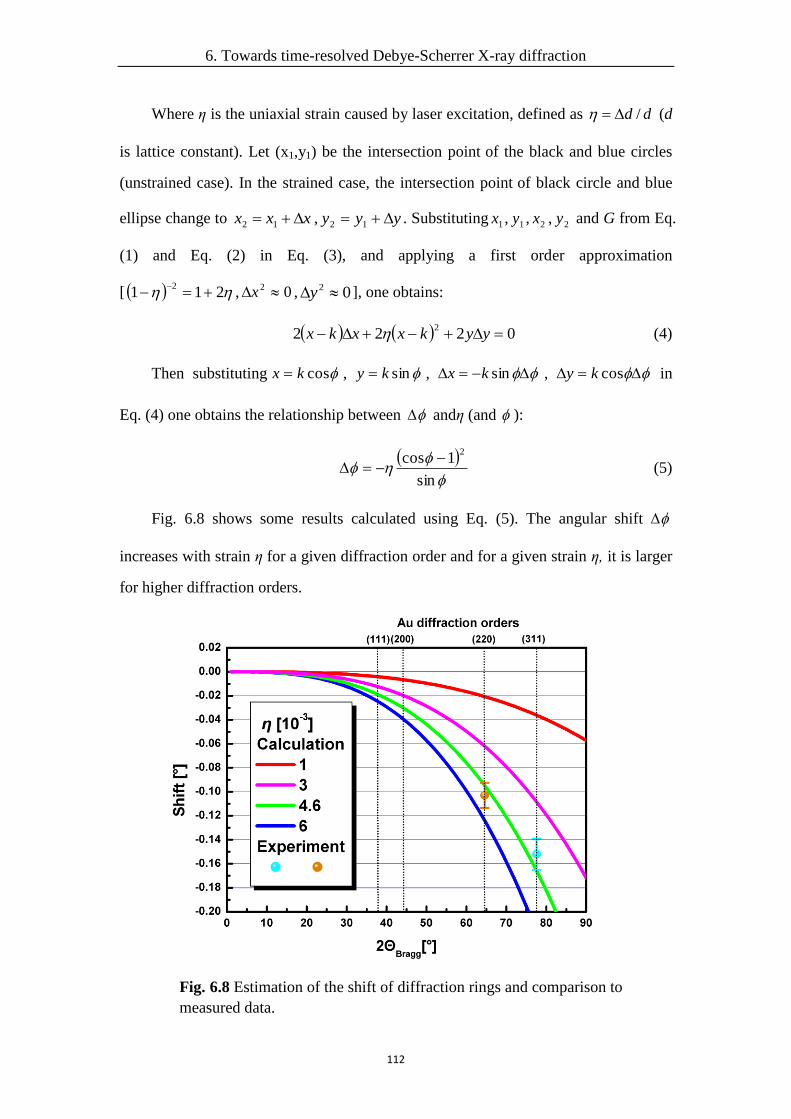
634 Discussion for the experimental results 113
64 Summary 114
7 Summary and outlook 115
71 Summary 115
72 Outlook 117
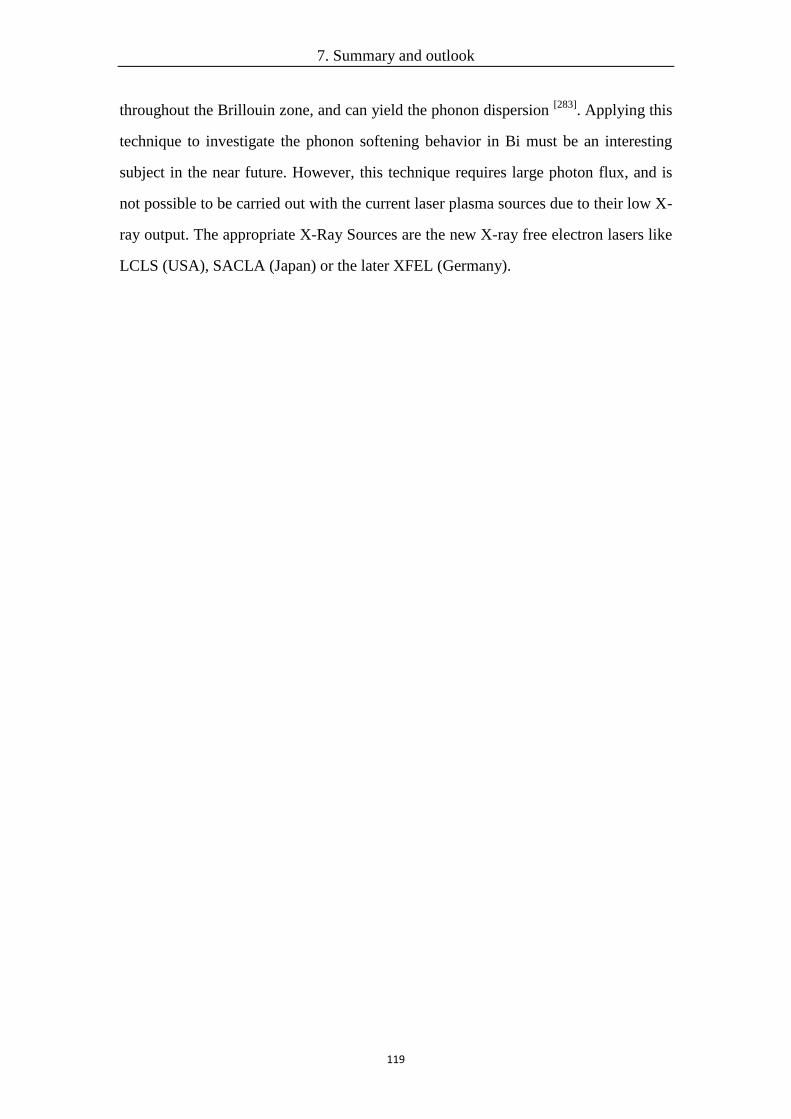
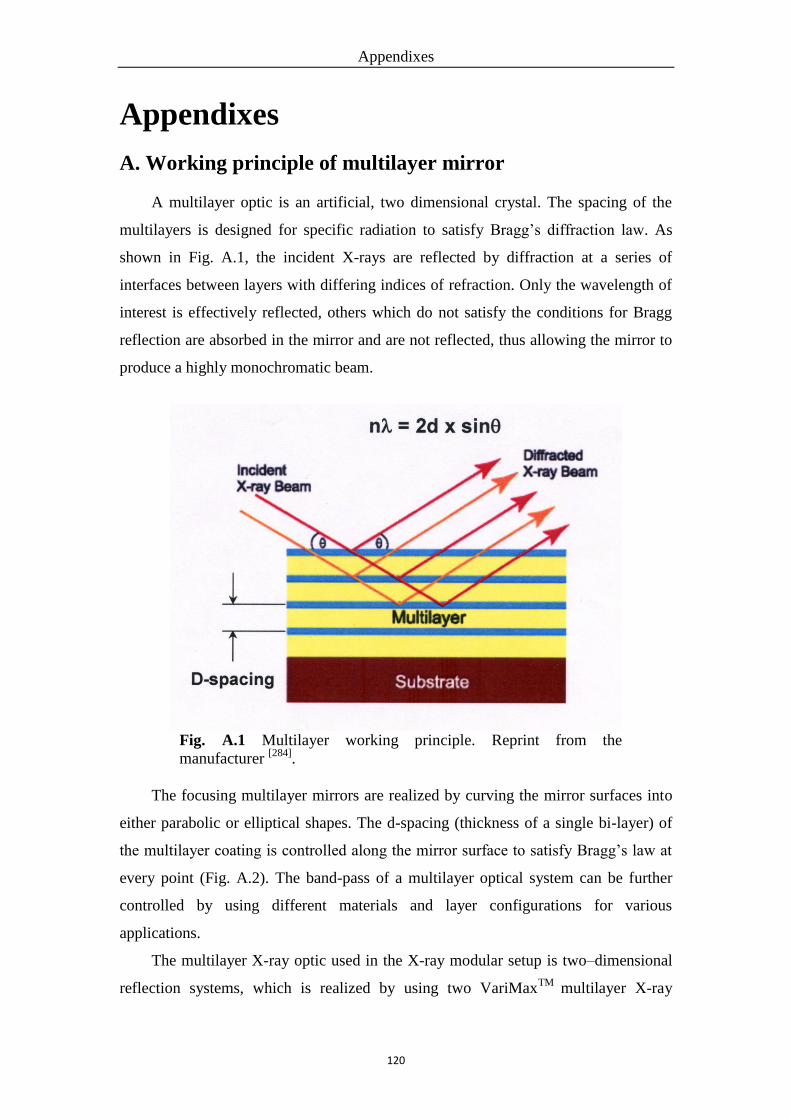
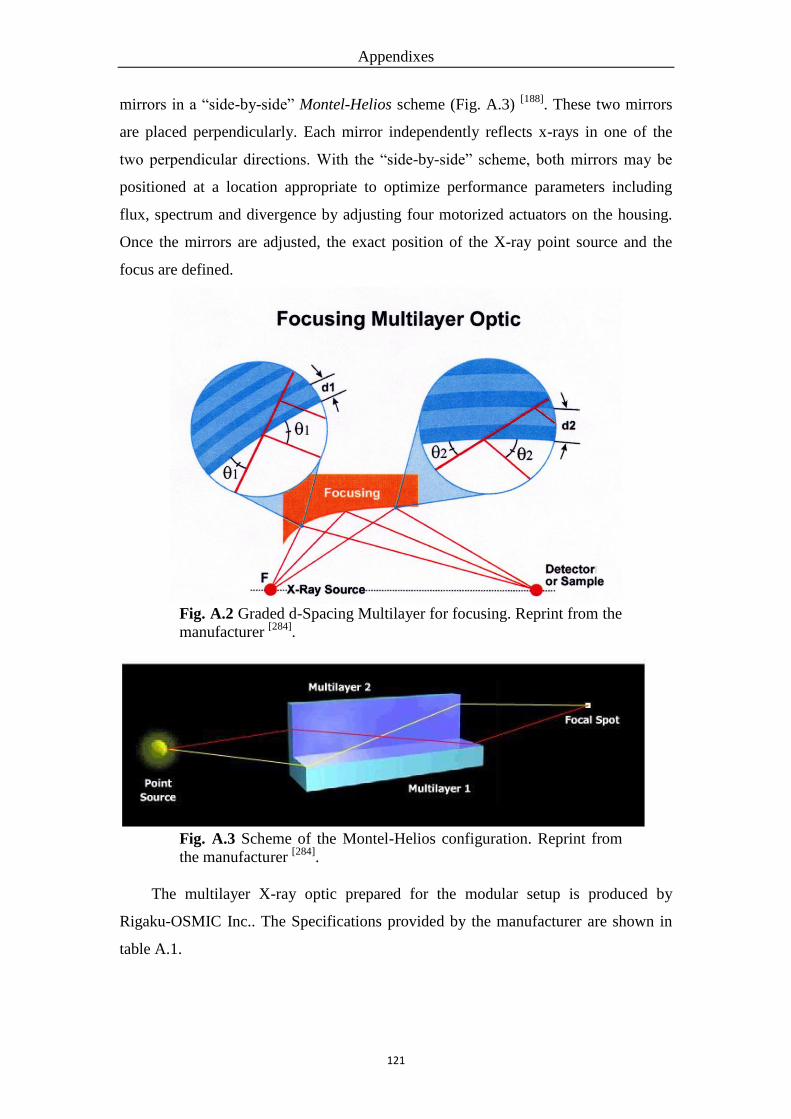
Appendixes 120 A Working principle of multilayer mirror 120
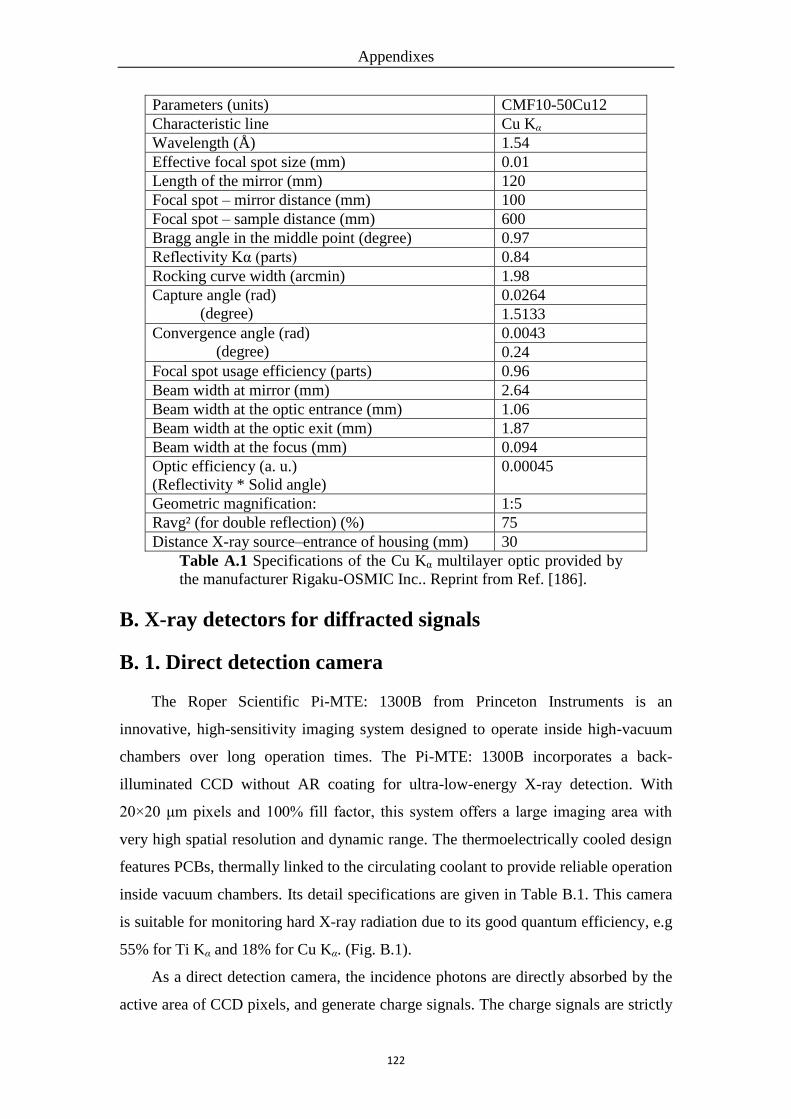
B X-ray detectors for diffracted signals 122
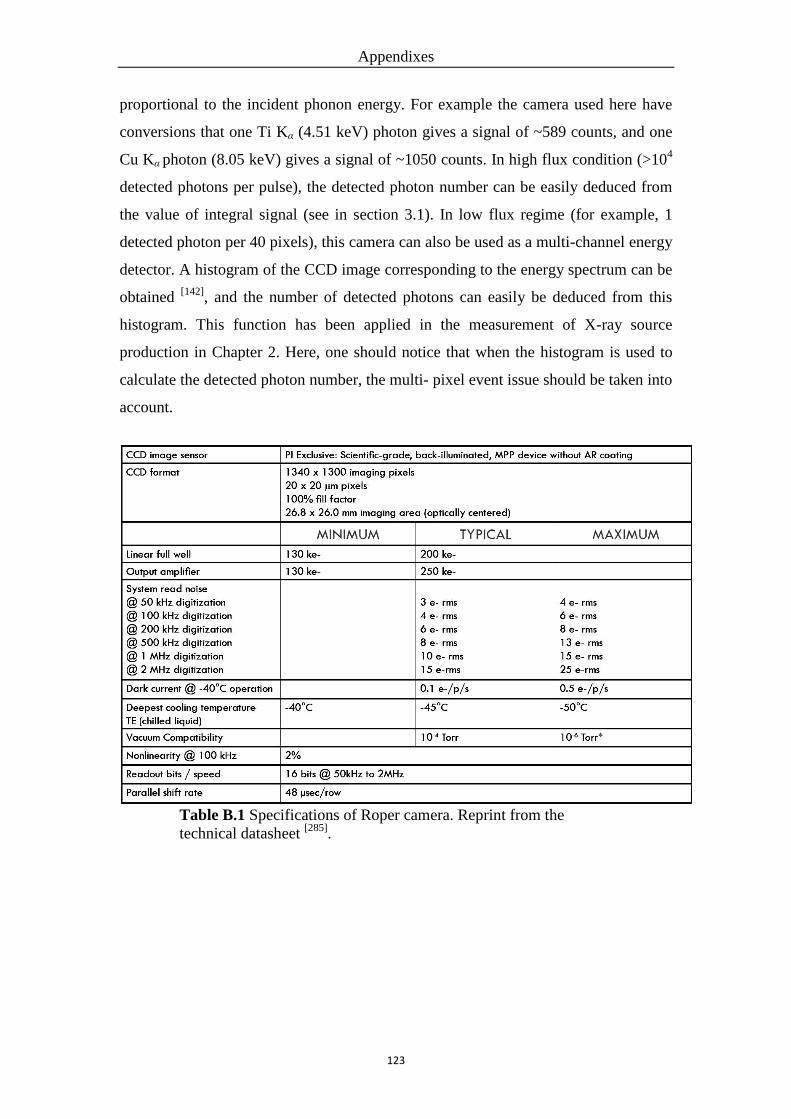
B 1 Direct detection camera 122
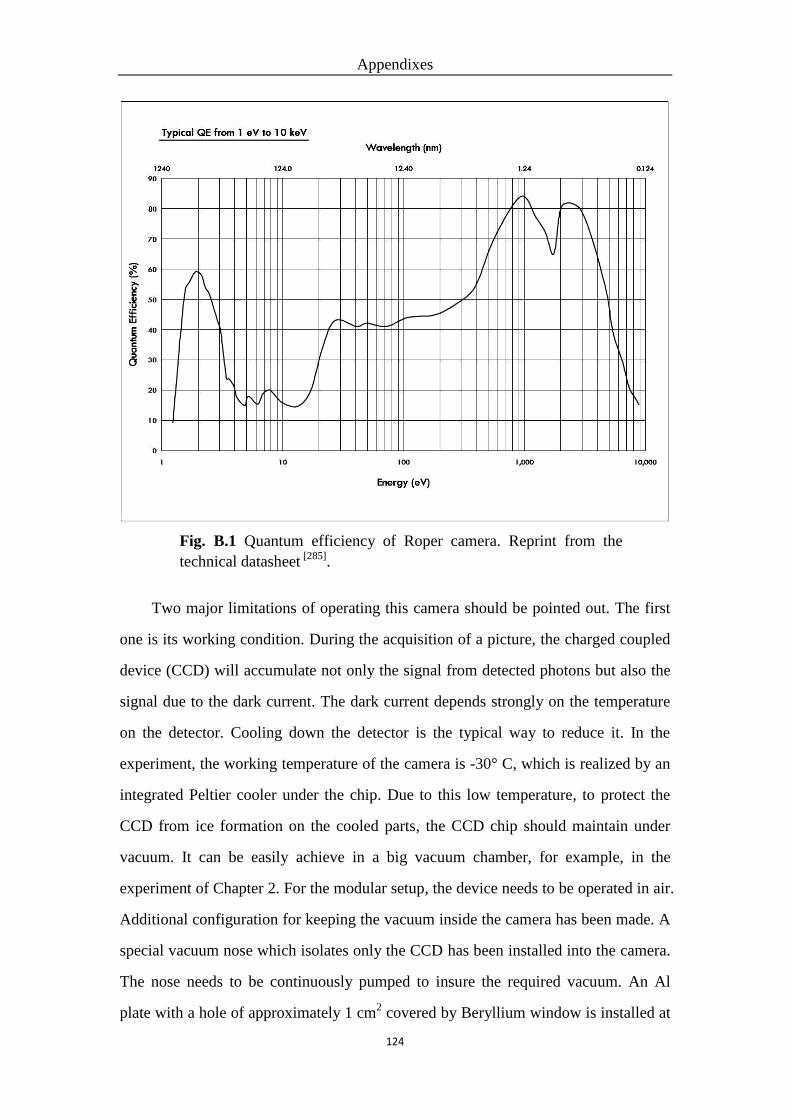
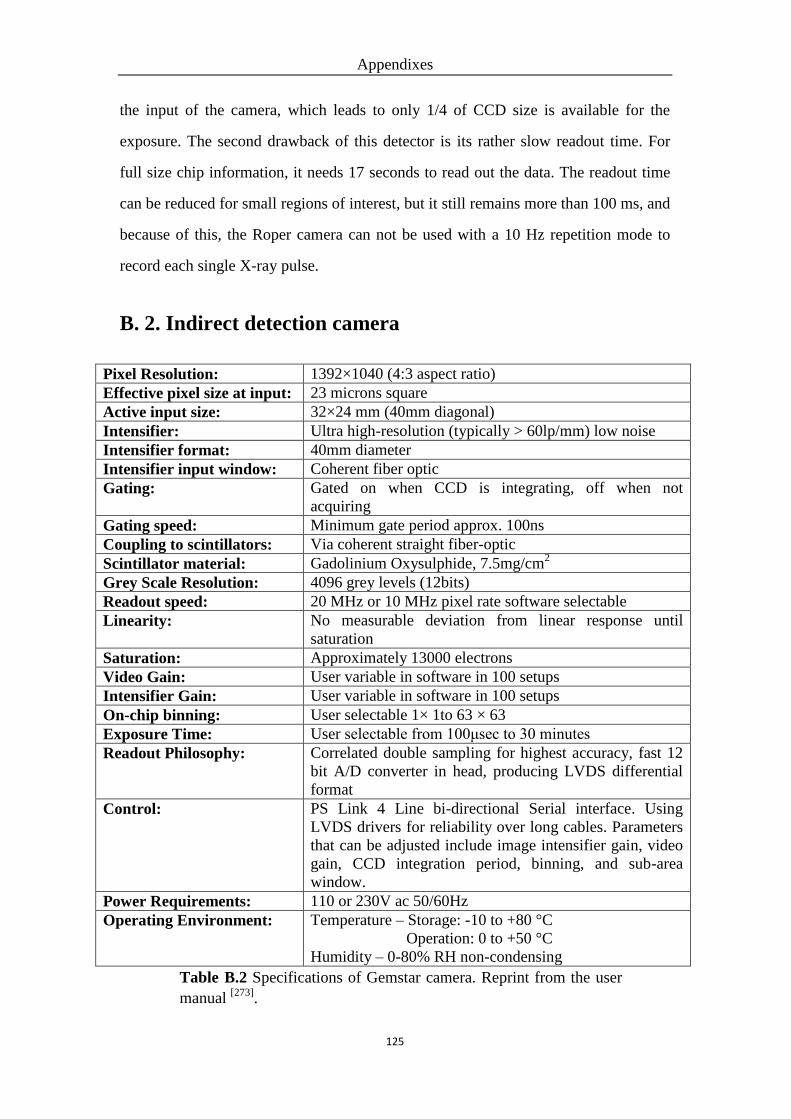
B 2 Indirect detection camera 125
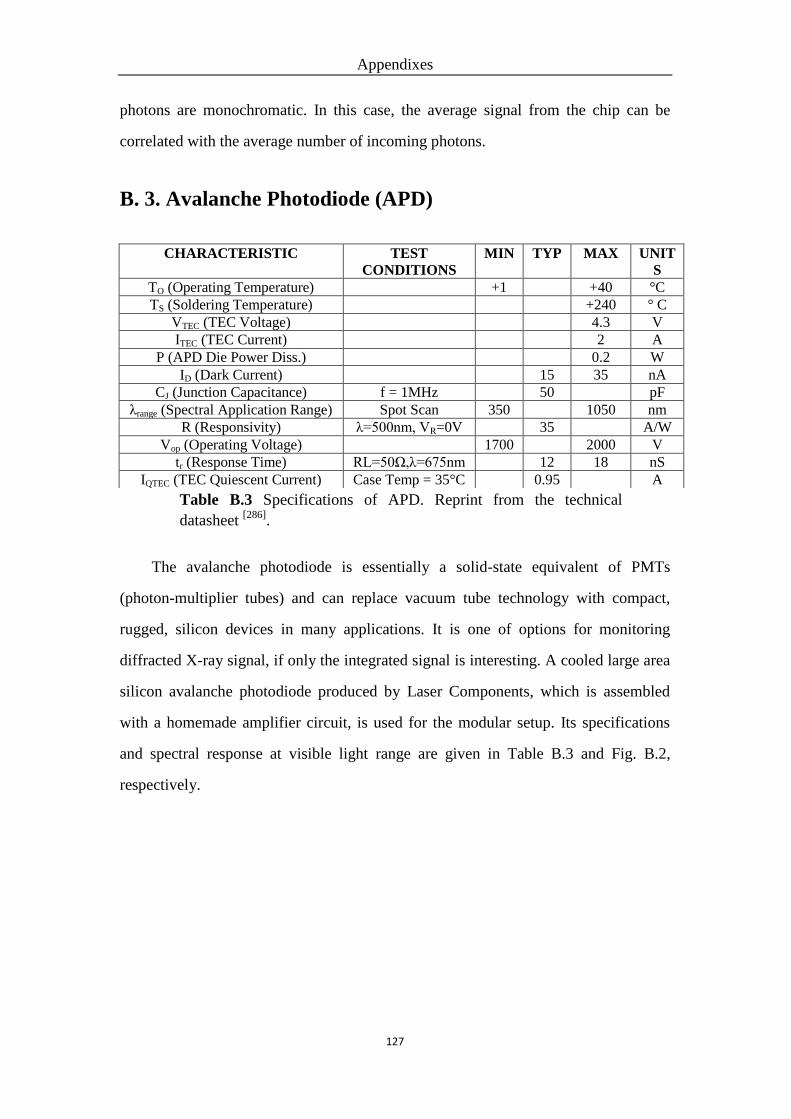
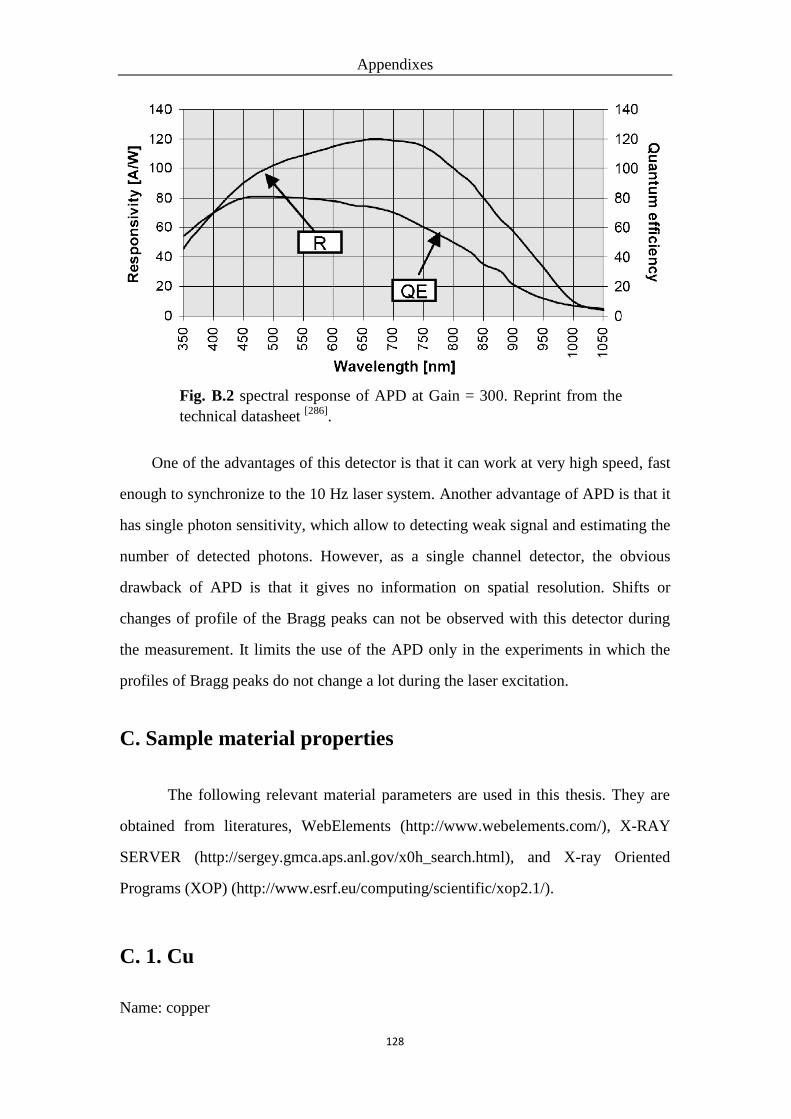
B 3 Avalanche Photodiode (APD) 127
C Sample material properties 128
C 1 Cu 128
C 2 Ti 129
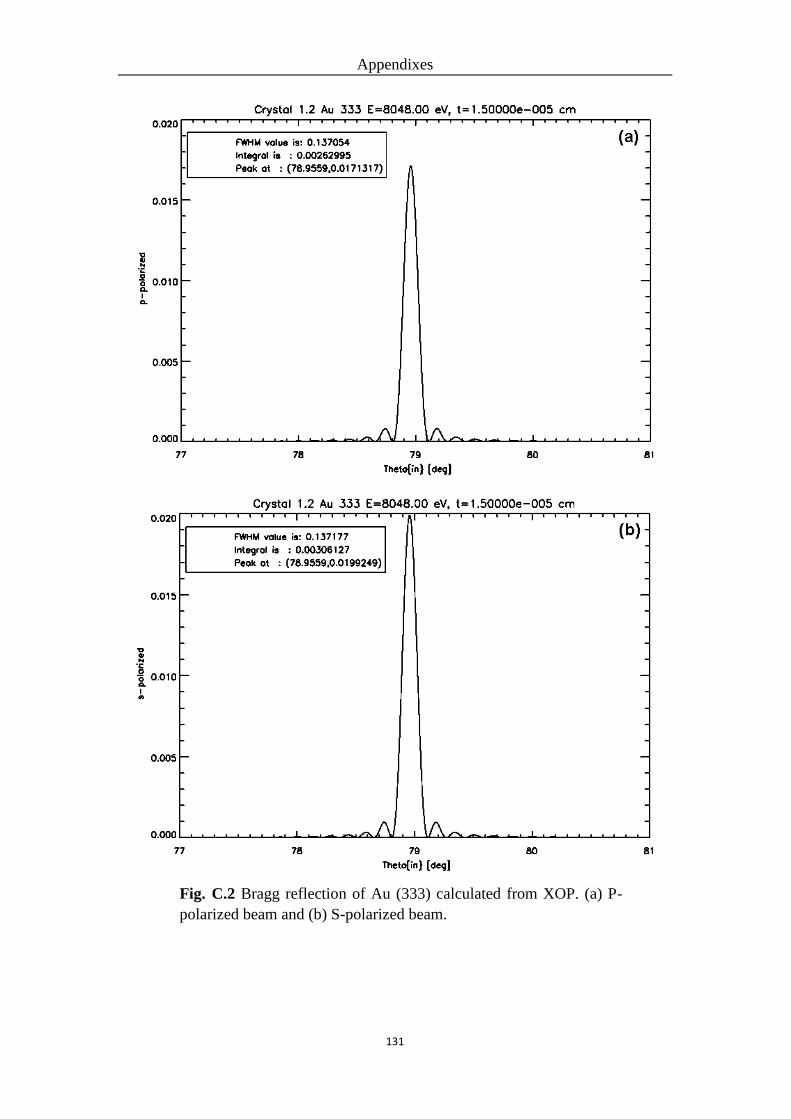
C 3 Au 129
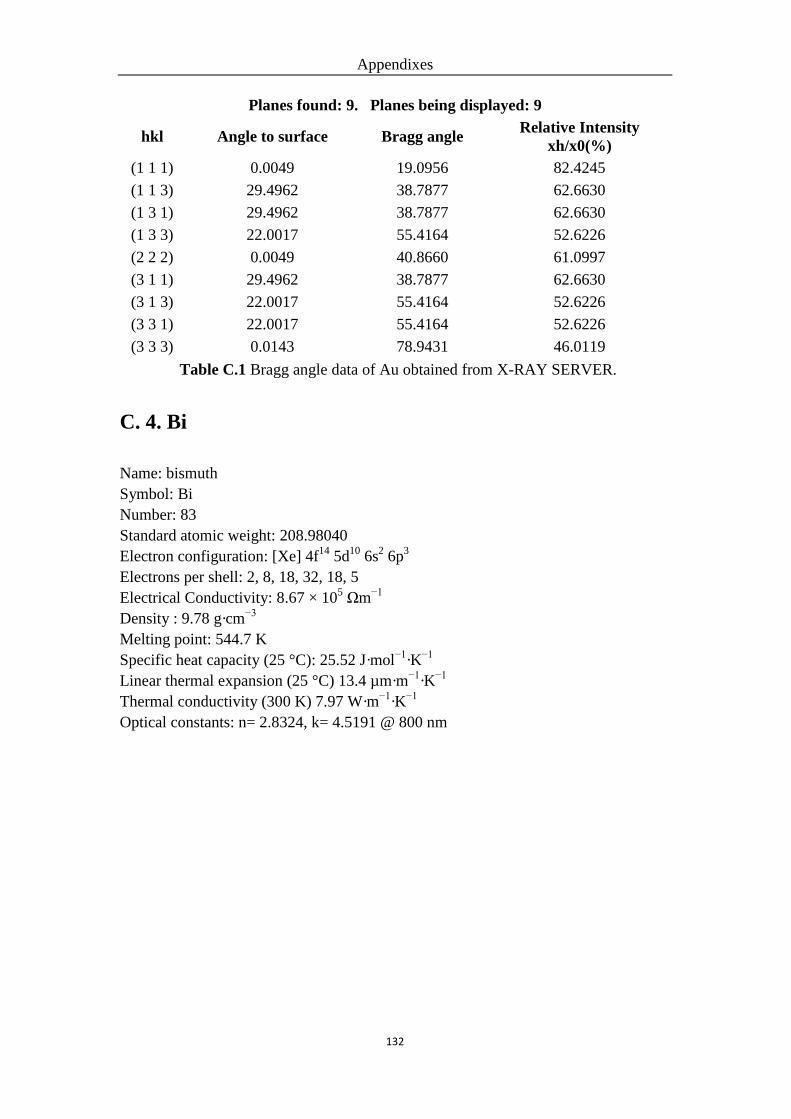
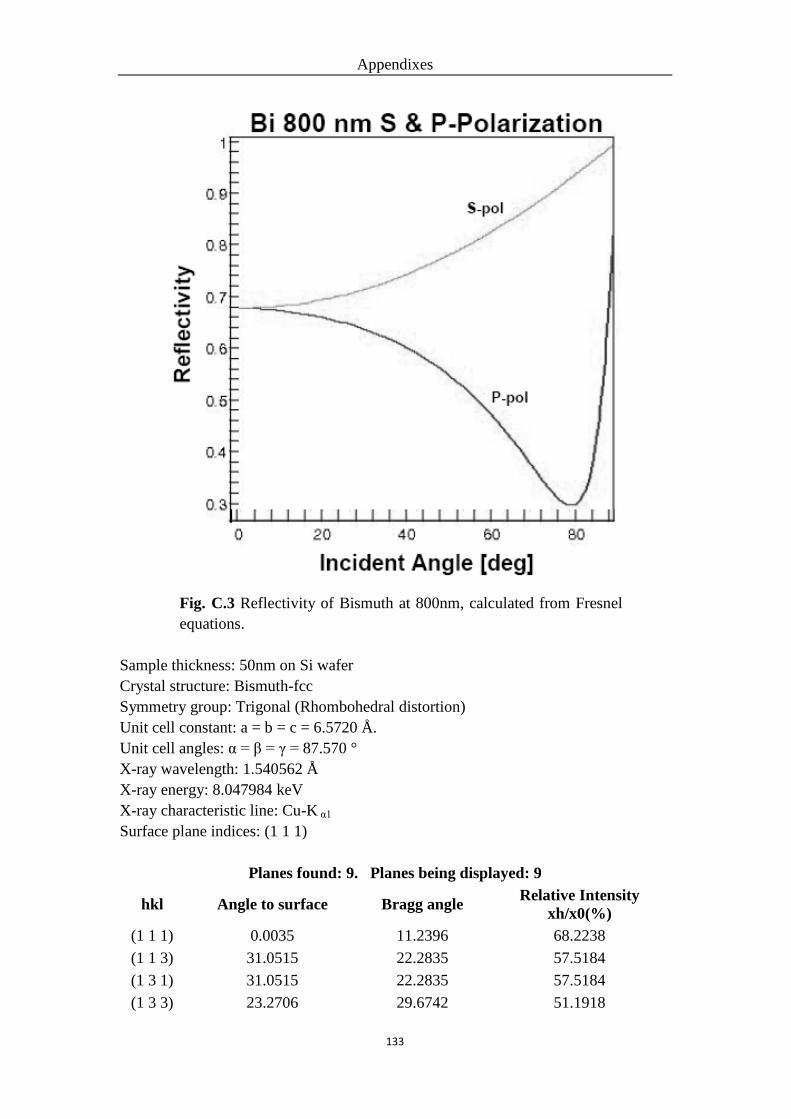
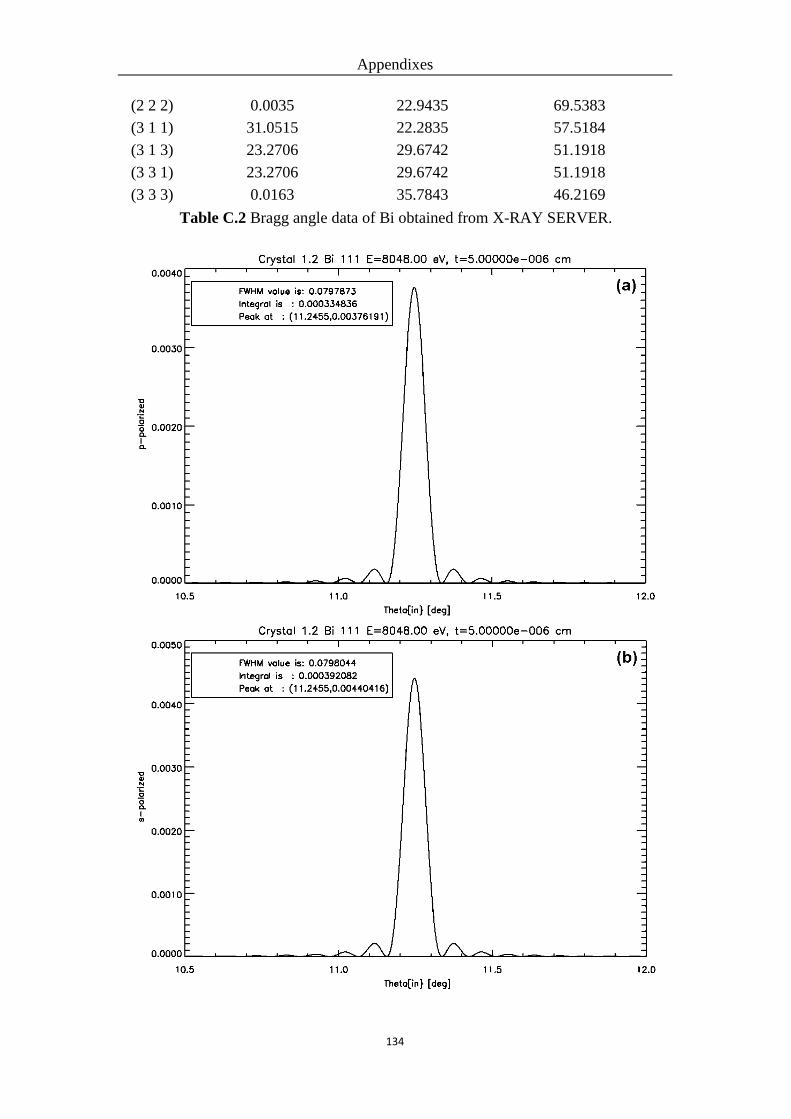
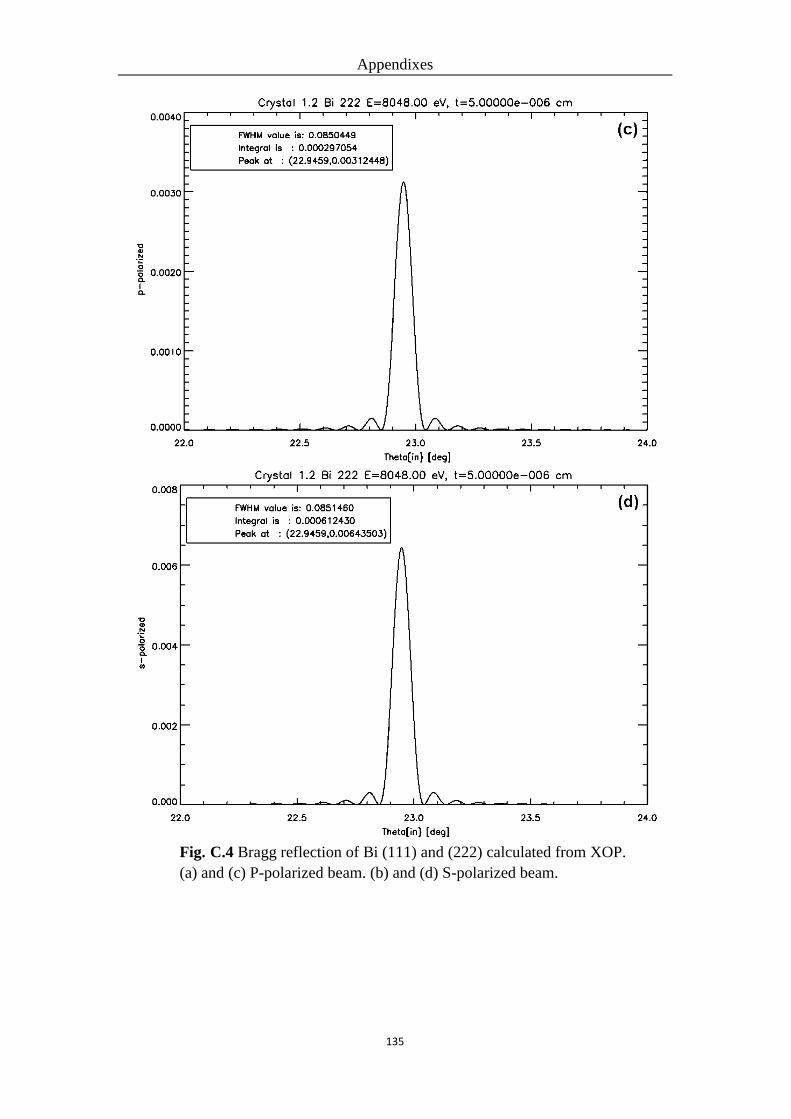
C 4 Bi 132
Bibliography 136
1 Introduction
1
1 Introduction
11 Introduction and motivation
In order to study the ultrafast structural dynamics of matter excited by a
femtosecond optical pulse atomic spatial resolution (~Aring) and temporal resolution
comparable to characteristic time scales of atomic motion (femtosecond to
picosecond) are required
For a long time static atomic resolution has been achieved by using either X-
rays which were discovered by William Conrad Roentgen in 1895 [1]
electrons
proved by George Paget Thomson and Clinton Joseph Davisson independently in
1920s [2 3]
or neutrons which was established by Ernest O Wollan and Clifford Shull
in 1940s [4]
The knowledge of the structure of matter has been largely extended with
the application of these invaluable tools For their outstanding contributions
Roentgen earned the first Nobel Prize for Physics in 1901 Thomson and Davisson
shared the Nobel Prize for Physics in 1937 and Shull was awarded one half of the
1994 Nobel Prize in Physics
On the other hand the temporal resolution had made no significant improvement
until the development of femtosecond laser technology [5 6]
Since then the situation
has changed rapidly New types of radiation sources have been developed or are being
developed to provide ultrashort pulses of photons or electrons with sufficiently short
wavelength to enable the direct observation of structural changes on the relevant
length- and time-scales In the late 1980searly 1990s the first laser-produced plasma
femtosecond x-ray sources were demonstrated [7-9]
In the early 2000s ultrafast
electron diffraction with sub-picosecond time resolution was realized [10-13]
In the
mean time also accelerator based short-pulse X-rays sources have been developed [14-
18] However until now it has not been possible to generate ultrashort (sub-
picosecond) pulses of thermal neutrons
In the works presented in this thesis ultrashort X-ray pulses are used as a tool to
investigate ultrafast structural dynamics Currently there are six techniques exist to
1 Introduction
2
produce femtosecond X-ray pulses
1) Ultrafast X-ray tube achieved by using pulsed femtosecond lasers to produce
pulsed electron injection within a normal X-ray tube [19-21]
2) Direct conversion of the laser pulse into the X-ray region by nonlinear optical
processes ie high order harmonic generation(HHG)[22-25]
3) laser-produced plasma X-ray source achieved by the interaction of high
intensity laser pulses with solid targets [7-9]
4) The very recent developed laser-plasma wakefield accelerator-based betatron
X-ray source [26-29]
5) Unlike the previous four laboratory-sized techniques the large-scale electron
synchrotron-based slicing X-ray sources such as the Advanced Light Source ldquoALSrdquo
in Berkeley USA [14]
the Berliner Elektronenspeicherring-Gesellschaft fuumlr
Synchrotronstrahlung ldquoBESSYrdquo in Berlin Germany [15]
the Swiss Light Source
ldquoSLSrdquo in Villigen Switzerland [16]
6) The large-scale linear accelerator-based X-ray Free electron lasers (XFEL)
such as the Linac Coherent Light Source ldquoLCLSrdquo at SLAC in Standford USA [30]
the
SPring-8 Angstrom Compact free electron LAser ldquoSACLArdquo in Japan [31]
and the X-
ray Free-Electron Laser ldquoXFELrdquo at DESY in Hamburg Germany [32 33]
For all of these ultrafast X-ray sources the femtosecond laser pulses have to be
employed in some ways and the accelerated electrons play important roles in the
conversion process Each of these sources has its own characteristics in terms of the
repetition rate the minimum achievable pulse duration the produced photon number
the photon energy range the spatial and temporal coherence properties and the size or
the cost of the installation
Presently the first two sources are not yet suitable for studying ultrafast
structural dynamics due to the limited overall X-ray production The betatron X-ray
source is still under development [34-38]
The last two large-scale X-ray sources
represent the most promising X-ray sources for performing ultrafast time resolved
experiments However their construction and running costs are extremely high and
beam time access is very limited The laser-produced plasma X-ray sources are
presently unique because they are the easiest to operate laboratory-sized X-ray source
that can deliver hard X-ray radiation with very short pulse duration and at the same
time provide perfect synchronization between the produced X-ray pulses and the
1 Introduction
3
driving femtosecond laser pulses This is the type of X-ray source that has been used
for performing the time resolved X-ray diffraction experiments presented in this
thesis A part of the work in this thesis is dedicated to optimizing the X-ray emission
from this X-ray source
To obtain the time dependent information in sub-picosecond time scale the
common method using a fast detector (eg photo diodes or streak cameras) with one
ultrashort pump pulse is not accessible due to the limited temporal-resolution
capability of current fast detectors Most experiments are performed in the ultrafast-
pumpndashultrafast-probe scheme with a slow detector With this scheme the time
evolution of photoinduced structural changes can be studied by taking a sequence of
diffraction patterns at different time delays with respect to (femtosecond) excitation
Since the ultrashort X-ray pulse was available this scheme has been further extended
to X-ray region Using laser-pump X-ray-probe scheme the first femtosecond time-
resolved X-ray diffraction experiment was performed with laser plasma X-ray source
in 1997 by Rischel et al [39]
Since then many ultrafast phenomena have been
investigated by using ultrashort X-ray pulses Reviews on these studies can be found
in Ref [40 41] The current researches cover the following fields
1) Propagating GHz acoustic waves caused by the release of impulsive stress
launched by the femtosecond optical excitation [42-67]
2) Coherent optical phonon excitations which connect with unit-cell level
transient structural changes [67-73]
3) Non-thermal melting which is melting before thermal equilibrium between
electrons and lattice has been established after femtosecond laser excitation [17 18 39
46 76-81]
4) Phase transition in ferroelectric [66 82-87]
and ferromagnetic [88-104]
materials
caused by femtosecond laser excitation
5) Debye-Scherrer type time-resolved X-ray measurements on polycrystalline
and powder samples which allow obtaining much more information of the excited
sample from one measurement through detecting simultaneously several diffraction
orders similar to studies by ultrafast electron diffraction [105-110]
6) Utilizing X-ray diffuse scattering to investigate the transient nonequilibrium
states of the lattice system following ultrafast laser excitation [111 112]
The ultrafast phenomena investigated in this thesis focus on structural dynamics
in thin laser-excited metal films These works covered by the research field includes
1 Introduction
4
coherent excitations of acoustic phonons and optical phonons
12 Overview and structure of the thesis
The thesis is organized as following
Chapter 2 presents experimental results on the optimization of Kα X-ray emission
from a laser-plasma based X-ray source It contains the principle of X-ray generation
with a laser produced plasma and a systematic investigation of optimizing the X-ray
emission
Chapter 3 describes a modular setup for time-resolved X-ray diffraction
experiments This chapter presents and discusses implemented improvements of the
setup such as hardware software and methodology which are essential to achieve the
results of following time-resolved diffraction experiments
Chapter 4 deals with the first time-resolved X-ray diffraction experiment with
the improved modular setup The Debye -Waller effect in a thin laser-excited Au film
is observed The evolutions of the lattice temperature are compared with the
theoretical prediction of Two-Temperature Model (TTM)
Chapter 5 contains the study on the photoinduced softening of the A1g optical
phonon mode in laser-excited Bi This work extends the studies of coherent optical
phonons in laser-excited Bi to a higher fluence range that has not been studied
previously
Chapter 6 focuses on the experiments performed with X-ray Debye-Scherrer
diffraction scheme A static measurement on a Cu foil (20 μm) and a time-resolved
measurement on an Au thin film (200 nm) have been carried out The temporal
behaviors of the measured data are discussed
The last chapter summarizes the main results presented in this thesis An outlook
for the future studies is also provided
2 Optimization of a laser-plasma based X-ray source
5
2 Optimization of a laser-plasma based
X-ray source
This chapter discusses the principles of X-ray generation using a laser-produced
plasma and strategies to optimize the X-ray source for time-resolved X-ray diffraction
experiments discussed in the following chapters For this purpose the Kα-emissions
from plasmas on Ti and Cu targets for different excitation and plasma conditions were
investigated Section 21 describes the mechanism for generating ultrashort X-ray
pulses using the laser-produced plasma The laser system and the experimental setup
are presented in sections 22 and 23 respectively Section 24 discusses the
optimization of the Kα yield as a function of laser intensity Measurements of the Kα
yield as a function of target thickness and angle of incidence and a detailed
investigation of the influence of a pre-formed plasma by using a controlled pre-pulse
with variable delay are presented and discussed in section 25 The experimental data
show that for a given angle of incidence the Kα yield can be optimized by choosing a
suitable pre-pulse ie plasma scale-length conditions For large angles of incidence a
steep electron density gradient maximizes the yield At near normal incidence
maximum yield is achieved for a more expanded plasma and the best energy
conversion efficiency has been found in this case For a certain scale-length range
(between 01λ ndash 1λ here λ is the laser wavelength) the optimized yield is scale-length
independent It can be achieved by choosing the appropriate angle of incidence This
situation results from the strong dependence of collisionless absorption mechanisms ndash
in particular resonance absorption (RA) ndash on the angle of incidence and the plasma
scale length By maximizing the absorption the highest Kα yield is achieved The
experimental data are supported by the results of calculations based on the classical
resonance absorption mechanism (section 25) and of particle-in-cell (PIC) simulations
(section 26) Finally a summary of this chapter is given in section 27
2 Optimization of a laser-plasma based X-ray source
6
21 Generation of ultrashort X-ray pulses from laser-
produced plasma
Optical radiation is absorbed by a metal within a thin layer of about 10 nm which
is called the ldquoskin depthrdquo [113]
If the intensity of the laser radiation on the material is
large enough typically more than 1014
Wcm2 the target material within the skin depth
will be ionized and transformed into a plasma during the pulse For laser intensities
above 1015
Wcm2 easily achievable with current femtosecond laser technology it has
been found that the hot plasma emits radiation in the (hard) X-ray range [7]
The emitted
radiation consists of continuum emission from recombination in the plasma
characteristic line emission (Kα Kβhellip) and Bremsstrahlung radiation The latter two
components come not only from the hot plasma resulting from transitions on the
strongly ionized atoms but also the interaction of high energy electrons accelerated by
the intense laser field with the cold non-excited material underneath [7 9 114 115]
These
laser-accelerated electrons often called hot electrons in the laser plasma community
have a kinetic energy (~10hellip100 keV) significantly higher than the thermal energy of
the overwhelming part of the plasma electrons Among the three different contributions
to the X-ray emission mentioned above the characteristic line emission especially K
emission is particularly interesting for applications (eg time-resolved X-ray
diffraction) The generation of characteristic line radiation during the irradiation of a
solid material with an intense femtosecond laser pulse is described detail in Ref [9
116-118]
The mechanism of K -ray emission from a laser induced plasma is very similar
to that in an ordinary X-ray tube However the static electric field used for electron
acceleration is replaced by the femtosecond laser electric field A brief description of
the process of K The interaction of a high
intensity laser beam with a solid surface rapidly creates a plasma The plasma electrons
interacting with the strong electric field of the incident femtosecond optical pulse can
acquire an energy which is high enough to leave the skin layer and penetrate into the
non-excited material underneath the surface plasma layer Some of these electrons will
be slowed down and generate Bremstrahlung Others collide with the non-excited
atoms kick out electrons from their inner electronic shells which subsequently undergo
inner shell recombination leading to characteristic line emission Therefore the
emission of the characteristic line radiation can only occur as long as the high energy
2 Optimization of a laser-plasma based X-ray source
7
electrons are present and can be regarded as a direct result of these hot electrons
These electrons exist only during the femtosecond laser pulse irradiation (and for a very
short time afterwards which is determined by the flight-time of the high energy
electrons through the material) Thus one can expect that the duration of the X-ray
pulses produced in this way is comparable to the laser pulse duration ie in the sub-
picosecond region [119-122]
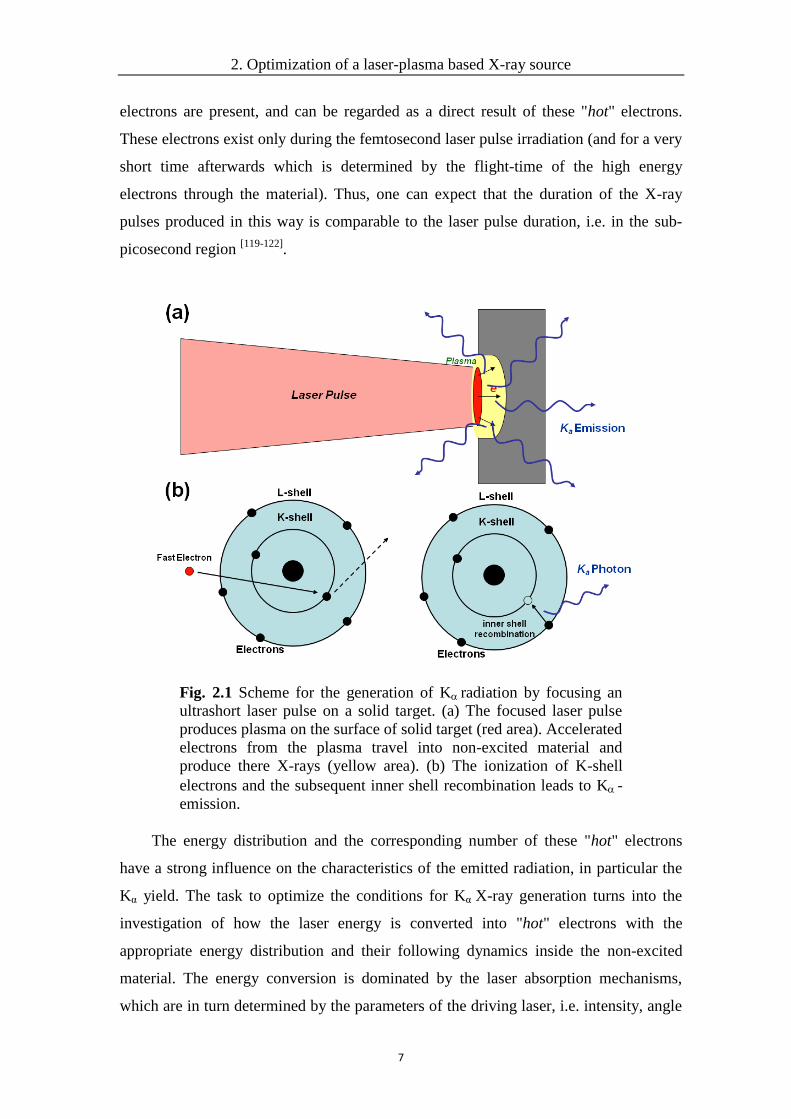
Fig 21 Scheme for the generation of Kradiation by focusing an
ultrashort laser pulse on a solid target (a) The focused laser pulse
produces plasma on the surface of solid target (red area) Accelerated
electrons from the plasma travel into non-excited material and
produce there X-rays (yellow area) (b) The ionization of K-shell
electrons and the subsequent inner shell recombination leads to K-
emission
The energy distribution and the corresponding number of these hot electrons
have a strong influence on the characteristics of the emitted radiation in particular the
Kα yield The task to optimize the conditions for Kα X-ray generation turns into the
investigation of how the laser energy is converted into hot electrons with the
appropriate energy distribution and their following dynamics inside the non-excited
material The energy conversion is dominated by the laser absorption mechanisms
which are in turn determined by the parameters of the driving laser ie intensity angle
2 Optimization of a laser-plasma based X-ray source
8
of incidence laser polarization as well as by the properties of the plasma with which
the laser pulse interacts [119 123]
The subsequent interaction of the hot electrons and
the solid is mainly via collisions The mean free path of the hot electrons (or the
stopping distance) and the ionization cross section in the solid dominate the rate of Kα
emission [124-126]
Several studies based on simulations (particle-in-cell
simulation [127]
+ Monte Carlo transport code [128]
) were performed to investigate this
question Depending on the target material (Z) and the sample thickness the
simulations allowed to determine the laser parameters (ie laser wavelength intensity
polarization and pulse duration) which lead to the optimum electron distributions for
Kα emission [121 129-131]
These results are in good agreement with previous experimental
data [9 115 132 133-137]
In this study the effects of laser intensity target thickness angle of incidence and
precise controlled pre-plasma conditions on the Kα-production from Cu and Ti elements
are the objects for investigation To my knowledge systematic investigations of the
latter two effects on both elements were first performed
22 Laser system
In this section the laser system used as a driver for the laser-plasma based X-ray
source is described and some key parameters of this laser system are presented
The 10-Hz Titanium-Sapphire femtosecond terawatt laser system at the University
of Duisburg-Essen is based on the Chirped Pulsed Amplification (CPA) technique [5 6
138] Its working principle can be briefly described as follows A low energy
femtosecond pulse produced by an oscillator first passes through a so-called ldquostretcherrdquo
The stretcher consists of a dispersive delay line (gratings) and adds a controlled phase
modulation to the laser pulse thereby increasing its duration and decreasing its peak
intensity Typical stretching factors are 104 The ldquostretchedrdquo pulse can then be
amplified to high energies usually by several amplification stages After amplification
the pulse passes through the so-called ldquocompressorrdquo which compensates the phase
modulation imposed by the stretcher as well as any additional phase modulation
acquired during amplification (for example due to material dispersion) Ideally the
amplified pulse is recompressed to its original duration This technique allows to
produce high peak power laser pulses without deteriorating the pulse parameters and
damaging the optical components during the amplification process
2 Optimization of a laser-plasma based X-ray source
9
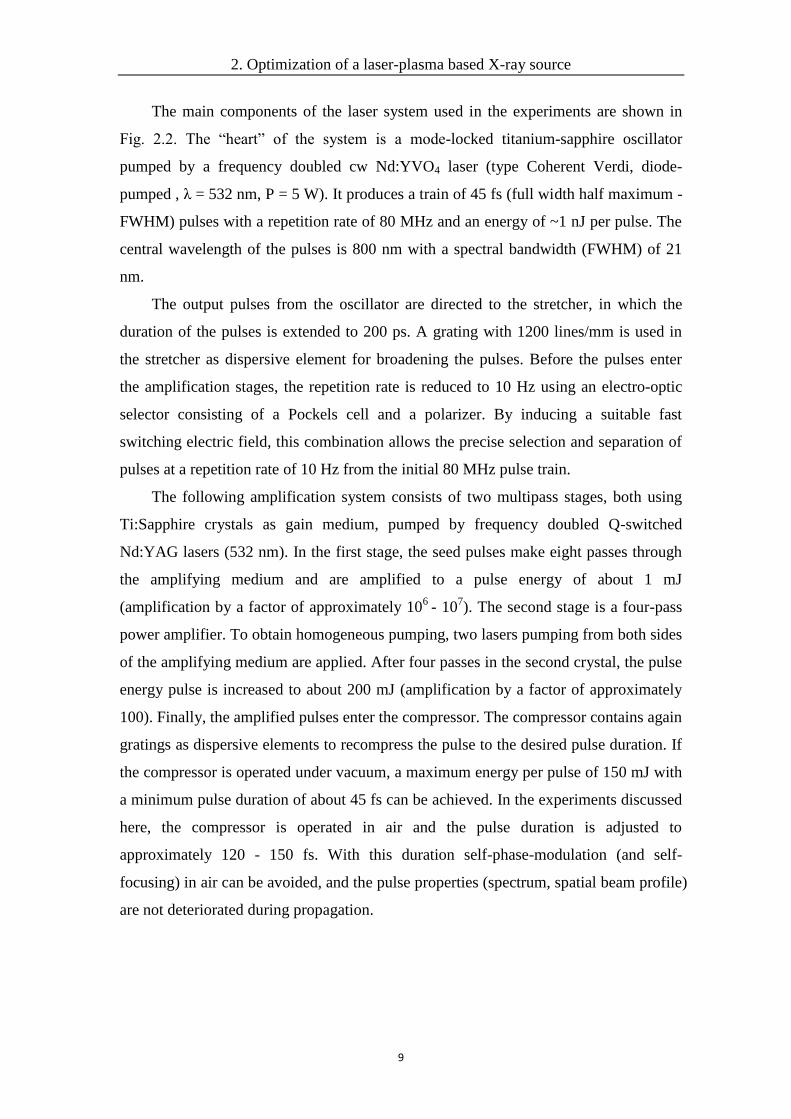
The main components of the laser system used in the experiments are shown in
Fig 22 The ldquoheartrdquo of the system is a mode-locked titanium-sapphire oscillator
pumped by a frequency doubled cw NdYVO4 laser (type Coherent Verdi diode-
pumped λ = 532 nm P = 5 W) It produces a train of 45 fs (full width half maximum -
FWHM) pulses with a repetition rate of 80 MHz and an energy of ~1 nJ per pulse The
central wavelength of the pulses is 800 nm with a spectral bandwidth (FWHM) of 21
nm
The output pulses from the oscillator are directed to the stretcher in which the
duration of the pulses is extended to 200 ps A grating with 1200 linesmm is used in
the stretcher as dispersive element for broadening the pulses Before the pulses enter
the amplification stages the repetition rate is reduced to 10 Hz using an electro-optic
selector consisting of a Pockels cell and a polarizer By inducing a suitable fast
switching electric field this combination allows the precise selection and separation of
pulses at a repetition rate of 10 Hz from the initial 80 MHz pulse train
The following amplification system consists of two multipass stages both using
TiSapphire crystals as gain medium pumped by frequency doubled Q-switched
NdYAG lasers (532 nm) In the first stage the seed pulses make eight passes through
the amplifying medium and are amplified to a pulse energy of about 1 mJ
(amplification by a factor of approximately 106
- 107) The second stage is a four-pass
power amplifier To obtain homogeneous pumping two lasers pumping from both sides
of the amplifying medium are applied After four passes in the second crystal the pulse
energy pulse is increased to about 200 mJ (amplification by a factor of approximately
100) Finally the amplified pulses enter the compressor The compressor contains again
gratings as dispersive elements to recompress the pulse to the desired pulse duration If
the compressor is operated under vacuum a maximum energy per pulse of 150 mJ with
a minimum pulse duration of about 45 fs can be achieved In the experiments discussed
here the compressor is operated in air and the pulse duration is adjusted to
approximately 120 - 150 fs With this duration self-phase-modulation (and self-
focusing) in air can be avoided and the pulse properties (spectrum spatial beam profile)
are not deteriorated during propagation
2 Optimization of a laser-plasma based X-ray source
10
Fig 22 The principle scheme of the laser system
The time-structure of the final output pulses was measured a third-order
autocorrelator (fs- to ps-time-range) The amplified laser pulse exhibits a relative
intensity of about 10-7
(ie contrast ratio of 107) approximately 1 ps ahead of the pulse
maximum and the contrast ratio to the amplified spontaneous emission (ASE) is 108 [139]
Due to such a high-contrast ratio the pre-plasma formation caused by laser pulse itself
is negligible in the experiments presented later
The key parameters of the laser system are summarized in the table 21 below
central wavelength 800 nm
spectral width 21 nm
min pulse duration 45 fs
in air pulse duration 120 150 fs
maximum pulse energy 150 mJ
contrast ratio at 1 ps 10-7
ASE 10-8
repetition rate 10 Hz
beam diameter (FWHM) 25 mm
Table 21 Key parameters of the 10 Hz laser system
The stability of the laser system ie energy and pointing stability is very
important for the experiments presented in this thesis Energy and pointing stability
were recorded and analyzed pulse-to-pulse over a few hours by U Shymanovich [140]
2 Optimization of a laser-plasma based X-ray source
11
Typical values under normal working conditions are less than 100 microrad pulse-to-pulse
pointing instability and 25 rms energy fluctuations
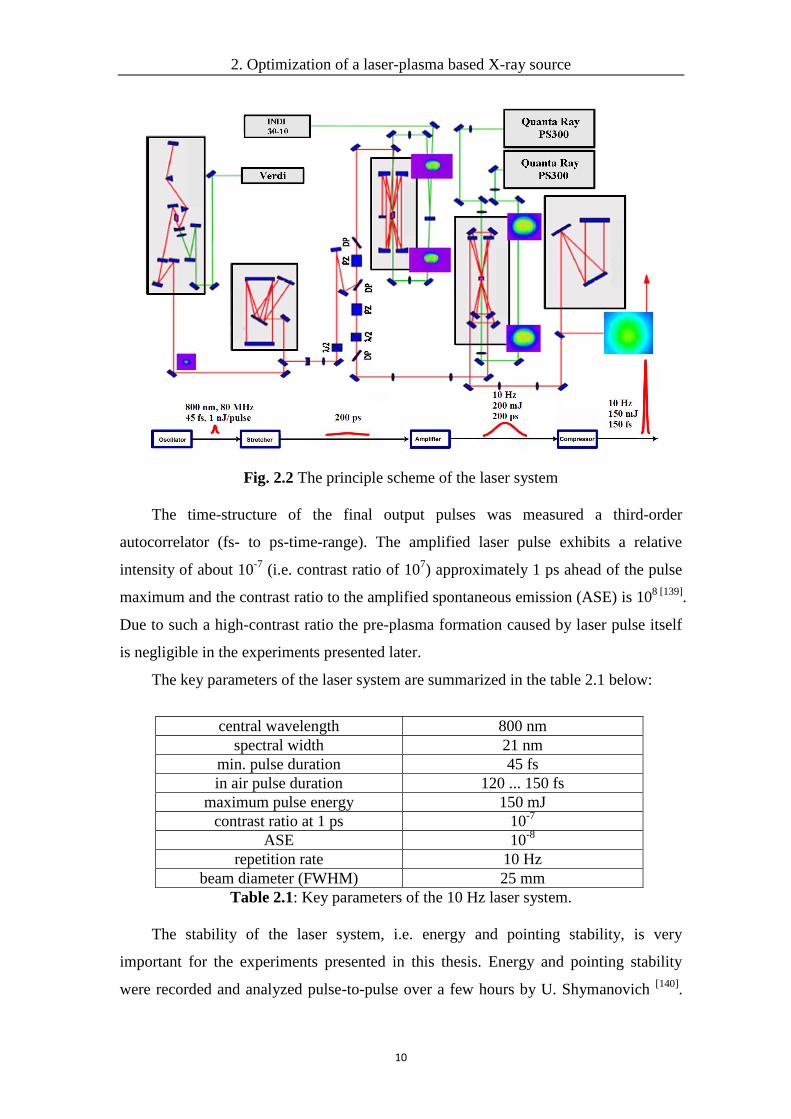
23 Experimental setup
Fig 23 Schematic of the experimental setup for Koptimization
All the works presented in this thesis were done with a few different experimental
setups For the investigation of the Kα production a setup as schematically shown in
Fig 23 was used The 25 mm diameter (FWHM) p-polarized laser beam was reflected
from a mirror with a 5 mm diameter hole in its center that allowed transmission of a
small part of the beam The transmitted part was time delayed with a variable delay
line and recombined with the main laser beam using a second apertured mirror The
combined p-polarized laser beams were focused with a 30 cm focal length lens onto the
target surface This lens could be accurately translated along the direction of the laser
beam propagation to change the focusing conditions ie the focus size on the target
Two PIN photodiodes one for recording the incident energy and another for the
reflected energy were used to measure the reflectivity from which the absorption of
the laser energy can be deduced By using a microscope objective combined with a
CCD camera the focal spot sizes of main and pre-pulse were measured as ~ 20 μm and
~ 70 μm FWHM respectively The focal area of the pre-pulse is about 12 times bigger
than that of the main pulse and both pulses can be adjusted to spatially overlap well at
all delay times The angle of incidence was varied by rotating the target For each
specific angle the laser intensity was kept constant by adjusting the laser energy The
targets were mounted on a motorized XYZ translation unit and moved between
2 Optimization of a laser-plasma based X-ray source
12
consecutive laser pulses to provide a fresh surface for each pulse In these experiments
four kinds of targets were used 300 nm Cu and Ti films coated on a glass substrate and
20 μm Cu and Ti foils glued onto a glass substrate
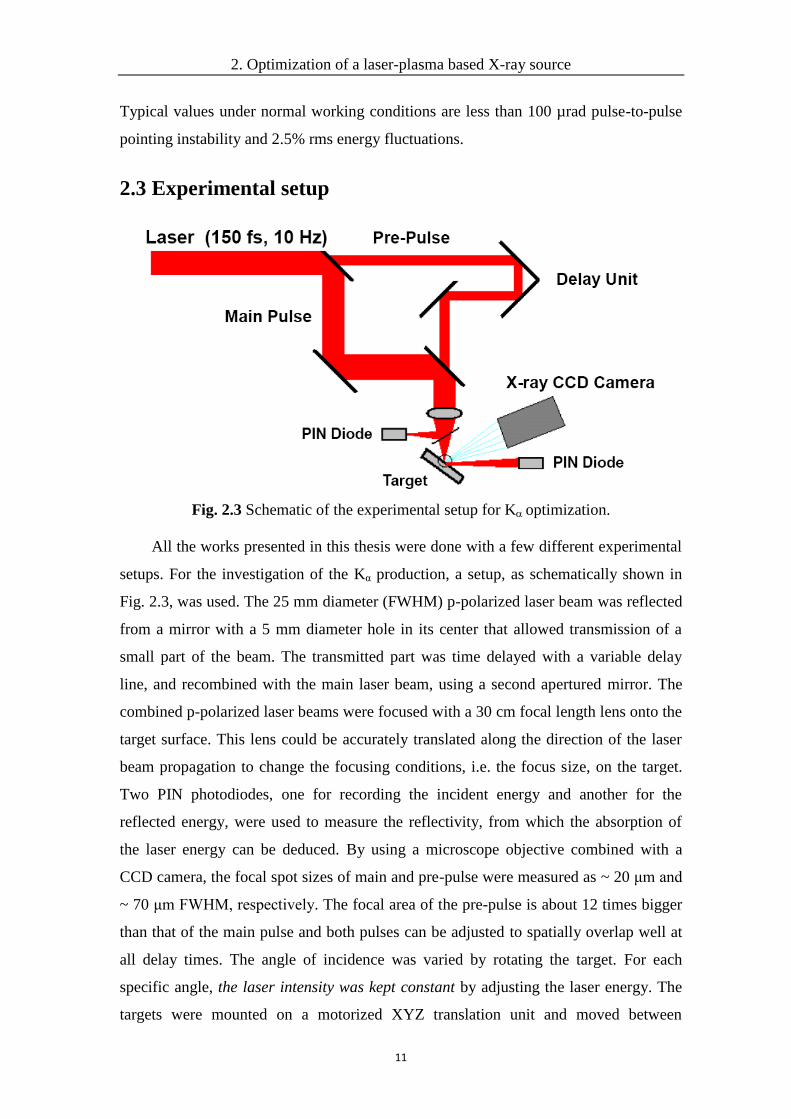
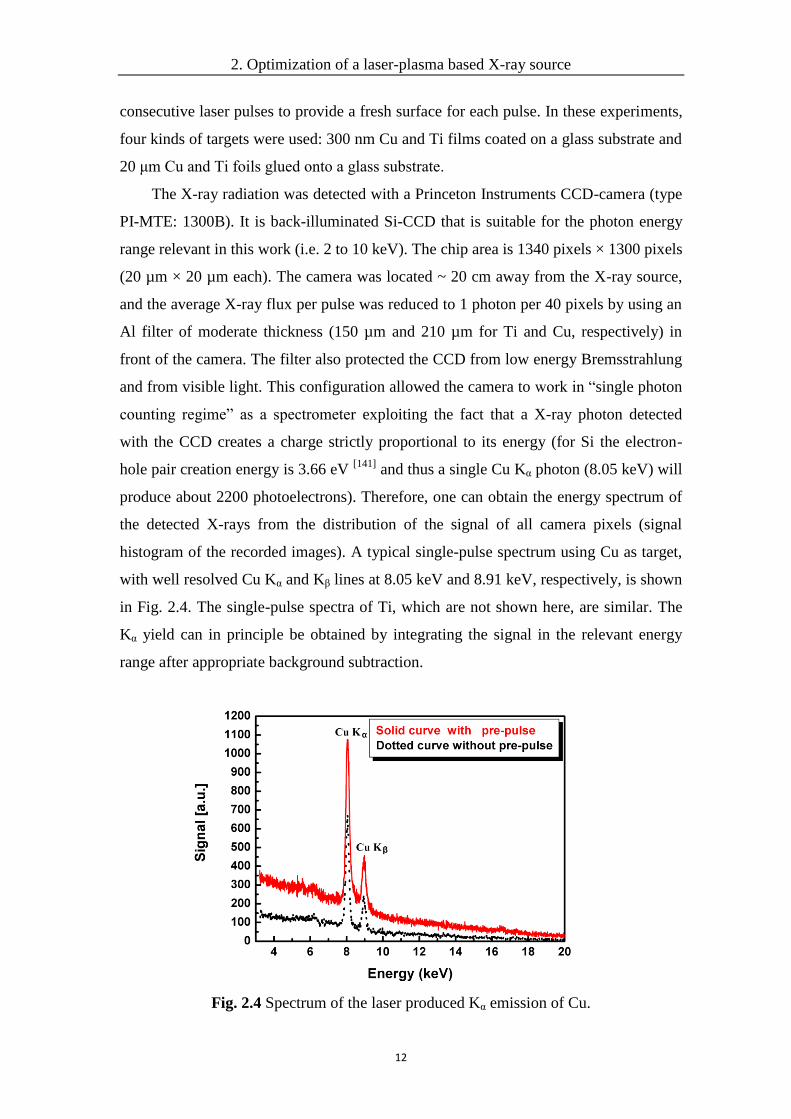
The X-ray radiation was detected with a Princeton Instruments CCD-camera (type
PI-MTE 1300B) It is back-illuminated Si-CCD that is suitable for the photon energy
range relevant in this work (ie 2 to 10 keV) The chip area is 1340 pixels times 1300 pixels
(20 microm times 20 microm each) The camera was located ~ 20 cm away from the X-ray source
and the average X-ray flux per pulse was reduced to 1 photon per 40 pixels by using an
Al filter of moderate thickness (150 microm and 210 microm for Ti and Cu respectively) in
front of the camera The filter also protected the CCD from low energy Bremsstrahlung
and from visible light This configuration allowed the camera to work in ldquosingle photon
counting regimerdquo as a spectrometer exploiting the fact that a X-ray photon detected
with the CCD creates a charge strictly proportional to its energy (for Si the electron-
hole pair creation energy is 366 eV [141]
and thus a single Cu Kα photon (805 keV) will
produce about 2200 photoelectrons) Therefore one can obtain the energy spectrum of
the detected X-rays from the distribution of the signal of all camera pixels (signal
histogram of the recorded images) A typical single-pulse spectrum using Cu as target
with well resolved Cu Kα and Kβ lines at 805 keV and 891 keV respectively is shown
in Fig 24 The single-pulse spectra of Ti which are not shown here are similar The
Kα yield can in principle be obtained by integrating the signal in the relevant energy
range after appropriate background subtraction
Fig 24 Spectrum of the laser produced Kα emission of Cu
2 Optimization of a laser-plasma based X-ray source
13
However to determine the absolute Kα yield of the source it has to be considered
that a single X-ray photon not always generates charge in only a single CCD pixel but
that the generated charge may be distributed over many pixels (many-pixel-
events)[142]
This distorts the measured spectra and leads to an underestimation of the
Kα yield since a many-pixel-event created by a single Kα-photon is detectedcounted
as several photons of apparently lower energy For Ti and Cu Kα radiation the spatially
largest events involve 4 pixels as reported in Ref [142] In order to determine the
percentage of single-pixel events in the detection system a few images were randomly
sampled from all the measured data and analyzed in detail It was found that about 50
of all detected Kα-photons generated single-pixel events while the other 50 were 2-
3- and 4-pixel events (the number of events involving 5 and more pixels was
negligible) Therefore a correction factor of 2 was applied to the number of detected
Kα-photons determined from the integration of the spectra To derive from this the
absolute Kα yield the transmission of the Al filters as well as the quantum efficiency of
the CCD (18 at 8 keV 55 at 45 keV) [143]
was taken into account Moreover it was
assumed that the X-ray emission is isotropic into the full solid angle
24 Optimization of Kα X-ray emission by adjusting the laser
intensity
In this section the experimental results concerning the optimization of the Kα X-
ray emission are presented Two key factors namely laser intensity and the pre-plasma
scale length were varied to study their influence on the Kα yield
As mentioned in section 21 to efficiently ionize the K-shell electrons of the target
material which in turn lead to an efficient X-ray emission hot electrons with the
appropriate kinetic energy should be produced The kinetic energy of these hot
electrons is strongly dependent on the accelerating laser field Therefore the laser
intensity is one of the key factors to control and optimize the Kα generation The
average energy of the accelerated electrons often described by an effective ldquohotrdquo
electron temperature Th generally relates to the pondermotive potential of the laser
field and follows a power scaling law Th ~ (Iλ2)13
[144 145]
as observed in many
experiments [115 146-148]
and also found with PIC simulations [119]
For optimum Kα
emission the average electron energy should be a few times the K-shell ionization
energy depending on the geometry of the target and the atomic number [121 129 137
2 Optimization of a laser-plasma based X-ray source
14
149]With this condition the laser intensity for optimum Kα production can be estimated
For example to maximize the yield of Cu Kα (805 keV) radiation the average electron
energy should be between 25 keV and 50 keV [120 121 129 148 150 151]
With the mentioned
empirical scaling law Th ~ (I0λ2)13
this average electron energy corresponds to a laser
intensity of a few times 1017
Wcm2 at a laser wavelength of 800 nm
[120 121 137] For Ti
the predicted optimum laser intensity is a few times 1016
Wcm2 [121 152]
With the given focal length (30 cm) a maximum laser intensity of
16 times 1017
Wcm2 can be achieved The laser intensity dependence is investigated by
varying the relative position of the laser focus with respect to the target surface In this
way the laser intensity on target changes while the pulse energy is kept constant No
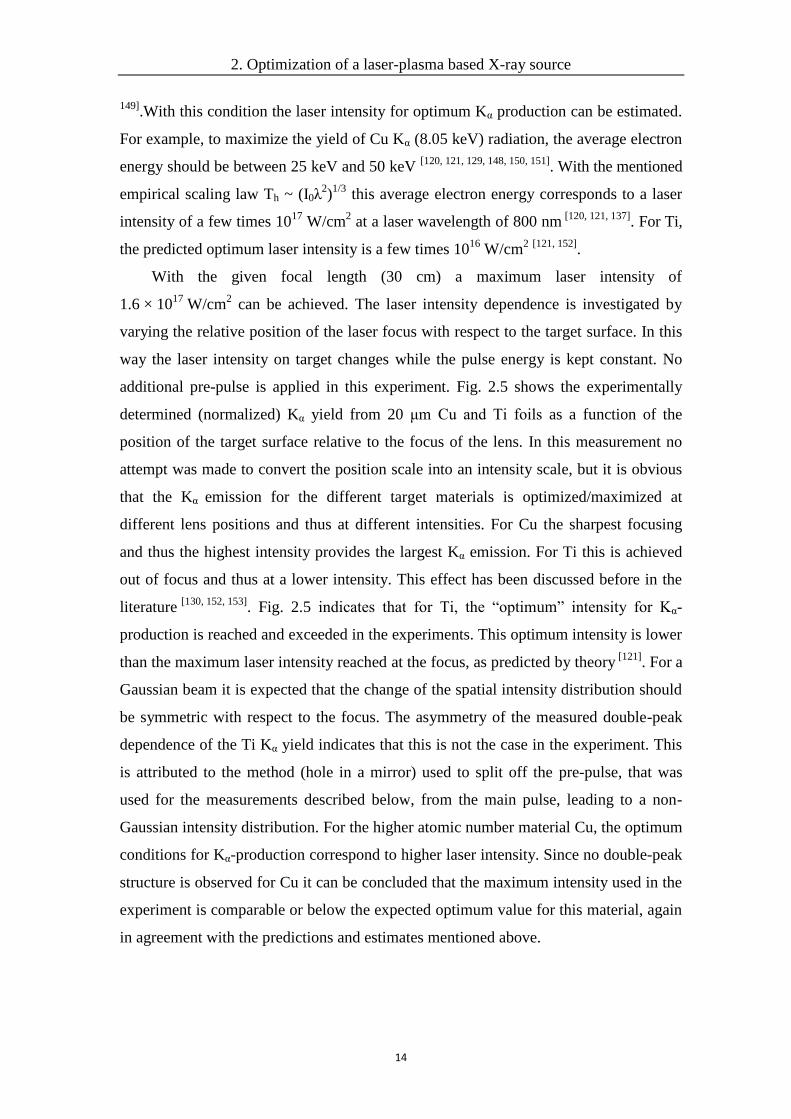
additional pre-pulse is applied in this experiment Fig 25 shows the experimentally
determined (normalized) Kα yield from 20 μm Cu and Ti foils as a function of the
position of the target surface relative to the focus of the lens In this measurement no
attempt was made to convert the position scale into an intensity scale but it is obvious
that the Kα emission for the different target materials is optimizedmaximized at
different lens positions and thus at different intensities For Cu the sharpest focusing
and thus the highest intensity provides the largest Kα emission For Ti this is achieved
out of focus and thus at a lower intensity This effect has been discussed before in the
literature [130 152 153]
Fig 25 indicates that for Ti the ldquooptimumrdquo intensity for Kα-
production is reached and exceeded in the experiments This optimum intensity is lower
than the maximum laser intensity reached at the focus as predicted by theory [121]
For a
Gaussian beam it is expected that the change of the spatial intensity distribution should
be symmetric with respect to the focus The asymmetry of the measured double-peak
dependence of the Ti Kα yield indicates that this is not the case in the experiment This
is attributed to the method (hole in a mirror) used to split off the pre-pulse that was
used for the measurements described below from the main pulse leading to a non-
Gaussian intensity distribution For the higher atomic number material Cu the optimum
conditions for Kα-production correspond to higher laser intensity Since no double-peak
structure is observed for Cu it can be concluded that the maximum intensity used in the
experiment is comparable or below the expected optimum value for this material again
in agreement with the predictions and estimates mentioned above
2 Optimization of a laser-plasma based X-ray source
15
Fig 25 Kα emission as a function of the relative position of the
target surface of 20 μm Cu and Ti foils with respect to laser focus
The lines between the data points are only to guide the eye
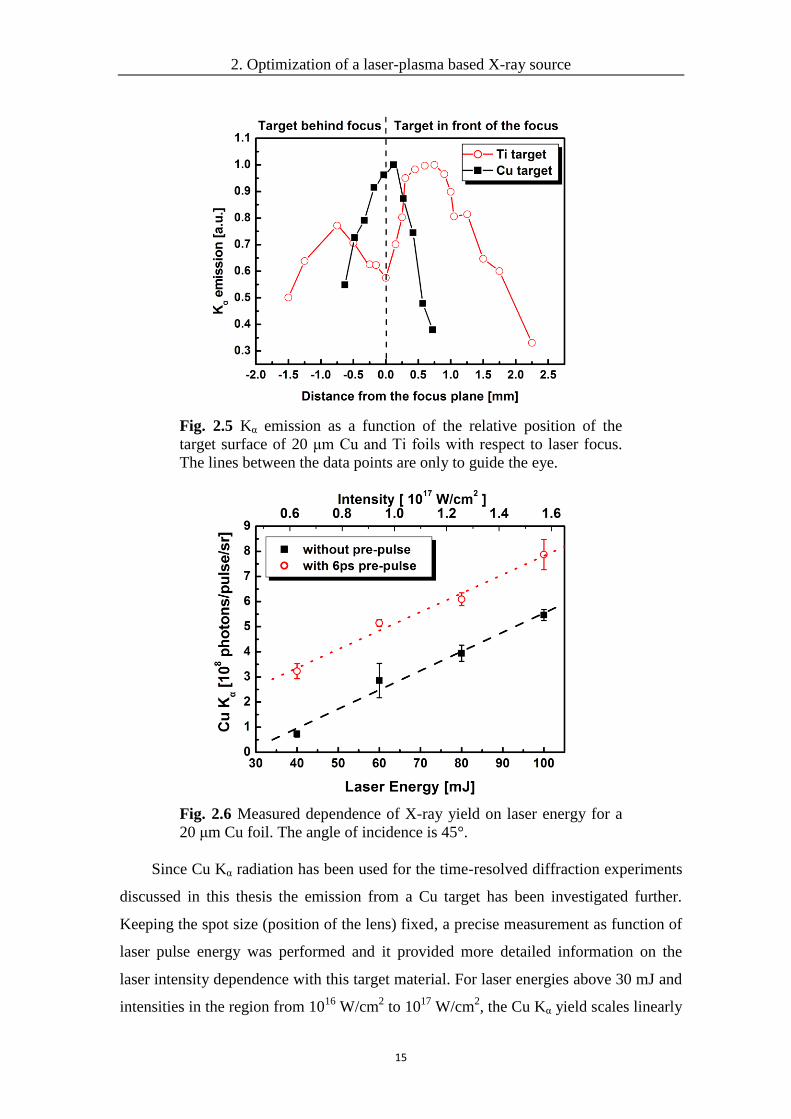
Fig 26 Measured dependence of X-ray yield on laser energy for a
20 μm Cu foil The angle of incidence is 45deg
Since Cu Kα radiation has been used for the time-resolved diffraction experiments
discussed in this thesis the emission from a Cu target has been investigated further
Keeping the spot size (position of the lens) fixed a precise measurement as function of
laser pulse energy was performed and it provided more detailed information on the
laser intensity dependence with this target material For laser energies above 30 mJ and
intensities in the region from 1016
Wcm2 to 10
17 Wcm
2 the Cu Kα yield scales linearly
2 Optimization of a laser-plasma based X-ray source
16
with laser energyintensity - Fig 26 There has been no evidence of saturation in
agreement with theoretical calculations which predict an optimum intensity for Cu Kα-
production of a few times 1017
Wcm2 [121 137]
Additionally a data set with a controlled
pre-pulse arriving 6 ps before the main pulse is also presented in this figure An
obvious improvement in the Kα-production is observed A detailed discussion of this
effect will be presented in the next section The maximum absolute yield obtained in
this measurement is in line with other reported Cu Kα sources [107 148 154 155]
25 Optimization of Kα X-ray emission by using a controlled
pre-plasma
Another approach for optimization of the Kα emission is to improve the energy
conversion efficiency from the laser pulse to electrons and subsequently to Kα photons
The dominant absorption mechanism at laser intensities around 1017
Wcm2
is expected
to be resonance absorption (RA) [116 121 131 133 152 156-158]
The crucial parameter for the
efficiency of the energy transfer for this mechanism is the plasma density scale length
at the time when the maximum pulse intensity is reached Assuming isothermal plasma
expansion an exponential electron density profile )exp()( 0 Lxnxn ee is
produced [159]
and the plasma density scale length L is defined as ee nnL Since
the plasma expands with a typical velocity of ~106ndash10
7 cms
[160-162] the time interval
between the plasma-formation threshold and the maximum intensity largely determines
the scale length seen by the pulse during the interaction Therefore the conversion
efficiency in this case is very sensitive to the temporal structure of the rising edge of the
laser pulse For this reason control over the time structure of the pulse provided by the
laser system becomes important to control the Kα emission An important parameter of
the laser pulse time structure is the contrast ratio defined as the ratio of intensity of the
pulse at the maximum and pre-pulsesbackground before the main pulse In some
previous work [130 148 152 156]
using laser systems with low contrast ratio pre-pulses
andor amplified spontaneous emissions (ASE) usually cause plasma formation long
before the peak of the pulse reaches the target Such long pre-plasma scale lengths
provided by the laser systems already lead to strong absorption making additional
improvements difficult However relying for a particular laser system only on its
inherent pre-pulse for ldquooptimizationrdquo is hardly satisfactory because the scale length will
rarely be optimized and matched to other parameters On the other hand with a very
2 Optimization of a laser-plasma based X-ray source
17
high contrast laser system it has already been demonstrated that introducing a pre-
formed plasma using a weak artificial pre-pulse can increase the conversion efficiency
of the X-ray yield from laser produced plasmas [118 137 163-167]
(this effect is also visible
in Fig 26) Therefore systematic investigations of the plasma scale length
requirements for different experimental conditions are necessary In this section the
mechanism of the resonance absorption will first be explained Then the experimental
results are presented followed by their discussion
251 The resonance absorption (RA) and its optimum
condition
The resonance absorption occurs when an electromagnetic wave with p-
polarization (the electric field in the plane of incidence) is obliquely incident in an
unmagnetized inhomogeneous plasma In this process the electromagnetic wave
couples with the electron plasma wave at the region of critical density (defined as
nc=22 4 em L where m and e are the charge and the mass of the electron respectively
and L the angular frequency of the laser light) where the local electron plasma
frequency equals the incident wave frequency There the energy is effectively
transferred from the incident electromagnetic wave to electron plasma wave and the
electron plasma wave can be resonantly enhanced As the electron plasma wave grows
nonlinear wave-breaking [168 169]
can lead to the consequent production of hot
electrons
2 Optimization of a laser-plasma based X-ray source
18
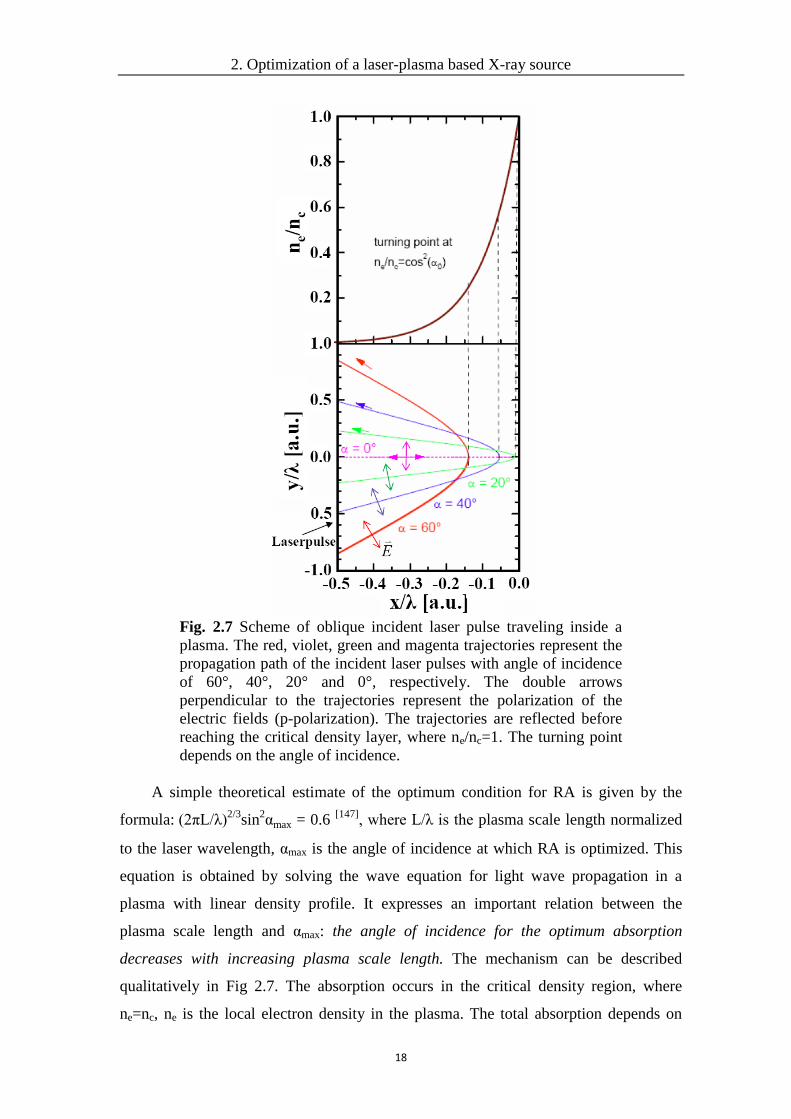
Fig 27 Scheme of oblique incident laser pulse traveling inside a
plasma The red violet green and magenta trajectories represent the
propagation path of the incident laser pulses with angle of incidence
of 60deg 40deg 20deg and 0deg respectively The double arrows
perpendicular to the trajectories represent the polarization of the
electric fields (p-polarization) The trajectories are reflected before
reaching the critical density layer where nenc=1 The turning point
depends on the angle of incidence
A simple theoretical estimate of the optimum condition for RA is given by the
formula (2πLλ)23
sin2αmax = 06
[147] where Lλ is the plasma scale length normalized
to the laser wavelength αmax is the angle of incidence at which RA is optimized This
equation is obtained by solving the wave equation for light wave propagation in a
plasma with linear density profile It expresses an important relation between the
plasma scale length and αmax the angle of incidence for the optimum absorption
decreases with increasing plasma scale length The mechanism can be described
qualitatively in Fig 27 The absorption occurs in the critical density region where
ne=nc ne is the local electron density in the plasma The total absorption depends on
2 Optimization of a laser-plasma based X-ray source
19
how large the field driving the resonance is at the layer of critical density This field is
firstly determined by the angle of incidence because only the field component along the
density gradient which varies as sinα contributes to the excitation of electron plasma
wave Secondly since the refractive index of the plasma in the undercritical region
decreases with increasing density (ie Drude-model) an obliquely incident light wave is
refracted towards regions of lower density and reflected at a density lower than the
critical density (turning point) with ne= nccos2α
[147] Although the laser light wave
can propagate only up to turning point before it is specularly reflected some amount of
the light energy will tunnel into the critical density region and drive the resonance The
value of this driving field at the turning point can be estimated using the Airy function
solution [170]
and it decays exponentially depending on its travel distance as it penetrates
beyond the turning point Thus the resulting driving field at the layer of critical density
is a competition between maximization of the electric field component along the
density gradient and the distance of the field penetration beyond the turning point
Particularly in the situation of the experiments that will be presented later for a long
scale-length system (eg Lλ asymp 1) the turning point of a steep angle of incidence is
closer to the layer of critical density as one can see in the Fig 27 Although the field
component normal to the density gradient is weak in this case the short attenuation
distance to the critical density surface provides a stronger driving field than the one
with large angle of incidence which has large field components normal to the density
gradient but the field decay dramatically due to the large tunnel distance to reach the
critical density surface The stronger driving field at a small α (eg asymp 25deg) leads to the
stronger absorption than with a large α (eg asymp 55deg) On the other hand for a short scale-
length system (eg Lλ asymp 01) the positions of turning points of all incidences are all
close to the layer of critical density thus the attenuations of their driving fields due to
the tunnel distance are neglectable With increasing angle of incidence α (eg asymp 55deg)
the electromagnetic wave spends progressively more of its time near nc and the
excitation of the electron plasma wave at the critical density layer becomes more
efficient This leads to more efficient absorption than at small α (eg asymp 25deg)
2 Optimization of a laser-plasma based X-ray source
20
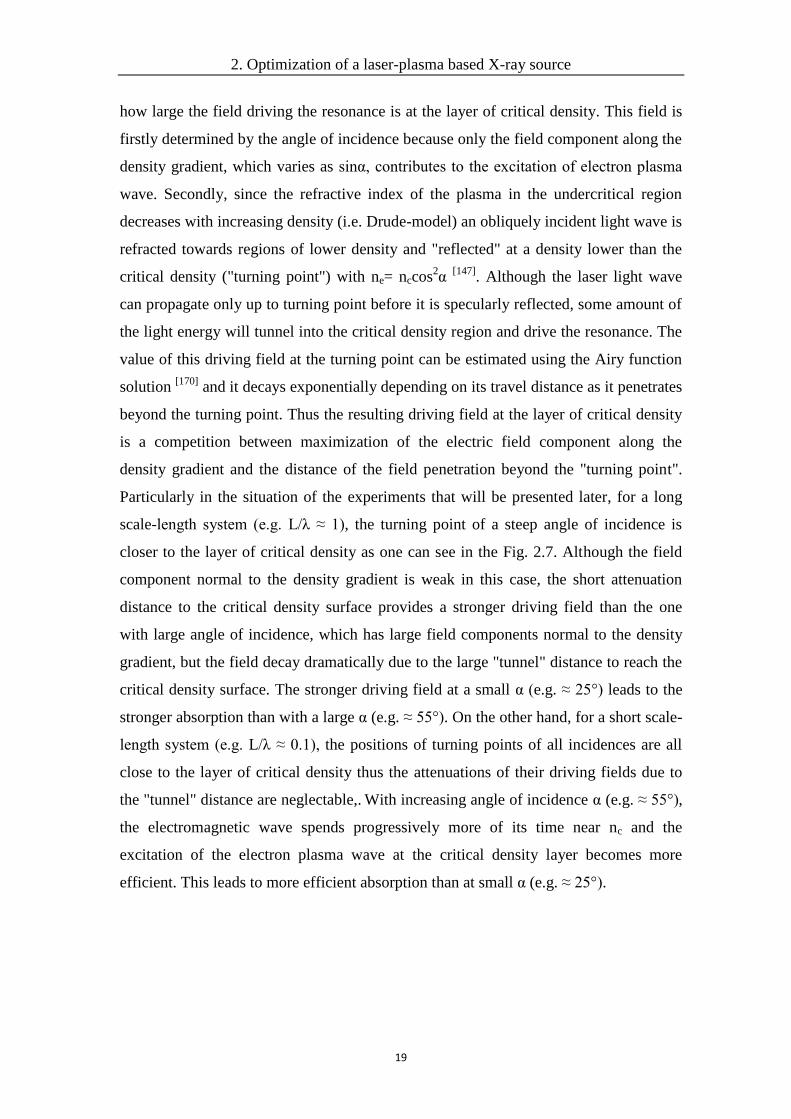
Fig 28 Plasma density profile for different times (a) arrival of the
pre-pulse (b) between pre- and main pulse and (c) when the main
pulse arrives
In order to establish a well defined plasma scale length in the work described later
the pre-plasma is produced by a laser pre-pulse arriving with a controllable delay before
the main laser pulse In Fig 28 a schematic of this arrangement is presented The pre-
pulse strikes the target surface and ionizes the material Subsequently the created
plasma starts to expand Assuming a constant expansion velocity Cs = (ZkTeM)12
the
plasma scale length L grows linearly in time according to L equiv Cst [171]
(Te is the
electron temperature determined by the pre-pulse intensity Z is the average ionization
degree k is the Boltzmann constant and M is the ion mass) After a certain time ∆t the
main pulse arrives and strikes on this pre-formed plasma with a specific density scale-
length L This scheme offers the possibility of actively manipulating and optimizing the
coupling efficiency hot electron distribution and thus the Kα emission With such a
precisely controlled pre-plasma the optimum conditions for RA discussed in this
section can be used to compare with the experimental conditions for which the Kα yield
is optimized in the following experiments
252 Experimental results
According to the results discussed in the previous section the experiments in this
chapter where performed under ldquooptimumrdquo focusing conditions The Cu targets were
placed exactly in the focus of the lens while the Ti targets were placed about 900 μm in
front of the focus These configurations lead to intensities on the Cu and Ti targets of
16 times 1017
Wcm2
(focus diameter ~20 μm FWHM) and 92 times 1016
Wcm2
(~25 μm
FWHM) for the main pulse and 20 times 1014
Wcm2
(~70 μm FWHM) and 11 times 1014
Wcm2 (~90 μm FWHM) for the pre-pulse respectively
2 Optimization of a laser-plasma based X-ray source
21
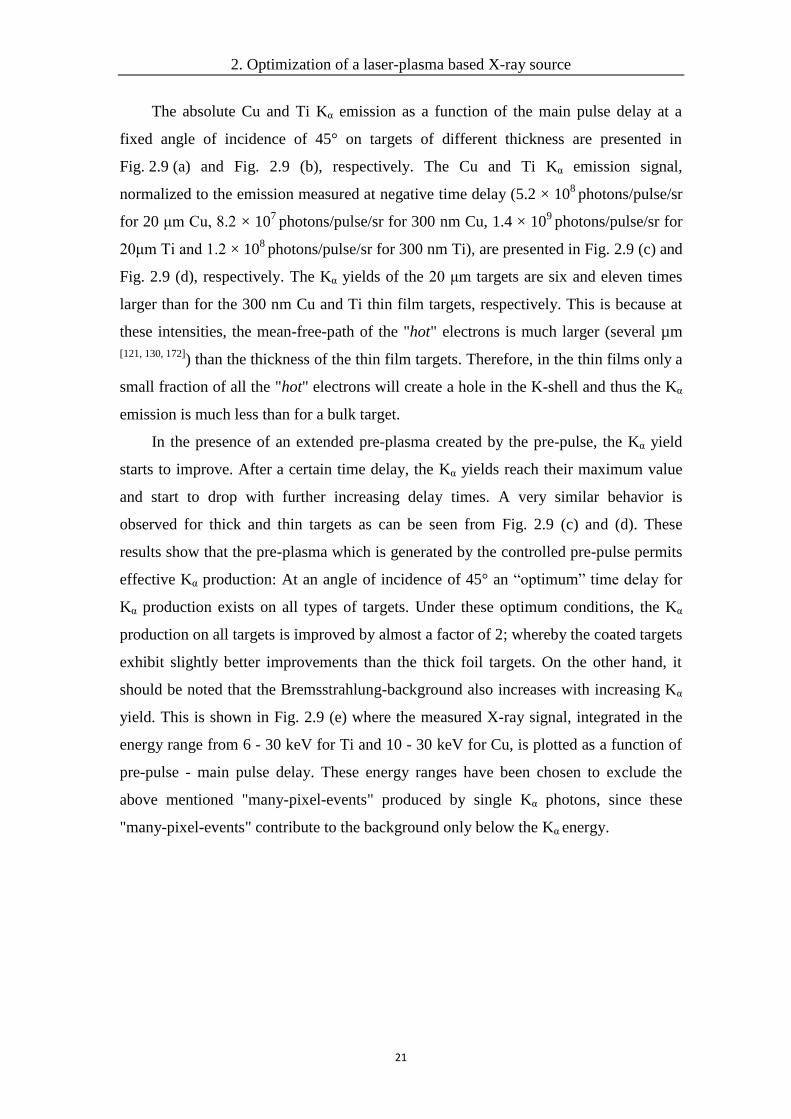
The absolute Cu and Ti Kα emission as a function of the main pulse delay at a
fixed angle of incidence of 45deg on targets of different thickness are presented in
Fig 29 (a) and Fig 29 (b) respectively The Cu and Ti Kα emission signal
normalized to the emission measured at negative time delay (52 times 108
photonspulsesr
for 20 μm Cu 82 times 107
photonspulsesr for 300 nm Cu 14 times 109
photonspulsesr for
20μm Ti and 12 times 108
photonspulsesr for 300 nm Ti) are presented in Fig 29 (c) and
Fig 29 (d) respectively The Kα yields of the 20 μm targets are six and eleven times
larger than for the 300 nm Cu and Ti thin film targets respectively This is because at
these intensities the mean-free-path of the hot electrons is much larger (several microm
[121 130 172]) than the thickness of the thin film targets Therefore in the thin films only a
small fraction of all the hot electrons will create a hole in the K-shell and thus the Kα
emission is much less than for a bulk target
In the presence of an extended pre-plasma created by the pre-pulse the Kα yield
starts to improve After a certain time delay the Kα yields reach their maximum value
and start to drop with further increasing delay times A very similar behavior is
observed for thick and thin targets as can be seen from Fig 29 (c) and (d) These
results show that the pre-plasma which is generated by the controlled pre-pulse permits
effective Kα production At an angle of incidence of 45deg an ldquooptimumrdquo time delay for
Kα production exists on all types of targets Under these optimum conditions the Kα
production on all targets is improved by almost a factor of 2 whereby the coated targets
exhibit slightly better improvements than the thick foil targets On the other hand it
should be noted that the Bremsstrahlung-background also increases with increasing Kα
yield This is shown in Fig 29 (e) where the measured X-ray signal integrated in the
energy range from 6 - 30 keV for Ti and 10 - 30 keV for Cu is plotted as a function of
pre-pulse - main pulse delay These energy ranges have been chosen to exclude the
above mentioned many-pixel-events produced by single Kα photons since these
many-pixel-events contribute to the background only below the Kα energy
2 Optimization of a laser-plasma based X-ray source
22
Fig 29 Kα emission as a function of main pulse delay at a fixed
angle of incidence of 45deg on targets of different thickness (a) Cu and
(b) Ti (c) Kα emission of Cu-targets normalized to the emission
measured at negative delay time (52 times 108
photonspulsesr and 82
times 107
photonspulsesr for d = 20 μm and 300 nm respectively) (d)
Kα emission of Ti-targets normalized to the emission measured at
negative delay time (14 times 109
photonspulsesr and 12 times 108
photonspulsesr for d = 20 μm and 300 nm respectively) (e) Hard
X-ray background signal as a function of main pulse delay on 20μm
targets
2 Optimization of a laser-plasma based X-ray source
23
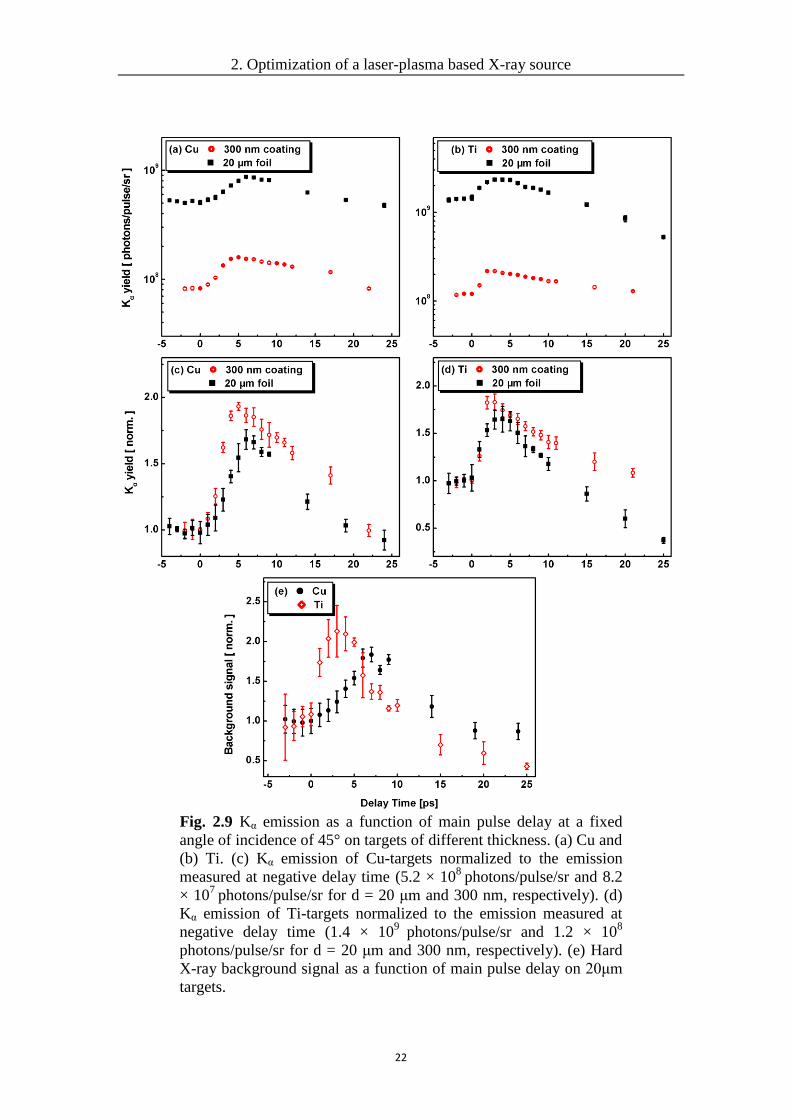
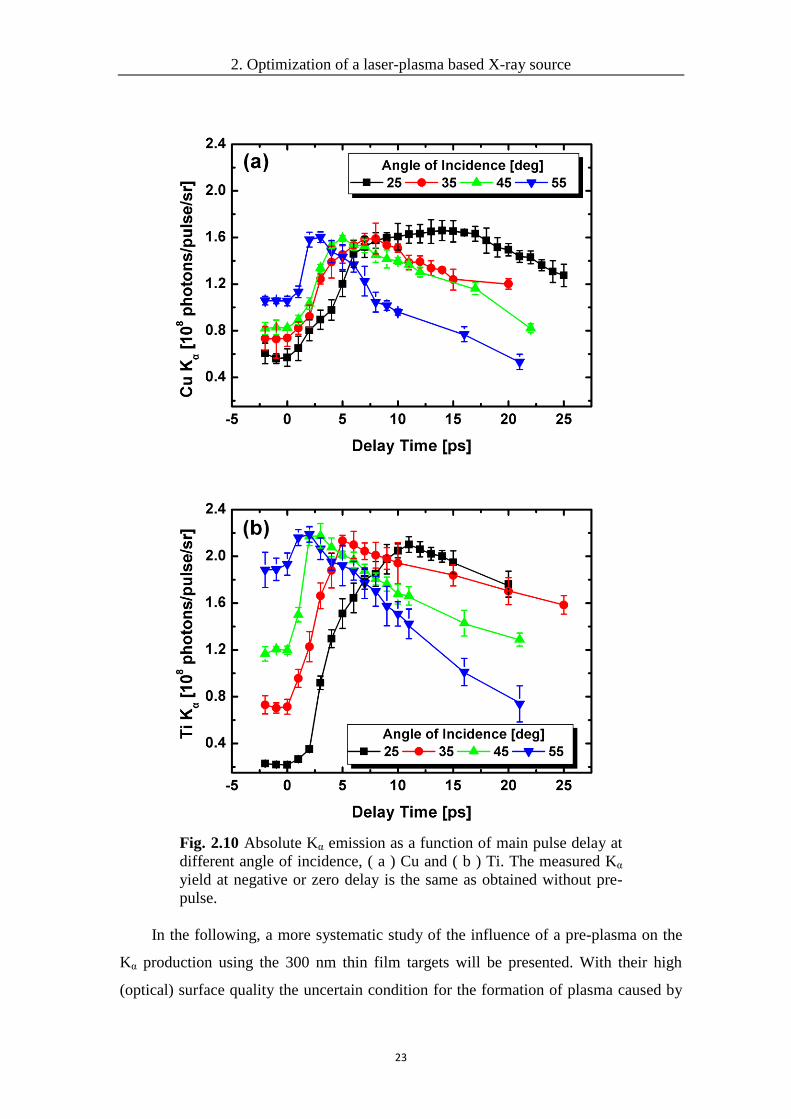
Fig 210 Absolute Kα emission as a function of main pulse delay at
different angle of incidence ( a ) Cu and ( b ) Ti The measured Kα
yield at negative or zero delay is the same as obtained without pre-
pulse
In the following a more systematic study of the influence of a pre-plasma on the
Kα production using the 300 nm thin film targets will be presented With their high
(optical) surface quality the uncertain condition for the formation of plasma caused by
2 Optimization of a laser-plasma based X-ray source
24
surface roughness can be avoided [173]
Based on the very similar behaviour of thin film
and bulk targets for the specific conditions of the measurements presented in Fig 29 it
is presumed that the results obtained on thin films which will be discussed below can
be transferred to thick targets (by scaling of the absolute yield) Fig 210 (a) and (b)
show the Cu and Ti Kα emission as a function of the main pulse delay at different
angles of incidence respectively Since the pre-pulse arrives after the main pulse and
thus does not play a role at negative delay time the X-ray yields obtained in this
situation will be refer to the situation as rdquowithout pre-pulserdquo in the later discussions
Introducing a pre-pulse results in an increase of the Kα yield which is particularly
important for small angles of incidence The Kα yield of both target elements exhibit
similar qualitative dependencies on delay time and angle of incidence though the Ti
target shows noticeably larger relative variations
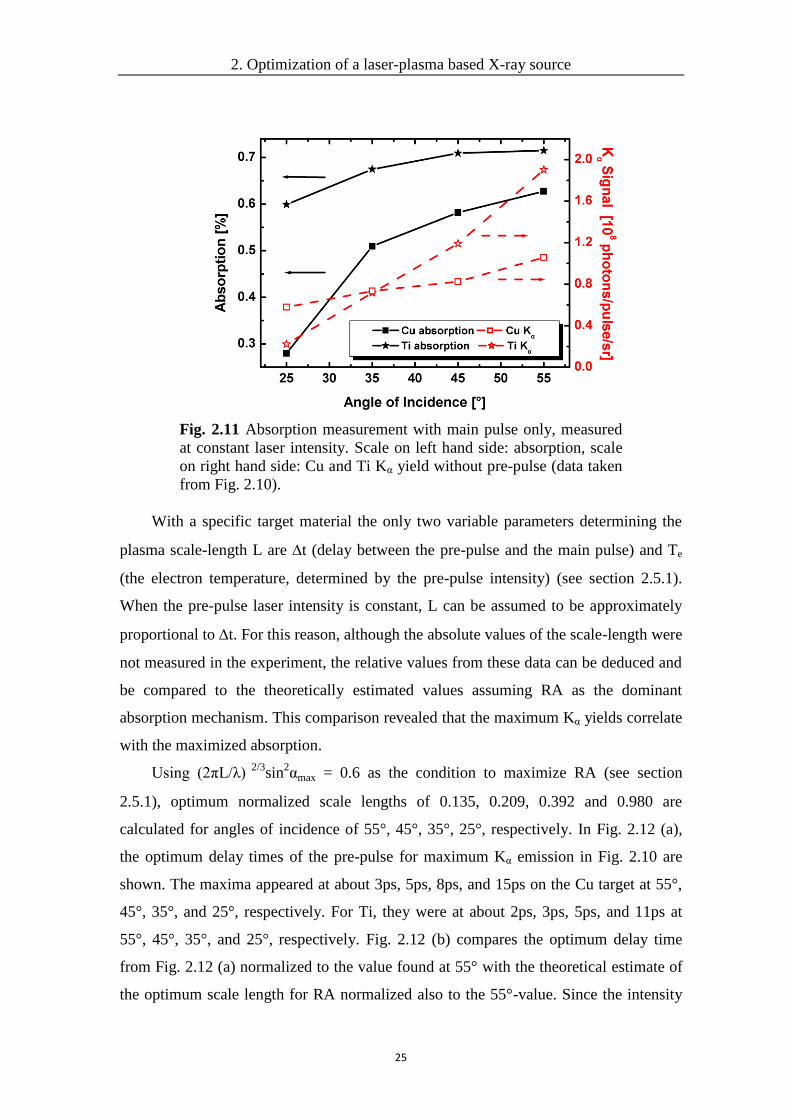
253 Discussion
Due to the high contrast ratio laser pulses used in the present experiment the
scale-length in the absence of the controlled pre-pulse will be very small With short
scale-lengths as already discussed in section 251 the maximum absorption occurs at a
large angle of incidence αmax typically 70deg or 80deg [147 174 175]
In such a case the
absorption should increase monotonically with the angle of incidence and this is
expected to result in an increase of the Kα yield In Fig 211 the measured absorption
of the main pulse and the Cu and Ti Kα yield without pre-pulse from Fig 210 are
presented together The measurement was carried out at constant laser intensity
(~16 times 1017
Wcm2
for Cu and ~92 times 1016
Wcm2 for Ti) With a sample thickness of
300 nm no light is transmitted Thus the absorption A can be simply determined from a
measurement of the reflectivity R using the two photodiodes shown in Fig 23 as
A = 1 - R As can be seen in Fig 211 the laser absorption does indeed increase with
the angle of incidence α for both target elements so do the Kα yields These
observations are in agreement with the previous works [147 174 175]
2 Optimization of a laser-plasma based X-ray source
25
Fig 211 Absorption measurement with main pulse only measured
at constant laser intensity Scale on left hand side absorption scale
on right hand side Cu and Ti Kα yield without pre-pulse (data taken
from Fig 210)
With a specific target material the only two variable parameters determining the
plasma scale-length L are t (delay between the pre-pulse and the main pulse) and Te
(the electron temperature determined by the pre-pulse intensity) (see section 251)
When the pre-pulse laser intensity is constant L can be assumed to be approximately
proportional to t For this reason although the absolute values of the scale-length were
not measured in the experiment the relative values from these data can be deduced and
be compared to the theoretically estimated values assuming RA as the dominant
absorption mechanism This comparison revealed that the maximum Kα yields correlate
with the maximized absorption
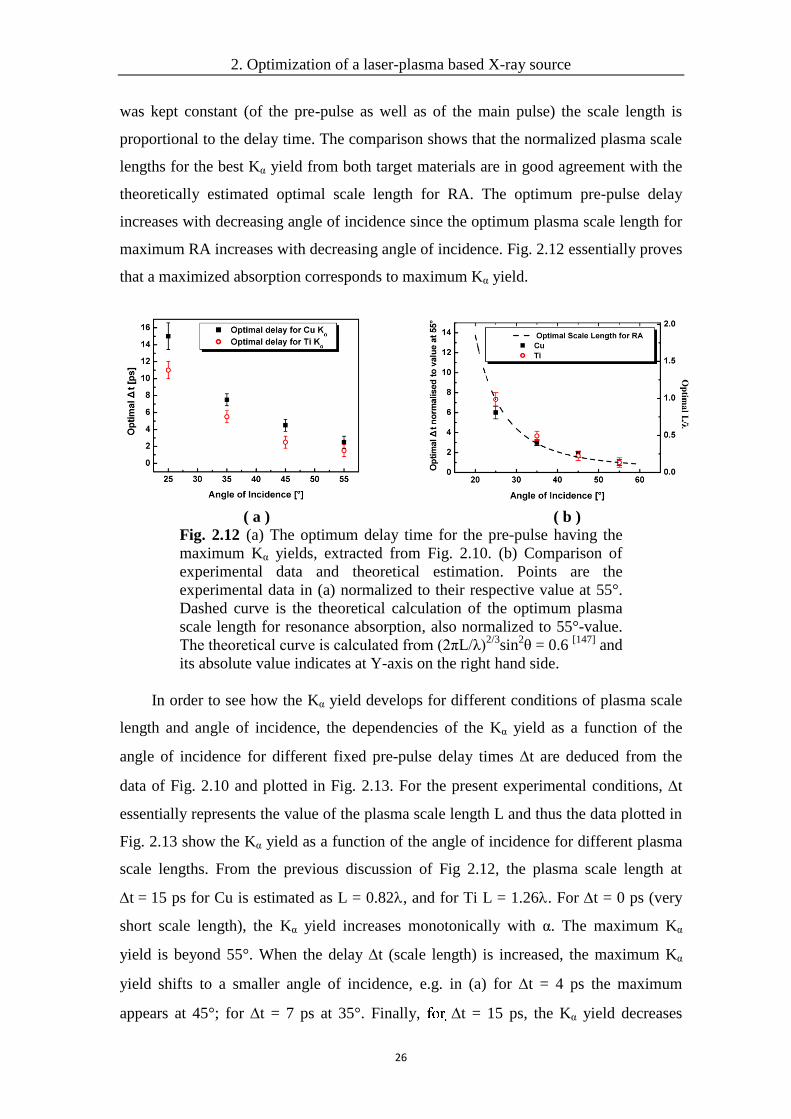
Using (2πLλ) 23
sin2αmax = 06 as the condition to maximize RA (see section
251) optimum normalized scale lengths of 0135 0209 0392 and 0980 are
calculated for angles of incidence of 55deg 45deg 35deg 25deg respectively In Fig 212 (a)
the optimum delay times of the pre-pulse for maximum Kα emission in Fig 210 are
shown The maxima appeared at about 3ps 5ps 8ps and 15ps on the Cu target at 55deg
45deg 35deg and 25deg respectively For Ti they were at about 2ps 3ps 5ps and 11ps at
55deg 45deg 35deg and 25deg respectively Fig 212 (b) compares the optimum delay time
from Fig 212 (a) normalized to the value found at 55deg with the theoretical estimate of
the optimum scale length for RA normalized also to the 55deg-value Since the intensity
2 Optimization of a laser-plasma based X-ray source
26
was kept constant (of the pre-pulse as well as of the main pulse) the scale length is
proportional to the delay time The comparison shows that the normalized plasma scale
lengths for the best Kα yield from both target materials are in good agreement with the
theoretically estimated optimal scale length for RA The optimum pre-pulse delay
increases with decreasing angle of incidence since the optimum plasma scale length for
maximum RA increases with decreasing angle of incidence Fig 212 essentially proves
that a maximized absorption corresponds to maximum Kα yield
( a ) ( b )
Fig 212 (a) The optimum delay time for the pre-pulse having the
maximum Kα yields extracted from Fig 210 (b) Comparison of
experimental data and theoretical estimation Points are the
experimental data in (a) normalized to their respective value at 55deg
Dashed curve is the theoretical calculation of the optimum plasma
scale length for resonance absorption also normalized to 55deg-value
The theoretical curve is calculated from (2πLλ)23
sin2θ = 06
[147] and
its absolute value indicates at Y-axis on the right hand side
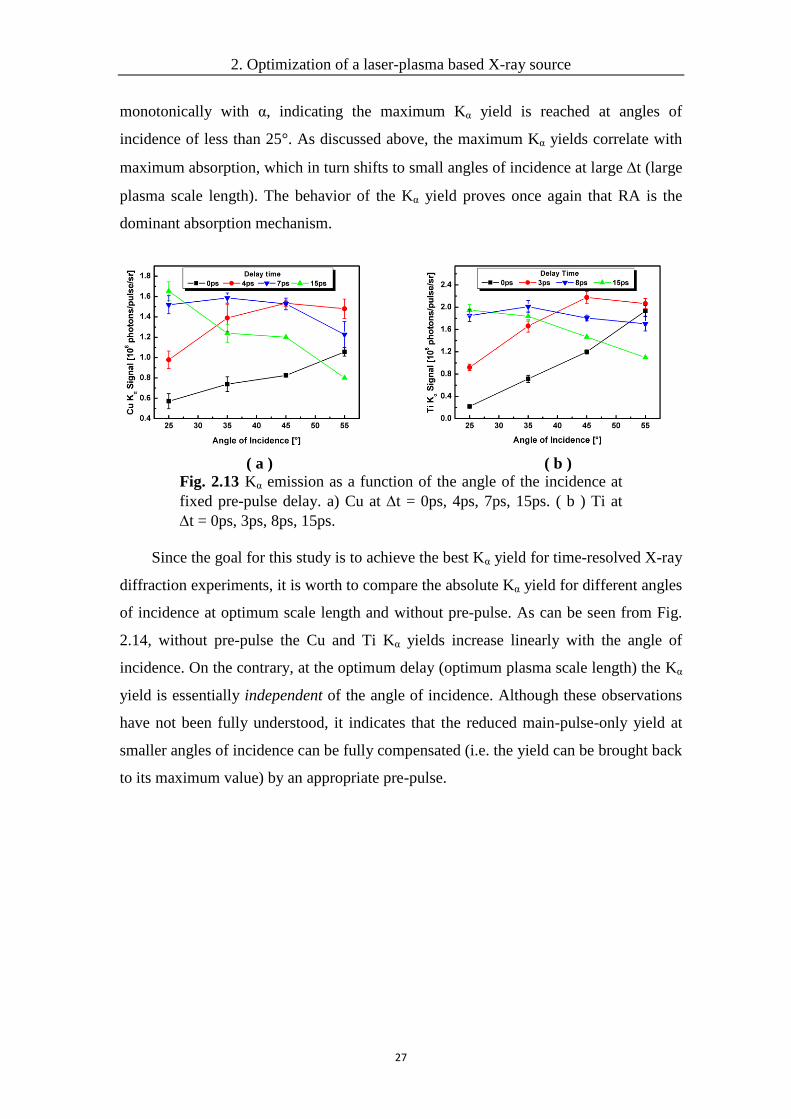
In order to see how the Kα yield develops for different conditions of plasma scale
length and angle of incidence the dependencies of the Kα yield as a function of the
angle of incidence for different fixed pre-pulse delay times t are deduced from the
data of Fig 210 and plotted in Fig 213 For the present experimental conditions t
essentially represents the value of the plasma scale length L and thus the data plotted in
Fig 213 show the Kα yield as a function of the angle of incidence for different plasma
scale lengths From the previous discussion of Fig 212 the plasma scale length at
t = 15 ps for Cu is estimated as L = 082 and for Ti L = 126 For t = 0 ps (very
short scale length) the Kα yield increases monotonically with α The maximum Kα
yield is beyond 55deg When the delay t (scale length) is increased the maximum Kα
yield shifts to a smaller angle of incidence eg in (a) for t = 4 ps the maximum
appears at 45deg for t = 7 ps at 35deg Finally t = 15 ps the Kα yield decreases
2 Optimization of a laser-plasma based X-ray source
27
monotonically with α indicating the maximum Kα yield is reached at angles of
incidence of less than 25deg As discussed above the maximum Kα yields correlate with
maximum absorption which in turn shifts to small angles of incidence at large t (large
plasma scale length) The behavior of the Kα yield proves once again that RA is the
dominant absorption mechanism
( a ) ( b )
Fig 213 Kα emission as a function of the angle of the incidence at
fixed pre-pulse delay a) Cu at t = 0ps 4ps 7ps 15ps ( b ) Ti at
t = 0ps 3ps 8ps 15ps
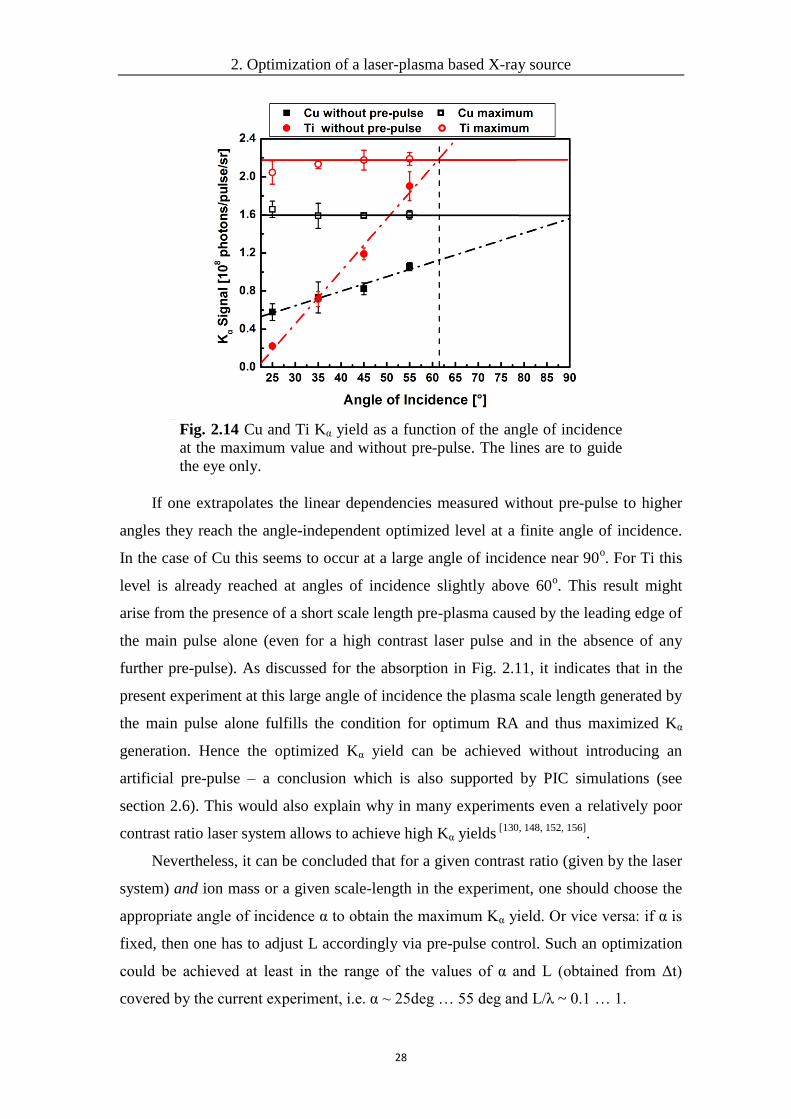
Since the goal for this study is to achieve the best Kα yield for time-resolved X-ray
diffraction experiments it is worth to compare the absolute Kα yield for different angles
of incidence at optimum scale length and without pre-pulse As can be seen from Fig
214 without pre-pulse the Cu and Ti Kα yields increase linearly with the angle of
incidence On the contrary at the optimum delay (optimum plasma scale length) the Kα
yield is essentially independent of the angle of incidence Although these observations
have not been fully understood it indicates that the reduced main-pulse-only yield at
smaller angles of incidence can be fully compensated (ie the yield can be brought back
to its maximum value) by an appropriate pre-pulse
2 Optimization of a laser-plasma based X-ray source
28
Fig 214 Cu and Ti Kα yield as a function of the angle of incidence
at the maximum value and without pre-pulse The lines are to guide
the eye only
If one extrapolates the linear dependencies measured without pre-pulse to higher
angles they reach the angle-independent optimized level at a finite angle of incidence
In the case of Cu this seems to occur at a large angle of incidence near 90o For Ti this
level is already reached at angles of incidence slightly above 60o This result might
arise from the presence of a short scale length pre-plasma caused by the leading edge of
the main pulse alone (even for a high contrast laser pulse and in the absence of any
further pre-pulse) As discussed for the absorption in Fig 211 it indicates that in the
present experiment at this large angle of incidence the plasma scale length generated by
the main pulse alone fulfills the condition for optimum RA and thus maximized Kα
generation Hence the optimized Kα yield can be achieved without introducing an
artificial pre-pulse ndash a conclusion which is also supported by PIC simulations (see
section 26) This would also explain why in many experiments even a relatively poor
contrast ratio laser system allows to achieve high Kα yields [130 148 152 156]
Nevertheless it can be concluded that for a given contrast ratio (given by the laser
system) and ion mass or a given scale-length in the experiment one should choose the
appropriate angle of incidence α to obtain the maximum Kα yield Or vice versa if α is
fixed then one has to adjust L accordingly via pre-pulse control Such an optimization
could be achieved at least in the range of the values of α and L (obtained from Δt)
covered by the current experiment ie α ~ 25deg hellip 55 deg and Lλ ~ 01 hellip 1
2 Optimization of a laser-plasma based X-ray source
29
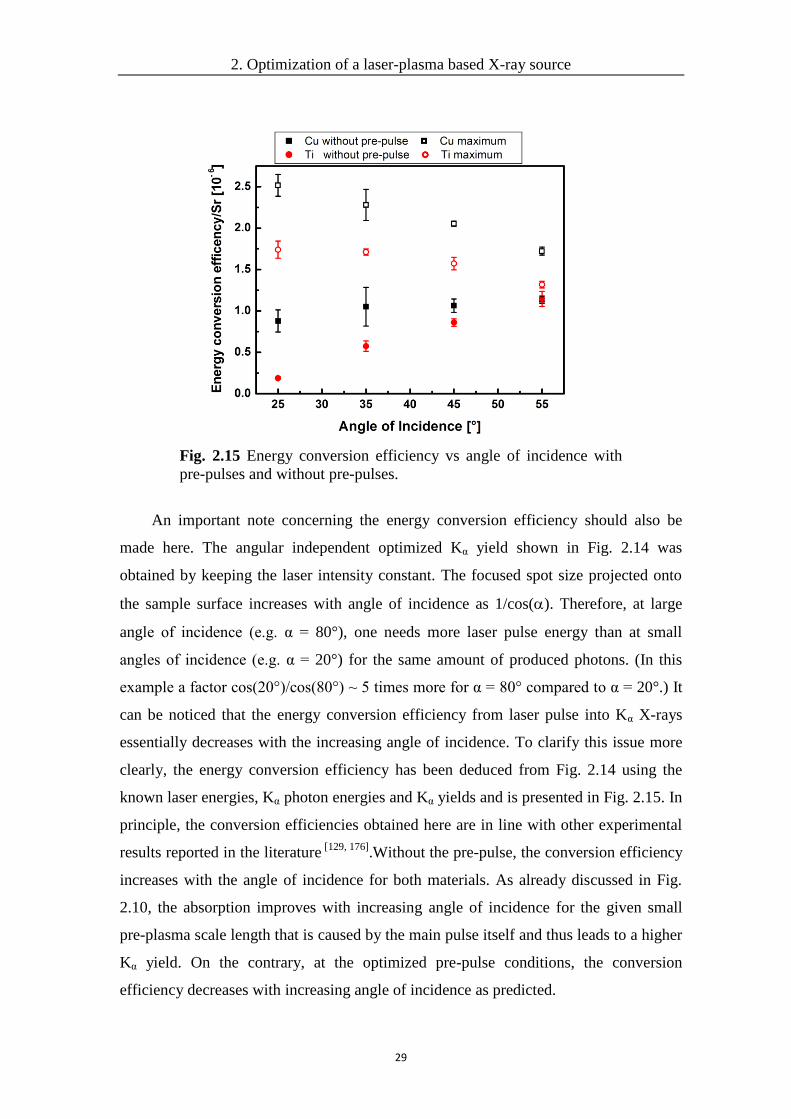
Fig 215 Energy conversion efficiency vs angle of incidence with
pre-pulses and without pre-pulses
An important note concerning the energy conversion efficiency should also be
made here The angular independent optimized Kα yield shown in Fig 214 was
obtained by keeping the laser intensity constant The focused spot size projected onto
the sample surface increases with angle of incidence as 1cos() Therefore at large
angle of incidence (eg α = 80deg) one needs more laser pulse energy than at small
angles of incidence (eg α = 20deg) for the same amount of produced photons (In this
example a factor cos(20deg)cos(80deg) ~ 5 times more for α = 80deg compared to α = 20deg) It
can be noticed that the energy conversion efficiency from laser pulse into Kα X-rays
essentially decreases with the increasing angle of incidence To clarify this issue more
clearly the energy conversion efficiency has been deduced from Fig 214 using the
known laser energies Kα photon energies and Kα yields and is presented in Fig 215 In
principle the conversion efficiencies obtained here are in line with other experimental
results reported in the literature [129 176]
Without the pre-pulse the conversion efficiency
increases with the angle of incidence for both materials As already discussed in Fig
210 the absorption improves with increasing angle of incidence for the given small
pre-plasma scale length that is caused by the main pulse itself and thus leads to a higher
Kα yield On the contrary at the optimized pre-pulse conditions the conversion
efficiency decreases with increasing angle of incidence as predicted
2 Optimization of a laser-plasma based X-ray source
30
26 Comparison of the experimental results with simulations
Particle-in-Cell simulations (PIC) are a very powerful and direct numerical tool for
modeling laser-plasma interactions [177-179]
In the PIC simulation the charged particles
(electrons ions neutrals molecules dust particles etc) are modeled as individual
macro-particles moving in non-physical grid across the plasma (the cell part of the
name) using Newtons laws and self-consistently calculated electric fields resulting
from external (applied) fields and internal fields from charge distributions By solving
the equations of motion of these particles the moments of the distribution of the
particles such as densities and currents can be obtained simultaneously The results of
PIC simulations presented in this section were preformed by M Mašek and P Gibbon
with whom we cooperated
To obtain a quantitative estimate of the Kα production this simulation consists of
two steps The energy distribution of hot electrons generated by the laser-plasma
interaction was first determined with PIC simulations Then the total Kα photon yields
produced by fast electrons going inside the target were calculated with a Monte-Carlo
method which is a stochastic technique using random numbers and probability
statistics to investigate mathematical or statistical problems [180]
The detailed PIC simulations were performed by using the 1D3V (1 spatial 3
velocity coordinates) code BOPS (Boosted Oblique Particle Simulation) [127 131]
which
can treat oblique incidence Up to 6000 spatial grids and 500000 electrons and ions are
used in the simulation The laser is p-polarized with fixed intensities as in the
experiments The initial plasma parameters were chosen as close as possible to those
expected in the experiment More details can be found in Ref [181]
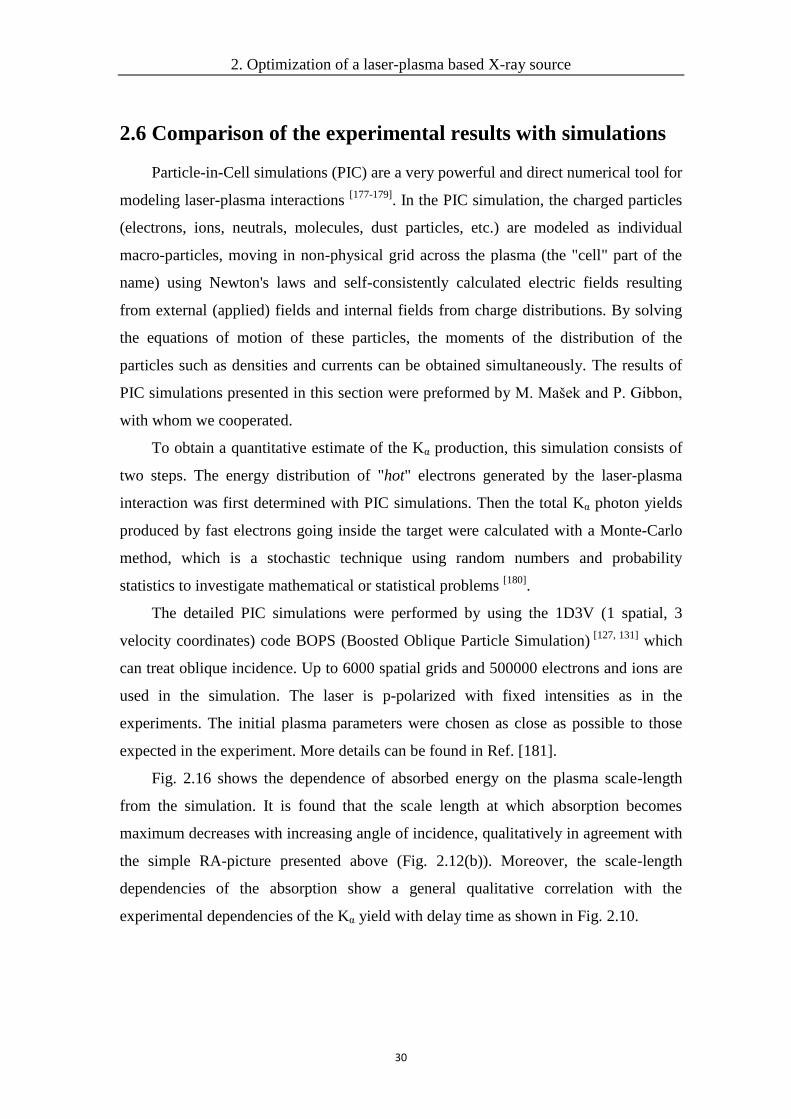
Fig 216 shows the dependence of absorbed energy on the plasma scale-length
from the simulation It is found that the scale length at which absorption becomes
maximum decreases with increasing angle of incidence qualitatively in agreement with
the simple RA-picture presented above (Fig 212(b)) Moreover the scale-length
dependencies of the absorption show a general qualitative correlation with the
experimental dependencies of the Kα yield with delay time as shown in Fig 210
2 Optimization of a laser-plasma based X-ray source
31
( a ) ( b )
Fig 216 The calculated absorbed energy as a function of the initial
plasma density scale length and incidence angle for Cu ( a ) and Ti
( b ) targets Pictures reproduced from Ref [181]
The total number of Kα photons generated by the hot electrons during their
propagation through the nonexcited solid material underneath the plasma layer was
calculated according to a standard cross section model using a method similar to Ref
[129 182] The electron distributions obtained from the PIC simulations are split into
several monoenergetic beams and transported through the foil which is divided into
several cells Using the relativistic K-shell ionization cross section [124]
the number of
generated Kα photons is calculated With the Monte-Carlo method each electron beam
is slowed down via collisions according to the Bethe stopping formula whereby the
stopping power is taken from the NIST database [183]
for both materials Once the
electron beam escapes from the rear of the target it is assumed to play no further role in
the Kα production a reasonable assumption because the foils were mounted on low-Z
(glass) substrates The reabsorption of Kα photons is also taken into account The
attenuation coefficient is taken also from the NIST database [184]
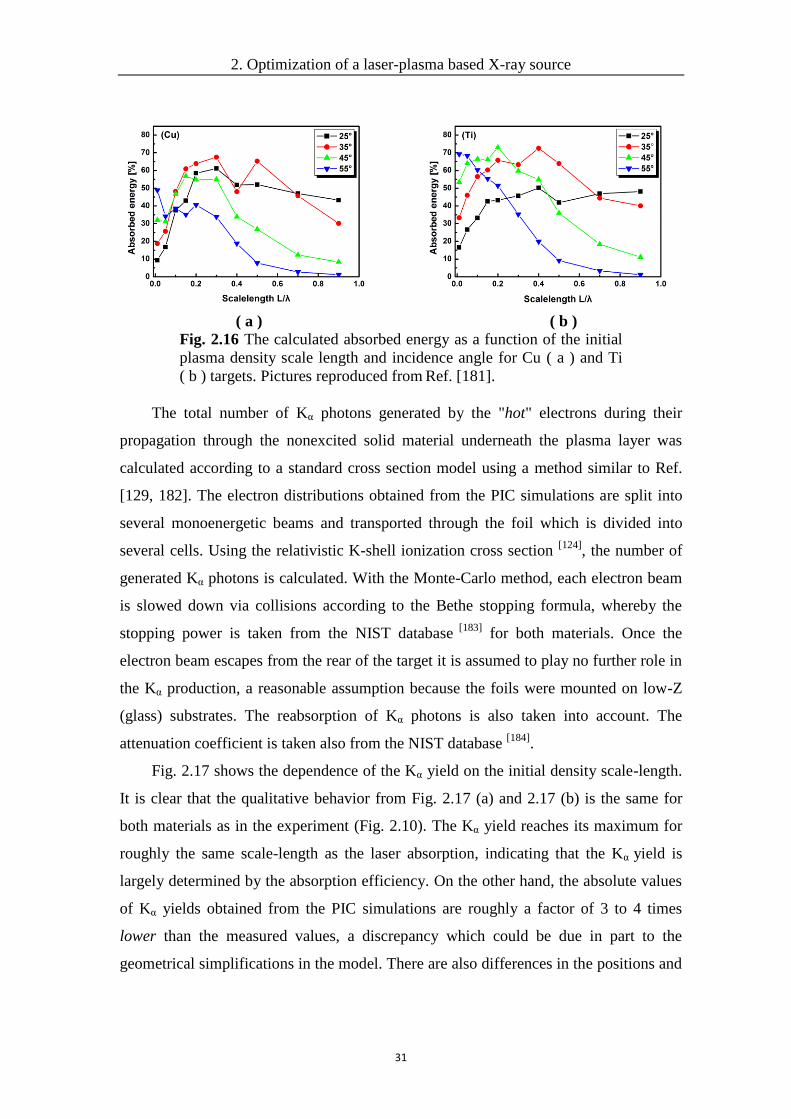
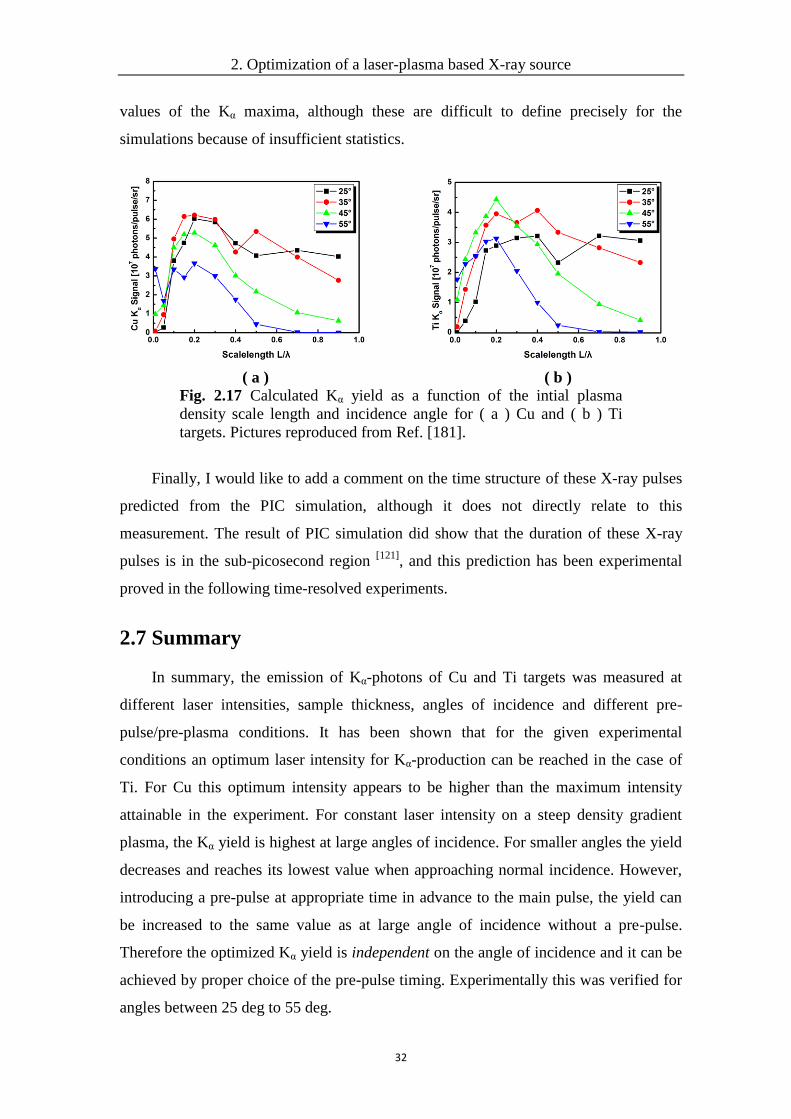
Fig 217 shows the dependence of the Kα yield on the initial density scale-length
It is clear that the qualitative behavior from Fig 217 (a) and 217 (b) is the same for
both materials as in the experiment (Fig 210) The Kα yield reaches its maximum for
roughly the same scale-length as the laser absorption indicating that the Kα yield is
largely determined by the absorption efficiency On the other hand the absolute values
of Kα yields obtained from the PIC simulations are roughly a factor of 3 to 4 times
lower than the measured values a discrepancy which could be due in part to the
geometrical simplifications in the model There are also differences in the positions and
2 Optimization of a laser-plasma based X-ray source
32
values of the Kα maxima although these are difficult to define precisely for the
simulations because of insufficient statistics
( a ) ( b )
Fig 217 Calculated Kα yield as a function of the intial plasma
density scale length and incidence angle for ( a ) Cu and ( b ) Ti
targets Pictures reproduced from Ref [181]
Finally I would like to add a comment on the time structure of these X-ray pulses
predicted from the PIC simulation although it does not directly relate to this
measurement The result of PIC simulation did show that the duration of these X-ray
pulses is in the sub-picosecond region [121]
and this prediction has been experimental
proved in the following time-resolved experiments
27 Summary
In summary the emission of Kα-photons of Cu and Ti targets was measured at
different laser intensities sample thickness angles of incidence and different pre-
pulsepre-plasma conditions It has been shown that for the given experimental
conditions an optimum laser intensity for Kα-production can be reached in the case of
Ti For Cu this optimum intensity appears to be higher than the maximum intensity
attainable in the experiment For constant laser intensity on a steep density gradient
plasma the Kα yield is highest at large angles of incidence For smaller angles the yield
decreases and reaches its lowest value when approaching normal incidence However
introducing a pre-pulse at appropriate time in advance to the main pulse the yield can
be increased to the same value as at large angle of incidence without a pre-pulse
Therefore the optimized Kα yield is independent on the angle of incidence and it can be
achieved by proper choice of the pre-pulse timing Experimentally this was verified for
angles between 25 deg to 55 deg
2 Optimization of a laser-plasma based X-ray source
33
It was also experimentally found and supported by simulations that the Cu and Ti
Kα generation follows the laser absorption as known for other materials [77 118 164 172
156 163 167] As expected resonance absorption (RA) has been proved to be the dominant
absorption mechanism in this process and optimization of the Kα production results
from a maximized absorption of the laser pulse For a high contrast laser system as
used in this experiment controlled pre-pulses provide well defined pre-plasma scale-
lengths allowing systematic investigation on the optimization of absorption Kα
production for the other given experimental conditions (material angle of incidence
pulse energy intensity) The simulations with these well defined initial parameters
show the qualitative agreement with experimental observations and provide insights
into the physical process of laser energy absorption hot electron generation electron
transport in the material and the resulting Kα generation
For practical purposes the present work indicates that for long plasma density
scale lengths created by the leading edge of a low contrast ratio laser system and other
experimental conditions (within the range Lλ ~ 01-10) the Kα emission from a laser
produced plasma could be optimized by operating the X-ray source at the matched
angle of incidence Experimental arrangements in which an unintentional (or
unavoidable) pre-pulse is present could probably be improved simply by using a small
angle of incidence instead of the 45deg geometry typical of many setups The present
study indicates that the X-ray emission could be increased by a factor of 2 or 3 in this
case with obvious advantages for many applications of fs-Kα sources such as time-
resolved X-ray diffraction (TRXD) On the other hand for a high contrast laser system
leading where the self generated plasma exhibits a steep density gradient (small scale
lenghth) these findings still suggest to use a small angle of incidence and a matched Δt
For the same value of Kα emission this requires less energy to achieve the same on-
target intensity as with a large angle of incidence and subsequently leads to a better
energy conversion efficiency
In the following chapter these results are applied to improve the laser-plasma
based X-ray source for the TRXD experiments
3 Improvement of the modular setup for time-resolved X-ray diffraction experiments
34
3 Improvements of the modular setup for
time-resolved X-ray diffraction experiments
As it has been discussed in detail in the previous chapter focused laser intensities
in the range of 1017
- 1018
Wcm2 are required to efficiently generate X-rays in the
multi-keV range If the irradiated target is surrounded by an atmosphere non-linear
effects (eg self-phase-modulation self-focusing [185]
) and plasma formation
(breakdown) in the atmosphere will severely deteriorate the spatial intensity
distribution of the focused femtosecond pulse and the required on-target intensities
cannot be reached Therefore the X-ray target has to be placed in vacuum Two
different set-ups to perform time-resolved X-ray diffraction are currently used at the
University of Duisburg-Essen One scheme uses a large vacuum chamber to place not
only the X-ray target but the whole setup (including X-ray optics samples and
detectors) under vacuum [70 140]
This scheme avoids absorption losses of the generated
X-rays in air (which is more critical for lower energy radiation like Ti K- 451 keV)
but it poses some geometrical restrictions due to its limited size Moreover operation of
the setup is relatively complicated since most of the components in the chamber require
remote control
To overcome some of these drawbacks a second scheme for time-resolved X-ray
diffraction experiments had been designed and built up mainly by Dr Matthieu Nicoul
[186] and since then it has been continually further developed This setup has a modular
design and only the X-ray sourcetarget itself is operated under vacuum and all the
other experimental components are placed in air This gives a lot of advantages such as
more space for experimental components and convenience in adjusting them It was the
aim of the work described in this chapter to improve the existing setup to allow for
time-resolved Bragg-diffraction experiments with increased accuracy (see chapter 5)
and to enable new experimental schemes that had not been possible before (ie time-
resolved Debey-Scherrer-diffraction see chapter 6) In the first part of this chapter the
fundamental components of the previously existing setup are briefly described In the
3 Improvement of the modular setup for time-resolved X-ray diffraction experiments
35
second part I present and discuss the implemented improvements including hardware
software and methodology Finally a summary for this chapter is given
31 The fundamental components of the current setup
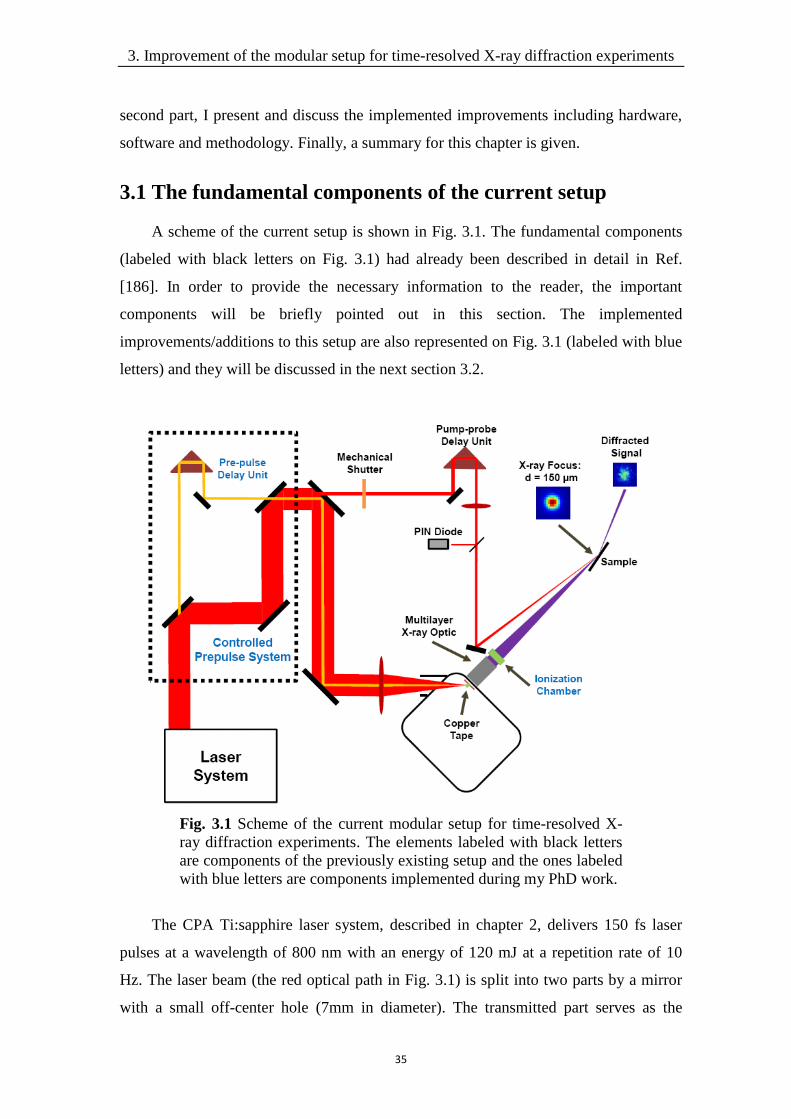
A scheme of the current setup is shown in Fig 31 The fundamental components
(labeled with black letters on Fig 31) had already been described in detail in Ref
[186] In order to provide the necessary information to the reader the important
components will be briefly pointed out in this section The implemented
improvementsadditions to this setup are also represented on Fig 31 (labeled with blue
letters) and they will be discussed in the next section 32
Fig 31 Scheme of the current modular setup for time-resolved X-
ray diffraction experiments The elements labeled with black letters
are components of the previously existing setup and the ones labeled
with blue letters are components implemented during my PhD work
The CPA Tisapphire laser system described in chapter 2 delivers 150 fs laser
pulses at a wavelength of 800 nm with an energy of 120 mJ at a repetition rate of 10
Hz The laser beam (the red optical path in Fig 31) is split into two parts by a mirror
with a small off-center hole (7mm in diameter) The transmitted part serves as the
3 Improvement of the modular setup for time-resolved X-ray diffraction experiments
36
optical pump beam to excite the sample under study while the reflected part is focused
by a lens of 300 mm focal length onto a Cu-tape target with an incident angle of 45ordm (p-
pol) to produce the Cu Kα (805 keV) probe pulse
For the reasons mentioned in the introduction of this chapter the Cu-target is
placed inside a compact vacuum chamber (size 24times30times30 cm3) which includes
connectors for the vacuum pump a pressure gauge and electrical feedthroughs as
shown in Fig 32 For mechanical and radiation safety reasons this chamber is made of
stainless steel with a wall thickness of 15 mm Additionally a 2 mm lead cover was
added inside the chamber to enhance security and to reduce the level of background
radiation that may reach the detector The working pressure of the chamber is 01 mbar
(a) (b)
Fig 32 Overview of chamber (a) outside and (b) band target inside
the chamber
The target consists of a 10 microm thick Cu tape mounted on a motorized spooling
system which works similarly to an audiocassette recorder (Fig 33 (a)) The pulling
speed is approximately 8 mms (ie 800 microm motion between two consecutive laser
pulses) to ensure that a fresh surface area is provided for each laser pulse The tape
shifts vertically to its pulling direction by about 08 mm when the pulling direction is
(automatically) changed One set of band (25 mm wide and 15 m long) can provide
more than 12 hours experiment time In order to minimize the deposition of ablated
material in particular at the small hole where the X-rays can leave the chamber [187]
a 8
μm Kapton foil has been rolled together with the Cu tape before mounting it to the
spooling system The Kapton foil runs simultaneously with the tape to pick up the
debris which is predominantly ejected at the back-side of the tape normal to its
surface [187]
Close to the laser-target interaction point it is mechanically separated from
the Cu tape by about 2 mm (see Fig 33 (b))
3 Improvement of the modular setup for time-resolved X-ray diffraction experiments
37
(a) (b)
Fig 33 (a) Photo of band target (b) Kapton foil used for reducing
material deposition
Using a pin-hole camera the size of the X-ray source on the tape target was found
to be similar to the spot size of the focused laser beam ie ~25 microm [187]
The Cu Kα
emission is close to 5times109 photonspulse in 4π solid angle without pre-pulse and 1times10
10
photonspulse with an optimized pre-pulse (see section 321) Since the X-ray emission
is into the full solid angle a multilayer X-ray optic with Montel-Helios geometry [188]
is
used to collect the radiation and to refocus it onto the sample under investigation The
multilayer X-ray optic reflects both the Cu Kα1 and Kα2 emission lines but suppresses
other spectral components (ie K) More details on the working principle and the
specifications of this mirror can be found in Appendix A
The focused X-ray beam was characterized at different positions of the beam path
through four relevant parameters [186]
the beam profile directly after the multilayer
optic the total number of reflected photons the convergence of the beam and the size
of focus spot A direct detection CCD camera was used to measure the first three
relevant parameters of the X-ray beam since it allows a rather accurate estimation of
the absolute detected X-ray signal (eg number of diffracted photons per pulse) A X-
ray beam profile taken at 4 centimeters after reflection on the multilayer optic is shown
in Fig 34 (a) Since the X-ray emission from the plasma is isotropic (ie homogeneous
illumination of the mirror) the intensity distribution measured at such a short distance
after the optic gives direct information on the spatial reflection properties of the two
multilayer mirrors The image in Fig 34 (a) demonstrates the uniformity of the
reflectivity over the mirror surfaces Due to the mounting configuration of the
multilayer mirrors inside the housing the beam shape is a 45deg rotated square [Appendix A]
The convergence angle of the beam was measured to be approximately 023deg which
3 Improvement of the modular setup for time-resolved X-ray diffraction experiments
38
corresponds to the specifications of the manufacturer (024deg) Using the known
sensitivity of the direct detection CCD camera [186]
the Cu Kα flux in the focused beam
can be determined from images like the one shown in Fig 34 (a) With an optimized
pre-pulse a typical flux of 13times105
photonspulse was obtained The intensity
distribution at the focus spot was measured with an indirect phosphor based detector
(Gemstar) [186]
A typical image with horizontal and vertical cross sections is shown
in Fig 34 (b) The measured FWHM of the focus spot is 150 microm in horizontal and 127
μm in vertical With the given source size of approximately 25 microm and the 5x
magnification of the multilayer optics this is close to the expected value
(a) (b)
Fig 34 (a) Topography of Cu Kα beam observed with the direct
detection CCD camera 4 cm after reflection on multilayer mirror (b)
Intensity distribution of Cu Kα emission at the focal point of the
multilayer optic obtained with the phosphor based detector Pictures
reproduced from Ref [186]
Since most of the experimental components of the modular setup are placed in air
they are easily accessible and can be conveniently manipulated In order to minimize
losses by absorption of the Cu Kα-radiation in air [189]
the optics housing is purged with
He and He-purged beam-tubes were installed in the X-ray beam path Although the X-
ray beam path cannot be covered completely more than 90 of the radiation collected
and reflected by the X-ray optic is delivered to the sample
The samples are mounted on a motorized x-y-θ stage to adjust the Bragg-angle (θ)
and the beam position on the sample (x-y) The diffraction signals have been recorded
so far by two different X-ray sensitive area detectors The first detector is a direct
3 Improvement of the modular setup for time-resolved X-ray diffraction experiments
39
detection CCD-camera (type PI-MTE 1300B) which has also been used for the
measurements discussed in chapter 2 As it has been explained before due to the strict
relation between the X-ray photon energy and the generated charge this detector can be
used as a spectrometer (see chapter 2) and allows determination of the absolute X-ray
signal with rather high accuracy (single photon sensitivity) The low quantum
efficiency (18 ) and the slow readout time are its main drawbacks The second area
detector uses indirect detection A phosphor screen converts incoming X-ray photons
into visible photons The optical signal is amplified by an image-intensifier and then
detected by a normal CCD Although this system allows single photon detection at high
gain of the intensifier there is no well-defined relation between the detected signal and
the X-ray photon energy On the other hand this detector has a high quantum efficiency
(85 for Cu Kα radiation [186]
) and high read-out rate (up to 10 Hz) so that an image
can be recorded for each single X-ray pulse A more detailed discussion of these
detectors and their specific advantages and drawbacks can be found in Ref [186] as
well as in Appendix B
The energy of the pump beam used to excite the sample is adjusted with a half-
wave-plate in conjunction with a thin film polarizer and monitored with a PIN diode A
motorized translation stage with a retro-reflector allows varying the delay between the
optical pump and the X-ray probe beam The p-polarized pump beam is focused with a
lens of 1 meter focal length onto the sample surface The angle between laser pump and
x-ray probe beam is set to be as small as possible ie approximately 10deg In order to
ensure that the measured diffraction signals represent the response of an almost
homogeneously excited region the diameter of the pump beam is chosen to be at least 3
times larger than the X-ray spot size Since the available amount of energy in the pump-
path (about 1 mJ per pulse) is more than sufficient for the experiments discussed in this
thesis a diaphragm has been used to adjust the pump beam spot size A removable
mirror which can be inserted in the beam path directs the beam to a CCD camera
positioned at a position equivalent to the distance to the sample to monitor the size and
the shape of the focused beam
32 Improvements of the modular setup
During my thesis work several improvements of the setup have been implemented
in order to (i) optimizeincrease the X-ray flux of the plasma source (ii) improve the
measurement sensitivityaccuracy and (iii) automatize and speed up the experimental
3 Improvement of the modular setup for time-resolved X-ray diffraction experiments
40
procedures This section describes in detail the necessary steps and modifications which
were essential to achieve the results of the time-resolved diffraction experiments
discussed in the following chapters in particular the results of the phonon softening
obtained on photo-excited Bismuth (Chapter 5)
321 Controlled pre-pulse to enhance the X-ray production
In chapter 2 it has been discussed in detail that a controlled pre-pulse with suitable
delay can be used to improve the X-ray production Based on this result a pre-pulse unit
(beam splitter and combiner delay stage see the black-dotted box in Fig 31) has been
added to the modular setup The main pulse energy is 110 mJ and the pre-pulse energy
is 15 mJ which results in intensities at the focus of the lens of 16times1017
Wcm2 for the
main pulse and 20times1014
Wcm2 for the pre-pulse respectively With a pre-pulse
arriving 5 ps before the main pulse the X-ray production of the modular setup has been
improved by about a factor of 2 which leads to more than 105 Cu Kα photonspulse
collected and focused by the X-ray mirror on the sample under normal experimental
conditions The positive effect of the pre-pulse was also briefly underlined and
presented in Dr Nicoulrsquos thesis
322 Avalanche photodiode (APD)
It was pointed out by Nicoul [186]
that the modular setup with the
magnifyingcollimating Montel-optic is most appropriate for experiments in which the
shape or angular position of the rocking curve of the excited sample does not change
but only the total diffraction efficiency (ie due to structure factor changes) Under
these conditions it is not necessary to use a detector with 2D resolution and therefore a
single-channel detector is sufficient Since the diffraction efficiency of the thin-film
samples typically used in the time-resolved experiments is low (10-3
-10-4
resulting in
diffraction signals of 10 - 100 photonspulse) a detector with high sensitivity down to
the single-photon level is required X-ray sensitive avalanche photodiodes (APD) fulfill
these requirements An APD is a photodiode with internal gain obtained by applying a
high reverse bias voltage to the photodiode which creates an intense electric field inside
its volume It combines the benefits of a photomultiplier tube (gain) and conventional
photodiodes (high quantum efficiency)
3 Improvement of the modular setup for time-resolved X-ray diffraction experiments
41
For the modular setup a large area (10 mm in diameter) Silicon APD was chosen
(its technical data are given in Appendix B) Using the direct detection CCD for
calibration the quantum efficiency of the APD for Cu Kα radiation was measured to
(36 plusmn 7) in agreement with previously published data [190 191]
This detector can be
easily operated at a repetition rate of 10 Hz and with more convenience (compact size
no need for water cooling) as compared to the phosphor based area detector To digitize
the detected X-ray signal a gated charge-integrating analogue-to-digital converter
(ADC) [192]
is used In order to match the APD-output to the input specifications of the
ADC a pulse shaperamplifier is added directly to the APD
The APDADC-combination was calibrated for the detection of Cu Kα radiation by
reducing the incident X-ray signal to the few-photons-per-pulse-level (0 to 6) and
analyzing the signal value distribution (histogram) of a large number of pulses
(typically a few thousand) for different bias voltages Results are shown in Fig 35 (a)
The signal value distributions exhibit a multi-peak structure as it is expected for a Si-
detector with its rather well defined relation between the charge generated by a single
X-ray photon and the photon energy (e g one Cu Kα photon produces 366 times 10 -4
pCb)
A multi-peak fit was applied to separate the individual peaks and to determine in
particular the position of each peak (marked in the figures) The first left peak
corresponds to the dark current background (no photon detected proven by blocking
the X-rays) and the second third fourth hellip peaks are correspond to one two three hellip
detected photons respectively By plotting the peak position as a function of photon
number in Fig 35 (b) and fitting the result by a linear function (Y = m + n X) the
corresponding ADC output (given in counts) for the background signal (parameter m)
and for a single Cu Kα photon (parameter n) can be determined for different bias
voltages The result is shown in Fig 35 (c) The ADC output per Cu Kα photon (black
squares) increases rapidly with bias voltage reflecting the corresponding increase of the
APD-gain It has to be noted that the dark current is also amplified with increasing bias
voltage underlined by the increase of the background signal (red circles)
Since the X-ray-to-charge conversion is known as well as the amplification of the
amplifier (11x) and the sensitivity of the ADC (32 counts per pCb) this APD-gain can
also be deduced from the information above The result is plotted in Fig 36 as a
function of bias voltage together with results of optical measurements (see below) and
data provided by the manufacturer All data are in a good agreement and the maximum
gain of 103 is proven to be achievable with this device
3 Improvement of the modular setup for time-resolved X-ray diffraction experiments
42
(a)
(b) (c)
Fig 35 (a) The signal value distributions (histograms) measured
with the APD at the few-photons-per-pulse-level at different bias
voltages The blue curves are the total multi-peak fits and the green
peak profiles are the separated individual peaks The peak positions
are indicated on the top of each peak (b) The values of peak
positions in (a) as a function of the number of detected photons
With the linear fitting function (Y = m + n X) the background
signals and corresponding ADC outputs (given in counts) pre Cu Kα
photon can be determined by the fitting parameter m and n
respectively (c) The corresponding ADC outputs per Cu Kα photon
(black square points) and the background signals (red circle points)
at different bias voltages
3 Improvement of the modular setup for time-resolved X-ray diffraction experiments
43
Fig 36 Comparison of the gain of APD from three measurements
Fig 37 APD signal as a function of PIN diode signal with different
operating voltages
Another important information concerns the question whether the (electric) output
signal is proportional to the (X-ray or light) input signal (linearity) The linearity of the
APD was checked by measuring an optical input with the APD at different bias
voltages and a regular Silicon PIN-diode which was known to be linear over the used
range of incident optical power In Fig 37 the APD-signal is plotted as a function of
the PIN diode signal for different APD bias voltages It turns out that the response of
the APD is linear for an ADC-output up to about 1000 counts For higher signal levels
the response becomes nonlinear Since the APD and the assembled electronic
3 Improvement of the modular setup for time-resolved X-ray diffraction experiments
44
shaperamplifier were not tested separately the source of the nonlinearity cannot be
determined at this point In the time-resolved diffraction experiments the nonlinearity
of the APD needs to be taken into account and corrected
323 Ionization chamber detector (ICD)
(a) (b)
Fig 38 (a) Photo of the ionization chamber detector and (b) its
working scheme
In order to normalize the diffraction signals and to determine the changes in the X-
ray diffraction efficiency of an optically excited sample with high accuracy it is
necessary to measure also the (relative) incident X-ray flux for each pulse For this
purpose a small ionization chamber detector has been placed behind the X-ray
multilayer optic A photo of the installed chamber and its working scheme is shown in
Fig 38 Part of the Cu Kα radiation reflected by the optic is absorbed and ionizes the
Ar-gas with which the cell is filled The Ar-pressure is around one atmosphere At 8
keV a transmission of 72 is measured and it agrees with the expected transmission
value of 16 cm Ar at 1 atm plus 16 μm of Kapton foil used as cell windows [189]
To
collect the charge generated by ionization a high bias voltage is applied (2000 kV) A
high speed current amplifier (type DHPCA-100 FEMTO) with a gain of 105 is used to
3 Improvement of the modular setup for time-resolved X-ray diffraction experiments
45
match the output signal of the ionization chamber to the input of the gated charge-
integrating ADC (same as used for recording the APD-signals)
In order to characterize the ionization chamber detector its linearity was measured
using the phosphor based area detector which can be regarded as a linear detector The
result of this measurement shown in Fig 39 (each data point corresponds to an
acquisition time of 30 sec) clearly shows the linear response of the ionization chamber
Fig 39 Calibration between ionization chamber detector and
phosphor based detector Red dashed line is a linear fit of the
measured data
Fig 310 Long term drift of the normalized ratio
3 Improvement of the modular setup for time-resolved X-ray diffraction experiments
46
It should be noted that the output signal of the ionization chamber is surprisingly
very sensitive to changes of the Ar-pressure (approx 30 change of signal for lt1
change of pressure) Therefore the pressure inside the chamber needs to be stabilized
during the whole measurement For this purpose a pressure control system consisting
of two pinhole valves and a pressure gauge was implemented (see Fig 38) It allows
stabilizing the pressure inside the chamber to about plusmn01 mbar (relative to the external
pressure) Despite stabilizing the pressure in the ICD we observed long term drifts of
the ICD-signal during the diffraction measurements As an example the ratio between
the APD and ICD signals from one representative measurement recorded over about
one hour is presented in Fig 310 The large pulse-to-pulse variations of the ratio are
caused by the counting statistics limited fluctuations of the APD-signal (only a few
photons per pulse are detected in this particular measurement) Additionally the ratio
which should be constant on average changes slowly with time So far no clear
explanation has been found for this effect These drifts can severely limit the achievable
accuracy in a time-resolved experiment when for example the different pump-probe
delays are sequentially measured during an experimental run The issue has been solved
by applying a ldquofastrdquo delay scanning technique in the experiments which will be
discussed in section 3262
324 Experiment control program
The modular setup is entirely controlled by a software program developed using
the LabVIEW environment The functions of this program include control and
monitoring of the different elements and detectors in the setup as well as data recording
and pre-processing All functions can be accessed from one interface (shown in Fig
311) which has been geometrically divided into two parts
3 Improvement of the modular setup for time-resolved X-ray diffraction experiments
47
Fig 311 Interface of the experiment control program
The upper part (part I) is used to prepare an experiment and to perform some
simple test measurements eg checking signal levels the background signals of the
detectors etc Frame (Ia) is a control panel for the pump-probe delay unit In frame
(Ib) the detected signals from individual detectors (ie PIN diodes APD ICD) can be
selected and displayed The received data can be recorded into files Frame (Ic) is a
waveform graph to show the histogram of the signal of the detector selected in frame
(Ib) Frame (Id) displays the real time trace for the selected detector
The lower part (part II) is used for the time-resolved diffraction experiments In
region (IIa) one can enter the relevant measurement settings eg background signal of
the different detectors acquisition time for the individual measurement points delay
range delay steps and saving folder Frame (IIb) shows the real time traces of the
measurement and the ratio APDICD The five indicators at the bottom of this frame
indicate the status of the measurement system Frame (IIc) displays a constantly
updated preliminary analysis (ie ratio APDICD vs delay time) of the measured data
In region (IId) several switches allow to change between different operation modes of
the tape target the laser triggering and the delay unit (eg fast scanning see below)
3 Improvement of the modular setup for time-resolved X-ray diffraction experiments
48
Frame (IIe) displays the correlation between APD and ICD and Frame (IIf) displays the
pump beam energy
part I To prepare the experiments and to perform some simple test measurements
Frame (Ia) Control of the pump-probe time delay
Frame (Ib) Selection and value display of the signals from individual detectors
Frame (Ic) Display of the signal value distributions of the selected detectors
Frame (Id) Display of real time traces for the selected detectors
part II To perform the time-resolved diffraction experiments
Frame (IIa) Input of the relevant measurement settings
Frame (IIb) Display of real time traces of APD ICD and their ratio
Frame (IIc) Display of a preliminary analysis of the measured data
Frame (IId) Control of tape motion and ldquofastrdquo scanning
Frame (IIe) Display of APD-signal vs ICD-signal
Frame (IIf) Display of the pump beam energy
Table 31 The functions of the individual areas in the user interface
of the experiment control program
For a better overview the functions described above are briefly summarized in
Table 31 This program has been proven very useful during the performed experiments
However further improvements are possible For example integration of control
functions for the sample holder might be required to allow a synchronized motion of
the sample during data acquisition (eg for experiments where the sample is
irreversibly damagedmodified by a single laser pulse)
325 Spatial and temporal overlap adjustments with APD
A very important and non-trivial part of performing a time-resolved diffraction
experiment is to find spatial and temporal overlap between the (invisible) X-ray probe
beam and the laser pump beam To find spatial overlap a similar procedure is applied
as described in Ref [186] The sample is moved vertically and horizontally with the
translation stage in order to scan its border through the X-ray beam Since the sample
surface is monitored by a camera on a video screen the disappearance of the X-ray
diffraction signal allows to localize the X-ray beam position by marking the sample
border in horizontal and vertical direction on the screen Then the optical beam can be
easily adjusted to overlap with X-ray beam on the marked position The spatial overlap
needs to be checked before every measurement
Once the spatial overlap is established the temporal overlap is adjusted by
exciting the sample with the laser and monitoring changes of the diffraction signal
while scanning the delay stage Two examples are presented in Fig 312 which show
3 Improvement of the modular setup for time-resolved X-ray diffraction experiments
49
the relative decrease in the diffraction signal upon laser excitation on thin films of Au
(333)-reflection (a) and Bi (111)-reflection (b) While the different physical processes
responsible for the observed signal changes will not be discussed here (see chapter 4
and 5) the time-traces allow to determine delay zero (temporal overlap) The accuracy
depends obviously on the speed of the induced changes and can reach the sub-
picoseconds level if the changes are fast (ie Bi) Moreover it should be emphasized
that using the APD and the new experiment control program allows to obtain such
results in just a few minutes Without the implemented improvement it usually took
around 45 to 60 minutes for the same purpose [186]
Finally it should be noted that the
observed decay of the Bi-diffraction signal in less than 400 fs (Fig 312b) represents an
upper limit for the temporal resolution that is possible with the modular setup A
temporal resolution of about 100 fs has been demonstrated with a similar X-ray source
in Ref [106]
(a) (b)
Fig 312 Time-resolved measurements with high temporal
resolution detected using APD (a) Au (333) and (b) Bi (111) The
cyan dashed line marks the position of time zero
326 Normalization of X-ray signals
Since only a few photons per pulse are diffracted from the thin film samples
typically used in the time-resolved X-ray diffraction experiments it is necessary to
accumulate signal over a sufficiently long time (a few hours are usually required for a
complete experiment) to enable the measurement of transient changes of the diffraction
efficiency at the percent level During this time the variation of the X-ray flux
delivered to the sample cannot be avoided without a normalization procedure In the
following one needs to distinguish between short-term fluctuations and long term drifts
3 Improvement of the modular setup for time-resolved X-ray diffraction experiments
50
Short-term fluctuations refers here to all intensity variations of the X-rays
occurring within seconds down to pulse-to-pulse fluctuations They are mainly caused
by energy and spatial (pointing stability) instabilities of the driving laser As mentioned
in chapter 2 the laser energy essentially affects the total X-ray yield Hence the pulse-
to-pulse energy fluctuation results in a fluctuation of the X-ray output signal For the
modular setup spatial instabilities represent the most critical issue which had already
been detailed discussed in Ref [186] Together with the position instabilities of the
copper tape with respect to the focused laser spot (caused mainly by mechanical
instabilities of the pulling system) the finite pointing stability results in fluctuation of
the spatial position of the X-ray source Due to the short source-to-mirror distance the
overall reflection efficiency of the multilayer X-ray optic is very sensitive to variations
of the source position which lead to significant changes of the X-ray output behind the
optic
Long term drifts refer to variations of the X-ray flux within minutes up to hours
(see Fig 310) While the sources of these drifts are not completely understood it must
be noted that they cannot be simply averaged out
Therefore suitable measurement schemes with reliable normalization procedures
are required to maximize the accuracy of the measurement and to minimize the
necessary experimental time Two measurementnormalization schemes are described
and discussed in the following sections which allow to handle both short term
fluctuations and long term drifts
3261 Chopping normalization scheme with a shutter
The first normalization scheme I call the chopping method which is a low
repetition rate variant of a well-known normalization scheme used for all-optical pump-
probe experiments at high repetition rate laser systems [193-196]
In this scheme the pump
beam is periodically blocked (chopped) in order to record the probe signal with and
without laser excitation within a short time interval To achieve this a mechanical
shutter is installed in the pump beam path (see Fig 31) and operated at 1 Hz with an
opening time of 05 sec Given the 10 Hz repetition rate of the laser system the
diffraction signal is recorded 5 times with sample excitation followed by 5 times
without sample excitation within one shutter cycle The signals from the PIN diode
used to monitor the pump beam energy allow to mark ldquopumpedrdquo and ldquoumpumpedrdquo
events in the data stream The relative change of the signal due to the laser excitation
3 Improvement of the modular setup for time-resolved X-ray diffraction experiments
51
can be retrieved by normalizing the sum of ldquopumpedrdquo signals to the sum of the
ldquoumpumpedrdquo signals In this way both short term fluctuations (by averaging) and long
term drifts (by comparing pumped and unpumped signals every second) are
properly taken into account However only one half of the total flux contributes to the
transient diffraction signal while the other half is used for normalization
Fig 313 Chopping normalization scheme Standard deviations as
function of integrated acquisition time with different detected photon
numbers per pulse Data points obtained from the experiment and
solid curves are calculated from counting statistics
In the ideal case the achievable accuracy of the experiment is determined by the
counting statistics through the total number of detected photons (given by the laser
repetition rate the number of diffracted photon per pulse and the acquisition time)
Since the laser repetition rate is fixed and the number of diffracted photons per pulse is
determined by the diffraction efficiency of the sample and the X-ray source
performance the acquisition time is the only parameter to control the accuracy of the
experiment In order to define the required acquisition time for a desired accuracy a
series of test measurements were performed with Bi- and Au- samples Each set of the
diffracted signals from these two samples were recorded with the APD for
approximately one hour in the same experimental conditions without sample excitation
The detected APD-signal for each set of data was varied by changing X-ray source
production (adjusting the energy of the driving laser for the X-ray source) and by
choosing different Bragg-reflections The data are analyzed with a MATLAB routine
3 Improvement of the modular setup for time-resolved X-ray diffraction experiments
52
which artificially groups the data in pumped and unpumped events (assuming
chopping at 1 Hz) and averages and normalizes the diffraction signal over bins of
different size (ie the number of pulses used to produce one normalized data point)
Each specific binning produces a set of data with different number of points as the
number of points times the binning size equals the same number determined by the total
acquisition time The standard deviations of each data set are calculated and presented
in Fig 313 as a function of the acquisition time for one point (determined by the
binning size) Since the APD has been calibrated one can calculate the expected
standard deviation of the measured diffraction signal S assuming that it is determined
only by counting statistics as 21 NSS where N is the total number of detected
photons in the respective acquisition time [197 198]
These calculated values are plotted as
solid lines in Fig 313 and they are used to compare to the experimentally determined
values Note that due to the chopping method used for normalization only one half of
the detected photons contributing to the signal have been taken into account in the latter
calculation (the other half has been used as reference for the normalization) As one can
see in Fig 313 the experimental data strictly follow the counting statistics curves with
the respective number of detected photons It indicates that this normalization scheme
allows to reach the fundamental limit set by counting statistics in the experiment
Moreover this figure also provides the required acquisition time for a desired accuracy
for a given diffraction signal (number of detected photons per pulse) For example if
one intends to have an accuracy of 1 with 23 detected photons per pulse an
acquisition time of 150 seconds per data point is sufficient
3262 Direct normalization scheme with the ionization
chamber detector
As I have already pointed out in section 323 that the ICD allows the direct
measurement of the X-ray beam intensity behind the multilayer optic The signals
generated by the ionization chamber are proportional to the incident X-ray flux on the
sample Therefore they can be used as a reference to normalize the diffraction signals
on a pulse-to-pulse basis In order to account for the long term drift of the ICD signal
mentioned in section 323 a ldquofastrdquo scanning technique adapted from all-optical
experiments [199]
has been combined with this normalization scheme Fast scanning
means that the full delay range to be investigated in a particular experiment is
3 Improvement of the modular setup for time-resolved X-ray diffraction experiments
53
repetitively scanned in a relatively short time (during which drift effects are small) and
the data from all scans are summed up and averaged
In order to check the accuracy achievable with this scheme a series of similar test
measurements as above were performed using the ICD for normalization for different
levels of the diffraction signals (given again in number of detected photons per pulse)
This time the data were treated as a set of ldquofastrdquo scanning measurements by artificially
sorting them into a number of delay scans with a certain number of delay points and
pulses per delay before normalization As the result of this analysis Fig 314 shows the
obtained standard deviation as a function of the total measurement time for a single
delay at different levels of the diffraction signal (data points) and compares the
experimental data to calculated curves assuming again counting statistics as the limiting
source of error Again the experimental data agree well with the counting statistics
curves demonstrating that the fast scanning scheme can indeed correct the long term
drifts
Fig 314 Direct normalization scheme with the ldquofastrdquo scanning
technique Standard deviations as a function of integrated acquisition
time with different numbers of detected photons per pulse Point data
obtained from the experiment and solid curves are calculated from
counting statistics
3 Improvement of the modular setup for time-resolved X-ray diffraction experiments
54
3263 Comparison of normalization schemes
Finally the two normalization schemes discussed above will be compared in this
section for similar experimental conditions (ie same X-ray flux after the X-ray optic
same diffraction efficiency of the sample) For this comparison one needs to consider
that the ICD has a transmission of 72 Therefore using the direct normalization
scheme 28 of the incoming X-ray flux serves as reference signal and only 72 are
used for diffraction Since the number of detected photons in the ICD is large (a few
times 104) the error of the measurement with direct normalization is determined only by
the counting statistics of the diffraction signal (see previous section) The standard
deviation in this case isn)720(
1
tr where r is the repetition rate of laser t is the
total integration time in second and n is the number of detected photons per pulse On
the other hand when the chopping scheme is used for normalization the ICD can be
removed from the beam path and the full X-ray flux reaches the sample However as
already mentioned above only one half of the total signal contributes to the transient
diffraction signal while the other half is used for normalization Both transient
diffraction and normalization signals are limited by counting statistics which doubles
the error of the normalized signal Then the standard deviation in this case gives as
ntr )2
(
2 Combining this information one can show that for the same
experimental conditions (with same r t n) the direct normalization scheme (with fast
scanning) should give a factor of 17 better accuracy than the chopping scheme
3 Improvement of the modular setup for time-resolved X-ray diffraction experiments
55
Fig 315 Comparison of the chopping normalization scheme and the
direct normalization scheme (with ldquofastrdquo scanning processing) for
the same amount of incident photons from the X-ray optic (a) with 7
and 5 detected photons (b) with 23 and 15 detected photons and (c)
with 110 and 81 detected photons for the chopping and direct
normalization scheme respectively
Fig 315 compares the measured error (data points) as a function of accumulation
time for the two normalization schemes at different levels of the diffraction signal (the
signal level for direct normalization with the ICD is lower than for the chopping
scheme to account for the transmission losses of the ICD) The red and blue curves
3 Improvement of the modular setup for time-resolved X-ray diffraction experiments
56
show the calculated error based on counting statistics Not only do experimental and
calculated errors agree very well the data quantitatively confirm the advantage of the
direct normalization scheme discussed above
In conclusion the direct normalization scheme represents the most efficient way to
perform time-resolved diffraction measurements with the modular setup Depending on
the level of the diffraction signal an accuracy of better than percent for an individual
data point can be achieved with accumulation times of tens of seconds to a few
minutes
33 Summary
This chapter discussed a modular setup for time-resolved X-ray diffraction
experiments at the University of Duisburg-Essen All components of the previously
existing setup as well as the components that have been added to improve its
performance have been presented and characterized Due to its compact design the
setup is easy to operate and adjustments of components are convenient Applying the
results discussed in chapter 2 the X-ray production in the setup has been improved
using a controlled pre-pulse Using an avalanche photodiode as detector for the
diffraction signal it has been shown that the combination of direct normalization with
an ionization chamber as reference detector and the ldquofastrdquo delay scanning scheme
represents the most efficient way to achieve a high measurement accuracy The setup in
its current status has proved its capabilities through several preliminary experiments
and has been successfully used for the diffraction experiments that will be presented in
the following chapters
4 Observation of the Debye -Waller effect in Au
57
4 Observation of the Debye -Waller
effect in Au
Ultrafast x-ray diffraction is a relatively new technique that provides both high
temporal and atomic scale spatial resolution to directly observe the atomic motions and
changes in the atomic structure of matter upon optical excitation This chapter will
present a laser-pumpX-ray-probe experiment on a thin Au film the first time-resolved
experiment performed with the modular setup described in the previous chapter The
lattice vibrations that result from the electronic energy relaxation following optical
excitation have been directly observed through the DebyendashWaller effect The rise times
of the lattice temperature were measured for different absorbed laser fluences and
compared with the Two-Temperature Model (TTM) [200]
These experimental results are
consistent with previous data obtained by ultrafast X-ray diffraction [61]
as well as
ultrafast electron diffraction [201]
and prove the capability of the new built modular
setup
This chapter is organized as follows The first section is a brief description of the
Au sample used in these experiments In the second section the Debye ndashWaller effect
is discussed In the third section the time-resolved experiments are described and
experimental results are presented In the fourth section a comparison between the
experimental results and calculations based on the TTM model are discussed In the
final section a summary will be drawn
41 Au sample
Au a noble metal has been extensively studied with respect to its transient
properties and transient structure after femtosecond optical excitation [61 186 201-208]
In
4 Observation of the Debye -Waller effect in Au
58
particular the transient Debye ndash Waller effect has been recently used in ultrafast
electron diffraction experiments to study fast lattice heating after femtoseond laser-
excitation of thin polycrystalline Au films [201 206]
In the experiments described in this chapter an epitaxial Au film was used The
150 nm thick (111)-oriented Au samples had been grown on (001)-oriented high
quality Mica using a magnetron sputtering technique and were provided by the
company Phasis [209]
Relevant physical parameters of this sample are provided in
Appendix C3
To maximize the pump-induced changes of the diffraction signal due to the
Debye-Waller effect measurements were performed using the symmetric (333)-
reflection (see also next section) The corresponding Bragg angle (measured relative
to the surface) is 789deg for Cu Kα radiation Given the angle of 10deg between the
optical pump beam and the X-ray probe the angle of incidence (measured to the
surface normal) of the pump is 20deg The corresponding reflectivity of the sample at
800 nm is 97 The optical penetration depth is about 13 nm which is much smaller
than the film thickness [210]
Nevertheless fast ballistic electronic transport distributes
the deposited energy over the whole film thickness within a few hundred
femtoseconds [211-213]
Therefore the sample can be considered as being
homogeneously excited on the time scale of a picosecond
42 Debye ndashWaller effect
Debye [214]
and Waller [215]
found that by heating the lattice the intensity of
Bragg-reflections decreases whereas their angular profiles (rocking curves) remain
unchanged This decrease is described by the Debye-Waller factor DW(T)
)3
1exp()( 22
0
hklT Gr
I
ITDW
(41)
where IT is the integrated intensity of a particular Bragg-reflection with Miller
indices (hkl) (determined by the reciprocal lattice vector Ghkl) at temperature T I0 is
4 Observation of the Debye -Waller effect in Au
59
the integrated intensity in the case of the perfectly ordered and lsquofrozen latticersquo and
2r
is the mean square atomic displacement [216]
By calculating 2r
within the Debye theory for the specific heat [217]
and
taking into account Braggs law )sin(2 Bhkld the Debye-Waller factor can be
represented as [218]
22
2
2
16exp)(
hkl
D
DB dTmk
ThTDW (42)
where h is Plankrsquos constant T is the temperature of material m is the mass of
the atom Bk is the Boltzmanrsquos constant D is the Debye temperature of the material
T
D is the Debye function and hkld is the corresponding lattice constant Eq 42
indicates that the Debye-Waller effect becomes stronger with a smallerhkld ie larger
changes in the diffracted signal are expected for higher diffraction orders (hkl)
Fig 41 Calculated Debye-Waller factor for Au
According to Eq 42 the Debye-Waller factor for the (111) (222) and (333)
Bragg diffraction of Au are calculated as a function of temperature and presented in
Fig 41 (normalized to the corresponding value at 295 K) Since the changes of the
4 Observation of the Debye -Waller effect in Au
60
integrated signal are more pronounced for higher orders the (333)-reflection has been
used in following experiments as mentioned above
43 Time-resolved X-ray diffraction experiments on Au
431 Bragg diffraction of Au
Before performing the time-resolved experiments for studying the Debye ndash
Waller effect in Au several preparation experiments were carried out using an area
detector (ldquoGemstarrdquo camera see Appendix B) to pre-characterize the structural
response of the sample upon ultrafast optical excitation
Fig42 shows as one result the variation of the total diffraction signal with the
angle of incidence of the X-ray beam for the Au (333)-reflection In principle such
angular dependencies represent the convolution of three contributions namely (a) the
sample rocking curve (b) the angular intensity distribution of the focused X-ray beam
and (c) the source spectrum As a consequence the angular dependence shown in Fig
42 exhibits a two-peak structure which can be attributed to the Kα1- and Kα2-lines of
Cu which are both reflected by the mirror Each individual peak exhibits a FWHM of
about 07deg This is significantly more than the expected width of about 026deg due to
the combined effects of the spectral width (FWHM) of the two emission lines (approx
013deg) [219]
the angular FWHM of the focused X-rays (017deg FWHM) [Appendix A]
and
the expected FWHM of the rocking curve of a 150 nm film (014deg) [220]
The
broadened diffraction curve is attributed to the mosaic structure of the Au-film [221]
)
The following experiments are performed at a sample angle of 7895deg corresponding
to the maximum detected diffraction signal
4 Observation of the Debye -Waller effect in Au
61
Fig 42 The diffraction signal as a function of sample angle for the
Au (333)-reflection without excitation
However upon excitation of the sample not only the intensity of a particular
Bragg-reflection can change (eg due to the Debye-Waller effect) but also its angular
position (and shape) due to laser induced strain With respect to the latter one it has to
be stressed that the angular FWHM of the incident X-ray beam covers only a part of
the total width of the diffraction curve Therefore for a fixed sample angle changes
of the diffraction signal might be caused by both real intensity changes as well as a
peak shift due to the fact that strain if sufficiently large can shift the diffraction
curve out of the narrow angular range of the incident X-ray beam In order to
(preliminary) clarify the effect of strain time-resolved measurements have been
performed for different fluences both at fixed sample angle as a function of pump-
probe time-delay and as a function of sample angle for a fixed time-delay
Fig 43 shows the shift of the diffraction peak (center of gravity of the
distribution of diffracted X-rays measured on the area detector mentioned above) for a
(low) absorbed pump fluence of 15 mJcm2 (black open squares the red dots show
reference data measured in the course of the experiment without laser pumping) As it
is evident the Bragg-peak starts to shift shortly after excitation towards smaller
diffraction angles indicating lattice expansion The maximum shiftexpansion is
4 Observation of the Debye -Waller effect in Au
62
reached after about 45 ps Subsequently the Bragg-peak shifts back to larger
diffraction angles indicating recompression of the material Before discussing this
behavior it should be noted that this measurement could be performed with a fixed
sample angle using an area detector because of the low absorbed fluence with which
the shift of the Bragg-peak is smaller than the angular range of the incident X-ray
beam
Fig 43 Centers of gravity of the Au (333) rocking curves measured
with the Gemstar camera Red circles correspond to data obtained on
the non-excited sample the black squares represent data from the
excited sample
The observed behavior in particular the oscillatory time-dependence of the
Bragg-peak shift is in line with the generation and propagation of acoustic waves
launched by an almost instantaneous increase of pressure after optical
excitation [222 223]
In this interpretation the observed period of 45 ps should
correspond to the time ac that a longitudinal acoustic wave with speed cs needs to
travel through a film with thickness d sac cd With the known speed of sound of
cs = 339 kms [224]
in Au along the (111)-direction and using the nominal film
thickness of (150 5) nm I obtain ac = (44 15) ps which is in agreement with the
experimentally found value Very similar results have been recently reported by
4 Observation of the Debye -Waller effect in Au
63
Nicoul et al on a similar Au-sample of smaller thickness (d = 90 nm) [61]
The close
correspondence in the time-evolution of the Bragg-peak shift in particular its
ldquotriangularrdquo shape give clear indication that also the 150 nm film is homogeneously
(as expected ndash see above) and almost instantaneously pressurized over its whole
thickness
Fig 44 The diffraction signal as a function of sample angle for the
Au (333)-reflection at a delay of 45 ps (maximum shift) measured
with APD The points are measured data and the solid curves
represent Gaussian fits
Fig 44 shows the diffraction signal measured with the APD at a delay of 45 ps
(maximum shift) as a function of sample angle for different pump fluences the solid
curves represent Gaussian fits to the measured data The APD has a sufficient large
detecting area allowing to perform this measurement without moving its position As
expected the shift of the Bragg peak increases with pump fluence The peak positions
were obtained from the fitting function and are shown as function of absorbed fluence
The ldquotriangularrdquo shape of the time-trace indicates that the changes of the average interspacing
distance inside the sample can be assumed to be linear with time It is expected for the time-
independent pressurestress (the strain waves exhibit a rectangular shape) which results from
instantaneously and homogeneously heating of a sample Detailed interpretations can be found in Ref
[140 186]
4 Observation of the Debye -Waller effect in Au
64
in Fig 45 As it can be seen in Fig 45 the maximum shift of the Bragg-peak caused
by laser induced strain scales linear with the absorbed fluence Such behavior was
also observed in other X-ray diffraction experiments [140 186 225]
Fig 45 Angular shift of Bragg peak as function of absorbed fluence
The green dashed lines are linear fits for the data points
In summary the experiments above show that the strain caused by laser-
excitation result in a linear shift of the Bragg-peak both with time (for the first 45 ps)
and fluence
432 Observation of Debye ndashWaller effect on Au
In order to obtain the temporal evolution of the Debye ndashWaller effect without
being affected by the laser induced angular shifts of the Bragg peak an angular
compensation procedure is applied during the measurements This method is based on
the results shown in Figs 43 and 45 namely the linear increase of the Bragg-peak
shift with time and fluence This allows to properly adjust the sample angle both as a
function of pump-probe time delay as well as fluence to stay always at the angular
position of the maximum of the diffraction signal
4 Observation of the Debye -Waller effect in Au
65
Fig 46 Time-resolved measurements with and without the angular
compensation procedure The black curve is an exponential fit for
the data with compensation the red curve is a guide to eye for the
data without compensation
To illustrate the effect of this compensation Fig 46 shows the results of time-
resolved measurements with and without angular compensation at a fluence of
35 mJcm2 (absorbed) Without the compensation the detected diffraction signal
represents the combined effects of the strain-induced angular shift of the Bragg peak
and the DebyendashWaller effect As it can be seen in this case the detected diffraction
signal drops and rebounds at 45 ps essentially resembling the temporal behavior of
the angular shift of the Bragg peak after excitation (see Fig 43) However with the
compensation method the Debye-Waller effect can be isolated In this case the
measured (normalized) diffraction signal shows a much faster exponential drop with a
time constant of about 43 ps
Additional measurements were performed at lower pump fluences applying this
angular compensation The results are presented in Fig 47 In all cases the
experimental data were fitted with an exponential function and the fitting curves are
depicted as solid lines in the figure Most obvious and not unexpected the decrease of
the overall change of the diffraction signal increases with fluence due to the larger
4 Observation of the Debye -Waller effect in Au
66
temperature increase achieved at higher fluences The temporal evolution of the
diffraction intensities directly maps out the excitation of lattice vibrations (increase of
2r
) during heating After approximately 20 ps all diffraction signals reach their
asymptotic values which can be considered as the sign of reaching the new thermal
equilibrium state in the lattice system
Applying eq 42 the measured asymptotic drop of the diffraction signal as
obtained from the exponential fitting can be converted into a temperature increase
The results are plotted as blue squares in Fig 48 (a) The experimentally determined
temperature increases are compared to the temperature increase estimated from the
deposited laser energy and the specific heat of the material (red circles) Both data
sets agree within their error bars thus confirming that lattice heating and the Debye-
Waller effect is responsible for the observed decrease in diffraction intensity
The time constant of the exponential fit represents how fast the lattice is heated
and the new thermal equilibrium state is reached The time constant is plotted in Fig
48(b) as a function of absorbed laser fluence (bottom axis) and lattice temperature
(top axis) For comparison two data points from previously published experiments
[61 201] have been added Since the absolute fluence values are often difficult to
compare in independent experiments the absorbed fluence value is not used for this
comparison but the observed temperature increase (top axis) My measurements agree
within the error bars with the previously published data
4 Observation of the Debye -Waller effect in Au
67
Fig 47 Diffraction signal as a function of delay time for different
absorbed fluences (obtained with the angular compensation
procedure) The solid curves are exponential fits of the measured
data
(a) (b)
Fig 48 (a) Asymptotic temperature after laser-excitation as a
function of absorbed fluence Blue squares Values determined by
using eq 42 and the experimentally observed asymptotic drop of the
diffraction signal (top axis) Red circles Estimated temperatures
from the deposited optical energy (b) Decay time constant as a
function of absorbed fluence (bottom axis) and lattice temperature
(top axis) The black square points are obtained from the exponential
fits of the measured data in Fig 47 The red circle and the blue
diamond are taken from Ref [201] and [61] respectively
4 Observation of the Debye -Waller effect in Au
68
The data in Fig 48(b) seem to show a tendency that the decay constant
decreases with increasing fluence However due to the large errors of the derived
decay time constants at low fluences this effect will not be discussed further The only
remark to be made here is that the frequently used TTM (see below) does predict the
opposite
44 Comparison with the Two ndash Temperature Model (TTM)
and discussion
Upon the laser excitation the laser energy is first absorbed by free electrons and
then exchanges between electrons and the lattice through electron-phonon collisions
The evolutions of the electron and lattice temperature are determined by the electron-
phonon coupling constant [226]
In order to understand this process of above
experimental results in this section I compare the experimental results with the
theoretical prediction of the two-temperature model (TTM) [200]
which is a simple and
frequently used model to describe the electron-phonon energy relaxation
The TTM is based on the assumption that the electronic and lattice system can be
described by two different time-dependent temperatures Te and Tl The rate of energy
exchange between these two subsystems depends linearly on the temperature
difference and is given by
)( le
e
e
l
l TTt
TC
t
TC
(43)
where Ce and Cl are the specific heats of electrons and phonons (in principle
temperature dependent) respectively The energy exchange rate parameter α is related
to the electron-phonon coupling constant Solving the differential equation 43
numerically by using the coupling constants determined from all-optical
measurements [227]
not only the electron dynamics but also the evolution of the
lattice temperature can be predicted
In order to solve this differential equation the initial temperature of the
electronic system is calculated by using the experimentally determined asymptotic
4 Observation of the Debye -Waller effect in Au
69
lattice temperature Tasy According to the law of energy conservation and assuming no
energy losses the total initial energy in electronic system soon after laser excitation
and in lattice system at initial room temperature is equal to the total energy of
electronic and lattice system at asymptotic lattice temperature One obtains
asylasyeRleee TCTCTCTTC ))(()( 00 (44)
and
eeee TATC )( (45)
where Ae and TR are coefficient of electronic heat capacity and the room
temperature respectively Then the corresponding initial electron temperature 0eT can
be expressed as
))(2
( 2
0 asyRasy
e
le TTT
A
CT (46)
Using the deduced parameters and the material constants summarized in table 41
equation 43 was numerically solved and the results of temporal evolution of lattice
temperature are shown in Fig 49 (red dashed curves) together with the measured data
for the further discussions
Ae[Jm3K
2] Cl [MJm
3K] α [10
16Wm
3K]
676 245 21
TR [K] Tasy[K] Te0[K]
295
335 17363
365 22831
390 26544
Table 41 The material constants of Au and parameters used in the
TTM calculations [228]
4 Observation of the Debye -Waller effect in Au
70
Fig 49 Temporal evolution of the detected X-ray signal (data points
left axis) with exponential fits (black solid curves left axis) and the
results of the numerical solutions of the TTM for the
maximumasymptotic lattice temperature at (a) 335K (b) 365K and
(c) 390K (red dashed curves right axis)
4 Observation of the Debye -Waller effect in Au
71
Fig 49 shows again the temporal evolution of the relative changes of the X-ray
diffraction signal (data points note the flipped signal axis to the left) together with the
exponential fitting (black solid curve) The right axis displays the corresponding
lattice temperature obtained from the DWF The experimental data are compared to
calculated time dependencies (red dashed curves) of the lattice temperature obtained
from the TTM-calculations for maximumasymptotic lattice temperatures Tasy of (a)
335K (b) 365K and (c) 390K It is evident from this comparison that the TTM with
ldquostandardrdquo parameters (table 41) provides a good description of the experimental data
only for the highest fluence For the lower fluences the TTM predicts a faster energy
relaxationlattice heating than observed in the experiment Although B Rethfeld [229]
has predicted such a delayed energy exchange which deviates from the TTM for weak
excitation the effect will not be discussed further here because of the large error of
the experimentally determined time constant for the lower fluences At least for the
highest fluence the TTM provides a reasonable description of the experimental data
which are moreover in good agreement with previously published results [61 201]
45 Summary and conclusion
As the first time-revolved experiment performed with the improved modular
setup the observation of the Debye -Waller effect in Au and its good agreement with
both previous experimental results [61 201]
as well as the TTM at high fluences
demonstrates that it is well suited to perform time-resolved diffraction experiments
with good accuracy However this experiment also reveals a major limitation of the
setup Due to the narrow convergence angle of the incident X-ray beam an angular
compensation technique as discussed above needs to be applied to eliminate strain
effects As a consequence a pre-characterization of the response of a particular sample
is necessary This made the experiment quite time consuming and might have
introduced additional error sources The modular setup is therefore most suitable for
measurements where the position andor shape of the Bragg-peak does not change
4 Observation of the Debye -Waller effect in Au
72
upon laser-excitation (at least for a certain range of fluences andor pump-probe time
delays) As will be discussed in chapter 5 this is the case for laser-excited Bi where
the Bragg-peak does not start to shift for almost 5 ps after laser excitation
5 Extreme phonon softening in laser-excited Bi
73
5 Extreme phonon softening in laser-
excited Bi
Bi is a group-V (Nitrogen group) element which contains 5 electrons in its outer
shell It is stabilized at equilibrium into the A7 structure a rhombohedral structure
with two atoms per unit cell The pairing of these two atoms is attributed to the so-
called PeierlsndashJones mechanism [230]
This mechanism states that in order to arrange
the lattice system in the minimum energy configuration every second atom along the
body diagonal of the Bi unit cell ((111) direction) moves closer to one neighbor and
further away from the other leading to the pairing of atoms along the body diagonal
and doubling of the lattice constant As a consequence of this distortion a small band
gap is introduced at the Fermi level lowering the total energy of the occupied
electronic states and hence lowering the total energy of the system This opened band
gap is responsible for Bi being a semimetal A more detail description of the structure
of Bi will be presented in Section 51
Due to the unique properties of the broken symmetry ground state of the crystal
the equilibrium structure of Bi is sensitive to external perturbations ie changes of
pressure and temperature or electronic excitation [231- 234]
Among these perturbations
the ultrafast electronic excitation with ultrashort laser pulses is particularly unique
since the laser induced non-equilibrium states which depend on the excitation level
can be precisely controlled by adjusting the pump laser fluence and thus it can
provide unique non-equilibrium states of matter for the investigation of the transient
dynamics Following ultrafast laser excitation the valence electrons are promoted to
the conduction band The interatomic potential which defines the position of the
atoms in the unit cell is altered by the optically induced redistribution of electrons and
5 Extreme phonon softening in laser-excited Bi
74
the potential minima shift If this alteration occurs fast in comparison with the time
scale of atomic motion it triggers a coherent atomic motion around the new
equilibrium position along the body diagonal resulting in the modulation of the
equilibrium distance of the two paired atoms towards the phase of the higher
symmetry This coherent atomic motion represents the A1g optical phonon mode of
the crystal The generation mechanism has been named displacive excitation of
coherent phonons (DECP) [231 232]
which can be also considered as a special case of
impulsive stimulated Raman scattering for absorbing materials [235 236]
Within the framework of the DECP mechanism it has been predicted by
theory [237]
that the broken symmetry ground state of Bi (the Peierls distortion) can be
reversed with high enough density excitation This structural transformation is
accompanied by the change of the electronic properties The opened band gap at
Fermi level should close and Bi transforms from a semi-metal to a metal on the sub-
picosecond range The study of this phase transition process can provide important
information not only for the understanding of non-equilibrium structural dynamics in
Peierls distorted systems but also for designing future ultrafast electronic devices So
far it is not clear whether this phase transition can be achieved without subsequent
disorderingmelting of the Bi sample for an initial room temperature lattice Moreover
there is no experimental evidence yet that the structural phase transition to the high
symmetry state can be realized This experimental challenge has been addressed in
my PhD work
In this chapter the evolutions of laser-excited coherent optical phonons in Bi
have been investigated by directly monitoring the atomic motion using time-resolved
X-ray diffraction The observed extreme softening of the A1g phonon mode indicates
transient disappearance of the Peierls distortion This chapter is organized as follows
Section 51 provides a brief introduction of Bi Section 52 presents the experiment
results and discussion Section 53 summaries the main results of this chapter
5 Extreme phonon softening in laser-excited Bi
75
51 Research background
511 Structure of Bi and the phonons
The crystalline form of Bi is the di-atomic basis rhombohedral A7 structure [238]
which is derived from a simple cubic structure in two steps First a simple cubic
lattice is stretched along one of the body diagonals creating a smaller shear angle than
the cubic value of 60deg Then a Peierls instability [230]
causes the atoms to be displaced
along the same diagonal in opposite directions leading to a reduction of the structural
symmetry and a doubling of the lattice constant Fig 51 illustrates the primitive unit
cell of Bi The first atom is placed at the node of the primitive unit cell and the second
atom lies along the body diagonal with a slight displacement from the center of the
unit cell The length of the body diagonal is defined as d then the corresponding
distance for the second atom is xbulld At room temperature the lattice parameters are
a = b = c = 455 Aring body diagonal d = 1186 Aring and x = 0468 ie the distance of the
pair of atoms is xbulld = 55505 Aring
Fig 51 Primitive unit cell of Bi and the motion directions of the A1g
and Eg phonon mode
5 Extreme phonon softening in laser-excited Bi
76
Fig 52 Potential energy surface in Bi as a function of percentage of
electrons excited into the conduction band n and normalized atomic
distance x Picture reproduced from Ref [237]
Upon the external perturbations the motion of the two atoms against each other
along the body diagonal corresponds to the A1g-optical phonon mode The motion of
the atoms in the plane perpendicular to the body diagonal corresponds to the two
(degenerate) Eg-optical phonon modes (Fig 51) The work presented in this chapter
has focused on studying the laser excited A1g-optical phonon that can be characterized
by the changes of the normalized atomic distance x along the body diagonal Murray
et al have used density functional theory (DFT) to compute the potential energy
surface (PES) along x for different levels of electronic excitation [237]
Fig 52 (taken
from Ref [237]) displays the potential energy as a function of the percentage of
carriers excited into the conduction band and the normalized atomic distance x To
interpret the experimental results this PES will be frequently referred to in the
remaining sections of this chapter
512 Previous works
Bi has been studied by methods of ultrafast optics for over two decades The
coherent optical phonons launched in Bi after femtosecond laser excitation were first
5 Extreme phonon softening in laser-excited Bi
77
observed by Cheng et al [239]
in time-resolved reflectivity measurement By
monitoring the oscillations in the optical reflectivity the A1g phonon motion was
detected and its frequency compared to the results obtained by spontaneous Raman
scattering and inelastic neutron scattering [240]
Owing to the high temporal resolution
and high accuracy optical techniques are powerful to retrieve quantitative
information about the frequency of the excited phonon and its decay dynamics The
subsequent experiments explored coherent phonon dynamics by studying the phonon
frequency [231 232]
the electron-phonon energy coupling [241 242]
the temperature
dependence [236 243 244]
and the excitation level dependence [237 244-249]
The Eg mode
was also observed with optical techniques [236 244 249 250]
However optical techniques measure the modulation of the dielectric constant
Therefore they can provide only indirect information about the magnitude of the
atomic motion in the excited sample Providing direct information about the atomic
motion in laser-excited Bi ultrafast time-resolved X-ray diffraction [7-9 17 18 39-41 67-69
73 251 252] and electron diffraction
[12 13 81 253 254] have been recently applied Two
time-resolved X-ray diffraction experiments which are closely connected to the study
presented in this thesis will be described in detail in the following part
When a thin film sample with a thickness much smaller than the extinction
length [255 256]
is investigated with X-ray diffraction the secondary scattering of the
Bragg reflected beam can be neglected This treatment is known as the kinematic
approximation Thus the intensity of a particular Bragg reflection (hkl) of Bi is
determined by the squared modulus of the geometrical structure factor
22cos2 xlkhfFI Bihklhkl (51)
where h k and l are the Miller indices f Bi is the atomic scattering factor for Bi x
is normalized atomic distance which becomes time-dependent after laser excitation
If the Debye-Waller factor is assumed to be constant a direct indication of the atomic
displacement along the trigonal direction inside the unit cell after laser excitation can
be presented by the changes in the normalized diffraction signal for the (111) and
(222) reflections as
5 Extreme phonon softening in laser-excited Bi
78
)0(3cos
)(3cos
)0(
)(2
2
xn
txn
I
tI
nnn
nnn
n=1 for (111) n=2 for (222) reflection (52)
Figure 53 shows the normalized X-ray diffraction efficiency of the (111) and
(222) Bragg-peaks of Bi as a function of x The diffraction intensity is normalized to
the value of x = 0468 (actual equilibrium value in the unperturbed crystals) and
plotted as a function of x In the high-symmetry non-Peierls distorted state where
x = 05 (2nd
atom in the centre) diffraction from (111) planes is forbidden whereas
(222) diffraction becomes the minimal diffraction order and reaches a maximum
value Impulsive electronic excitation suddenly displaces the minimum of the PES
closer to x = 05 and the atoms are set in motion towards the new equilibrium position
As a consequence of this motion the changes in the X-ray diffraction signal are
expected to evolve in opposite directions An increase for the (222)-reflection and a
decrease for the (111)-reflection Following these initial changes the oscillatory
atomic motion around the new equilibrium position should give rise to oscillations of
both the (222)- and the (111)- diffraction signal with a frequency corresponding to
the A1g optical phonon mode
Fig 53 Normalized intensity of Bragg peak (111) and (222) versus
atomic displacement expressed in the relative position along the
body diagonal
5 Extreme phonon softening in laser-excited Bi
79
The first time resolved experiment where X-ray diffraction had been applied to
directly follow the atomic motion associated with the laser-excited coherent phonon
in Bi was performed by Sokolowski-Tinten et al [68 251]
In this work the evolutions
of two Bragg-reflections of a laser-excited 50 nm Bi thin film were measured (Fig
54) The frequency of the A1g mode was found to be only 212 THz substantially
smaller than the frequency of 292 THz measured in non-excited Bi (ie by Raman-
spectroscopy) The large displacements as well as the strong softening indicated
substantial changes of the interatomic potential which had not been observed before in
all-optical experiments
(a) (b)
Fig 54 X-ray diffraction efficiency of the (a) (111) and (b) (222)
reflections as a function of time delay between the optical pump
pulse and X-ray probe pulse Coherent phonon oscillations with
oscillation frequencies of 212 THz were observed Pictures
reproduced from Ref [68]
However due to the limited signal-to-noise ratio that was available with the laser
plasma-based source at that time this successful work was only achieved at a
relatively high excitation fluence A systematic investigation of the frequency and
amplitude dependence of the A1g phonon towards weaker excitation was required to
fill the gap to the all-optical work carried out with lower excitation fluences
Due to a significantly higher X-ray flux the Sub-Picosecond Pulse Source
(SPPS) [257]
at Stanford appeared to be the ideal X-ray source to perform this
experiment The softening of the A1g phonon mode as a function of excitation density
5 Extreme phonon softening in laser-excited Bi
80
and the detailed mapping of the carrier density-dependent PES were quantitatively
characterized for the first time by the work performed at the SPPS [69 186]
In this
work the optical phonon modes in Bi had been investigated at different absorbed
laser fluences up to 23 mJcm2 Fig 55 (a) shows four time traces for different
excitation fluences The optical phonon frequency as a function of the normalized
equilibrium atomic distance x is displayed in the inset of Fig 55 (a) A softening of
the A1g phonon frequency was found (from 291 THz down to 23 THz) with
increasing x These data provide direct information about the laser-induced changes of
the PES namely the position of potential minimum as well as its curvature In Fig
55 (b) a comparison between these measured data and theoretical calculations based
on DFT [237]
is presented A good agreement between the experiment and the DFT-
results is found
(a) (b)
Fig 55 (a) Bi (111) X-ray diffraction efficiency as a function of
time delay for different absorbed fluences 07 (green) 12 (orange)
17 (blue) and 23 mJcm2 (gray) The observed A1g optical phonon
frequencies are displayed in the inset as a function of x the new
normalized (quasi-)equilibrium atomic distance along the body
diagonal of the unit cell The dotted curve represents A1g
frequencies predicted from DFT calculations [237]
(b) Normalized
quasi-equilibrium atomic distance x as a function of carrier density n
with the overlaid excited state PES (false color) The white dotted
line represents the equilibrium atomic distance obtained with DFT
The red points are the measured data at the SPPS The Bi unit cell is
depicted in the top right The ratio of yellow bar to red bar
determines x Pictures reproduced from Ref [69]
5 Extreme phonon softening in laser-excited Bi
81
These results bridged the gap between the existing work on low and high
fluence However another interesting question has been raised here Could the system
when excited with higher fluence be really driven back to the high symmetry state
(x = 05) and could the Peierls distortion be reversed To answer this question I have
extended the studies of coherent optical phonons in Bi to a higher excitation fluence
regime that has not been studied previously By using the modular setup [chapter 3]
time-resolved X-ray diffraction experiments were performed A complete softening of
the excited A1g mode is observed in the high level excitation data This represents
conclusive experimental evidence that the Peierls distortion which defines the
equilibrium structure of Bi is transiently reversed
52 Experiments and discussion
521 Method
The measurements were performed using the modular setup which was already
introduced in chapter 3 (Fig 31) X-ray pulses at a photon energy of 805 keV
(wavelength 154Aring) were used The (111)- oriented crystalline Bi sample (50 nm film
on Silicon same type of sample which was used in the previous experiments [68 69]
More details on relevant parameters of the Bi sample used in this work are provided
in Appendix C) is placed under the appropriate Bragg-angle 1124deg for (111)-
reflection and 2294deg for (222)-reflection To launch the A1g optical phonon mode
through displacive excitation the sample was optically excited by near-infrared (800
nm) femtosecond laser pulses with (absorbed) fluences from 1 mJcm2 to 42 mJcm
2
It should be noted that for absorbed fluences above 25 mJcm2 the sample suffered
damage after excitation with many pulses The damage could be detected by
monitoring (with a CCD-camera) the scattered fraction of the incident pump light
which increased significantly upon damage From the fact that the increase of pump
light scattering occurred long before permanent changes in the X-ray diffraction
5 Extreme phonon softening in laser-excited Bi
82
signals could be observed it can be concluded that multi-pulse damage occurs initially
only at the very surface of the sample Still when this increase in scattering was
observed the sample was shifted to a fresh spot The atomic motion was probed by
measuring the diffraction of the X-ray probe pulses after a controlled time delay with
respect to the pump laser pulses In order to maximize the accuracy of the experiment
and to observe small changes in the diffraction signals the direct normalization
scheme with ldquofastrdquo scanning (see chapter 3) had been applied in the measurements
The diffraction signals of the (111)- and (222)-reflection are recorded with the silicon
avalanche photodiode and the signal from the ionization chamber detector is used for
normalization The typical time required to measure a complete time-dependence
(approx 180 delay points) of one diffraction order for one fluence with an accuracy of
approximately 1 was around 6 hours Comparing to the 12 hours per measurement
using the Ti Kα source reported by Sokolowski-Tinten et al [68]
(accuracy approx
2) this represents a significant improvement
522 Preliminary measurements
Before performing the time-resolved experiments for studying laser-excited
coherent optical phonons in Bi two preliminary experiments were carried out to
characterize the structural response of the sample upon ultrafast optical excitation
Fig 56 shows the diffraction signal of the Bi (111)-reflection and the (substrate)
Si (111)-reflection as a function of sample angle The lattice mismatch provides
sufficient angular separation of the diffraction signal from the Bi film and the
diffraction signal from the Si substrate As expected the diffraction signal of the bulk
Si-substrate is significantly stronger (approx 20times) than the diffraction from the thin
Bi-film Another important information obtained from this measurement is that the
angular width of the Bi diffraction curve (03deg FWHM) is larger than the angular
width of the incident X-ray beam (017deg FWHM) As it had been discussed in the
previous chapters in this case the experiments will be performed at a fixed sample
angle corresponding to the maximum detected diffraction signal
5 Extreme phonon softening in laser-excited Bi
83
Fig 56 The diffraction signal of Bi (111)-reflection and (substrate)
Si (111)-reflection as a function of sample angle Both signals are
normalized to the maximal value of Bi (111) signal
A preliminary time revolved measurement was performed on the (111)-reflection
with an area detector (ldquoGemstarrdquo camera) This measurement allowed to
approximately determine time delay zero and provided some information on the
temporal evolution of signal intensity and in particular on the changes of the angular
position of the diffraction peak upon laser excitation The incident pump fluence in
this measurement was about 5 mJcm2 The measured results are displayed in Fig 57
Despite the low accuracy of this measurement three different stages in the temporal
evolution of the diffraction intensity can be recognized Immediately after the photo-
excitation a rapid decrease in the diffraction efficiency is observed followed by a
partial recovery of the diffraction signal during the next 5 ps After that the diffraction
intensity starts to decrease again on a 10 ps time-scale On the other hand the angular
position of the (111)-diffraction peak starts to change only after 5 - 7 ps The shift to
smaller diffraction angles indicates lattice expansion
5 Extreme phonon softening in laser-excited Bi
84
In consequence the initial decrease of the diffraction signal and the 5 ps
recovery are attributed to changes of the structure factor and thus changes of the
normalized atomic distance x upon electronic excitation and subsequent relaxation
However the expected signal oscillations could not be resolved due to the limited
accuracy and the coarse delay spacing Moreover it is important to note that
measurements on Bi can be performed within a time window of about 5 ps without a
correction of the angle of incidence of the X-ray beam as it was necessary for the case
of Au (compare discussion in chapter 4) The following detailed investigation of the
coherent optical phonon concentrates therefore on this time window of about 5 ps
after excitation (marked with the blue dashed-dotted line in Fig 57) where the
changes of the signal intensity caused by the shift of the Bragg peak are negligible
Fig 57 Time revolved measurement with the Gemstar camera The
left axis shows the position of the center of gravity of the Bi (111)
rocking curve The right axis showed the integrated intensity of the
diffracted signal
5 Extreme phonon softening in laser-excited Bi
85
523 Results of time resolved measurements and discussion
Before presenting the experimental results and discussion it should be noted that
the effective energy deposition depth of 800nm fs laser pulses is approximately
26 nm [73]
This means that initially only half of the sample thickness (50 nm) is
excited The spatially inhomogeneous excitation of the sample needs to be taken into
account in the following discussion
Fig 58 shows representative examples of time-traces of the normalized
diffraction efficiency of the (111)- (a) and the (222)- reflection (b) for different pump
laser fluences Since the absolute time-zero in these experiments is only known to an
accuracy of about +- 150 fs the zero-delay point is arbitrarily set for each curve at
the half maximum of the initial transient change A typical error bar of the measured
data is given at the end of each curve While the (111)-reflection exhibits a fluence
dependent initial drop followed by oscillations and a slow recovery the (222)-
reflection initially increases in diffraction efficiency followed also by oscillations and
a slow recovery This behavior is similar to the results reported in the previous
studies [68 69]
and can be readily interpreted by considering the changes of the
geometrical structure factor (see Fig 53) within the DECP-picture The initial
transient change is ascribed to photon-induced alteration of the minimum position of
the PES that leads to a atomic motion towards a symmetric arrangement (x = 05) The
following oscillations correspond to the A1g coherent optical phonon mode of the
lattice and the recovery of the diffraction efficiency is attributed to restoration of the
PES to its equilibrium state
5 Extreme phonon softening in laser-excited Bi
86
Fig 58 X-ray diffraction efficiency (a) (111)-reflection and (b)
(222)-reflection of a 50 nm (111)-oriented Bi-film as a function of
pump-probe time delay for different excitation fluences The zero-
delay point is set at the half maximum of the initial transient change
A typical error bar of the measured data is given at the end of each
curve
It should be noted that Fig 53 only takes into account changes of x Upon laser-
excitation other effects become important as well For example the Debye-Waller
5 Extreme phonon softening in laser-excited Bi
87
effect caused by an increase of the lattice temperature (incoherent phonons) also
affects the X-ray diffraction efficiency (see Chapter 4) Although the Debye-Waller
effect can be neglected for the first few hundred femtoseconds after laser excitation
since the energy exchange between the initially excited hot electrons and the lattice
system occurs typically on a time-scale of a few ps it should be considered in the
later recovery processes For the (111)-reflection the change in the Debye-Waller
factor is calculated to be a few percent from room temperature up to the melting
temperature [186]
Relative to the signal changes associated with the induced changes
in x the drop in the signal induced by the Debye-Waller effect is negligible On the
other hand for the (222)-reflection the change in the Debye-Waller factor is 4 times
larger for the same temperature increase and comparable to the effects caused by
changes in x The decrease of the mean value of the normalized (222) diffraction
signal to values below that of the unexcited sample is tentatively attributed to the
combination of the restoration of the PES and the DebyendashWaller effect
In the following section the magnitude of the initial change of the diffraction
efficiency and the frequency of the following oscillatory part are retrieved from the
measured time traces and will be discussed in detail
The initial maximum diffraction efficiency changes ΔI111 and ΔI222 as a function
of laser pump fluence (red (111)-refl black (222)-refl) are shown in Fig 59 Data
obtained at the SPPS (green) [69]
are also plotted in the figure for comparison and they
are consistent with the new results The linear fits of the data points reveal that the
initial changes of both reflections are linearly dependent on absorbed fluence From
the comparison of the ratio of ΔI111ΔI222 = - (28 plusmn 02) obtained from the fitting
slopes and the value of -235 as estimated from the change of the geometrical
structure factor upon the increase of the Bi-Bi distance x a rough agreement of both
values is found and this clearly demonstrates that the coherent motion of atoms is the
leading contribution which influences the initial changes of the diffraction efficiencies
The initial atomic motion is proved to be mainly coherent
5 Extreme phonon softening in laser-excited Bi
88
Fig 59 Initial maximum changes of the diffraction efficiencies for
the (111)-reflection (red) and the (222)-reflection (black)
respectively as a function of pump laser fluence The red and black
dashed lines are the linear fits for the measured data The data
obtained at the SPPS (green) [69]
is also plotted in the figure for
comparison
To determine the frequencies from the oscillatory part of the measured
diffraction efficiencies a Fast Fourier Transform (FFT) had been applied to all
measured time traces including others not shown in Fig 58 The slow background
components (initial changes and the slow recovery) are subtracted from the time-
traces before transformation As an example Fig 510 shows as red solid curve one of
those FFT results obtained from a time trace of the (222)-reflection measured at
23 mJcm2
absorbed fluence The FFT is characterized by one main peak at 24 THz
and a number of secondary peaks Due to the limited number of phonon periods
covered in this measurements as well as the small amplitude of the oscillations a
relatively low signal to noise ratio in this Fourier transform analysis is expected
Therefore only the frequency with the highest amplitude representing the main
contribution of the atomic motion is considered as reliable Since the understanding
5 Extreme phonon softening in laser-excited Bi
89
of the other observable frequency components is still an open question they will not
be discussed further in this thesis
Fig 510 FFT-spectra of the time traces of Bi 222-reflection with
23 mJcm2
absorbed fluence The solid curve and the dotted curves
(6 examples) represent the FFT results obtained from the mean time
trace and the random time traces produced within its error bar
respectively
In order to validate this approach and to assess the accuracy of the obtained
frequencies it is necessary to check how the dominant frequencies are influenced by
the measurement errors The following procedure demonstrated with the time trace
used above (222-reflection at 23 mJcm2
absorbed fluence) is applied For each time
trace the signal values of the individual data points are randomly changed within the
limits set by the error bars In this way a set of artificial time-traces is produced which
represent - within the error - possible time traces The variation of the FFT-spectra
of all this possible time-traces allows to estimate the error in the FFT and to asses
which frequency components can be regarded as real In Fig 510 six of these FFT-
spectra are presented as dotted curves With respect to the main peak (the solid curve)
it can be concluded that the measurement errors slightly change its amplitude and
width but do not affect much its position The variation of the peak position is
5 Extreme phonon softening in laser-excited Bi
90
significantly smaller than the peak width which I consider in the following as the
error of the measured frequency In conclusion the dominant frequency obtained
from the FFT can be regarded as reliable and it is assumed that it represents the A1g-
phonon mode Some more FFT-spectra obtained from the measured time-
dependencies of the diffraction efficiency are presented in Fig 511
Fig 511 FFT-spectra of the measured diffraction efficiencies for
different absorbed fluences The dominant frequency in each figure
is marked by the blue arrow
5 Extreme phonon softening in laser-excited Bi
91
Fig 511 clearly indicates that for each fluence a unique dominant frequency
can be determined as marked with the blue arrow The only exception is the one at
F = 32 mJcm2 where several peaks of equal strength are found Fig 512 summarizes
the result of the FFT-analysis It shows the determined dominant frequency as a
function of fluence The frequency error bars represent the FWHM of a Gaussian fit
to the dominant peak
Fig 512 Frequency of the excited A1g-mode as function of laser
fluence derived from the time resolved diffraction data red 111-
reflection green 222-reflection violet data obtained from earlier
results at University Duisburg-Essen (UDE) [68]
blue data obtained
at the SPPS [69]
Cyan A1g-frequency of unexcited Bi black dashed
line guide to the eye Insert DFT calculations from Murray et al [237]
The solid and dashed lines show the anharmonic and harmonic
frequencies as a function of carrier density n respectively
In Fig 512 the red and green data points represent the new data from my
measurements At lower fluences they compare well with the results obtained earlier
which have discussed above (violet point Ref [68] blue points Ref [69] Most
strikingly these experimental data reveal an extreme softening of the A1g-mode for
5 Extreme phonon softening in laser-excited Bi
92
high fluences (gt 2 mJcm2) Particularly by extrapolating the measured data (black
dashed line as a guide to the eye) a complete softening at fluences of 30 to
33 mJcm2 is expected At first glance surprising a further increase of fluence leads
to the revival of the signal oscillations and an increase of the mode-frequency The
complete softening and later stiffening of the A1g-mode clearly indicate that the
Peierls distortion is transiently reversed for fluences above approx 30 mJcm2
Further evidence can be found in Fig 59 where initial signal changes of (111) and
(222) diffractions reach approx -50 and 20 at this excitation level respectively
These results agree with estimates based on the geometrical structure factor (see Fig
53) assuming that about half of the film thickness had been excited to the symmetric
arrangement x = 05 (where the 111-reflection is fully forbidden)
In order to compare my measured results with the theoretical predictions of the
DFT-calculations performed by Murray et al [237]
the calculated harmonic and
anharmonic phonon frequencies using the PES are presented in the inset of Fig 512
as a function of carrier density n One can immediately see qualitative agreement
between the experiment and the calculation The harmonic frequency computed from
the curvature of the PES at the minimum under the assumption of harmonic
approximation The anharmonic frequency obtained from the inverse of the actual
cycle period of atomic motion in the anharmonic potential More detailed
interpretations of the two frequencies are provided in Ref [237] and [258] At low
excitation level as already proved by experiment [69]
there is little difference between
the harmonic and anharmonic frequency The difference becomes apparent at high
excitation levels where the range of atomic motion increases leading to an
anharmonic oscillation of the atoms along the asymmetric part of the PES A detailed
interpretation of atomic motion upon laser excitation is given in the following
5 Extreme phonon softening in laser-excited Bi
93
Fig 513 Sketch of the interatomic potential energy surface of Bi
upon laser excitation The black curve represents the shape of initial
equilibrium PES The others represent (qualitatively) the shape of
PES upon different excitation levels For illustrative purpose the
curves are adjusted to be separated in arbitrary unit The dashed
curves along the surface indicate the range of atomic motions
Within the DECP-picture the atoms are immediately displaced from their
(transient) equilibrium position due to the impulsive laser induced change in the PES
A restoring force whose magnitude and direction are determined by the gradient of
the PES is exerted on the atoms setting them in motion The frequencies extracted
from the X-ray diffraction signals displayed in Fig 512 directly reflect this transient
atomic motion along the PES and yield information regarding the curvature of the
PES of the excited sample In order to concisely interpret this oscillatory behavior I
illustrate qualitatively the shapes of the PES of Bi upon laser excitation and the
possible range of atomic motion in Fig 513
The initial equilibrium PES of Bi has a double well structure with the minimum
position at x = 0468 (curve (a)) For weak excitation a slight shift of the minimum
position of the PES and a slight decrease of the Peierls barrier can be seen (curve (b))
The atomic motion is limited to a small range around the equilibrium position and the
5 Extreme phonon softening in laser-excited Bi
94
atom oscillates harmonically along the PES Anharmonicity is negligible The
frequency drops approximately linearly with excitation fluence This situation
corresponds to the excitation level up to 15 of carrier density in the DFT
calculation and excitation fluences below 25 mJcm2 in Fig 512 Extensive studies
[68 69 237 244-246 248 249 259] on the generation of coherent optical phonons in Bi have
been performed in this region with time-resolved optical and X-ray techniques Up to
now no study has been carried out beyond this level of excitation The behavior in
this unexplored area has been revealed in this work
Following the increase of the excitation level the range of oscillatory atomic
motion becomes larger (curve c) The asymmetric anharmonic shape of the PES leads
to an additional increase of the period of atomic motion which defines the
anharmonic phonon frequency shown in the inset of Fig 512 It differs
significantly from the harmonic frequency (defined by the curvature of the PES at the
minimum) This situation corresponds to 15 ~ 2 of excited carrier density in the
DFT calculations and the excitation fluences of 25 ~ 3 mJcm2 in Fig 512
Upon further increase of excitation the system can reach the particular state in
which the Peierls barrier becomes low enough to let the atom just climb to its top
where it stops (curve d) In this labile equilibrium atomic motion freezes and the
anharmonic frequency becomes zero After reaching the above particular state the
Peierls barrier is further lowered by an increased fluence and the atom is allowed to
cross the x = 05 position and moving in both wells (curve e) As the atomic motion
restarts the phonon frequency revives Upon further increase in fluence the double
well and the barrier vanish The minimum of the PES is now at x = 05 which means
that the Peierls distortion has been transiently reversed Right at the transition the
harmonic term of the PES vanishes (curve f) which corresponds to the situation where
the harmonic frequency becomes zero These happen at an excitation level of 2 ~
27 of carrier density in the DFT calculation and absorbed laser fluences between
30 to 33 mJcm2 in Fig 512
With the further increase of excitation level corresponding to the value beyond
27 of carrier density in the DFT calculation and absorbed laser fluences above 33
5 Extreme phonon softening in laser-excited Bi
95
mJcm2 in Fig 512 the PES is continuously altered and the two minima converge to
one transforming the flat profile to the sharp parabola with the minimum position at
x = 05 (curve g and h) As the relative potential energy (to the minimum of the PES)
increases the atom moves along a parabolic surface with higher velocity thus
shortening the motion period and leading to an increase in the phonon frequency The
A1g phonon mode stiffens However it should be noted that due to the already
reversed Peierls distortion and the transformation into a more symmetric structure
with only one atom per unit cell this atomic motion correspond now to an acoustic
phonon mode at the new Brillouin-zone boundary
In contradiction with the above description about the range of atomic motion the
observed oscillation amplitudes in the measured data (see Fig 58) are much smaller
compared to the average signal change A very strong damping in the A1g atomic
motion can be responsible for the observation The reason of the damping effect is not
fully understood yet Considering the high excitation level applied in the
measurements a coupling of the A1g mode to other modes (eg Eg mode) which was
proposed in the earlier electron diffraction experiment [81]
and predicted in calculation
by Zijlstra et al [260]
could be the reasonable explanation for this effect Since the
system performs small amplitude oscillations around the new equilibrium
positionpotential minimum I suppose the experimental results are more suitable to be
described by the harmonic frequency
Finally it should be noted that the above description of the A1g phonon behavior
follows the results of the first principles DFT calculation [237]
which applies separate
chemical potentials for electrons and holes This model has been proved to be
quantitatively correct for low excitation fluences [69]
and at least qualitatively in good
agreement with my experimental results The other approach proposed by
Zijlstra et al [260]
using all-electron full-potential linearized augmented planewave
method (FLAPW) [261 262]
provides a description not only on A1g phonon but also on
Eg phonon and interactions between them This model could be more accurate for the
situation of Bi at the high level excitation While these two theoretical calculations
5 Extreme phonon softening in laser-excited Bi
96
differ quantitatively they qualitatively predict similar changes of the PES and the
phonon frequency
53 Summary
In summary an investigation of the laser-excited A1g coherent optical phonon
mode in Bi was performed with the laser plasma X-ray source The reversal of Peierls
distortion as well as the coherent motions of atoms in Bi following laser excitation
was observed In the low excitation regime the data agree with previous results
obtained at UDE and the SPPS In the strong excitation regime (absorbed laser
fluences gt 2 mJcm2) an extreme softening of the A1g mode was observed and an
interpretation was given Particularly the observation of a complete softening
(frequency down to zero) at fluences of 30 to 33 mJcm2 indicates that the Peierls
distortion defining the equilibrium structure of Bi transiently vanishes At even
stronger excitation (absorbed laser fluences gt 33 mJcm2) Bi starts to respond as a
material arranged in the structure with half of its equilibrium lattice constant and the
atomic motion becomes a Brillouin-zone boundary acoustic phonon mode These
observations follow at least qualitatively the predictions of calculations based on DFT
[237 260]
However due to the limited experimental accuracy these results do not provide
more detailed information with respect to the damping behavior of the oscillations the
decay of coherent phonons and the coupling of the phonon modes For further detailed
investigation in the high excitation region more powerful X-ray sources (eg XFEL
or LCLS) are needed
As already mentioned in the experimental section accumulative sample damage
was observed when absorbed fluences beyond 25 mJcm2 are used It indicates that
the applied excitation density is close to the melting threshold of the Bi sample It
questions how the phonons respond to excitations far beyond the melting threshold
which allow the melting of Bi sample with a single laser pulse Such a question had
recently been investigated by Sciaini et al [81] The ultrafast melting of Bi had been
5 Extreme phonon softening in laser-excited Bi
97
observed with time-resolved electron diffraction It was found that under extreme
excitation conditions the disordering of the Bi crystal structure occurs within 190 fs
which is substantially shorter than the disordering time determined by lattice heating
indicating a non-thermal melting process The authors attribute such surprising speed
of the non-thermal solid-to-liquid phase transition in Bi to laser induced changes in
the PES which result in strong acceleration of atoms along the longitudinal direction
(A1g mode) and an efficient coupling of this motion to the transverse mode (Eg mode)
This coupling effect had also been theoretically predicted by Zijlstra et al [260]
in high
excitation regime In order to obtain the insight into more details of DECP mechanism
and subsequent phonon dynamics at the high excitation regime the Eg phonon motion
as well as the coupling effect of A1g and Eg mode should be included in this study
However since amplitude of the Eg mode is much smaller than the one of the A1g
mode and the experimental geometry in this measurement is not sensitive to Eg
motions the Eg phonon mode as well as the coupling effect has not been observed in
my data
Nevertheless a complete insight of A1g optical phonon dynamics in laser excited
Bi from the weak excitation to melting is provided now from the results of three
excitation levels (low data from SPPS high data in this thesis extreme data from
electron diffraction) The transient reversal of Peierls distortion happening before the
disordering of Bi crystal structure has been experimentally confirmed The structural
change resulting from the coherent phonons has been indicated by the appearance of
the acoustic phonon mode Since many properties of a solid including the electronic
thermal and optical properties are affected by lattice structure this knowledge of
ultrafast structural changes caused by electronically altered energy surfaces can be
extended to understand not only the phonon dynamics of other Peierls distorted
materials (Sb and As) but also the mechanism of ultrafast phase transition in other
functional materials eg insulator-metal transition in VO2 [263 264]
and crystalline-
amorphous transition in chalcogenide alloys [265 266]
6 Towards time-resolved Debye-Scherrer X-ray diffraction
98
6 Towards time-resolved Debye-Scherrer
X-ray diffraction
The observation of the transient changes of a single Bragg-reflection in a
femtosecond X-ray diffraction measurement provides only limited information about
the transient structural response of optically excited materials To obtain a more
complete picture of the induced processes it is desirable to monitor as many Bragg
peaks as possible The Bragg diffraction scheme with a monochromatic source applied
in the experiments discussed in chapter 4 and 5 requires single crystalline samples of
high quality and thus the range of materials that can be studied is limited Moreover
a sequential measurement of many individual Bragg peaks is time consuming and
difficult to handle due to multiple sample adjustments (sample rotations) as well as
the instability of the laser and X-ray sources One alternative for effectively
measuring multiple diffraction peaks with single crystalline sample is the so-called
rotating-crystal method [74]
By rotating a single crystalline sample at a high constant
angular velocity (eg 180degs) the Bragg condition for different diffraction peaks is
fulfilled and simultaneously allowing a detection of a larger number of transient
diffraction peaks under the same experimental conditions in one measurement Again
this method requires good sample preparation precise mounting and alignment of the
sample as well as extremely stable mechanical components
Moreover not all materials can be prepared as crystalline thin films (thin films
are necessary in order to match the optical absorption depth to the X-ray probing
depth) On the other hand many materials can be prepared in polycrystalline form
For polycrystalline materials the well-known Debye-Scherrer scheme [267]
represents a
simpler approach to access simultaneously multiple Bragg peaks The simultaneous
6 Towards time-resolved Debye-Scherrer X-ray diffraction
99
detection of several reflectionsdiffraction rings without additional (sample
adjustments and mechanical stability) requirements allows conveniently getting as
much as possible information of the sample from one measurement A successful
time-resolved experiment using the Debye-Scherrer scheme on a thick (250 microm)
powder sample has been recently reported [106]
Since a material with a large unit cell
size was used multiple diffraction rings were recorded simultaneously proving the
relocation of charges within the unit cell with a time resolution of 100 fs This result
demonstrates the feasibility of using a laser-plasma based X-ray source for
investigating a wide range of polycrystalline inorganic and organic materials with
time-resolved Debye-Scherrer diffraction
The use of an X-ray optic with high magnification in the modular setup (see in
chapter 3) can provide a quasi-collimated beam well suited for the Debye-Scherrer
diffraction scheme In the work discussed in this chapter I performed Debye-Scherrer
X-ray diffraction experiments on thin polycrystalline metal films and I demonstrated
the possibility to perform time-resolved experiments with the modular setup The first
part of this chapter presents the experimental configuration In the second part static
Debye-Scherrer diffraction measurements on a 20μm Cu foil are presented This
measurement serves as comparison to results previously obtained by U Shymanovich
using a different kind of focusing X-ray optic (elliptical capillary) [105]
In the third
part of this chapter results of a time-resolved X-ray Debye-Scherrer diffraction
measurement on a 200 nm Au film are presented and discussed
6 Towards time-resolved Debye-Scherrer X-ray diffraction
100
61 Experimental configuration
(a)
(b) (c)
Fig 61 Experimental configuration (a) The principle schema of the
experimental setup (b) A photo of the arrangement of sample and X-
ray area detector (c) The configuration of the experiment for an Au
sample
A schematic of the experimental setup is shown in Fig 61 (a) The femtosecond
X-ray pulses are collected by the X-ray multilayer optic and focused on a
polycrystalline thin film sample at normal incidence Comparing to the experiments
described in the previous chapters no special alignment of the sample is necessary
due to its polycrystalline structure The diffraction pattern from the sample forms a
series diffraction cones Each diffraction cone corresponds to the diffraction from the
same family of crystalline planes in all the participating crystallites For the detection
a large area detector is required to cover a sufficiently large angular range In the
experiment discussed here the phosphor-based MCP amplified X-ray area detector
(ie ldquoGemstarrdquo) was utilized for this purpose This camera has already been
mentioned in chapter 3 and its working principle and detailed parameters are provided
Thin Film Sample
CC
D
Multilayer
X-ray Optic
Plasma
Kα-Source
6 Towards time-resolved Debye-Scherrer X-ray diffraction
101
in Appendix B In order to simultaneously record as many diffraction orders as
possible the camera was placed not normal to the incident beam Fig 61 (b) presents
a photo of the sample and camera arrangement In Fig 61 (c) the detectable
diffraction orders have been depicted for Au as an example Their corresponding
diffraction angles are shown in the insert of Fig 61 (c) Note that due to the limited
size of the detector only parts of the different rings are recorded (see below)
62 Static Debye-Scherrer measurements
(a) (c)
(b) (d)
Fig 62 Diffraction pattern of a 20μm polycrystalline Cu foil with
Cu Kα X-ray source The CCD images in (a) and (c) are obtained
using multilayer optic and capillary optic respectively (b) and (d)
are the radial cross section of image (a) and (c) respectively (c) and
(d) reproduced from Ref [105]
In order to test the feasibility of the experiment and the capability of the setup I
first performed a (static) Debye-Scherrer diffraction experiment on a 20 μm thick Cu
6 Towards time-resolved Debye-Scherrer X-ray diffraction
102
foil This sample was used in the above mentioned previous study with the elliptical
capillary optic [105]
and it provided sufficient diffraction signals to record the Debye-
Scherrer diffraction pattern Using the sample this time with the multilayer optic
offered an opportunity to compare results obtained with different types of X-ray
optics
The detailed parameters of the experiment and the accessible diffraction orders
of Cu with Cu Kα X-ray (805 keV) are provided in Appendix C A typical Debye-
Scherrer diffraction pattern obtained using the multilayer optic with 5 minutes
exposure time is given in Fig 62 (a) It can be seen that three different diffraction
rings are detected simultaneously These rings are the intersections of the diffraction
cones and the detector plane The shape of a complete ring which can be a circle an
ellipse a parabola or a hyperbola depends on the angle of the detector plane with
respect to the incoming X-ray beam In order to derive the intensity of diffraction X-
ray as a function of diffraction angle I() from this CCD image one needs to integrate
the pixel intensity along the ring in which the pixels belong to the same Thus a
complete diffraction ring for a corresponding needs to be reconstructed Considering
that only small fractions of the rings are detected by the CCD the curvatures of the
detected parts are small enough to allow these ring patterns being reconstructed by
approximating them as circles As it can be seen in Fig 63 (a) the coordinate origin
is set at the middle of the left edge of the CCD image By sampling the coordinates
from each ring their individual circle parameters (0x
0y and R ) for a circle
approximation ( 22
0
2
0 )( Ryyxx ) can be obtained Knowing these
parameters the full ring pattern out of CCD plane for each diffraction order can be
reconstructed The zoom of CCD plane (Fig 63(b)) presenting the well overlapping
of X-ray and the reconstructed rings demonstrates feasibility of this reconstruction
With these circle fitting functions the circle parameters ( 0x 0y and R ) as a function
of the x coordinate on the line y = 0 are obtained as displayed in Fig 63 (c) For each
x coordinate (from 1 to 1392) a corresponding ring can be deduced Each point (xy)
of the image belongs to one of these rings By integrating the pixel intensity along
6 Towards time-resolved Debye-Scherrer X-ray diffraction
103
each ring and projecting all data on the line y = 0 the X-ray intensity as a function of
x coordinate is obtained Converting the pixel coordinate to the angular coordinate by
applying the known angular positions of the corresponding detected diffraction orders
the diffraction X-ray intensity as a function of diffraction angle is finally derived The
result of this data processing for Fig 62 (a) is given in Fig 62 (b)
Fig 63 Reconstruction of the diffraction pattern in order to extract
the diffracted X-ray intensity as a function of diffraction angle (a)
Chosen coordinate system and the reconstructed ring pattern (b)
Zoom of the CCD image plane showing the overlap of the measured
diffraction pattern with the reconstructed rings (c) Circle fit
parameters (0x
0y and R ) of each diffraction ring as a function of x
coordinate on the y=0 line The dashed lines are the 2nd
order
Polynomial Fit for the data points
To compare my result with that obtained with a different kind of collimating
X-ray optic namely the elliptical capillary optics [105]
a CCD image from this study
and its radial profile are displayed in Fig 62 (c) and (d) The elliptical capillary
optics uses total reflection All incident X-rays passing through the capillary with an
angle smaller than the angle of total reflection undergo total reflection at its inner
6 Towards time-resolved Debye-Scherrer X-ray diffraction
104
surface The angle of total reflection has a weak dependence on the wavelength of the
X-rays and thus the optic is not wavelength sensitive Therefore more diffraction
orders originating from Kα and also Kβ radiation can be observed in Fig 62 (c)
instead of only three diffraction orders from the monochromatizing multilayer optics
The noisy background observed in Fig 62 (d) is caused by the unfocused radiation
passing directly through the capillary optic without reflection
In conclusion due to the monochromatic reflection of the multilayer optic and
the optimized Kα flux of the laser-plasma source (see chapter 2) the modular setup
can provide Debye-Scherrer diffraction patterns with much better signal-to-noise ratio
than those obtained previously [105]
63 Time-resolved Debye-Scherrer experiment
The absorption depth of a metal at visible and near-infrared wavelengths is
typically less than 20 nm [113]
However multi-keV X-ray penetrate much deeper [189]
In particular with the transmission geometry used in this experiment the 20 μm Cu
sample presented in the former section is not a suitable sample to perform time-
resolved experiments because it can not be effectively excited by the optical radiation
over the whole depth probed by the X-rays Therefore in the experiments discussed in
this section a 200 nm thick free standing Au thin film [268]
was used as sample to
demonstrate the feasibility of time-resolved Debey-Scherrer diffraction
6 Towards time-resolved Debye-Scherrer X-ray diffraction
105
631 Static Debye-Scherrer-diffraction pattern of the Au
thin film
(a)
(b)
Fig 64 Diffraction pattern of a 200 nm polycrystalline Au film (a)
CCD image (b) Radial cross section of (a)
The detailed parameters of the experiment and the detectable diffraction orders
6 Towards time-resolved Debye-Scherrer X-ray diffraction
106
for Au are provided in Appendix C and Fig 61 (c) The static Debye-Scherrer-
diffraction pattern of the Au thin film is presented in Fig 64 (a) Using a similar
experimental configuration as described in the previous section four diffraction
orders were observed in this case due to the larger lattice constant of Au as compared
to Cu I() is obtained in the same way as described in the previous section and shown
in Fig 64 (b) Compared to result with 20 μm Cu foil (Fig 62 (b)) the signal-to-
noise ratio becomes much worse Such a difference is attributed to the small thickness
of this sample the total intensities of the diffraction peaks decrease with sample
thickness whereas the noise (background signal) coming from the scattering of X-ray
are barely affected by the sample thickness
632 Results of time-resolved pump-probe measurements
In the timendashresolved measurement the incident fluence of the pump beam was
set to 160 mJcm2 (wavelength 800 nm) The diffraction patterns were recorded using
again the Phosphor-based X-ray area detector An exposure time of 5 minutes had
been chosen for each delay point After subtracting the CCD background the images
for a given delay were processed using a MatLab program (with the same routines
described in section 62) to obtain I()) By analyzing the transient changes of I()
the laser induced changes can be deduced
6 Towards time-resolved Debye-Scherrer X-ray diffraction
107
Fig 65 Comparison of the signal from non-excited and excited Au
sample (a) Radial cross sections obtained from measured data (b)
The selected profiles above the noisy background (about 30 of the
peak value) are fitted with Gaussian function
It is known since many years that the excitation of a thin metal film with an
ultrashort optical pump pulse leads to several effects which can be observed with
time resolved techniques [42 75 269 270]
Generally the changes of the diffraction
intensity due to the Debye-Waller effect and the changes of the diffraction angle due
to laser induced strain can be extracted from the measured time resolved data Both
effects have been discussed in Chapter 4 The amplitude of these changes is more
pronounced for higher diffraction orders (see the discussion in section 42 and the
latter discussion in section 633) Therefore I focused in the analysis on the two
highest diffraction orders (311) and (220) Since the reduction of the diffraction
intensity due to the Debye-Waller effect could not clearly be observed in these
measurements as will be explained in section 633 I will only discuss the observed
changes in the angular position of the Bragg-peaks attributed to strain caused by
acoustic waves
The changes of the diffraction pattern induced by the optical excitation are
6 Towards time-resolved Debye-Scherrer X-ray diffraction
108
presented in Fig 65 (a) where the I()-data for the non-excited sample (black-dotted
curve) and for a delay of 70 ps between the optical pump and the X-ray probe (green
dotted curve) are shown Shifts of both Bragg peaks are clearly observable In order to
quantify the shift the two selected Bragg-peaks have been fitted using the Gaussian
function To eliminate any effects of the noisy background on the fitting only data
points with an intensity larger than 30 of the peak intensity (blue and red curves in
Fig 65) have been used for the fitting The results are shown in Fig 65 (b) as dashed
curves and the peak positions and their error bars are obtained from the fitting
parameters Applying the same routine to all measured diffraction profiles the peak
positions as a function of delay time for the (311) and (220) Bragg reflections were
obtained and are shown in Fig 66
Upon the laser excitation pressure rises inside the sample inducing strain The
resulting strain will modify the lattice constant of the sample and thus the radii of the
diffraction rings This is the origin of the transient peak shifts displayed in Fig 66
For Au the energy will be rapidly (in a few hundred femtoseconds [211-213]
) distributed
after optical excitation over the full 200 nm film thickness Rarefaction waves are
launched at both film surfaces and start to propagate into the bulk of the film As a
consequence the diffraction peaks start to shift to smaller diffraction angles indicating
expansion of the material After a time determined by the film thickness and the speed
of sound of the considered material the fronts of the strain waves traveling in the
sample arrive at the opposite surface For a free surface the strain waves are totally
reflected with a change of sign Such recompression of the material is indicated by the
diffraction peaks shifting back to larger diffraction angles without obvious damping
effect As already discussed in Chapter 4 the ldquotriangularrdquo shape of the time-traces
results from a very fast and homogeneous (over the whole film thickness) increase of
pressure in the sample upon optical excitation [140 186]
The temporal position of the
maxima and minima of the time traces in Fig 66 (a) and (b) are determined by the
transit time of longitudinal acoustic waves through the film For both diffraction
orders oscillations with a half period of about (67 plusmn 1) ps are observed Using the
known sound velocity for polycrystalline Au of vs = 324 kms [271]
this transit time
6 Towards time-resolved Debye-Scherrer X-ray diffraction
109
corresponds to a film thickness of 217 nm which agrees within specifications (+-
10) of the manufacturer with the nominal thickness of 200 nm
(a)
(b)
Fig 66 Relative transient shift of the peak positions for the diffraction
rings (311) (a) and (220) (b) after laser excitation (blue squares) The
red circle points give the peak positions for non-excited sample The
black curves are guides for eye
6 Towards time-resolved Debye-Scherrer X-ray diffraction
110
633 Modeling the transient behavior of the diffraction
pattern after laser excitation
Fig 67 Debye-Scherrer Ewald-sphere construction without strain
(solid circles) and with uniaxial strain (dashed circle)
In polycrystalline samples the crystallites are randomly oriented When the X-
ray beam passes through the sample only the crystallites with a plane orientation
which fulfills the Bragg condition diffract X-rays The diffraction contributions from
all these crystallites form the Debye-Scherrer-diffraction pattern When the sample is
excited by the laser pulse with the condition that the illuminated area of laser is much
larger than the samplersquos absorption depth the sample expands only along the surface
normal resulting in uniaxial strain To understand the changes of the Debye-Scherrer
pattern under uniaxial strain I use a Ewald-sphere-construction [272]
as displayed in
Fig 67
The black and blue solid circles are used to describe the situation in an
6 Towards time-resolved Debye-Scherrer X-ray diffraction
111
unstrained polycrystalline film The black circle represents the Ewald-sphere Its
radius corresponds to the length of the wave vector of the incident X-rays Since we
are considering elastic scattering the incoming wave-vector ink as well as all possible
wave vectors of diffracted waves have to lie on this sphere The difference in direction
is given by the reciprocal lattice vector hklG For a single crystalline sample hklG
points only to one particular direction For a polycrystalline sample all directions of
hklG are possible This is illustrated by the blue circle which has a radius
corresponding to the length of hklG In two dimensions the two points of intersection
mark the positions where the Bragg-condition is fulfilled Extending this to three
dimensions by rotation around ink will transform the two points to a diffraction ring
When the film is uniaxially strainedexpanded the length and direction of hklG
depends on the orientation of the individual crystallite with respect to the surface
normal and the circle (with direction-independent radius) transforms into an ellipse
which is represented in Fig 67 by the blue dashed line Its shorter axis corresponds to
the direction of strainexpansion (larger lattice constant - smaller length of hklG ) Now
the intersection of the ellipse with the Ewald-sphere defines the diffraction direction
for the strainedexpanded sample As a result the diffraction rings should decrease
their radius
According to these considerations a simple geometrical calculation allows to
determine for a given strain what shifts will be induced for different Bragg peaks and
these estimations can be compared to the experimental data Choosing the center of
the Ewald-sphere as coordinate origin the black and the blue circle as well as the blue
ellipse can be expressed as follows
222 kyx (1)
222Gykx (2)
11
2
2
22
2
G
y
G
kx
(3)
6 Towards time-resolved Debye-Scherrer X-ray diffraction
112
Where η is the uniaxial strain caused by laser excitation defined as dd (d
is lattice constant) Let (x1y1) be the intersection point of the black and blue circles
(unstrained case) In the strained case the intersection point of black circle and blue
ellipse change to xxx 12 yyy 12 Substituting 1x 1y 2x 2y and G from Eq
(1) and Eq (2) in Eq (3) and applying a first order approximation
[ 2112
02 x 02 y ] one obtains
02222
yykxxkx (4)
Then substituting coskx sinky sinkx cosky in
Eq (4) one obtains the relationship between andη (and )
sin
1cos2
(5)
Fig 68 shows some results calculated using Eq (5) The angular shift
increases with strain η for a given diffraction order and for a given strain η it is larger
for higher diffraction orders
Fig 68 Estimation of the shift of diffraction rings and comparison to
measured data
6 Towards time-resolved Debye-Scherrer X-ray diffraction
113
634 Discussion for the experimental results
Following the above discussion the laser induced strain in the Au sample can be
deduced from the angular shift of the diffraction peaks observed in the time-resolved
experiment The measured peak shifts are (- 0152 plusmn 0013) ordm and (- 0103 plusmn 0010) ordm
for the (311)- and (220)-reflection respectively Using equation (5) a strain of
η(311) = (42 plusmn 04) times10-3
and η(220)= (50 plusmn 05) times10-3
is derived These two values
agree within the error bars and can be used to estimate the sample temperature For
this we use the average value ηavgasymp (46 plusmn 05) times10-3
Since the lateral dimensions of
the excited area (04 mm) are much larger than the film thickness on the time scale of
a few hundred picoseconds expansion of the film can only occur along the surface
normal Under these conditions the relation between the peak strain and the laser-
induced temperature increase is given by the following equation [223]
Tv
B
S
2
6 (6)
where B β ρ vs are the bulk modulus (B = 180 GPa) the coefficient of linear
thermal expansion (β = 142 μmbullm-1
bullK-1
) the density (ρ = 193 gbullcm-1
) and the speed
of sound (vs = 324 kms) respectively Equation (6) yields = (61 plusmn 7) K This
result is in rough agreement with the temperature increase (= (80 plusmn 11) K)
estimated from the deposited energy in the sample for the given excitation fluence
The Debye-Waller effect (see in Chapter 4) induced by this increase of
temperature should lead to a 42 and 31 decrease in the integrated diffraction
signal of the (311)- and (220)-reflection respectively However due to the low
diffraction signals (approx 3 detected photons per second for the (311)-reflection
less for the (220)-reflection) these changes could not be detected in the experiment
since they are of the same order (eg for (311)-reflection) or smaller (eg for (220)-
reflection) than the experimental errors which are mainly determined by counting
statistics
6 Towards time-resolved Debye-Scherrer X-ray diffraction
114
64 Summary
In this chapter the static Debye-Scherrer-diffraction pattern of a Cu foil (20 μm)
and an Au thin film (200 nm) have been presented The feasibility of performing a
time-resolved X-ray Debye-Scherrer measurement with the modular setup has also
been shown A preliminary time-resolved X-ray Debye-Scherrer measurement on a
thin Au film has been preformed The generation of acoustic waves due to rapid build-
up of pressure upon laser excitation and their propagation inside the film has been
followed by simultaneously measuring the transient shifts of the (311)- and (220)-
reflection as a function of pump-probe time delay The measured data are in good
agreement with the behavior expected from propagation of acoustic waves in a
200 nm Au free standing film A Ewald-sphere construction has been used to
determine the strain induced by laser
Finally I would like to comment on the better accuracy achieved in the reported
time-resolved powder diffraction experiment [106]
This is not related to properties of
the X-ray source and the setup which are in fact quite similar (eg X-ray flux of the
source) The essential point determining the different experimental accuracy is the
samples under investigation Comparing the thin film sample used here to the (organic)
powder sample used in Ref [106] the large penetration depth of pump beam in the
latter one (up to a few tens of microm) allows much thicker samples to be used in the
pump-probe experiments Moreover due to the large unit cell size (large lattice
constant small diffraction angles) and the use of a larger detector more diffractions
orders and larger fractions of the complete diffraction rings could be recorded with the
powder sample used in Ref [106] Only these sample properties provided diffraction
patterns with a better signal-to-noise ratio leading to a better experimental accuracy
in the powder diffraction experiment
7 Summary and outlook
115
7 Summary and outlook
71 Summary
This thesis describes my work on optimizing a femtosecond laser plasma Kα X-
ray source improving an existing modular setup for time-resolved X-ray diffraction
experiments and several studies on ultrafast lattice dynamics in thin laser-excited
metal films
In the second chapter the principles of ultrafast laser-plasma based X-ray
sources are presented A systematic investigation of optimizing the Kα X-ray source
for time-resolved X-ray diffraction experiments was performed The Cu and Ti Kα
yield were studied as a function of different laser intensities different angles of
incidence and different controlled pre-pulsepre-plasma conditions The optimized
conditions for both materials were determined Introducing a controlled pre-pulse at
an appropriate time in advance of the main pulse the Kα yield can be enhanced to the
same value no matter what angle of incidence is used This result is valid for both
materials under investigation Due to the same required on-target intensity for the
same Kα emission better energy conversion efficiency is found at a small angle of
incidence with a matching controlled pre-pulse These experimental results agree well
with estimations based on the classical resonance absorption mechanism and detailed
Particle in Cell (PIC) simulations
The third chapter describes the used modular setup for time-resolved X-ray
diffraction and the implemented improvements Applying the results discussed in the
second chapter the X-ray production has been improved Two normalization
methods are compared and discussed The combination of direct normalization and
7 Summary and outlook
116
a ldquofastrdquo delay scanning scheme represents the most efficient way to achieve high
measurement accuracy
By using the optimized setup presented in Chapter 3 the Debye-Waller effect in a
thin laser-excited Au film was observed The experimental results are presented in
chapter 4 For high excitation fluences an exponential drop of the measured
diffraction signal with a decay time constant of 43 ps is measured This result is in
good agreement with previous experimental results as well as the Two-Temperature
Model (TTM) calculations at high fluences As the first time-revolved experiment
performed with the improved modular setup these observations also underline the
capabilities as well as the restrictions of the modular setup
The fifth chapter focuses on investigating coherent optical phonons in Bi after
intense laser-excitation Large amplitude coherent motion of atoms and a softening of
the A1g phonon mode were observed At lower fluences the measured results agree
perfectly with earlier results obtained at the Sub-Picosecond Pulse Source (SPPS) and
University Duisburg-Essen (UDE) Upon strong excitation (absorbed laser fluences gt
2 mJcm2) a further softening of the A1g mode is observed At fluences between 31
and 33 mJcm2 a complete softening of the A1g mode is found This observation
strongly indicates that the Peierls distortion which defines the equilibrium structure
of Bi vanishes and the material is transformed into a transient ordered state of higher
symmetry At even stronger excitation (absorbed laser fluences gt 33 mJcm2) the
atomic motion becomes a Brillouin-zone boundary acoustic phonon mode and this
mode stiffens The observations follow qualitatively the predictions of calculations
based on density functional theory
The sixth chapter is dedicated to time-resolved X-ray Debye-Scherrer diffraction
measurements The presentation of static Debye-Scherrer diffraction pattern of Cu
(20 μm) and Au (200 nm) showed the feasibility of performing time-resolved X-ray
Debye-Scherrer diffraction experiments with the modular setup In the time-resolved
measurements on a Au thin film the generation of acoustic waves and their
propagation inside the film had been observed through the transient shifts of the
(311)- and (220)-reflection The temporal evolution of the measured data is in good
7 Summary and outlook
117
agreement with the behavior expected from propagation of acoustic waves inside the
200 nm free standing film A simple model based on a Ewald-sphere construction has
been used to determine the laser-induced uniaxial strain from the measured time-
resolved Debye-Scherrer patterns
72 Outlook
As it has been underlined in this thesis the modular setup using the laser-plasma-
based X-ray source is still of great interest for performing time-resolved X-ray
diffraction experiments due to its availability and low cost (in comparison to
accelerator-based sources) The following technical developments can be done to
improve the performance of the modular setup and open possibilities for new types of
experiments
1) The conditions to optimize the X-ray output have been discussed in detail in
this thesis Redesign of the source chamber allowing a smaller angle of incidence of
the drive laser for the X-ray source could be an option to fulfill the optimized
condition with less energy requirements to the laser system
2) Improving the overall stability is another important issue for the source This
requires improvement of the stability of the laser system as well as the mechanical
parts of the tape target pulling system
3) An automatic optimizationstabilization of the X-ray output behind the
multilayer optic during experiments can be realized by an automatic adjustment of the
position of the X-ray source point on the tape target through motorized actuators To
carry out this function the manual actuators of several mirrors in the setup should be
replaced by motorized actuators and a control program should be developed and
integrated into the main experiment control program
4) The current sample holder with manual adjustments should be replaced with a
motorized one It should definitely improve the accuracy of the adjustment and also
save time Additionally this would allow to perform irreversible time-resolved X-ray
diffraction experiments eg on laser-induced melting with the modular setup
7 Summary and outlook
118
5) The results of the time-resolved X-ray Debye-Scherrer diffraction
measurements presented in this thesis successfully proved the possibility of
performing Debye-Scherrer type measurements with the laser plasma X-ray source
As single crystalline samples are not required in this scheme a much wider range of
materials which are not easily available as single crystals can be studied now In
order to further improve the experimental accuracy (which directly relates to the
number of detected photons) for this type of experiments a new camera with large
detection area [273]
has been implemented in the setup and tested by F Quirin Once
suitable samples with sufficient diffraction signal are obtained further investigations
could be made with this setup
Since the electronic properties of the material are strongly affected by lattice
structure the laser-induced reversal of the Peierls distortion in Bi should lead to
corresponding changes in its electronic band structure resulting in a semimetal to
metal phase transition Investigation of this phase transition process can be one of the
most interesting subjects for Bi To study the electronic dynamics it requires
techniques which are sensitive to the electronic structure eg time-resolved X-ray
absorption spectroscopy (t-XAS) [274-276]
time-resolved angle-resolved photoelectron
spectroscopy (t-APRES) [277]
and time-resolved THz spectroscopy [278-280]
Another interesting topic on Bi is to observe the coherent Eg motion with X-ray
diffraction The excitation of the Eg mode has been demonstrated in many ultrafast
optical experiments [247 281]
which do not provide direct quantitative information on
the vibrational dynamics These dynamics can be retrieved directly with X-rays and
provide quantitative information about the amplitude of the Eg motion as well as the
coupling behavior between A1g modes and Eg modes Up to now only one study on
this topic has been performed at the Swiss Light Source (SLS) [282]
To completely
understand the displacive excitation of coherent phonons (DECP) mechanism and the
subsequent phonon dynamics more knowledge on the Eg motion is required The
extension of this study should be continued
In recent years sub-picosecond time-resolved X-ray diffuse scattering technique
became available This technique gives information on the phonon population
7 Summary and outlook
119
throughout the Brillouin zone and can yield the phonon dispersion [283]
Applying this
technique to investigate the phonon softening behavior in Bi must be an interesting
subject in the near future However this technique requires large photon flux and is
not possible to be carried out with the current laser plasma sources due to their low X-
ray output The appropriate X-Ray Sources are the new X-ray free electron lasers like
LCLS (USA) SACLA (Japan) or the later XFEL (Germany)
Appendixes
120
Appendixes
A Working principle of multilayer mirror
A multilayer optic is an artificial two dimensional crystal The spacing of the
multilayers is designed for specific radiation to satisfy Braggrsquos diffraction law As
shown in Fig A1 the incident X-rays are reflected by diffraction at a series of
interfaces between layers with differing indices of refraction Only the wavelength of
interest is effectively reflected others which do not satisfy the conditions for Bragg
reflection are absorbed in the mirror and are not reflected thus allowing the mirror to
produce a highly monochromatic beam
Fig A1 Multilayer working principle Reprint from the
manufacturer [284]
The focusing multilayer mirrors are realized by curving the mirror surfaces into
either parabolic or elliptical shapes The d-spacing (thickness of a single bi-layer) of
the multilayer coating is controlled along the mirror surface to satisfy Braggrsquos law at
every point (Fig A2) The band-pass of a multilayer optical system can be further
controlled by using different materials and layer configurations for various
applications
The multilayer X-ray optic used in the X-ray modular setup is twondashdimensional
reflection systems which is realized by using two VariMaxTM
multilayer X-ray
Appendixes
121
mirrors in a ldquoside-by-siderdquo Montel-Helios scheme (Fig A3) [188]
These two mirrors
are placed perpendicularly Each mirror independently reflects x-rays in one of the
two perpendicular directions With the ldquoside-by-siderdquo scheme both mirrors may be
positioned at a location appropriate to optimize performance parameters including
flux spectrum and divergence by adjusting four motorized actuators on the housing
Once the mirrors are adjusted the exact position of the X-ray point source and the
focus are defined
Fig A2 Graded d-Spacing Multilayer for focusing Reprint from the
manufacturer [284]
Fig A3 Scheme of the Montel-Helios configuration Reprint from
the manufacturer [284]
The multilayer X-ray optic prepared for the modular setup is produced by
Rigaku-OSMIC Inc The Specifications provided by the manufacturer are shown in
table A1
Appendixes
122
Parameters (units) CMF10-50Cu12
Characteristic line Cu Kα
Wavelength (Aring) 154
Effective focal spot size (mm) 001
Length of the mirror (mm) 120
Focal spot ndash mirror distance (mm) 100
Focal spot ndash sample distance (mm) 600
Bragg angle in the middle point (degree) 097
Reflectivity Kα (parts) 084
Rocking curve width (arcmin) 198
Capture angle (rad)
(degree)
00264
15133
Convergence angle (rad)
(degree)
00043
024
Focal spot usage efficiency (parts) 096
Beam width at mirror (mm) 264
Beam width at the optic entrance (mm) 106
Beam width at the optic exit (mm) 187
Beam width at the focus (mm) 0094
Optic efficiency (a u)
(Reflectivity Solid angle)
000045
Geometric magnification 15
Ravgsup2 (for double reflection) () 75
Distance X-ray sourcendashentrance of housing (mm) 30
Table A1 Specifications of the Cu Kα multilayer optic provided by
the manufacturer Rigaku-OSMIC Inc Reprint from Ref [186]
B X-ray detectors for diffracted signals
B 1 Direct detection camera
The Roper Scientific Pi-MTE 1300B from Princeton Instruments is an
innovative high-sensitivity imaging system designed to operate inside high-vacuum
chambers over long operation times The Pi-MTE 1300B incorporates a back-
illuminated CCD without AR coating for ultra-low-energy X-ray detection With
20times20 μm pixels and 100 fill factor this system offers a large imaging area with
very high spatial resolution and dynamic range The thermoelectrically cooled design
features PCBs thermally linked to the circulating coolant to provide reliable operation
inside vacuum chambers Its detail specifications are given in Table B1 This camera
is suitable for monitoring hard X-ray radiation due to its good quantum efficiency eg
55 for Ti Kα and 18 for Cu Kα (Fig B1)
As a direct detection camera the incidence photons are directly absorbed by the
active area of CCD pixels and generate charge signals The charge signals are strictly
Appendixes
123
proportional to the incident phonon energy For example the camera used here have
conversions that one Ti Kα (451 keV) photon gives a signal of ~589 counts and one
Cu Kα photon (805 keV) gives a signal of ~1050 counts In high flux condition (gt104
detected photons per pulse) the detected photon number can be easily deduced from
the value of integral signal (see in section 31) In low flux regime (for example 1
detected photon per 40 pixels) this camera can also be used as a multi-channel energy
detector A histogram of the CCD image corresponding to the energy spectrum can be
obtained [142]
and the number of detected photons can easily be deduced from this
histogram This function has been applied in the measurement of X-ray source
production in Chapter 2 Here one should notice that when the histogram is used to
calculate the detected photon number the multi- pixel event issue should be taken into
account
Table B1 Specifications of Roper camera Reprint from the
technical datasheet [285]
Appendixes
124
Fig B1 Quantum efficiency of Roper camera Reprint from the
technical datasheet [285]
Two major limitations of operating this camera should be pointed out The first
one is its working condition During the acquisition of a picture the charged coupled
device (CCD) will accumulate not only the signal from detected photons but also the
signal due to the dark current The dark current depends strongly on the temperature
on the detector Cooling down the detector is the typical way to reduce it In the
experiment the working temperature of the camera is -30deg C which is realized by an
integrated Peltier cooler under the chip Due to this low temperature to protect the
CCD from ice formation on the cooled parts the CCD chip should maintain under
vacuum It can be easily achieve in a big vacuum chamber for example in the
experiment of Chapter 2 For the modular setup the device needs to be operated in air
Additional configuration for keeping the vacuum inside the camera has been made A
special vacuum nose which isolates only the CCD has been installed into the camera
The nose needs to be continuously pumped to insure the required vacuum An Al
plate with a hole of approximately 1 cm2 covered by Beryllium window is installed at
Appendixes
125
the input of the camera which leads to only 14 of CCD size is available for the
exposure The second drawback of this detector is its rather slow readout time For
full size chip information it needs 17 seconds to read out the data The readout time
can be reduced for small regions of interest but it still remains more than 100 ms and
because of this the Roper camera can not be used with a 10 Hz repetition mode to
record each single X-ray pulse
B 2 Indirect detection camera
Pixel Resolution 1392times1040 (43 aspect ratio)
Effective pixel size at input 23 microns square
Active input size 32times24 mm (40mm diagonal)
Intensifier Ultra high-resolution (typically gt 60lpmm) low noise
Intensifier format 40mm diameter
Intensifier input window Coherent fiber optic
Gating Gated on when CCD is integrating off when not
acquiring
Gating speed Minimum gate period approx 100ns
Coupling to scintillators Via coherent straight fiber-optic
Scintillator material Gadolinium Oxysulphide 75mgcm2
Grey Scale Resolution 4096 grey levels (12bits)
Readout speed 20 MHz or 10 MHz pixel rate software selectable
Linearity No measurable deviation from linear response until
saturation
Saturation Approximately 13000 electrons
Video Gain User variable in software in 100 setups
Intensifier Gain User variable in software in 100 setups
On-chip binning User selectable 1times 1to 63 times 63
Exposure Time User selectable from 100μsec to 30 minutes
Readout Philosophy Correlated double sampling for highest accuracy fast 12
bit AD converter in head producing LVDS differential
format
Control PS Link 4 Line bi-directional Serial interface Using
LVDS drivers for reliability over long cables Parameters
that can be adjusted include image intensifier gain video
gain CCD integration period binning and sub-area
window
Power Requirements 110 or 230V ac 5060Hz
Operating Environment Temperature ndash Storage -10 to +80 degC
Operation 0 to +50 degC
Humidity ndash 0-80 RH non-condensing
Table B2 Specifications of Gemstar camera Reprint from the user
manual [273]
Appendixes
126
The Gemstar Camera from Photonic Science is an indirect detection camera Its
specifications are given in Table B2 The main feature of the indirect X-ray detection
is using a scintillator to transform the incoming signal into an optical signal which
can be easily detected and recorded This allows the quantum efficiency of certain
wavelengths like Cu Kα to be optimized by choosing an appropriate material The
scintillator inside this camera is made of a polycrystalline layer of Gadolinium
Oxysulphide which has a quantum efficiency of 85 for Cu Kα radiation When
incident photons are absorbed the scintillator emits photons in the visible range A
straight fiber-optic is used to couple them into the photocathode of the intensifier
These incoming photons produce photoelectrons from the photocathode The
produced electrons are sent through a multi channel plate (MCP) for a further step
amplification The amplification of MCP can be changed in the control software By
triggering the MCP by a camera trigger signal or an additional gate signal the
amplifying process can only be active for a short period during the presence of the X-
ray pulse therefore increasing the signal to noise ratio by reducing the background
signals This method could be very useful when multiple exposures of the Bragg
peaks are required After amplified by MCP the outcoming electrons hit on a
phosphor screen and produce phosphorescence whose intensity is proportional to the
number of incident electrons This light emitted from the screen is then collected by a
tapered fiber optic and sent onto a CCD sensor cooled by a peltier cooler which
allows images to be acquired with extended integration periods with minimal build-
up of CCD dark current This whole process allows the camera to work with a
repetition rate of 10 Hz when the On-Chip binning is set to large than 4times2 binning or
a small region of interest is selected This camera can record a sequence of pictures
containing every single X-ray pulse per picture
A major limitation of this camera is that it can not provide any information about
the energy of the incoming X-ray photons due to several conversion processes and
unlike a direct detection camera it can not be used for obtaining the energy spectrum
from a histogram of the image This type of camera is useful when the incoming
Appendixes
127
photons are monochromatic In this case the average signal from the chip can be
correlated with the average number of incoming photons
B 3 Avalanche Photodiode (APD)
Table B3 Specifications of APD Reprint from the technical
datasheet [286]
The avalanche photodiode is essentially a solid-state equivalent of PMTs
(photon-multiplier tubes) and can replace vacuum tube technology with compact
rugged silicon devices in many applications It is one of options for monitoring
diffracted X-ray signal if only the integrated signal is interesting A cooled large area
silicon avalanche photodiode produced by Laser Components which is assembled
with a homemade amplifier circuit is used for the modular setup Its specifications
and spectral response at visible light range are given in Table B3 and Fig B2
respectively
CHARACTERISTIC TEST
CONDITIONS
MIN TYP MAX UNIT
S
TO (Operating Temperature) +1 +40 degC
TS (Soldering Temperature) +240 deg C
VTEC (TEC Voltage) 43 V
ITEC (TEC Current) 2 A
P (APD Die Power Diss) 02 W
ID (Dark Current) 15 35 nA
CJ (Junction Capacitance) f = 1MHz 50 pF
λrange (Spectral Application Range) Spot Scan 350 1050 nm
R (Responsivity) λ=500nm VR=0V 35 AW
Vop (Operating Voltage) 1700 2000 V
tr (Response Time) RL=50Ωλ=675nm 12 18 nS
IQTEC (TEC Quiescent Current) Case Temp = 35degC 095 A
Appendixes
128
Fig B2 spectral response of APD at Gain = 300 Reprint from the
technical datasheet [286]
One of the advantages of this detector is that it can work at very high speed fast
enough to synchronize to the 10 Hz laser system Another advantage of APD is that it
has single photon sensitivity which allow to detecting weak signal and estimating the
number of detected photons However as a single channel detector the obvious
drawback of APD is that it gives no information on spatial resolution Shifts or
changes of profile of the Bragg peaks can not be observed with this detector during
the measurement It limits the use of the APD only in the experiments in which the
profiles of Bragg peaks do not change a lot during the laser excitation
C Sample material properties
The following relevant material parameters are used in this thesis They are
obtained from literatures WebElements (httpwwwwebelementscom) X-RAY
SERVER (httpsergeygmcaapsanlgovx0h_searchhtml) and X-ray Oriented
Programs (XOP) (httpwwwesrfeucomputingscientificxop21)
C 1 Cu
Name copper
Appendixes
129
Symbol Cu
Number 29
Standard atomic weight 63546
Electron configuration [Ar] 3d10
4s1
Electrons per shell 2 8 18 1
Density 894 gmiddotcmminus3
Crystal structure face-centered cubic
Melting point 1358 K
Specific heat capacity (25 degC) 24440 Jmiddotmolminus1
middotKminus1
Bulk modulus 140 GPa
Kα1 804778 eV λ = 154060410 Aring
Kα2 802783 eV λ = 154443266 Aring
Kβ 890529 eV λ = 139225593 Aring
Sample thickness 10microm 20 microm foil and 300nm thin film on glass substrate
C 2 Ti
Name titanium
Symbol Ti
Number 22
Standard atomic weight 47867
Electron configuration [Ar] 3d2 4s
2
Electrons per shell 2 8 10 2
Density 4506 gmiddotcmminus3
Crystal structure hexagonal
Melting point 1941 K
Specific heat capacity (25 degC) 25060 Jmiddotmolminus1
middotKminus1
Bulk modulus 110 GPa
Kα1 451084 eV λ = 274858848 Aring
Kα2 450486 eV λ = 275223711 Aring
Kβ 493181 eV λ = 251397415 Aring
Sample thickness 20 microm foil and 300nm thin film on glass substrate
C 3 Au
Name gold
Symbol Au
Number 79
Standard atomic weight 196966569
Electron configuration [Xe] 4f14
5d10
6s1
Electrons per shell 2 8 18 32 18 1
Density 1930 gmiddotcmminus3
Appendixes
130
Melting point 133733 K
Specific heat capacity (25 degC) 25418 Jmiddotmolminus1
middotKminus1
Speed of sound 324 kms (polycrystalline)
339 kms (single crystalline 111-direction)
Linear thermal expansion (25 degC) 142 micrommiddotmminus1
middotKminus1
Thermal conductivity (300 K) 318 Wmiddotmminus1
middotKminus1
Optical constants n=0181 k=5125 800 nm
Fig C1 Reflectivity of Gold at 800nm calculated from Fresnel
equations
Sample thickness 150nm on mica substrate and 200nm free standing film
Crystal structure Lattice face centered cubic
Symmetry group Cubic
Unit cell constant a = b = c = 40782 Aring
Unit cell angles α = β = γ = 90deg
X-ray wavelength 1540562 Aring
X-ray energy 8047984 keV
X-ray characteristic line Cu-K α1
Surface plane indices (1 1 1)
Appendixes
131
Fig C2 Bragg reflection of Au (333) calculated from XOP (a) P-
polarized beam and (b) S-polarized beam
Appendixes
132
Planes found 9 Planes being displayed 9
hkl Angle to surface Bragg angle Relative Intensity
xhx0()
(1 1 1) 00049 190956 824245
(1 1 3) 294962 387877 626630
(1 3 1) 294962 387877 626630
(1 3 3) 220017 554164 526226
(2 2 2) 00049 408660 610997
(3 1 1) 294962 387877 626630
(3 1 3) 220017 554164 526226
(3 3 1) 220017 554164 526226
(3 3 3) 00143 789431 460119
Table C1 Bragg angle data of Au obtained from X-RAY SERVER
C 4 Bi
Name bismuth
Symbol Bi
Number 83
Standard atomic weight 20898040
Electron configuration [Xe] 4f14
5d10
6s2 6p
3
Electrons per shell 2 8 18 32 18 5
Electrical Conductivity 867 times 105 Ωm
minus1
Density 978 gmiddotcmminus3
Melting point 5447 K
Specific heat capacity (25 degC) 2552 Jmiddotmolminus1
middotKminus1
Linear thermal expansion (25 degC) 134 micrommiddotmminus1
middotKminus1
Thermal conductivity (300 K) 797 Wmiddotmminus1
middotKminus1
Optical constants n= 28324 k= 45191 800 nm
Appendixes
133
Fig C3 Reflectivity of Bismuth at 800nm calculated from Fresnel
equations
Sample thickness 50nm on Si wafer
Crystal structure Bismuth-fcc
Symmetry group Trigonal (Rhombohedral distortion)
Unit cell constant a = b = c = 65720 Aring
Unit cell angles α = β = γ = 87570 deg
X-ray wavelength 1540562 Aring
X-ray energy 8047984 keV
X-ray characteristic line Cu-K α1
Surface plane indices (1 1 1)
Planes found 9 Planes being displayed 9
hkl Angle to surface Bragg angle Relative Intensity
xhx0()
(1 1 1) 00035 112396 682238
(1 1 3) 310515 222835 575184
(1 3 1) 310515 222835 575184
(1 3 3) 232706 296742 511918
Appendixes
134
(2 2 2) 00035 229435 695383
(3 1 1) 310515 222835 575184
(3 1 3) 232706 296742 511918
(3 3 1) 232706 296742 511918
(3 3 3) 00163 357843 462169
Table C2 Bragg angle data of Bi obtained from X-RAY SERVER
Appendixes
135
Fig C4 Bragg reflection of Bi (111) and (222) calculated from XOP
(a) and (c) P-polarized beam (b) and (d) S-polarized beam
Bibliography
136
Bibliography
[1] W C Roumlntgen ldquoOn a new kind of Rayrdquo Nature 53 274-277 (1896) translated
by A Stanton from W C Roumlntgen ldquoUumlber eine neue Art von Strahlenrdquo Sitz
ber an die med-phys Gesellschaft Wuumlrzburg (1895)
[2] C Davisson and L H Germer ldquoThe Scattering of Electrons by a Single Crystal
of Nickelrdquo Nature 119 558 (1927)
[3] G P Thomson and A Reid ldquoDiffraction of Cathode Rays by a Thin Filmrdquo
Nature 119 890 (1927)
[4] C G Shull ldquoEarly development of neutron scatteringrdquo Rev Mod Phys 67 753
(1995)
[5] D Strickland and G Mourou ldquoCompression of Amplified Chirped Optical
Pulsesrdquo Optics Communications 55 447 (1985)
[6] D Strickland and G Mourou ldquoCompression of Amplified Chirped Optical
Pulses rdquo Optics Communications 56 219 (1985)
[7] D Kuumlhlke U Herpes D von der Linde ldquoSoft x-ray emission from subpicosend
laser-produced plasmardquo Appl Phys Lett 50 1785 (1987)
[8] M M Murnane H C Kapteyn M D Rosen R W Falcone ldquoUltrafast X-ray
Pulses from Laser-Produced Plasmasrdquo Science 251 531 (1991)
[9] A Rousse P Audebert J P Geindre F Fall and J C Gauthier ldquoEfficient Kα
X-ray source from femtosecond laser-produced plasmasrdquo Phys Rev E 50 2200
(1994)
[10] J C Williamson J Cao H Ihee H Frey and A H Zewail ldquoClocking transient
chemical changes by ultrafast electron diffractionrdquo Nature 386 159 (1997)
[11] CY Ruan V A Lobastov R Srinivasan B M Goodson H Ihee and A H
Zewail ldquoUltrafast diffraction and structural dynamics The nature of complex
molecules far from equilibriumrdquo Proc National Acad Sci USA 98 7117
(2001)
[12] B J Siwick J R Dwyer R E Jordan and R J D Miller ldquoUltrafast electron
optics Propagation dynamics of femtosecond electron packetsrdquo J Appl Phys
92 1643 (2002)
[13] B J Siwick J R Dwyer R E Jordan and R J Dwayne Miller ldquoAn Atomic-
Level View of Melting Using Femtosecond Electron Diffractionrdquo Science 302
1382 (2003)
[14] R W Schoenlein S Chattopadhyay H H W Chong T E Glover P A
Heimann C V Shank A A Zholents and M S Zolotorev ldquoGeneration of
Femtosecond Pulses of Synchrotron Radiationrdquo Science 287 2237 (2000)
[15] S Khan K Holldack T Kachel R Mitzner and T Quast ldquoFemtosecond
Undulator Radiation from Sliced Electron Bunchesrdquo Phys Rev Lett 97
074801 (2006)
Bibliography
137
[16] G Ingold P Beaud S L Johnson D Grolimund V Schlott T Schmidt and A
Streun ldquoTechnical Report FEMTO A Sub-ps Tunable Hard X-ray Undulator
Source for LaserX-ray Pump-Probe Experiments at the SLSrdquo Sync Rad News
20 Issue 5 35 (2007)
[17] A L Cavalieri et al ldquoClocking Femtosecond X Raysrdquo Phys Rev Lett 94
114801 (2005)
[18] A M Lindenberg et al ldquoAtomic scale visualization of inertial dynamicsrdquo
Science 308 392 (2005)
[19] A Egbert B N Chichkov and A Ostendorf ldquoUltrashort X-ray source driven by
femtosecond laser pulsesrdquo Europhys Lett 56 228 (2001)
[20] A Egbert B Mader B Tkachenko C Fallnich B N Chichkov H Stiel and P
V Nickles ldquoHigh-repetition rate femtosecond laser-driven hard-x-ray sourcerdquo
Appl Phys Lett 81 2328 (2002)
[21] U Hinze A Egbert B Chichkov and K Eidmann ldquoGeneration of picosecond
hard-x-ray pulses in a femtosecond-laser-driven x-ray dioderdquo Optics Letters 29
2079 (2004)
[22] E Seres J Seres F Krausz C Spielmann ldquoGeneration of Coherent Soft-X-Ray
Radiation Extending Far Beyond the Titanium L Edgerdquo Phys Rev Lett 92
163002 (2004)
[23] J Seres E Seres A J Verhoef G Tempea C Streli P Wobrauschek V
Yakovlev A Scrinzi C Spielmann and F Krausz ldquoLaser technology Source
of coherent kiloelectronvolt X-raysrdquo Nature 433 596 (2005)
[24] Ch Spielmann N H Burnett S Sartania R Koppitsch M Schnuumlrer C Kan
M Lenzner P Wobrauschek F Krausz ldquoGeneration of Coherent X-rays in the
Water Window Using 5-Femtosecond Laser Pulsesrdquo Science 278 661 (1997)
[25] J Zhou J Peatross M M Murnane and H C Kapteyn ldquoEnhanced High-
Harmonic Generation Using 25 fs Laser Pulsesrdquo Phys Rev Lett 76 752
(1996)
[26] A Rousse K Ta Phuoc R Shah A Pukhov E Lefebvre V Malka S Kiselev
F Burgy J P Rousseau D Umstadter and D Hulin ldquoProduction of a keV X-
Ray Beam from Synchrotron Radiation in Relativistic Laser-Plasma
Interactionrdquo Phys Rev Lett 93 135005 (2004)
[27] V Malka J Faure Y A Gauduel E Lefebvre A Rousse and K Ta Phuoc
ldquoPrinciples and applications of compact laserndashplasma acceleratorsrdquo Nature
Physics 4 447 (2008)
[28] H-P Schlenvoigt K Haupt A Debus F Budde O Jaumlckel S Pfotenhauer H
Schwoerer E Rohwer J G Gallacher E Brunetti R P Shanks S M
Wiggins and D A Jaroszynski ldquoA compact synchrotron radiation source driven
by a laser-plasma wakefield acceleratorrdquo Nature Physics 4 130 (2008)
[29] K Nakajima ldquoCompact X-ray sources Towards a table-top free-electron laserrdquo
Nature Physics 4 92 (2008)
Bibliography
138
[30] httpwww-ssrlslacstanfordedulclsindexhtml
[31] T Ishikawa et al ldquoA compact X-ray free-electron laser emitting in the sub-
aringngstroumlm regionrdquo Nature Photon 6 540 (2012)
[32] httpwwwxfeleuXFELpresseenhintergrundwasindexhtml
[33] M Altarelli et al The European X-ray Free-electron Laser (DESY Technical
Report Hamburg Germany)
[34] S Kneip C McGuffey F Dollar M S Bloom V Chvykov G Kalintchenko
K Krushelnick A Maksimchuk S P D Mangles T Matsuoka Z Najmudin
C A J Palmer J Schreiber W Schumaker A G R Thomas and V
Yanovsky ldquoX-ray phase contrast imaging of biological specimens with
femtosecond pulses of betatron radiation from a compact laser plasma wakefield
acceleratorrdquo Appl Phys Lett 99 093701 (2011)
[35] K Ta Phuoc S CordeC Thaury V Malka A Tafzi J P GoddetR C Shah
S Sebban A Rousse ldquoAll-optical Compton gamma-ray sourcerdquo Nature
Photonics 6 308 (2012)
[36] J Ju K Svensson A Doumlpp H E Ferrari K Cassou O Neveu G Genoud F
Wojda M Burza A Persson O Lundh C-G Wahlstroumlm and B Cros
ldquoEnhancement of x-rays generated by a guided laser wakefield accelerator
inside capillary tubesrdquo Appl Phys Lett 100 191106 (2012)
[37] M Schnell A Saumlvert B Landgraf M Reuter M Nicolai O Jaumlckel C Peth T
Thiele O Jansen A Pukhov O Willi M C Kaluza and C Spielmann
ldquoBetatron radiation based measurement of the electron-beam size in a wakefield
acceleratorrdquo AIP Conf Proc 1462 231 (2011)
[38] S Corde C Thaury K Ta Phuoc A Lifschitz G Lambert J Faure O Lundh
E Benveniste A Ben-Ismail L Arantchuk A Marciniak A Stordeur P
Brijesh A Rousse A Specka and V Malka ldquoMapping the X-Ray Emission
Region in a Laser-Plasma Acceleratorrdquo Phys Rev Lett 107 215004 (2011)
[39] C Rischel A Rousse I Uschmann P A Albouy J P Geindre P Audebert J
C Gauthier E Foumlrster J L Martin and A Antonetti ldquoFemtosecond time-
resolved X-ray diffraction from laser heated organic filmsrdquo Nature 390 490
(1997)
[40] T Pfeifer C Spielmann and G Gerber ldquoFemtosecond X-ray sciencerdquo Rep
Prog Phys 96 443 (2006)
[41] M Bargheer N Zhavoronkon M Woerner and T Elsaesser ldquoRecent progress
in ultrafast X-ray diffractionrdquo Chem Phys Chem 7 783 (2006)
[42] C Rose-Petruck R Jimenez T Guo A Cavalleri C W Siders F Rksi J A
Squier B C Walker K R Wilson and C P J Barty ldquoPicosecondndash
milliaringngstroumlm lattice dynamics measured by ultrafast X-ray diffractionrdquo Nature
398 310 (1999)
Bibliography
139
[43] A H Chin R W Schoenlein T E Glover P Balling W P Leemans and C
V Shank ldquoUltrafast Structural Dynamics in InSb Probed by Time-Resolved X-
Ray Diffractionrdquo Phys Rev Lett 83 336 (1999)
[44] AM Lindenberg I Kang S L Johnson T Missalla P A Heimann Z Chang
JLarsson P H Bucksbaum H C Kapteyn H A Padmore R W Lee J S
Wark and R W Falcone ldquoTime-resolved X-ray diffraction from coherent
phonons during a laser-induced phase transitionrdquo Phys Rev Lett 84 111
(2000)
[45] A Cavalleri C W Siders F L H Brown D M Leitner C Toacuteth J A Squier
C P J Barty K R Wilson K Sokolowski-Tinten M Horn von Hoegen and
D von der Linde M Kammler ldquoAnharmonic Lattice Dynamics in Germanium
Measured with Ultrafast X-Ray Diffractionrdquo Phys Rev Lett 85 586 (2000)
[46] A Cavalleri C W Siders C Rose-Petruck R Jimenez C Toacuteth J A Squier C
PJ Barty K R Wilson K Sokolowski-Tinten M Horn-von Hoegen and D
von der Linde ldquoUltrafast x-ray measurement of laser heating in semiconductors
Parameters determining the melting thresholdrdquo Phys Rev B 63 193306 (2001)
[47] D A Reis M F DeCamp P H Bucksbaum R Clarke E Dufresne M
Hertlein R Merlin R Falcone H Kapteyn M M Murnane J Larsson Th
Missalla and J S Wark ldquoProbing impulsive strain propagation with X-Ray
pulsesrdquo Phys Rev Lett 86 3072 (2001)
[48] M F DeCamp D A Reis P H Bucksbaum B Adams J M Caraher R
Clarke C W S Conover E M Dufresne R Merlin V Stoica and J K
Wahlstrand ldquoCoherent control of pulsed X-ray beamsrdquo Nature 413 825 (2001)
[49] D von der Linde K Sokolowski-Tinten Ch Blome C Dietrich A Tarasevitch
A Cavalleri and J A Squier ldquoUltrafast extended to X-rays Femtosecond
time-resolved X-ray diffractionrdquo Z f Phys Chemie 215 1527 (2001)
[50] J Larsson A Allen P H Bucksbaum R W Falcone A Lindenberg G
Naylor T Missalla D A Reis K Scheidt A Sjoumlgren P Sondhauss M Wulff
and J SWark ldquoPicosecond X-ray diffraction studies of laser-excited acoustic
phonons in InSbrdquo Appl Phys A 75 467 (2002)
[51] O Synnergren M Harbst T Missalla J Larssona G Katona R Neutze and R
Wouts ldquoProjecting picosecond lattice dynamics through x-ray topographyrdquo
Appl Phys Lett 80 3727 (2002)
[52] A M Lindenberg I Kang S L Johnson R W Falcone P A Heimann Z
Chang R W Lee and J S Wark ldquoCoherent control of phonons probed by
time-resolved x-ray diffractionrdquo Opt Lett 27 869 (2002)
[53] M F DeCamp D A Reis A Cavalieri P H Bucksbaum R Clarke R Merlin
EM Dufresne D A Arms A M Lindenberg AG MacPhee Z Chang B
Bibliography
140
Lings J SWark and S Fahy ldquoTransient strain driven by a dense electron-hole
plasmardquo Phys Rev Lett 91 165502 (2003)
[54] M Bargheer N Zhavoronkov Y Gritsai J C Woo D S Kim M Woerner
and T Elsaesser ldquoCoherent atomic motions in a nanostructure studied by
femtosecond X-ray diffractionrdquo Science 306 1771 (2004)
[55] M F DeCamp D A Reis D M Fritz P H Bucksbaum E M Dufresneb and
Roy Clarke ldquoX-ray synchrotron studies of ultrafast crystalline dynamicsrdquo J
Synchrotron Rad 12 177 (2005)
[56] S H Lee A L Cavalieri D M Fritz M C Swan R S Hegde M Reason R
S Goldman and D A Reis ldquoGeneration and propagation of a picosecond
acoustic pulse at a buried interface Time-resolved X-ray diffraction
measurementsrdquo Phys Rev Lett 95 246104 (2005)
[57] Y Hayashi Y Tanaka T Kirimura N Tsukuda E Kuramoto and T Ishikawa
ldquoAcoustic pulse echoes probed with time-resolved X-ray triple-crystal
diffractometryrdquo Phys Rev Lett 96 115505 (2006)
[58] C V Korff Schmising M Bargheer M Kiel N Zhavoronkov MWoerner T
Elsaesser I Vrejoiu D Hesse and M Alexe ldquoStrain propagation in
nanolayered perovskites probed by ultrafast x-ray diffractionrdquo Phys Rev B 73
212202 (2006)
[59] A Morak T Kaumlmpfer I Uschmann A Luumlbcke E Foumlrster and R Sauerbrey
ldquoAcoustic phonons in InSb probed by time-resolved x-ray diffractionrdquo Phys
Stat Sol b 243 2728 (2006)
[60] H Enquist H Navirian T N Hansen A M Lindenberg P Sondhauss
OSynnergren J SWark and J Larsson ldquoLarge Acoustic Transients Induced
by Nonthermal Melting of InSbrdquo Phys Rev Lett 98 225502 (2007)
[61] M Nicoul U Shymanovich A Tarasevitch D von der Linde and K
Sokolowski-Tinten ldquoPicosecond acoustic response of a laser-heated Gold-film
studied with time-resolved X-ray diffractionrdquo Appl Phys Lett 98 191902
(2011)
[62] R Shayduk H Navirian W Leitenberger J Goldshteyn I Vrejoiu M
Weinelt P Gaal M Herzog C v Korff Schmising and M Bargheer
ldquoNanoscale heat transport studied by high-resolution time-resolved x-ray
diffractionrdquo New Journal of Physics 13 093032 (2011)
[63] M Herzog D Schick W Leitenberger R Shayduk R M van der Veen C J
Milne S L Johnson I Vrejoiu and M Bargheer ldquoTailoring interference and
nonlinear manipulation of femtosecond x-raysrdquo New Journal of Physics 14
013004 (2012)
[64] M Herzog D Schick P Gaal R Shayduk C v Korff Schmising M Bargheer
ldquoAnalysis of ultrafast X-ray diffraction data in a linear-chain model of the
lattice dynamicsrdquo Appl Phys A 106 489 (2012)
Bibliography
141
[65] M Herzog A Bojahr J Goldshteyn W Leitenberger I Vrejoiu D Khakhulin
M Wulff R Shayduk P Gaal and M Bargheer ldquoDetecting optically
synthesized quasi-monochromatic sub-terahertz phonon wavepackets by
ultrafast x-ray diffractionrdquo Appl Phys Lett 100 094101 (2012)
[66] C V Korff Schmising A Harpoeth N Zhavoronkov M Woerner T
Elsaesser M Bargheer M Schmidbauer I Vrejoiu D Hesse and M Alexe
ldquoFemtosecond X-ray diffraction from nanolayered oxidesrdquo Physics Procedia
3333 (2010)
[67] S L Johnson P Beaud E Vorobeva C J Milne EacuteD Murray S Fahy and G
Ingold ldquoNon-equilibrium phonon dynamics studied by grazing-incidence
femtosecond X-ray crystallographyrdquo Acta Cryst A 66 157 (2010)
[68] K Sokolowski-Tinten C Blome J Blums A Cavalleri C Dietrich A
Tarasevitch I Uschmann E Foumlrster M Kammler M Horn-von Hoegen and D
von der Linde ldquoFemtosecond X-ray measurement of coherent lattice vibrations
near the Lindemann stability limitrdquo Nature 422 287 (2003)
[69] D M Fritz et al ldquoUltrafast bond softening in Bismuth Mapping a solids
interatomic potential with X-raysrdquo Science 315 633 (2007)
[70] M Bargheer N Zhavoronkov J C Woo D S Kim M Woerner and T
ElsaesserldquoExcitation mechanisms of coherent phonons unravelled by
femtosecond X-ray diffractionrdquo Phys Stat Sol (b) 243 2389 (2006)
[71] C von Korff Schmising M Bargheer M Kiel N Zhavoronkov M Woerner
TElsaesser I Vrejoiu D Hesse and M Alexe ldquoAccurate time delay
determination for femtosecond X-ray diffraction experimentsrdquo Appl Phys B 88
1 (2007)
[72] B Freyer J Stingl F Zamponi M Woerner and T Elsaesser ldquoThe rotating-
crystal method in femtosecond X-ray diffractionrdquo Optics Express 19 15506
(2011)
[73] S L Johnson P Beaud C J Milne F S Krasniqi E S Zijlstra M E Garcia
M Kaiser D Grolimund R Abela and G Ingold ldquoNanoscale Depth-Resolved
Coherent Femtosecond Motion in Laser-Excited Bismuthrdquo Phys Rev Lett 100
155501 (2008)
[74] K H Bennemann ldquoUltrafast dynamics in solidsrdquo J Phys Condens Matter 16
R995 (2004)
[75] C W Siders A Cavalleri K Sokolowski-Tinten Cs Toacuteth T Guo M
Kammler M Horn von Hoegen K R Wilson D von der Linde and C P J
Barty ldquoDetection of Nonthermal Melting by Ultrafast X-ray Diffractionrdquo
Science 286 1340 (1999)
[76] K Sokolowski-Tinten C Blome C Dietrich A TarasevitchM Horn-von
Hoegen D von der Linde A Cavalleri J Squier and M Kammler
Bibliography
142
ldquoFemtosecond X-ray measurement of ultrafast melting and large acoustic
transientsrdquo Phys Rev Lett 87 225701 (2001)
[77] T Feurer A Morak I Uschmann Ch Ziener H Schwoerer Ch Reich P
Gibbon E Foumlrster R Sauerbrey K Ortner and C R Becker ldquoFemtosecond
silicon Kα pulses from laser-produced plasmasrdquo Phys Rev E 65 016412
(2001)
[78] A Rousse C Rischel S Fourmaux I Uschmann S Sebban G Grillon P
Balcou E Foumlrster J P Geindre P Audebert J C Gauthier and D Hulin
ldquoNon-thermal melting in semiconductors measured at femtosecond resolutionrdquo
Nature 410 65 (2001)
[79] K J Gaffney et al ldquoObservation of Structural Anisotropy and the Onset of
Liquidlike Motion During the Nonthermal Melting of InSbrdquo Phys Rev Lett
95 125701 (2005)
[80] P B Hillyard et al ldquoCarrier-density-dependent lattice stability in InSbrdquo Phys
RevLett 98 125501 (2007)
[81] G Sciaini M Harb S G Kruglik T Payer C T Hebeisen F -J Meyer zu
Heringdorf M Yamaguchi M Horn von Hoegen R Ernstorfer and R J D
Miller ldquoElectronic acceleration of atomic motions and disordering in bismuthrdquo
Nature 458 56 (2009)
[82] E Collet et al ldquoLaser-Induced Ferroelectric Structural Order in an Organic
Charge-Transfer Crystalrdquo Science 300 612 (2003)
[83] A Cavalleri S Wall C Simpson E Statz D W Ward K A Nelson M Rini
R W Schoenlein ldquoTracking the motion of charges in a terahertz light field by
femtosecond X-ray diffractionrdquo Nature 442 664 (2006)
[84] SK Streiffer JA Eastman DD Fong C Thompson A Munkholm MV
Ramana Murty O Auciello GR Bai GB Stephenson ldquoObservation of
nanoscale 180 deg stripe domains in ferroelectric PbTiO3 thin filmsrdquo Phys Rev
Lett 89 067601 (2002)
[85] RV Wang DD Fong F Jiang MJ Highland PH Fuoss C Thompson A
M Kolpak J A Eastman S K Streiffer A M Rappe and G B Stephenson
ldquoReversible chemical switching of a ferroelectric filmrdquo Phys Rev Lett 102
047601 (2009)
[86] M Woerner C v Korff Schmising M Bargheer N Zhavoronkov I Vrejoiu
D Hesse M Alexe and T Elsaesser ldquoUltrafast structural dynamics of
perovskite superlatticesrdquo Applied Physics A 96 83 (2009)
[87] D Daranciang M J Highland H Wen et al ldquoUltrafast photovoltaic response
in ferroelectric nanolayersrdquo Phys Rev Lett 108 087601 (2012)
[88] I Radu C Stamm N Pontius T Kachel P Ramm J-U Thiele H A Duumlrr
and C H Back ldquoLaser-induced generation and quenching of magnetization on
FeRh studied with time-resolved x-ray magnetic circular dichroismrdquo Phys Rev
B 81 104415 (2010)
Bibliography
143
[89] U Shymanovich F Quirin M Vattilana W Lu M Nicoul A-E El-Kamhawy
A Tarasevitch D von der Linde K Sokolowski-Tinten ldquoUltrafast lattice
dynamics in FeRh during a laser-induced magnetic phase transitionrdquo Ultrafast
Phenomena XVII Oxford University Press (2011)
[90] C Stamm T Kachel N Pontius R Mitzner T Quast K Holldack S Khan C
Lupulescu E F Aziz M Wietstruk H A Duumlrr and W Eberhardt
ldquoFemtosecond modification of electron localization and transfer of angular
momentum in nickelrdquo Nature Materials 6 740 (2007)
[91] C Stamm J-U Thiele T Kachel I Radu P Ramm M Kosuth J Minaacuter H
Ebert H A Duumlrr W Eberhardt and C H Back ldquoAntiferromagnetic-
ferromagnetic phase transition in FeRh probed by x-ray magnetic circular
dichroismrdquo Phys Rev B 77 184401 (2008)
[92] M Wietstruk A Melnikov Ch Stamm T Kachel N Pontius M Sultan C
Gahl MWeinelt H A Duumlrr U Bovensiepen ldquoHot electron driven
enhancement of spin-lattice coupling in 4f ferromagnets observed by
femtosecond x-ray magnetic circular dichroismrdquo Phys Rev Lett 106 127401
(2011)
[93] C Boeglin E Beaurepaire V Halteacute V Loacutepez-Flores C Stamm N Pontius H
A Duumlrr and J-Y Bigo ldquoDistinguishing the ultrafast dynamics of spin and
orbital moments in solidsrdquo Nature 465 458 (2010)
[94] C Stamm N Pontius T Kachel M Wietstruk and H A Duumlrr ldquoFemtosecond
x-ray absorption spectroscopy of spin and orbital angular momentum in
photoexcited Ni films during ultrafast demagnetizationldquo Phys Rev B 81
104425 (2010)
[95] H A Duumlrr ldquoFemtosecond electron and spin dynamics in ferromagnetic Ni
probed by UV and soft X-ray pulsesldquo Nucl Instr and Meth A 601 132 (2009)
[96] J Miguel J Saacutenchez-Barriga D Bayer J Kurde B Heitkamp M Piantek F Kronast
M Aeschlimann H A Duumlrr and W Kuch ldquoTime-resolved magnetization
dynamics of cross-tie domain walls in permalloy microstructuresrdquo J Phys
Condens Matter 21 496001 (2009)
[97] T Kachel N Pontius C Stamm M Wietstruk E F Aziz H A Duumlrr W
Eberhardt and F M F de Groot ldquoTransient electronic and magnetic structures
of nickel heated by ultrafast laser pulsesrdquo Phys Rev B 80 092404 (2009)
[98] H A Duumlrr C Stamm T Kachel N Pontius R Mitzner T Quast K
Holldack S Khan C Lupulescu EF Aziz M Wietstruk W Eberhardt
ldquoUltrafast Electron and Spin Dynamics in Nickel Probed With Femtosecond X-
Ray Pulsesrdquo IEEE Trans Magn 44 1957 (2008)
[99] S L Johnson et al ldquoFemtosecond Dynamics of the Collinear-to-Spiral
Antiferromagnetic Phase Transition in CuOrdquo Phys Rev Lett 108 037203
(2012)
Bibliography
144
[100] K A Seu S Roy J J Turner S Park C M Falco and S D Kevan ldquoCone
phase and magnetization fluctuations in AuCoAu thin films near the spin-
reorientation transitionrdquo Phys Rev B 82 012404 (2010)
[101] I Radu K Vahaplar C Stamm T Kachel N Pontius H A Duumlrr T A
Ostler J Barker R F L Evans R W Chantrell A Tsukamoto A Itoh A
Kirilyuk Th Rasing and A V Kimel ldquoTransient ferromagnetic-like state
mediating ultrafast reversal of antiferromagnetically coupled spinsrdquo Nature
472 205 (2011)
[102] K Holldack N Pontius E Schierle T Kachel V Soltwisch R Mitzner T
Quast G Springholz and E Weschke ldquoUltrafast dynamics of
antiferromagnetic order studied by femtosecond resonant soft x-ray diffractionrdquo
Appl Phys Lett 97 062502 (2010)
[103] A Kirilyuk A Kimel and T Rasing ldquoUltrafast optical manipulation of
magnetic orderrdquo Rev Mod Phys 82 2731 (2010)
[104] F Quirin M Vattilana U Shymanovich A-E El-Kamhawy A Tarasevitch
J Hohlfeld D von der Linde and K Sokolowski-Tinten ldquoStructural dynamics
in FeRh during a laser-induced metamagnetic phase transitionrdquo Phys Rev
B 85 020103(R) (2012)
[105] U Shymanovich M Nicoul W Lu S Kaumlhle A Tarasevitch K Sokolowski-
Tinten and D von der Linde ldquoTowards ultrafast time-resolved Debye-Scherrer
Xray diffraction using a laser-plasma sourcerdquo Rev Sci Instrum 80 083102
(2009)
[106] F Zamponi Z Ansari M Woerner and T Elsaesser ldquoFemtosecond powder
diffraction with a laser-driven hard X-ray sourcerdquo Optics Express 18 947
(2010)
[107] F Zamponi Z Ansari C v Korff Schmising P Rothhardt N Zhavoronkov
M Woerner T Elsaesser M Bargheer T Trobitzsch-Ryll and M Haschke
ldquoFemtosecond hard X-ray plasma sources with a kilohertz repetition raterdquo Appl
Phys A 96 51 (2009)
[108] J Stingl F Zamponi B Freyer M Woerner T Elsaesser and A Borgschulte
ldquoStrong-field electron transfer in a virtual quantum state mapped by
femtosecond x-ray diffractionrdquo Phys Rev Lett 109 147402 (2012)
[109] M J J Vrakking and T Elsaesser ldquoX-rays inspire electron moviesrdquo Nature
Photon 6 645 (2012)
[110] F Zamponi J Stingl M Woerner and T Elsaesser ldquoUltrafast soft-mode
driven charge relocation in an ionic crystalrdquo Physical Chemistry Chemical
Physics (PCCP) 14 6156 (2012)
[111] M Trigo J Chen V H Vishwanath Y M Sheu T Graber R Henning and
D A Reis ldquoImaging nonequilibrium atomic vibrations with x-ray diffuse
scatteringrdquo Physical Review B 82 235205(2010)
Bibliography
145
[112] A M Lindenberg et al ldquoX-Ray Diffuse Scattering Measurements of
Nucleation Dynamics at Femtosecond Resolutionrdquo Phys Rev Lett 100
135502 (2008)
[113] M Born and E Wolf Principles of optics Cambridge University Press (1988)
[114] G Jenke ldquoErzeugung von XUV- und Roumlntgenstralung mit Femtosecunden-
Laserimpulsenrdquo Dissertation (1999)
[115] Z Jiang J C Kieffer J P Matte M Chaker O Peyrusse D Gilles GKorn
A Maksimchuk S Coe and G Mourou ldquoX-ray spectroscopy of hot solid
density plasmas produced by subpicosecond high contrast laser pulses at 1018
ndash
1019
Wcm2rdquoPhys Plasmas 2 1702 (1995)
[116] F Brunel ldquoNot-So Resonant Resonant Absorptionrdquo Phys Rev Lett 59 52
(1987)
[117] S C Wilks and W L Kruer ldquoAbsorption of ultrashort ultra-intense laser light
by solids and overdense plasmasrdquo IEEE J Quan Electron 33 1954 (1997)
[118] S Bastiani A Rousse J P Geindre P Audebert C Quoix G Hamoniaux A
Antonettia and J C Gauthier ldquoExperimental study of the interaction of
subpicosecond laser pulses with solid targets of varying initial scale lengthsrdquo
Phys Rev E 56 7179 (1997)
[119] P Gibbon E Foumlrster ldquoShort-pulse laser-plasma interactionsrdquo Plasma Phys
Control Fusion 38 769 (1996)
[120] T Feurer A Morak I Uschmann Ch Ziener H Schwoumlrer E Foumlrster and R
Sauerbrey ldquoAn incoherent sub-picosecond X-ray source for time-resolved X-
ray-diffraction experimentsrdquo Appl Phys B Lasers Opt 72 15 (2001)
[121] C Reich P Gibbon I Uschmann and E Foumlrster ldquoYield optimization and time
structure of femtosecond laser plasma Kα sourcesrdquo Phys Rev Lett 84 4846
(2000)
[122] T Guo Ch Spielmann B C Walker C P J Barthy ldquoGeneration of hard X-
rays by ultrafast terawatt lasersrdquo Rev Sci Instr 72 41 (2001)
[123] R Fedosejevs R Ottmann R Sigel G Kuumlhnle S Szatmaacuteri F P Schaumlfer
ldquoAbsorption of subpicosecond ultraviolet laser pulses in high-density plasmardquo
ApplPhyB 50 79 (1990)
[124] C A Quarles ldquoSemiempirical analysis of electron-induced K-shell ionizationrdquo
Phys Rev A 13 1278 (1976)
[125] W E Burcham Elements of Nuclear Physics Pearson (1979)
[126] E Casnati A Tartari and C Baraldi ldquoAn empirical approach to K-shell ionisation
cross section by electronsrdquo J Phys B 15 155 (1982)
[127] P Gibbon A Andreev E Lefebvre G Bonnaud H Ruhl J Delettrez and A
R Bell ldquoCalibration of one-dimensional boosted kinetic codes for modeling
high-intensity laserndashsolid interactionsrdquo Phys Plasmas 6 947 (1999)
Bibliography
146
[128] DC Joy Monte Carlo Modeling for Electron Microscopy and Microanalysis
Oxford University Press Oxford (1995)
[129] D Salzmann Ch Reich I Uschmann E Foumlrster PGibbon ldquoTheory of Kα
generation by femtosecond laser-produced hot electrons in thin foilsrdquo Phys
Rev E 65 036402 (2002)
[130] F Y Khattak O A M B Percie du Sert D Riley P S Foster E J Divall C
J Hooker A J Langley J Smith and P Gibbon ldquoComparison of experimental
and simulated Kα yield for 400 nm ultrashort pulse laser irradiationrdquo Phys Rev
E 74 027401 (2006)
[131] P Gibbon and A R Bell ldquoCollisionless Absorption in Sharp-Edged Plasmasrdquo
Phys Rev Lett 68 1535 (1992)
[132] D D Meyerhofer H Chen J A Delettrez B Soom S Uchida and B Yaakobi
ldquoResonance absorption in high-intensity contrast picosecond laser-plasma
interactionsrdquo Phys Fluids B 5 2584 (1993)
[133] U Teubner W Theobald and C Wuumllker ldquoMechanisms and origin of
continuum and line emission from carbon plasmas produced by ultrashort laser
pulsesrdquo J Phys B 29 4333 (1996)
[134] M Schnuumlrer M P Kalashnikov P V Nickles Th Schlegel W Sandner N
Demchenko R Nolte and P Ambrosi ldquoHard x‐ray emission from intense short
pulse laser plasmasrdquo Phys Plasmas 2 3106 (1995)
[135] J D Kmetec C L Gordon III J J Macklin B E Lemoff G S Brown and
S E Harris ldquoMeV x-ray generation with a femtosecond laserrdquo Phys Rev Lett
68 1527 (1992)
[136] A P Fews P A Norreys F N Beg A R Bell A E Dangor C N Danson
P Lee and S J Rose ldquoPlasma Ion Emission from High Intensity Picosecond
Laser Pulse Interactions with Solid Targetsrdquo Phys Rev Lett 73 1801 (1994)
[137] D C Eder G Pretzler E Fill K Eidmann and A Saemann ldquoSpatial
characteristics of Kα radiation from weakly relativistic laser plasmasrdquo Appl
Phys B Lasers Opt 70 211 (2000)
[138] S Backus C G Durfee M M Murnane and H C Kapteyn ldquoHigh power
ultrafast lasersrdquo Rev Sci Instrum 69 1207 (1998)
[139] K Lobov ldquoHigh order harmonic generation at relativistic laser intensitiesrdquo
Dissertation (2008)
[140] U Shymanovich ldquoDirect observation of ultrafast atomic motion using time-
resolved X-ray diffractionrdquo Dissertation (2007)
[141] F Scholze H Henneken P Kuschnerus H Rabus M Richter G Ulm
ldquoDetermination of the electronndashhole pair creation energy for semiconductors
from the spectral responsivity of photodiodesrdquo Nuclear Instruments and
Methods in Physics Research A 439 208 (2000)
Bibliography
147
[142] F Zamponi T Kaumlmpfer A Morak I Uschmann and E Foumlrster
ldquoCharacterization of a deep depletion back-illuminated charge-coupled device
in the x-ray rangerdquo Rev Sci Instrum 76 116101 (2005)
[143] The quantum efficiency of the CCD was calibrated with a Si reference detector
[144] D W Forslund J M Kindel and K Lee ldquoTheory of Hot-Electron Spectra at
High Laser Intensityrdquo Phys Rev Lett 39 284 (1977)
[145] W L Kruer and K Estabrook ldquoLaser light absorption due to self‐generated
magnetic fieldsrdquo Phys Fluids 20 1688 (1977)
[146] N H Burnett G D Enright A Avery A Loen and J C Kieffer ldquoTime-
resolved Kα spectra in high-intensity laser-target interactionrdquo Phys Rev A 29
2294 (1984)
[147] W L Kruer The Physics of Laser Plasma Interaction Addison-Wesley (1988)
[148] N Zhavoronkov Y Gritsai M Bargheer M Woerner and T Elsaesser
ldquoGeneration of ultrashort Kα radiation from quasipoint interaction area of
femtosecond pulses with thin foilsrdquo Appl Phys Lett 86 244107 (2005)
[149] F Ewald H Schwoerer and R Sauerbrey ldquoKα-radiation from relativistic laser-
produced plasmasrdquo Europhys Lett 60 710 (2002)
[150] A Zhidkov A Sasaki T Utsumi I Fukumoto T Tajima F Saito Y
Hironaka K G Nakamura K I Kondo and M Yoshida ldquoPrepulse effects on
the interaction of intense femtosecond laser pulses with high-Z solidsrdquo Phys
Rev E 62 7232 (2000)
[151] F Y Khattak E Garcia Saiz T Dzelzainis D Riley and Z Zhai ldquoScale-
length optimizing of short pulse Cu Kα laser-plasma sourcesrdquo Appl Phys Lett
90 081502 (2007)
[152] Ch Reich I Uschmann F Ewald S Duumlsterer A Luumlbcke H Schwoerer R
Sauerbrey E Foumlrster and P Gibbon ldquoSpatial characteristics of Kα x-ray
emission from relativistic femtosecond laser plasmasrdquo Phys Rev E 68 056408
(2003)
[153] K Sokolowski-Tinten C Blome J Blums A Cavalleri C Dietrich A
Tarasevitch and D von der Linde ldquoUltrafast Time-Resolved X-ray
Diffractionrdquo AIP Conf Proc 634 11 (2002)
[154] N Zhavoronkov Y Gritsai M Bargheer M Woerner T Elsaesser F
Zamponi I Uschmann and E Forster ldquoUltrafast Optics - Microfocus Cu Kα
source for femtosecond x-ray sciencerdquo Optics Letters 30 1737 (2005)
[155] Bixue Hou James Easter Karl Krushelnick and John A Nees ldquo Generation of
hard x rays by femtosecond laser pulse interaction with Cu in laminar helium
flow in ambient airrdquo Appl Phys Lett 92 161501 (2008)
[156] Ch Ziener I Uschmann G Stobrawa Ch Reich P Gibbon T Feurer A
Morak S Duumlsterer H Schwoerer E Foumlrster and R Sauerbrey ldquoOptimization
of Kα bursts for photon energies between 17 and 7 keV produced by
Bibliography
148
femtosecond-laser-produced plasmas of different scale lengthrdquo Phys Rev E 65
066411 (2002)
[157] U Teubner J Bergmann B van Wonterghem F P Schaumlfer and R Sauerbrey
ldquoAngle-dependent x-ray emission and resonance absorption in a laser-produced
plasma generated by a high intensity ultrashort pulserdquo Phys Rev Lett 70 794
(1993)
[158] U Teubner P Gibbon E Foumlrster F Falliegraves P Audebert J P Geindre and J
C Gauthier ldquoSubpicosecond KrF‐laser plasma interaction at intensities
between 1014
and 1017
Wcm2rdquo Phys Plasmas 3 2679 (1996)
[159] J F Liu W Yu and L J Qian ldquoCharge Displacement in Ultraintense Laser-
Plasma Interactionrdquo Physica Scripta 72 243 (2005)
[160] T P Hughes Plasma and Laser Light Adam Hilger (1975)
[161] Y T Lee R A London G B Zimmerman and P L Hagelstein ldquoApplication
of escape probability to line transfer in laser‐produced plasmasrdquo Phys Fluids B
2 2731 (1990)
[162] A K Sharma R K Thareja ldquoPlume dynamics of laser-produced aluminum
plasma in ambient nitrogenrdquo Applied Surface Science 243 68 (2005)
[163] H Nakano T Nishikawa and N Uesugi ldquoEnhanced K-shell x-ray line
emissions from aluminum plasma created by a pair of femtosecond laser pulsesrdquo
Appl Phys Lett79 24 (2001)
[164] H Ahn H Nakano T Nishikawa and N Uesugi ldquoSimultaneous Measurement
of Absorption and X-Ray Emission from Preformed Plasma Generated by
Ultrashort Prepulseldquo Jpn J Appl Phys 35 L154 (1996)
[165] T Feurer ldquoFeedback-controlled optimization of soft-X-ray radiation from
femtosecond laser-produced plasmasrdquo Appl Phys B Lasers Opt 68 55 (1999)
[166] U Teubner G Kuumlhnle and F P Schaumlfer ldquoDetailed study of the effect of a
short prepulse on soft X-ray spectra generated by a high-intensity KrF laser
pulserdquo Appl Phys B 54 493 (1992)
[167] Th Schlegel S Bastiani L Gregravemillet J-P Geindre P Audebert J-C
Gauthier E Lebebvre G Bonnaud and J Delettrez ldquoComparison of measured
and calculated x-ray and hot-electron production in short-pulse laser-solid
interactions at moderate intensitiesrdquo Phys Rev E 60 2209 (1999)
[168] A Schmitt R S B Ong ldquoThe effect of collisions on wave-breaking in a cold
plasmardquo Appl Phys 22333 (1980)
[169] J P Freidberg R W Mitchell R L Morse and L I Rudsinski ldquoResonant
Absorption of Laser Light by Plasma Targetsrdquo Phys Rev Lett 28 795 (1972)
[170] M Abramowitz and I Stegun Handbook of Mathematical functions National
Bureau of Standards (1964)
[171] A Tarasevitch A Orisch D von der Linde Ph Balcou G Rey J -P
Chambaret U Teubner D Kloumlpfel and W Theobald ldquoGeneration of high-
Bibliography
149
order spatially coherent harmonics from solid targets by femtosecond laser
pulsesrdquo Phys Rev A 62 023816 (2000)
[172] H-S Park D M Chambers H -K Chung R J Clarke et al ldquoHigh-energy
Kα radiography using high-intensity short-pulse lasersrdquo Phys Plasmas 13
056309 (2006)
[173] P P Rajeev S Banerjee A S Sandhu R C Issac L C Tribedi and G R
Kumar ldquoRole of surface roughness in hard-x-ray emission from femtosecond-
laser-produced copper plasmasrdquo Phys Rev A 65 052903 (2002)
[174] R Rix ldquoAbsorption intensiver ultrakurzer Laserpulse an Festkoumlrpertargetsrdquo
Diplomarbeit Max-Planck-Institut Fuumlr Quantenoptik Garching Germany
(1999)
[175] U Teubner I Uschmann P Gibbon D Altenbernd E Foumlrster T Feurer W
Theobald R Sauerbrey G Hirst M H Key J Lister and D Neely
ldquoAbsorption and hot electron production by high intensity femtosecond uv-laser
pulses in solid targetsrdquo Phys Rev E 54 4167 (1996)
[176] P Gibbon M Mašek U Teubner W Lu M Nicoul U Shymanovich A
Tarasevitch P Zhou K Sokolowski-Tinten and D von der Linde ldquoModelling
and optimisation of fs laser-produced Kα sourcesrdquo Appl Phys A 96 23 (2009)
[177] J M Dawson ldquoParticle simulation of plasmasrdquo Rev Mod Phys 55 403
(1983)
[178] T Tajima Computational Plasma Physics with Applications to Fusion and
Astrophysics AddisonndashWesley (1989)
[179] C K Birdsall and A B Langdon Plasma Physics via Computer simulations
IOP Publishing Ltd Bristol U K (1991)
[180] H L Anderson ldquoMetropolis Monte Carlo and the MANIACrdquo Los Alamos
Science 14 96 (1986)
[181] W Lu M Nicoul U Shymanovich A Tarasevitch P Zhou K Sokolowski-
Tinten D von der Linde M Mašek P Gibbon and U Teubner ldquoOptimized
Kα X-ray flashes from femtosecond-laser irradiated foilsrdquo Phys Rev E 80
026404 (2009)
[182] D Riley J J Angulo-Gareta F Y Khattak M J Lamb P S Foster E J
Divall C J Hooker A J Langley R J Clarke and D Neely ldquoKα yields from
Ti foils irradiated with ultrashort laser pulsesrdquo Phys Rev E 71 016406 (2005)
[183] International Commission on Radiation Units amp Measurements Report No 37
unpublished (1984)
[184] httpphysicsnistgovPhysRefDataXrayMassCoefcoverhtml
[185] C Rulliere Femtosecond Laser Pulses Principles and Experiments 2nd ed
Springer (2004)
[186] M Nicoul ldquoTime-resolved X-ray diffraction with accelerator- and laser-
plasma-based X-ray sourcesrdquo Dissertation (2010)
Bibliography
150
[187] A Ruhl ldquoErzeugung intensiver Roumlntgenimpulse mit einem Bandtargetrdquo
Diplomarbeit (2006)
[188] M Montel ldquoAberrations du Premier Ordre des Systegravemes Catoptriques
Asymeacutetriques Application au Microscope X agrave Reacuteflexion Totalerdquo Optica Acta 1
117 (1954)
[189] httpwwwcxrolblgov
[190] L M P Fernandes F D Amaro A Antognini J M R Cardoso C A N
Conde O Huot P E Knowles F Kottmann J A M Lopes L Ludhova C
M B Monteiro F Mulhauser R Pohl J M F dos Santos L A Schaller D
Taqqud and J F C A Velosoe ldquoCharacterization of large area avalanche
photodiodes in X-ray and VUV-light detectionrdquo Journal of Instrumentation
(JINST) 2 08005 (2007)
[191] L M P Fernandes J A M Lopes J M F dos Santos P E Knowles L
Ludhova F Mulhauser F Kottmann R Pohl D Taqqu ldquoLAAPD low
temperature performance in X-ray and visible-light detectionrdquo IEEE
Transactions on Nuclear Science 51 1575 (2004)
[192] httpwwwcaenitjspTemplate2CaenProdjspparent=9ampidmod=409
[193] W Demtroumlder Laser Spectroscopy Basic Concepts and Instrumentation 2nd
Edition Springer-Verlag (1996)
[194] J Chesnoy and A Mokhtari Resonant impulsive-stimulated Raman-scattering
on Malachite Green Phys Rev A 38 3566 (1988)
[195] A Tokmakoff B Sauter and M D Fayer ldquoTemperature‐dependent
vibrational relaxation in polyatomic liquids Picosecond infrared pumpndashprobe
experimentsrdquo J Chem Phys 100 9035 (1994)
[196] S Ghosh and B M Arora ldquoPhotoreflectance spectroscopy with white light
pump beamrdquo Rev Sci Instrum 69 1261 (1998)
[197] R C Stanley ldquoCounting statistics in X-ray spectroscopyrdquo Br J Appl Phys 12
503 (1961)
[198] D Laundy and S Collins ldquoCounting statistics of X-ray detectors at high
counting ratesrdquo J Synchrotron Rad 10 214 (2003)
[199] G C Cho W Kuumltt and H Kurz ldquoSubpicosecond time-resolved coherent-
phonon oscillations in GaAsrdquo Phys Rev Lett 65 764 (1990)
[200] S I Anisimov B L Kapeliovich T L Perelman ldquoElectron emission from
metal surfaces exposed to ultrashort laser pulsesrdquo Sov Phys JETP 39 375
(1974)
[201] M Ligges I Rajkovic P Zhou O Posth C Hassel G Dumpich D von der
Linde ldquoObservation of ultrafast lattice heating using time reolved electron
diffractionrdquo Appl Phys Lett 94 101910 (2009)
Bibliography
151
[202] P Chen I V Tomov and P M Rentzepis ldquoTime resolved heat propagation in
a gold crystal by means of picosecondx-ray diffractionrdquo J Chem Phys 104
10001 (1996)
[203] A A Maznev J Hohlfeld and J Guumldde ldquoSurface thermal expansion of metal
under femtosecond laser irradiationrdquo J Appl Phys 82 5082 (1997)
[204] A Plech S Kuumlrbitz K -J Berg H Graener G Berg S Greacutesillon M Kaempfe J
Feldmann M Wulff and G von Plessen ldquoTime-resolved X-ray diffraction on
laser-excited metal nanoparticlesrdquo Europhys Lett 61 762 (2003)
[205] J Chen H Zhang I V Tomov and P M Rentzepis ldquoLaser Induced Transient
Structures in a 150 nm Gold Crystalrdquo Journal of the chinese chemical society
54 1619 (2007)
[206] P Musumeci J T Moody C M Scoby M S Gutierrez and M Westfall
ldquoLaser-induced melting of a single crystal gold sample by time-resolved
ultrafast relativistic electron diffractionrdquo Appl Phys Lett 97 063502 (2010)
[207] R Ernstorfer M Harb T Dartigalongue C T Hebeisen R E Jordan L Zhu
and R J D Miller ldquoFemtosecond Electron Diffraction Study on the Heating
and Melting Dynamics of Goldrdquo Springer Series in Chemical Physics 88 755
(2007)
[208] R Ernstorfer M Harb C T Hebeisen G Sciaini T Dartigalongue I
Rajkovic M Ligges D von der Linde Th Payer and M Horn-von-Hoegen F
-J Meyer zu Heringdorf S G Kruglik and R J D Miller ldquoAtomic view of the
photoinduced collapse of gold and bismuthrdquo Springer Series in Chemical
Physics 92 113 (2009)
[209] httpwwwphasisch
[210] E D Palik (Author Editor) Handbook of Optical Constants of Solids
Academic Press (1985)
[211] J Hohlfeld J G Muumlller S -S Wellershoff and E Matthias ldquoTime-resolved
thermoreflectivity of thin gold films and its dependence on film thicknessrdquo
Appl Phys B 64 387 (1997)
[212] T Juhasz H E Elsayed-Ali G O Smith C Suaacuterez and W E Bron ldquoDirect
measurements of the transport of nonequilibrium electrons in gold films with
different crystal structuresrdquo Phys Rev B 48 15488 (1993)
[213] S D Brorson J G Fujimoto and E P Ippen ldquoFemtosecond electronic heat-
transport dynamics in thin gold filmsrdquo Phys Rev Lett 59 1962 (1987)
[214] P Debye Interferenz von Roumlntgenstrahlen und Waumlrmebewegung Ann d
Phys 348 49 (1913)
[215] I Waller ldquoZur Frage der Einwirkung der Waumlrmebewegung auf die Interferenz
von Roumlntgenstrahlenrdquo Zeitschrift fuumlr Physik A Hadrons and Nuclei 17 398
(1923)
[216] C Kittel Introduction to solid state physics 6th ed Wiley New York (1986)
Bibliography
152
[217] G Busch and H Schade Lectures on solid state physics Pergamon Press
(1976)
[218] B C Larson J Z Tischler and D M Mills ldquoNanosecond resolution
timeresolved x-ray study of silicon during pulsed-laser irradiationrdquo Journal of
Materials Research 1 144 (1986)
[219] S K Allison ldquoThe Natural Widths of the Kα X-Ray Doublet from 26FE to
47AGrdquo The physical review 44 63 (1933)
[220] calculated from XOP httpwwwesrfeucomputingscientificxop21
[221] T H Johnson ldquoThe Diffraction of Hydrogen Atoms by the Mosaic Structure of
Crystalsrdquo Phys Rev 37 87 (1931)
[222] C Thomsen J Strait Z Vardeny H J Mark J Tauc and J Hauser
ldquoCoherent phonon generation and detection by picosecond light pulsesrdquo Phys
Rev Lett 53 989 (1984)
[223] C Thomsen H T Grahn H J Maris and J Tauc ldquoSurface generation and
detection of phonons by picosecond light pulsesrdquo Phys Rev B 34 4129 (1986)
[224] American Institute of Physics (Author Corporate Author) Dwight E Gray
(Editor) American Institute of Physics Handbook 3rd ed McGraw-Hill
Columbus (1972)
[225] S Kaumlhle ldquoKurzzeit-Roumlntgenbeugung mit Hilfe einer Effizienz-optimierten
hochrepetierenden Laser-Plasma-Roumlntgenquellerdquo Dissertation (2009)
[226] P B Allen ldquoTheory of thermal relaxation of electrons in metalsrdquo Phys Rev
Lett 59 1460 (1987)
[227] J Hohlfeld S -S Wellershoff J Guumldde U Conrad V Jaumlhnke E Matthias
ldquoElectron and lattice dynamics following optical excitation of metalsrdquo Chem
Phys 251 237 (2000)
[228] Online-Datenbank WebElements Periodic Table of the Elements
httpwwwwebelementscom (Stand November 2008)
[229] B Rethfeld A Kaiser M Vicanek and G Simon ldquoUltrafast dynamics of
nonequilibrium electrons in metals under femtosecond laser irradiationrdquoPhys
Rev B 65 214303 (2002)
[230] R Peierls More Surprises in Theoretical Physics Princeton University Press
(1991)
[231] H J Zeiger J Vidal T K Cheng E P Ippen G Dresselhauss and M S
Dresselhaus ldquoTheory for displacive excitation of coherent phononsrdquo Phys Rev
B 45 768 (1992)
[232] T K Cheng J Vidal H J Zeiger G Dresselhaus M S Dresselhaus and E P
Ippen ldquoMechanism for displacive excitation of coherent phonons in Sb Bi Te
and Ti2O3rdquo Appl Phys Lett 59 1923 (1991)
Bibliography
153
[233] A B Shick J B Ketterson D L Novikov and A J Freeman ldquoElectronic
structure phase stability and semimetal-semiconductor transitions in Birdquo Phys
Rev B 60 15484 (1999)
[234] O Degtyareva M I MCMahon and R J Nelmes ldquoHigh-pressure structural
studies of group-15 elementsrdquo High Pressure Research 24 319 (2004)
[235] T E Stevens J Kuhl and R Merlin ldquoCoherent phonon generation and the two
stimulated Raman tensorsrdquo Phys Rev B 65 144304 (2002)
[236] K Ishioka1 M Kitajima1 and O V Misochko ldquoTemperature dependence of
coherent A1g and Eg phonons of bismuthrdquo J Appl Phys 100 093501 (2006)
[237] E D Murray D M Fritz J K Wahlstrand S Fahy and D A Reis ldquoEffect of
Lattice Anharmonicity in Bismuth High-amplitude Phonon Dynamicsrdquo Phys
Rev B 72 060301 (2005)
[238] X Gonze J-P Michenaud and J-P Vigneron ldquoFirst-principles study of As Sb
and Bi electronic propertiesrdquo Phys Rev B 41 11827 (1990)
[239] T K Cheng S D Brorson A S Kazeroonian J S Moodera G Dresselhaus
M S Dresselhaus and E P Ippen ldquoImpulsive excitation of coherent phonons
observed in reflection in bismuth and antimonyrdquo Appl Phys Lett 57 1004
(1990)
[240] J S Lannin J M Calleja and M Cardona ldquoSecond-order Raman scattering in
the group-Vb semimetals Bi Sb and Asrdquo Phys Rev B 12 585 (1975)
[241] A Q Wu and X XuldquoCoupling of ultrafast laser energy to coherent phonons in
bismuthrdquo Appl Phys Lett 90 251111 (2007)
[242] E G Gamaly A V Rode ldquoElectronndashphonon energy relaxation in bismuth
excited by ultrashort laser pulse temperature and fluence dependence rdquo Appl
Phys A online (2012)
[243] M Hase K Mizoguchi H Harima S Nakashima and K Sakai ldquoDynamics of
coherent phonons in bismuth generated by ultrashort laser pulsesrdquo Phys Rev B
58 5448 (1998)
[244] O V Misochko K Ishioka M Hase and M Kitajima ldquoFano interference for
large-amplitude coherent phonons in bismuthrdquo J Phys Condens Matter 19
156227 (2007)
[245] M F DeCamp D A Reis P H Bucksbaum and R Merlin ldquoDynamics and
coherent control of high-amplitude optical phonons in bismuthrdquo Phys Rev B
64 092301 (2001)
[246] O V Misochko Muneaki Hase K Ishioka and M Kitajima ldquoObservation of
an Amplitude Collapse and Revival of Chirped Coherent Phonons in Bismuthrdquo
Phys Rev Lett 92 197401 (2004)
[247] M S Diakhate E S Zijlstra M E Garcia ldquoQuantum dynamical study of the
amplitude collapse and revival of coherent A 1g phonons in bismuth a classical
phenomenon rdquo Appl Phys A 96 5 (2009)
Bibliography
154
[248] D Boschetto E G Gamaly A V Rode B Luther-Davies D Glijer T Garl
O Albert A Rousse and J Etchepare ldquoSmall Atomic Displacements Recorded
in Bismuth by the Optical Reflectivity of Femtosecond Laser-Pulse
Excitationsrdquo Phys Rev Lett 100 027404 (2008)
[249] M Hase M Kitajima S-i Nakashima and K Mizoguchi ldquoDynamics of
Coherent Anharmonic Phonons in Bismuth Using High Density
Photoexcitationrdquo Phys Rev Lett 88 067401 (2002)
[250] M Hase K Mizoguchi H Harima S Nakashima M Tani K Sakai and M
Hangyo ldquoOptical control of coherent optical phonons in bismuth filmsrdquo Appl
Phys Lett 69 2474 (1996)
[251] C Blome ldquoUntersuchung schneller Strukturbullanderungen mit Hilfe ultrakurzer
Rbullontgenimpulserdquo Dissertation (2003)
[252] S L Johnson P Beaud E Vorobeva C J Milne Eacute D Murray S Fahy and
G Ingold ldquoDirectly Observing Squeezed Phonon States with Femtosecond X-
Ray Diffractionrdquo Phys Rev Lett 102 175503 (2009)
[253] M Ligges ldquoUntersuchung der schnellen Gitteraufheizung in duumlnnen (Halb-)
Metallfilmen mit Hilfe zeitaufgeloumlster Elektronenbeugungrdquo Dissertation (2009)
[254] A Bugayev A Esmail M Abdel-Fattah and H E Elsayed-Ali ldquoCoherent
phonons in bismuth film observed by ultrafast electron diffractionrdquo AIP
Advances 1 012117 (2011)
[255] A Authier S Lagomarsino and BK Tanner (Eds) X-ray and Neutron
Dynamical Diffraction Theory and Applications New York Plenum Press
(1996)
[256] J Daillant and A Gibaud (Eds) X-ray and Neutron Reflectivity Principles and
Applications Lecture Notes in Physics 770 Springer (2009)
[257] M Cornacchia J Arthur L Bentson R Carr P Emma J Galayda P Krejcik
I Lindau J Safranek J Schmerge J Stohr R Tatchyn and A Wootton ldquoA
Sub-Picosecond Photon Pulse Facility for SLACrdquo SLAC-PUB-8950 (2001)
[258] P Tangney and S Fahy ldquoDensity-functional theory approach to ultrafast laser
excitation of semiconductors Application to the A1 phonon in telluriumrdquo Phys
Rev B 65 054302 (2002)
[259] O V Misochko K Ishioka M Hase and M Kitajima ldquoFully symmetric and
doubly degenerate coherent phonons in semimetals at low temperature and high
excitation similarities and differencesrdquo J Phys Condens Matter 18 10571
(2006)
[260] E S Zijlstra L L Tatarinova and M E Garcia ldquoLaser-induced phonon-
phonon interactions in bismuthrdquo Phys Rev B 74 220301 (2006)
[261] S Bluumlgel and G Bihlmayer ldquoFull-Potential Linearized Augmented Planewave
Methodrdquo Computational Nanoscience Do It Yourself (J Grotendorst S
Bluumlgel D Marx (Eds)) NIC Series 31 85 (2006)
Bibliography
155
[262] P Blaha K Schwarz G K H Madsen D Kvasnicka and J Luitz ldquoWIEN2k
An Augmented Plane Wave+Local Orbitals Program for Calculating Crystal
Propertiesrdquo Karlheinz Schwarz Techn Universitaumlt Wien Austria (2001)
[263] Z Yang C Ko and S Ramanathan ldquoOxide Electronics Utilizing Ultrafast
Metal-Insulator Transitionsrdquo Annu Rev Mater Res 41 337 (2011)
[264] A Pashkin C Kuumlbler H Ehrke R Lopez A Halabica R F Haglund Jr R
Huber A Leitenstorfer ldquoUltrafast Insulator-Metal Phase Transition in VO2
Studied by Multiterahertz Spectroscopyrdquo Phys Rev B 83 195120 (2011)
[265] M Wuttig N Yamada ldquoPhase-change materials for rewriteable data storagerdquo
Nature Mater 6 824 (2007)
[266] T Siegrist P Jost H Volker M Woda P Merkelbach C Schlockermann and
M Wuttig ldquoDisorder-induced localization in crystalline phase-change
materialsrdquo Nature Mater 10 202 (2011)
[267] P Debye and P Scherrer ldquoInterferenzen an regellos orientierten Teilchen im
Roumlntgenlichtrdquo Phys Z 17 277 (1916)
[268] httpwwwlebowcompanycomspecificationshtm
[269] E Zolotoyabko D Shilo W Sauer E Pernot and J Baruchel ldquoVisualization
of 10 μm surface acoustic waves by stroboscopic x-ray topographyrdquo Appl
Phys Lett 73 2278 (1998)
[270] W Sauer M Streibl T Metzger A Haubrich S Manus W A J Peisl J
Mazuelas J Haumlrtwig and J Baruchel ldquoX-ray imaging and diffraction from
surface phonons on GaAsrdquo ApplPhysLett 75 1709 (1999)
[271] C Voisin D Christofilos N Del Fatti F Valleacutee ldquoEnvironment effect on the
acoustic vibration of metal nanoparticlesrdquo Physica B Condensed Matter 316
89 (2002)
[272] P P Ewald ldquoIntroduction to the dynamical theory of X-ray diffractionldquo Acta
CrystA 25 103 (1969)
[273] httpphotonic-sciencecoukproductsXRAY-cameras-detectorshtml
[274] C Bressler and M Chergui ldquoUltrafast X-ray Absorption Spectroscopyrdquo Chem
Rev 104 1781 (2004)
[275] C Bressler and M Chergui Molecular structural dynamics probed by ultrafast
X-ray absorption spectroscopy Annu Rev Phys Chem 61 263 (2010)
[276] A O Er J Chen and P M Rentzepis Ultrafast time resolved x-ray
diffraction extended x-ray absorption fine structure and x-ray absorption near
edge structure J Appl Phys 112 031101 (2012)
[277] E Papalazarou J Faure J Mauchain M Marsi A Taleb-Ibrahimi I
Reshetnyak A van Roekeghem I Timrov N Vast B Arnaud and L Perfetti
ldquoCoherent Phonon Coupling to Individual Bloch States in Photoexcited
Bismuthrdquo Phys Rev Lett 108 256808 (2012)
Bibliography
156
[278] M Nakajima N Takubo Z Hiroi Y Ueda and T Suemoto ldquoPhotoinduced
metallic state in VO2 proved by the terahertz pump-probe spectroscopyrdquo Appl
Phys Lett 92 011907 (2008)
[279] R Ulbricht E Hendry J Shan T F Heinz and M Bonn ldquoCarrier dynamics
in semiconductors studied with time-resolved terahertz spectroscopyrdquo Rev Mod
Phys 83 543 (2011)
[280] Time-resolved THz studies of carrier dynamics in semiconductors
superconductors and strongly-correlated electron materials Lawrence Berkeley
National Laboratory Lawrence Berkeley National Laboratory LBNL
Paper LBNL-597E Retrieved from httpescholarshiporgucitem2m32w0fs
[281] O V Misochko K Ishioka M Hase and M Kitajima ldquoFully symmetric and
doubly degenerate coherent phonons in semimetals at low temperature and high
excitation similarities and differencesrdquo J Phys Condens Matter 18 10571
(2006)
[282] arXiv12122348 (httparxivorgpdf12122348pdf )(2013)
[283] M Holt Z Wu H Hong P Zschack P Jemian J Tischler H Chen and T-C
Chiang ldquoDetermination of Phonon Dispersions from X-Ray Transmission
Scattering The Example of Siliconrdquo Phys Rev Lett 83 3317 (1999)
[284] httpwwwrigakucomproductscomponents
[285] httpwwwroperscientificdedatasheetsPrinceton_Instruments_PI-
MTE_1300B_RevA0pdf
[286] httpwwwadvancedphotonixcomap_productspdfsSD394-70-74-591pdf
Erklaumlrung
157
Ich bestaumltige dass ich die vorliegende Dissertation bdquoUltrafast time-resolved X-ray
diffraction using an optimized laser-plasma based X-ray sourceldquo selbststaumlndig
verfasst habe und dabei nur die angegebenen Hilfsmittel verwendet habe
Daruumlber hinaus bestaumltige ich dass ich die vorliegende Dissertation bdquoUltrafast time-
resolved X-ray diffraction using an optimized laser-plasma based X-ray sourceldquo nur
in diesem Promotionsverfahren an der Fakultaumlt fuumlr Physik der Universitaumlt Duisburg-
Essen eingereicht wurde
Wei Lu
Duisburg den 01022013

I
For Xi Shen
Acknowledgments
II
Acknowledgments
The works of this thesis would not have been possible to present here without the
helps assistances and supports of many people At this point I would like to thank all
those who have contributed to this work through any kind of activity
First of all I would like to thank my supervisor Prof em Dr Dietrich von der
Linde for providing me the opportunity to carry out my PhD study in the exciting
research flied of ultrafast time-resolved X-ray diffraction at the University Duisburg-
Essen and also his support for accomplishing this thesis
A very special thank also to my advisor Dr Klaus Sokolowski-Tinten whom it
was indeed an honor and a pleasure for me to work with during my PhD study
Without his intensive cares supports and guidance this work could not be presented
here
A thank to Prof Dr Ulrich Teubner for taking care of me at the initial stage of
my PhD studies and also a thank to Priv-Doz Dr Paul Gibbon for his help in the X-
ray production project
I am very grateful to Prof Dr Uwe Bovensiepen and Prof Dr Peter Kratzer for
their agreement to evaluate this work and the related efforts
I want to thank Dr Alexander Tarasevitch for his support by maintaining the 10
Hz laser system for all the experiments in this work and also for many discussions
and advices concerning laser ndash plasma physics
I also want to thank Dr Ping Zhou for his valuable helps and advices for both
my study and life in Germany
Acknowledgments
III
To Dr Uladzimir Shymanovich and Dr Matthieu Nicoul who are my closest
colleagues and also my best friends in Germany I will never forget the days and
nights we spend together in the lab measuring driving me home many times
especially at the midnight after the experiments giving me advices to improve my
skills in both study and lifehellipThanks for everything you have done for me
Special thanks to our group secretaries Kay Eibl and Christina Boese for their
helps in dealing with all the various paperwork and administration issues
To our technical staffs I want to thank Michael Bieske for making all the
mechanical components Doris Steeger for all the support cornering electronic
devices and Roland Kohn for all the computer related issues
I thank Dr Nicolas Bergeard and Carla Streubuumlhr for their helpful suggestions
and comments on this work
Many thanks go to all the former and current members working in AG von der
Linde and AG Bovensiepen Dr Nikola Stojanovic Dr Ivan Rajkovic Dr Manuel
Ligges Dr Stephan Kaumlhle Dr Konstantin Lobov Dr Oliver Heinz Jan Goumlhre Jens
Wieczorek Michael Vattilana and Florian Quirin and all of the diploma students and
the student assistants who contributed to the wonderful working atmosphere in the
groups I enjoyed all our exchanges very much
Finally I want to thank my parents and my wife Xi Shen for their unlimited
encouragement and assistance during my PhD studies I could not have succeeded
without their supports I dedicate this work to them
Contents
IV
Contents
Acknowledgments II
Contents IV
1 Introduction 1 11 Introduction and motivation 1
12 Overview and structure of the thesis 4
2 Optimization of a laser-plasma based X-ray source 5
21 Generation of ultrashort X-ray pulses from laser-produced plasma 6
22 Laser system 8
23 Experimental setup 11
24 Optimization of Kα X-ray emission by adjusting the laser intensity 13
25 Optimization of Kα X-ray emission by using a controlled pre-plasma 16
251 The resonance absorption (RA) and its optimum condition 17
252 Experimental results 20
253 Discussion 24
26 Comparison of the experimental results with simulations 30
27 Summary 32
3 Improvements of the modular setup for time-resolved X-ray
diffraction experiments 34
31 The fundamental components of the current setup 35
32 Improvements of the modular setup 39
321 Controlled pre-pulse to enhance the X-ray production 40
322 Avalanche photodiode (APD) 40
323 Ionization chamber detector (ICD) 44
324 Experiment control program 46
325 Spatial and temporal overlap adjustments with APD 48
326 Normalization of X-ray signals 49
3261 Chopping normalization scheme with a shutter 50
3262 Direct normalization scheme with the ionization chamber
detector 52
3263 Comparison of normalization schemes 54
33 Summary 56
4 Observation of the Debye -Waller effect in Au 57
41 Au sample 57
42 Debye ndashWaller effect 58
43 Time-resolved X-ray diffraction experiments on Au 60
431 Bragg diffraction of Au 60
432 Observation of Debye ndashWaller effect on Au 64
44 Comparison with the Two ndash Temperature Model (TTM) and discussion 68
45 Summary and conclusion 71
Contents
V
5 Extreme phonon softening in laser-excited Bi 73
51 Research background 75
511 Structure of Bi and the phonons 75
512 Previous works 76
52 Experiments and discussion 81
521 Method 81
522 Preliminary measurements 82
523 Results of time resolved measurements and discussion 85
53 Summary 96
6 Towards time-resolved Debye-Scherrer X-ray diffraction 98
61 Experimental configuration 100
62 Static Debye-Scherrer measurements 101
63 Time-resolved Debye-Scherrer experiment 104
631 Static Debye-Scherrer-diffraction pattern of the Au thin film 105
632 Results of time-resolved pump-probe measurements 106
633 Modeling the transient behavior of the diffraction pattern after laser
excitation 110
634 Discussion for the experimental results 113
64 Summary 114
7 Summary and outlook 115
71 Summary 115
72 Outlook 117
Appendixes 120 A Working principle of multilayer mirror 120
B X-ray detectors for diffracted signals 122
B 1 Direct detection camera 122
B 2 Indirect detection camera 125
B 3 Avalanche Photodiode (APD) 127
C Sample material properties 128
C 1 Cu 128
C 2 Ti 129
C 3 Au 129
C 4 Bi 132
Bibliography 136
1 Introduction
1
1 Introduction
11 Introduction and motivation
In order to study the ultrafast structural dynamics of matter excited by a
femtosecond optical pulse atomic spatial resolution (~Aring) and temporal resolution
comparable to characteristic time scales of atomic motion (femtosecond to
picosecond) are required
For a long time static atomic resolution has been achieved by using either X-
rays which were discovered by William Conrad Roentgen in 1895 [1]
electrons
proved by George Paget Thomson and Clinton Joseph Davisson independently in
1920s [2 3]
or neutrons which was established by Ernest O Wollan and Clifford Shull
in 1940s [4]
The knowledge of the structure of matter has been largely extended with
the application of these invaluable tools For their outstanding contributions
Roentgen earned the first Nobel Prize for Physics in 1901 Thomson and Davisson
shared the Nobel Prize for Physics in 1937 and Shull was awarded one half of the
1994 Nobel Prize in Physics
On the other hand the temporal resolution had made no significant improvement
until the development of femtosecond laser technology [5 6]
Since then the situation
has changed rapidly New types of radiation sources have been developed or are being
developed to provide ultrashort pulses of photons or electrons with sufficiently short
wavelength to enable the direct observation of structural changes on the relevant
length- and time-scales In the late 1980searly 1990s the first laser-produced plasma
femtosecond x-ray sources were demonstrated [7-9]
In the early 2000s ultrafast
electron diffraction with sub-picosecond time resolution was realized [10-13]
In the
mean time also accelerator based short-pulse X-rays sources have been developed [14-
18] However until now it has not been possible to generate ultrashort (sub-
picosecond) pulses of thermal neutrons
In the works presented in this thesis ultrashort X-ray pulses are used as a tool to
investigate ultrafast structural dynamics Currently there are six techniques exist to
1 Introduction
2
produce femtosecond X-ray pulses
1) Ultrafast X-ray tube achieved by using pulsed femtosecond lasers to produce
pulsed electron injection within a normal X-ray tube [19-21]
2) Direct conversion of the laser pulse into the X-ray region by nonlinear optical
processes ie high order harmonic generation(HHG)[22-25]
3) laser-produced plasma X-ray source achieved by the interaction of high
intensity laser pulses with solid targets [7-9]
4) The very recent developed laser-plasma wakefield accelerator-based betatron
X-ray source [26-29]
5) Unlike the previous four laboratory-sized techniques the large-scale electron
synchrotron-based slicing X-ray sources such as the Advanced Light Source ldquoALSrdquo
in Berkeley USA [14]
the Berliner Elektronenspeicherring-Gesellschaft fuumlr
Synchrotronstrahlung ldquoBESSYrdquo in Berlin Germany [15]
the Swiss Light Source
ldquoSLSrdquo in Villigen Switzerland [16]
6) The large-scale linear accelerator-based X-ray Free electron lasers (XFEL)
such as the Linac Coherent Light Source ldquoLCLSrdquo at SLAC in Standford USA [30]
the
SPring-8 Angstrom Compact free electron LAser ldquoSACLArdquo in Japan [31]
and the X-
ray Free-Electron Laser ldquoXFELrdquo at DESY in Hamburg Germany [32 33]
For all of these ultrafast X-ray sources the femtosecond laser pulses have to be
employed in some ways and the accelerated electrons play important roles in the
conversion process Each of these sources has its own characteristics in terms of the
repetition rate the minimum achievable pulse duration the produced photon number
the photon energy range the spatial and temporal coherence properties and the size or
the cost of the installation
Presently the first two sources are not yet suitable for studying ultrafast
structural dynamics due to the limited overall X-ray production The betatron X-ray
source is still under development [34-38]
The last two large-scale X-ray sources
represent the most promising X-ray sources for performing ultrafast time resolved
experiments However their construction and running costs are extremely high and
beam time access is very limited The laser-produced plasma X-ray sources are
presently unique because they are the easiest to operate laboratory-sized X-ray source
that can deliver hard X-ray radiation with very short pulse duration and at the same
time provide perfect synchronization between the produced X-ray pulses and the
1 Introduction
3
driving femtosecond laser pulses This is the type of X-ray source that has been used
for performing the time resolved X-ray diffraction experiments presented in this
thesis A part of the work in this thesis is dedicated to optimizing the X-ray emission
from this X-ray source
To obtain the time dependent information in sub-picosecond time scale the
common method using a fast detector (eg photo diodes or streak cameras) with one
ultrashort pump pulse is not accessible due to the limited temporal-resolution
capability of current fast detectors Most experiments are performed in the ultrafast-
pumpndashultrafast-probe scheme with a slow detector With this scheme the time
evolution of photoinduced structural changes can be studied by taking a sequence of
diffraction patterns at different time delays with respect to (femtosecond) excitation
Since the ultrashort X-ray pulse was available this scheme has been further extended
to X-ray region Using laser-pump X-ray-probe scheme the first femtosecond time-
resolved X-ray diffraction experiment was performed with laser plasma X-ray source
in 1997 by Rischel et al [39]
Since then many ultrafast phenomena have been
investigated by using ultrashort X-ray pulses Reviews on these studies can be found
in Ref [40 41] The current researches cover the following fields
1) Propagating GHz acoustic waves caused by the release of impulsive stress
launched by the femtosecond optical excitation [42-67]
2) Coherent optical phonon excitations which connect with unit-cell level
transient structural changes [67-73]
3) Non-thermal melting which is melting before thermal equilibrium between
electrons and lattice has been established after femtosecond laser excitation [17 18 39
46 76-81]
4) Phase transition in ferroelectric [66 82-87]
and ferromagnetic [88-104]
materials
caused by femtosecond laser excitation
5) Debye-Scherrer type time-resolved X-ray measurements on polycrystalline
and powder samples which allow obtaining much more information of the excited
sample from one measurement through detecting simultaneously several diffraction
orders similar to studies by ultrafast electron diffraction [105-110]
6) Utilizing X-ray diffuse scattering to investigate the transient nonequilibrium
states of the lattice system following ultrafast laser excitation [111 112]
The ultrafast phenomena investigated in this thesis focus on structural dynamics
in thin laser-excited metal films These works covered by the research field includes
1 Introduction
4
coherent excitations of acoustic phonons and optical phonons
12 Overview and structure of the thesis
The thesis is organized as following
Chapter 2 presents experimental results on the optimization of Kα X-ray emission
from a laser-plasma based X-ray source It contains the principle of X-ray generation
with a laser produced plasma and a systematic investigation of optimizing the X-ray
emission
Chapter 3 describes a modular setup for time-resolved X-ray diffraction
experiments This chapter presents and discusses implemented improvements of the
setup such as hardware software and methodology which are essential to achieve the
results of following time-resolved diffraction experiments
Chapter 4 deals with the first time-resolved X-ray diffraction experiment with
the improved modular setup The Debye -Waller effect in a thin laser-excited Au film
is observed The evolutions of the lattice temperature are compared with the
theoretical prediction of Two-Temperature Model (TTM)
Chapter 5 contains the study on the photoinduced softening of the A1g optical
phonon mode in laser-excited Bi This work extends the studies of coherent optical
phonons in laser-excited Bi to a higher fluence range that has not been studied
previously
Chapter 6 focuses on the experiments performed with X-ray Debye-Scherrer
diffraction scheme A static measurement on a Cu foil (20 μm) and a time-resolved
measurement on an Au thin film (200 nm) have been carried out The temporal
behaviors of the measured data are discussed
The last chapter summarizes the main results presented in this thesis An outlook
for the future studies is also provided
2 Optimization of a laser-plasma based X-ray source
5
2 Optimization of a laser-plasma based
X-ray source
This chapter discusses the principles of X-ray generation using a laser-produced
plasma and strategies to optimize the X-ray source for time-resolved X-ray diffraction
experiments discussed in the following chapters For this purpose the Kα-emissions
from plasmas on Ti and Cu targets for different excitation and plasma conditions were
investigated Section 21 describes the mechanism for generating ultrashort X-ray
pulses using the laser-produced plasma The laser system and the experimental setup
are presented in sections 22 and 23 respectively Section 24 discusses the
optimization of the Kα yield as a function of laser intensity Measurements of the Kα
yield as a function of target thickness and angle of incidence and a detailed
investigation of the influence of a pre-formed plasma by using a controlled pre-pulse
with variable delay are presented and discussed in section 25 The experimental data
show that for a given angle of incidence the Kα yield can be optimized by choosing a
suitable pre-pulse ie plasma scale-length conditions For large angles of incidence a
steep electron density gradient maximizes the yield At near normal incidence
maximum yield is achieved for a more expanded plasma and the best energy
conversion efficiency has been found in this case For a certain scale-length range
(between 01λ ndash 1λ here λ is the laser wavelength) the optimized yield is scale-length
independent It can be achieved by choosing the appropriate angle of incidence This
situation results from the strong dependence of collisionless absorption mechanisms ndash
in particular resonance absorption (RA) ndash on the angle of incidence and the plasma
scale length By maximizing the absorption the highest Kα yield is achieved The
experimental data are supported by the results of calculations based on the classical
resonance absorption mechanism (section 25) and of particle-in-cell (PIC) simulations
(section 26) Finally a summary of this chapter is given in section 27
2 Optimization of a laser-plasma based X-ray source
6
21 Generation of ultrashort X-ray pulses from laser-
produced plasma
Optical radiation is absorbed by a metal within a thin layer of about 10 nm which
is called the ldquoskin depthrdquo [113]
If the intensity of the laser radiation on the material is
large enough typically more than 1014
Wcm2 the target material within the skin depth
will be ionized and transformed into a plasma during the pulse For laser intensities
above 1015
Wcm2 easily achievable with current femtosecond laser technology it has
been found that the hot plasma emits radiation in the (hard) X-ray range [7]
The emitted
radiation consists of continuum emission from recombination in the plasma
characteristic line emission (Kα Kβhellip) and Bremsstrahlung radiation The latter two
components come not only from the hot plasma resulting from transitions on the
strongly ionized atoms but also the interaction of high energy electrons accelerated by
the intense laser field with the cold non-excited material underneath [7 9 114 115]
These
laser-accelerated electrons often called hot electrons in the laser plasma community
have a kinetic energy (~10hellip100 keV) significantly higher than the thermal energy of
the overwhelming part of the plasma electrons Among the three different contributions
to the X-ray emission mentioned above the characteristic line emission especially K
emission is particularly interesting for applications (eg time-resolved X-ray
diffraction) The generation of characteristic line radiation during the irradiation of a
solid material with an intense femtosecond laser pulse is described detail in Ref [9
116-118]
The mechanism of K -ray emission from a laser induced plasma is very similar
to that in an ordinary X-ray tube However the static electric field used for electron
acceleration is replaced by the femtosecond laser electric field A brief description of
the process of K The interaction of a high
intensity laser beam with a solid surface rapidly creates a plasma The plasma electrons
interacting with the strong electric field of the incident femtosecond optical pulse can
acquire an energy which is high enough to leave the skin layer and penetrate into the
non-excited material underneath the surface plasma layer Some of these electrons will
be slowed down and generate Bremstrahlung Others collide with the non-excited
atoms kick out electrons from their inner electronic shells which subsequently undergo
inner shell recombination leading to characteristic line emission Therefore the
emission of the characteristic line radiation can only occur as long as the high energy
2 Optimization of a laser-plasma based X-ray source
7
electrons are present and can be regarded as a direct result of these hot electrons
These electrons exist only during the femtosecond laser pulse irradiation (and for a very
short time afterwards which is determined by the flight-time of the high energy
electrons through the material) Thus one can expect that the duration of the X-ray
pulses produced in this way is comparable to the laser pulse duration ie in the sub-
picosecond region [119-122]
Fig 21 Scheme for the generation of Kradiation by focusing an
ultrashort laser pulse on a solid target (a) The focused laser pulse
produces plasma on the surface of solid target (red area) Accelerated
electrons from the plasma travel into non-excited material and
produce there X-rays (yellow area) (b) The ionization of K-shell
electrons and the subsequent inner shell recombination leads to K-
emission
The energy distribution and the corresponding number of these hot electrons
have a strong influence on the characteristics of the emitted radiation in particular the
Kα yield The task to optimize the conditions for Kα X-ray generation turns into the
investigation of how the laser energy is converted into hot electrons with the
appropriate energy distribution and their following dynamics inside the non-excited
material The energy conversion is dominated by the laser absorption mechanisms
which are in turn determined by the parameters of the driving laser ie intensity angle
2 Optimization of a laser-plasma based X-ray source
8
of incidence laser polarization as well as by the properties of the plasma with which
the laser pulse interacts [119 123]
The subsequent interaction of the hot electrons and
the solid is mainly via collisions The mean free path of the hot electrons (or the
stopping distance) and the ionization cross section in the solid dominate the rate of Kα
emission [124-126]
Several studies based on simulations (particle-in-cell
simulation [127]
+ Monte Carlo transport code [128]
) were performed to investigate this
question Depending on the target material (Z) and the sample thickness the
simulations allowed to determine the laser parameters (ie laser wavelength intensity
polarization and pulse duration) which lead to the optimum electron distributions for
Kα emission [121 129-131]
These results are in good agreement with previous experimental
data [9 115 132 133-137]
In this study the effects of laser intensity target thickness angle of incidence and
precise controlled pre-plasma conditions on the Kα-production from Cu and Ti elements
are the objects for investigation To my knowledge systematic investigations of the
latter two effects on both elements were first performed
22 Laser system
In this section the laser system used as a driver for the laser-plasma based X-ray
source is described and some key parameters of this laser system are presented
The 10-Hz Titanium-Sapphire femtosecond terawatt laser system at the University
of Duisburg-Essen is based on the Chirped Pulsed Amplification (CPA) technique [5 6
138] Its working principle can be briefly described as follows A low energy
femtosecond pulse produced by an oscillator first passes through a so-called ldquostretcherrdquo
The stretcher consists of a dispersive delay line (gratings) and adds a controlled phase
modulation to the laser pulse thereby increasing its duration and decreasing its peak
intensity Typical stretching factors are 104 The ldquostretchedrdquo pulse can then be
amplified to high energies usually by several amplification stages After amplification
the pulse passes through the so-called ldquocompressorrdquo which compensates the phase
modulation imposed by the stretcher as well as any additional phase modulation
acquired during amplification (for example due to material dispersion) Ideally the
amplified pulse is recompressed to its original duration This technique allows to
produce high peak power laser pulses without deteriorating the pulse parameters and
damaging the optical components during the amplification process
2 Optimization of a laser-plasma based X-ray source
9
The main components of the laser system used in the experiments are shown in
Fig 22 The ldquoheartrdquo of the system is a mode-locked titanium-sapphire oscillator
pumped by a frequency doubled cw NdYVO4 laser (type Coherent Verdi diode-
pumped λ = 532 nm P = 5 W) It produces a train of 45 fs (full width half maximum -
FWHM) pulses with a repetition rate of 80 MHz and an energy of ~1 nJ per pulse The
central wavelength of the pulses is 800 nm with a spectral bandwidth (FWHM) of 21
nm
The output pulses from the oscillator are directed to the stretcher in which the
duration of the pulses is extended to 200 ps A grating with 1200 linesmm is used in
the stretcher as dispersive element for broadening the pulses Before the pulses enter
the amplification stages the repetition rate is reduced to 10 Hz using an electro-optic
selector consisting of a Pockels cell and a polarizer By inducing a suitable fast
switching electric field this combination allows the precise selection and separation of
pulses at a repetition rate of 10 Hz from the initial 80 MHz pulse train
The following amplification system consists of two multipass stages both using
TiSapphire crystals as gain medium pumped by frequency doubled Q-switched
NdYAG lasers (532 nm) In the first stage the seed pulses make eight passes through
the amplifying medium and are amplified to a pulse energy of about 1 mJ
(amplification by a factor of approximately 106
- 107) The second stage is a four-pass
power amplifier To obtain homogeneous pumping two lasers pumping from both sides
of the amplifying medium are applied After four passes in the second crystal the pulse
energy pulse is increased to about 200 mJ (amplification by a factor of approximately
100) Finally the amplified pulses enter the compressor The compressor contains again
gratings as dispersive elements to recompress the pulse to the desired pulse duration If
the compressor is operated under vacuum a maximum energy per pulse of 150 mJ with
a minimum pulse duration of about 45 fs can be achieved In the experiments discussed
here the compressor is operated in air and the pulse duration is adjusted to
approximately 120 - 150 fs With this duration self-phase-modulation (and self-
focusing) in air can be avoided and the pulse properties (spectrum spatial beam profile)
are not deteriorated during propagation
2 Optimization of a laser-plasma based X-ray source
10
Fig 22 The principle scheme of the laser system
The time-structure of the final output pulses was measured a third-order
autocorrelator (fs- to ps-time-range) The amplified laser pulse exhibits a relative
intensity of about 10-7
(ie contrast ratio of 107) approximately 1 ps ahead of the pulse
maximum and the contrast ratio to the amplified spontaneous emission (ASE) is 108 [139]
Due to such a high-contrast ratio the pre-plasma formation caused by laser pulse itself
is negligible in the experiments presented later
The key parameters of the laser system are summarized in the table 21 below
central wavelength 800 nm
spectral width 21 nm
min pulse duration 45 fs
in air pulse duration 120 150 fs
maximum pulse energy 150 mJ
contrast ratio at 1 ps 10-7
ASE 10-8
repetition rate 10 Hz
beam diameter (FWHM) 25 mm
Table 21 Key parameters of the 10 Hz laser system
The stability of the laser system ie energy and pointing stability is very
important for the experiments presented in this thesis Energy and pointing stability
were recorded and analyzed pulse-to-pulse over a few hours by U Shymanovich [140]
2 Optimization of a laser-plasma based X-ray source
11
Typical values under normal working conditions are less than 100 microrad pulse-to-pulse
pointing instability and 25 rms energy fluctuations
23 Experimental setup
Fig 23 Schematic of the experimental setup for Koptimization
All the works presented in this thesis were done with a few different experimental
setups For the investigation of the Kα production a setup as schematically shown in
Fig 23 was used The 25 mm diameter (FWHM) p-polarized laser beam was reflected
from a mirror with a 5 mm diameter hole in its center that allowed transmission of a
small part of the beam The transmitted part was time delayed with a variable delay
line and recombined with the main laser beam using a second apertured mirror The
combined p-polarized laser beams were focused with a 30 cm focal length lens onto the
target surface This lens could be accurately translated along the direction of the laser
beam propagation to change the focusing conditions ie the focus size on the target
Two PIN photodiodes one for recording the incident energy and another for the
reflected energy were used to measure the reflectivity from which the absorption of
the laser energy can be deduced By using a microscope objective combined with a
CCD camera the focal spot sizes of main and pre-pulse were measured as ~ 20 μm and
~ 70 μm FWHM respectively The focal area of the pre-pulse is about 12 times bigger
than that of the main pulse and both pulses can be adjusted to spatially overlap well at
all delay times The angle of incidence was varied by rotating the target For each
specific angle the laser intensity was kept constant by adjusting the laser energy The
targets were mounted on a motorized XYZ translation unit and moved between
2 Optimization of a laser-plasma based X-ray source
12
consecutive laser pulses to provide a fresh surface for each pulse In these experiments
four kinds of targets were used 300 nm Cu and Ti films coated on a glass substrate and
20 μm Cu and Ti foils glued onto a glass substrate
The X-ray radiation was detected with a Princeton Instruments CCD-camera (type
PI-MTE 1300B) It is back-illuminated Si-CCD that is suitable for the photon energy
range relevant in this work (ie 2 to 10 keV) The chip area is 1340 pixels times 1300 pixels
(20 microm times 20 microm each) The camera was located ~ 20 cm away from the X-ray source
and the average X-ray flux per pulse was reduced to 1 photon per 40 pixels by using an
Al filter of moderate thickness (150 microm and 210 microm for Ti and Cu respectively) in
front of the camera The filter also protected the CCD from low energy Bremsstrahlung
and from visible light This configuration allowed the camera to work in ldquosingle photon
counting regimerdquo as a spectrometer exploiting the fact that a X-ray photon detected
with the CCD creates a charge strictly proportional to its energy (for Si the electron-
hole pair creation energy is 366 eV [141]
and thus a single Cu Kα photon (805 keV) will
produce about 2200 photoelectrons) Therefore one can obtain the energy spectrum of
the detected X-rays from the distribution of the signal of all camera pixels (signal
histogram of the recorded images) A typical single-pulse spectrum using Cu as target
with well resolved Cu Kα and Kβ lines at 805 keV and 891 keV respectively is shown
in Fig 24 The single-pulse spectra of Ti which are not shown here are similar The
Kα yield can in principle be obtained by integrating the signal in the relevant energy
range after appropriate background subtraction
Fig 24 Spectrum of the laser produced Kα emission of Cu
2 Optimization of a laser-plasma based X-ray source
13
However to determine the absolute Kα yield of the source it has to be considered
that a single X-ray photon not always generates charge in only a single CCD pixel but
that the generated charge may be distributed over many pixels (many-pixel-
events)[142]
This distorts the measured spectra and leads to an underestimation of the
Kα yield since a many-pixel-event created by a single Kα-photon is detectedcounted
as several photons of apparently lower energy For Ti and Cu Kα radiation the spatially
largest events involve 4 pixels as reported in Ref [142] In order to determine the
percentage of single-pixel events in the detection system a few images were randomly
sampled from all the measured data and analyzed in detail It was found that about 50
of all detected Kα-photons generated single-pixel events while the other 50 were 2-
3- and 4-pixel events (the number of events involving 5 and more pixels was
negligible) Therefore a correction factor of 2 was applied to the number of detected
Kα-photons determined from the integration of the spectra To derive from this the
absolute Kα yield the transmission of the Al filters as well as the quantum efficiency of
the CCD (18 at 8 keV 55 at 45 keV) [143]
was taken into account Moreover it was
assumed that the X-ray emission is isotropic into the full solid angle
24 Optimization of Kα X-ray emission by adjusting the laser
intensity
In this section the experimental results concerning the optimization of the Kα X-
ray emission are presented Two key factors namely laser intensity and the pre-plasma
scale length were varied to study their influence on the Kα yield
As mentioned in section 21 to efficiently ionize the K-shell electrons of the target
material which in turn lead to an efficient X-ray emission hot electrons with the
appropriate kinetic energy should be produced The kinetic energy of these hot
electrons is strongly dependent on the accelerating laser field Therefore the laser
intensity is one of the key factors to control and optimize the Kα generation The
average energy of the accelerated electrons often described by an effective ldquohotrdquo
electron temperature Th generally relates to the pondermotive potential of the laser
field and follows a power scaling law Th ~ (Iλ2)13
[144 145]
as observed in many
experiments [115 146-148]
and also found with PIC simulations [119]
For optimum Kα
emission the average electron energy should be a few times the K-shell ionization
energy depending on the geometry of the target and the atomic number [121 129 137
2 Optimization of a laser-plasma based X-ray source
14
149]With this condition the laser intensity for optimum Kα production can be estimated
For example to maximize the yield of Cu Kα (805 keV) radiation the average electron
energy should be between 25 keV and 50 keV [120 121 129 148 150 151]
With the mentioned
empirical scaling law Th ~ (I0λ2)13
this average electron energy corresponds to a laser
intensity of a few times 1017
Wcm2 at a laser wavelength of 800 nm
[120 121 137] For Ti
the predicted optimum laser intensity is a few times 1016
Wcm2 [121 152]
With the given focal length (30 cm) a maximum laser intensity of
16 times 1017
Wcm2 can be achieved The laser intensity dependence is investigated by
varying the relative position of the laser focus with respect to the target surface In this
way the laser intensity on target changes while the pulse energy is kept constant No
additional pre-pulse is applied in this experiment Fig 25 shows the experimentally
determined (normalized) Kα yield from 20 μm Cu and Ti foils as a function of the
position of the target surface relative to the focus of the lens In this measurement no
attempt was made to convert the position scale into an intensity scale but it is obvious
that the Kα emission for the different target materials is optimizedmaximized at
different lens positions and thus at different intensities For Cu the sharpest focusing
and thus the highest intensity provides the largest Kα emission For Ti this is achieved
out of focus and thus at a lower intensity This effect has been discussed before in the
literature [130 152 153]
Fig 25 indicates that for Ti the ldquooptimumrdquo intensity for Kα-
production is reached and exceeded in the experiments This optimum intensity is lower
than the maximum laser intensity reached at the focus as predicted by theory [121]
For a
Gaussian beam it is expected that the change of the spatial intensity distribution should
be symmetric with respect to the focus The asymmetry of the measured double-peak
dependence of the Ti Kα yield indicates that this is not the case in the experiment This
is attributed to the method (hole in a mirror) used to split off the pre-pulse that was
used for the measurements described below from the main pulse leading to a non-
Gaussian intensity distribution For the higher atomic number material Cu the optimum
conditions for Kα-production correspond to higher laser intensity Since no double-peak
structure is observed for Cu it can be concluded that the maximum intensity used in the
experiment is comparable or below the expected optimum value for this material again
in agreement with the predictions and estimates mentioned above
2 Optimization of a laser-plasma based X-ray source
15
Fig 25 Kα emission as a function of the relative position of the
target surface of 20 μm Cu and Ti foils with respect to laser focus
The lines between the data points are only to guide the eye
Fig 26 Measured dependence of X-ray yield on laser energy for a
20 μm Cu foil The angle of incidence is 45deg
Since Cu Kα radiation has been used for the time-resolved diffraction experiments
discussed in this thesis the emission from a Cu target has been investigated further
Keeping the spot size (position of the lens) fixed a precise measurement as function of
laser pulse energy was performed and it provided more detailed information on the
laser intensity dependence with this target material For laser energies above 30 mJ and
intensities in the region from 1016
Wcm2 to 10
17 Wcm
2 the Cu Kα yield scales linearly
2 Optimization of a laser-plasma based X-ray source
16
with laser energyintensity - Fig 26 There has been no evidence of saturation in
agreement with theoretical calculations which predict an optimum intensity for Cu Kα-
production of a few times 1017
Wcm2 [121 137]
Additionally a data set with a controlled
pre-pulse arriving 6 ps before the main pulse is also presented in this figure An
obvious improvement in the Kα-production is observed A detailed discussion of this
effect will be presented in the next section The maximum absolute yield obtained in
this measurement is in line with other reported Cu Kα sources [107 148 154 155]
25 Optimization of Kα X-ray emission by using a controlled
pre-plasma
Another approach for optimization of the Kα emission is to improve the energy
conversion efficiency from the laser pulse to electrons and subsequently to Kα photons
The dominant absorption mechanism at laser intensities around 1017
Wcm2
is expected
to be resonance absorption (RA) [116 121 131 133 152 156-158]
The crucial parameter for the
efficiency of the energy transfer for this mechanism is the plasma density scale length
at the time when the maximum pulse intensity is reached Assuming isothermal plasma
expansion an exponential electron density profile )exp()( 0 Lxnxn ee is
produced [159]
and the plasma density scale length L is defined as ee nnL Since
the plasma expands with a typical velocity of ~106ndash10
7 cms
[160-162] the time interval
between the plasma-formation threshold and the maximum intensity largely determines
the scale length seen by the pulse during the interaction Therefore the conversion
efficiency in this case is very sensitive to the temporal structure of the rising edge of the
laser pulse For this reason control over the time structure of the pulse provided by the
laser system becomes important to control the Kα emission An important parameter of
the laser pulse time structure is the contrast ratio defined as the ratio of intensity of the
pulse at the maximum and pre-pulsesbackground before the main pulse In some
previous work [130 148 152 156]
using laser systems with low contrast ratio pre-pulses
andor amplified spontaneous emissions (ASE) usually cause plasma formation long
before the peak of the pulse reaches the target Such long pre-plasma scale lengths
provided by the laser systems already lead to strong absorption making additional
improvements difficult However relying for a particular laser system only on its
inherent pre-pulse for ldquooptimizationrdquo is hardly satisfactory because the scale length will
rarely be optimized and matched to other parameters On the other hand with a very
2 Optimization of a laser-plasma based X-ray source
17
high contrast laser system it has already been demonstrated that introducing a pre-
formed plasma using a weak artificial pre-pulse can increase the conversion efficiency
of the X-ray yield from laser produced plasmas [118 137 163-167]
(this effect is also visible
in Fig 26) Therefore systematic investigations of the plasma scale length
requirements for different experimental conditions are necessary In this section the
mechanism of the resonance absorption will first be explained Then the experimental
results are presented followed by their discussion
251 The resonance absorption (RA) and its optimum
condition
The resonance absorption occurs when an electromagnetic wave with p-
polarization (the electric field in the plane of incidence) is obliquely incident in an
unmagnetized inhomogeneous plasma In this process the electromagnetic wave
couples with the electron plasma wave at the region of critical density (defined as
nc=22 4 em L where m and e are the charge and the mass of the electron respectively
and L the angular frequency of the laser light) where the local electron plasma
frequency equals the incident wave frequency There the energy is effectively
transferred from the incident electromagnetic wave to electron plasma wave and the
electron plasma wave can be resonantly enhanced As the electron plasma wave grows
nonlinear wave-breaking [168 169]
can lead to the consequent production of hot
electrons
2 Optimization of a laser-plasma based X-ray source
18
Fig 27 Scheme of oblique incident laser pulse traveling inside a
plasma The red violet green and magenta trajectories represent the
propagation path of the incident laser pulses with angle of incidence
of 60deg 40deg 20deg and 0deg respectively The double arrows
perpendicular to the trajectories represent the polarization of the
electric fields (p-polarization) The trajectories are reflected before
reaching the critical density layer where nenc=1 The turning point
depends on the angle of incidence
A simple theoretical estimate of the optimum condition for RA is given by the
formula (2πLλ)23
sin2αmax = 06
[147] where Lλ is the plasma scale length normalized
to the laser wavelength αmax is the angle of incidence at which RA is optimized This
equation is obtained by solving the wave equation for light wave propagation in a
plasma with linear density profile It expresses an important relation between the
plasma scale length and αmax the angle of incidence for the optimum absorption
decreases with increasing plasma scale length The mechanism can be described
qualitatively in Fig 27 The absorption occurs in the critical density region where
ne=nc ne is the local electron density in the plasma The total absorption depends on
2 Optimization of a laser-plasma based X-ray source
19
how large the field driving the resonance is at the layer of critical density This field is
firstly determined by the angle of incidence because only the field component along the
density gradient which varies as sinα contributes to the excitation of electron plasma
wave Secondly since the refractive index of the plasma in the undercritical region
decreases with increasing density (ie Drude-model) an obliquely incident light wave is
refracted towards regions of lower density and reflected at a density lower than the
critical density (turning point) with ne= nccos2α
[147] Although the laser light wave
can propagate only up to turning point before it is specularly reflected some amount of
the light energy will tunnel into the critical density region and drive the resonance The
value of this driving field at the turning point can be estimated using the Airy function
solution [170]
and it decays exponentially depending on its travel distance as it penetrates
beyond the turning point Thus the resulting driving field at the layer of critical density
is a competition between maximization of the electric field component along the
density gradient and the distance of the field penetration beyond the turning point
Particularly in the situation of the experiments that will be presented later for a long
scale-length system (eg Lλ asymp 1) the turning point of a steep angle of incidence is
closer to the layer of critical density as one can see in the Fig 27 Although the field
component normal to the density gradient is weak in this case the short attenuation
distance to the critical density surface provides a stronger driving field than the one
with large angle of incidence which has large field components normal to the density
gradient but the field decay dramatically due to the large tunnel distance to reach the
critical density surface The stronger driving field at a small α (eg asymp 25deg) leads to the
stronger absorption than with a large α (eg asymp 55deg) On the other hand for a short scale-
length system (eg Lλ asymp 01) the positions of turning points of all incidences are all
close to the layer of critical density thus the attenuations of their driving fields due to
the tunnel distance are neglectable With increasing angle of incidence α (eg asymp 55deg)
the electromagnetic wave spends progressively more of its time near nc and the
excitation of the electron plasma wave at the critical density layer becomes more
efficient This leads to more efficient absorption than at small α (eg asymp 25deg)
2 Optimization of a laser-plasma based X-ray source
20
Fig 28 Plasma density profile for different times (a) arrival of the
pre-pulse (b) between pre- and main pulse and (c) when the main
pulse arrives
In order to establish a well defined plasma scale length in the work described later
the pre-plasma is produced by a laser pre-pulse arriving with a controllable delay before
the main laser pulse In Fig 28 a schematic of this arrangement is presented The pre-
pulse strikes the target surface and ionizes the material Subsequently the created
plasma starts to expand Assuming a constant expansion velocity Cs = (ZkTeM)12
the
plasma scale length L grows linearly in time according to L equiv Cst [171]
(Te is the
electron temperature determined by the pre-pulse intensity Z is the average ionization
degree k is the Boltzmann constant and M is the ion mass) After a certain time ∆t the
main pulse arrives and strikes on this pre-formed plasma with a specific density scale-
length L This scheme offers the possibility of actively manipulating and optimizing the
coupling efficiency hot electron distribution and thus the Kα emission With such a
precisely controlled pre-plasma the optimum conditions for RA discussed in this
section can be used to compare with the experimental conditions for which the Kα yield
is optimized in the following experiments
252 Experimental results
According to the results discussed in the previous section the experiments in this
chapter where performed under ldquooptimumrdquo focusing conditions The Cu targets were
placed exactly in the focus of the lens while the Ti targets were placed about 900 μm in
front of the focus These configurations lead to intensities on the Cu and Ti targets of
16 times 1017
Wcm2
(focus diameter ~20 μm FWHM) and 92 times 1016
Wcm2
(~25 μm
FWHM) for the main pulse and 20 times 1014
Wcm2
(~70 μm FWHM) and 11 times 1014
Wcm2 (~90 μm FWHM) for the pre-pulse respectively
2 Optimization of a laser-plasma based X-ray source
21
The absolute Cu and Ti Kα emission as a function of the main pulse delay at a
fixed angle of incidence of 45deg on targets of different thickness are presented in
Fig 29 (a) and Fig 29 (b) respectively The Cu and Ti Kα emission signal
normalized to the emission measured at negative time delay (52 times 108
photonspulsesr
for 20 μm Cu 82 times 107
photonspulsesr for 300 nm Cu 14 times 109
photonspulsesr for
20μm Ti and 12 times 108
photonspulsesr for 300 nm Ti) are presented in Fig 29 (c) and
Fig 29 (d) respectively The Kα yields of the 20 μm targets are six and eleven times
larger than for the 300 nm Cu and Ti thin film targets respectively This is because at
these intensities the mean-free-path of the hot electrons is much larger (several microm
[121 130 172]) than the thickness of the thin film targets Therefore in the thin films only a
small fraction of all the hot electrons will create a hole in the K-shell and thus the Kα
emission is much less than for a bulk target
In the presence of an extended pre-plasma created by the pre-pulse the Kα yield
starts to improve After a certain time delay the Kα yields reach their maximum value
and start to drop with further increasing delay times A very similar behavior is
observed for thick and thin targets as can be seen from Fig 29 (c) and (d) These
results show that the pre-plasma which is generated by the controlled pre-pulse permits
effective Kα production At an angle of incidence of 45deg an ldquooptimumrdquo time delay for
Kα production exists on all types of targets Under these optimum conditions the Kα
production on all targets is improved by almost a factor of 2 whereby the coated targets
exhibit slightly better improvements than the thick foil targets On the other hand it
should be noted that the Bremsstrahlung-background also increases with increasing Kα
yield This is shown in Fig 29 (e) where the measured X-ray signal integrated in the
energy range from 6 - 30 keV for Ti and 10 - 30 keV for Cu is plotted as a function of
pre-pulse - main pulse delay These energy ranges have been chosen to exclude the
above mentioned many-pixel-events produced by single Kα photons since these
many-pixel-events contribute to the background only below the Kα energy
2 Optimization of a laser-plasma based X-ray source
22
Fig 29 Kα emission as a function of main pulse delay at a fixed
angle of incidence of 45deg on targets of different thickness (a) Cu and
(b) Ti (c) Kα emission of Cu-targets normalized to the emission
measured at negative delay time (52 times 108
photonspulsesr and 82
times 107
photonspulsesr for d = 20 μm and 300 nm respectively) (d)
Kα emission of Ti-targets normalized to the emission measured at
negative delay time (14 times 109
photonspulsesr and 12 times 108
photonspulsesr for d = 20 μm and 300 nm respectively) (e) Hard
X-ray background signal as a function of main pulse delay on 20μm
targets
2 Optimization of a laser-plasma based X-ray source
23
Fig 210 Absolute Kα emission as a function of main pulse delay at
different angle of incidence ( a ) Cu and ( b ) Ti The measured Kα
yield at negative or zero delay is the same as obtained without pre-
pulse
In the following a more systematic study of the influence of a pre-plasma on the
Kα production using the 300 nm thin film targets will be presented With their high
(optical) surface quality the uncertain condition for the formation of plasma caused by
2 Optimization of a laser-plasma based X-ray source
24
surface roughness can be avoided [173]
Based on the very similar behaviour of thin film
and bulk targets for the specific conditions of the measurements presented in Fig 29 it
is presumed that the results obtained on thin films which will be discussed below can
be transferred to thick targets (by scaling of the absolute yield) Fig 210 (a) and (b)
show the Cu and Ti Kα emission as a function of the main pulse delay at different
angles of incidence respectively Since the pre-pulse arrives after the main pulse and
thus does not play a role at negative delay time the X-ray yields obtained in this
situation will be refer to the situation as rdquowithout pre-pulserdquo in the later discussions
Introducing a pre-pulse results in an increase of the Kα yield which is particularly
important for small angles of incidence The Kα yield of both target elements exhibit
similar qualitative dependencies on delay time and angle of incidence though the Ti
target shows noticeably larger relative variations
253 Discussion
Due to the high contrast ratio laser pulses used in the present experiment the
scale-length in the absence of the controlled pre-pulse will be very small With short
scale-lengths as already discussed in section 251 the maximum absorption occurs at a
large angle of incidence αmax typically 70deg or 80deg [147 174 175]
In such a case the
absorption should increase monotonically with the angle of incidence and this is
expected to result in an increase of the Kα yield In Fig 211 the measured absorption
of the main pulse and the Cu and Ti Kα yield without pre-pulse from Fig 210 are
presented together The measurement was carried out at constant laser intensity
(~16 times 1017
Wcm2
for Cu and ~92 times 1016
Wcm2 for Ti) With a sample thickness of
300 nm no light is transmitted Thus the absorption A can be simply determined from a
measurement of the reflectivity R using the two photodiodes shown in Fig 23 as
A = 1 - R As can be seen in Fig 211 the laser absorption does indeed increase with
the angle of incidence α for both target elements so do the Kα yields These
observations are in agreement with the previous works [147 174 175]
2 Optimization of a laser-plasma based X-ray source
25
Fig 211 Absorption measurement with main pulse only measured
at constant laser intensity Scale on left hand side absorption scale
on right hand side Cu and Ti Kα yield without pre-pulse (data taken
from Fig 210)
With a specific target material the only two variable parameters determining the
plasma scale-length L are t (delay between the pre-pulse and the main pulse) and Te
(the electron temperature determined by the pre-pulse intensity) (see section 251)
When the pre-pulse laser intensity is constant L can be assumed to be approximately
proportional to t For this reason although the absolute values of the scale-length were
not measured in the experiment the relative values from these data can be deduced and
be compared to the theoretically estimated values assuming RA as the dominant
absorption mechanism This comparison revealed that the maximum Kα yields correlate
with the maximized absorption
Using (2πLλ) 23
sin2αmax = 06 as the condition to maximize RA (see section
251) optimum normalized scale lengths of 0135 0209 0392 and 0980 are
calculated for angles of incidence of 55deg 45deg 35deg 25deg respectively In Fig 212 (a)
the optimum delay times of the pre-pulse for maximum Kα emission in Fig 210 are
shown The maxima appeared at about 3ps 5ps 8ps and 15ps on the Cu target at 55deg
45deg 35deg and 25deg respectively For Ti they were at about 2ps 3ps 5ps and 11ps at
55deg 45deg 35deg and 25deg respectively Fig 212 (b) compares the optimum delay time
from Fig 212 (a) normalized to the value found at 55deg with the theoretical estimate of
the optimum scale length for RA normalized also to the 55deg-value Since the intensity
2 Optimization of a laser-plasma based X-ray source
26
was kept constant (of the pre-pulse as well as of the main pulse) the scale length is
proportional to the delay time The comparison shows that the normalized plasma scale
lengths for the best Kα yield from both target materials are in good agreement with the
theoretically estimated optimal scale length for RA The optimum pre-pulse delay
increases with decreasing angle of incidence since the optimum plasma scale length for
maximum RA increases with decreasing angle of incidence Fig 212 essentially proves
that a maximized absorption corresponds to maximum Kα yield
( a ) ( b )
Fig 212 (a) The optimum delay time for the pre-pulse having the
maximum Kα yields extracted from Fig 210 (b) Comparison of
experimental data and theoretical estimation Points are the
experimental data in (a) normalized to their respective value at 55deg
Dashed curve is the theoretical calculation of the optimum plasma
scale length for resonance absorption also normalized to 55deg-value
The theoretical curve is calculated from (2πLλ)23
sin2θ = 06
[147] and
its absolute value indicates at Y-axis on the right hand side
In order to see how the Kα yield develops for different conditions of plasma scale
length and angle of incidence the dependencies of the Kα yield as a function of the
angle of incidence for different fixed pre-pulse delay times t are deduced from the
data of Fig 210 and plotted in Fig 213 For the present experimental conditions t
essentially represents the value of the plasma scale length L and thus the data plotted in
Fig 213 show the Kα yield as a function of the angle of incidence for different plasma
scale lengths From the previous discussion of Fig 212 the plasma scale length at
t = 15 ps for Cu is estimated as L = 082 and for Ti L = 126 For t = 0 ps (very
short scale length) the Kα yield increases monotonically with α The maximum Kα
yield is beyond 55deg When the delay t (scale length) is increased the maximum Kα
yield shifts to a smaller angle of incidence eg in (a) for t = 4 ps the maximum
appears at 45deg for t = 7 ps at 35deg Finally t = 15 ps the Kα yield decreases
2 Optimization of a laser-plasma based X-ray source
27
monotonically with α indicating the maximum Kα yield is reached at angles of
incidence of less than 25deg As discussed above the maximum Kα yields correlate with
maximum absorption which in turn shifts to small angles of incidence at large t (large
plasma scale length) The behavior of the Kα yield proves once again that RA is the
dominant absorption mechanism
( a ) ( b )
Fig 213 Kα emission as a function of the angle of the incidence at
fixed pre-pulse delay a) Cu at t = 0ps 4ps 7ps 15ps ( b ) Ti at
t = 0ps 3ps 8ps 15ps
Since the goal for this study is to achieve the best Kα yield for time-resolved X-ray
diffraction experiments it is worth to compare the absolute Kα yield for different angles
of incidence at optimum scale length and without pre-pulse As can be seen from Fig
214 without pre-pulse the Cu and Ti Kα yields increase linearly with the angle of
incidence On the contrary at the optimum delay (optimum plasma scale length) the Kα
yield is essentially independent of the angle of incidence Although these observations
have not been fully understood it indicates that the reduced main-pulse-only yield at
smaller angles of incidence can be fully compensated (ie the yield can be brought back
to its maximum value) by an appropriate pre-pulse
2 Optimization of a laser-plasma based X-ray source
28
Fig 214 Cu and Ti Kα yield as a function of the angle of incidence
at the maximum value and without pre-pulse The lines are to guide
the eye only
If one extrapolates the linear dependencies measured without pre-pulse to higher
angles they reach the angle-independent optimized level at a finite angle of incidence
In the case of Cu this seems to occur at a large angle of incidence near 90o For Ti this
level is already reached at angles of incidence slightly above 60o This result might
arise from the presence of a short scale length pre-plasma caused by the leading edge of
the main pulse alone (even for a high contrast laser pulse and in the absence of any
further pre-pulse) As discussed for the absorption in Fig 211 it indicates that in the
present experiment at this large angle of incidence the plasma scale length generated by
the main pulse alone fulfills the condition for optimum RA and thus maximized Kα
generation Hence the optimized Kα yield can be achieved without introducing an
artificial pre-pulse ndash a conclusion which is also supported by PIC simulations (see
section 26) This would also explain why in many experiments even a relatively poor
contrast ratio laser system allows to achieve high Kα yields [130 148 152 156]
Nevertheless it can be concluded that for a given contrast ratio (given by the laser
system) and ion mass or a given scale-length in the experiment one should choose the
appropriate angle of incidence α to obtain the maximum Kα yield Or vice versa if α is
fixed then one has to adjust L accordingly via pre-pulse control Such an optimization
could be achieved at least in the range of the values of α and L (obtained from Δt)
covered by the current experiment ie α ~ 25deg hellip 55 deg and Lλ ~ 01 hellip 1
2 Optimization of a laser-plasma based X-ray source
29
Fig 215 Energy conversion efficiency vs angle of incidence with
pre-pulses and without pre-pulses
An important note concerning the energy conversion efficiency should also be
made here The angular independent optimized Kα yield shown in Fig 214 was
obtained by keeping the laser intensity constant The focused spot size projected onto
the sample surface increases with angle of incidence as 1cos() Therefore at large
angle of incidence (eg α = 80deg) one needs more laser pulse energy than at small
angles of incidence (eg α = 20deg) for the same amount of produced photons (In this
example a factor cos(20deg)cos(80deg) ~ 5 times more for α = 80deg compared to α = 20deg) It
can be noticed that the energy conversion efficiency from laser pulse into Kα X-rays
essentially decreases with the increasing angle of incidence To clarify this issue more
clearly the energy conversion efficiency has been deduced from Fig 214 using the
known laser energies Kα photon energies and Kα yields and is presented in Fig 215 In
principle the conversion efficiencies obtained here are in line with other experimental
results reported in the literature [129 176]
Without the pre-pulse the conversion efficiency
increases with the angle of incidence for both materials As already discussed in Fig
210 the absorption improves with increasing angle of incidence for the given small
pre-plasma scale length that is caused by the main pulse itself and thus leads to a higher
Kα yield On the contrary at the optimized pre-pulse conditions the conversion
efficiency decreases with increasing angle of incidence as predicted
2 Optimization of a laser-plasma based X-ray source
30
26 Comparison of the experimental results with simulations
Particle-in-Cell simulations (PIC) are a very powerful and direct numerical tool for
modeling laser-plasma interactions [177-179]
In the PIC simulation the charged particles
(electrons ions neutrals molecules dust particles etc) are modeled as individual
macro-particles moving in non-physical grid across the plasma (the cell part of the
name) using Newtons laws and self-consistently calculated electric fields resulting
from external (applied) fields and internal fields from charge distributions By solving
the equations of motion of these particles the moments of the distribution of the
particles such as densities and currents can be obtained simultaneously The results of
PIC simulations presented in this section were preformed by M Mašek and P Gibbon
with whom we cooperated
To obtain a quantitative estimate of the Kα production this simulation consists of
two steps The energy distribution of hot electrons generated by the laser-plasma
interaction was first determined with PIC simulations Then the total Kα photon yields
produced by fast electrons going inside the target were calculated with a Monte-Carlo
method which is a stochastic technique using random numbers and probability
statistics to investigate mathematical or statistical problems [180]
The detailed PIC simulations were performed by using the 1D3V (1 spatial 3
velocity coordinates) code BOPS (Boosted Oblique Particle Simulation) [127 131]
which
can treat oblique incidence Up to 6000 spatial grids and 500000 electrons and ions are
used in the simulation The laser is p-polarized with fixed intensities as in the
experiments The initial plasma parameters were chosen as close as possible to those
expected in the experiment More details can be found in Ref [181]
Fig 216 shows the dependence of absorbed energy on the plasma scale-length
from the simulation It is found that the scale length at which absorption becomes
maximum decreases with increasing angle of incidence qualitatively in agreement with
the simple RA-picture presented above (Fig 212(b)) Moreover the scale-length
dependencies of the absorption show a general qualitative correlation with the
experimental dependencies of the Kα yield with delay time as shown in Fig 210
2 Optimization of a laser-plasma based X-ray source
31
( a ) ( b )
Fig 216 The calculated absorbed energy as a function of the initial
plasma density scale length and incidence angle for Cu ( a ) and Ti
( b ) targets Pictures reproduced from Ref [181]
The total number of Kα photons generated by the hot electrons during their
propagation through the nonexcited solid material underneath the plasma layer was
calculated according to a standard cross section model using a method similar to Ref
[129 182] The electron distributions obtained from the PIC simulations are split into
several monoenergetic beams and transported through the foil which is divided into
several cells Using the relativistic K-shell ionization cross section [124]
the number of
generated Kα photons is calculated With the Monte-Carlo method each electron beam
is slowed down via collisions according to the Bethe stopping formula whereby the
stopping power is taken from the NIST database [183]
for both materials Once the
electron beam escapes from the rear of the target it is assumed to play no further role in
the Kα production a reasonable assumption because the foils were mounted on low-Z
(glass) substrates The reabsorption of Kα photons is also taken into account The
attenuation coefficient is taken also from the NIST database [184]
Fig 217 shows the dependence of the Kα yield on the initial density scale-length
It is clear that the qualitative behavior from Fig 217 (a) and 217 (b) is the same for
both materials as in the experiment (Fig 210) The Kα yield reaches its maximum for
roughly the same scale-length as the laser absorption indicating that the Kα yield is
largely determined by the absorption efficiency On the other hand the absolute values
of Kα yields obtained from the PIC simulations are roughly a factor of 3 to 4 times
lower than the measured values a discrepancy which could be due in part to the
geometrical simplifications in the model There are also differences in the positions and
2 Optimization of a laser-plasma based X-ray source
32
values of the Kα maxima although these are difficult to define precisely for the
simulations because of insufficient statistics
( a ) ( b )
Fig 217 Calculated Kα yield as a function of the intial plasma
density scale length and incidence angle for ( a ) Cu and ( b ) Ti
targets Pictures reproduced from Ref [181]
Finally I would like to add a comment on the time structure of these X-ray pulses
predicted from the PIC simulation although it does not directly relate to this
measurement The result of PIC simulation did show that the duration of these X-ray
pulses is in the sub-picosecond region [121]
and this prediction has been experimental
proved in the following time-resolved experiments
27 Summary
In summary the emission of Kα-photons of Cu and Ti targets was measured at
different laser intensities sample thickness angles of incidence and different pre-
pulsepre-plasma conditions It has been shown that for the given experimental
conditions an optimum laser intensity for Kα-production can be reached in the case of
Ti For Cu this optimum intensity appears to be higher than the maximum intensity
attainable in the experiment For constant laser intensity on a steep density gradient
plasma the Kα yield is highest at large angles of incidence For smaller angles the yield
decreases and reaches its lowest value when approaching normal incidence However
introducing a pre-pulse at appropriate time in advance to the main pulse the yield can
be increased to the same value as at large angle of incidence without a pre-pulse
Therefore the optimized Kα yield is independent on the angle of incidence and it can be
achieved by proper choice of the pre-pulse timing Experimentally this was verified for
angles between 25 deg to 55 deg
2 Optimization of a laser-plasma based X-ray source
33
It was also experimentally found and supported by simulations that the Cu and Ti
Kα generation follows the laser absorption as known for other materials [77 118 164 172
156 163 167] As expected resonance absorption (RA) has been proved to be the dominant
absorption mechanism in this process and optimization of the Kα production results
from a maximized absorption of the laser pulse For a high contrast laser system as
used in this experiment controlled pre-pulses provide well defined pre-plasma scale-
lengths allowing systematic investigation on the optimization of absorption Kα
production for the other given experimental conditions (material angle of incidence
pulse energy intensity) The simulations with these well defined initial parameters
show the qualitative agreement with experimental observations and provide insights
into the physical process of laser energy absorption hot electron generation electron
transport in the material and the resulting Kα generation
For practical purposes the present work indicates that for long plasma density
scale lengths created by the leading edge of a low contrast ratio laser system and other
experimental conditions (within the range Lλ ~ 01-10) the Kα emission from a laser
produced plasma could be optimized by operating the X-ray source at the matched
angle of incidence Experimental arrangements in which an unintentional (or
unavoidable) pre-pulse is present could probably be improved simply by using a small
angle of incidence instead of the 45deg geometry typical of many setups The present
study indicates that the X-ray emission could be increased by a factor of 2 or 3 in this
case with obvious advantages for many applications of fs-Kα sources such as time-
resolved X-ray diffraction (TRXD) On the other hand for a high contrast laser system
leading where the self generated plasma exhibits a steep density gradient (small scale
lenghth) these findings still suggest to use a small angle of incidence and a matched Δt
For the same value of Kα emission this requires less energy to achieve the same on-
target intensity as with a large angle of incidence and subsequently leads to a better
energy conversion efficiency
In the following chapter these results are applied to improve the laser-plasma
based X-ray source for the TRXD experiments
3 Improvement of the modular setup for time-resolved X-ray diffraction experiments
34
3 Improvements of the modular setup for
time-resolved X-ray diffraction experiments
As it has been discussed in detail in the previous chapter focused laser intensities
in the range of 1017
- 1018
Wcm2 are required to efficiently generate X-rays in the
multi-keV range If the irradiated target is surrounded by an atmosphere non-linear
effects (eg self-phase-modulation self-focusing [185]
) and plasma formation
(breakdown) in the atmosphere will severely deteriorate the spatial intensity
distribution of the focused femtosecond pulse and the required on-target intensities
cannot be reached Therefore the X-ray target has to be placed in vacuum Two
different set-ups to perform time-resolved X-ray diffraction are currently used at the
University of Duisburg-Essen One scheme uses a large vacuum chamber to place not
only the X-ray target but the whole setup (including X-ray optics samples and
detectors) under vacuum [70 140]
This scheme avoids absorption losses of the generated
X-rays in air (which is more critical for lower energy radiation like Ti K- 451 keV)
but it poses some geometrical restrictions due to its limited size Moreover operation of
the setup is relatively complicated since most of the components in the chamber require
remote control
To overcome some of these drawbacks a second scheme for time-resolved X-ray
diffraction experiments had been designed and built up mainly by Dr Matthieu Nicoul
[186] and since then it has been continually further developed This setup has a modular
design and only the X-ray sourcetarget itself is operated under vacuum and all the
other experimental components are placed in air This gives a lot of advantages such as
more space for experimental components and convenience in adjusting them It was the
aim of the work described in this chapter to improve the existing setup to allow for
time-resolved Bragg-diffraction experiments with increased accuracy (see chapter 5)
and to enable new experimental schemes that had not been possible before (ie time-
resolved Debey-Scherrer-diffraction see chapter 6) In the first part of this chapter the
fundamental components of the previously existing setup are briefly described In the
3 Improvement of the modular setup for time-resolved X-ray diffraction experiments
35
second part I present and discuss the implemented improvements including hardware
software and methodology Finally a summary for this chapter is given
31 The fundamental components of the current setup
A scheme of the current setup is shown in Fig 31 The fundamental components
(labeled with black letters on Fig 31) had already been described in detail in Ref
[186] In order to provide the necessary information to the reader the important
components will be briefly pointed out in this section The implemented
improvementsadditions to this setup are also represented on Fig 31 (labeled with blue
letters) and they will be discussed in the next section 32
Fig 31 Scheme of the current modular setup for time-resolved X-
ray diffraction experiments The elements labeled with black letters
are components of the previously existing setup and the ones labeled
with blue letters are components implemented during my PhD work
The CPA Tisapphire laser system described in chapter 2 delivers 150 fs laser
pulses at a wavelength of 800 nm with an energy of 120 mJ at a repetition rate of 10
Hz The laser beam (the red optical path in Fig 31) is split into two parts by a mirror
with a small off-center hole (7mm in diameter) The transmitted part serves as the
3 Improvement of the modular setup for time-resolved X-ray diffraction experiments
36
optical pump beam to excite the sample under study while the reflected part is focused
by a lens of 300 mm focal length onto a Cu-tape target with an incident angle of 45ordm (p-
pol) to produce the Cu Kα (805 keV) probe pulse
For the reasons mentioned in the introduction of this chapter the Cu-target is
placed inside a compact vacuum chamber (size 24times30times30 cm3) which includes
connectors for the vacuum pump a pressure gauge and electrical feedthroughs as
shown in Fig 32 For mechanical and radiation safety reasons this chamber is made of
stainless steel with a wall thickness of 15 mm Additionally a 2 mm lead cover was
added inside the chamber to enhance security and to reduce the level of background
radiation that may reach the detector The working pressure of the chamber is 01 mbar
(a) (b)
Fig 32 Overview of chamber (a) outside and (b) band target inside
the chamber
The target consists of a 10 microm thick Cu tape mounted on a motorized spooling
system which works similarly to an audiocassette recorder (Fig 33 (a)) The pulling
speed is approximately 8 mms (ie 800 microm motion between two consecutive laser
pulses) to ensure that a fresh surface area is provided for each laser pulse The tape
shifts vertically to its pulling direction by about 08 mm when the pulling direction is
(automatically) changed One set of band (25 mm wide and 15 m long) can provide
more than 12 hours experiment time In order to minimize the deposition of ablated
material in particular at the small hole where the X-rays can leave the chamber [187]
a 8
μm Kapton foil has been rolled together with the Cu tape before mounting it to the
spooling system The Kapton foil runs simultaneously with the tape to pick up the
debris which is predominantly ejected at the back-side of the tape normal to its
surface [187]
Close to the laser-target interaction point it is mechanically separated from
the Cu tape by about 2 mm (see Fig 33 (b))
3 Improvement of the modular setup for time-resolved X-ray diffraction experiments
37
(a) (b)
Fig 33 (a) Photo of band target (b) Kapton foil used for reducing
material deposition
Using a pin-hole camera the size of the X-ray source on the tape target was found
to be similar to the spot size of the focused laser beam ie ~25 microm [187]
The Cu Kα
emission is close to 5times109 photonspulse in 4π solid angle without pre-pulse and 1times10
10
photonspulse with an optimized pre-pulse (see section 321) Since the X-ray emission
is into the full solid angle a multilayer X-ray optic with Montel-Helios geometry [188]
is
used to collect the radiation and to refocus it onto the sample under investigation The
multilayer X-ray optic reflects both the Cu Kα1 and Kα2 emission lines but suppresses
other spectral components (ie K) More details on the working principle and the
specifications of this mirror can be found in Appendix A
The focused X-ray beam was characterized at different positions of the beam path
through four relevant parameters [186]
the beam profile directly after the multilayer
optic the total number of reflected photons the convergence of the beam and the size
of focus spot A direct detection CCD camera was used to measure the first three
relevant parameters of the X-ray beam since it allows a rather accurate estimation of
the absolute detected X-ray signal (eg number of diffracted photons per pulse) A X-
ray beam profile taken at 4 centimeters after reflection on the multilayer optic is shown
in Fig 34 (a) Since the X-ray emission from the plasma is isotropic (ie homogeneous
illumination of the mirror) the intensity distribution measured at such a short distance
after the optic gives direct information on the spatial reflection properties of the two
multilayer mirrors The image in Fig 34 (a) demonstrates the uniformity of the
reflectivity over the mirror surfaces Due to the mounting configuration of the
multilayer mirrors inside the housing the beam shape is a 45deg rotated square [Appendix A]
The convergence angle of the beam was measured to be approximately 023deg which
3 Improvement of the modular setup for time-resolved X-ray diffraction experiments
38
corresponds to the specifications of the manufacturer (024deg) Using the known
sensitivity of the direct detection CCD camera [186]
the Cu Kα flux in the focused beam
can be determined from images like the one shown in Fig 34 (a) With an optimized
pre-pulse a typical flux of 13times105
photonspulse was obtained The intensity
distribution at the focus spot was measured with an indirect phosphor based detector
(Gemstar) [186]
A typical image with horizontal and vertical cross sections is shown
in Fig 34 (b) The measured FWHM of the focus spot is 150 microm in horizontal and 127
μm in vertical With the given source size of approximately 25 microm and the 5x
magnification of the multilayer optics this is close to the expected value
(a) (b)
Fig 34 (a) Topography of Cu Kα beam observed with the direct
detection CCD camera 4 cm after reflection on multilayer mirror (b)
Intensity distribution of Cu Kα emission at the focal point of the
multilayer optic obtained with the phosphor based detector Pictures
reproduced from Ref [186]
Since most of the experimental components of the modular setup are placed in air
they are easily accessible and can be conveniently manipulated In order to minimize
losses by absorption of the Cu Kα-radiation in air [189]
the optics housing is purged with
He and He-purged beam-tubes were installed in the X-ray beam path Although the X-
ray beam path cannot be covered completely more than 90 of the radiation collected
and reflected by the X-ray optic is delivered to the sample
The samples are mounted on a motorized x-y-θ stage to adjust the Bragg-angle (θ)
and the beam position on the sample (x-y) The diffraction signals have been recorded
so far by two different X-ray sensitive area detectors The first detector is a direct
3 Improvement of the modular setup for time-resolved X-ray diffraction experiments
39
detection CCD-camera (type PI-MTE 1300B) which has also been used for the
measurements discussed in chapter 2 As it has been explained before due to the strict
relation between the X-ray photon energy and the generated charge this detector can be
used as a spectrometer (see chapter 2) and allows determination of the absolute X-ray
signal with rather high accuracy (single photon sensitivity) The low quantum
efficiency (18 ) and the slow readout time are its main drawbacks The second area
detector uses indirect detection A phosphor screen converts incoming X-ray photons
into visible photons The optical signal is amplified by an image-intensifier and then
detected by a normal CCD Although this system allows single photon detection at high
gain of the intensifier there is no well-defined relation between the detected signal and
the X-ray photon energy On the other hand this detector has a high quantum efficiency
(85 for Cu Kα radiation [186]
) and high read-out rate (up to 10 Hz) so that an image
can be recorded for each single X-ray pulse A more detailed discussion of these
detectors and their specific advantages and drawbacks can be found in Ref [186] as
well as in Appendix B
The energy of the pump beam used to excite the sample is adjusted with a half-
wave-plate in conjunction with a thin film polarizer and monitored with a PIN diode A
motorized translation stage with a retro-reflector allows varying the delay between the
optical pump and the X-ray probe beam The p-polarized pump beam is focused with a
lens of 1 meter focal length onto the sample surface The angle between laser pump and
x-ray probe beam is set to be as small as possible ie approximately 10deg In order to
ensure that the measured diffraction signals represent the response of an almost
homogeneously excited region the diameter of the pump beam is chosen to be at least 3
times larger than the X-ray spot size Since the available amount of energy in the pump-
path (about 1 mJ per pulse) is more than sufficient for the experiments discussed in this
thesis a diaphragm has been used to adjust the pump beam spot size A removable
mirror which can be inserted in the beam path directs the beam to a CCD camera
positioned at a position equivalent to the distance to the sample to monitor the size and
the shape of the focused beam
32 Improvements of the modular setup
During my thesis work several improvements of the setup have been implemented
in order to (i) optimizeincrease the X-ray flux of the plasma source (ii) improve the
measurement sensitivityaccuracy and (iii) automatize and speed up the experimental
3 Improvement of the modular setup for time-resolved X-ray diffraction experiments
40
procedures This section describes in detail the necessary steps and modifications which
were essential to achieve the results of the time-resolved diffraction experiments
discussed in the following chapters in particular the results of the phonon softening
obtained on photo-excited Bismuth (Chapter 5)
321 Controlled pre-pulse to enhance the X-ray production
In chapter 2 it has been discussed in detail that a controlled pre-pulse with suitable
delay can be used to improve the X-ray production Based on this result a pre-pulse unit
(beam splitter and combiner delay stage see the black-dotted box in Fig 31) has been
added to the modular setup The main pulse energy is 110 mJ and the pre-pulse energy
is 15 mJ which results in intensities at the focus of the lens of 16times1017
Wcm2 for the
main pulse and 20times1014
Wcm2 for the pre-pulse respectively With a pre-pulse
arriving 5 ps before the main pulse the X-ray production of the modular setup has been
improved by about a factor of 2 which leads to more than 105 Cu Kα photonspulse
collected and focused by the X-ray mirror on the sample under normal experimental
conditions The positive effect of the pre-pulse was also briefly underlined and
presented in Dr Nicoulrsquos thesis
322 Avalanche photodiode (APD)
It was pointed out by Nicoul [186]
that the modular setup with the
magnifyingcollimating Montel-optic is most appropriate for experiments in which the
shape or angular position of the rocking curve of the excited sample does not change
but only the total diffraction efficiency (ie due to structure factor changes) Under
these conditions it is not necessary to use a detector with 2D resolution and therefore a
single-channel detector is sufficient Since the diffraction efficiency of the thin-film
samples typically used in the time-resolved experiments is low (10-3
-10-4
resulting in
diffraction signals of 10 - 100 photonspulse) a detector with high sensitivity down to
the single-photon level is required X-ray sensitive avalanche photodiodes (APD) fulfill
these requirements An APD is a photodiode with internal gain obtained by applying a
high reverse bias voltage to the photodiode which creates an intense electric field inside
its volume It combines the benefits of a photomultiplier tube (gain) and conventional
photodiodes (high quantum efficiency)
3 Improvement of the modular setup for time-resolved X-ray diffraction experiments
41
For the modular setup a large area (10 mm in diameter) Silicon APD was chosen
(its technical data are given in Appendix B) Using the direct detection CCD for
calibration the quantum efficiency of the APD for Cu Kα radiation was measured to
(36 plusmn 7) in agreement with previously published data [190 191]
This detector can be
easily operated at a repetition rate of 10 Hz and with more convenience (compact size
no need for water cooling) as compared to the phosphor based area detector To digitize
the detected X-ray signal a gated charge-integrating analogue-to-digital converter
(ADC) [192]
is used In order to match the APD-output to the input specifications of the
ADC a pulse shaperamplifier is added directly to the APD
The APDADC-combination was calibrated for the detection of Cu Kα radiation by
reducing the incident X-ray signal to the few-photons-per-pulse-level (0 to 6) and
analyzing the signal value distribution (histogram) of a large number of pulses
(typically a few thousand) for different bias voltages Results are shown in Fig 35 (a)
The signal value distributions exhibit a multi-peak structure as it is expected for a Si-
detector with its rather well defined relation between the charge generated by a single
X-ray photon and the photon energy (e g one Cu Kα photon produces 366 times 10 -4
pCb)
A multi-peak fit was applied to separate the individual peaks and to determine in
particular the position of each peak (marked in the figures) The first left peak
corresponds to the dark current background (no photon detected proven by blocking
the X-rays) and the second third fourth hellip peaks are correspond to one two three hellip
detected photons respectively By plotting the peak position as a function of photon
number in Fig 35 (b) and fitting the result by a linear function (Y = m + n X) the
corresponding ADC output (given in counts) for the background signal (parameter m)
and for a single Cu Kα photon (parameter n) can be determined for different bias
voltages The result is shown in Fig 35 (c) The ADC output per Cu Kα photon (black
squares) increases rapidly with bias voltage reflecting the corresponding increase of the
APD-gain It has to be noted that the dark current is also amplified with increasing bias
voltage underlined by the increase of the background signal (red circles)
Since the X-ray-to-charge conversion is known as well as the amplification of the
amplifier (11x) and the sensitivity of the ADC (32 counts per pCb) this APD-gain can
also be deduced from the information above The result is plotted in Fig 36 as a
function of bias voltage together with results of optical measurements (see below) and
data provided by the manufacturer All data are in a good agreement and the maximum
gain of 103 is proven to be achievable with this device
3 Improvement of the modular setup for time-resolved X-ray diffraction experiments
42
(a)
(b) (c)
Fig 35 (a) The signal value distributions (histograms) measured
with the APD at the few-photons-per-pulse-level at different bias
voltages The blue curves are the total multi-peak fits and the green
peak profiles are the separated individual peaks The peak positions
are indicated on the top of each peak (b) The values of peak
positions in (a) as a function of the number of detected photons
With the linear fitting function (Y = m + n X) the background
signals and corresponding ADC outputs (given in counts) pre Cu Kα
photon can be determined by the fitting parameter m and n
respectively (c) The corresponding ADC outputs per Cu Kα photon
(black square points) and the background signals (red circle points)
at different bias voltages
3 Improvement of the modular setup for time-resolved X-ray diffraction experiments
43
Fig 36 Comparison of the gain of APD from three measurements
Fig 37 APD signal as a function of PIN diode signal with different
operating voltages
Another important information concerns the question whether the (electric) output
signal is proportional to the (X-ray or light) input signal (linearity) The linearity of the
APD was checked by measuring an optical input with the APD at different bias
voltages and a regular Silicon PIN-diode which was known to be linear over the used
range of incident optical power In Fig 37 the APD-signal is plotted as a function of
the PIN diode signal for different APD bias voltages It turns out that the response of
the APD is linear for an ADC-output up to about 1000 counts For higher signal levels
the response becomes nonlinear Since the APD and the assembled electronic
3 Improvement of the modular setup for time-resolved X-ray diffraction experiments
44
shaperamplifier were not tested separately the source of the nonlinearity cannot be
determined at this point In the time-resolved diffraction experiments the nonlinearity
of the APD needs to be taken into account and corrected
323 Ionization chamber detector (ICD)
(a) (b)
Fig 38 (a) Photo of the ionization chamber detector and (b) its
working scheme
In order to normalize the diffraction signals and to determine the changes in the X-
ray diffraction efficiency of an optically excited sample with high accuracy it is
necessary to measure also the (relative) incident X-ray flux for each pulse For this
purpose a small ionization chamber detector has been placed behind the X-ray
multilayer optic A photo of the installed chamber and its working scheme is shown in
Fig 38 Part of the Cu Kα radiation reflected by the optic is absorbed and ionizes the
Ar-gas with which the cell is filled The Ar-pressure is around one atmosphere At 8
keV a transmission of 72 is measured and it agrees with the expected transmission
value of 16 cm Ar at 1 atm plus 16 μm of Kapton foil used as cell windows [189]
To
collect the charge generated by ionization a high bias voltage is applied (2000 kV) A
high speed current amplifier (type DHPCA-100 FEMTO) with a gain of 105 is used to
3 Improvement of the modular setup for time-resolved X-ray diffraction experiments
45
match the output signal of the ionization chamber to the input of the gated charge-
integrating ADC (same as used for recording the APD-signals)
In order to characterize the ionization chamber detector its linearity was measured
using the phosphor based area detector which can be regarded as a linear detector The
result of this measurement shown in Fig 39 (each data point corresponds to an
acquisition time of 30 sec) clearly shows the linear response of the ionization chamber
Fig 39 Calibration between ionization chamber detector and
phosphor based detector Red dashed line is a linear fit of the
measured data
Fig 310 Long term drift of the normalized ratio
3 Improvement of the modular setup for time-resolved X-ray diffraction experiments
46
It should be noted that the output signal of the ionization chamber is surprisingly
very sensitive to changes of the Ar-pressure (approx 30 change of signal for lt1
change of pressure) Therefore the pressure inside the chamber needs to be stabilized
during the whole measurement For this purpose a pressure control system consisting
of two pinhole valves and a pressure gauge was implemented (see Fig 38) It allows
stabilizing the pressure inside the chamber to about plusmn01 mbar (relative to the external
pressure) Despite stabilizing the pressure in the ICD we observed long term drifts of
the ICD-signal during the diffraction measurements As an example the ratio between
the APD and ICD signals from one representative measurement recorded over about
one hour is presented in Fig 310 The large pulse-to-pulse variations of the ratio are
caused by the counting statistics limited fluctuations of the APD-signal (only a few
photons per pulse are detected in this particular measurement) Additionally the ratio
which should be constant on average changes slowly with time So far no clear
explanation has been found for this effect These drifts can severely limit the achievable
accuracy in a time-resolved experiment when for example the different pump-probe
delays are sequentially measured during an experimental run The issue has been solved
by applying a ldquofastrdquo delay scanning technique in the experiments which will be
discussed in section 3262
324 Experiment control program
The modular setup is entirely controlled by a software program developed using
the LabVIEW environment The functions of this program include control and
monitoring of the different elements and detectors in the setup as well as data recording
and pre-processing All functions can be accessed from one interface (shown in Fig
311) which has been geometrically divided into two parts
3 Improvement of the modular setup for time-resolved X-ray diffraction experiments
47
Fig 311 Interface of the experiment control program
The upper part (part I) is used to prepare an experiment and to perform some
simple test measurements eg checking signal levels the background signals of the
detectors etc Frame (Ia) is a control panel for the pump-probe delay unit In frame
(Ib) the detected signals from individual detectors (ie PIN diodes APD ICD) can be
selected and displayed The received data can be recorded into files Frame (Ic) is a
waveform graph to show the histogram of the signal of the detector selected in frame
(Ib) Frame (Id) displays the real time trace for the selected detector
The lower part (part II) is used for the time-resolved diffraction experiments In
region (IIa) one can enter the relevant measurement settings eg background signal of
the different detectors acquisition time for the individual measurement points delay
range delay steps and saving folder Frame (IIb) shows the real time traces of the
measurement and the ratio APDICD The five indicators at the bottom of this frame
indicate the status of the measurement system Frame (IIc) displays a constantly
updated preliminary analysis (ie ratio APDICD vs delay time) of the measured data
In region (IId) several switches allow to change between different operation modes of
the tape target the laser triggering and the delay unit (eg fast scanning see below)
3 Improvement of the modular setup for time-resolved X-ray diffraction experiments
48
Frame (IIe) displays the correlation between APD and ICD and Frame (IIf) displays the
pump beam energy
part I To prepare the experiments and to perform some simple test measurements
Frame (Ia) Control of the pump-probe time delay
Frame (Ib) Selection and value display of the signals from individual detectors
Frame (Ic) Display of the signal value distributions of the selected detectors
Frame (Id) Display of real time traces for the selected detectors
part II To perform the time-resolved diffraction experiments
Frame (IIa) Input of the relevant measurement settings
Frame (IIb) Display of real time traces of APD ICD and their ratio
Frame (IIc) Display of a preliminary analysis of the measured data
Frame (IId) Control of tape motion and ldquofastrdquo scanning
Frame (IIe) Display of APD-signal vs ICD-signal
Frame (IIf) Display of the pump beam energy
Table 31 The functions of the individual areas in the user interface
of the experiment control program
For a better overview the functions described above are briefly summarized in
Table 31 This program has been proven very useful during the performed experiments
However further improvements are possible For example integration of control
functions for the sample holder might be required to allow a synchronized motion of
the sample during data acquisition (eg for experiments where the sample is
irreversibly damagedmodified by a single laser pulse)
325 Spatial and temporal overlap adjustments with APD
A very important and non-trivial part of performing a time-resolved diffraction
experiment is to find spatial and temporal overlap between the (invisible) X-ray probe
beam and the laser pump beam To find spatial overlap a similar procedure is applied
as described in Ref [186] The sample is moved vertically and horizontally with the
translation stage in order to scan its border through the X-ray beam Since the sample
surface is monitored by a camera on a video screen the disappearance of the X-ray
diffraction signal allows to localize the X-ray beam position by marking the sample
border in horizontal and vertical direction on the screen Then the optical beam can be
easily adjusted to overlap with X-ray beam on the marked position The spatial overlap
needs to be checked before every measurement
Once the spatial overlap is established the temporal overlap is adjusted by
exciting the sample with the laser and monitoring changes of the diffraction signal
while scanning the delay stage Two examples are presented in Fig 312 which show
3 Improvement of the modular setup for time-resolved X-ray diffraction experiments
49
the relative decrease in the diffraction signal upon laser excitation on thin films of Au
(333)-reflection (a) and Bi (111)-reflection (b) While the different physical processes
responsible for the observed signal changes will not be discussed here (see chapter 4
and 5) the time-traces allow to determine delay zero (temporal overlap) The accuracy
depends obviously on the speed of the induced changes and can reach the sub-
picoseconds level if the changes are fast (ie Bi) Moreover it should be emphasized
that using the APD and the new experiment control program allows to obtain such
results in just a few minutes Without the implemented improvement it usually took
around 45 to 60 minutes for the same purpose [186]
Finally it should be noted that the
observed decay of the Bi-diffraction signal in less than 400 fs (Fig 312b) represents an
upper limit for the temporal resolution that is possible with the modular setup A
temporal resolution of about 100 fs has been demonstrated with a similar X-ray source
in Ref [106]
(a) (b)
Fig 312 Time-resolved measurements with high temporal
resolution detected using APD (a) Au (333) and (b) Bi (111) The
cyan dashed line marks the position of time zero
326 Normalization of X-ray signals
Since only a few photons per pulse are diffracted from the thin film samples
typically used in the time-resolved X-ray diffraction experiments it is necessary to
accumulate signal over a sufficiently long time (a few hours are usually required for a
complete experiment) to enable the measurement of transient changes of the diffraction
efficiency at the percent level During this time the variation of the X-ray flux
delivered to the sample cannot be avoided without a normalization procedure In the
following one needs to distinguish between short-term fluctuations and long term drifts
3 Improvement of the modular setup for time-resolved X-ray diffraction experiments
50
Short-term fluctuations refers here to all intensity variations of the X-rays
occurring within seconds down to pulse-to-pulse fluctuations They are mainly caused
by energy and spatial (pointing stability) instabilities of the driving laser As mentioned
in chapter 2 the laser energy essentially affects the total X-ray yield Hence the pulse-
to-pulse energy fluctuation results in a fluctuation of the X-ray output signal For the
modular setup spatial instabilities represent the most critical issue which had already
been detailed discussed in Ref [186] Together with the position instabilities of the
copper tape with respect to the focused laser spot (caused mainly by mechanical
instabilities of the pulling system) the finite pointing stability results in fluctuation of
the spatial position of the X-ray source Due to the short source-to-mirror distance the
overall reflection efficiency of the multilayer X-ray optic is very sensitive to variations
of the source position which lead to significant changes of the X-ray output behind the
optic
Long term drifts refer to variations of the X-ray flux within minutes up to hours
(see Fig 310) While the sources of these drifts are not completely understood it must
be noted that they cannot be simply averaged out
Therefore suitable measurement schemes with reliable normalization procedures
are required to maximize the accuracy of the measurement and to minimize the
necessary experimental time Two measurementnormalization schemes are described
and discussed in the following sections which allow to handle both short term
fluctuations and long term drifts
3261 Chopping normalization scheme with a shutter
The first normalization scheme I call the chopping method which is a low
repetition rate variant of a well-known normalization scheme used for all-optical pump-
probe experiments at high repetition rate laser systems [193-196]
In this scheme the pump
beam is periodically blocked (chopped) in order to record the probe signal with and
without laser excitation within a short time interval To achieve this a mechanical
shutter is installed in the pump beam path (see Fig 31) and operated at 1 Hz with an
opening time of 05 sec Given the 10 Hz repetition rate of the laser system the
diffraction signal is recorded 5 times with sample excitation followed by 5 times
without sample excitation within one shutter cycle The signals from the PIN diode
used to monitor the pump beam energy allow to mark ldquopumpedrdquo and ldquoumpumpedrdquo
events in the data stream The relative change of the signal due to the laser excitation
3 Improvement of the modular setup for time-resolved X-ray diffraction experiments
51
can be retrieved by normalizing the sum of ldquopumpedrdquo signals to the sum of the
ldquoumpumpedrdquo signals In this way both short term fluctuations (by averaging) and long
term drifts (by comparing pumped and unpumped signals every second) are
properly taken into account However only one half of the total flux contributes to the
transient diffraction signal while the other half is used for normalization
Fig 313 Chopping normalization scheme Standard deviations as
function of integrated acquisition time with different detected photon
numbers per pulse Data points obtained from the experiment and
solid curves are calculated from counting statistics
In the ideal case the achievable accuracy of the experiment is determined by the
counting statistics through the total number of detected photons (given by the laser
repetition rate the number of diffracted photon per pulse and the acquisition time)
Since the laser repetition rate is fixed and the number of diffracted photons per pulse is
determined by the diffraction efficiency of the sample and the X-ray source
performance the acquisition time is the only parameter to control the accuracy of the
experiment In order to define the required acquisition time for a desired accuracy a
series of test measurements were performed with Bi- and Au- samples Each set of the
diffracted signals from these two samples were recorded with the APD for
approximately one hour in the same experimental conditions without sample excitation
The detected APD-signal for each set of data was varied by changing X-ray source
production (adjusting the energy of the driving laser for the X-ray source) and by
choosing different Bragg-reflections The data are analyzed with a MATLAB routine
3 Improvement of the modular setup for time-resolved X-ray diffraction experiments
52
which artificially groups the data in pumped and unpumped events (assuming
chopping at 1 Hz) and averages and normalizes the diffraction signal over bins of
different size (ie the number of pulses used to produce one normalized data point)
Each specific binning produces a set of data with different number of points as the
number of points times the binning size equals the same number determined by the total
acquisition time The standard deviations of each data set are calculated and presented
in Fig 313 as a function of the acquisition time for one point (determined by the
binning size) Since the APD has been calibrated one can calculate the expected
standard deviation of the measured diffraction signal S assuming that it is determined
only by counting statistics as 21 NSS where N is the total number of detected
photons in the respective acquisition time [197 198]
These calculated values are plotted as
solid lines in Fig 313 and they are used to compare to the experimentally determined
values Note that due to the chopping method used for normalization only one half of
the detected photons contributing to the signal have been taken into account in the latter
calculation (the other half has been used as reference for the normalization) As one can
see in Fig 313 the experimental data strictly follow the counting statistics curves with
the respective number of detected photons It indicates that this normalization scheme
allows to reach the fundamental limit set by counting statistics in the experiment
Moreover this figure also provides the required acquisition time for a desired accuracy
for a given diffraction signal (number of detected photons per pulse) For example if
one intends to have an accuracy of 1 with 23 detected photons per pulse an
acquisition time of 150 seconds per data point is sufficient
3262 Direct normalization scheme with the ionization
chamber detector
As I have already pointed out in section 323 that the ICD allows the direct
measurement of the X-ray beam intensity behind the multilayer optic The signals
generated by the ionization chamber are proportional to the incident X-ray flux on the
sample Therefore they can be used as a reference to normalize the diffraction signals
on a pulse-to-pulse basis In order to account for the long term drift of the ICD signal
mentioned in section 323 a ldquofastrdquo scanning technique adapted from all-optical
experiments [199]
has been combined with this normalization scheme Fast scanning
means that the full delay range to be investigated in a particular experiment is
3 Improvement of the modular setup for time-resolved X-ray diffraction experiments
53
repetitively scanned in a relatively short time (during which drift effects are small) and
the data from all scans are summed up and averaged
In order to check the accuracy achievable with this scheme a series of similar test
measurements as above were performed using the ICD for normalization for different
levels of the diffraction signals (given again in number of detected photons per pulse)
This time the data were treated as a set of ldquofastrdquo scanning measurements by artificially
sorting them into a number of delay scans with a certain number of delay points and
pulses per delay before normalization As the result of this analysis Fig 314 shows the
obtained standard deviation as a function of the total measurement time for a single
delay at different levels of the diffraction signal (data points) and compares the
experimental data to calculated curves assuming again counting statistics as the limiting
source of error Again the experimental data agree well with the counting statistics
curves demonstrating that the fast scanning scheme can indeed correct the long term
drifts
Fig 314 Direct normalization scheme with the ldquofastrdquo scanning
technique Standard deviations as a function of integrated acquisition
time with different numbers of detected photons per pulse Point data
obtained from the experiment and solid curves are calculated from
counting statistics
3 Improvement of the modular setup for time-resolved X-ray diffraction experiments
54
3263 Comparison of normalization schemes
Finally the two normalization schemes discussed above will be compared in this
section for similar experimental conditions (ie same X-ray flux after the X-ray optic
same diffraction efficiency of the sample) For this comparison one needs to consider
that the ICD has a transmission of 72 Therefore using the direct normalization
scheme 28 of the incoming X-ray flux serves as reference signal and only 72 are
used for diffraction Since the number of detected photons in the ICD is large (a few
times 104) the error of the measurement with direct normalization is determined only by
the counting statistics of the diffraction signal (see previous section) The standard
deviation in this case isn)720(
1
tr where r is the repetition rate of laser t is the
total integration time in second and n is the number of detected photons per pulse On
the other hand when the chopping scheme is used for normalization the ICD can be
removed from the beam path and the full X-ray flux reaches the sample However as
already mentioned above only one half of the total signal contributes to the transient
diffraction signal while the other half is used for normalization Both transient
diffraction and normalization signals are limited by counting statistics which doubles
the error of the normalized signal Then the standard deviation in this case gives as
ntr )2
(
2 Combining this information one can show that for the same
experimental conditions (with same r t n) the direct normalization scheme (with fast
scanning) should give a factor of 17 better accuracy than the chopping scheme
3 Improvement of the modular setup for time-resolved X-ray diffraction experiments
55
Fig 315 Comparison of the chopping normalization scheme and the
direct normalization scheme (with ldquofastrdquo scanning processing) for
the same amount of incident photons from the X-ray optic (a) with 7
and 5 detected photons (b) with 23 and 15 detected photons and (c)
with 110 and 81 detected photons for the chopping and direct
normalization scheme respectively
Fig 315 compares the measured error (data points) as a function of accumulation
time for the two normalization schemes at different levels of the diffraction signal (the
signal level for direct normalization with the ICD is lower than for the chopping
scheme to account for the transmission losses of the ICD) The red and blue curves
3 Improvement of the modular setup for time-resolved X-ray diffraction experiments
56
show the calculated error based on counting statistics Not only do experimental and
calculated errors agree very well the data quantitatively confirm the advantage of the
direct normalization scheme discussed above
In conclusion the direct normalization scheme represents the most efficient way to
perform time-resolved diffraction measurements with the modular setup Depending on
the level of the diffraction signal an accuracy of better than percent for an individual
data point can be achieved with accumulation times of tens of seconds to a few
minutes
33 Summary
This chapter discussed a modular setup for time-resolved X-ray diffraction
experiments at the University of Duisburg-Essen All components of the previously
existing setup as well as the components that have been added to improve its
performance have been presented and characterized Due to its compact design the
setup is easy to operate and adjustments of components are convenient Applying the
results discussed in chapter 2 the X-ray production in the setup has been improved
using a controlled pre-pulse Using an avalanche photodiode as detector for the
diffraction signal it has been shown that the combination of direct normalization with
an ionization chamber as reference detector and the ldquofastrdquo delay scanning scheme
represents the most efficient way to achieve a high measurement accuracy The setup in
its current status has proved its capabilities through several preliminary experiments
and has been successfully used for the diffraction experiments that will be presented in
the following chapters
4 Observation of the Debye -Waller effect in Au
57
4 Observation of the Debye -Waller
effect in Au
Ultrafast x-ray diffraction is a relatively new technique that provides both high
temporal and atomic scale spatial resolution to directly observe the atomic motions and
changes in the atomic structure of matter upon optical excitation This chapter will
present a laser-pumpX-ray-probe experiment on a thin Au film the first time-resolved
experiment performed with the modular setup described in the previous chapter The
lattice vibrations that result from the electronic energy relaxation following optical
excitation have been directly observed through the DebyendashWaller effect The rise times
of the lattice temperature were measured for different absorbed laser fluences and
compared with the Two-Temperature Model (TTM) [200]
These experimental results are
consistent with previous data obtained by ultrafast X-ray diffraction [61]
as well as
ultrafast electron diffraction [201]
and prove the capability of the new built modular
setup
This chapter is organized as follows The first section is a brief description of the
Au sample used in these experiments In the second section the Debye ndashWaller effect
is discussed In the third section the time-resolved experiments are described and
experimental results are presented In the fourth section a comparison between the
experimental results and calculations based on the TTM model are discussed In the
final section a summary will be drawn
41 Au sample
Au a noble metal has been extensively studied with respect to its transient
properties and transient structure after femtosecond optical excitation [61 186 201-208]
In
4 Observation of the Debye -Waller effect in Au
58
particular the transient Debye ndash Waller effect has been recently used in ultrafast
electron diffraction experiments to study fast lattice heating after femtoseond laser-
excitation of thin polycrystalline Au films [201 206]
In the experiments described in this chapter an epitaxial Au film was used The
150 nm thick (111)-oriented Au samples had been grown on (001)-oriented high
quality Mica using a magnetron sputtering technique and were provided by the
company Phasis [209]
Relevant physical parameters of this sample are provided in
Appendix C3
To maximize the pump-induced changes of the diffraction signal due to the
Debye-Waller effect measurements were performed using the symmetric (333)-
reflection (see also next section) The corresponding Bragg angle (measured relative
to the surface) is 789deg for Cu Kα radiation Given the angle of 10deg between the
optical pump beam and the X-ray probe the angle of incidence (measured to the
surface normal) of the pump is 20deg The corresponding reflectivity of the sample at
800 nm is 97 The optical penetration depth is about 13 nm which is much smaller
than the film thickness [210]
Nevertheless fast ballistic electronic transport distributes
the deposited energy over the whole film thickness within a few hundred
femtoseconds [211-213]
Therefore the sample can be considered as being
homogeneously excited on the time scale of a picosecond
42 Debye ndashWaller effect
Debye [214]
and Waller [215]
found that by heating the lattice the intensity of
Bragg-reflections decreases whereas their angular profiles (rocking curves) remain
unchanged This decrease is described by the Debye-Waller factor DW(T)
)3
1exp()( 22
0
hklT Gr
I
ITDW
(41)
where IT is the integrated intensity of a particular Bragg-reflection with Miller
indices (hkl) (determined by the reciprocal lattice vector Ghkl) at temperature T I0 is
4 Observation of the Debye -Waller effect in Au
59
the integrated intensity in the case of the perfectly ordered and lsquofrozen latticersquo and
2r
is the mean square atomic displacement [216]
By calculating 2r
within the Debye theory for the specific heat [217]
and
taking into account Braggs law )sin(2 Bhkld the Debye-Waller factor can be
represented as [218]
22
2
2
16exp)(
hkl
D
DB dTmk
ThTDW (42)
where h is Plankrsquos constant T is the temperature of material m is the mass of
the atom Bk is the Boltzmanrsquos constant D is the Debye temperature of the material
T
D is the Debye function and hkld is the corresponding lattice constant Eq 42
indicates that the Debye-Waller effect becomes stronger with a smallerhkld ie larger
changes in the diffracted signal are expected for higher diffraction orders (hkl)
Fig 41 Calculated Debye-Waller factor for Au
According to Eq 42 the Debye-Waller factor for the (111) (222) and (333)
Bragg diffraction of Au are calculated as a function of temperature and presented in
Fig 41 (normalized to the corresponding value at 295 K) Since the changes of the
4 Observation of the Debye -Waller effect in Au
60
integrated signal are more pronounced for higher orders the (333)-reflection has been
used in following experiments as mentioned above
43 Time-resolved X-ray diffraction experiments on Au
431 Bragg diffraction of Au
Before performing the time-resolved experiments for studying the Debye ndash
Waller effect in Au several preparation experiments were carried out using an area
detector (ldquoGemstarrdquo camera see Appendix B) to pre-characterize the structural
response of the sample upon ultrafast optical excitation
Fig42 shows as one result the variation of the total diffraction signal with the
angle of incidence of the X-ray beam for the Au (333)-reflection In principle such
angular dependencies represent the convolution of three contributions namely (a) the
sample rocking curve (b) the angular intensity distribution of the focused X-ray beam
and (c) the source spectrum As a consequence the angular dependence shown in Fig
42 exhibits a two-peak structure which can be attributed to the Kα1- and Kα2-lines of
Cu which are both reflected by the mirror Each individual peak exhibits a FWHM of
about 07deg This is significantly more than the expected width of about 026deg due to
the combined effects of the spectral width (FWHM) of the two emission lines (approx
013deg) [219]
the angular FWHM of the focused X-rays (017deg FWHM) [Appendix A]
and
the expected FWHM of the rocking curve of a 150 nm film (014deg) [220]
The
broadened diffraction curve is attributed to the mosaic structure of the Au-film [221]
)
The following experiments are performed at a sample angle of 7895deg corresponding
to the maximum detected diffraction signal
4 Observation of the Debye -Waller effect in Au
61
Fig 42 The diffraction signal as a function of sample angle for the
Au (333)-reflection without excitation
However upon excitation of the sample not only the intensity of a particular
Bragg-reflection can change (eg due to the Debye-Waller effect) but also its angular
position (and shape) due to laser induced strain With respect to the latter one it has to
be stressed that the angular FWHM of the incident X-ray beam covers only a part of
the total width of the diffraction curve Therefore for a fixed sample angle changes
of the diffraction signal might be caused by both real intensity changes as well as a
peak shift due to the fact that strain if sufficiently large can shift the diffraction
curve out of the narrow angular range of the incident X-ray beam In order to
(preliminary) clarify the effect of strain time-resolved measurements have been
performed for different fluences both at fixed sample angle as a function of pump-
probe time-delay and as a function of sample angle for a fixed time-delay
Fig 43 shows the shift of the diffraction peak (center of gravity of the
distribution of diffracted X-rays measured on the area detector mentioned above) for a
(low) absorbed pump fluence of 15 mJcm2 (black open squares the red dots show
reference data measured in the course of the experiment without laser pumping) As it
is evident the Bragg-peak starts to shift shortly after excitation towards smaller
diffraction angles indicating lattice expansion The maximum shiftexpansion is
4 Observation of the Debye -Waller effect in Au
62
reached after about 45 ps Subsequently the Bragg-peak shifts back to larger
diffraction angles indicating recompression of the material Before discussing this
behavior it should be noted that this measurement could be performed with a fixed
sample angle using an area detector because of the low absorbed fluence with which
the shift of the Bragg-peak is smaller than the angular range of the incident X-ray
beam
Fig 43 Centers of gravity of the Au (333) rocking curves measured
with the Gemstar camera Red circles correspond to data obtained on
the non-excited sample the black squares represent data from the
excited sample
The observed behavior in particular the oscillatory time-dependence of the
Bragg-peak shift is in line with the generation and propagation of acoustic waves
launched by an almost instantaneous increase of pressure after optical
excitation [222 223]
In this interpretation the observed period of 45 ps should
correspond to the time ac that a longitudinal acoustic wave with speed cs needs to
travel through a film with thickness d sac cd With the known speed of sound of
cs = 339 kms [224]
in Au along the (111)-direction and using the nominal film
thickness of (150 5) nm I obtain ac = (44 15) ps which is in agreement with the
experimentally found value Very similar results have been recently reported by
4 Observation of the Debye -Waller effect in Au
63
Nicoul et al on a similar Au-sample of smaller thickness (d = 90 nm) [61]
The close
correspondence in the time-evolution of the Bragg-peak shift in particular its
ldquotriangularrdquo shape give clear indication that also the 150 nm film is homogeneously
(as expected ndash see above) and almost instantaneously pressurized over its whole
thickness
Fig 44 The diffraction signal as a function of sample angle for the
Au (333)-reflection at a delay of 45 ps (maximum shift) measured
with APD The points are measured data and the solid curves
represent Gaussian fits
Fig 44 shows the diffraction signal measured with the APD at a delay of 45 ps
(maximum shift) as a function of sample angle for different pump fluences the solid
curves represent Gaussian fits to the measured data The APD has a sufficient large
detecting area allowing to perform this measurement without moving its position As
expected the shift of the Bragg peak increases with pump fluence The peak positions
were obtained from the fitting function and are shown as function of absorbed fluence
The ldquotriangularrdquo shape of the time-trace indicates that the changes of the average interspacing
distance inside the sample can be assumed to be linear with time It is expected for the time-
independent pressurestress (the strain waves exhibit a rectangular shape) which results from
instantaneously and homogeneously heating of a sample Detailed interpretations can be found in Ref
[140 186]
4 Observation of the Debye -Waller effect in Au
64
in Fig 45 As it can be seen in Fig 45 the maximum shift of the Bragg-peak caused
by laser induced strain scales linear with the absorbed fluence Such behavior was
also observed in other X-ray diffraction experiments [140 186 225]
Fig 45 Angular shift of Bragg peak as function of absorbed fluence
The green dashed lines are linear fits for the data points
In summary the experiments above show that the strain caused by laser-
excitation result in a linear shift of the Bragg-peak both with time (for the first 45 ps)
and fluence
432 Observation of Debye ndashWaller effect on Au
In order to obtain the temporal evolution of the Debye ndashWaller effect without
being affected by the laser induced angular shifts of the Bragg peak an angular
compensation procedure is applied during the measurements This method is based on
the results shown in Figs 43 and 45 namely the linear increase of the Bragg-peak
shift with time and fluence This allows to properly adjust the sample angle both as a
function of pump-probe time delay as well as fluence to stay always at the angular
position of the maximum of the diffraction signal
4 Observation of the Debye -Waller effect in Au
65
Fig 46 Time-resolved measurements with and without the angular
compensation procedure The black curve is an exponential fit for
the data with compensation the red curve is a guide to eye for the
data without compensation
To illustrate the effect of this compensation Fig 46 shows the results of time-
resolved measurements with and without angular compensation at a fluence of
35 mJcm2 (absorbed) Without the compensation the detected diffraction signal
represents the combined effects of the strain-induced angular shift of the Bragg peak
and the DebyendashWaller effect As it can be seen in this case the detected diffraction
signal drops and rebounds at 45 ps essentially resembling the temporal behavior of
the angular shift of the Bragg peak after excitation (see Fig 43) However with the
compensation method the Debye-Waller effect can be isolated In this case the
measured (normalized) diffraction signal shows a much faster exponential drop with a
time constant of about 43 ps
Additional measurements were performed at lower pump fluences applying this
angular compensation The results are presented in Fig 47 In all cases the
experimental data were fitted with an exponential function and the fitting curves are
depicted as solid lines in the figure Most obvious and not unexpected the decrease of
the overall change of the diffraction signal increases with fluence due to the larger
4 Observation of the Debye -Waller effect in Au
66
temperature increase achieved at higher fluences The temporal evolution of the
diffraction intensities directly maps out the excitation of lattice vibrations (increase of
2r
) during heating After approximately 20 ps all diffraction signals reach their
asymptotic values which can be considered as the sign of reaching the new thermal
equilibrium state in the lattice system
Applying eq 42 the measured asymptotic drop of the diffraction signal as
obtained from the exponential fitting can be converted into a temperature increase
The results are plotted as blue squares in Fig 48 (a) The experimentally determined
temperature increases are compared to the temperature increase estimated from the
deposited laser energy and the specific heat of the material (red circles) Both data
sets agree within their error bars thus confirming that lattice heating and the Debye-
Waller effect is responsible for the observed decrease in diffraction intensity
The time constant of the exponential fit represents how fast the lattice is heated
and the new thermal equilibrium state is reached The time constant is plotted in Fig
48(b) as a function of absorbed laser fluence (bottom axis) and lattice temperature
(top axis) For comparison two data points from previously published experiments
[61 201] have been added Since the absolute fluence values are often difficult to
compare in independent experiments the absorbed fluence value is not used for this
comparison but the observed temperature increase (top axis) My measurements agree
within the error bars with the previously published data
4 Observation of the Debye -Waller effect in Au
67
Fig 47 Diffraction signal as a function of delay time for different
absorbed fluences (obtained with the angular compensation
procedure) The solid curves are exponential fits of the measured
data
(a) (b)
Fig 48 (a) Asymptotic temperature after laser-excitation as a
function of absorbed fluence Blue squares Values determined by
using eq 42 and the experimentally observed asymptotic drop of the
diffraction signal (top axis) Red circles Estimated temperatures
from the deposited optical energy (b) Decay time constant as a
function of absorbed fluence (bottom axis) and lattice temperature
(top axis) The black square points are obtained from the exponential
fits of the measured data in Fig 47 The red circle and the blue
diamond are taken from Ref [201] and [61] respectively
4 Observation of the Debye -Waller effect in Au
68
The data in Fig 48(b) seem to show a tendency that the decay constant
decreases with increasing fluence However due to the large errors of the derived
decay time constants at low fluences this effect will not be discussed further The only
remark to be made here is that the frequently used TTM (see below) does predict the
opposite
44 Comparison with the Two ndash Temperature Model (TTM)
and discussion
Upon the laser excitation the laser energy is first absorbed by free electrons and
then exchanges between electrons and the lattice through electron-phonon collisions
The evolutions of the electron and lattice temperature are determined by the electron-
phonon coupling constant [226]
In order to understand this process of above
experimental results in this section I compare the experimental results with the
theoretical prediction of the two-temperature model (TTM) [200]
which is a simple and
frequently used model to describe the electron-phonon energy relaxation
The TTM is based on the assumption that the electronic and lattice system can be
described by two different time-dependent temperatures Te and Tl The rate of energy
exchange between these two subsystems depends linearly on the temperature
difference and is given by
)( le
e
e
l
l TTt
TC
t
TC
(43)
where Ce and Cl are the specific heats of electrons and phonons (in principle
temperature dependent) respectively The energy exchange rate parameter α is related
to the electron-phonon coupling constant Solving the differential equation 43
numerically by using the coupling constants determined from all-optical
measurements [227]
not only the electron dynamics but also the evolution of the
lattice temperature can be predicted
In order to solve this differential equation the initial temperature of the
electronic system is calculated by using the experimentally determined asymptotic
4 Observation of the Debye -Waller effect in Au
69
lattice temperature Tasy According to the law of energy conservation and assuming no
energy losses the total initial energy in electronic system soon after laser excitation
and in lattice system at initial room temperature is equal to the total energy of
electronic and lattice system at asymptotic lattice temperature One obtains
asylasyeRleee TCTCTCTTC ))(()( 00 (44)
and
eeee TATC )( (45)
where Ae and TR are coefficient of electronic heat capacity and the room
temperature respectively Then the corresponding initial electron temperature 0eT can
be expressed as
))(2
( 2
0 asyRasy
e
le TTT
A
CT (46)
Using the deduced parameters and the material constants summarized in table 41
equation 43 was numerically solved and the results of temporal evolution of lattice
temperature are shown in Fig 49 (red dashed curves) together with the measured data
for the further discussions
Ae[Jm3K
2] Cl [MJm
3K] α [10
16Wm
3K]
676 245 21
TR [K] Tasy[K] Te0[K]
295
335 17363
365 22831
390 26544
Table 41 The material constants of Au and parameters used in the
TTM calculations [228]
4 Observation of the Debye -Waller effect in Au
70
Fig 49 Temporal evolution of the detected X-ray signal (data points
left axis) with exponential fits (black solid curves left axis) and the
results of the numerical solutions of the TTM for the
maximumasymptotic lattice temperature at (a) 335K (b) 365K and
(c) 390K (red dashed curves right axis)
4 Observation of the Debye -Waller effect in Au
71
Fig 49 shows again the temporal evolution of the relative changes of the X-ray
diffraction signal (data points note the flipped signal axis to the left) together with the
exponential fitting (black solid curve) The right axis displays the corresponding
lattice temperature obtained from the DWF The experimental data are compared to
calculated time dependencies (red dashed curves) of the lattice temperature obtained
from the TTM-calculations for maximumasymptotic lattice temperatures Tasy of (a)
335K (b) 365K and (c) 390K It is evident from this comparison that the TTM with
ldquostandardrdquo parameters (table 41) provides a good description of the experimental data
only for the highest fluence For the lower fluences the TTM predicts a faster energy
relaxationlattice heating than observed in the experiment Although B Rethfeld [229]
has predicted such a delayed energy exchange which deviates from the TTM for weak
excitation the effect will not be discussed further here because of the large error of
the experimentally determined time constant for the lower fluences At least for the
highest fluence the TTM provides a reasonable description of the experimental data
which are moreover in good agreement with previously published results [61 201]
45 Summary and conclusion
As the first time-revolved experiment performed with the improved modular
setup the observation of the Debye -Waller effect in Au and its good agreement with
both previous experimental results [61 201]
as well as the TTM at high fluences
demonstrates that it is well suited to perform time-resolved diffraction experiments
with good accuracy However this experiment also reveals a major limitation of the
setup Due to the narrow convergence angle of the incident X-ray beam an angular
compensation technique as discussed above needs to be applied to eliminate strain
effects As a consequence a pre-characterization of the response of a particular sample
is necessary This made the experiment quite time consuming and might have
introduced additional error sources The modular setup is therefore most suitable for
measurements where the position andor shape of the Bragg-peak does not change
4 Observation of the Debye -Waller effect in Au
72
upon laser-excitation (at least for a certain range of fluences andor pump-probe time
delays) As will be discussed in chapter 5 this is the case for laser-excited Bi where
the Bragg-peak does not start to shift for almost 5 ps after laser excitation
5 Extreme phonon softening in laser-excited Bi
73
5 Extreme phonon softening in laser-
excited Bi
Bi is a group-V (Nitrogen group) element which contains 5 electrons in its outer
shell It is stabilized at equilibrium into the A7 structure a rhombohedral structure
with two atoms per unit cell The pairing of these two atoms is attributed to the so-
called PeierlsndashJones mechanism [230]
This mechanism states that in order to arrange
the lattice system in the minimum energy configuration every second atom along the
body diagonal of the Bi unit cell ((111) direction) moves closer to one neighbor and
further away from the other leading to the pairing of atoms along the body diagonal
and doubling of the lattice constant As a consequence of this distortion a small band
gap is introduced at the Fermi level lowering the total energy of the occupied
electronic states and hence lowering the total energy of the system This opened band
gap is responsible for Bi being a semimetal A more detail description of the structure
of Bi will be presented in Section 51
Due to the unique properties of the broken symmetry ground state of the crystal
the equilibrium structure of Bi is sensitive to external perturbations ie changes of
pressure and temperature or electronic excitation [231- 234]
Among these perturbations
the ultrafast electronic excitation with ultrashort laser pulses is particularly unique
since the laser induced non-equilibrium states which depend on the excitation level
can be precisely controlled by adjusting the pump laser fluence and thus it can
provide unique non-equilibrium states of matter for the investigation of the transient
dynamics Following ultrafast laser excitation the valence electrons are promoted to
the conduction band The interatomic potential which defines the position of the
atoms in the unit cell is altered by the optically induced redistribution of electrons and
5 Extreme phonon softening in laser-excited Bi
74
the potential minima shift If this alteration occurs fast in comparison with the time
scale of atomic motion it triggers a coherent atomic motion around the new
equilibrium position along the body diagonal resulting in the modulation of the
equilibrium distance of the two paired atoms towards the phase of the higher
symmetry This coherent atomic motion represents the A1g optical phonon mode of
the crystal The generation mechanism has been named displacive excitation of
coherent phonons (DECP) [231 232]
which can be also considered as a special case of
impulsive stimulated Raman scattering for absorbing materials [235 236]
Within the framework of the DECP mechanism it has been predicted by
theory [237]
that the broken symmetry ground state of Bi (the Peierls distortion) can be
reversed with high enough density excitation This structural transformation is
accompanied by the change of the electronic properties The opened band gap at
Fermi level should close and Bi transforms from a semi-metal to a metal on the sub-
picosecond range The study of this phase transition process can provide important
information not only for the understanding of non-equilibrium structural dynamics in
Peierls distorted systems but also for designing future ultrafast electronic devices So
far it is not clear whether this phase transition can be achieved without subsequent
disorderingmelting of the Bi sample for an initial room temperature lattice Moreover
there is no experimental evidence yet that the structural phase transition to the high
symmetry state can be realized This experimental challenge has been addressed in
my PhD work
In this chapter the evolutions of laser-excited coherent optical phonons in Bi
have been investigated by directly monitoring the atomic motion using time-resolved
X-ray diffraction The observed extreme softening of the A1g phonon mode indicates
transient disappearance of the Peierls distortion This chapter is organized as follows
Section 51 provides a brief introduction of Bi Section 52 presents the experiment
results and discussion Section 53 summaries the main results of this chapter
5 Extreme phonon softening in laser-excited Bi
75
51 Research background
511 Structure of Bi and the phonons
The crystalline form of Bi is the di-atomic basis rhombohedral A7 structure [238]
which is derived from a simple cubic structure in two steps First a simple cubic
lattice is stretched along one of the body diagonals creating a smaller shear angle than
the cubic value of 60deg Then a Peierls instability [230]
causes the atoms to be displaced
along the same diagonal in opposite directions leading to a reduction of the structural
symmetry and a doubling of the lattice constant Fig 51 illustrates the primitive unit
cell of Bi The first atom is placed at the node of the primitive unit cell and the second
atom lies along the body diagonal with a slight displacement from the center of the
unit cell The length of the body diagonal is defined as d then the corresponding
distance for the second atom is xbulld At room temperature the lattice parameters are
a = b = c = 455 Aring body diagonal d = 1186 Aring and x = 0468 ie the distance of the
pair of atoms is xbulld = 55505 Aring
Fig 51 Primitive unit cell of Bi and the motion directions of the A1g
and Eg phonon mode
5 Extreme phonon softening in laser-excited Bi
76
Fig 52 Potential energy surface in Bi as a function of percentage of
electrons excited into the conduction band n and normalized atomic
distance x Picture reproduced from Ref [237]
Upon the external perturbations the motion of the two atoms against each other
along the body diagonal corresponds to the A1g-optical phonon mode The motion of
the atoms in the plane perpendicular to the body diagonal corresponds to the two
(degenerate) Eg-optical phonon modes (Fig 51) The work presented in this chapter
has focused on studying the laser excited A1g-optical phonon that can be characterized
by the changes of the normalized atomic distance x along the body diagonal Murray
et al have used density functional theory (DFT) to compute the potential energy
surface (PES) along x for different levels of electronic excitation [237]
Fig 52 (taken
from Ref [237]) displays the potential energy as a function of the percentage of
carriers excited into the conduction band and the normalized atomic distance x To
interpret the experimental results this PES will be frequently referred to in the
remaining sections of this chapter
512 Previous works
Bi has been studied by methods of ultrafast optics for over two decades The
coherent optical phonons launched in Bi after femtosecond laser excitation were first
5 Extreme phonon softening in laser-excited Bi
77
observed by Cheng et al [239]
in time-resolved reflectivity measurement By
monitoring the oscillations in the optical reflectivity the A1g phonon motion was
detected and its frequency compared to the results obtained by spontaneous Raman
scattering and inelastic neutron scattering [240]
Owing to the high temporal resolution
and high accuracy optical techniques are powerful to retrieve quantitative
information about the frequency of the excited phonon and its decay dynamics The
subsequent experiments explored coherent phonon dynamics by studying the phonon
frequency [231 232]
the electron-phonon energy coupling [241 242]
the temperature
dependence [236 243 244]
and the excitation level dependence [237 244-249]
The Eg mode
was also observed with optical techniques [236 244 249 250]
However optical techniques measure the modulation of the dielectric constant
Therefore they can provide only indirect information about the magnitude of the
atomic motion in the excited sample Providing direct information about the atomic
motion in laser-excited Bi ultrafast time-resolved X-ray diffraction [7-9 17 18 39-41 67-69
73 251 252] and electron diffraction
[12 13 81 253 254] have been recently applied Two
time-resolved X-ray diffraction experiments which are closely connected to the study
presented in this thesis will be described in detail in the following part
When a thin film sample with a thickness much smaller than the extinction
length [255 256]
is investigated with X-ray diffraction the secondary scattering of the
Bragg reflected beam can be neglected This treatment is known as the kinematic
approximation Thus the intensity of a particular Bragg reflection (hkl) of Bi is
determined by the squared modulus of the geometrical structure factor
22cos2 xlkhfFI Bihklhkl (51)
where h k and l are the Miller indices f Bi is the atomic scattering factor for Bi x
is normalized atomic distance which becomes time-dependent after laser excitation
If the Debye-Waller factor is assumed to be constant a direct indication of the atomic
displacement along the trigonal direction inside the unit cell after laser excitation can
be presented by the changes in the normalized diffraction signal for the (111) and
(222) reflections as
5 Extreme phonon softening in laser-excited Bi
78
)0(3cos
)(3cos
)0(
)(2
2
xn
txn
I
tI
nnn
nnn
n=1 for (111) n=2 for (222) reflection (52)
Figure 53 shows the normalized X-ray diffraction efficiency of the (111) and
(222) Bragg-peaks of Bi as a function of x The diffraction intensity is normalized to
the value of x = 0468 (actual equilibrium value in the unperturbed crystals) and
plotted as a function of x In the high-symmetry non-Peierls distorted state where
x = 05 (2nd
atom in the centre) diffraction from (111) planes is forbidden whereas
(222) diffraction becomes the minimal diffraction order and reaches a maximum
value Impulsive electronic excitation suddenly displaces the minimum of the PES
closer to x = 05 and the atoms are set in motion towards the new equilibrium position
As a consequence of this motion the changes in the X-ray diffraction signal are
expected to evolve in opposite directions An increase for the (222)-reflection and a
decrease for the (111)-reflection Following these initial changes the oscillatory
atomic motion around the new equilibrium position should give rise to oscillations of
both the (222)- and the (111)- diffraction signal with a frequency corresponding to
the A1g optical phonon mode
Fig 53 Normalized intensity of Bragg peak (111) and (222) versus
atomic displacement expressed in the relative position along the
body diagonal
5 Extreme phonon softening in laser-excited Bi
79
The first time resolved experiment where X-ray diffraction had been applied to
directly follow the atomic motion associated with the laser-excited coherent phonon
in Bi was performed by Sokolowski-Tinten et al [68 251]
In this work the evolutions
of two Bragg-reflections of a laser-excited 50 nm Bi thin film were measured (Fig
54) The frequency of the A1g mode was found to be only 212 THz substantially
smaller than the frequency of 292 THz measured in non-excited Bi (ie by Raman-
spectroscopy) The large displacements as well as the strong softening indicated
substantial changes of the interatomic potential which had not been observed before in
all-optical experiments
(a) (b)
Fig 54 X-ray diffraction efficiency of the (a) (111) and (b) (222)
reflections as a function of time delay between the optical pump
pulse and X-ray probe pulse Coherent phonon oscillations with
oscillation frequencies of 212 THz were observed Pictures
reproduced from Ref [68]
However due to the limited signal-to-noise ratio that was available with the laser
plasma-based source at that time this successful work was only achieved at a
relatively high excitation fluence A systematic investigation of the frequency and
amplitude dependence of the A1g phonon towards weaker excitation was required to
fill the gap to the all-optical work carried out with lower excitation fluences
Due to a significantly higher X-ray flux the Sub-Picosecond Pulse Source
(SPPS) [257]
at Stanford appeared to be the ideal X-ray source to perform this
experiment The softening of the A1g phonon mode as a function of excitation density
5 Extreme phonon softening in laser-excited Bi
80
and the detailed mapping of the carrier density-dependent PES were quantitatively
characterized for the first time by the work performed at the SPPS [69 186]
In this
work the optical phonon modes in Bi had been investigated at different absorbed
laser fluences up to 23 mJcm2 Fig 55 (a) shows four time traces for different
excitation fluences The optical phonon frequency as a function of the normalized
equilibrium atomic distance x is displayed in the inset of Fig 55 (a) A softening of
the A1g phonon frequency was found (from 291 THz down to 23 THz) with
increasing x These data provide direct information about the laser-induced changes of
the PES namely the position of potential minimum as well as its curvature In Fig
55 (b) a comparison between these measured data and theoretical calculations based
on DFT [237]
is presented A good agreement between the experiment and the DFT-
results is found
(a) (b)
Fig 55 (a) Bi (111) X-ray diffraction efficiency as a function of
time delay for different absorbed fluences 07 (green) 12 (orange)
17 (blue) and 23 mJcm2 (gray) The observed A1g optical phonon
frequencies are displayed in the inset as a function of x the new
normalized (quasi-)equilibrium atomic distance along the body
diagonal of the unit cell The dotted curve represents A1g
frequencies predicted from DFT calculations [237]
(b) Normalized
quasi-equilibrium atomic distance x as a function of carrier density n
with the overlaid excited state PES (false color) The white dotted
line represents the equilibrium atomic distance obtained with DFT
The red points are the measured data at the SPPS The Bi unit cell is
depicted in the top right The ratio of yellow bar to red bar
determines x Pictures reproduced from Ref [69]
5 Extreme phonon softening in laser-excited Bi
81
These results bridged the gap between the existing work on low and high
fluence However another interesting question has been raised here Could the system
when excited with higher fluence be really driven back to the high symmetry state
(x = 05) and could the Peierls distortion be reversed To answer this question I have
extended the studies of coherent optical phonons in Bi to a higher excitation fluence
regime that has not been studied previously By using the modular setup [chapter 3]
time-resolved X-ray diffraction experiments were performed A complete softening of
the excited A1g mode is observed in the high level excitation data This represents
conclusive experimental evidence that the Peierls distortion which defines the
equilibrium structure of Bi is transiently reversed
52 Experiments and discussion
521 Method
The measurements were performed using the modular setup which was already
introduced in chapter 3 (Fig 31) X-ray pulses at a photon energy of 805 keV
(wavelength 154Aring) were used The (111)- oriented crystalline Bi sample (50 nm film
on Silicon same type of sample which was used in the previous experiments [68 69]
More details on relevant parameters of the Bi sample used in this work are provided
in Appendix C) is placed under the appropriate Bragg-angle 1124deg for (111)-
reflection and 2294deg for (222)-reflection To launch the A1g optical phonon mode
through displacive excitation the sample was optically excited by near-infrared (800
nm) femtosecond laser pulses with (absorbed) fluences from 1 mJcm2 to 42 mJcm
2
It should be noted that for absorbed fluences above 25 mJcm2 the sample suffered
damage after excitation with many pulses The damage could be detected by
monitoring (with a CCD-camera) the scattered fraction of the incident pump light
which increased significantly upon damage From the fact that the increase of pump
light scattering occurred long before permanent changes in the X-ray diffraction
5 Extreme phonon softening in laser-excited Bi
82
signals could be observed it can be concluded that multi-pulse damage occurs initially
only at the very surface of the sample Still when this increase in scattering was
observed the sample was shifted to a fresh spot The atomic motion was probed by
measuring the diffraction of the X-ray probe pulses after a controlled time delay with
respect to the pump laser pulses In order to maximize the accuracy of the experiment
and to observe small changes in the diffraction signals the direct normalization
scheme with ldquofastrdquo scanning (see chapter 3) had been applied in the measurements
The diffraction signals of the (111)- and (222)-reflection are recorded with the silicon
avalanche photodiode and the signal from the ionization chamber detector is used for
normalization The typical time required to measure a complete time-dependence
(approx 180 delay points) of one diffraction order for one fluence with an accuracy of
approximately 1 was around 6 hours Comparing to the 12 hours per measurement
using the Ti Kα source reported by Sokolowski-Tinten et al [68]
(accuracy approx
2) this represents a significant improvement
522 Preliminary measurements
Before performing the time-resolved experiments for studying laser-excited
coherent optical phonons in Bi two preliminary experiments were carried out to
characterize the structural response of the sample upon ultrafast optical excitation
Fig 56 shows the diffraction signal of the Bi (111)-reflection and the (substrate)
Si (111)-reflection as a function of sample angle The lattice mismatch provides
sufficient angular separation of the diffraction signal from the Bi film and the
diffraction signal from the Si substrate As expected the diffraction signal of the bulk
Si-substrate is significantly stronger (approx 20times) than the diffraction from the thin
Bi-film Another important information obtained from this measurement is that the
angular width of the Bi diffraction curve (03deg FWHM) is larger than the angular
width of the incident X-ray beam (017deg FWHM) As it had been discussed in the
previous chapters in this case the experiments will be performed at a fixed sample
angle corresponding to the maximum detected diffraction signal
5 Extreme phonon softening in laser-excited Bi
83
Fig 56 The diffraction signal of Bi (111)-reflection and (substrate)
Si (111)-reflection as a function of sample angle Both signals are
normalized to the maximal value of Bi (111) signal
A preliminary time revolved measurement was performed on the (111)-reflection
with an area detector (ldquoGemstarrdquo camera) This measurement allowed to
approximately determine time delay zero and provided some information on the
temporal evolution of signal intensity and in particular on the changes of the angular
position of the diffraction peak upon laser excitation The incident pump fluence in
this measurement was about 5 mJcm2 The measured results are displayed in Fig 57
Despite the low accuracy of this measurement three different stages in the temporal
evolution of the diffraction intensity can be recognized Immediately after the photo-
excitation a rapid decrease in the diffraction efficiency is observed followed by a
partial recovery of the diffraction signal during the next 5 ps After that the diffraction
intensity starts to decrease again on a 10 ps time-scale On the other hand the angular
position of the (111)-diffraction peak starts to change only after 5 - 7 ps The shift to
smaller diffraction angles indicates lattice expansion
5 Extreme phonon softening in laser-excited Bi
84
In consequence the initial decrease of the diffraction signal and the 5 ps
recovery are attributed to changes of the structure factor and thus changes of the
normalized atomic distance x upon electronic excitation and subsequent relaxation
However the expected signal oscillations could not be resolved due to the limited
accuracy and the coarse delay spacing Moreover it is important to note that
measurements on Bi can be performed within a time window of about 5 ps without a
correction of the angle of incidence of the X-ray beam as it was necessary for the case
of Au (compare discussion in chapter 4) The following detailed investigation of the
coherent optical phonon concentrates therefore on this time window of about 5 ps
after excitation (marked with the blue dashed-dotted line in Fig 57) where the
changes of the signal intensity caused by the shift of the Bragg peak are negligible
Fig 57 Time revolved measurement with the Gemstar camera The
left axis shows the position of the center of gravity of the Bi (111)
rocking curve The right axis showed the integrated intensity of the
diffracted signal
5 Extreme phonon softening in laser-excited Bi
85
523 Results of time resolved measurements and discussion
Before presenting the experimental results and discussion it should be noted that
the effective energy deposition depth of 800nm fs laser pulses is approximately
26 nm [73]
This means that initially only half of the sample thickness (50 nm) is
excited The spatially inhomogeneous excitation of the sample needs to be taken into
account in the following discussion
Fig 58 shows representative examples of time-traces of the normalized
diffraction efficiency of the (111)- (a) and the (222)- reflection (b) for different pump
laser fluences Since the absolute time-zero in these experiments is only known to an
accuracy of about +- 150 fs the zero-delay point is arbitrarily set for each curve at
the half maximum of the initial transient change A typical error bar of the measured
data is given at the end of each curve While the (111)-reflection exhibits a fluence
dependent initial drop followed by oscillations and a slow recovery the (222)-
reflection initially increases in diffraction efficiency followed also by oscillations and
a slow recovery This behavior is similar to the results reported in the previous
studies [68 69]
and can be readily interpreted by considering the changes of the
geometrical structure factor (see Fig 53) within the DECP-picture The initial
transient change is ascribed to photon-induced alteration of the minimum position of
the PES that leads to a atomic motion towards a symmetric arrangement (x = 05) The
following oscillations correspond to the A1g coherent optical phonon mode of the
lattice and the recovery of the diffraction efficiency is attributed to restoration of the
PES to its equilibrium state
5 Extreme phonon softening in laser-excited Bi
86
Fig 58 X-ray diffraction efficiency (a) (111)-reflection and (b)
(222)-reflection of a 50 nm (111)-oriented Bi-film as a function of
pump-probe time delay for different excitation fluences The zero-
delay point is set at the half maximum of the initial transient change
A typical error bar of the measured data is given at the end of each
curve
It should be noted that Fig 53 only takes into account changes of x Upon laser-
excitation other effects become important as well For example the Debye-Waller
5 Extreme phonon softening in laser-excited Bi
87
effect caused by an increase of the lattice temperature (incoherent phonons) also
affects the X-ray diffraction efficiency (see Chapter 4) Although the Debye-Waller
effect can be neglected for the first few hundred femtoseconds after laser excitation
since the energy exchange between the initially excited hot electrons and the lattice
system occurs typically on a time-scale of a few ps it should be considered in the
later recovery processes For the (111)-reflection the change in the Debye-Waller
factor is calculated to be a few percent from room temperature up to the melting
temperature [186]
Relative to the signal changes associated with the induced changes
in x the drop in the signal induced by the Debye-Waller effect is negligible On the
other hand for the (222)-reflection the change in the Debye-Waller factor is 4 times
larger for the same temperature increase and comparable to the effects caused by
changes in x The decrease of the mean value of the normalized (222) diffraction
signal to values below that of the unexcited sample is tentatively attributed to the
combination of the restoration of the PES and the DebyendashWaller effect
In the following section the magnitude of the initial change of the diffraction
efficiency and the frequency of the following oscillatory part are retrieved from the
measured time traces and will be discussed in detail
The initial maximum diffraction efficiency changes ΔI111 and ΔI222 as a function
of laser pump fluence (red (111)-refl black (222)-refl) are shown in Fig 59 Data
obtained at the SPPS (green) [69]
are also plotted in the figure for comparison and they
are consistent with the new results The linear fits of the data points reveal that the
initial changes of both reflections are linearly dependent on absorbed fluence From
the comparison of the ratio of ΔI111ΔI222 = - (28 plusmn 02) obtained from the fitting
slopes and the value of -235 as estimated from the change of the geometrical
structure factor upon the increase of the Bi-Bi distance x a rough agreement of both
values is found and this clearly demonstrates that the coherent motion of atoms is the
leading contribution which influences the initial changes of the diffraction efficiencies
The initial atomic motion is proved to be mainly coherent
5 Extreme phonon softening in laser-excited Bi
88
Fig 59 Initial maximum changes of the diffraction efficiencies for
the (111)-reflection (red) and the (222)-reflection (black)
respectively as a function of pump laser fluence The red and black
dashed lines are the linear fits for the measured data The data
obtained at the SPPS (green) [69]
is also plotted in the figure for
comparison
To determine the frequencies from the oscillatory part of the measured
diffraction efficiencies a Fast Fourier Transform (FFT) had been applied to all
measured time traces including others not shown in Fig 58 The slow background
components (initial changes and the slow recovery) are subtracted from the time-
traces before transformation As an example Fig 510 shows as red solid curve one of
those FFT results obtained from a time trace of the (222)-reflection measured at
23 mJcm2
absorbed fluence The FFT is characterized by one main peak at 24 THz
and a number of secondary peaks Due to the limited number of phonon periods
covered in this measurements as well as the small amplitude of the oscillations a
relatively low signal to noise ratio in this Fourier transform analysis is expected
Therefore only the frequency with the highest amplitude representing the main
contribution of the atomic motion is considered as reliable Since the understanding
5 Extreme phonon softening in laser-excited Bi
89
of the other observable frequency components is still an open question they will not
be discussed further in this thesis
Fig 510 FFT-spectra of the time traces of Bi 222-reflection with
23 mJcm2
absorbed fluence The solid curve and the dotted curves
(6 examples) represent the FFT results obtained from the mean time
trace and the random time traces produced within its error bar
respectively
In order to validate this approach and to assess the accuracy of the obtained
frequencies it is necessary to check how the dominant frequencies are influenced by
the measurement errors The following procedure demonstrated with the time trace
used above (222-reflection at 23 mJcm2
absorbed fluence) is applied For each time
trace the signal values of the individual data points are randomly changed within the
limits set by the error bars In this way a set of artificial time-traces is produced which
represent - within the error - possible time traces The variation of the FFT-spectra
of all this possible time-traces allows to estimate the error in the FFT and to asses
which frequency components can be regarded as real In Fig 510 six of these FFT-
spectra are presented as dotted curves With respect to the main peak (the solid curve)
it can be concluded that the measurement errors slightly change its amplitude and
width but do not affect much its position The variation of the peak position is
5 Extreme phonon softening in laser-excited Bi
90
significantly smaller than the peak width which I consider in the following as the
error of the measured frequency In conclusion the dominant frequency obtained
from the FFT can be regarded as reliable and it is assumed that it represents the A1g-
phonon mode Some more FFT-spectra obtained from the measured time-
dependencies of the diffraction efficiency are presented in Fig 511
Fig 511 FFT-spectra of the measured diffraction efficiencies for
different absorbed fluences The dominant frequency in each figure
is marked by the blue arrow
5 Extreme phonon softening in laser-excited Bi
91
Fig 511 clearly indicates that for each fluence a unique dominant frequency
can be determined as marked with the blue arrow The only exception is the one at
F = 32 mJcm2 where several peaks of equal strength are found Fig 512 summarizes
the result of the FFT-analysis It shows the determined dominant frequency as a
function of fluence The frequency error bars represent the FWHM of a Gaussian fit
to the dominant peak
Fig 512 Frequency of the excited A1g-mode as function of laser
fluence derived from the time resolved diffraction data red 111-
reflection green 222-reflection violet data obtained from earlier
results at University Duisburg-Essen (UDE) [68]
blue data obtained
at the SPPS [69]
Cyan A1g-frequency of unexcited Bi black dashed
line guide to the eye Insert DFT calculations from Murray et al [237]
The solid and dashed lines show the anharmonic and harmonic
frequencies as a function of carrier density n respectively
In Fig 512 the red and green data points represent the new data from my
measurements At lower fluences they compare well with the results obtained earlier
which have discussed above (violet point Ref [68] blue points Ref [69] Most
strikingly these experimental data reveal an extreme softening of the A1g-mode for
5 Extreme phonon softening in laser-excited Bi
92
high fluences (gt 2 mJcm2) Particularly by extrapolating the measured data (black
dashed line as a guide to the eye) a complete softening at fluences of 30 to
33 mJcm2 is expected At first glance surprising a further increase of fluence leads
to the revival of the signal oscillations and an increase of the mode-frequency The
complete softening and later stiffening of the A1g-mode clearly indicate that the
Peierls distortion is transiently reversed for fluences above approx 30 mJcm2
Further evidence can be found in Fig 59 where initial signal changes of (111) and
(222) diffractions reach approx -50 and 20 at this excitation level respectively
These results agree with estimates based on the geometrical structure factor (see Fig
53) assuming that about half of the film thickness had been excited to the symmetric
arrangement x = 05 (where the 111-reflection is fully forbidden)
In order to compare my measured results with the theoretical predictions of the
DFT-calculations performed by Murray et al [237]
the calculated harmonic and
anharmonic phonon frequencies using the PES are presented in the inset of Fig 512
as a function of carrier density n One can immediately see qualitative agreement
between the experiment and the calculation The harmonic frequency computed from
the curvature of the PES at the minimum under the assumption of harmonic
approximation The anharmonic frequency obtained from the inverse of the actual
cycle period of atomic motion in the anharmonic potential More detailed
interpretations of the two frequencies are provided in Ref [237] and [258] At low
excitation level as already proved by experiment [69]
there is little difference between
the harmonic and anharmonic frequency The difference becomes apparent at high
excitation levels where the range of atomic motion increases leading to an
anharmonic oscillation of the atoms along the asymmetric part of the PES A detailed
interpretation of atomic motion upon laser excitation is given in the following
5 Extreme phonon softening in laser-excited Bi
93
Fig 513 Sketch of the interatomic potential energy surface of Bi
upon laser excitation The black curve represents the shape of initial
equilibrium PES The others represent (qualitatively) the shape of
PES upon different excitation levels For illustrative purpose the
curves are adjusted to be separated in arbitrary unit The dashed
curves along the surface indicate the range of atomic motions
Within the DECP-picture the atoms are immediately displaced from their
(transient) equilibrium position due to the impulsive laser induced change in the PES
A restoring force whose magnitude and direction are determined by the gradient of
the PES is exerted on the atoms setting them in motion The frequencies extracted
from the X-ray diffraction signals displayed in Fig 512 directly reflect this transient
atomic motion along the PES and yield information regarding the curvature of the
PES of the excited sample In order to concisely interpret this oscillatory behavior I
illustrate qualitatively the shapes of the PES of Bi upon laser excitation and the
possible range of atomic motion in Fig 513
The initial equilibrium PES of Bi has a double well structure with the minimum
position at x = 0468 (curve (a)) For weak excitation a slight shift of the minimum
position of the PES and a slight decrease of the Peierls barrier can be seen (curve (b))
The atomic motion is limited to a small range around the equilibrium position and the
5 Extreme phonon softening in laser-excited Bi
94
atom oscillates harmonically along the PES Anharmonicity is negligible The
frequency drops approximately linearly with excitation fluence This situation
corresponds to the excitation level up to 15 of carrier density in the DFT
calculation and excitation fluences below 25 mJcm2 in Fig 512 Extensive studies
[68 69 237 244-246 248 249 259] on the generation of coherent optical phonons in Bi have
been performed in this region with time-resolved optical and X-ray techniques Up to
now no study has been carried out beyond this level of excitation The behavior in
this unexplored area has been revealed in this work
Following the increase of the excitation level the range of oscillatory atomic
motion becomes larger (curve c) The asymmetric anharmonic shape of the PES leads
to an additional increase of the period of atomic motion which defines the
anharmonic phonon frequency shown in the inset of Fig 512 It differs
significantly from the harmonic frequency (defined by the curvature of the PES at the
minimum) This situation corresponds to 15 ~ 2 of excited carrier density in the
DFT calculations and the excitation fluences of 25 ~ 3 mJcm2 in Fig 512
Upon further increase of excitation the system can reach the particular state in
which the Peierls barrier becomes low enough to let the atom just climb to its top
where it stops (curve d) In this labile equilibrium atomic motion freezes and the
anharmonic frequency becomes zero After reaching the above particular state the
Peierls barrier is further lowered by an increased fluence and the atom is allowed to
cross the x = 05 position and moving in both wells (curve e) As the atomic motion
restarts the phonon frequency revives Upon further increase in fluence the double
well and the barrier vanish The minimum of the PES is now at x = 05 which means
that the Peierls distortion has been transiently reversed Right at the transition the
harmonic term of the PES vanishes (curve f) which corresponds to the situation where
the harmonic frequency becomes zero These happen at an excitation level of 2 ~
27 of carrier density in the DFT calculation and absorbed laser fluences between
30 to 33 mJcm2 in Fig 512
With the further increase of excitation level corresponding to the value beyond
27 of carrier density in the DFT calculation and absorbed laser fluences above 33
5 Extreme phonon softening in laser-excited Bi
95
mJcm2 in Fig 512 the PES is continuously altered and the two minima converge to
one transforming the flat profile to the sharp parabola with the minimum position at
x = 05 (curve g and h) As the relative potential energy (to the minimum of the PES)
increases the atom moves along a parabolic surface with higher velocity thus
shortening the motion period and leading to an increase in the phonon frequency The
A1g phonon mode stiffens However it should be noted that due to the already
reversed Peierls distortion and the transformation into a more symmetric structure
with only one atom per unit cell this atomic motion correspond now to an acoustic
phonon mode at the new Brillouin-zone boundary
In contradiction with the above description about the range of atomic motion the
observed oscillation amplitudes in the measured data (see Fig 58) are much smaller
compared to the average signal change A very strong damping in the A1g atomic
motion can be responsible for the observation The reason of the damping effect is not
fully understood yet Considering the high excitation level applied in the
measurements a coupling of the A1g mode to other modes (eg Eg mode) which was
proposed in the earlier electron diffraction experiment [81]
and predicted in calculation
by Zijlstra et al [260]
could be the reasonable explanation for this effect Since the
system performs small amplitude oscillations around the new equilibrium
positionpotential minimum I suppose the experimental results are more suitable to be
described by the harmonic frequency
Finally it should be noted that the above description of the A1g phonon behavior
follows the results of the first principles DFT calculation [237]
which applies separate
chemical potentials for electrons and holes This model has been proved to be
quantitatively correct for low excitation fluences [69]
and at least qualitatively in good
agreement with my experimental results The other approach proposed by
Zijlstra et al [260]
using all-electron full-potential linearized augmented planewave
method (FLAPW) [261 262]
provides a description not only on A1g phonon but also on
Eg phonon and interactions between them This model could be more accurate for the
situation of Bi at the high level excitation While these two theoretical calculations
5 Extreme phonon softening in laser-excited Bi
96
differ quantitatively they qualitatively predict similar changes of the PES and the
phonon frequency
53 Summary
In summary an investigation of the laser-excited A1g coherent optical phonon
mode in Bi was performed with the laser plasma X-ray source The reversal of Peierls
distortion as well as the coherent motions of atoms in Bi following laser excitation
was observed In the low excitation regime the data agree with previous results
obtained at UDE and the SPPS In the strong excitation regime (absorbed laser
fluences gt 2 mJcm2) an extreme softening of the A1g mode was observed and an
interpretation was given Particularly the observation of a complete softening
(frequency down to zero) at fluences of 30 to 33 mJcm2 indicates that the Peierls
distortion defining the equilibrium structure of Bi transiently vanishes At even
stronger excitation (absorbed laser fluences gt 33 mJcm2) Bi starts to respond as a
material arranged in the structure with half of its equilibrium lattice constant and the
atomic motion becomes a Brillouin-zone boundary acoustic phonon mode These
observations follow at least qualitatively the predictions of calculations based on DFT
[237 260]
However due to the limited experimental accuracy these results do not provide
more detailed information with respect to the damping behavior of the oscillations the
decay of coherent phonons and the coupling of the phonon modes For further detailed
investigation in the high excitation region more powerful X-ray sources (eg XFEL
or LCLS) are needed
As already mentioned in the experimental section accumulative sample damage
was observed when absorbed fluences beyond 25 mJcm2 are used It indicates that
the applied excitation density is close to the melting threshold of the Bi sample It
questions how the phonons respond to excitations far beyond the melting threshold
which allow the melting of Bi sample with a single laser pulse Such a question had
recently been investigated by Sciaini et al [81] The ultrafast melting of Bi had been
5 Extreme phonon softening in laser-excited Bi
97
observed with time-resolved electron diffraction It was found that under extreme
excitation conditions the disordering of the Bi crystal structure occurs within 190 fs
which is substantially shorter than the disordering time determined by lattice heating
indicating a non-thermal melting process The authors attribute such surprising speed
of the non-thermal solid-to-liquid phase transition in Bi to laser induced changes in
the PES which result in strong acceleration of atoms along the longitudinal direction
(A1g mode) and an efficient coupling of this motion to the transverse mode (Eg mode)
This coupling effect had also been theoretically predicted by Zijlstra et al [260]
in high
excitation regime In order to obtain the insight into more details of DECP mechanism
and subsequent phonon dynamics at the high excitation regime the Eg phonon motion
as well as the coupling effect of A1g and Eg mode should be included in this study
However since amplitude of the Eg mode is much smaller than the one of the A1g
mode and the experimental geometry in this measurement is not sensitive to Eg
motions the Eg phonon mode as well as the coupling effect has not been observed in
my data
Nevertheless a complete insight of A1g optical phonon dynamics in laser excited
Bi from the weak excitation to melting is provided now from the results of three
excitation levels (low data from SPPS high data in this thesis extreme data from
electron diffraction) The transient reversal of Peierls distortion happening before the
disordering of Bi crystal structure has been experimentally confirmed The structural
change resulting from the coherent phonons has been indicated by the appearance of
the acoustic phonon mode Since many properties of a solid including the electronic
thermal and optical properties are affected by lattice structure this knowledge of
ultrafast structural changes caused by electronically altered energy surfaces can be
extended to understand not only the phonon dynamics of other Peierls distorted
materials (Sb and As) but also the mechanism of ultrafast phase transition in other
functional materials eg insulator-metal transition in VO2 [263 264]
and crystalline-
amorphous transition in chalcogenide alloys [265 266]
6 Towards time-resolved Debye-Scherrer X-ray diffraction
98
6 Towards time-resolved Debye-Scherrer
X-ray diffraction
The observation of the transient changes of a single Bragg-reflection in a
femtosecond X-ray diffraction measurement provides only limited information about
the transient structural response of optically excited materials To obtain a more
complete picture of the induced processes it is desirable to monitor as many Bragg
peaks as possible The Bragg diffraction scheme with a monochromatic source applied
in the experiments discussed in chapter 4 and 5 requires single crystalline samples of
high quality and thus the range of materials that can be studied is limited Moreover
a sequential measurement of many individual Bragg peaks is time consuming and
difficult to handle due to multiple sample adjustments (sample rotations) as well as
the instability of the laser and X-ray sources One alternative for effectively
measuring multiple diffraction peaks with single crystalline sample is the so-called
rotating-crystal method [74]
By rotating a single crystalline sample at a high constant
angular velocity (eg 180degs) the Bragg condition for different diffraction peaks is
fulfilled and simultaneously allowing a detection of a larger number of transient
diffraction peaks under the same experimental conditions in one measurement Again
this method requires good sample preparation precise mounting and alignment of the
sample as well as extremely stable mechanical components
Moreover not all materials can be prepared as crystalline thin films (thin films
are necessary in order to match the optical absorption depth to the X-ray probing
depth) On the other hand many materials can be prepared in polycrystalline form
For polycrystalline materials the well-known Debye-Scherrer scheme [267]
represents a
simpler approach to access simultaneously multiple Bragg peaks The simultaneous
6 Towards time-resolved Debye-Scherrer X-ray diffraction
99
detection of several reflectionsdiffraction rings without additional (sample
adjustments and mechanical stability) requirements allows conveniently getting as
much as possible information of the sample from one measurement A successful
time-resolved experiment using the Debye-Scherrer scheme on a thick (250 microm)
powder sample has been recently reported [106]
Since a material with a large unit cell
size was used multiple diffraction rings were recorded simultaneously proving the
relocation of charges within the unit cell with a time resolution of 100 fs This result
demonstrates the feasibility of using a laser-plasma based X-ray source for
investigating a wide range of polycrystalline inorganic and organic materials with
time-resolved Debye-Scherrer diffraction
The use of an X-ray optic with high magnification in the modular setup (see in
chapter 3) can provide a quasi-collimated beam well suited for the Debye-Scherrer
diffraction scheme In the work discussed in this chapter I performed Debye-Scherrer
X-ray diffraction experiments on thin polycrystalline metal films and I demonstrated
the possibility to perform time-resolved experiments with the modular setup The first
part of this chapter presents the experimental configuration In the second part static
Debye-Scherrer diffraction measurements on a 20μm Cu foil are presented This
measurement serves as comparison to results previously obtained by U Shymanovich
using a different kind of focusing X-ray optic (elliptical capillary) [105]
In the third
part of this chapter results of a time-resolved X-ray Debye-Scherrer diffraction
measurement on a 200 nm Au film are presented and discussed
6 Towards time-resolved Debye-Scherrer X-ray diffraction
100
61 Experimental configuration
(a)
(b) (c)
Fig 61 Experimental configuration (a) The principle schema of the
experimental setup (b) A photo of the arrangement of sample and X-
ray area detector (c) The configuration of the experiment for an Au
sample
A schematic of the experimental setup is shown in Fig 61 (a) The femtosecond
X-ray pulses are collected by the X-ray multilayer optic and focused on a
polycrystalline thin film sample at normal incidence Comparing to the experiments
described in the previous chapters no special alignment of the sample is necessary
due to its polycrystalline structure The diffraction pattern from the sample forms a
series diffraction cones Each diffraction cone corresponds to the diffraction from the
same family of crystalline planes in all the participating crystallites For the detection
a large area detector is required to cover a sufficiently large angular range In the
experiment discussed here the phosphor-based MCP amplified X-ray area detector
(ie ldquoGemstarrdquo) was utilized for this purpose This camera has already been
mentioned in chapter 3 and its working principle and detailed parameters are provided
Thin Film Sample
CC
D
Multilayer
X-ray Optic
Plasma
Kα-Source
6 Towards time-resolved Debye-Scherrer X-ray diffraction
101
in Appendix B In order to simultaneously record as many diffraction orders as
possible the camera was placed not normal to the incident beam Fig 61 (b) presents
a photo of the sample and camera arrangement In Fig 61 (c) the detectable
diffraction orders have been depicted for Au as an example Their corresponding
diffraction angles are shown in the insert of Fig 61 (c) Note that due to the limited
size of the detector only parts of the different rings are recorded (see below)
62 Static Debye-Scherrer measurements
(a) (c)
(b) (d)
Fig 62 Diffraction pattern of a 20μm polycrystalline Cu foil with
Cu Kα X-ray source The CCD images in (a) and (c) are obtained
using multilayer optic and capillary optic respectively (b) and (d)
are the radial cross section of image (a) and (c) respectively (c) and
(d) reproduced from Ref [105]
In order to test the feasibility of the experiment and the capability of the setup I
first performed a (static) Debye-Scherrer diffraction experiment on a 20 μm thick Cu
6 Towards time-resolved Debye-Scherrer X-ray diffraction
102
foil This sample was used in the above mentioned previous study with the elliptical
capillary optic [105]
and it provided sufficient diffraction signals to record the Debye-
Scherrer diffraction pattern Using the sample this time with the multilayer optic
offered an opportunity to compare results obtained with different types of X-ray
optics
The detailed parameters of the experiment and the accessible diffraction orders
of Cu with Cu Kα X-ray (805 keV) are provided in Appendix C A typical Debye-
Scherrer diffraction pattern obtained using the multilayer optic with 5 minutes
exposure time is given in Fig 62 (a) It can be seen that three different diffraction
rings are detected simultaneously These rings are the intersections of the diffraction
cones and the detector plane The shape of a complete ring which can be a circle an
ellipse a parabola or a hyperbola depends on the angle of the detector plane with
respect to the incoming X-ray beam In order to derive the intensity of diffraction X-
ray as a function of diffraction angle I() from this CCD image one needs to integrate
the pixel intensity along the ring in which the pixels belong to the same Thus a
complete diffraction ring for a corresponding needs to be reconstructed Considering
that only small fractions of the rings are detected by the CCD the curvatures of the
detected parts are small enough to allow these ring patterns being reconstructed by
approximating them as circles As it can be seen in Fig 63 (a) the coordinate origin
is set at the middle of the left edge of the CCD image By sampling the coordinates
from each ring their individual circle parameters (0x
0y and R ) for a circle
approximation ( 22
0
2
0 )( Ryyxx ) can be obtained Knowing these
parameters the full ring pattern out of CCD plane for each diffraction order can be
reconstructed The zoom of CCD plane (Fig 63(b)) presenting the well overlapping
of X-ray and the reconstructed rings demonstrates feasibility of this reconstruction
With these circle fitting functions the circle parameters ( 0x 0y and R ) as a function
of the x coordinate on the line y = 0 are obtained as displayed in Fig 63 (c) For each
x coordinate (from 1 to 1392) a corresponding ring can be deduced Each point (xy)
of the image belongs to one of these rings By integrating the pixel intensity along
6 Towards time-resolved Debye-Scherrer X-ray diffraction
103
each ring and projecting all data on the line y = 0 the X-ray intensity as a function of
x coordinate is obtained Converting the pixel coordinate to the angular coordinate by
applying the known angular positions of the corresponding detected diffraction orders
the diffraction X-ray intensity as a function of diffraction angle is finally derived The
result of this data processing for Fig 62 (a) is given in Fig 62 (b)
Fig 63 Reconstruction of the diffraction pattern in order to extract
the diffracted X-ray intensity as a function of diffraction angle (a)
Chosen coordinate system and the reconstructed ring pattern (b)
Zoom of the CCD image plane showing the overlap of the measured
diffraction pattern with the reconstructed rings (c) Circle fit
parameters (0x
0y and R ) of each diffraction ring as a function of x
coordinate on the y=0 line The dashed lines are the 2nd
order
Polynomial Fit for the data points
To compare my result with that obtained with a different kind of collimating
X-ray optic namely the elliptical capillary optics [105]
a CCD image from this study
and its radial profile are displayed in Fig 62 (c) and (d) The elliptical capillary
optics uses total reflection All incident X-rays passing through the capillary with an
angle smaller than the angle of total reflection undergo total reflection at its inner
6 Towards time-resolved Debye-Scherrer X-ray diffraction
104
surface The angle of total reflection has a weak dependence on the wavelength of the
X-rays and thus the optic is not wavelength sensitive Therefore more diffraction
orders originating from Kα and also Kβ radiation can be observed in Fig 62 (c)
instead of only three diffraction orders from the monochromatizing multilayer optics
The noisy background observed in Fig 62 (d) is caused by the unfocused radiation
passing directly through the capillary optic without reflection
In conclusion due to the monochromatic reflection of the multilayer optic and
the optimized Kα flux of the laser-plasma source (see chapter 2) the modular setup
can provide Debye-Scherrer diffraction patterns with much better signal-to-noise ratio
than those obtained previously [105]
63 Time-resolved Debye-Scherrer experiment
The absorption depth of a metal at visible and near-infrared wavelengths is
typically less than 20 nm [113]
However multi-keV X-ray penetrate much deeper [189]
In particular with the transmission geometry used in this experiment the 20 μm Cu
sample presented in the former section is not a suitable sample to perform time-
resolved experiments because it can not be effectively excited by the optical radiation
over the whole depth probed by the X-rays Therefore in the experiments discussed in
this section a 200 nm thick free standing Au thin film [268]
was used as sample to
demonstrate the feasibility of time-resolved Debey-Scherrer diffraction
6 Towards time-resolved Debye-Scherrer X-ray diffraction
105
631 Static Debye-Scherrer-diffraction pattern of the Au
thin film
(a)
(b)
Fig 64 Diffraction pattern of a 200 nm polycrystalline Au film (a)
CCD image (b) Radial cross section of (a)
The detailed parameters of the experiment and the detectable diffraction orders
6 Towards time-resolved Debye-Scherrer X-ray diffraction
106
for Au are provided in Appendix C and Fig 61 (c) The static Debye-Scherrer-
diffraction pattern of the Au thin film is presented in Fig 64 (a) Using a similar
experimental configuration as described in the previous section four diffraction
orders were observed in this case due to the larger lattice constant of Au as compared
to Cu I() is obtained in the same way as described in the previous section and shown
in Fig 64 (b) Compared to result with 20 μm Cu foil (Fig 62 (b)) the signal-to-
noise ratio becomes much worse Such a difference is attributed to the small thickness
of this sample the total intensities of the diffraction peaks decrease with sample
thickness whereas the noise (background signal) coming from the scattering of X-ray
are barely affected by the sample thickness
632 Results of time-resolved pump-probe measurements
In the timendashresolved measurement the incident fluence of the pump beam was
set to 160 mJcm2 (wavelength 800 nm) The diffraction patterns were recorded using
again the Phosphor-based X-ray area detector An exposure time of 5 minutes had
been chosen for each delay point After subtracting the CCD background the images
for a given delay were processed using a MatLab program (with the same routines
described in section 62) to obtain I()) By analyzing the transient changes of I()
the laser induced changes can be deduced
6 Towards time-resolved Debye-Scherrer X-ray diffraction
107
Fig 65 Comparison of the signal from non-excited and excited Au
sample (a) Radial cross sections obtained from measured data (b)
The selected profiles above the noisy background (about 30 of the
peak value) are fitted with Gaussian function
It is known since many years that the excitation of a thin metal film with an
ultrashort optical pump pulse leads to several effects which can be observed with
time resolved techniques [42 75 269 270]
Generally the changes of the diffraction
intensity due to the Debye-Waller effect and the changes of the diffraction angle due
to laser induced strain can be extracted from the measured time resolved data Both
effects have been discussed in Chapter 4 The amplitude of these changes is more
pronounced for higher diffraction orders (see the discussion in section 42 and the
latter discussion in section 633) Therefore I focused in the analysis on the two
highest diffraction orders (311) and (220) Since the reduction of the diffraction
intensity due to the Debye-Waller effect could not clearly be observed in these
measurements as will be explained in section 633 I will only discuss the observed
changes in the angular position of the Bragg-peaks attributed to strain caused by
acoustic waves
The changes of the diffraction pattern induced by the optical excitation are
6 Towards time-resolved Debye-Scherrer X-ray diffraction
108
presented in Fig 65 (a) where the I()-data for the non-excited sample (black-dotted
curve) and for a delay of 70 ps between the optical pump and the X-ray probe (green
dotted curve) are shown Shifts of both Bragg peaks are clearly observable In order to
quantify the shift the two selected Bragg-peaks have been fitted using the Gaussian
function To eliminate any effects of the noisy background on the fitting only data
points with an intensity larger than 30 of the peak intensity (blue and red curves in
Fig 65) have been used for the fitting The results are shown in Fig 65 (b) as dashed
curves and the peak positions and their error bars are obtained from the fitting
parameters Applying the same routine to all measured diffraction profiles the peak
positions as a function of delay time for the (311) and (220) Bragg reflections were
obtained and are shown in Fig 66
Upon the laser excitation pressure rises inside the sample inducing strain The
resulting strain will modify the lattice constant of the sample and thus the radii of the
diffraction rings This is the origin of the transient peak shifts displayed in Fig 66
For Au the energy will be rapidly (in a few hundred femtoseconds [211-213]
) distributed
after optical excitation over the full 200 nm film thickness Rarefaction waves are
launched at both film surfaces and start to propagate into the bulk of the film As a
consequence the diffraction peaks start to shift to smaller diffraction angles indicating
expansion of the material After a time determined by the film thickness and the speed
of sound of the considered material the fronts of the strain waves traveling in the
sample arrive at the opposite surface For a free surface the strain waves are totally
reflected with a change of sign Such recompression of the material is indicated by the
diffraction peaks shifting back to larger diffraction angles without obvious damping
effect As already discussed in Chapter 4 the ldquotriangularrdquo shape of the time-traces
results from a very fast and homogeneous (over the whole film thickness) increase of
pressure in the sample upon optical excitation [140 186]
The temporal position of the
maxima and minima of the time traces in Fig 66 (a) and (b) are determined by the
transit time of longitudinal acoustic waves through the film For both diffraction
orders oscillations with a half period of about (67 plusmn 1) ps are observed Using the
known sound velocity for polycrystalline Au of vs = 324 kms [271]
this transit time
6 Towards time-resolved Debye-Scherrer X-ray diffraction
109
corresponds to a film thickness of 217 nm which agrees within specifications (+-
10) of the manufacturer with the nominal thickness of 200 nm
(a)
(b)
Fig 66 Relative transient shift of the peak positions for the diffraction
rings (311) (a) and (220) (b) after laser excitation (blue squares) The
red circle points give the peak positions for non-excited sample The
black curves are guides for eye
6 Towards time-resolved Debye-Scherrer X-ray diffraction
110
633 Modeling the transient behavior of the diffraction
pattern after laser excitation
Fig 67 Debye-Scherrer Ewald-sphere construction without strain
(solid circles) and with uniaxial strain (dashed circle)
In polycrystalline samples the crystallites are randomly oriented When the X-
ray beam passes through the sample only the crystallites with a plane orientation
which fulfills the Bragg condition diffract X-rays The diffraction contributions from
all these crystallites form the Debye-Scherrer-diffraction pattern When the sample is
excited by the laser pulse with the condition that the illuminated area of laser is much
larger than the samplersquos absorption depth the sample expands only along the surface
normal resulting in uniaxial strain To understand the changes of the Debye-Scherrer
pattern under uniaxial strain I use a Ewald-sphere-construction [272]
as displayed in
Fig 67
The black and blue solid circles are used to describe the situation in an
6 Towards time-resolved Debye-Scherrer X-ray diffraction
111
unstrained polycrystalline film The black circle represents the Ewald-sphere Its
radius corresponds to the length of the wave vector of the incident X-rays Since we
are considering elastic scattering the incoming wave-vector ink as well as all possible
wave vectors of diffracted waves have to lie on this sphere The difference in direction
is given by the reciprocal lattice vector hklG For a single crystalline sample hklG
points only to one particular direction For a polycrystalline sample all directions of
hklG are possible This is illustrated by the blue circle which has a radius
corresponding to the length of hklG In two dimensions the two points of intersection
mark the positions where the Bragg-condition is fulfilled Extending this to three
dimensions by rotation around ink will transform the two points to a diffraction ring
When the film is uniaxially strainedexpanded the length and direction of hklG
depends on the orientation of the individual crystallite with respect to the surface
normal and the circle (with direction-independent radius) transforms into an ellipse
which is represented in Fig 67 by the blue dashed line Its shorter axis corresponds to
the direction of strainexpansion (larger lattice constant - smaller length of hklG ) Now
the intersection of the ellipse with the Ewald-sphere defines the diffraction direction
for the strainedexpanded sample As a result the diffraction rings should decrease
their radius
According to these considerations a simple geometrical calculation allows to
determine for a given strain what shifts will be induced for different Bragg peaks and
these estimations can be compared to the experimental data Choosing the center of
the Ewald-sphere as coordinate origin the black and the blue circle as well as the blue
ellipse can be expressed as follows
222 kyx (1)
222Gykx (2)
11
2
2
22
2
G
y
G
kx
(3)
6 Towards time-resolved Debye-Scherrer X-ray diffraction
112
Where η is the uniaxial strain caused by laser excitation defined as dd (d
is lattice constant) Let (x1y1) be the intersection point of the black and blue circles
(unstrained case) In the strained case the intersection point of black circle and blue
ellipse change to xxx 12 yyy 12 Substituting 1x 1y 2x 2y and G from Eq
(1) and Eq (2) in Eq (3) and applying a first order approximation
[ 2112
02 x 02 y ] one obtains
02222
yykxxkx (4)
Then substituting coskx sinky sinkx cosky in
Eq (4) one obtains the relationship between andη (and )
sin
1cos2
(5)
Fig 68 shows some results calculated using Eq (5) The angular shift
increases with strain η for a given diffraction order and for a given strain η it is larger
for higher diffraction orders
Fig 68 Estimation of the shift of diffraction rings and comparison to
measured data
6 Towards time-resolved Debye-Scherrer X-ray diffraction
113
634 Discussion for the experimental results
Following the above discussion the laser induced strain in the Au sample can be
deduced from the angular shift of the diffraction peaks observed in the time-resolved
experiment The measured peak shifts are (- 0152 plusmn 0013) ordm and (- 0103 plusmn 0010) ordm
for the (311)- and (220)-reflection respectively Using equation (5) a strain of
η(311) = (42 plusmn 04) times10-3
and η(220)= (50 plusmn 05) times10-3
is derived These two values
agree within the error bars and can be used to estimate the sample temperature For
this we use the average value ηavgasymp (46 plusmn 05) times10-3
Since the lateral dimensions of
the excited area (04 mm) are much larger than the film thickness on the time scale of
a few hundred picoseconds expansion of the film can only occur along the surface
normal Under these conditions the relation between the peak strain and the laser-
induced temperature increase is given by the following equation [223]
Tv
B
S
2
6 (6)
where B β ρ vs are the bulk modulus (B = 180 GPa) the coefficient of linear
thermal expansion (β = 142 μmbullm-1
bullK-1
) the density (ρ = 193 gbullcm-1
) and the speed
of sound (vs = 324 kms) respectively Equation (6) yields = (61 plusmn 7) K This
result is in rough agreement with the temperature increase (= (80 plusmn 11) K)
estimated from the deposited energy in the sample for the given excitation fluence
The Debye-Waller effect (see in Chapter 4) induced by this increase of
temperature should lead to a 42 and 31 decrease in the integrated diffraction
signal of the (311)- and (220)-reflection respectively However due to the low
diffraction signals (approx 3 detected photons per second for the (311)-reflection
less for the (220)-reflection) these changes could not be detected in the experiment
since they are of the same order (eg for (311)-reflection) or smaller (eg for (220)-
reflection) than the experimental errors which are mainly determined by counting
statistics
6 Towards time-resolved Debye-Scherrer X-ray diffraction
114
64 Summary
In this chapter the static Debye-Scherrer-diffraction pattern of a Cu foil (20 μm)
and an Au thin film (200 nm) have been presented The feasibility of performing a
time-resolved X-ray Debye-Scherrer measurement with the modular setup has also
been shown A preliminary time-resolved X-ray Debye-Scherrer measurement on a
thin Au film has been preformed The generation of acoustic waves due to rapid build-
up of pressure upon laser excitation and their propagation inside the film has been
followed by simultaneously measuring the transient shifts of the (311)- and (220)-
reflection as a function of pump-probe time delay The measured data are in good
agreement with the behavior expected from propagation of acoustic waves in a
200 nm Au free standing film A Ewald-sphere construction has been used to
determine the strain induced by laser
Finally I would like to comment on the better accuracy achieved in the reported
time-resolved powder diffraction experiment [106]
This is not related to properties of
the X-ray source and the setup which are in fact quite similar (eg X-ray flux of the
source) The essential point determining the different experimental accuracy is the
samples under investigation Comparing the thin film sample used here to the (organic)
powder sample used in Ref [106] the large penetration depth of pump beam in the
latter one (up to a few tens of microm) allows much thicker samples to be used in the
pump-probe experiments Moreover due to the large unit cell size (large lattice
constant small diffraction angles) and the use of a larger detector more diffractions
orders and larger fractions of the complete diffraction rings could be recorded with the
powder sample used in Ref [106] Only these sample properties provided diffraction
patterns with a better signal-to-noise ratio leading to a better experimental accuracy
in the powder diffraction experiment
7 Summary and outlook
115
7 Summary and outlook
71 Summary
This thesis describes my work on optimizing a femtosecond laser plasma Kα X-
ray source improving an existing modular setup for time-resolved X-ray diffraction
experiments and several studies on ultrafast lattice dynamics in thin laser-excited
metal films
In the second chapter the principles of ultrafast laser-plasma based X-ray
sources are presented A systematic investigation of optimizing the Kα X-ray source
for time-resolved X-ray diffraction experiments was performed The Cu and Ti Kα
yield were studied as a function of different laser intensities different angles of
incidence and different controlled pre-pulsepre-plasma conditions The optimized
conditions for both materials were determined Introducing a controlled pre-pulse at
an appropriate time in advance of the main pulse the Kα yield can be enhanced to the
same value no matter what angle of incidence is used This result is valid for both
materials under investigation Due to the same required on-target intensity for the
same Kα emission better energy conversion efficiency is found at a small angle of
incidence with a matching controlled pre-pulse These experimental results agree well
with estimations based on the classical resonance absorption mechanism and detailed
Particle in Cell (PIC) simulations
The third chapter describes the used modular setup for time-resolved X-ray
diffraction and the implemented improvements Applying the results discussed in the
second chapter the X-ray production has been improved Two normalization
methods are compared and discussed The combination of direct normalization and
7 Summary and outlook
116
a ldquofastrdquo delay scanning scheme represents the most efficient way to achieve high
measurement accuracy
By using the optimized setup presented in Chapter 3 the Debye-Waller effect in a
thin laser-excited Au film was observed The experimental results are presented in
chapter 4 For high excitation fluences an exponential drop of the measured
diffraction signal with a decay time constant of 43 ps is measured This result is in
good agreement with previous experimental results as well as the Two-Temperature
Model (TTM) calculations at high fluences As the first time-revolved experiment
performed with the improved modular setup these observations also underline the
capabilities as well as the restrictions of the modular setup
The fifth chapter focuses on investigating coherent optical phonons in Bi after
intense laser-excitation Large amplitude coherent motion of atoms and a softening of
the A1g phonon mode were observed At lower fluences the measured results agree
perfectly with earlier results obtained at the Sub-Picosecond Pulse Source (SPPS) and
University Duisburg-Essen (UDE) Upon strong excitation (absorbed laser fluences gt
2 mJcm2) a further softening of the A1g mode is observed At fluences between 31
and 33 mJcm2 a complete softening of the A1g mode is found This observation
strongly indicates that the Peierls distortion which defines the equilibrium structure
of Bi vanishes and the material is transformed into a transient ordered state of higher
symmetry At even stronger excitation (absorbed laser fluences gt 33 mJcm2) the
atomic motion becomes a Brillouin-zone boundary acoustic phonon mode and this
mode stiffens The observations follow qualitatively the predictions of calculations
based on density functional theory
The sixth chapter is dedicated to time-resolved X-ray Debye-Scherrer diffraction
measurements The presentation of static Debye-Scherrer diffraction pattern of Cu
(20 μm) and Au (200 nm) showed the feasibility of performing time-resolved X-ray
Debye-Scherrer diffraction experiments with the modular setup In the time-resolved
measurements on a Au thin film the generation of acoustic waves and their
propagation inside the film had been observed through the transient shifts of the
(311)- and (220)-reflection The temporal evolution of the measured data is in good
7 Summary and outlook
117
agreement with the behavior expected from propagation of acoustic waves inside the
200 nm free standing film A simple model based on a Ewald-sphere construction has
been used to determine the laser-induced uniaxial strain from the measured time-
resolved Debye-Scherrer patterns
72 Outlook
As it has been underlined in this thesis the modular setup using the laser-plasma-
based X-ray source is still of great interest for performing time-resolved X-ray
diffraction experiments due to its availability and low cost (in comparison to
accelerator-based sources) The following technical developments can be done to
improve the performance of the modular setup and open possibilities for new types of
experiments
1) The conditions to optimize the X-ray output have been discussed in detail in
this thesis Redesign of the source chamber allowing a smaller angle of incidence of
the drive laser for the X-ray source could be an option to fulfill the optimized
condition with less energy requirements to the laser system
2) Improving the overall stability is another important issue for the source This
requires improvement of the stability of the laser system as well as the mechanical
parts of the tape target pulling system
3) An automatic optimizationstabilization of the X-ray output behind the
multilayer optic during experiments can be realized by an automatic adjustment of the
position of the X-ray source point on the tape target through motorized actuators To
carry out this function the manual actuators of several mirrors in the setup should be
replaced by motorized actuators and a control program should be developed and
integrated into the main experiment control program
4) The current sample holder with manual adjustments should be replaced with a
motorized one It should definitely improve the accuracy of the adjustment and also
save time Additionally this would allow to perform irreversible time-resolved X-ray
diffraction experiments eg on laser-induced melting with the modular setup
7 Summary and outlook
118
5) The results of the time-resolved X-ray Debye-Scherrer diffraction
measurements presented in this thesis successfully proved the possibility of
performing Debye-Scherrer type measurements with the laser plasma X-ray source
As single crystalline samples are not required in this scheme a much wider range of
materials which are not easily available as single crystals can be studied now In
order to further improve the experimental accuracy (which directly relates to the
number of detected photons) for this type of experiments a new camera with large
detection area [273]
has been implemented in the setup and tested by F Quirin Once
suitable samples with sufficient diffraction signal are obtained further investigations
could be made with this setup
Since the electronic properties of the material are strongly affected by lattice
structure the laser-induced reversal of the Peierls distortion in Bi should lead to
corresponding changes in its electronic band structure resulting in a semimetal to
metal phase transition Investigation of this phase transition process can be one of the
most interesting subjects for Bi To study the electronic dynamics it requires
techniques which are sensitive to the electronic structure eg time-resolved X-ray
absorption spectroscopy (t-XAS) [274-276]
time-resolved angle-resolved photoelectron
spectroscopy (t-APRES) [277]
and time-resolved THz spectroscopy [278-280]
Another interesting topic on Bi is to observe the coherent Eg motion with X-ray
diffraction The excitation of the Eg mode has been demonstrated in many ultrafast
optical experiments [247 281]
which do not provide direct quantitative information on
the vibrational dynamics These dynamics can be retrieved directly with X-rays and
provide quantitative information about the amplitude of the Eg motion as well as the
coupling behavior between A1g modes and Eg modes Up to now only one study on
this topic has been performed at the Swiss Light Source (SLS) [282]
To completely
understand the displacive excitation of coherent phonons (DECP) mechanism and the
subsequent phonon dynamics more knowledge on the Eg motion is required The
extension of this study should be continued
In recent years sub-picosecond time-resolved X-ray diffuse scattering technique
became available This technique gives information on the phonon population
7 Summary and outlook
119
throughout the Brillouin zone and can yield the phonon dispersion [283]
Applying this
technique to investigate the phonon softening behavior in Bi must be an interesting
subject in the near future However this technique requires large photon flux and is
not possible to be carried out with the current laser plasma sources due to their low X-
ray output The appropriate X-Ray Sources are the new X-ray free electron lasers like
LCLS (USA) SACLA (Japan) or the later XFEL (Germany)
Appendixes
120
Appendixes
A Working principle of multilayer mirror
A multilayer optic is an artificial two dimensional crystal The spacing of the
multilayers is designed for specific radiation to satisfy Braggrsquos diffraction law As
shown in Fig A1 the incident X-rays are reflected by diffraction at a series of
interfaces between layers with differing indices of refraction Only the wavelength of
interest is effectively reflected others which do not satisfy the conditions for Bragg
reflection are absorbed in the mirror and are not reflected thus allowing the mirror to
produce a highly monochromatic beam
Fig A1 Multilayer working principle Reprint from the
manufacturer [284]
The focusing multilayer mirrors are realized by curving the mirror surfaces into
either parabolic or elliptical shapes The d-spacing (thickness of a single bi-layer) of
the multilayer coating is controlled along the mirror surface to satisfy Braggrsquos law at
every point (Fig A2) The band-pass of a multilayer optical system can be further
controlled by using different materials and layer configurations for various
applications
The multilayer X-ray optic used in the X-ray modular setup is twondashdimensional
reflection systems which is realized by using two VariMaxTM
multilayer X-ray
Appendixes
121
mirrors in a ldquoside-by-siderdquo Montel-Helios scheme (Fig A3) [188]
These two mirrors
are placed perpendicularly Each mirror independently reflects x-rays in one of the
two perpendicular directions With the ldquoside-by-siderdquo scheme both mirrors may be
positioned at a location appropriate to optimize performance parameters including
flux spectrum and divergence by adjusting four motorized actuators on the housing
Once the mirrors are adjusted the exact position of the X-ray point source and the
focus are defined
Fig A2 Graded d-Spacing Multilayer for focusing Reprint from the
manufacturer [284]
Fig A3 Scheme of the Montel-Helios configuration Reprint from
the manufacturer [284]
The multilayer X-ray optic prepared for the modular setup is produced by
Rigaku-OSMIC Inc The Specifications provided by the manufacturer are shown in
table A1
Appendixes
122
Parameters (units) CMF10-50Cu12
Characteristic line Cu Kα
Wavelength (Aring) 154
Effective focal spot size (mm) 001
Length of the mirror (mm) 120
Focal spot ndash mirror distance (mm) 100
Focal spot ndash sample distance (mm) 600
Bragg angle in the middle point (degree) 097
Reflectivity Kα (parts) 084
Rocking curve width (arcmin) 198
Capture angle (rad)
(degree)
00264
15133
Convergence angle (rad)
(degree)
00043
024
Focal spot usage efficiency (parts) 096
Beam width at mirror (mm) 264
Beam width at the optic entrance (mm) 106
Beam width at the optic exit (mm) 187
Beam width at the focus (mm) 0094
Optic efficiency (a u)
(Reflectivity Solid angle)
000045
Geometric magnification 15
Ravgsup2 (for double reflection) () 75
Distance X-ray sourcendashentrance of housing (mm) 30
Table A1 Specifications of the Cu Kα multilayer optic provided by
the manufacturer Rigaku-OSMIC Inc Reprint from Ref [186]
B X-ray detectors for diffracted signals
B 1 Direct detection camera
The Roper Scientific Pi-MTE 1300B from Princeton Instruments is an
innovative high-sensitivity imaging system designed to operate inside high-vacuum
chambers over long operation times The Pi-MTE 1300B incorporates a back-
illuminated CCD without AR coating for ultra-low-energy X-ray detection With
20times20 μm pixels and 100 fill factor this system offers a large imaging area with
very high spatial resolution and dynamic range The thermoelectrically cooled design
features PCBs thermally linked to the circulating coolant to provide reliable operation
inside vacuum chambers Its detail specifications are given in Table B1 This camera
is suitable for monitoring hard X-ray radiation due to its good quantum efficiency eg
55 for Ti Kα and 18 for Cu Kα (Fig B1)
As a direct detection camera the incidence photons are directly absorbed by the
active area of CCD pixels and generate charge signals The charge signals are strictly
Appendixes
123
proportional to the incident phonon energy For example the camera used here have
conversions that one Ti Kα (451 keV) photon gives a signal of ~589 counts and one
Cu Kα photon (805 keV) gives a signal of ~1050 counts In high flux condition (gt104
detected photons per pulse) the detected photon number can be easily deduced from
the value of integral signal (see in section 31) In low flux regime (for example 1
detected photon per 40 pixels) this camera can also be used as a multi-channel energy
detector A histogram of the CCD image corresponding to the energy spectrum can be
obtained [142]
and the number of detected photons can easily be deduced from this
histogram This function has been applied in the measurement of X-ray source
production in Chapter 2 Here one should notice that when the histogram is used to
calculate the detected photon number the multi- pixel event issue should be taken into
account
Table B1 Specifications of Roper camera Reprint from the
technical datasheet [285]
Appendixes
124
Fig B1 Quantum efficiency of Roper camera Reprint from the
technical datasheet [285]
Two major limitations of operating this camera should be pointed out The first
one is its working condition During the acquisition of a picture the charged coupled
device (CCD) will accumulate not only the signal from detected photons but also the
signal due to the dark current The dark current depends strongly on the temperature
on the detector Cooling down the detector is the typical way to reduce it In the
experiment the working temperature of the camera is -30deg C which is realized by an
integrated Peltier cooler under the chip Due to this low temperature to protect the
CCD from ice formation on the cooled parts the CCD chip should maintain under
vacuum It can be easily achieve in a big vacuum chamber for example in the
experiment of Chapter 2 For the modular setup the device needs to be operated in air
Additional configuration for keeping the vacuum inside the camera has been made A
special vacuum nose which isolates only the CCD has been installed into the camera
The nose needs to be continuously pumped to insure the required vacuum An Al
plate with a hole of approximately 1 cm2 covered by Beryllium window is installed at
Appendixes
125
the input of the camera which leads to only 14 of CCD size is available for the
exposure The second drawback of this detector is its rather slow readout time For
full size chip information it needs 17 seconds to read out the data The readout time
can be reduced for small regions of interest but it still remains more than 100 ms and
because of this the Roper camera can not be used with a 10 Hz repetition mode to
record each single X-ray pulse
B 2 Indirect detection camera
Pixel Resolution 1392times1040 (43 aspect ratio)
Effective pixel size at input 23 microns square
Active input size 32times24 mm (40mm diagonal)
Intensifier Ultra high-resolution (typically gt 60lpmm) low noise
Intensifier format 40mm diameter
Intensifier input window Coherent fiber optic
Gating Gated on when CCD is integrating off when not
acquiring
Gating speed Minimum gate period approx 100ns
Coupling to scintillators Via coherent straight fiber-optic
Scintillator material Gadolinium Oxysulphide 75mgcm2
Grey Scale Resolution 4096 grey levels (12bits)
Readout speed 20 MHz or 10 MHz pixel rate software selectable
Linearity No measurable deviation from linear response until
saturation
Saturation Approximately 13000 electrons
Video Gain User variable in software in 100 setups
Intensifier Gain User variable in software in 100 setups
On-chip binning User selectable 1times 1to 63 times 63
Exposure Time User selectable from 100μsec to 30 minutes
Readout Philosophy Correlated double sampling for highest accuracy fast 12
bit AD converter in head producing LVDS differential
format
Control PS Link 4 Line bi-directional Serial interface Using
LVDS drivers for reliability over long cables Parameters
that can be adjusted include image intensifier gain video
gain CCD integration period binning and sub-area
window
Power Requirements 110 or 230V ac 5060Hz
Operating Environment Temperature ndash Storage -10 to +80 degC
Operation 0 to +50 degC
Humidity ndash 0-80 RH non-condensing
Table B2 Specifications of Gemstar camera Reprint from the user
manual [273]
Appendixes
126
The Gemstar Camera from Photonic Science is an indirect detection camera Its
specifications are given in Table B2 The main feature of the indirect X-ray detection
is using a scintillator to transform the incoming signal into an optical signal which
can be easily detected and recorded This allows the quantum efficiency of certain
wavelengths like Cu Kα to be optimized by choosing an appropriate material The
scintillator inside this camera is made of a polycrystalline layer of Gadolinium
Oxysulphide which has a quantum efficiency of 85 for Cu Kα radiation When
incident photons are absorbed the scintillator emits photons in the visible range A
straight fiber-optic is used to couple them into the photocathode of the intensifier
These incoming photons produce photoelectrons from the photocathode The
produced electrons are sent through a multi channel plate (MCP) for a further step
amplification The amplification of MCP can be changed in the control software By
triggering the MCP by a camera trigger signal or an additional gate signal the
amplifying process can only be active for a short period during the presence of the X-
ray pulse therefore increasing the signal to noise ratio by reducing the background
signals This method could be very useful when multiple exposures of the Bragg
peaks are required After amplified by MCP the outcoming electrons hit on a
phosphor screen and produce phosphorescence whose intensity is proportional to the
number of incident electrons This light emitted from the screen is then collected by a
tapered fiber optic and sent onto a CCD sensor cooled by a peltier cooler which
allows images to be acquired with extended integration periods with minimal build-
up of CCD dark current This whole process allows the camera to work with a
repetition rate of 10 Hz when the On-Chip binning is set to large than 4times2 binning or
a small region of interest is selected This camera can record a sequence of pictures
containing every single X-ray pulse per picture
A major limitation of this camera is that it can not provide any information about
the energy of the incoming X-ray photons due to several conversion processes and
unlike a direct detection camera it can not be used for obtaining the energy spectrum
from a histogram of the image This type of camera is useful when the incoming
Appendixes
127
photons are monochromatic In this case the average signal from the chip can be
correlated with the average number of incoming photons
B 3 Avalanche Photodiode (APD)
Table B3 Specifications of APD Reprint from the technical
datasheet [286]
The avalanche photodiode is essentially a solid-state equivalent of PMTs
(photon-multiplier tubes) and can replace vacuum tube technology with compact
rugged silicon devices in many applications It is one of options for monitoring
diffracted X-ray signal if only the integrated signal is interesting A cooled large area
silicon avalanche photodiode produced by Laser Components which is assembled
with a homemade amplifier circuit is used for the modular setup Its specifications
and spectral response at visible light range are given in Table B3 and Fig B2
respectively
CHARACTERISTIC TEST
CONDITIONS
MIN TYP MAX UNIT
S
TO (Operating Temperature) +1 +40 degC
TS (Soldering Temperature) +240 deg C
VTEC (TEC Voltage) 43 V
ITEC (TEC Current) 2 A
P (APD Die Power Diss) 02 W
ID (Dark Current) 15 35 nA
CJ (Junction Capacitance) f = 1MHz 50 pF
λrange (Spectral Application Range) Spot Scan 350 1050 nm
R (Responsivity) λ=500nm VR=0V 35 AW
Vop (Operating Voltage) 1700 2000 V
tr (Response Time) RL=50Ωλ=675nm 12 18 nS
IQTEC (TEC Quiescent Current) Case Temp = 35degC 095 A
Appendixes
128
Fig B2 spectral response of APD at Gain = 300 Reprint from the
technical datasheet [286]
One of the advantages of this detector is that it can work at very high speed fast
enough to synchronize to the 10 Hz laser system Another advantage of APD is that it
has single photon sensitivity which allow to detecting weak signal and estimating the
number of detected photons However as a single channel detector the obvious
drawback of APD is that it gives no information on spatial resolution Shifts or
changes of profile of the Bragg peaks can not be observed with this detector during
the measurement It limits the use of the APD only in the experiments in which the
profiles of Bragg peaks do not change a lot during the laser excitation
C Sample material properties
The following relevant material parameters are used in this thesis They are
obtained from literatures WebElements (httpwwwwebelementscom) X-RAY
SERVER (httpsergeygmcaapsanlgovx0h_searchhtml) and X-ray Oriented
Programs (XOP) (httpwwwesrfeucomputingscientificxop21)
C 1 Cu
Name copper
Appendixes
129
Symbol Cu
Number 29
Standard atomic weight 63546
Electron configuration [Ar] 3d10
4s1
Electrons per shell 2 8 18 1
Density 894 gmiddotcmminus3
Crystal structure face-centered cubic
Melting point 1358 K
Specific heat capacity (25 degC) 24440 Jmiddotmolminus1
middotKminus1
Bulk modulus 140 GPa
Kα1 804778 eV λ = 154060410 Aring
Kα2 802783 eV λ = 154443266 Aring
Kβ 890529 eV λ = 139225593 Aring
Sample thickness 10microm 20 microm foil and 300nm thin film on glass substrate
C 2 Ti
Name titanium
Symbol Ti
Number 22
Standard atomic weight 47867
Electron configuration [Ar] 3d2 4s
2
Electrons per shell 2 8 10 2
Density 4506 gmiddotcmminus3
Crystal structure hexagonal
Melting point 1941 K
Specific heat capacity (25 degC) 25060 Jmiddotmolminus1
middotKminus1
Bulk modulus 110 GPa
Kα1 451084 eV λ = 274858848 Aring
Kα2 450486 eV λ = 275223711 Aring
Kβ 493181 eV λ = 251397415 Aring
Sample thickness 20 microm foil and 300nm thin film on glass substrate
C 3 Au
Name gold
Symbol Au
Number 79
Standard atomic weight 196966569
Electron configuration [Xe] 4f14
5d10
6s1
Electrons per shell 2 8 18 32 18 1
Density 1930 gmiddotcmminus3
Appendixes
130
Melting point 133733 K
Specific heat capacity (25 degC) 25418 Jmiddotmolminus1
middotKminus1
Speed of sound 324 kms (polycrystalline)
339 kms (single crystalline 111-direction)
Linear thermal expansion (25 degC) 142 micrommiddotmminus1
middotKminus1
Thermal conductivity (300 K) 318 Wmiddotmminus1
middotKminus1
Optical constants n=0181 k=5125 800 nm
Fig C1 Reflectivity of Gold at 800nm calculated from Fresnel
equations
Sample thickness 150nm on mica substrate and 200nm free standing film
Crystal structure Lattice face centered cubic
Symmetry group Cubic
Unit cell constant a = b = c = 40782 Aring
Unit cell angles α = β = γ = 90deg
X-ray wavelength 1540562 Aring
X-ray energy 8047984 keV
X-ray characteristic line Cu-K α1
Surface plane indices (1 1 1)
Appendixes
131
Fig C2 Bragg reflection of Au (333) calculated from XOP (a) P-
polarized beam and (b) S-polarized beam
Appendixes
132
Planes found 9 Planes being displayed 9
hkl Angle to surface Bragg angle Relative Intensity
xhx0()
(1 1 1) 00049 190956 824245
(1 1 3) 294962 387877 626630
(1 3 1) 294962 387877 626630
(1 3 3) 220017 554164 526226
(2 2 2) 00049 408660 610997
(3 1 1) 294962 387877 626630
(3 1 3) 220017 554164 526226
(3 3 1) 220017 554164 526226
(3 3 3) 00143 789431 460119
Table C1 Bragg angle data of Au obtained from X-RAY SERVER
C 4 Bi
Name bismuth
Symbol Bi
Number 83
Standard atomic weight 20898040
Electron configuration [Xe] 4f14
5d10
6s2 6p
3
Electrons per shell 2 8 18 32 18 5
Electrical Conductivity 867 times 105 Ωm
minus1
Density 978 gmiddotcmminus3
Melting point 5447 K
Specific heat capacity (25 degC) 2552 Jmiddotmolminus1
middotKminus1
Linear thermal expansion (25 degC) 134 micrommiddotmminus1
middotKminus1
Thermal conductivity (300 K) 797 Wmiddotmminus1
middotKminus1
Optical constants n= 28324 k= 45191 800 nm
Appendixes
133
Fig C3 Reflectivity of Bismuth at 800nm calculated from Fresnel
equations
Sample thickness 50nm on Si wafer
Crystal structure Bismuth-fcc
Symmetry group Trigonal (Rhombohedral distortion)
Unit cell constant a = b = c = 65720 Aring
Unit cell angles α = β = γ = 87570 deg
X-ray wavelength 1540562 Aring
X-ray energy 8047984 keV
X-ray characteristic line Cu-K α1
Surface plane indices (1 1 1)
Planes found 9 Planes being displayed 9
hkl Angle to surface Bragg angle Relative Intensity
xhx0()
(1 1 1) 00035 112396 682238
(1 1 3) 310515 222835 575184
(1 3 1) 310515 222835 575184
(1 3 3) 232706 296742 511918
Appendixes
134
(2 2 2) 00035 229435 695383
(3 1 1) 310515 222835 575184
(3 1 3) 232706 296742 511918
(3 3 1) 232706 296742 511918
(3 3 3) 00163 357843 462169
Table C2 Bragg angle data of Bi obtained from X-RAY SERVER
Appendixes
135
Fig C4 Bragg reflection of Bi (111) and (222) calculated from XOP
(a) and (c) P-polarized beam (b) and (d) S-polarized beam
Bibliography
136
Bibliography
[1] W C Roumlntgen ldquoOn a new kind of Rayrdquo Nature 53 274-277 (1896) translated
by A Stanton from W C Roumlntgen ldquoUumlber eine neue Art von Strahlenrdquo Sitz
ber an die med-phys Gesellschaft Wuumlrzburg (1895)
[2] C Davisson and L H Germer ldquoThe Scattering of Electrons by a Single Crystal
of Nickelrdquo Nature 119 558 (1927)
[3] G P Thomson and A Reid ldquoDiffraction of Cathode Rays by a Thin Filmrdquo
Nature 119 890 (1927)
[4] C G Shull ldquoEarly development of neutron scatteringrdquo Rev Mod Phys 67 753
(1995)
[5] D Strickland and G Mourou ldquoCompression of Amplified Chirped Optical
Pulsesrdquo Optics Communications 55 447 (1985)
[6] D Strickland and G Mourou ldquoCompression of Amplified Chirped Optical
Pulses rdquo Optics Communications 56 219 (1985)
[7] D Kuumlhlke U Herpes D von der Linde ldquoSoft x-ray emission from subpicosend
laser-produced plasmardquo Appl Phys Lett 50 1785 (1987)
[8] M M Murnane H C Kapteyn M D Rosen R W Falcone ldquoUltrafast X-ray
Pulses from Laser-Produced Plasmasrdquo Science 251 531 (1991)
[9] A Rousse P Audebert J P Geindre F Fall and J C Gauthier ldquoEfficient Kα
X-ray source from femtosecond laser-produced plasmasrdquo Phys Rev E 50 2200
(1994)
[10] J C Williamson J Cao H Ihee H Frey and A H Zewail ldquoClocking transient
chemical changes by ultrafast electron diffractionrdquo Nature 386 159 (1997)
[11] CY Ruan V A Lobastov R Srinivasan B M Goodson H Ihee and A H
Zewail ldquoUltrafast diffraction and structural dynamics The nature of complex
molecules far from equilibriumrdquo Proc National Acad Sci USA 98 7117
(2001)
[12] B J Siwick J R Dwyer R E Jordan and R J D Miller ldquoUltrafast electron
optics Propagation dynamics of femtosecond electron packetsrdquo J Appl Phys
92 1643 (2002)
[13] B J Siwick J R Dwyer R E Jordan and R J Dwayne Miller ldquoAn Atomic-
Level View of Melting Using Femtosecond Electron Diffractionrdquo Science 302
1382 (2003)
[14] R W Schoenlein S Chattopadhyay H H W Chong T E Glover P A
Heimann C V Shank A A Zholents and M S Zolotorev ldquoGeneration of
Femtosecond Pulses of Synchrotron Radiationrdquo Science 287 2237 (2000)
[15] S Khan K Holldack T Kachel R Mitzner and T Quast ldquoFemtosecond
Undulator Radiation from Sliced Electron Bunchesrdquo Phys Rev Lett 97
074801 (2006)
Bibliography
137
[16] G Ingold P Beaud S L Johnson D Grolimund V Schlott T Schmidt and A
Streun ldquoTechnical Report FEMTO A Sub-ps Tunable Hard X-ray Undulator
Source for LaserX-ray Pump-Probe Experiments at the SLSrdquo Sync Rad News
20 Issue 5 35 (2007)
[17] A L Cavalieri et al ldquoClocking Femtosecond X Raysrdquo Phys Rev Lett 94
114801 (2005)
[18] A M Lindenberg et al ldquoAtomic scale visualization of inertial dynamicsrdquo
Science 308 392 (2005)
[19] A Egbert B N Chichkov and A Ostendorf ldquoUltrashort X-ray source driven by
femtosecond laser pulsesrdquo Europhys Lett 56 228 (2001)
[20] A Egbert B Mader B Tkachenko C Fallnich B N Chichkov H Stiel and P
V Nickles ldquoHigh-repetition rate femtosecond laser-driven hard-x-ray sourcerdquo
Appl Phys Lett 81 2328 (2002)
[21] U Hinze A Egbert B Chichkov and K Eidmann ldquoGeneration of picosecond
hard-x-ray pulses in a femtosecond-laser-driven x-ray dioderdquo Optics Letters 29
2079 (2004)
[22] E Seres J Seres F Krausz C Spielmann ldquoGeneration of Coherent Soft-X-Ray
Radiation Extending Far Beyond the Titanium L Edgerdquo Phys Rev Lett 92
163002 (2004)
[23] J Seres E Seres A J Verhoef G Tempea C Streli P Wobrauschek V
Yakovlev A Scrinzi C Spielmann and F Krausz ldquoLaser technology Source
of coherent kiloelectronvolt X-raysrdquo Nature 433 596 (2005)
[24] Ch Spielmann N H Burnett S Sartania R Koppitsch M Schnuumlrer C Kan
M Lenzner P Wobrauschek F Krausz ldquoGeneration of Coherent X-rays in the
Water Window Using 5-Femtosecond Laser Pulsesrdquo Science 278 661 (1997)
[25] J Zhou J Peatross M M Murnane and H C Kapteyn ldquoEnhanced High-
Harmonic Generation Using 25 fs Laser Pulsesrdquo Phys Rev Lett 76 752
(1996)
[26] A Rousse K Ta Phuoc R Shah A Pukhov E Lefebvre V Malka S Kiselev
F Burgy J P Rousseau D Umstadter and D Hulin ldquoProduction of a keV X-
Ray Beam from Synchrotron Radiation in Relativistic Laser-Plasma
Interactionrdquo Phys Rev Lett 93 135005 (2004)
[27] V Malka J Faure Y A Gauduel E Lefebvre A Rousse and K Ta Phuoc
ldquoPrinciples and applications of compact laserndashplasma acceleratorsrdquo Nature
Physics 4 447 (2008)
[28] H-P Schlenvoigt K Haupt A Debus F Budde O Jaumlckel S Pfotenhauer H
Schwoerer E Rohwer J G Gallacher E Brunetti R P Shanks S M
Wiggins and D A Jaroszynski ldquoA compact synchrotron radiation source driven
by a laser-plasma wakefield acceleratorrdquo Nature Physics 4 130 (2008)
[29] K Nakajima ldquoCompact X-ray sources Towards a table-top free-electron laserrdquo
Nature Physics 4 92 (2008)
Bibliography
138
[30] httpwww-ssrlslacstanfordedulclsindexhtml
[31] T Ishikawa et al ldquoA compact X-ray free-electron laser emitting in the sub-
aringngstroumlm regionrdquo Nature Photon 6 540 (2012)
[32] httpwwwxfeleuXFELpresseenhintergrundwasindexhtml
[33] M Altarelli et al The European X-ray Free-electron Laser (DESY Technical
Report Hamburg Germany)
[34] S Kneip C McGuffey F Dollar M S Bloom V Chvykov G Kalintchenko
K Krushelnick A Maksimchuk S P D Mangles T Matsuoka Z Najmudin
C A J Palmer J Schreiber W Schumaker A G R Thomas and V
Yanovsky ldquoX-ray phase contrast imaging of biological specimens with
femtosecond pulses of betatron radiation from a compact laser plasma wakefield
acceleratorrdquo Appl Phys Lett 99 093701 (2011)
[35] K Ta Phuoc S CordeC Thaury V Malka A Tafzi J P GoddetR C Shah
S Sebban A Rousse ldquoAll-optical Compton gamma-ray sourcerdquo Nature
Photonics 6 308 (2012)
[36] J Ju K Svensson A Doumlpp H E Ferrari K Cassou O Neveu G Genoud F
Wojda M Burza A Persson O Lundh C-G Wahlstroumlm and B Cros
ldquoEnhancement of x-rays generated by a guided laser wakefield accelerator
inside capillary tubesrdquo Appl Phys Lett 100 191106 (2012)
[37] M Schnell A Saumlvert B Landgraf M Reuter M Nicolai O Jaumlckel C Peth T
Thiele O Jansen A Pukhov O Willi M C Kaluza and C Spielmann
ldquoBetatron radiation based measurement of the electron-beam size in a wakefield
acceleratorrdquo AIP Conf Proc 1462 231 (2011)
[38] S Corde C Thaury K Ta Phuoc A Lifschitz G Lambert J Faure O Lundh
E Benveniste A Ben-Ismail L Arantchuk A Marciniak A Stordeur P
Brijesh A Rousse A Specka and V Malka ldquoMapping the X-Ray Emission
Region in a Laser-Plasma Acceleratorrdquo Phys Rev Lett 107 215004 (2011)
[39] C Rischel A Rousse I Uschmann P A Albouy J P Geindre P Audebert J
C Gauthier E Foumlrster J L Martin and A Antonetti ldquoFemtosecond time-
resolved X-ray diffraction from laser heated organic filmsrdquo Nature 390 490
(1997)
[40] T Pfeifer C Spielmann and G Gerber ldquoFemtosecond X-ray sciencerdquo Rep
Prog Phys 96 443 (2006)
[41] M Bargheer N Zhavoronkon M Woerner and T Elsaesser ldquoRecent progress
in ultrafast X-ray diffractionrdquo Chem Phys Chem 7 783 (2006)
[42] C Rose-Petruck R Jimenez T Guo A Cavalleri C W Siders F Rksi J A
Squier B C Walker K R Wilson and C P J Barty ldquoPicosecondndash
milliaringngstroumlm lattice dynamics measured by ultrafast X-ray diffractionrdquo Nature
398 310 (1999)
Bibliography
139
[43] A H Chin R W Schoenlein T E Glover P Balling W P Leemans and C
V Shank ldquoUltrafast Structural Dynamics in InSb Probed by Time-Resolved X-
Ray Diffractionrdquo Phys Rev Lett 83 336 (1999)
[44] AM Lindenberg I Kang S L Johnson T Missalla P A Heimann Z Chang
JLarsson P H Bucksbaum H C Kapteyn H A Padmore R W Lee J S
Wark and R W Falcone ldquoTime-resolved X-ray diffraction from coherent
phonons during a laser-induced phase transitionrdquo Phys Rev Lett 84 111
(2000)
[45] A Cavalleri C W Siders F L H Brown D M Leitner C Toacuteth J A Squier
C P J Barty K R Wilson K Sokolowski-Tinten M Horn von Hoegen and
D von der Linde M Kammler ldquoAnharmonic Lattice Dynamics in Germanium
Measured with Ultrafast X-Ray Diffractionrdquo Phys Rev Lett 85 586 (2000)
[46] A Cavalleri C W Siders C Rose-Petruck R Jimenez C Toacuteth J A Squier C
PJ Barty K R Wilson K Sokolowski-Tinten M Horn-von Hoegen and D
von der Linde ldquoUltrafast x-ray measurement of laser heating in semiconductors
Parameters determining the melting thresholdrdquo Phys Rev B 63 193306 (2001)
[47] D A Reis M F DeCamp P H Bucksbaum R Clarke E Dufresne M
Hertlein R Merlin R Falcone H Kapteyn M M Murnane J Larsson Th
Missalla and J S Wark ldquoProbing impulsive strain propagation with X-Ray
pulsesrdquo Phys Rev Lett 86 3072 (2001)
[48] M F DeCamp D A Reis P H Bucksbaum B Adams J M Caraher R
Clarke C W S Conover E M Dufresne R Merlin V Stoica and J K
Wahlstrand ldquoCoherent control of pulsed X-ray beamsrdquo Nature 413 825 (2001)
[49] D von der Linde K Sokolowski-Tinten Ch Blome C Dietrich A Tarasevitch
A Cavalleri and J A Squier ldquoUltrafast extended to X-rays Femtosecond
time-resolved X-ray diffractionrdquo Z f Phys Chemie 215 1527 (2001)
[50] J Larsson A Allen P H Bucksbaum R W Falcone A Lindenberg G
Naylor T Missalla D A Reis K Scheidt A Sjoumlgren P Sondhauss M Wulff
and J SWark ldquoPicosecond X-ray diffraction studies of laser-excited acoustic
phonons in InSbrdquo Appl Phys A 75 467 (2002)
[51] O Synnergren M Harbst T Missalla J Larssona G Katona R Neutze and R
Wouts ldquoProjecting picosecond lattice dynamics through x-ray topographyrdquo
Appl Phys Lett 80 3727 (2002)
[52] A M Lindenberg I Kang S L Johnson R W Falcone P A Heimann Z
Chang R W Lee and J S Wark ldquoCoherent control of phonons probed by
time-resolved x-ray diffractionrdquo Opt Lett 27 869 (2002)
[53] M F DeCamp D A Reis A Cavalieri P H Bucksbaum R Clarke R Merlin
EM Dufresne D A Arms A M Lindenberg AG MacPhee Z Chang B
Bibliography
140
Lings J SWark and S Fahy ldquoTransient strain driven by a dense electron-hole
plasmardquo Phys Rev Lett 91 165502 (2003)
[54] M Bargheer N Zhavoronkov Y Gritsai J C Woo D S Kim M Woerner
and T Elsaesser ldquoCoherent atomic motions in a nanostructure studied by
femtosecond X-ray diffractionrdquo Science 306 1771 (2004)
[55] M F DeCamp D A Reis D M Fritz P H Bucksbaum E M Dufresneb and
Roy Clarke ldquoX-ray synchrotron studies of ultrafast crystalline dynamicsrdquo J
Synchrotron Rad 12 177 (2005)
[56] S H Lee A L Cavalieri D M Fritz M C Swan R S Hegde M Reason R
S Goldman and D A Reis ldquoGeneration and propagation of a picosecond
acoustic pulse at a buried interface Time-resolved X-ray diffraction
measurementsrdquo Phys Rev Lett 95 246104 (2005)
[57] Y Hayashi Y Tanaka T Kirimura N Tsukuda E Kuramoto and T Ishikawa
ldquoAcoustic pulse echoes probed with time-resolved X-ray triple-crystal
diffractometryrdquo Phys Rev Lett 96 115505 (2006)
[58] C V Korff Schmising M Bargheer M Kiel N Zhavoronkov MWoerner T
Elsaesser I Vrejoiu D Hesse and M Alexe ldquoStrain propagation in
nanolayered perovskites probed by ultrafast x-ray diffractionrdquo Phys Rev B 73
212202 (2006)
[59] A Morak T Kaumlmpfer I Uschmann A Luumlbcke E Foumlrster and R Sauerbrey
ldquoAcoustic phonons in InSb probed by time-resolved x-ray diffractionrdquo Phys
Stat Sol b 243 2728 (2006)
[60] H Enquist H Navirian T N Hansen A M Lindenberg P Sondhauss
OSynnergren J SWark and J Larsson ldquoLarge Acoustic Transients Induced
by Nonthermal Melting of InSbrdquo Phys Rev Lett 98 225502 (2007)
[61] M Nicoul U Shymanovich A Tarasevitch D von der Linde and K
Sokolowski-Tinten ldquoPicosecond acoustic response of a laser-heated Gold-film
studied with time-resolved X-ray diffractionrdquo Appl Phys Lett 98 191902
(2011)
[62] R Shayduk H Navirian W Leitenberger J Goldshteyn I Vrejoiu M
Weinelt P Gaal M Herzog C v Korff Schmising and M Bargheer
ldquoNanoscale heat transport studied by high-resolution time-resolved x-ray
diffractionrdquo New Journal of Physics 13 093032 (2011)
[63] M Herzog D Schick W Leitenberger R Shayduk R M van der Veen C J
Milne S L Johnson I Vrejoiu and M Bargheer ldquoTailoring interference and
nonlinear manipulation of femtosecond x-raysrdquo New Journal of Physics 14
013004 (2012)
[64] M Herzog D Schick P Gaal R Shayduk C v Korff Schmising M Bargheer
ldquoAnalysis of ultrafast X-ray diffraction data in a linear-chain model of the
lattice dynamicsrdquo Appl Phys A 106 489 (2012)
Bibliography
141
[65] M Herzog A Bojahr J Goldshteyn W Leitenberger I Vrejoiu D Khakhulin
M Wulff R Shayduk P Gaal and M Bargheer ldquoDetecting optically
synthesized quasi-monochromatic sub-terahertz phonon wavepackets by
ultrafast x-ray diffractionrdquo Appl Phys Lett 100 094101 (2012)
[66] C V Korff Schmising A Harpoeth N Zhavoronkov M Woerner T
Elsaesser M Bargheer M Schmidbauer I Vrejoiu D Hesse and M Alexe
ldquoFemtosecond X-ray diffraction from nanolayered oxidesrdquo Physics Procedia
3333 (2010)
[67] S L Johnson P Beaud E Vorobeva C J Milne EacuteD Murray S Fahy and G
Ingold ldquoNon-equilibrium phonon dynamics studied by grazing-incidence
femtosecond X-ray crystallographyrdquo Acta Cryst A 66 157 (2010)
[68] K Sokolowski-Tinten C Blome J Blums A Cavalleri C Dietrich A
Tarasevitch I Uschmann E Foumlrster M Kammler M Horn-von Hoegen and D
von der Linde ldquoFemtosecond X-ray measurement of coherent lattice vibrations
near the Lindemann stability limitrdquo Nature 422 287 (2003)
[69] D M Fritz et al ldquoUltrafast bond softening in Bismuth Mapping a solids
interatomic potential with X-raysrdquo Science 315 633 (2007)
[70] M Bargheer N Zhavoronkov J C Woo D S Kim M Woerner and T
ElsaesserldquoExcitation mechanisms of coherent phonons unravelled by
femtosecond X-ray diffractionrdquo Phys Stat Sol (b) 243 2389 (2006)
[71] C von Korff Schmising M Bargheer M Kiel N Zhavoronkov M Woerner
TElsaesser I Vrejoiu D Hesse and M Alexe ldquoAccurate time delay
determination for femtosecond X-ray diffraction experimentsrdquo Appl Phys B 88
1 (2007)
[72] B Freyer J Stingl F Zamponi M Woerner and T Elsaesser ldquoThe rotating-
crystal method in femtosecond X-ray diffractionrdquo Optics Express 19 15506
(2011)
[73] S L Johnson P Beaud C J Milne F S Krasniqi E S Zijlstra M E Garcia
M Kaiser D Grolimund R Abela and G Ingold ldquoNanoscale Depth-Resolved
Coherent Femtosecond Motion in Laser-Excited Bismuthrdquo Phys Rev Lett 100
155501 (2008)
[74] K H Bennemann ldquoUltrafast dynamics in solidsrdquo J Phys Condens Matter 16
R995 (2004)
[75] C W Siders A Cavalleri K Sokolowski-Tinten Cs Toacuteth T Guo M
Kammler M Horn von Hoegen K R Wilson D von der Linde and C P J
Barty ldquoDetection of Nonthermal Melting by Ultrafast X-ray Diffractionrdquo
Science 286 1340 (1999)
[76] K Sokolowski-Tinten C Blome C Dietrich A TarasevitchM Horn-von
Hoegen D von der Linde A Cavalleri J Squier and M Kammler
Bibliography
142
ldquoFemtosecond X-ray measurement of ultrafast melting and large acoustic
transientsrdquo Phys Rev Lett 87 225701 (2001)
[77] T Feurer A Morak I Uschmann Ch Ziener H Schwoerer Ch Reich P
Gibbon E Foumlrster R Sauerbrey K Ortner and C R Becker ldquoFemtosecond
silicon Kα pulses from laser-produced plasmasrdquo Phys Rev E 65 016412
(2001)
[78] A Rousse C Rischel S Fourmaux I Uschmann S Sebban G Grillon P
Balcou E Foumlrster J P Geindre P Audebert J C Gauthier and D Hulin
ldquoNon-thermal melting in semiconductors measured at femtosecond resolutionrdquo
Nature 410 65 (2001)
[79] K J Gaffney et al ldquoObservation of Structural Anisotropy and the Onset of
Liquidlike Motion During the Nonthermal Melting of InSbrdquo Phys Rev Lett
95 125701 (2005)
[80] P B Hillyard et al ldquoCarrier-density-dependent lattice stability in InSbrdquo Phys
RevLett 98 125501 (2007)
[81] G Sciaini M Harb S G Kruglik T Payer C T Hebeisen F -J Meyer zu
Heringdorf M Yamaguchi M Horn von Hoegen R Ernstorfer and R J D
Miller ldquoElectronic acceleration of atomic motions and disordering in bismuthrdquo
Nature 458 56 (2009)
[82] E Collet et al ldquoLaser-Induced Ferroelectric Structural Order in an Organic
Charge-Transfer Crystalrdquo Science 300 612 (2003)
[83] A Cavalleri S Wall C Simpson E Statz D W Ward K A Nelson M Rini
R W Schoenlein ldquoTracking the motion of charges in a terahertz light field by
femtosecond X-ray diffractionrdquo Nature 442 664 (2006)
[84] SK Streiffer JA Eastman DD Fong C Thompson A Munkholm MV
Ramana Murty O Auciello GR Bai GB Stephenson ldquoObservation of
nanoscale 180 deg stripe domains in ferroelectric PbTiO3 thin filmsrdquo Phys Rev
Lett 89 067601 (2002)
[85] RV Wang DD Fong F Jiang MJ Highland PH Fuoss C Thompson A
M Kolpak J A Eastman S K Streiffer A M Rappe and G B Stephenson
ldquoReversible chemical switching of a ferroelectric filmrdquo Phys Rev Lett 102
047601 (2009)
[86] M Woerner C v Korff Schmising M Bargheer N Zhavoronkov I Vrejoiu
D Hesse M Alexe and T Elsaesser ldquoUltrafast structural dynamics of
perovskite superlatticesrdquo Applied Physics A 96 83 (2009)
[87] D Daranciang M J Highland H Wen et al ldquoUltrafast photovoltaic response
in ferroelectric nanolayersrdquo Phys Rev Lett 108 087601 (2012)
[88] I Radu C Stamm N Pontius T Kachel P Ramm J-U Thiele H A Duumlrr
and C H Back ldquoLaser-induced generation and quenching of magnetization on
FeRh studied with time-resolved x-ray magnetic circular dichroismrdquo Phys Rev
B 81 104415 (2010)
Bibliography
143
[89] U Shymanovich F Quirin M Vattilana W Lu M Nicoul A-E El-Kamhawy
A Tarasevitch D von der Linde K Sokolowski-Tinten ldquoUltrafast lattice
dynamics in FeRh during a laser-induced magnetic phase transitionrdquo Ultrafast
Phenomena XVII Oxford University Press (2011)
[90] C Stamm T Kachel N Pontius R Mitzner T Quast K Holldack S Khan C
Lupulescu E F Aziz M Wietstruk H A Duumlrr and W Eberhardt
ldquoFemtosecond modification of electron localization and transfer of angular
momentum in nickelrdquo Nature Materials 6 740 (2007)
[91] C Stamm J-U Thiele T Kachel I Radu P Ramm M Kosuth J Minaacuter H
Ebert H A Duumlrr W Eberhardt and C H Back ldquoAntiferromagnetic-
ferromagnetic phase transition in FeRh probed by x-ray magnetic circular
dichroismrdquo Phys Rev B 77 184401 (2008)
[92] M Wietstruk A Melnikov Ch Stamm T Kachel N Pontius M Sultan C
Gahl MWeinelt H A Duumlrr U Bovensiepen ldquoHot electron driven
enhancement of spin-lattice coupling in 4f ferromagnets observed by
femtosecond x-ray magnetic circular dichroismrdquo Phys Rev Lett 106 127401
(2011)
[93] C Boeglin E Beaurepaire V Halteacute V Loacutepez-Flores C Stamm N Pontius H
A Duumlrr and J-Y Bigo ldquoDistinguishing the ultrafast dynamics of spin and
orbital moments in solidsrdquo Nature 465 458 (2010)
[94] C Stamm N Pontius T Kachel M Wietstruk and H A Duumlrr ldquoFemtosecond
x-ray absorption spectroscopy of spin and orbital angular momentum in
photoexcited Ni films during ultrafast demagnetizationldquo Phys Rev B 81
104425 (2010)
[95] H A Duumlrr ldquoFemtosecond electron and spin dynamics in ferromagnetic Ni
probed by UV and soft X-ray pulsesldquo Nucl Instr and Meth A 601 132 (2009)
[96] J Miguel J Saacutenchez-Barriga D Bayer J Kurde B Heitkamp M Piantek F Kronast
M Aeschlimann H A Duumlrr and W Kuch ldquoTime-resolved magnetization
dynamics of cross-tie domain walls in permalloy microstructuresrdquo J Phys
Condens Matter 21 496001 (2009)
[97] T Kachel N Pontius C Stamm M Wietstruk E F Aziz H A Duumlrr W
Eberhardt and F M F de Groot ldquoTransient electronic and magnetic structures
of nickel heated by ultrafast laser pulsesrdquo Phys Rev B 80 092404 (2009)
[98] H A Duumlrr C Stamm T Kachel N Pontius R Mitzner T Quast K
Holldack S Khan C Lupulescu EF Aziz M Wietstruk W Eberhardt
ldquoUltrafast Electron and Spin Dynamics in Nickel Probed With Femtosecond X-
Ray Pulsesrdquo IEEE Trans Magn 44 1957 (2008)
[99] S L Johnson et al ldquoFemtosecond Dynamics of the Collinear-to-Spiral
Antiferromagnetic Phase Transition in CuOrdquo Phys Rev Lett 108 037203
(2012)
Bibliography
144
[100] K A Seu S Roy J J Turner S Park C M Falco and S D Kevan ldquoCone
phase and magnetization fluctuations in AuCoAu thin films near the spin-
reorientation transitionrdquo Phys Rev B 82 012404 (2010)
[101] I Radu K Vahaplar C Stamm T Kachel N Pontius H A Duumlrr T A
Ostler J Barker R F L Evans R W Chantrell A Tsukamoto A Itoh A
Kirilyuk Th Rasing and A V Kimel ldquoTransient ferromagnetic-like state
mediating ultrafast reversal of antiferromagnetically coupled spinsrdquo Nature
472 205 (2011)
[102] K Holldack N Pontius E Schierle T Kachel V Soltwisch R Mitzner T
Quast G Springholz and E Weschke ldquoUltrafast dynamics of
antiferromagnetic order studied by femtosecond resonant soft x-ray diffractionrdquo
Appl Phys Lett 97 062502 (2010)
[103] A Kirilyuk A Kimel and T Rasing ldquoUltrafast optical manipulation of
magnetic orderrdquo Rev Mod Phys 82 2731 (2010)
[104] F Quirin M Vattilana U Shymanovich A-E El-Kamhawy A Tarasevitch
J Hohlfeld D von der Linde and K Sokolowski-Tinten ldquoStructural dynamics
in FeRh during a laser-induced metamagnetic phase transitionrdquo Phys Rev
B 85 020103(R) (2012)
[105] U Shymanovich M Nicoul W Lu S Kaumlhle A Tarasevitch K Sokolowski-
Tinten and D von der Linde ldquoTowards ultrafast time-resolved Debye-Scherrer
Xray diffraction using a laser-plasma sourcerdquo Rev Sci Instrum 80 083102
(2009)
[106] F Zamponi Z Ansari M Woerner and T Elsaesser ldquoFemtosecond powder
diffraction with a laser-driven hard X-ray sourcerdquo Optics Express 18 947
(2010)
[107] F Zamponi Z Ansari C v Korff Schmising P Rothhardt N Zhavoronkov
M Woerner T Elsaesser M Bargheer T Trobitzsch-Ryll and M Haschke
ldquoFemtosecond hard X-ray plasma sources with a kilohertz repetition raterdquo Appl
Phys A 96 51 (2009)
[108] J Stingl F Zamponi B Freyer M Woerner T Elsaesser and A Borgschulte
ldquoStrong-field electron transfer in a virtual quantum state mapped by
femtosecond x-ray diffractionrdquo Phys Rev Lett 109 147402 (2012)
[109] M J J Vrakking and T Elsaesser ldquoX-rays inspire electron moviesrdquo Nature
Photon 6 645 (2012)
[110] F Zamponi J Stingl M Woerner and T Elsaesser ldquoUltrafast soft-mode
driven charge relocation in an ionic crystalrdquo Physical Chemistry Chemical
Physics (PCCP) 14 6156 (2012)
[111] M Trigo J Chen V H Vishwanath Y M Sheu T Graber R Henning and
D A Reis ldquoImaging nonequilibrium atomic vibrations with x-ray diffuse
scatteringrdquo Physical Review B 82 235205(2010)
Bibliography
145
[112] A M Lindenberg et al ldquoX-Ray Diffuse Scattering Measurements of
Nucleation Dynamics at Femtosecond Resolutionrdquo Phys Rev Lett 100
135502 (2008)
[113] M Born and E Wolf Principles of optics Cambridge University Press (1988)
[114] G Jenke ldquoErzeugung von XUV- und Roumlntgenstralung mit Femtosecunden-
Laserimpulsenrdquo Dissertation (1999)
[115] Z Jiang J C Kieffer J P Matte M Chaker O Peyrusse D Gilles GKorn
A Maksimchuk S Coe and G Mourou ldquoX-ray spectroscopy of hot solid
density plasmas produced by subpicosecond high contrast laser pulses at 1018
ndash
1019
Wcm2rdquoPhys Plasmas 2 1702 (1995)
[116] F Brunel ldquoNot-So Resonant Resonant Absorptionrdquo Phys Rev Lett 59 52
(1987)
[117] S C Wilks and W L Kruer ldquoAbsorption of ultrashort ultra-intense laser light
by solids and overdense plasmasrdquo IEEE J Quan Electron 33 1954 (1997)
[118] S Bastiani A Rousse J P Geindre P Audebert C Quoix G Hamoniaux A
Antonettia and J C Gauthier ldquoExperimental study of the interaction of
subpicosecond laser pulses with solid targets of varying initial scale lengthsrdquo
Phys Rev E 56 7179 (1997)
[119] P Gibbon E Foumlrster ldquoShort-pulse laser-plasma interactionsrdquo Plasma Phys
Control Fusion 38 769 (1996)
[120] T Feurer A Morak I Uschmann Ch Ziener H Schwoumlrer E Foumlrster and R
Sauerbrey ldquoAn incoherent sub-picosecond X-ray source for time-resolved X-
ray-diffraction experimentsrdquo Appl Phys B Lasers Opt 72 15 (2001)
[121] C Reich P Gibbon I Uschmann and E Foumlrster ldquoYield optimization and time
structure of femtosecond laser plasma Kα sourcesrdquo Phys Rev Lett 84 4846
(2000)
[122] T Guo Ch Spielmann B C Walker C P J Barthy ldquoGeneration of hard X-
rays by ultrafast terawatt lasersrdquo Rev Sci Instr 72 41 (2001)
[123] R Fedosejevs R Ottmann R Sigel G Kuumlhnle S Szatmaacuteri F P Schaumlfer
ldquoAbsorption of subpicosecond ultraviolet laser pulses in high-density plasmardquo
ApplPhyB 50 79 (1990)
[124] C A Quarles ldquoSemiempirical analysis of electron-induced K-shell ionizationrdquo
Phys Rev A 13 1278 (1976)
[125] W E Burcham Elements of Nuclear Physics Pearson (1979)
[126] E Casnati A Tartari and C Baraldi ldquoAn empirical approach to K-shell ionisation
cross section by electronsrdquo J Phys B 15 155 (1982)
[127] P Gibbon A Andreev E Lefebvre G Bonnaud H Ruhl J Delettrez and A
R Bell ldquoCalibration of one-dimensional boosted kinetic codes for modeling
high-intensity laserndashsolid interactionsrdquo Phys Plasmas 6 947 (1999)
Bibliography
146
[128] DC Joy Monte Carlo Modeling for Electron Microscopy and Microanalysis
Oxford University Press Oxford (1995)
[129] D Salzmann Ch Reich I Uschmann E Foumlrster PGibbon ldquoTheory of Kα
generation by femtosecond laser-produced hot electrons in thin foilsrdquo Phys
Rev E 65 036402 (2002)
[130] F Y Khattak O A M B Percie du Sert D Riley P S Foster E J Divall C
J Hooker A J Langley J Smith and P Gibbon ldquoComparison of experimental
and simulated Kα yield for 400 nm ultrashort pulse laser irradiationrdquo Phys Rev
E 74 027401 (2006)
[131] P Gibbon and A R Bell ldquoCollisionless Absorption in Sharp-Edged Plasmasrdquo
Phys Rev Lett 68 1535 (1992)
[132] D D Meyerhofer H Chen J A Delettrez B Soom S Uchida and B Yaakobi
ldquoResonance absorption in high-intensity contrast picosecond laser-plasma
interactionsrdquo Phys Fluids B 5 2584 (1993)
[133] U Teubner W Theobald and C Wuumllker ldquoMechanisms and origin of
continuum and line emission from carbon plasmas produced by ultrashort laser
pulsesrdquo J Phys B 29 4333 (1996)
[134] M Schnuumlrer M P Kalashnikov P V Nickles Th Schlegel W Sandner N
Demchenko R Nolte and P Ambrosi ldquoHard x‐ray emission from intense short
pulse laser plasmasrdquo Phys Plasmas 2 3106 (1995)
[135] J D Kmetec C L Gordon III J J Macklin B E Lemoff G S Brown and
S E Harris ldquoMeV x-ray generation with a femtosecond laserrdquo Phys Rev Lett
68 1527 (1992)
[136] A P Fews P A Norreys F N Beg A R Bell A E Dangor C N Danson
P Lee and S J Rose ldquoPlasma Ion Emission from High Intensity Picosecond
Laser Pulse Interactions with Solid Targetsrdquo Phys Rev Lett 73 1801 (1994)
[137] D C Eder G Pretzler E Fill K Eidmann and A Saemann ldquoSpatial
characteristics of Kα radiation from weakly relativistic laser plasmasrdquo Appl
Phys B Lasers Opt 70 211 (2000)
[138] S Backus C G Durfee M M Murnane and H C Kapteyn ldquoHigh power
ultrafast lasersrdquo Rev Sci Instrum 69 1207 (1998)
[139] K Lobov ldquoHigh order harmonic generation at relativistic laser intensitiesrdquo
Dissertation (2008)
[140] U Shymanovich ldquoDirect observation of ultrafast atomic motion using time-
resolved X-ray diffractionrdquo Dissertation (2007)
[141] F Scholze H Henneken P Kuschnerus H Rabus M Richter G Ulm
ldquoDetermination of the electronndashhole pair creation energy for semiconductors
from the spectral responsivity of photodiodesrdquo Nuclear Instruments and
Methods in Physics Research A 439 208 (2000)
Bibliography
147
[142] F Zamponi T Kaumlmpfer A Morak I Uschmann and E Foumlrster
ldquoCharacterization of a deep depletion back-illuminated charge-coupled device
in the x-ray rangerdquo Rev Sci Instrum 76 116101 (2005)
[143] The quantum efficiency of the CCD was calibrated with a Si reference detector
[144] D W Forslund J M Kindel and K Lee ldquoTheory of Hot-Electron Spectra at
High Laser Intensityrdquo Phys Rev Lett 39 284 (1977)
[145] W L Kruer and K Estabrook ldquoLaser light absorption due to self‐generated
magnetic fieldsrdquo Phys Fluids 20 1688 (1977)
[146] N H Burnett G D Enright A Avery A Loen and J C Kieffer ldquoTime-
resolved Kα spectra in high-intensity laser-target interactionrdquo Phys Rev A 29
2294 (1984)
[147] W L Kruer The Physics of Laser Plasma Interaction Addison-Wesley (1988)
[148] N Zhavoronkov Y Gritsai M Bargheer M Woerner and T Elsaesser
ldquoGeneration of ultrashort Kα radiation from quasipoint interaction area of
femtosecond pulses with thin foilsrdquo Appl Phys Lett 86 244107 (2005)
[149] F Ewald H Schwoerer and R Sauerbrey ldquoKα-radiation from relativistic laser-
produced plasmasrdquo Europhys Lett 60 710 (2002)
[150] A Zhidkov A Sasaki T Utsumi I Fukumoto T Tajima F Saito Y
Hironaka K G Nakamura K I Kondo and M Yoshida ldquoPrepulse effects on
the interaction of intense femtosecond laser pulses with high-Z solidsrdquo Phys
Rev E 62 7232 (2000)
[151] F Y Khattak E Garcia Saiz T Dzelzainis D Riley and Z Zhai ldquoScale-
length optimizing of short pulse Cu Kα laser-plasma sourcesrdquo Appl Phys Lett
90 081502 (2007)
[152] Ch Reich I Uschmann F Ewald S Duumlsterer A Luumlbcke H Schwoerer R
Sauerbrey E Foumlrster and P Gibbon ldquoSpatial characteristics of Kα x-ray
emission from relativistic femtosecond laser plasmasrdquo Phys Rev E 68 056408
(2003)
[153] K Sokolowski-Tinten C Blome J Blums A Cavalleri C Dietrich A
Tarasevitch and D von der Linde ldquoUltrafast Time-Resolved X-ray
Diffractionrdquo AIP Conf Proc 634 11 (2002)
[154] N Zhavoronkov Y Gritsai M Bargheer M Woerner T Elsaesser F
Zamponi I Uschmann and E Forster ldquoUltrafast Optics - Microfocus Cu Kα
source for femtosecond x-ray sciencerdquo Optics Letters 30 1737 (2005)
[155] Bixue Hou James Easter Karl Krushelnick and John A Nees ldquo Generation of
hard x rays by femtosecond laser pulse interaction with Cu in laminar helium
flow in ambient airrdquo Appl Phys Lett 92 161501 (2008)
[156] Ch Ziener I Uschmann G Stobrawa Ch Reich P Gibbon T Feurer A
Morak S Duumlsterer H Schwoerer E Foumlrster and R Sauerbrey ldquoOptimization
of Kα bursts for photon energies between 17 and 7 keV produced by
Bibliography
148
femtosecond-laser-produced plasmas of different scale lengthrdquo Phys Rev E 65
066411 (2002)
[157] U Teubner J Bergmann B van Wonterghem F P Schaumlfer and R Sauerbrey
ldquoAngle-dependent x-ray emission and resonance absorption in a laser-produced
plasma generated by a high intensity ultrashort pulserdquo Phys Rev Lett 70 794
(1993)
[158] U Teubner P Gibbon E Foumlrster F Falliegraves P Audebert J P Geindre and J
C Gauthier ldquoSubpicosecond KrF‐laser plasma interaction at intensities
between 1014
and 1017
Wcm2rdquo Phys Plasmas 3 2679 (1996)
[159] J F Liu W Yu and L J Qian ldquoCharge Displacement in Ultraintense Laser-
Plasma Interactionrdquo Physica Scripta 72 243 (2005)
[160] T P Hughes Plasma and Laser Light Adam Hilger (1975)
[161] Y T Lee R A London G B Zimmerman and P L Hagelstein ldquoApplication
of escape probability to line transfer in laser‐produced plasmasrdquo Phys Fluids B
2 2731 (1990)
[162] A K Sharma R K Thareja ldquoPlume dynamics of laser-produced aluminum
plasma in ambient nitrogenrdquo Applied Surface Science 243 68 (2005)
[163] H Nakano T Nishikawa and N Uesugi ldquoEnhanced K-shell x-ray line
emissions from aluminum plasma created by a pair of femtosecond laser pulsesrdquo
Appl Phys Lett79 24 (2001)
[164] H Ahn H Nakano T Nishikawa and N Uesugi ldquoSimultaneous Measurement
of Absorption and X-Ray Emission from Preformed Plasma Generated by
Ultrashort Prepulseldquo Jpn J Appl Phys 35 L154 (1996)
[165] T Feurer ldquoFeedback-controlled optimization of soft-X-ray radiation from
femtosecond laser-produced plasmasrdquo Appl Phys B Lasers Opt 68 55 (1999)
[166] U Teubner G Kuumlhnle and F P Schaumlfer ldquoDetailed study of the effect of a
short prepulse on soft X-ray spectra generated by a high-intensity KrF laser
pulserdquo Appl Phys B 54 493 (1992)
[167] Th Schlegel S Bastiani L Gregravemillet J-P Geindre P Audebert J-C
Gauthier E Lebebvre G Bonnaud and J Delettrez ldquoComparison of measured
and calculated x-ray and hot-electron production in short-pulse laser-solid
interactions at moderate intensitiesrdquo Phys Rev E 60 2209 (1999)
[168] A Schmitt R S B Ong ldquoThe effect of collisions on wave-breaking in a cold
plasmardquo Appl Phys 22333 (1980)
[169] J P Freidberg R W Mitchell R L Morse and L I Rudsinski ldquoResonant
Absorption of Laser Light by Plasma Targetsrdquo Phys Rev Lett 28 795 (1972)
[170] M Abramowitz and I Stegun Handbook of Mathematical functions National
Bureau of Standards (1964)
[171] A Tarasevitch A Orisch D von der Linde Ph Balcou G Rey J -P
Chambaret U Teubner D Kloumlpfel and W Theobald ldquoGeneration of high-
Bibliography
149
order spatially coherent harmonics from solid targets by femtosecond laser
pulsesrdquo Phys Rev A 62 023816 (2000)
[172] H-S Park D M Chambers H -K Chung R J Clarke et al ldquoHigh-energy
Kα radiography using high-intensity short-pulse lasersrdquo Phys Plasmas 13
056309 (2006)
[173] P P Rajeev S Banerjee A S Sandhu R C Issac L C Tribedi and G R
Kumar ldquoRole of surface roughness in hard-x-ray emission from femtosecond-
laser-produced copper plasmasrdquo Phys Rev A 65 052903 (2002)
[174] R Rix ldquoAbsorption intensiver ultrakurzer Laserpulse an Festkoumlrpertargetsrdquo
Diplomarbeit Max-Planck-Institut Fuumlr Quantenoptik Garching Germany
(1999)
[175] U Teubner I Uschmann P Gibbon D Altenbernd E Foumlrster T Feurer W
Theobald R Sauerbrey G Hirst M H Key J Lister and D Neely
ldquoAbsorption and hot electron production by high intensity femtosecond uv-laser
pulses in solid targetsrdquo Phys Rev E 54 4167 (1996)
[176] P Gibbon M Mašek U Teubner W Lu M Nicoul U Shymanovich A
Tarasevitch P Zhou K Sokolowski-Tinten and D von der Linde ldquoModelling
and optimisation of fs laser-produced Kα sourcesrdquo Appl Phys A 96 23 (2009)
[177] J M Dawson ldquoParticle simulation of plasmasrdquo Rev Mod Phys 55 403
(1983)
[178] T Tajima Computational Plasma Physics with Applications to Fusion and
Astrophysics AddisonndashWesley (1989)
[179] C K Birdsall and A B Langdon Plasma Physics via Computer simulations
IOP Publishing Ltd Bristol U K (1991)
[180] H L Anderson ldquoMetropolis Monte Carlo and the MANIACrdquo Los Alamos
Science 14 96 (1986)
[181] W Lu M Nicoul U Shymanovich A Tarasevitch P Zhou K Sokolowski-
Tinten D von der Linde M Mašek P Gibbon and U Teubner ldquoOptimized
Kα X-ray flashes from femtosecond-laser irradiated foilsrdquo Phys Rev E 80
026404 (2009)
[182] D Riley J J Angulo-Gareta F Y Khattak M J Lamb P S Foster E J
Divall C J Hooker A J Langley R J Clarke and D Neely ldquoKα yields from
Ti foils irradiated with ultrashort laser pulsesrdquo Phys Rev E 71 016406 (2005)
[183] International Commission on Radiation Units amp Measurements Report No 37
unpublished (1984)
[184] httpphysicsnistgovPhysRefDataXrayMassCoefcoverhtml
[185] C Rulliere Femtosecond Laser Pulses Principles and Experiments 2nd ed
Springer (2004)
[186] M Nicoul ldquoTime-resolved X-ray diffraction with accelerator- and laser-
plasma-based X-ray sourcesrdquo Dissertation (2010)
Bibliography
150
[187] A Ruhl ldquoErzeugung intensiver Roumlntgenimpulse mit einem Bandtargetrdquo
Diplomarbeit (2006)
[188] M Montel ldquoAberrations du Premier Ordre des Systegravemes Catoptriques
Asymeacutetriques Application au Microscope X agrave Reacuteflexion Totalerdquo Optica Acta 1
117 (1954)
[189] httpwwwcxrolblgov
[190] L M P Fernandes F D Amaro A Antognini J M R Cardoso C A N
Conde O Huot P E Knowles F Kottmann J A M Lopes L Ludhova C
M B Monteiro F Mulhauser R Pohl J M F dos Santos L A Schaller D
Taqqud and J F C A Velosoe ldquoCharacterization of large area avalanche
photodiodes in X-ray and VUV-light detectionrdquo Journal of Instrumentation
(JINST) 2 08005 (2007)
[191] L M P Fernandes J A M Lopes J M F dos Santos P E Knowles L
Ludhova F Mulhauser F Kottmann R Pohl D Taqqu ldquoLAAPD low
temperature performance in X-ray and visible-light detectionrdquo IEEE
Transactions on Nuclear Science 51 1575 (2004)
[192] httpwwwcaenitjspTemplate2CaenProdjspparent=9ampidmod=409
[193] W Demtroumlder Laser Spectroscopy Basic Concepts and Instrumentation 2nd
Edition Springer-Verlag (1996)
[194] J Chesnoy and A Mokhtari Resonant impulsive-stimulated Raman-scattering
on Malachite Green Phys Rev A 38 3566 (1988)
[195] A Tokmakoff B Sauter and M D Fayer ldquoTemperature‐dependent
vibrational relaxation in polyatomic liquids Picosecond infrared pumpndashprobe
experimentsrdquo J Chem Phys 100 9035 (1994)
[196] S Ghosh and B M Arora ldquoPhotoreflectance spectroscopy with white light
pump beamrdquo Rev Sci Instrum 69 1261 (1998)
[197] R C Stanley ldquoCounting statistics in X-ray spectroscopyrdquo Br J Appl Phys 12
503 (1961)
[198] D Laundy and S Collins ldquoCounting statistics of X-ray detectors at high
counting ratesrdquo J Synchrotron Rad 10 214 (2003)
[199] G C Cho W Kuumltt and H Kurz ldquoSubpicosecond time-resolved coherent-
phonon oscillations in GaAsrdquo Phys Rev Lett 65 764 (1990)
[200] S I Anisimov B L Kapeliovich T L Perelman ldquoElectron emission from
metal surfaces exposed to ultrashort laser pulsesrdquo Sov Phys JETP 39 375
(1974)
[201] M Ligges I Rajkovic P Zhou O Posth C Hassel G Dumpich D von der
Linde ldquoObservation of ultrafast lattice heating using time reolved electron
diffractionrdquo Appl Phys Lett 94 101910 (2009)
Bibliography
151
[202] P Chen I V Tomov and P M Rentzepis ldquoTime resolved heat propagation in
a gold crystal by means of picosecondx-ray diffractionrdquo J Chem Phys 104
10001 (1996)
[203] A A Maznev J Hohlfeld and J Guumldde ldquoSurface thermal expansion of metal
under femtosecond laser irradiationrdquo J Appl Phys 82 5082 (1997)
[204] A Plech S Kuumlrbitz K -J Berg H Graener G Berg S Greacutesillon M Kaempfe J
Feldmann M Wulff and G von Plessen ldquoTime-resolved X-ray diffraction on
laser-excited metal nanoparticlesrdquo Europhys Lett 61 762 (2003)
[205] J Chen H Zhang I V Tomov and P M Rentzepis ldquoLaser Induced Transient
Structures in a 150 nm Gold Crystalrdquo Journal of the chinese chemical society
54 1619 (2007)
[206] P Musumeci J T Moody C M Scoby M S Gutierrez and M Westfall
ldquoLaser-induced melting of a single crystal gold sample by time-resolved
ultrafast relativistic electron diffractionrdquo Appl Phys Lett 97 063502 (2010)
[207] R Ernstorfer M Harb T Dartigalongue C T Hebeisen R E Jordan L Zhu
and R J D Miller ldquoFemtosecond Electron Diffraction Study on the Heating
and Melting Dynamics of Goldrdquo Springer Series in Chemical Physics 88 755
(2007)
[208] R Ernstorfer M Harb C T Hebeisen G Sciaini T Dartigalongue I
Rajkovic M Ligges D von der Linde Th Payer and M Horn-von-Hoegen F
-J Meyer zu Heringdorf S G Kruglik and R J D Miller ldquoAtomic view of the
photoinduced collapse of gold and bismuthrdquo Springer Series in Chemical
Physics 92 113 (2009)
[209] httpwwwphasisch
[210] E D Palik (Author Editor) Handbook of Optical Constants of Solids
Academic Press (1985)
[211] J Hohlfeld J G Muumlller S -S Wellershoff and E Matthias ldquoTime-resolved
thermoreflectivity of thin gold films and its dependence on film thicknessrdquo
Appl Phys B 64 387 (1997)
[212] T Juhasz H E Elsayed-Ali G O Smith C Suaacuterez and W E Bron ldquoDirect
measurements of the transport of nonequilibrium electrons in gold films with
different crystal structuresrdquo Phys Rev B 48 15488 (1993)
[213] S D Brorson J G Fujimoto and E P Ippen ldquoFemtosecond electronic heat-
transport dynamics in thin gold filmsrdquo Phys Rev Lett 59 1962 (1987)
[214] P Debye Interferenz von Roumlntgenstrahlen und Waumlrmebewegung Ann d
Phys 348 49 (1913)
[215] I Waller ldquoZur Frage der Einwirkung der Waumlrmebewegung auf die Interferenz
von Roumlntgenstrahlenrdquo Zeitschrift fuumlr Physik A Hadrons and Nuclei 17 398
(1923)
[216] C Kittel Introduction to solid state physics 6th ed Wiley New York (1986)
Bibliography
152
[217] G Busch and H Schade Lectures on solid state physics Pergamon Press
(1976)
[218] B C Larson J Z Tischler and D M Mills ldquoNanosecond resolution
timeresolved x-ray study of silicon during pulsed-laser irradiationrdquo Journal of
Materials Research 1 144 (1986)
[219] S K Allison ldquoThe Natural Widths of the Kα X-Ray Doublet from 26FE to
47AGrdquo The physical review 44 63 (1933)
[220] calculated from XOP httpwwwesrfeucomputingscientificxop21
[221] T H Johnson ldquoThe Diffraction of Hydrogen Atoms by the Mosaic Structure of
Crystalsrdquo Phys Rev 37 87 (1931)
[222] C Thomsen J Strait Z Vardeny H J Mark J Tauc and J Hauser
ldquoCoherent phonon generation and detection by picosecond light pulsesrdquo Phys
Rev Lett 53 989 (1984)
[223] C Thomsen H T Grahn H J Maris and J Tauc ldquoSurface generation and
detection of phonons by picosecond light pulsesrdquo Phys Rev B 34 4129 (1986)
[224] American Institute of Physics (Author Corporate Author) Dwight E Gray
(Editor) American Institute of Physics Handbook 3rd ed McGraw-Hill
Columbus (1972)
[225] S Kaumlhle ldquoKurzzeit-Roumlntgenbeugung mit Hilfe einer Effizienz-optimierten
hochrepetierenden Laser-Plasma-Roumlntgenquellerdquo Dissertation (2009)
[226] P B Allen ldquoTheory of thermal relaxation of electrons in metalsrdquo Phys Rev
Lett 59 1460 (1987)
[227] J Hohlfeld S -S Wellershoff J Guumldde U Conrad V Jaumlhnke E Matthias
ldquoElectron and lattice dynamics following optical excitation of metalsrdquo Chem
Phys 251 237 (2000)
[228] Online-Datenbank WebElements Periodic Table of the Elements
httpwwwwebelementscom (Stand November 2008)
[229] B Rethfeld A Kaiser M Vicanek and G Simon ldquoUltrafast dynamics of
nonequilibrium electrons in metals under femtosecond laser irradiationrdquoPhys
Rev B 65 214303 (2002)
[230] R Peierls More Surprises in Theoretical Physics Princeton University Press
(1991)
[231] H J Zeiger J Vidal T K Cheng E P Ippen G Dresselhauss and M S
Dresselhaus ldquoTheory for displacive excitation of coherent phononsrdquo Phys Rev
B 45 768 (1992)
[232] T K Cheng J Vidal H J Zeiger G Dresselhaus M S Dresselhaus and E P
Ippen ldquoMechanism for displacive excitation of coherent phonons in Sb Bi Te
and Ti2O3rdquo Appl Phys Lett 59 1923 (1991)
Bibliography
153
[233] A B Shick J B Ketterson D L Novikov and A J Freeman ldquoElectronic
structure phase stability and semimetal-semiconductor transitions in Birdquo Phys
Rev B 60 15484 (1999)
[234] O Degtyareva M I MCMahon and R J Nelmes ldquoHigh-pressure structural
studies of group-15 elementsrdquo High Pressure Research 24 319 (2004)
[235] T E Stevens J Kuhl and R Merlin ldquoCoherent phonon generation and the two
stimulated Raman tensorsrdquo Phys Rev B 65 144304 (2002)
[236] K Ishioka1 M Kitajima1 and O V Misochko ldquoTemperature dependence of
coherent A1g and Eg phonons of bismuthrdquo J Appl Phys 100 093501 (2006)
[237] E D Murray D M Fritz J K Wahlstrand S Fahy and D A Reis ldquoEffect of
Lattice Anharmonicity in Bismuth High-amplitude Phonon Dynamicsrdquo Phys
Rev B 72 060301 (2005)
[238] X Gonze J-P Michenaud and J-P Vigneron ldquoFirst-principles study of As Sb
and Bi electronic propertiesrdquo Phys Rev B 41 11827 (1990)
[239] T K Cheng S D Brorson A S Kazeroonian J S Moodera G Dresselhaus
M S Dresselhaus and E P Ippen ldquoImpulsive excitation of coherent phonons
observed in reflection in bismuth and antimonyrdquo Appl Phys Lett 57 1004
(1990)
[240] J S Lannin J M Calleja and M Cardona ldquoSecond-order Raman scattering in
the group-Vb semimetals Bi Sb and Asrdquo Phys Rev B 12 585 (1975)
[241] A Q Wu and X XuldquoCoupling of ultrafast laser energy to coherent phonons in
bismuthrdquo Appl Phys Lett 90 251111 (2007)
[242] E G Gamaly A V Rode ldquoElectronndashphonon energy relaxation in bismuth
excited by ultrashort laser pulse temperature and fluence dependence rdquo Appl
Phys A online (2012)
[243] M Hase K Mizoguchi H Harima S Nakashima and K Sakai ldquoDynamics of
coherent phonons in bismuth generated by ultrashort laser pulsesrdquo Phys Rev B
58 5448 (1998)
[244] O V Misochko K Ishioka M Hase and M Kitajima ldquoFano interference for
large-amplitude coherent phonons in bismuthrdquo J Phys Condens Matter 19
156227 (2007)
[245] M F DeCamp D A Reis P H Bucksbaum and R Merlin ldquoDynamics and
coherent control of high-amplitude optical phonons in bismuthrdquo Phys Rev B
64 092301 (2001)
[246] O V Misochko Muneaki Hase K Ishioka and M Kitajima ldquoObservation of
an Amplitude Collapse and Revival of Chirped Coherent Phonons in Bismuthrdquo
Phys Rev Lett 92 197401 (2004)
[247] M S Diakhate E S Zijlstra M E Garcia ldquoQuantum dynamical study of the
amplitude collapse and revival of coherent A 1g phonons in bismuth a classical
phenomenon rdquo Appl Phys A 96 5 (2009)
Bibliography
154
[248] D Boschetto E G Gamaly A V Rode B Luther-Davies D Glijer T Garl
O Albert A Rousse and J Etchepare ldquoSmall Atomic Displacements Recorded
in Bismuth by the Optical Reflectivity of Femtosecond Laser-Pulse
Excitationsrdquo Phys Rev Lett 100 027404 (2008)
[249] M Hase M Kitajima S-i Nakashima and K Mizoguchi ldquoDynamics of
Coherent Anharmonic Phonons in Bismuth Using High Density
Photoexcitationrdquo Phys Rev Lett 88 067401 (2002)
[250] M Hase K Mizoguchi H Harima S Nakashima M Tani K Sakai and M
Hangyo ldquoOptical control of coherent optical phonons in bismuth filmsrdquo Appl
Phys Lett 69 2474 (1996)
[251] C Blome ldquoUntersuchung schneller Strukturbullanderungen mit Hilfe ultrakurzer
Rbullontgenimpulserdquo Dissertation (2003)
[252] S L Johnson P Beaud E Vorobeva C J Milne Eacute D Murray S Fahy and
G Ingold ldquoDirectly Observing Squeezed Phonon States with Femtosecond X-
Ray Diffractionrdquo Phys Rev Lett 102 175503 (2009)
[253] M Ligges ldquoUntersuchung der schnellen Gitteraufheizung in duumlnnen (Halb-)
Metallfilmen mit Hilfe zeitaufgeloumlster Elektronenbeugungrdquo Dissertation (2009)
[254] A Bugayev A Esmail M Abdel-Fattah and H E Elsayed-Ali ldquoCoherent
phonons in bismuth film observed by ultrafast electron diffractionrdquo AIP
Advances 1 012117 (2011)
[255] A Authier S Lagomarsino and BK Tanner (Eds) X-ray and Neutron
Dynamical Diffraction Theory and Applications New York Plenum Press
(1996)
[256] J Daillant and A Gibaud (Eds) X-ray and Neutron Reflectivity Principles and
Applications Lecture Notes in Physics 770 Springer (2009)
[257] M Cornacchia J Arthur L Bentson R Carr P Emma J Galayda P Krejcik
I Lindau J Safranek J Schmerge J Stohr R Tatchyn and A Wootton ldquoA
Sub-Picosecond Photon Pulse Facility for SLACrdquo SLAC-PUB-8950 (2001)
[258] P Tangney and S Fahy ldquoDensity-functional theory approach to ultrafast laser
excitation of semiconductors Application to the A1 phonon in telluriumrdquo Phys
Rev B 65 054302 (2002)
[259] O V Misochko K Ishioka M Hase and M Kitajima ldquoFully symmetric and
doubly degenerate coherent phonons in semimetals at low temperature and high
excitation similarities and differencesrdquo J Phys Condens Matter 18 10571
(2006)
[260] E S Zijlstra L L Tatarinova and M E Garcia ldquoLaser-induced phonon-
phonon interactions in bismuthrdquo Phys Rev B 74 220301 (2006)
[261] S Bluumlgel and G Bihlmayer ldquoFull-Potential Linearized Augmented Planewave
Methodrdquo Computational Nanoscience Do It Yourself (J Grotendorst S
Bluumlgel D Marx (Eds)) NIC Series 31 85 (2006)
Bibliography
155
[262] P Blaha K Schwarz G K H Madsen D Kvasnicka and J Luitz ldquoWIEN2k
An Augmented Plane Wave+Local Orbitals Program for Calculating Crystal
Propertiesrdquo Karlheinz Schwarz Techn Universitaumlt Wien Austria (2001)
[263] Z Yang C Ko and S Ramanathan ldquoOxide Electronics Utilizing Ultrafast
Metal-Insulator Transitionsrdquo Annu Rev Mater Res 41 337 (2011)
[264] A Pashkin C Kuumlbler H Ehrke R Lopez A Halabica R F Haglund Jr R
Huber A Leitenstorfer ldquoUltrafast Insulator-Metal Phase Transition in VO2
Studied by Multiterahertz Spectroscopyrdquo Phys Rev B 83 195120 (2011)
[265] M Wuttig N Yamada ldquoPhase-change materials for rewriteable data storagerdquo
Nature Mater 6 824 (2007)
[266] T Siegrist P Jost H Volker M Woda P Merkelbach C Schlockermann and
M Wuttig ldquoDisorder-induced localization in crystalline phase-change
materialsrdquo Nature Mater 10 202 (2011)
[267] P Debye and P Scherrer ldquoInterferenzen an regellos orientierten Teilchen im
Roumlntgenlichtrdquo Phys Z 17 277 (1916)
[268] httpwwwlebowcompanycomspecificationshtm
[269] E Zolotoyabko D Shilo W Sauer E Pernot and J Baruchel ldquoVisualization
of 10 μm surface acoustic waves by stroboscopic x-ray topographyrdquo Appl
Phys Lett 73 2278 (1998)
[270] W Sauer M Streibl T Metzger A Haubrich S Manus W A J Peisl J
Mazuelas J Haumlrtwig and J Baruchel ldquoX-ray imaging and diffraction from
surface phonons on GaAsrdquo ApplPhysLett 75 1709 (1999)
[271] C Voisin D Christofilos N Del Fatti F Valleacutee ldquoEnvironment effect on the
acoustic vibration of metal nanoparticlesrdquo Physica B Condensed Matter 316
89 (2002)
[272] P P Ewald ldquoIntroduction to the dynamical theory of X-ray diffractionldquo Acta
CrystA 25 103 (1969)
[273] httpphotonic-sciencecoukproductsXRAY-cameras-detectorshtml
[274] C Bressler and M Chergui ldquoUltrafast X-ray Absorption Spectroscopyrdquo Chem
Rev 104 1781 (2004)
[275] C Bressler and M Chergui Molecular structural dynamics probed by ultrafast
X-ray absorption spectroscopy Annu Rev Phys Chem 61 263 (2010)
[276] A O Er J Chen and P M Rentzepis Ultrafast time resolved x-ray
diffraction extended x-ray absorption fine structure and x-ray absorption near
edge structure J Appl Phys 112 031101 (2012)
[277] E Papalazarou J Faure J Mauchain M Marsi A Taleb-Ibrahimi I
Reshetnyak A van Roekeghem I Timrov N Vast B Arnaud and L Perfetti
ldquoCoherent Phonon Coupling to Individual Bloch States in Photoexcited
Bismuthrdquo Phys Rev Lett 108 256808 (2012)
Bibliography
156
[278] M Nakajima N Takubo Z Hiroi Y Ueda and T Suemoto ldquoPhotoinduced
metallic state in VO2 proved by the terahertz pump-probe spectroscopyrdquo Appl
Phys Lett 92 011907 (2008)
[279] R Ulbricht E Hendry J Shan T F Heinz and M Bonn ldquoCarrier dynamics
in semiconductors studied with time-resolved terahertz spectroscopyrdquo Rev Mod
Phys 83 543 (2011)
[280] Time-resolved THz studies of carrier dynamics in semiconductors
superconductors and strongly-correlated electron materials Lawrence Berkeley
National Laboratory Lawrence Berkeley National Laboratory LBNL
Paper LBNL-597E Retrieved from httpescholarshiporgucitem2m32w0fs
[281] O V Misochko K Ishioka M Hase and M Kitajima ldquoFully symmetric and
doubly degenerate coherent phonons in semimetals at low temperature and high
excitation similarities and differencesrdquo J Phys Condens Matter 18 10571
(2006)
[282] arXiv12122348 (httparxivorgpdf12122348pdf )(2013)
[283] M Holt Z Wu H Hong P Zschack P Jemian J Tischler H Chen and T-C
Chiang ldquoDetermination of Phonon Dispersions from X-Ray Transmission
Scattering The Example of Siliconrdquo Phys Rev Lett 83 3317 (1999)
[284] httpwwwrigakucomproductscomponents
[285] httpwwwroperscientificdedatasheetsPrinceton_Instruments_PI-
MTE_1300B_RevA0pdf
[286] httpwwwadvancedphotonixcomap_productspdfsSD394-70-74-591pdf
Erklaumlrung
157
Ich bestaumltige dass ich die vorliegende Dissertation bdquoUltrafast time-resolved X-ray
diffraction using an optimized laser-plasma based X-ray sourceldquo selbststaumlndig
verfasst habe und dabei nur die angegebenen Hilfsmittel verwendet habe
Daruumlber hinaus bestaumltige ich dass ich die vorliegende Dissertation bdquoUltrafast time-
resolved X-ray diffraction using an optimized laser-plasma based X-ray sourceldquo nur
in diesem Promotionsverfahren an der Fakultaumlt fuumlr Physik der Universitaumlt Duisburg-
Essen eingereicht wurde
Wei Lu
Duisburg den 01022013

Acknowledgments
II
Acknowledgments
The works of this thesis would not have been possible to present here without the
helps assistances and supports of many people At this point I would like to thank all
those who have contributed to this work through any kind of activity
First of all I would like to thank my supervisor Prof em Dr Dietrich von der
Linde for providing me the opportunity to carry out my PhD study in the exciting
research flied of ultrafast time-resolved X-ray diffraction at the University Duisburg-
Essen and also his support for accomplishing this thesis
A very special thank also to my advisor Dr Klaus Sokolowski-Tinten whom it
was indeed an honor and a pleasure for me to work with during my PhD study
Without his intensive cares supports and guidance this work could not be presented
here
A thank to Prof Dr Ulrich Teubner for taking care of me at the initial stage of
my PhD studies and also a thank to Priv-Doz Dr Paul Gibbon for his help in the X-
ray production project
I am very grateful to Prof Dr Uwe Bovensiepen and Prof Dr Peter Kratzer for
their agreement to evaluate this work and the related efforts
I want to thank Dr Alexander Tarasevitch for his support by maintaining the 10
Hz laser system for all the experiments in this work and also for many discussions
and advices concerning laser ndash plasma physics
I also want to thank Dr Ping Zhou for his valuable helps and advices for both
my study and life in Germany
Acknowledgments
III
To Dr Uladzimir Shymanovich and Dr Matthieu Nicoul who are my closest
colleagues and also my best friends in Germany I will never forget the days and
nights we spend together in the lab measuring driving me home many times
especially at the midnight after the experiments giving me advices to improve my
skills in both study and lifehellipThanks for everything you have done for me
Special thanks to our group secretaries Kay Eibl and Christina Boese for their
helps in dealing with all the various paperwork and administration issues
To our technical staffs I want to thank Michael Bieske for making all the
mechanical components Doris Steeger for all the support cornering electronic
devices and Roland Kohn for all the computer related issues
I thank Dr Nicolas Bergeard and Carla Streubuumlhr for their helpful suggestions
and comments on this work
Many thanks go to all the former and current members working in AG von der
Linde and AG Bovensiepen Dr Nikola Stojanovic Dr Ivan Rajkovic Dr Manuel
Ligges Dr Stephan Kaumlhle Dr Konstantin Lobov Dr Oliver Heinz Jan Goumlhre Jens
Wieczorek Michael Vattilana and Florian Quirin and all of the diploma students and
the student assistants who contributed to the wonderful working atmosphere in the
groups I enjoyed all our exchanges very much
Finally I want to thank my parents and my wife Xi Shen for their unlimited
encouragement and assistance during my PhD studies I could not have succeeded
without their supports I dedicate this work to them
Contents
IV
Contents
Acknowledgments II
Contents IV
1 Introduction 1 11 Introduction and motivation 1
12 Overview and structure of the thesis 4
2 Optimization of a laser-plasma based X-ray source 5
21 Generation of ultrashort X-ray pulses from laser-produced plasma 6
22 Laser system 8
23 Experimental setup 11
24 Optimization of Kα X-ray emission by adjusting the laser intensity 13
25 Optimization of Kα X-ray emission by using a controlled pre-plasma 16
251 The resonance absorption (RA) and its optimum condition 17
252 Experimental results 20
253 Discussion 24
26 Comparison of the experimental results with simulations 30
27 Summary 32
3 Improvements of the modular setup for time-resolved X-ray
diffraction experiments 34
31 The fundamental components of the current setup 35
32 Improvements of the modular setup 39
321 Controlled pre-pulse to enhance the X-ray production 40
322 Avalanche photodiode (APD) 40
323 Ionization chamber detector (ICD) 44
324 Experiment control program 46
325 Spatial and temporal overlap adjustments with APD 48
326 Normalization of X-ray signals 49
3261 Chopping normalization scheme with a shutter 50
3262 Direct normalization scheme with the ionization chamber
detector 52
3263 Comparison of normalization schemes 54
33 Summary 56
4 Observation of the Debye -Waller effect in Au 57
41 Au sample 57
42 Debye ndashWaller effect 58
43 Time-resolved X-ray diffraction experiments on Au 60
431 Bragg diffraction of Au 60
432 Observation of Debye ndashWaller effect on Au 64
44 Comparison with the Two ndash Temperature Model (TTM) and discussion 68
45 Summary and conclusion 71
Contents
V
5 Extreme phonon softening in laser-excited Bi 73
51 Research background 75
511 Structure of Bi and the phonons 75
512 Previous works 76
52 Experiments and discussion 81
521 Method 81
522 Preliminary measurements 82
523 Results of time resolved measurements and discussion 85
53 Summary 96
6 Towards time-resolved Debye-Scherrer X-ray diffraction 98
61 Experimental configuration 100
62 Static Debye-Scherrer measurements 101
63 Time-resolved Debye-Scherrer experiment 104
631 Static Debye-Scherrer-diffraction pattern of the Au thin film 105
632 Results of time-resolved pump-probe measurements 106
633 Modeling the transient behavior of the diffraction pattern after laser
excitation 110
634 Discussion for the experimental results 113
64 Summary 114
7 Summary and outlook 115
71 Summary 115
72 Outlook 117
Appendixes 120 A Working principle of multilayer mirror 120
B X-ray detectors for diffracted signals 122
B 1 Direct detection camera 122
B 2 Indirect detection camera 125
B 3 Avalanche Photodiode (APD) 127
C Sample material properties 128
C 1 Cu 128
C 2 Ti 129
C 3 Au 129
C 4 Bi 132
Bibliography 136
1 Introduction
1
1 Introduction
11 Introduction and motivation
In order to study the ultrafast structural dynamics of matter excited by a
femtosecond optical pulse atomic spatial resolution (~Aring) and temporal resolution
comparable to characteristic time scales of atomic motion (femtosecond to
picosecond) are required
For a long time static atomic resolution has been achieved by using either X-
rays which were discovered by William Conrad Roentgen in 1895 [1]
electrons
proved by George Paget Thomson and Clinton Joseph Davisson independently in
1920s [2 3]
or neutrons which was established by Ernest O Wollan and Clifford Shull
in 1940s [4]
The knowledge of the structure of matter has been largely extended with
the application of these invaluable tools For their outstanding contributions
Roentgen earned the first Nobel Prize for Physics in 1901 Thomson and Davisson
shared the Nobel Prize for Physics in 1937 and Shull was awarded one half of the
1994 Nobel Prize in Physics
On the other hand the temporal resolution had made no significant improvement
until the development of femtosecond laser technology [5 6]
Since then the situation
has changed rapidly New types of radiation sources have been developed or are being
developed to provide ultrashort pulses of photons or electrons with sufficiently short
wavelength to enable the direct observation of structural changes on the relevant
length- and time-scales In the late 1980searly 1990s the first laser-produced plasma
femtosecond x-ray sources were demonstrated [7-9]
In the early 2000s ultrafast
electron diffraction with sub-picosecond time resolution was realized [10-13]
In the
mean time also accelerator based short-pulse X-rays sources have been developed [14-
18] However until now it has not been possible to generate ultrashort (sub-
picosecond) pulses of thermal neutrons
In the works presented in this thesis ultrashort X-ray pulses are used as a tool to
investigate ultrafast structural dynamics Currently there are six techniques exist to
1 Introduction
2
produce femtosecond X-ray pulses
1) Ultrafast X-ray tube achieved by using pulsed femtosecond lasers to produce
pulsed electron injection within a normal X-ray tube [19-21]
2) Direct conversion of the laser pulse into the X-ray region by nonlinear optical
processes ie high order harmonic generation(HHG)[22-25]
3) laser-produced plasma X-ray source achieved by the interaction of high
intensity laser pulses with solid targets [7-9]
4) The very recent developed laser-plasma wakefield accelerator-based betatron
X-ray source [26-29]
5) Unlike the previous four laboratory-sized techniques the large-scale electron
synchrotron-based slicing X-ray sources such as the Advanced Light Source ldquoALSrdquo
in Berkeley USA [14]
the Berliner Elektronenspeicherring-Gesellschaft fuumlr
Synchrotronstrahlung ldquoBESSYrdquo in Berlin Germany [15]
the Swiss Light Source
ldquoSLSrdquo in Villigen Switzerland [16]
6) The large-scale linear accelerator-based X-ray Free electron lasers (XFEL)
such as the Linac Coherent Light Source ldquoLCLSrdquo at SLAC in Standford USA [30]
the
SPring-8 Angstrom Compact free electron LAser ldquoSACLArdquo in Japan [31]
and the X-
ray Free-Electron Laser ldquoXFELrdquo at DESY in Hamburg Germany [32 33]
For all of these ultrafast X-ray sources the femtosecond laser pulses have to be
employed in some ways and the accelerated electrons play important roles in the
conversion process Each of these sources has its own characteristics in terms of the
repetition rate the minimum achievable pulse duration the produced photon number
the photon energy range the spatial and temporal coherence properties and the size or
the cost of the installation
Presently the first two sources are not yet suitable for studying ultrafast
structural dynamics due to the limited overall X-ray production The betatron X-ray
source is still under development [34-38]
The last two large-scale X-ray sources
represent the most promising X-ray sources for performing ultrafast time resolved
experiments However their construction and running costs are extremely high and
beam time access is very limited The laser-produced plasma X-ray sources are
presently unique because they are the easiest to operate laboratory-sized X-ray source
that can deliver hard X-ray radiation with very short pulse duration and at the same
time provide perfect synchronization between the produced X-ray pulses and the
1 Introduction
3
driving femtosecond laser pulses This is the type of X-ray source that has been used
for performing the time resolved X-ray diffraction experiments presented in this
thesis A part of the work in this thesis is dedicated to optimizing the X-ray emission
from this X-ray source
To obtain the time dependent information in sub-picosecond time scale the
common method using a fast detector (eg photo diodes or streak cameras) with one
ultrashort pump pulse is not accessible due to the limited temporal-resolution
capability of current fast detectors Most experiments are performed in the ultrafast-
pumpndashultrafast-probe scheme with a slow detector With this scheme the time
evolution of photoinduced structural changes can be studied by taking a sequence of
diffraction patterns at different time delays with respect to (femtosecond) excitation
Since the ultrashort X-ray pulse was available this scheme has been further extended
to X-ray region Using laser-pump X-ray-probe scheme the first femtosecond time-
resolved X-ray diffraction experiment was performed with laser plasma X-ray source
in 1997 by Rischel et al [39]
Since then many ultrafast phenomena have been
investigated by using ultrashort X-ray pulses Reviews on these studies can be found
in Ref [40 41] The current researches cover the following fields
1) Propagating GHz acoustic waves caused by the release of impulsive stress
launched by the femtosecond optical excitation [42-67]
2) Coherent optical phonon excitations which connect with unit-cell level
transient structural changes [67-73]
3) Non-thermal melting which is melting before thermal equilibrium between
electrons and lattice has been established after femtosecond laser excitation [17 18 39
46 76-81]
4) Phase transition in ferroelectric [66 82-87]
and ferromagnetic [88-104]
materials
caused by femtosecond laser excitation
5) Debye-Scherrer type time-resolved X-ray measurements on polycrystalline
and powder samples which allow obtaining much more information of the excited
sample from one measurement through detecting simultaneously several diffraction
orders similar to studies by ultrafast electron diffraction [105-110]
6) Utilizing X-ray diffuse scattering to investigate the transient nonequilibrium
states of the lattice system following ultrafast laser excitation [111 112]
The ultrafast phenomena investigated in this thesis focus on structural dynamics
in thin laser-excited metal films These works covered by the research field includes
1 Introduction
4
coherent excitations of acoustic phonons and optical phonons
12 Overview and structure of the thesis
The thesis is organized as following
Chapter 2 presents experimental results on the optimization of Kα X-ray emission
from a laser-plasma based X-ray source It contains the principle of X-ray generation
with a laser produced plasma and a systematic investigation of optimizing the X-ray
emission
Chapter 3 describes a modular setup for time-resolved X-ray diffraction
experiments This chapter presents and discusses implemented improvements of the
setup such as hardware software and methodology which are essential to achieve the
results of following time-resolved diffraction experiments
Chapter 4 deals with the first time-resolved X-ray diffraction experiment with
the improved modular setup The Debye -Waller effect in a thin laser-excited Au film
is observed The evolutions of the lattice temperature are compared with the
theoretical prediction of Two-Temperature Model (TTM)
Chapter 5 contains the study on the photoinduced softening of the A1g optical
phonon mode in laser-excited Bi This work extends the studies of coherent optical
phonons in laser-excited Bi to a higher fluence range that has not been studied
previously
Chapter 6 focuses on the experiments performed with X-ray Debye-Scherrer
diffraction scheme A static measurement on a Cu foil (20 μm) and a time-resolved
measurement on an Au thin film (200 nm) have been carried out The temporal
behaviors of the measured data are discussed
The last chapter summarizes the main results presented in this thesis An outlook
for the future studies is also provided
2 Optimization of a laser-plasma based X-ray source
5
2 Optimization of a laser-plasma based
X-ray source
This chapter discusses the principles of X-ray generation using a laser-produced
plasma and strategies to optimize the X-ray source for time-resolved X-ray diffraction
experiments discussed in the following chapters For this purpose the Kα-emissions
from plasmas on Ti and Cu targets for different excitation and plasma conditions were
investigated Section 21 describes the mechanism for generating ultrashort X-ray
pulses using the laser-produced plasma The laser system and the experimental setup
are presented in sections 22 and 23 respectively Section 24 discusses the
optimization of the Kα yield as a function of laser intensity Measurements of the Kα
yield as a function of target thickness and angle of incidence and a detailed
investigation of the influence of a pre-formed plasma by using a controlled pre-pulse
with variable delay are presented and discussed in section 25 The experimental data
show that for a given angle of incidence the Kα yield can be optimized by choosing a
suitable pre-pulse ie plasma scale-length conditions For large angles of incidence a
steep electron density gradient maximizes the yield At near normal incidence
maximum yield is achieved for a more expanded plasma and the best energy
conversion efficiency has been found in this case For a certain scale-length range
(between 01λ ndash 1λ here λ is the laser wavelength) the optimized yield is scale-length
independent It can be achieved by choosing the appropriate angle of incidence This
situation results from the strong dependence of collisionless absorption mechanisms ndash
in particular resonance absorption (RA) ndash on the angle of incidence and the plasma
scale length By maximizing the absorption the highest Kα yield is achieved The
experimental data are supported by the results of calculations based on the classical
resonance absorption mechanism (section 25) and of particle-in-cell (PIC) simulations
(section 26) Finally a summary of this chapter is given in section 27
2 Optimization of a laser-plasma based X-ray source
6
21 Generation of ultrashort X-ray pulses from laser-
produced plasma
Optical radiation is absorbed by a metal within a thin layer of about 10 nm which
is called the ldquoskin depthrdquo [113]
If the intensity of the laser radiation on the material is
large enough typically more than 1014
Wcm2 the target material within the skin depth
will be ionized and transformed into a plasma during the pulse For laser intensities
above 1015
Wcm2 easily achievable with current femtosecond laser technology it has
been found that the hot plasma emits radiation in the (hard) X-ray range [7]
The emitted
radiation consists of continuum emission from recombination in the plasma
characteristic line emission (Kα Kβhellip) and Bremsstrahlung radiation The latter two
components come not only from the hot plasma resulting from transitions on the
strongly ionized atoms but also the interaction of high energy electrons accelerated by
the intense laser field with the cold non-excited material underneath [7 9 114 115]
These
laser-accelerated electrons often called hot electrons in the laser plasma community
have a kinetic energy (~10hellip100 keV) significantly higher than the thermal energy of
the overwhelming part of the plasma electrons Among the three different contributions
to the X-ray emission mentioned above the characteristic line emission especially K
emission is particularly interesting for applications (eg time-resolved X-ray
diffraction) The generation of characteristic line radiation during the irradiation of a
solid material with an intense femtosecond laser pulse is described detail in Ref [9
116-118]
The mechanism of K -ray emission from a laser induced plasma is very similar
to that in an ordinary X-ray tube However the static electric field used for electron
acceleration is replaced by the femtosecond laser electric field A brief description of
the process of K The interaction of a high
intensity laser beam with a solid surface rapidly creates a plasma The plasma electrons
interacting with the strong electric field of the incident femtosecond optical pulse can
acquire an energy which is high enough to leave the skin layer and penetrate into the
non-excited material underneath the surface plasma layer Some of these electrons will
be slowed down and generate Bremstrahlung Others collide with the non-excited
atoms kick out electrons from their inner electronic shells which subsequently undergo
inner shell recombination leading to characteristic line emission Therefore the
emission of the characteristic line radiation can only occur as long as the high energy
2 Optimization of a laser-plasma based X-ray source
7
electrons are present and can be regarded as a direct result of these hot electrons
These electrons exist only during the femtosecond laser pulse irradiation (and for a very
short time afterwards which is determined by the flight-time of the high energy
electrons through the material) Thus one can expect that the duration of the X-ray
pulses produced in this way is comparable to the laser pulse duration ie in the sub-
picosecond region [119-122]
Fig 21 Scheme for the generation of Kradiation by focusing an
ultrashort laser pulse on a solid target (a) The focused laser pulse
produces plasma on the surface of solid target (red area) Accelerated
electrons from the plasma travel into non-excited material and
produce there X-rays (yellow area) (b) The ionization of K-shell
electrons and the subsequent inner shell recombination leads to K-
emission
The energy distribution and the corresponding number of these hot electrons
have a strong influence on the characteristics of the emitted radiation in particular the
Kα yield The task to optimize the conditions for Kα X-ray generation turns into the
investigation of how the laser energy is converted into hot electrons with the
appropriate energy distribution and their following dynamics inside the non-excited
material The energy conversion is dominated by the laser absorption mechanisms
which are in turn determined by the parameters of the driving laser ie intensity angle
2 Optimization of a laser-plasma based X-ray source
8
of incidence laser polarization as well as by the properties of the plasma with which
the laser pulse interacts [119 123]
The subsequent interaction of the hot electrons and
the solid is mainly via collisions The mean free path of the hot electrons (or the
stopping distance) and the ionization cross section in the solid dominate the rate of Kα
emission [124-126]
Several studies based on simulations (particle-in-cell
simulation [127]
+ Monte Carlo transport code [128]
) were performed to investigate this
question Depending on the target material (Z) and the sample thickness the
simulations allowed to determine the laser parameters (ie laser wavelength intensity
polarization and pulse duration) which lead to the optimum electron distributions for
Kα emission [121 129-131]
These results are in good agreement with previous experimental
data [9 115 132 133-137]
In this study the effects of laser intensity target thickness angle of incidence and
precise controlled pre-plasma conditions on the Kα-production from Cu and Ti elements
are the objects for investigation To my knowledge systematic investigations of the
latter two effects on both elements were first performed
22 Laser system
In this section the laser system used as a driver for the laser-plasma based X-ray
source is described and some key parameters of this laser system are presented
The 10-Hz Titanium-Sapphire femtosecond terawatt laser system at the University
of Duisburg-Essen is based on the Chirped Pulsed Amplification (CPA) technique [5 6
138] Its working principle can be briefly described as follows A low energy
femtosecond pulse produced by an oscillator first passes through a so-called ldquostretcherrdquo
The stretcher consists of a dispersive delay line (gratings) and adds a controlled phase
modulation to the laser pulse thereby increasing its duration and decreasing its peak
intensity Typical stretching factors are 104 The ldquostretchedrdquo pulse can then be
amplified to high energies usually by several amplification stages After amplification
the pulse passes through the so-called ldquocompressorrdquo which compensates the phase
modulation imposed by the stretcher as well as any additional phase modulation
acquired during amplification (for example due to material dispersion) Ideally the
amplified pulse is recompressed to its original duration This technique allows to
produce high peak power laser pulses without deteriorating the pulse parameters and
damaging the optical components during the amplification process
2 Optimization of a laser-plasma based X-ray source
9
The main components of the laser system used in the experiments are shown in
Fig 22 The ldquoheartrdquo of the system is a mode-locked titanium-sapphire oscillator
pumped by a frequency doubled cw NdYVO4 laser (type Coherent Verdi diode-
pumped λ = 532 nm P = 5 W) It produces a train of 45 fs (full width half maximum -
FWHM) pulses with a repetition rate of 80 MHz and an energy of ~1 nJ per pulse The
central wavelength of the pulses is 800 nm with a spectral bandwidth (FWHM) of 21
nm
The output pulses from the oscillator are directed to the stretcher in which the
duration of the pulses is extended to 200 ps A grating with 1200 linesmm is used in
the stretcher as dispersive element for broadening the pulses Before the pulses enter
the amplification stages the repetition rate is reduced to 10 Hz using an electro-optic
selector consisting of a Pockels cell and a polarizer By inducing a suitable fast
switching electric field this combination allows the precise selection and separation of
pulses at a repetition rate of 10 Hz from the initial 80 MHz pulse train
The following amplification system consists of two multipass stages both using
TiSapphire crystals as gain medium pumped by frequency doubled Q-switched
NdYAG lasers (532 nm) In the first stage the seed pulses make eight passes through
the amplifying medium and are amplified to a pulse energy of about 1 mJ
(amplification by a factor of approximately 106
- 107) The second stage is a four-pass
power amplifier To obtain homogeneous pumping two lasers pumping from both sides
of the amplifying medium are applied After four passes in the second crystal the pulse
energy pulse is increased to about 200 mJ (amplification by a factor of approximately
100) Finally the amplified pulses enter the compressor The compressor contains again
gratings as dispersive elements to recompress the pulse to the desired pulse duration If
the compressor is operated under vacuum a maximum energy per pulse of 150 mJ with
a minimum pulse duration of about 45 fs can be achieved In the experiments discussed
here the compressor is operated in air and the pulse duration is adjusted to
approximately 120 - 150 fs With this duration self-phase-modulation (and self-
focusing) in air can be avoided and the pulse properties (spectrum spatial beam profile)
are not deteriorated during propagation
2 Optimization of a laser-plasma based X-ray source
10
Fig 22 The principle scheme of the laser system
The time-structure of the final output pulses was measured a third-order
autocorrelator (fs- to ps-time-range) The amplified laser pulse exhibits a relative
intensity of about 10-7
(ie contrast ratio of 107) approximately 1 ps ahead of the pulse
maximum and the contrast ratio to the amplified spontaneous emission (ASE) is 108 [139]
Due to such a high-contrast ratio the pre-plasma formation caused by laser pulse itself
is negligible in the experiments presented later
The key parameters of the laser system are summarized in the table 21 below
central wavelength 800 nm
spectral width 21 nm
min pulse duration 45 fs
in air pulse duration 120 150 fs
maximum pulse energy 150 mJ
contrast ratio at 1 ps 10-7
ASE 10-8
repetition rate 10 Hz
beam diameter (FWHM) 25 mm
Table 21 Key parameters of the 10 Hz laser system
The stability of the laser system ie energy and pointing stability is very
important for the experiments presented in this thesis Energy and pointing stability
were recorded and analyzed pulse-to-pulse over a few hours by U Shymanovich [140]
2 Optimization of a laser-plasma based X-ray source
11
Typical values under normal working conditions are less than 100 microrad pulse-to-pulse
pointing instability and 25 rms energy fluctuations
23 Experimental setup
Fig 23 Schematic of the experimental setup for Koptimization
All the works presented in this thesis were done with a few different experimental
setups For the investigation of the Kα production a setup as schematically shown in
Fig 23 was used The 25 mm diameter (FWHM) p-polarized laser beam was reflected
from a mirror with a 5 mm diameter hole in its center that allowed transmission of a
small part of the beam The transmitted part was time delayed with a variable delay
line and recombined with the main laser beam using a second apertured mirror The
combined p-polarized laser beams were focused with a 30 cm focal length lens onto the
target surface This lens could be accurately translated along the direction of the laser
beam propagation to change the focusing conditions ie the focus size on the target
Two PIN photodiodes one for recording the incident energy and another for the
reflected energy were used to measure the reflectivity from which the absorption of
the laser energy can be deduced By using a microscope objective combined with a
CCD camera the focal spot sizes of main and pre-pulse were measured as ~ 20 μm and
~ 70 μm FWHM respectively The focal area of the pre-pulse is about 12 times bigger
than that of the main pulse and both pulses can be adjusted to spatially overlap well at
all delay times The angle of incidence was varied by rotating the target For each
specific angle the laser intensity was kept constant by adjusting the laser energy The
targets were mounted on a motorized XYZ translation unit and moved between
2 Optimization of a laser-plasma based X-ray source
12
consecutive laser pulses to provide a fresh surface for each pulse In these experiments
four kinds of targets were used 300 nm Cu and Ti films coated on a glass substrate and
20 μm Cu and Ti foils glued onto a glass substrate
The X-ray radiation was detected with a Princeton Instruments CCD-camera (type
PI-MTE 1300B) It is back-illuminated Si-CCD that is suitable for the photon energy
range relevant in this work (ie 2 to 10 keV) The chip area is 1340 pixels times 1300 pixels
(20 microm times 20 microm each) The camera was located ~ 20 cm away from the X-ray source
and the average X-ray flux per pulse was reduced to 1 photon per 40 pixels by using an
Al filter of moderate thickness (150 microm and 210 microm for Ti and Cu respectively) in
front of the camera The filter also protected the CCD from low energy Bremsstrahlung
and from visible light This configuration allowed the camera to work in ldquosingle photon
counting regimerdquo as a spectrometer exploiting the fact that a X-ray photon detected
with the CCD creates a charge strictly proportional to its energy (for Si the electron-
hole pair creation energy is 366 eV [141]
and thus a single Cu Kα photon (805 keV) will
produce about 2200 photoelectrons) Therefore one can obtain the energy spectrum of
the detected X-rays from the distribution of the signal of all camera pixels (signal
histogram of the recorded images) A typical single-pulse spectrum using Cu as target
with well resolved Cu Kα and Kβ lines at 805 keV and 891 keV respectively is shown
in Fig 24 The single-pulse spectra of Ti which are not shown here are similar The
Kα yield can in principle be obtained by integrating the signal in the relevant energy
range after appropriate background subtraction
Fig 24 Spectrum of the laser produced Kα emission of Cu
2 Optimization of a laser-plasma based X-ray source
13
However to determine the absolute Kα yield of the source it has to be considered
that a single X-ray photon not always generates charge in only a single CCD pixel but
that the generated charge may be distributed over many pixels (many-pixel-
events)[142]
This distorts the measured spectra and leads to an underestimation of the
Kα yield since a many-pixel-event created by a single Kα-photon is detectedcounted
as several photons of apparently lower energy For Ti and Cu Kα radiation the spatially
largest events involve 4 pixels as reported in Ref [142] In order to determine the
percentage of single-pixel events in the detection system a few images were randomly
sampled from all the measured data and analyzed in detail It was found that about 50
of all detected Kα-photons generated single-pixel events while the other 50 were 2-
3- and 4-pixel events (the number of events involving 5 and more pixels was
negligible) Therefore a correction factor of 2 was applied to the number of detected
Kα-photons determined from the integration of the spectra To derive from this the
absolute Kα yield the transmission of the Al filters as well as the quantum efficiency of
the CCD (18 at 8 keV 55 at 45 keV) [143]
was taken into account Moreover it was
assumed that the X-ray emission is isotropic into the full solid angle
24 Optimization of Kα X-ray emission by adjusting the laser
intensity
In this section the experimental results concerning the optimization of the Kα X-
ray emission are presented Two key factors namely laser intensity and the pre-plasma
scale length were varied to study their influence on the Kα yield
As mentioned in section 21 to efficiently ionize the K-shell electrons of the target
material which in turn lead to an efficient X-ray emission hot electrons with the
appropriate kinetic energy should be produced The kinetic energy of these hot
electrons is strongly dependent on the accelerating laser field Therefore the laser
intensity is one of the key factors to control and optimize the Kα generation The
average energy of the accelerated electrons often described by an effective ldquohotrdquo
electron temperature Th generally relates to the pondermotive potential of the laser
field and follows a power scaling law Th ~ (Iλ2)13
[144 145]
as observed in many
experiments [115 146-148]
and also found with PIC simulations [119]
For optimum Kα
emission the average electron energy should be a few times the K-shell ionization
energy depending on the geometry of the target and the atomic number [121 129 137
2 Optimization of a laser-plasma based X-ray source
14
149]With this condition the laser intensity for optimum Kα production can be estimated
For example to maximize the yield of Cu Kα (805 keV) radiation the average electron
energy should be between 25 keV and 50 keV [120 121 129 148 150 151]
With the mentioned
empirical scaling law Th ~ (I0λ2)13
this average electron energy corresponds to a laser
intensity of a few times 1017
Wcm2 at a laser wavelength of 800 nm
[120 121 137] For Ti
the predicted optimum laser intensity is a few times 1016
Wcm2 [121 152]
With the given focal length (30 cm) a maximum laser intensity of
16 times 1017
Wcm2 can be achieved The laser intensity dependence is investigated by
varying the relative position of the laser focus with respect to the target surface In this
way the laser intensity on target changes while the pulse energy is kept constant No
additional pre-pulse is applied in this experiment Fig 25 shows the experimentally
determined (normalized) Kα yield from 20 μm Cu and Ti foils as a function of the
position of the target surface relative to the focus of the lens In this measurement no
attempt was made to convert the position scale into an intensity scale but it is obvious
that the Kα emission for the different target materials is optimizedmaximized at
different lens positions and thus at different intensities For Cu the sharpest focusing
and thus the highest intensity provides the largest Kα emission For Ti this is achieved
out of focus and thus at a lower intensity This effect has been discussed before in the
literature [130 152 153]
Fig 25 indicates that for Ti the ldquooptimumrdquo intensity for Kα-
production is reached and exceeded in the experiments This optimum intensity is lower
than the maximum laser intensity reached at the focus as predicted by theory [121]
For a
Gaussian beam it is expected that the change of the spatial intensity distribution should
be symmetric with respect to the focus The asymmetry of the measured double-peak
dependence of the Ti Kα yield indicates that this is not the case in the experiment This
is attributed to the method (hole in a mirror) used to split off the pre-pulse that was
used for the measurements described below from the main pulse leading to a non-
Gaussian intensity distribution For the higher atomic number material Cu the optimum
conditions for Kα-production correspond to higher laser intensity Since no double-peak
structure is observed for Cu it can be concluded that the maximum intensity used in the
experiment is comparable or below the expected optimum value for this material again
in agreement with the predictions and estimates mentioned above
2 Optimization of a laser-plasma based X-ray source
15
Fig 25 Kα emission as a function of the relative position of the
target surface of 20 μm Cu and Ti foils with respect to laser focus
The lines between the data points are only to guide the eye
Fig 26 Measured dependence of X-ray yield on laser energy for a
20 μm Cu foil The angle of incidence is 45deg
Since Cu Kα radiation has been used for the time-resolved diffraction experiments
discussed in this thesis the emission from a Cu target has been investigated further
Keeping the spot size (position of the lens) fixed a precise measurement as function of
laser pulse energy was performed and it provided more detailed information on the
laser intensity dependence with this target material For laser energies above 30 mJ and
intensities in the region from 1016
Wcm2 to 10
17 Wcm
2 the Cu Kα yield scales linearly
2 Optimization of a laser-plasma based X-ray source
16
with laser energyintensity - Fig 26 There has been no evidence of saturation in
agreement with theoretical calculations which predict an optimum intensity for Cu Kα-
production of a few times 1017
Wcm2 [121 137]
Additionally a data set with a controlled
pre-pulse arriving 6 ps before the main pulse is also presented in this figure An
obvious improvement in the Kα-production is observed A detailed discussion of this
effect will be presented in the next section The maximum absolute yield obtained in
this measurement is in line with other reported Cu Kα sources [107 148 154 155]
25 Optimization of Kα X-ray emission by using a controlled
pre-plasma
Another approach for optimization of the Kα emission is to improve the energy
conversion efficiency from the laser pulse to electrons and subsequently to Kα photons
The dominant absorption mechanism at laser intensities around 1017
Wcm2
is expected
to be resonance absorption (RA) [116 121 131 133 152 156-158]
The crucial parameter for the
efficiency of the energy transfer for this mechanism is the plasma density scale length
at the time when the maximum pulse intensity is reached Assuming isothermal plasma
expansion an exponential electron density profile )exp()( 0 Lxnxn ee is
produced [159]
and the plasma density scale length L is defined as ee nnL Since
the plasma expands with a typical velocity of ~106ndash10
7 cms
[160-162] the time interval
between the plasma-formation threshold and the maximum intensity largely determines
the scale length seen by the pulse during the interaction Therefore the conversion
efficiency in this case is very sensitive to the temporal structure of the rising edge of the
laser pulse For this reason control over the time structure of the pulse provided by the
laser system becomes important to control the Kα emission An important parameter of
the laser pulse time structure is the contrast ratio defined as the ratio of intensity of the
pulse at the maximum and pre-pulsesbackground before the main pulse In some
previous work [130 148 152 156]
using laser systems with low contrast ratio pre-pulses
andor amplified spontaneous emissions (ASE) usually cause plasma formation long
before the peak of the pulse reaches the target Such long pre-plasma scale lengths
provided by the laser systems already lead to strong absorption making additional
improvements difficult However relying for a particular laser system only on its
inherent pre-pulse for ldquooptimizationrdquo is hardly satisfactory because the scale length will
rarely be optimized and matched to other parameters On the other hand with a very
2 Optimization of a laser-plasma based X-ray source
17
high contrast laser system it has already been demonstrated that introducing a pre-
formed plasma using a weak artificial pre-pulse can increase the conversion efficiency
of the X-ray yield from laser produced plasmas [118 137 163-167]
(this effect is also visible
in Fig 26) Therefore systematic investigations of the plasma scale length
requirements for different experimental conditions are necessary In this section the
mechanism of the resonance absorption will first be explained Then the experimental
results are presented followed by their discussion
251 The resonance absorption (RA) and its optimum
condition
The resonance absorption occurs when an electromagnetic wave with p-
polarization (the electric field in the plane of incidence) is obliquely incident in an
unmagnetized inhomogeneous plasma In this process the electromagnetic wave
couples with the electron plasma wave at the region of critical density (defined as
nc=22 4 em L where m and e are the charge and the mass of the electron respectively
and L the angular frequency of the laser light) where the local electron plasma
frequency equals the incident wave frequency There the energy is effectively
transferred from the incident electromagnetic wave to electron plasma wave and the
electron plasma wave can be resonantly enhanced As the electron plasma wave grows
nonlinear wave-breaking [168 169]
can lead to the consequent production of hot
electrons
2 Optimization of a laser-plasma based X-ray source
18
Fig 27 Scheme of oblique incident laser pulse traveling inside a
plasma The red violet green and magenta trajectories represent the
propagation path of the incident laser pulses with angle of incidence
of 60deg 40deg 20deg and 0deg respectively The double arrows
perpendicular to the trajectories represent the polarization of the
electric fields (p-polarization) The trajectories are reflected before
reaching the critical density layer where nenc=1 The turning point
depends on the angle of incidence
A simple theoretical estimate of the optimum condition for RA is given by the
formula (2πLλ)23
sin2αmax = 06
[147] where Lλ is the plasma scale length normalized
to the laser wavelength αmax is the angle of incidence at which RA is optimized This
equation is obtained by solving the wave equation for light wave propagation in a
plasma with linear density profile It expresses an important relation between the
plasma scale length and αmax the angle of incidence for the optimum absorption
decreases with increasing plasma scale length The mechanism can be described
qualitatively in Fig 27 The absorption occurs in the critical density region where
ne=nc ne is the local electron density in the plasma The total absorption depends on
2 Optimization of a laser-plasma based X-ray source
19
how large the field driving the resonance is at the layer of critical density This field is
firstly determined by the angle of incidence because only the field component along the
density gradient which varies as sinα contributes to the excitation of electron plasma
wave Secondly since the refractive index of the plasma in the undercritical region
decreases with increasing density (ie Drude-model) an obliquely incident light wave is
refracted towards regions of lower density and reflected at a density lower than the
critical density (turning point) with ne= nccos2α
[147] Although the laser light wave
can propagate only up to turning point before it is specularly reflected some amount of
the light energy will tunnel into the critical density region and drive the resonance The
value of this driving field at the turning point can be estimated using the Airy function
solution [170]
and it decays exponentially depending on its travel distance as it penetrates
beyond the turning point Thus the resulting driving field at the layer of critical density
is a competition between maximization of the electric field component along the
density gradient and the distance of the field penetration beyond the turning point
Particularly in the situation of the experiments that will be presented later for a long
scale-length system (eg Lλ asymp 1) the turning point of a steep angle of incidence is
closer to the layer of critical density as one can see in the Fig 27 Although the field
component normal to the density gradient is weak in this case the short attenuation
distance to the critical density surface provides a stronger driving field than the one
with large angle of incidence which has large field components normal to the density
gradient but the field decay dramatically due to the large tunnel distance to reach the
critical density surface The stronger driving field at a small α (eg asymp 25deg) leads to the
stronger absorption than with a large α (eg asymp 55deg) On the other hand for a short scale-
length system (eg Lλ asymp 01) the positions of turning points of all incidences are all
close to the layer of critical density thus the attenuations of their driving fields due to
the tunnel distance are neglectable With increasing angle of incidence α (eg asymp 55deg)
the electromagnetic wave spends progressively more of its time near nc and the
excitation of the electron plasma wave at the critical density layer becomes more
efficient This leads to more efficient absorption than at small α (eg asymp 25deg)
2 Optimization of a laser-plasma based X-ray source
20
Fig 28 Plasma density profile for different times (a) arrival of the
pre-pulse (b) between pre- and main pulse and (c) when the main
pulse arrives
In order to establish a well defined plasma scale length in the work described later
the pre-plasma is produced by a laser pre-pulse arriving with a controllable delay before
the main laser pulse In Fig 28 a schematic of this arrangement is presented The pre-
pulse strikes the target surface and ionizes the material Subsequently the created
plasma starts to expand Assuming a constant expansion velocity Cs = (ZkTeM)12
the
plasma scale length L grows linearly in time according to L equiv Cst [171]
(Te is the
electron temperature determined by the pre-pulse intensity Z is the average ionization
degree k is the Boltzmann constant and M is the ion mass) After a certain time ∆t the
main pulse arrives and strikes on this pre-formed plasma with a specific density scale-
length L This scheme offers the possibility of actively manipulating and optimizing the
coupling efficiency hot electron distribution and thus the Kα emission With such a
precisely controlled pre-plasma the optimum conditions for RA discussed in this
section can be used to compare with the experimental conditions for which the Kα yield
is optimized in the following experiments
252 Experimental results
According to the results discussed in the previous section the experiments in this
chapter where performed under ldquooptimumrdquo focusing conditions The Cu targets were
placed exactly in the focus of the lens while the Ti targets were placed about 900 μm in
front of the focus These configurations lead to intensities on the Cu and Ti targets of
16 times 1017
Wcm2
(focus diameter ~20 μm FWHM) and 92 times 1016
Wcm2
(~25 μm
FWHM) for the main pulse and 20 times 1014
Wcm2
(~70 μm FWHM) and 11 times 1014
Wcm2 (~90 μm FWHM) for the pre-pulse respectively
2 Optimization of a laser-plasma based X-ray source
21
The absolute Cu and Ti Kα emission as a function of the main pulse delay at a
fixed angle of incidence of 45deg on targets of different thickness are presented in
Fig 29 (a) and Fig 29 (b) respectively The Cu and Ti Kα emission signal
normalized to the emission measured at negative time delay (52 times 108
photonspulsesr
for 20 μm Cu 82 times 107
photonspulsesr for 300 nm Cu 14 times 109
photonspulsesr for
20μm Ti and 12 times 108
photonspulsesr for 300 nm Ti) are presented in Fig 29 (c) and
Fig 29 (d) respectively The Kα yields of the 20 μm targets are six and eleven times
larger than for the 300 nm Cu and Ti thin film targets respectively This is because at
these intensities the mean-free-path of the hot electrons is much larger (several microm
[121 130 172]) than the thickness of the thin film targets Therefore in the thin films only a
small fraction of all the hot electrons will create a hole in the K-shell and thus the Kα
emission is much less than for a bulk target
In the presence of an extended pre-plasma created by the pre-pulse the Kα yield
starts to improve After a certain time delay the Kα yields reach their maximum value
and start to drop with further increasing delay times A very similar behavior is
observed for thick and thin targets as can be seen from Fig 29 (c) and (d) These
results show that the pre-plasma which is generated by the controlled pre-pulse permits
effective Kα production At an angle of incidence of 45deg an ldquooptimumrdquo time delay for
Kα production exists on all types of targets Under these optimum conditions the Kα
production on all targets is improved by almost a factor of 2 whereby the coated targets
exhibit slightly better improvements than the thick foil targets On the other hand it
should be noted that the Bremsstrahlung-background also increases with increasing Kα
yield This is shown in Fig 29 (e) where the measured X-ray signal integrated in the
energy range from 6 - 30 keV for Ti and 10 - 30 keV for Cu is plotted as a function of
pre-pulse - main pulse delay These energy ranges have been chosen to exclude the
above mentioned many-pixel-events produced by single Kα photons since these
many-pixel-events contribute to the background only below the Kα energy
2 Optimization of a laser-plasma based X-ray source
22
Fig 29 Kα emission as a function of main pulse delay at a fixed
angle of incidence of 45deg on targets of different thickness (a) Cu and
(b) Ti (c) Kα emission of Cu-targets normalized to the emission
measured at negative delay time (52 times 108
photonspulsesr and 82
times 107
photonspulsesr for d = 20 μm and 300 nm respectively) (d)
Kα emission of Ti-targets normalized to the emission measured at
negative delay time (14 times 109
photonspulsesr and 12 times 108
photonspulsesr for d = 20 μm and 300 nm respectively) (e) Hard
X-ray background signal as a function of main pulse delay on 20μm
targets
2 Optimization of a laser-plasma based X-ray source
23
Fig 210 Absolute Kα emission as a function of main pulse delay at
different angle of incidence ( a ) Cu and ( b ) Ti The measured Kα
yield at negative or zero delay is the same as obtained without pre-
pulse
In the following a more systematic study of the influence of a pre-plasma on the
Kα production using the 300 nm thin film targets will be presented With their high
(optical) surface quality the uncertain condition for the formation of plasma caused by
2 Optimization of a laser-plasma based X-ray source
24
surface roughness can be avoided [173]
Based on the very similar behaviour of thin film
and bulk targets for the specific conditions of the measurements presented in Fig 29 it
is presumed that the results obtained on thin films which will be discussed below can
be transferred to thick targets (by scaling of the absolute yield) Fig 210 (a) and (b)
show the Cu and Ti Kα emission as a function of the main pulse delay at different
angles of incidence respectively Since the pre-pulse arrives after the main pulse and
thus does not play a role at negative delay time the X-ray yields obtained in this
situation will be refer to the situation as rdquowithout pre-pulserdquo in the later discussions
Introducing a pre-pulse results in an increase of the Kα yield which is particularly
important for small angles of incidence The Kα yield of both target elements exhibit
similar qualitative dependencies on delay time and angle of incidence though the Ti
target shows noticeably larger relative variations
253 Discussion
Due to the high contrast ratio laser pulses used in the present experiment the
scale-length in the absence of the controlled pre-pulse will be very small With short
scale-lengths as already discussed in section 251 the maximum absorption occurs at a
large angle of incidence αmax typically 70deg or 80deg [147 174 175]
In such a case the
absorption should increase monotonically with the angle of incidence and this is
expected to result in an increase of the Kα yield In Fig 211 the measured absorption
of the main pulse and the Cu and Ti Kα yield without pre-pulse from Fig 210 are
presented together The measurement was carried out at constant laser intensity
(~16 times 1017
Wcm2
for Cu and ~92 times 1016
Wcm2 for Ti) With a sample thickness of
300 nm no light is transmitted Thus the absorption A can be simply determined from a
measurement of the reflectivity R using the two photodiodes shown in Fig 23 as
A = 1 - R As can be seen in Fig 211 the laser absorption does indeed increase with
the angle of incidence α for both target elements so do the Kα yields These
observations are in agreement with the previous works [147 174 175]
2 Optimization of a laser-plasma based X-ray source
25
Fig 211 Absorption measurement with main pulse only measured
at constant laser intensity Scale on left hand side absorption scale
on right hand side Cu and Ti Kα yield without pre-pulse (data taken
from Fig 210)
With a specific target material the only two variable parameters determining the
plasma scale-length L are t (delay between the pre-pulse and the main pulse) and Te
(the electron temperature determined by the pre-pulse intensity) (see section 251)
When the pre-pulse laser intensity is constant L can be assumed to be approximately
proportional to t For this reason although the absolute values of the scale-length were
not measured in the experiment the relative values from these data can be deduced and
be compared to the theoretically estimated values assuming RA as the dominant
absorption mechanism This comparison revealed that the maximum Kα yields correlate
with the maximized absorption
Using (2πLλ) 23
sin2αmax = 06 as the condition to maximize RA (see section
251) optimum normalized scale lengths of 0135 0209 0392 and 0980 are
calculated for angles of incidence of 55deg 45deg 35deg 25deg respectively In Fig 212 (a)
the optimum delay times of the pre-pulse for maximum Kα emission in Fig 210 are
shown The maxima appeared at about 3ps 5ps 8ps and 15ps on the Cu target at 55deg
45deg 35deg and 25deg respectively For Ti they were at about 2ps 3ps 5ps and 11ps at
55deg 45deg 35deg and 25deg respectively Fig 212 (b) compares the optimum delay time
from Fig 212 (a) normalized to the value found at 55deg with the theoretical estimate of
the optimum scale length for RA normalized also to the 55deg-value Since the intensity
2 Optimization of a laser-plasma based X-ray source
26
was kept constant (of the pre-pulse as well as of the main pulse) the scale length is
proportional to the delay time The comparison shows that the normalized plasma scale
lengths for the best Kα yield from both target materials are in good agreement with the
theoretically estimated optimal scale length for RA The optimum pre-pulse delay
increases with decreasing angle of incidence since the optimum plasma scale length for
maximum RA increases with decreasing angle of incidence Fig 212 essentially proves
that a maximized absorption corresponds to maximum Kα yield
( a ) ( b )
Fig 212 (a) The optimum delay time for the pre-pulse having the
maximum Kα yields extracted from Fig 210 (b) Comparison of
experimental data and theoretical estimation Points are the
experimental data in (a) normalized to their respective value at 55deg
Dashed curve is the theoretical calculation of the optimum plasma
scale length for resonance absorption also normalized to 55deg-value
The theoretical curve is calculated from (2πLλ)23
sin2θ = 06
[147] and
its absolute value indicates at Y-axis on the right hand side
In order to see how the Kα yield develops for different conditions of plasma scale
length and angle of incidence the dependencies of the Kα yield as a function of the
angle of incidence for different fixed pre-pulse delay times t are deduced from the
data of Fig 210 and plotted in Fig 213 For the present experimental conditions t
essentially represents the value of the plasma scale length L and thus the data plotted in
Fig 213 show the Kα yield as a function of the angle of incidence for different plasma
scale lengths From the previous discussion of Fig 212 the plasma scale length at
t = 15 ps for Cu is estimated as L = 082 and for Ti L = 126 For t = 0 ps (very
short scale length) the Kα yield increases monotonically with α The maximum Kα
yield is beyond 55deg When the delay t (scale length) is increased the maximum Kα
yield shifts to a smaller angle of incidence eg in (a) for t = 4 ps the maximum
appears at 45deg for t = 7 ps at 35deg Finally t = 15 ps the Kα yield decreases
2 Optimization of a laser-plasma based X-ray source
27
monotonically with α indicating the maximum Kα yield is reached at angles of
incidence of less than 25deg As discussed above the maximum Kα yields correlate with
maximum absorption which in turn shifts to small angles of incidence at large t (large
plasma scale length) The behavior of the Kα yield proves once again that RA is the
dominant absorption mechanism
( a ) ( b )
Fig 213 Kα emission as a function of the angle of the incidence at
fixed pre-pulse delay a) Cu at t = 0ps 4ps 7ps 15ps ( b ) Ti at
t = 0ps 3ps 8ps 15ps
Since the goal for this study is to achieve the best Kα yield for time-resolved X-ray
diffraction experiments it is worth to compare the absolute Kα yield for different angles
of incidence at optimum scale length and without pre-pulse As can be seen from Fig
214 without pre-pulse the Cu and Ti Kα yields increase linearly with the angle of
incidence On the contrary at the optimum delay (optimum plasma scale length) the Kα
yield is essentially independent of the angle of incidence Although these observations
have not been fully understood it indicates that the reduced main-pulse-only yield at
smaller angles of incidence can be fully compensated (ie the yield can be brought back
to its maximum value) by an appropriate pre-pulse
2 Optimization of a laser-plasma based X-ray source
28
Fig 214 Cu and Ti Kα yield as a function of the angle of incidence
at the maximum value and without pre-pulse The lines are to guide
the eye only
If one extrapolates the linear dependencies measured without pre-pulse to higher
angles they reach the angle-independent optimized level at a finite angle of incidence
In the case of Cu this seems to occur at a large angle of incidence near 90o For Ti this
level is already reached at angles of incidence slightly above 60o This result might
arise from the presence of a short scale length pre-plasma caused by the leading edge of
the main pulse alone (even for a high contrast laser pulse and in the absence of any
further pre-pulse) As discussed for the absorption in Fig 211 it indicates that in the
present experiment at this large angle of incidence the plasma scale length generated by
the main pulse alone fulfills the condition for optimum RA and thus maximized Kα
generation Hence the optimized Kα yield can be achieved without introducing an
artificial pre-pulse ndash a conclusion which is also supported by PIC simulations (see
section 26) This would also explain why in many experiments even a relatively poor
contrast ratio laser system allows to achieve high Kα yields [130 148 152 156]
Nevertheless it can be concluded that for a given contrast ratio (given by the laser
system) and ion mass or a given scale-length in the experiment one should choose the
appropriate angle of incidence α to obtain the maximum Kα yield Or vice versa if α is
fixed then one has to adjust L accordingly via pre-pulse control Such an optimization
could be achieved at least in the range of the values of α and L (obtained from Δt)
covered by the current experiment ie α ~ 25deg hellip 55 deg and Lλ ~ 01 hellip 1
2 Optimization of a laser-plasma based X-ray source
29
Fig 215 Energy conversion efficiency vs angle of incidence with
pre-pulses and without pre-pulses
An important note concerning the energy conversion efficiency should also be
made here The angular independent optimized Kα yield shown in Fig 214 was
obtained by keeping the laser intensity constant The focused spot size projected onto
the sample surface increases with angle of incidence as 1cos() Therefore at large
angle of incidence (eg α = 80deg) one needs more laser pulse energy than at small
angles of incidence (eg α = 20deg) for the same amount of produced photons (In this
example a factor cos(20deg)cos(80deg) ~ 5 times more for α = 80deg compared to α = 20deg) It
can be noticed that the energy conversion efficiency from laser pulse into Kα X-rays
essentially decreases with the increasing angle of incidence To clarify this issue more
clearly the energy conversion efficiency has been deduced from Fig 214 using the
known laser energies Kα photon energies and Kα yields and is presented in Fig 215 In
principle the conversion efficiencies obtained here are in line with other experimental
results reported in the literature [129 176]
Without the pre-pulse the conversion efficiency
increases with the angle of incidence for both materials As already discussed in Fig
210 the absorption improves with increasing angle of incidence for the given small
pre-plasma scale length that is caused by the main pulse itself and thus leads to a higher
Kα yield On the contrary at the optimized pre-pulse conditions the conversion
efficiency decreases with increasing angle of incidence as predicted
2 Optimization of a laser-plasma based X-ray source
30
26 Comparison of the experimental results with simulations
Particle-in-Cell simulations (PIC) are a very powerful and direct numerical tool for
modeling laser-plasma interactions [177-179]
In the PIC simulation the charged particles
(electrons ions neutrals molecules dust particles etc) are modeled as individual
macro-particles moving in non-physical grid across the plasma (the cell part of the
name) using Newtons laws and self-consistently calculated electric fields resulting
from external (applied) fields and internal fields from charge distributions By solving
the equations of motion of these particles the moments of the distribution of the
particles such as densities and currents can be obtained simultaneously The results of
PIC simulations presented in this section were preformed by M Mašek and P Gibbon
with whom we cooperated
To obtain a quantitative estimate of the Kα production this simulation consists of
two steps The energy distribution of hot electrons generated by the laser-plasma
interaction was first determined with PIC simulations Then the total Kα photon yields
produced by fast electrons going inside the target were calculated with a Monte-Carlo
method which is a stochastic technique using random numbers and probability
statistics to investigate mathematical or statistical problems [180]
The detailed PIC simulations were performed by using the 1D3V (1 spatial 3
velocity coordinates) code BOPS (Boosted Oblique Particle Simulation) [127 131]
which
can treat oblique incidence Up to 6000 spatial grids and 500000 electrons and ions are
used in the simulation The laser is p-polarized with fixed intensities as in the
experiments The initial plasma parameters were chosen as close as possible to those
expected in the experiment More details can be found in Ref [181]
Fig 216 shows the dependence of absorbed energy on the plasma scale-length
from the simulation It is found that the scale length at which absorption becomes
maximum decreases with increasing angle of incidence qualitatively in agreement with
the simple RA-picture presented above (Fig 212(b)) Moreover the scale-length
dependencies of the absorption show a general qualitative correlation with the
experimental dependencies of the Kα yield with delay time as shown in Fig 210
2 Optimization of a laser-plasma based X-ray source
31
( a ) ( b )
Fig 216 The calculated absorbed energy as a function of the initial
plasma density scale length and incidence angle for Cu ( a ) and Ti
( b ) targets Pictures reproduced from Ref [181]
The total number of Kα photons generated by the hot electrons during their
propagation through the nonexcited solid material underneath the plasma layer was
calculated according to a standard cross section model using a method similar to Ref
[129 182] The electron distributions obtained from the PIC simulations are split into
several monoenergetic beams and transported through the foil which is divided into
several cells Using the relativistic K-shell ionization cross section [124]
the number of
generated Kα photons is calculated With the Monte-Carlo method each electron beam
is slowed down via collisions according to the Bethe stopping formula whereby the
stopping power is taken from the NIST database [183]
for both materials Once the
electron beam escapes from the rear of the target it is assumed to play no further role in
the Kα production a reasonable assumption because the foils were mounted on low-Z
(glass) substrates The reabsorption of Kα photons is also taken into account The
attenuation coefficient is taken also from the NIST database [184]
Fig 217 shows the dependence of the Kα yield on the initial density scale-length
It is clear that the qualitative behavior from Fig 217 (a) and 217 (b) is the same for
both materials as in the experiment (Fig 210) The Kα yield reaches its maximum for
roughly the same scale-length as the laser absorption indicating that the Kα yield is
largely determined by the absorption efficiency On the other hand the absolute values
of Kα yields obtained from the PIC simulations are roughly a factor of 3 to 4 times
lower than the measured values a discrepancy which could be due in part to the
geometrical simplifications in the model There are also differences in the positions and
2 Optimization of a laser-plasma based X-ray source
32
values of the Kα maxima although these are difficult to define precisely for the
simulations because of insufficient statistics
( a ) ( b )
Fig 217 Calculated Kα yield as a function of the intial plasma
density scale length and incidence angle for ( a ) Cu and ( b ) Ti
targets Pictures reproduced from Ref [181]
Finally I would like to add a comment on the time structure of these X-ray pulses
predicted from the PIC simulation although it does not directly relate to this
measurement The result of PIC simulation did show that the duration of these X-ray
pulses is in the sub-picosecond region [121]
and this prediction has been experimental
proved in the following time-resolved experiments
27 Summary
In summary the emission of Kα-photons of Cu and Ti targets was measured at
different laser intensities sample thickness angles of incidence and different pre-
pulsepre-plasma conditions It has been shown that for the given experimental
conditions an optimum laser intensity for Kα-production can be reached in the case of
Ti For Cu this optimum intensity appears to be higher than the maximum intensity
attainable in the experiment For constant laser intensity on a steep density gradient
plasma the Kα yield is highest at large angles of incidence For smaller angles the yield
decreases and reaches its lowest value when approaching normal incidence However
introducing a pre-pulse at appropriate time in advance to the main pulse the yield can
be increased to the same value as at large angle of incidence without a pre-pulse
Therefore the optimized Kα yield is independent on the angle of incidence and it can be
achieved by proper choice of the pre-pulse timing Experimentally this was verified for
angles between 25 deg to 55 deg
2 Optimization of a laser-plasma based X-ray source
33
It was also experimentally found and supported by simulations that the Cu and Ti
Kα generation follows the laser absorption as known for other materials [77 118 164 172
156 163 167] As expected resonance absorption (RA) has been proved to be the dominant
absorption mechanism in this process and optimization of the Kα production results
from a maximized absorption of the laser pulse For a high contrast laser system as
used in this experiment controlled pre-pulses provide well defined pre-plasma scale-
lengths allowing systematic investigation on the optimization of absorption Kα
production for the other given experimental conditions (material angle of incidence
pulse energy intensity) The simulations with these well defined initial parameters
show the qualitative agreement with experimental observations and provide insights
into the physical process of laser energy absorption hot electron generation electron
transport in the material and the resulting Kα generation
For practical purposes the present work indicates that for long plasma density
scale lengths created by the leading edge of a low contrast ratio laser system and other
experimental conditions (within the range Lλ ~ 01-10) the Kα emission from a laser
produced plasma could be optimized by operating the X-ray source at the matched
angle of incidence Experimental arrangements in which an unintentional (or
unavoidable) pre-pulse is present could probably be improved simply by using a small
angle of incidence instead of the 45deg geometry typical of many setups The present
study indicates that the X-ray emission could be increased by a factor of 2 or 3 in this
case with obvious advantages for many applications of fs-Kα sources such as time-
resolved X-ray diffraction (TRXD) On the other hand for a high contrast laser system
leading where the self generated plasma exhibits a steep density gradient (small scale
lenghth) these findings still suggest to use a small angle of incidence and a matched Δt
For the same value of Kα emission this requires less energy to achieve the same on-
target intensity as with a large angle of incidence and subsequently leads to a better
energy conversion efficiency
In the following chapter these results are applied to improve the laser-plasma
based X-ray source for the TRXD experiments
3 Improvement of the modular setup for time-resolved X-ray diffraction experiments
34
3 Improvements of the modular setup for
time-resolved X-ray diffraction experiments
As it has been discussed in detail in the previous chapter focused laser intensities
in the range of 1017
- 1018
Wcm2 are required to efficiently generate X-rays in the
multi-keV range If the irradiated target is surrounded by an atmosphere non-linear
effects (eg self-phase-modulation self-focusing [185]
) and plasma formation
(breakdown) in the atmosphere will severely deteriorate the spatial intensity
distribution of the focused femtosecond pulse and the required on-target intensities
cannot be reached Therefore the X-ray target has to be placed in vacuum Two
different set-ups to perform time-resolved X-ray diffraction are currently used at the
University of Duisburg-Essen One scheme uses a large vacuum chamber to place not
only the X-ray target but the whole setup (including X-ray optics samples and
detectors) under vacuum [70 140]
This scheme avoids absorption losses of the generated
X-rays in air (which is more critical for lower energy radiation like Ti K- 451 keV)
but it poses some geometrical restrictions due to its limited size Moreover operation of
the setup is relatively complicated since most of the components in the chamber require
remote control
To overcome some of these drawbacks a second scheme for time-resolved X-ray
diffraction experiments had been designed and built up mainly by Dr Matthieu Nicoul
[186] and since then it has been continually further developed This setup has a modular
design and only the X-ray sourcetarget itself is operated under vacuum and all the
other experimental components are placed in air This gives a lot of advantages such as
more space for experimental components and convenience in adjusting them It was the
aim of the work described in this chapter to improve the existing setup to allow for
time-resolved Bragg-diffraction experiments with increased accuracy (see chapter 5)
and to enable new experimental schemes that had not been possible before (ie time-
resolved Debey-Scherrer-diffraction see chapter 6) In the first part of this chapter the
fundamental components of the previously existing setup are briefly described In the
3 Improvement of the modular setup for time-resolved X-ray diffraction experiments
35
second part I present and discuss the implemented improvements including hardware
software and methodology Finally a summary for this chapter is given
31 The fundamental components of the current setup
A scheme of the current setup is shown in Fig 31 The fundamental components
(labeled with black letters on Fig 31) had already been described in detail in Ref
[186] In order to provide the necessary information to the reader the important
components will be briefly pointed out in this section The implemented
improvementsadditions to this setup are also represented on Fig 31 (labeled with blue
letters) and they will be discussed in the next section 32
Fig 31 Scheme of the current modular setup for time-resolved X-
ray diffraction experiments The elements labeled with black letters
are components of the previously existing setup and the ones labeled
with blue letters are components implemented during my PhD work
The CPA Tisapphire laser system described in chapter 2 delivers 150 fs laser
pulses at a wavelength of 800 nm with an energy of 120 mJ at a repetition rate of 10
Hz The laser beam (the red optical path in Fig 31) is split into two parts by a mirror
with a small off-center hole (7mm in diameter) The transmitted part serves as the
3 Improvement of the modular setup for time-resolved X-ray diffraction experiments
36
optical pump beam to excite the sample under study while the reflected part is focused
by a lens of 300 mm focal length onto a Cu-tape target with an incident angle of 45ordm (p-
pol) to produce the Cu Kα (805 keV) probe pulse
For the reasons mentioned in the introduction of this chapter the Cu-target is
placed inside a compact vacuum chamber (size 24times30times30 cm3) which includes
connectors for the vacuum pump a pressure gauge and electrical feedthroughs as
shown in Fig 32 For mechanical and radiation safety reasons this chamber is made of
stainless steel with a wall thickness of 15 mm Additionally a 2 mm lead cover was
added inside the chamber to enhance security and to reduce the level of background
radiation that may reach the detector The working pressure of the chamber is 01 mbar
(a) (b)
Fig 32 Overview of chamber (a) outside and (b) band target inside
the chamber
The target consists of a 10 microm thick Cu tape mounted on a motorized spooling
system which works similarly to an audiocassette recorder (Fig 33 (a)) The pulling
speed is approximately 8 mms (ie 800 microm motion between two consecutive laser
pulses) to ensure that a fresh surface area is provided for each laser pulse The tape
shifts vertically to its pulling direction by about 08 mm when the pulling direction is
(automatically) changed One set of band (25 mm wide and 15 m long) can provide
more than 12 hours experiment time In order to minimize the deposition of ablated
material in particular at the small hole where the X-rays can leave the chamber [187]
a 8
μm Kapton foil has been rolled together with the Cu tape before mounting it to the
spooling system The Kapton foil runs simultaneously with the tape to pick up the
debris which is predominantly ejected at the back-side of the tape normal to its
surface [187]
Close to the laser-target interaction point it is mechanically separated from
the Cu tape by about 2 mm (see Fig 33 (b))
3 Improvement of the modular setup for time-resolved X-ray diffraction experiments
37
(a) (b)
Fig 33 (a) Photo of band target (b) Kapton foil used for reducing
material deposition
Using a pin-hole camera the size of the X-ray source on the tape target was found
to be similar to the spot size of the focused laser beam ie ~25 microm [187]
The Cu Kα
emission is close to 5times109 photonspulse in 4π solid angle without pre-pulse and 1times10
10
photonspulse with an optimized pre-pulse (see section 321) Since the X-ray emission
is into the full solid angle a multilayer X-ray optic with Montel-Helios geometry [188]
is
used to collect the radiation and to refocus it onto the sample under investigation The
multilayer X-ray optic reflects both the Cu Kα1 and Kα2 emission lines but suppresses
other spectral components (ie K) More details on the working principle and the
specifications of this mirror can be found in Appendix A
The focused X-ray beam was characterized at different positions of the beam path
through four relevant parameters [186]
the beam profile directly after the multilayer
optic the total number of reflected photons the convergence of the beam and the size
of focus spot A direct detection CCD camera was used to measure the first three
relevant parameters of the X-ray beam since it allows a rather accurate estimation of
the absolute detected X-ray signal (eg number of diffracted photons per pulse) A X-
ray beam profile taken at 4 centimeters after reflection on the multilayer optic is shown
in Fig 34 (a) Since the X-ray emission from the plasma is isotropic (ie homogeneous
illumination of the mirror) the intensity distribution measured at such a short distance
after the optic gives direct information on the spatial reflection properties of the two
multilayer mirrors The image in Fig 34 (a) demonstrates the uniformity of the
reflectivity over the mirror surfaces Due to the mounting configuration of the
multilayer mirrors inside the housing the beam shape is a 45deg rotated square [Appendix A]
The convergence angle of the beam was measured to be approximately 023deg which
3 Improvement of the modular setup for time-resolved X-ray diffraction experiments
38
corresponds to the specifications of the manufacturer (024deg) Using the known
sensitivity of the direct detection CCD camera [186]
the Cu Kα flux in the focused beam
can be determined from images like the one shown in Fig 34 (a) With an optimized
pre-pulse a typical flux of 13times105
photonspulse was obtained The intensity
distribution at the focus spot was measured with an indirect phosphor based detector
(Gemstar) [186]
A typical image with horizontal and vertical cross sections is shown
in Fig 34 (b) The measured FWHM of the focus spot is 150 microm in horizontal and 127
μm in vertical With the given source size of approximately 25 microm and the 5x
magnification of the multilayer optics this is close to the expected value
(a) (b)
Fig 34 (a) Topography of Cu Kα beam observed with the direct
detection CCD camera 4 cm after reflection on multilayer mirror (b)
Intensity distribution of Cu Kα emission at the focal point of the
multilayer optic obtained with the phosphor based detector Pictures
reproduced from Ref [186]
Since most of the experimental components of the modular setup are placed in air
they are easily accessible and can be conveniently manipulated In order to minimize
losses by absorption of the Cu Kα-radiation in air [189]
the optics housing is purged with
He and He-purged beam-tubes were installed in the X-ray beam path Although the X-
ray beam path cannot be covered completely more than 90 of the radiation collected
and reflected by the X-ray optic is delivered to the sample
The samples are mounted on a motorized x-y-θ stage to adjust the Bragg-angle (θ)
and the beam position on the sample (x-y) The diffraction signals have been recorded
so far by two different X-ray sensitive area detectors The first detector is a direct
3 Improvement of the modular setup for time-resolved X-ray diffraction experiments
39
detection CCD-camera (type PI-MTE 1300B) which has also been used for the
measurements discussed in chapter 2 As it has been explained before due to the strict
relation between the X-ray photon energy and the generated charge this detector can be
used as a spectrometer (see chapter 2) and allows determination of the absolute X-ray
signal with rather high accuracy (single photon sensitivity) The low quantum
efficiency (18 ) and the slow readout time are its main drawbacks The second area
detector uses indirect detection A phosphor screen converts incoming X-ray photons
into visible photons The optical signal is amplified by an image-intensifier and then
detected by a normal CCD Although this system allows single photon detection at high
gain of the intensifier there is no well-defined relation between the detected signal and
the X-ray photon energy On the other hand this detector has a high quantum efficiency
(85 for Cu Kα radiation [186]
) and high read-out rate (up to 10 Hz) so that an image
can be recorded for each single X-ray pulse A more detailed discussion of these
detectors and their specific advantages and drawbacks can be found in Ref [186] as
well as in Appendix B
The energy of the pump beam used to excite the sample is adjusted with a half-
wave-plate in conjunction with a thin film polarizer and monitored with a PIN diode A
motorized translation stage with a retro-reflector allows varying the delay between the
optical pump and the X-ray probe beam The p-polarized pump beam is focused with a
lens of 1 meter focal length onto the sample surface The angle between laser pump and
x-ray probe beam is set to be as small as possible ie approximately 10deg In order to
ensure that the measured diffraction signals represent the response of an almost
homogeneously excited region the diameter of the pump beam is chosen to be at least 3
times larger than the X-ray spot size Since the available amount of energy in the pump-
path (about 1 mJ per pulse) is more than sufficient for the experiments discussed in this
thesis a diaphragm has been used to adjust the pump beam spot size A removable
mirror which can be inserted in the beam path directs the beam to a CCD camera
positioned at a position equivalent to the distance to the sample to monitor the size and
the shape of the focused beam
32 Improvements of the modular setup
During my thesis work several improvements of the setup have been implemented
in order to (i) optimizeincrease the X-ray flux of the plasma source (ii) improve the
measurement sensitivityaccuracy and (iii) automatize and speed up the experimental
3 Improvement of the modular setup for time-resolved X-ray diffraction experiments
40
procedures This section describes in detail the necessary steps and modifications which
were essential to achieve the results of the time-resolved diffraction experiments
discussed in the following chapters in particular the results of the phonon softening
obtained on photo-excited Bismuth (Chapter 5)
321 Controlled pre-pulse to enhance the X-ray production
In chapter 2 it has been discussed in detail that a controlled pre-pulse with suitable
delay can be used to improve the X-ray production Based on this result a pre-pulse unit
(beam splitter and combiner delay stage see the black-dotted box in Fig 31) has been
added to the modular setup The main pulse energy is 110 mJ and the pre-pulse energy
is 15 mJ which results in intensities at the focus of the lens of 16times1017
Wcm2 for the
main pulse and 20times1014
Wcm2 for the pre-pulse respectively With a pre-pulse
arriving 5 ps before the main pulse the X-ray production of the modular setup has been
improved by about a factor of 2 which leads to more than 105 Cu Kα photonspulse
collected and focused by the X-ray mirror on the sample under normal experimental
conditions The positive effect of the pre-pulse was also briefly underlined and
presented in Dr Nicoulrsquos thesis
322 Avalanche photodiode (APD)
It was pointed out by Nicoul [186]
that the modular setup with the
magnifyingcollimating Montel-optic is most appropriate for experiments in which the
shape or angular position of the rocking curve of the excited sample does not change
but only the total diffraction efficiency (ie due to structure factor changes) Under
these conditions it is not necessary to use a detector with 2D resolution and therefore a
single-channel detector is sufficient Since the diffraction efficiency of the thin-film
samples typically used in the time-resolved experiments is low (10-3
-10-4
resulting in
diffraction signals of 10 - 100 photonspulse) a detector with high sensitivity down to
the single-photon level is required X-ray sensitive avalanche photodiodes (APD) fulfill
these requirements An APD is a photodiode with internal gain obtained by applying a
high reverse bias voltage to the photodiode which creates an intense electric field inside
its volume It combines the benefits of a photomultiplier tube (gain) and conventional
photodiodes (high quantum efficiency)
3 Improvement of the modular setup for time-resolved X-ray diffraction experiments
41
For the modular setup a large area (10 mm in diameter) Silicon APD was chosen
(its technical data are given in Appendix B) Using the direct detection CCD for
calibration the quantum efficiency of the APD for Cu Kα radiation was measured to
(36 plusmn 7) in agreement with previously published data [190 191]
This detector can be
easily operated at a repetition rate of 10 Hz and with more convenience (compact size
no need for water cooling) as compared to the phosphor based area detector To digitize
the detected X-ray signal a gated charge-integrating analogue-to-digital converter
(ADC) [192]
is used In order to match the APD-output to the input specifications of the
ADC a pulse shaperamplifier is added directly to the APD
The APDADC-combination was calibrated for the detection of Cu Kα radiation by
reducing the incident X-ray signal to the few-photons-per-pulse-level (0 to 6) and
analyzing the signal value distribution (histogram) of a large number of pulses
(typically a few thousand) for different bias voltages Results are shown in Fig 35 (a)
The signal value distributions exhibit a multi-peak structure as it is expected for a Si-
detector with its rather well defined relation between the charge generated by a single
X-ray photon and the photon energy (e g one Cu Kα photon produces 366 times 10 -4
pCb)
A multi-peak fit was applied to separate the individual peaks and to determine in
particular the position of each peak (marked in the figures) The first left peak
corresponds to the dark current background (no photon detected proven by blocking
the X-rays) and the second third fourth hellip peaks are correspond to one two three hellip
detected photons respectively By plotting the peak position as a function of photon
number in Fig 35 (b) and fitting the result by a linear function (Y = m + n X) the
corresponding ADC output (given in counts) for the background signal (parameter m)
and for a single Cu Kα photon (parameter n) can be determined for different bias
voltages The result is shown in Fig 35 (c) The ADC output per Cu Kα photon (black
squares) increases rapidly with bias voltage reflecting the corresponding increase of the
APD-gain It has to be noted that the dark current is also amplified with increasing bias
voltage underlined by the increase of the background signal (red circles)
Since the X-ray-to-charge conversion is known as well as the amplification of the
amplifier (11x) and the sensitivity of the ADC (32 counts per pCb) this APD-gain can
also be deduced from the information above The result is plotted in Fig 36 as a
function of bias voltage together with results of optical measurements (see below) and
data provided by the manufacturer All data are in a good agreement and the maximum
gain of 103 is proven to be achievable with this device
3 Improvement of the modular setup for time-resolved X-ray diffraction experiments
42
(a)
(b) (c)
Fig 35 (a) The signal value distributions (histograms) measured
with the APD at the few-photons-per-pulse-level at different bias
voltages The blue curves are the total multi-peak fits and the green
peak profiles are the separated individual peaks The peak positions
are indicated on the top of each peak (b) The values of peak
positions in (a) as a function of the number of detected photons
With the linear fitting function (Y = m + n X) the background
signals and corresponding ADC outputs (given in counts) pre Cu Kα
photon can be determined by the fitting parameter m and n
respectively (c) The corresponding ADC outputs per Cu Kα photon
(black square points) and the background signals (red circle points)
at different bias voltages
3 Improvement of the modular setup for time-resolved X-ray diffraction experiments
43
Fig 36 Comparison of the gain of APD from three measurements
Fig 37 APD signal as a function of PIN diode signal with different
operating voltages
Another important information concerns the question whether the (electric) output
signal is proportional to the (X-ray or light) input signal (linearity) The linearity of the
APD was checked by measuring an optical input with the APD at different bias
voltages and a regular Silicon PIN-diode which was known to be linear over the used
range of incident optical power In Fig 37 the APD-signal is plotted as a function of
the PIN diode signal for different APD bias voltages It turns out that the response of
the APD is linear for an ADC-output up to about 1000 counts For higher signal levels
the response becomes nonlinear Since the APD and the assembled electronic
3 Improvement of the modular setup for time-resolved X-ray diffraction experiments
44
shaperamplifier were not tested separately the source of the nonlinearity cannot be
determined at this point In the time-resolved diffraction experiments the nonlinearity
of the APD needs to be taken into account and corrected
323 Ionization chamber detector (ICD)
(a) (b)
Fig 38 (a) Photo of the ionization chamber detector and (b) its
working scheme
In order to normalize the diffraction signals and to determine the changes in the X-
ray diffraction efficiency of an optically excited sample with high accuracy it is
necessary to measure also the (relative) incident X-ray flux for each pulse For this
purpose a small ionization chamber detector has been placed behind the X-ray
multilayer optic A photo of the installed chamber and its working scheme is shown in
Fig 38 Part of the Cu Kα radiation reflected by the optic is absorbed and ionizes the
Ar-gas with which the cell is filled The Ar-pressure is around one atmosphere At 8
keV a transmission of 72 is measured and it agrees with the expected transmission
value of 16 cm Ar at 1 atm plus 16 μm of Kapton foil used as cell windows [189]
To
collect the charge generated by ionization a high bias voltage is applied (2000 kV) A
high speed current amplifier (type DHPCA-100 FEMTO) with a gain of 105 is used to
3 Improvement of the modular setup for time-resolved X-ray diffraction experiments
45
match the output signal of the ionization chamber to the input of the gated charge-
integrating ADC (same as used for recording the APD-signals)
In order to characterize the ionization chamber detector its linearity was measured
using the phosphor based area detector which can be regarded as a linear detector The
result of this measurement shown in Fig 39 (each data point corresponds to an
acquisition time of 30 sec) clearly shows the linear response of the ionization chamber
Fig 39 Calibration between ionization chamber detector and
phosphor based detector Red dashed line is a linear fit of the
measured data
Fig 310 Long term drift of the normalized ratio
3 Improvement of the modular setup for time-resolved X-ray diffraction experiments
46
It should be noted that the output signal of the ionization chamber is surprisingly
very sensitive to changes of the Ar-pressure (approx 30 change of signal for lt1
change of pressure) Therefore the pressure inside the chamber needs to be stabilized
during the whole measurement For this purpose a pressure control system consisting
of two pinhole valves and a pressure gauge was implemented (see Fig 38) It allows
stabilizing the pressure inside the chamber to about plusmn01 mbar (relative to the external
pressure) Despite stabilizing the pressure in the ICD we observed long term drifts of
the ICD-signal during the diffraction measurements As an example the ratio between
the APD and ICD signals from one representative measurement recorded over about
one hour is presented in Fig 310 The large pulse-to-pulse variations of the ratio are
caused by the counting statistics limited fluctuations of the APD-signal (only a few
photons per pulse are detected in this particular measurement) Additionally the ratio
which should be constant on average changes slowly with time So far no clear
explanation has been found for this effect These drifts can severely limit the achievable
accuracy in a time-resolved experiment when for example the different pump-probe
delays are sequentially measured during an experimental run The issue has been solved
by applying a ldquofastrdquo delay scanning technique in the experiments which will be
discussed in section 3262
324 Experiment control program
The modular setup is entirely controlled by a software program developed using
the LabVIEW environment The functions of this program include control and
monitoring of the different elements and detectors in the setup as well as data recording
and pre-processing All functions can be accessed from one interface (shown in Fig
311) which has been geometrically divided into two parts
3 Improvement of the modular setup for time-resolved X-ray diffraction experiments
47
Fig 311 Interface of the experiment control program
The upper part (part I) is used to prepare an experiment and to perform some
simple test measurements eg checking signal levels the background signals of the
detectors etc Frame (Ia) is a control panel for the pump-probe delay unit In frame
(Ib) the detected signals from individual detectors (ie PIN diodes APD ICD) can be
selected and displayed The received data can be recorded into files Frame (Ic) is a
waveform graph to show the histogram of the signal of the detector selected in frame
(Ib) Frame (Id) displays the real time trace for the selected detector
The lower part (part II) is used for the time-resolved diffraction experiments In
region (IIa) one can enter the relevant measurement settings eg background signal of
the different detectors acquisition time for the individual measurement points delay
range delay steps and saving folder Frame (IIb) shows the real time traces of the
measurement and the ratio APDICD The five indicators at the bottom of this frame
indicate the status of the measurement system Frame (IIc) displays a constantly
updated preliminary analysis (ie ratio APDICD vs delay time) of the measured data
In region (IId) several switches allow to change between different operation modes of
the tape target the laser triggering and the delay unit (eg fast scanning see below)
3 Improvement of the modular setup for time-resolved X-ray diffraction experiments
48
Frame (IIe) displays the correlation between APD and ICD and Frame (IIf) displays the
pump beam energy
part I To prepare the experiments and to perform some simple test measurements
Frame (Ia) Control of the pump-probe time delay
Frame (Ib) Selection and value display of the signals from individual detectors
Frame (Ic) Display of the signal value distributions of the selected detectors
Frame (Id) Display of real time traces for the selected detectors
part II To perform the time-resolved diffraction experiments
Frame (IIa) Input of the relevant measurement settings
Frame (IIb) Display of real time traces of APD ICD and their ratio
Frame (IIc) Display of a preliminary analysis of the measured data
Frame (IId) Control of tape motion and ldquofastrdquo scanning
Frame (IIe) Display of APD-signal vs ICD-signal
Frame (IIf) Display of the pump beam energy
Table 31 The functions of the individual areas in the user interface
of the experiment control program
For a better overview the functions described above are briefly summarized in
Table 31 This program has been proven very useful during the performed experiments
However further improvements are possible For example integration of control
functions for the sample holder might be required to allow a synchronized motion of
the sample during data acquisition (eg for experiments where the sample is
irreversibly damagedmodified by a single laser pulse)
325 Spatial and temporal overlap adjustments with APD
A very important and non-trivial part of performing a time-resolved diffraction
experiment is to find spatial and temporal overlap between the (invisible) X-ray probe
beam and the laser pump beam To find spatial overlap a similar procedure is applied
as described in Ref [186] The sample is moved vertically and horizontally with the
translation stage in order to scan its border through the X-ray beam Since the sample
surface is monitored by a camera on a video screen the disappearance of the X-ray
diffraction signal allows to localize the X-ray beam position by marking the sample
border in horizontal and vertical direction on the screen Then the optical beam can be
easily adjusted to overlap with X-ray beam on the marked position The spatial overlap
needs to be checked before every measurement
Once the spatial overlap is established the temporal overlap is adjusted by
exciting the sample with the laser and monitoring changes of the diffraction signal
while scanning the delay stage Two examples are presented in Fig 312 which show
3 Improvement of the modular setup for time-resolved X-ray diffraction experiments
49
the relative decrease in the diffraction signal upon laser excitation on thin films of Au
(333)-reflection (a) and Bi (111)-reflection (b) While the different physical processes
responsible for the observed signal changes will not be discussed here (see chapter 4
and 5) the time-traces allow to determine delay zero (temporal overlap) The accuracy
depends obviously on the speed of the induced changes and can reach the sub-
picoseconds level if the changes are fast (ie Bi) Moreover it should be emphasized
that using the APD and the new experiment control program allows to obtain such
results in just a few minutes Without the implemented improvement it usually took
around 45 to 60 minutes for the same purpose [186]
Finally it should be noted that the
observed decay of the Bi-diffraction signal in less than 400 fs (Fig 312b) represents an
upper limit for the temporal resolution that is possible with the modular setup A
temporal resolution of about 100 fs has been demonstrated with a similar X-ray source
in Ref [106]
(a) (b)
Fig 312 Time-resolved measurements with high temporal
resolution detected using APD (a) Au (333) and (b) Bi (111) The
cyan dashed line marks the position of time zero
326 Normalization of X-ray signals
Since only a few photons per pulse are diffracted from the thin film samples
typically used in the time-resolved X-ray diffraction experiments it is necessary to
accumulate signal over a sufficiently long time (a few hours are usually required for a
complete experiment) to enable the measurement of transient changes of the diffraction
efficiency at the percent level During this time the variation of the X-ray flux
delivered to the sample cannot be avoided without a normalization procedure In the
following one needs to distinguish between short-term fluctuations and long term drifts
3 Improvement of the modular setup for time-resolved X-ray diffraction experiments
50
Short-term fluctuations refers here to all intensity variations of the X-rays
occurring within seconds down to pulse-to-pulse fluctuations They are mainly caused
by energy and spatial (pointing stability) instabilities of the driving laser As mentioned
in chapter 2 the laser energy essentially affects the total X-ray yield Hence the pulse-
to-pulse energy fluctuation results in a fluctuation of the X-ray output signal For the
modular setup spatial instabilities represent the most critical issue which had already
been detailed discussed in Ref [186] Together with the position instabilities of the
copper tape with respect to the focused laser spot (caused mainly by mechanical
instabilities of the pulling system) the finite pointing stability results in fluctuation of
the spatial position of the X-ray source Due to the short source-to-mirror distance the
overall reflection efficiency of the multilayer X-ray optic is very sensitive to variations
of the source position which lead to significant changes of the X-ray output behind the
optic
Long term drifts refer to variations of the X-ray flux within minutes up to hours
(see Fig 310) While the sources of these drifts are not completely understood it must
be noted that they cannot be simply averaged out
Therefore suitable measurement schemes with reliable normalization procedures
are required to maximize the accuracy of the measurement and to minimize the
necessary experimental time Two measurementnormalization schemes are described
and discussed in the following sections which allow to handle both short term
fluctuations and long term drifts
3261 Chopping normalization scheme with a shutter
The first normalization scheme I call the chopping method which is a low
repetition rate variant of a well-known normalization scheme used for all-optical pump-
probe experiments at high repetition rate laser systems [193-196]
In this scheme the pump
beam is periodically blocked (chopped) in order to record the probe signal with and
without laser excitation within a short time interval To achieve this a mechanical
shutter is installed in the pump beam path (see Fig 31) and operated at 1 Hz with an
opening time of 05 sec Given the 10 Hz repetition rate of the laser system the
diffraction signal is recorded 5 times with sample excitation followed by 5 times
without sample excitation within one shutter cycle The signals from the PIN diode
used to monitor the pump beam energy allow to mark ldquopumpedrdquo and ldquoumpumpedrdquo
events in the data stream The relative change of the signal due to the laser excitation
3 Improvement of the modular setup for time-resolved X-ray diffraction experiments
51
can be retrieved by normalizing the sum of ldquopumpedrdquo signals to the sum of the
ldquoumpumpedrdquo signals In this way both short term fluctuations (by averaging) and long
term drifts (by comparing pumped and unpumped signals every second) are
properly taken into account However only one half of the total flux contributes to the
transient diffraction signal while the other half is used for normalization
Fig 313 Chopping normalization scheme Standard deviations as
function of integrated acquisition time with different detected photon
numbers per pulse Data points obtained from the experiment and
solid curves are calculated from counting statistics
In the ideal case the achievable accuracy of the experiment is determined by the
counting statistics through the total number of detected photons (given by the laser
repetition rate the number of diffracted photon per pulse and the acquisition time)
Since the laser repetition rate is fixed and the number of diffracted photons per pulse is
determined by the diffraction efficiency of the sample and the X-ray source
performance the acquisition time is the only parameter to control the accuracy of the
experiment In order to define the required acquisition time for a desired accuracy a
series of test measurements were performed with Bi- and Au- samples Each set of the
diffracted signals from these two samples were recorded with the APD for
approximately one hour in the same experimental conditions without sample excitation
The detected APD-signal for each set of data was varied by changing X-ray source
production (adjusting the energy of the driving laser for the X-ray source) and by
choosing different Bragg-reflections The data are analyzed with a MATLAB routine
3 Improvement of the modular setup for time-resolved X-ray diffraction experiments
52
which artificially groups the data in pumped and unpumped events (assuming
chopping at 1 Hz) and averages and normalizes the diffraction signal over bins of
different size (ie the number of pulses used to produce one normalized data point)
Each specific binning produces a set of data with different number of points as the
number of points times the binning size equals the same number determined by the total
acquisition time The standard deviations of each data set are calculated and presented
in Fig 313 as a function of the acquisition time for one point (determined by the
binning size) Since the APD has been calibrated one can calculate the expected
standard deviation of the measured diffraction signal S assuming that it is determined
only by counting statistics as 21 NSS where N is the total number of detected
photons in the respective acquisition time [197 198]
These calculated values are plotted as
solid lines in Fig 313 and they are used to compare to the experimentally determined
values Note that due to the chopping method used for normalization only one half of
the detected photons contributing to the signal have been taken into account in the latter
calculation (the other half has been used as reference for the normalization) As one can
see in Fig 313 the experimental data strictly follow the counting statistics curves with
the respective number of detected photons It indicates that this normalization scheme
allows to reach the fundamental limit set by counting statistics in the experiment
Moreover this figure also provides the required acquisition time for a desired accuracy
for a given diffraction signal (number of detected photons per pulse) For example if
one intends to have an accuracy of 1 with 23 detected photons per pulse an
acquisition time of 150 seconds per data point is sufficient
3262 Direct normalization scheme with the ionization
chamber detector
As I have already pointed out in section 323 that the ICD allows the direct
measurement of the X-ray beam intensity behind the multilayer optic The signals
generated by the ionization chamber are proportional to the incident X-ray flux on the
sample Therefore they can be used as a reference to normalize the diffraction signals
on a pulse-to-pulse basis In order to account for the long term drift of the ICD signal
mentioned in section 323 a ldquofastrdquo scanning technique adapted from all-optical
experiments [199]
has been combined with this normalization scheme Fast scanning
means that the full delay range to be investigated in a particular experiment is
3 Improvement of the modular setup for time-resolved X-ray diffraction experiments
53
repetitively scanned in a relatively short time (during which drift effects are small) and
the data from all scans are summed up and averaged
In order to check the accuracy achievable with this scheme a series of similar test
measurements as above were performed using the ICD for normalization for different
levels of the diffraction signals (given again in number of detected photons per pulse)
This time the data were treated as a set of ldquofastrdquo scanning measurements by artificially
sorting them into a number of delay scans with a certain number of delay points and
pulses per delay before normalization As the result of this analysis Fig 314 shows the
obtained standard deviation as a function of the total measurement time for a single
delay at different levels of the diffraction signal (data points) and compares the
experimental data to calculated curves assuming again counting statistics as the limiting
source of error Again the experimental data agree well with the counting statistics
curves demonstrating that the fast scanning scheme can indeed correct the long term
drifts
Fig 314 Direct normalization scheme with the ldquofastrdquo scanning
technique Standard deviations as a function of integrated acquisition
time with different numbers of detected photons per pulse Point data
obtained from the experiment and solid curves are calculated from
counting statistics
3 Improvement of the modular setup for time-resolved X-ray diffraction experiments
54
3263 Comparison of normalization schemes
Finally the two normalization schemes discussed above will be compared in this
section for similar experimental conditions (ie same X-ray flux after the X-ray optic
same diffraction efficiency of the sample) For this comparison one needs to consider
that the ICD has a transmission of 72 Therefore using the direct normalization
scheme 28 of the incoming X-ray flux serves as reference signal and only 72 are
used for diffraction Since the number of detected photons in the ICD is large (a few
times 104) the error of the measurement with direct normalization is determined only by
the counting statistics of the diffraction signal (see previous section) The standard
deviation in this case isn)720(
1
tr where r is the repetition rate of laser t is the
total integration time in second and n is the number of detected photons per pulse On
the other hand when the chopping scheme is used for normalization the ICD can be
removed from the beam path and the full X-ray flux reaches the sample However as
already mentioned above only one half of the total signal contributes to the transient
diffraction signal while the other half is used for normalization Both transient
diffraction and normalization signals are limited by counting statistics which doubles
the error of the normalized signal Then the standard deviation in this case gives as
ntr )2
(
2 Combining this information one can show that for the same
experimental conditions (with same r t n) the direct normalization scheme (with fast
scanning) should give a factor of 17 better accuracy than the chopping scheme
3 Improvement of the modular setup for time-resolved X-ray diffraction experiments
55
Fig 315 Comparison of the chopping normalization scheme and the
direct normalization scheme (with ldquofastrdquo scanning processing) for
the same amount of incident photons from the X-ray optic (a) with 7
and 5 detected photons (b) with 23 and 15 detected photons and (c)
with 110 and 81 detected photons for the chopping and direct
normalization scheme respectively
Fig 315 compares the measured error (data points) as a function of accumulation
time for the two normalization schemes at different levels of the diffraction signal (the
signal level for direct normalization with the ICD is lower than for the chopping
scheme to account for the transmission losses of the ICD) The red and blue curves
3 Improvement of the modular setup for time-resolved X-ray diffraction experiments
56
show the calculated error based on counting statistics Not only do experimental and
calculated errors agree very well the data quantitatively confirm the advantage of the
direct normalization scheme discussed above
In conclusion the direct normalization scheme represents the most efficient way to
perform time-resolved diffraction measurements with the modular setup Depending on
the level of the diffraction signal an accuracy of better than percent for an individual
data point can be achieved with accumulation times of tens of seconds to a few
minutes
33 Summary
This chapter discussed a modular setup for time-resolved X-ray diffraction
experiments at the University of Duisburg-Essen All components of the previously
existing setup as well as the components that have been added to improve its
performance have been presented and characterized Due to its compact design the
setup is easy to operate and adjustments of components are convenient Applying the
results discussed in chapter 2 the X-ray production in the setup has been improved
using a controlled pre-pulse Using an avalanche photodiode as detector for the
diffraction signal it has been shown that the combination of direct normalization with
an ionization chamber as reference detector and the ldquofastrdquo delay scanning scheme
represents the most efficient way to achieve a high measurement accuracy The setup in
its current status has proved its capabilities through several preliminary experiments
and has been successfully used for the diffraction experiments that will be presented in
the following chapters
4 Observation of the Debye -Waller effect in Au
57
4 Observation of the Debye -Waller
effect in Au
Ultrafast x-ray diffraction is a relatively new technique that provides both high
temporal and atomic scale spatial resolution to directly observe the atomic motions and
changes in the atomic structure of matter upon optical excitation This chapter will
present a laser-pumpX-ray-probe experiment on a thin Au film the first time-resolved
experiment performed with the modular setup described in the previous chapter The
lattice vibrations that result from the electronic energy relaxation following optical
excitation have been directly observed through the DebyendashWaller effect The rise times
of the lattice temperature were measured for different absorbed laser fluences and
compared with the Two-Temperature Model (TTM) [200]
These experimental results are
consistent with previous data obtained by ultrafast X-ray diffraction [61]
as well as
ultrafast electron diffraction [201]
and prove the capability of the new built modular
setup
This chapter is organized as follows The first section is a brief description of the
Au sample used in these experiments In the second section the Debye ndashWaller effect
is discussed In the third section the time-resolved experiments are described and
experimental results are presented In the fourth section a comparison between the
experimental results and calculations based on the TTM model are discussed In the
final section a summary will be drawn
41 Au sample
Au a noble metal has been extensively studied with respect to its transient
properties and transient structure after femtosecond optical excitation [61 186 201-208]
In
4 Observation of the Debye -Waller effect in Au
58
particular the transient Debye ndash Waller effect has been recently used in ultrafast
electron diffraction experiments to study fast lattice heating after femtoseond laser-
excitation of thin polycrystalline Au films [201 206]
In the experiments described in this chapter an epitaxial Au film was used The
150 nm thick (111)-oriented Au samples had been grown on (001)-oriented high
quality Mica using a magnetron sputtering technique and were provided by the
company Phasis [209]
Relevant physical parameters of this sample are provided in
Appendix C3
To maximize the pump-induced changes of the diffraction signal due to the
Debye-Waller effect measurements were performed using the symmetric (333)-
reflection (see also next section) The corresponding Bragg angle (measured relative
to the surface) is 789deg for Cu Kα radiation Given the angle of 10deg between the
optical pump beam and the X-ray probe the angle of incidence (measured to the
surface normal) of the pump is 20deg The corresponding reflectivity of the sample at
800 nm is 97 The optical penetration depth is about 13 nm which is much smaller
than the film thickness [210]
Nevertheless fast ballistic electronic transport distributes
the deposited energy over the whole film thickness within a few hundred
femtoseconds [211-213]
Therefore the sample can be considered as being
homogeneously excited on the time scale of a picosecond
42 Debye ndashWaller effect
Debye [214]
and Waller [215]
found that by heating the lattice the intensity of
Bragg-reflections decreases whereas their angular profiles (rocking curves) remain
unchanged This decrease is described by the Debye-Waller factor DW(T)
)3
1exp()( 22
0
hklT Gr
I
ITDW
(41)
where IT is the integrated intensity of a particular Bragg-reflection with Miller
indices (hkl) (determined by the reciprocal lattice vector Ghkl) at temperature T I0 is
4 Observation of the Debye -Waller effect in Au
59
the integrated intensity in the case of the perfectly ordered and lsquofrozen latticersquo and
2r
is the mean square atomic displacement [216]
By calculating 2r
within the Debye theory for the specific heat [217]
and
taking into account Braggs law )sin(2 Bhkld the Debye-Waller factor can be
represented as [218]
22
2
2
16exp)(
hkl
D
DB dTmk
ThTDW (42)
where h is Plankrsquos constant T is the temperature of material m is the mass of
the atom Bk is the Boltzmanrsquos constant D is the Debye temperature of the material
T
D is the Debye function and hkld is the corresponding lattice constant Eq 42
indicates that the Debye-Waller effect becomes stronger with a smallerhkld ie larger
changes in the diffracted signal are expected for higher diffraction orders (hkl)
Fig 41 Calculated Debye-Waller factor for Au
According to Eq 42 the Debye-Waller factor for the (111) (222) and (333)
Bragg diffraction of Au are calculated as a function of temperature and presented in
Fig 41 (normalized to the corresponding value at 295 K) Since the changes of the
4 Observation of the Debye -Waller effect in Au
60
integrated signal are more pronounced for higher orders the (333)-reflection has been
used in following experiments as mentioned above
43 Time-resolved X-ray diffraction experiments on Au
431 Bragg diffraction of Au
Before performing the time-resolved experiments for studying the Debye ndash
Waller effect in Au several preparation experiments were carried out using an area
detector (ldquoGemstarrdquo camera see Appendix B) to pre-characterize the structural
response of the sample upon ultrafast optical excitation
Fig42 shows as one result the variation of the total diffraction signal with the
angle of incidence of the X-ray beam for the Au (333)-reflection In principle such
angular dependencies represent the convolution of three contributions namely (a) the
sample rocking curve (b) the angular intensity distribution of the focused X-ray beam
and (c) the source spectrum As a consequence the angular dependence shown in Fig
42 exhibits a two-peak structure which can be attributed to the Kα1- and Kα2-lines of
Cu which are both reflected by the mirror Each individual peak exhibits a FWHM of
about 07deg This is significantly more than the expected width of about 026deg due to
the combined effects of the spectral width (FWHM) of the two emission lines (approx
013deg) [219]
the angular FWHM of the focused X-rays (017deg FWHM) [Appendix A]
and
the expected FWHM of the rocking curve of a 150 nm film (014deg) [220]
The
broadened diffraction curve is attributed to the mosaic structure of the Au-film [221]
)
The following experiments are performed at a sample angle of 7895deg corresponding
to the maximum detected diffraction signal
4 Observation of the Debye -Waller effect in Au
61
Fig 42 The diffraction signal as a function of sample angle for the
Au (333)-reflection without excitation
However upon excitation of the sample not only the intensity of a particular
Bragg-reflection can change (eg due to the Debye-Waller effect) but also its angular
position (and shape) due to laser induced strain With respect to the latter one it has to
be stressed that the angular FWHM of the incident X-ray beam covers only a part of
the total width of the diffraction curve Therefore for a fixed sample angle changes
of the diffraction signal might be caused by both real intensity changes as well as a
peak shift due to the fact that strain if sufficiently large can shift the diffraction
curve out of the narrow angular range of the incident X-ray beam In order to
(preliminary) clarify the effect of strain time-resolved measurements have been
performed for different fluences both at fixed sample angle as a function of pump-
probe time-delay and as a function of sample angle for a fixed time-delay
Fig 43 shows the shift of the diffraction peak (center of gravity of the
distribution of diffracted X-rays measured on the area detector mentioned above) for a
(low) absorbed pump fluence of 15 mJcm2 (black open squares the red dots show
reference data measured in the course of the experiment without laser pumping) As it
is evident the Bragg-peak starts to shift shortly after excitation towards smaller
diffraction angles indicating lattice expansion The maximum shiftexpansion is
4 Observation of the Debye -Waller effect in Au
62
reached after about 45 ps Subsequently the Bragg-peak shifts back to larger
diffraction angles indicating recompression of the material Before discussing this
behavior it should be noted that this measurement could be performed with a fixed
sample angle using an area detector because of the low absorbed fluence with which
the shift of the Bragg-peak is smaller than the angular range of the incident X-ray
beam
Fig 43 Centers of gravity of the Au (333) rocking curves measured
with the Gemstar camera Red circles correspond to data obtained on
the non-excited sample the black squares represent data from the
excited sample
The observed behavior in particular the oscillatory time-dependence of the
Bragg-peak shift is in line with the generation and propagation of acoustic waves
launched by an almost instantaneous increase of pressure after optical
excitation [222 223]
In this interpretation the observed period of 45 ps should
correspond to the time ac that a longitudinal acoustic wave with speed cs needs to
travel through a film with thickness d sac cd With the known speed of sound of
cs = 339 kms [224]
in Au along the (111)-direction and using the nominal film
thickness of (150 5) nm I obtain ac = (44 15) ps which is in agreement with the
experimentally found value Very similar results have been recently reported by
4 Observation of the Debye -Waller effect in Au
63
Nicoul et al on a similar Au-sample of smaller thickness (d = 90 nm) [61]
The close
correspondence in the time-evolution of the Bragg-peak shift in particular its
ldquotriangularrdquo shape give clear indication that also the 150 nm film is homogeneously
(as expected ndash see above) and almost instantaneously pressurized over its whole
thickness
Fig 44 The diffraction signal as a function of sample angle for the
Au (333)-reflection at a delay of 45 ps (maximum shift) measured
with APD The points are measured data and the solid curves
represent Gaussian fits
Fig 44 shows the diffraction signal measured with the APD at a delay of 45 ps
(maximum shift) as a function of sample angle for different pump fluences the solid
curves represent Gaussian fits to the measured data The APD has a sufficient large
detecting area allowing to perform this measurement without moving its position As
expected the shift of the Bragg peak increases with pump fluence The peak positions
were obtained from the fitting function and are shown as function of absorbed fluence
The ldquotriangularrdquo shape of the time-trace indicates that the changes of the average interspacing
distance inside the sample can be assumed to be linear with time It is expected for the time-
independent pressurestress (the strain waves exhibit a rectangular shape) which results from
instantaneously and homogeneously heating of a sample Detailed interpretations can be found in Ref
[140 186]
4 Observation of the Debye -Waller effect in Au
64
in Fig 45 As it can be seen in Fig 45 the maximum shift of the Bragg-peak caused
by laser induced strain scales linear with the absorbed fluence Such behavior was
also observed in other X-ray diffraction experiments [140 186 225]
Fig 45 Angular shift of Bragg peak as function of absorbed fluence
The green dashed lines are linear fits for the data points
In summary the experiments above show that the strain caused by laser-
excitation result in a linear shift of the Bragg-peak both with time (for the first 45 ps)
and fluence
432 Observation of Debye ndashWaller effect on Au
In order to obtain the temporal evolution of the Debye ndashWaller effect without
being affected by the laser induced angular shifts of the Bragg peak an angular
compensation procedure is applied during the measurements This method is based on
the results shown in Figs 43 and 45 namely the linear increase of the Bragg-peak
shift with time and fluence This allows to properly adjust the sample angle both as a
function of pump-probe time delay as well as fluence to stay always at the angular
position of the maximum of the diffraction signal
4 Observation of the Debye -Waller effect in Au
65
Fig 46 Time-resolved measurements with and without the angular
compensation procedure The black curve is an exponential fit for
the data with compensation the red curve is a guide to eye for the
data without compensation
To illustrate the effect of this compensation Fig 46 shows the results of time-
resolved measurements with and without angular compensation at a fluence of
35 mJcm2 (absorbed) Without the compensation the detected diffraction signal
represents the combined effects of the strain-induced angular shift of the Bragg peak
and the DebyendashWaller effect As it can be seen in this case the detected diffraction
signal drops and rebounds at 45 ps essentially resembling the temporal behavior of
the angular shift of the Bragg peak after excitation (see Fig 43) However with the
compensation method the Debye-Waller effect can be isolated In this case the
measured (normalized) diffraction signal shows a much faster exponential drop with a
time constant of about 43 ps
Additional measurements were performed at lower pump fluences applying this
angular compensation The results are presented in Fig 47 In all cases the
experimental data were fitted with an exponential function and the fitting curves are
depicted as solid lines in the figure Most obvious and not unexpected the decrease of
the overall change of the diffraction signal increases with fluence due to the larger
4 Observation of the Debye -Waller effect in Au
66
temperature increase achieved at higher fluences The temporal evolution of the
diffraction intensities directly maps out the excitation of lattice vibrations (increase of
2r
) during heating After approximately 20 ps all diffraction signals reach their
asymptotic values which can be considered as the sign of reaching the new thermal
equilibrium state in the lattice system
Applying eq 42 the measured asymptotic drop of the diffraction signal as
obtained from the exponential fitting can be converted into a temperature increase
The results are plotted as blue squares in Fig 48 (a) The experimentally determined
temperature increases are compared to the temperature increase estimated from the
deposited laser energy and the specific heat of the material (red circles) Both data
sets agree within their error bars thus confirming that lattice heating and the Debye-
Waller effect is responsible for the observed decrease in diffraction intensity
The time constant of the exponential fit represents how fast the lattice is heated
and the new thermal equilibrium state is reached The time constant is plotted in Fig
48(b) as a function of absorbed laser fluence (bottom axis) and lattice temperature
(top axis) For comparison two data points from previously published experiments
[61 201] have been added Since the absolute fluence values are often difficult to
compare in independent experiments the absorbed fluence value is not used for this
comparison but the observed temperature increase (top axis) My measurements agree
within the error bars with the previously published data
4 Observation of the Debye -Waller effect in Au
67
Fig 47 Diffraction signal as a function of delay time for different
absorbed fluences (obtained with the angular compensation
procedure) The solid curves are exponential fits of the measured
data
(a) (b)
Fig 48 (a) Asymptotic temperature after laser-excitation as a
function of absorbed fluence Blue squares Values determined by
using eq 42 and the experimentally observed asymptotic drop of the
diffraction signal (top axis) Red circles Estimated temperatures
from the deposited optical energy (b) Decay time constant as a
function of absorbed fluence (bottom axis) and lattice temperature
(top axis) The black square points are obtained from the exponential
fits of the measured data in Fig 47 The red circle and the blue
diamond are taken from Ref [201] and [61] respectively
4 Observation of the Debye -Waller effect in Au
68
The data in Fig 48(b) seem to show a tendency that the decay constant
decreases with increasing fluence However due to the large errors of the derived
decay time constants at low fluences this effect will not be discussed further The only
remark to be made here is that the frequently used TTM (see below) does predict the
opposite
44 Comparison with the Two ndash Temperature Model (TTM)
and discussion
Upon the laser excitation the laser energy is first absorbed by free electrons and
then exchanges between electrons and the lattice through electron-phonon collisions
The evolutions of the electron and lattice temperature are determined by the electron-
phonon coupling constant [226]
In order to understand this process of above
experimental results in this section I compare the experimental results with the
theoretical prediction of the two-temperature model (TTM) [200]
which is a simple and
frequently used model to describe the electron-phonon energy relaxation
The TTM is based on the assumption that the electronic and lattice system can be
described by two different time-dependent temperatures Te and Tl The rate of energy
exchange between these two subsystems depends linearly on the temperature
difference and is given by
)( le
e
e
l
l TTt
TC
t
TC
(43)
where Ce and Cl are the specific heats of electrons and phonons (in principle
temperature dependent) respectively The energy exchange rate parameter α is related
to the electron-phonon coupling constant Solving the differential equation 43
numerically by using the coupling constants determined from all-optical
measurements [227]
not only the electron dynamics but also the evolution of the
lattice temperature can be predicted
In order to solve this differential equation the initial temperature of the
electronic system is calculated by using the experimentally determined asymptotic
4 Observation of the Debye -Waller effect in Au
69
lattice temperature Tasy According to the law of energy conservation and assuming no
energy losses the total initial energy in electronic system soon after laser excitation
and in lattice system at initial room temperature is equal to the total energy of
electronic and lattice system at asymptotic lattice temperature One obtains
asylasyeRleee TCTCTCTTC ))(()( 00 (44)
and
eeee TATC )( (45)
where Ae and TR are coefficient of electronic heat capacity and the room
temperature respectively Then the corresponding initial electron temperature 0eT can
be expressed as
))(2
( 2
0 asyRasy
e
le TTT
A
CT (46)
Using the deduced parameters and the material constants summarized in table 41
equation 43 was numerically solved and the results of temporal evolution of lattice
temperature are shown in Fig 49 (red dashed curves) together with the measured data
for the further discussions
Ae[Jm3K
2] Cl [MJm
3K] α [10
16Wm
3K]
676 245 21
TR [K] Tasy[K] Te0[K]
295
335 17363
365 22831
390 26544
Table 41 The material constants of Au and parameters used in the
TTM calculations [228]
4 Observation of the Debye -Waller effect in Au
70
Fig 49 Temporal evolution of the detected X-ray signal (data points
left axis) with exponential fits (black solid curves left axis) and the
results of the numerical solutions of the TTM for the
maximumasymptotic lattice temperature at (a) 335K (b) 365K and
(c) 390K (red dashed curves right axis)
4 Observation of the Debye -Waller effect in Au
71
Fig 49 shows again the temporal evolution of the relative changes of the X-ray
diffraction signal (data points note the flipped signal axis to the left) together with the
exponential fitting (black solid curve) The right axis displays the corresponding
lattice temperature obtained from the DWF The experimental data are compared to
calculated time dependencies (red dashed curves) of the lattice temperature obtained
from the TTM-calculations for maximumasymptotic lattice temperatures Tasy of (a)
335K (b) 365K and (c) 390K It is evident from this comparison that the TTM with
ldquostandardrdquo parameters (table 41) provides a good description of the experimental data
only for the highest fluence For the lower fluences the TTM predicts a faster energy
relaxationlattice heating than observed in the experiment Although B Rethfeld [229]
has predicted such a delayed energy exchange which deviates from the TTM for weak
excitation the effect will not be discussed further here because of the large error of
the experimentally determined time constant for the lower fluences At least for the
highest fluence the TTM provides a reasonable description of the experimental data
which are moreover in good agreement with previously published results [61 201]
45 Summary and conclusion
As the first time-revolved experiment performed with the improved modular
setup the observation of the Debye -Waller effect in Au and its good agreement with
both previous experimental results [61 201]
as well as the TTM at high fluences
demonstrates that it is well suited to perform time-resolved diffraction experiments
with good accuracy However this experiment also reveals a major limitation of the
setup Due to the narrow convergence angle of the incident X-ray beam an angular
compensation technique as discussed above needs to be applied to eliminate strain
effects As a consequence a pre-characterization of the response of a particular sample
is necessary This made the experiment quite time consuming and might have
introduced additional error sources The modular setup is therefore most suitable for
measurements where the position andor shape of the Bragg-peak does not change
4 Observation of the Debye -Waller effect in Au
72
upon laser-excitation (at least for a certain range of fluences andor pump-probe time
delays) As will be discussed in chapter 5 this is the case for laser-excited Bi where
the Bragg-peak does not start to shift for almost 5 ps after laser excitation
5 Extreme phonon softening in laser-excited Bi
73
5 Extreme phonon softening in laser-
excited Bi
Bi is a group-V (Nitrogen group) element which contains 5 electrons in its outer
shell It is stabilized at equilibrium into the A7 structure a rhombohedral structure
with two atoms per unit cell The pairing of these two atoms is attributed to the so-
called PeierlsndashJones mechanism [230]
This mechanism states that in order to arrange
the lattice system in the minimum energy configuration every second atom along the
body diagonal of the Bi unit cell ((111) direction) moves closer to one neighbor and
further away from the other leading to the pairing of atoms along the body diagonal
and doubling of the lattice constant As a consequence of this distortion a small band
gap is introduced at the Fermi level lowering the total energy of the occupied
electronic states and hence lowering the total energy of the system This opened band
gap is responsible for Bi being a semimetal A more detail description of the structure
of Bi will be presented in Section 51
Due to the unique properties of the broken symmetry ground state of the crystal
the equilibrium structure of Bi is sensitive to external perturbations ie changes of
pressure and temperature or electronic excitation [231- 234]
Among these perturbations
the ultrafast electronic excitation with ultrashort laser pulses is particularly unique
since the laser induced non-equilibrium states which depend on the excitation level
can be precisely controlled by adjusting the pump laser fluence and thus it can
provide unique non-equilibrium states of matter for the investigation of the transient
dynamics Following ultrafast laser excitation the valence electrons are promoted to
the conduction band The interatomic potential which defines the position of the
atoms in the unit cell is altered by the optically induced redistribution of electrons and
5 Extreme phonon softening in laser-excited Bi
74
the potential minima shift If this alteration occurs fast in comparison with the time
scale of atomic motion it triggers a coherent atomic motion around the new
equilibrium position along the body diagonal resulting in the modulation of the
equilibrium distance of the two paired atoms towards the phase of the higher
symmetry This coherent atomic motion represents the A1g optical phonon mode of
the crystal The generation mechanism has been named displacive excitation of
coherent phonons (DECP) [231 232]
which can be also considered as a special case of
impulsive stimulated Raman scattering for absorbing materials [235 236]
Within the framework of the DECP mechanism it has been predicted by
theory [237]
that the broken symmetry ground state of Bi (the Peierls distortion) can be
reversed with high enough density excitation This structural transformation is
accompanied by the change of the electronic properties The opened band gap at
Fermi level should close and Bi transforms from a semi-metal to a metal on the sub-
picosecond range The study of this phase transition process can provide important
information not only for the understanding of non-equilibrium structural dynamics in
Peierls distorted systems but also for designing future ultrafast electronic devices So
far it is not clear whether this phase transition can be achieved without subsequent
disorderingmelting of the Bi sample for an initial room temperature lattice Moreover
there is no experimental evidence yet that the structural phase transition to the high
symmetry state can be realized This experimental challenge has been addressed in
my PhD work
In this chapter the evolutions of laser-excited coherent optical phonons in Bi
have been investigated by directly monitoring the atomic motion using time-resolved
X-ray diffraction The observed extreme softening of the A1g phonon mode indicates
transient disappearance of the Peierls distortion This chapter is organized as follows
Section 51 provides a brief introduction of Bi Section 52 presents the experiment
results and discussion Section 53 summaries the main results of this chapter
5 Extreme phonon softening in laser-excited Bi
75
51 Research background
511 Structure of Bi and the phonons
The crystalline form of Bi is the di-atomic basis rhombohedral A7 structure [238]
which is derived from a simple cubic structure in two steps First a simple cubic
lattice is stretched along one of the body diagonals creating a smaller shear angle than
the cubic value of 60deg Then a Peierls instability [230]
causes the atoms to be displaced
along the same diagonal in opposite directions leading to a reduction of the structural
symmetry and a doubling of the lattice constant Fig 51 illustrates the primitive unit
cell of Bi The first atom is placed at the node of the primitive unit cell and the second
atom lies along the body diagonal with a slight displacement from the center of the
unit cell The length of the body diagonal is defined as d then the corresponding
distance for the second atom is xbulld At room temperature the lattice parameters are
a = b = c = 455 Aring body diagonal d = 1186 Aring and x = 0468 ie the distance of the
pair of atoms is xbulld = 55505 Aring
Fig 51 Primitive unit cell of Bi and the motion directions of the A1g
and Eg phonon mode
5 Extreme phonon softening in laser-excited Bi
76
Fig 52 Potential energy surface in Bi as a function of percentage of
electrons excited into the conduction band n and normalized atomic
distance x Picture reproduced from Ref [237]
Upon the external perturbations the motion of the two atoms against each other
along the body diagonal corresponds to the A1g-optical phonon mode The motion of
the atoms in the plane perpendicular to the body diagonal corresponds to the two
(degenerate) Eg-optical phonon modes (Fig 51) The work presented in this chapter
has focused on studying the laser excited A1g-optical phonon that can be characterized
by the changes of the normalized atomic distance x along the body diagonal Murray
et al have used density functional theory (DFT) to compute the potential energy
surface (PES) along x for different levels of electronic excitation [237]
Fig 52 (taken
from Ref [237]) displays the potential energy as a function of the percentage of
carriers excited into the conduction band and the normalized atomic distance x To
interpret the experimental results this PES will be frequently referred to in the
remaining sections of this chapter
512 Previous works
Bi has been studied by methods of ultrafast optics for over two decades The
coherent optical phonons launched in Bi after femtosecond laser excitation were first
5 Extreme phonon softening in laser-excited Bi
77
observed by Cheng et al [239]
in time-resolved reflectivity measurement By
monitoring the oscillations in the optical reflectivity the A1g phonon motion was
detected and its frequency compared to the results obtained by spontaneous Raman
scattering and inelastic neutron scattering [240]
Owing to the high temporal resolution
and high accuracy optical techniques are powerful to retrieve quantitative
information about the frequency of the excited phonon and its decay dynamics The
subsequent experiments explored coherent phonon dynamics by studying the phonon
frequency [231 232]
the electron-phonon energy coupling [241 242]
the temperature
dependence [236 243 244]
and the excitation level dependence [237 244-249]
The Eg mode
was also observed with optical techniques [236 244 249 250]
However optical techniques measure the modulation of the dielectric constant
Therefore they can provide only indirect information about the magnitude of the
atomic motion in the excited sample Providing direct information about the atomic
motion in laser-excited Bi ultrafast time-resolved X-ray diffraction [7-9 17 18 39-41 67-69
73 251 252] and electron diffraction
[12 13 81 253 254] have been recently applied Two
time-resolved X-ray diffraction experiments which are closely connected to the study
presented in this thesis will be described in detail in the following part
When a thin film sample with a thickness much smaller than the extinction
length [255 256]
is investigated with X-ray diffraction the secondary scattering of the
Bragg reflected beam can be neglected This treatment is known as the kinematic
approximation Thus the intensity of a particular Bragg reflection (hkl) of Bi is
determined by the squared modulus of the geometrical structure factor
22cos2 xlkhfFI Bihklhkl (51)
where h k and l are the Miller indices f Bi is the atomic scattering factor for Bi x
is normalized atomic distance which becomes time-dependent after laser excitation
If the Debye-Waller factor is assumed to be constant a direct indication of the atomic
displacement along the trigonal direction inside the unit cell after laser excitation can
be presented by the changes in the normalized diffraction signal for the (111) and
(222) reflections as
5 Extreme phonon softening in laser-excited Bi
78
)0(3cos
)(3cos
)0(
)(2
2
xn
txn
I
tI
nnn
nnn
n=1 for (111) n=2 for (222) reflection (52)
Figure 53 shows the normalized X-ray diffraction efficiency of the (111) and
(222) Bragg-peaks of Bi as a function of x The diffraction intensity is normalized to
the value of x = 0468 (actual equilibrium value in the unperturbed crystals) and
plotted as a function of x In the high-symmetry non-Peierls distorted state where
x = 05 (2nd
atom in the centre) diffraction from (111) planes is forbidden whereas
(222) diffraction becomes the minimal diffraction order and reaches a maximum
value Impulsive electronic excitation suddenly displaces the minimum of the PES
closer to x = 05 and the atoms are set in motion towards the new equilibrium position
As a consequence of this motion the changes in the X-ray diffraction signal are
expected to evolve in opposite directions An increase for the (222)-reflection and a
decrease for the (111)-reflection Following these initial changes the oscillatory
atomic motion around the new equilibrium position should give rise to oscillations of
both the (222)- and the (111)- diffraction signal with a frequency corresponding to
the A1g optical phonon mode
Fig 53 Normalized intensity of Bragg peak (111) and (222) versus
atomic displacement expressed in the relative position along the
body diagonal
5 Extreme phonon softening in laser-excited Bi
79
The first time resolved experiment where X-ray diffraction had been applied to
directly follow the atomic motion associated with the laser-excited coherent phonon
in Bi was performed by Sokolowski-Tinten et al [68 251]
In this work the evolutions
of two Bragg-reflections of a laser-excited 50 nm Bi thin film were measured (Fig
54) The frequency of the A1g mode was found to be only 212 THz substantially
smaller than the frequency of 292 THz measured in non-excited Bi (ie by Raman-
spectroscopy) The large displacements as well as the strong softening indicated
substantial changes of the interatomic potential which had not been observed before in
all-optical experiments
(a) (b)
Fig 54 X-ray diffraction efficiency of the (a) (111) and (b) (222)
reflections as a function of time delay between the optical pump
pulse and X-ray probe pulse Coherent phonon oscillations with
oscillation frequencies of 212 THz were observed Pictures
reproduced from Ref [68]
However due to the limited signal-to-noise ratio that was available with the laser
plasma-based source at that time this successful work was only achieved at a
relatively high excitation fluence A systematic investigation of the frequency and
amplitude dependence of the A1g phonon towards weaker excitation was required to
fill the gap to the all-optical work carried out with lower excitation fluences
Due to a significantly higher X-ray flux the Sub-Picosecond Pulse Source
(SPPS) [257]
at Stanford appeared to be the ideal X-ray source to perform this
experiment The softening of the A1g phonon mode as a function of excitation density
5 Extreme phonon softening in laser-excited Bi
80
and the detailed mapping of the carrier density-dependent PES were quantitatively
characterized for the first time by the work performed at the SPPS [69 186]
In this
work the optical phonon modes in Bi had been investigated at different absorbed
laser fluences up to 23 mJcm2 Fig 55 (a) shows four time traces for different
excitation fluences The optical phonon frequency as a function of the normalized
equilibrium atomic distance x is displayed in the inset of Fig 55 (a) A softening of
the A1g phonon frequency was found (from 291 THz down to 23 THz) with
increasing x These data provide direct information about the laser-induced changes of
the PES namely the position of potential minimum as well as its curvature In Fig
55 (b) a comparison between these measured data and theoretical calculations based
on DFT [237]
is presented A good agreement between the experiment and the DFT-
results is found
(a) (b)
Fig 55 (a) Bi (111) X-ray diffraction efficiency as a function of
time delay for different absorbed fluences 07 (green) 12 (orange)
17 (blue) and 23 mJcm2 (gray) The observed A1g optical phonon
frequencies are displayed in the inset as a function of x the new
normalized (quasi-)equilibrium atomic distance along the body
diagonal of the unit cell The dotted curve represents A1g
frequencies predicted from DFT calculations [237]
(b) Normalized
quasi-equilibrium atomic distance x as a function of carrier density n
with the overlaid excited state PES (false color) The white dotted
line represents the equilibrium atomic distance obtained with DFT
The red points are the measured data at the SPPS The Bi unit cell is
depicted in the top right The ratio of yellow bar to red bar
determines x Pictures reproduced from Ref [69]
5 Extreme phonon softening in laser-excited Bi
81
These results bridged the gap between the existing work on low and high
fluence However another interesting question has been raised here Could the system
when excited with higher fluence be really driven back to the high symmetry state
(x = 05) and could the Peierls distortion be reversed To answer this question I have
extended the studies of coherent optical phonons in Bi to a higher excitation fluence
regime that has not been studied previously By using the modular setup [chapter 3]
time-resolved X-ray diffraction experiments were performed A complete softening of
the excited A1g mode is observed in the high level excitation data This represents
conclusive experimental evidence that the Peierls distortion which defines the
equilibrium structure of Bi is transiently reversed
52 Experiments and discussion
521 Method
The measurements were performed using the modular setup which was already
introduced in chapter 3 (Fig 31) X-ray pulses at a photon energy of 805 keV
(wavelength 154Aring) were used The (111)- oriented crystalline Bi sample (50 nm film
on Silicon same type of sample which was used in the previous experiments [68 69]
More details on relevant parameters of the Bi sample used in this work are provided
in Appendix C) is placed under the appropriate Bragg-angle 1124deg for (111)-
reflection and 2294deg for (222)-reflection To launch the A1g optical phonon mode
through displacive excitation the sample was optically excited by near-infrared (800
nm) femtosecond laser pulses with (absorbed) fluences from 1 mJcm2 to 42 mJcm
2
It should be noted that for absorbed fluences above 25 mJcm2 the sample suffered
damage after excitation with many pulses The damage could be detected by
monitoring (with a CCD-camera) the scattered fraction of the incident pump light
which increased significantly upon damage From the fact that the increase of pump
light scattering occurred long before permanent changes in the X-ray diffraction
5 Extreme phonon softening in laser-excited Bi
82
signals could be observed it can be concluded that multi-pulse damage occurs initially
only at the very surface of the sample Still when this increase in scattering was
observed the sample was shifted to a fresh spot The atomic motion was probed by
measuring the diffraction of the X-ray probe pulses after a controlled time delay with
respect to the pump laser pulses In order to maximize the accuracy of the experiment
and to observe small changes in the diffraction signals the direct normalization
scheme with ldquofastrdquo scanning (see chapter 3) had been applied in the measurements
The diffraction signals of the (111)- and (222)-reflection are recorded with the silicon
avalanche photodiode and the signal from the ionization chamber detector is used for
normalization The typical time required to measure a complete time-dependence
(approx 180 delay points) of one diffraction order for one fluence with an accuracy of
approximately 1 was around 6 hours Comparing to the 12 hours per measurement
using the Ti Kα source reported by Sokolowski-Tinten et al [68]
(accuracy approx
2) this represents a significant improvement
522 Preliminary measurements
Before performing the time-resolved experiments for studying laser-excited
coherent optical phonons in Bi two preliminary experiments were carried out to
characterize the structural response of the sample upon ultrafast optical excitation
Fig 56 shows the diffraction signal of the Bi (111)-reflection and the (substrate)
Si (111)-reflection as a function of sample angle The lattice mismatch provides
sufficient angular separation of the diffraction signal from the Bi film and the
diffraction signal from the Si substrate As expected the diffraction signal of the bulk
Si-substrate is significantly stronger (approx 20times) than the diffraction from the thin
Bi-film Another important information obtained from this measurement is that the
angular width of the Bi diffraction curve (03deg FWHM) is larger than the angular
width of the incident X-ray beam (017deg FWHM) As it had been discussed in the
previous chapters in this case the experiments will be performed at a fixed sample
angle corresponding to the maximum detected diffraction signal
5 Extreme phonon softening in laser-excited Bi
83
Fig 56 The diffraction signal of Bi (111)-reflection and (substrate)
Si (111)-reflection as a function of sample angle Both signals are
normalized to the maximal value of Bi (111) signal
A preliminary time revolved measurement was performed on the (111)-reflection
with an area detector (ldquoGemstarrdquo camera) This measurement allowed to
approximately determine time delay zero and provided some information on the
temporal evolution of signal intensity and in particular on the changes of the angular
position of the diffraction peak upon laser excitation The incident pump fluence in
this measurement was about 5 mJcm2 The measured results are displayed in Fig 57
Despite the low accuracy of this measurement three different stages in the temporal
evolution of the diffraction intensity can be recognized Immediately after the photo-
excitation a rapid decrease in the diffraction efficiency is observed followed by a
partial recovery of the diffraction signal during the next 5 ps After that the diffraction
intensity starts to decrease again on a 10 ps time-scale On the other hand the angular
position of the (111)-diffraction peak starts to change only after 5 - 7 ps The shift to
smaller diffraction angles indicates lattice expansion
5 Extreme phonon softening in laser-excited Bi
84
In consequence the initial decrease of the diffraction signal and the 5 ps
recovery are attributed to changes of the structure factor and thus changes of the
normalized atomic distance x upon electronic excitation and subsequent relaxation
However the expected signal oscillations could not be resolved due to the limited
accuracy and the coarse delay spacing Moreover it is important to note that
measurements on Bi can be performed within a time window of about 5 ps without a
correction of the angle of incidence of the X-ray beam as it was necessary for the case
of Au (compare discussion in chapter 4) The following detailed investigation of the
coherent optical phonon concentrates therefore on this time window of about 5 ps
after excitation (marked with the blue dashed-dotted line in Fig 57) where the
changes of the signal intensity caused by the shift of the Bragg peak are negligible
Fig 57 Time revolved measurement with the Gemstar camera The
left axis shows the position of the center of gravity of the Bi (111)
rocking curve The right axis showed the integrated intensity of the
diffracted signal
5 Extreme phonon softening in laser-excited Bi
85
523 Results of time resolved measurements and discussion
Before presenting the experimental results and discussion it should be noted that
the effective energy deposition depth of 800nm fs laser pulses is approximately
26 nm [73]
This means that initially only half of the sample thickness (50 nm) is
excited The spatially inhomogeneous excitation of the sample needs to be taken into
account in the following discussion
Fig 58 shows representative examples of time-traces of the normalized
diffraction efficiency of the (111)- (a) and the (222)- reflection (b) for different pump
laser fluences Since the absolute time-zero in these experiments is only known to an
accuracy of about +- 150 fs the zero-delay point is arbitrarily set for each curve at
the half maximum of the initial transient change A typical error bar of the measured
data is given at the end of each curve While the (111)-reflection exhibits a fluence
dependent initial drop followed by oscillations and a slow recovery the (222)-
reflection initially increases in diffraction efficiency followed also by oscillations and
a slow recovery This behavior is similar to the results reported in the previous
studies [68 69]
and can be readily interpreted by considering the changes of the
geometrical structure factor (see Fig 53) within the DECP-picture The initial
transient change is ascribed to photon-induced alteration of the minimum position of
the PES that leads to a atomic motion towards a symmetric arrangement (x = 05) The
following oscillations correspond to the A1g coherent optical phonon mode of the
lattice and the recovery of the diffraction efficiency is attributed to restoration of the
PES to its equilibrium state
5 Extreme phonon softening in laser-excited Bi
86
Fig 58 X-ray diffraction efficiency (a) (111)-reflection and (b)
(222)-reflection of a 50 nm (111)-oriented Bi-film as a function of
pump-probe time delay for different excitation fluences The zero-
delay point is set at the half maximum of the initial transient change
A typical error bar of the measured data is given at the end of each
curve
It should be noted that Fig 53 only takes into account changes of x Upon laser-
excitation other effects become important as well For example the Debye-Waller
5 Extreme phonon softening in laser-excited Bi
87
effect caused by an increase of the lattice temperature (incoherent phonons) also
affects the X-ray diffraction efficiency (see Chapter 4) Although the Debye-Waller
effect can be neglected for the first few hundred femtoseconds after laser excitation
since the energy exchange between the initially excited hot electrons and the lattice
system occurs typically on a time-scale of a few ps it should be considered in the
later recovery processes For the (111)-reflection the change in the Debye-Waller
factor is calculated to be a few percent from room temperature up to the melting
temperature [186]
Relative to the signal changes associated with the induced changes
in x the drop in the signal induced by the Debye-Waller effect is negligible On the
other hand for the (222)-reflection the change in the Debye-Waller factor is 4 times
larger for the same temperature increase and comparable to the effects caused by
changes in x The decrease of the mean value of the normalized (222) diffraction
signal to values below that of the unexcited sample is tentatively attributed to the
combination of the restoration of the PES and the DebyendashWaller effect
In the following section the magnitude of the initial change of the diffraction
efficiency and the frequency of the following oscillatory part are retrieved from the
measured time traces and will be discussed in detail
The initial maximum diffraction efficiency changes ΔI111 and ΔI222 as a function
of laser pump fluence (red (111)-refl black (222)-refl) are shown in Fig 59 Data
obtained at the SPPS (green) [69]
are also plotted in the figure for comparison and they
are consistent with the new results The linear fits of the data points reveal that the
initial changes of both reflections are linearly dependent on absorbed fluence From
the comparison of the ratio of ΔI111ΔI222 = - (28 plusmn 02) obtained from the fitting
slopes and the value of -235 as estimated from the change of the geometrical
structure factor upon the increase of the Bi-Bi distance x a rough agreement of both
values is found and this clearly demonstrates that the coherent motion of atoms is the
leading contribution which influences the initial changes of the diffraction efficiencies
The initial atomic motion is proved to be mainly coherent
5 Extreme phonon softening in laser-excited Bi
88
Fig 59 Initial maximum changes of the diffraction efficiencies for
the (111)-reflection (red) and the (222)-reflection (black)
respectively as a function of pump laser fluence The red and black
dashed lines are the linear fits for the measured data The data
obtained at the SPPS (green) [69]
is also plotted in the figure for
comparison
To determine the frequencies from the oscillatory part of the measured
diffraction efficiencies a Fast Fourier Transform (FFT) had been applied to all
measured time traces including others not shown in Fig 58 The slow background
components (initial changes and the slow recovery) are subtracted from the time-
traces before transformation As an example Fig 510 shows as red solid curve one of
those FFT results obtained from a time trace of the (222)-reflection measured at
23 mJcm2
absorbed fluence The FFT is characterized by one main peak at 24 THz
and a number of secondary peaks Due to the limited number of phonon periods
covered in this measurements as well as the small amplitude of the oscillations a
relatively low signal to noise ratio in this Fourier transform analysis is expected
Therefore only the frequency with the highest amplitude representing the main
contribution of the atomic motion is considered as reliable Since the understanding
5 Extreme phonon softening in laser-excited Bi
89
of the other observable frequency components is still an open question they will not
be discussed further in this thesis
Fig 510 FFT-spectra of the time traces of Bi 222-reflection with
23 mJcm2
absorbed fluence The solid curve and the dotted curves
(6 examples) represent the FFT results obtained from the mean time
trace and the random time traces produced within its error bar
respectively
In order to validate this approach and to assess the accuracy of the obtained
frequencies it is necessary to check how the dominant frequencies are influenced by
the measurement errors The following procedure demonstrated with the time trace
used above (222-reflection at 23 mJcm2
absorbed fluence) is applied For each time
trace the signal values of the individual data points are randomly changed within the
limits set by the error bars In this way a set of artificial time-traces is produced which
represent - within the error - possible time traces The variation of the FFT-spectra
of all this possible time-traces allows to estimate the error in the FFT and to asses
which frequency components can be regarded as real In Fig 510 six of these FFT-
spectra are presented as dotted curves With respect to the main peak (the solid curve)
it can be concluded that the measurement errors slightly change its amplitude and
width but do not affect much its position The variation of the peak position is
5 Extreme phonon softening in laser-excited Bi
90
significantly smaller than the peak width which I consider in the following as the
error of the measured frequency In conclusion the dominant frequency obtained
from the FFT can be regarded as reliable and it is assumed that it represents the A1g-
phonon mode Some more FFT-spectra obtained from the measured time-
dependencies of the diffraction efficiency are presented in Fig 511
Fig 511 FFT-spectra of the measured diffraction efficiencies for
different absorbed fluences The dominant frequency in each figure
is marked by the blue arrow
5 Extreme phonon softening in laser-excited Bi
91
Fig 511 clearly indicates that for each fluence a unique dominant frequency
can be determined as marked with the blue arrow The only exception is the one at
F = 32 mJcm2 where several peaks of equal strength are found Fig 512 summarizes
the result of the FFT-analysis It shows the determined dominant frequency as a
function of fluence The frequency error bars represent the FWHM of a Gaussian fit
to the dominant peak
Fig 512 Frequency of the excited A1g-mode as function of laser
fluence derived from the time resolved diffraction data red 111-
reflection green 222-reflection violet data obtained from earlier
results at University Duisburg-Essen (UDE) [68]
blue data obtained
at the SPPS [69]
Cyan A1g-frequency of unexcited Bi black dashed
line guide to the eye Insert DFT calculations from Murray et al [237]
The solid and dashed lines show the anharmonic and harmonic
frequencies as a function of carrier density n respectively
In Fig 512 the red and green data points represent the new data from my
measurements At lower fluences they compare well with the results obtained earlier
which have discussed above (violet point Ref [68] blue points Ref [69] Most
strikingly these experimental data reveal an extreme softening of the A1g-mode for
5 Extreme phonon softening in laser-excited Bi
92
high fluences (gt 2 mJcm2) Particularly by extrapolating the measured data (black
dashed line as a guide to the eye) a complete softening at fluences of 30 to
33 mJcm2 is expected At first glance surprising a further increase of fluence leads
to the revival of the signal oscillations and an increase of the mode-frequency The
complete softening and later stiffening of the A1g-mode clearly indicate that the
Peierls distortion is transiently reversed for fluences above approx 30 mJcm2
Further evidence can be found in Fig 59 where initial signal changes of (111) and
(222) diffractions reach approx -50 and 20 at this excitation level respectively
These results agree with estimates based on the geometrical structure factor (see Fig
53) assuming that about half of the film thickness had been excited to the symmetric
arrangement x = 05 (where the 111-reflection is fully forbidden)
In order to compare my measured results with the theoretical predictions of the
DFT-calculations performed by Murray et al [237]
the calculated harmonic and
anharmonic phonon frequencies using the PES are presented in the inset of Fig 512
as a function of carrier density n One can immediately see qualitative agreement
between the experiment and the calculation The harmonic frequency computed from
the curvature of the PES at the minimum under the assumption of harmonic
approximation The anharmonic frequency obtained from the inverse of the actual
cycle period of atomic motion in the anharmonic potential More detailed
interpretations of the two frequencies are provided in Ref [237] and [258] At low
excitation level as already proved by experiment [69]
there is little difference between
the harmonic and anharmonic frequency The difference becomes apparent at high
excitation levels where the range of atomic motion increases leading to an
anharmonic oscillation of the atoms along the asymmetric part of the PES A detailed
interpretation of atomic motion upon laser excitation is given in the following
5 Extreme phonon softening in laser-excited Bi
93
Fig 513 Sketch of the interatomic potential energy surface of Bi
upon laser excitation The black curve represents the shape of initial
equilibrium PES The others represent (qualitatively) the shape of
PES upon different excitation levels For illustrative purpose the
curves are adjusted to be separated in arbitrary unit The dashed
curves along the surface indicate the range of atomic motions
Within the DECP-picture the atoms are immediately displaced from their
(transient) equilibrium position due to the impulsive laser induced change in the PES
A restoring force whose magnitude and direction are determined by the gradient of
the PES is exerted on the atoms setting them in motion The frequencies extracted
from the X-ray diffraction signals displayed in Fig 512 directly reflect this transient
atomic motion along the PES and yield information regarding the curvature of the
PES of the excited sample In order to concisely interpret this oscillatory behavior I
illustrate qualitatively the shapes of the PES of Bi upon laser excitation and the
possible range of atomic motion in Fig 513
The initial equilibrium PES of Bi has a double well structure with the minimum
position at x = 0468 (curve (a)) For weak excitation a slight shift of the minimum
position of the PES and a slight decrease of the Peierls barrier can be seen (curve (b))
The atomic motion is limited to a small range around the equilibrium position and the
5 Extreme phonon softening in laser-excited Bi
94
atom oscillates harmonically along the PES Anharmonicity is negligible The
frequency drops approximately linearly with excitation fluence This situation
corresponds to the excitation level up to 15 of carrier density in the DFT
calculation and excitation fluences below 25 mJcm2 in Fig 512 Extensive studies
[68 69 237 244-246 248 249 259] on the generation of coherent optical phonons in Bi have
been performed in this region with time-resolved optical and X-ray techniques Up to
now no study has been carried out beyond this level of excitation The behavior in
this unexplored area has been revealed in this work
Following the increase of the excitation level the range of oscillatory atomic
motion becomes larger (curve c) The asymmetric anharmonic shape of the PES leads
to an additional increase of the period of atomic motion which defines the
anharmonic phonon frequency shown in the inset of Fig 512 It differs
significantly from the harmonic frequency (defined by the curvature of the PES at the
minimum) This situation corresponds to 15 ~ 2 of excited carrier density in the
DFT calculations and the excitation fluences of 25 ~ 3 mJcm2 in Fig 512
Upon further increase of excitation the system can reach the particular state in
which the Peierls barrier becomes low enough to let the atom just climb to its top
where it stops (curve d) In this labile equilibrium atomic motion freezes and the
anharmonic frequency becomes zero After reaching the above particular state the
Peierls barrier is further lowered by an increased fluence and the atom is allowed to
cross the x = 05 position and moving in both wells (curve e) As the atomic motion
restarts the phonon frequency revives Upon further increase in fluence the double
well and the barrier vanish The minimum of the PES is now at x = 05 which means
that the Peierls distortion has been transiently reversed Right at the transition the
harmonic term of the PES vanishes (curve f) which corresponds to the situation where
the harmonic frequency becomes zero These happen at an excitation level of 2 ~
27 of carrier density in the DFT calculation and absorbed laser fluences between
30 to 33 mJcm2 in Fig 512
With the further increase of excitation level corresponding to the value beyond
27 of carrier density in the DFT calculation and absorbed laser fluences above 33
5 Extreme phonon softening in laser-excited Bi
95
mJcm2 in Fig 512 the PES is continuously altered and the two minima converge to
one transforming the flat profile to the sharp parabola with the minimum position at
x = 05 (curve g and h) As the relative potential energy (to the minimum of the PES)
increases the atom moves along a parabolic surface with higher velocity thus
shortening the motion period and leading to an increase in the phonon frequency The
A1g phonon mode stiffens However it should be noted that due to the already
reversed Peierls distortion and the transformation into a more symmetric structure
with only one atom per unit cell this atomic motion correspond now to an acoustic
phonon mode at the new Brillouin-zone boundary
In contradiction with the above description about the range of atomic motion the
observed oscillation amplitudes in the measured data (see Fig 58) are much smaller
compared to the average signal change A very strong damping in the A1g atomic
motion can be responsible for the observation The reason of the damping effect is not
fully understood yet Considering the high excitation level applied in the
measurements a coupling of the A1g mode to other modes (eg Eg mode) which was
proposed in the earlier electron diffraction experiment [81]
and predicted in calculation
by Zijlstra et al [260]
could be the reasonable explanation for this effect Since the
system performs small amplitude oscillations around the new equilibrium
positionpotential minimum I suppose the experimental results are more suitable to be
described by the harmonic frequency
Finally it should be noted that the above description of the A1g phonon behavior
follows the results of the first principles DFT calculation [237]
which applies separate
chemical potentials for electrons and holes This model has been proved to be
quantitatively correct for low excitation fluences [69]
and at least qualitatively in good
agreement with my experimental results The other approach proposed by
Zijlstra et al [260]
using all-electron full-potential linearized augmented planewave
method (FLAPW) [261 262]
provides a description not only on A1g phonon but also on
Eg phonon and interactions between them This model could be more accurate for the
situation of Bi at the high level excitation While these two theoretical calculations
5 Extreme phonon softening in laser-excited Bi
96
differ quantitatively they qualitatively predict similar changes of the PES and the
phonon frequency
53 Summary
In summary an investigation of the laser-excited A1g coherent optical phonon
mode in Bi was performed with the laser plasma X-ray source The reversal of Peierls
distortion as well as the coherent motions of atoms in Bi following laser excitation
was observed In the low excitation regime the data agree with previous results
obtained at UDE and the SPPS In the strong excitation regime (absorbed laser
fluences gt 2 mJcm2) an extreme softening of the A1g mode was observed and an
interpretation was given Particularly the observation of a complete softening
(frequency down to zero) at fluences of 30 to 33 mJcm2 indicates that the Peierls
distortion defining the equilibrium structure of Bi transiently vanishes At even
stronger excitation (absorbed laser fluences gt 33 mJcm2) Bi starts to respond as a
material arranged in the structure with half of its equilibrium lattice constant and the
atomic motion becomes a Brillouin-zone boundary acoustic phonon mode These
observations follow at least qualitatively the predictions of calculations based on DFT
[237 260]
However due to the limited experimental accuracy these results do not provide
more detailed information with respect to the damping behavior of the oscillations the
decay of coherent phonons and the coupling of the phonon modes For further detailed
investigation in the high excitation region more powerful X-ray sources (eg XFEL
or LCLS) are needed
As already mentioned in the experimental section accumulative sample damage
was observed when absorbed fluences beyond 25 mJcm2 are used It indicates that
the applied excitation density is close to the melting threshold of the Bi sample It
questions how the phonons respond to excitations far beyond the melting threshold
which allow the melting of Bi sample with a single laser pulse Such a question had
recently been investigated by Sciaini et al [81] The ultrafast melting of Bi had been
5 Extreme phonon softening in laser-excited Bi
97
observed with time-resolved electron diffraction It was found that under extreme
excitation conditions the disordering of the Bi crystal structure occurs within 190 fs
which is substantially shorter than the disordering time determined by lattice heating
indicating a non-thermal melting process The authors attribute such surprising speed
of the non-thermal solid-to-liquid phase transition in Bi to laser induced changes in
the PES which result in strong acceleration of atoms along the longitudinal direction
(A1g mode) and an efficient coupling of this motion to the transverse mode (Eg mode)
This coupling effect had also been theoretically predicted by Zijlstra et al [260]
in high
excitation regime In order to obtain the insight into more details of DECP mechanism
and subsequent phonon dynamics at the high excitation regime the Eg phonon motion
as well as the coupling effect of A1g and Eg mode should be included in this study
However since amplitude of the Eg mode is much smaller than the one of the A1g
mode and the experimental geometry in this measurement is not sensitive to Eg
motions the Eg phonon mode as well as the coupling effect has not been observed in
my data
Nevertheless a complete insight of A1g optical phonon dynamics in laser excited
Bi from the weak excitation to melting is provided now from the results of three
excitation levels (low data from SPPS high data in this thesis extreme data from
electron diffraction) The transient reversal of Peierls distortion happening before the
disordering of Bi crystal structure has been experimentally confirmed The structural
change resulting from the coherent phonons has been indicated by the appearance of
the acoustic phonon mode Since many properties of a solid including the electronic
thermal and optical properties are affected by lattice structure this knowledge of
ultrafast structural changes caused by electronically altered energy surfaces can be
extended to understand not only the phonon dynamics of other Peierls distorted
materials (Sb and As) but also the mechanism of ultrafast phase transition in other
functional materials eg insulator-metal transition in VO2 [263 264]
and crystalline-
amorphous transition in chalcogenide alloys [265 266]
6 Towards time-resolved Debye-Scherrer X-ray diffraction
98
6 Towards time-resolved Debye-Scherrer
X-ray diffraction
The observation of the transient changes of a single Bragg-reflection in a
femtosecond X-ray diffraction measurement provides only limited information about
the transient structural response of optically excited materials To obtain a more
complete picture of the induced processes it is desirable to monitor as many Bragg
peaks as possible The Bragg diffraction scheme with a monochromatic source applied
in the experiments discussed in chapter 4 and 5 requires single crystalline samples of
high quality and thus the range of materials that can be studied is limited Moreover
a sequential measurement of many individual Bragg peaks is time consuming and
difficult to handle due to multiple sample adjustments (sample rotations) as well as
the instability of the laser and X-ray sources One alternative for effectively
measuring multiple diffraction peaks with single crystalline sample is the so-called
rotating-crystal method [74]
By rotating a single crystalline sample at a high constant
angular velocity (eg 180degs) the Bragg condition for different diffraction peaks is
fulfilled and simultaneously allowing a detection of a larger number of transient
diffraction peaks under the same experimental conditions in one measurement Again
this method requires good sample preparation precise mounting and alignment of the
sample as well as extremely stable mechanical components
Moreover not all materials can be prepared as crystalline thin films (thin films
are necessary in order to match the optical absorption depth to the X-ray probing
depth) On the other hand many materials can be prepared in polycrystalline form
For polycrystalline materials the well-known Debye-Scherrer scheme [267]
represents a
simpler approach to access simultaneously multiple Bragg peaks The simultaneous
6 Towards time-resolved Debye-Scherrer X-ray diffraction
99
detection of several reflectionsdiffraction rings without additional (sample
adjustments and mechanical stability) requirements allows conveniently getting as
much as possible information of the sample from one measurement A successful
time-resolved experiment using the Debye-Scherrer scheme on a thick (250 microm)
powder sample has been recently reported [106]
Since a material with a large unit cell
size was used multiple diffraction rings were recorded simultaneously proving the
relocation of charges within the unit cell with a time resolution of 100 fs This result
demonstrates the feasibility of using a laser-plasma based X-ray source for
investigating a wide range of polycrystalline inorganic and organic materials with
time-resolved Debye-Scherrer diffraction
The use of an X-ray optic with high magnification in the modular setup (see in
chapter 3) can provide a quasi-collimated beam well suited for the Debye-Scherrer
diffraction scheme In the work discussed in this chapter I performed Debye-Scherrer
X-ray diffraction experiments on thin polycrystalline metal films and I demonstrated
the possibility to perform time-resolved experiments with the modular setup The first
part of this chapter presents the experimental configuration In the second part static
Debye-Scherrer diffraction measurements on a 20μm Cu foil are presented This
measurement serves as comparison to results previously obtained by U Shymanovich
using a different kind of focusing X-ray optic (elliptical capillary) [105]
In the third
part of this chapter results of a time-resolved X-ray Debye-Scherrer diffraction
measurement on a 200 nm Au film are presented and discussed
6 Towards time-resolved Debye-Scherrer X-ray diffraction
100
61 Experimental configuration
(a)
(b) (c)
Fig 61 Experimental configuration (a) The principle schema of the
experimental setup (b) A photo of the arrangement of sample and X-
ray area detector (c) The configuration of the experiment for an Au
sample
A schematic of the experimental setup is shown in Fig 61 (a) The femtosecond
X-ray pulses are collected by the X-ray multilayer optic and focused on a
polycrystalline thin film sample at normal incidence Comparing to the experiments
described in the previous chapters no special alignment of the sample is necessary
due to its polycrystalline structure The diffraction pattern from the sample forms a
series diffraction cones Each diffraction cone corresponds to the diffraction from the
same family of crystalline planes in all the participating crystallites For the detection
a large area detector is required to cover a sufficiently large angular range In the
experiment discussed here the phosphor-based MCP amplified X-ray area detector
(ie ldquoGemstarrdquo) was utilized for this purpose This camera has already been
mentioned in chapter 3 and its working principle and detailed parameters are provided
Thin Film Sample
CC
D
Multilayer
X-ray Optic
Plasma
Kα-Source
6 Towards time-resolved Debye-Scherrer X-ray diffraction
101
in Appendix B In order to simultaneously record as many diffraction orders as
possible the camera was placed not normal to the incident beam Fig 61 (b) presents
a photo of the sample and camera arrangement In Fig 61 (c) the detectable
diffraction orders have been depicted for Au as an example Their corresponding
diffraction angles are shown in the insert of Fig 61 (c) Note that due to the limited
size of the detector only parts of the different rings are recorded (see below)
62 Static Debye-Scherrer measurements
(a) (c)
(b) (d)
Fig 62 Diffraction pattern of a 20μm polycrystalline Cu foil with
Cu Kα X-ray source The CCD images in (a) and (c) are obtained
using multilayer optic and capillary optic respectively (b) and (d)
are the radial cross section of image (a) and (c) respectively (c) and
(d) reproduced from Ref [105]
In order to test the feasibility of the experiment and the capability of the setup I
first performed a (static) Debye-Scherrer diffraction experiment on a 20 μm thick Cu
6 Towards time-resolved Debye-Scherrer X-ray diffraction
102
foil This sample was used in the above mentioned previous study with the elliptical
capillary optic [105]
and it provided sufficient diffraction signals to record the Debye-
Scherrer diffraction pattern Using the sample this time with the multilayer optic
offered an opportunity to compare results obtained with different types of X-ray
optics
The detailed parameters of the experiment and the accessible diffraction orders
of Cu with Cu Kα X-ray (805 keV) are provided in Appendix C A typical Debye-
Scherrer diffraction pattern obtained using the multilayer optic with 5 minutes
exposure time is given in Fig 62 (a) It can be seen that three different diffraction
rings are detected simultaneously These rings are the intersections of the diffraction
cones and the detector plane The shape of a complete ring which can be a circle an
ellipse a parabola or a hyperbola depends on the angle of the detector plane with
respect to the incoming X-ray beam In order to derive the intensity of diffraction X-
ray as a function of diffraction angle I() from this CCD image one needs to integrate
the pixel intensity along the ring in which the pixels belong to the same Thus a
complete diffraction ring for a corresponding needs to be reconstructed Considering
that only small fractions of the rings are detected by the CCD the curvatures of the
detected parts are small enough to allow these ring patterns being reconstructed by
approximating them as circles As it can be seen in Fig 63 (a) the coordinate origin
is set at the middle of the left edge of the CCD image By sampling the coordinates
from each ring their individual circle parameters (0x
0y and R ) for a circle
approximation ( 22
0
2
0 )( Ryyxx ) can be obtained Knowing these
parameters the full ring pattern out of CCD plane for each diffraction order can be
reconstructed The zoom of CCD plane (Fig 63(b)) presenting the well overlapping
of X-ray and the reconstructed rings demonstrates feasibility of this reconstruction
With these circle fitting functions the circle parameters ( 0x 0y and R ) as a function
of the x coordinate on the line y = 0 are obtained as displayed in Fig 63 (c) For each
x coordinate (from 1 to 1392) a corresponding ring can be deduced Each point (xy)
of the image belongs to one of these rings By integrating the pixel intensity along
6 Towards time-resolved Debye-Scherrer X-ray diffraction
103
each ring and projecting all data on the line y = 0 the X-ray intensity as a function of
x coordinate is obtained Converting the pixel coordinate to the angular coordinate by
applying the known angular positions of the corresponding detected diffraction orders
the diffraction X-ray intensity as a function of diffraction angle is finally derived The
result of this data processing for Fig 62 (a) is given in Fig 62 (b)
Fig 63 Reconstruction of the diffraction pattern in order to extract
the diffracted X-ray intensity as a function of diffraction angle (a)
Chosen coordinate system and the reconstructed ring pattern (b)
Zoom of the CCD image plane showing the overlap of the measured
diffraction pattern with the reconstructed rings (c) Circle fit
parameters (0x
0y and R ) of each diffraction ring as a function of x
coordinate on the y=0 line The dashed lines are the 2nd
order
Polynomial Fit for the data points
To compare my result with that obtained with a different kind of collimating
X-ray optic namely the elliptical capillary optics [105]
a CCD image from this study
and its radial profile are displayed in Fig 62 (c) and (d) The elliptical capillary
optics uses total reflection All incident X-rays passing through the capillary with an
angle smaller than the angle of total reflection undergo total reflection at its inner
6 Towards time-resolved Debye-Scherrer X-ray diffraction
104
surface The angle of total reflection has a weak dependence on the wavelength of the
X-rays and thus the optic is not wavelength sensitive Therefore more diffraction
orders originating from Kα and also Kβ radiation can be observed in Fig 62 (c)
instead of only three diffraction orders from the monochromatizing multilayer optics
The noisy background observed in Fig 62 (d) is caused by the unfocused radiation
passing directly through the capillary optic without reflection
In conclusion due to the monochromatic reflection of the multilayer optic and
the optimized Kα flux of the laser-plasma source (see chapter 2) the modular setup
can provide Debye-Scherrer diffraction patterns with much better signal-to-noise ratio
than those obtained previously [105]
63 Time-resolved Debye-Scherrer experiment
The absorption depth of a metal at visible and near-infrared wavelengths is
typically less than 20 nm [113]
However multi-keV X-ray penetrate much deeper [189]
In particular with the transmission geometry used in this experiment the 20 μm Cu
sample presented in the former section is not a suitable sample to perform time-
resolved experiments because it can not be effectively excited by the optical radiation
over the whole depth probed by the X-rays Therefore in the experiments discussed in
this section a 200 nm thick free standing Au thin film [268]
was used as sample to
demonstrate the feasibility of time-resolved Debey-Scherrer diffraction
6 Towards time-resolved Debye-Scherrer X-ray diffraction
105
631 Static Debye-Scherrer-diffraction pattern of the Au
thin film
(a)
(b)
Fig 64 Diffraction pattern of a 200 nm polycrystalline Au film (a)
CCD image (b) Radial cross section of (a)
The detailed parameters of the experiment and the detectable diffraction orders
6 Towards time-resolved Debye-Scherrer X-ray diffraction
106
for Au are provided in Appendix C and Fig 61 (c) The static Debye-Scherrer-
diffraction pattern of the Au thin film is presented in Fig 64 (a) Using a similar
experimental configuration as described in the previous section four diffraction
orders were observed in this case due to the larger lattice constant of Au as compared
to Cu I() is obtained in the same way as described in the previous section and shown
in Fig 64 (b) Compared to result with 20 μm Cu foil (Fig 62 (b)) the signal-to-
noise ratio becomes much worse Such a difference is attributed to the small thickness
of this sample the total intensities of the diffraction peaks decrease with sample
thickness whereas the noise (background signal) coming from the scattering of X-ray
are barely affected by the sample thickness
632 Results of time-resolved pump-probe measurements
In the timendashresolved measurement the incident fluence of the pump beam was
set to 160 mJcm2 (wavelength 800 nm) The diffraction patterns were recorded using
again the Phosphor-based X-ray area detector An exposure time of 5 minutes had
been chosen for each delay point After subtracting the CCD background the images
for a given delay were processed using a MatLab program (with the same routines
described in section 62) to obtain I()) By analyzing the transient changes of I()
the laser induced changes can be deduced
6 Towards time-resolved Debye-Scherrer X-ray diffraction
107
Fig 65 Comparison of the signal from non-excited and excited Au
sample (a) Radial cross sections obtained from measured data (b)
The selected profiles above the noisy background (about 30 of the
peak value) are fitted with Gaussian function
It is known since many years that the excitation of a thin metal film with an
ultrashort optical pump pulse leads to several effects which can be observed with
time resolved techniques [42 75 269 270]
Generally the changes of the diffraction
intensity due to the Debye-Waller effect and the changes of the diffraction angle due
to laser induced strain can be extracted from the measured time resolved data Both
effects have been discussed in Chapter 4 The amplitude of these changes is more
pronounced for higher diffraction orders (see the discussion in section 42 and the
latter discussion in section 633) Therefore I focused in the analysis on the two
highest diffraction orders (311) and (220) Since the reduction of the diffraction
intensity due to the Debye-Waller effect could not clearly be observed in these
measurements as will be explained in section 633 I will only discuss the observed
changes in the angular position of the Bragg-peaks attributed to strain caused by
acoustic waves
The changes of the diffraction pattern induced by the optical excitation are
6 Towards time-resolved Debye-Scherrer X-ray diffraction
108
presented in Fig 65 (a) where the I()-data for the non-excited sample (black-dotted
curve) and for a delay of 70 ps between the optical pump and the X-ray probe (green
dotted curve) are shown Shifts of both Bragg peaks are clearly observable In order to
quantify the shift the two selected Bragg-peaks have been fitted using the Gaussian
function To eliminate any effects of the noisy background on the fitting only data
points with an intensity larger than 30 of the peak intensity (blue and red curves in
Fig 65) have been used for the fitting The results are shown in Fig 65 (b) as dashed
curves and the peak positions and their error bars are obtained from the fitting
parameters Applying the same routine to all measured diffraction profiles the peak
positions as a function of delay time for the (311) and (220) Bragg reflections were
obtained and are shown in Fig 66
Upon the laser excitation pressure rises inside the sample inducing strain The
resulting strain will modify the lattice constant of the sample and thus the radii of the
diffraction rings This is the origin of the transient peak shifts displayed in Fig 66
For Au the energy will be rapidly (in a few hundred femtoseconds [211-213]
) distributed
after optical excitation over the full 200 nm film thickness Rarefaction waves are
launched at both film surfaces and start to propagate into the bulk of the film As a
consequence the diffraction peaks start to shift to smaller diffraction angles indicating
expansion of the material After a time determined by the film thickness and the speed
of sound of the considered material the fronts of the strain waves traveling in the
sample arrive at the opposite surface For a free surface the strain waves are totally
reflected with a change of sign Such recompression of the material is indicated by the
diffraction peaks shifting back to larger diffraction angles without obvious damping
effect As already discussed in Chapter 4 the ldquotriangularrdquo shape of the time-traces
results from a very fast and homogeneous (over the whole film thickness) increase of
pressure in the sample upon optical excitation [140 186]
The temporal position of the
maxima and minima of the time traces in Fig 66 (a) and (b) are determined by the
transit time of longitudinal acoustic waves through the film For both diffraction
orders oscillations with a half period of about (67 plusmn 1) ps are observed Using the
known sound velocity for polycrystalline Au of vs = 324 kms [271]
this transit time
6 Towards time-resolved Debye-Scherrer X-ray diffraction
109
corresponds to a film thickness of 217 nm which agrees within specifications (+-
10) of the manufacturer with the nominal thickness of 200 nm
(a)
(b)
Fig 66 Relative transient shift of the peak positions for the diffraction
rings (311) (a) and (220) (b) after laser excitation (blue squares) The
red circle points give the peak positions for non-excited sample The
black curves are guides for eye
6 Towards time-resolved Debye-Scherrer X-ray diffraction
110
633 Modeling the transient behavior of the diffraction
pattern after laser excitation
Fig 67 Debye-Scherrer Ewald-sphere construction without strain
(solid circles) and with uniaxial strain (dashed circle)
In polycrystalline samples the crystallites are randomly oriented When the X-
ray beam passes through the sample only the crystallites with a plane orientation
which fulfills the Bragg condition diffract X-rays The diffraction contributions from
all these crystallites form the Debye-Scherrer-diffraction pattern When the sample is
excited by the laser pulse with the condition that the illuminated area of laser is much
larger than the samplersquos absorption depth the sample expands only along the surface
normal resulting in uniaxial strain To understand the changes of the Debye-Scherrer
pattern under uniaxial strain I use a Ewald-sphere-construction [272]
as displayed in
Fig 67
The black and blue solid circles are used to describe the situation in an
6 Towards time-resolved Debye-Scherrer X-ray diffraction
111
unstrained polycrystalline film The black circle represents the Ewald-sphere Its
radius corresponds to the length of the wave vector of the incident X-rays Since we
are considering elastic scattering the incoming wave-vector ink as well as all possible
wave vectors of diffracted waves have to lie on this sphere The difference in direction
is given by the reciprocal lattice vector hklG For a single crystalline sample hklG
points only to one particular direction For a polycrystalline sample all directions of
hklG are possible This is illustrated by the blue circle which has a radius
corresponding to the length of hklG In two dimensions the two points of intersection
mark the positions where the Bragg-condition is fulfilled Extending this to three
dimensions by rotation around ink will transform the two points to a diffraction ring
When the film is uniaxially strainedexpanded the length and direction of hklG
depends on the orientation of the individual crystallite with respect to the surface
normal and the circle (with direction-independent radius) transforms into an ellipse
which is represented in Fig 67 by the blue dashed line Its shorter axis corresponds to
the direction of strainexpansion (larger lattice constant - smaller length of hklG ) Now
the intersection of the ellipse with the Ewald-sphere defines the diffraction direction
for the strainedexpanded sample As a result the diffraction rings should decrease
their radius
According to these considerations a simple geometrical calculation allows to
determine for a given strain what shifts will be induced for different Bragg peaks and
these estimations can be compared to the experimental data Choosing the center of
the Ewald-sphere as coordinate origin the black and the blue circle as well as the blue
ellipse can be expressed as follows
222 kyx (1)
222Gykx (2)
11
2
2
22
2
G
y
G
kx
(3)
6 Towards time-resolved Debye-Scherrer X-ray diffraction
112
Where η is the uniaxial strain caused by laser excitation defined as dd (d
is lattice constant) Let (x1y1) be the intersection point of the black and blue circles
(unstrained case) In the strained case the intersection point of black circle and blue
ellipse change to xxx 12 yyy 12 Substituting 1x 1y 2x 2y and G from Eq
(1) and Eq (2) in Eq (3) and applying a first order approximation
[ 2112
02 x 02 y ] one obtains
02222
yykxxkx (4)
Then substituting coskx sinky sinkx cosky in
Eq (4) one obtains the relationship between andη (and )
sin
1cos2
(5)
Fig 68 shows some results calculated using Eq (5) The angular shift
increases with strain η for a given diffraction order and for a given strain η it is larger
for higher diffraction orders
Fig 68 Estimation of the shift of diffraction rings and comparison to
measured data
6 Towards time-resolved Debye-Scherrer X-ray diffraction
113
634 Discussion for the experimental results
Following the above discussion the laser induced strain in the Au sample can be
deduced from the angular shift of the diffraction peaks observed in the time-resolved
experiment The measured peak shifts are (- 0152 plusmn 0013) ordm and (- 0103 plusmn 0010) ordm
for the (311)- and (220)-reflection respectively Using equation (5) a strain of
η(311) = (42 plusmn 04) times10-3
and η(220)= (50 plusmn 05) times10-3
is derived These two values
agree within the error bars and can be used to estimate the sample temperature For
this we use the average value ηavgasymp (46 plusmn 05) times10-3
Since the lateral dimensions of
the excited area (04 mm) are much larger than the film thickness on the time scale of
a few hundred picoseconds expansion of the film can only occur along the surface
normal Under these conditions the relation between the peak strain and the laser-
induced temperature increase is given by the following equation [223]
Tv
B
S
2
6 (6)
where B β ρ vs are the bulk modulus (B = 180 GPa) the coefficient of linear
thermal expansion (β = 142 μmbullm-1
bullK-1
) the density (ρ = 193 gbullcm-1
) and the speed
of sound (vs = 324 kms) respectively Equation (6) yields = (61 plusmn 7) K This
result is in rough agreement with the temperature increase (= (80 plusmn 11) K)
estimated from the deposited energy in the sample for the given excitation fluence
The Debye-Waller effect (see in Chapter 4) induced by this increase of
temperature should lead to a 42 and 31 decrease in the integrated diffraction
signal of the (311)- and (220)-reflection respectively However due to the low
diffraction signals (approx 3 detected photons per second for the (311)-reflection
less for the (220)-reflection) these changes could not be detected in the experiment
since they are of the same order (eg for (311)-reflection) or smaller (eg for (220)-
reflection) than the experimental errors which are mainly determined by counting
statistics
6 Towards time-resolved Debye-Scherrer X-ray diffraction
114
64 Summary
In this chapter the static Debye-Scherrer-diffraction pattern of a Cu foil (20 μm)
and an Au thin film (200 nm) have been presented The feasibility of performing a
time-resolved X-ray Debye-Scherrer measurement with the modular setup has also
been shown A preliminary time-resolved X-ray Debye-Scherrer measurement on a
thin Au film has been preformed The generation of acoustic waves due to rapid build-
up of pressure upon laser excitation and their propagation inside the film has been
followed by simultaneously measuring the transient shifts of the (311)- and (220)-
reflection as a function of pump-probe time delay The measured data are in good
agreement with the behavior expected from propagation of acoustic waves in a
200 nm Au free standing film A Ewald-sphere construction has been used to
determine the strain induced by laser
Finally I would like to comment on the better accuracy achieved in the reported
time-resolved powder diffraction experiment [106]
This is not related to properties of
the X-ray source and the setup which are in fact quite similar (eg X-ray flux of the
source) The essential point determining the different experimental accuracy is the
samples under investigation Comparing the thin film sample used here to the (organic)
powder sample used in Ref [106] the large penetration depth of pump beam in the
latter one (up to a few tens of microm) allows much thicker samples to be used in the
pump-probe experiments Moreover due to the large unit cell size (large lattice
constant small diffraction angles) and the use of a larger detector more diffractions
orders and larger fractions of the complete diffraction rings could be recorded with the
powder sample used in Ref [106] Only these sample properties provided diffraction
patterns with a better signal-to-noise ratio leading to a better experimental accuracy
in the powder diffraction experiment
7 Summary and outlook
115
7 Summary and outlook
71 Summary
This thesis describes my work on optimizing a femtosecond laser plasma Kα X-
ray source improving an existing modular setup for time-resolved X-ray diffraction
experiments and several studies on ultrafast lattice dynamics in thin laser-excited
metal films
In the second chapter the principles of ultrafast laser-plasma based X-ray
sources are presented A systematic investigation of optimizing the Kα X-ray source
for time-resolved X-ray diffraction experiments was performed The Cu and Ti Kα
yield were studied as a function of different laser intensities different angles of
incidence and different controlled pre-pulsepre-plasma conditions The optimized
conditions for both materials were determined Introducing a controlled pre-pulse at
an appropriate time in advance of the main pulse the Kα yield can be enhanced to the
same value no matter what angle of incidence is used This result is valid for both
materials under investigation Due to the same required on-target intensity for the
same Kα emission better energy conversion efficiency is found at a small angle of
incidence with a matching controlled pre-pulse These experimental results agree well
with estimations based on the classical resonance absorption mechanism and detailed
Particle in Cell (PIC) simulations
The third chapter describes the used modular setup for time-resolved X-ray
diffraction and the implemented improvements Applying the results discussed in the
second chapter the X-ray production has been improved Two normalization
methods are compared and discussed The combination of direct normalization and
7 Summary and outlook
116
a ldquofastrdquo delay scanning scheme represents the most efficient way to achieve high
measurement accuracy
By using the optimized setup presented in Chapter 3 the Debye-Waller effect in a
thin laser-excited Au film was observed The experimental results are presented in
chapter 4 For high excitation fluences an exponential drop of the measured
diffraction signal with a decay time constant of 43 ps is measured This result is in
good agreement with previous experimental results as well as the Two-Temperature
Model (TTM) calculations at high fluences As the first time-revolved experiment
performed with the improved modular setup these observations also underline the
capabilities as well as the restrictions of the modular setup
The fifth chapter focuses on investigating coherent optical phonons in Bi after
intense laser-excitation Large amplitude coherent motion of atoms and a softening of
the A1g phonon mode were observed At lower fluences the measured results agree
perfectly with earlier results obtained at the Sub-Picosecond Pulse Source (SPPS) and
University Duisburg-Essen (UDE) Upon strong excitation (absorbed laser fluences gt
2 mJcm2) a further softening of the A1g mode is observed At fluences between 31
and 33 mJcm2 a complete softening of the A1g mode is found This observation
strongly indicates that the Peierls distortion which defines the equilibrium structure
of Bi vanishes and the material is transformed into a transient ordered state of higher
symmetry At even stronger excitation (absorbed laser fluences gt 33 mJcm2) the
atomic motion becomes a Brillouin-zone boundary acoustic phonon mode and this
mode stiffens The observations follow qualitatively the predictions of calculations
based on density functional theory
The sixth chapter is dedicated to time-resolved X-ray Debye-Scherrer diffraction
measurements The presentation of static Debye-Scherrer diffraction pattern of Cu
(20 μm) and Au (200 nm) showed the feasibility of performing time-resolved X-ray
Debye-Scherrer diffraction experiments with the modular setup In the time-resolved
measurements on a Au thin film the generation of acoustic waves and their
propagation inside the film had been observed through the transient shifts of the
(311)- and (220)-reflection The temporal evolution of the measured data is in good
7 Summary and outlook
117
agreement with the behavior expected from propagation of acoustic waves inside the
200 nm free standing film A simple model based on a Ewald-sphere construction has
been used to determine the laser-induced uniaxial strain from the measured time-
resolved Debye-Scherrer patterns
72 Outlook
As it has been underlined in this thesis the modular setup using the laser-plasma-
based X-ray source is still of great interest for performing time-resolved X-ray
diffraction experiments due to its availability and low cost (in comparison to
accelerator-based sources) The following technical developments can be done to
improve the performance of the modular setup and open possibilities for new types of
experiments
1) The conditions to optimize the X-ray output have been discussed in detail in
this thesis Redesign of the source chamber allowing a smaller angle of incidence of
the drive laser for the X-ray source could be an option to fulfill the optimized
condition with less energy requirements to the laser system
2) Improving the overall stability is another important issue for the source This
requires improvement of the stability of the laser system as well as the mechanical
parts of the tape target pulling system
3) An automatic optimizationstabilization of the X-ray output behind the
multilayer optic during experiments can be realized by an automatic adjustment of the
position of the X-ray source point on the tape target through motorized actuators To
carry out this function the manual actuators of several mirrors in the setup should be
replaced by motorized actuators and a control program should be developed and
integrated into the main experiment control program
4) The current sample holder with manual adjustments should be replaced with a
motorized one It should definitely improve the accuracy of the adjustment and also
save time Additionally this would allow to perform irreversible time-resolved X-ray
diffraction experiments eg on laser-induced melting with the modular setup
7 Summary and outlook
118
5) The results of the time-resolved X-ray Debye-Scherrer diffraction
measurements presented in this thesis successfully proved the possibility of
performing Debye-Scherrer type measurements with the laser plasma X-ray source
As single crystalline samples are not required in this scheme a much wider range of
materials which are not easily available as single crystals can be studied now In
order to further improve the experimental accuracy (which directly relates to the
number of detected photons) for this type of experiments a new camera with large
detection area [273]
has been implemented in the setup and tested by F Quirin Once
suitable samples with sufficient diffraction signal are obtained further investigations
could be made with this setup
Since the electronic properties of the material are strongly affected by lattice
structure the laser-induced reversal of the Peierls distortion in Bi should lead to
corresponding changes in its electronic band structure resulting in a semimetal to
metal phase transition Investigation of this phase transition process can be one of the
most interesting subjects for Bi To study the electronic dynamics it requires
techniques which are sensitive to the electronic structure eg time-resolved X-ray
absorption spectroscopy (t-XAS) [274-276]
time-resolved angle-resolved photoelectron
spectroscopy (t-APRES) [277]
and time-resolved THz spectroscopy [278-280]
Another interesting topic on Bi is to observe the coherent Eg motion with X-ray
diffraction The excitation of the Eg mode has been demonstrated in many ultrafast
optical experiments [247 281]
which do not provide direct quantitative information on
the vibrational dynamics These dynamics can be retrieved directly with X-rays and
provide quantitative information about the amplitude of the Eg motion as well as the
coupling behavior between A1g modes and Eg modes Up to now only one study on
this topic has been performed at the Swiss Light Source (SLS) [282]
To completely
understand the displacive excitation of coherent phonons (DECP) mechanism and the
subsequent phonon dynamics more knowledge on the Eg motion is required The
extension of this study should be continued
In recent years sub-picosecond time-resolved X-ray diffuse scattering technique
became available This technique gives information on the phonon population
7 Summary and outlook
119
throughout the Brillouin zone and can yield the phonon dispersion [283]
Applying this
technique to investigate the phonon softening behavior in Bi must be an interesting
subject in the near future However this technique requires large photon flux and is
not possible to be carried out with the current laser plasma sources due to their low X-
ray output The appropriate X-Ray Sources are the new X-ray free electron lasers like
LCLS (USA) SACLA (Japan) or the later XFEL (Germany)
Appendixes
120
Appendixes
A Working principle of multilayer mirror
A multilayer optic is an artificial two dimensional crystal The spacing of the
multilayers is designed for specific radiation to satisfy Braggrsquos diffraction law As
shown in Fig A1 the incident X-rays are reflected by diffraction at a series of
interfaces between layers with differing indices of refraction Only the wavelength of
interest is effectively reflected others which do not satisfy the conditions for Bragg
reflection are absorbed in the mirror and are not reflected thus allowing the mirror to
produce a highly monochromatic beam
Fig A1 Multilayer working principle Reprint from the
manufacturer [284]
The focusing multilayer mirrors are realized by curving the mirror surfaces into
either parabolic or elliptical shapes The d-spacing (thickness of a single bi-layer) of
the multilayer coating is controlled along the mirror surface to satisfy Braggrsquos law at
every point (Fig A2) The band-pass of a multilayer optical system can be further
controlled by using different materials and layer configurations for various
applications
The multilayer X-ray optic used in the X-ray modular setup is twondashdimensional
reflection systems which is realized by using two VariMaxTM
multilayer X-ray
Appendixes
121
mirrors in a ldquoside-by-siderdquo Montel-Helios scheme (Fig A3) [188]
These two mirrors
are placed perpendicularly Each mirror independently reflects x-rays in one of the
two perpendicular directions With the ldquoside-by-siderdquo scheme both mirrors may be
positioned at a location appropriate to optimize performance parameters including
flux spectrum and divergence by adjusting four motorized actuators on the housing
Once the mirrors are adjusted the exact position of the X-ray point source and the
focus are defined
Fig A2 Graded d-Spacing Multilayer for focusing Reprint from the
manufacturer [284]
Fig A3 Scheme of the Montel-Helios configuration Reprint from
the manufacturer [284]
The multilayer X-ray optic prepared for the modular setup is produced by
Rigaku-OSMIC Inc The Specifications provided by the manufacturer are shown in
table A1
Appendixes
122
Parameters (units) CMF10-50Cu12
Characteristic line Cu Kα
Wavelength (Aring) 154
Effective focal spot size (mm) 001
Length of the mirror (mm) 120
Focal spot ndash mirror distance (mm) 100
Focal spot ndash sample distance (mm) 600
Bragg angle in the middle point (degree) 097
Reflectivity Kα (parts) 084
Rocking curve width (arcmin) 198
Capture angle (rad)
(degree)
00264
15133
Convergence angle (rad)
(degree)
00043
024
Focal spot usage efficiency (parts) 096
Beam width at mirror (mm) 264
Beam width at the optic entrance (mm) 106
Beam width at the optic exit (mm) 187
Beam width at the focus (mm) 0094
Optic efficiency (a u)
(Reflectivity Solid angle)
000045
Geometric magnification 15
Ravgsup2 (for double reflection) () 75
Distance X-ray sourcendashentrance of housing (mm) 30
Table A1 Specifications of the Cu Kα multilayer optic provided by
the manufacturer Rigaku-OSMIC Inc Reprint from Ref [186]
B X-ray detectors for diffracted signals
B 1 Direct detection camera
The Roper Scientific Pi-MTE 1300B from Princeton Instruments is an
innovative high-sensitivity imaging system designed to operate inside high-vacuum
chambers over long operation times The Pi-MTE 1300B incorporates a back-
illuminated CCD without AR coating for ultra-low-energy X-ray detection With
20times20 μm pixels and 100 fill factor this system offers a large imaging area with
very high spatial resolution and dynamic range The thermoelectrically cooled design
features PCBs thermally linked to the circulating coolant to provide reliable operation
inside vacuum chambers Its detail specifications are given in Table B1 This camera
is suitable for monitoring hard X-ray radiation due to its good quantum efficiency eg
55 for Ti Kα and 18 for Cu Kα (Fig B1)
As a direct detection camera the incidence photons are directly absorbed by the
active area of CCD pixels and generate charge signals The charge signals are strictly
Appendixes
123
proportional to the incident phonon energy For example the camera used here have
conversions that one Ti Kα (451 keV) photon gives a signal of ~589 counts and one
Cu Kα photon (805 keV) gives a signal of ~1050 counts In high flux condition (gt104
detected photons per pulse) the detected photon number can be easily deduced from
the value of integral signal (see in section 31) In low flux regime (for example 1
detected photon per 40 pixels) this camera can also be used as a multi-channel energy
detector A histogram of the CCD image corresponding to the energy spectrum can be
obtained [142]
and the number of detected photons can easily be deduced from this
histogram This function has been applied in the measurement of X-ray source
production in Chapter 2 Here one should notice that when the histogram is used to
calculate the detected photon number the multi- pixel event issue should be taken into
account
Table B1 Specifications of Roper camera Reprint from the
technical datasheet [285]
Appendixes
124
Fig B1 Quantum efficiency of Roper camera Reprint from the
technical datasheet [285]
Two major limitations of operating this camera should be pointed out The first
one is its working condition During the acquisition of a picture the charged coupled
device (CCD) will accumulate not only the signal from detected photons but also the
signal due to the dark current The dark current depends strongly on the temperature
on the detector Cooling down the detector is the typical way to reduce it In the
experiment the working temperature of the camera is -30deg C which is realized by an
integrated Peltier cooler under the chip Due to this low temperature to protect the
CCD from ice formation on the cooled parts the CCD chip should maintain under
vacuum It can be easily achieve in a big vacuum chamber for example in the
experiment of Chapter 2 For the modular setup the device needs to be operated in air
Additional configuration for keeping the vacuum inside the camera has been made A
special vacuum nose which isolates only the CCD has been installed into the camera
The nose needs to be continuously pumped to insure the required vacuum An Al
plate with a hole of approximately 1 cm2 covered by Beryllium window is installed at
Appendixes
125
the input of the camera which leads to only 14 of CCD size is available for the
exposure The second drawback of this detector is its rather slow readout time For
full size chip information it needs 17 seconds to read out the data The readout time
can be reduced for small regions of interest but it still remains more than 100 ms and
because of this the Roper camera can not be used with a 10 Hz repetition mode to
record each single X-ray pulse
B 2 Indirect detection camera
Pixel Resolution 1392times1040 (43 aspect ratio)
Effective pixel size at input 23 microns square
Active input size 32times24 mm (40mm diagonal)
Intensifier Ultra high-resolution (typically gt 60lpmm) low noise
Intensifier format 40mm diameter
Intensifier input window Coherent fiber optic
Gating Gated on when CCD is integrating off when not
acquiring
Gating speed Minimum gate period approx 100ns
Coupling to scintillators Via coherent straight fiber-optic
Scintillator material Gadolinium Oxysulphide 75mgcm2
Grey Scale Resolution 4096 grey levels (12bits)
Readout speed 20 MHz or 10 MHz pixel rate software selectable
Linearity No measurable deviation from linear response until
saturation
Saturation Approximately 13000 electrons
Video Gain User variable in software in 100 setups
Intensifier Gain User variable in software in 100 setups
On-chip binning User selectable 1times 1to 63 times 63
Exposure Time User selectable from 100μsec to 30 minutes
Readout Philosophy Correlated double sampling for highest accuracy fast 12
bit AD converter in head producing LVDS differential
format
Control PS Link 4 Line bi-directional Serial interface Using
LVDS drivers for reliability over long cables Parameters
that can be adjusted include image intensifier gain video
gain CCD integration period binning and sub-area
window
Power Requirements 110 or 230V ac 5060Hz
Operating Environment Temperature ndash Storage -10 to +80 degC
Operation 0 to +50 degC
Humidity ndash 0-80 RH non-condensing
Table B2 Specifications of Gemstar camera Reprint from the user
manual [273]
Appendixes
126
The Gemstar Camera from Photonic Science is an indirect detection camera Its
specifications are given in Table B2 The main feature of the indirect X-ray detection
is using a scintillator to transform the incoming signal into an optical signal which
can be easily detected and recorded This allows the quantum efficiency of certain
wavelengths like Cu Kα to be optimized by choosing an appropriate material The
scintillator inside this camera is made of a polycrystalline layer of Gadolinium
Oxysulphide which has a quantum efficiency of 85 for Cu Kα radiation When
incident photons are absorbed the scintillator emits photons in the visible range A
straight fiber-optic is used to couple them into the photocathode of the intensifier
These incoming photons produce photoelectrons from the photocathode The
produced electrons are sent through a multi channel plate (MCP) for a further step
amplification The amplification of MCP can be changed in the control software By
triggering the MCP by a camera trigger signal or an additional gate signal the
amplifying process can only be active for a short period during the presence of the X-
ray pulse therefore increasing the signal to noise ratio by reducing the background
signals This method could be very useful when multiple exposures of the Bragg
peaks are required After amplified by MCP the outcoming electrons hit on a
phosphor screen and produce phosphorescence whose intensity is proportional to the
number of incident electrons This light emitted from the screen is then collected by a
tapered fiber optic and sent onto a CCD sensor cooled by a peltier cooler which
allows images to be acquired with extended integration periods with minimal build-
up of CCD dark current This whole process allows the camera to work with a
repetition rate of 10 Hz when the On-Chip binning is set to large than 4times2 binning or
a small region of interest is selected This camera can record a sequence of pictures
containing every single X-ray pulse per picture
A major limitation of this camera is that it can not provide any information about
the energy of the incoming X-ray photons due to several conversion processes and
unlike a direct detection camera it can not be used for obtaining the energy spectrum
from a histogram of the image This type of camera is useful when the incoming
Appendixes
127
photons are monochromatic In this case the average signal from the chip can be
correlated with the average number of incoming photons
B 3 Avalanche Photodiode (APD)
Table B3 Specifications of APD Reprint from the technical
datasheet [286]
The avalanche photodiode is essentially a solid-state equivalent of PMTs
(photon-multiplier tubes) and can replace vacuum tube technology with compact
rugged silicon devices in many applications It is one of options for monitoring
diffracted X-ray signal if only the integrated signal is interesting A cooled large area
silicon avalanche photodiode produced by Laser Components which is assembled
with a homemade amplifier circuit is used for the modular setup Its specifications
and spectral response at visible light range are given in Table B3 and Fig B2
respectively
CHARACTERISTIC TEST
CONDITIONS
MIN TYP MAX UNIT
S
TO (Operating Temperature) +1 +40 degC
TS (Soldering Temperature) +240 deg C
VTEC (TEC Voltage) 43 V
ITEC (TEC Current) 2 A
P (APD Die Power Diss) 02 W
ID (Dark Current) 15 35 nA
CJ (Junction Capacitance) f = 1MHz 50 pF
λrange (Spectral Application Range) Spot Scan 350 1050 nm
R (Responsivity) λ=500nm VR=0V 35 AW
Vop (Operating Voltage) 1700 2000 V
tr (Response Time) RL=50Ωλ=675nm 12 18 nS
IQTEC (TEC Quiescent Current) Case Temp = 35degC 095 A
Appendixes
128
Fig B2 spectral response of APD at Gain = 300 Reprint from the
technical datasheet [286]
One of the advantages of this detector is that it can work at very high speed fast
enough to synchronize to the 10 Hz laser system Another advantage of APD is that it
has single photon sensitivity which allow to detecting weak signal and estimating the
number of detected photons However as a single channel detector the obvious
drawback of APD is that it gives no information on spatial resolution Shifts or
changes of profile of the Bragg peaks can not be observed with this detector during
the measurement It limits the use of the APD only in the experiments in which the
profiles of Bragg peaks do not change a lot during the laser excitation
C Sample material properties
The following relevant material parameters are used in this thesis They are
obtained from literatures WebElements (httpwwwwebelementscom) X-RAY
SERVER (httpsergeygmcaapsanlgovx0h_searchhtml) and X-ray Oriented
Programs (XOP) (httpwwwesrfeucomputingscientificxop21)
C 1 Cu
Name copper
Appendixes
129
Symbol Cu
Number 29
Standard atomic weight 63546
Electron configuration [Ar] 3d10
4s1
Electrons per shell 2 8 18 1
Density 894 gmiddotcmminus3
Crystal structure face-centered cubic
Melting point 1358 K
Specific heat capacity (25 degC) 24440 Jmiddotmolminus1
middotKminus1
Bulk modulus 140 GPa
Kα1 804778 eV λ = 154060410 Aring
Kα2 802783 eV λ = 154443266 Aring
Kβ 890529 eV λ = 139225593 Aring
Sample thickness 10microm 20 microm foil and 300nm thin film on glass substrate
C 2 Ti
Name titanium
Symbol Ti
Number 22
Standard atomic weight 47867
Electron configuration [Ar] 3d2 4s
2
Electrons per shell 2 8 10 2
Density 4506 gmiddotcmminus3
Crystal structure hexagonal
Melting point 1941 K
Specific heat capacity (25 degC) 25060 Jmiddotmolminus1
middotKminus1
Bulk modulus 110 GPa
Kα1 451084 eV λ = 274858848 Aring
Kα2 450486 eV λ = 275223711 Aring
Kβ 493181 eV λ = 251397415 Aring
Sample thickness 20 microm foil and 300nm thin film on glass substrate
C 3 Au
Name gold
Symbol Au
Number 79
Standard atomic weight 196966569
Electron configuration [Xe] 4f14
5d10
6s1
Electrons per shell 2 8 18 32 18 1
Density 1930 gmiddotcmminus3
Appendixes
130
Melting point 133733 K
Specific heat capacity (25 degC) 25418 Jmiddotmolminus1
middotKminus1
Speed of sound 324 kms (polycrystalline)
339 kms (single crystalline 111-direction)
Linear thermal expansion (25 degC) 142 micrommiddotmminus1
middotKminus1
Thermal conductivity (300 K) 318 Wmiddotmminus1
middotKminus1
Optical constants n=0181 k=5125 800 nm
Fig C1 Reflectivity of Gold at 800nm calculated from Fresnel
equations
Sample thickness 150nm on mica substrate and 200nm free standing film
Crystal structure Lattice face centered cubic
Symmetry group Cubic
Unit cell constant a = b = c = 40782 Aring
Unit cell angles α = β = γ = 90deg
X-ray wavelength 1540562 Aring
X-ray energy 8047984 keV
X-ray characteristic line Cu-K α1
Surface plane indices (1 1 1)
Appendixes
131
Fig C2 Bragg reflection of Au (333) calculated from XOP (a) P-
polarized beam and (b) S-polarized beam
Appendixes
132
Planes found 9 Planes being displayed 9
hkl Angle to surface Bragg angle Relative Intensity
xhx0()
(1 1 1) 00049 190956 824245
(1 1 3) 294962 387877 626630
(1 3 1) 294962 387877 626630
(1 3 3) 220017 554164 526226
(2 2 2) 00049 408660 610997
(3 1 1) 294962 387877 626630
(3 1 3) 220017 554164 526226
(3 3 1) 220017 554164 526226
(3 3 3) 00143 789431 460119
Table C1 Bragg angle data of Au obtained from X-RAY SERVER
C 4 Bi
Name bismuth
Symbol Bi
Number 83
Standard atomic weight 20898040
Electron configuration [Xe] 4f14
5d10
6s2 6p
3
Electrons per shell 2 8 18 32 18 5
Electrical Conductivity 867 times 105 Ωm
minus1
Density 978 gmiddotcmminus3
Melting point 5447 K
Specific heat capacity (25 degC) 2552 Jmiddotmolminus1
middotKminus1
Linear thermal expansion (25 degC) 134 micrommiddotmminus1
middotKminus1
Thermal conductivity (300 K) 797 Wmiddotmminus1
middotKminus1
Optical constants n= 28324 k= 45191 800 nm
Appendixes
133
Fig C3 Reflectivity of Bismuth at 800nm calculated from Fresnel
equations
Sample thickness 50nm on Si wafer
Crystal structure Bismuth-fcc
Symmetry group Trigonal (Rhombohedral distortion)
Unit cell constant a = b = c = 65720 Aring
Unit cell angles α = β = γ = 87570 deg
X-ray wavelength 1540562 Aring
X-ray energy 8047984 keV
X-ray characteristic line Cu-K α1
Surface plane indices (1 1 1)
Planes found 9 Planes being displayed 9
hkl Angle to surface Bragg angle Relative Intensity
xhx0()
(1 1 1) 00035 112396 682238
(1 1 3) 310515 222835 575184
(1 3 1) 310515 222835 575184
(1 3 3) 232706 296742 511918
Appendixes
134
(2 2 2) 00035 229435 695383
(3 1 1) 310515 222835 575184
(3 1 3) 232706 296742 511918
(3 3 1) 232706 296742 511918
(3 3 3) 00163 357843 462169
Table C2 Bragg angle data of Bi obtained from X-RAY SERVER
Appendixes
135
Fig C4 Bragg reflection of Bi (111) and (222) calculated from XOP
(a) and (c) P-polarized beam (b) and (d) S-polarized beam
Bibliography
136
Bibliography
[1] W C Roumlntgen ldquoOn a new kind of Rayrdquo Nature 53 274-277 (1896) translated
by A Stanton from W C Roumlntgen ldquoUumlber eine neue Art von Strahlenrdquo Sitz
ber an die med-phys Gesellschaft Wuumlrzburg (1895)
[2] C Davisson and L H Germer ldquoThe Scattering of Electrons by a Single Crystal
of Nickelrdquo Nature 119 558 (1927)
[3] G P Thomson and A Reid ldquoDiffraction of Cathode Rays by a Thin Filmrdquo
Nature 119 890 (1927)
[4] C G Shull ldquoEarly development of neutron scatteringrdquo Rev Mod Phys 67 753
(1995)
[5] D Strickland and G Mourou ldquoCompression of Amplified Chirped Optical
Pulsesrdquo Optics Communications 55 447 (1985)
[6] D Strickland and G Mourou ldquoCompression of Amplified Chirped Optical
Pulses rdquo Optics Communications 56 219 (1985)
[7] D Kuumlhlke U Herpes D von der Linde ldquoSoft x-ray emission from subpicosend
laser-produced plasmardquo Appl Phys Lett 50 1785 (1987)
[8] M M Murnane H C Kapteyn M D Rosen R W Falcone ldquoUltrafast X-ray
Pulses from Laser-Produced Plasmasrdquo Science 251 531 (1991)
[9] A Rousse P Audebert J P Geindre F Fall and J C Gauthier ldquoEfficient Kα
X-ray source from femtosecond laser-produced plasmasrdquo Phys Rev E 50 2200
(1994)
[10] J C Williamson J Cao H Ihee H Frey and A H Zewail ldquoClocking transient
chemical changes by ultrafast electron diffractionrdquo Nature 386 159 (1997)
[11] CY Ruan V A Lobastov R Srinivasan B M Goodson H Ihee and A H
Zewail ldquoUltrafast diffraction and structural dynamics The nature of complex
molecules far from equilibriumrdquo Proc National Acad Sci USA 98 7117
(2001)
[12] B J Siwick J R Dwyer R E Jordan and R J D Miller ldquoUltrafast electron
optics Propagation dynamics of femtosecond electron packetsrdquo J Appl Phys
92 1643 (2002)
[13] B J Siwick J R Dwyer R E Jordan and R J Dwayne Miller ldquoAn Atomic-
Level View of Melting Using Femtosecond Electron Diffractionrdquo Science 302
1382 (2003)
[14] R W Schoenlein S Chattopadhyay H H W Chong T E Glover P A
Heimann C V Shank A A Zholents and M S Zolotorev ldquoGeneration of
Femtosecond Pulses of Synchrotron Radiationrdquo Science 287 2237 (2000)
[15] S Khan K Holldack T Kachel R Mitzner and T Quast ldquoFemtosecond
Undulator Radiation from Sliced Electron Bunchesrdquo Phys Rev Lett 97
074801 (2006)
Bibliography
137
[16] G Ingold P Beaud S L Johnson D Grolimund V Schlott T Schmidt and A
Streun ldquoTechnical Report FEMTO A Sub-ps Tunable Hard X-ray Undulator
Source for LaserX-ray Pump-Probe Experiments at the SLSrdquo Sync Rad News
20 Issue 5 35 (2007)
[17] A L Cavalieri et al ldquoClocking Femtosecond X Raysrdquo Phys Rev Lett 94
114801 (2005)
[18] A M Lindenberg et al ldquoAtomic scale visualization of inertial dynamicsrdquo
Science 308 392 (2005)
[19] A Egbert B N Chichkov and A Ostendorf ldquoUltrashort X-ray source driven by
femtosecond laser pulsesrdquo Europhys Lett 56 228 (2001)
[20] A Egbert B Mader B Tkachenko C Fallnich B N Chichkov H Stiel and P
V Nickles ldquoHigh-repetition rate femtosecond laser-driven hard-x-ray sourcerdquo
Appl Phys Lett 81 2328 (2002)
[21] U Hinze A Egbert B Chichkov and K Eidmann ldquoGeneration of picosecond
hard-x-ray pulses in a femtosecond-laser-driven x-ray dioderdquo Optics Letters 29
2079 (2004)
[22] E Seres J Seres F Krausz C Spielmann ldquoGeneration of Coherent Soft-X-Ray
Radiation Extending Far Beyond the Titanium L Edgerdquo Phys Rev Lett 92
163002 (2004)
[23] J Seres E Seres A J Verhoef G Tempea C Streli P Wobrauschek V
Yakovlev A Scrinzi C Spielmann and F Krausz ldquoLaser technology Source
of coherent kiloelectronvolt X-raysrdquo Nature 433 596 (2005)
[24] Ch Spielmann N H Burnett S Sartania R Koppitsch M Schnuumlrer C Kan
M Lenzner P Wobrauschek F Krausz ldquoGeneration of Coherent X-rays in the
Water Window Using 5-Femtosecond Laser Pulsesrdquo Science 278 661 (1997)
[25] J Zhou J Peatross M M Murnane and H C Kapteyn ldquoEnhanced High-
Harmonic Generation Using 25 fs Laser Pulsesrdquo Phys Rev Lett 76 752
(1996)
[26] A Rousse K Ta Phuoc R Shah A Pukhov E Lefebvre V Malka S Kiselev
F Burgy J P Rousseau D Umstadter and D Hulin ldquoProduction of a keV X-
Ray Beam from Synchrotron Radiation in Relativistic Laser-Plasma
Interactionrdquo Phys Rev Lett 93 135005 (2004)
[27] V Malka J Faure Y A Gauduel E Lefebvre A Rousse and K Ta Phuoc
ldquoPrinciples and applications of compact laserndashplasma acceleratorsrdquo Nature
Physics 4 447 (2008)
[28] H-P Schlenvoigt K Haupt A Debus F Budde O Jaumlckel S Pfotenhauer H
Schwoerer E Rohwer J G Gallacher E Brunetti R P Shanks S M
Wiggins and D A Jaroszynski ldquoA compact synchrotron radiation source driven
by a laser-plasma wakefield acceleratorrdquo Nature Physics 4 130 (2008)
[29] K Nakajima ldquoCompact X-ray sources Towards a table-top free-electron laserrdquo
Nature Physics 4 92 (2008)
Bibliography
138
[30] httpwww-ssrlslacstanfordedulclsindexhtml
[31] T Ishikawa et al ldquoA compact X-ray free-electron laser emitting in the sub-
aringngstroumlm regionrdquo Nature Photon 6 540 (2012)
[32] httpwwwxfeleuXFELpresseenhintergrundwasindexhtml
[33] M Altarelli et al The European X-ray Free-electron Laser (DESY Technical
Report Hamburg Germany)
[34] S Kneip C McGuffey F Dollar M S Bloom V Chvykov G Kalintchenko
K Krushelnick A Maksimchuk S P D Mangles T Matsuoka Z Najmudin
C A J Palmer J Schreiber W Schumaker A G R Thomas and V
Yanovsky ldquoX-ray phase contrast imaging of biological specimens with
femtosecond pulses of betatron radiation from a compact laser plasma wakefield
acceleratorrdquo Appl Phys Lett 99 093701 (2011)
[35] K Ta Phuoc S CordeC Thaury V Malka A Tafzi J P GoddetR C Shah
S Sebban A Rousse ldquoAll-optical Compton gamma-ray sourcerdquo Nature
Photonics 6 308 (2012)
[36] J Ju K Svensson A Doumlpp H E Ferrari K Cassou O Neveu G Genoud F
Wojda M Burza A Persson O Lundh C-G Wahlstroumlm and B Cros
ldquoEnhancement of x-rays generated by a guided laser wakefield accelerator
inside capillary tubesrdquo Appl Phys Lett 100 191106 (2012)
[37] M Schnell A Saumlvert B Landgraf M Reuter M Nicolai O Jaumlckel C Peth T
Thiele O Jansen A Pukhov O Willi M C Kaluza and C Spielmann
ldquoBetatron radiation based measurement of the electron-beam size in a wakefield
acceleratorrdquo AIP Conf Proc 1462 231 (2011)
[38] S Corde C Thaury K Ta Phuoc A Lifschitz G Lambert J Faure O Lundh
E Benveniste A Ben-Ismail L Arantchuk A Marciniak A Stordeur P
Brijesh A Rousse A Specka and V Malka ldquoMapping the X-Ray Emission
Region in a Laser-Plasma Acceleratorrdquo Phys Rev Lett 107 215004 (2011)
[39] C Rischel A Rousse I Uschmann P A Albouy J P Geindre P Audebert J
C Gauthier E Foumlrster J L Martin and A Antonetti ldquoFemtosecond time-
resolved X-ray diffraction from laser heated organic filmsrdquo Nature 390 490
(1997)
[40] T Pfeifer C Spielmann and G Gerber ldquoFemtosecond X-ray sciencerdquo Rep
Prog Phys 96 443 (2006)
[41] M Bargheer N Zhavoronkon M Woerner and T Elsaesser ldquoRecent progress
in ultrafast X-ray diffractionrdquo Chem Phys Chem 7 783 (2006)
[42] C Rose-Petruck R Jimenez T Guo A Cavalleri C W Siders F Rksi J A
Squier B C Walker K R Wilson and C P J Barty ldquoPicosecondndash
milliaringngstroumlm lattice dynamics measured by ultrafast X-ray diffractionrdquo Nature
398 310 (1999)
Bibliography
139
[43] A H Chin R W Schoenlein T E Glover P Balling W P Leemans and C
V Shank ldquoUltrafast Structural Dynamics in InSb Probed by Time-Resolved X-
Ray Diffractionrdquo Phys Rev Lett 83 336 (1999)
[44] AM Lindenberg I Kang S L Johnson T Missalla P A Heimann Z Chang
JLarsson P H Bucksbaum H C Kapteyn H A Padmore R W Lee J S
Wark and R W Falcone ldquoTime-resolved X-ray diffraction from coherent
phonons during a laser-induced phase transitionrdquo Phys Rev Lett 84 111
(2000)
[45] A Cavalleri C W Siders F L H Brown D M Leitner C Toacuteth J A Squier
C P J Barty K R Wilson K Sokolowski-Tinten M Horn von Hoegen and
D von der Linde M Kammler ldquoAnharmonic Lattice Dynamics in Germanium
Measured with Ultrafast X-Ray Diffractionrdquo Phys Rev Lett 85 586 (2000)
[46] A Cavalleri C W Siders C Rose-Petruck R Jimenez C Toacuteth J A Squier C
PJ Barty K R Wilson K Sokolowski-Tinten M Horn-von Hoegen and D
von der Linde ldquoUltrafast x-ray measurement of laser heating in semiconductors
Parameters determining the melting thresholdrdquo Phys Rev B 63 193306 (2001)
[47] D A Reis M F DeCamp P H Bucksbaum R Clarke E Dufresne M
Hertlein R Merlin R Falcone H Kapteyn M M Murnane J Larsson Th
Missalla and J S Wark ldquoProbing impulsive strain propagation with X-Ray
pulsesrdquo Phys Rev Lett 86 3072 (2001)
[48] M F DeCamp D A Reis P H Bucksbaum B Adams J M Caraher R
Clarke C W S Conover E M Dufresne R Merlin V Stoica and J K
Wahlstrand ldquoCoherent control of pulsed X-ray beamsrdquo Nature 413 825 (2001)
[49] D von der Linde K Sokolowski-Tinten Ch Blome C Dietrich A Tarasevitch
A Cavalleri and J A Squier ldquoUltrafast extended to X-rays Femtosecond
time-resolved X-ray diffractionrdquo Z f Phys Chemie 215 1527 (2001)
[50] J Larsson A Allen P H Bucksbaum R W Falcone A Lindenberg G
Naylor T Missalla D A Reis K Scheidt A Sjoumlgren P Sondhauss M Wulff
and J SWark ldquoPicosecond X-ray diffraction studies of laser-excited acoustic
phonons in InSbrdquo Appl Phys A 75 467 (2002)
[51] O Synnergren M Harbst T Missalla J Larssona G Katona R Neutze and R
Wouts ldquoProjecting picosecond lattice dynamics through x-ray topographyrdquo
Appl Phys Lett 80 3727 (2002)
[52] A M Lindenberg I Kang S L Johnson R W Falcone P A Heimann Z
Chang R W Lee and J S Wark ldquoCoherent control of phonons probed by
time-resolved x-ray diffractionrdquo Opt Lett 27 869 (2002)
[53] M F DeCamp D A Reis A Cavalieri P H Bucksbaum R Clarke R Merlin
EM Dufresne D A Arms A M Lindenberg AG MacPhee Z Chang B
Bibliography
140
Lings J SWark and S Fahy ldquoTransient strain driven by a dense electron-hole
plasmardquo Phys Rev Lett 91 165502 (2003)
[54] M Bargheer N Zhavoronkov Y Gritsai J C Woo D S Kim M Woerner
and T Elsaesser ldquoCoherent atomic motions in a nanostructure studied by
femtosecond X-ray diffractionrdquo Science 306 1771 (2004)
[55] M F DeCamp D A Reis D M Fritz P H Bucksbaum E M Dufresneb and
Roy Clarke ldquoX-ray synchrotron studies of ultrafast crystalline dynamicsrdquo J
Synchrotron Rad 12 177 (2005)
[56] S H Lee A L Cavalieri D M Fritz M C Swan R S Hegde M Reason R
S Goldman and D A Reis ldquoGeneration and propagation of a picosecond
acoustic pulse at a buried interface Time-resolved X-ray diffraction
measurementsrdquo Phys Rev Lett 95 246104 (2005)
[57] Y Hayashi Y Tanaka T Kirimura N Tsukuda E Kuramoto and T Ishikawa
ldquoAcoustic pulse echoes probed with time-resolved X-ray triple-crystal
diffractometryrdquo Phys Rev Lett 96 115505 (2006)
[58] C V Korff Schmising M Bargheer M Kiel N Zhavoronkov MWoerner T
Elsaesser I Vrejoiu D Hesse and M Alexe ldquoStrain propagation in
nanolayered perovskites probed by ultrafast x-ray diffractionrdquo Phys Rev B 73
212202 (2006)
[59] A Morak T Kaumlmpfer I Uschmann A Luumlbcke E Foumlrster and R Sauerbrey
ldquoAcoustic phonons in InSb probed by time-resolved x-ray diffractionrdquo Phys
Stat Sol b 243 2728 (2006)
[60] H Enquist H Navirian T N Hansen A M Lindenberg P Sondhauss
OSynnergren J SWark and J Larsson ldquoLarge Acoustic Transients Induced
by Nonthermal Melting of InSbrdquo Phys Rev Lett 98 225502 (2007)
[61] M Nicoul U Shymanovich A Tarasevitch D von der Linde and K
Sokolowski-Tinten ldquoPicosecond acoustic response of a laser-heated Gold-film
studied with time-resolved X-ray diffractionrdquo Appl Phys Lett 98 191902
(2011)
[62] R Shayduk H Navirian W Leitenberger J Goldshteyn I Vrejoiu M
Weinelt P Gaal M Herzog C v Korff Schmising and M Bargheer
ldquoNanoscale heat transport studied by high-resolution time-resolved x-ray
diffractionrdquo New Journal of Physics 13 093032 (2011)
[63] M Herzog D Schick W Leitenberger R Shayduk R M van der Veen C J
Milne S L Johnson I Vrejoiu and M Bargheer ldquoTailoring interference and
nonlinear manipulation of femtosecond x-raysrdquo New Journal of Physics 14
013004 (2012)
[64] M Herzog D Schick P Gaal R Shayduk C v Korff Schmising M Bargheer
ldquoAnalysis of ultrafast X-ray diffraction data in a linear-chain model of the
lattice dynamicsrdquo Appl Phys A 106 489 (2012)
Bibliography
141
[65] M Herzog A Bojahr J Goldshteyn W Leitenberger I Vrejoiu D Khakhulin
M Wulff R Shayduk P Gaal and M Bargheer ldquoDetecting optically
synthesized quasi-monochromatic sub-terahertz phonon wavepackets by
ultrafast x-ray diffractionrdquo Appl Phys Lett 100 094101 (2012)
[66] C V Korff Schmising A Harpoeth N Zhavoronkov M Woerner T
Elsaesser M Bargheer M Schmidbauer I Vrejoiu D Hesse and M Alexe
ldquoFemtosecond X-ray diffraction from nanolayered oxidesrdquo Physics Procedia
3333 (2010)
[67] S L Johnson P Beaud E Vorobeva C J Milne EacuteD Murray S Fahy and G
Ingold ldquoNon-equilibrium phonon dynamics studied by grazing-incidence
femtosecond X-ray crystallographyrdquo Acta Cryst A 66 157 (2010)
[68] K Sokolowski-Tinten C Blome J Blums A Cavalleri C Dietrich A
Tarasevitch I Uschmann E Foumlrster M Kammler M Horn-von Hoegen and D
von der Linde ldquoFemtosecond X-ray measurement of coherent lattice vibrations
near the Lindemann stability limitrdquo Nature 422 287 (2003)
[69] D M Fritz et al ldquoUltrafast bond softening in Bismuth Mapping a solids
interatomic potential with X-raysrdquo Science 315 633 (2007)
[70] M Bargheer N Zhavoronkov J C Woo D S Kim M Woerner and T
ElsaesserldquoExcitation mechanisms of coherent phonons unravelled by
femtosecond X-ray diffractionrdquo Phys Stat Sol (b) 243 2389 (2006)
[71] C von Korff Schmising M Bargheer M Kiel N Zhavoronkov M Woerner
TElsaesser I Vrejoiu D Hesse and M Alexe ldquoAccurate time delay
determination for femtosecond X-ray diffraction experimentsrdquo Appl Phys B 88
1 (2007)
[72] B Freyer J Stingl F Zamponi M Woerner and T Elsaesser ldquoThe rotating-
crystal method in femtosecond X-ray diffractionrdquo Optics Express 19 15506
(2011)
[73] S L Johnson P Beaud C J Milne F S Krasniqi E S Zijlstra M E Garcia
M Kaiser D Grolimund R Abela and G Ingold ldquoNanoscale Depth-Resolved
Coherent Femtosecond Motion in Laser-Excited Bismuthrdquo Phys Rev Lett 100
155501 (2008)
[74] K H Bennemann ldquoUltrafast dynamics in solidsrdquo J Phys Condens Matter 16
R995 (2004)
[75] C W Siders A Cavalleri K Sokolowski-Tinten Cs Toacuteth T Guo M
Kammler M Horn von Hoegen K R Wilson D von der Linde and C P J
Barty ldquoDetection of Nonthermal Melting by Ultrafast X-ray Diffractionrdquo
Science 286 1340 (1999)
[76] K Sokolowski-Tinten C Blome C Dietrich A TarasevitchM Horn-von
Hoegen D von der Linde A Cavalleri J Squier and M Kammler
Bibliography
142
ldquoFemtosecond X-ray measurement of ultrafast melting and large acoustic
transientsrdquo Phys Rev Lett 87 225701 (2001)
[77] T Feurer A Morak I Uschmann Ch Ziener H Schwoerer Ch Reich P
Gibbon E Foumlrster R Sauerbrey K Ortner and C R Becker ldquoFemtosecond
silicon Kα pulses from laser-produced plasmasrdquo Phys Rev E 65 016412
(2001)
[78] A Rousse C Rischel S Fourmaux I Uschmann S Sebban G Grillon P
Balcou E Foumlrster J P Geindre P Audebert J C Gauthier and D Hulin
ldquoNon-thermal melting in semiconductors measured at femtosecond resolutionrdquo
Nature 410 65 (2001)
[79] K J Gaffney et al ldquoObservation of Structural Anisotropy and the Onset of
Liquidlike Motion During the Nonthermal Melting of InSbrdquo Phys Rev Lett
95 125701 (2005)
[80] P B Hillyard et al ldquoCarrier-density-dependent lattice stability in InSbrdquo Phys
RevLett 98 125501 (2007)
[81] G Sciaini M Harb S G Kruglik T Payer C T Hebeisen F -J Meyer zu
Heringdorf M Yamaguchi M Horn von Hoegen R Ernstorfer and R J D
Miller ldquoElectronic acceleration of atomic motions and disordering in bismuthrdquo
Nature 458 56 (2009)
[82] E Collet et al ldquoLaser-Induced Ferroelectric Structural Order in an Organic
Charge-Transfer Crystalrdquo Science 300 612 (2003)
[83] A Cavalleri S Wall C Simpson E Statz D W Ward K A Nelson M Rini
R W Schoenlein ldquoTracking the motion of charges in a terahertz light field by
femtosecond X-ray diffractionrdquo Nature 442 664 (2006)
[84] SK Streiffer JA Eastman DD Fong C Thompson A Munkholm MV
Ramana Murty O Auciello GR Bai GB Stephenson ldquoObservation of
nanoscale 180 deg stripe domains in ferroelectric PbTiO3 thin filmsrdquo Phys Rev
Lett 89 067601 (2002)
[85] RV Wang DD Fong F Jiang MJ Highland PH Fuoss C Thompson A
M Kolpak J A Eastman S K Streiffer A M Rappe and G B Stephenson
ldquoReversible chemical switching of a ferroelectric filmrdquo Phys Rev Lett 102
047601 (2009)
[86] M Woerner C v Korff Schmising M Bargheer N Zhavoronkov I Vrejoiu
D Hesse M Alexe and T Elsaesser ldquoUltrafast structural dynamics of
perovskite superlatticesrdquo Applied Physics A 96 83 (2009)
[87] D Daranciang M J Highland H Wen et al ldquoUltrafast photovoltaic response
in ferroelectric nanolayersrdquo Phys Rev Lett 108 087601 (2012)
[88] I Radu C Stamm N Pontius T Kachel P Ramm J-U Thiele H A Duumlrr
and C H Back ldquoLaser-induced generation and quenching of magnetization on
FeRh studied with time-resolved x-ray magnetic circular dichroismrdquo Phys Rev
B 81 104415 (2010)
Bibliography
143
[89] U Shymanovich F Quirin M Vattilana W Lu M Nicoul A-E El-Kamhawy
A Tarasevitch D von der Linde K Sokolowski-Tinten ldquoUltrafast lattice
dynamics in FeRh during a laser-induced magnetic phase transitionrdquo Ultrafast
Phenomena XVII Oxford University Press (2011)
[90] C Stamm T Kachel N Pontius R Mitzner T Quast K Holldack S Khan C
Lupulescu E F Aziz M Wietstruk H A Duumlrr and W Eberhardt
ldquoFemtosecond modification of electron localization and transfer of angular
momentum in nickelrdquo Nature Materials 6 740 (2007)
[91] C Stamm J-U Thiele T Kachel I Radu P Ramm M Kosuth J Minaacuter H
Ebert H A Duumlrr W Eberhardt and C H Back ldquoAntiferromagnetic-
ferromagnetic phase transition in FeRh probed by x-ray magnetic circular
dichroismrdquo Phys Rev B 77 184401 (2008)
[92] M Wietstruk A Melnikov Ch Stamm T Kachel N Pontius M Sultan C
Gahl MWeinelt H A Duumlrr U Bovensiepen ldquoHot electron driven
enhancement of spin-lattice coupling in 4f ferromagnets observed by
femtosecond x-ray magnetic circular dichroismrdquo Phys Rev Lett 106 127401
(2011)
[93] C Boeglin E Beaurepaire V Halteacute V Loacutepez-Flores C Stamm N Pontius H
A Duumlrr and J-Y Bigo ldquoDistinguishing the ultrafast dynamics of spin and
orbital moments in solidsrdquo Nature 465 458 (2010)
[94] C Stamm N Pontius T Kachel M Wietstruk and H A Duumlrr ldquoFemtosecond
x-ray absorption spectroscopy of spin and orbital angular momentum in
photoexcited Ni films during ultrafast demagnetizationldquo Phys Rev B 81
104425 (2010)
[95] H A Duumlrr ldquoFemtosecond electron and spin dynamics in ferromagnetic Ni
probed by UV and soft X-ray pulsesldquo Nucl Instr and Meth A 601 132 (2009)
[96] J Miguel J Saacutenchez-Barriga D Bayer J Kurde B Heitkamp M Piantek F Kronast
M Aeschlimann H A Duumlrr and W Kuch ldquoTime-resolved magnetization
dynamics of cross-tie domain walls in permalloy microstructuresrdquo J Phys
Condens Matter 21 496001 (2009)
[97] T Kachel N Pontius C Stamm M Wietstruk E F Aziz H A Duumlrr W
Eberhardt and F M F de Groot ldquoTransient electronic and magnetic structures
of nickel heated by ultrafast laser pulsesrdquo Phys Rev B 80 092404 (2009)
[98] H A Duumlrr C Stamm T Kachel N Pontius R Mitzner T Quast K
Holldack S Khan C Lupulescu EF Aziz M Wietstruk W Eberhardt
ldquoUltrafast Electron and Spin Dynamics in Nickel Probed With Femtosecond X-
Ray Pulsesrdquo IEEE Trans Magn 44 1957 (2008)
[99] S L Johnson et al ldquoFemtosecond Dynamics of the Collinear-to-Spiral
Antiferromagnetic Phase Transition in CuOrdquo Phys Rev Lett 108 037203
(2012)
Bibliography
144
[100] K A Seu S Roy J J Turner S Park C M Falco and S D Kevan ldquoCone
phase and magnetization fluctuations in AuCoAu thin films near the spin-
reorientation transitionrdquo Phys Rev B 82 012404 (2010)
[101] I Radu K Vahaplar C Stamm T Kachel N Pontius H A Duumlrr T A
Ostler J Barker R F L Evans R W Chantrell A Tsukamoto A Itoh A
Kirilyuk Th Rasing and A V Kimel ldquoTransient ferromagnetic-like state
mediating ultrafast reversal of antiferromagnetically coupled spinsrdquo Nature
472 205 (2011)
[102] K Holldack N Pontius E Schierle T Kachel V Soltwisch R Mitzner T
Quast G Springholz and E Weschke ldquoUltrafast dynamics of
antiferromagnetic order studied by femtosecond resonant soft x-ray diffractionrdquo
Appl Phys Lett 97 062502 (2010)
[103] A Kirilyuk A Kimel and T Rasing ldquoUltrafast optical manipulation of
magnetic orderrdquo Rev Mod Phys 82 2731 (2010)
[104] F Quirin M Vattilana U Shymanovich A-E El-Kamhawy A Tarasevitch
J Hohlfeld D von der Linde and K Sokolowski-Tinten ldquoStructural dynamics
in FeRh during a laser-induced metamagnetic phase transitionrdquo Phys Rev
B 85 020103(R) (2012)
[105] U Shymanovich M Nicoul W Lu S Kaumlhle A Tarasevitch K Sokolowski-
Tinten and D von der Linde ldquoTowards ultrafast time-resolved Debye-Scherrer
Xray diffraction using a laser-plasma sourcerdquo Rev Sci Instrum 80 083102
(2009)
[106] F Zamponi Z Ansari M Woerner and T Elsaesser ldquoFemtosecond powder
diffraction with a laser-driven hard X-ray sourcerdquo Optics Express 18 947
(2010)
[107] F Zamponi Z Ansari C v Korff Schmising P Rothhardt N Zhavoronkov
M Woerner T Elsaesser M Bargheer T Trobitzsch-Ryll and M Haschke
ldquoFemtosecond hard X-ray plasma sources with a kilohertz repetition raterdquo Appl
Phys A 96 51 (2009)
[108] J Stingl F Zamponi B Freyer M Woerner T Elsaesser and A Borgschulte
ldquoStrong-field electron transfer in a virtual quantum state mapped by
femtosecond x-ray diffractionrdquo Phys Rev Lett 109 147402 (2012)
[109] M J J Vrakking and T Elsaesser ldquoX-rays inspire electron moviesrdquo Nature
Photon 6 645 (2012)
[110] F Zamponi J Stingl M Woerner and T Elsaesser ldquoUltrafast soft-mode
driven charge relocation in an ionic crystalrdquo Physical Chemistry Chemical
Physics (PCCP) 14 6156 (2012)
[111] M Trigo J Chen V H Vishwanath Y M Sheu T Graber R Henning and
D A Reis ldquoImaging nonequilibrium atomic vibrations with x-ray diffuse
scatteringrdquo Physical Review B 82 235205(2010)
Bibliography
145
[112] A M Lindenberg et al ldquoX-Ray Diffuse Scattering Measurements of
Nucleation Dynamics at Femtosecond Resolutionrdquo Phys Rev Lett 100
135502 (2008)
[113] M Born and E Wolf Principles of optics Cambridge University Press (1988)
[114] G Jenke ldquoErzeugung von XUV- und Roumlntgenstralung mit Femtosecunden-
Laserimpulsenrdquo Dissertation (1999)
[115] Z Jiang J C Kieffer J P Matte M Chaker O Peyrusse D Gilles GKorn
A Maksimchuk S Coe and G Mourou ldquoX-ray spectroscopy of hot solid
density plasmas produced by subpicosecond high contrast laser pulses at 1018
ndash
1019
Wcm2rdquoPhys Plasmas 2 1702 (1995)
[116] F Brunel ldquoNot-So Resonant Resonant Absorptionrdquo Phys Rev Lett 59 52
(1987)
[117] S C Wilks and W L Kruer ldquoAbsorption of ultrashort ultra-intense laser light
by solids and overdense plasmasrdquo IEEE J Quan Electron 33 1954 (1997)
[118] S Bastiani A Rousse J P Geindre P Audebert C Quoix G Hamoniaux A
Antonettia and J C Gauthier ldquoExperimental study of the interaction of
subpicosecond laser pulses with solid targets of varying initial scale lengthsrdquo
Phys Rev E 56 7179 (1997)
[119] P Gibbon E Foumlrster ldquoShort-pulse laser-plasma interactionsrdquo Plasma Phys
Control Fusion 38 769 (1996)
[120] T Feurer A Morak I Uschmann Ch Ziener H Schwoumlrer E Foumlrster and R
Sauerbrey ldquoAn incoherent sub-picosecond X-ray source for time-resolved X-
ray-diffraction experimentsrdquo Appl Phys B Lasers Opt 72 15 (2001)
[121] C Reich P Gibbon I Uschmann and E Foumlrster ldquoYield optimization and time
structure of femtosecond laser plasma Kα sourcesrdquo Phys Rev Lett 84 4846
(2000)
[122] T Guo Ch Spielmann B C Walker C P J Barthy ldquoGeneration of hard X-
rays by ultrafast terawatt lasersrdquo Rev Sci Instr 72 41 (2001)
[123] R Fedosejevs R Ottmann R Sigel G Kuumlhnle S Szatmaacuteri F P Schaumlfer
ldquoAbsorption of subpicosecond ultraviolet laser pulses in high-density plasmardquo
ApplPhyB 50 79 (1990)
[124] C A Quarles ldquoSemiempirical analysis of electron-induced K-shell ionizationrdquo
Phys Rev A 13 1278 (1976)
[125] W E Burcham Elements of Nuclear Physics Pearson (1979)
[126] E Casnati A Tartari and C Baraldi ldquoAn empirical approach to K-shell ionisation
cross section by electronsrdquo J Phys B 15 155 (1982)
[127] P Gibbon A Andreev E Lefebvre G Bonnaud H Ruhl J Delettrez and A
R Bell ldquoCalibration of one-dimensional boosted kinetic codes for modeling
high-intensity laserndashsolid interactionsrdquo Phys Plasmas 6 947 (1999)
Bibliography
146
[128] DC Joy Monte Carlo Modeling for Electron Microscopy and Microanalysis
Oxford University Press Oxford (1995)
[129] D Salzmann Ch Reich I Uschmann E Foumlrster PGibbon ldquoTheory of Kα
generation by femtosecond laser-produced hot electrons in thin foilsrdquo Phys
Rev E 65 036402 (2002)
[130] F Y Khattak O A M B Percie du Sert D Riley P S Foster E J Divall C
J Hooker A J Langley J Smith and P Gibbon ldquoComparison of experimental
and simulated Kα yield for 400 nm ultrashort pulse laser irradiationrdquo Phys Rev
E 74 027401 (2006)
[131] P Gibbon and A R Bell ldquoCollisionless Absorption in Sharp-Edged Plasmasrdquo
Phys Rev Lett 68 1535 (1992)
[132] D D Meyerhofer H Chen J A Delettrez B Soom S Uchida and B Yaakobi
ldquoResonance absorption in high-intensity contrast picosecond laser-plasma
interactionsrdquo Phys Fluids B 5 2584 (1993)
[133] U Teubner W Theobald and C Wuumllker ldquoMechanisms and origin of
continuum and line emission from carbon plasmas produced by ultrashort laser
pulsesrdquo J Phys B 29 4333 (1996)
[134] M Schnuumlrer M P Kalashnikov P V Nickles Th Schlegel W Sandner N
Demchenko R Nolte and P Ambrosi ldquoHard x‐ray emission from intense short
pulse laser plasmasrdquo Phys Plasmas 2 3106 (1995)
[135] J D Kmetec C L Gordon III J J Macklin B E Lemoff G S Brown and
S E Harris ldquoMeV x-ray generation with a femtosecond laserrdquo Phys Rev Lett
68 1527 (1992)
[136] A P Fews P A Norreys F N Beg A R Bell A E Dangor C N Danson
P Lee and S J Rose ldquoPlasma Ion Emission from High Intensity Picosecond
Laser Pulse Interactions with Solid Targetsrdquo Phys Rev Lett 73 1801 (1994)
[137] D C Eder G Pretzler E Fill K Eidmann and A Saemann ldquoSpatial
characteristics of Kα radiation from weakly relativistic laser plasmasrdquo Appl
Phys B Lasers Opt 70 211 (2000)
[138] S Backus C G Durfee M M Murnane and H C Kapteyn ldquoHigh power
ultrafast lasersrdquo Rev Sci Instrum 69 1207 (1998)
[139] K Lobov ldquoHigh order harmonic generation at relativistic laser intensitiesrdquo
Dissertation (2008)
[140] U Shymanovich ldquoDirect observation of ultrafast atomic motion using time-
resolved X-ray diffractionrdquo Dissertation (2007)
[141] F Scholze H Henneken P Kuschnerus H Rabus M Richter G Ulm
ldquoDetermination of the electronndashhole pair creation energy for semiconductors
from the spectral responsivity of photodiodesrdquo Nuclear Instruments and
Methods in Physics Research A 439 208 (2000)
Bibliography
147
[142] F Zamponi T Kaumlmpfer A Morak I Uschmann and E Foumlrster
ldquoCharacterization of a deep depletion back-illuminated charge-coupled device
in the x-ray rangerdquo Rev Sci Instrum 76 116101 (2005)
[143] The quantum efficiency of the CCD was calibrated with a Si reference detector
[144] D W Forslund J M Kindel and K Lee ldquoTheory of Hot-Electron Spectra at
High Laser Intensityrdquo Phys Rev Lett 39 284 (1977)
[145] W L Kruer and K Estabrook ldquoLaser light absorption due to self‐generated
magnetic fieldsrdquo Phys Fluids 20 1688 (1977)
[146] N H Burnett G D Enright A Avery A Loen and J C Kieffer ldquoTime-
resolved Kα spectra in high-intensity laser-target interactionrdquo Phys Rev A 29
2294 (1984)
[147] W L Kruer The Physics of Laser Plasma Interaction Addison-Wesley (1988)
[148] N Zhavoronkov Y Gritsai M Bargheer M Woerner and T Elsaesser
ldquoGeneration of ultrashort Kα radiation from quasipoint interaction area of
femtosecond pulses with thin foilsrdquo Appl Phys Lett 86 244107 (2005)
[149] F Ewald H Schwoerer and R Sauerbrey ldquoKα-radiation from relativistic laser-
produced plasmasrdquo Europhys Lett 60 710 (2002)
[150] A Zhidkov A Sasaki T Utsumi I Fukumoto T Tajima F Saito Y
Hironaka K G Nakamura K I Kondo and M Yoshida ldquoPrepulse effects on
the interaction of intense femtosecond laser pulses with high-Z solidsrdquo Phys
Rev E 62 7232 (2000)
[151] F Y Khattak E Garcia Saiz T Dzelzainis D Riley and Z Zhai ldquoScale-
length optimizing of short pulse Cu Kα laser-plasma sourcesrdquo Appl Phys Lett
90 081502 (2007)
[152] Ch Reich I Uschmann F Ewald S Duumlsterer A Luumlbcke H Schwoerer R
Sauerbrey E Foumlrster and P Gibbon ldquoSpatial characteristics of Kα x-ray
emission from relativistic femtosecond laser plasmasrdquo Phys Rev E 68 056408
(2003)
[153] K Sokolowski-Tinten C Blome J Blums A Cavalleri C Dietrich A
Tarasevitch and D von der Linde ldquoUltrafast Time-Resolved X-ray
Diffractionrdquo AIP Conf Proc 634 11 (2002)
[154] N Zhavoronkov Y Gritsai M Bargheer M Woerner T Elsaesser F
Zamponi I Uschmann and E Forster ldquoUltrafast Optics - Microfocus Cu Kα
source for femtosecond x-ray sciencerdquo Optics Letters 30 1737 (2005)
[155] Bixue Hou James Easter Karl Krushelnick and John A Nees ldquo Generation of
hard x rays by femtosecond laser pulse interaction with Cu in laminar helium
flow in ambient airrdquo Appl Phys Lett 92 161501 (2008)
[156] Ch Ziener I Uschmann G Stobrawa Ch Reich P Gibbon T Feurer A
Morak S Duumlsterer H Schwoerer E Foumlrster and R Sauerbrey ldquoOptimization
of Kα bursts for photon energies between 17 and 7 keV produced by
Bibliography
148
femtosecond-laser-produced plasmas of different scale lengthrdquo Phys Rev E 65
066411 (2002)
[157] U Teubner J Bergmann B van Wonterghem F P Schaumlfer and R Sauerbrey
ldquoAngle-dependent x-ray emission and resonance absorption in a laser-produced
plasma generated by a high intensity ultrashort pulserdquo Phys Rev Lett 70 794
(1993)
[158] U Teubner P Gibbon E Foumlrster F Falliegraves P Audebert J P Geindre and J
C Gauthier ldquoSubpicosecond KrF‐laser plasma interaction at intensities
between 1014
and 1017
Wcm2rdquo Phys Plasmas 3 2679 (1996)
[159] J F Liu W Yu and L J Qian ldquoCharge Displacement in Ultraintense Laser-
Plasma Interactionrdquo Physica Scripta 72 243 (2005)
[160] T P Hughes Plasma and Laser Light Adam Hilger (1975)
[161] Y T Lee R A London G B Zimmerman and P L Hagelstein ldquoApplication
of escape probability to line transfer in laser‐produced plasmasrdquo Phys Fluids B
2 2731 (1990)
[162] A K Sharma R K Thareja ldquoPlume dynamics of laser-produced aluminum
plasma in ambient nitrogenrdquo Applied Surface Science 243 68 (2005)
[163] H Nakano T Nishikawa and N Uesugi ldquoEnhanced K-shell x-ray line
emissions from aluminum plasma created by a pair of femtosecond laser pulsesrdquo
Appl Phys Lett79 24 (2001)
[164] H Ahn H Nakano T Nishikawa and N Uesugi ldquoSimultaneous Measurement
of Absorption and X-Ray Emission from Preformed Plasma Generated by
Ultrashort Prepulseldquo Jpn J Appl Phys 35 L154 (1996)
[165] T Feurer ldquoFeedback-controlled optimization of soft-X-ray radiation from
femtosecond laser-produced plasmasrdquo Appl Phys B Lasers Opt 68 55 (1999)
[166] U Teubner G Kuumlhnle and F P Schaumlfer ldquoDetailed study of the effect of a
short prepulse on soft X-ray spectra generated by a high-intensity KrF laser
pulserdquo Appl Phys B 54 493 (1992)
[167] Th Schlegel S Bastiani L Gregravemillet J-P Geindre P Audebert J-C
Gauthier E Lebebvre G Bonnaud and J Delettrez ldquoComparison of measured
and calculated x-ray and hot-electron production in short-pulse laser-solid
interactions at moderate intensitiesrdquo Phys Rev E 60 2209 (1999)
[168] A Schmitt R S B Ong ldquoThe effect of collisions on wave-breaking in a cold
plasmardquo Appl Phys 22333 (1980)
[169] J P Freidberg R W Mitchell R L Morse and L I Rudsinski ldquoResonant
Absorption of Laser Light by Plasma Targetsrdquo Phys Rev Lett 28 795 (1972)
[170] M Abramowitz and I Stegun Handbook of Mathematical functions National
Bureau of Standards (1964)
[171] A Tarasevitch A Orisch D von der Linde Ph Balcou G Rey J -P
Chambaret U Teubner D Kloumlpfel and W Theobald ldquoGeneration of high-
Bibliography
149
order spatially coherent harmonics from solid targets by femtosecond laser
pulsesrdquo Phys Rev A 62 023816 (2000)
[172] H-S Park D M Chambers H -K Chung R J Clarke et al ldquoHigh-energy
Kα radiography using high-intensity short-pulse lasersrdquo Phys Plasmas 13
056309 (2006)
[173] P P Rajeev S Banerjee A S Sandhu R C Issac L C Tribedi and G R
Kumar ldquoRole of surface roughness in hard-x-ray emission from femtosecond-
laser-produced copper plasmasrdquo Phys Rev A 65 052903 (2002)
[174] R Rix ldquoAbsorption intensiver ultrakurzer Laserpulse an Festkoumlrpertargetsrdquo
Diplomarbeit Max-Planck-Institut Fuumlr Quantenoptik Garching Germany
(1999)
[175] U Teubner I Uschmann P Gibbon D Altenbernd E Foumlrster T Feurer W
Theobald R Sauerbrey G Hirst M H Key J Lister and D Neely
ldquoAbsorption and hot electron production by high intensity femtosecond uv-laser
pulses in solid targetsrdquo Phys Rev E 54 4167 (1996)
[176] P Gibbon M Mašek U Teubner W Lu M Nicoul U Shymanovich A
Tarasevitch P Zhou K Sokolowski-Tinten and D von der Linde ldquoModelling
and optimisation of fs laser-produced Kα sourcesrdquo Appl Phys A 96 23 (2009)
[177] J M Dawson ldquoParticle simulation of plasmasrdquo Rev Mod Phys 55 403
(1983)
[178] T Tajima Computational Plasma Physics with Applications to Fusion and
Astrophysics AddisonndashWesley (1989)
[179] C K Birdsall and A B Langdon Plasma Physics via Computer simulations
IOP Publishing Ltd Bristol U K (1991)
[180] H L Anderson ldquoMetropolis Monte Carlo and the MANIACrdquo Los Alamos
Science 14 96 (1986)
[181] W Lu M Nicoul U Shymanovich A Tarasevitch P Zhou K Sokolowski-
Tinten D von der Linde M Mašek P Gibbon and U Teubner ldquoOptimized
Kα X-ray flashes from femtosecond-laser irradiated foilsrdquo Phys Rev E 80
026404 (2009)
[182] D Riley J J Angulo-Gareta F Y Khattak M J Lamb P S Foster E J
Divall C J Hooker A J Langley R J Clarke and D Neely ldquoKα yields from
Ti foils irradiated with ultrashort laser pulsesrdquo Phys Rev E 71 016406 (2005)
[183] International Commission on Radiation Units amp Measurements Report No 37
unpublished (1984)
[184] httpphysicsnistgovPhysRefDataXrayMassCoefcoverhtml
[185] C Rulliere Femtosecond Laser Pulses Principles and Experiments 2nd ed
Springer (2004)
[186] M Nicoul ldquoTime-resolved X-ray diffraction with accelerator- and laser-
plasma-based X-ray sourcesrdquo Dissertation (2010)
Bibliography
150
[187] A Ruhl ldquoErzeugung intensiver Roumlntgenimpulse mit einem Bandtargetrdquo
Diplomarbeit (2006)
[188] M Montel ldquoAberrations du Premier Ordre des Systegravemes Catoptriques
Asymeacutetriques Application au Microscope X agrave Reacuteflexion Totalerdquo Optica Acta 1
117 (1954)
[189] httpwwwcxrolblgov
[190] L M P Fernandes F D Amaro A Antognini J M R Cardoso C A N
Conde O Huot P E Knowles F Kottmann J A M Lopes L Ludhova C
M B Monteiro F Mulhauser R Pohl J M F dos Santos L A Schaller D
Taqqud and J F C A Velosoe ldquoCharacterization of large area avalanche
photodiodes in X-ray and VUV-light detectionrdquo Journal of Instrumentation
(JINST) 2 08005 (2007)
[191] L M P Fernandes J A M Lopes J M F dos Santos P E Knowles L
Ludhova F Mulhauser F Kottmann R Pohl D Taqqu ldquoLAAPD low
temperature performance in X-ray and visible-light detectionrdquo IEEE
Transactions on Nuclear Science 51 1575 (2004)
[192] httpwwwcaenitjspTemplate2CaenProdjspparent=9ampidmod=409
[193] W Demtroumlder Laser Spectroscopy Basic Concepts and Instrumentation 2nd
Edition Springer-Verlag (1996)
[194] J Chesnoy and A Mokhtari Resonant impulsive-stimulated Raman-scattering
on Malachite Green Phys Rev A 38 3566 (1988)
[195] A Tokmakoff B Sauter and M D Fayer ldquoTemperature‐dependent
vibrational relaxation in polyatomic liquids Picosecond infrared pumpndashprobe
experimentsrdquo J Chem Phys 100 9035 (1994)
[196] S Ghosh and B M Arora ldquoPhotoreflectance spectroscopy with white light
pump beamrdquo Rev Sci Instrum 69 1261 (1998)
[197] R C Stanley ldquoCounting statistics in X-ray spectroscopyrdquo Br J Appl Phys 12
503 (1961)
[198] D Laundy and S Collins ldquoCounting statistics of X-ray detectors at high
counting ratesrdquo J Synchrotron Rad 10 214 (2003)
[199] G C Cho W Kuumltt and H Kurz ldquoSubpicosecond time-resolved coherent-
phonon oscillations in GaAsrdquo Phys Rev Lett 65 764 (1990)
[200] S I Anisimov B L Kapeliovich T L Perelman ldquoElectron emission from
metal surfaces exposed to ultrashort laser pulsesrdquo Sov Phys JETP 39 375
(1974)
[201] M Ligges I Rajkovic P Zhou O Posth C Hassel G Dumpich D von der
Linde ldquoObservation of ultrafast lattice heating using time reolved electron
diffractionrdquo Appl Phys Lett 94 101910 (2009)
Bibliography
151
[202] P Chen I V Tomov and P M Rentzepis ldquoTime resolved heat propagation in
a gold crystal by means of picosecondx-ray diffractionrdquo J Chem Phys 104
10001 (1996)
[203] A A Maznev J Hohlfeld and J Guumldde ldquoSurface thermal expansion of metal
under femtosecond laser irradiationrdquo J Appl Phys 82 5082 (1997)
[204] A Plech S Kuumlrbitz K -J Berg H Graener G Berg S Greacutesillon M Kaempfe J
Feldmann M Wulff and G von Plessen ldquoTime-resolved X-ray diffraction on
laser-excited metal nanoparticlesrdquo Europhys Lett 61 762 (2003)
[205] J Chen H Zhang I V Tomov and P M Rentzepis ldquoLaser Induced Transient
Structures in a 150 nm Gold Crystalrdquo Journal of the chinese chemical society
54 1619 (2007)
[206] P Musumeci J T Moody C M Scoby M S Gutierrez and M Westfall
ldquoLaser-induced melting of a single crystal gold sample by time-resolved
ultrafast relativistic electron diffractionrdquo Appl Phys Lett 97 063502 (2010)
[207] R Ernstorfer M Harb T Dartigalongue C T Hebeisen R E Jordan L Zhu
and R J D Miller ldquoFemtosecond Electron Diffraction Study on the Heating
and Melting Dynamics of Goldrdquo Springer Series in Chemical Physics 88 755
(2007)
[208] R Ernstorfer M Harb C T Hebeisen G Sciaini T Dartigalongue I
Rajkovic M Ligges D von der Linde Th Payer and M Horn-von-Hoegen F
-J Meyer zu Heringdorf S G Kruglik and R J D Miller ldquoAtomic view of the
photoinduced collapse of gold and bismuthrdquo Springer Series in Chemical
Physics 92 113 (2009)
[209] httpwwwphasisch
[210] E D Palik (Author Editor) Handbook of Optical Constants of Solids
Academic Press (1985)
[211] J Hohlfeld J G Muumlller S -S Wellershoff and E Matthias ldquoTime-resolved
thermoreflectivity of thin gold films and its dependence on film thicknessrdquo
Appl Phys B 64 387 (1997)
[212] T Juhasz H E Elsayed-Ali G O Smith C Suaacuterez and W E Bron ldquoDirect
measurements of the transport of nonequilibrium electrons in gold films with
different crystal structuresrdquo Phys Rev B 48 15488 (1993)
[213] S D Brorson J G Fujimoto and E P Ippen ldquoFemtosecond electronic heat-
transport dynamics in thin gold filmsrdquo Phys Rev Lett 59 1962 (1987)
[214] P Debye Interferenz von Roumlntgenstrahlen und Waumlrmebewegung Ann d
Phys 348 49 (1913)
[215] I Waller ldquoZur Frage der Einwirkung der Waumlrmebewegung auf die Interferenz
von Roumlntgenstrahlenrdquo Zeitschrift fuumlr Physik A Hadrons and Nuclei 17 398
(1923)
[216] C Kittel Introduction to solid state physics 6th ed Wiley New York (1986)
Bibliography
152
[217] G Busch and H Schade Lectures on solid state physics Pergamon Press
(1976)
[218] B C Larson J Z Tischler and D M Mills ldquoNanosecond resolution
timeresolved x-ray study of silicon during pulsed-laser irradiationrdquo Journal of
Materials Research 1 144 (1986)
[219] S K Allison ldquoThe Natural Widths of the Kα X-Ray Doublet from 26FE to
47AGrdquo The physical review 44 63 (1933)
[220] calculated from XOP httpwwwesrfeucomputingscientificxop21
[221] T H Johnson ldquoThe Diffraction of Hydrogen Atoms by the Mosaic Structure of
Crystalsrdquo Phys Rev 37 87 (1931)
[222] C Thomsen J Strait Z Vardeny H J Mark J Tauc and J Hauser
ldquoCoherent phonon generation and detection by picosecond light pulsesrdquo Phys
Rev Lett 53 989 (1984)
[223] C Thomsen H T Grahn H J Maris and J Tauc ldquoSurface generation and
detection of phonons by picosecond light pulsesrdquo Phys Rev B 34 4129 (1986)
[224] American Institute of Physics (Author Corporate Author) Dwight E Gray
(Editor) American Institute of Physics Handbook 3rd ed McGraw-Hill
Columbus (1972)
[225] S Kaumlhle ldquoKurzzeit-Roumlntgenbeugung mit Hilfe einer Effizienz-optimierten
hochrepetierenden Laser-Plasma-Roumlntgenquellerdquo Dissertation (2009)
[226] P B Allen ldquoTheory of thermal relaxation of electrons in metalsrdquo Phys Rev
Lett 59 1460 (1987)
[227] J Hohlfeld S -S Wellershoff J Guumldde U Conrad V Jaumlhnke E Matthias
ldquoElectron and lattice dynamics following optical excitation of metalsrdquo Chem
Phys 251 237 (2000)
[228] Online-Datenbank WebElements Periodic Table of the Elements
httpwwwwebelementscom (Stand November 2008)
[229] B Rethfeld A Kaiser M Vicanek and G Simon ldquoUltrafast dynamics of
nonequilibrium electrons in metals under femtosecond laser irradiationrdquoPhys
Rev B 65 214303 (2002)
[230] R Peierls More Surprises in Theoretical Physics Princeton University Press
(1991)
[231] H J Zeiger J Vidal T K Cheng E P Ippen G Dresselhauss and M S
Dresselhaus ldquoTheory for displacive excitation of coherent phononsrdquo Phys Rev
B 45 768 (1992)
[232] T K Cheng J Vidal H J Zeiger G Dresselhaus M S Dresselhaus and E P
Ippen ldquoMechanism for displacive excitation of coherent phonons in Sb Bi Te
and Ti2O3rdquo Appl Phys Lett 59 1923 (1991)
Bibliography
153
[233] A B Shick J B Ketterson D L Novikov and A J Freeman ldquoElectronic
structure phase stability and semimetal-semiconductor transitions in Birdquo Phys
Rev B 60 15484 (1999)
[234] O Degtyareva M I MCMahon and R J Nelmes ldquoHigh-pressure structural
studies of group-15 elementsrdquo High Pressure Research 24 319 (2004)
[235] T E Stevens J Kuhl and R Merlin ldquoCoherent phonon generation and the two
stimulated Raman tensorsrdquo Phys Rev B 65 144304 (2002)
[236] K Ishioka1 M Kitajima1 and O V Misochko ldquoTemperature dependence of
coherent A1g and Eg phonons of bismuthrdquo J Appl Phys 100 093501 (2006)
[237] E D Murray D M Fritz J K Wahlstrand S Fahy and D A Reis ldquoEffect of
Lattice Anharmonicity in Bismuth High-amplitude Phonon Dynamicsrdquo Phys
Rev B 72 060301 (2005)
[238] X Gonze J-P Michenaud and J-P Vigneron ldquoFirst-principles study of As Sb
and Bi electronic propertiesrdquo Phys Rev B 41 11827 (1990)
[239] T K Cheng S D Brorson A S Kazeroonian J S Moodera G Dresselhaus
M S Dresselhaus and E P Ippen ldquoImpulsive excitation of coherent phonons
observed in reflection in bismuth and antimonyrdquo Appl Phys Lett 57 1004
(1990)
[240] J S Lannin J M Calleja and M Cardona ldquoSecond-order Raman scattering in
the group-Vb semimetals Bi Sb and Asrdquo Phys Rev B 12 585 (1975)
[241] A Q Wu and X XuldquoCoupling of ultrafast laser energy to coherent phonons in
bismuthrdquo Appl Phys Lett 90 251111 (2007)
[242] E G Gamaly A V Rode ldquoElectronndashphonon energy relaxation in bismuth
excited by ultrashort laser pulse temperature and fluence dependence rdquo Appl
Phys A online (2012)
[243] M Hase K Mizoguchi H Harima S Nakashima and K Sakai ldquoDynamics of
coherent phonons in bismuth generated by ultrashort laser pulsesrdquo Phys Rev B
58 5448 (1998)
[244] O V Misochko K Ishioka M Hase and M Kitajima ldquoFano interference for
large-amplitude coherent phonons in bismuthrdquo J Phys Condens Matter 19
156227 (2007)
[245] M F DeCamp D A Reis P H Bucksbaum and R Merlin ldquoDynamics and
coherent control of high-amplitude optical phonons in bismuthrdquo Phys Rev B
64 092301 (2001)
[246] O V Misochko Muneaki Hase K Ishioka and M Kitajima ldquoObservation of
an Amplitude Collapse and Revival of Chirped Coherent Phonons in Bismuthrdquo
Phys Rev Lett 92 197401 (2004)
[247] M S Diakhate E S Zijlstra M E Garcia ldquoQuantum dynamical study of the
amplitude collapse and revival of coherent A 1g phonons in bismuth a classical
phenomenon rdquo Appl Phys A 96 5 (2009)
Bibliography
154
[248] D Boschetto E G Gamaly A V Rode B Luther-Davies D Glijer T Garl
O Albert A Rousse and J Etchepare ldquoSmall Atomic Displacements Recorded
in Bismuth by the Optical Reflectivity of Femtosecond Laser-Pulse
Excitationsrdquo Phys Rev Lett 100 027404 (2008)
[249] M Hase M Kitajima S-i Nakashima and K Mizoguchi ldquoDynamics of
Coherent Anharmonic Phonons in Bismuth Using High Density
Photoexcitationrdquo Phys Rev Lett 88 067401 (2002)
[250] M Hase K Mizoguchi H Harima S Nakashima M Tani K Sakai and M
Hangyo ldquoOptical control of coherent optical phonons in bismuth filmsrdquo Appl
Phys Lett 69 2474 (1996)
[251] C Blome ldquoUntersuchung schneller Strukturbullanderungen mit Hilfe ultrakurzer
Rbullontgenimpulserdquo Dissertation (2003)
[252] S L Johnson P Beaud E Vorobeva C J Milne Eacute D Murray S Fahy and
G Ingold ldquoDirectly Observing Squeezed Phonon States with Femtosecond X-
Ray Diffractionrdquo Phys Rev Lett 102 175503 (2009)
[253] M Ligges ldquoUntersuchung der schnellen Gitteraufheizung in duumlnnen (Halb-)
Metallfilmen mit Hilfe zeitaufgeloumlster Elektronenbeugungrdquo Dissertation (2009)
[254] A Bugayev A Esmail M Abdel-Fattah and H E Elsayed-Ali ldquoCoherent
phonons in bismuth film observed by ultrafast electron diffractionrdquo AIP
Advances 1 012117 (2011)
[255] A Authier S Lagomarsino and BK Tanner (Eds) X-ray and Neutron
Dynamical Diffraction Theory and Applications New York Plenum Press
(1996)
[256] J Daillant and A Gibaud (Eds) X-ray and Neutron Reflectivity Principles and
Applications Lecture Notes in Physics 770 Springer (2009)
[257] M Cornacchia J Arthur L Bentson R Carr P Emma J Galayda P Krejcik
I Lindau J Safranek J Schmerge J Stohr R Tatchyn and A Wootton ldquoA
Sub-Picosecond Photon Pulse Facility for SLACrdquo SLAC-PUB-8950 (2001)
[258] P Tangney and S Fahy ldquoDensity-functional theory approach to ultrafast laser
excitation of semiconductors Application to the A1 phonon in telluriumrdquo Phys
Rev B 65 054302 (2002)
[259] O V Misochko K Ishioka M Hase and M Kitajima ldquoFully symmetric and
doubly degenerate coherent phonons in semimetals at low temperature and high
excitation similarities and differencesrdquo J Phys Condens Matter 18 10571
(2006)
[260] E S Zijlstra L L Tatarinova and M E Garcia ldquoLaser-induced phonon-
phonon interactions in bismuthrdquo Phys Rev B 74 220301 (2006)
[261] S Bluumlgel and G Bihlmayer ldquoFull-Potential Linearized Augmented Planewave
Methodrdquo Computational Nanoscience Do It Yourself (J Grotendorst S
Bluumlgel D Marx (Eds)) NIC Series 31 85 (2006)
Bibliography
155
[262] P Blaha K Schwarz G K H Madsen D Kvasnicka and J Luitz ldquoWIEN2k
An Augmented Plane Wave+Local Orbitals Program for Calculating Crystal
Propertiesrdquo Karlheinz Schwarz Techn Universitaumlt Wien Austria (2001)
[263] Z Yang C Ko and S Ramanathan ldquoOxide Electronics Utilizing Ultrafast
Metal-Insulator Transitionsrdquo Annu Rev Mater Res 41 337 (2011)
[264] A Pashkin C Kuumlbler H Ehrke R Lopez A Halabica R F Haglund Jr R
Huber A Leitenstorfer ldquoUltrafast Insulator-Metal Phase Transition in VO2
Studied by Multiterahertz Spectroscopyrdquo Phys Rev B 83 195120 (2011)
[265] M Wuttig N Yamada ldquoPhase-change materials for rewriteable data storagerdquo
Nature Mater 6 824 (2007)
[266] T Siegrist P Jost H Volker M Woda P Merkelbach C Schlockermann and
M Wuttig ldquoDisorder-induced localization in crystalline phase-change
materialsrdquo Nature Mater 10 202 (2011)
[267] P Debye and P Scherrer ldquoInterferenzen an regellos orientierten Teilchen im
Roumlntgenlichtrdquo Phys Z 17 277 (1916)
[268] httpwwwlebowcompanycomspecificationshtm
[269] E Zolotoyabko D Shilo W Sauer E Pernot and J Baruchel ldquoVisualization
of 10 μm surface acoustic waves by stroboscopic x-ray topographyrdquo Appl
Phys Lett 73 2278 (1998)
[270] W Sauer M Streibl T Metzger A Haubrich S Manus W A J Peisl J
Mazuelas J Haumlrtwig and J Baruchel ldquoX-ray imaging and diffraction from
surface phonons on GaAsrdquo ApplPhysLett 75 1709 (1999)
[271] C Voisin D Christofilos N Del Fatti F Valleacutee ldquoEnvironment effect on the
acoustic vibration of metal nanoparticlesrdquo Physica B Condensed Matter 316
89 (2002)
[272] P P Ewald ldquoIntroduction to the dynamical theory of X-ray diffractionldquo Acta
CrystA 25 103 (1969)
[273] httpphotonic-sciencecoukproductsXRAY-cameras-detectorshtml
[274] C Bressler and M Chergui ldquoUltrafast X-ray Absorption Spectroscopyrdquo Chem
Rev 104 1781 (2004)
[275] C Bressler and M Chergui Molecular structural dynamics probed by ultrafast
X-ray absorption spectroscopy Annu Rev Phys Chem 61 263 (2010)
[276] A O Er J Chen and P M Rentzepis Ultrafast time resolved x-ray
diffraction extended x-ray absorption fine structure and x-ray absorption near
edge structure J Appl Phys 112 031101 (2012)
[277] E Papalazarou J Faure J Mauchain M Marsi A Taleb-Ibrahimi I
Reshetnyak A van Roekeghem I Timrov N Vast B Arnaud and L Perfetti
ldquoCoherent Phonon Coupling to Individual Bloch States in Photoexcited
Bismuthrdquo Phys Rev Lett 108 256808 (2012)
Bibliography
156
[278] M Nakajima N Takubo Z Hiroi Y Ueda and T Suemoto ldquoPhotoinduced
metallic state in VO2 proved by the terahertz pump-probe spectroscopyrdquo Appl
Phys Lett 92 011907 (2008)
[279] R Ulbricht E Hendry J Shan T F Heinz and M Bonn ldquoCarrier dynamics
in semiconductors studied with time-resolved terahertz spectroscopyrdquo Rev Mod
Phys 83 543 (2011)
[280] Time-resolved THz studies of carrier dynamics in semiconductors
superconductors and strongly-correlated electron materials Lawrence Berkeley
National Laboratory Lawrence Berkeley National Laboratory LBNL
Paper LBNL-597E Retrieved from httpescholarshiporgucitem2m32w0fs
[281] O V Misochko K Ishioka M Hase and M Kitajima ldquoFully symmetric and
doubly degenerate coherent phonons in semimetals at low temperature and high
excitation similarities and differencesrdquo J Phys Condens Matter 18 10571
(2006)
[282] arXiv12122348 (httparxivorgpdf12122348pdf )(2013)
[283] M Holt Z Wu H Hong P Zschack P Jemian J Tischler H Chen and T-C
Chiang ldquoDetermination of Phonon Dispersions from X-Ray Transmission
Scattering The Example of Siliconrdquo Phys Rev Lett 83 3317 (1999)
[284] httpwwwrigakucomproductscomponents
[285] httpwwwroperscientificdedatasheetsPrinceton_Instruments_PI-
MTE_1300B_RevA0pdf
[286] httpwwwadvancedphotonixcomap_productspdfsSD394-70-74-591pdf
Erklaumlrung
157
Ich bestaumltige dass ich die vorliegende Dissertation bdquoUltrafast time-resolved X-ray
diffraction using an optimized laser-plasma based X-ray sourceldquo selbststaumlndig
verfasst habe und dabei nur die angegebenen Hilfsmittel verwendet habe
Daruumlber hinaus bestaumltige ich dass ich die vorliegende Dissertation bdquoUltrafast time-
resolved X-ray diffraction using an optimized laser-plasma based X-ray sourceldquo nur
in diesem Promotionsverfahren an der Fakultaumlt fuumlr Physik der Universitaumlt Duisburg-
Essen eingereicht wurde
Wei Lu
Duisburg den 01022013
Contents
V
5 Extreme phonon softening in laser-excited Bi 73
51 Research background 75
511 Structure of Bi and the phonons 75
512 Previous works 76
52 Experiments and discussion 81
521 Method 81
522 Preliminary measurements 82
523 Results of time resolved measurements and discussion 85
53 Summary 96
6 Towards time-resolved Debye-Scherrer X-ray diffraction 98
61 Experimental configuration 100
62 Static Debye-Scherrer measurements 101
63 Time-resolved Debye-Scherrer experiment 104
631 Static Debye-Scherrer-diffraction pattern of the Au thin film 105
632 Results of time-resolved pump-probe measurements 106
633 Modeling the transient behavior of the diffraction pattern after laser
excitation 110
634 Discussion for the experimental results 113
64 Summary 114
7 Summary and outlook 115
71 Summary 115
72 Outlook 117
Appendixes 120 A Working principle of multilayer mirror 120
B X-ray detectors for diffracted signals 122
B 1 Direct detection camera 122
B 2 Indirect detection camera 125
B 3 Avalanche Photodiode (APD) 127
C Sample material properties 128
C 1 Cu 128
C 2 Ti 129
C 3 Au 129
C 4 Bi 132
Bibliography 136
1 Introduction
1
1 Introduction
11 Introduction and motivation
In order to study the ultrafast structural dynamics of matter excited by a
femtosecond optical pulse atomic spatial resolution (~Aring) and temporal resolution
comparable to characteristic time scales of atomic motion (femtosecond to
picosecond) are required
For a long time static atomic resolution has been achieved by using either X-
rays which were discovered by William Conrad Roentgen in 1895 [1]
electrons
proved by George Paget Thomson and Clinton Joseph Davisson independently in
1920s [2 3]
or neutrons which was established by Ernest O Wollan and Clifford Shull
in 1940s [4]
The knowledge of the structure of matter has been largely extended with
the application of these invaluable tools For their outstanding contributions
Roentgen earned the first Nobel Prize for Physics in 1901 Thomson and Davisson
shared the Nobel Prize for Physics in 1937 and Shull was awarded one half of the
1994 Nobel Prize in Physics
On the other hand the temporal resolution had made no significant improvement
until the development of femtosecond laser technology [5 6]
Since then the situation
has changed rapidly New types of radiation sources have been developed or are being
developed to provide ultrashort pulses of photons or electrons with sufficiently short
wavelength to enable the direct observation of structural changes on the relevant
length- and time-scales In the late 1980searly 1990s the first laser-produced plasma
femtosecond x-ray sources were demonstrated [7-9]
In the early 2000s ultrafast
electron diffraction with sub-picosecond time resolution was realized [10-13]
In the
mean time also accelerator based short-pulse X-rays sources have been developed [14-
18] However until now it has not been possible to generate ultrashort (sub-
picosecond) pulses of thermal neutrons
In the works presented in this thesis ultrashort X-ray pulses are used as a tool to
investigate ultrafast structural dynamics Currently there are six techniques exist to
1 Introduction
2
produce femtosecond X-ray pulses
1) Ultrafast X-ray tube achieved by using pulsed femtosecond lasers to produce
pulsed electron injection within a normal X-ray tube [19-21]
2) Direct conversion of the laser pulse into the X-ray region by nonlinear optical
processes ie high order harmonic generation(HHG)[22-25]
3) laser-produced plasma X-ray source achieved by the interaction of high
intensity laser pulses with solid targets [7-9]
4) The very recent developed laser-plasma wakefield accelerator-based betatron
X-ray source [26-29]
5) Unlike the previous four laboratory-sized techniques the large-scale electron
synchrotron-based slicing X-ray sources such as the Advanced Light Source ldquoALSrdquo
in Berkeley USA [14]
the Berliner Elektronenspeicherring-Gesellschaft fuumlr
Synchrotronstrahlung ldquoBESSYrdquo in Berlin Germany [15]
the Swiss Light Source
ldquoSLSrdquo in Villigen Switzerland [16]
6) The large-scale linear accelerator-based X-ray Free electron lasers (XFEL)
such as the Linac Coherent Light Source ldquoLCLSrdquo at SLAC in Standford USA [30]
the
SPring-8 Angstrom Compact free electron LAser ldquoSACLArdquo in Japan [31]
and the X-
ray Free-Electron Laser ldquoXFELrdquo at DESY in Hamburg Germany [32 33]
For all of these ultrafast X-ray sources the femtosecond laser pulses have to be
employed in some ways and the accelerated electrons play important roles in the
conversion process Each of these sources has its own characteristics in terms of the
repetition rate the minimum achievable pulse duration the produced photon number
the photon energy range the spatial and temporal coherence properties and the size or
the cost of the installation
Presently the first two sources are not yet suitable for studying ultrafast
structural dynamics due to the limited overall X-ray production The betatron X-ray
source is still under development [34-38]
The last two large-scale X-ray sources
represent the most promising X-ray sources for performing ultrafast time resolved
experiments However their construction and running costs are extremely high and
beam time access is very limited The laser-produced plasma X-ray sources are
presently unique because they are the easiest to operate laboratory-sized X-ray source
that can deliver hard X-ray radiation with very short pulse duration and at the same
time provide perfect synchronization between the produced X-ray pulses and the
1 Introduction
3
driving femtosecond laser pulses This is the type of X-ray source that has been used
for performing the time resolved X-ray diffraction experiments presented in this
thesis A part of the work in this thesis is dedicated to optimizing the X-ray emission
from this X-ray source
To obtain the time dependent information in sub-picosecond time scale the
common method using a fast detector (eg photo diodes or streak cameras) with one
ultrashort pump pulse is not accessible due to the limited temporal-resolution
capability of current fast detectors Most experiments are performed in the ultrafast-
pumpndashultrafast-probe scheme with a slow detector With this scheme the time
evolution of photoinduced structural changes can be studied by taking a sequence of
diffraction patterns at different time delays with respect to (femtosecond) excitation
Since the ultrashort X-ray pulse was available this scheme has been further extended
to X-ray region Using laser-pump X-ray-probe scheme the first femtosecond time-
resolved X-ray diffraction experiment was performed with laser plasma X-ray source
in 1997 by Rischel et al [39]
Since then many ultrafast phenomena have been
investigated by using ultrashort X-ray pulses Reviews on these studies can be found
in Ref [40 41] The current researches cover the following fields
1) Propagating GHz acoustic waves caused by the release of impulsive stress
launched by the femtosecond optical excitation [42-67]
2) Coherent optical phonon excitations which connect with unit-cell level
transient structural changes [67-73]
3) Non-thermal melting which is melting before thermal equilibrium between
electrons and lattice has been established after femtosecond laser excitation [17 18 39
46 76-81]
4) Phase transition in ferroelectric [66 82-87]
and ferromagnetic [88-104]
materials
caused by femtosecond laser excitation
5) Debye-Scherrer type time-resolved X-ray measurements on polycrystalline
and powder samples which allow obtaining much more information of the excited
sample from one measurement through detecting simultaneously several diffraction
orders similar to studies by ultrafast electron diffraction [105-110]
6) Utilizing X-ray diffuse scattering to investigate the transient nonequilibrium
states of the lattice system following ultrafast laser excitation [111 112]
The ultrafast phenomena investigated in this thesis focus on structural dynamics
in thin laser-excited metal films These works covered by the research field includes
1 Introduction
4
coherent excitations of acoustic phonons and optical phonons
12 Overview and structure of the thesis
The thesis is organized as following
Chapter 2 presents experimental results on the optimization of Kα X-ray emission
from a laser-plasma based X-ray source It contains the principle of X-ray generation
with a laser produced plasma and a systematic investigation of optimizing the X-ray
emission
Chapter 3 describes a modular setup for time-resolved X-ray diffraction
experiments This chapter presents and discusses implemented improvements of the
setup such as hardware software and methodology which are essential to achieve the
results of following time-resolved diffraction experiments
Chapter 4 deals with the first time-resolved X-ray diffraction experiment with
the improved modular setup The Debye -Waller effect in a thin laser-excited Au film
is observed The evolutions of the lattice temperature are compared with the
theoretical prediction of Two-Temperature Model (TTM)
Chapter 5 contains the study on the photoinduced softening of the A1g optical
phonon mode in laser-excited Bi This work extends the studies of coherent optical
phonons in laser-excited Bi to a higher fluence range that has not been studied
previously
Chapter 6 focuses on the experiments performed with X-ray Debye-Scherrer
diffraction scheme A static measurement on a Cu foil (20 μm) and a time-resolved
measurement on an Au thin film (200 nm) have been carried out The temporal
behaviors of the measured data are discussed
The last chapter summarizes the main results presented in this thesis An outlook
for the future studies is also provided
2 Optimization of a laser-plasma based X-ray source
5
2 Optimization of a laser-plasma based
X-ray source
This chapter discusses the principles of X-ray generation using a laser-produced
plasma and strategies to optimize the X-ray source for time-resolved X-ray diffraction
experiments discussed in the following chapters For this purpose the Kα-emissions
from plasmas on Ti and Cu targets for different excitation and plasma conditions were
investigated Section 21 describes the mechanism for generating ultrashort X-ray
pulses using the laser-produced plasma The laser system and the experimental setup
are presented in sections 22 and 23 respectively Section 24 discusses the
optimization of the Kα yield as a function of laser intensity Measurements of the Kα
yield as a function of target thickness and angle of incidence and a detailed
investigation of the influence of a pre-formed plasma by using a controlled pre-pulse
with variable delay are presented and discussed in section 25 The experimental data
show that for a given angle of incidence the Kα yield can be optimized by choosing a
suitable pre-pulse ie plasma scale-length conditions For large angles of incidence a
steep electron density gradient maximizes the yield At near normal incidence
maximum yield is achieved for a more expanded plasma and the best energy
conversion efficiency has been found in this case For a certain scale-length range
(between 01λ ndash 1λ here λ is the laser wavelength) the optimized yield is scale-length
independent It can be achieved by choosing the appropriate angle of incidence This
situation results from the strong dependence of collisionless absorption mechanisms ndash
in particular resonance absorption (RA) ndash on the angle of incidence and the plasma
scale length By maximizing the absorption the highest Kα yield is achieved The
experimental data are supported by the results of calculations based on the classical
resonance absorption mechanism (section 25) and of particle-in-cell (PIC) simulations
(section 26) Finally a summary of this chapter is given in section 27
2 Optimization of a laser-plasma based X-ray source
6
21 Generation of ultrashort X-ray pulses from laser-
produced plasma
Optical radiation is absorbed by a metal within a thin layer of about 10 nm which
is called the ldquoskin depthrdquo [113]
If the intensity of the laser radiation on the material is
large enough typically more than 1014
Wcm2 the target material within the skin depth
will be ionized and transformed into a plasma during the pulse For laser intensities
above 1015
Wcm2 easily achievable with current femtosecond laser technology it has
been found that the hot plasma emits radiation in the (hard) X-ray range [7]
The emitted
radiation consists of continuum emission from recombination in the plasma
characteristic line emission (Kα Kβhellip) and Bremsstrahlung radiation The latter two
components come not only from the hot plasma resulting from transitions on the
strongly ionized atoms but also the interaction of high energy electrons accelerated by
the intense laser field with the cold non-excited material underneath [7 9 114 115]
These
laser-accelerated electrons often called hot electrons in the laser plasma community
have a kinetic energy (~10hellip100 keV) significantly higher than the thermal energy of
the overwhelming part of the plasma electrons Among the three different contributions
to the X-ray emission mentioned above the characteristic line emission especially K
emission is particularly interesting for applications (eg time-resolved X-ray
diffraction) The generation of characteristic line radiation during the irradiation of a
solid material with an intense femtosecond laser pulse is described detail in Ref [9
116-118]
The mechanism of K -ray emission from a laser induced plasma is very similar
to that in an ordinary X-ray tube However the static electric field used for electron
acceleration is replaced by the femtosecond laser electric field A brief description of
the process of K The interaction of a high
intensity laser beam with a solid surface rapidly creates a plasma The plasma electrons
interacting with the strong electric field of the incident femtosecond optical pulse can
acquire an energy which is high enough to leave the skin layer and penetrate into the
non-excited material underneath the surface plasma layer Some of these electrons will
be slowed down and generate Bremstrahlung Others collide with the non-excited
atoms kick out electrons from their inner electronic shells which subsequently undergo
inner shell recombination leading to characteristic line emission Therefore the
emission of the characteristic line radiation can only occur as long as the high energy
2 Optimization of a laser-plasma based X-ray source
7
electrons are present and can be regarded as a direct result of these hot electrons
These electrons exist only during the femtosecond laser pulse irradiation (and for a very
short time afterwards which is determined by the flight-time of the high energy
electrons through the material) Thus one can expect that the duration of the X-ray
pulses produced in this way is comparable to the laser pulse duration ie in the sub-
picosecond region [119-122]
Fig 21 Scheme for the generation of Kradiation by focusing an
ultrashort laser pulse on a solid target (a) The focused laser pulse
produces plasma on the surface of solid target (red area) Accelerated
electrons from the plasma travel into non-excited material and
produce there X-rays (yellow area) (b) The ionization of K-shell
electrons and the subsequent inner shell recombination leads to K-
emission
The energy distribution and the corresponding number of these hot electrons
have a strong influence on the characteristics of the emitted radiation in particular the
Kα yield The task to optimize the conditions for Kα X-ray generation turns into the
investigation of how the laser energy is converted into hot electrons with the
appropriate energy distribution and their following dynamics inside the non-excited
material The energy conversion is dominated by the laser absorption mechanisms
which are in turn determined by the parameters of the driving laser ie intensity angle
2 Optimization of a laser-plasma based X-ray source
8
of incidence laser polarization as well as by the properties of the plasma with which
the laser pulse interacts [119 123]
The subsequent interaction of the hot electrons and
the solid is mainly via collisions The mean free path of the hot electrons (or the
stopping distance) and the ionization cross section in the solid dominate the rate of Kα
emission [124-126]
Several studies based on simulations (particle-in-cell
simulation [127]
+ Monte Carlo transport code [128]
) were performed to investigate this
question Depending on the target material (Z) and the sample thickness the
simulations allowed to determine the laser parameters (ie laser wavelength intensity
polarization and pulse duration) which lead to the optimum electron distributions for
Kα emission [121 129-131]
These results are in good agreement with previous experimental
data [9 115 132 133-137]
In this study the effects of laser intensity target thickness angle of incidence and
precise controlled pre-plasma conditions on the Kα-production from Cu and Ti elements
are the objects for investigation To my knowledge systematic investigations of the
latter two effects on both elements were first performed
22 Laser system
In this section the laser system used as a driver for the laser-plasma based X-ray
source is described and some key parameters of this laser system are presented
The 10-Hz Titanium-Sapphire femtosecond terawatt laser system at the University
of Duisburg-Essen is based on the Chirped Pulsed Amplification (CPA) technique [5 6
138] Its working principle can be briefly described as follows A low energy
femtosecond pulse produced by an oscillator first passes through a so-called ldquostretcherrdquo
The stretcher consists of a dispersive delay line (gratings) and adds a controlled phase
modulation to the laser pulse thereby increasing its duration and decreasing its peak
intensity Typical stretching factors are 104 The ldquostretchedrdquo pulse can then be
amplified to high energies usually by several amplification stages After amplification
the pulse passes through the so-called ldquocompressorrdquo which compensates the phase
modulation imposed by the stretcher as well as any additional phase modulation
acquired during amplification (for example due to material dispersion) Ideally the
amplified pulse is recompressed to its original duration This technique allows to
produce high peak power laser pulses without deteriorating the pulse parameters and
damaging the optical components during the amplification process
2 Optimization of a laser-plasma based X-ray source
9
The main components of the laser system used in the experiments are shown in
Fig 22 The ldquoheartrdquo of the system is a mode-locked titanium-sapphire oscillator
pumped by a frequency doubled cw NdYVO4 laser (type Coherent Verdi diode-
pumped λ = 532 nm P = 5 W) It produces a train of 45 fs (full width half maximum -
FWHM) pulses with a repetition rate of 80 MHz and an energy of ~1 nJ per pulse The
central wavelength of the pulses is 800 nm with a spectral bandwidth (FWHM) of 21
nm
The output pulses from the oscillator are directed to the stretcher in which the
duration of the pulses is extended to 200 ps A grating with 1200 linesmm is used in
the stretcher as dispersive element for broadening the pulses Before the pulses enter
the amplification stages the repetition rate is reduced to 10 Hz using an electro-optic
selector consisting of a Pockels cell and a polarizer By inducing a suitable fast
switching electric field this combination allows the precise selection and separation of
pulses at a repetition rate of 10 Hz from the initial 80 MHz pulse train
The following amplification system consists of two multipass stages both using
TiSapphire crystals as gain medium pumped by frequency doubled Q-switched
NdYAG lasers (532 nm) In the first stage the seed pulses make eight passes through
the amplifying medium and are amplified to a pulse energy of about 1 mJ
(amplification by a factor of approximately 106
- 107) The second stage is a four-pass
power amplifier To obtain homogeneous pumping two lasers pumping from both sides
of the amplifying medium are applied After four passes in the second crystal the pulse
energy pulse is increased to about 200 mJ (amplification by a factor of approximately
100) Finally the amplified pulses enter the compressor The compressor contains again
gratings as dispersive elements to recompress the pulse to the desired pulse duration If
the compressor is operated under vacuum a maximum energy per pulse of 150 mJ with
a minimum pulse duration of about 45 fs can be achieved In the experiments discussed
here the compressor is operated in air and the pulse duration is adjusted to
approximately 120 - 150 fs With this duration self-phase-modulation (and self-
focusing) in air can be avoided and the pulse properties (spectrum spatial beam profile)
are not deteriorated during propagation
2 Optimization of a laser-plasma based X-ray source
10
Fig 22 The principle scheme of the laser system
The time-structure of the final output pulses was measured a third-order
autocorrelator (fs- to ps-time-range) The amplified laser pulse exhibits a relative
intensity of about 10-7
(ie contrast ratio of 107) approximately 1 ps ahead of the pulse
maximum and the contrast ratio to the amplified spontaneous emission (ASE) is 108 [139]
Due to such a high-contrast ratio the pre-plasma formation caused by laser pulse itself
is negligible in the experiments presented later
The key parameters of the laser system are summarized in the table 21 below
central wavelength 800 nm
spectral width 21 nm
min pulse duration 45 fs
in air pulse duration 120 150 fs
maximum pulse energy 150 mJ
contrast ratio at 1 ps 10-7
ASE 10-8
repetition rate 10 Hz
beam diameter (FWHM) 25 mm
Table 21 Key parameters of the 10 Hz laser system
The stability of the laser system ie energy and pointing stability is very
important for the experiments presented in this thesis Energy and pointing stability
were recorded and analyzed pulse-to-pulse over a few hours by U Shymanovich [140]
2 Optimization of a laser-plasma based X-ray source
11
Typical values under normal working conditions are less than 100 microrad pulse-to-pulse
pointing instability and 25 rms energy fluctuations
23 Experimental setup
Fig 23 Schematic of the experimental setup for Koptimization
All the works presented in this thesis were done with a few different experimental
setups For the investigation of the Kα production a setup as schematically shown in
Fig 23 was used The 25 mm diameter (FWHM) p-polarized laser beam was reflected
from a mirror with a 5 mm diameter hole in its center that allowed transmission of a
small part of the beam The transmitted part was time delayed with a variable delay
line and recombined with the main laser beam using a second apertured mirror The
combined p-polarized laser beams were focused with a 30 cm focal length lens onto the
target surface This lens could be accurately translated along the direction of the laser
beam propagation to change the focusing conditions ie the focus size on the target
Two PIN photodiodes one for recording the incident energy and another for the
reflected energy were used to measure the reflectivity from which the absorption of
the laser energy can be deduced By using a microscope objective combined with a
CCD camera the focal spot sizes of main and pre-pulse were measured as ~ 20 μm and
~ 70 μm FWHM respectively The focal area of the pre-pulse is about 12 times bigger
than that of the main pulse and both pulses can be adjusted to spatially overlap well at
all delay times The angle of incidence was varied by rotating the target For each
specific angle the laser intensity was kept constant by adjusting the laser energy The
targets were mounted on a motorized XYZ translation unit and moved between
2 Optimization of a laser-plasma based X-ray source
12
consecutive laser pulses to provide a fresh surface for each pulse In these experiments
four kinds of targets were used 300 nm Cu and Ti films coated on a glass substrate and
20 μm Cu and Ti foils glued onto a glass substrate
The X-ray radiation was detected with a Princeton Instruments CCD-camera (type
PI-MTE 1300B) It is back-illuminated Si-CCD that is suitable for the photon energy
range relevant in this work (ie 2 to 10 keV) The chip area is 1340 pixels times 1300 pixels
(20 microm times 20 microm each) The camera was located ~ 20 cm away from the X-ray source
and the average X-ray flux per pulse was reduced to 1 photon per 40 pixels by using an
Al filter of moderate thickness (150 microm and 210 microm for Ti and Cu respectively) in
front of the camera The filter also protected the CCD from low energy Bremsstrahlung
and from visible light This configuration allowed the camera to work in ldquosingle photon
counting regimerdquo as a spectrometer exploiting the fact that a X-ray photon detected
with the CCD creates a charge strictly proportional to its energy (for Si the electron-
hole pair creation energy is 366 eV [141]
and thus a single Cu Kα photon (805 keV) will
produce about 2200 photoelectrons) Therefore one can obtain the energy spectrum of
the detected X-rays from the distribution of the signal of all camera pixels (signal
histogram of the recorded images) A typical single-pulse spectrum using Cu as target
with well resolved Cu Kα and Kβ lines at 805 keV and 891 keV respectively is shown
in Fig 24 The single-pulse spectra of Ti which are not shown here are similar The
Kα yield can in principle be obtained by integrating the signal in the relevant energy
range after appropriate background subtraction
Fig 24 Spectrum of the laser produced Kα emission of Cu
2 Optimization of a laser-plasma based X-ray source
13
However to determine the absolute Kα yield of the source it has to be considered
that a single X-ray photon not always generates charge in only a single CCD pixel but
that the generated charge may be distributed over many pixels (many-pixel-
events)[142]
This distorts the measured spectra and leads to an underestimation of the
Kα yield since a many-pixel-event created by a single Kα-photon is detectedcounted
as several photons of apparently lower energy For Ti and Cu Kα radiation the spatially
largest events involve 4 pixels as reported in Ref [142] In order to determine the
percentage of single-pixel events in the detection system a few images were randomly
sampled from all the measured data and analyzed in detail It was found that about 50
of all detected Kα-photons generated single-pixel events while the other 50 were 2-
3- and 4-pixel events (the number of events involving 5 and more pixels was
negligible) Therefore a correction factor of 2 was applied to the number of detected
Kα-photons determined from the integration of the spectra To derive from this the
absolute Kα yield the transmission of the Al filters as well as the quantum efficiency of
the CCD (18 at 8 keV 55 at 45 keV) [143]
was taken into account Moreover it was
assumed that the X-ray emission is isotropic into the full solid angle
24 Optimization of Kα X-ray emission by adjusting the laser
intensity
In this section the experimental results concerning the optimization of the Kα X-
ray emission are presented Two key factors namely laser intensity and the pre-plasma
scale length were varied to study their influence on the Kα yield
As mentioned in section 21 to efficiently ionize the K-shell electrons of the target
material which in turn lead to an efficient X-ray emission hot electrons with the
appropriate kinetic energy should be produced The kinetic energy of these hot
electrons is strongly dependent on the accelerating laser field Therefore the laser
intensity is one of the key factors to control and optimize the Kα generation The
average energy of the accelerated electrons often described by an effective ldquohotrdquo
electron temperature Th generally relates to the pondermotive potential of the laser
field and follows a power scaling law Th ~ (Iλ2)13
[144 145]
as observed in many
experiments [115 146-148]
and also found with PIC simulations [119]
For optimum Kα
emission the average electron energy should be a few times the K-shell ionization
energy depending on the geometry of the target and the atomic number [121 129 137
2 Optimization of a laser-plasma based X-ray source
14
149]With this condition the laser intensity for optimum Kα production can be estimated
For example to maximize the yield of Cu Kα (805 keV) radiation the average electron
energy should be between 25 keV and 50 keV [120 121 129 148 150 151]
With the mentioned
empirical scaling law Th ~ (I0λ2)13
this average electron energy corresponds to a laser
intensity of a few times 1017
Wcm2 at a laser wavelength of 800 nm
[120 121 137] For Ti
the predicted optimum laser intensity is a few times 1016
Wcm2 [121 152]
With the given focal length (30 cm) a maximum laser intensity of
16 times 1017
Wcm2 can be achieved The laser intensity dependence is investigated by
varying the relative position of the laser focus with respect to the target surface In this
way the laser intensity on target changes while the pulse energy is kept constant No
additional pre-pulse is applied in this experiment Fig 25 shows the experimentally
determined (normalized) Kα yield from 20 μm Cu and Ti foils as a function of the
position of the target surface relative to the focus of the lens In this measurement no
attempt was made to convert the position scale into an intensity scale but it is obvious
that the Kα emission for the different target materials is optimizedmaximized at
different lens positions and thus at different intensities For Cu the sharpest focusing
and thus the highest intensity provides the largest Kα emission For Ti this is achieved
out of focus and thus at a lower intensity This effect has been discussed before in the
literature [130 152 153]
Fig 25 indicates that for Ti the ldquooptimumrdquo intensity for Kα-
production is reached and exceeded in the experiments This optimum intensity is lower
than the maximum laser intensity reached at the focus as predicted by theory [121]
For a
Gaussian beam it is expected that the change of the spatial intensity distribution should
be symmetric with respect to the focus The asymmetry of the measured double-peak
dependence of the Ti Kα yield indicates that this is not the case in the experiment This
is attributed to the method (hole in a mirror) used to split off the pre-pulse that was
used for the measurements described below from the main pulse leading to a non-
Gaussian intensity distribution For the higher atomic number material Cu the optimum
conditions for Kα-production correspond to higher laser intensity Since no double-peak
structure is observed for Cu it can be concluded that the maximum intensity used in the
experiment is comparable or below the expected optimum value for this material again
in agreement with the predictions and estimates mentioned above
2 Optimization of a laser-plasma based X-ray source
15
Fig 25 Kα emission as a function of the relative position of the
target surface of 20 μm Cu and Ti foils with respect to laser focus
The lines between the data points are only to guide the eye
Fig 26 Measured dependence of X-ray yield on laser energy for a
20 μm Cu foil The angle of incidence is 45deg
Since Cu Kα radiation has been used for the time-resolved diffraction experiments
discussed in this thesis the emission from a Cu target has been investigated further
Keeping the spot size (position of the lens) fixed a precise measurement as function of
laser pulse energy was performed and it provided more detailed information on the
laser intensity dependence with this target material For laser energies above 30 mJ and
intensities in the region from 1016
Wcm2 to 10
17 Wcm
2 the Cu Kα yield scales linearly
2 Optimization of a laser-plasma based X-ray source
16
with laser energyintensity - Fig 26 There has been no evidence of saturation in
agreement with theoretical calculations which predict an optimum intensity for Cu Kα-
production of a few times 1017
Wcm2 [121 137]
Additionally a data set with a controlled
pre-pulse arriving 6 ps before the main pulse is also presented in this figure An
obvious improvement in the Kα-production is observed A detailed discussion of this
effect will be presented in the next section The maximum absolute yield obtained in
this measurement is in line with other reported Cu Kα sources [107 148 154 155]
25 Optimization of Kα X-ray emission by using a controlled
pre-plasma
Another approach for optimization of the Kα emission is to improve the energy
conversion efficiency from the laser pulse to electrons and subsequently to Kα photons
The dominant absorption mechanism at laser intensities around 1017
Wcm2
is expected
to be resonance absorption (RA) [116 121 131 133 152 156-158]
The crucial parameter for the
efficiency of the energy transfer for this mechanism is the plasma density scale length
at the time when the maximum pulse intensity is reached Assuming isothermal plasma
expansion an exponential electron density profile )exp()( 0 Lxnxn ee is
produced [159]
and the plasma density scale length L is defined as ee nnL Since
the plasma expands with a typical velocity of ~106ndash10
7 cms
[160-162] the time interval
between the plasma-formation threshold and the maximum intensity largely determines
the scale length seen by the pulse during the interaction Therefore the conversion
efficiency in this case is very sensitive to the temporal structure of the rising edge of the
laser pulse For this reason control over the time structure of the pulse provided by the
laser system becomes important to control the Kα emission An important parameter of
the laser pulse time structure is the contrast ratio defined as the ratio of intensity of the
pulse at the maximum and pre-pulsesbackground before the main pulse In some
previous work [130 148 152 156]
using laser systems with low contrast ratio pre-pulses
andor amplified spontaneous emissions (ASE) usually cause plasma formation long
before the peak of the pulse reaches the target Such long pre-plasma scale lengths
provided by the laser systems already lead to strong absorption making additional
improvements difficult However relying for a particular laser system only on its
inherent pre-pulse for ldquooptimizationrdquo is hardly satisfactory because the scale length will
rarely be optimized and matched to other parameters On the other hand with a very
2 Optimization of a laser-plasma based X-ray source
17
high contrast laser system it has already been demonstrated that introducing a pre-
formed plasma using a weak artificial pre-pulse can increase the conversion efficiency
of the X-ray yield from laser produced plasmas [118 137 163-167]
(this effect is also visible
in Fig 26) Therefore systematic investigations of the plasma scale length
requirements for different experimental conditions are necessary In this section the
mechanism of the resonance absorption will first be explained Then the experimental
results are presented followed by their discussion
251 The resonance absorption (RA) and its optimum
condition
The resonance absorption occurs when an electromagnetic wave with p-
polarization (the electric field in the plane of incidence) is obliquely incident in an
unmagnetized inhomogeneous plasma In this process the electromagnetic wave
couples with the electron plasma wave at the region of critical density (defined as
nc=22 4 em L where m and e are the charge and the mass of the electron respectively
and L the angular frequency of the laser light) where the local electron plasma
frequency equals the incident wave frequency There the energy is effectively
transferred from the incident electromagnetic wave to electron plasma wave and the
electron plasma wave can be resonantly enhanced As the electron plasma wave grows
nonlinear wave-breaking [168 169]
can lead to the consequent production of hot
electrons
2 Optimization of a laser-plasma based X-ray source
18
Fig 27 Scheme of oblique incident laser pulse traveling inside a
plasma The red violet green and magenta trajectories represent the
propagation path of the incident laser pulses with angle of incidence
of 60deg 40deg 20deg and 0deg respectively The double arrows
perpendicular to the trajectories represent the polarization of the
electric fields (p-polarization) The trajectories are reflected before
reaching the critical density layer where nenc=1 The turning point
depends on the angle of incidence
A simple theoretical estimate of the optimum condition for RA is given by the
formula (2πLλ)23
sin2αmax = 06
[147] where Lλ is the plasma scale length normalized
to the laser wavelength αmax is the angle of incidence at which RA is optimized This
equation is obtained by solving the wave equation for light wave propagation in a
plasma with linear density profile It expresses an important relation between the
plasma scale length and αmax the angle of incidence for the optimum absorption
decreases with increasing plasma scale length The mechanism can be described
qualitatively in Fig 27 The absorption occurs in the critical density region where
ne=nc ne is the local electron density in the plasma The total absorption depends on
2 Optimization of a laser-plasma based X-ray source
19
how large the field driving the resonance is at the layer of critical density This field is
firstly determined by the angle of incidence because only the field component along the
density gradient which varies as sinα contributes to the excitation of electron plasma
wave Secondly since the refractive index of the plasma in the undercritical region
decreases with increasing density (ie Drude-model) an obliquely incident light wave is
refracted towards regions of lower density and reflected at a density lower than the
critical density (turning point) with ne= nccos2α
[147] Although the laser light wave
can propagate only up to turning point before it is specularly reflected some amount of
the light energy will tunnel into the critical density region and drive the resonance The
value of this driving field at the turning point can be estimated using the Airy function
solution [170]
and it decays exponentially depending on its travel distance as it penetrates
beyond the turning point Thus the resulting driving field at the layer of critical density
is a competition between maximization of the electric field component along the
density gradient and the distance of the field penetration beyond the turning point
Particularly in the situation of the experiments that will be presented later for a long
scale-length system (eg Lλ asymp 1) the turning point of a steep angle of incidence is
closer to the layer of critical density as one can see in the Fig 27 Although the field
component normal to the density gradient is weak in this case the short attenuation
distance to the critical density surface provides a stronger driving field than the one
with large angle of incidence which has large field components normal to the density
gradient but the field decay dramatically due to the large tunnel distance to reach the
critical density surface The stronger driving field at a small α (eg asymp 25deg) leads to the
stronger absorption than with a large α (eg asymp 55deg) On the other hand for a short scale-
length system (eg Lλ asymp 01) the positions of turning points of all incidences are all
close to the layer of critical density thus the attenuations of their driving fields due to
the tunnel distance are neglectable With increasing angle of incidence α (eg asymp 55deg)
the electromagnetic wave spends progressively more of its time near nc and the
excitation of the electron plasma wave at the critical density layer becomes more
efficient This leads to more efficient absorption than at small α (eg asymp 25deg)
2 Optimization of a laser-plasma based X-ray source
20
Fig 28 Plasma density profile for different times (a) arrival of the
pre-pulse (b) between pre- and main pulse and (c) when the main
pulse arrives
In order to establish a well defined plasma scale length in the work described later
the pre-plasma is produced by a laser pre-pulse arriving with a controllable delay before
the main laser pulse In Fig 28 a schematic of this arrangement is presented The pre-
pulse strikes the target surface and ionizes the material Subsequently the created
plasma starts to expand Assuming a constant expansion velocity Cs = (ZkTeM)12
the
plasma scale length L grows linearly in time according to L equiv Cst [171]
(Te is the
electron temperature determined by the pre-pulse intensity Z is the average ionization
degree k is the Boltzmann constant and M is the ion mass) After a certain time ∆t the
main pulse arrives and strikes on this pre-formed plasma with a specific density scale-
length L This scheme offers the possibility of actively manipulating and optimizing the
coupling efficiency hot electron distribution and thus the Kα emission With such a
precisely controlled pre-plasma the optimum conditions for RA discussed in this
section can be used to compare with the experimental conditions for which the Kα yield
is optimized in the following experiments
252 Experimental results
According to the results discussed in the previous section the experiments in this
chapter where performed under ldquooptimumrdquo focusing conditions The Cu targets were
placed exactly in the focus of the lens while the Ti targets were placed about 900 μm in
front of the focus These configurations lead to intensities on the Cu and Ti targets of
16 times 1017
Wcm2
(focus diameter ~20 μm FWHM) and 92 times 1016
Wcm2
(~25 μm
FWHM) for the main pulse and 20 times 1014
Wcm2
(~70 μm FWHM) and 11 times 1014
Wcm2 (~90 μm FWHM) for the pre-pulse respectively
2 Optimization of a laser-plasma based X-ray source
21
The absolute Cu and Ti Kα emission as a function of the main pulse delay at a
fixed angle of incidence of 45deg on targets of different thickness are presented in
Fig 29 (a) and Fig 29 (b) respectively The Cu and Ti Kα emission signal
normalized to the emission measured at negative time delay (52 times 108
photonspulsesr
for 20 μm Cu 82 times 107
photonspulsesr for 300 nm Cu 14 times 109
photonspulsesr for
20μm Ti and 12 times 108
photonspulsesr for 300 nm Ti) are presented in Fig 29 (c) and
Fig 29 (d) respectively The Kα yields of the 20 μm targets are six and eleven times
larger than for the 300 nm Cu and Ti thin film targets respectively This is because at
these intensities the mean-free-path of the hot electrons is much larger (several microm
[121 130 172]) than the thickness of the thin film targets Therefore in the thin films only a
small fraction of all the hot electrons will create a hole in the K-shell and thus the Kα
emission is much less than for a bulk target
In the presence of an extended pre-plasma created by the pre-pulse the Kα yield
starts to improve After a certain time delay the Kα yields reach their maximum value
and start to drop with further increasing delay times A very similar behavior is
observed for thick and thin targets as can be seen from Fig 29 (c) and (d) These
results show that the pre-plasma which is generated by the controlled pre-pulse permits
effective Kα production At an angle of incidence of 45deg an ldquooptimumrdquo time delay for
Kα production exists on all types of targets Under these optimum conditions the Kα
production on all targets is improved by almost a factor of 2 whereby the coated targets
exhibit slightly better improvements than the thick foil targets On the other hand it
should be noted that the Bremsstrahlung-background also increases with increasing Kα
yield This is shown in Fig 29 (e) where the measured X-ray signal integrated in the
energy range from 6 - 30 keV for Ti and 10 - 30 keV for Cu is plotted as a function of
pre-pulse - main pulse delay These energy ranges have been chosen to exclude the
above mentioned many-pixel-events produced by single Kα photons since these
many-pixel-events contribute to the background only below the Kα energy
2 Optimization of a laser-plasma based X-ray source
22
Fig 29 Kα emission as a function of main pulse delay at a fixed
angle of incidence of 45deg on targets of different thickness (a) Cu and
(b) Ti (c) Kα emission of Cu-targets normalized to the emission
measured at negative delay time (52 times 108
photonspulsesr and 82
times 107
photonspulsesr for d = 20 μm and 300 nm respectively) (d)
Kα emission of Ti-targets normalized to the emission measured at
negative delay time (14 times 109
photonspulsesr and 12 times 108
photonspulsesr for d = 20 μm and 300 nm respectively) (e) Hard
X-ray background signal as a function of main pulse delay on 20μm
targets
2 Optimization of a laser-plasma based X-ray source
23
Fig 210 Absolute Kα emission as a function of main pulse delay at
different angle of incidence ( a ) Cu and ( b ) Ti The measured Kα
yield at negative or zero delay is the same as obtained without pre-
pulse
In the following a more systematic study of the influence of a pre-plasma on the
Kα production using the 300 nm thin film targets will be presented With their high
(optical) surface quality the uncertain condition for the formation of plasma caused by
2 Optimization of a laser-plasma based X-ray source
24
surface roughness can be avoided [173]
Based on the very similar behaviour of thin film
and bulk targets for the specific conditions of the measurements presented in Fig 29 it
is presumed that the results obtained on thin films which will be discussed below can
be transferred to thick targets (by scaling of the absolute yield) Fig 210 (a) and (b)
show the Cu and Ti Kα emission as a function of the main pulse delay at different
angles of incidence respectively Since the pre-pulse arrives after the main pulse and
thus does not play a role at negative delay time the X-ray yields obtained in this
situation will be refer to the situation as rdquowithout pre-pulserdquo in the later discussions
Introducing a pre-pulse results in an increase of the Kα yield which is particularly
important for small angles of incidence The Kα yield of both target elements exhibit
similar qualitative dependencies on delay time and angle of incidence though the Ti
target shows noticeably larger relative variations
253 Discussion
Due to the high contrast ratio laser pulses used in the present experiment the
scale-length in the absence of the controlled pre-pulse will be very small With short
scale-lengths as already discussed in section 251 the maximum absorption occurs at a
large angle of incidence αmax typically 70deg or 80deg [147 174 175]
In such a case the
absorption should increase monotonically with the angle of incidence and this is
expected to result in an increase of the Kα yield In Fig 211 the measured absorption
of the main pulse and the Cu and Ti Kα yield without pre-pulse from Fig 210 are
presented together The measurement was carried out at constant laser intensity
(~16 times 1017
Wcm2
for Cu and ~92 times 1016
Wcm2 for Ti) With a sample thickness of
300 nm no light is transmitted Thus the absorption A can be simply determined from a
measurement of the reflectivity R using the two photodiodes shown in Fig 23 as
A = 1 - R As can be seen in Fig 211 the laser absorption does indeed increase with
the angle of incidence α for both target elements so do the Kα yields These
observations are in agreement with the previous works [147 174 175]
2 Optimization of a laser-plasma based X-ray source
25
Fig 211 Absorption measurement with main pulse only measured
at constant laser intensity Scale on left hand side absorption scale
on right hand side Cu and Ti Kα yield without pre-pulse (data taken
from Fig 210)
With a specific target material the only two variable parameters determining the
plasma scale-length L are t (delay between the pre-pulse and the main pulse) and Te
(the electron temperature determined by the pre-pulse intensity) (see section 251)
When the pre-pulse laser intensity is constant L can be assumed to be approximately
proportional to t For this reason although the absolute values of the scale-length were
not measured in the experiment the relative values from these data can be deduced and
be compared to the theoretically estimated values assuming RA as the dominant
absorption mechanism This comparison revealed that the maximum Kα yields correlate
with the maximized absorption
Using (2πLλ) 23
sin2αmax = 06 as the condition to maximize RA (see section
251) optimum normalized scale lengths of 0135 0209 0392 and 0980 are
calculated for angles of incidence of 55deg 45deg 35deg 25deg respectively In Fig 212 (a)
the optimum delay times of the pre-pulse for maximum Kα emission in Fig 210 are
shown The maxima appeared at about 3ps 5ps 8ps and 15ps on the Cu target at 55deg
45deg 35deg and 25deg respectively For Ti they were at about 2ps 3ps 5ps and 11ps at
55deg 45deg 35deg and 25deg respectively Fig 212 (b) compares the optimum delay time
from Fig 212 (a) normalized to the value found at 55deg with the theoretical estimate of
the optimum scale length for RA normalized also to the 55deg-value Since the intensity
2 Optimization of a laser-plasma based X-ray source
26
was kept constant (of the pre-pulse as well as of the main pulse) the scale length is
proportional to the delay time The comparison shows that the normalized plasma scale
lengths for the best Kα yield from both target materials are in good agreement with the
theoretically estimated optimal scale length for RA The optimum pre-pulse delay
increases with decreasing angle of incidence since the optimum plasma scale length for
maximum RA increases with decreasing angle of incidence Fig 212 essentially proves
that a maximized absorption corresponds to maximum Kα yield
( a ) ( b )
Fig 212 (a) The optimum delay time for the pre-pulse having the
maximum Kα yields extracted from Fig 210 (b) Comparison of
experimental data and theoretical estimation Points are the
experimental data in (a) normalized to their respective value at 55deg
Dashed curve is the theoretical calculation of the optimum plasma
scale length for resonance absorption also normalized to 55deg-value
The theoretical curve is calculated from (2πLλ)23
sin2θ = 06
[147] and
its absolute value indicates at Y-axis on the right hand side
In order to see how the Kα yield develops for different conditions of plasma scale
length and angle of incidence the dependencies of the Kα yield as a function of the
angle of incidence for different fixed pre-pulse delay times t are deduced from the
data of Fig 210 and plotted in Fig 213 For the present experimental conditions t
essentially represents the value of the plasma scale length L and thus the data plotted in
Fig 213 show the Kα yield as a function of the angle of incidence for different plasma
scale lengths From the previous discussion of Fig 212 the plasma scale length at
t = 15 ps for Cu is estimated as L = 082 and for Ti L = 126 For t = 0 ps (very
short scale length) the Kα yield increases monotonically with α The maximum Kα
yield is beyond 55deg When the delay t (scale length) is increased the maximum Kα
yield shifts to a smaller angle of incidence eg in (a) for t = 4 ps the maximum
appears at 45deg for t = 7 ps at 35deg Finally t = 15 ps the Kα yield decreases
2 Optimization of a laser-plasma based X-ray source
27
monotonically with α indicating the maximum Kα yield is reached at angles of
incidence of less than 25deg As discussed above the maximum Kα yields correlate with
maximum absorption which in turn shifts to small angles of incidence at large t (large
plasma scale length) The behavior of the Kα yield proves once again that RA is the
dominant absorption mechanism
( a ) ( b )
Fig 213 Kα emission as a function of the angle of the incidence at
fixed pre-pulse delay a) Cu at t = 0ps 4ps 7ps 15ps ( b ) Ti at
t = 0ps 3ps 8ps 15ps
Since the goal for this study is to achieve the best Kα yield for time-resolved X-ray
diffraction experiments it is worth to compare the absolute Kα yield for different angles
of incidence at optimum scale length and without pre-pulse As can be seen from Fig
214 without pre-pulse the Cu and Ti Kα yields increase linearly with the angle of
incidence On the contrary at the optimum delay (optimum plasma scale length) the Kα
yield is essentially independent of the angle of incidence Although these observations
have not been fully understood it indicates that the reduced main-pulse-only yield at
smaller angles of incidence can be fully compensated (ie the yield can be brought back
to its maximum value) by an appropriate pre-pulse
2 Optimization of a laser-plasma based X-ray source
28
Fig 214 Cu and Ti Kα yield as a function of the angle of incidence
at the maximum value and without pre-pulse The lines are to guide
the eye only
If one extrapolates the linear dependencies measured without pre-pulse to higher
angles they reach the angle-independent optimized level at a finite angle of incidence
In the case of Cu this seems to occur at a large angle of incidence near 90o For Ti this
level is already reached at angles of incidence slightly above 60o This result might
arise from the presence of a short scale length pre-plasma caused by the leading edge of
the main pulse alone (even for a high contrast laser pulse and in the absence of any
further pre-pulse) As discussed for the absorption in Fig 211 it indicates that in the
present experiment at this large angle of incidence the plasma scale length generated by
the main pulse alone fulfills the condition for optimum RA and thus maximized Kα
generation Hence the optimized Kα yield can be achieved without introducing an
artificial pre-pulse ndash a conclusion which is also supported by PIC simulations (see
section 26) This would also explain why in many experiments even a relatively poor
contrast ratio laser system allows to achieve high Kα yields [130 148 152 156]
Nevertheless it can be concluded that for a given contrast ratio (given by the laser
system) and ion mass or a given scale-length in the experiment one should choose the
appropriate angle of incidence α to obtain the maximum Kα yield Or vice versa if α is
fixed then one has to adjust L accordingly via pre-pulse control Such an optimization
could be achieved at least in the range of the values of α and L (obtained from Δt)
covered by the current experiment ie α ~ 25deg hellip 55 deg and Lλ ~ 01 hellip 1
2 Optimization of a laser-plasma based X-ray source
29
Fig 215 Energy conversion efficiency vs angle of incidence with
pre-pulses and without pre-pulses
An important note concerning the energy conversion efficiency should also be
made here The angular independent optimized Kα yield shown in Fig 214 was
obtained by keeping the laser intensity constant The focused spot size projected onto
the sample surface increases with angle of incidence as 1cos() Therefore at large
angle of incidence (eg α = 80deg) one needs more laser pulse energy than at small
angles of incidence (eg α = 20deg) for the same amount of produced photons (In this
example a factor cos(20deg)cos(80deg) ~ 5 times more for α = 80deg compared to α = 20deg) It
can be noticed that the energy conversion efficiency from laser pulse into Kα X-rays
essentially decreases with the increasing angle of incidence To clarify this issue more
clearly the energy conversion efficiency has been deduced from Fig 214 using the
known laser energies Kα photon energies and Kα yields and is presented in Fig 215 In
principle the conversion efficiencies obtained here are in line with other experimental
results reported in the literature [129 176]
Without the pre-pulse the conversion efficiency
increases with the angle of incidence for both materials As already discussed in Fig
210 the absorption improves with increasing angle of incidence for the given small
pre-plasma scale length that is caused by the main pulse itself and thus leads to a higher
Kα yield On the contrary at the optimized pre-pulse conditions the conversion
efficiency decreases with increasing angle of incidence as predicted
2 Optimization of a laser-plasma based X-ray source
30
26 Comparison of the experimental results with simulations
Particle-in-Cell simulations (PIC) are a very powerful and direct numerical tool for
modeling laser-plasma interactions [177-179]
In the PIC simulation the charged particles
(electrons ions neutrals molecules dust particles etc) are modeled as individual
macro-particles moving in non-physical grid across the plasma (the cell part of the
name) using Newtons laws and self-consistently calculated electric fields resulting
from external (applied) fields and internal fields from charge distributions By solving
the equations of motion of these particles the moments of the distribution of the
particles such as densities and currents can be obtained simultaneously The results of
PIC simulations presented in this section were preformed by M Mašek and P Gibbon
with whom we cooperated
To obtain a quantitative estimate of the Kα production this simulation consists of
two steps The energy distribution of hot electrons generated by the laser-plasma
interaction was first determined with PIC simulations Then the total Kα photon yields
produced by fast electrons going inside the target were calculated with a Monte-Carlo
method which is a stochastic technique using random numbers and probability
statistics to investigate mathematical or statistical problems [180]
The detailed PIC simulations were performed by using the 1D3V (1 spatial 3
velocity coordinates) code BOPS (Boosted Oblique Particle Simulation) [127 131]
which
can treat oblique incidence Up to 6000 spatial grids and 500000 electrons and ions are
used in the simulation The laser is p-polarized with fixed intensities as in the
experiments The initial plasma parameters were chosen as close as possible to those
expected in the experiment More details can be found in Ref [181]
Fig 216 shows the dependence of absorbed energy on the plasma scale-length
from the simulation It is found that the scale length at which absorption becomes
maximum decreases with increasing angle of incidence qualitatively in agreement with
the simple RA-picture presented above (Fig 212(b)) Moreover the scale-length
dependencies of the absorption show a general qualitative correlation with the
experimental dependencies of the Kα yield with delay time as shown in Fig 210
2 Optimization of a laser-plasma based X-ray source
31
( a ) ( b )
Fig 216 The calculated absorbed energy as a function of the initial
plasma density scale length and incidence angle for Cu ( a ) and Ti
( b ) targets Pictures reproduced from Ref [181]
The total number of Kα photons generated by the hot electrons during their
propagation through the nonexcited solid material underneath the plasma layer was
calculated according to a standard cross section model using a method similar to Ref
[129 182] The electron distributions obtained from the PIC simulations are split into
several monoenergetic beams and transported through the foil which is divided into
several cells Using the relativistic K-shell ionization cross section [124]
the number of
generated Kα photons is calculated With the Monte-Carlo method each electron beam
is slowed down via collisions according to the Bethe stopping formula whereby the
stopping power is taken from the NIST database [183]
for both materials Once the
electron beam escapes from the rear of the target it is assumed to play no further role in
the Kα production a reasonable assumption because the foils were mounted on low-Z
(glass) substrates The reabsorption of Kα photons is also taken into account The
attenuation coefficient is taken also from the NIST database [184]
Fig 217 shows the dependence of the Kα yield on the initial density scale-length
It is clear that the qualitative behavior from Fig 217 (a) and 217 (b) is the same for
both materials as in the experiment (Fig 210) The Kα yield reaches its maximum for
roughly the same scale-length as the laser absorption indicating that the Kα yield is
largely determined by the absorption efficiency On the other hand the absolute values
of Kα yields obtained from the PIC simulations are roughly a factor of 3 to 4 times
lower than the measured values a discrepancy which could be due in part to the
geometrical simplifications in the model There are also differences in the positions and
2 Optimization of a laser-plasma based X-ray source
32
values of the Kα maxima although these are difficult to define precisely for the
simulations because of insufficient statistics
( a ) ( b )
Fig 217 Calculated Kα yield as a function of the intial plasma
density scale length and incidence angle for ( a ) Cu and ( b ) Ti
targets Pictures reproduced from Ref [181]
Finally I would like to add a comment on the time structure of these X-ray pulses
predicted from the PIC simulation although it does not directly relate to this
measurement The result of PIC simulation did show that the duration of these X-ray
pulses is in the sub-picosecond region [121]
and this prediction has been experimental
proved in the following time-resolved experiments
27 Summary
In summary the emission of Kα-photons of Cu and Ti targets was measured at
different laser intensities sample thickness angles of incidence and different pre-
pulsepre-plasma conditions It has been shown that for the given experimental
conditions an optimum laser intensity for Kα-production can be reached in the case of
Ti For Cu this optimum intensity appears to be higher than the maximum intensity
attainable in the experiment For constant laser intensity on a steep density gradient
plasma the Kα yield is highest at large angles of incidence For smaller angles the yield
decreases and reaches its lowest value when approaching normal incidence However
introducing a pre-pulse at appropriate time in advance to the main pulse the yield can
be increased to the same value as at large angle of incidence without a pre-pulse
Therefore the optimized Kα yield is independent on the angle of incidence and it can be
achieved by proper choice of the pre-pulse timing Experimentally this was verified for
angles between 25 deg to 55 deg
2 Optimization of a laser-plasma based X-ray source
33
It was also experimentally found and supported by simulations that the Cu and Ti
Kα generation follows the laser absorption as known for other materials [77 118 164 172
156 163 167] As expected resonance absorption (RA) has been proved to be the dominant
absorption mechanism in this process and optimization of the Kα production results
from a maximized absorption of the laser pulse For a high contrast laser system as
used in this experiment controlled pre-pulses provide well defined pre-plasma scale-
lengths allowing systematic investigation on the optimization of absorption Kα
production for the other given experimental conditions (material angle of incidence
pulse energy intensity) The simulations with these well defined initial parameters
show the qualitative agreement with experimental observations and provide insights
into the physical process of laser energy absorption hot electron generation electron
transport in the material and the resulting Kα generation
For practical purposes the present work indicates that for long plasma density
scale lengths created by the leading edge of a low contrast ratio laser system and other
experimental conditions (within the range Lλ ~ 01-10) the Kα emission from a laser
produced plasma could be optimized by operating the X-ray source at the matched
angle of incidence Experimental arrangements in which an unintentional (or
unavoidable) pre-pulse is present could probably be improved simply by using a small
angle of incidence instead of the 45deg geometry typical of many setups The present
study indicates that the X-ray emission could be increased by a factor of 2 or 3 in this
case with obvious advantages for many applications of fs-Kα sources such as time-
resolved X-ray diffraction (TRXD) On the other hand for a high contrast laser system
leading where the self generated plasma exhibits a steep density gradient (small scale
lenghth) these findings still suggest to use a small angle of incidence and a matched Δt
For the same value of Kα emission this requires less energy to achieve the same on-
target intensity as with a large angle of incidence and subsequently leads to a better
energy conversion efficiency
In the following chapter these results are applied to improve the laser-plasma
based X-ray source for the TRXD experiments
3 Improvement of the modular setup for time-resolved X-ray diffraction experiments
34
3 Improvements of the modular setup for
time-resolved X-ray diffraction experiments
As it has been discussed in detail in the previous chapter focused laser intensities
in the range of 1017
- 1018
Wcm2 are required to efficiently generate X-rays in the
multi-keV range If the irradiated target is surrounded by an atmosphere non-linear
effects (eg self-phase-modulation self-focusing [185]
) and plasma formation
(breakdown) in the atmosphere will severely deteriorate the spatial intensity
distribution of the focused femtosecond pulse and the required on-target intensities
cannot be reached Therefore the X-ray target has to be placed in vacuum Two
different set-ups to perform time-resolved X-ray diffraction are currently used at the
University of Duisburg-Essen One scheme uses a large vacuum chamber to place not
only the X-ray target but the whole setup (including X-ray optics samples and
detectors) under vacuum [70 140]
This scheme avoids absorption losses of the generated
X-rays in air (which is more critical for lower energy radiation like Ti K- 451 keV)
but it poses some geometrical restrictions due to its limited size Moreover operation of
the setup is relatively complicated since most of the components in the chamber require
remote control
To overcome some of these drawbacks a second scheme for time-resolved X-ray
diffraction experiments had been designed and built up mainly by Dr Matthieu Nicoul
[186] and since then it has been continually further developed This setup has a modular
design and only the X-ray sourcetarget itself is operated under vacuum and all the
other experimental components are placed in air This gives a lot of advantages such as
more space for experimental components and convenience in adjusting them It was the
aim of the work described in this chapter to improve the existing setup to allow for
time-resolved Bragg-diffraction experiments with increased accuracy (see chapter 5)
and to enable new experimental schemes that had not been possible before (ie time-
resolved Debey-Scherrer-diffraction see chapter 6) In the first part of this chapter the
fundamental components of the previously existing setup are briefly described In the
3 Improvement of the modular setup for time-resolved X-ray diffraction experiments
35
second part I present and discuss the implemented improvements including hardware
software and methodology Finally a summary for this chapter is given
31 The fundamental components of the current setup
A scheme of the current setup is shown in Fig 31 The fundamental components
(labeled with black letters on Fig 31) had already been described in detail in Ref
[186] In order to provide the necessary information to the reader the important
components will be briefly pointed out in this section The implemented
improvementsadditions to this setup are also represented on Fig 31 (labeled with blue
letters) and they will be discussed in the next section 32
Fig 31 Scheme of the current modular setup for time-resolved X-
ray diffraction experiments The elements labeled with black letters
are components of the previously existing setup and the ones labeled
with blue letters are components implemented during my PhD work
The CPA Tisapphire laser system described in chapter 2 delivers 150 fs laser
pulses at a wavelength of 800 nm with an energy of 120 mJ at a repetition rate of 10
Hz The laser beam (the red optical path in Fig 31) is split into two parts by a mirror
with a small off-center hole (7mm in diameter) The transmitted part serves as the
3 Improvement of the modular setup for time-resolved X-ray diffraction experiments
36
optical pump beam to excite the sample under study while the reflected part is focused
by a lens of 300 mm focal length onto a Cu-tape target with an incident angle of 45ordm (p-
pol) to produce the Cu Kα (805 keV) probe pulse
For the reasons mentioned in the introduction of this chapter the Cu-target is
placed inside a compact vacuum chamber (size 24times30times30 cm3) which includes
connectors for the vacuum pump a pressure gauge and electrical feedthroughs as
shown in Fig 32 For mechanical and radiation safety reasons this chamber is made of
stainless steel with a wall thickness of 15 mm Additionally a 2 mm lead cover was
added inside the chamber to enhance security and to reduce the level of background
radiation that may reach the detector The working pressure of the chamber is 01 mbar
(a) (b)
Fig 32 Overview of chamber (a) outside and (b) band target inside
the chamber
The target consists of a 10 microm thick Cu tape mounted on a motorized spooling
system which works similarly to an audiocassette recorder (Fig 33 (a)) The pulling
speed is approximately 8 mms (ie 800 microm motion between two consecutive laser
pulses) to ensure that a fresh surface area is provided for each laser pulse The tape
shifts vertically to its pulling direction by about 08 mm when the pulling direction is
(automatically) changed One set of band (25 mm wide and 15 m long) can provide
more than 12 hours experiment time In order to minimize the deposition of ablated
material in particular at the small hole where the X-rays can leave the chamber [187]
a 8
μm Kapton foil has been rolled together with the Cu tape before mounting it to the
spooling system The Kapton foil runs simultaneously with the tape to pick up the
debris which is predominantly ejected at the back-side of the tape normal to its
surface [187]
Close to the laser-target interaction point it is mechanically separated from
the Cu tape by about 2 mm (see Fig 33 (b))
3 Improvement of the modular setup for time-resolved X-ray diffraction experiments
37
(a) (b)
Fig 33 (a) Photo of band target (b) Kapton foil used for reducing
material deposition
Using a pin-hole camera the size of the X-ray source on the tape target was found
to be similar to the spot size of the focused laser beam ie ~25 microm [187]
The Cu Kα
emission is close to 5times109 photonspulse in 4π solid angle without pre-pulse and 1times10
10
photonspulse with an optimized pre-pulse (see section 321) Since the X-ray emission
is into the full solid angle a multilayer X-ray optic with Montel-Helios geometry [188]
is
used to collect the radiation and to refocus it onto the sample under investigation The
multilayer X-ray optic reflects both the Cu Kα1 and Kα2 emission lines but suppresses
other spectral components (ie K) More details on the working principle and the
specifications of this mirror can be found in Appendix A
The focused X-ray beam was characterized at different positions of the beam path
through four relevant parameters [186]
the beam profile directly after the multilayer
optic the total number of reflected photons the convergence of the beam and the size
of focus spot A direct detection CCD camera was used to measure the first three
relevant parameters of the X-ray beam since it allows a rather accurate estimation of
the absolute detected X-ray signal (eg number of diffracted photons per pulse) A X-
ray beam profile taken at 4 centimeters after reflection on the multilayer optic is shown
in Fig 34 (a) Since the X-ray emission from the plasma is isotropic (ie homogeneous
illumination of the mirror) the intensity distribution measured at such a short distance
after the optic gives direct information on the spatial reflection properties of the two
multilayer mirrors The image in Fig 34 (a) demonstrates the uniformity of the
reflectivity over the mirror surfaces Due to the mounting configuration of the
multilayer mirrors inside the housing the beam shape is a 45deg rotated square [Appendix A]
The convergence angle of the beam was measured to be approximately 023deg which
3 Improvement of the modular setup for time-resolved X-ray diffraction experiments
38
corresponds to the specifications of the manufacturer (024deg) Using the known
sensitivity of the direct detection CCD camera [186]
the Cu Kα flux in the focused beam
can be determined from images like the one shown in Fig 34 (a) With an optimized
pre-pulse a typical flux of 13times105
photonspulse was obtained The intensity
distribution at the focus spot was measured with an indirect phosphor based detector
(Gemstar) [186]
A typical image with horizontal and vertical cross sections is shown
in Fig 34 (b) The measured FWHM of the focus spot is 150 microm in horizontal and 127
μm in vertical With the given source size of approximately 25 microm and the 5x
magnification of the multilayer optics this is close to the expected value
(a) (b)
Fig 34 (a) Topography of Cu Kα beam observed with the direct
detection CCD camera 4 cm after reflection on multilayer mirror (b)
Intensity distribution of Cu Kα emission at the focal point of the
multilayer optic obtained with the phosphor based detector Pictures
reproduced from Ref [186]
Since most of the experimental components of the modular setup are placed in air
they are easily accessible and can be conveniently manipulated In order to minimize
losses by absorption of the Cu Kα-radiation in air [189]
the optics housing is purged with
He and He-purged beam-tubes were installed in the X-ray beam path Although the X-
ray beam path cannot be covered completely more than 90 of the radiation collected
and reflected by the X-ray optic is delivered to the sample
The samples are mounted on a motorized x-y-θ stage to adjust the Bragg-angle (θ)
and the beam position on the sample (x-y) The diffraction signals have been recorded
so far by two different X-ray sensitive area detectors The first detector is a direct
3 Improvement of the modular setup for time-resolved X-ray diffraction experiments
39
detection CCD-camera (type PI-MTE 1300B) which has also been used for the
measurements discussed in chapter 2 As it has been explained before due to the strict
relation between the X-ray photon energy and the generated charge this detector can be
used as a spectrometer (see chapter 2) and allows determination of the absolute X-ray
signal with rather high accuracy (single photon sensitivity) The low quantum
efficiency (18 ) and the slow readout time are its main drawbacks The second area
detector uses indirect detection A phosphor screen converts incoming X-ray photons
into visible photons The optical signal is amplified by an image-intensifier and then
detected by a normal CCD Although this system allows single photon detection at high
gain of the intensifier there is no well-defined relation between the detected signal and
the X-ray photon energy On the other hand this detector has a high quantum efficiency
(85 for Cu Kα radiation [186]
) and high read-out rate (up to 10 Hz) so that an image
can be recorded for each single X-ray pulse A more detailed discussion of these
detectors and their specific advantages and drawbacks can be found in Ref [186] as
well as in Appendix B
The energy of the pump beam used to excite the sample is adjusted with a half-
wave-plate in conjunction with a thin film polarizer and monitored with a PIN diode A
motorized translation stage with a retro-reflector allows varying the delay between the
optical pump and the X-ray probe beam The p-polarized pump beam is focused with a
lens of 1 meter focal length onto the sample surface The angle between laser pump and
x-ray probe beam is set to be as small as possible ie approximately 10deg In order to
ensure that the measured diffraction signals represent the response of an almost
homogeneously excited region the diameter of the pump beam is chosen to be at least 3
times larger than the X-ray spot size Since the available amount of energy in the pump-
path (about 1 mJ per pulse) is more than sufficient for the experiments discussed in this
thesis a diaphragm has been used to adjust the pump beam spot size A removable
mirror which can be inserted in the beam path directs the beam to a CCD camera
positioned at a position equivalent to the distance to the sample to monitor the size and
the shape of the focused beam
32 Improvements of the modular setup
During my thesis work several improvements of the setup have been implemented
in order to (i) optimizeincrease the X-ray flux of the plasma source (ii) improve the
measurement sensitivityaccuracy and (iii) automatize and speed up the experimental
3 Improvement of the modular setup for time-resolved X-ray diffraction experiments
40
procedures This section describes in detail the necessary steps and modifications which
were essential to achieve the results of the time-resolved diffraction experiments
discussed in the following chapters in particular the results of the phonon softening
obtained on photo-excited Bismuth (Chapter 5)
321 Controlled pre-pulse to enhance the X-ray production
In chapter 2 it has been discussed in detail that a controlled pre-pulse with suitable
delay can be used to improve the X-ray production Based on this result a pre-pulse unit
(beam splitter and combiner delay stage see the black-dotted box in Fig 31) has been
added to the modular setup The main pulse energy is 110 mJ and the pre-pulse energy
is 15 mJ which results in intensities at the focus of the lens of 16times1017
Wcm2 for the
main pulse and 20times1014
Wcm2 for the pre-pulse respectively With a pre-pulse
arriving 5 ps before the main pulse the X-ray production of the modular setup has been
improved by about a factor of 2 which leads to more than 105 Cu Kα photonspulse
collected and focused by the X-ray mirror on the sample under normal experimental
conditions The positive effect of the pre-pulse was also briefly underlined and
presented in Dr Nicoulrsquos thesis
322 Avalanche photodiode (APD)
It was pointed out by Nicoul [186]
that the modular setup with the
magnifyingcollimating Montel-optic is most appropriate for experiments in which the
shape or angular position of the rocking curve of the excited sample does not change
but only the total diffraction efficiency (ie due to structure factor changes) Under
these conditions it is not necessary to use a detector with 2D resolution and therefore a
single-channel detector is sufficient Since the diffraction efficiency of the thin-film
samples typically used in the time-resolved experiments is low (10-3
-10-4
resulting in
diffraction signals of 10 - 100 photonspulse) a detector with high sensitivity down to
the single-photon level is required X-ray sensitive avalanche photodiodes (APD) fulfill
these requirements An APD is a photodiode with internal gain obtained by applying a
high reverse bias voltage to the photodiode which creates an intense electric field inside
its volume It combines the benefits of a photomultiplier tube (gain) and conventional
photodiodes (high quantum efficiency)
3 Improvement of the modular setup for time-resolved X-ray diffraction experiments
41
For the modular setup a large area (10 mm in diameter) Silicon APD was chosen
(its technical data are given in Appendix B) Using the direct detection CCD for
calibration the quantum efficiency of the APD for Cu Kα radiation was measured to
(36 plusmn 7) in agreement with previously published data [190 191]
This detector can be
easily operated at a repetition rate of 10 Hz and with more convenience (compact size
no need for water cooling) as compared to the phosphor based area detector To digitize
the detected X-ray signal a gated charge-integrating analogue-to-digital converter
(ADC) [192]
is used In order to match the APD-output to the input specifications of the
ADC a pulse shaperamplifier is added directly to the APD
The APDADC-combination was calibrated for the detection of Cu Kα radiation by
reducing the incident X-ray signal to the few-photons-per-pulse-level (0 to 6) and
analyzing the signal value distribution (histogram) of a large number of pulses
(typically a few thousand) for different bias voltages Results are shown in Fig 35 (a)
The signal value distributions exhibit a multi-peak structure as it is expected for a Si-
detector with its rather well defined relation between the charge generated by a single
X-ray photon and the photon energy (e g one Cu Kα photon produces 366 times 10 -4
pCb)
A multi-peak fit was applied to separate the individual peaks and to determine in
particular the position of each peak (marked in the figures) The first left peak
corresponds to the dark current background (no photon detected proven by blocking
the X-rays) and the second third fourth hellip peaks are correspond to one two three hellip
detected photons respectively By plotting the peak position as a function of photon
number in Fig 35 (b) and fitting the result by a linear function (Y = m + n X) the
corresponding ADC output (given in counts) for the background signal (parameter m)
and for a single Cu Kα photon (parameter n) can be determined for different bias
voltages The result is shown in Fig 35 (c) The ADC output per Cu Kα photon (black
squares) increases rapidly with bias voltage reflecting the corresponding increase of the
APD-gain It has to be noted that the dark current is also amplified with increasing bias
voltage underlined by the increase of the background signal (red circles)
Since the X-ray-to-charge conversion is known as well as the amplification of the
amplifier (11x) and the sensitivity of the ADC (32 counts per pCb) this APD-gain can
also be deduced from the information above The result is plotted in Fig 36 as a
function of bias voltage together with results of optical measurements (see below) and
data provided by the manufacturer All data are in a good agreement and the maximum
gain of 103 is proven to be achievable with this device
3 Improvement of the modular setup for time-resolved X-ray diffraction experiments
42
(a)
(b) (c)
Fig 35 (a) The signal value distributions (histograms) measured
with the APD at the few-photons-per-pulse-level at different bias
voltages The blue curves are the total multi-peak fits and the green
peak profiles are the separated individual peaks The peak positions
are indicated on the top of each peak (b) The values of peak
positions in (a) as a function of the number of detected photons
With the linear fitting function (Y = m + n X) the background
signals and corresponding ADC outputs (given in counts) pre Cu Kα
photon can be determined by the fitting parameter m and n
respectively (c) The corresponding ADC outputs per Cu Kα photon
(black square points) and the background signals (red circle points)
at different bias voltages
3 Improvement of the modular setup for time-resolved X-ray diffraction experiments
43
Fig 36 Comparison of the gain of APD from three measurements
Fig 37 APD signal as a function of PIN diode signal with different
operating voltages
Another important information concerns the question whether the (electric) output
signal is proportional to the (X-ray or light) input signal (linearity) The linearity of the
APD was checked by measuring an optical input with the APD at different bias
voltages and a regular Silicon PIN-diode which was known to be linear over the used
range of incident optical power In Fig 37 the APD-signal is plotted as a function of
the PIN diode signal for different APD bias voltages It turns out that the response of
the APD is linear for an ADC-output up to about 1000 counts For higher signal levels
the response becomes nonlinear Since the APD and the assembled electronic
3 Improvement of the modular setup for time-resolved X-ray diffraction experiments
44
shaperamplifier were not tested separately the source of the nonlinearity cannot be
determined at this point In the time-resolved diffraction experiments the nonlinearity
of the APD needs to be taken into account and corrected
323 Ionization chamber detector (ICD)
(a) (b)
Fig 38 (a) Photo of the ionization chamber detector and (b) its
working scheme
In order to normalize the diffraction signals and to determine the changes in the X-
ray diffraction efficiency of an optically excited sample with high accuracy it is
necessary to measure also the (relative) incident X-ray flux for each pulse For this
purpose a small ionization chamber detector has been placed behind the X-ray
multilayer optic A photo of the installed chamber and its working scheme is shown in
Fig 38 Part of the Cu Kα radiation reflected by the optic is absorbed and ionizes the
Ar-gas with which the cell is filled The Ar-pressure is around one atmosphere At 8
keV a transmission of 72 is measured and it agrees with the expected transmission
value of 16 cm Ar at 1 atm plus 16 μm of Kapton foil used as cell windows [189]
To
collect the charge generated by ionization a high bias voltage is applied (2000 kV) A
high speed current amplifier (type DHPCA-100 FEMTO) with a gain of 105 is used to
3 Improvement of the modular setup for time-resolved X-ray diffraction experiments
45
match the output signal of the ionization chamber to the input of the gated charge-
integrating ADC (same as used for recording the APD-signals)
In order to characterize the ionization chamber detector its linearity was measured
using the phosphor based area detector which can be regarded as a linear detector The
result of this measurement shown in Fig 39 (each data point corresponds to an
acquisition time of 30 sec) clearly shows the linear response of the ionization chamber
Fig 39 Calibration between ionization chamber detector and
phosphor based detector Red dashed line is a linear fit of the
measured data
Fig 310 Long term drift of the normalized ratio
3 Improvement of the modular setup for time-resolved X-ray diffraction experiments
46
It should be noted that the output signal of the ionization chamber is surprisingly
very sensitive to changes of the Ar-pressure (approx 30 change of signal for lt1
change of pressure) Therefore the pressure inside the chamber needs to be stabilized
during the whole measurement For this purpose a pressure control system consisting
of two pinhole valves and a pressure gauge was implemented (see Fig 38) It allows
stabilizing the pressure inside the chamber to about plusmn01 mbar (relative to the external
pressure) Despite stabilizing the pressure in the ICD we observed long term drifts of
the ICD-signal during the diffraction measurements As an example the ratio between
the APD and ICD signals from one representative measurement recorded over about
one hour is presented in Fig 310 The large pulse-to-pulse variations of the ratio are
caused by the counting statistics limited fluctuations of the APD-signal (only a few
photons per pulse are detected in this particular measurement) Additionally the ratio
which should be constant on average changes slowly with time So far no clear
explanation has been found for this effect These drifts can severely limit the achievable
accuracy in a time-resolved experiment when for example the different pump-probe
delays are sequentially measured during an experimental run The issue has been solved
by applying a ldquofastrdquo delay scanning technique in the experiments which will be
discussed in section 3262
324 Experiment control program
The modular setup is entirely controlled by a software program developed using
the LabVIEW environment The functions of this program include control and
monitoring of the different elements and detectors in the setup as well as data recording
and pre-processing All functions can be accessed from one interface (shown in Fig
311) which has been geometrically divided into two parts
3 Improvement of the modular setup for time-resolved X-ray diffraction experiments
47
Fig 311 Interface of the experiment control program
The upper part (part I) is used to prepare an experiment and to perform some
simple test measurements eg checking signal levels the background signals of the
detectors etc Frame (Ia) is a control panel for the pump-probe delay unit In frame
(Ib) the detected signals from individual detectors (ie PIN diodes APD ICD) can be
selected and displayed The received data can be recorded into files Frame (Ic) is a
waveform graph to show the histogram of the signal of the detector selected in frame
(Ib) Frame (Id) displays the real time trace for the selected detector
The lower part (part II) is used for the time-resolved diffraction experiments In
region (IIa) one can enter the relevant measurement settings eg background signal of
the different detectors acquisition time for the individual measurement points delay
range delay steps and saving folder Frame (IIb) shows the real time traces of the
measurement and the ratio APDICD The five indicators at the bottom of this frame
indicate the status of the measurement system Frame (IIc) displays a constantly
updated preliminary analysis (ie ratio APDICD vs delay time) of the measured data
In region (IId) several switches allow to change between different operation modes of
the tape target the laser triggering and the delay unit (eg fast scanning see below)
3 Improvement of the modular setup for time-resolved X-ray diffraction experiments
48
Frame (IIe) displays the correlation between APD and ICD and Frame (IIf) displays the
pump beam energy
part I To prepare the experiments and to perform some simple test measurements
Frame (Ia) Control of the pump-probe time delay
Frame (Ib) Selection and value display of the signals from individual detectors
Frame (Ic) Display of the signal value distributions of the selected detectors
Frame (Id) Display of real time traces for the selected detectors
part II To perform the time-resolved diffraction experiments
Frame (IIa) Input of the relevant measurement settings
Frame (IIb) Display of real time traces of APD ICD and their ratio
Frame (IIc) Display of a preliminary analysis of the measured data
Frame (IId) Control of tape motion and ldquofastrdquo scanning
Frame (IIe) Display of APD-signal vs ICD-signal
Frame (IIf) Display of the pump beam energy
Table 31 The functions of the individual areas in the user interface
of the experiment control program
For a better overview the functions described above are briefly summarized in
Table 31 This program has been proven very useful during the performed experiments
However further improvements are possible For example integration of control
functions for the sample holder might be required to allow a synchronized motion of
the sample during data acquisition (eg for experiments where the sample is
irreversibly damagedmodified by a single laser pulse)
325 Spatial and temporal overlap adjustments with APD
A very important and non-trivial part of performing a time-resolved diffraction
experiment is to find spatial and temporal overlap between the (invisible) X-ray probe
beam and the laser pump beam To find spatial overlap a similar procedure is applied
as described in Ref [186] The sample is moved vertically and horizontally with the
translation stage in order to scan its border through the X-ray beam Since the sample
surface is monitored by a camera on a video screen the disappearance of the X-ray
diffraction signal allows to localize the X-ray beam position by marking the sample
border in horizontal and vertical direction on the screen Then the optical beam can be
easily adjusted to overlap with X-ray beam on the marked position The spatial overlap
needs to be checked before every measurement
Once the spatial overlap is established the temporal overlap is adjusted by
exciting the sample with the laser and monitoring changes of the diffraction signal
while scanning the delay stage Two examples are presented in Fig 312 which show
3 Improvement of the modular setup for time-resolved X-ray diffraction experiments
49
the relative decrease in the diffraction signal upon laser excitation on thin films of Au
(333)-reflection (a) and Bi (111)-reflection (b) While the different physical processes
responsible for the observed signal changes will not be discussed here (see chapter 4
and 5) the time-traces allow to determine delay zero (temporal overlap) The accuracy
depends obviously on the speed of the induced changes and can reach the sub-
picoseconds level if the changes are fast (ie Bi) Moreover it should be emphasized
that using the APD and the new experiment control program allows to obtain such
results in just a few minutes Without the implemented improvement it usually took
around 45 to 60 minutes for the same purpose [186]
Finally it should be noted that the
observed decay of the Bi-diffraction signal in less than 400 fs (Fig 312b) represents an
upper limit for the temporal resolution that is possible with the modular setup A
temporal resolution of about 100 fs has been demonstrated with a similar X-ray source
in Ref [106]
(a) (b)
Fig 312 Time-resolved measurements with high temporal
resolution detected using APD (a) Au (333) and (b) Bi (111) The
cyan dashed line marks the position of time zero
326 Normalization of X-ray signals
Since only a few photons per pulse are diffracted from the thin film samples
typically used in the time-resolved X-ray diffraction experiments it is necessary to
accumulate signal over a sufficiently long time (a few hours are usually required for a
complete experiment) to enable the measurement of transient changes of the diffraction
efficiency at the percent level During this time the variation of the X-ray flux
delivered to the sample cannot be avoided without a normalization procedure In the
following one needs to distinguish between short-term fluctuations and long term drifts
3 Improvement of the modular setup for time-resolved X-ray diffraction experiments
50
Short-term fluctuations refers here to all intensity variations of the X-rays
occurring within seconds down to pulse-to-pulse fluctuations They are mainly caused
by energy and spatial (pointing stability) instabilities of the driving laser As mentioned
in chapter 2 the laser energy essentially affects the total X-ray yield Hence the pulse-
to-pulse energy fluctuation results in a fluctuation of the X-ray output signal For the
modular setup spatial instabilities represent the most critical issue which had already
been detailed discussed in Ref [186] Together with the position instabilities of the
copper tape with respect to the focused laser spot (caused mainly by mechanical
instabilities of the pulling system) the finite pointing stability results in fluctuation of
the spatial position of the X-ray source Due to the short source-to-mirror distance the
overall reflection efficiency of the multilayer X-ray optic is very sensitive to variations
of the source position which lead to significant changes of the X-ray output behind the
optic
Long term drifts refer to variations of the X-ray flux within minutes up to hours
(see Fig 310) While the sources of these drifts are not completely understood it must
be noted that they cannot be simply averaged out
Therefore suitable measurement schemes with reliable normalization procedures
are required to maximize the accuracy of the measurement and to minimize the
necessary experimental time Two measurementnormalization schemes are described
and discussed in the following sections which allow to handle both short term
fluctuations and long term drifts
3261 Chopping normalization scheme with a shutter
The first normalization scheme I call the chopping method which is a low
repetition rate variant of a well-known normalization scheme used for all-optical pump-
probe experiments at high repetition rate laser systems [193-196]
In this scheme the pump
beam is periodically blocked (chopped) in order to record the probe signal with and
without laser excitation within a short time interval To achieve this a mechanical
shutter is installed in the pump beam path (see Fig 31) and operated at 1 Hz with an
opening time of 05 sec Given the 10 Hz repetition rate of the laser system the
diffraction signal is recorded 5 times with sample excitation followed by 5 times
without sample excitation within one shutter cycle The signals from the PIN diode
used to monitor the pump beam energy allow to mark ldquopumpedrdquo and ldquoumpumpedrdquo
events in the data stream The relative change of the signal due to the laser excitation
3 Improvement of the modular setup for time-resolved X-ray diffraction experiments
51
can be retrieved by normalizing the sum of ldquopumpedrdquo signals to the sum of the
ldquoumpumpedrdquo signals In this way both short term fluctuations (by averaging) and long
term drifts (by comparing pumped and unpumped signals every second) are
properly taken into account However only one half of the total flux contributes to the
transient diffraction signal while the other half is used for normalization
Fig 313 Chopping normalization scheme Standard deviations as
function of integrated acquisition time with different detected photon
numbers per pulse Data points obtained from the experiment and
solid curves are calculated from counting statistics
In the ideal case the achievable accuracy of the experiment is determined by the
counting statistics through the total number of detected photons (given by the laser
repetition rate the number of diffracted photon per pulse and the acquisition time)
Since the laser repetition rate is fixed and the number of diffracted photons per pulse is
determined by the diffraction efficiency of the sample and the X-ray source
performance the acquisition time is the only parameter to control the accuracy of the
experiment In order to define the required acquisition time for a desired accuracy a
series of test measurements were performed with Bi- and Au- samples Each set of the
diffracted signals from these two samples were recorded with the APD for
approximately one hour in the same experimental conditions without sample excitation
The detected APD-signal for each set of data was varied by changing X-ray source
production (adjusting the energy of the driving laser for the X-ray source) and by
choosing different Bragg-reflections The data are analyzed with a MATLAB routine
3 Improvement of the modular setup for time-resolved X-ray diffraction experiments
52
which artificially groups the data in pumped and unpumped events (assuming
chopping at 1 Hz) and averages and normalizes the diffraction signal over bins of
different size (ie the number of pulses used to produce one normalized data point)
Each specific binning produces a set of data with different number of points as the
number of points times the binning size equals the same number determined by the total
acquisition time The standard deviations of each data set are calculated and presented
in Fig 313 as a function of the acquisition time for one point (determined by the
binning size) Since the APD has been calibrated one can calculate the expected
standard deviation of the measured diffraction signal S assuming that it is determined
only by counting statistics as 21 NSS where N is the total number of detected
photons in the respective acquisition time [197 198]
These calculated values are plotted as
solid lines in Fig 313 and they are used to compare to the experimentally determined
values Note that due to the chopping method used for normalization only one half of
the detected photons contributing to the signal have been taken into account in the latter
calculation (the other half has been used as reference for the normalization) As one can
see in Fig 313 the experimental data strictly follow the counting statistics curves with
the respective number of detected photons It indicates that this normalization scheme
allows to reach the fundamental limit set by counting statistics in the experiment
Moreover this figure also provides the required acquisition time for a desired accuracy
for a given diffraction signal (number of detected photons per pulse) For example if
one intends to have an accuracy of 1 with 23 detected photons per pulse an
acquisition time of 150 seconds per data point is sufficient
3262 Direct normalization scheme with the ionization
chamber detector
As I have already pointed out in section 323 that the ICD allows the direct
measurement of the X-ray beam intensity behind the multilayer optic The signals
generated by the ionization chamber are proportional to the incident X-ray flux on the
sample Therefore they can be used as a reference to normalize the diffraction signals
on a pulse-to-pulse basis In order to account for the long term drift of the ICD signal
mentioned in section 323 a ldquofastrdquo scanning technique adapted from all-optical
experiments [199]
has been combined with this normalization scheme Fast scanning
means that the full delay range to be investigated in a particular experiment is
3 Improvement of the modular setup for time-resolved X-ray diffraction experiments
53
repetitively scanned in a relatively short time (during which drift effects are small) and
the data from all scans are summed up and averaged
In order to check the accuracy achievable with this scheme a series of similar test
measurements as above were performed using the ICD for normalization for different
levels of the diffraction signals (given again in number of detected photons per pulse)
This time the data were treated as a set of ldquofastrdquo scanning measurements by artificially
sorting them into a number of delay scans with a certain number of delay points and
pulses per delay before normalization As the result of this analysis Fig 314 shows the
obtained standard deviation as a function of the total measurement time for a single
delay at different levels of the diffraction signal (data points) and compares the
experimental data to calculated curves assuming again counting statistics as the limiting
source of error Again the experimental data agree well with the counting statistics
curves demonstrating that the fast scanning scheme can indeed correct the long term
drifts
Fig 314 Direct normalization scheme with the ldquofastrdquo scanning
technique Standard deviations as a function of integrated acquisition
time with different numbers of detected photons per pulse Point data
obtained from the experiment and solid curves are calculated from
counting statistics
3 Improvement of the modular setup for time-resolved X-ray diffraction experiments
54
3263 Comparison of normalization schemes
Finally the two normalization schemes discussed above will be compared in this
section for similar experimental conditions (ie same X-ray flux after the X-ray optic
same diffraction efficiency of the sample) For this comparison one needs to consider
that the ICD has a transmission of 72 Therefore using the direct normalization
scheme 28 of the incoming X-ray flux serves as reference signal and only 72 are
used for diffraction Since the number of detected photons in the ICD is large (a few
times 104) the error of the measurement with direct normalization is determined only by
the counting statistics of the diffraction signal (see previous section) The standard
deviation in this case isn)720(
1
tr where r is the repetition rate of laser t is the
total integration time in second and n is the number of detected photons per pulse On
the other hand when the chopping scheme is used for normalization the ICD can be
removed from the beam path and the full X-ray flux reaches the sample However as
already mentioned above only one half of the total signal contributes to the transient
diffraction signal while the other half is used for normalization Both transient
diffraction and normalization signals are limited by counting statistics which doubles
the error of the normalized signal Then the standard deviation in this case gives as
ntr )2
(
2 Combining this information one can show that for the same
experimental conditions (with same r t n) the direct normalization scheme (with fast
scanning) should give a factor of 17 better accuracy than the chopping scheme
3 Improvement of the modular setup for time-resolved X-ray diffraction experiments
55
Fig 315 Comparison of the chopping normalization scheme and the
direct normalization scheme (with ldquofastrdquo scanning processing) for
the same amount of incident photons from the X-ray optic (a) with 7
and 5 detected photons (b) with 23 and 15 detected photons and (c)
with 110 and 81 detected photons for the chopping and direct
normalization scheme respectively
Fig 315 compares the measured error (data points) as a function of accumulation
time for the two normalization schemes at different levels of the diffraction signal (the
signal level for direct normalization with the ICD is lower than for the chopping
scheme to account for the transmission losses of the ICD) The red and blue curves
3 Improvement of the modular setup for time-resolved X-ray diffraction experiments
56
show the calculated error based on counting statistics Not only do experimental and
calculated errors agree very well the data quantitatively confirm the advantage of the
direct normalization scheme discussed above
In conclusion the direct normalization scheme represents the most efficient way to
perform time-resolved diffraction measurements with the modular setup Depending on
the level of the diffraction signal an accuracy of better than percent for an individual
data point can be achieved with accumulation times of tens of seconds to a few
minutes
33 Summary
This chapter discussed a modular setup for time-resolved X-ray diffraction
experiments at the University of Duisburg-Essen All components of the previously
existing setup as well as the components that have been added to improve its
performance have been presented and characterized Due to its compact design the
setup is easy to operate and adjustments of components are convenient Applying the
results discussed in chapter 2 the X-ray production in the setup has been improved
using a controlled pre-pulse Using an avalanche photodiode as detector for the
diffraction signal it has been shown that the combination of direct normalization with
an ionization chamber as reference detector and the ldquofastrdquo delay scanning scheme
represents the most efficient way to achieve a high measurement accuracy The setup in
its current status has proved its capabilities through several preliminary experiments
and has been successfully used for the diffraction experiments that will be presented in
the following chapters
4 Observation of the Debye -Waller effect in Au
57
4 Observation of the Debye -Waller
effect in Au
Ultrafast x-ray diffraction is a relatively new technique that provides both high
temporal and atomic scale spatial resolution to directly observe the atomic motions and
changes in the atomic structure of matter upon optical excitation This chapter will
present a laser-pumpX-ray-probe experiment on a thin Au film the first time-resolved
experiment performed with the modular setup described in the previous chapter The
lattice vibrations that result from the electronic energy relaxation following optical
excitation have been directly observed through the DebyendashWaller effect The rise times
of the lattice temperature were measured for different absorbed laser fluences and
compared with the Two-Temperature Model (TTM) [200]
These experimental results are
consistent with previous data obtained by ultrafast X-ray diffraction [61]
as well as
ultrafast electron diffraction [201]
and prove the capability of the new built modular
setup
This chapter is organized as follows The first section is a brief description of the
Au sample used in these experiments In the second section the Debye ndashWaller effect
is discussed In the third section the time-resolved experiments are described and
experimental results are presented In the fourth section a comparison between the
experimental results and calculations based on the TTM model are discussed In the
final section a summary will be drawn
41 Au sample
Au a noble metal has been extensively studied with respect to its transient
properties and transient structure after femtosecond optical excitation [61 186 201-208]
In
4 Observation of the Debye -Waller effect in Au
58
particular the transient Debye ndash Waller effect has been recently used in ultrafast
electron diffraction experiments to study fast lattice heating after femtoseond laser-
excitation of thin polycrystalline Au films [201 206]
In the experiments described in this chapter an epitaxial Au film was used The
150 nm thick (111)-oriented Au samples had been grown on (001)-oriented high
quality Mica using a magnetron sputtering technique and were provided by the
company Phasis [209]
Relevant physical parameters of this sample are provided in
Appendix C3
To maximize the pump-induced changes of the diffraction signal due to the
Debye-Waller effect measurements were performed using the symmetric (333)-
reflection (see also next section) The corresponding Bragg angle (measured relative
to the surface) is 789deg for Cu Kα radiation Given the angle of 10deg between the
optical pump beam and the X-ray probe the angle of incidence (measured to the
surface normal) of the pump is 20deg The corresponding reflectivity of the sample at
800 nm is 97 The optical penetration depth is about 13 nm which is much smaller
than the film thickness [210]
Nevertheless fast ballistic electronic transport distributes
the deposited energy over the whole film thickness within a few hundred
femtoseconds [211-213]
Therefore the sample can be considered as being
homogeneously excited on the time scale of a picosecond
42 Debye ndashWaller effect
Debye [214]
and Waller [215]
found that by heating the lattice the intensity of
Bragg-reflections decreases whereas their angular profiles (rocking curves) remain
unchanged This decrease is described by the Debye-Waller factor DW(T)
)3
1exp()( 22
0
hklT Gr
I
ITDW
(41)
where IT is the integrated intensity of a particular Bragg-reflection with Miller
indices (hkl) (determined by the reciprocal lattice vector Ghkl) at temperature T I0 is
4 Observation of the Debye -Waller effect in Au
59
the integrated intensity in the case of the perfectly ordered and lsquofrozen latticersquo and
2r
is the mean square atomic displacement [216]
By calculating 2r
within the Debye theory for the specific heat [217]
and
taking into account Braggs law )sin(2 Bhkld the Debye-Waller factor can be
represented as [218]
22
2
2
16exp)(
hkl
D
DB dTmk
ThTDW (42)
where h is Plankrsquos constant T is the temperature of material m is the mass of
the atom Bk is the Boltzmanrsquos constant D is the Debye temperature of the material
T
D is the Debye function and hkld is the corresponding lattice constant Eq 42
indicates that the Debye-Waller effect becomes stronger with a smallerhkld ie larger
changes in the diffracted signal are expected for higher diffraction orders (hkl)
Fig 41 Calculated Debye-Waller factor for Au
According to Eq 42 the Debye-Waller factor for the (111) (222) and (333)
Bragg diffraction of Au are calculated as a function of temperature and presented in
Fig 41 (normalized to the corresponding value at 295 K) Since the changes of the
4 Observation of the Debye -Waller effect in Au
60
integrated signal are more pronounced for higher orders the (333)-reflection has been
used in following experiments as mentioned above
43 Time-resolved X-ray diffraction experiments on Au
431 Bragg diffraction of Au
Before performing the time-resolved experiments for studying the Debye ndash
Waller effect in Au several preparation experiments were carried out using an area
detector (ldquoGemstarrdquo camera see Appendix B) to pre-characterize the structural
response of the sample upon ultrafast optical excitation
Fig42 shows as one result the variation of the total diffraction signal with the
angle of incidence of the X-ray beam for the Au (333)-reflection In principle such
angular dependencies represent the convolution of three contributions namely (a) the
sample rocking curve (b) the angular intensity distribution of the focused X-ray beam
and (c) the source spectrum As a consequence the angular dependence shown in Fig
42 exhibits a two-peak structure which can be attributed to the Kα1- and Kα2-lines of
Cu which are both reflected by the mirror Each individual peak exhibits a FWHM of
about 07deg This is significantly more than the expected width of about 026deg due to
the combined effects of the spectral width (FWHM) of the two emission lines (approx
013deg) [219]
the angular FWHM of the focused X-rays (017deg FWHM) [Appendix A]
and
the expected FWHM of the rocking curve of a 150 nm film (014deg) [220]
The
broadened diffraction curve is attributed to the mosaic structure of the Au-film [221]
)
The following experiments are performed at a sample angle of 7895deg corresponding
to the maximum detected diffraction signal
4 Observation of the Debye -Waller effect in Au
61
Fig 42 The diffraction signal as a function of sample angle for the
Au (333)-reflection without excitation
However upon excitation of the sample not only the intensity of a particular
Bragg-reflection can change (eg due to the Debye-Waller effect) but also its angular
position (and shape) due to laser induced strain With respect to the latter one it has to
be stressed that the angular FWHM of the incident X-ray beam covers only a part of
the total width of the diffraction curve Therefore for a fixed sample angle changes
of the diffraction signal might be caused by both real intensity changes as well as a
peak shift due to the fact that strain if sufficiently large can shift the diffraction
curve out of the narrow angular range of the incident X-ray beam In order to
(preliminary) clarify the effect of strain time-resolved measurements have been
performed for different fluences both at fixed sample angle as a function of pump-
probe time-delay and as a function of sample angle for a fixed time-delay
Fig 43 shows the shift of the diffraction peak (center of gravity of the
distribution of diffracted X-rays measured on the area detector mentioned above) for a
(low) absorbed pump fluence of 15 mJcm2 (black open squares the red dots show
reference data measured in the course of the experiment without laser pumping) As it
is evident the Bragg-peak starts to shift shortly after excitation towards smaller
diffraction angles indicating lattice expansion The maximum shiftexpansion is
4 Observation of the Debye -Waller effect in Au
62
reached after about 45 ps Subsequently the Bragg-peak shifts back to larger
diffraction angles indicating recompression of the material Before discussing this
behavior it should be noted that this measurement could be performed with a fixed
sample angle using an area detector because of the low absorbed fluence with which
the shift of the Bragg-peak is smaller than the angular range of the incident X-ray
beam
Fig 43 Centers of gravity of the Au (333) rocking curves measured
with the Gemstar camera Red circles correspond to data obtained on
the non-excited sample the black squares represent data from the
excited sample
The observed behavior in particular the oscillatory time-dependence of the
Bragg-peak shift is in line with the generation and propagation of acoustic waves
launched by an almost instantaneous increase of pressure after optical
excitation [222 223]
In this interpretation the observed period of 45 ps should
correspond to the time ac that a longitudinal acoustic wave with speed cs needs to
travel through a film with thickness d sac cd With the known speed of sound of
cs = 339 kms [224]
in Au along the (111)-direction and using the nominal film
thickness of (150 5) nm I obtain ac = (44 15) ps which is in agreement with the
experimentally found value Very similar results have been recently reported by
4 Observation of the Debye -Waller effect in Au
63
Nicoul et al on a similar Au-sample of smaller thickness (d = 90 nm) [61]
The close
correspondence in the time-evolution of the Bragg-peak shift in particular its
ldquotriangularrdquo shape give clear indication that also the 150 nm film is homogeneously
(as expected ndash see above) and almost instantaneously pressurized over its whole
thickness
Fig 44 The diffraction signal as a function of sample angle for the
Au (333)-reflection at a delay of 45 ps (maximum shift) measured
with APD The points are measured data and the solid curves
represent Gaussian fits
Fig 44 shows the diffraction signal measured with the APD at a delay of 45 ps
(maximum shift) as a function of sample angle for different pump fluences the solid
curves represent Gaussian fits to the measured data The APD has a sufficient large
detecting area allowing to perform this measurement without moving its position As
expected the shift of the Bragg peak increases with pump fluence The peak positions
were obtained from the fitting function and are shown as function of absorbed fluence
The ldquotriangularrdquo shape of the time-trace indicates that the changes of the average interspacing
distance inside the sample can be assumed to be linear with time It is expected for the time-
independent pressurestress (the strain waves exhibit a rectangular shape) which results from
instantaneously and homogeneously heating of a sample Detailed interpretations can be found in Ref
[140 186]
4 Observation of the Debye -Waller effect in Au
64
in Fig 45 As it can be seen in Fig 45 the maximum shift of the Bragg-peak caused
by laser induced strain scales linear with the absorbed fluence Such behavior was
also observed in other X-ray diffraction experiments [140 186 225]
Fig 45 Angular shift of Bragg peak as function of absorbed fluence
The green dashed lines are linear fits for the data points
In summary the experiments above show that the strain caused by laser-
excitation result in a linear shift of the Bragg-peak both with time (for the first 45 ps)
and fluence
432 Observation of Debye ndashWaller effect on Au
In order to obtain the temporal evolution of the Debye ndashWaller effect without
being affected by the laser induced angular shifts of the Bragg peak an angular
compensation procedure is applied during the measurements This method is based on
the results shown in Figs 43 and 45 namely the linear increase of the Bragg-peak
shift with time and fluence This allows to properly adjust the sample angle both as a
function of pump-probe time delay as well as fluence to stay always at the angular
position of the maximum of the diffraction signal
4 Observation of the Debye -Waller effect in Au
65
Fig 46 Time-resolved measurements with and without the angular
compensation procedure The black curve is an exponential fit for
the data with compensation the red curve is a guide to eye for the
data without compensation
To illustrate the effect of this compensation Fig 46 shows the results of time-
resolved measurements with and without angular compensation at a fluence of
35 mJcm2 (absorbed) Without the compensation the detected diffraction signal
represents the combined effects of the strain-induced angular shift of the Bragg peak
and the DebyendashWaller effect As it can be seen in this case the detected diffraction
signal drops and rebounds at 45 ps essentially resembling the temporal behavior of
the angular shift of the Bragg peak after excitation (see Fig 43) However with the
compensation method the Debye-Waller effect can be isolated In this case the
measured (normalized) diffraction signal shows a much faster exponential drop with a
time constant of about 43 ps
Additional measurements were performed at lower pump fluences applying this
angular compensation The results are presented in Fig 47 In all cases the
experimental data were fitted with an exponential function and the fitting curves are
depicted as solid lines in the figure Most obvious and not unexpected the decrease of
the overall change of the diffraction signal increases with fluence due to the larger
4 Observation of the Debye -Waller effect in Au
66
temperature increase achieved at higher fluences The temporal evolution of the
diffraction intensities directly maps out the excitation of lattice vibrations (increase of
2r
) during heating After approximately 20 ps all diffraction signals reach their
asymptotic values which can be considered as the sign of reaching the new thermal
equilibrium state in the lattice system
Applying eq 42 the measured asymptotic drop of the diffraction signal as
obtained from the exponential fitting can be converted into a temperature increase
The results are plotted as blue squares in Fig 48 (a) The experimentally determined
temperature increases are compared to the temperature increase estimated from the
deposited laser energy and the specific heat of the material (red circles) Both data
sets agree within their error bars thus confirming that lattice heating and the Debye-
Waller effect is responsible for the observed decrease in diffraction intensity
The time constant of the exponential fit represents how fast the lattice is heated
and the new thermal equilibrium state is reached The time constant is plotted in Fig
48(b) as a function of absorbed laser fluence (bottom axis) and lattice temperature
(top axis) For comparison two data points from previously published experiments
[61 201] have been added Since the absolute fluence values are often difficult to
compare in independent experiments the absorbed fluence value is not used for this
comparison but the observed temperature increase (top axis) My measurements agree
within the error bars with the previously published data
4 Observation of the Debye -Waller effect in Au
67
Fig 47 Diffraction signal as a function of delay time for different
absorbed fluences (obtained with the angular compensation
procedure) The solid curves are exponential fits of the measured
data
(a) (b)
Fig 48 (a) Asymptotic temperature after laser-excitation as a
function of absorbed fluence Blue squares Values determined by
using eq 42 and the experimentally observed asymptotic drop of the
diffraction signal (top axis) Red circles Estimated temperatures
from the deposited optical energy (b) Decay time constant as a
function of absorbed fluence (bottom axis) and lattice temperature
(top axis) The black square points are obtained from the exponential
fits of the measured data in Fig 47 The red circle and the blue
diamond are taken from Ref [201] and [61] respectively
4 Observation of the Debye -Waller effect in Au
68
The data in Fig 48(b) seem to show a tendency that the decay constant
decreases with increasing fluence However due to the large errors of the derived
decay time constants at low fluences this effect will not be discussed further The only
remark to be made here is that the frequently used TTM (see below) does predict the
opposite
44 Comparison with the Two ndash Temperature Model (TTM)
and discussion
Upon the laser excitation the laser energy is first absorbed by free electrons and
then exchanges between electrons and the lattice through electron-phonon collisions
The evolutions of the electron and lattice temperature are determined by the electron-
phonon coupling constant [226]
In order to understand this process of above
experimental results in this section I compare the experimental results with the
theoretical prediction of the two-temperature model (TTM) [200]
which is a simple and
frequently used model to describe the electron-phonon energy relaxation
The TTM is based on the assumption that the electronic and lattice system can be
described by two different time-dependent temperatures Te and Tl The rate of energy
exchange between these two subsystems depends linearly on the temperature
difference and is given by
)( le
e
e
l
l TTt
TC
t
TC
(43)
where Ce and Cl are the specific heats of electrons and phonons (in principle
temperature dependent) respectively The energy exchange rate parameter α is related
to the electron-phonon coupling constant Solving the differential equation 43
numerically by using the coupling constants determined from all-optical
measurements [227]
not only the electron dynamics but also the evolution of the
lattice temperature can be predicted
In order to solve this differential equation the initial temperature of the
electronic system is calculated by using the experimentally determined asymptotic
4 Observation of the Debye -Waller effect in Au
69
lattice temperature Tasy According to the law of energy conservation and assuming no
energy losses the total initial energy in electronic system soon after laser excitation
and in lattice system at initial room temperature is equal to the total energy of
electronic and lattice system at asymptotic lattice temperature One obtains
asylasyeRleee TCTCTCTTC ))(()( 00 (44)
and
eeee TATC )( (45)
where Ae and TR are coefficient of electronic heat capacity and the room
temperature respectively Then the corresponding initial electron temperature 0eT can
be expressed as
))(2
( 2
0 asyRasy
e
le TTT
A
CT (46)
Using the deduced parameters and the material constants summarized in table 41
equation 43 was numerically solved and the results of temporal evolution of lattice
temperature are shown in Fig 49 (red dashed curves) together with the measured data
for the further discussions
Ae[Jm3K
2] Cl [MJm
3K] α [10
16Wm
3K]
676 245 21
TR [K] Tasy[K] Te0[K]
295
335 17363
365 22831
390 26544
Table 41 The material constants of Au and parameters used in the
TTM calculations [228]
4 Observation of the Debye -Waller effect in Au
70
Fig 49 Temporal evolution of the detected X-ray signal (data points
left axis) with exponential fits (black solid curves left axis) and the
results of the numerical solutions of the TTM for the
maximumasymptotic lattice temperature at (a) 335K (b) 365K and
(c) 390K (red dashed curves right axis)
4 Observation of the Debye -Waller effect in Au
71
Fig 49 shows again the temporal evolution of the relative changes of the X-ray
diffraction signal (data points note the flipped signal axis to the left) together with the
exponential fitting (black solid curve) The right axis displays the corresponding
lattice temperature obtained from the DWF The experimental data are compared to
calculated time dependencies (red dashed curves) of the lattice temperature obtained
from the TTM-calculations for maximumasymptotic lattice temperatures Tasy of (a)
335K (b) 365K and (c) 390K It is evident from this comparison that the TTM with
ldquostandardrdquo parameters (table 41) provides a good description of the experimental data
only for the highest fluence For the lower fluences the TTM predicts a faster energy
relaxationlattice heating than observed in the experiment Although B Rethfeld [229]
has predicted such a delayed energy exchange which deviates from the TTM for weak
excitation the effect will not be discussed further here because of the large error of
the experimentally determined time constant for the lower fluences At least for the
highest fluence the TTM provides a reasonable description of the experimental data
which are moreover in good agreement with previously published results [61 201]
45 Summary and conclusion
As the first time-revolved experiment performed with the improved modular
setup the observation of the Debye -Waller effect in Au and its good agreement with
both previous experimental results [61 201]
as well as the TTM at high fluences
demonstrates that it is well suited to perform time-resolved diffraction experiments
with good accuracy However this experiment also reveals a major limitation of the
setup Due to the narrow convergence angle of the incident X-ray beam an angular
compensation technique as discussed above needs to be applied to eliminate strain
effects As a consequence a pre-characterization of the response of a particular sample
is necessary This made the experiment quite time consuming and might have
introduced additional error sources The modular setup is therefore most suitable for
measurements where the position andor shape of the Bragg-peak does not change
4 Observation of the Debye -Waller effect in Au
72
upon laser-excitation (at least for a certain range of fluences andor pump-probe time
delays) As will be discussed in chapter 5 this is the case for laser-excited Bi where
the Bragg-peak does not start to shift for almost 5 ps after laser excitation
5 Extreme phonon softening in laser-excited Bi
73
5 Extreme phonon softening in laser-
excited Bi
Bi is a group-V (Nitrogen group) element which contains 5 electrons in its outer
shell It is stabilized at equilibrium into the A7 structure a rhombohedral structure
with two atoms per unit cell The pairing of these two atoms is attributed to the so-
called PeierlsndashJones mechanism [230]
This mechanism states that in order to arrange
the lattice system in the minimum energy configuration every second atom along the
body diagonal of the Bi unit cell ((111) direction) moves closer to one neighbor and
further away from the other leading to the pairing of atoms along the body diagonal
and doubling of the lattice constant As a consequence of this distortion a small band
gap is introduced at the Fermi level lowering the total energy of the occupied
electronic states and hence lowering the total energy of the system This opened band
gap is responsible for Bi being a semimetal A more detail description of the structure
of Bi will be presented in Section 51
Due to the unique properties of the broken symmetry ground state of the crystal
the equilibrium structure of Bi is sensitive to external perturbations ie changes of
pressure and temperature or electronic excitation [231- 234]
Among these perturbations
the ultrafast electronic excitation with ultrashort laser pulses is particularly unique
since the laser induced non-equilibrium states which depend on the excitation level
can be precisely controlled by adjusting the pump laser fluence and thus it can
provide unique non-equilibrium states of matter for the investigation of the transient
dynamics Following ultrafast laser excitation the valence electrons are promoted to
the conduction band The interatomic potential which defines the position of the
atoms in the unit cell is altered by the optically induced redistribution of electrons and
5 Extreme phonon softening in laser-excited Bi
74
the potential minima shift If this alteration occurs fast in comparison with the time
scale of atomic motion it triggers a coherent atomic motion around the new
equilibrium position along the body diagonal resulting in the modulation of the
equilibrium distance of the two paired atoms towards the phase of the higher
symmetry This coherent atomic motion represents the A1g optical phonon mode of
the crystal The generation mechanism has been named displacive excitation of
coherent phonons (DECP) [231 232]
which can be also considered as a special case of
impulsive stimulated Raman scattering for absorbing materials [235 236]
Within the framework of the DECP mechanism it has been predicted by
theory [237]
that the broken symmetry ground state of Bi (the Peierls distortion) can be
reversed with high enough density excitation This structural transformation is
accompanied by the change of the electronic properties The opened band gap at
Fermi level should close and Bi transforms from a semi-metal to a metal on the sub-
picosecond range The study of this phase transition process can provide important
information not only for the understanding of non-equilibrium structural dynamics in
Peierls distorted systems but also for designing future ultrafast electronic devices So
far it is not clear whether this phase transition can be achieved without subsequent
disorderingmelting of the Bi sample for an initial room temperature lattice Moreover
there is no experimental evidence yet that the structural phase transition to the high
symmetry state can be realized This experimental challenge has been addressed in
my PhD work
In this chapter the evolutions of laser-excited coherent optical phonons in Bi
have been investigated by directly monitoring the atomic motion using time-resolved
X-ray diffraction The observed extreme softening of the A1g phonon mode indicates
transient disappearance of the Peierls distortion This chapter is organized as follows
Section 51 provides a brief introduction of Bi Section 52 presents the experiment
results and discussion Section 53 summaries the main results of this chapter
5 Extreme phonon softening in laser-excited Bi
75
51 Research background
511 Structure of Bi and the phonons
The crystalline form of Bi is the di-atomic basis rhombohedral A7 structure [238]
which is derived from a simple cubic structure in two steps First a simple cubic
lattice is stretched along one of the body diagonals creating a smaller shear angle than
the cubic value of 60deg Then a Peierls instability [230]
causes the atoms to be displaced
along the same diagonal in opposite directions leading to a reduction of the structural
symmetry and a doubling of the lattice constant Fig 51 illustrates the primitive unit
cell of Bi The first atom is placed at the node of the primitive unit cell and the second
atom lies along the body diagonal with a slight displacement from the center of the
unit cell The length of the body diagonal is defined as d then the corresponding
distance for the second atom is xbulld At room temperature the lattice parameters are
a = b = c = 455 Aring body diagonal d = 1186 Aring and x = 0468 ie the distance of the
pair of atoms is xbulld = 55505 Aring
Fig 51 Primitive unit cell of Bi and the motion directions of the A1g
and Eg phonon mode
5 Extreme phonon softening in laser-excited Bi
76
Fig 52 Potential energy surface in Bi as a function of percentage of
electrons excited into the conduction band n and normalized atomic
distance x Picture reproduced from Ref [237]
Upon the external perturbations the motion of the two atoms against each other
along the body diagonal corresponds to the A1g-optical phonon mode The motion of
the atoms in the plane perpendicular to the body diagonal corresponds to the two
(degenerate) Eg-optical phonon modes (Fig 51) The work presented in this chapter
has focused on studying the laser excited A1g-optical phonon that can be characterized
by the changes of the normalized atomic distance x along the body diagonal Murray
et al have used density functional theory (DFT) to compute the potential energy
surface (PES) along x for different levels of electronic excitation [237]
Fig 52 (taken
from Ref [237]) displays the potential energy as a function of the percentage of
carriers excited into the conduction band and the normalized atomic distance x To
interpret the experimental results this PES will be frequently referred to in the
remaining sections of this chapter
512 Previous works
Bi has been studied by methods of ultrafast optics for over two decades The
coherent optical phonons launched in Bi after femtosecond laser excitation were first
5 Extreme phonon softening in laser-excited Bi
77
observed by Cheng et al [239]
in time-resolved reflectivity measurement By
monitoring the oscillations in the optical reflectivity the A1g phonon motion was
detected and its frequency compared to the results obtained by spontaneous Raman
scattering and inelastic neutron scattering [240]
Owing to the high temporal resolution
and high accuracy optical techniques are powerful to retrieve quantitative
information about the frequency of the excited phonon and its decay dynamics The
subsequent experiments explored coherent phonon dynamics by studying the phonon
frequency [231 232]
the electron-phonon energy coupling [241 242]
the temperature
dependence [236 243 244]
and the excitation level dependence [237 244-249]
The Eg mode
was also observed with optical techniques [236 244 249 250]
However optical techniques measure the modulation of the dielectric constant
Therefore they can provide only indirect information about the magnitude of the
atomic motion in the excited sample Providing direct information about the atomic
motion in laser-excited Bi ultrafast time-resolved X-ray diffraction [7-9 17 18 39-41 67-69
73 251 252] and electron diffraction
[12 13 81 253 254] have been recently applied Two
time-resolved X-ray diffraction experiments which are closely connected to the study
presented in this thesis will be described in detail in the following part
When a thin film sample with a thickness much smaller than the extinction
length [255 256]
is investigated with X-ray diffraction the secondary scattering of the
Bragg reflected beam can be neglected This treatment is known as the kinematic
approximation Thus the intensity of a particular Bragg reflection (hkl) of Bi is
determined by the squared modulus of the geometrical structure factor
22cos2 xlkhfFI Bihklhkl (51)
where h k and l are the Miller indices f Bi is the atomic scattering factor for Bi x
is normalized atomic distance which becomes time-dependent after laser excitation
If the Debye-Waller factor is assumed to be constant a direct indication of the atomic
displacement along the trigonal direction inside the unit cell after laser excitation can
be presented by the changes in the normalized diffraction signal for the (111) and
(222) reflections as
5 Extreme phonon softening in laser-excited Bi
78
)0(3cos
)(3cos
)0(
)(2
2
xn
txn
I
tI
nnn
nnn
n=1 for (111) n=2 for (222) reflection (52)
Figure 53 shows the normalized X-ray diffraction efficiency of the (111) and
(222) Bragg-peaks of Bi as a function of x The diffraction intensity is normalized to
the value of x = 0468 (actual equilibrium value in the unperturbed crystals) and
plotted as a function of x In the high-symmetry non-Peierls distorted state where
x = 05 (2nd
atom in the centre) diffraction from (111) planes is forbidden whereas
(222) diffraction becomes the minimal diffraction order and reaches a maximum
value Impulsive electronic excitation suddenly displaces the minimum of the PES
closer to x = 05 and the atoms are set in motion towards the new equilibrium position
As a consequence of this motion the changes in the X-ray diffraction signal are
expected to evolve in opposite directions An increase for the (222)-reflection and a
decrease for the (111)-reflection Following these initial changes the oscillatory
atomic motion around the new equilibrium position should give rise to oscillations of
both the (222)- and the (111)- diffraction signal with a frequency corresponding to
the A1g optical phonon mode
Fig 53 Normalized intensity of Bragg peak (111) and (222) versus
atomic displacement expressed in the relative position along the
body diagonal
5 Extreme phonon softening in laser-excited Bi
79
The first time resolved experiment where X-ray diffraction had been applied to
directly follow the atomic motion associated with the laser-excited coherent phonon
in Bi was performed by Sokolowski-Tinten et al [68 251]
In this work the evolutions
of two Bragg-reflections of a laser-excited 50 nm Bi thin film were measured (Fig
54) The frequency of the A1g mode was found to be only 212 THz substantially
smaller than the frequency of 292 THz measured in non-excited Bi (ie by Raman-
spectroscopy) The large displacements as well as the strong softening indicated
substantial changes of the interatomic potential which had not been observed before in
all-optical experiments
(a) (b)
Fig 54 X-ray diffraction efficiency of the (a) (111) and (b) (222)
reflections as a function of time delay between the optical pump
pulse and X-ray probe pulse Coherent phonon oscillations with
oscillation frequencies of 212 THz were observed Pictures
reproduced from Ref [68]
However due to the limited signal-to-noise ratio that was available with the laser
plasma-based source at that time this successful work was only achieved at a
relatively high excitation fluence A systematic investigation of the frequency and
amplitude dependence of the A1g phonon towards weaker excitation was required to
fill the gap to the all-optical work carried out with lower excitation fluences
Due to a significantly higher X-ray flux the Sub-Picosecond Pulse Source
(SPPS) [257]
at Stanford appeared to be the ideal X-ray source to perform this
experiment The softening of the A1g phonon mode as a function of excitation density
5 Extreme phonon softening in laser-excited Bi
80
and the detailed mapping of the carrier density-dependent PES were quantitatively
characterized for the first time by the work performed at the SPPS [69 186]
In this
work the optical phonon modes in Bi had been investigated at different absorbed
laser fluences up to 23 mJcm2 Fig 55 (a) shows four time traces for different
excitation fluences The optical phonon frequency as a function of the normalized
equilibrium atomic distance x is displayed in the inset of Fig 55 (a) A softening of
the A1g phonon frequency was found (from 291 THz down to 23 THz) with
increasing x These data provide direct information about the laser-induced changes of
the PES namely the position of potential minimum as well as its curvature In Fig
55 (b) a comparison between these measured data and theoretical calculations based
on DFT [237]
is presented A good agreement between the experiment and the DFT-
results is found
(a) (b)
Fig 55 (a) Bi (111) X-ray diffraction efficiency as a function of
time delay for different absorbed fluences 07 (green) 12 (orange)
17 (blue) and 23 mJcm2 (gray) The observed A1g optical phonon
frequencies are displayed in the inset as a function of x the new
normalized (quasi-)equilibrium atomic distance along the body
diagonal of the unit cell The dotted curve represents A1g
frequencies predicted from DFT calculations [237]
(b) Normalized
quasi-equilibrium atomic distance x as a function of carrier density n
with the overlaid excited state PES (false color) The white dotted
line represents the equilibrium atomic distance obtained with DFT
The red points are the measured data at the SPPS The Bi unit cell is
depicted in the top right The ratio of yellow bar to red bar
determines x Pictures reproduced from Ref [69]
5 Extreme phonon softening in laser-excited Bi
81
These results bridged the gap between the existing work on low and high
fluence However another interesting question has been raised here Could the system
when excited with higher fluence be really driven back to the high symmetry state
(x = 05) and could the Peierls distortion be reversed To answer this question I have
extended the studies of coherent optical phonons in Bi to a higher excitation fluence
regime that has not been studied previously By using the modular setup [chapter 3]
time-resolved X-ray diffraction experiments were performed A complete softening of
the excited A1g mode is observed in the high level excitation data This represents
conclusive experimental evidence that the Peierls distortion which defines the
equilibrium structure of Bi is transiently reversed
52 Experiments and discussion
521 Method
The measurements were performed using the modular setup which was already
introduced in chapter 3 (Fig 31) X-ray pulses at a photon energy of 805 keV
(wavelength 154Aring) were used The (111)- oriented crystalline Bi sample (50 nm film
on Silicon same type of sample which was used in the previous experiments [68 69]
More details on relevant parameters of the Bi sample used in this work are provided
in Appendix C) is placed under the appropriate Bragg-angle 1124deg for (111)-
reflection and 2294deg for (222)-reflection To launch the A1g optical phonon mode
through displacive excitation the sample was optically excited by near-infrared (800
nm) femtosecond laser pulses with (absorbed) fluences from 1 mJcm2 to 42 mJcm
2
It should be noted that for absorbed fluences above 25 mJcm2 the sample suffered
damage after excitation with many pulses The damage could be detected by
monitoring (with a CCD-camera) the scattered fraction of the incident pump light
which increased significantly upon damage From the fact that the increase of pump
light scattering occurred long before permanent changes in the X-ray diffraction
5 Extreme phonon softening in laser-excited Bi
82
signals could be observed it can be concluded that multi-pulse damage occurs initially
only at the very surface of the sample Still when this increase in scattering was
observed the sample was shifted to a fresh spot The atomic motion was probed by
measuring the diffraction of the X-ray probe pulses after a controlled time delay with
respect to the pump laser pulses In order to maximize the accuracy of the experiment
and to observe small changes in the diffraction signals the direct normalization
scheme with ldquofastrdquo scanning (see chapter 3) had been applied in the measurements
The diffraction signals of the (111)- and (222)-reflection are recorded with the silicon
avalanche photodiode and the signal from the ionization chamber detector is used for
normalization The typical time required to measure a complete time-dependence
(approx 180 delay points) of one diffraction order for one fluence with an accuracy of
approximately 1 was around 6 hours Comparing to the 12 hours per measurement
using the Ti Kα source reported by Sokolowski-Tinten et al [68]
(accuracy approx
2) this represents a significant improvement
522 Preliminary measurements
Before performing the time-resolved experiments for studying laser-excited
coherent optical phonons in Bi two preliminary experiments were carried out to
characterize the structural response of the sample upon ultrafast optical excitation
Fig 56 shows the diffraction signal of the Bi (111)-reflection and the (substrate)
Si (111)-reflection as a function of sample angle The lattice mismatch provides
sufficient angular separation of the diffraction signal from the Bi film and the
diffraction signal from the Si substrate As expected the diffraction signal of the bulk
Si-substrate is significantly stronger (approx 20times) than the diffraction from the thin
Bi-film Another important information obtained from this measurement is that the
angular width of the Bi diffraction curve (03deg FWHM) is larger than the angular
width of the incident X-ray beam (017deg FWHM) As it had been discussed in the
previous chapters in this case the experiments will be performed at a fixed sample
angle corresponding to the maximum detected diffraction signal
5 Extreme phonon softening in laser-excited Bi
83
Fig 56 The diffraction signal of Bi (111)-reflection and (substrate)
Si (111)-reflection as a function of sample angle Both signals are
normalized to the maximal value of Bi (111) signal
A preliminary time revolved measurement was performed on the (111)-reflection
with an area detector (ldquoGemstarrdquo camera) This measurement allowed to
approximately determine time delay zero and provided some information on the
temporal evolution of signal intensity and in particular on the changes of the angular
position of the diffraction peak upon laser excitation The incident pump fluence in
this measurement was about 5 mJcm2 The measured results are displayed in Fig 57
Despite the low accuracy of this measurement three different stages in the temporal
evolution of the diffraction intensity can be recognized Immediately after the photo-
excitation a rapid decrease in the diffraction efficiency is observed followed by a
partial recovery of the diffraction signal during the next 5 ps After that the diffraction
intensity starts to decrease again on a 10 ps time-scale On the other hand the angular
position of the (111)-diffraction peak starts to change only after 5 - 7 ps The shift to
smaller diffraction angles indicates lattice expansion
5 Extreme phonon softening in laser-excited Bi
84
In consequence the initial decrease of the diffraction signal and the 5 ps
recovery are attributed to changes of the structure factor and thus changes of the
normalized atomic distance x upon electronic excitation and subsequent relaxation
However the expected signal oscillations could not be resolved due to the limited
accuracy and the coarse delay spacing Moreover it is important to note that
measurements on Bi can be performed within a time window of about 5 ps without a
correction of the angle of incidence of the X-ray beam as it was necessary for the case
of Au (compare discussion in chapter 4) The following detailed investigation of the
coherent optical phonon concentrates therefore on this time window of about 5 ps
after excitation (marked with the blue dashed-dotted line in Fig 57) where the
changes of the signal intensity caused by the shift of the Bragg peak are negligible
Fig 57 Time revolved measurement with the Gemstar camera The
left axis shows the position of the center of gravity of the Bi (111)
rocking curve The right axis showed the integrated intensity of the
diffracted signal
5 Extreme phonon softening in laser-excited Bi
85
523 Results of time resolved measurements and discussion
Before presenting the experimental results and discussion it should be noted that
the effective energy deposition depth of 800nm fs laser pulses is approximately
26 nm [73]
This means that initially only half of the sample thickness (50 nm) is
excited The spatially inhomogeneous excitation of the sample needs to be taken into
account in the following discussion
Fig 58 shows representative examples of time-traces of the normalized
diffraction efficiency of the (111)- (a) and the (222)- reflection (b) for different pump
laser fluences Since the absolute time-zero in these experiments is only known to an
accuracy of about +- 150 fs the zero-delay point is arbitrarily set for each curve at
the half maximum of the initial transient change A typical error bar of the measured
data is given at the end of each curve While the (111)-reflection exhibits a fluence
dependent initial drop followed by oscillations and a slow recovery the (222)-
reflection initially increases in diffraction efficiency followed also by oscillations and
a slow recovery This behavior is similar to the results reported in the previous
studies [68 69]
and can be readily interpreted by considering the changes of the
geometrical structure factor (see Fig 53) within the DECP-picture The initial
transient change is ascribed to photon-induced alteration of the minimum position of
the PES that leads to a atomic motion towards a symmetric arrangement (x = 05) The
following oscillations correspond to the A1g coherent optical phonon mode of the
lattice and the recovery of the diffraction efficiency is attributed to restoration of the
PES to its equilibrium state
5 Extreme phonon softening in laser-excited Bi
86
Fig 58 X-ray diffraction efficiency (a) (111)-reflection and (b)
(222)-reflection of a 50 nm (111)-oriented Bi-film as a function of
pump-probe time delay for different excitation fluences The zero-
delay point is set at the half maximum of the initial transient change
A typical error bar of the measured data is given at the end of each
curve
It should be noted that Fig 53 only takes into account changes of x Upon laser-
excitation other effects become important as well For example the Debye-Waller
5 Extreme phonon softening in laser-excited Bi
87
effect caused by an increase of the lattice temperature (incoherent phonons) also
affects the X-ray diffraction efficiency (see Chapter 4) Although the Debye-Waller
effect can be neglected for the first few hundred femtoseconds after laser excitation
since the energy exchange between the initially excited hot electrons and the lattice
system occurs typically on a time-scale of a few ps it should be considered in the
later recovery processes For the (111)-reflection the change in the Debye-Waller
factor is calculated to be a few percent from room temperature up to the melting
temperature [186]
Relative to the signal changes associated with the induced changes
in x the drop in the signal induced by the Debye-Waller effect is negligible On the
other hand for the (222)-reflection the change in the Debye-Waller factor is 4 times
larger for the same temperature increase and comparable to the effects caused by
changes in x The decrease of the mean value of the normalized (222) diffraction
signal to values below that of the unexcited sample is tentatively attributed to the
combination of the restoration of the PES and the DebyendashWaller effect
In the following section the magnitude of the initial change of the diffraction
efficiency and the frequency of the following oscillatory part are retrieved from the
measured time traces and will be discussed in detail
The initial maximum diffraction efficiency changes ΔI111 and ΔI222 as a function
of laser pump fluence (red (111)-refl black (222)-refl) are shown in Fig 59 Data
obtained at the SPPS (green) [69]
are also plotted in the figure for comparison and they
are consistent with the new results The linear fits of the data points reveal that the
initial changes of both reflections are linearly dependent on absorbed fluence From
the comparison of the ratio of ΔI111ΔI222 = - (28 plusmn 02) obtained from the fitting
slopes and the value of -235 as estimated from the change of the geometrical
structure factor upon the increase of the Bi-Bi distance x a rough agreement of both
values is found and this clearly demonstrates that the coherent motion of atoms is the
leading contribution which influences the initial changes of the diffraction efficiencies
The initial atomic motion is proved to be mainly coherent
5 Extreme phonon softening in laser-excited Bi
88
Fig 59 Initial maximum changes of the diffraction efficiencies for
the (111)-reflection (red) and the (222)-reflection (black)
respectively as a function of pump laser fluence The red and black
dashed lines are the linear fits for the measured data The data
obtained at the SPPS (green) [69]
is also plotted in the figure for
comparison
To determine the frequencies from the oscillatory part of the measured
diffraction efficiencies a Fast Fourier Transform (FFT) had been applied to all
measured time traces including others not shown in Fig 58 The slow background
components (initial changes and the slow recovery) are subtracted from the time-
traces before transformation As an example Fig 510 shows as red solid curve one of
those FFT results obtained from a time trace of the (222)-reflection measured at
23 mJcm2
absorbed fluence The FFT is characterized by one main peak at 24 THz
and a number of secondary peaks Due to the limited number of phonon periods
covered in this measurements as well as the small amplitude of the oscillations a
relatively low signal to noise ratio in this Fourier transform analysis is expected
Therefore only the frequency with the highest amplitude representing the main
contribution of the atomic motion is considered as reliable Since the understanding
5 Extreme phonon softening in laser-excited Bi
89
of the other observable frequency components is still an open question they will not
be discussed further in this thesis
Fig 510 FFT-spectra of the time traces of Bi 222-reflection with
23 mJcm2
absorbed fluence The solid curve and the dotted curves
(6 examples) represent the FFT results obtained from the mean time
trace and the random time traces produced within its error bar
respectively
In order to validate this approach and to assess the accuracy of the obtained
frequencies it is necessary to check how the dominant frequencies are influenced by
the measurement errors The following procedure demonstrated with the time trace
used above (222-reflection at 23 mJcm2
absorbed fluence) is applied For each time
trace the signal values of the individual data points are randomly changed within the
limits set by the error bars In this way a set of artificial time-traces is produced which
represent - within the error - possible time traces The variation of the FFT-spectra
of all this possible time-traces allows to estimate the error in the FFT and to asses
which frequency components can be regarded as real In Fig 510 six of these FFT-
spectra are presented as dotted curves With respect to the main peak (the solid curve)
it can be concluded that the measurement errors slightly change its amplitude and
width but do not affect much its position The variation of the peak position is
5 Extreme phonon softening in laser-excited Bi
90
significantly smaller than the peak width which I consider in the following as the
error of the measured frequency In conclusion the dominant frequency obtained
from the FFT can be regarded as reliable and it is assumed that it represents the A1g-
phonon mode Some more FFT-spectra obtained from the measured time-
dependencies of the diffraction efficiency are presented in Fig 511
Fig 511 FFT-spectra of the measured diffraction efficiencies for
different absorbed fluences The dominant frequency in each figure
is marked by the blue arrow
5 Extreme phonon softening in laser-excited Bi
91
Fig 511 clearly indicates that for each fluence a unique dominant frequency
can be determined as marked with the blue arrow The only exception is the one at
F = 32 mJcm2 where several peaks of equal strength are found Fig 512 summarizes
the result of the FFT-analysis It shows the determined dominant frequency as a
function of fluence The frequency error bars represent the FWHM of a Gaussian fit
to the dominant peak
Fig 512 Frequency of the excited A1g-mode as function of laser
fluence derived from the time resolved diffraction data red 111-
reflection green 222-reflection violet data obtained from earlier
results at University Duisburg-Essen (UDE) [68]
blue data obtained
at the SPPS [69]
Cyan A1g-frequency of unexcited Bi black dashed
line guide to the eye Insert DFT calculations from Murray et al [237]
The solid and dashed lines show the anharmonic and harmonic
frequencies as a function of carrier density n respectively
In Fig 512 the red and green data points represent the new data from my
measurements At lower fluences they compare well with the results obtained earlier
which have discussed above (violet point Ref [68] blue points Ref [69] Most
strikingly these experimental data reveal an extreme softening of the A1g-mode for
5 Extreme phonon softening in laser-excited Bi
92
high fluences (gt 2 mJcm2) Particularly by extrapolating the measured data (black
dashed line as a guide to the eye) a complete softening at fluences of 30 to
33 mJcm2 is expected At first glance surprising a further increase of fluence leads
to the revival of the signal oscillations and an increase of the mode-frequency The
complete softening and later stiffening of the A1g-mode clearly indicate that the
Peierls distortion is transiently reversed for fluences above approx 30 mJcm2
Further evidence can be found in Fig 59 where initial signal changes of (111) and
(222) diffractions reach approx -50 and 20 at this excitation level respectively
These results agree with estimates based on the geometrical structure factor (see Fig
53) assuming that about half of the film thickness had been excited to the symmetric
arrangement x = 05 (where the 111-reflection is fully forbidden)
In order to compare my measured results with the theoretical predictions of the
DFT-calculations performed by Murray et al [237]
the calculated harmonic and
anharmonic phonon frequencies using the PES are presented in the inset of Fig 512
as a function of carrier density n One can immediately see qualitative agreement
between the experiment and the calculation The harmonic frequency computed from
the curvature of the PES at the minimum under the assumption of harmonic
approximation The anharmonic frequency obtained from the inverse of the actual
cycle period of atomic motion in the anharmonic potential More detailed
interpretations of the two frequencies are provided in Ref [237] and [258] At low
excitation level as already proved by experiment [69]
there is little difference between
the harmonic and anharmonic frequency The difference becomes apparent at high
excitation levels where the range of atomic motion increases leading to an
anharmonic oscillation of the atoms along the asymmetric part of the PES A detailed
interpretation of atomic motion upon laser excitation is given in the following
5 Extreme phonon softening in laser-excited Bi
93
Fig 513 Sketch of the interatomic potential energy surface of Bi
upon laser excitation The black curve represents the shape of initial
equilibrium PES The others represent (qualitatively) the shape of
PES upon different excitation levels For illustrative purpose the
curves are adjusted to be separated in arbitrary unit The dashed
curves along the surface indicate the range of atomic motions
Within the DECP-picture the atoms are immediately displaced from their
(transient) equilibrium position due to the impulsive laser induced change in the PES
A restoring force whose magnitude and direction are determined by the gradient of
the PES is exerted on the atoms setting them in motion The frequencies extracted
from the X-ray diffraction signals displayed in Fig 512 directly reflect this transient
atomic motion along the PES and yield information regarding the curvature of the
PES of the excited sample In order to concisely interpret this oscillatory behavior I
illustrate qualitatively the shapes of the PES of Bi upon laser excitation and the
possible range of atomic motion in Fig 513
The initial equilibrium PES of Bi has a double well structure with the minimum
position at x = 0468 (curve (a)) For weak excitation a slight shift of the minimum
position of the PES and a slight decrease of the Peierls barrier can be seen (curve (b))
The atomic motion is limited to a small range around the equilibrium position and the
5 Extreme phonon softening in laser-excited Bi
94
atom oscillates harmonically along the PES Anharmonicity is negligible The
frequency drops approximately linearly with excitation fluence This situation
corresponds to the excitation level up to 15 of carrier density in the DFT
calculation and excitation fluences below 25 mJcm2 in Fig 512 Extensive studies
[68 69 237 244-246 248 249 259] on the generation of coherent optical phonons in Bi have
been performed in this region with time-resolved optical and X-ray techniques Up to
now no study has been carried out beyond this level of excitation The behavior in
this unexplored area has been revealed in this work
Following the increase of the excitation level the range of oscillatory atomic
motion becomes larger (curve c) The asymmetric anharmonic shape of the PES leads
to an additional increase of the period of atomic motion which defines the
anharmonic phonon frequency shown in the inset of Fig 512 It differs
significantly from the harmonic frequency (defined by the curvature of the PES at the
minimum) This situation corresponds to 15 ~ 2 of excited carrier density in the
DFT calculations and the excitation fluences of 25 ~ 3 mJcm2 in Fig 512
Upon further increase of excitation the system can reach the particular state in
which the Peierls barrier becomes low enough to let the atom just climb to its top
where it stops (curve d) In this labile equilibrium atomic motion freezes and the
anharmonic frequency becomes zero After reaching the above particular state the
Peierls barrier is further lowered by an increased fluence and the atom is allowed to
cross the x = 05 position and moving in both wells (curve e) As the atomic motion
restarts the phonon frequency revives Upon further increase in fluence the double
well and the barrier vanish The minimum of the PES is now at x = 05 which means
that the Peierls distortion has been transiently reversed Right at the transition the
harmonic term of the PES vanishes (curve f) which corresponds to the situation where
the harmonic frequency becomes zero These happen at an excitation level of 2 ~
27 of carrier density in the DFT calculation and absorbed laser fluences between
30 to 33 mJcm2 in Fig 512
With the further increase of excitation level corresponding to the value beyond
27 of carrier density in the DFT calculation and absorbed laser fluences above 33
5 Extreme phonon softening in laser-excited Bi
95
mJcm2 in Fig 512 the PES is continuously altered and the two minima converge to
one transforming the flat profile to the sharp parabola with the minimum position at
x = 05 (curve g and h) As the relative potential energy (to the minimum of the PES)
increases the atom moves along a parabolic surface with higher velocity thus
shortening the motion period and leading to an increase in the phonon frequency The
A1g phonon mode stiffens However it should be noted that due to the already
reversed Peierls distortion and the transformation into a more symmetric structure
with only one atom per unit cell this atomic motion correspond now to an acoustic
phonon mode at the new Brillouin-zone boundary
In contradiction with the above description about the range of atomic motion the
observed oscillation amplitudes in the measured data (see Fig 58) are much smaller
compared to the average signal change A very strong damping in the A1g atomic
motion can be responsible for the observation The reason of the damping effect is not
fully understood yet Considering the high excitation level applied in the
measurements a coupling of the A1g mode to other modes (eg Eg mode) which was
proposed in the earlier electron diffraction experiment [81]
and predicted in calculation
by Zijlstra et al [260]
could be the reasonable explanation for this effect Since the
system performs small amplitude oscillations around the new equilibrium
positionpotential minimum I suppose the experimental results are more suitable to be
described by the harmonic frequency
Finally it should be noted that the above description of the A1g phonon behavior
follows the results of the first principles DFT calculation [237]
which applies separate
chemical potentials for electrons and holes This model has been proved to be
quantitatively correct for low excitation fluences [69]
and at least qualitatively in good
agreement with my experimental results The other approach proposed by
Zijlstra et al [260]
using all-electron full-potential linearized augmented planewave
method (FLAPW) [261 262]
provides a description not only on A1g phonon but also on
Eg phonon and interactions between them This model could be more accurate for the
situation of Bi at the high level excitation While these two theoretical calculations
5 Extreme phonon softening in laser-excited Bi
96
differ quantitatively they qualitatively predict similar changes of the PES and the
phonon frequency
53 Summary
In summary an investigation of the laser-excited A1g coherent optical phonon
mode in Bi was performed with the laser plasma X-ray source The reversal of Peierls
distortion as well as the coherent motions of atoms in Bi following laser excitation
was observed In the low excitation regime the data agree with previous results
obtained at UDE and the SPPS In the strong excitation regime (absorbed laser
fluences gt 2 mJcm2) an extreme softening of the A1g mode was observed and an
interpretation was given Particularly the observation of a complete softening
(frequency down to zero) at fluences of 30 to 33 mJcm2 indicates that the Peierls
distortion defining the equilibrium structure of Bi transiently vanishes At even
stronger excitation (absorbed laser fluences gt 33 mJcm2) Bi starts to respond as a
material arranged in the structure with half of its equilibrium lattice constant and the
atomic motion becomes a Brillouin-zone boundary acoustic phonon mode These
observations follow at least qualitatively the predictions of calculations based on DFT
[237 260]
However due to the limited experimental accuracy these results do not provide
more detailed information with respect to the damping behavior of the oscillations the
decay of coherent phonons and the coupling of the phonon modes For further detailed
investigation in the high excitation region more powerful X-ray sources (eg XFEL
or LCLS) are needed
As already mentioned in the experimental section accumulative sample damage
was observed when absorbed fluences beyond 25 mJcm2 are used It indicates that
the applied excitation density is close to the melting threshold of the Bi sample It
questions how the phonons respond to excitations far beyond the melting threshold
which allow the melting of Bi sample with a single laser pulse Such a question had
recently been investigated by Sciaini et al [81] The ultrafast melting of Bi had been
5 Extreme phonon softening in laser-excited Bi
97
observed with time-resolved electron diffraction It was found that under extreme
excitation conditions the disordering of the Bi crystal structure occurs within 190 fs
which is substantially shorter than the disordering time determined by lattice heating
indicating a non-thermal melting process The authors attribute such surprising speed
of the non-thermal solid-to-liquid phase transition in Bi to laser induced changes in
the PES which result in strong acceleration of atoms along the longitudinal direction
(A1g mode) and an efficient coupling of this motion to the transverse mode (Eg mode)
This coupling effect had also been theoretically predicted by Zijlstra et al [260]
in high
excitation regime In order to obtain the insight into more details of DECP mechanism
and subsequent phonon dynamics at the high excitation regime the Eg phonon motion
as well as the coupling effect of A1g and Eg mode should be included in this study
However since amplitude of the Eg mode is much smaller than the one of the A1g
mode and the experimental geometry in this measurement is not sensitive to Eg
motions the Eg phonon mode as well as the coupling effect has not been observed in
my data
Nevertheless a complete insight of A1g optical phonon dynamics in laser excited
Bi from the weak excitation to melting is provided now from the results of three
excitation levels (low data from SPPS high data in this thesis extreme data from
electron diffraction) The transient reversal of Peierls distortion happening before the
disordering of Bi crystal structure has been experimentally confirmed The structural
change resulting from the coherent phonons has been indicated by the appearance of
the acoustic phonon mode Since many properties of a solid including the electronic
thermal and optical properties are affected by lattice structure this knowledge of
ultrafast structural changes caused by electronically altered energy surfaces can be
extended to understand not only the phonon dynamics of other Peierls distorted
materials (Sb and As) but also the mechanism of ultrafast phase transition in other
functional materials eg insulator-metal transition in VO2 [263 264]
and crystalline-
amorphous transition in chalcogenide alloys [265 266]
6 Towards time-resolved Debye-Scherrer X-ray diffraction
98
6 Towards time-resolved Debye-Scherrer
X-ray diffraction
The observation of the transient changes of a single Bragg-reflection in a
femtosecond X-ray diffraction measurement provides only limited information about
the transient structural response of optically excited materials To obtain a more
complete picture of the induced processes it is desirable to monitor as many Bragg
peaks as possible The Bragg diffraction scheme with a monochromatic source applied
in the experiments discussed in chapter 4 and 5 requires single crystalline samples of
high quality and thus the range of materials that can be studied is limited Moreover
a sequential measurement of many individual Bragg peaks is time consuming and
difficult to handle due to multiple sample adjustments (sample rotations) as well as
the instability of the laser and X-ray sources One alternative for effectively
measuring multiple diffraction peaks with single crystalline sample is the so-called
rotating-crystal method [74]
By rotating a single crystalline sample at a high constant
angular velocity (eg 180degs) the Bragg condition for different diffraction peaks is
fulfilled and simultaneously allowing a detection of a larger number of transient
diffraction peaks under the same experimental conditions in one measurement Again
this method requires good sample preparation precise mounting and alignment of the
sample as well as extremely stable mechanical components
Moreover not all materials can be prepared as crystalline thin films (thin films
are necessary in order to match the optical absorption depth to the X-ray probing
depth) On the other hand many materials can be prepared in polycrystalline form
For polycrystalline materials the well-known Debye-Scherrer scheme [267]
represents a
simpler approach to access simultaneously multiple Bragg peaks The simultaneous
6 Towards time-resolved Debye-Scherrer X-ray diffraction
99
detection of several reflectionsdiffraction rings without additional (sample
adjustments and mechanical stability) requirements allows conveniently getting as
much as possible information of the sample from one measurement A successful
time-resolved experiment using the Debye-Scherrer scheme on a thick (250 microm)
powder sample has been recently reported [106]
Since a material with a large unit cell
size was used multiple diffraction rings were recorded simultaneously proving the
relocation of charges within the unit cell with a time resolution of 100 fs This result
demonstrates the feasibility of using a laser-plasma based X-ray source for
investigating a wide range of polycrystalline inorganic and organic materials with
time-resolved Debye-Scherrer diffraction
The use of an X-ray optic with high magnification in the modular setup (see in
chapter 3) can provide a quasi-collimated beam well suited for the Debye-Scherrer
diffraction scheme In the work discussed in this chapter I performed Debye-Scherrer
X-ray diffraction experiments on thin polycrystalline metal films and I demonstrated
the possibility to perform time-resolved experiments with the modular setup The first
part of this chapter presents the experimental configuration In the second part static
Debye-Scherrer diffraction measurements on a 20μm Cu foil are presented This
measurement serves as comparison to results previously obtained by U Shymanovich
using a different kind of focusing X-ray optic (elliptical capillary) [105]
In the third
part of this chapter results of a time-resolved X-ray Debye-Scherrer diffraction
measurement on a 200 nm Au film are presented and discussed
6 Towards time-resolved Debye-Scherrer X-ray diffraction
100
61 Experimental configuration
(a)
(b) (c)
Fig 61 Experimental configuration (a) The principle schema of the
experimental setup (b) A photo of the arrangement of sample and X-
ray area detector (c) The configuration of the experiment for an Au
sample
A schematic of the experimental setup is shown in Fig 61 (a) The femtosecond
X-ray pulses are collected by the X-ray multilayer optic and focused on a
polycrystalline thin film sample at normal incidence Comparing to the experiments
described in the previous chapters no special alignment of the sample is necessary
due to its polycrystalline structure The diffraction pattern from the sample forms a
series diffraction cones Each diffraction cone corresponds to the diffraction from the
same family of crystalline planes in all the participating crystallites For the detection
a large area detector is required to cover a sufficiently large angular range In the
experiment discussed here the phosphor-based MCP amplified X-ray area detector
(ie ldquoGemstarrdquo) was utilized for this purpose This camera has already been
mentioned in chapter 3 and its working principle and detailed parameters are provided
Thin Film Sample
CC
D
Multilayer
X-ray Optic
Plasma
Kα-Source
6 Towards time-resolved Debye-Scherrer X-ray diffraction
101
in Appendix B In order to simultaneously record as many diffraction orders as
possible the camera was placed not normal to the incident beam Fig 61 (b) presents
a photo of the sample and camera arrangement In Fig 61 (c) the detectable
diffraction orders have been depicted for Au as an example Their corresponding
diffraction angles are shown in the insert of Fig 61 (c) Note that due to the limited
size of the detector only parts of the different rings are recorded (see below)
62 Static Debye-Scherrer measurements
(a) (c)
(b) (d)
Fig 62 Diffraction pattern of a 20μm polycrystalline Cu foil with
Cu Kα X-ray source The CCD images in (a) and (c) are obtained
using multilayer optic and capillary optic respectively (b) and (d)
are the radial cross section of image (a) and (c) respectively (c) and
(d) reproduced from Ref [105]
In order to test the feasibility of the experiment and the capability of the setup I
first performed a (static) Debye-Scherrer diffraction experiment on a 20 μm thick Cu
6 Towards time-resolved Debye-Scherrer X-ray diffraction
102
foil This sample was used in the above mentioned previous study with the elliptical
capillary optic [105]
and it provided sufficient diffraction signals to record the Debye-
Scherrer diffraction pattern Using the sample this time with the multilayer optic
offered an opportunity to compare results obtained with different types of X-ray
optics
The detailed parameters of the experiment and the accessible diffraction orders
of Cu with Cu Kα X-ray (805 keV) are provided in Appendix C A typical Debye-
Scherrer diffraction pattern obtained using the multilayer optic with 5 minutes
exposure time is given in Fig 62 (a) It can be seen that three different diffraction
rings are detected simultaneously These rings are the intersections of the diffraction
cones and the detector plane The shape of a complete ring which can be a circle an
ellipse a parabola or a hyperbola depends on the angle of the detector plane with
respect to the incoming X-ray beam In order to derive the intensity of diffraction X-
ray as a function of diffraction angle I() from this CCD image one needs to integrate
the pixel intensity along the ring in which the pixels belong to the same Thus a
complete diffraction ring for a corresponding needs to be reconstructed Considering
that only small fractions of the rings are detected by the CCD the curvatures of the
detected parts are small enough to allow these ring patterns being reconstructed by
approximating them as circles As it can be seen in Fig 63 (a) the coordinate origin
is set at the middle of the left edge of the CCD image By sampling the coordinates
from each ring their individual circle parameters (0x
0y and R ) for a circle
approximation ( 22
0
2
0 )( Ryyxx ) can be obtained Knowing these
parameters the full ring pattern out of CCD plane for each diffraction order can be
reconstructed The zoom of CCD plane (Fig 63(b)) presenting the well overlapping
of X-ray and the reconstructed rings demonstrates feasibility of this reconstruction
With these circle fitting functions the circle parameters ( 0x 0y and R ) as a function
of the x coordinate on the line y = 0 are obtained as displayed in Fig 63 (c) For each
x coordinate (from 1 to 1392) a corresponding ring can be deduced Each point (xy)
of the image belongs to one of these rings By integrating the pixel intensity along
6 Towards time-resolved Debye-Scherrer X-ray diffraction
103
each ring and projecting all data on the line y = 0 the X-ray intensity as a function of
x coordinate is obtained Converting the pixel coordinate to the angular coordinate by
applying the known angular positions of the corresponding detected diffraction orders
the diffraction X-ray intensity as a function of diffraction angle is finally derived The
result of this data processing for Fig 62 (a) is given in Fig 62 (b)
Fig 63 Reconstruction of the diffraction pattern in order to extract
the diffracted X-ray intensity as a function of diffraction angle (a)
Chosen coordinate system and the reconstructed ring pattern (b)
Zoom of the CCD image plane showing the overlap of the measured
diffraction pattern with the reconstructed rings (c) Circle fit
parameters (0x
0y and R ) of each diffraction ring as a function of x
coordinate on the y=0 line The dashed lines are the 2nd
order
Polynomial Fit for the data points
To compare my result with that obtained with a different kind of collimating
X-ray optic namely the elliptical capillary optics [105]
a CCD image from this study
and its radial profile are displayed in Fig 62 (c) and (d) The elliptical capillary
optics uses total reflection All incident X-rays passing through the capillary with an
angle smaller than the angle of total reflection undergo total reflection at its inner
6 Towards time-resolved Debye-Scherrer X-ray diffraction
104
surface The angle of total reflection has a weak dependence on the wavelength of the
X-rays and thus the optic is not wavelength sensitive Therefore more diffraction
orders originating from Kα and also Kβ radiation can be observed in Fig 62 (c)
instead of only three diffraction orders from the monochromatizing multilayer optics
The noisy background observed in Fig 62 (d) is caused by the unfocused radiation
passing directly through the capillary optic without reflection
In conclusion due to the monochromatic reflection of the multilayer optic and
the optimized Kα flux of the laser-plasma source (see chapter 2) the modular setup
can provide Debye-Scherrer diffraction patterns with much better signal-to-noise ratio
than those obtained previously [105]
63 Time-resolved Debye-Scherrer experiment
The absorption depth of a metal at visible and near-infrared wavelengths is
typically less than 20 nm [113]
However multi-keV X-ray penetrate much deeper [189]
In particular with the transmission geometry used in this experiment the 20 μm Cu
sample presented in the former section is not a suitable sample to perform time-
resolved experiments because it can not be effectively excited by the optical radiation
over the whole depth probed by the X-rays Therefore in the experiments discussed in
this section a 200 nm thick free standing Au thin film [268]
was used as sample to
demonstrate the feasibility of time-resolved Debey-Scherrer diffraction
6 Towards time-resolved Debye-Scherrer X-ray diffraction
105
631 Static Debye-Scherrer-diffraction pattern of the Au
thin film
(a)
(b)
Fig 64 Diffraction pattern of a 200 nm polycrystalline Au film (a)
CCD image (b) Radial cross section of (a)
The detailed parameters of the experiment and the detectable diffraction orders
6 Towards time-resolved Debye-Scherrer X-ray diffraction
106
for Au are provided in Appendix C and Fig 61 (c) The static Debye-Scherrer-
diffraction pattern of the Au thin film is presented in Fig 64 (a) Using a similar
experimental configuration as described in the previous section four diffraction
orders were observed in this case due to the larger lattice constant of Au as compared
to Cu I() is obtained in the same way as described in the previous section and shown
in Fig 64 (b) Compared to result with 20 μm Cu foil (Fig 62 (b)) the signal-to-
noise ratio becomes much worse Such a difference is attributed to the small thickness
of this sample the total intensities of the diffraction peaks decrease with sample
thickness whereas the noise (background signal) coming from the scattering of X-ray
are barely affected by the sample thickness
632 Results of time-resolved pump-probe measurements
In the timendashresolved measurement the incident fluence of the pump beam was
set to 160 mJcm2 (wavelength 800 nm) The diffraction patterns were recorded using
again the Phosphor-based X-ray area detector An exposure time of 5 minutes had
been chosen for each delay point After subtracting the CCD background the images
for a given delay were processed using a MatLab program (with the same routines
described in section 62) to obtain I()) By analyzing the transient changes of I()
the laser induced changes can be deduced
6 Towards time-resolved Debye-Scherrer X-ray diffraction
107
Fig 65 Comparison of the signal from non-excited and excited Au
sample (a) Radial cross sections obtained from measured data (b)
The selected profiles above the noisy background (about 30 of the
peak value) are fitted with Gaussian function
It is known since many years that the excitation of a thin metal film with an
ultrashort optical pump pulse leads to several effects which can be observed with
time resolved techniques [42 75 269 270]
Generally the changes of the diffraction
intensity due to the Debye-Waller effect and the changes of the diffraction angle due
to laser induced strain can be extracted from the measured time resolved data Both
effects have been discussed in Chapter 4 The amplitude of these changes is more
pronounced for higher diffraction orders (see the discussion in section 42 and the
latter discussion in section 633) Therefore I focused in the analysis on the two
highest diffraction orders (311) and (220) Since the reduction of the diffraction
intensity due to the Debye-Waller effect could not clearly be observed in these
measurements as will be explained in section 633 I will only discuss the observed
changes in the angular position of the Bragg-peaks attributed to strain caused by
acoustic waves
The changes of the diffraction pattern induced by the optical excitation are
6 Towards time-resolved Debye-Scherrer X-ray diffraction
108
presented in Fig 65 (a) where the I()-data for the non-excited sample (black-dotted
curve) and for a delay of 70 ps between the optical pump and the X-ray probe (green
dotted curve) are shown Shifts of both Bragg peaks are clearly observable In order to
quantify the shift the two selected Bragg-peaks have been fitted using the Gaussian
function To eliminate any effects of the noisy background on the fitting only data
points with an intensity larger than 30 of the peak intensity (blue and red curves in
Fig 65) have been used for the fitting The results are shown in Fig 65 (b) as dashed
curves and the peak positions and their error bars are obtained from the fitting
parameters Applying the same routine to all measured diffraction profiles the peak
positions as a function of delay time for the (311) and (220) Bragg reflections were
obtained and are shown in Fig 66
Upon the laser excitation pressure rises inside the sample inducing strain The
resulting strain will modify the lattice constant of the sample and thus the radii of the
diffraction rings This is the origin of the transient peak shifts displayed in Fig 66
For Au the energy will be rapidly (in a few hundred femtoseconds [211-213]
) distributed
after optical excitation over the full 200 nm film thickness Rarefaction waves are
launched at both film surfaces and start to propagate into the bulk of the film As a
consequence the diffraction peaks start to shift to smaller diffraction angles indicating
expansion of the material After a time determined by the film thickness and the speed
of sound of the considered material the fronts of the strain waves traveling in the
sample arrive at the opposite surface For a free surface the strain waves are totally
reflected with a change of sign Such recompression of the material is indicated by the
diffraction peaks shifting back to larger diffraction angles without obvious damping
effect As already discussed in Chapter 4 the ldquotriangularrdquo shape of the time-traces
results from a very fast and homogeneous (over the whole film thickness) increase of
pressure in the sample upon optical excitation [140 186]
The temporal position of the
maxima and minima of the time traces in Fig 66 (a) and (b) are determined by the
transit time of longitudinal acoustic waves through the film For both diffraction
orders oscillations with a half period of about (67 plusmn 1) ps are observed Using the
known sound velocity for polycrystalline Au of vs = 324 kms [271]
this transit time
6 Towards time-resolved Debye-Scherrer X-ray diffraction
109
corresponds to a film thickness of 217 nm which agrees within specifications (+-
10) of the manufacturer with the nominal thickness of 200 nm
(a)
(b)
Fig 66 Relative transient shift of the peak positions for the diffraction
rings (311) (a) and (220) (b) after laser excitation (blue squares) The
red circle points give the peak positions for non-excited sample The
black curves are guides for eye
6 Towards time-resolved Debye-Scherrer X-ray diffraction
110
633 Modeling the transient behavior of the diffraction
pattern after laser excitation
Fig 67 Debye-Scherrer Ewald-sphere construction without strain
(solid circles) and with uniaxial strain (dashed circle)
In polycrystalline samples the crystallites are randomly oriented When the X-
ray beam passes through the sample only the crystallites with a plane orientation
which fulfills the Bragg condition diffract X-rays The diffraction contributions from
all these crystallites form the Debye-Scherrer-diffraction pattern When the sample is
excited by the laser pulse with the condition that the illuminated area of laser is much
larger than the samplersquos absorption depth the sample expands only along the surface
normal resulting in uniaxial strain To understand the changes of the Debye-Scherrer
pattern under uniaxial strain I use a Ewald-sphere-construction [272]
as displayed in
Fig 67
The black and blue solid circles are used to describe the situation in an
6 Towards time-resolved Debye-Scherrer X-ray diffraction
111
unstrained polycrystalline film The black circle represents the Ewald-sphere Its
radius corresponds to the length of the wave vector of the incident X-rays Since we
are considering elastic scattering the incoming wave-vector ink as well as all possible
wave vectors of diffracted waves have to lie on this sphere The difference in direction
is given by the reciprocal lattice vector hklG For a single crystalline sample hklG
points only to one particular direction For a polycrystalline sample all directions of
hklG are possible This is illustrated by the blue circle which has a radius
corresponding to the length of hklG In two dimensions the two points of intersection
mark the positions where the Bragg-condition is fulfilled Extending this to three
dimensions by rotation around ink will transform the two points to a diffraction ring
When the film is uniaxially strainedexpanded the length and direction of hklG
depends on the orientation of the individual crystallite with respect to the surface
normal and the circle (with direction-independent radius) transforms into an ellipse
which is represented in Fig 67 by the blue dashed line Its shorter axis corresponds to
the direction of strainexpansion (larger lattice constant - smaller length of hklG ) Now
the intersection of the ellipse with the Ewald-sphere defines the diffraction direction
for the strainedexpanded sample As a result the diffraction rings should decrease
their radius
According to these considerations a simple geometrical calculation allows to
determine for a given strain what shifts will be induced for different Bragg peaks and
these estimations can be compared to the experimental data Choosing the center of
the Ewald-sphere as coordinate origin the black and the blue circle as well as the blue
ellipse can be expressed as follows
222 kyx (1)
222Gykx (2)
11
2
2
22
2
G
y
G
kx
(3)
6 Towards time-resolved Debye-Scherrer X-ray diffraction
112
Where η is the uniaxial strain caused by laser excitation defined as dd (d
is lattice constant) Let (x1y1) be the intersection point of the black and blue circles
(unstrained case) In the strained case the intersection point of black circle and blue
ellipse change to xxx 12 yyy 12 Substituting 1x 1y 2x 2y and G from Eq
(1) and Eq (2) in Eq (3) and applying a first order approximation
[ 2112
02 x 02 y ] one obtains
02222
yykxxkx (4)
Then substituting coskx sinky sinkx cosky in
Eq (4) one obtains the relationship between andη (and )
sin
1cos2
(5)
Fig 68 shows some results calculated using Eq (5) The angular shift
increases with strain η for a given diffraction order and for a given strain η it is larger
for higher diffraction orders
Fig 68 Estimation of the shift of diffraction rings and comparison to
measured data
6 Towards time-resolved Debye-Scherrer X-ray diffraction
113
634 Discussion for the experimental results
Following the above discussion the laser induced strain in the Au sample can be
deduced from the angular shift of the diffraction peaks observed in the time-resolved
experiment The measured peak shifts are (- 0152 plusmn 0013) ordm and (- 0103 plusmn 0010) ordm
for the (311)- and (220)-reflection respectively Using equation (5) a strain of
η(311) = (42 plusmn 04) times10-3
and η(220)= (50 plusmn 05) times10-3
is derived These two values
agree within the error bars and can be used to estimate the sample temperature For
this we use the average value ηavgasymp (46 plusmn 05) times10-3
Since the lateral dimensions of
the excited area (04 mm) are much larger than the film thickness on the time scale of
a few hundred picoseconds expansion of the film can only occur along the surface
normal Under these conditions the relation between the peak strain and the laser-
induced temperature increase is given by the following equation [223]
Tv
B
S
2
6 (6)
where B β ρ vs are the bulk modulus (B = 180 GPa) the coefficient of linear
thermal expansion (β = 142 μmbullm-1
bullK-1
) the density (ρ = 193 gbullcm-1
) and the speed
of sound (vs = 324 kms) respectively Equation (6) yields = (61 plusmn 7) K This
result is in rough agreement with the temperature increase (= (80 plusmn 11) K)
estimated from the deposited energy in the sample for the given excitation fluence
The Debye-Waller effect (see in Chapter 4) induced by this increase of
temperature should lead to a 42 and 31 decrease in the integrated diffraction
signal of the (311)- and (220)-reflection respectively However due to the low
diffraction signals (approx 3 detected photons per second for the (311)-reflection
less for the (220)-reflection) these changes could not be detected in the experiment
since they are of the same order (eg for (311)-reflection) or smaller (eg for (220)-
reflection) than the experimental errors which are mainly determined by counting
statistics
6 Towards time-resolved Debye-Scherrer X-ray diffraction
114
64 Summary
In this chapter the static Debye-Scherrer-diffraction pattern of a Cu foil (20 μm)
and an Au thin film (200 nm) have been presented The feasibility of performing a
time-resolved X-ray Debye-Scherrer measurement with the modular setup has also
been shown A preliminary time-resolved X-ray Debye-Scherrer measurement on a
thin Au film has been preformed The generation of acoustic waves due to rapid build-
up of pressure upon laser excitation and their propagation inside the film has been
followed by simultaneously measuring the transient shifts of the (311)- and (220)-
reflection as a function of pump-probe time delay The measured data are in good
agreement with the behavior expected from propagation of acoustic waves in a
200 nm Au free standing film A Ewald-sphere construction has been used to
determine the strain induced by laser
Finally I would like to comment on the better accuracy achieved in the reported
time-resolved powder diffraction experiment [106]
This is not related to properties of
the X-ray source and the setup which are in fact quite similar (eg X-ray flux of the
source) The essential point determining the different experimental accuracy is the
samples under investigation Comparing the thin film sample used here to the (organic)
powder sample used in Ref [106] the large penetration depth of pump beam in the
latter one (up to a few tens of microm) allows much thicker samples to be used in the
pump-probe experiments Moreover due to the large unit cell size (large lattice
constant small diffraction angles) and the use of a larger detector more diffractions
orders and larger fractions of the complete diffraction rings could be recorded with the
powder sample used in Ref [106] Only these sample properties provided diffraction
patterns with a better signal-to-noise ratio leading to a better experimental accuracy
in the powder diffraction experiment
7 Summary and outlook
115
7 Summary and outlook
71 Summary
This thesis describes my work on optimizing a femtosecond laser plasma Kα X-
ray source improving an existing modular setup for time-resolved X-ray diffraction
experiments and several studies on ultrafast lattice dynamics in thin laser-excited
metal films
In the second chapter the principles of ultrafast laser-plasma based X-ray
sources are presented A systematic investigation of optimizing the Kα X-ray source
for time-resolved X-ray diffraction experiments was performed The Cu and Ti Kα
yield were studied as a function of different laser intensities different angles of
incidence and different controlled pre-pulsepre-plasma conditions The optimized
conditions for both materials were determined Introducing a controlled pre-pulse at
an appropriate time in advance of the main pulse the Kα yield can be enhanced to the
same value no matter what angle of incidence is used This result is valid for both
materials under investigation Due to the same required on-target intensity for the
same Kα emission better energy conversion efficiency is found at a small angle of
incidence with a matching controlled pre-pulse These experimental results agree well
with estimations based on the classical resonance absorption mechanism and detailed
Particle in Cell (PIC) simulations
The third chapter describes the used modular setup for time-resolved X-ray
diffraction and the implemented improvements Applying the results discussed in the
second chapter the X-ray production has been improved Two normalization
methods are compared and discussed The combination of direct normalization and
7 Summary and outlook
116
a ldquofastrdquo delay scanning scheme represents the most efficient way to achieve high
measurement accuracy
By using the optimized setup presented in Chapter 3 the Debye-Waller effect in a
thin laser-excited Au film was observed The experimental results are presented in
chapter 4 For high excitation fluences an exponential drop of the measured
diffraction signal with a decay time constant of 43 ps is measured This result is in
good agreement with previous experimental results as well as the Two-Temperature
Model (TTM) calculations at high fluences As the first time-revolved experiment
performed with the improved modular setup these observations also underline the
capabilities as well as the restrictions of the modular setup
The fifth chapter focuses on investigating coherent optical phonons in Bi after
intense laser-excitation Large amplitude coherent motion of atoms and a softening of
the A1g phonon mode were observed At lower fluences the measured results agree
perfectly with earlier results obtained at the Sub-Picosecond Pulse Source (SPPS) and
University Duisburg-Essen (UDE) Upon strong excitation (absorbed laser fluences gt
2 mJcm2) a further softening of the A1g mode is observed At fluences between 31
and 33 mJcm2 a complete softening of the A1g mode is found This observation
strongly indicates that the Peierls distortion which defines the equilibrium structure
of Bi vanishes and the material is transformed into a transient ordered state of higher
symmetry At even stronger excitation (absorbed laser fluences gt 33 mJcm2) the
atomic motion becomes a Brillouin-zone boundary acoustic phonon mode and this
mode stiffens The observations follow qualitatively the predictions of calculations
based on density functional theory
The sixth chapter is dedicated to time-resolved X-ray Debye-Scherrer diffraction
measurements The presentation of static Debye-Scherrer diffraction pattern of Cu
(20 μm) and Au (200 nm) showed the feasibility of performing time-resolved X-ray
Debye-Scherrer diffraction experiments with the modular setup In the time-resolved
measurements on a Au thin film the generation of acoustic waves and their
propagation inside the film had been observed through the transient shifts of the
(311)- and (220)-reflection The temporal evolution of the measured data is in good
7 Summary and outlook
117
agreement with the behavior expected from propagation of acoustic waves inside the
200 nm free standing film A simple model based on a Ewald-sphere construction has
been used to determine the laser-induced uniaxial strain from the measured time-
resolved Debye-Scherrer patterns
72 Outlook
As it has been underlined in this thesis the modular setup using the laser-plasma-
based X-ray source is still of great interest for performing time-resolved X-ray
diffraction experiments due to its availability and low cost (in comparison to
accelerator-based sources) The following technical developments can be done to
improve the performance of the modular setup and open possibilities for new types of
experiments
1) The conditions to optimize the X-ray output have been discussed in detail in
this thesis Redesign of the source chamber allowing a smaller angle of incidence of
the drive laser for the X-ray source could be an option to fulfill the optimized
condition with less energy requirements to the laser system
2) Improving the overall stability is another important issue for the source This
requires improvement of the stability of the laser system as well as the mechanical
parts of the tape target pulling system
3) An automatic optimizationstabilization of the X-ray output behind the
multilayer optic during experiments can be realized by an automatic adjustment of the
position of the X-ray source point on the tape target through motorized actuators To
carry out this function the manual actuators of several mirrors in the setup should be
replaced by motorized actuators and a control program should be developed and
integrated into the main experiment control program
4) The current sample holder with manual adjustments should be replaced with a
motorized one It should definitely improve the accuracy of the adjustment and also
save time Additionally this would allow to perform irreversible time-resolved X-ray
diffraction experiments eg on laser-induced melting with the modular setup
7 Summary and outlook
118
5) The results of the time-resolved X-ray Debye-Scherrer diffraction
measurements presented in this thesis successfully proved the possibility of
performing Debye-Scherrer type measurements with the laser plasma X-ray source
As single crystalline samples are not required in this scheme a much wider range of
materials which are not easily available as single crystals can be studied now In
order to further improve the experimental accuracy (which directly relates to the
number of detected photons) for this type of experiments a new camera with large
detection area [273]
has been implemented in the setup and tested by F Quirin Once
suitable samples with sufficient diffraction signal are obtained further investigations
could be made with this setup
Since the electronic properties of the material are strongly affected by lattice
structure the laser-induced reversal of the Peierls distortion in Bi should lead to
corresponding changes in its electronic band structure resulting in a semimetal to
metal phase transition Investigation of this phase transition process can be one of the
most interesting subjects for Bi To study the electronic dynamics it requires
techniques which are sensitive to the electronic structure eg time-resolved X-ray
absorption spectroscopy (t-XAS) [274-276]
time-resolved angle-resolved photoelectron
spectroscopy (t-APRES) [277]
and time-resolved THz spectroscopy [278-280]
Another interesting topic on Bi is to observe the coherent Eg motion with X-ray
diffraction The excitation of the Eg mode has been demonstrated in many ultrafast
optical experiments [247 281]
which do not provide direct quantitative information on
the vibrational dynamics These dynamics can be retrieved directly with X-rays and
provide quantitative information about the amplitude of the Eg motion as well as the
coupling behavior between A1g modes and Eg modes Up to now only one study on
this topic has been performed at the Swiss Light Source (SLS) [282]
To completely
understand the displacive excitation of coherent phonons (DECP) mechanism and the
subsequent phonon dynamics more knowledge on the Eg motion is required The
extension of this study should be continued
In recent years sub-picosecond time-resolved X-ray diffuse scattering technique
became available This technique gives information on the phonon population
7 Summary and outlook
119
throughout the Brillouin zone and can yield the phonon dispersion [283]
Applying this
technique to investigate the phonon softening behavior in Bi must be an interesting
subject in the near future However this technique requires large photon flux and is
not possible to be carried out with the current laser plasma sources due to their low X-
ray output The appropriate X-Ray Sources are the new X-ray free electron lasers like
LCLS (USA) SACLA (Japan) or the later XFEL (Germany)
Appendixes
120
Appendixes
A Working principle of multilayer mirror
A multilayer optic is an artificial two dimensional crystal The spacing of the
multilayers is designed for specific radiation to satisfy Braggrsquos diffraction law As
shown in Fig A1 the incident X-rays are reflected by diffraction at a series of
interfaces between layers with differing indices of refraction Only the wavelength of
interest is effectively reflected others which do not satisfy the conditions for Bragg
reflection are absorbed in the mirror and are not reflected thus allowing the mirror to
produce a highly monochromatic beam
Fig A1 Multilayer working principle Reprint from the
manufacturer [284]
The focusing multilayer mirrors are realized by curving the mirror surfaces into
either parabolic or elliptical shapes The d-spacing (thickness of a single bi-layer) of
the multilayer coating is controlled along the mirror surface to satisfy Braggrsquos law at
every point (Fig A2) The band-pass of a multilayer optical system can be further
controlled by using different materials and layer configurations for various
applications
The multilayer X-ray optic used in the X-ray modular setup is twondashdimensional
reflection systems which is realized by using two VariMaxTM
multilayer X-ray
Appendixes
121
mirrors in a ldquoside-by-siderdquo Montel-Helios scheme (Fig A3) [188]
These two mirrors
are placed perpendicularly Each mirror independently reflects x-rays in one of the
two perpendicular directions With the ldquoside-by-siderdquo scheme both mirrors may be
positioned at a location appropriate to optimize performance parameters including
flux spectrum and divergence by adjusting four motorized actuators on the housing
Once the mirrors are adjusted the exact position of the X-ray point source and the
focus are defined
Fig A2 Graded d-Spacing Multilayer for focusing Reprint from the
manufacturer [284]
Fig A3 Scheme of the Montel-Helios configuration Reprint from
the manufacturer [284]
The multilayer X-ray optic prepared for the modular setup is produced by
Rigaku-OSMIC Inc The Specifications provided by the manufacturer are shown in
table A1
Appendixes
122
Parameters (units) CMF10-50Cu12
Characteristic line Cu Kα
Wavelength (Aring) 154
Effective focal spot size (mm) 001
Length of the mirror (mm) 120
Focal spot ndash mirror distance (mm) 100
Focal spot ndash sample distance (mm) 600
Bragg angle in the middle point (degree) 097
Reflectivity Kα (parts) 084
Rocking curve width (arcmin) 198
Capture angle (rad)
(degree)
00264
15133
Convergence angle (rad)
(degree)
00043
024
Focal spot usage efficiency (parts) 096
Beam width at mirror (mm) 264
Beam width at the optic entrance (mm) 106
Beam width at the optic exit (mm) 187
Beam width at the focus (mm) 0094
Optic efficiency (a u)
(Reflectivity Solid angle)
000045
Geometric magnification 15
Ravgsup2 (for double reflection) () 75
Distance X-ray sourcendashentrance of housing (mm) 30
Table A1 Specifications of the Cu Kα multilayer optic provided by
the manufacturer Rigaku-OSMIC Inc Reprint from Ref [186]
B X-ray detectors for diffracted signals
B 1 Direct detection camera
The Roper Scientific Pi-MTE 1300B from Princeton Instruments is an
innovative high-sensitivity imaging system designed to operate inside high-vacuum
chambers over long operation times The Pi-MTE 1300B incorporates a back-
illuminated CCD without AR coating for ultra-low-energy X-ray detection With
20times20 μm pixels and 100 fill factor this system offers a large imaging area with
very high spatial resolution and dynamic range The thermoelectrically cooled design
features PCBs thermally linked to the circulating coolant to provide reliable operation
inside vacuum chambers Its detail specifications are given in Table B1 This camera
is suitable for monitoring hard X-ray radiation due to its good quantum efficiency eg
55 for Ti Kα and 18 for Cu Kα (Fig B1)
As a direct detection camera the incidence photons are directly absorbed by the
active area of CCD pixels and generate charge signals The charge signals are strictly
Appendixes
123
proportional to the incident phonon energy For example the camera used here have
conversions that one Ti Kα (451 keV) photon gives a signal of ~589 counts and one
Cu Kα photon (805 keV) gives a signal of ~1050 counts In high flux condition (gt104
detected photons per pulse) the detected photon number can be easily deduced from
the value of integral signal (see in section 31) In low flux regime (for example 1
detected photon per 40 pixels) this camera can also be used as a multi-channel energy
detector A histogram of the CCD image corresponding to the energy spectrum can be
obtained [142]
and the number of detected photons can easily be deduced from this
histogram This function has been applied in the measurement of X-ray source
production in Chapter 2 Here one should notice that when the histogram is used to
calculate the detected photon number the multi- pixel event issue should be taken into
account
Table B1 Specifications of Roper camera Reprint from the
technical datasheet [285]
Appendixes
124
Fig B1 Quantum efficiency of Roper camera Reprint from the
technical datasheet [285]
Two major limitations of operating this camera should be pointed out The first
one is its working condition During the acquisition of a picture the charged coupled
device (CCD) will accumulate not only the signal from detected photons but also the
signal due to the dark current The dark current depends strongly on the temperature
on the detector Cooling down the detector is the typical way to reduce it In the
experiment the working temperature of the camera is -30deg C which is realized by an
integrated Peltier cooler under the chip Due to this low temperature to protect the
CCD from ice formation on the cooled parts the CCD chip should maintain under
vacuum It can be easily achieve in a big vacuum chamber for example in the
experiment of Chapter 2 For the modular setup the device needs to be operated in air
Additional configuration for keeping the vacuum inside the camera has been made A
special vacuum nose which isolates only the CCD has been installed into the camera
The nose needs to be continuously pumped to insure the required vacuum An Al
plate with a hole of approximately 1 cm2 covered by Beryllium window is installed at
Appendixes
125
the input of the camera which leads to only 14 of CCD size is available for the
exposure The second drawback of this detector is its rather slow readout time For
full size chip information it needs 17 seconds to read out the data The readout time
can be reduced for small regions of interest but it still remains more than 100 ms and
because of this the Roper camera can not be used with a 10 Hz repetition mode to
record each single X-ray pulse
B 2 Indirect detection camera
Pixel Resolution 1392times1040 (43 aspect ratio)
Effective pixel size at input 23 microns square
Active input size 32times24 mm (40mm diagonal)
Intensifier Ultra high-resolution (typically gt 60lpmm) low noise
Intensifier format 40mm diameter
Intensifier input window Coherent fiber optic
Gating Gated on when CCD is integrating off when not
acquiring
Gating speed Minimum gate period approx 100ns
Coupling to scintillators Via coherent straight fiber-optic
Scintillator material Gadolinium Oxysulphide 75mgcm2
Grey Scale Resolution 4096 grey levels (12bits)
Readout speed 20 MHz or 10 MHz pixel rate software selectable
Linearity No measurable deviation from linear response until
saturation
Saturation Approximately 13000 electrons
Video Gain User variable in software in 100 setups
Intensifier Gain User variable in software in 100 setups
On-chip binning User selectable 1times 1to 63 times 63
Exposure Time User selectable from 100μsec to 30 minutes
Readout Philosophy Correlated double sampling for highest accuracy fast 12
bit AD converter in head producing LVDS differential
format
Control PS Link 4 Line bi-directional Serial interface Using
LVDS drivers for reliability over long cables Parameters
that can be adjusted include image intensifier gain video
gain CCD integration period binning and sub-area
window
Power Requirements 110 or 230V ac 5060Hz
Operating Environment Temperature ndash Storage -10 to +80 degC
Operation 0 to +50 degC
Humidity ndash 0-80 RH non-condensing
Table B2 Specifications of Gemstar camera Reprint from the user
manual [273]
Appendixes
126
The Gemstar Camera from Photonic Science is an indirect detection camera Its
specifications are given in Table B2 The main feature of the indirect X-ray detection
is using a scintillator to transform the incoming signal into an optical signal which
can be easily detected and recorded This allows the quantum efficiency of certain
wavelengths like Cu Kα to be optimized by choosing an appropriate material The
scintillator inside this camera is made of a polycrystalline layer of Gadolinium
Oxysulphide which has a quantum efficiency of 85 for Cu Kα radiation When
incident photons are absorbed the scintillator emits photons in the visible range A
straight fiber-optic is used to couple them into the photocathode of the intensifier
These incoming photons produce photoelectrons from the photocathode The
produced electrons are sent through a multi channel plate (MCP) for a further step
amplification The amplification of MCP can be changed in the control software By
triggering the MCP by a camera trigger signal or an additional gate signal the
amplifying process can only be active for a short period during the presence of the X-
ray pulse therefore increasing the signal to noise ratio by reducing the background
signals This method could be very useful when multiple exposures of the Bragg
peaks are required After amplified by MCP the outcoming electrons hit on a
phosphor screen and produce phosphorescence whose intensity is proportional to the
number of incident electrons This light emitted from the screen is then collected by a
tapered fiber optic and sent onto a CCD sensor cooled by a peltier cooler which
allows images to be acquired with extended integration periods with minimal build-
up of CCD dark current This whole process allows the camera to work with a
repetition rate of 10 Hz when the On-Chip binning is set to large than 4times2 binning or
a small region of interest is selected This camera can record a sequence of pictures
containing every single X-ray pulse per picture
A major limitation of this camera is that it can not provide any information about
the energy of the incoming X-ray photons due to several conversion processes and
unlike a direct detection camera it can not be used for obtaining the energy spectrum
from a histogram of the image This type of camera is useful when the incoming
Appendixes
127
photons are monochromatic In this case the average signal from the chip can be
correlated with the average number of incoming photons
B 3 Avalanche Photodiode (APD)
Table B3 Specifications of APD Reprint from the technical
datasheet [286]
The avalanche photodiode is essentially a solid-state equivalent of PMTs
(photon-multiplier tubes) and can replace vacuum tube technology with compact
rugged silicon devices in many applications It is one of options for monitoring
diffracted X-ray signal if only the integrated signal is interesting A cooled large area
silicon avalanche photodiode produced by Laser Components which is assembled
with a homemade amplifier circuit is used for the modular setup Its specifications
and spectral response at visible light range are given in Table B3 and Fig B2
respectively
CHARACTERISTIC TEST
CONDITIONS
MIN TYP MAX UNIT
S
TO (Operating Temperature) +1 +40 degC
TS (Soldering Temperature) +240 deg C
VTEC (TEC Voltage) 43 V
ITEC (TEC Current) 2 A
P (APD Die Power Diss) 02 W
ID (Dark Current) 15 35 nA
CJ (Junction Capacitance) f = 1MHz 50 pF
λrange (Spectral Application Range) Spot Scan 350 1050 nm
R (Responsivity) λ=500nm VR=0V 35 AW
Vop (Operating Voltage) 1700 2000 V
tr (Response Time) RL=50Ωλ=675nm 12 18 nS
IQTEC (TEC Quiescent Current) Case Temp = 35degC 095 A
Appendixes
128
Fig B2 spectral response of APD at Gain = 300 Reprint from the
technical datasheet [286]
One of the advantages of this detector is that it can work at very high speed fast
enough to synchronize to the 10 Hz laser system Another advantage of APD is that it
has single photon sensitivity which allow to detecting weak signal and estimating the
number of detected photons However as a single channel detector the obvious
drawback of APD is that it gives no information on spatial resolution Shifts or
changes of profile of the Bragg peaks can not be observed with this detector during
the measurement It limits the use of the APD only in the experiments in which the
profiles of Bragg peaks do not change a lot during the laser excitation
C Sample material properties
The following relevant material parameters are used in this thesis They are
obtained from literatures WebElements (httpwwwwebelementscom) X-RAY
SERVER (httpsergeygmcaapsanlgovx0h_searchhtml) and X-ray Oriented
Programs (XOP) (httpwwwesrfeucomputingscientificxop21)
C 1 Cu
Name copper
Appendixes
129
Symbol Cu
Number 29
Standard atomic weight 63546
Electron configuration [Ar] 3d10
4s1
Electrons per shell 2 8 18 1
Density 894 gmiddotcmminus3
Crystal structure face-centered cubic
Melting point 1358 K
Specific heat capacity (25 degC) 24440 Jmiddotmolminus1
middotKminus1
Bulk modulus 140 GPa
Kα1 804778 eV λ = 154060410 Aring
Kα2 802783 eV λ = 154443266 Aring
Kβ 890529 eV λ = 139225593 Aring
Sample thickness 10microm 20 microm foil and 300nm thin film on glass substrate
C 2 Ti
Name titanium
Symbol Ti
Number 22
Standard atomic weight 47867
Electron configuration [Ar] 3d2 4s
2
Electrons per shell 2 8 10 2
Density 4506 gmiddotcmminus3
Crystal structure hexagonal
Melting point 1941 K
Specific heat capacity (25 degC) 25060 Jmiddotmolminus1
middotKminus1
Bulk modulus 110 GPa
Kα1 451084 eV λ = 274858848 Aring
Kα2 450486 eV λ = 275223711 Aring
Kβ 493181 eV λ = 251397415 Aring
Sample thickness 20 microm foil and 300nm thin film on glass substrate
C 3 Au
Name gold
Symbol Au
Number 79
Standard atomic weight 196966569
Electron configuration [Xe] 4f14
5d10
6s1
Electrons per shell 2 8 18 32 18 1
Density 1930 gmiddotcmminus3
Appendixes
130
Melting point 133733 K
Specific heat capacity (25 degC) 25418 Jmiddotmolminus1
middotKminus1
Speed of sound 324 kms (polycrystalline)
339 kms (single crystalline 111-direction)
Linear thermal expansion (25 degC) 142 micrommiddotmminus1
middotKminus1
Thermal conductivity (300 K) 318 Wmiddotmminus1
middotKminus1
Optical constants n=0181 k=5125 800 nm
Fig C1 Reflectivity of Gold at 800nm calculated from Fresnel
equations
Sample thickness 150nm on mica substrate and 200nm free standing film
Crystal structure Lattice face centered cubic
Symmetry group Cubic
Unit cell constant a = b = c = 40782 Aring
Unit cell angles α = β = γ = 90deg
X-ray wavelength 1540562 Aring
X-ray energy 8047984 keV
X-ray characteristic line Cu-K α1
Surface plane indices (1 1 1)
Appendixes
131
Fig C2 Bragg reflection of Au (333) calculated from XOP (a) P-
polarized beam and (b) S-polarized beam
Appendixes
132
Planes found 9 Planes being displayed 9
hkl Angle to surface Bragg angle Relative Intensity
xhx0()
(1 1 1) 00049 190956 824245
(1 1 3) 294962 387877 626630
(1 3 1) 294962 387877 626630
(1 3 3) 220017 554164 526226
(2 2 2) 00049 408660 610997
(3 1 1) 294962 387877 626630
(3 1 3) 220017 554164 526226
(3 3 1) 220017 554164 526226
(3 3 3) 00143 789431 460119
Table C1 Bragg angle data of Au obtained from X-RAY SERVER
C 4 Bi
Name bismuth
Symbol Bi
Number 83
Standard atomic weight 20898040
Electron configuration [Xe] 4f14
5d10
6s2 6p
3
Electrons per shell 2 8 18 32 18 5
Electrical Conductivity 867 times 105 Ωm
minus1
Density 978 gmiddotcmminus3
Melting point 5447 K
Specific heat capacity (25 degC) 2552 Jmiddotmolminus1
middotKminus1
Linear thermal expansion (25 degC) 134 micrommiddotmminus1
middotKminus1
Thermal conductivity (300 K) 797 Wmiddotmminus1
middotKminus1
Optical constants n= 28324 k= 45191 800 nm
Appendixes
133
Fig C3 Reflectivity of Bismuth at 800nm calculated from Fresnel
equations
Sample thickness 50nm on Si wafer
Crystal structure Bismuth-fcc
Symmetry group Trigonal (Rhombohedral distortion)
Unit cell constant a = b = c = 65720 Aring
Unit cell angles α = β = γ = 87570 deg
X-ray wavelength 1540562 Aring
X-ray energy 8047984 keV
X-ray characteristic line Cu-K α1
Surface plane indices (1 1 1)
Planes found 9 Planes being displayed 9
hkl Angle to surface Bragg angle Relative Intensity
xhx0()
(1 1 1) 00035 112396 682238
(1 1 3) 310515 222835 575184
(1 3 1) 310515 222835 575184
(1 3 3) 232706 296742 511918
Appendixes
134
(2 2 2) 00035 229435 695383
(3 1 1) 310515 222835 575184
(3 1 3) 232706 296742 511918
(3 3 1) 232706 296742 511918
(3 3 3) 00163 357843 462169
Table C2 Bragg angle data of Bi obtained from X-RAY SERVER
Appendixes
135
Fig C4 Bragg reflection of Bi (111) and (222) calculated from XOP
(a) and (c) P-polarized beam (b) and (d) S-polarized beam
Bibliography
136
Bibliography
[1] W C Roumlntgen ldquoOn a new kind of Rayrdquo Nature 53 274-277 (1896) translated
by A Stanton from W C Roumlntgen ldquoUumlber eine neue Art von Strahlenrdquo Sitz
ber an die med-phys Gesellschaft Wuumlrzburg (1895)
[2] C Davisson and L H Germer ldquoThe Scattering of Electrons by a Single Crystal
of Nickelrdquo Nature 119 558 (1927)
[3] G P Thomson and A Reid ldquoDiffraction of Cathode Rays by a Thin Filmrdquo
Nature 119 890 (1927)
[4] C G Shull ldquoEarly development of neutron scatteringrdquo Rev Mod Phys 67 753
(1995)
[5] D Strickland and G Mourou ldquoCompression of Amplified Chirped Optical
Pulsesrdquo Optics Communications 55 447 (1985)
[6] D Strickland and G Mourou ldquoCompression of Amplified Chirped Optical
Pulses rdquo Optics Communications 56 219 (1985)
[7] D Kuumlhlke U Herpes D von der Linde ldquoSoft x-ray emission from subpicosend
laser-produced plasmardquo Appl Phys Lett 50 1785 (1987)
[8] M M Murnane H C Kapteyn M D Rosen R W Falcone ldquoUltrafast X-ray
Pulses from Laser-Produced Plasmasrdquo Science 251 531 (1991)
[9] A Rousse P Audebert J P Geindre F Fall and J C Gauthier ldquoEfficient Kα
X-ray source from femtosecond laser-produced plasmasrdquo Phys Rev E 50 2200
(1994)
[10] J C Williamson J Cao H Ihee H Frey and A H Zewail ldquoClocking transient
chemical changes by ultrafast electron diffractionrdquo Nature 386 159 (1997)
[11] CY Ruan V A Lobastov R Srinivasan B M Goodson H Ihee and A H
Zewail ldquoUltrafast diffraction and structural dynamics The nature of complex
molecules far from equilibriumrdquo Proc National Acad Sci USA 98 7117
(2001)
[12] B J Siwick J R Dwyer R E Jordan and R J D Miller ldquoUltrafast electron
optics Propagation dynamics of femtosecond electron packetsrdquo J Appl Phys
92 1643 (2002)
[13] B J Siwick J R Dwyer R E Jordan and R J Dwayne Miller ldquoAn Atomic-
Level View of Melting Using Femtosecond Electron Diffractionrdquo Science 302
1382 (2003)
[14] R W Schoenlein S Chattopadhyay H H W Chong T E Glover P A
Heimann C V Shank A A Zholents and M S Zolotorev ldquoGeneration of
Femtosecond Pulses of Synchrotron Radiationrdquo Science 287 2237 (2000)
[15] S Khan K Holldack T Kachel R Mitzner and T Quast ldquoFemtosecond
Undulator Radiation from Sliced Electron Bunchesrdquo Phys Rev Lett 97
074801 (2006)
Bibliography
137
[16] G Ingold P Beaud S L Johnson D Grolimund V Schlott T Schmidt and A
Streun ldquoTechnical Report FEMTO A Sub-ps Tunable Hard X-ray Undulator
Source for LaserX-ray Pump-Probe Experiments at the SLSrdquo Sync Rad News
20 Issue 5 35 (2007)
[17] A L Cavalieri et al ldquoClocking Femtosecond X Raysrdquo Phys Rev Lett 94
114801 (2005)
[18] A M Lindenberg et al ldquoAtomic scale visualization of inertial dynamicsrdquo
Science 308 392 (2005)
[19] A Egbert B N Chichkov and A Ostendorf ldquoUltrashort X-ray source driven by
femtosecond laser pulsesrdquo Europhys Lett 56 228 (2001)
[20] A Egbert B Mader B Tkachenko C Fallnich B N Chichkov H Stiel and P
V Nickles ldquoHigh-repetition rate femtosecond laser-driven hard-x-ray sourcerdquo
Appl Phys Lett 81 2328 (2002)
[21] U Hinze A Egbert B Chichkov and K Eidmann ldquoGeneration of picosecond
hard-x-ray pulses in a femtosecond-laser-driven x-ray dioderdquo Optics Letters 29
2079 (2004)
[22] E Seres J Seres F Krausz C Spielmann ldquoGeneration of Coherent Soft-X-Ray
Radiation Extending Far Beyond the Titanium L Edgerdquo Phys Rev Lett 92
163002 (2004)
[23] J Seres E Seres A J Verhoef G Tempea C Streli P Wobrauschek V
Yakovlev A Scrinzi C Spielmann and F Krausz ldquoLaser technology Source
of coherent kiloelectronvolt X-raysrdquo Nature 433 596 (2005)
[24] Ch Spielmann N H Burnett S Sartania R Koppitsch M Schnuumlrer C Kan
M Lenzner P Wobrauschek F Krausz ldquoGeneration of Coherent X-rays in the
Water Window Using 5-Femtosecond Laser Pulsesrdquo Science 278 661 (1997)
[25] J Zhou J Peatross M M Murnane and H C Kapteyn ldquoEnhanced High-
Harmonic Generation Using 25 fs Laser Pulsesrdquo Phys Rev Lett 76 752
(1996)
[26] A Rousse K Ta Phuoc R Shah A Pukhov E Lefebvre V Malka S Kiselev
F Burgy J P Rousseau D Umstadter and D Hulin ldquoProduction of a keV X-
Ray Beam from Synchrotron Radiation in Relativistic Laser-Plasma
Interactionrdquo Phys Rev Lett 93 135005 (2004)
[27] V Malka J Faure Y A Gauduel E Lefebvre A Rousse and K Ta Phuoc
ldquoPrinciples and applications of compact laserndashplasma acceleratorsrdquo Nature
Physics 4 447 (2008)
[28] H-P Schlenvoigt K Haupt A Debus F Budde O Jaumlckel S Pfotenhauer H
Schwoerer E Rohwer J G Gallacher E Brunetti R P Shanks S M
Wiggins and D A Jaroszynski ldquoA compact synchrotron radiation source driven
by a laser-plasma wakefield acceleratorrdquo Nature Physics 4 130 (2008)
[29] K Nakajima ldquoCompact X-ray sources Towards a table-top free-electron laserrdquo
Nature Physics 4 92 (2008)
Bibliography
138
[30] httpwww-ssrlslacstanfordedulclsindexhtml
[31] T Ishikawa et al ldquoA compact X-ray free-electron laser emitting in the sub-
aringngstroumlm regionrdquo Nature Photon 6 540 (2012)
[32] httpwwwxfeleuXFELpresseenhintergrundwasindexhtml
[33] M Altarelli et al The European X-ray Free-electron Laser (DESY Technical
Report Hamburg Germany)
[34] S Kneip C McGuffey F Dollar M S Bloom V Chvykov G Kalintchenko
K Krushelnick A Maksimchuk S P D Mangles T Matsuoka Z Najmudin
C A J Palmer J Schreiber W Schumaker A G R Thomas and V
Yanovsky ldquoX-ray phase contrast imaging of biological specimens with
femtosecond pulses of betatron radiation from a compact laser plasma wakefield
acceleratorrdquo Appl Phys Lett 99 093701 (2011)
[35] K Ta Phuoc S CordeC Thaury V Malka A Tafzi J P GoddetR C Shah
S Sebban A Rousse ldquoAll-optical Compton gamma-ray sourcerdquo Nature
Photonics 6 308 (2012)
[36] J Ju K Svensson A Doumlpp H E Ferrari K Cassou O Neveu G Genoud F
Wojda M Burza A Persson O Lundh C-G Wahlstroumlm and B Cros
ldquoEnhancement of x-rays generated by a guided laser wakefield accelerator
inside capillary tubesrdquo Appl Phys Lett 100 191106 (2012)
[37] M Schnell A Saumlvert B Landgraf M Reuter M Nicolai O Jaumlckel C Peth T
Thiele O Jansen A Pukhov O Willi M C Kaluza and C Spielmann
ldquoBetatron radiation based measurement of the electron-beam size in a wakefield
acceleratorrdquo AIP Conf Proc 1462 231 (2011)
[38] S Corde C Thaury K Ta Phuoc A Lifschitz G Lambert J Faure O Lundh
E Benveniste A Ben-Ismail L Arantchuk A Marciniak A Stordeur P
Brijesh A Rousse A Specka and V Malka ldquoMapping the X-Ray Emission
Region in a Laser-Plasma Acceleratorrdquo Phys Rev Lett 107 215004 (2011)
[39] C Rischel A Rousse I Uschmann P A Albouy J P Geindre P Audebert J
C Gauthier E Foumlrster J L Martin and A Antonetti ldquoFemtosecond time-
resolved X-ray diffraction from laser heated organic filmsrdquo Nature 390 490
(1997)
[40] T Pfeifer C Spielmann and G Gerber ldquoFemtosecond X-ray sciencerdquo Rep
Prog Phys 96 443 (2006)
[41] M Bargheer N Zhavoronkon M Woerner and T Elsaesser ldquoRecent progress
in ultrafast X-ray diffractionrdquo Chem Phys Chem 7 783 (2006)
[42] C Rose-Petruck R Jimenez T Guo A Cavalleri C W Siders F Rksi J A
Squier B C Walker K R Wilson and C P J Barty ldquoPicosecondndash
milliaringngstroumlm lattice dynamics measured by ultrafast X-ray diffractionrdquo Nature
398 310 (1999)
Bibliography
139
[43] A H Chin R W Schoenlein T E Glover P Balling W P Leemans and C
V Shank ldquoUltrafast Structural Dynamics in InSb Probed by Time-Resolved X-
Ray Diffractionrdquo Phys Rev Lett 83 336 (1999)
[44] AM Lindenberg I Kang S L Johnson T Missalla P A Heimann Z Chang
JLarsson P H Bucksbaum H C Kapteyn H A Padmore R W Lee J S
Wark and R W Falcone ldquoTime-resolved X-ray diffraction from coherent
phonons during a laser-induced phase transitionrdquo Phys Rev Lett 84 111
(2000)
[45] A Cavalleri C W Siders F L H Brown D M Leitner C Toacuteth J A Squier
C P J Barty K R Wilson K Sokolowski-Tinten M Horn von Hoegen and
D von der Linde M Kammler ldquoAnharmonic Lattice Dynamics in Germanium
Measured with Ultrafast X-Ray Diffractionrdquo Phys Rev Lett 85 586 (2000)
[46] A Cavalleri C W Siders C Rose-Petruck R Jimenez C Toacuteth J A Squier C
PJ Barty K R Wilson K Sokolowski-Tinten M Horn-von Hoegen and D
von der Linde ldquoUltrafast x-ray measurement of laser heating in semiconductors
Parameters determining the melting thresholdrdquo Phys Rev B 63 193306 (2001)
[47] D A Reis M F DeCamp P H Bucksbaum R Clarke E Dufresne M
Hertlein R Merlin R Falcone H Kapteyn M M Murnane J Larsson Th
Missalla and J S Wark ldquoProbing impulsive strain propagation with X-Ray
pulsesrdquo Phys Rev Lett 86 3072 (2001)
[48] M F DeCamp D A Reis P H Bucksbaum B Adams J M Caraher R
Clarke C W S Conover E M Dufresne R Merlin V Stoica and J K
Wahlstrand ldquoCoherent control of pulsed X-ray beamsrdquo Nature 413 825 (2001)
[49] D von der Linde K Sokolowski-Tinten Ch Blome C Dietrich A Tarasevitch
A Cavalleri and J A Squier ldquoUltrafast extended to X-rays Femtosecond
time-resolved X-ray diffractionrdquo Z f Phys Chemie 215 1527 (2001)
[50] J Larsson A Allen P H Bucksbaum R W Falcone A Lindenberg G
Naylor T Missalla D A Reis K Scheidt A Sjoumlgren P Sondhauss M Wulff
and J SWark ldquoPicosecond X-ray diffraction studies of laser-excited acoustic
phonons in InSbrdquo Appl Phys A 75 467 (2002)
[51] O Synnergren M Harbst T Missalla J Larssona G Katona R Neutze and R
Wouts ldquoProjecting picosecond lattice dynamics through x-ray topographyrdquo
Appl Phys Lett 80 3727 (2002)
[52] A M Lindenberg I Kang S L Johnson R W Falcone P A Heimann Z
Chang R W Lee and J S Wark ldquoCoherent control of phonons probed by
time-resolved x-ray diffractionrdquo Opt Lett 27 869 (2002)
[53] M F DeCamp D A Reis A Cavalieri P H Bucksbaum R Clarke R Merlin
EM Dufresne D A Arms A M Lindenberg AG MacPhee Z Chang B
Bibliography
140
Lings J SWark and S Fahy ldquoTransient strain driven by a dense electron-hole
plasmardquo Phys Rev Lett 91 165502 (2003)
[54] M Bargheer N Zhavoronkov Y Gritsai J C Woo D S Kim M Woerner
and T Elsaesser ldquoCoherent atomic motions in a nanostructure studied by
femtosecond X-ray diffractionrdquo Science 306 1771 (2004)
[55] M F DeCamp D A Reis D M Fritz P H Bucksbaum E M Dufresneb and
Roy Clarke ldquoX-ray synchrotron studies of ultrafast crystalline dynamicsrdquo J
Synchrotron Rad 12 177 (2005)
[56] S H Lee A L Cavalieri D M Fritz M C Swan R S Hegde M Reason R
S Goldman and D A Reis ldquoGeneration and propagation of a picosecond
acoustic pulse at a buried interface Time-resolved X-ray diffraction
measurementsrdquo Phys Rev Lett 95 246104 (2005)
[57] Y Hayashi Y Tanaka T Kirimura N Tsukuda E Kuramoto and T Ishikawa
ldquoAcoustic pulse echoes probed with time-resolved X-ray triple-crystal
diffractometryrdquo Phys Rev Lett 96 115505 (2006)
[58] C V Korff Schmising M Bargheer M Kiel N Zhavoronkov MWoerner T
Elsaesser I Vrejoiu D Hesse and M Alexe ldquoStrain propagation in
nanolayered perovskites probed by ultrafast x-ray diffractionrdquo Phys Rev B 73
212202 (2006)
[59] A Morak T Kaumlmpfer I Uschmann A Luumlbcke E Foumlrster and R Sauerbrey
ldquoAcoustic phonons in InSb probed by time-resolved x-ray diffractionrdquo Phys
Stat Sol b 243 2728 (2006)
[60] H Enquist H Navirian T N Hansen A M Lindenberg P Sondhauss
OSynnergren J SWark and J Larsson ldquoLarge Acoustic Transients Induced
by Nonthermal Melting of InSbrdquo Phys Rev Lett 98 225502 (2007)
[61] M Nicoul U Shymanovich A Tarasevitch D von der Linde and K
Sokolowski-Tinten ldquoPicosecond acoustic response of a laser-heated Gold-film
studied with time-resolved X-ray diffractionrdquo Appl Phys Lett 98 191902
(2011)
[62] R Shayduk H Navirian W Leitenberger J Goldshteyn I Vrejoiu M
Weinelt P Gaal M Herzog C v Korff Schmising and M Bargheer
ldquoNanoscale heat transport studied by high-resolution time-resolved x-ray
diffractionrdquo New Journal of Physics 13 093032 (2011)
[63] M Herzog D Schick W Leitenberger R Shayduk R M van der Veen C J
Milne S L Johnson I Vrejoiu and M Bargheer ldquoTailoring interference and
nonlinear manipulation of femtosecond x-raysrdquo New Journal of Physics 14
013004 (2012)
[64] M Herzog D Schick P Gaal R Shayduk C v Korff Schmising M Bargheer
ldquoAnalysis of ultrafast X-ray diffraction data in a linear-chain model of the
lattice dynamicsrdquo Appl Phys A 106 489 (2012)
Bibliography
141
[65] M Herzog A Bojahr J Goldshteyn W Leitenberger I Vrejoiu D Khakhulin
M Wulff R Shayduk P Gaal and M Bargheer ldquoDetecting optically
synthesized quasi-monochromatic sub-terahertz phonon wavepackets by
ultrafast x-ray diffractionrdquo Appl Phys Lett 100 094101 (2012)
[66] C V Korff Schmising A Harpoeth N Zhavoronkov M Woerner T
Elsaesser M Bargheer M Schmidbauer I Vrejoiu D Hesse and M Alexe
ldquoFemtosecond X-ray diffraction from nanolayered oxidesrdquo Physics Procedia
3333 (2010)
[67] S L Johnson P Beaud E Vorobeva C J Milne EacuteD Murray S Fahy and G
Ingold ldquoNon-equilibrium phonon dynamics studied by grazing-incidence
femtosecond X-ray crystallographyrdquo Acta Cryst A 66 157 (2010)
[68] K Sokolowski-Tinten C Blome J Blums A Cavalleri C Dietrich A
Tarasevitch I Uschmann E Foumlrster M Kammler M Horn-von Hoegen and D
von der Linde ldquoFemtosecond X-ray measurement of coherent lattice vibrations
near the Lindemann stability limitrdquo Nature 422 287 (2003)
[69] D M Fritz et al ldquoUltrafast bond softening in Bismuth Mapping a solids
interatomic potential with X-raysrdquo Science 315 633 (2007)
[70] M Bargheer N Zhavoronkov J C Woo D S Kim M Woerner and T
ElsaesserldquoExcitation mechanisms of coherent phonons unravelled by
femtosecond X-ray diffractionrdquo Phys Stat Sol (b) 243 2389 (2006)
[71] C von Korff Schmising M Bargheer M Kiel N Zhavoronkov M Woerner
TElsaesser I Vrejoiu D Hesse and M Alexe ldquoAccurate time delay
determination for femtosecond X-ray diffraction experimentsrdquo Appl Phys B 88
1 (2007)
[72] B Freyer J Stingl F Zamponi M Woerner and T Elsaesser ldquoThe rotating-
crystal method in femtosecond X-ray diffractionrdquo Optics Express 19 15506
(2011)
[73] S L Johnson P Beaud C J Milne F S Krasniqi E S Zijlstra M E Garcia
M Kaiser D Grolimund R Abela and G Ingold ldquoNanoscale Depth-Resolved
Coherent Femtosecond Motion in Laser-Excited Bismuthrdquo Phys Rev Lett 100
155501 (2008)
[74] K H Bennemann ldquoUltrafast dynamics in solidsrdquo J Phys Condens Matter 16
R995 (2004)
[75] C W Siders A Cavalleri K Sokolowski-Tinten Cs Toacuteth T Guo M
Kammler M Horn von Hoegen K R Wilson D von der Linde and C P J
Barty ldquoDetection of Nonthermal Melting by Ultrafast X-ray Diffractionrdquo
Science 286 1340 (1999)
[76] K Sokolowski-Tinten C Blome C Dietrich A TarasevitchM Horn-von
Hoegen D von der Linde A Cavalleri J Squier and M Kammler
Bibliography
142
ldquoFemtosecond X-ray measurement of ultrafast melting and large acoustic
transientsrdquo Phys Rev Lett 87 225701 (2001)
[77] T Feurer A Morak I Uschmann Ch Ziener H Schwoerer Ch Reich P
Gibbon E Foumlrster R Sauerbrey K Ortner and C R Becker ldquoFemtosecond
silicon Kα pulses from laser-produced plasmasrdquo Phys Rev E 65 016412
(2001)
[78] A Rousse C Rischel S Fourmaux I Uschmann S Sebban G Grillon P
Balcou E Foumlrster J P Geindre P Audebert J C Gauthier and D Hulin
ldquoNon-thermal melting in semiconductors measured at femtosecond resolutionrdquo
Nature 410 65 (2001)
[79] K J Gaffney et al ldquoObservation of Structural Anisotropy and the Onset of
Liquidlike Motion During the Nonthermal Melting of InSbrdquo Phys Rev Lett
95 125701 (2005)
[80] P B Hillyard et al ldquoCarrier-density-dependent lattice stability in InSbrdquo Phys
RevLett 98 125501 (2007)
[81] G Sciaini M Harb S G Kruglik T Payer C T Hebeisen F -J Meyer zu
Heringdorf M Yamaguchi M Horn von Hoegen R Ernstorfer and R J D
Miller ldquoElectronic acceleration of atomic motions and disordering in bismuthrdquo
Nature 458 56 (2009)
[82] E Collet et al ldquoLaser-Induced Ferroelectric Structural Order in an Organic
Charge-Transfer Crystalrdquo Science 300 612 (2003)
[83] A Cavalleri S Wall C Simpson E Statz D W Ward K A Nelson M Rini
R W Schoenlein ldquoTracking the motion of charges in a terahertz light field by
femtosecond X-ray diffractionrdquo Nature 442 664 (2006)
[84] SK Streiffer JA Eastman DD Fong C Thompson A Munkholm MV
Ramana Murty O Auciello GR Bai GB Stephenson ldquoObservation of
nanoscale 180 deg stripe domains in ferroelectric PbTiO3 thin filmsrdquo Phys Rev
Lett 89 067601 (2002)
[85] RV Wang DD Fong F Jiang MJ Highland PH Fuoss C Thompson A
M Kolpak J A Eastman S K Streiffer A M Rappe and G B Stephenson
ldquoReversible chemical switching of a ferroelectric filmrdquo Phys Rev Lett 102
047601 (2009)
[86] M Woerner C v Korff Schmising M Bargheer N Zhavoronkov I Vrejoiu
D Hesse M Alexe and T Elsaesser ldquoUltrafast structural dynamics of
perovskite superlatticesrdquo Applied Physics A 96 83 (2009)
[87] D Daranciang M J Highland H Wen et al ldquoUltrafast photovoltaic response
in ferroelectric nanolayersrdquo Phys Rev Lett 108 087601 (2012)
[88] I Radu C Stamm N Pontius T Kachel P Ramm J-U Thiele H A Duumlrr
and C H Back ldquoLaser-induced generation and quenching of magnetization on
FeRh studied with time-resolved x-ray magnetic circular dichroismrdquo Phys Rev
B 81 104415 (2010)
Bibliography
143
[89] U Shymanovich F Quirin M Vattilana W Lu M Nicoul A-E El-Kamhawy
A Tarasevitch D von der Linde K Sokolowski-Tinten ldquoUltrafast lattice
dynamics in FeRh during a laser-induced magnetic phase transitionrdquo Ultrafast
Phenomena XVII Oxford University Press (2011)
[90] C Stamm T Kachel N Pontius R Mitzner T Quast K Holldack S Khan C
Lupulescu E F Aziz M Wietstruk H A Duumlrr and W Eberhardt
ldquoFemtosecond modification of electron localization and transfer of angular
momentum in nickelrdquo Nature Materials 6 740 (2007)
[91] C Stamm J-U Thiele T Kachel I Radu P Ramm M Kosuth J Minaacuter H
Ebert H A Duumlrr W Eberhardt and C H Back ldquoAntiferromagnetic-
ferromagnetic phase transition in FeRh probed by x-ray magnetic circular
dichroismrdquo Phys Rev B 77 184401 (2008)
[92] M Wietstruk A Melnikov Ch Stamm T Kachel N Pontius M Sultan C
Gahl MWeinelt H A Duumlrr U Bovensiepen ldquoHot electron driven
enhancement of spin-lattice coupling in 4f ferromagnets observed by
femtosecond x-ray magnetic circular dichroismrdquo Phys Rev Lett 106 127401
(2011)
[93] C Boeglin E Beaurepaire V Halteacute V Loacutepez-Flores C Stamm N Pontius H
A Duumlrr and J-Y Bigo ldquoDistinguishing the ultrafast dynamics of spin and
orbital moments in solidsrdquo Nature 465 458 (2010)
[94] C Stamm N Pontius T Kachel M Wietstruk and H A Duumlrr ldquoFemtosecond
x-ray absorption spectroscopy of spin and orbital angular momentum in
photoexcited Ni films during ultrafast demagnetizationldquo Phys Rev B 81
104425 (2010)
[95] H A Duumlrr ldquoFemtosecond electron and spin dynamics in ferromagnetic Ni
probed by UV and soft X-ray pulsesldquo Nucl Instr and Meth A 601 132 (2009)
[96] J Miguel J Saacutenchez-Barriga D Bayer J Kurde B Heitkamp M Piantek F Kronast
M Aeschlimann H A Duumlrr and W Kuch ldquoTime-resolved magnetization
dynamics of cross-tie domain walls in permalloy microstructuresrdquo J Phys
Condens Matter 21 496001 (2009)
[97] T Kachel N Pontius C Stamm M Wietstruk E F Aziz H A Duumlrr W
Eberhardt and F M F de Groot ldquoTransient electronic and magnetic structures
of nickel heated by ultrafast laser pulsesrdquo Phys Rev B 80 092404 (2009)
[98] H A Duumlrr C Stamm T Kachel N Pontius R Mitzner T Quast K
Holldack S Khan C Lupulescu EF Aziz M Wietstruk W Eberhardt
ldquoUltrafast Electron and Spin Dynamics in Nickel Probed With Femtosecond X-
Ray Pulsesrdquo IEEE Trans Magn 44 1957 (2008)
[99] S L Johnson et al ldquoFemtosecond Dynamics of the Collinear-to-Spiral
Antiferromagnetic Phase Transition in CuOrdquo Phys Rev Lett 108 037203
(2012)
Bibliography
144
[100] K A Seu S Roy J J Turner S Park C M Falco and S D Kevan ldquoCone
phase and magnetization fluctuations in AuCoAu thin films near the spin-
reorientation transitionrdquo Phys Rev B 82 012404 (2010)
[101] I Radu K Vahaplar C Stamm T Kachel N Pontius H A Duumlrr T A
Ostler J Barker R F L Evans R W Chantrell A Tsukamoto A Itoh A
Kirilyuk Th Rasing and A V Kimel ldquoTransient ferromagnetic-like state
mediating ultrafast reversal of antiferromagnetically coupled spinsrdquo Nature
472 205 (2011)
[102] K Holldack N Pontius E Schierle T Kachel V Soltwisch R Mitzner T
Quast G Springholz and E Weschke ldquoUltrafast dynamics of
antiferromagnetic order studied by femtosecond resonant soft x-ray diffractionrdquo
Appl Phys Lett 97 062502 (2010)
[103] A Kirilyuk A Kimel and T Rasing ldquoUltrafast optical manipulation of
magnetic orderrdquo Rev Mod Phys 82 2731 (2010)
[104] F Quirin M Vattilana U Shymanovich A-E El-Kamhawy A Tarasevitch
J Hohlfeld D von der Linde and K Sokolowski-Tinten ldquoStructural dynamics
in FeRh during a laser-induced metamagnetic phase transitionrdquo Phys Rev
B 85 020103(R) (2012)
[105] U Shymanovich M Nicoul W Lu S Kaumlhle A Tarasevitch K Sokolowski-
Tinten and D von der Linde ldquoTowards ultrafast time-resolved Debye-Scherrer
Xray diffraction using a laser-plasma sourcerdquo Rev Sci Instrum 80 083102
(2009)
[106] F Zamponi Z Ansari M Woerner and T Elsaesser ldquoFemtosecond powder
diffraction with a laser-driven hard X-ray sourcerdquo Optics Express 18 947
(2010)
[107] F Zamponi Z Ansari C v Korff Schmising P Rothhardt N Zhavoronkov
M Woerner T Elsaesser M Bargheer T Trobitzsch-Ryll and M Haschke
ldquoFemtosecond hard X-ray plasma sources with a kilohertz repetition raterdquo Appl
Phys A 96 51 (2009)
[108] J Stingl F Zamponi B Freyer M Woerner T Elsaesser and A Borgschulte
ldquoStrong-field electron transfer in a virtual quantum state mapped by
femtosecond x-ray diffractionrdquo Phys Rev Lett 109 147402 (2012)
[109] M J J Vrakking and T Elsaesser ldquoX-rays inspire electron moviesrdquo Nature
Photon 6 645 (2012)
[110] F Zamponi J Stingl M Woerner and T Elsaesser ldquoUltrafast soft-mode
driven charge relocation in an ionic crystalrdquo Physical Chemistry Chemical
Physics (PCCP) 14 6156 (2012)
[111] M Trigo J Chen V H Vishwanath Y M Sheu T Graber R Henning and
D A Reis ldquoImaging nonequilibrium atomic vibrations with x-ray diffuse
scatteringrdquo Physical Review B 82 235205(2010)
Bibliography
145
[112] A M Lindenberg et al ldquoX-Ray Diffuse Scattering Measurements of
Nucleation Dynamics at Femtosecond Resolutionrdquo Phys Rev Lett 100
135502 (2008)
[113] M Born and E Wolf Principles of optics Cambridge University Press (1988)
[114] G Jenke ldquoErzeugung von XUV- und Roumlntgenstralung mit Femtosecunden-
Laserimpulsenrdquo Dissertation (1999)
[115] Z Jiang J C Kieffer J P Matte M Chaker O Peyrusse D Gilles GKorn
A Maksimchuk S Coe and G Mourou ldquoX-ray spectroscopy of hot solid
density plasmas produced by subpicosecond high contrast laser pulses at 1018
ndash
1019
Wcm2rdquoPhys Plasmas 2 1702 (1995)
[116] F Brunel ldquoNot-So Resonant Resonant Absorptionrdquo Phys Rev Lett 59 52
(1987)
[117] S C Wilks and W L Kruer ldquoAbsorption of ultrashort ultra-intense laser light
by solids and overdense plasmasrdquo IEEE J Quan Electron 33 1954 (1997)
[118] S Bastiani A Rousse J P Geindre P Audebert C Quoix G Hamoniaux A
Antonettia and J C Gauthier ldquoExperimental study of the interaction of
subpicosecond laser pulses with solid targets of varying initial scale lengthsrdquo
Phys Rev E 56 7179 (1997)
[119] P Gibbon E Foumlrster ldquoShort-pulse laser-plasma interactionsrdquo Plasma Phys
Control Fusion 38 769 (1996)
[120] T Feurer A Morak I Uschmann Ch Ziener H Schwoumlrer E Foumlrster and R
Sauerbrey ldquoAn incoherent sub-picosecond X-ray source for time-resolved X-
ray-diffraction experimentsrdquo Appl Phys B Lasers Opt 72 15 (2001)
[121] C Reich P Gibbon I Uschmann and E Foumlrster ldquoYield optimization and time
structure of femtosecond laser plasma Kα sourcesrdquo Phys Rev Lett 84 4846
(2000)
[122] T Guo Ch Spielmann B C Walker C P J Barthy ldquoGeneration of hard X-
rays by ultrafast terawatt lasersrdquo Rev Sci Instr 72 41 (2001)
[123] R Fedosejevs R Ottmann R Sigel G Kuumlhnle S Szatmaacuteri F P Schaumlfer
ldquoAbsorption of subpicosecond ultraviolet laser pulses in high-density plasmardquo
ApplPhyB 50 79 (1990)
[124] C A Quarles ldquoSemiempirical analysis of electron-induced K-shell ionizationrdquo
Phys Rev A 13 1278 (1976)
[125] W E Burcham Elements of Nuclear Physics Pearson (1979)
[126] E Casnati A Tartari and C Baraldi ldquoAn empirical approach to K-shell ionisation
cross section by electronsrdquo J Phys B 15 155 (1982)
[127] P Gibbon A Andreev E Lefebvre G Bonnaud H Ruhl J Delettrez and A
R Bell ldquoCalibration of one-dimensional boosted kinetic codes for modeling
high-intensity laserndashsolid interactionsrdquo Phys Plasmas 6 947 (1999)
Bibliography
146
[128] DC Joy Monte Carlo Modeling for Electron Microscopy and Microanalysis
Oxford University Press Oxford (1995)
[129] D Salzmann Ch Reich I Uschmann E Foumlrster PGibbon ldquoTheory of Kα
generation by femtosecond laser-produced hot electrons in thin foilsrdquo Phys
Rev E 65 036402 (2002)
[130] F Y Khattak O A M B Percie du Sert D Riley P S Foster E J Divall C
J Hooker A J Langley J Smith and P Gibbon ldquoComparison of experimental
and simulated Kα yield for 400 nm ultrashort pulse laser irradiationrdquo Phys Rev
E 74 027401 (2006)
[131] P Gibbon and A R Bell ldquoCollisionless Absorption in Sharp-Edged Plasmasrdquo
Phys Rev Lett 68 1535 (1992)
[132] D D Meyerhofer H Chen J A Delettrez B Soom S Uchida and B Yaakobi
ldquoResonance absorption in high-intensity contrast picosecond laser-plasma
interactionsrdquo Phys Fluids B 5 2584 (1993)
[133] U Teubner W Theobald and C Wuumllker ldquoMechanisms and origin of
continuum and line emission from carbon plasmas produced by ultrashort laser
pulsesrdquo J Phys B 29 4333 (1996)
[134] M Schnuumlrer M P Kalashnikov P V Nickles Th Schlegel W Sandner N
Demchenko R Nolte and P Ambrosi ldquoHard x‐ray emission from intense short
pulse laser plasmasrdquo Phys Plasmas 2 3106 (1995)
[135] J D Kmetec C L Gordon III J J Macklin B E Lemoff G S Brown and
S E Harris ldquoMeV x-ray generation with a femtosecond laserrdquo Phys Rev Lett
68 1527 (1992)
[136] A P Fews P A Norreys F N Beg A R Bell A E Dangor C N Danson
P Lee and S J Rose ldquoPlasma Ion Emission from High Intensity Picosecond
Laser Pulse Interactions with Solid Targetsrdquo Phys Rev Lett 73 1801 (1994)
[137] D C Eder G Pretzler E Fill K Eidmann and A Saemann ldquoSpatial
characteristics of Kα radiation from weakly relativistic laser plasmasrdquo Appl
Phys B Lasers Opt 70 211 (2000)
[138] S Backus C G Durfee M M Murnane and H C Kapteyn ldquoHigh power
ultrafast lasersrdquo Rev Sci Instrum 69 1207 (1998)
[139] K Lobov ldquoHigh order harmonic generation at relativistic laser intensitiesrdquo
Dissertation (2008)
[140] U Shymanovich ldquoDirect observation of ultrafast atomic motion using time-
resolved X-ray diffractionrdquo Dissertation (2007)
[141] F Scholze H Henneken P Kuschnerus H Rabus M Richter G Ulm
ldquoDetermination of the electronndashhole pair creation energy for semiconductors
from the spectral responsivity of photodiodesrdquo Nuclear Instruments and
Methods in Physics Research A 439 208 (2000)
Bibliography
147
[142] F Zamponi T Kaumlmpfer A Morak I Uschmann and E Foumlrster
ldquoCharacterization of a deep depletion back-illuminated charge-coupled device
in the x-ray rangerdquo Rev Sci Instrum 76 116101 (2005)
[143] The quantum efficiency of the CCD was calibrated with a Si reference detector
[144] D W Forslund J M Kindel and K Lee ldquoTheory of Hot-Electron Spectra at
High Laser Intensityrdquo Phys Rev Lett 39 284 (1977)
[145] W L Kruer and K Estabrook ldquoLaser light absorption due to self‐generated
magnetic fieldsrdquo Phys Fluids 20 1688 (1977)
[146] N H Burnett G D Enright A Avery A Loen and J C Kieffer ldquoTime-
resolved Kα spectra in high-intensity laser-target interactionrdquo Phys Rev A 29
2294 (1984)
[147] W L Kruer The Physics of Laser Plasma Interaction Addison-Wesley (1988)
[148] N Zhavoronkov Y Gritsai M Bargheer M Woerner and T Elsaesser
ldquoGeneration of ultrashort Kα radiation from quasipoint interaction area of
femtosecond pulses with thin foilsrdquo Appl Phys Lett 86 244107 (2005)
[149] F Ewald H Schwoerer and R Sauerbrey ldquoKα-radiation from relativistic laser-
produced plasmasrdquo Europhys Lett 60 710 (2002)
[150] A Zhidkov A Sasaki T Utsumi I Fukumoto T Tajima F Saito Y
Hironaka K G Nakamura K I Kondo and M Yoshida ldquoPrepulse effects on
the interaction of intense femtosecond laser pulses with high-Z solidsrdquo Phys
Rev E 62 7232 (2000)
[151] F Y Khattak E Garcia Saiz T Dzelzainis D Riley and Z Zhai ldquoScale-
length optimizing of short pulse Cu Kα laser-plasma sourcesrdquo Appl Phys Lett
90 081502 (2007)
[152] Ch Reich I Uschmann F Ewald S Duumlsterer A Luumlbcke H Schwoerer R
Sauerbrey E Foumlrster and P Gibbon ldquoSpatial characteristics of Kα x-ray
emission from relativistic femtosecond laser plasmasrdquo Phys Rev E 68 056408
(2003)
[153] K Sokolowski-Tinten C Blome J Blums A Cavalleri C Dietrich A
Tarasevitch and D von der Linde ldquoUltrafast Time-Resolved X-ray
Diffractionrdquo AIP Conf Proc 634 11 (2002)
[154] N Zhavoronkov Y Gritsai M Bargheer M Woerner T Elsaesser F
Zamponi I Uschmann and E Forster ldquoUltrafast Optics - Microfocus Cu Kα
source for femtosecond x-ray sciencerdquo Optics Letters 30 1737 (2005)
[155] Bixue Hou James Easter Karl Krushelnick and John A Nees ldquo Generation of
hard x rays by femtosecond laser pulse interaction with Cu in laminar helium
flow in ambient airrdquo Appl Phys Lett 92 161501 (2008)
[156] Ch Ziener I Uschmann G Stobrawa Ch Reich P Gibbon T Feurer A
Morak S Duumlsterer H Schwoerer E Foumlrster and R Sauerbrey ldquoOptimization
of Kα bursts for photon energies between 17 and 7 keV produced by
Bibliography
148
femtosecond-laser-produced plasmas of different scale lengthrdquo Phys Rev E 65
066411 (2002)
[157] U Teubner J Bergmann B van Wonterghem F P Schaumlfer and R Sauerbrey
ldquoAngle-dependent x-ray emission and resonance absorption in a laser-produced
plasma generated by a high intensity ultrashort pulserdquo Phys Rev Lett 70 794
(1993)
[158] U Teubner P Gibbon E Foumlrster F Falliegraves P Audebert J P Geindre and J
C Gauthier ldquoSubpicosecond KrF‐laser plasma interaction at intensities
between 1014
and 1017
Wcm2rdquo Phys Plasmas 3 2679 (1996)
[159] J F Liu W Yu and L J Qian ldquoCharge Displacement in Ultraintense Laser-
Plasma Interactionrdquo Physica Scripta 72 243 (2005)
[160] T P Hughes Plasma and Laser Light Adam Hilger (1975)
[161] Y T Lee R A London G B Zimmerman and P L Hagelstein ldquoApplication
of escape probability to line transfer in laser‐produced plasmasrdquo Phys Fluids B
2 2731 (1990)
[162] A K Sharma R K Thareja ldquoPlume dynamics of laser-produced aluminum
plasma in ambient nitrogenrdquo Applied Surface Science 243 68 (2005)
[163] H Nakano T Nishikawa and N Uesugi ldquoEnhanced K-shell x-ray line
emissions from aluminum plasma created by a pair of femtosecond laser pulsesrdquo
Appl Phys Lett79 24 (2001)
[164] H Ahn H Nakano T Nishikawa and N Uesugi ldquoSimultaneous Measurement
of Absorption and X-Ray Emission from Preformed Plasma Generated by
Ultrashort Prepulseldquo Jpn J Appl Phys 35 L154 (1996)
[165] T Feurer ldquoFeedback-controlled optimization of soft-X-ray radiation from
femtosecond laser-produced plasmasrdquo Appl Phys B Lasers Opt 68 55 (1999)
[166] U Teubner G Kuumlhnle and F P Schaumlfer ldquoDetailed study of the effect of a
short prepulse on soft X-ray spectra generated by a high-intensity KrF laser
pulserdquo Appl Phys B 54 493 (1992)
[167] Th Schlegel S Bastiani L Gregravemillet J-P Geindre P Audebert J-C
Gauthier E Lebebvre G Bonnaud and J Delettrez ldquoComparison of measured
and calculated x-ray and hot-electron production in short-pulse laser-solid
interactions at moderate intensitiesrdquo Phys Rev E 60 2209 (1999)
[168] A Schmitt R S B Ong ldquoThe effect of collisions on wave-breaking in a cold
plasmardquo Appl Phys 22333 (1980)
[169] J P Freidberg R W Mitchell R L Morse and L I Rudsinski ldquoResonant
Absorption of Laser Light by Plasma Targetsrdquo Phys Rev Lett 28 795 (1972)
[170] M Abramowitz and I Stegun Handbook of Mathematical functions National
Bureau of Standards (1964)
[171] A Tarasevitch A Orisch D von der Linde Ph Balcou G Rey J -P
Chambaret U Teubner D Kloumlpfel and W Theobald ldquoGeneration of high-
Bibliography
149
order spatially coherent harmonics from solid targets by femtosecond laser
pulsesrdquo Phys Rev A 62 023816 (2000)
[172] H-S Park D M Chambers H -K Chung R J Clarke et al ldquoHigh-energy
Kα radiography using high-intensity short-pulse lasersrdquo Phys Plasmas 13
056309 (2006)
[173] P P Rajeev S Banerjee A S Sandhu R C Issac L C Tribedi and G R
Kumar ldquoRole of surface roughness in hard-x-ray emission from femtosecond-
laser-produced copper plasmasrdquo Phys Rev A 65 052903 (2002)
[174] R Rix ldquoAbsorption intensiver ultrakurzer Laserpulse an Festkoumlrpertargetsrdquo
Diplomarbeit Max-Planck-Institut Fuumlr Quantenoptik Garching Germany
(1999)
[175] U Teubner I Uschmann P Gibbon D Altenbernd E Foumlrster T Feurer W
Theobald R Sauerbrey G Hirst M H Key J Lister and D Neely
ldquoAbsorption and hot electron production by high intensity femtosecond uv-laser
pulses in solid targetsrdquo Phys Rev E 54 4167 (1996)
[176] P Gibbon M Mašek U Teubner W Lu M Nicoul U Shymanovich A
Tarasevitch P Zhou K Sokolowski-Tinten and D von der Linde ldquoModelling
and optimisation of fs laser-produced Kα sourcesrdquo Appl Phys A 96 23 (2009)
[177] J M Dawson ldquoParticle simulation of plasmasrdquo Rev Mod Phys 55 403
(1983)
[178] T Tajima Computational Plasma Physics with Applications to Fusion and
Astrophysics AddisonndashWesley (1989)
[179] C K Birdsall and A B Langdon Plasma Physics via Computer simulations
IOP Publishing Ltd Bristol U K (1991)
[180] H L Anderson ldquoMetropolis Monte Carlo and the MANIACrdquo Los Alamos
Science 14 96 (1986)
[181] W Lu M Nicoul U Shymanovich A Tarasevitch P Zhou K Sokolowski-
Tinten D von der Linde M Mašek P Gibbon and U Teubner ldquoOptimized
Kα X-ray flashes from femtosecond-laser irradiated foilsrdquo Phys Rev E 80
026404 (2009)
[182] D Riley J J Angulo-Gareta F Y Khattak M J Lamb P S Foster E J
Divall C J Hooker A J Langley R J Clarke and D Neely ldquoKα yields from
Ti foils irradiated with ultrashort laser pulsesrdquo Phys Rev E 71 016406 (2005)
[183] International Commission on Radiation Units amp Measurements Report No 37
unpublished (1984)
[184] httpphysicsnistgovPhysRefDataXrayMassCoefcoverhtml
[185] C Rulliere Femtosecond Laser Pulses Principles and Experiments 2nd ed
Springer (2004)
[186] M Nicoul ldquoTime-resolved X-ray diffraction with accelerator- and laser-
plasma-based X-ray sourcesrdquo Dissertation (2010)
Bibliography
150
[187] A Ruhl ldquoErzeugung intensiver Roumlntgenimpulse mit einem Bandtargetrdquo
Diplomarbeit (2006)
[188] M Montel ldquoAberrations du Premier Ordre des Systegravemes Catoptriques
Asymeacutetriques Application au Microscope X agrave Reacuteflexion Totalerdquo Optica Acta 1
117 (1954)
[189] httpwwwcxrolblgov
[190] L M P Fernandes F D Amaro A Antognini J M R Cardoso C A N
Conde O Huot P E Knowles F Kottmann J A M Lopes L Ludhova C
M B Monteiro F Mulhauser R Pohl J M F dos Santos L A Schaller D
Taqqud and J F C A Velosoe ldquoCharacterization of large area avalanche
photodiodes in X-ray and VUV-light detectionrdquo Journal of Instrumentation
(JINST) 2 08005 (2007)
[191] L M P Fernandes J A M Lopes J M F dos Santos P E Knowles L
Ludhova F Mulhauser F Kottmann R Pohl D Taqqu ldquoLAAPD low
temperature performance in X-ray and visible-light detectionrdquo IEEE
Transactions on Nuclear Science 51 1575 (2004)
[192] httpwwwcaenitjspTemplate2CaenProdjspparent=9ampidmod=409
[193] W Demtroumlder Laser Spectroscopy Basic Concepts and Instrumentation 2nd
Edition Springer-Verlag (1996)
[194] J Chesnoy and A Mokhtari Resonant impulsive-stimulated Raman-scattering
on Malachite Green Phys Rev A 38 3566 (1988)
[195] A Tokmakoff B Sauter and M D Fayer ldquoTemperature‐dependent
vibrational relaxation in polyatomic liquids Picosecond infrared pumpndashprobe
experimentsrdquo J Chem Phys 100 9035 (1994)
[196] S Ghosh and B M Arora ldquoPhotoreflectance spectroscopy with white light
pump beamrdquo Rev Sci Instrum 69 1261 (1998)
[197] R C Stanley ldquoCounting statistics in X-ray spectroscopyrdquo Br J Appl Phys 12
503 (1961)
[198] D Laundy and S Collins ldquoCounting statistics of X-ray detectors at high
counting ratesrdquo J Synchrotron Rad 10 214 (2003)
[199] G C Cho W Kuumltt and H Kurz ldquoSubpicosecond time-resolved coherent-
phonon oscillations in GaAsrdquo Phys Rev Lett 65 764 (1990)
[200] S I Anisimov B L Kapeliovich T L Perelman ldquoElectron emission from
metal surfaces exposed to ultrashort laser pulsesrdquo Sov Phys JETP 39 375
(1974)
[201] M Ligges I Rajkovic P Zhou O Posth C Hassel G Dumpich D von der
Linde ldquoObservation of ultrafast lattice heating using time reolved electron
diffractionrdquo Appl Phys Lett 94 101910 (2009)
Bibliography
151
[202] P Chen I V Tomov and P M Rentzepis ldquoTime resolved heat propagation in
a gold crystal by means of picosecondx-ray diffractionrdquo J Chem Phys 104
10001 (1996)
[203] A A Maznev J Hohlfeld and J Guumldde ldquoSurface thermal expansion of metal
under femtosecond laser irradiationrdquo J Appl Phys 82 5082 (1997)
[204] A Plech S Kuumlrbitz K -J Berg H Graener G Berg S Greacutesillon M Kaempfe J
Feldmann M Wulff and G von Plessen ldquoTime-resolved X-ray diffraction on
laser-excited metal nanoparticlesrdquo Europhys Lett 61 762 (2003)
[205] J Chen H Zhang I V Tomov and P M Rentzepis ldquoLaser Induced Transient
Structures in a 150 nm Gold Crystalrdquo Journal of the chinese chemical society
54 1619 (2007)
[206] P Musumeci J T Moody C M Scoby M S Gutierrez and M Westfall
ldquoLaser-induced melting of a single crystal gold sample by time-resolved
ultrafast relativistic electron diffractionrdquo Appl Phys Lett 97 063502 (2010)
[207] R Ernstorfer M Harb T Dartigalongue C T Hebeisen R E Jordan L Zhu
and R J D Miller ldquoFemtosecond Electron Diffraction Study on the Heating
and Melting Dynamics of Goldrdquo Springer Series in Chemical Physics 88 755
(2007)
[208] R Ernstorfer M Harb C T Hebeisen G Sciaini T Dartigalongue I
Rajkovic M Ligges D von der Linde Th Payer and M Horn-von-Hoegen F
-J Meyer zu Heringdorf S G Kruglik and R J D Miller ldquoAtomic view of the
photoinduced collapse of gold and bismuthrdquo Springer Series in Chemical
Physics 92 113 (2009)
[209] httpwwwphasisch
[210] E D Palik (Author Editor) Handbook of Optical Constants of Solids
Academic Press (1985)
[211] J Hohlfeld J G Muumlller S -S Wellershoff and E Matthias ldquoTime-resolved
thermoreflectivity of thin gold films and its dependence on film thicknessrdquo
Appl Phys B 64 387 (1997)
[212] T Juhasz H E Elsayed-Ali G O Smith C Suaacuterez and W E Bron ldquoDirect
measurements of the transport of nonequilibrium electrons in gold films with
different crystal structuresrdquo Phys Rev B 48 15488 (1993)
[213] S D Brorson J G Fujimoto and E P Ippen ldquoFemtosecond electronic heat-
transport dynamics in thin gold filmsrdquo Phys Rev Lett 59 1962 (1987)
[214] P Debye Interferenz von Roumlntgenstrahlen und Waumlrmebewegung Ann d
Phys 348 49 (1913)
[215] I Waller ldquoZur Frage der Einwirkung der Waumlrmebewegung auf die Interferenz
von Roumlntgenstrahlenrdquo Zeitschrift fuumlr Physik A Hadrons and Nuclei 17 398
(1923)
[216] C Kittel Introduction to solid state physics 6th ed Wiley New York (1986)
Bibliography
152
[217] G Busch and H Schade Lectures on solid state physics Pergamon Press
(1976)
[218] B C Larson J Z Tischler and D M Mills ldquoNanosecond resolution
timeresolved x-ray study of silicon during pulsed-laser irradiationrdquo Journal of
Materials Research 1 144 (1986)
[219] S K Allison ldquoThe Natural Widths of the Kα X-Ray Doublet from 26FE to
47AGrdquo The physical review 44 63 (1933)
[220] calculated from XOP httpwwwesrfeucomputingscientificxop21
[221] T H Johnson ldquoThe Diffraction of Hydrogen Atoms by the Mosaic Structure of
Crystalsrdquo Phys Rev 37 87 (1931)
[222] C Thomsen J Strait Z Vardeny H J Mark J Tauc and J Hauser
ldquoCoherent phonon generation and detection by picosecond light pulsesrdquo Phys
Rev Lett 53 989 (1984)
[223] C Thomsen H T Grahn H J Maris and J Tauc ldquoSurface generation and
detection of phonons by picosecond light pulsesrdquo Phys Rev B 34 4129 (1986)
[224] American Institute of Physics (Author Corporate Author) Dwight E Gray
(Editor) American Institute of Physics Handbook 3rd ed McGraw-Hill
Columbus (1972)
[225] S Kaumlhle ldquoKurzzeit-Roumlntgenbeugung mit Hilfe einer Effizienz-optimierten
hochrepetierenden Laser-Plasma-Roumlntgenquellerdquo Dissertation (2009)
[226] P B Allen ldquoTheory of thermal relaxation of electrons in metalsrdquo Phys Rev
Lett 59 1460 (1987)
[227] J Hohlfeld S -S Wellershoff J Guumldde U Conrad V Jaumlhnke E Matthias
ldquoElectron and lattice dynamics following optical excitation of metalsrdquo Chem
Phys 251 237 (2000)
[228] Online-Datenbank WebElements Periodic Table of the Elements
httpwwwwebelementscom (Stand November 2008)
[229] B Rethfeld A Kaiser M Vicanek and G Simon ldquoUltrafast dynamics of
nonequilibrium electrons in metals under femtosecond laser irradiationrdquoPhys
Rev B 65 214303 (2002)
[230] R Peierls More Surprises in Theoretical Physics Princeton University Press
(1991)
[231] H J Zeiger J Vidal T K Cheng E P Ippen G Dresselhauss and M S
Dresselhaus ldquoTheory for displacive excitation of coherent phononsrdquo Phys Rev
B 45 768 (1992)
[232] T K Cheng J Vidal H J Zeiger G Dresselhaus M S Dresselhaus and E P
Ippen ldquoMechanism for displacive excitation of coherent phonons in Sb Bi Te
and Ti2O3rdquo Appl Phys Lett 59 1923 (1991)
Bibliography
153
[233] A B Shick J B Ketterson D L Novikov and A J Freeman ldquoElectronic
structure phase stability and semimetal-semiconductor transitions in Birdquo Phys
Rev B 60 15484 (1999)
[234] O Degtyareva M I MCMahon and R J Nelmes ldquoHigh-pressure structural
studies of group-15 elementsrdquo High Pressure Research 24 319 (2004)
[235] T E Stevens J Kuhl and R Merlin ldquoCoherent phonon generation and the two
stimulated Raman tensorsrdquo Phys Rev B 65 144304 (2002)
[236] K Ishioka1 M Kitajima1 and O V Misochko ldquoTemperature dependence of
coherent A1g and Eg phonons of bismuthrdquo J Appl Phys 100 093501 (2006)
[237] E D Murray D M Fritz J K Wahlstrand S Fahy and D A Reis ldquoEffect of
Lattice Anharmonicity in Bismuth High-amplitude Phonon Dynamicsrdquo Phys
Rev B 72 060301 (2005)
[238] X Gonze J-P Michenaud and J-P Vigneron ldquoFirst-principles study of As Sb
and Bi electronic propertiesrdquo Phys Rev B 41 11827 (1990)
[239] T K Cheng S D Brorson A S Kazeroonian J S Moodera G Dresselhaus
M S Dresselhaus and E P Ippen ldquoImpulsive excitation of coherent phonons
observed in reflection in bismuth and antimonyrdquo Appl Phys Lett 57 1004
(1990)
[240] J S Lannin J M Calleja and M Cardona ldquoSecond-order Raman scattering in
the group-Vb semimetals Bi Sb and Asrdquo Phys Rev B 12 585 (1975)
[241] A Q Wu and X XuldquoCoupling of ultrafast laser energy to coherent phonons in
bismuthrdquo Appl Phys Lett 90 251111 (2007)
[242] E G Gamaly A V Rode ldquoElectronndashphonon energy relaxation in bismuth
excited by ultrashort laser pulse temperature and fluence dependence rdquo Appl
Phys A online (2012)
[243] M Hase K Mizoguchi H Harima S Nakashima and K Sakai ldquoDynamics of
coherent phonons in bismuth generated by ultrashort laser pulsesrdquo Phys Rev B
58 5448 (1998)
[244] O V Misochko K Ishioka M Hase and M Kitajima ldquoFano interference for
large-amplitude coherent phonons in bismuthrdquo J Phys Condens Matter 19
156227 (2007)
[245] M F DeCamp D A Reis P H Bucksbaum and R Merlin ldquoDynamics and
coherent control of high-amplitude optical phonons in bismuthrdquo Phys Rev B
64 092301 (2001)
[246] O V Misochko Muneaki Hase K Ishioka and M Kitajima ldquoObservation of
an Amplitude Collapse and Revival of Chirped Coherent Phonons in Bismuthrdquo
Phys Rev Lett 92 197401 (2004)
[247] M S Diakhate E S Zijlstra M E Garcia ldquoQuantum dynamical study of the
amplitude collapse and revival of coherent A 1g phonons in bismuth a classical
phenomenon rdquo Appl Phys A 96 5 (2009)
Bibliography
154
[248] D Boschetto E G Gamaly A V Rode B Luther-Davies D Glijer T Garl
O Albert A Rousse and J Etchepare ldquoSmall Atomic Displacements Recorded
in Bismuth by the Optical Reflectivity of Femtosecond Laser-Pulse
Excitationsrdquo Phys Rev Lett 100 027404 (2008)
[249] M Hase M Kitajima S-i Nakashima and K Mizoguchi ldquoDynamics of
Coherent Anharmonic Phonons in Bismuth Using High Density
Photoexcitationrdquo Phys Rev Lett 88 067401 (2002)
[250] M Hase K Mizoguchi H Harima S Nakashima M Tani K Sakai and M
Hangyo ldquoOptical control of coherent optical phonons in bismuth filmsrdquo Appl
Phys Lett 69 2474 (1996)
[251] C Blome ldquoUntersuchung schneller Strukturbullanderungen mit Hilfe ultrakurzer
Rbullontgenimpulserdquo Dissertation (2003)
[252] S L Johnson P Beaud E Vorobeva C J Milne Eacute D Murray S Fahy and
G Ingold ldquoDirectly Observing Squeezed Phonon States with Femtosecond X-
Ray Diffractionrdquo Phys Rev Lett 102 175503 (2009)
[253] M Ligges ldquoUntersuchung der schnellen Gitteraufheizung in duumlnnen (Halb-)
Metallfilmen mit Hilfe zeitaufgeloumlster Elektronenbeugungrdquo Dissertation (2009)
[254] A Bugayev A Esmail M Abdel-Fattah and H E Elsayed-Ali ldquoCoherent
phonons in bismuth film observed by ultrafast electron diffractionrdquo AIP
Advances 1 012117 (2011)
[255] A Authier S Lagomarsino and BK Tanner (Eds) X-ray and Neutron
Dynamical Diffraction Theory and Applications New York Plenum Press
(1996)
[256] J Daillant and A Gibaud (Eds) X-ray and Neutron Reflectivity Principles and
Applications Lecture Notes in Physics 770 Springer (2009)
[257] M Cornacchia J Arthur L Bentson R Carr P Emma J Galayda P Krejcik
I Lindau J Safranek J Schmerge J Stohr R Tatchyn and A Wootton ldquoA
Sub-Picosecond Photon Pulse Facility for SLACrdquo SLAC-PUB-8950 (2001)
[258] P Tangney and S Fahy ldquoDensity-functional theory approach to ultrafast laser
excitation of semiconductors Application to the A1 phonon in telluriumrdquo Phys
Rev B 65 054302 (2002)
[259] O V Misochko K Ishioka M Hase and M Kitajima ldquoFully symmetric and
doubly degenerate coherent phonons in semimetals at low temperature and high
excitation similarities and differencesrdquo J Phys Condens Matter 18 10571
(2006)
[260] E S Zijlstra L L Tatarinova and M E Garcia ldquoLaser-induced phonon-
phonon interactions in bismuthrdquo Phys Rev B 74 220301 (2006)
[261] S Bluumlgel and G Bihlmayer ldquoFull-Potential Linearized Augmented Planewave
Methodrdquo Computational Nanoscience Do It Yourself (J Grotendorst S
Bluumlgel D Marx (Eds)) NIC Series 31 85 (2006)
Bibliography
155
[262] P Blaha K Schwarz G K H Madsen D Kvasnicka and J Luitz ldquoWIEN2k
An Augmented Plane Wave+Local Orbitals Program for Calculating Crystal
Propertiesrdquo Karlheinz Schwarz Techn Universitaumlt Wien Austria (2001)
[263] Z Yang C Ko and S Ramanathan ldquoOxide Electronics Utilizing Ultrafast
Metal-Insulator Transitionsrdquo Annu Rev Mater Res 41 337 (2011)
[264] A Pashkin C Kuumlbler H Ehrke R Lopez A Halabica R F Haglund Jr R
Huber A Leitenstorfer ldquoUltrafast Insulator-Metal Phase Transition in VO2
Studied by Multiterahertz Spectroscopyrdquo Phys Rev B 83 195120 (2011)
[265] M Wuttig N Yamada ldquoPhase-change materials for rewriteable data storagerdquo
Nature Mater 6 824 (2007)
[266] T Siegrist P Jost H Volker M Woda P Merkelbach C Schlockermann and
M Wuttig ldquoDisorder-induced localization in crystalline phase-change
materialsrdquo Nature Mater 10 202 (2011)
[267] P Debye and P Scherrer ldquoInterferenzen an regellos orientierten Teilchen im
Roumlntgenlichtrdquo Phys Z 17 277 (1916)
[268] httpwwwlebowcompanycomspecificationshtm
[269] E Zolotoyabko D Shilo W Sauer E Pernot and J Baruchel ldquoVisualization
of 10 μm surface acoustic waves by stroboscopic x-ray topographyrdquo Appl
Phys Lett 73 2278 (1998)
[270] W Sauer M Streibl T Metzger A Haubrich S Manus W A J Peisl J
Mazuelas J Haumlrtwig and J Baruchel ldquoX-ray imaging and diffraction from
surface phonons on GaAsrdquo ApplPhysLett 75 1709 (1999)
[271] C Voisin D Christofilos N Del Fatti F Valleacutee ldquoEnvironment effect on the
acoustic vibration of metal nanoparticlesrdquo Physica B Condensed Matter 316
89 (2002)
[272] P P Ewald ldquoIntroduction to the dynamical theory of X-ray diffractionldquo Acta
CrystA 25 103 (1969)
[273] httpphotonic-sciencecoukproductsXRAY-cameras-detectorshtml
[274] C Bressler and M Chergui ldquoUltrafast X-ray Absorption Spectroscopyrdquo Chem
Rev 104 1781 (2004)
[275] C Bressler and M Chergui Molecular structural dynamics probed by ultrafast
X-ray absorption spectroscopy Annu Rev Phys Chem 61 263 (2010)
[276] A O Er J Chen and P M Rentzepis Ultrafast time resolved x-ray
diffraction extended x-ray absorption fine structure and x-ray absorption near
edge structure J Appl Phys 112 031101 (2012)
[277] E Papalazarou J Faure J Mauchain M Marsi A Taleb-Ibrahimi I
Reshetnyak A van Roekeghem I Timrov N Vast B Arnaud and L Perfetti
ldquoCoherent Phonon Coupling to Individual Bloch States in Photoexcited
Bismuthrdquo Phys Rev Lett 108 256808 (2012)
Bibliography
156
[278] M Nakajima N Takubo Z Hiroi Y Ueda and T Suemoto ldquoPhotoinduced
metallic state in VO2 proved by the terahertz pump-probe spectroscopyrdquo Appl
Phys Lett 92 011907 (2008)
[279] R Ulbricht E Hendry J Shan T F Heinz and M Bonn ldquoCarrier dynamics
in semiconductors studied with time-resolved terahertz spectroscopyrdquo Rev Mod
Phys 83 543 (2011)
[280] Time-resolved THz studies of carrier dynamics in semiconductors
superconductors and strongly-correlated electron materials Lawrence Berkeley
National Laboratory Lawrence Berkeley National Laboratory LBNL
Paper LBNL-597E Retrieved from httpescholarshiporgucitem2m32w0fs
[281] O V Misochko K Ishioka M Hase and M Kitajima ldquoFully symmetric and
doubly degenerate coherent phonons in semimetals at low temperature and high
excitation similarities and differencesrdquo J Phys Condens Matter 18 10571
(2006)
[282] arXiv12122348 (httparxivorgpdf12122348pdf )(2013)
[283] M Holt Z Wu H Hong P Zschack P Jemian J Tischler H Chen and T-C
Chiang ldquoDetermination of Phonon Dispersions from X-Ray Transmission
Scattering The Example of Siliconrdquo Phys Rev Lett 83 3317 (1999)
[284] httpwwwrigakucomproductscomponents
[285] httpwwwroperscientificdedatasheetsPrinceton_Instruments_PI-
MTE_1300B_RevA0pdf
[286] httpwwwadvancedphotonixcomap_productspdfsSD394-70-74-591pdf
Erklaumlrung
157
Ich bestaumltige dass ich die vorliegende Dissertation bdquoUltrafast time-resolved X-ray
diffraction using an optimized laser-plasma based X-ray sourceldquo selbststaumlndig
verfasst habe und dabei nur die angegebenen Hilfsmittel verwendet habe
Daruumlber hinaus bestaumltige ich dass ich die vorliegende Dissertation bdquoUltrafast time-
resolved X-ray diffraction using an optimized laser-plasma based X-ray sourceldquo nur
in diesem Promotionsverfahren an der Fakultaumlt fuumlr Physik der Universitaumlt Duisburg-
Essen eingereicht wurde
Wei Lu
Duisburg den 01022013
1 Introduction
1
1 Introduction
11 Introduction and motivation
In order to study the ultrafast structural dynamics of matter excited by a
femtosecond optical pulse atomic spatial resolution (~Aring) and temporal resolution
comparable to characteristic time scales of atomic motion (femtosecond to
picosecond) are required
For a long time static atomic resolution has been achieved by using either X-
rays which were discovered by William Conrad Roentgen in 1895 [1]
electrons
proved by George Paget Thomson and Clinton Joseph Davisson independently in
1920s [2 3]
or neutrons which was established by Ernest O Wollan and Clifford Shull
in 1940s [4]
The knowledge of the structure of matter has been largely extended with
the application of these invaluable tools For their outstanding contributions
Roentgen earned the first Nobel Prize for Physics in 1901 Thomson and Davisson
shared the Nobel Prize for Physics in 1937 and Shull was awarded one half of the
1994 Nobel Prize in Physics
On the other hand the temporal resolution had made no significant improvement
until the development of femtosecond laser technology [5 6]
Since then the situation
has changed rapidly New types of radiation sources have been developed or are being
developed to provide ultrashort pulses of photons or electrons with sufficiently short
wavelength to enable the direct observation of structural changes on the relevant
length- and time-scales In the late 1980searly 1990s the first laser-produced plasma
femtosecond x-ray sources were demonstrated [7-9]
In the early 2000s ultrafast
electron diffraction with sub-picosecond time resolution was realized [10-13]
In the
mean time also accelerator based short-pulse X-rays sources have been developed [14-
18] However until now it has not been possible to generate ultrashort (sub-
picosecond) pulses of thermal neutrons
In the works presented in this thesis ultrashort X-ray pulses are used as a tool to
investigate ultrafast structural dynamics Currently there are six techniques exist to
1 Introduction
2
produce femtosecond X-ray pulses
1) Ultrafast X-ray tube achieved by using pulsed femtosecond lasers to produce
pulsed electron injection within a normal X-ray tube [19-21]
2) Direct conversion of the laser pulse into the X-ray region by nonlinear optical
processes ie high order harmonic generation(HHG)[22-25]
3) laser-produced plasma X-ray source achieved by the interaction of high
intensity laser pulses with solid targets [7-9]
4) The very recent developed laser-plasma wakefield accelerator-based betatron
X-ray source [26-29]
5) Unlike the previous four laboratory-sized techniques the large-scale electron
synchrotron-based slicing X-ray sources such as the Advanced Light Source ldquoALSrdquo
in Berkeley USA [14]
the Berliner Elektronenspeicherring-Gesellschaft fuumlr
Synchrotronstrahlung ldquoBESSYrdquo in Berlin Germany [15]
the Swiss Light Source
ldquoSLSrdquo in Villigen Switzerland [16]
6) The large-scale linear accelerator-based X-ray Free electron lasers (XFEL)
such as the Linac Coherent Light Source ldquoLCLSrdquo at SLAC in Standford USA [30]
the
SPring-8 Angstrom Compact free electron LAser ldquoSACLArdquo in Japan [31]
and the X-
ray Free-Electron Laser ldquoXFELrdquo at DESY in Hamburg Germany [32 33]
For all of these ultrafast X-ray sources the femtosecond laser pulses have to be
employed in some ways and the accelerated electrons play important roles in the
conversion process Each of these sources has its own characteristics in terms of the
repetition rate the minimum achievable pulse duration the produced photon number
the photon energy range the spatial and temporal coherence properties and the size or
the cost of the installation
Presently the first two sources are not yet suitable for studying ultrafast
structural dynamics due to the limited overall X-ray production The betatron X-ray
source is still under development [34-38]
The last two large-scale X-ray sources
represent the most promising X-ray sources for performing ultrafast time resolved
experiments However their construction and running costs are extremely high and
beam time access is very limited The laser-produced plasma X-ray sources are
presently unique because they are the easiest to operate laboratory-sized X-ray source
that can deliver hard X-ray radiation with very short pulse duration and at the same
time provide perfect synchronization between the produced X-ray pulses and the
1 Introduction
3
driving femtosecond laser pulses This is the type of X-ray source that has been used
for performing the time resolved X-ray diffraction experiments presented in this
thesis A part of the work in this thesis is dedicated to optimizing the X-ray emission
from this X-ray source
To obtain the time dependent information in sub-picosecond time scale the
common method using a fast detector (eg photo diodes or streak cameras) with one
ultrashort pump pulse is not accessible due to the limited temporal-resolution
capability of current fast detectors Most experiments are performed in the ultrafast-
pumpndashultrafast-probe scheme with a slow detector With this scheme the time
evolution of photoinduced structural changes can be studied by taking a sequence of
diffraction patterns at different time delays with respect to (femtosecond) excitation
Since the ultrashort X-ray pulse was available this scheme has been further extended
to X-ray region Using laser-pump X-ray-probe scheme the first femtosecond time-
resolved X-ray diffraction experiment was performed with laser plasma X-ray source
in 1997 by Rischel et al [39]
Since then many ultrafast phenomena have been
investigated by using ultrashort X-ray pulses Reviews on these studies can be found
in Ref [40 41] The current researches cover the following fields
1) Propagating GHz acoustic waves caused by the release of impulsive stress
launched by the femtosecond optical excitation [42-67]
2) Coherent optical phonon excitations which connect with unit-cell level
transient structural changes [67-73]
3) Non-thermal melting which is melting before thermal equilibrium between
electrons and lattice has been established after femtosecond laser excitation [17 18 39
46 76-81]
4) Phase transition in ferroelectric [66 82-87]
and ferromagnetic [88-104]
materials
caused by femtosecond laser excitation
5) Debye-Scherrer type time-resolved X-ray measurements on polycrystalline
and powder samples which allow obtaining much more information of the excited
sample from one measurement through detecting simultaneously several diffraction
orders similar to studies by ultrafast electron diffraction [105-110]
6) Utilizing X-ray diffuse scattering to investigate the transient nonequilibrium
states of the lattice system following ultrafast laser excitation [111 112]
The ultrafast phenomena investigated in this thesis focus on structural dynamics
in thin laser-excited metal films These works covered by the research field includes
1 Introduction
4
coherent excitations of acoustic phonons and optical phonons
12 Overview and structure of the thesis
The thesis is organized as following
Chapter 2 presents experimental results on the optimization of Kα X-ray emission
from a laser-plasma based X-ray source It contains the principle of X-ray generation
with a laser produced plasma and a systematic investigation of optimizing the X-ray
emission
Chapter 3 describes a modular setup for time-resolved X-ray diffraction
experiments This chapter presents and discusses implemented improvements of the
setup such as hardware software and methodology which are essential to achieve the
results of following time-resolved diffraction experiments
Chapter 4 deals with the first time-resolved X-ray diffraction experiment with
the improved modular setup The Debye -Waller effect in a thin laser-excited Au film
is observed The evolutions of the lattice temperature are compared with the
theoretical prediction of Two-Temperature Model (TTM)
Chapter 5 contains the study on the photoinduced softening of the A1g optical
phonon mode in laser-excited Bi This work extends the studies of coherent optical
phonons in laser-excited Bi to a higher fluence range that has not been studied
previously
Chapter 6 focuses on the experiments performed with X-ray Debye-Scherrer
diffraction scheme A static measurement on a Cu foil (20 μm) and a time-resolved
measurement on an Au thin film (200 nm) have been carried out The temporal
behaviors of the measured data are discussed
The last chapter summarizes the main results presented in this thesis An outlook
for the future studies is also provided
2 Optimization of a laser-plasma based X-ray source
5
2 Optimization of a laser-plasma based
X-ray source
This chapter discusses the principles of X-ray generation using a laser-produced
plasma and strategies to optimize the X-ray source for time-resolved X-ray diffraction
experiments discussed in the following chapters For this purpose the Kα-emissions
from plasmas on Ti and Cu targets for different excitation and plasma conditions were
investigated Section 21 describes the mechanism for generating ultrashort X-ray
pulses using the laser-produced plasma The laser system and the experimental setup
are presented in sections 22 and 23 respectively Section 24 discusses the
optimization of the Kα yield as a function of laser intensity Measurements of the Kα
yield as a function of target thickness and angle of incidence and a detailed
investigation of the influence of a pre-formed plasma by using a controlled pre-pulse
with variable delay are presented and discussed in section 25 The experimental data
show that for a given angle of incidence the Kα yield can be optimized by choosing a
suitable pre-pulse ie plasma scale-length conditions For large angles of incidence a
steep electron density gradient maximizes the yield At near normal incidence
maximum yield is achieved for a more expanded plasma and the best energy
conversion efficiency has been found in this case For a certain scale-length range
(between 01λ ndash 1λ here λ is the laser wavelength) the optimized yield is scale-length
independent It can be achieved by choosing the appropriate angle of incidence This
situation results from the strong dependence of collisionless absorption mechanisms ndash
in particular resonance absorption (RA) ndash on the angle of incidence and the plasma
scale length By maximizing the absorption the highest Kα yield is achieved The
experimental data are supported by the results of calculations based on the classical
resonance absorption mechanism (section 25) and of particle-in-cell (PIC) simulations
(section 26) Finally a summary of this chapter is given in section 27
2 Optimization of a laser-plasma based X-ray source
6
21 Generation of ultrashort X-ray pulses from laser-
produced plasma
Optical radiation is absorbed by a metal within a thin layer of about 10 nm which
is called the ldquoskin depthrdquo [113]
If the intensity of the laser radiation on the material is
large enough typically more than 1014
Wcm2 the target material within the skin depth
will be ionized and transformed into a plasma during the pulse For laser intensities
above 1015
Wcm2 easily achievable with current femtosecond laser technology it has
been found that the hot plasma emits radiation in the (hard) X-ray range [7]
The emitted
radiation consists of continuum emission from recombination in the plasma
characteristic line emission (Kα Kβhellip) and Bremsstrahlung radiation The latter two
components come not only from the hot plasma resulting from transitions on the
strongly ionized atoms but also the interaction of high energy electrons accelerated by
the intense laser field with the cold non-excited material underneath [7 9 114 115]
These
laser-accelerated electrons often called hot electrons in the laser plasma community
have a kinetic energy (~10hellip100 keV) significantly higher than the thermal energy of
the overwhelming part of the plasma electrons Among the three different contributions
to the X-ray emission mentioned above the characteristic line emission especially K
emission is particularly interesting for applications (eg time-resolved X-ray
diffraction) The generation of characteristic line radiation during the irradiation of a
solid material with an intense femtosecond laser pulse is described detail in Ref [9
116-118]
The mechanism of K -ray emission from a laser induced plasma is very similar
to that in an ordinary X-ray tube However the static electric field used for electron
acceleration is replaced by the femtosecond laser electric field A brief description of
the process of K The interaction of a high
intensity laser beam with a solid surface rapidly creates a plasma The plasma electrons
interacting with the strong electric field of the incident femtosecond optical pulse can
acquire an energy which is high enough to leave the skin layer and penetrate into the
non-excited material underneath the surface plasma layer Some of these electrons will
be slowed down and generate Bremstrahlung Others collide with the non-excited
atoms kick out electrons from their inner electronic shells which subsequently undergo
inner shell recombination leading to characteristic line emission Therefore the
emission of the characteristic line radiation can only occur as long as the high energy
2 Optimization of a laser-plasma based X-ray source
7
electrons are present and can be regarded as a direct result of these hot electrons
These electrons exist only during the femtosecond laser pulse irradiation (and for a very
short time afterwards which is determined by the flight-time of the high energy
electrons through the material) Thus one can expect that the duration of the X-ray
pulses produced in this way is comparable to the laser pulse duration ie in the sub-
picosecond region [119-122]
Fig 21 Scheme for the generation of Kradiation by focusing an
ultrashort laser pulse on a solid target (a) The focused laser pulse
produces plasma on the surface of solid target (red area) Accelerated
electrons from the plasma travel into non-excited material and
produce there X-rays (yellow area) (b) The ionization of K-shell
electrons and the subsequent inner shell recombination leads to K-
emission
The energy distribution and the corresponding number of these hot electrons
have a strong influence on the characteristics of the emitted radiation in particular the
Kα yield The task to optimize the conditions for Kα X-ray generation turns into the
investigation of how the laser energy is converted into hot electrons with the
appropriate energy distribution and their following dynamics inside the non-excited
material The energy conversion is dominated by the laser absorption mechanisms
which are in turn determined by the parameters of the driving laser ie intensity angle
2 Optimization of a laser-plasma based X-ray source
8
of incidence laser polarization as well as by the properties of the plasma with which
the laser pulse interacts [119 123]
The subsequent interaction of the hot electrons and
the solid is mainly via collisions The mean free path of the hot electrons (or the
stopping distance) and the ionization cross section in the solid dominate the rate of Kα
emission [124-126]
Several studies based on simulations (particle-in-cell
simulation [127]
+ Monte Carlo transport code [128]
) were performed to investigate this
question Depending on the target material (Z) and the sample thickness the
simulations allowed to determine the laser parameters (ie laser wavelength intensity
polarization and pulse duration) which lead to the optimum electron distributions for
Kα emission [121 129-131]
These results are in good agreement with previous experimental
data [9 115 132 133-137]
In this study the effects of laser intensity target thickness angle of incidence and
precise controlled pre-plasma conditions on the Kα-production from Cu and Ti elements
are the objects for investigation To my knowledge systematic investigations of the
latter two effects on both elements were first performed
22 Laser system
In this section the laser system used as a driver for the laser-plasma based X-ray
source is described and some key parameters of this laser system are presented
The 10-Hz Titanium-Sapphire femtosecond terawatt laser system at the University
of Duisburg-Essen is based on the Chirped Pulsed Amplification (CPA) technique [5 6
138] Its working principle can be briefly described as follows A low energy
femtosecond pulse produced by an oscillator first passes through a so-called ldquostretcherrdquo
The stretcher consists of a dispersive delay line (gratings) and adds a controlled phase
modulation to the laser pulse thereby increasing its duration and decreasing its peak
intensity Typical stretching factors are 104 The ldquostretchedrdquo pulse can then be
amplified to high energies usually by several amplification stages After amplification
the pulse passes through the so-called ldquocompressorrdquo which compensates the phase
modulation imposed by the stretcher as well as any additional phase modulation
acquired during amplification (for example due to material dispersion) Ideally the
amplified pulse is recompressed to its original duration This technique allows to
produce high peak power laser pulses without deteriorating the pulse parameters and
damaging the optical components during the amplification process
2 Optimization of a laser-plasma based X-ray source
9
The main components of the laser system used in the experiments are shown in
Fig 22 The ldquoheartrdquo of the system is a mode-locked titanium-sapphire oscillator
pumped by a frequency doubled cw NdYVO4 laser (type Coherent Verdi diode-
pumped λ = 532 nm P = 5 W) It produces a train of 45 fs (full width half maximum -
FWHM) pulses with a repetition rate of 80 MHz and an energy of ~1 nJ per pulse The
central wavelength of the pulses is 800 nm with a spectral bandwidth (FWHM) of 21
nm
The output pulses from the oscillator are directed to the stretcher in which the
duration of the pulses is extended to 200 ps A grating with 1200 linesmm is used in
the stretcher as dispersive element for broadening the pulses Before the pulses enter
the amplification stages the repetition rate is reduced to 10 Hz using an electro-optic
selector consisting of a Pockels cell and a polarizer By inducing a suitable fast
switching electric field this combination allows the precise selection and separation of
pulses at a repetition rate of 10 Hz from the initial 80 MHz pulse train
The following amplification system consists of two multipass stages both using
TiSapphire crystals as gain medium pumped by frequency doubled Q-switched
NdYAG lasers (532 nm) In the first stage the seed pulses make eight passes through
the amplifying medium and are amplified to a pulse energy of about 1 mJ
(amplification by a factor of approximately 106
- 107) The second stage is a four-pass
power amplifier To obtain homogeneous pumping two lasers pumping from both sides
of the amplifying medium are applied After four passes in the second crystal the pulse
energy pulse is increased to about 200 mJ (amplification by a factor of approximately
100) Finally the amplified pulses enter the compressor The compressor contains again
gratings as dispersive elements to recompress the pulse to the desired pulse duration If
the compressor is operated under vacuum a maximum energy per pulse of 150 mJ with
a minimum pulse duration of about 45 fs can be achieved In the experiments discussed
here the compressor is operated in air and the pulse duration is adjusted to
approximately 120 - 150 fs With this duration self-phase-modulation (and self-
focusing) in air can be avoided and the pulse properties (spectrum spatial beam profile)
are not deteriorated during propagation
2 Optimization of a laser-plasma based X-ray source
10
Fig 22 The principle scheme of the laser system
The time-structure of the final output pulses was measured a third-order
autocorrelator (fs- to ps-time-range) The amplified laser pulse exhibits a relative
intensity of about 10-7
(ie contrast ratio of 107) approximately 1 ps ahead of the pulse
maximum and the contrast ratio to the amplified spontaneous emission (ASE) is 108 [139]
Due to such a high-contrast ratio the pre-plasma formation caused by laser pulse itself
is negligible in the experiments presented later
The key parameters of the laser system are summarized in the table 21 below
central wavelength 800 nm
spectral width 21 nm
min pulse duration 45 fs
in air pulse duration 120 150 fs
maximum pulse energy 150 mJ
contrast ratio at 1 ps 10-7
ASE 10-8
repetition rate 10 Hz
beam diameter (FWHM) 25 mm
Table 21 Key parameters of the 10 Hz laser system
The stability of the laser system ie energy and pointing stability is very
important for the experiments presented in this thesis Energy and pointing stability
were recorded and analyzed pulse-to-pulse over a few hours by U Shymanovich [140]
2 Optimization of a laser-plasma based X-ray source
11
Typical values under normal working conditions are less than 100 microrad pulse-to-pulse
pointing instability and 25 rms energy fluctuations
23 Experimental setup
Fig 23 Schematic of the experimental setup for Koptimization
All the works presented in this thesis were done with a few different experimental
setups For the investigation of the Kα production a setup as schematically shown in
Fig 23 was used The 25 mm diameter (FWHM) p-polarized laser beam was reflected
from a mirror with a 5 mm diameter hole in its center that allowed transmission of a
small part of the beam The transmitted part was time delayed with a variable delay
line and recombined with the main laser beam using a second apertured mirror The
combined p-polarized laser beams were focused with a 30 cm focal length lens onto the
target surface This lens could be accurately translated along the direction of the laser
beam propagation to change the focusing conditions ie the focus size on the target
Two PIN photodiodes one for recording the incident energy and another for the
reflected energy were used to measure the reflectivity from which the absorption of
the laser energy can be deduced By using a microscope objective combined with a
CCD camera the focal spot sizes of main and pre-pulse were measured as ~ 20 μm and
~ 70 μm FWHM respectively The focal area of the pre-pulse is about 12 times bigger
than that of the main pulse and both pulses can be adjusted to spatially overlap well at
all delay times The angle of incidence was varied by rotating the target For each
specific angle the laser intensity was kept constant by adjusting the laser energy The
targets were mounted on a motorized XYZ translation unit and moved between
2 Optimization of a laser-plasma based X-ray source
12
consecutive laser pulses to provide a fresh surface for each pulse In these experiments
four kinds of targets were used 300 nm Cu and Ti films coated on a glass substrate and
20 μm Cu and Ti foils glued onto a glass substrate
The X-ray radiation was detected with a Princeton Instruments CCD-camera (type
PI-MTE 1300B) It is back-illuminated Si-CCD that is suitable for the photon energy
range relevant in this work (ie 2 to 10 keV) The chip area is 1340 pixels times 1300 pixels
(20 microm times 20 microm each) The camera was located ~ 20 cm away from the X-ray source
and the average X-ray flux per pulse was reduced to 1 photon per 40 pixels by using an
Al filter of moderate thickness (150 microm and 210 microm for Ti and Cu respectively) in
front of the camera The filter also protected the CCD from low energy Bremsstrahlung
and from visible light This configuration allowed the camera to work in ldquosingle photon
counting regimerdquo as a spectrometer exploiting the fact that a X-ray photon detected
with the CCD creates a charge strictly proportional to its energy (for Si the electron-
hole pair creation energy is 366 eV [141]
and thus a single Cu Kα photon (805 keV) will
produce about 2200 photoelectrons) Therefore one can obtain the energy spectrum of
the detected X-rays from the distribution of the signal of all camera pixels (signal
histogram of the recorded images) A typical single-pulse spectrum using Cu as target
with well resolved Cu Kα and Kβ lines at 805 keV and 891 keV respectively is shown
in Fig 24 The single-pulse spectra of Ti which are not shown here are similar The
Kα yield can in principle be obtained by integrating the signal in the relevant energy
range after appropriate background subtraction
Fig 24 Spectrum of the laser produced Kα emission of Cu
2 Optimization of a laser-plasma based X-ray source
13
However to determine the absolute Kα yield of the source it has to be considered
that a single X-ray photon not always generates charge in only a single CCD pixel but
that the generated charge may be distributed over many pixels (many-pixel-
events)[142]
This distorts the measured spectra and leads to an underestimation of the
Kα yield since a many-pixel-event created by a single Kα-photon is detectedcounted
as several photons of apparently lower energy For Ti and Cu Kα radiation the spatially
largest events involve 4 pixels as reported in Ref [142] In order to determine the
percentage of single-pixel events in the detection system a few images were randomly
sampled from all the measured data and analyzed in detail It was found that about 50
of all detected Kα-photons generated single-pixel events while the other 50 were 2-
3- and 4-pixel events (the number of events involving 5 and more pixels was
negligible) Therefore a correction factor of 2 was applied to the number of detected
Kα-photons determined from the integration of the spectra To derive from this the
absolute Kα yield the transmission of the Al filters as well as the quantum efficiency of
the CCD (18 at 8 keV 55 at 45 keV) [143]
was taken into account Moreover it was
assumed that the X-ray emission is isotropic into the full solid angle
24 Optimization of Kα X-ray emission by adjusting the laser
intensity
In this section the experimental results concerning the optimization of the Kα X-
ray emission are presented Two key factors namely laser intensity and the pre-plasma
scale length were varied to study their influence on the Kα yield
As mentioned in section 21 to efficiently ionize the K-shell electrons of the target
material which in turn lead to an efficient X-ray emission hot electrons with the
appropriate kinetic energy should be produced The kinetic energy of these hot
electrons is strongly dependent on the accelerating laser field Therefore the laser
intensity is one of the key factors to control and optimize the Kα generation The
average energy of the accelerated electrons often described by an effective ldquohotrdquo
electron temperature Th generally relates to the pondermotive potential of the laser
field and follows a power scaling law Th ~ (Iλ2)13
[144 145]
as observed in many
experiments [115 146-148]
and also found with PIC simulations [119]
For optimum Kα
emission the average electron energy should be a few times the K-shell ionization
energy depending on the geometry of the target and the atomic number [121 129 137
2 Optimization of a laser-plasma based X-ray source
14
149]With this condition the laser intensity for optimum Kα production can be estimated
For example to maximize the yield of Cu Kα (805 keV) radiation the average electron
energy should be between 25 keV and 50 keV [120 121 129 148 150 151]
With the mentioned
empirical scaling law Th ~ (I0λ2)13
this average electron energy corresponds to a laser
intensity of a few times 1017
Wcm2 at a laser wavelength of 800 nm
[120 121 137] For Ti
the predicted optimum laser intensity is a few times 1016
Wcm2 [121 152]
With the given focal length (30 cm) a maximum laser intensity of
16 times 1017
Wcm2 can be achieved The laser intensity dependence is investigated by
varying the relative position of the laser focus with respect to the target surface In this
way the laser intensity on target changes while the pulse energy is kept constant No
additional pre-pulse is applied in this experiment Fig 25 shows the experimentally
determined (normalized) Kα yield from 20 μm Cu and Ti foils as a function of the
position of the target surface relative to the focus of the lens In this measurement no
attempt was made to convert the position scale into an intensity scale but it is obvious
that the Kα emission for the different target materials is optimizedmaximized at
different lens positions and thus at different intensities For Cu the sharpest focusing
and thus the highest intensity provides the largest Kα emission For Ti this is achieved
out of focus and thus at a lower intensity This effect has been discussed before in the
literature [130 152 153]
Fig 25 indicates that for Ti the ldquooptimumrdquo intensity for Kα-
production is reached and exceeded in the experiments This optimum intensity is lower
than the maximum laser intensity reached at the focus as predicted by theory [121]
For a
Gaussian beam it is expected that the change of the spatial intensity distribution should
be symmetric with respect to the focus The asymmetry of the measured double-peak
dependence of the Ti Kα yield indicates that this is not the case in the experiment This
is attributed to the method (hole in a mirror) used to split off the pre-pulse that was
used for the measurements described below from the main pulse leading to a non-
Gaussian intensity distribution For the higher atomic number material Cu the optimum
conditions for Kα-production correspond to higher laser intensity Since no double-peak
structure is observed for Cu it can be concluded that the maximum intensity used in the
experiment is comparable or below the expected optimum value for this material again
in agreement with the predictions and estimates mentioned above
2 Optimization of a laser-plasma based X-ray source
15
Fig 25 Kα emission as a function of the relative position of the
target surface of 20 μm Cu and Ti foils with respect to laser focus
The lines between the data points are only to guide the eye
Fig 26 Measured dependence of X-ray yield on laser energy for a
20 μm Cu foil The angle of incidence is 45deg
Since Cu Kα radiation has been used for the time-resolved diffraction experiments
discussed in this thesis the emission from a Cu target has been investigated further
Keeping the spot size (position of the lens) fixed a precise measurement as function of
laser pulse energy was performed and it provided more detailed information on the
laser intensity dependence with this target material For laser energies above 30 mJ and
intensities in the region from 1016
Wcm2 to 10
17 Wcm
2 the Cu Kα yield scales linearly
2 Optimization of a laser-plasma based X-ray source
16
with laser energyintensity - Fig 26 There has been no evidence of saturation in
agreement with theoretical calculations which predict an optimum intensity for Cu Kα-
production of a few times 1017
Wcm2 [121 137]
Additionally a data set with a controlled
pre-pulse arriving 6 ps before the main pulse is also presented in this figure An
obvious improvement in the Kα-production is observed A detailed discussion of this
effect will be presented in the next section The maximum absolute yield obtained in
this measurement is in line with other reported Cu Kα sources [107 148 154 155]
25 Optimization of Kα X-ray emission by using a controlled
pre-plasma
Another approach for optimization of the Kα emission is to improve the energy
conversion efficiency from the laser pulse to electrons and subsequently to Kα photons
The dominant absorption mechanism at laser intensities around 1017
Wcm2
is expected
to be resonance absorption (RA) [116 121 131 133 152 156-158]
The crucial parameter for the
efficiency of the energy transfer for this mechanism is the plasma density scale length
at the time when the maximum pulse intensity is reached Assuming isothermal plasma
expansion an exponential electron density profile )exp()( 0 Lxnxn ee is
produced [159]
and the plasma density scale length L is defined as ee nnL Since
the plasma expands with a typical velocity of ~106ndash10
7 cms
[160-162] the time interval
between the plasma-formation threshold and the maximum intensity largely determines
the scale length seen by the pulse during the interaction Therefore the conversion
efficiency in this case is very sensitive to the temporal structure of the rising edge of the
laser pulse For this reason control over the time structure of the pulse provided by the
laser system becomes important to control the Kα emission An important parameter of
the laser pulse time structure is the contrast ratio defined as the ratio of intensity of the
pulse at the maximum and pre-pulsesbackground before the main pulse In some
previous work [130 148 152 156]
using laser systems with low contrast ratio pre-pulses
andor amplified spontaneous emissions (ASE) usually cause plasma formation long
before the peak of the pulse reaches the target Such long pre-plasma scale lengths
provided by the laser systems already lead to strong absorption making additional
improvements difficult However relying for a particular laser system only on its
inherent pre-pulse for ldquooptimizationrdquo is hardly satisfactory because the scale length will
rarely be optimized and matched to other parameters On the other hand with a very
2 Optimization of a laser-plasma based X-ray source
17
high contrast laser system it has already been demonstrated that introducing a pre-
formed plasma using a weak artificial pre-pulse can increase the conversion efficiency
of the X-ray yield from laser produced plasmas [118 137 163-167]
(this effect is also visible
in Fig 26) Therefore systematic investigations of the plasma scale length
requirements for different experimental conditions are necessary In this section the
mechanism of the resonance absorption will first be explained Then the experimental
results are presented followed by their discussion
251 The resonance absorption (RA) and its optimum
condition
The resonance absorption occurs when an electromagnetic wave with p-
polarization (the electric field in the plane of incidence) is obliquely incident in an
unmagnetized inhomogeneous plasma In this process the electromagnetic wave
couples with the electron plasma wave at the region of critical density (defined as
nc=22 4 em L where m and e are the charge and the mass of the electron respectively
and L the angular frequency of the laser light) where the local electron plasma
frequency equals the incident wave frequency There the energy is effectively
transferred from the incident electromagnetic wave to electron plasma wave and the
electron plasma wave can be resonantly enhanced As the electron plasma wave grows
nonlinear wave-breaking [168 169]
can lead to the consequent production of hot
electrons
2 Optimization of a laser-plasma based X-ray source
18
Fig 27 Scheme of oblique incident laser pulse traveling inside a
plasma The red violet green and magenta trajectories represent the
propagation path of the incident laser pulses with angle of incidence
of 60deg 40deg 20deg and 0deg respectively The double arrows
perpendicular to the trajectories represent the polarization of the
electric fields (p-polarization) The trajectories are reflected before
reaching the critical density layer where nenc=1 The turning point
depends on the angle of incidence
A simple theoretical estimate of the optimum condition for RA is given by the
formula (2πLλ)23
sin2αmax = 06
[147] where Lλ is the plasma scale length normalized
to the laser wavelength αmax is the angle of incidence at which RA is optimized This
equation is obtained by solving the wave equation for light wave propagation in a
plasma with linear density profile It expresses an important relation between the
plasma scale length and αmax the angle of incidence for the optimum absorption
decreases with increasing plasma scale length The mechanism can be described
qualitatively in Fig 27 The absorption occurs in the critical density region where
ne=nc ne is the local electron density in the plasma The total absorption depends on
2 Optimization of a laser-plasma based X-ray source
19
how large the field driving the resonance is at the layer of critical density This field is
firstly determined by the angle of incidence because only the field component along the
density gradient which varies as sinα contributes to the excitation of electron plasma
wave Secondly since the refractive index of the plasma in the undercritical region
decreases with increasing density (ie Drude-model) an obliquely incident light wave is
refracted towards regions of lower density and reflected at a density lower than the
critical density (turning point) with ne= nccos2α
[147] Although the laser light wave
can propagate only up to turning point before it is specularly reflected some amount of
the light energy will tunnel into the critical density region and drive the resonance The
value of this driving field at the turning point can be estimated using the Airy function
solution [170]
and it decays exponentially depending on its travel distance as it penetrates
beyond the turning point Thus the resulting driving field at the layer of critical density
is a competition between maximization of the electric field component along the
density gradient and the distance of the field penetration beyond the turning point
Particularly in the situation of the experiments that will be presented later for a long
scale-length system (eg Lλ asymp 1) the turning point of a steep angle of incidence is
closer to the layer of critical density as one can see in the Fig 27 Although the field
component normal to the density gradient is weak in this case the short attenuation
distance to the critical density surface provides a stronger driving field than the one
with large angle of incidence which has large field components normal to the density
gradient but the field decay dramatically due to the large tunnel distance to reach the
critical density surface The stronger driving field at a small α (eg asymp 25deg) leads to the
stronger absorption than with a large α (eg asymp 55deg) On the other hand for a short scale-
length system (eg Lλ asymp 01) the positions of turning points of all incidences are all
close to the layer of critical density thus the attenuations of their driving fields due to
the tunnel distance are neglectable With increasing angle of incidence α (eg asymp 55deg)
the electromagnetic wave spends progressively more of its time near nc and the
excitation of the electron plasma wave at the critical density layer becomes more
efficient This leads to more efficient absorption than at small α (eg asymp 25deg)
2 Optimization of a laser-plasma based X-ray source
20
Fig 28 Plasma density profile for different times (a) arrival of the
pre-pulse (b) between pre- and main pulse and (c) when the main
pulse arrives
In order to establish a well defined plasma scale length in the work described later
the pre-plasma is produced by a laser pre-pulse arriving with a controllable delay before
the main laser pulse In Fig 28 a schematic of this arrangement is presented The pre-
pulse strikes the target surface and ionizes the material Subsequently the created
plasma starts to expand Assuming a constant expansion velocity Cs = (ZkTeM)12
the
plasma scale length L grows linearly in time according to L equiv Cst [171]
(Te is the
electron temperature determined by the pre-pulse intensity Z is the average ionization
degree k is the Boltzmann constant and M is the ion mass) After a certain time ∆t the
main pulse arrives and strikes on this pre-formed plasma with a specific density scale-
length L This scheme offers the possibility of actively manipulating and optimizing the
coupling efficiency hot electron distribution and thus the Kα emission With such a
precisely controlled pre-plasma the optimum conditions for RA discussed in this
section can be used to compare with the experimental conditions for which the Kα yield
is optimized in the following experiments
252 Experimental results
According to the results discussed in the previous section the experiments in this
chapter where performed under ldquooptimumrdquo focusing conditions The Cu targets were
placed exactly in the focus of the lens while the Ti targets were placed about 900 μm in
front of the focus These configurations lead to intensities on the Cu and Ti targets of
16 times 1017
Wcm2
(focus diameter ~20 μm FWHM) and 92 times 1016
Wcm2
(~25 μm
FWHM) for the main pulse and 20 times 1014
Wcm2
(~70 μm FWHM) and 11 times 1014
Wcm2 (~90 μm FWHM) for the pre-pulse respectively
2 Optimization of a laser-plasma based X-ray source
21
The absolute Cu and Ti Kα emission as a function of the main pulse delay at a
fixed angle of incidence of 45deg on targets of different thickness are presented in
Fig 29 (a) and Fig 29 (b) respectively The Cu and Ti Kα emission signal
normalized to the emission measured at negative time delay (52 times 108
photonspulsesr
for 20 μm Cu 82 times 107
photonspulsesr for 300 nm Cu 14 times 109
photonspulsesr for
20μm Ti and 12 times 108
photonspulsesr for 300 nm Ti) are presented in Fig 29 (c) and
Fig 29 (d) respectively The Kα yields of the 20 μm targets are six and eleven times
larger than for the 300 nm Cu and Ti thin film targets respectively This is because at
these intensities the mean-free-path of the hot electrons is much larger (several microm
[121 130 172]) than the thickness of the thin film targets Therefore in the thin films only a
small fraction of all the hot electrons will create a hole in the K-shell and thus the Kα
emission is much less than for a bulk target
In the presence of an extended pre-plasma created by the pre-pulse the Kα yield
starts to improve After a certain time delay the Kα yields reach their maximum value
and start to drop with further increasing delay times A very similar behavior is
observed for thick and thin targets as can be seen from Fig 29 (c) and (d) These
results show that the pre-plasma which is generated by the controlled pre-pulse permits
effective Kα production At an angle of incidence of 45deg an ldquooptimumrdquo time delay for
Kα production exists on all types of targets Under these optimum conditions the Kα
production on all targets is improved by almost a factor of 2 whereby the coated targets
exhibit slightly better improvements than the thick foil targets On the other hand it
should be noted that the Bremsstrahlung-background also increases with increasing Kα
yield This is shown in Fig 29 (e) where the measured X-ray signal integrated in the
energy range from 6 - 30 keV for Ti and 10 - 30 keV for Cu is plotted as a function of
pre-pulse - main pulse delay These energy ranges have been chosen to exclude the
above mentioned many-pixel-events produced by single Kα photons since these
many-pixel-events contribute to the background only below the Kα energy
2 Optimization of a laser-plasma based X-ray source
22
Fig 29 Kα emission as a function of main pulse delay at a fixed
angle of incidence of 45deg on targets of different thickness (a) Cu and
(b) Ti (c) Kα emission of Cu-targets normalized to the emission
measured at negative delay time (52 times 108
photonspulsesr and 82
times 107
photonspulsesr for d = 20 μm and 300 nm respectively) (d)
Kα emission of Ti-targets normalized to the emission measured at
negative delay time (14 times 109
photonspulsesr and 12 times 108
photonspulsesr for d = 20 μm and 300 nm respectively) (e) Hard
X-ray background signal as a function of main pulse delay on 20μm
targets
2 Optimization of a laser-plasma based X-ray source
23
Fig 210 Absolute Kα emission as a function of main pulse delay at
different angle of incidence ( a ) Cu and ( b ) Ti The measured Kα
yield at negative or zero delay is the same as obtained without pre-
pulse
In the following a more systematic study of the influence of a pre-plasma on the
Kα production using the 300 nm thin film targets will be presented With their high
(optical) surface quality the uncertain condition for the formation of plasma caused by
2 Optimization of a laser-plasma based X-ray source
24
surface roughness can be avoided [173]
Based on the very similar behaviour of thin film
and bulk targets for the specific conditions of the measurements presented in Fig 29 it
is presumed that the results obtained on thin films which will be discussed below can
be transferred to thick targets (by scaling of the absolute yield) Fig 210 (a) and (b)
show the Cu and Ti Kα emission as a function of the main pulse delay at different
angles of incidence respectively Since the pre-pulse arrives after the main pulse and
thus does not play a role at negative delay time the X-ray yields obtained in this
situation will be refer to the situation as rdquowithout pre-pulserdquo in the later discussions
Introducing a pre-pulse results in an increase of the Kα yield which is particularly
important for small angles of incidence The Kα yield of both target elements exhibit
similar qualitative dependencies on delay time and angle of incidence though the Ti
target shows noticeably larger relative variations
253 Discussion
Due to the high contrast ratio laser pulses used in the present experiment the
scale-length in the absence of the controlled pre-pulse will be very small With short
scale-lengths as already discussed in section 251 the maximum absorption occurs at a
large angle of incidence αmax typically 70deg or 80deg [147 174 175]
In such a case the
absorption should increase monotonically with the angle of incidence and this is
expected to result in an increase of the Kα yield In Fig 211 the measured absorption
of the main pulse and the Cu and Ti Kα yield without pre-pulse from Fig 210 are
presented together The measurement was carried out at constant laser intensity
(~16 times 1017
Wcm2
for Cu and ~92 times 1016
Wcm2 for Ti) With a sample thickness of
300 nm no light is transmitted Thus the absorption A can be simply determined from a
measurement of the reflectivity R using the two photodiodes shown in Fig 23 as
A = 1 - R As can be seen in Fig 211 the laser absorption does indeed increase with
the angle of incidence α for both target elements so do the Kα yields These
observations are in agreement with the previous works [147 174 175]
2 Optimization of a laser-plasma based X-ray source
25
Fig 211 Absorption measurement with main pulse only measured
at constant laser intensity Scale on left hand side absorption scale
on right hand side Cu and Ti Kα yield without pre-pulse (data taken
from Fig 210)
With a specific target material the only two variable parameters determining the
plasma scale-length L are t (delay between the pre-pulse and the main pulse) and Te
(the electron temperature determined by the pre-pulse intensity) (see section 251)
When the pre-pulse laser intensity is constant L can be assumed to be approximately
proportional to t For this reason although the absolute values of the scale-length were
not measured in the experiment the relative values from these data can be deduced and
be compared to the theoretically estimated values assuming RA as the dominant
absorption mechanism This comparison revealed that the maximum Kα yields correlate
with the maximized absorption
Using (2πLλ) 23
sin2αmax = 06 as the condition to maximize RA (see section
251) optimum normalized scale lengths of 0135 0209 0392 and 0980 are
calculated for angles of incidence of 55deg 45deg 35deg 25deg respectively In Fig 212 (a)
the optimum delay times of the pre-pulse for maximum Kα emission in Fig 210 are
shown The maxima appeared at about 3ps 5ps 8ps and 15ps on the Cu target at 55deg
45deg 35deg and 25deg respectively For Ti they were at about 2ps 3ps 5ps and 11ps at
55deg 45deg 35deg and 25deg respectively Fig 212 (b) compares the optimum delay time
from Fig 212 (a) normalized to the value found at 55deg with the theoretical estimate of
the optimum scale length for RA normalized also to the 55deg-value Since the intensity
2 Optimization of a laser-plasma based X-ray source
26
was kept constant (of the pre-pulse as well as of the main pulse) the scale length is
proportional to the delay time The comparison shows that the normalized plasma scale
lengths for the best Kα yield from both target materials are in good agreement with the
theoretically estimated optimal scale length for RA The optimum pre-pulse delay
increases with decreasing angle of incidence since the optimum plasma scale length for
maximum RA increases with decreasing angle of incidence Fig 212 essentially proves
that a maximized absorption corresponds to maximum Kα yield
( a ) ( b )
Fig 212 (a) The optimum delay time for the pre-pulse having the
maximum Kα yields extracted from Fig 210 (b) Comparison of
experimental data and theoretical estimation Points are the
experimental data in (a) normalized to their respective value at 55deg
Dashed curve is the theoretical calculation of the optimum plasma
scale length for resonance absorption also normalized to 55deg-value
The theoretical curve is calculated from (2πLλ)23
sin2θ = 06
[147] and
its absolute value indicates at Y-axis on the right hand side
In order to see how the Kα yield develops for different conditions of plasma scale
length and angle of incidence the dependencies of the Kα yield as a function of the
angle of incidence for different fixed pre-pulse delay times t are deduced from the
data of Fig 210 and plotted in Fig 213 For the present experimental conditions t
essentially represents the value of the plasma scale length L and thus the data plotted in
Fig 213 show the Kα yield as a function of the angle of incidence for different plasma
scale lengths From the previous discussion of Fig 212 the plasma scale length at
t = 15 ps for Cu is estimated as L = 082 and for Ti L = 126 For t = 0 ps (very
short scale length) the Kα yield increases monotonically with α The maximum Kα
yield is beyond 55deg When the delay t (scale length) is increased the maximum Kα
yield shifts to a smaller angle of incidence eg in (a) for t = 4 ps the maximum
appears at 45deg for t = 7 ps at 35deg Finally t = 15 ps the Kα yield decreases
2 Optimization of a laser-plasma based X-ray source
27
monotonically with α indicating the maximum Kα yield is reached at angles of
incidence of less than 25deg As discussed above the maximum Kα yields correlate with
maximum absorption which in turn shifts to small angles of incidence at large t (large
plasma scale length) The behavior of the Kα yield proves once again that RA is the
dominant absorption mechanism
( a ) ( b )
Fig 213 Kα emission as a function of the angle of the incidence at
fixed pre-pulse delay a) Cu at t = 0ps 4ps 7ps 15ps ( b ) Ti at
t = 0ps 3ps 8ps 15ps
Since the goal for this study is to achieve the best Kα yield for time-resolved X-ray
diffraction experiments it is worth to compare the absolute Kα yield for different angles
of incidence at optimum scale length and without pre-pulse As can be seen from Fig
214 without pre-pulse the Cu and Ti Kα yields increase linearly with the angle of
incidence On the contrary at the optimum delay (optimum plasma scale length) the Kα
yield is essentially independent of the angle of incidence Although these observations
have not been fully understood it indicates that the reduced main-pulse-only yield at
smaller angles of incidence can be fully compensated (ie the yield can be brought back
to its maximum value) by an appropriate pre-pulse
2 Optimization of a laser-plasma based X-ray source
28
Fig 214 Cu and Ti Kα yield as a function of the angle of incidence
at the maximum value and without pre-pulse The lines are to guide
the eye only
If one extrapolates the linear dependencies measured without pre-pulse to higher
angles they reach the angle-independent optimized level at a finite angle of incidence
In the case of Cu this seems to occur at a large angle of incidence near 90o For Ti this
level is already reached at angles of incidence slightly above 60o This result might
arise from the presence of a short scale length pre-plasma caused by the leading edge of
the main pulse alone (even for a high contrast laser pulse and in the absence of any
further pre-pulse) As discussed for the absorption in Fig 211 it indicates that in the
present experiment at this large angle of incidence the plasma scale length generated by
the main pulse alone fulfills the condition for optimum RA and thus maximized Kα
generation Hence the optimized Kα yield can be achieved without introducing an
artificial pre-pulse ndash a conclusion which is also supported by PIC simulations (see
section 26) This would also explain why in many experiments even a relatively poor
contrast ratio laser system allows to achieve high Kα yields [130 148 152 156]
Nevertheless it can be concluded that for a given contrast ratio (given by the laser
system) and ion mass or a given scale-length in the experiment one should choose the
appropriate angle of incidence α to obtain the maximum Kα yield Or vice versa if α is
fixed then one has to adjust L accordingly via pre-pulse control Such an optimization
could be achieved at least in the range of the values of α and L (obtained from Δt)
covered by the current experiment ie α ~ 25deg hellip 55 deg and Lλ ~ 01 hellip 1
2 Optimization of a laser-plasma based X-ray source
29
Fig 215 Energy conversion efficiency vs angle of incidence with
pre-pulses and without pre-pulses
An important note concerning the energy conversion efficiency should also be
made here The angular independent optimized Kα yield shown in Fig 214 was
obtained by keeping the laser intensity constant The focused spot size projected onto
the sample surface increases with angle of incidence as 1cos() Therefore at large
angle of incidence (eg α = 80deg) one needs more laser pulse energy than at small
angles of incidence (eg α = 20deg) for the same amount of produced photons (In this
example a factor cos(20deg)cos(80deg) ~ 5 times more for α = 80deg compared to α = 20deg) It
can be noticed that the energy conversion efficiency from laser pulse into Kα X-rays
essentially decreases with the increasing angle of incidence To clarify this issue more
clearly the energy conversion efficiency has been deduced from Fig 214 using the
known laser energies Kα photon energies and Kα yields and is presented in Fig 215 In
principle the conversion efficiencies obtained here are in line with other experimental
results reported in the literature [129 176]
Without the pre-pulse the conversion efficiency
increases with the angle of incidence for both materials As already discussed in Fig
210 the absorption improves with increasing angle of incidence for the given small
pre-plasma scale length that is caused by the main pulse itself and thus leads to a higher
Kα yield On the contrary at the optimized pre-pulse conditions the conversion
efficiency decreases with increasing angle of incidence as predicted
2 Optimization of a laser-plasma based X-ray source
30
26 Comparison of the experimental results with simulations
Particle-in-Cell simulations (PIC) are a very powerful and direct numerical tool for
modeling laser-plasma interactions [177-179]
In the PIC simulation the charged particles
(electrons ions neutrals molecules dust particles etc) are modeled as individual
macro-particles moving in non-physical grid across the plasma (the cell part of the
name) using Newtons laws and self-consistently calculated electric fields resulting
from external (applied) fields and internal fields from charge distributions By solving
the equations of motion of these particles the moments of the distribution of the
particles such as densities and currents can be obtained simultaneously The results of
PIC simulations presented in this section were preformed by M Mašek and P Gibbon
with whom we cooperated
To obtain a quantitative estimate of the Kα production this simulation consists of
two steps The energy distribution of hot electrons generated by the laser-plasma
interaction was first determined with PIC simulations Then the total Kα photon yields
produced by fast electrons going inside the target were calculated with a Monte-Carlo
method which is a stochastic technique using random numbers and probability
statistics to investigate mathematical or statistical problems [180]
The detailed PIC simulations were performed by using the 1D3V (1 spatial 3
velocity coordinates) code BOPS (Boosted Oblique Particle Simulation) [127 131]
which
can treat oblique incidence Up to 6000 spatial grids and 500000 electrons and ions are
used in the simulation The laser is p-polarized with fixed intensities as in the
experiments The initial plasma parameters were chosen as close as possible to those
expected in the experiment More details can be found in Ref [181]
Fig 216 shows the dependence of absorbed energy on the plasma scale-length
from the simulation It is found that the scale length at which absorption becomes
maximum decreases with increasing angle of incidence qualitatively in agreement with
the simple RA-picture presented above (Fig 212(b)) Moreover the scale-length
dependencies of the absorption show a general qualitative correlation with the
experimental dependencies of the Kα yield with delay time as shown in Fig 210
2 Optimization of a laser-plasma based X-ray source
31
( a ) ( b )
Fig 216 The calculated absorbed energy as a function of the initial
plasma density scale length and incidence angle for Cu ( a ) and Ti
( b ) targets Pictures reproduced from Ref [181]
The total number of Kα photons generated by the hot electrons during their
propagation through the nonexcited solid material underneath the plasma layer was
calculated according to a standard cross section model using a method similar to Ref
[129 182] The electron distributions obtained from the PIC simulations are split into
several monoenergetic beams and transported through the foil which is divided into
several cells Using the relativistic K-shell ionization cross section [124]
the number of
generated Kα photons is calculated With the Monte-Carlo method each electron beam
is slowed down via collisions according to the Bethe stopping formula whereby the
stopping power is taken from the NIST database [183]
for both materials Once the
electron beam escapes from the rear of the target it is assumed to play no further role in
the Kα production a reasonable assumption because the foils were mounted on low-Z
(glass) substrates The reabsorption of Kα photons is also taken into account The
attenuation coefficient is taken also from the NIST database [184]
Fig 217 shows the dependence of the Kα yield on the initial density scale-length
It is clear that the qualitative behavior from Fig 217 (a) and 217 (b) is the same for
both materials as in the experiment (Fig 210) The Kα yield reaches its maximum for
roughly the same scale-length as the laser absorption indicating that the Kα yield is
largely determined by the absorption efficiency On the other hand the absolute values
of Kα yields obtained from the PIC simulations are roughly a factor of 3 to 4 times
lower than the measured values a discrepancy which could be due in part to the
geometrical simplifications in the model There are also differences in the positions and
2 Optimization of a laser-plasma based X-ray source
32
values of the Kα maxima although these are difficult to define precisely for the
simulations because of insufficient statistics
( a ) ( b )
Fig 217 Calculated Kα yield as a function of the intial plasma
density scale length and incidence angle for ( a ) Cu and ( b ) Ti
targets Pictures reproduced from Ref [181]
Finally I would like to add a comment on the time structure of these X-ray pulses
predicted from the PIC simulation although it does not directly relate to this
measurement The result of PIC simulation did show that the duration of these X-ray
pulses is in the sub-picosecond region [121]
and this prediction has been experimental
proved in the following time-resolved experiments
27 Summary
In summary the emission of Kα-photons of Cu and Ti targets was measured at
different laser intensities sample thickness angles of incidence and different pre-
pulsepre-plasma conditions It has been shown that for the given experimental
conditions an optimum laser intensity for Kα-production can be reached in the case of
Ti For Cu this optimum intensity appears to be higher than the maximum intensity
attainable in the experiment For constant laser intensity on a steep density gradient
plasma the Kα yield is highest at large angles of incidence For smaller angles the yield
decreases and reaches its lowest value when approaching normal incidence However
introducing a pre-pulse at appropriate time in advance to the main pulse the yield can
be increased to the same value as at large angle of incidence without a pre-pulse
Therefore the optimized Kα yield is independent on the angle of incidence and it can be
achieved by proper choice of the pre-pulse timing Experimentally this was verified for
angles between 25 deg to 55 deg
2 Optimization of a laser-plasma based X-ray source
33
It was also experimentally found and supported by simulations that the Cu and Ti
Kα generation follows the laser absorption as known for other materials [77 118 164 172
156 163 167] As expected resonance absorption (RA) has been proved to be the dominant
absorption mechanism in this process and optimization of the Kα production results
from a maximized absorption of the laser pulse For a high contrast laser system as
used in this experiment controlled pre-pulses provide well defined pre-plasma scale-
lengths allowing systematic investigation on the optimization of absorption Kα
production for the other given experimental conditions (material angle of incidence
pulse energy intensity) The simulations with these well defined initial parameters
show the qualitative agreement with experimental observations and provide insights
into the physical process of laser energy absorption hot electron generation electron
transport in the material and the resulting Kα generation
For practical purposes the present work indicates that for long plasma density
scale lengths created by the leading edge of a low contrast ratio laser system and other
experimental conditions (within the range Lλ ~ 01-10) the Kα emission from a laser
produced plasma could be optimized by operating the X-ray source at the matched
angle of incidence Experimental arrangements in which an unintentional (or
unavoidable) pre-pulse is present could probably be improved simply by using a small
angle of incidence instead of the 45deg geometry typical of many setups The present
study indicates that the X-ray emission could be increased by a factor of 2 or 3 in this
case with obvious advantages for many applications of fs-Kα sources such as time-
resolved X-ray diffraction (TRXD) On the other hand for a high contrast laser system
leading where the self generated plasma exhibits a steep density gradient (small scale
lenghth) these findings still suggest to use a small angle of incidence and a matched Δt
For the same value of Kα emission this requires less energy to achieve the same on-
target intensity as with a large angle of incidence and subsequently leads to a better
energy conversion efficiency
In the following chapter these results are applied to improve the laser-plasma
based X-ray source for the TRXD experiments
3 Improvement of the modular setup for time-resolved X-ray diffraction experiments
34
3 Improvements of the modular setup for
time-resolved X-ray diffraction experiments
As it has been discussed in detail in the previous chapter focused laser intensities
in the range of 1017
- 1018
Wcm2 are required to efficiently generate X-rays in the
multi-keV range If the irradiated target is surrounded by an atmosphere non-linear
effects (eg self-phase-modulation self-focusing [185]
) and plasma formation
(breakdown) in the atmosphere will severely deteriorate the spatial intensity
distribution of the focused femtosecond pulse and the required on-target intensities
cannot be reached Therefore the X-ray target has to be placed in vacuum Two
different set-ups to perform time-resolved X-ray diffraction are currently used at the
University of Duisburg-Essen One scheme uses a large vacuum chamber to place not
only the X-ray target but the whole setup (including X-ray optics samples and
detectors) under vacuum [70 140]
This scheme avoids absorption losses of the generated
X-rays in air (which is more critical for lower energy radiation like Ti K- 451 keV)
but it poses some geometrical restrictions due to its limited size Moreover operation of
the setup is relatively complicated since most of the components in the chamber require
remote control
To overcome some of these drawbacks a second scheme for time-resolved X-ray
diffraction experiments had been designed and built up mainly by Dr Matthieu Nicoul
[186] and since then it has been continually further developed This setup has a modular
design and only the X-ray sourcetarget itself is operated under vacuum and all the
other experimental components are placed in air This gives a lot of advantages such as
more space for experimental components and convenience in adjusting them It was the
aim of the work described in this chapter to improve the existing setup to allow for
time-resolved Bragg-diffraction experiments with increased accuracy (see chapter 5)
and to enable new experimental schemes that had not been possible before (ie time-
resolved Debey-Scherrer-diffraction see chapter 6) In the first part of this chapter the
fundamental components of the previously existing setup are briefly described In the
3 Improvement of the modular setup for time-resolved X-ray diffraction experiments
35
second part I present and discuss the implemented improvements including hardware
software and methodology Finally a summary for this chapter is given
31 The fundamental components of the current setup
A scheme of the current setup is shown in Fig 31 The fundamental components
(labeled with black letters on Fig 31) had already been described in detail in Ref
[186] In order to provide the necessary information to the reader the important
components will be briefly pointed out in this section The implemented
improvementsadditions to this setup are also represented on Fig 31 (labeled with blue
letters) and they will be discussed in the next section 32
Fig 31 Scheme of the current modular setup for time-resolved X-
ray diffraction experiments The elements labeled with black letters
are components of the previously existing setup and the ones labeled
with blue letters are components implemented during my PhD work
The CPA Tisapphire laser system described in chapter 2 delivers 150 fs laser
pulses at a wavelength of 800 nm with an energy of 120 mJ at a repetition rate of 10
Hz The laser beam (the red optical path in Fig 31) is split into two parts by a mirror
with a small off-center hole (7mm in diameter) The transmitted part serves as the
3 Improvement of the modular setup for time-resolved X-ray diffraction experiments
36
optical pump beam to excite the sample under study while the reflected part is focused
by a lens of 300 mm focal length onto a Cu-tape target with an incident angle of 45ordm (p-
pol) to produce the Cu Kα (805 keV) probe pulse
For the reasons mentioned in the introduction of this chapter the Cu-target is
placed inside a compact vacuum chamber (size 24times30times30 cm3) which includes
connectors for the vacuum pump a pressure gauge and electrical feedthroughs as
shown in Fig 32 For mechanical and radiation safety reasons this chamber is made of
stainless steel with a wall thickness of 15 mm Additionally a 2 mm lead cover was
added inside the chamber to enhance security and to reduce the level of background
radiation that may reach the detector The working pressure of the chamber is 01 mbar
(a) (b)
Fig 32 Overview of chamber (a) outside and (b) band target inside
the chamber
The target consists of a 10 microm thick Cu tape mounted on a motorized spooling
system which works similarly to an audiocassette recorder (Fig 33 (a)) The pulling
speed is approximately 8 mms (ie 800 microm motion between two consecutive laser
pulses) to ensure that a fresh surface area is provided for each laser pulse The tape
shifts vertically to its pulling direction by about 08 mm when the pulling direction is
(automatically) changed One set of band (25 mm wide and 15 m long) can provide
more than 12 hours experiment time In order to minimize the deposition of ablated
material in particular at the small hole where the X-rays can leave the chamber [187]
a 8
μm Kapton foil has been rolled together with the Cu tape before mounting it to the
spooling system The Kapton foil runs simultaneously with the tape to pick up the
debris which is predominantly ejected at the back-side of the tape normal to its
surface [187]
Close to the laser-target interaction point it is mechanically separated from
the Cu tape by about 2 mm (see Fig 33 (b))
3 Improvement of the modular setup for time-resolved X-ray diffraction experiments
37
(a) (b)
Fig 33 (a) Photo of band target (b) Kapton foil used for reducing
material deposition
Using a pin-hole camera the size of the X-ray source on the tape target was found
to be similar to the spot size of the focused laser beam ie ~25 microm [187]
The Cu Kα
emission is close to 5times109 photonspulse in 4π solid angle without pre-pulse and 1times10
10
photonspulse with an optimized pre-pulse (see section 321) Since the X-ray emission
is into the full solid angle a multilayer X-ray optic with Montel-Helios geometry [188]
is
used to collect the radiation and to refocus it onto the sample under investigation The
multilayer X-ray optic reflects both the Cu Kα1 and Kα2 emission lines but suppresses
other spectral components (ie K) More details on the working principle and the
specifications of this mirror can be found in Appendix A
The focused X-ray beam was characterized at different positions of the beam path
through four relevant parameters [186]
the beam profile directly after the multilayer
optic the total number of reflected photons the convergence of the beam and the size
of focus spot A direct detection CCD camera was used to measure the first three
relevant parameters of the X-ray beam since it allows a rather accurate estimation of
the absolute detected X-ray signal (eg number of diffracted photons per pulse) A X-
ray beam profile taken at 4 centimeters after reflection on the multilayer optic is shown
in Fig 34 (a) Since the X-ray emission from the plasma is isotropic (ie homogeneous
illumination of the mirror) the intensity distribution measured at such a short distance
after the optic gives direct information on the spatial reflection properties of the two
multilayer mirrors The image in Fig 34 (a) demonstrates the uniformity of the
reflectivity over the mirror surfaces Due to the mounting configuration of the
multilayer mirrors inside the housing the beam shape is a 45deg rotated square [Appendix A]
The convergence angle of the beam was measured to be approximately 023deg which
3 Improvement of the modular setup for time-resolved X-ray diffraction experiments
38
corresponds to the specifications of the manufacturer (024deg) Using the known
sensitivity of the direct detection CCD camera [186]
the Cu Kα flux in the focused beam
can be determined from images like the one shown in Fig 34 (a) With an optimized
pre-pulse a typical flux of 13times105
photonspulse was obtained The intensity
distribution at the focus spot was measured with an indirect phosphor based detector
(Gemstar) [186]
A typical image with horizontal and vertical cross sections is shown
in Fig 34 (b) The measured FWHM of the focus spot is 150 microm in horizontal and 127
μm in vertical With the given source size of approximately 25 microm and the 5x
magnification of the multilayer optics this is close to the expected value
(a) (b)
Fig 34 (a) Topography of Cu Kα beam observed with the direct
detection CCD camera 4 cm after reflection on multilayer mirror (b)
Intensity distribution of Cu Kα emission at the focal point of the
multilayer optic obtained with the phosphor based detector Pictures
reproduced from Ref [186]
Since most of the experimental components of the modular setup are placed in air
they are easily accessible and can be conveniently manipulated In order to minimize
losses by absorption of the Cu Kα-radiation in air [189]
the optics housing is purged with
He and He-purged beam-tubes were installed in the X-ray beam path Although the X-
ray beam path cannot be covered completely more than 90 of the radiation collected
and reflected by the X-ray optic is delivered to the sample
The samples are mounted on a motorized x-y-θ stage to adjust the Bragg-angle (θ)
and the beam position on the sample (x-y) The diffraction signals have been recorded
so far by two different X-ray sensitive area detectors The first detector is a direct
3 Improvement of the modular setup for time-resolved X-ray diffraction experiments
39
detection CCD-camera (type PI-MTE 1300B) which has also been used for the
measurements discussed in chapter 2 As it has been explained before due to the strict
relation between the X-ray photon energy and the generated charge this detector can be
used as a spectrometer (see chapter 2) and allows determination of the absolute X-ray
signal with rather high accuracy (single photon sensitivity) The low quantum
efficiency (18 ) and the slow readout time are its main drawbacks The second area
detector uses indirect detection A phosphor screen converts incoming X-ray photons
into visible photons The optical signal is amplified by an image-intensifier and then
detected by a normal CCD Although this system allows single photon detection at high
gain of the intensifier there is no well-defined relation between the detected signal and
the X-ray photon energy On the other hand this detector has a high quantum efficiency
(85 for Cu Kα radiation [186]
) and high read-out rate (up to 10 Hz) so that an image
can be recorded for each single X-ray pulse A more detailed discussion of these
detectors and their specific advantages and drawbacks can be found in Ref [186] as
well as in Appendix B
The energy of the pump beam used to excite the sample is adjusted with a half-
wave-plate in conjunction with a thin film polarizer and monitored with a PIN diode A
motorized translation stage with a retro-reflector allows varying the delay between the
optical pump and the X-ray probe beam The p-polarized pump beam is focused with a
lens of 1 meter focal length onto the sample surface The angle between laser pump and
x-ray probe beam is set to be as small as possible ie approximately 10deg In order to
ensure that the measured diffraction signals represent the response of an almost
homogeneously excited region the diameter of the pump beam is chosen to be at least 3
times larger than the X-ray spot size Since the available amount of energy in the pump-
path (about 1 mJ per pulse) is more than sufficient for the experiments discussed in this
thesis a diaphragm has been used to adjust the pump beam spot size A removable
mirror which can be inserted in the beam path directs the beam to a CCD camera
positioned at a position equivalent to the distance to the sample to monitor the size and
the shape of the focused beam
32 Improvements of the modular setup
During my thesis work several improvements of the setup have been implemented
in order to (i) optimizeincrease the X-ray flux of the plasma source (ii) improve the
measurement sensitivityaccuracy and (iii) automatize and speed up the experimental
3 Improvement of the modular setup for time-resolved X-ray diffraction experiments
40
procedures This section describes in detail the necessary steps and modifications which
were essential to achieve the results of the time-resolved diffraction experiments
discussed in the following chapters in particular the results of the phonon softening
obtained on photo-excited Bismuth (Chapter 5)
321 Controlled pre-pulse to enhance the X-ray production
In chapter 2 it has been discussed in detail that a controlled pre-pulse with suitable
delay can be used to improve the X-ray production Based on this result a pre-pulse unit
(beam splitter and combiner delay stage see the black-dotted box in Fig 31) has been
added to the modular setup The main pulse energy is 110 mJ and the pre-pulse energy
is 15 mJ which results in intensities at the focus of the lens of 16times1017
Wcm2 for the
main pulse and 20times1014
Wcm2 for the pre-pulse respectively With a pre-pulse
arriving 5 ps before the main pulse the X-ray production of the modular setup has been
improved by about a factor of 2 which leads to more than 105 Cu Kα photonspulse
collected and focused by the X-ray mirror on the sample under normal experimental
conditions The positive effect of the pre-pulse was also briefly underlined and
presented in Dr Nicoulrsquos thesis
322 Avalanche photodiode (APD)
It was pointed out by Nicoul [186]
that the modular setup with the
magnifyingcollimating Montel-optic is most appropriate for experiments in which the
shape or angular position of the rocking curve of the excited sample does not change
but only the total diffraction efficiency (ie due to structure factor changes) Under
these conditions it is not necessary to use a detector with 2D resolution and therefore a
single-channel detector is sufficient Since the diffraction efficiency of the thin-film
samples typically used in the time-resolved experiments is low (10-3
-10-4
resulting in
diffraction signals of 10 - 100 photonspulse) a detector with high sensitivity down to
the single-photon level is required X-ray sensitive avalanche photodiodes (APD) fulfill
these requirements An APD is a photodiode with internal gain obtained by applying a
high reverse bias voltage to the photodiode which creates an intense electric field inside
its volume It combines the benefits of a photomultiplier tube (gain) and conventional
photodiodes (high quantum efficiency)
3 Improvement of the modular setup for time-resolved X-ray diffraction experiments
41
For the modular setup a large area (10 mm in diameter) Silicon APD was chosen
(its technical data are given in Appendix B) Using the direct detection CCD for
calibration the quantum efficiency of the APD for Cu Kα radiation was measured to
(36 plusmn 7) in agreement with previously published data [190 191]
This detector can be
easily operated at a repetition rate of 10 Hz and with more convenience (compact size
no need for water cooling) as compared to the phosphor based area detector To digitize
the detected X-ray signal a gated charge-integrating analogue-to-digital converter
(ADC) [192]
is used In order to match the APD-output to the input specifications of the
ADC a pulse shaperamplifier is added directly to the APD
The APDADC-combination was calibrated for the detection of Cu Kα radiation by
reducing the incident X-ray signal to the few-photons-per-pulse-level (0 to 6) and
analyzing the signal value distribution (histogram) of a large number of pulses
(typically a few thousand) for different bias voltages Results are shown in Fig 35 (a)
The signal value distributions exhibit a multi-peak structure as it is expected for a Si-
detector with its rather well defined relation between the charge generated by a single
X-ray photon and the photon energy (e g one Cu Kα photon produces 366 times 10 -4
pCb)
A multi-peak fit was applied to separate the individual peaks and to determine in
particular the position of each peak (marked in the figures) The first left peak
corresponds to the dark current background (no photon detected proven by blocking
the X-rays) and the second third fourth hellip peaks are correspond to one two three hellip
detected photons respectively By plotting the peak position as a function of photon
number in Fig 35 (b) and fitting the result by a linear function (Y = m + n X) the
corresponding ADC output (given in counts) for the background signal (parameter m)
and for a single Cu Kα photon (parameter n) can be determined for different bias
voltages The result is shown in Fig 35 (c) The ADC output per Cu Kα photon (black
squares) increases rapidly with bias voltage reflecting the corresponding increase of the
APD-gain It has to be noted that the dark current is also amplified with increasing bias
voltage underlined by the increase of the background signal (red circles)
Since the X-ray-to-charge conversion is known as well as the amplification of the
amplifier (11x) and the sensitivity of the ADC (32 counts per pCb) this APD-gain can
also be deduced from the information above The result is plotted in Fig 36 as a
function of bias voltage together with results of optical measurements (see below) and
data provided by the manufacturer All data are in a good agreement and the maximum
gain of 103 is proven to be achievable with this device
3 Improvement of the modular setup for time-resolved X-ray diffraction experiments
42
(a)
(b) (c)
Fig 35 (a) The signal value distributions (histograms) measured
with the APD at the few-photons-per-pulse-level at different bias
voltages The blue curves are the total multi-peak fits and the green
peak profiles are the separated individual peaks The peak positions
are indicated on the top of each peak (b) The values of peak
positions in (a) as a function of the number of detected photons
With the linear fitting function (Y = m + n X) the background
signals and corresponding ADC outputs (given in counts) pre Cu Kα
photon can be determined by the fitting parameter m and n
respectively (c) The corresponding ADC outputs per Cu Kα photon
(black square points) and the background signals (red circle points)
at different bias voltages
3 Improvement of the modular setup for time-resolved X-ray diffraction experiments
43
Fig 36 Comparison of the gain of APD from three measurements
Fig 37 APD signal as a function of PIN diode signal with different
operating voltages
Another important information concerns the question whether the (electric) output
signal is proportional to the (X-ray or light) input signal (linearity) The linearity of the
APD was checked by measuring an optical input with the APD at different bias
voltages and a regular Silicon PIN-diode which was known to be linear over the used
range of incident optical power In Fig 37 the APD-signal is plotted as a function of
the PIN diode signal for different APD bias voltages It turns out that the response of
the APD is linear for an ADC-output up to about 1000 counts For higher signal levels
the response becomes nonlinear Since the APD and the assembled electronic
3 Improvement of the modular setup for time-resolved X-ray diffraction experiments
44
shaperamplifier were not tested separately the source of the nonlinearity cannot be
determined at this point In the time-resolved diffraction experiments the nonlinearity
of the APD needs to be taken into account and corrected
323 Ionization chamber detector (ICD)
(a) (b)
Fig 38 (a) Photo of the ionization chamber detector and (b) its
working scheme
In order to normalize the diffraction signals and to determine the changes in the X-
ray diffraction efficiency of an optically excited sample with high accuracy it is
necessary to measure also the (relative) incident X-ray flux for each pulse For this
purpose a small ionization chamber detector has been placed behind the X-ray
multilayer optic A photo of the installed chamber and its working scheme is shown in
Fig 38 Part of the Cu Kα radiation reflected by the optic is absorbed and ionizes the
Ar-gas with which the cell is filled The Ar-pressure is around one atmosphere At 8
keV a transmission of 72 is measured and it agrees with the expected transmission
value of 16 cm Ar at 1 atm plus 16 μm of Kapton foil used as cell windows [189]
To
collect the charge generated by ionization a high bias voltage is applied (2000 kV) A
high speed current amplifier (type DHPCA-100 FEMTO) with a gain of 105 is used to
3 Improvement of the modular setup for time-resolved X-ray diffraction experiments
45
match the output signal of the ionization chamber to the input of the gated charge-
integrating ADC (same as used for recording the APD-signals)
In order to characterize the ionization chamber detector its linearity was measured
using the phosphor based area detector which can be regarded as a linear detector The
result of this measurement shown in Fig 39 (each data point corresponds to an
acquisition time of 30 sec) clearly shows the linear response of the ionization chamber
Fig 39 Calibration between ionization chamber detector and
phosphor based detector Red dashed line is a linear fit of the
measured data
Fig 310 Long term drift of the normalized ratio
3 Improvement of the modular setup for time-resolved X-ray diffraction experiments
46
It should be noted that the output signal of the ionization chamber is surprisingly
very sensitive to changes of the Ar-pressure (approx 30 change of signal for lt1
change of pressure) Therefore the pressure inside the chamber needs to be stabilized
during the whole measurement For this purpose a pressure control system consisting
of two pinhole valves and a pressure gauge was implemented (see Fig 38) It allows
stabilizing the pressure inside the chamber to about plusmn01 mbar (relative to the external
pressure) Despite stabilizing the pressure in the ICD we observed long term drifts of
the ICD-signal during the diffraction measurements As an example the ratio between
the APD and ICD signals from one representative measurement recorded over about
one hour is presented in Fig 310 The large pulse-to-pulse variations of the ratio are
caused by the counting statistics limited fluctuations of the APD-signal (only a few
photons per pulse are detected in this particular measurement) Additionally the ratio
which should be constant on average changes slowly with time So far no clear
explanation has been found for this effect These drifts can severely limit the achievable
accuracy in a time-resolved experiment when for example the different pump-probe
delays are sequentially measured during an experimental run The issue has been solved
by applying a ldquofastrdquo delay scanning technique in the experiments which will be
discussed in section 3262
324 Experiment control program
The modular setup is entirely controlled by a software program developed using
the LabVIEW environment The functions of this program include control and
monitoring of the different elements and detectors in the setup as well as data recording
and pre-processing All functions can be accessed from one interface (shown in Fig
311) which has been geometrically divided into two parts
3 Improvement of the modular setup for time-resolved X-ray diffraction experiments
47
Fig 311 Interface of the experiment control program
The upper part (part I) is used to prepare an experiment and to perform some
simple test measurements eg checking signal levels the background signals of the
detectors etc Frame (Ia) is a control panel for the pump-probe delay unit In frame
(Ib) the detected signals from individual detectors (ie PIN diodes APD ICD) can be
selected and displayed The received data can be recorded into files Frame (Ic) is a
waveform graph to show the histogram of the signal of the detector selected in frame
(Ib) Frame (Id) displays the real time trace for the selected detector
The lower part (part II) is used for the time-resolved diffraction experiments In
region (IIa) one can enter the relevant measurement settings eg background signal of
the different detectors acquisition time for the individual measurement points delay
range delay steps and saving folder Frame (IIb) shows the real time traces of the
measurement and the ratio APDICD The five indicators at the bottom of this frame
indicate the status of the measurement system Frame (IIc) displays a constantly
updated preliminary analysis (ie ratio APDICD vs delay time) of the measured data
In region (IId) several switches allow to change between different operation modes of
the tape target the laser triggering and the delay unit (eg fast scanning see below)
3 Improvement of the modular setup for time-resolved X-ray diffraction experiments
48
Frame (IIe) displays the correlation between APD and ICD and Frame (IIf) displays the
pump beam energy
part I To prepare the experiments and to perform some simple test measurements
Frame (Ia) Control of the pump-probe time delay
Frame (Ib) Selection and value display of the signals from individual detectors
Frame (Ic) Display of the signal value distributions of the selected detectors
Frame (Id) Display of real time traces for the selected detectors
part II To perform the time-resolved diffraction experiments
Frame (IIa) Input of the relevant measurement settings
Frame (IIb) Display of real time traces of APD ICD and their ratio
Frame (IIc) Display of a preliminary analysis of the measured data
Frame (IId) Control of tape motion and ldquofastrdquo scanning
Frame (IIe) Display of APD-signal vs ICD-signal
Frame (IIf) Display of the pump beam energy
Table 31 The functions of the individual areas in the user interface
of the experiment control program
For a better overview the functions described above are briefly summarized in
Table 31 This program has been proven very useful during the performed experiments
However further improvements are possible For example integration of control
functions for the sample holder might be required to allow a synchronized motion of
the sample during data acquisition (eg for experiments where the sample is
irreversibly damagedmodified by a single laser pulse)
325 Spatial and temporal overlap adjustments with APD
A very important and non-trivial part of performing a time-resolved diffraction
experiment is to find spatial and temporal overlap between the (invisible) X-ray probe
beam and the laser pump beam To find spatial overlap a similar procedure is applied
as described in Ref [186] The sample is moved vertically and horizontally with the
translation stage in order to scan its border through the X-ray beam Since the sample
surface is monitored by a camera on a video screen the disappearance of the X-ray
diffraction signal allows to localize the X-ray beam position by marking the sample
border in horizontal and vertical direction on the screen Then the optical beam can be
easily adjusted to overlap with X-ray beam on the marked position The spatial overlap
needs to be checked before every measurement
Once the spatial overlap is established the temporal overlap is adjusted by
exciting the sample with the laser and monitoring changes of the diffraction signal
while scanning the delay stage Two examples are presented in Fig 312 which show
3 Improvement of the modular setup for time-resolved X-ray diffraction experiments
49
the relative decrease in the diffraction signal upon laser excitation on thin films of Au
(333)-reflection (a) and Bi (111)-reflection (b) While the different physical processes
responsible for the observed signal changes will not be discussed here (see chapter 4
and 5) the time-traces allow to determine delay zero (temporal overlap) The accuracy
depends obviously on the speed of the induced changes and can reach the sub-
picoseconds level if the changes are fast (ie Bi) Moreover it should be emphasized
that using the APD and the new experiment control program allows to obtain such
results in just a few minutes Without the implemented improvement it usually took
around 45 to 60 minutes for the same purpose [186]
Finally it should be noted that the
observed decay of the Bi-diffraction signal in less than 400 fs (Fig 312b) represents an
upper limit for the temporal resolution that is possible with the modular setup A
temporal resolution of about 100 fs has been demonstrated with a similar X-ray source
in Ref [106]
(a) (b)
Fig 312 Time-resolved measurements with high temporal
resolution detected using APD (a) Au (333) and (b) Bi (111) The
cyan dashed line marks the position of time zero
326 Normalization of X-ray signals
Since only a few photons per pulse are diffracted from the thin film samples
typically used in the time-resolved X-ray diffraction experiments it is necessary to
accumulate signal over a sufficiently long time (a few hours are usually required for a
complete experiment) to enable the measurement of transient changes of the diffraction
efficiency at the percent level During this time the variation of the X-ray flux
delivered to the sample cannot be avoided without a normalization procedure In the
following one needs to distinguish between short-term fluctuations and long term drifts
3 Improvement of the modular setup for time-resolved X-ray diffraction experiments
50
Short-term fluctuations refers here to all intensity variations of the X-rays
occurring within seconds down to pulse-to-pulse fluctuations They are mainly caused
by energy and spatial (pointing stability) instabilities of the driving laser As mentioned
in chapter 2 the laser energy essentially affects the total X-ray yield Hence the pulse-
to-pulse energy fluctuation results in a fluctuation of the X-ray output signal For the
modular setup spatial instabilities represent the most critical issue which had already
been detailed discussed in Ref [186] Together with the position instabilities of the
copper tape with respect to the focused laser spot (caused mainly by mechanical
instabilities of the pulling system) the finite pointing stability results in fluctuation of
the spatial position of the X-ray source Due to the short source-to-mirror distance the
overall reflection efficiency of the multilayer X-ray optic is very sensitive to variations
of the source position which lead to significant changes of the X-ray output behind the
optic
Long term drifts refer to variations of the X-ray flux within minutes up to hours
(see Fig 310) While the sources of these drifts are not completely understood it must
be noted that they cannot be simply averaged out
Therefore suitable measurement schemes with reliable normalization procedures
are required to maximize the accuracy of the measurement and to minimize the
necessary experimental time Two measurementnormalization schemes are described
and discussed in the following sections which allow to handle both short term
fluctuations and long term drifts
3261 Chopping normalization scheme with a shutter
The first normalization scheme I call the chopping method which is a low
repetition rate variant of a well-known normalization scheme used for all-optical pump-
probe experiments at high repetition rate laser systems [193-196]
In this scheme the pump
beam is periodically blocked (chopped) in order to record the probe signal with and
without laser excitation within a short time interval To achieve this a mechanical
shutter is installed in the pump beam path (see Fig 31) and operated at 1 Hz with an
opening time of 05 sec Given the 10 Hz repetition rate of the laser system the
diffraction signal is recorded 5 times with sample excitation followed by 5 times
without sample excitation within one shutter cycle The signals from the PIN diode
used to monitor the pump beam energy allow to mark ldquopumpedrdquo and ldquoumpumpedrdquo
events in the data stream The relative change of the signal due to the laser excitation
3 Improvement of the modular setup for time-resolved X-ray diffraction experiments
51
can be retrieved by normalizing the sum of ldquopumpedrdquo signals to the sum of the
ldquoumpumpedrdquo signals In this way both short term fluctuations (by averaging) and long
term drifts (by comparing pumped and unpumped signals every second) are
properly taken into account However only one half of the total flux contributes to the
transient diffraction signal while the other half is used for normalization
Fig 313 Chopping normalization scheme Standard deviations as
function of integrated acquisition time with different detected photon
numbers per pulse Data points obtained from the experiment and
solid curves are calculated from counting statistics
In the ideal case the achievable accuracy of the experiment is determined by the
counting statistics through the total number of detected photons (given by the laser
repetition rate the number of diffracted photon per pulse and the acquisition time)
Since the laser repetition rate is fixed and the number of diffracted photons per pulse is
determined by the diffraction efficiency of the sample and the X-ray source
performance the acquisition time is the only parameter to control the accuracy of the
experiment In order to define the required acquisition time for a desired accuracy a
series of test measurements were performed with Bi- and Au- samples Each set of the
diffracted signals from these two samples were recorded with the APD for
approximately one hour in the same experimental conditions without sample excitation
The detected APD-signal for each set of data was varied by changing X-ray source
production (adjusting the energy of the driving laser for the X-ray source) and by
choosing different Bragg-reflections The data are analyzed with a MATLAB routine
3 Improvement of the modular setup for time-resolved X-ray diffraction experiments
52
which artificially groups the data in pumped and unpumped events (assuming
chopping at 1 Hz) and averages and normalizes the diffraction signal over bins of
different size (ie the number of pulses used to produce one normalized data point)
Each specific binning produces a set of data with different number of points as the
number of points times the binning size equals the same number determined by the total
acquisition time The standard deviations of each data set are calculated and presented
in Fig 313 as a function of the acquisition time for one point (determined by the
binning size) Since the APD has been calibrated one can calculate the expected
standard deviation of the measured diffraction signal S assuming that it is determined
only by counting statistics as 21 NSS where N is the total number of detected
photons in the respective acquisition time [197 198]
These calculated values are plotted as
solid lines in Fig 313 and they are used to compare to the experimentally determined
values Note that due to the chopping method used for normalization only one half of
the detected photons contributing to the signal have been taken into account in the latter
calculation (the other half has been used as reference for the normalization) As one can
see in Fig 313 the experimental data strictly follow the counting statistics curves with
the respective number of detected photons It indicates that this normalization scheme
allows to reach the fundamental limit set by counting statistics in the experiment
Moreover this figure also provides the required acquisition time for a desired accuracy
for a given diffraction signal (number of detected photons per pulse) For example if
one intends to have an accuracy of 1 with 23 detected photons per pulse an
acquisition time of 150 seconds per data point is sufficient
3262 Direct normalization scheme with the ionization
chamber detector
As I have already pointed out in section 323 that the ICD allows the direct
measurement of the X-ray beam intensity behind the multilayer optic The signals
generated by the ionization chamber are proportional to the incident X-ray flux on the
sample Therefore they can be used as a reference to normalize the diffraction signals
on a pulse-to-pulse basis In order to account for the long term drift of the ICD signal
mentioned in section 323 a ldquofastrdquo scanning technique adapted from all-optical
experiments [199]
has been combined with this normalization scheme Fast scanning
means that the full delay range to be investigated in a particular experiment is
3 Improvement of the modular setup for time-resolved X-ray diffraction experiments
53
repetitively scanned in a relatively short time (during which drift effects are small) and
the data from all scans are summed up and averaged
In order to check the accuracy achievable with this scheme a series of similar test
measurements as above were performed using the ICD for normalization for different
levels of the diffraction signals (given again in number of detected photons per pulse)
This time the data were treated as a set of ldquofastrdquo scanning measurements by artificially
sorting them into a number of delay scans with a certain number of delay points and
pulses per delay before normalization As the result of this analysis Fig 314 shows the
obtained standard deviation as a function of the total measurement time for a single
delay at different levels of the diffraction signal (data points) and compares the
experimental data to calculated curves assuming again counting statistics as the limiting
source of error Again the experimental data agree well with the counting statistics
curves demonstrating that the fast scanning scheme can indeed correct the long term
drifts
Fig 314 Direct normalization scheme with the ldquofastrdquo scanning
technique Standard deviations as a function of integrated acquisition
time with different numbers of detected photons per pulse Point data
obtained from the experiment and solid curves are calculated from
counting statistics
3 Improvement of the modular setup for time-resolved X-ray diffraction experiments
54
3263 Comparison of normalization schemes
Finally the two normalization schemes discussed above will be compared in this
section for similar experimental conditions (ie same X-ray flux after the X-ray optic
same diffraction efficiency of the sample) For this comparison one needs to consider
that the ICD has a transmission of 72 Therefore using the direct normalization
scheme 28 of the incoming X-ray flux serves as reference signal and only 72 are
used for diffraction Since the number of detected photons in the ICD is large (a few
times 104) the error of the measurement with direct normalization is determined only by
the counting statistics of the diffraction signal (see previous section) The standard
deviation in this case isn)720(
1
tr where r is the repetition rate of laser t is the
total integration time in second and n is the number of detected photons per pulse On
the other hand when the chopping scheme is used for normalization the ICD can be
removed from the beam path and the full X-ray flux reaches the sample However as
already mentioned above only one half of the total signal contributes to the transient
diffraction signal while the other half is used for normalization Both transient
diffraction and normalization signals are limited by counting statistics which doubles
the error of the normalized signal Then the standard deviation in this case gives as
ntr )2
(
2 Combining this information one can show that for the same
experimental conditions (with same r t n) the direct normalization scheme (with fast
scanning) should give a factor of 17 better accuracy than the chopping scheme
3 Improvement of the modular setup for time-resolved X-ray diffraction experiments
55
Fig 315 Comparison of the chopping normalization scheme and the
direct normalization scheme (with ldquofastrdquo scanning processing) for
the same amount of incident photons from the X-ray optic (a) with 7
and 5 detected photons (b) with 23 and 15 detected photons and (c)
with 110 and 81 detected photons for the chopping and direct
normalization scheme respectively
Fig 315 compares the measured error (data points) as a function of accumulation
time for the two normalization schemes at different levels of the diffraction signal (the
signal level for direct normalization with the ICD is lower than for the chopping
scheme to account for the transmission losses of the ICD) The red and blue curves
3 Improvement of the modular setup for time-resolved X-ray diffraction experiments
56
show the calculated error based on counting statistics Not only do experimental and
calculated errors agree very well the data quantitatively confirm the advantage of the
direct normalization scheme discussed above
In conclusion the direct normalization scheme represents the most efficient way to
perform time-resolved diffraction measurements with the modular setup Depending on
the level of the diffraction signal an accuracy of better than percent for an individual
data point can be achieved with accumulation times of tens of seconds to a few
minutes
33 Summary
This chapter discussed a modular setup for time-resolved X-ray diffraction
experiments at the University of Duisburg-Essen All components of the previously
existing setup as well as the components that have been added to improve its
performance have been presented and characterized Due to its compact design the
setup is easy to operate and adjustments of components are convenient Applying the
results discussed in chapter 2 the X-ray production in the setup has been improved
using a controlled pre-pulse Using an avalanche photodiode as detector for the
diffraction signal it has been shown that the combination of direct normalization with
an ionization chamber as reference detector and the ldquofastrdquo delay scanning scheme
represents the most efficient way to achieve a high measurement accuracy The setup in
its current status has proved its capabilities through several preliminary experiments
and has been successfully used for the diffraction experiments that will be presented in
the following chapters
4 Observation of the Debye -Waller effect in Au
57
4 Observation of the Debye -Waller
effect in Au
Ultrafast x-ray diffraction is a relatively new technique that provides both high
temporal and atomic scale spatial resolution to directly observe the atomic motions and
changes in the atomic structure of matter upon optical excitation This chapter will
present a laser-pumpX-ray-probe experiment on a thin Au film the first time-resolved
experiment performed with the modular setup described in the previous chapter The
lattice vibrations that result from the electronic energy relaxation following optical
excitation have been directly observed through the DebyendashWaller effect The rise times
of the lattice temperature were measured for different absorbed laser fluences and
compared with the Two-Temperature Model (TTM) [200]
These experimental results are
consistent with previous data obtained by ultrafast X-ray diffraction [61]
as well as
ultrafast electron diffraction [201]
and prove the capability of the new built modular
setup
This chapter is organized as follows The first section is a brief description of the
Au sample used in these experiments In the second section the Debye ndashWaller effect
is discussed In the third section the time-resolved experiments are described and
experimental results are presented In the fourth section a comparison between the
experimental results and calculations based on the TTM model are discussed In the
final section a summary will be drawn
41 Au sample
Au a noble metal has been extensively studied with respect to its transient
properties and transient structure after femtosecond optical excitation [61 186 201-208]
In
4 Observation of the Debye -Waller effect in Au
58
particular the transient Debye ndash Waller effect has been recently used in ultrafast
electron diffraction experiments to study fast lattice heating after femtoseond laser-
excitation of thin polycrystalline Au films [201 206]
In the experiments described in this chapter an epitaxial Au film was used The
150 nm thick (111)-oriented Au samples had been grown on (001)-oriented high
quality Mica using a magnetron sputtering technique and were provided by the
company Phasis [209]
Relevant physical parameters of this sample are provided in
Appendix C3
To maximize the pump-induced changes of the diffraction signal due to the
Debye-Waller effect measurements were performed using the symmetric (333)-
reflection (see also next section) The corresponding Bragg angle (measured relative
to the surface) is 789deg for Cu Kα radiation Given the angle of 10deg between the
optical pump beam and the X-ray probe the angle of incidence (measured to the
surface normal) of the pump is 20deg The corresponding reflectivity of the sample at
800 nm is 97 The optical penetration depth is about 13 nm which is much smaller
than the film thickness [210]
Nevertheless fast ballistic electronic transport distributes
the deposited energy over the whole film thickness within a few hundred
femtoseconds [211-213]
Therefore the sample can be considered as being
homogeneously excited on the time scale of a picosecond
42 Debye ndashWaller effect
Debye [214]
and Waller [215]
found that by heating the lattice the intensity of
Bragg-reflections decreases whereas their angular profiles (rocking curves) remain
unchanged This decrease is described by the Debye-Waller factor DW(T)
)3
1exp()( 22
0
hklT Gr
I
ITDW
(41)
where IT is the integrated intensity of a particular Bragg-reflection with Miller
indices (hkl) (determined by the reciprocal lattice vector Ghkl) at temperature T I0 is
4 Observation of the Debye -Waller effect in Au
59
the integrated intensity in the case of the perfectly ordered and lsquofrozen latticersquo and
2r
is the mean square atomic displacement [216]
By calculating 2r
within the Debye theory for the specific heat [217]
and
taking into account Braggs law )sin(2 Bhkld the Debye-Waller factor can be
represented as [218]
22
2
2
16exp)(
hkl
D
DB dTmk
ThTDW (42)
where h is Plankrsquos constant T is the temperature of material m is the mass of
the atom Bk is the Boltzmanrsquos constant D is the Debye temperature of the material
T
D is the Debye function and hkld is the corresponding lattice constant Eq 42
indicates that the Debye-Waller effect becomes stronger with a smallerhkld ie larger
changes in the diffracted signal are expected for higher diffraction orders (hkl)
Fig 41 Calculated Debye-Waller factor for Au
According to Eq 42 the Debye-Waller factor for the (111) (222) and (333)
Bragg diffraction of Au are calculated as a function of temperature and presented in
Fig 41 (normalized to the corresponding value at 295 K) Since the changes of the
4 Observation of the Debye -Waller effect in Au
60
integrated signal are more pronounced for higher orders the (333)-reflection has been
used in following experiments as mentioned above
43 Time-resolved X-ray diffraction experiments on Au
431 Bragg diffraction of Au
Before performing the time-resolved experiments for studying the Debye ndash
Waller effect in Au several preparation experiments were carried out using an area
detector (ldquoGemstarrdquo camera see Appendix B) to pre-characterize the structural
response of the sample upon ultrafast optical excitation
Fig42 shows as one result the variation of the total diffraction signal with the
angle of incidence of the X-ray beam for the Au (333)-reflection In principle such
angular dependencies represent the convolution of three contributions namely (a) the
sample rocking curve (b) the angular intensity distribution of the focused X-ray beam
and (c) the source spectrum As a consequence the angular dependence shown in Fig
42 exhibits a two-peak structure which can be attributed to the Kα1- and Kα2-lines of
Cu which are both reflected by the mirror Each individual peak exhibits a FWHM of
about 07deg This is significantly more than the expected width of about 026deg due to
the combined effects of the spectral width (FWHM) of the two emission lines (approx
013deg) [219]
the angular FWHM of the focused X-rays (017deg FWHM) [Appendix A]
and
the expected FWHM of the rocking curve of a 150 nm film (014deg) [220]
The
broadened diffraction curve is attributed to the mosaic structure of the Au-film [221]
)
The following experiments are performed at a sample angle of 7895deg corresponding
to the maximum detected diffraction signal
4 Observation of the Debye -Waller effect in Au
61
Fig 42 The diffraction signal as a function of sample angle for the
Au (333)-reflection without excitation
However upon excitation of the sample not only the intensity of a particular
Bragg-reflection can change (eg due to the Debye-Waller effect) but also its angular
position (and shape) due to laser induced strain With respect to the latter one it has to
be stressed that the angular FWHM of the incident X-ray beam covers only a part of
the total width of the diffraction curve Therefore for a fixed sample angle changes
of the diffraction signal might be caused by both real intensity changes as well as a
peak shift due to the fact that strain if sufficiently large can shift the diffraction
curve out of the narrow angular range of the incident X-ray beam In order to
(preliminary) clarify the effect of strain time-resolved measurements have been
performed for different fluences both at fixed sample angle as a function of pump-
probe time-delay and as a function of sample angle for a fixed time-delay
Fig 43 shows the shift of the diffraction peak (center of gravity of the
distribution of diffracted X-rays measured on the area detector mentioned above) for a
(low) absorbed pump fluence of 15 mJcm2 (black open squares the red dots show
reference data measured in the course of the experiment without laser pumping) As it
is evident the Bragg-peak starts to shift shortly after excitation towards smaller
diffraction angles indicating lattice expansion The maximum shiftexpansion is
4 Observation of the Debye -Waller effect in Au
62
reached after about 45 ps Subsequently the Bragg-peak shifts back to larger
diffraction angles indicating recompression of the material Before discussing this
behavior it should be noted that this measurement could be performed with a fixed
sample angle using an area detector because of the low absorbed fluence with which
the shift of the Bragg-peak is smaller than the angular range of the incident X-ray
beam
Fig 43 Centers of gravity of the Au (333) rocking curves measured
with the Gemstar camera Red circles correspond to data obtained on
the non-excited sample the black squares represent data from the
excited sample
The observed behavior in particular the oscillatory time-dependence of the
Bragg-peak shift is in line with the generation and propagation of acoustic waves
launched by an almost instantaneous increase of pressure after optical
excitation [222 223]
In this interpretation the observed period of 45 ps should
correspond to the time ac that a longitudinal acoustic wave with speed cs needs to
travel through a film with thickness d sac cd With the known speed of sound of
cs = 339 kms [224]
in Au along the (111)-direction and using the nominal film
thickness of (150 5) nm I obtain ac = (44 15) ps which is in agreement with the
experimentally found value Very similar results have been recently reported by
4 Observation of the Debye -Waller effect in Au
63
Nicoul et al on a similar Au-sample of smaller thickness (d = 90 nm) [61]
The close
correspondence in the time-evolution of the Bragg-peak shift in particular its
ldquotriangularrdquo shape give clear indication that also the 150 nm film is homogeneously
(as expected ndash see above) and almost instantaneously pressurized over its whole
thickness
Fig 44 The diffraction signal as a function of sample angle for the
Au (333)-reflection at a delay of 45 ps (maximum shift) measured
with APD The points are measured data and the solid curves
represent Gaussian fits
Fig 44 shows the diffraction signal measured with the APD at a delay of 45 ps
(maximum shift) as a function of sample angle for different pump fluences the solid
curves represent Gaussian fits to the measured data The APD has a sufficient large
detecting area allowing to perform this measurement without moving its position As
expected the shift of the Bragg peak increases with pump fluence The peak positions
were obtained from the fitting function and are shown as function of absorbed fluence
The ldquotriangularrdquo shape of the time-trace indicates that the changes of the average interspacing
distance inside the sample can be assumed to be linear with time It is expected for the time-
independent pressurestress (the strain waves exhibit a rectangular shape) which results from
instantaneously and homogeneously heating of a sample Detailed interpretations can be found in Ref
[140 186]
4 Observation of the Debye -Waller effect in Au
64
in Fig 45 As it can be seen in Fig 45 the maximum shift of the Bragg-peak caused
by laser induced strain scales linear with the absorbed fluence Such behavior was
also observed in other X-ray diffraction experiments [140 186 225]
Fig 45 Angular shift of Bragg peak as function of absorbed fluence
The green dashed lines are linear fits for the data points
In summary the experiments above show that the strain caused by laser-
excitation result in a linear shift of the Bragg-peak both with time (for the first 45 ps)
and fluence
432 Observation of Debye ndashWaller effect on Au
In order to obtain the temporal evolution of the Debye ndashWaller effect without
being affected by the laser induced angular shifts of the Bragg peak an angular
compensation procedure is applied during the measurements This method is based on
the results shown in Figs 43 and 45 namely the linear increase of the Bragg-peak
shift with time and fluence This allows to properly adjust the sample angle both as a
function of pump-probe time delay as well as fluence to stay always at the angular
position of the maximum of the diffraction signal
4 Observation of the Debye -Waller effect in Au
65
Fig 46 Time-resolved measurements with and without the angular
compensation procedure The black curve is an exponential fit for
the data with compensation the red curve is a guide to eye for the
data without compensation
To illustrate the effect of this compensation Fig 46 shows the results of time-
resolved measurements with and without angular compensation at a fluence of
35 mJcm2 (absorbed) Without the compensation the detected diffraction signal
represents the combined effects of the strain-induced angular shift of the Bragg peak
and the DebyendashWaller effect As it can be seen in this case the detected diffraction
signal drops and rebounds at 45 ps essentially resembling the temporal behavior of
the angular shift of the Bragg peak after excitation (see Fig 43) However with the
compensation method the Debye-Waller effect can be isolated In this case the
measured (normalized) diffraction signal shows a much faster exponential drop with a
time constant of about 43 ps
Additional measurements were performed at lower pump fluences applying this
angular compensation The results are presented in Fig 47 In all cases the
experimental data were fitted with an exponential function and the fitting curves are
depicted as solid lines in the figure Most obvious and not unexpected the decrease of
the overall change of the diffraction signal increases with fluence due to the larger
4 Observation of the Debye -Waller effect in Au
66
temperature increase achieved at higher fluences The temporal evolution of the
diffraction intensities directly maps out the excitation of lattice vibrations (increase of
2r
) during heating After approximately 20 ps all diffraction signals reach their
asymptotic values which can be considered as the sign of reaching the new thermal
equilibrium state in the lattice system
Applying eq 42 the measured asymptotic drop of the diffraction signal as
obtained from the exponential fitting can be converted into a temperature increase
The results are plotted as blue squares in Fig 48 (a) The experimentally determined
temperature increases are compared to the temperature increase estimated from the
deposited laser energy and the specific heat of the material (red circles) Both data
sets agree within their error bars thus confirming that lattice heating and the Debye-
Waller effect is responsible for the observed decrease in diffraction intensity
The time constant of the exponential fit represents how fast the lattice is heated
and the new thermal equilibrium state is reached The time constant is plotted in Fig
48(b) as a function of absorbed laser fluence (bottom axis) and lattice temperature
(top axis) For comparison two data points from previously published experiments
[61 201] have been added Since the absolute fluence values are often difficult to
compare in independent experiments the absorbed fluence value is not used for this
comparison but the observed temperature increase (top axis) My measurements agree
within the error bars with the previously published data
4 Observation of the Debye -Waller effect in Au
67
Fig 47 Diffraction signal as a function of delay time for different
absorbed fluences (obtained with the angular compensation
procedure) The solid curves are exponential fits of the measured
data
(a) (b)
Fig 48 (a) Asymptotic temperature after laser-excitation as a
function of absorbed fluence Blue squares Values determined by
using eq 42 and the experimentally observed asymptotic drop of the
diffraction signal (top axis) Red circles Estimated temperatures
from the deposited optical energy (b) Decay time constant as a
function of absorbed fluence (bottom axis) and lattice temperature
(top axis) The black square points are obtained from the exponential
fits of the measured data in Fig 47 The red circle and the blue
diamond are taken from Ref [201] and [61] respectively
4 Observation of the Debye -Waller effect in Au
68
The data in Fig 48(b) seem to show a tendency that the decay constant
decreases with increasing fluence However due to the large errors of the derived
decay time constants at low fluences this effect will not be discussed further The only
remark to be made here is that the frequently used TTM (see below) does predict the
opposite
44 Comparison with the Two ndash Temperature Model (TTM)
and discussion
Upon the laser excitation the laser energy is first absorbed by free electrons and
then exchanges between electrons and the lattice through electron-phonon collisions
The evolutions of the electron and lattice temperature are determined by the electron-
phonon coupling constant [226]
In order to understand this process of above
experimental results in this section I compare the experimental results with the
theoretical prediction of the two-temperature model (TTM) [200]
which is a simple and
frequently used model to describe the electron-phonon energy relaxation
The TTM is based on the assumption that the electronic and lattice system can be
described by two different time-dependent temperatures Te and Tl The rate of energy
exchange between these two subsystems depends linearly on the temperature
difference and is given by
)( le
e
e
l
l TTt
TC
t
TC
(43)
where Ce and Cl are the specific heats of electrons and phonons (in principle
temperature dependent) respectively The energy exchange rate parameter α is related
to the electron-phonon coupling constant Solving the differential equation 43
numerically by using the coupling constants determined from all-optical
measurements [227]
not only the electron dynamics but also the evolution of the
lattice temperature can be predicted
In order to solve this differential equation the initial temperature of the
electronic system is calculated by using the experimentally determined asymptotic
4 Observation of the Debye -Waller effect in Au
69
lattice temperature Tasy According to the law of energy conservation and assuming no
energy losses the total initial energy in electronic system soon after laser excitation
and in lattice system at initial room temperature is equal to the total energy of
electronic and lattice system at asymptotic lattice temperature One obtains
asylasyeRleee TCTCTCTTC ))(()( 00 (44)
and
eeee TATC )( (45)
where Ae and TR are coefficient of electronic heat capacity and the room
temperature respectively Then the corresponding initial electron temperature 0eT can
be expressed as
))(2
( 2
0 asyRasy
e
le TTT
A
CT (46)
Using the deduced parameters and the material constants summarized in table 41
equation 43 was numerically solved and the results of temporal evolution of lattice
temperature are shown in Fig 49 (red dashed curves) together with the measured data
for the further discussions
Ae[Jm3K
2] Cl [MJm
3K] α [10
16Wm
3K]
676 245 21
TR [K] Tasy[K] Te0[K]
295
335 17363
365 22831
390 26544
Table 41 The material constants of Au and parameters used in the
TTM calculations [228]
4 Observation of the Debye -Waller effect in Au
70
Fig 49 Temporal evolution of the detected X-ray signal (data points
left axis) with exponential fits (black solid curves left axis) and the
results of the numerical solutions of the TTM for the
maximumasymptotic lattice temperature at (a) 335K (b) 365K and
(c) 390K (red dashed curves right axis)
4 Observation of the Debye -Waller effect in Au
71
Fig 49 shows again the temporal evolution of the relative changes of the X-ray
diffraction signal (data points note the flipped signal axis to the left) together with the
exponential fitting (black solid curve) The right axis displays the corresponding
lattice temperature obtained from the DWF The experimental data are compared to
calculated time dependencies (red dashed curves) of the lattice temperature obtained
from the TTM-calculations for maximumasymptotic lattice temperatures Tasy of (a)
335K (b) 365K and (c) 390K It is evident from this comparison that the TTM with
ldquostandardrdquo parameters (table 41) provides a good description of the experimental data
only for the highest fluence For the lower fluences the TTM predicts a faster energy
relaxationlattice heating than observed in the experiment Although B Rethfeld [229]
has predicted such a delayed energy exchange which deviates from the TTM for weak
excitation the effect will not be discussed further here because of the large error of
the experimentally determined time constant for the lower fluences At least for the
highest fluence the TTM provides a reasonable description of the experimental data
which are moreover in good agreement with previously published results [61 201]
45 Summary and conclusion
As the first time-revolved experiment performed with the improved modular
setup the observation of the Debye -Waller effect in Au and its good agreement with
both previous experimental results [61 201]
as well as the TTM at high fluences
demonstrates that it is well suited to perform time-resolved diffraction experiments
with good accuracy However this experiment also reveals a major limitation of the
setup Due to the narrow convergence angle of the incident X-ray beam an angular
compensation technique as discussed above needs to be applied to eliminate strain
effects As a consequence a pre-characterization of the response of a particular sample
is necessary This made the experiment quite time consuming and might have
introduced additional error sources The modular setup is therefore most suitable for
measurements where the position andor shape of the Bragg-peak does not change
4 Observation of the Debye -Waller effect in Au
72
upon laser-excitation (at least for a certain range of fluences andor pump-probe time
delays) As will be discussed in chapter 5 this is the case for laser-excited Bi where
the Bragg-peak does not start to shift for almost 5 ps after laser excitation
5 Extreme phonon softening in laser-excited Bi
73
5 Extreme phonon softening in laser-
excited Bi
Bi is a group-V (Nitrogen group) element which contains 5 electrons in its outer
shell It is stabilized at equilibrium into the A7 structure a rhombohedral structure
with two atoms per unit cell The pairing of these two atoms is attributed to the so-
called PeierlsndashJones mechanism [230]
This mechanism states that in order to arrange
the lattice system in the minimum energy configuration every second atom along the
body diagonal of the Bi unit cell ((111) direction) moves closer to one neighbor and
further away from the other leading to the pairing of atoms along the body diagonal
and doubling of the lattice constant As a consequence of this distortion a small band
gap is introduced at the Fermi level lowering the total energy of the occupied
electronic states and hence lowering the total energy of the system This opened band
gap is responsible for Bi being a semimetal A more detail description of the structure
of Bi will be presented in Section 51
Due to the unique properties of the broken symmetry ground state of the crystal
the equilibrium structure of Bi is sensitive to external perturbations ie changes of
pressure and temperature or electronic excitation [231- 234]
Among these perturbations
the ultrafast electronic excitation with ultrashort laser pulses is particularly unique
since the laser induced non-equilibrium states which depend on the excitation level
can be precisely controlled by adjusting the pump laser fluence and thus it can
provide unique non-equilibrium states of matter for the investigation of the transient
dynamics Following ultrafast laser excitation the valence electrons are promoted to
the conduction band The interatomic potential which defines the position of the
atoms in the unit cell is altered by the optically induced redistribution of electrons and
5 Extreme phonon softening in laser-excited Bi
74
the potential minima shift If this alteration occurs fast in comparison with the time
scale of atomic motion it triggers a coherent atomic motion around the new
equilibrium position along the body diagonal resulting in the modulation of the
equilibrium distance of the two paired atoms towards the phase of the higher
symmetry This coherent atomic motion represents the A1g optical phonon mode of
the crystal The generation mechanism has been named displacive excitation of
coherent phonons (DECP) [231 232]
which can be also considered as a special case of
impulsive stimulated Raman scattering for absorbing materials [235 236]
Within the framework of the DECP mechanism it has been predicted by
theory [237]
that the broken symmetry ground state of Bi (the Peierls distortion) can be
reversed with high enough density excitation This structural transformation is
accompanied by the change of the electronic properties The opened band gap at
Fermi level should close and Bi transforms from a semi-metal to a metal on the sub-
picosecond range The study of this phase transition process can provide important
information not only for the understanding of non-equilibrium structural dynamics in
Peierls distorted systems but also for designing future ultrafast electronic devices So
far it is not clear whether this phase transition can be achieved without subsequent
disorderingmelting of the Bi sample for an initial room temperature lattice Moreover
there is no experimental evidence yet that the structural phase transition to the high
symmetry state can be realized This experimental challenge has been addressed in
my PhD work
In this chapter the evolutions of laser-excited coherent optical phonons in Bi
have been investigated by directly monitoring the atomic motion using time-resolved
X-ray diffraction The observed extreme softening of the A1g phonon mode indicates
transient disappearance of the Peierls distortion This chapter is organized as follows
Section 51 provides a brief introduction of Bi Section 52 presents the experiment
results and discussion Section 53 summaries the main results of this chapter
5 Extreme phonon softening in laser-excited Bi
75
51 Research background
511 Structure of Bi and the phonons
The crystalline form of Bi is the di-atomic basis rhombohedral A7 structure [238]
which is derived from a simple cubic structure in two steps First a simple cubic
lattice is stretched along one of the body diagonals creating a smaller shear angle than
the cubic value of 60deg Then a Peierls instability [230]
causes the atoms to be displaced
along the same diagonal in opposite directions leading to a reduction of the structural
symmetry and a doubling of the lattice constant Fig 51 illustrates the primitive unit
cell of Bi The first atom is placed at the node of the primitive unit cell and the second
atom lies along the body diagonal with a slight displacement from the center of the
unit cell The length of the body diagonal is defined as d then the corresponding
distance for the second atom is xbulld At room temperature the lattice parameters are
a = b = c = 455 Aring body diagonal d = 1186 Aring and x = 0468 ie the distance of the
pair of atoms is xbulld = 55505 Aring
Fig 51 Primitive unit cell of Bi and the motion directions of the A1g
and Eg phonon mode
5 Extreme phonon softening in laser-excited Bi
76
Fig 52 Potential energy surface in Bi as a function of percentage of
electrons excited into the conduction band n and normalized atomic
distance x Picture reproduced from Ref [237]
Upon the external perturbations the motion of the two atoms against each other
along the body diagonal corresponds to the A1g-optical phonon mode The motion of
the atoms in the plane perpendicular to the body diagonal corresponds to the two
(degenerate) Eg-optical phonon modes (Fig 51) The work presented in this chapter
has focused on studying the laser excited A1g-optical phonon that can be characterized
by the changes of the normalized atomic distance x along the body diagonal Murray
et al have used density functional theory (DFT) to compute the potential energy
surface (PES) along x for different levels of electronic excitation [237]
Fig 52 (taken
from Ref [237]) displays the potential energy as a function of the percentage of
carriers excited into the conduction band and the normalized atomic distance x To
interpret the experimental results this PES will be frequently referred to in the
remaining sections of this chapter
512 Previous works
Bi has been studied by methods of ultrafast optics for over two decades The
coherent optical phonons launched in Bi after femtosecond laser excitation were first
5 Extreme phonon softening in laser-excited Bi
77
observed by Cheng et al [239]
in time-resolved reflectivity measurement By
monitoring the oscillations in the optical reflectivity the A1g phonon motion was
detected and its frequency compared to the results obtained by spontaneous Raman
scattering and inelastic neutron scattering [240]
Owing to the high temporal resolution
and high accuracy optical techniques are powerful to retrieve quantitative
information about the frequency of the excited phonon and its decay dynamics The
subsequent experiments explored coherent phonon dynamics by studying the phonon
frequency [231 232]
the electron-phonon energy coupling [241 242]
the temperature
dependence [236 243 244]
and the excitation level dependence [237 244-249]
The Eg mode
was also observed with optical techniques [236 244 249 250]
However optical techniques measure the modulation of the dielectric constant
Therefore they can provide only indirect information about the magnitude of the
atomic motion in the excited sample Providing direct information about the atomic
motion in laser-excited Bi ultrafast time-resolved X-ray diffraction [7-9 17 18 39-41 67-69
73 251 252] and electron diffraction
[12 13 81 253 254] have been recently applied Two
time-resolved X-ray diffraction experiments which are closely connected to the study
presented in this thesis will be described in detail in the following part
When a thin film sample with a thickness much smaller than the extinction
length [255 256]
is investigated with X-ray diffraction the secondary scattering of the
Bragg reflected beam can be neglected This treatment is known as the kinematic
approximation Thus the intensity of a particular Bragg reflection (hkl) of Bi is
determined by the squared modulus of the geometrical structure factor
22cos2 xlkhfFI Bihklhkl (51)
where h k and l are the Miller indices f Bi is the atomic scattering factor for Bi x
is normalized atomic distance which becomes time-dependent after laser excitation
If the Debye-Waller factor is assumed to be constant a direct indication of the atomic
displacement along the trigonal direction inside the unit cell after laser excitation can
be presented by the changes in the normalized diffraction signal for the (111) and
(222) reflections as
5 Extreme phonon softening in laser-excited Bi
78
)0(3cos
)(3cos
)0(
)(2
2
xn
txn
I
tI
nnn
nnn
n=1 for (111) n=2 for (222) reflection (52)
Figure 53 shows the normalized X-ray diffraction efficiency of the (111) and
(222) Bragg-peaks of Bi as a function of x The diffraction intensity is normalized to
the value of x = 0468 (actual equilibrium value in the unperturbed crystals) and
plotted as a function of x In the high-symmetry non-Peierls distorted state where
x = 05 (2nd
atom in the centre) diffraction from (111) planes is forbidden whereas
(222) diffraction becomes the minimal diffraction order and reaches a maximum
value Impulsive electronic excitation suddenly displaces the minimum of the PES
closer to x = 05 and the atoms are set in motion towards the new equilibrium position
As a consequence of this motion the changes in the X-ray diffraction signal are
expected to evolve in opposite directions An increase for the (222)-reflection and a
decrease for the (111)-reflection Following these initial changes the oscillatory
atomic motion around the new equilibrium position should give rise to oscillations of
both the (222)- and the (111)- diffraction signal with a frequency corresponding to
the A1g optical phonon mode
Fig 53 Normalized intensity of Bragg peak (111) and (222) versus
atomic displacement expressed in the relative position along the
body diagonal
5 Extreme phonon softening in laser-excited Bi
79
The first time resolved experiment where X-ray diffraction had been applied to
directly follow the atomic motion associated with the laser-excited coherent phonon
in Bi was performed by Sokolowski-Tinten et al [68 251]
In this work the evolutions
of two Bragg-reflections of a laser-excited 50 nm Bi thin film were measured (Fig
54) The frequency of the A1g mode was found to be only 212 THz substantially
smaller than the frequency of 292 THz measured in non-excited Bi (ie by Raman-
spectroscopy) The large displacements as well as the strong softening indicated
substantial changes of the interatomic potential which had not been observed before in
all-optical experiments
(a) (b)
Fig 54 X-ray diffraction efficiency of the (a) (111) and (b) (222)
reflections as a function of time delay between the optical pump
pulse and X-ray probe pulse Coherent phonon oscillations with
oscillation frequencies of 212 THz were observed Pictures
reproduced from Ref [68]
However due to the limited signal-to-noise ratio that was available with the laser
plasma-based source at that time this successful work was only achieved at a
relatively high excitation fluence A systematic investigation of the frequency and
amplitude dependence of the A1g phonon towards weaker excitation was required to
fill the gap to the all-optical work carried out with lower excitation fluences
Due to a significantly higher X-ray flux the Sub-Picosecond Pulse Source
(SPPS) [257]
at Stanford appeared to be the ideal X-ray source to perform this
experiment The softening of the A1g phonon mode as a function of excitation density
5 Extreme phonon softening in laser-excited Bi
80
and the detailed mapping of the carrier density-dependent PES were quantitatively
characterized for the first time by the work performed at the SPPS [69 186]
In this
work the optical phonon modes in Bi had been investigated at different absorbed
laser fluences up to 23 mJcm2 Fig 55 (a) shows four time traces for different
excitation fluences The optical phonon frequency as a function of the normalized
equilibrium atomic distance x is displayed in the inset of Fig 55 (a) A softening of
the A1g phonon frequency was found (from 291 THz down to 23 THz) with
increasing x These data provide direct information about the laser-induced changes of
the PES namely the position of potential minimum as well as its curvature In Fig
55 (b) a comparison between these measured data and theoretical calculations based
on DFT [237]
is presented A good agreement between the experiment and the DFT-
results is found
(a) (b)
Fig 55 (a) Bi (111) X-ray diffraction efficiency as a function of
time delay for different absorbed fluences 07 (green) 12 (orange)
17 (blue) and 23 mJcm2 (gray) The observed A1g optical phonon
frequencies are displayed in the inset as a function of x the new
normalized (quasi-)equilibrium atomic distance along the body
diagonal of the unit cell The dotted curve represents A1g
frequencies predicted from DFT calculations [237]
(b) Normalized
quasi-equilibrium atomic distance x as a function of carrier density n
with the overlaid excited state PES (false color) The white dotted
line represents the equilibrium atomic distance obtained with DFT
The red points are the measured data at the SPPS The Bi unit cell is
depicted in the top right The ratio of yellow bar to red bar
determines x Pictures reproduced from Ref [69]
5 Extreme phonon softening in laser-excited Bi
81
These results bridged the gap between the existing work on low and high
fluence However another interesting question has been raised here Could the system
when excited with higher fluence be really driven back to the high symmetry state
(x = 05) and could the Peierls distortion be reversed To answer this question I have
extended the studies of coherent optical phonons in Bi to a higher excitation fluence
regime that has not been studied previously By using the modular setup [chapter 3]
time-resolved X-ray diffraction experiments were performed A complete softening of
the excited A1g mode is observed in the high level excitation data This represents
conclusive experimental evidence that the Peierls distortion which defines the
equilibrium structure of Bi is transiently reversed
52 Experiments and discussion
521 Method
The measurements were performed using the modular setup which was already
introduced in chapter 3 (Fig 31) X-ray pulses at a photon energy of 805 keV
(wavelength 154Aring) were used The (111)- oriented crystalline Bi sample (50 nm film
on Silicon same type of sample which was used in the previous experiments [68 69]
More details on relevant parameters of the Bi sample used in this work are provided
in Appendix C) is placed under the appropriate Bragg-angle 1124deg for (111)-
reflection and 2294deg for (222)-reflection To launch the A1g optical phonon mode
through displacive excitation the sample was optically excited by near-infrared (800
nm) femtosecond laser pulses with (absorbed) fluences from 1 mJcm2 to 42 mJcm
2
It should be noted that for absorbed fluences above 25 mJcm2 the sample suffered
damage after excitation with many pulses The damage could be detected by
monitoring (with a CCD-camera) the scattered fraction of the incident pump light
which increased significantly upon damage From the fact that the increase of pump
light scattering occurred long before permanent changes in the X-ray diffraction
5 Extreme phonon softening in laser-excited Bi
82
signals could be observed it can be concluded that multi-pulse damage occurs initially
only at the very surface of the sample Still when this increase in scattering was
observed the sample was shifted to a fresh spot The atomic motion was probed by
measuring the diffraction of the X-ray probe pulses after a controlled time delay with
respect to the pump laser pulses In order to maximize the accuracy of the experiment
and to observe small changes in the diffraction signals the direct normalization
scheme with ldquofastrdquo scanning (see chapter 3) had been applied in the measurements
The diffraction signals of the (111)- and (222)-reflection are recorded with the silicon
avalanche photodiode and the signal from the ionization chamber detector is used for
normalization The typical time required to measure a complete time-dependence
(approx 180 delay points) of one diffraction order for one fluence with an accuracy of
approximately 1 was around 6 hours Comparing to the 12 hours per measurement
using the Ti Kα source reported by Sokolowski-Tinten et al [68]
(accuracy approx
2) this represents a significant improvement
522 Preliminary measurements
Before performing the time-resolved experiments for studying laser-excited
coherent optical phonons in Bi two preliminary experiments were carried out to
characterize the structural response of the sample upon ultrafast optical excitation
Fig 56 shows the diffraction signal of the Bi (111)-reflection and the (substrate)
Si (111)-reflection as a function of sample angle The lattice mismatch provides
sufficient angular separation of the diffraction signal from the Bi film and the
diffraction signal from the Si substrate As expected the diffraction signal of the bulk
Si-substrate is significantly stronger (approx 20times) than the diffraction from the thin
Bi-film Another important information obtained from this measurement is that the
angular width of the Bi diffraction curve (03deg FWHM) is larger than the angular
width of the incident X-ray beam (017deg FWHM) As it had been discussed in the
previous chapters in this case the experiments will be performed at a fixed sample
angle corresponding to the maximum detected diffraction signal
5 Extreme phonon softening in laser-excited Bi
83
Fig 56 The diffraction signal of Bi (111)-reflection and (substrate)
Si (111)-reflection as a function of sample angle Both signals are
normalized to the maximal value of Bi (111) signal
A preliminary time revolved measurement was performed on the (111)-reflection
with an area detector (ldquoGemstarrdquo camera) This measurement allowed to
approximately determine time delay zero and provided some information on the
temporal evolution of signal intensity and in particular on the changes of the angular
position of the diffraction peak upon laser excitation The incident pump fluence in
this measurement was about 5 mJcm2 The measured results are displayed in Fig 57
Despite the low accuracy of this measurement three different stages in the temporal
evolution of the diffraction intensity can be recognized Immediately after the photo-
excitation a rapid decrease in the diffraction efficiency is observed followed by a
partial recovery of the diffraction signal during the next 5 ps After that the diffraction
intensity starts to decrease again on a 10 ps time-scale On the other hand the angular
position of the (111)-diffraction peak starts to change only after 5 - 7 ps The shift to
smaller diffraction angles indicates lattice expansion
5 Extreme phonon softening in laser-excited Bi
84
In consequence the initial decrease of the diffraction signal and the 5 ps
recovery are attributed to changes of the structure factor and thus changes of the
normalized atomic distance x upon electronic excitation and subsequent relaxation
However the expected signal oscillations could not be resolved due to the limited
accuracy and the coarse delay spacing Moreover it is important to note that
measurements on Bi can be performed within a time window of about 5 ps without a
correction of the angle of incidence of the X-ray beam as it was necessary for the case
of Au (compare discussion in chapter 4) The following detailed investigation of the
coherent optical phonon concentrates therefore on this time window of about 5 ps
after excitation (marked with the blue dashed-dotted line in Fig 57) where the
changes of the signal intensity caused by the shift of the Bragg peak are negligible
Fig 57 Time revolved measurement with the Gemstar camera The
left axis shows the position of the center of gravity of the Bi (111)
rocking curve The right axis showed the integrated intensity of the
diffracted signal
5 Extreme phonon softening in laser-excited Bi
85
523 Results of time resolved measurements and discussion
Before presenting the experimental results and discussion it should be noted that
the effective energy deposition depth of 800nm fs laser pulses is approximately
26 nm [73]
This means that initially only half of the sample thickness (50 nm) is
excited The spatially inhomogeneous excitation of the sample needs to be taken into
account in the following discussion
Fig 58 shows representative examples of time-traces of the normalized
diffraction efficiency of the (111)- (a) and the (222)- reflection (b) for different pump
laser fluences Since the absolute time-zero in these experiments is only known to an
accuracy of about +- 150 fs the zero-delay point is arbitrarily set for each curve at
the half maximum of the initial transient change A typical error bar of the measured
data is given at the end of each curve While the (111)-reflection exhibits a fluence
dependent initial drop followed by oscillations and a slow recovery the (222)-
reflection initially increases in diffraction efficiency followed also by oscillations and
a slow recovery This behavior is similar to the results reported in the previous
studies [68 69]
and can be readily interpreted by considering the changes of the
geometrical structure factor (see Fig 53) within the DECP-picture The initial
transient change is ascribed to photon-induced alteration of the minimum position of
the PES that leads to a atomic motion towards a symmetric arrangement (x = 05) The
following oscillations correspond to the A1g coherent optical phonon mode of the
lattice and the recovery of the diffraction efficiency is attributed to restoration of the
PES to its equilibrium state
5 Extreme phonon softening in laser-excited Bi
86
Fig 58 X-ray diffraction efficiency (a) (111)-reflection and (b)
(222)-reflection of a 50 nm (111)-oriented Bi-film as a function of
pump-probe time delay for different excitation fluences The zero-
delay point is set at the half maximum of the initial transient change
A typical error bar of the measured data is given at the end of each
curve
It should be noted that Fig 53 only takes into account changes of x Upon laser-
excitation other effects become important as well For example the Debye-Waller
5 Extreme phonon softening in laser-excited Bi
87
effect caused by an increase of the lattice temperature (incoherent phonons) also
affects the X-ray diffraction efficiency (see Chapter 4) Although the Debye-Waller
effect can be neglected for the first few hundred femtoseconds after laser excitation
since the energy exchange between the initially excited hot electrons and the lattice
system occurs typically on a time-scale of a few ps it should be considered in the
later recovery processes For the (111)-reflection the change in the Debye-Waller
factor is calculated to be a few percent from room temperature up to the melting
temperature [186]
Relative to the signal changes associated with the induced changes
in x the drop in the signal induced by the Debye-Waller effect is negligible On the
other hand for the (222)-reflection the change in the Debye-Waller factor is 4 times
larger for the same temperature increase and comparable to the effects caused by
changes in x The decrease of the mean value of the normalized (222) diffraction
signal to values below that of the unexcited sample is tentatively attributed to the
combination of the restoration of the PES and the DebyendashWaller effect
In the following section the magnitude of the initial change of the diffraction
efficiency and the frequency of the following oscillatory part are retrieved from the
measured time traces and will be discussed in detail
The initial maximum diffraction efficiency changes ΔI111 and ΔI222 as a function
of laser pump fluence (red (111)-refl black (222)-refl) are shown in Fig 59 Data
obtained at the SPPS (green) [69]
are also plotted in the figure for comparison and they
are consistent with the new results The linear fits of the data points reveal that the
initial changes of both reflections are linearly dependent on absorbed fluence From
the comparison of the ratio of ΔI111ΔI222 = - (28 plusmn 02) obtained from the fitting
slopes and the value of -235 as estimated from the change of the geometrical
structure factor upon the increase of the Bi-Bi distance x a rough agreement of both
values is found and this clearly demonstrates that the coherent motion of atoms is the
leading contribution which influences the initial changes of the diffraction efficiencies
The initial atomic motion is proved to be mainly coherent
5 Extreme phonon softening in laser-excited Bi
88
Fig 59 Initial maximum changes of the diffraction efficiencies for
the (111)-reflection (red) and the (222)-reflection (black)
respectively as a function of pump laser fluence The red and black
dashed lines are the linear fits for the measured data The data
obtained at the SPPS (green) [69]
is also plotted in the figure for
comparison
To determine the frequencies from the oscillatory part of the measured
diffraction efficiencies a Fast Fourier Transform (FFT) had been applied to all
measured time traces including others not shown in Fig 58 The slow background
components (initial changes and the slow recovery) are subtracted from the time-
traces before transformation As an example Fig 510 shows as red solid curve one of
those FFT results obtained from a time trace of the (222)-reflection measured at
23 mJcm2
absorbed fluence The FFT is characterized by one main peak at 24 THz
and a number of secondary peaks Due to the limited number of phonon periods
covered in this measurements as well as the small amplitude of the oscillations a
relatively low signal to noise ratio in this Fourier transform analysis is expected
Therefore only the frequency with the highest amplitude representing the main
contribution of the atomic motion is considered as reliable Since the understanding
5 Extreme phonon softening in laser-excited Bi
89
of the other observable frequency components is still an open question they will not
be discussed further in this thesis
Fig 510 FFT-spectra of the time traces of Bi 222-reflection with
23 mJcm2
absorbed fluence The solid curve and the dotted curves
(6 examples) represent the FFT results obtained from the mean time
trace and the random time traces produced within its error bar
respectively
In order to validate this approach and to assess the accuracy of the obtained
frequencies it is necessary to check how the dominant frequencies are influenced by
the measurement errors The following procedure demonstrated with the time trace
used above (222-reflection at 23 mJcm2
absorbed fluence) is applied For each time
trace the signal values of the individual data points are randomly changed within the
limits set by the error bars In this way a set of artificial time-traces is produced which
represent - within the error - possible time traces The variation of the FFT-spectra
of all this possible time-traces allows to estimate the error in the FFT and to asses
which frequency components can be regarded as real In Fig 510 six of these FFT-
spectra are presented as dotted curves With respect to the main peak (the solid curve)
it can be concluded that the measurement errors slightly change its amplitude and
width but do not affect much its position The variation of the peak position is
5 Extreme phonon softening in laser-excited Bi
90
significantly smaller than the peak width which I consider in the following as the
error of the measured frequency In conclusion the dominant frequency obtained
from the FFT can be regarded as reliable and it is assumed that it represents the A1g-
phonon mode Some more FFT-spectra obtained from the measured time-
dependencies of the diffraction efficiency are presented in Fig 511
Fig 511 FFT-spectra of the measured diffraction efficiencies for
different absorbed fluences The dominant frequency in each figure
is marked by the blue arrow
5 Extreme phonon softening in laser-excited Bi
91
Fig 511 clearly indicates that for each fluence a unique dominant frequency
can be determined as marked with the blue arrow The only exception is the one at
F = 32 mJcm2 where several peaks of equal strength are found Fig 512 summarizes
the result of the FFT-analysis It shows the determined dominant frequency as a
function of fluence The frequency error bars represent the FWHM of a Gaussian fit
to the dominant peak
Fig 512 Frequency of the excited A1g-mode as function of laser
fluence derived from the time resolved diffraction data red 111-
reflection green 222-reflection violet data obtained from earlier
results at University Duisburg-Essen (UDE) [68]
blue data obtained
at the SPPS [69]
Cyan A1g-frequency of unexcited Bi black dashed
line guide to the eye Insert DFT calculations from Murray et al [237]
The solid and dashed lines show the anharmonic and harmonic
frequencies as a function of carrier density n respectively
In Fig 512 the red and green data points represent the new data from my
measurements At lower fluences they compare well with the results obtained earlier
which have discussed above (violet point Ref [68] blue points Ref [69] Most
strikingly these experimental data reveal an extreme softening of the A1g-mode for
5 Extreme phonon softening in laser-excited Bi
92
high fluences (gt 2 mJcm2) Particularly by extrapolating the measured data (black
dashed line as a guide to the eye) a complete softening at fluences of 30 to
33 mJcm2 is expected At first glance surprising a further increase of fluence leads
to the revival of the signal oscillations and an increase of the mode-frequency The
complete softening and later stiffening of the A1g-mode clearly indicate that the
Peierls distortion is transiently reversed for fluences above approx 30 mJcm2
Further evidence can be found in Fig 59 where initial signal changes of (111) and
(222) diffractions reach approx -50 and 20 at this excitation level respectively
These results agree with estimates based on the geometrical structure factor (see Fig
53) assuming that about half of the film thickness had been excited to the symmetric
arrangement x = 05 (where the 111-reflection is fully forbidden)
In order to compare my measured results with the theoretical predictions of the
DFT-calculations performed by Murray et al [237]
the calculated harmonic and
anharmonic phonon frequencies using the PES are presented in the inset of Fig 512
as a function of carrier density n One can immediately see qualitative agreement
between the experiment and the calculation The harmonic frequency computed from
the curvature of the PES at the minimum under the assumption of harmonic
approximation The anharmonic frequency obtained from the inverse of the actual
cycle period of atomic motion in the anharmonic potential More detailed
interpretations of the two frequencies are provided in Ref [237] and [258] At low
excitation level as already proved by experiment [69]
there is little difference between
the harmonic and anharmonic frequency The difference becomes apparent at high
excitation levels where the range of atomic motion increases leading to an
anharmonic oscillation of the atoms along the asymmetric part of the PES A detailed
interpretation of atomic motion upon laser excitation is given in the following
5 Extreme phonon softening in laser-excited Bi
93
Fig 513 Sketch of the interatomic potential energy surface of Bi
upon laser excitation The black curve represents the shape of initial
equilibrium PES The others represent (qualitatively) the shape of
PES upon different excitation levels For illustrative purpose the
curves are adjusted to be separated in arbitrary unit The dashed
curves along the surface indicate the range of atomic motions
Within the DECP-picture the atoms are immediately displaced from their
(transient) equilibrium position due to the impulsive laser induced change in the PES
A restoring force whose magnitude and direction are determined by the gradient of
the PES is exerted on the atoms setting them in motion The frequencies extracted
from the X-ray diffraction signals displayed in Fig 512 directly reflect this transient
atomic motion along the PES and yield information regarding the curvature of the
PES of the excited sample In order to concisely interpret this oscillatory behavior I
illustrate qualitatively the shapes of the PES of Bi upon laser excitation and the
possible range of atomic motion in Fig 513
The initial equilibrium PES of Bi has a double well structure with the minimum
position at x = 0468 (curve (a)) For weak excitation a slight shift of the minimum
position of the PES and a slight decrease of the Peierls barrier can be seen (curve (b))
The atomic motion is limited to a small range around the equilibrium position and the
5 Extreme phonon softening in laser-excited Bi
94
atom oscillates harmonically along the PES Anharmonicity is negligible The
frequency drops approximately linearly with excitation fluence This situation
corresponds to the excitation level up to 15 of carrier density in the DFT
calculation and excitation fluences below 25 mJcm2 in Fig 512 Extensive studies
[68 69 237 244-246 248 249 259] on the generation of coherent optical phonons in Bi have
been performed in this region with time-resolved optical and X-ray techniques Up to
now no study has been carried out beyond this level of excitation The behavior in
this unexplored area has been revealed in this work
Following the increase of the excitation level the range of oscillatory atomic
motion becomes larger (curve c) The asymmetric anharmonic shape of the PES leads
to an additional increase of the period of atomic motion which defines the
anharmonic phonon frequency shown in the inset of Fig 512 It differs
significantly from the harmonic frequency (defined by the curvature of the PES at the
minimum) This situation corresponds to 15 ~ 2 of excited carrier density in the
DFT calculations and the excitation fluences of 25 ~ 3 mJcm2 in Fig 512
Upon further increase of excitation the system can reach the particular state in
which the Peierls barrier becomes low enough to let the atom just climb to its top
where it stops (curve d) In this labile equilibrium atomic motion freezes and the
anharmonic frequency becomes zero After reaching the above particular state the
Peierls barrier is further lowered by an increased fluence and the atom is allowed to
cross the x = 05 position and moving in both wells (curve e) As the atomic motion
restarts the phonon frequency revives Upon further increase in fluence the double
well and the barrier vanish The minimum of the PES is now at x = 05 which means
that the Peierls distortion has been transiently reversed Right at the transition the
harmonic term of the PES vanishes (curve f) which corresponds to the situation where
the harmonic frequency becomes zero These happen at an excitation level of 2 ~
27 of carrier density in the DFT calculation and absorbed laser fluences between
30 to 33 mJcm2 in Fig 512
With the further increase of excitation level corresponding to the value beyond
27 of carrier density in the DFT calculation and absorbed laser fluences above 33
5 Extreme phonon softening in laser-excited Bi
95
mJcm2 in Fig 512 the PES is continuously altered and the two minima converge to
one transforming the flat profile to the sharp parabola with the minimum position at
x = 05 (curve g and h) As the relative potential energy (to the minimum of the PES)
increases the atom moves along a parabolic surface with higher velocity thus
shortening the motion period and leading to an increase in the phonon frequency The
A1g phonon mode stiffens However it should be noted that due to the already
reversed Peierls distortion and the transformation into a more symmetric structure
with only one atom per unit cell this atomic motion correspond now to an acoustic
phonon mode at the new Brillouin-zone boundary
In contradiction with the above description about the range of atomic motion the
observed oscillation amplitudes in the measured data (see Fig 58) are much smaller
compared to the average signal change A very strong damping in the A1g atomic
motion can be responsible for the observation The reason of the damping effect is not
fully understood yet Considering the high excitation level applied in the
measurements a coupling of the A1g mode to other modes (eg Eg mode) which was
proposed in the earlier electron diffraction experiment [81]
and predicted in calculation
by Zijlstra et al [260]
could be the reasonable explanation for this effect Since the
system performs small amplitude oscillations around the new equilibrium
positionpotential minimum I suppose the experimental results are more suitable to be
described by the harmonic frequency
Finally it should be noted that the above description of the A1g phonon behavior
follows the results of the first principles DFT calculation [237]
which applies separate
chemical potentials for electrons and holes This model has been proved to be
quantitatively correct for low excitation fluences [69]
and at least qualitatively in good
agreement with my experimental results The other approach proposed by
Zijlstra et al [260]
using all-electron full-potential linearized augmented planewave
method (FLAPW) [261 262]
provides a description not only on A1g phonon but also on
Eg phonon and interactions between them This model could be more accurate for the
situation of Bi at the high level excitation While these two theoretical calculations
5 Extreme phonon softening in laser-excited Bi
96
differ quantitatively they qualitatively predict similar changes of the PES and the
phonon frequency
53 Summary
In summary an investigation of the laser-excited A1g coherent optical phonon
mode in Bi was performed with the laser plasma X-ray source The reversal of Peierls
distortion as well as the coherent motions of atoms in Bi following laser excitation
was observed In the low excitation regime the data agree with previous results
obtained at UDE and the SPPS In the strong excitation regime (absorbed laser
fluences gt 2 mJcm2) an extreme softening of the A1g mode was observed and an
interpretation was given Particularly the observation of a complete softening
(frequency down to zero) at fluences of 30 to 33 mJcm2 indicates that the Peierls
distortion defining the equilibrium structure of Bi transiently vanishes At even
stronger excitation (absorbed laser fluences gt 33 mJcm2) Bi starts to respond as a
material arranged in the structure with half of its equilibrium lattice constant and the
atomic motion becomes a Brillouin-zone boundary acoustic phonon mode These
observations follow at least qualitatively the predictions of calculations based on DFT
[237 260]
However due to the limited experimental accuracy these results do not provide
more detailed information with respect to the damping behavior of the oscillations the
decay of coherent phonons and the coupling of the phonon modes For further detailed
investigation in the high excitation region more powerful X-ray sources (eg XFEL
or LCLS) are needed
As already mentioned in the experimental section accumulative sample damage
was observed when absorbed fluences beyond 25 mJcm2 are used It indicates that
the applied excitation density is close to the melting threshold of the Bi sample It
questions how the phonons respond to excitations far beyond the melting threshold
which allow the melting of Bi sample with a single laser pulse Such a question had
recently been investigated by Sciaini et al [81] The ultrafast melting of Bi had been
5 Extreme phonon softening in laser-excited Bi
97
observed with time-resolved electron diffraction It was found that under extreme
excitation conditions the disordering of the Bi crystal structure occurs within 190 fs
which is substantially shorter than the disordering time determined by lattice heating
indicating a non-thermal melting process The authors attribute such surprising speed
of the non-thermal solid-to-liquid phase transition in Bi to laser induced changes in
the PES which result in strong acceleration of atoms along the longitudinal direction
(A1g mode) and an efficient coupling of this motion to the transverse mode (Eg mode)
This coupling effect had also been theoretically predicted by Zijlstra et al [260]
in high
excitation regime In order to obtain the insight into more details of DECP mechanism
and subsequent phonon dynamics at the high excitation regime the Eg phonon motion
as well as the coupling effect of A1g and Eg mode should be included in this study
However since amplitude of the Eg mode is much smaller than the one of the A1g
mode and the experimental geometry in this measurement is not sensitive to Eg
motions the Eg phonon mode as well as the coupling effect has not been observed in
my data
Nevertheless a complete insight of A1g optical phonon dynamics in laser excited
Bi from the weak excitation to melting is provided now from the results of three
excitation levels (low data from SPPS high data in this thesis extreme data from
electron diffraction) The transient reversal of Peierls distortion happening before the
disordering of Bi crystal structure has been experimentally confirmed The structural
change resulting from the coherent phonons has been indicated by the appearance of
the acoustic phonon mode Since many properties of a solid including the electronic
thermal and optical properties are affected by lattice structure this knowledge of
ultrafast structural changes caused by electronically altered energy surfaces can be
extended to understand not only the phonon dynamics of other Peierls distorted
materials (Sb and As) but also the mechanism of ultrafast phase transition in other
functional materials eg insulator-metal transition in VO2 [263 264]
and crystalline-
amorphous transition in chalcogenide alloys [265 266]
6 Towards time-resolved Debye-Scherrer X-ray diffraction
98
6 Towards time-resolved Debye-Scherrer
X-ray diffraction
The observation of the transient changes of a single Bragg-reflection in a
femtosecond X-ray diffraction measurement provides only limited information about
the transient structural response of optically excited materials To obtain a more
complete picture of the induced processes it is desirable to monitor as many Bragg
peaks as possible The Bragg diffraction scheme with a monochromatic source applied
in the experiments discussed in chapter 4 and 5 requires single crystalline samples of
high quality and thus the range of materials that can be studied is limited Moreover
a sequential measurement of many individual Bragg peaks is time consuming and
difficult to handle due to multiple sample adjustments (sample rotations) as well as
the instability of the laser and X-ray sources One alternative for effectively
measuring multiple diffraction peaks with single crystalline sample is the so-called
rotating-crystal method [74]
By rotating a single crystalline sample at a high constant
angular velocity (eg 180degs) the Bragg condition for different diffraction peaks is
fulfilled and simultaneously allowing a detection of a larger number of transient
diffraction peaks under the same experimental conditions in one measurement Again
this method requires good sample preparation precise mounting and alignment of the
sample as well as extremely stable mechanical components
Moreover not all materials can be prepared as crystalline thin films (thin films
are necessary in order to match the optical absorption depth to the X-ray probing
depth) On the other hand many materials can be prepared in polycrystalline form
For polycrystalline materials the well-known Debye-Scherrer scheme [267]
represents a
simpler approach to access simultaneously multiple Bragg peaks The simultaneous
6 Towards time-resolved Debye-Scherrer X-ray diffraction
99
detection of several reflectionsdiffraction rings without additional (sample
adjustments and mechanical stability) requirements allows conveniently getting as
much as possible information of the sample from one measurement A successful
time-resolved experiment using the Debye-Scherrer scheme on a thick (250 microm)
powder sample has been recently reported [106]
Since a material with a large unit cell
size was used multiple diffraction rings were recorded simultaneously proving the
relocation of charges within the unit cell with a time resolution of 100 fs This result
demonstrates the feasibility of using a laser-plasma based X-ray source for
investigating a wide range of polycrystalline inorganic and organic materials with
time-resolved Debye-Scherrer diffraction
The use of an X-ray optic with high magnification in the modular setup (see in
chapter 3) can provide a quasi-collimated beam well suited for the Debye-Scherrer
diffraction scheme In the work discussed in this chapter I performed Debye-Scherrer
X-ray diffraction experiments on thin polycrystalline metal films and I demonstrated
the possibility to perform time-resolved experiments with the modular setup The first
part of this chapter presents the experimental configuration In the second part static
Debye-Scherrer diffraction measurements on a 20μm Cu foil are presented This
measurement serves as comparison to results previously obtained by U Shymanovich
using a different kind of focusing X-ray optic (elliptical capillary) [105]
In the third
part of this chapter results of a time-resolved X-ray Debye-Scherrer diffraction
measurement on a 200 nm Au film are presented and discussed
6 Towards time-resolved Debye-Scherrer X-ray diffraction
100
61 Experimental configuration
(a)
(b) (c)
Fig 61 Experimental configuration (a) The principle schema of the
experimental setup (b) A photo of the arrangement of sample and X-
ray area detector (c) The configuration of the experiment for an Au
sample
A schematic of the experimental setup is shown in Fig 61 (a) The femtosecond
X-ray pulses are collected by the X-ray multilayer optic and focused on a
polycrystalline thin film sample at normal incidence Comparing to the experiments
described in the previous chapters no special alignment of the sample is necessary
due to its polycrystalline structure The diffraction pattern from the sample forms a
series diffraction cones Each diffraction cone corresponds to the diffraction from the
same family of crystalline planes in all the participating crystallites For the detection
a large area detector is required to cover a sufficiently large angular range In the
experiment discussed here the phosphor-based MCP amplified X-ray area detector
(ie ldquoGemstarrdquo) was utilized for this purpose This camera has already been
mentioned in chapter 3 and its working principle and detailed parameters are provided
Thin Film Sample
CC
D
Multilayer
X-ray Optic
Plasma
Kα-Source
6 Towards time-resolved Debye-Scherrer X-ray diffraction
101
in Appendix B In order to simultaneously record as many diffraction orders as
possible the camera was placed not normal to the incident beam Fig 61 (b) presents
a photo of the sample and camera arrangement In Fig 61 (c) the detectable
diffraction orders have been depicted for Au as an example Their corresponding
diffraction angles are shown in the insert of Fig 61 (c) Note that due to the limited
size of the detector only parts of the different rings are recorded (see below)
62 Static Debye-Scherrer measurements
(a) (c)
(b) (d)
Fig 62 Diffraction pattern of a 20μm polycrystalline Cu foil with
Cu Kα X-ray source The CCD images in (a) and (c) are obtained
using multilayer optic and capillary optic respectively (b) and (d)
are the radial cross section of image (a) and (c) respectively (c) and
(d) reproduced from Ref [105]
In order to test the feasibility of the experiment and the capability of the setup I
first performed a (static) Debye-Scherrer diffraction experiment on a 20 μm thick Cu
6 Towards time-resolved Debye-Scherrer X-ray diffraction
102
foil This sample was used in the above mentioned previous study with the elliptical
capillary optic [105]
and it provided sufficient diffraction signals to record the Debye-
Scherrer diffraction pattern Using the sample this time with the multilayer optic
offered an opportunity to compare results obtained with different types of X-ray
optics
The detailed parameters of the experiment and the accessible diffraction orders
of Cu with Cu Kα X-ray (805 keV) are provided in Appendix C A typical Debye-
Scherrer diffraction pattern obtained using the multilayer optic with 5 minutes
exposure time is given in Fig 62 (a) It can be seen that three different diffraction
rings are detected simultaneously These rings are the intersections of the diffraction
cones and the detector plane The shape of a complete ring which can be a circle an
ellipse a parabola or a hyperbola depends on the angle of the detector plane with
respect to the incoming X-ray beam In order to derive the intensity of diffraction X-
ray as a function of diffraction angle I() from this CCD image one needs to integrate
the pixel intensity along the ring in which the pixels belong to the same Thus a
complete diffraction ring for a corresponding needs to be reconstructed Considering
that only small fractions of the rings are detected by the CCD the curvatures of the
detected parts are small enough to allow these ring patterns being reconstructed by
approximating them as circles As it can be seen in Fig 63 (a) the coordinate origin
is set at the middle of the left edge of the CCD image By sampling the coordinates
from each ring their individual circle parameters (0x
0y and R ) for a circle
approximation ( 22
0
2
0 )( Ryyxx ) can be obtained Knowing these
parameters the full ring pattern out of CCD plane for each diffraction order can be
reconstructed The zoom of CCD plane (Fig 63(b)) presenting the well overlapping
of X-ray and the reconstructed rings demonstrates feasibility of this reconstruction
With these circle fitting functions the circle parameters ( 0x 0y and R ) as a function
of the x coordinate on the line y = 0 are obtained as displayed in Fig 63 (c) For each
x coordinate (from 1 to 1392) a corresponding ring can be deduced Each point (xy)
of the image belongs to one of these rings By integrating the pixel intensity along
6 Towards time-resolved Debye-Scherrer X-ray diffraction
103
each ring and projecting all data on the line y = 0 the X-ray intensity as a function of
x coordinate is obtained Converting the pixel coordinate to the angular coordinate by
applying the known angular positions of the corresponding detected diffraction orders
the diffraction X-ray intensity as a function of diffraction angle is finally derived The
result of this data processing for Fig 62 (a) is given in Fig 62 (b)
Fig 63 Reconstruction of the diffraction pattern in order to extract
the diffracted X-ray intensity as a function of diffraction angle (a)
Chosen coordinate system and the reconstructed ring pattern (b)
Zoom of the CCD image plane showing the overlap of the measured
diffraction pattern with the reconstructed rings (c) Circle fit
parameters (0x
0y and R ) of each diffraction ring as a function of x
coordinate on the y=0 line The dashed lines are the 2nd
order
Polynomial Fit for the data points
To compare my result with that obtained with a different kind of collimating
X-ray optic namely the elliptical capillary optics [105]
a CCD image from this study
and its radial profile are displayed in Fig 62 (c) and (d) The elliptical capillary
optics uses total reflection All incident X-rays passing through the capillary with an
angle smaller than the angle of total reflection undergo total reflection at its inner
6 Towards time-resolved Debye-Scherrer X-ray diffraction
104
surface The angle of total reflection has a weak dependence on the wavelength of the
X-rays and thus the optic is not wavelength sensitive Therefore more diffraction
orders originating from Kα and also Kβ radiation can be observed in Fig 62 (c)
instead of only three diffraction orders from the monochromatizing multilayer optics
The noisy background observed in Fig 62 (d) is caused by the unfocused radiation
passing directly through the capillary optic without reflection
In conclusion due to the monochromatic reflection of the multilayer optic and
the optimized Kα flux of the laser-plasma source (see chapter 2) the modular setup
can provide Debye-Scherrer diffraction patterns with much better signal-to-noise ratio
than those obtained previously [105]
63 Time-resolved Debye-Scherrer experiment
The absorption depth of a metal at visible and near-infrared wavelengths is
typically less than 20 nm [113]
However multi-keV X-ray penetrate much deeper [189]
In particular with the transmission geometry used in this experiment the 20 μm Cu
sample presented in the former section is not a suitable sample to perform time-
resolved experiments because it can not be effectively excited by the optical radiation
over the whole depth probed by the X-rays Therefore in the experiments discussed in
this section a 200 nm thick free standing Au thin film [268]
was used as sample to
demonstrate the feasibility of time-resolved Debey-Scherrer diffraction
6 Towards time-resolved Debye-Scherrer X-ray diffraction
105
631 Static Debye-Scherrer-diffraction pattern of the Au
thin film
(a)
(b)
Fig 64 Diffraction pattern of a 200 nm polycrystalline Au film (a)
CCD image (b) Radial cross section of (a)
The detailed parameters of the experiment and the detectable diffraction orders
6 Towards time-resolved Debye-Scherrer X-ray diffraction
106
for Au are provided in Appendix C and Fig 61 (c) The static Debye-Scherrer-
diffraction pattern of the Au thin film is presented in Fig 64 (a) Using a similar
experimental configuration as described in the previous section four diffraction
orders were observed in this case due to the larger lattice constant of Au as compared
to Cu I() is obtained in the same way as described in the previous section and shown
in Fig 64 (b) Compared to result with 20 μm Cu foil (Fig 62 (b)) the signal-to-
noise ratio becomes much worse Such a difference is attributed to the small thickness
of this sample the total intensities of the diffraction peaks decrease with sample
thickness whereas the noise (background signal) coming from the scattering of X-ray
are barely affected by the sample thickness
632 Results of time-resolved pump-probe measurements
In the timendashresolved measurement the incident fluence of the pump beam was
set to 160 mJcm2 (wavelength 800 nm) The diffraction patterns were recorded using
again the Phosphor-based X-ray area detector An exposure time of 5 minutes had
been chosen for each delay point After subtracting the CCD background the images
for a given delay were processed using a MatLab program (with the same routines
described in section 62) to obtain I()) By analyzing the transient changes of I()
the laser induced changes can be deduced
6 Towards time-resolved Debye-Scherrer X-ray diffraction
107
Fig 65 Comparison of the signal from non-excited and excited Au
sample (a) Radial cross sections obtained from measured data (b)
The selected profiles above the noisy background (about 30 of the
peak value) are fitted with Gaussian function
It is known since many years that the excitation of a thin metal film with an
ultrashort optical pump pulse leads to several effects which can be observed with
time resolved techniques [42 75 269 270]
Generally the changes of the diffraction
intensity due to the Debye-Waller effect and the changes of the diffraction angle due
to laser induced strain can be extracted from the measured time resolved data Both
effects have been discussed in Chapter 4 The amplitude of these changes is more
pronounced for higher diffraction orders (see the discussion in section 42 and the
latter discussion in section 633) Therefore I focused in the analysis on the two
highest diffraction orders (311) and (220) Since the reduction of the diffraction
intensity due to the Debye-Waller effect could not clearly be observed in these
measurements as will be explained in section 633 I will only discuss the observed
changes in the angular position of the Bragg-peaks attributed to strain caused by
acoustic waves
The changes of the diffraction pattern induced by the optical excitation are
6 Towards time-resolved Debye-Scherrer X-ray diffraction
108
presented in Fig 65 (a) where the I()-data for the non-excited sample (black-dotted
curve) and for a delay of 70 ps between the optical pump and the X-ray probe (green
dotted curve) are shown Shifts of both Bragg peaks are clearly observable In order to
quantify the shift the two selected Bragg-peaks have been fitted using the Gaussian
function To eliminate any effects of the noisy background on the fitting only data
points with an intensity larger than 30 of the peak intensity (blue and red curves in
Fig 65) have been used for the fitting The results are shown in Fig 65 (b) as dashed
curves and the peak positions and their error bars are obtained from the fitting
parameters Applying the same routine to all measured diffraction profiles the peak
positions as a function of delay time for the (311) and (220) Bragg reflections were
obtained and are shown in Fig 66
Upon the laser excitation pressure rises inside the sample inducing strain The
resulting strain will modify the lattice constant of the sample and thus the radii of the
diffraction rings This is the origin of the transient peak shifts displayed in Fig 66
For Au the energy will be rapidly (in a few hundred femtoseconds [211-213]
) distributed
after optical excitation over the full 200 nm film thickness Rarefaction waves are
launched at both film surfaces and start to propagate into the bulk of the film As a
consequence the diffraction peaks start to shift to smaller diffraction angles indicating
expansion of the material After a time determined by the film thickness and the speed
of sound of the considered material the fronts of the strain waves traveling in the
sample arrive at the opposite surface For a free surface the strain waves are totally
reflected with a change of sign Such recompression of the material is indicated by the
diffraction peaks shifting back to larger diffraction angles without obvious damping
effect As already discussed in Chapter 4 the ldquotriangularrdquo shape of the time-traces
results from a very fast and homogeneous (over the whole film thickness) increase of
pressure in the sample upon optical excitation [140 186]
The temporal position of the
maxima and minima of the time traces in Fig 66 (a) and (b) are determined by the
transit time of longitudinal acoustic waves through the film For both diffraction
orders oscillations with a half period of about (67 plusmn 1) ps are observed Using the
known sound velocity for polycrystalline Au of vs = 324 kms [271]
this transit time
6 Towards time-resolved Debye-Scherrer X-ray diffraction
109
corresponds to a film thickness of 217 nm which agrees within specifications (+-
10) of the manufacturer with the nominal thickness of 200 nm
(a)
(b)
Fig 66 Relative transient shift of the peak positions for the diffraction
rings (311) (a) and (220) (b) after laser excitation (blue squares) The
red circle points give the peak positions for non-excited sample The
black curves are guides for eye
6 Towards time-resolved Debye-Scherrer X-ray diffraction
110
633 Modeling the transient behavior of the diffraction
pattern after laser excitation
Fig 67 Debye-Scherrer Ewald-sphere construction without strain
(solid circles) and with uniaxial strain (dashed circle)
In polycrystalline samples the crystallites are randomly oriented When the X-
ray beam passes through the sample only the crystallites with a plane orientation
which fulfills the Bragg condition diffract X-rays The diffraction contributions from
all these crystallites form the Debye-Scherrer-diffraction pattern When the sample is
excited by the laser pulse with the condition that the illuminated area of laser is much
larger than the samplersquos absorption depth the sample expands only along the surface
normal resulting in uniaxial strain To understand the changes of the Debye-Scherrer
pattern under uniaxial strain I use a Ewald-sphere-construction [272]
as displayed in
Fig 67
The black and blue solid circles are used to describe the situation in an
6 Towards time-resolved Debye-Scherrer X-ray diffraction
111
unstrained polycrystalline film The black circle represents the Ewald-sphere Its
radius corresponds to the length of the wave vector of the incident X-rays Since we
are considering elastic scattering the incoming wave-vector ink as well as all possible
wave vectors of diffracted waves have to lie on this sphere The difference in direction
is given by the reciprocal lattice vector hklG For a single crystalline sample hklG
points only to one particular direction For a polycrystalline sample all directions of
hklG are possible This is illustrated by the blue circle which has a radius
corresponding to the length of hklG In two dimensions the two points of intersection
mark the positions where the Bragg-condition is fulfilled Extending this to three
dimensions by rotation around ink will transform the two points to a diffraction ring
When the film is uniaxially strainedexpanded the length and direction of hklG
depends on the orientation of the individual crystallite with respect to the surface
normal and the circle (with direction-independent radius) transforms into an ellipse
which is represented in Fig 67 by the blue dashed line Its shorter axis corresponds to
the direction of strainexpansion (larger lattice constant - smaller length of hklG ) Now
the intersection of the ellipse with the Ewald-sphere defines the diffraction direction
for the strainedexpanded sample As a result the diffraction rings should decrease
their radius
According to these considerations a simple geometrical calculation allows to
determine for a given strain what shifts will be induced for different Bragg peaks and
these estimations can be compared to the experimental data Choosing the center of
the Ewald-sphere as coordinate origin the black and the blue circle as well as the blue
ellipse can be expressed as follows
222 kyx (1)
222Gykx (2)
11
2
2
22
2
G
y
G
kx
(3)
6 Towards time-resolved Debye-Scherrer X-ray diffraction
112
Where η is the uniaxial strain caused by laser excitation defined as dd (d
is lattice constant) Let (x1y1) be the intersection point of the black and blue circles
(unstrained case) In the strained case the intersection point of black circle and blue
ellipse change to xxx 12 yyy 12 Substituting 1x 1y 2x 2y and G from Eq
(1) and Eq (2) in Eq (3) and applying a first order approximation
[ 2112
02 x 02 y ] one obtains
02222
yykxxkx (4)
Then substituting coskx sinky sinkx cosky in
Eq (4) one obtains the relationship between andη (and )
sin
1cos2
(5)
Fig 68 shows some results calculated using Eq (5) The angular shift
increases with strain η for a given diffraction order and for a given strain η it is larger
for higher diffraction orders
Fig 68 Estimation of the shift of diffraction rings and comparison to
measured data
6 Towards time-resolved Debye-Scherrer X-ray diffraction
113
634 Discussion for the experimental results
Following the above discussion the laser induced strain in the Au sample can be
deduced from the angular shift of the diffraction peaks observed in the time-resolved
experiment The measured peak shifts are (- 0152 plusmn 0013) ordm and (- 0103 plusmn 0010) ordm
for the (311)- and (220)-reflection respectively Using equation (5) a strain of
η(311) = (42 plusmn 04) times10-3
and η(220)= (50 plusmn 05) times10-3
is derived These two values
agree within the error bars and can be used to estimate the sample temperature For
this we use the average value ηavgasymp (46 plusmn 05) times10-3
Since the lateral dimensions of
the excited area (04 mm) are much larger than the film thickness on the time scale of
a few hundred picoseconds expansion of the film can only occur along the surface
normal Under these conditions the relation between the peak strain and the laser-
induced temperature increase is given by the following equation [223]
Tv
B
S
2
6 (6)
where B β ρ vs are the bulk modulus (B = 180 GPa) the coefficient of linear
thermal expansion (β = 142 μmbullm-1
bullK-1
) the density (ρ = 193 gbullcm-1
) and the speed
of sound (vs = 324 kms) respectively Equation (6) yields = (61 plusmn 7) K This
result is in rough agreement with the temperature increase (= (80 plusmn 11) K)
estimated from the deposited energy in the sample for the given excitation fluence
The Debye-Waller effect (see in Chapter 4) induced by this increase of
temperature should lead to a 42 and 31 decrease in the integrated diffraction
signal of the (311)- and (220)-reflection respectively However due to the low
diffraction signals (approx 3 detected photons per second for the (311)-reflection
less for the (220)-reflection) these changes could not be detected in the experiment
since they are of the same order (eg for (311)-reflection) or smaller (eg for (220)-
reflection) than the experimental errors which are mainly determined by counting
statistics
6 Towards time-resolved Debye-Scherrer X-ray diffraction
114
64 Summary
In this chapter the static Debye-Scherrer-diffraction pattern of a Cu foil (20 μm)
and an Au thin film (200 nm) have been presented The feasibility of performing a
time-resolved X-ray Debye-Scherrer measurement with the modular setup has also
been shown A preliminary time-resolved X-ray Debye-Scherrer measurement on a
thin Au film has been preformed The generation of acoustic waves due to rapid build-
up of pressure upon laser excitation and their propagation inside the film has been
followed by simultaneously measuring the transient shifts of the (311)- and (220)-
reflection as a function of pump-probe time delay The measured data are in good
agreement with the behavior expected from propagation of acoustic waves in a
200 nm Au free standing film A Ewald-sphere construction has been used to
determine the strain induced by laser
Finally I would like to comment on the better accuracy achieved in the reported
time-resolved powder diffraction experiment [106]
This is not related to properties of
the X-ray source and the setup which are in fact quite similar (eg X-ray flux of the
source) The essential point determining the different experimental accuracy is the
samples under investigation Comparing the thin film sample used here to the (organic)
powder sample used in Ref [106] the large penetration depth of pump beam in the
latter one (up to a few tens of microm) allows much thicker samples to be used in the
pump-probe experiments Moreover due to the large unit cell size (large lattice
constant small diffraction angles) and the use of a larger detector more diffractions
orders and larger fractions of the complete diffraction rings could be recorded with the
powder sample used in Ref [106] Only these sample properties provided diffraction
patterns with a better signal-to-noise ratio leading to a better experimental accuracy
in the powder diffraction experiment
7 Summary and outlook
115
7 Summary and outlook
71 Summary
This thesis describes my work on optimizing a femtosecond laser plasma Kα X-
ray source improving an existing modular setup for time-resolved X-ray diffraction
experiments and several studies on ultrafast lattice dynamics in thin laser-excited
metal films
In the second chapter the principles of ultrafast laser-plasma based X-ray
sources are presented A systematic investigation of optimizing the Kα X-ray source
for time-resolved X-ray diffraction experiments was performed The Cu and Ti Kα
yield were studied as a function of different laser intensities different angles of
incidence and different controlled pre-pulsepre-plasma conditions The optimized
conditions for both materials were determined Introducing a controlled pre-pulse at
an appropriate time in advance of the main pulse the Kα yield can be enhanced to the
same value no matter what angle of incidence is used This result is valid for both
materials under investigation Due to the same required on-target intensity for the
same Kα emission better energy conversion efficiency is found at a small angle of
incidence with a matching controlled pre-pulse These experimental results agree well
with estimations based on the classical resonance absorption mechanism and detailed
Particle in Cell (PIC) simulations
The third chapter describes the used modular setup for time-resolved X-ray
diffraction and the implemented improvements Applying the results discussed in the
second chapter the X-ray production has been improved Two normalization
methods are compared and discussed The combination of direct normalization and
7 Summary and outlook
116
a ldquofastrdquo delay scanning scheme represents the most efficient way to achieve high
measurement accuracy
By using the optimized setup presented in Chapter 3 the Debye-Waller effect in a
thin laser-excited Au film was observed The experimental results are presented in
chapter 4 For high excitation fluences an exponential drop of the measured
diffraction signal with a decay time constant of 43 ps is measured This result is in
good agreement with previous experimental results as well as the Two-Temperature
Model (TTM) calculations at high fluences As the first time-revolved experiment
performed with the improved modular setup these observations also underline the
capabilities as well as the restrictions of the modular setup
The fifth chapter focuses on investigating coherent optical phonons in Bi after
intense laser-excitation Large amplitude coherent motion of atoms and a softening of
the A1g phonon mode were observed At lower fluences the measured results agree
perfectly with earlier results obtained at the Sub-Picosecond Pulse Source (SPPS) and
University Duisburg-Essen (UDE) Upon strong excitation (absorbed laser fluences gt
2 mJcm2) a further softening of the A1g mode is observed At fluences between 31
and 33 mJcm2 a complete softening of the A1g mode is found This observation
strongly indicates that the Peierls distortion which defines the equilibrium structure
of Bi vanishes and the material is transformed into a transient ordered state of higher
symmetry At even stronger excitation (absorbed laser fluences gt 33 mJcm2) the
atomic motion becomes a Brillouin-zone boundary acoustic phonon mode and this
mode stiffens The observations follow qualitatively the predictions of calculations
based on density functional theory
The sixth chapter is dedicated to time-resolved X-ray Debye-Scherrer diffraction
measurements The presentation of static Debye-Scherrer diffraction pattern of Cu
(20 μm) and Au (200 nm) showed the feasibility of performing time-resolved X-ray
Debye-Scherrer diffraction experiments with the modular setup In the time-resolved
measurements on a Au thin film the generation of acoustic waves and their
propagation inside the film had been observed through the transient shifts of the
(311)- and (220)-reflection The temporal evolution of the measured data is in good
7 Summary and outlook
117
agreement with the behavior expected from propagation of acoustic waves inside the
200 nm free standing film A simple model based on a Ewald-sphere construction has
been used to determine the laser-induced uniaxial strain from the measured time-
resolved Debye-Scherrer patterns
72 Outlook
As it has been underlined in this thesis the modular setup using the laser-plasma-
based X-ray source is still of great interest for performing time-resolved X-ray
diffraction experiments due to its availability and low cost (in comparison to
accelerator-based sources) The following technical developments can be done to
improve the performance of the modular setup and open possibilities for new types of
experiments
1) The conditions to optimize the X-ray output have been discussed in detail in
this thesis Redesign of the source chamber allowing a smaller angle of incidence of
the drive laser for the X-ray source could be an option to fulfill the optimized
condition with less energy requirements to the laser system
2) Improving the overall stability is another important issue for the source This
requires improvement of the stability of the laser system as well as the mechanical
parts of the tape target pulling system
3) An automatic optimizationstabilization of the X-ray output behind the
multilayer optic during experiments can be realized by an automatic adjustment of the
position of the X-ray source point on the tape target through motorized actuators To
carry out this function the manual actuators of several mirrors in the setup should be
replaced by motorized actuators and a control program should be developed and
integrated into the main experiment control program
4) The current sample holder with manual adjustments should be replaced with a
motorized one It should definitely improve the accuracy of the adjustment and also
save time Additionally this would allow to perform irreversible time-resolved X-ray
diffraction experiments eg on laser-induced melting with the modular setup
7 Summary and outlook
118
5) The results of the time-resolved X-ray Debye-Scherrer diffraction
measurements presented in this thesis successfully proved the possibility of
performing Debye-Scherrer type measurements with the laser plasma X-ray source
As single crystalline samples are not required in this scheme a much wider range of
materials which are not easily available as single crystals can be studied now In
order to further improve the experimental accuracy (which directly relates to the
number of detected photons) for this type of experiments a new camera with large
detection area [273]
has been implemented in the setup and tested by F Quirin Once
suitable samples with sufficient diffraction signal are obtained further investigations
could be made with this setup
Since the electronic properties of the material are strongly affected by lattice
structure the laser-induced reversal of the Peierls distortion in Bi should lead to
corresponding changes in its electronic band structure resulting in a semimetal to
metal phase transition Investigation of this phase transition process can be one of the
most interesting subjects for Bi To study the electronic dynamics it requires
techniques which are sensitive to the electronic structure eg time-resolved X-ray
absorption spectroscopy (t-XAS) [274-276]
time-resolved angle-resolved photoelectron
spectroscopy (t-APRES) [277]
and time-resolved THz spectroscopy [278-280]
Another interesting topic on Bi is to observe the coherent Eg motion with X-ray
diffraction The excitation of the Eg mode has been demonstrated in many ultrafast
optical experiments [247 281]
which do not provide direct quantitative information on
the vibrational dynamics These dynamics can be retrieved directly with X-rays and
provide quantitative information about the amplitude of the Eg motion as well as the
coupling behavior between A1g modes and Eg modes Up to now only one study on
this topic has been performed at the Swiss Light Source (SLS) [282]
To completely
understand the displacive excitation of coherent phonons (DECP) mechanism and the
subsequent phonon dynamics more knowledge on the Eg motion is required The
extension of this study should be continued
In recent years sub-picosecond time-resolved X-ray diffuse scattering technique
became available This technique gives information on the phonon population
7 Summary and outlook
119
throughout the Brillouin zone and can yield the phonon dispersion [283]
Applying this
technique to investigate the phonon softening behavior in Bi must be an interesting
subject in the near future However this technique requires large photon flux and is
not possible to be carried out with the current laser plasma sources due to their low X-
ray output The appropriate X-Ray Sources are the new X-ray free electron lasers like
LCLS (USA) SACLA (Japan) or the later XFEL (Germany)
Appendixes
120
Appendixes
A Working principle of multilayer mirror
A multilayer optic is an artificial two dimensional crystal The spacing of the
multilayers is designed for specific radiation to satisfy Braggrsquos diffraction law As
shown in Fig A1 the incident X-rays are reflected by diffraction at a series of
interfaces between layers with differing indices of refraction Only the wavelength of
interest is effectively reflected others which do not satisfy the conditions for Bragg
reflection are absorbed in the mirror and are not reflected thus allowing the mirror to
produce a highly monochromatic beam
Fig A1 Multilayer working principle Reprint from the
manufacturer [284]
The focusing multilayer mirrors are realized by curving the mirror surfaces into
either parabolic or elliptical shapes The d-spacing (thickness of a single bi-layer) of
the multilayer coating is controlled along the mirror surface to satisfy Braggrsquos law at
every point (Fig A2) The band-pass of a multilayer optical system can be further
controlled by using different materials and layer configurations for various
applications
The multilayer X-ray optic used in the X-ray modular setup is twondashdimensional
reflection systems which is realized by using two VariMaxTM
multilayer X-ray
Appendixes
121
mirrors in a ldquoside-by-siderdquo Montel-Helios scheme (Fig A3) [188]
These two mirrors
are placed perpendicularly Each mirror independently reflects x-rays in one of the
two perpendicular directions With the ldquoside-by-siderdquo scheme both mirrors may be
positioned at a location appropriate to optimize performance parameters including
flux spectrum and divergence by adjusting four motorized actuators on the housing
Once the mirrors are adjusted the exact position of the X-ray point source and the
focus are defined
Fig A2 Graded d-Spacing Multilayer for focusing Reprint from the
manufacturer [284]
Fig A3 Scheme of the Montel-Helios configuration Reprint from
the manufacturer [284]
The multilayer X-ray optic prepared for the modular setup is produced by
Rigaku-OSMIC Inc The Specifications provided by the manufacturer are shown in
table A1
Appendixes
122
Parameters (units) CMF10-50Cu12
Characteristic line Cu Kα
Wavelength (Aring) 154
Effective focal spot size (mm) 001
Length of the mirror (mm) 120
Focal spot ndash mirror distance (mm) 100
Focal spot ndash sample distance (mm) 600
Bragg angle in the middle point (degree) 097
Reflectivity Kα (parts) 084
Rocking curve width (arcmin) 198
Capture angle (rad)
(degree)
00264
15133
Convergence angle (rad)
(degree)
00043
024
Focal spot usage efficiency (parts) 096
Beam width at mirror (mm) 264
Beam width at the optic entrance (mm) 106
Beam width at the optic exit (mm) 187
Beam width at the focus (mm) 0094
Optic efficiency (a u)
(Reflectivity Solid angle)
000045
Geometric magnification 15
Ravgsup2 (for double reflection) () 75
Distance X-ray sourcendashentrance of housing (mm) 30
Table A1 Specifications of the Cu Kα multilayer optic provided by
the manufacturer Rigaku-OSMIC Inc Reprint from Ref [186]
B X-ray detectors for diffracted signals
B 1 Direct detection camera
The Roper Scientific Pi-MTE 1300B from Princeton Instruments is an
innovative high-sensitivity imaging system designed to operate inside high-vacuum
chambers over long operation times The Pi-MTE 1300B incorporates a back-
illuminated CCD without AR coating for ultra-low-energy X-ray detection With
20times20 μm pixels and 100 fill factor this system offers a large imaging area with
very high spatial resolution and dynamic range The thermoelectrically cooled design
features PCBs thermally linked to the circulating coolant to provide reliable operation
inside vacuum chambers Its detail specifications are given in Table B1 This camera
is suitable for monitoring hard X-ray radiation due to its good quantum efficiency eg
55 for Ti Kα and 18 for Cu Kα (Fig B1)
As a direct detection camera the incidence photons are directly absorbed by the
active area of CCD pixels and generate charge signals The charge signals are strictly
Appendixes
123
proportional to the incident phonon energy For example the camera used here have
conversions that one Ti Kα (451 keV) photon gives a signal of ~589 counts and one
Cu Kα photon (805 keV) gives a signal of ~1050 counts In high flux condition (gt104
detected photons per pulse) the detected photon number can be easily deduced from
the value of integral signal (see in section 31) In low flux regime (for example 1
detected photon per 40 pixels) this camera can also be used as a multi-channel energy
detector A histogram of the CCD image corresponding to the energy spectrum can be
obtained [142]
and the number of detected photons can easily be deduced from this
histogram This function has been applied in the measurement of X-ray source
production in Chapter 2 Here one should notice that when the histogram is used to
calculate the detected photon number the multi- pixel event issue should be taken into
account
Table B1 Specifications of Roper camera Reprint from the
technical datasheet [285]
Appendixes
124
Fig B1 Quantum efficiency of Roper camera Reprint from the
technical datasheet [285]
Two major limitations of operating this camera should be pointed out The first
one is its working condition During the acquisition of a picture the charged coupled
device (CCD) will accumulate not only the signal from detected photons but also the
signal due to the dark current The dark current depends strongly on the temperature
on the detector Cooling down the detector is the typical way to reduce it In the
experiment the working temperature of the camera is -30deg C which is realized by an
integrated Peltier cooler under the chip Due to this low temperature to protect the
CCD from ice formation on the cooled parts the CCD chip should maintain under
vacuum It can be easily achieve in a big vacuum chamber for example in the
experiment of Chapter 2 For the modular setup the device needs to be operated in air
Additional configuration for keeping the vacuum inside the camera has been made A
special vacuum nose which isolates only the CCD has been installed into the camera
The nose needs to be continuously pumped to insure the required vacuum An Al
plate with a hole of approximately 1 cm2 covered by Beryllium window is installed at
Appendixes
125
the input of the camera which leads to only 14 of CCD size is available for the
exposure The second drawback of this detector is its rather slow readout time For
full size chip information it needs 17 seconds to read out the data The readout time
can be reduced for small regions of interest but it still remains more than 100 ms and
because of this the Roper camera can not be used with a 10 Hz repetition mode to
record each single X-ray pulse
B 2 Indirect detection camera
Pixel Resolution 1392times1040 (43 aspect ratio)
Effective pixel size at input 23 microns square
Active input size 32times24 mm (40mm diagonal)
Intensifier Ultra high-resolution (typically gt 60lpmm) low noise
Intensifier format 40mm diameter
Intensifier input window Coherent fiber optic
Gating Gated on when CCD is integrating off when not
acquiring
Gating speed Minimum gate period approx 100ns
Coupling to scintillators Via coherent straight fiber-optic
Scintillator material Gadolinium Oxysulphide 75mgcm2
Grey Scale Resolution 4096 grey levels (12bits)
Readout speed 20 MHz or 10 MHz pixel rate software selectable
Linearity No measurable deviation from linear response until
saturation
Saturation Approximately 13000 electrons
Video Gain User variable in software in 100 setups
Intensifier Gain User variable in software in 100 setups
On-chip binning User selectable 1times 1to 63 times 63
Exposure Time User selectable from 100μsec to 30 minutes
Readout Philosophy Correlated double sampling for highest accuracy fast 12
bit AD converter in head producing LVDS differential
format
Control PS Link 4 Line bi-directional Serial interface Using
LVDS drivers for reliability over long cables Parameters
that can be adjusted include image intensifier gain video
gain CCD integration period binning and sub-area
window
Power Requirements 110 or 230V ac 5060Hz
Operating Environment Temperature ndash Storage -10 to +80 degC
Operation 0 to +50 degC
Humidity ndash 0-80 RH non-condensing
Table B2 Specifications of Gemstar camera Reprint from the user
manual [273]
Appendixes
126
The Gemstar Camera from Photonic Science is an indirect detection camera Its
specifications are given in Table B2 The main feature of the indirect X-ray detection
is using a scintillator to transform the incoming signal into an optical signal which
can be easily detected and recorded This allows the quantum efficiency of certain
wavelengths like Cu Kα to be optimized by choosing an appropriate material The
scintillator inside this camera is made of a polycrystalline layer of Gadolinium
Oxysulphide which has a quantum efficiency of 85 for Cu Kα radiation When
incident photons are absorbed the scintillator emits photons in the visible range A
straight fiber-optic is used to couple them into the photocathode of the intensifier
These incoming photons produce photoelectrons from the photocathode The
produced electrons are sent through a multi channel plate (MCP) for a further step
amplification The amplification of MCP can be changed in the control software By
triggering the MCP by a camera trigger signal or an additional gate signal the
amplifying process can only be active for a short period during the presence of the X-
ray pulse therefore increasing the signal to noise ratio by reducing the background
signals This method could be very useful when multiple exposures of the Bragg
peaks are required After amplified by MCP the outcoming electrons hit on a
phosphor screen and produce phosphorescence whose intensity is proportional to the
number of incident electrons This light emitted from the screen is then collected by a
tapered fiber optic and sent onto a CCD sensor cooled by a peltier cooler which
allows images to be acquired with extended integration periods with minimal build-
up of CCD dark current This whole process allows the camera to work with a
repetition rate of 10 Hz when the On-Chip binning is set to large than 4times2 binning or
a small region of interest is selected This camera can record a sequence of pictures
containing every single X-ray pulse per picture
A major limitation of this camera is that it can not provide any information about
the energy of the incoming X-ray photons due to several conversion processes and
unlike a direct detection camera it can not be used for obtaining the energy spectrum
from a histogram of the image This type of camera is useful when the incoming
Appendixes
127
photons are monochromatic In this case the average signal from the chip can be
correlated with the average number of incoming photons
B 3 Avalanche Photodiode (APD)
Table B3 Specifications of APD Reprint from the technical
datasheet [286]
The avalanche photodiode is essentially a solid-state equivalent of PMTs
(photon-multiplier tubes) and can replace vacuum tube technology with compact
rugged silicon devices in many applications It is one of options for monitoring
diffracted X-ray signal if only the integrated signal is interesting A cooled large area
silicon avalanche photodiode produced by Laser Components which is assembled
with a homemade amplifier circuit is used for the modular setup Its specifications
and spectral response at visible light range are given in Table B3 and Fig B2
respectively
CHARACTERISTIC TEST
CONDITIONS
MIN TYP MAX UNIT
S
TO (Operating Temperature) +1 +40 degC
TS (Soldering Temperature) +240 deg C
VTEC (TEC Voltage) 43 V
ITEC (TEC Current) 2 A
P (APD Die Power Diss) 02 W
ID (Dark Current) 15 35 nA
CJ (Junction Capacitance) f = 1MHz 50 pF
λrange (Spectral Application Range) Spot Scan 350 1050 nm
R (Responsivity) λ=500nm VR=0V 35 AW
Vop (Operating Voltage) 1700 2000 V
tr (Response Time) RL=50Ωλ=675nm 12 18 nS
IQTEC (TEC Quiescent Current) Case Temp = 35degC 095 A
Appendixes
128
Fig B2 spectral response of APD at Gain = 300 Reprint from the
technical datasheet [286]
One of the advantages of this detector is that it can work at very high speed fast
enough to synchronize to the 10 Hz laser system Another advantage of APD is that it
has single photon sensitivity which allow to detecting weak signal and estimating the
number of detected photons However as a single channel detector the obvious
drawback of APD is that it gives no information on spatial resolution Shifts or
changes of profile of the Bragg peaks can not be observed with this detector during
the measurement It limits the use of the APD only in the experiments in which the
profiles of Bragg peaks do not change a lot during the laser excitation
C Sample material properties
The following relevant material parameters are used in this thesis They are
obtained from literatures WebElements (httpwwwwebelementscom) X-RAY
SERVER (httpsergeygmcaapsanlgovx0h_searchhtml) and X-ray Oriented
Programs (XOP) (httpwwwesrfeucomputingscientificxop21)
C 1 Cu
Name copper
Appendixes
129
Symbol Cu
Number 29
Standard atomic weight 63546
Electron configuration [Ar] 3d10
4s1
Electrons per shell 2 8 18 1
Density 894 gmiddotcmminus3
Crystal structure face-centered cubic
Melting point 1358 K
Specific heat capacity (25 degC) 24440 Jmiddotmolminus1
middotKminus1
Bulk modulus 140 GPa
Kα1 804778 eV λ = 154060410 Aring
Kα2 802783 eV λ = 154443266 Aring
Kβ 890529 eV λ = 139225593 Aring
Sample thickness 10microm 20 microm foil and 300nm thin film on glass substrate
C 2 Ti
Name titanium
Symbol Ti
Number 22
Standard atomic weight 47867
Electron configuration [Ar] 3d2 4s
2
Electrons per shell 2 8 10 2
Density 4506 gmiddotcmminus3
Crystal structure hexagonal
Melting point 1941 K
Specific heat capacity (25 degC) 25060 Jmiddotmolminus1
middotKminus1
Bulk modulus 110 GPa
Kα1 451084 eV λ = 274858848 Aring
Kα2 450486 eV λ = 275223711 Aring
Kβ 493181 eV λ = 251397415 Aring
Sample thickness 20 microm foil and 300nm thin film on glass substrate
C 3 Au
Name gold
Symbol Au
Number 79
Standard atomic weight 196966569
Electron configuration [Xe] 4f14
5d10
6s1
Electrons per shell 2 8 18 32 18 1
Density 1930 gmiddotcmminus3
Appendixes
130
Melting point 133733 K
Specific heat capacity (25 degC) 25418 Jmiddotmolminus1
middotKminus1
Speed of sound 324 kms (polycrystalline)
339 kms (single crystalline 111-direction)
Linear thermal expansion (25 degC) 142 micrommiddotmminus1
middotKminus1
Thermal conductivity (300 K) 318 Wmiddotmminus1
middotKminus1
Optical constants n=0181 k=5125 800 nm
Fig C1 Reflectivity of Gold at 800nm calculated from Fresnel
equations
Sample thickness 150nm on mica substrate and 200nm free standing film
Crystal structure Lattice face centered cubic
Symmetry group Cubic
Unit cell constant a = b = c = 40782 Aring
Unit cell angles α = β = γ = 90deg
X-ray wavelength 1540562 Aring
X-ray energy 8047984 keV
X-ray characteristic line Cu-K α1
Surface plane indices (1 1 1)
Appendixes
131
Fig C2 Bragg reflection of Au (333) calculated from XOP (a) P-
polarized beam and (b) S-polarized beam
Appendixes
132
Planes found 9 Planes being displayed 9
hkl Angle to surface Bragg angle Relative Intensity
xhx0()
(1 1 1) 00049 190956 824245
(1 1 3) 294962 387877 626630
(1 3 1) 294962 387877 626630
(1 3 3) 220017 554164 526226
(2 2 2) 00049 408660 610997
(3 1 1) 294962 387877 626630
(3 1 3) 220017 554164 526226
(3 3 1) 220017 554164 526226
(3 3 3) 00143 789431 460119
Table C1 Bragg angle data of Au obtained from X-RAY SERVER
C 4 Bi
Name bismuth
Symbol Bi
Number 83
Standard atomic weight 20898040
Electron configuration [Xe] 4f14
5d10
6s2 6p
3
Electrons per shell 2 8 18 32 18 5
Electrical Conductivity 867 times 105 Ωm
minus1
Density 978 gmiddotcmminus3
Melting point 5447 K
Specific heat capacity (25 degC) 2552 Jmiddotmolminus1
middotKminus1
Linear thermal expansion (25 degC) 134 micrommiddotmminus1
middotKminus1
Thermal conductivity (300 K) 797 Wmiddotmminus1
middotKminus1
Optical constants n= 28324 k= 45191 800 nm
Appendixes
133
Fig C3 Reflectivity of Bismuth at 800nm calculated from Fresnel
equations
Sample thickness 50nm on Si wafer
Crystal structure Bismuth-fcc
Symmetry group Trigonal (Rhombohedral distortion)
Unit cell constant a = b = c = 65720 Aring
Unit cell angles α = β = γ = 87570 deg
X-ray wavelength 1540562 Aring
X-ray energy 8047984 keV
X-ray characteristic line Cu-K α1
Surface plane indices (1 1 1)
Planes found 9 Planes being displayed 9
hkl Angle to surface Bragg angle Relative Intensity
xhx0()
(1 1 1) 00035 112396 682238
(1 1 3) 310515 222835 575184
(1 3 1) 310515 222835 575184
(1 3 3) 232706 296742 511918
Appendixes
134
(2 2 2) 00035 229435 695383
(3 1 1) 310515 222835 575184
(3 1 3) 232706 296742 511918
(3 3 1) 232706 296742 511918
(3 3 3) 00163 357843 462169
Table C2 Bragg angle data of Bi obtained from X-RAY SERVER
Appendixes
135
Fig C4 Bragg reflection of Bi (111) and (222) calculated from XOP
(a) and (c) P-polarized beam (b) and (d) S-polarized beam
Bibliography
136
Bibliography
[1] W C Roumlntgen ldquoOn a new kind of Rayrdquo Nature 53 274-277 (1896) translated
by A Stanton from W C Roumlntgen ldquoUumlber eine neue Art von Strahlenrdquo Sitz
ber an die med-phys Gesellschaft Wuumlrzburg (1895)
[2] C Davisson and L H Germer ldquoThe Scattering of Electrons by a Single Crystal
of Nickelrdquo Nature 119 558 (1927)
[3] G P Thomson and A Reid ldquoDiffraction of Cathode Rays by a Thin Filmrdquo
Nature 119 890 (1927)
[4] C G Shull ldquoEarly development of neutron scatteringrdquo Rev Mod Phys 67 753
(1995)
[5] D Strickland and G Mourou ldquoCompression of Amplified Chirped Optical
Pulsesrdquo Optics Communications 55 447 (1985)
[6] D Strickland and G Mourou ldquoCompression of Amplified Chirped Optical
Pulses rdquo Optics Communications 56 219 (1985)
[7] D Kuumlhlke U Herpes D von der Linde ldquoSoft x-ray emission from subpicosend
laser-produced plasmardquo Appl Phys Lett 50 1785 (1987)
[8] M M Murnane H C Kapteyn M D Rosen R W Falcone ldquoUltrafast X-ray
Pulses from Laser-Produced Plasmasrdquo Science 251 531 (1991)
[9] A Rousse P Audebert J P Geindre F Fall and J C Gauthier ldquoEfficient Kα
X-ray source from femtosecond laser-produced plasmasrdquo Phys Rev E 50 2200
(1994)
[10] J C Williamson J Cao H Ihee H Frey and A H Zewail ldquoClocking transient
chemical changes by ultrafast electron diffractionrdquo Nature 386 159 (1997)
[11] CY Ruan V A Lobastov R Srinivasan B M Goodson H Ihee and A H
Zewail ldquoUltrafast diffraction and structural dynamics The nature of complex
molecules far from equilibriumrdquo Proc National Acad Sci USA 98 7117
(2001)
[12] B J Siwick J R Dwyer R E Jordan and R J D Miller ldquoUltrafast electron
optics Propagation dynamics of femtosecond electron packetsrdquo J Appl Phys
92 1643 (2002)
[13] B J Siwick J R Dwyer R E Jordan and R J Dwayne Miller ldquoAn Atomic-
Level View of Melting Using Femtosecond Electron Diffractionrdquo Science 302
1382 (2003)
[14] R W Schoenlein S Chattopadhyay H H W Chong T E Glover P A
Heimann C V Shank A A Zholents and M S Zolotorev ldquoGeneration of
Femtosecond Pulses of Synchrotron Radiationrdquo Science 287 2237 (2000)
[15] S Khan K Holldack T Kachel R Mitzner and T Quast ldquoFemtosecond
Undulator Radiation from Sliced Electron Bunchesrdquo Phys Rev Lett 97
074801 (2006)
Bibliography
137
[16] G Ingold P Beaud S L Johnson D Grolimund V Schlott T Schmidt and A
Streun ldquoTechnical Report FEMTO A Sub-ps Tunable Hard X-ray Undulator
Source for LaserX-ray Pump-Probe Experiments at the SLSrdquo Sync Rad News
20 Issue 5 35 (2007)
[17] A L Cavalieri et al ldquoClocking Femtosecond X Raysrdquo Phys Rev Lett 94
114801 (2005)
[18] A M Lindenberg et al ldquoAtomic scale visualization of inertial dynamicsrdquo
Science 308 392 (2005)
[19] A Egbert B N Chichkov and A Ostendorf ldquoUltrashort X-ray source driven by
femtosecond laser pulsesrdquo Europhys Lett 56 228 (2001)
[20] A Egbert B Mader B Tkachenko C Fallnich B N Chichkov H Stiel and P
V Nickles ldquoHigh-repetition rate femtosecond laser-driven hard-x-ray sourcerdquo
Appl Phys Lett 81 2328 (2002)
[21] U Hinze A Egbert B Chichkov and K Eidmann ldquoGeneration of picosecond
hard-x-ray pulses in a femtosecond-laser-driven x-ray dioderdquo Optics Letters 29
2079 (2004)
[22] E Seres J Seres F Krausz C Spielmann ldquoGeneration of Coherent Soft-X-Ray
Radiation Extending Far Beyond the Titanium L Edgerdquo Phys Rev Lett 92
163002 (2004)
[23] J Seres E Seres A J Verhoef G Tempea C Streli P Wobrauschek V
Yakovlev A Scrinzi C Spielmann and F Krausz ldquoLaser technology Source
of coherent kiloelectronvolt X-raysrdquo Nature 433 596 (2005)
[24] Ch Spielmann N H Burnett S Sartania R Koppitsch M Schnuumlrer C Kan
M Lenzner P Wobrauschek F Krausz ldquoGeneration of Coherent X-rays in the
Water Window Using 5-Femtosecond Laser Pulsesrdquo Science 278 661 (1997)
[25] J Zhou J Peatross M M Murnane and H C Kapteyn ldquoEnhanced High-
Harmonic Generation Using 25 fs Laser Pulsesrdquo Phys Rev Lett 76 752
(1996)
[26] A Rousse K Ta Phuoc R Shah A Pukhov E Lefebvre V Malka S Kiselev
F Burgy J P Rousseau D Umstadter and D Hulin ldquoProduction of a keV X-
Ray Beam from Synchrotron Radiation in Relativistic Laser-Plasma
Interactionrdquo Phys Rev Lett 93 135005 (2004)
[27] V Malka J Faure Y A Gauduel E Lefebvre A Rousse and K Ta Phuoc
ldquoPrinciples and applications of compact laserndashplasma acceleratorsrdquo Nature
Physics 4 447 (2008)
[28] H-P Schlenvoigt K Haupt A Debus F Budde O Jaumlckel S Pfotenhauer H
Schwoerer E Rohwer J G Gallacher E Brunetti R P Shanks S M
Wiggins and D A Jaroszynski ldquoA compact synchrotron radiation source driven
by a laser-plasma wakefield acceleratorrdquo Nature Physics 4 130 (2008)
[29] K Nakajima ldquoCompact X-ray sources Towards a table-top free-electron laserrdquo
Nature Physics 4 92 (2008)
Bibliography
138
[30] httpwww-ssrlslacstanfordedulclsindexhtml
[31] T Ishikawa et al ldquoA compact X-ray free-electron laser emitting in the sub-
aringngstroumlm regionrdquo Nature Photon 6 540 (2012)
[32] httpwwwxfeleuXFELpresseenhintergrundwasindexhtml
[33] M Altarelli et al The European X-ray Free-electron Laser (DESY Technical
Report Hamburg Germany)
[34] S Kneip C McGuffey F Dollar M S Bloom V Chvykov G Kalintchenko
K Krushelnick A Maksimchuk S P D Mangles T Matsuoka Z Najmudin
C A J Palmer J Schreiber W Schumaker A G R Thomas and V
Yanovsky ldquoX-ray phase contrast imaging of biological specimens with
femtosecond pulses of betatron radiation from a compact laser plasma wakefield
acceleratorrdquo Appl Phys Lett 99 093701 (2011)
[35] K Ta Phuoc S CordeC Thaury V Malka A Tafzi J P GoddetR C Shah
S Sebban A Rousse ldquoAll-optical Compton gamma-ray sourcerdquo Nature
Photonics 6 308 (2012)
[36] J Ju K Svensson A Doumlpp H E Ferrari K Cassou O Neveu G Genoud F
Wojda M Burza A Persson O Lundh C-G Wahlstroumlm and B Cros
ldquoEnhancement of x-rays generated by a guided laser wakefield accelerator
inside capillary tubesrdquo Appl Phys Lett 100 191106 (2012)
[37] M Schnell A Saumlvert B Landgraf M Reuter M Nicolai O Jaumlckel C Peth T
Thiele O Jansen A Pukhov O Willi M C Kaluza and C Spielmann
ldquoBetatron radiation based measurement of the electron-beam size in a wakefield
acceleratorrdquo AIP Conf Proc 1462 231 (2011)
[38] S Corde C Thaury K Ta Phuoc A Lifschitz G Lambert J Faure O Lundh
E Benveniste A Ben-Ismail L Arantchuk A Marciniak A Stordeur P
Brijesh A Rousse A Specka and V Malka ldquoMapping the X-Ray Emission
Region in a Laser-Plasma Acceleratorrdquo Phys Rev Lett 107 215004 (2011)
[39] C Rischel A Rousse I Uschmann P A Albouy J P Geindre P Audebert J
C Gauthier E Foumlrster J L Martin and A Antonetti ldquoFemtosecond time-
resolved X-ray diffraction from laser heated organic filmsrdquo Nature 390 490
(1997)
[40] T Pfeifer C Spielmann and G Gerber ldquoFemtosecond X-ray sciencerdquo Rep
Prog Phys 96 443 (2006)
[41] M Bargheer N Zhavoronkon M Woerner and T Elsaesser ldquoRecent progress
in ultrafast X-ray diffractionrdquo Chem Phys Chem 7 783 (2006)
[42] C Rose-Petruck R Jimenez T Guo A Cavalleri C W Siders F Rksi J A
Squier B C Walker K R Wilson and C P J Barty ldquoPicosecondndash
milliaringngstroumlm lattice dynamics measured by ultrafast X-ray diffractionrdquo Nature
398 310 (1999)
Bibliography
139
[43] A H Chin R W Schoenlein T E Glover P Balling W P Leemans and C
V Shank ldquoUltrafast Structural Dynamics in InSb Probed by Time-Resolved X-
Ray Diffractionrdquo Phys Rev Lett 83 336 (1999)
[44] AM Lindenberg I Kang S L Johnson T Missalla P A Heimann Z Chang
JLarsson P H Bucksbaum H C Kapteyn H A Padmore R W Lee J S
Wark and R W Falcone ldquoTime-resolved X-ray diffraction from coherent
phonons during a laser-induced phase transitionrdquo Phys Rev Lett 84 111
(2000)
[45] A Cavalleri C W Siders F L H Brown D M Leitner C Toacuteth J A Squier
C P J Barty K R Wilson K Sokolowski-Tinten M Horn von Hoegen and
D von der Linde M Kammler ldquoAnharmonic Lattice Dynamics in Germanium
Measured with Ultrafast X-Ray Diffractionrdquo Phys Rev Lett 85 586 (2000)
[46] A Cavalleri C W Siders C Rose-Petruck R Jimenez C Toacuteth J A Squier C
PJ Barty K R Wilson K Sokolowski-Tinten M Horn-von Hoegen and D
von der Linde ldquoUltrafast x-ray measurement of laser heating in semiconductors
Parameters determining the melting thresholdrdquo Phys Rev B 63 193306 (2001)
[47] D A Reis M F DeCamp P H Bucksbaum R Clarke E Dufresne M
Hertlein R Merlin R Falcone H Kapteyn M M Murnane J Larsson Th
Missalla and J S Wark ldquoProbing impulsive strain propagation with X-Ray
pulsesrdquo Phys Rev Lett 86 3072 (2001)
[48] M F DeCamp D A Reis P H Bucksbaum B Adams J M Caraher R
Clarke C W S Conover E M Dufresne R Merlin V Stoica and J K
Wahlstrand ldquoCoherent control of pulsed X-ray beamsrdquo Nature 413 825 (2001)
[49] D von der Linde K Sokolowski-Tinten Ch Blome C Dietrich A Tarasevitch
A Cavalleri and J A Squier ldquoUltrafast extended to X-rays Femtosecond
time-resolved X-ray diffractionrdquo Z f Phys Chemie 215 1527 (2001)
[50] J Larsson A Allen P H Bucksbaum R W Falcone A Lindenberg G
Naylor T Missalla D A Reis K Scheidt A Sjoumlgren P Sondhauss M Wulff
and J SWark ldquoPicosecond X-ray diffraction studies of laser-excited acoustic
phonons in InSbrdquo Appl Phys A 75 467 (2002)
[51] O Synnergren M Harbst T Missalla J Larssona G Katona R Neutze and R
Wouts ldquoProjecting picosecond lattice dynamics through x-ray topographyrdquo
Appl Phys Lett 80 3727 (2002)
[52] A M Lindenberg I Kang S L Johnson R W Falcone P A Heimann Z
Chang R W Lee and J S Wark ldquoCoherent control of phonons probed by
time-resolved x-ray diffractionrdquo Opt Lett 27 869 (2002)
[53] M F DeCamp D A Reis A Cavalieri P H Bucksbaum R Clarke R Merlin
EM Dufresne D A Arms A M Lindenberg AG MacPhee Z Chang B
Bibliography
140
Lings J SWark and S Fahy ldquoTransient strain driven by a dense electron-hole
plasmardquo Phys Rev Lett 91 165502 (2003)
[54] M Bargheer N Zhavoronkov Y Gritsai J C Woo D S Kim M Woerner
and T Elsaesser ldquoCoherent atomic motions in a nanostructure studied by
femtosecond X-ray diffractionrdquo Science 306 1771 (2004)
[55] M F DeCamp D A Reis D M Fritz P H Bucksbaum E M Dufresneb and
Roy Clarke ldquoX-ray synchrotron studies of ultrafast crystalline dynamicsrdquo J
Synchrotron Rad 12 177 (2005)
[56] S H Lee A L Cavalieri D M Fritz M C Swan R S Hegde M Reason R
S Goldman and D A Reis ldquoGeneration and propagation of a picosecond
acoustic pulse at a buried interface Time-resolved X-ray diffraction
measurementsrdquo Phys Rev Lett 95 246104 (2005)
[57] Y Hayashi Y Tanaka T Kirimura N Tsukuda E Kuramoto and T Ishikawa
ldquoAcoustic pulse echoes probed with time-resolved X-ray triple-crystal
diffractometryrdquo Phys Rev Lett 96 115505 (2006)
[58] C V Korff Schmising M Bargheer M Kiel N Zhavoronkov MWoerner T
Elsaesser I Vrejoiu D Hesse and M Alexe ldquoStrain propagation in
nanolayered perovskites probed by ultrafast x-ray diffractionrdquo Phys Rev B 73
212202 (2006)
[59] A Morak T Kaumlmpfer I Uschmann A Luumlbcke E Foumlrster and R Sauerbrey
ldquoAcoustic phonons in InSb probed by time-resolved x-ray diffractionrdquo Phys
Stat Sol b 243 2728 (2006)
[60] H Enquist H Navirian T N Hansen A M Lindenberg P Sondhauss
OSynnergren J SWark and J Larsson ldquoLarge Acoustic Transients Induced
by Nonthermal Melting of InSbrdquo Phys Rev Lett 98 225502 (2007)
[61] M Nicoul U Shymanovich A Tarasevitch D von der Linde and K
Sokolowski-Tinten ldquoPicosecond acoustic response of a laser-heated Gold-film
studied with time-resolved X-ray diffractionrdquo Appl Phys Lett 98 191902
(2011)
[62] R Shayduk H Navirian W Leitenberger J Goldshteyn I Vrejoiu M
Weinelt P Gaal M Herzog C v Korff Schmising and M Bargheer
ldquoNanoscale heat transport studied by high-resolution time-resolved x-ray
diffractionrdquo New Journal of Physics 13 093032 (2011)
[63] M Herzog D Schick W Leitenberger R Shayduk R M van der Veen C J
Milne S L Johnson I Vrejoiu and M Bargheer ldquoTailoring interference and
nonlinear manipulation of femtosecond x-raysrdquo New Journal of Physics 14
013004 (2012)
[64] M Herzog D Schick P Gaal R Shayduk C v Korff Schmising M Bargheer
ldquoAnalysis of ultrafast X-ray diffraction data in a linear-chain model of the
lattice dynamicsrdquo Appl Phys A 106 489 (2012)
Bibliography
141
[65] M Herzog A Bojahr J Goldshteyn W Leitenberger I Vrejoiu D Khakhulin
M Wulff R Shayduk P Gaal and M Bargheer ldquoDetecting optically
synthesized quasi-monochromatic sub-terahertz phonon wavepackets by
ultrafast x-ray diffractionrdquo Appl Phys Lett 100 094101 (2012)
[66] C V Korff Schmising A Harpoeth N Zhavoronkov M Woerner T
Elsaesser M Bargheer M Schmidbauer I Vrejoiu D Hesse and M Alexe
ldquoFemtosecond X-ray diffraction from nanolayered oxidesrdquo Physics Procedia
3333 (2010)
[67] S L Johnson P Beaud E Vorobeva C J Milne EacuteD Murray S Fahy and G
Ingold ldquoNon-equilibrium phonon dynamics studied by grazing-incidence
femtosecond X-ray crystallographyrdquo Acta Cryst A 66 157 (2010)
[68] K Sokolowski-Tinten C Blome J Blums A Cavalleri C Dietrich A
Tarasevitch I Uschmann E Foumlrster M Kammler M Horn-von Hoegen and D
von der Linde ldquoFemtosecond X-ray measurement of coherent lattice vibrations
near the Lindemann stability limitrdquo Nature 422 287 (2003)
[69] D M Fritz et al ldquoUltrafast bond softening in Bismuth Mapping a solids
interatomic potential with X-raysrdquo Science 315 633 (2007)
[70] M Bargheer N Zhavoronkov J C Woo D S Kim M Woerner and T
ElsaesserldquoExcitation mechanisms of coherent phonons unravelled by
femtosecond X-ray diffractionrdquo Phys Stat Sol (b) 243 2389 (2006)
[71] C von Korff Schmising M Bargheer M Kiel N Zhavoronkov M Woerner
TElsaesser I Vrejoiu D Hesse and M Alexe ldquoAccurate time delay
determination for femtosecond X-ray diffraction experimentsrdquo Appl Phys B 88
1 (2007)
[72] B Freyer J Stingl F Zamponi M Woerner and T Elsaesser ldquoThe rotating-
crystal method in femtosecond X-ray diffractionrdquo Optics Express 19 15506
(2011)
[73] S L Johnson P Beaud C J Milne F S Krasniqi E S Zijlstra M E Garcia
M Kaiser D Grolimund R Abela and G Ingold ldquoNanoscale Depth-Resolved
Coherent Femtosecond Motion in Laser-Excited Bismuthrdquo Phys Rev Lett 100
155501 (2008)
[74] K H Bennemann ldquoUltrafast dynamics in solidsrdquo J Phys Condens Matter 16
R995 (2004)
[75] C W Siders A Cavalleri K Sokolowski-Tinten Cs Toacuteth T Guo M
Kammler M Horn von Hoegen K R Wilson D von der Linde and C P J
Barty ldquoDetection of Nonthermal Melting by Ultrafast X-ray Diffractionrdquo
Science 286 1340 (1999)
[76] K Sokolowski-Tinten C Blome C Dietrich A TarasevitchM Horn-von
Hoegen D von der Linde A Cavalleri J Squier and M Kammler
Bibliography
142
ldquoFemtosecond X-ray measurement of ultrafast melting and large acoustic
transientsrdquo Phys Rev Lett 87 225701 (2001)
[77] T Feurer A Morak I Uschmann Ch Ziener H Schwoerer Ch Reich P
Gibbon E Foumlrster R Sauerbrey K Ortner and C R Becker ldquoFemtosecond
silicon Kα pulses from laser-produced plasmasrdquo Phys Rev E 65 016412
(2001)
[78] A Rousse C Rischel S Fourmaux I Uschmann S Sebban G Grillon P
Balcou E Foumlrster J P Geindre P Audebert J C Gauthier and D Hulin
ldquoNon-thermal melting in semiconductors measured at femtosecond resolutionrdquo
Nature 410 65 (2001)
[79] K J Gaffney et al ldquoObservation of Structural Anisotropy and the Onset of
Liquidlike Motion During the Nonthermal Melting of InSbrdquo Phys Rev Lett
95 125701 (2005)
[80] P B Hillyard et al ldquoCarrier-density-dependent lattice stability in InSbrdquo Phys
RevLett 98 125501 (2007)
[81] G Sciaini M Harb S G Kruglik T Payer C T Hebeisen F -J Meyer zu
Heringdorf M Yamaguchi M Horn von Hoegen R Ernstorfer and R J D
Miller ldquoElectronic acceleration of atomic motions and disordering in bismuthrdquo
Nature 458 56 (2009)
[82] E Collet et al ldquoLaser-Induced Ferroelectric Structural Order in an Organic
Charge-Transfer Crystalrdquo Science 300 612 (2003)
[83] A Cavalleri S Wall C Simpson E Statz D W Ward K A Nelson M Rini
R W Schoenlein ldquoTracking the motion of charges in a terahertz light field by
femtosecond X-ray diffractionrdquo Nature 442 664 (2006)
[84] SK Streiffer JA Eastman DD Fong C Thompson A Munkholm MV
Ramana Murty O Auciello GR Bai GB Stephenson ldquoObservation of
nanoscale 180 deg stripe domains in ferroelectric PbTiO3 thin filmsrdquo Phys Rev
Lett 89 067601 (2002)
[85] RV Wang DD Fong F Jiang MJ Highland PH Fuoss C Thompson A
M Kolpak J A Eastman S K Streiffer A M Rappe and G B Stephenson
ldquoReversible chemical switching of a ferroelectric filmrdquo Phys Rev Lett 102
047601 (2009)
[86] M Woerner C v Korff Schmising M Bargheer N Zhavoronkov I Vrejoiu
D Hesse M Alexe and T Elsaesser ldquoUltrafast structural dynamics of
perovskite superlatticesrdquo Applied Physics A 96 83 (2009)
[87] D Daranciang M J Highland H Wen et al ldquoUltrafast photovoltaic response
in ferroelectric nanolayersrdquo Phys Rev Lett 108 087601 (2012)
[88] I Radu C Stamm N Pontius T Kachel P Ramm J-U Thiele H A Duumlrr
and C H Back ldquoLaser-induced generation and quenching of magnetization on
FeRh studied with time-resolved x-ray magnetic circular dichroismrdquo Phys Rev
B 81 104415 (2010)
Bibliography
143
[89] U Shymanovich F Quirin M Vattilana W Lu M Nicoul A-E El-Kamhawy
A Tarasevitch D von der Linde K Sokolowski-Tinten ldquoUltrafast lattice
dynamics in FeRh during a laser-induced magnetic phase transitionrdquo Ultrafast
Phenomena XVII Oxford University Press (2011)
[90] C Stamm T Kachel N Pontius R Mitzner T Quast K Holldack S Khan C
Lupulescu E F Aziz M Wietstruk H A Duumlrr and W Eberhardt
ldquoFemtosecond modification of electron localization and transfer of angular
momentum in nickelrdquo Nature Materials 6 740 (2007)
[91] C Stamm J-U Thiele T Kachel I Radu P Ramm M Kosuth J Minaacuter H
Ebert H A Duumlrr W Eberhardt and C H Back ldquoAntiferromagnetic-
ferromagnetic phase transition in FeRh probed by x-ray magnetic circular
dichroismrdquo Phys Rev B 77 184401 (2008)
[92] M Wietstruk A Melnikov Ch Stamm T Kachel N Pontius M Sultan C
Gahl MWeinelt H A Duumlrr U Bovensiepen ldquoHot electron driven
enhancement of spin-lattice coupling in 4f ferromagnets observed by
femtosecond x-ray magnetic circular dichroismrdquo Phys Rev Lett 106 127401
(2011)
[93] C Boeglin E Beaurepaire V Halteacute V Loacutepez-Flores C Stamm N Pontius H
A Duumlrr and J-Y Bigo ldquoDistinguishing the ultrafast dynamics of spin and
orbital moments in solidsrdquo Nature 465 458 (2010)
[94] C Stamm N Pontius T Kachel M Wietstruk and H A Duumlrr ldquoFemtosecond
x-ray absorption spectroscopy of spin and orbital angular momentum in
photoexcited Ni films during ultrafast demagnetizationldquo Phys Rev B 81
104425 (2010)
[95] H A Duumlrr ldquoFemtosecond electron and spin dynamics in ferromagnetic Ni
probed by UV and soft X-ray pulsesldquo Nucl Instr and Meth A 601 132 (2009)
[96] J Miguel J Saacutenchez-Barriga D Bayer J Kurde B Heitkamp M Piantek F Kronast
M Aeschlimann H A Duumlrr and W Kuch ldquoTime-resolved magnetization
dynamics of cross-tie domain walls in permalloy microstructuresrdquo J Phys
Condens Matter 21 496001 (2009)
[97] T Kachel N Pontius C Stamm M Wietstruk E F Aziz H A Duumlrr W
Eberhardt and F M F de Groot ldquoTransient electronic and magnetic structures
of nickel heated by ultrafast laser pulsesrdquo Phys Rev B 80 092404 (2009)
[98] H A Duumlrr C Stamm T Kachel N Pontius R Mitzner T Quast K
Holldack S Khan C Lupulescu EF Aziz M Wietstruk W Eberhardt
ldquoUltrafast Electron and Spin Dynamics in Nickel Probed With Femtosecond X-
Ray Pulsesrdquo IEEE Trans Magn 44 1957 (2008)
[99] S L Johnson et al ldquoFemtosecond Dynamics of the Collinear-to-Spiral
Antiferromagnetic Phase Transition in CuOrdquo Phys Rev Lett 108 037203
(2012)
Bibliography
144
[100] K A Seu S Roy J J Turner S Park C M Falco and S D Kevan ldquoCone
phase and magnetization fluctuations in AuCoAu thin films near the spin-
reorientation transitionrdquo Phys Rev B 82 012404 (2010)
[101] I Radu K Vahaplar C Stamm T Kachel N Pontius H A Duumlrr T A
Ostler J Barker R F L Evans R W Chantrell A Tsukamoto A Itoh A
Kirilyuk Th Rasing and A V Kimel ldquoTransient ferromagnetic-like state
mediating ultrafast reversal of antiferromagnetically coupled spinsrdquo Nature
472 205 (2011)
[102] K Holldack N Pontius E Schierle T Kachel V Soltwisch R Mitzner T
Quast G Springholz and E Weschke ldquoUltrafast dynamics of
antiferromagnetic order studied by femtosecond resonant soft x-ray diffractionrdquo
Appl Phys Lett 97 062502 (2010)
[103] A Kirilyuk A Kimel and T Rasing ldquoUltrafast optical manipulation of
magnetic orderrdquo Rev Mod Phys 82 2731 (2010)
[104] F Quirin M Vattilana U Shymanovich A-E El-Kamhawy A Tarasevitch
J Hohlfeld D von der Linde and K Sokolowski-Tinten ldquoStructural dynamics
in FeRh during a laser-induced metamagnetic phase transitionrdquo Phys Rev
B 85 020103(R) (2012)
[105] U Shymanovich M Nicoul W Lu S Kaumlhle A Tarasevitch K Sokolowski-
Tinten and D von der Linde ldquoTowards ultrafast time-resolved Debye-Scherrer
Xray diffraction using a laser-plasma sourcerdquo Rev Sci Instrum 80 083102
(2009)
[106] F Zamponi Z Ansari M Woerner and T Elsaesser ldquoFemtosecond powder
diffraction with a laser-driven hard X-ray sourcerdquo Optics Express 18 947
(2010)
[107] F Zamponi Z Ansari C v Korff Schmising P Rothhardt N Zhavoronkov
M Woerner T Elsaesser M Bargheer T Trobitzsch-Ryll and M Haschke
ldquoFemtosecond hard X-ray plasma sources with a kilohertz repetition raterdquo Appl
Phys A 96 51 (2009)
[108] J Stingl F Zamponi B Freyer M Woerner T Elsaesser and A Borgschulte
ldquoStrong-field electron transfer in a virtual quantum state mapped by
femtosecond x-ray diffractionrdquo Phys Rev Lett 109 147402 (2012)
[109] M J J Vrakking and T Elsaesser ldquoX-rays inspire electron moviesrdquo Nature
Photon 6 645 (2012)
[110] F Zamponi J Stingl M Woerner and T Elsaesser ldquoUltrafast soft-mode
driven charge relocation in an ionic crystalrdquo Physical Chemistry Chemical
Physics (PCCP) 14 6156 (2012)
[111] M Trigo J Chen V H Vishwanath Y M Sheu T Graber R Henning and
D A Reis ldquoImaging nonequilibrium atomic vibrations with x-ray diffuse
scatteringrdquo Physical Review B 82 235205(2010)
Bibliography
145
[112] A M Lindenberg et al ldquoX-Ray Diffuse Scattering Measurements of
Nucleation Dynamics at Femtosecond Resolutionrdquo Phys Rev Lett 100
135502 (2008)
[113] M Born and E Wolf Principles of optics Cambridge University Press (1988)
[114] G Jenke ldquoErzeugung von XUV- und Roumlntgenstralung mit Femtosecunden-
Laserimpulsenrdquo Dissertation (1999)
[115] Z Jiang J C Kieffer J P Matte M Chaker O Peyrusse D Gilles GKorn
A Maksimchuk S Coe and G Mourou ldquoX-ray spectroscopy of hot solid
density plasmas produced by subpicosecond high contrast laser pulses at 1018
ndash
1019
Wcm2rdquoPhys Plasmas 2 1702 (1995)
[116] F Brunel ldquoNot-So Resonant Resonant Absorptionrdquo Phys Rev Lett 59 52
(1987)
[117] S C Wilks and W L Kruer ldquoAbsorption of ultrashort ultra-intense laser light
by solids and overdense plasmasrdquo IEEE J Quan Electron 33 1954 (1997)
[118] S Bastiani A Rousse J P Geindre P Audebert C Quoix G Hamoniaux A
Antonettia and J C Gauthier ldquoExperimental study of the interaction of
subpicosecond laser pulses with solid targets of varying initial scale lengthsrdquo
Phys Rev E 56 7179 (1997)
[119] P Gibbon E Foumlrster ldquoShort-pulse laser-plasma interactionsrdquo Plasma Phys
Control Fusion 38 769 (1996)
[120] T Feurer A Morak I Uschmann Ch Ziener H Schwoumlrer E Foumlrster and R
Sauerbrey ldquoAn incoherent sub-picosecond X-ray source for time-resolved X-
ray-diffraction experimentsrdquo Appl Phys B Lasers Opt 72 15 (2001)
[121] C Reich P Gibbon I Uschmann and E Foumlrster ldquoYield optimization and time
structure of femtosecond laser plasma Kα sourcesrdquo Phys Rev Lett 84 4846
(2000)
[122] T Guo Ch Spielmann B C Walker C P J Barthy ldquoGeneration of hard X-
rays by ultrafast terawatt lasersrdquo Rev Sci Instr 72 41 (2001)
[123] R Fedosejevs R Ottmann R Sigel G Kuumlhnle S Szatmaacuteri F P Schaumlfer
ldquoAbsorption of subpicosecond ultraviolet laser pulses in high-density plasmardquo
ApplPhyB 50 79 (1990)
[124] C A Quarles ldquoSemiempirical analysis of electron-induced K-shell ionizationrdquo
Phys Rev A 13 1278 (1976)
[125] W E Burcham Elements of Nuclear Physics Pearson (1979)
[126] E Casnati A Tartari and C Baraldi ldquoAn empirical approach to K-shell ionisation
cross section by electronsrdquo J Phys B 15 155 (1982)
[127] P Gibbon A Andreev E Lefebvre G Bonnaud H Ruhl J Delettrez and A
R Bell ldquoCalibration of one-dimensional boosted kinetic codes for modeling
high-intensity laserndashsolid interactionsrdquo Phys Plasmas 6 947 (1999)
Bibliography
146
[128] DC Joy Monte Carlo Modeling for Electron Microscopy and Microanalysis
Oxford University Press Oxford (1995)
[129] D Salzmann Ch Reich I Uschmann E Foumlrster PGibbon ldquoTheory of Kα
generation by femtosecond laser-produced hot electrons in thin foilsrdquo Phys
Rev E 65 036402 (2002)
[130] F Y Khattak O A M B Percie du Sert D Riley P S Foster E J Divall C
J Hooker A J Langley J Smith and P Gibbon ldquoComparison of experimental
and simulated Kα yield for 400 nm ultrashort pulse laser irradiationrdquo Phys Rev
E 74 027401 (2006)
[131] P Gibbon and A R Bell ldquoCollisionless Absorption in Sharp-Edged Plasmasrdquo
Phys Rev Lett 68 1535 (1992)
[132] D D Meyerhofer H Chen J A Delettrez B Soom S Uchida and B Yaakobi
ldquoResonance absorption in high-intensity contrast picosecond laser-plasma
interactionsrdquo Phys Fluids B 5 2584 (1993)
[133] U Teubner W Theobald and C Wuumllker ldquoMechanisms and origin of
continuum and line emission from carbon plasmas produced by ultrashort laser
pulsesrdquo J Phys B 29 4333 (1996)
[134] M Schnuumlrer M P Kalashnikov P V Nickles Th Schlegel W Sandner N
Demchenko R Nolte and P Ambrosi ldquoHard x‐ray emission from intense short
pulse laser plasmasrdquo Phys Plasmas 2 3106 (1995)
[135] J D Kmetec C L Gordon III J J Macklin B E Lemoff G S Brown and
S E Harris ldquoMeV x-ray generation with a femtosecond laserrdquo Phys Rev Lett
68 1527 (1992)
[136] A P Fews P A Norreys F N Beg A R Bell A E Dangor C N Danson
P Lee and S J Rose ldquoPlasma Ion Emission from High Intensity Picosecond
Laser Pulse Interactions with Solid Targetsrdquo Phys Rev Lett 73 1801 (1994)
[137] D C Eder G Pretzler E Fill K Eidmann and A Saemann ldquoSpatial
characteristics of Kα radiation from weakly relativistic laser plasmasrdquo Appl
Phys B Lasers Opt 70 211 (2000)
[138] S Backus C G Durfee M M Murnane and H C Kapteyn ldquoHigh power
ultrafast lasersrdquo Rev Sci Instrum 69 1207 (1998)
[139] K Lobov ldquoHigh order harmonic generation at relativistic laser intensitiesrdquo
Dissertation (2008)
[140] U Shymanovich ldquoDirect observation of ultrafast atomic motion using time-
resolved X-ray diffractionrdquo Dissertation (2007)
[141] F Scholze H Henneken P Kuschnerus H Rabus M Richter G Ulm
ldquoDetermination of the electronndashhole pair creation energy for semiconductors
from the spectral responsivity of photodiodesrdquo Nuclear Instruments and
Methods in Physics Research A 439 208 (2000)
Bibliography
147
[142] F Zamponi T Kaumlmpfer A Morak I Uschmann and E Foumlrster
ldquoCharacterization of a deep depletion back-illuminated charge-coupled device
in the x-ray rangerdquo Rev Sci Instrum 76 116101 (2005)
[143] The quantum efficiency of the CCD was calibrated with a Si reference detector
[144] D W Forslund J M Kindel and K Lee ldquoTheory of Hot-Electron Spectra at
High Laser Intensityrdquo Phys Rev Lett 39 284 (1977)
[145] W L Kruer and K Estabrook ldquoLaser light absorption due to self‐generated
magnetic fieldsrdquo Phys Fluids 20 1688 (1977)
[146] N H Burnett G D Enright A Avery A Loen and J C Kieffer ldquoTime-
resolved Kα spectra in high-intensity laser-target interactionrdquo Phys Rev A 29
2294 (1984)
[147] W L Kruer The Physics of Laser Plasma Interaction Addison-Wesley (1988)
[148] N Zhavoronkov Y Gritsai M Bargheer M Woerner and T Elsaesser
ldquoGeneration of ultrashort Kα radiation from quasipoint interaction area of
femtosecond pulses with thin foilsrdquo Appl Phys Lett 86 244107 (2005)
[149] F Ewald H Schwoerer and R Sauerbrey ldquoKα-radiation from relativistic laser-
produced plasmasrdquo Europhys Lett 60 710 (2002)
[150] A Zhidkov A Sasaki T Utsumi I Fukumoto T Tajima F Saito Y
Hironaka K G Nakamura K I Kondo and M Yoshida ldquoPrepulse effects on
the interaction of intense femtosecond laser pulses with high-Z solidsrdquo Phys
Rev E 62 7232 (2000)
[151] F Y Khattak E Garcia Saiz T Dzelzainis D Riley and Z Zhai ldquoScale-
length optimizing of short pulse Cu Kα laser-plasma sourcesrdquo Appl Phys Lett
90 081502 (2007)
[152] Ch Reich I Uschmann F Ewald S Duumlsterer A Luumlbcke H Schwoerer R
Sauerbrey E Foumlrster and P Gibbon ldquoSpatial characteristics of Kα x-ray
emission from relativistic femtosecond laser plasmasrdquo Phys Rev E 68 056408
(2003)
[153] K Sokolowski-Tinten C Blome J Blums A Cavalleri C Dietrich A
Tarasevitch and D von der Linde ldquoUltrafast Time-Resolved X-ray
Diffractionrdquo AIP Conf Proc 634 11 (2002)
[154] N Zhavoronkov Y Gritsai M Bargheer M Woerner T Elsaesser F
Zamponi I Uschmann and E Forster ldquoUltrafast Optics - Microfocus Cu Kα
source for femtosecond x-ray sciencerdquo Optics Letters 30 1737 (2005)
[155] Bixue Hou James Easter Karl Krushelnick and John A Nees ldquo Generation of
hard x rays by femtosecond laser pulse interaction with Cu in laminar helium
flow in ambient airrdquo Appl Phys Lett 92 161501 (2008)
[156] Ch Ziener I Uschmann G Stobrawa Ch Reich P Gibbon T Feurer A
Morak S Duumlsterer H Schwoerer E Foumlrster and R Sauerbrey ldquoOptimization
of Kα bursts for photon energies between 17 and 7 keV produced by
Bibliography
148
femtosecond-laser-produced plasmas of different scale lengthrdquo Phys Rev E 65
066411 (2002)
[157] U Teubner J Bergmann B van Wonterghem F P Schaumlfer and R Sauerbrey
ldquoAngle-dependent x-ray emission and resonance absorption in a laser-produced
plasma generated by a high intensity ultrashort pulserdquo Phys Rev Lett 70 794
(1993)
[158] U Teubner P Gibbon E Foumlrster F Falliegraves P Audebert J P Geindre and J
C Gauthier ldquoSubpicosecond KrF‐laser plasma interaction at intensities
between 1014
and 1017
Wcm2rdquo Phys Plasmas 3 2679 (1996)
[159] J F Liu W Yu and L J Qian ldquoCharge Displacement in Ultraintense Laser-
Plasma Interactionrdquo Physica Scripta 72 243 (2005)
[160] T P Hughes Plasma and Laser Light Adam Hilger (1975)
[161] Y T Lee R A London G B Zimmerman and P L Hagelstein ldquoApplication
of escape probability to line transfer in laser‐produced plasmasrdquo Phys Fluids B
2 2731 (1990)
[162] A K Sharma R K Thareja ldquoPlume dynamics of laser-produced aluminum
plasma in ambient nitrogenrdquo Applied Surface Science 243 68 (2005)
[163] H Nakano T Nishikawa and N Uesugi ldquoEnhanced K-shell x-ray line
emissions from aluminum plasma created by a pair of femtosecond laser pulsesrdquo
Appl Phys Lett79 24 (2001)
[164] H Ahn H Nakano T Nishikawa and N Uesugi ldquoSimultaneous Measurement
of Absorption and X-Ray Emission from Preformed Plasma Generated by
Ultrashort Prepulseldquo Jpn J Appl Phys 35 L154 (1996)
[165] T Feurer ldquoFeedback-controlled optimization of soft-X-ray radiation from
femtosecond laser-produced plasmasrdquo Appl Phys B Lasers Opt 68 55 (1999)
[166] U Teubner G Kuumlhnle and F P Schaumlfer ldquoDetailed study of the effect of a
short prepulse on soft X-ray spectra generated by a high-intensity KrF laser
pulserdquo Appl Phys B 54 493 (1992)
[167] Th Schlegel S Bastiani L Gregravemillet J-P Geindre P Audebert J-C
Gauthier E Lebebvre G Bonnaud and J Delettrez ldquoComparison of measured
and calculated x-ray and hot-electron production in short-pulse laser-solid
interactions at moderate intensitiesrdquo Phys Rev E 60 2209 (1999)
[168] A Schmitt R S B Ong ldquoThe effect of collisions on wave-breaking in a cold
plasmardquo Appl Phys 22333 (1980)
[169] J P Freidberg R W Mitchell R L Morse and L I Rudsinski ldquoResonant
Absorption of Laser Light by Plasma Targetsrdquo Phys Rev Lett 28 795 (1972)
[170] M Abramowitz and I Stegun Handbook of Mathematical functions National
Bureau of Standards (1964)
[171] A Tarasevitch A Orisch D von der Linde Ph Balcou G Rey J -P
Chambaret U Teubner D Kloumlpfel and W Theobald ldquoGeneration of high-
Bibliography
149
order spatially coherent harmonics from solid targets by femtosecond laser
pulsesrdquo Phys Rev A 62 023816 (2000)
[172] H-S Park D M Chambers H -K Chung R J Clarke et al ldquoHigh-energy
Kα radiography using high-intensity short-pulse lasersrdquo Phys Plasmas 13
056309 (2006)
[173] P P Rajeev S Banerjee A S Sandhu R C Issac L C Tribedi and G R
Kumar ldquoRole of surface roughness in hard-x-ray emission from femtosecond-
laser-produced copper plasmasrdquo Phys Rev A 65 052903 (2002)
[174] R Rix ldquoAbsorption intensiver ultrakurzer Laserpulse an Festkoumlrpertargetsrdquo
Diplomarbeit Max-Planck-Institut Fuumlr Quantenoptik Garching Germany
(1999)
[175] U Teubner I Uschmann P Gibbon D Altenbernd E Foumlrster T Feurer W
Theobald R Sauerbrey G Hirst M H Key J Lister and D Neely
ldquoAbsorption and hot electron production by high intensity femtosecond uv-laser
pulses in solid targetsrdquo Phys Rev E 54 4167 (1996)
[176] P Gibbon M Mašek U Teubner W Lu M Nicoul U Shymanovich A
Tarasevitch P Zhou K Sokolowski-Tinten and D von der Linde ldquoModelling
and optimisation of fs laser-produced Kα sourcesrdquo Appl Phys A 96 23 (2009)
[177] J M Dawson ldquoParticle simulation of plasmasrdquo Rev Mod Phys 55 403
(1983)
[178] T Tajima Computational Plasma Physics with Applications to Fusion and
Astrophysics AddisonndashWesley (1989)
[179] C K Birdsall and A B Langdon Plasma Physics via Computer simulations
IOP Publishing Ltd Bristol U K (1991)
[180] H L Anderson ldquoMetropolis Monte Carlo and the MANIACrdquo Los Alamos
Science 14 96 (1986)
[181] W Lu M Nicoul U Shymanovich A Tarasevitch P Zhou K Sokolowski-
Tinten D von der Linde M Mašek P Gibbon and U Teubner ldquoOptimized
Kα X-ray flashes from femtosecond-laser irradiated foilsrdquo Phys Rev E 80
026404 (2009)
[182] D Riley J J Angulo-Gareta F Y Khattak M J Lamb P S Foster E J
Divall C J Hooker A J Langley R J Clarke and D Neely ldquoKα yields from
Ti foils irradiated with ultrashort laser pulsesrdquo Phys Rev E 71 016406 (2005)
[183] International Commission on Radiation Units amp Measurements Report No 37
unpublished (1984)
[184] httpphysicsnistgovPhysRefDataXrayMassCoefcoverhtml
[185] C Rulliere Femtosecond Laser Pulses Principles and Experiments 2nd ed
Springer (2004)
[186] M Nicoul ldquoTime-resolved X-ray diffraction with accelerator- and laser-
plasma-based X-ray sourcesrdquo Dissertation (2010)
Bibliography
150
[187] A Ruhl ldquoErzeugung intensiver Roumlntgenimpulse mit einem Bandtargetrdquo
Diplomarbeit (2006)
[188] M Montel ldquoAberrations du Premier Ordre des Systegravemes Catoptriques
Asymeacutetriques Application au Microscope X agrave Reacuteflexion Totalerdquo Optica Acta 1
117 (1954)
[189] httpwwwcxrolblgov
[190] L M P Fernandes F D Amaro A Antognini J M R Cardoso C A N
Conde O Huot P E Knowles F Kottmann J A M Lopes L Ludhova C
M B Monteiro F Mulhauser R Pohl J M F dos Santos L A Schaller D
Taqqud and J F C A Velosoe ldquoCharacterization of large area avalanche
photodiodes in X-ray and VUV-light detectionrdquo Journal of Instrumentation
(JINST) 2 08005 (2007)
[191] L M P Fernandes J A M Lopes J M F dos Santos P E Knowles L
Ludhova F Mulhauser F Kottmann R Pohl D Taqqu ldquoLAAPD low
temperature performance in X-ray and visible-light detectionrdquo IEEE
Transactions on Nuclear Science 51 1575 (2004)
[192] httpwwwcaenitjspTemplate2CaenProdjspparent=9ampidmod=409
[193] W Demtroumlder Laser Spectroscopy Basic Concepts and Instrumentation 2nd
Edition Springer-Verlag (1996)
[194] J Chesnoy and A Mokhtari Resonant impulsive-stimulated Raman-scattering
on Malachite Green Phys Rev A 38 3566 (1988)
[195] A Tokmakoff B Sauter and M D Fayer ldquoTemperature‐dependent
vibrational relaxation in polyatomic liquids Picosecond infrared pumpndashprobe
experimentsrdquo J Chem Phys 100 9035 (1994)
[196] S Ghosh and B M Arora ldquoPhotoreflectance spectroscopy with white light
pump beamrdquo Rev Sci Instrum 69 1261 (1998)
[197] R C Stanley ldquoCounting statistics in X-ray spectroscopyrdquo Br J Appl Phys 12
503 (1961)
[198] D Laundy and S Collins ldquoCounting statistics of X-ray detectors at high
counting ratesrdquo J Synchrotron Rad 10 214 (2003)
[199] G C Cho W Kuumltt and H Kurz ldquoSubpicosecond time-resolved coherent-
phonon oscillations in GaAsrdquo Phys Rev Lett 65 764 (1990)
[200] S I Anisimov B L Kapeliovich T L Perelman ldquoElectron emission from
metal surfaces exposed to ultrashort laser pulsesrdquo Sov Phys JETP 39 375
(1974)
[201] M Ligges I Rajkovic P Zhou O Posth C Hassel G Dumpich D von der
Linde ldquoObservation of ultrafast lattice heating using time reolved electron
diffractionrdquo Appl Phys Lett 94 101910 (2009)
Bibliography
151
[202] P Chen I V Tomov and P M Rentzepis ldquoTime resolved heat propagation in
a gold crystal by means of picosecondx-ray diffractionrdquo J Chem Phys 104
10001 (1996)
[203] A A Maznev J Hohlfeld and J Guumldde ldquoSurface thermal expansion of metal
under femtosecond laser irradiationrdquo J Appl Phys 82 5082 (1997)
[204] A Plech S Kuumlrbitz K -J Berg H Graener G Berg S Greacutesillon M Kaempfe J
Feldmann M Wulff and G von Plessen ldquoTime-resolved X-ray diffraction on
laser-excited metal nanoparticlesrdquo Europhys Lett 61 762 (2003)
[205] J Chen H Zhang I V Tomov and P M Rentzepis ldquoLaser Induced Transient
Structures in a 150 nm Gold Crystalrdquo Journal of the chinese chemical society
54 1619 (2007)
[206] P Musumeci J T Moody C M Scoby M S Gutierrez and M Westfall
ldquoLaser-induced melting of a single crystal gold sample by time-resolved
ultrafast relativistic electron diffractionrdquo Appl Phys Lett 97 063502 (2010)
[207] R Ernstorfer M Harb T Dartigalongue C T Hebeisen R E Jordan L Zhu
and R J D Miller ldquoFemtosecond Electron Diffraction Study on the Heating
and Melting Dynamics of Goldrdquo Springer Series in Chemical Physics 88 755
(2007)
[208] R Ernstorfer M Harb C T Hebeisen G Sciaini T Dartigalongue I
Rajkovic M Ligges D von der Linde Th Payer and M Horn-von-Hoegen F
-J Meyer zu Heringdorf S G Kruglik and R J D Miller ldquoAtomic view of the
photoinduced collapse of gold and bismuthrdquo Springer Series in Chemical
Physics 92 113 (2009)
[209] httpwwwphasisch
[210] E D Palik (Author Editor) Handbook of Optical Constants of Solids
Academic Press (1985)
[211] J Hohlfeld J G Muumlller S -S Wellershoff and E Matthias ldquoTime-resolved
thermoreflectivity of thin gold films and its dependence on film thicknessrdquo
Appl Phys B 64 387 (1997)
[212] T Juhasz H E Elsayed-Ali G O Smith C Suaacuterez and W E Bron ldquoDirect
measurements of the transport of nonequilibrium electrons in gold films with
different crystal structuresrdquo Phys Rev B 48 15488 (1993)
[213] S D Brorson J G Fujimoto and E P Ippen ldquoFemtosecond electronic heat-
transport dynamics in thin gold filmsrdquo Phys Rev Lett 59 1962 (1987)
[214] P Debye Interferenz von Roumlntgenstrahlen und Waumlrmebewegung Ann d
Phys 348 49 (1913)
[215] I Waller ldquoZur Frage der Einwirkung der Waumlrmebewegung auf die Interferenz
von Roumlntgenstrahlenrdquo Zeitschrift fuumlr Physik A Hadrons and Nuclei 17 398
(1923)
[216] C Kittel Introduction to solid state physics 6th ed Wiley New York (1986)
Bibliography
152
[217] G Busch and H Schade Lectures on solid state physics Pergamon Press
(1976)
[218] B C Larson J Z Tischler and D M Mills ldquoNanosecond resolution
timeresolved x-ray study of silicon during pulsed-laser irradiationrdquo Journal of
Materials Research 1 144 (1986)
[219] S K Allison ldquoThe Natural Widths of the Kα X-Ray Doublet from 26FE to
47AGrdquo The physical review 44 63 (1933)
[220] calculated from XOP httpwwwesrfeucomputingscientificxop21
[221] T H Johnson ldquoThe Diffraction of Hydrogen Atoms by the Mosaic Structure of
Crystalsrdquo Phys Rev 37 87 (1931)
[222] C Thomsen J Strait Z Vardeny H J Mark J Tauc and J Hauser
ldquoCoherent phonon generation and detection by picosecond light pulsesrdquo Phys
Rev Lett 53 989 (1984)
[223] C Thomsen H T Grahn H J Maris and J Tauc ldquoSurface generation and
detection of phonons by picosecond light pulsesrdquo Phys Rev B 34 4129 (1986)
[224] American Institute of Physics (Author Corporate Author) Dwight E Gray
(Editor) American Institute of Physics Handbook 3rd ed McGraw-Hill
Columbus (1972)
[225] S Kaumlhle ldquoKurzzeit-Roumlntgenbeugung mit Hilfe einer Effizienz-optimierten
hochrepetierenden Laser-Plasma-Roumlntgenquellerdquo Dissertation (2009)
[226] P B Allen ldquoTheory of thermal relaxation of electrons in metalsrdquo Phys Rev
Lett 59 1460 (1987)
[227] J Hohlfeld S -S Wellershoff J Guumldde U Conrad V Jaumlhnke E Matthias
ldquoElectron and lattice dynamics following optical excitation of metalsrdquo Chem
Phys 251 237 (2000)
[228] Online-Datenbank WebElements Periodic Table of the Elements
httpwwwwebelementscom (Stand November 2008)
[229] B Rethfeld A Kaiser M Vicanek and G Simon ldquoUltrafast dynamics of
nonequilibrium electrons in metals under femtosecond laser irradiationrdquoPhys
Rev B 65 214303 (2002)
[230] R Peierls More Surprises in Theoretical Physics Princeton University Press
(1991)
[231] H J Zeiger J Vidal T K Cheng E P Ippen G Dresselhauss and M S
Dresselhaus ldquoTheory for displacive excitation of coherent phononsrdquo Phys Rev
B 45 768 (1992)
[232] T K Cheng J Vidal H J Zeiger G Dresselhaus M S Dresselhaus and E P
Ippen ldquoMechanism for displacive excitation of coherent phonons in Sb Bi Te
and Ti2O3rdquo Appl Phys Lett 59 1923 (1991)
Bibliography
153
[233] A B Shick J B Ketterson D L Novikov and A J Freeman ldquoElectronic
structure phase stability and semimetal-semiconductor transitions in Birdquo Phys
Rev B 60 15484 (1999)
[234] O Degtyareva M I MCMahon and R J Nelmes ldquoHigh-pressure structural
studies of group-15 elementsrdquo High Pressure Research 24 319 (2004)
[235] T E Stevens J Kuhl and R Merlin ldquoCoherent phonon generation and the two
stimulated Raman tensorsrdquo Phys Rev B 65 144304 (2002)
[236] K Ishioka1 M Kitajima1 and O V Misochko ldquoTemperature dependence of
coherent A1g and Eg phonons of bismuthrdquo J Appl Phys 100 093501 (2006)
[237] E D Murray D M Fritz J K Wahlstrand S Fahy and D A Reis ldquoEffect of
Lattice Anharmonicity in Bismuth High-amplitude Phonon Dynamicsrdquo Phys
Rev B 72 060301 (2005)
[238] X Gonze J-P Michenaud and J-P Vigneron ldquoFirst-principles study of As Sb
and Bi electronic propertiesrdquo Phys Rev B 41 11827 (1990)
[239] T K Cheng S D Brorson A S Kazeroonian J S Moodera G Dresselhaus
M S Dresselhaus and E P Ippen ldquoImpulsive excitation of coherent phonons
observed in reflection in bismuth and antimonyrdquo Appl Phys Lett 57 1004
(1990)
[240] J S Lannin J M Calleja and M Cardona ldquoSecond-order Raman scattering in
the group-Vb semimetals Bi Sb and Asrdquo Phys Rev B 12 585 (1975)
[241] A Q Wu and X XuldquoCoupling of ultrafast laser energy to coherent phonons in
bismuthrdquo Appl Phys Lett 90 251111 (2007)
[242] E G Gamaly A V Rode ldquoElectronndashphonon energy relaxation in bismuth
excited by ultrashort laser pulse temperature and fluence dependence rdquo Appl
Phys A online (2012)
[243] M Hase K Mizoguchi H Harima S Nakashima and K Sakai ldquoDynamics of
coherent phonons in bismuth generated by ultrashort laser pulsesrdquo Phys Rev B
58 5448 (1998)
[244] O V Misochko K Ishioka M Hase and M Kitajima ldquoFano interference for
large-amplitude coherent phonons in bismuthrdquo J Phys Condens Matter 19
156227 (2007)
[245] M F DeCamp D A Reis P H Bucksbaum and R Merlin ldquoDynamics and
coherent control of high-amplitude optical phonons in bismuthrdquo Phys Rev B
64 092301 (2001)
[246] O V Misochko Muneaki Hase K Ishioka and M Kitajima ldquoObservation of
an Amplitude Collapse and Revival of Chirped Coherent Phonons in Bismuthrdquo
Phys Rev Lett 92 197401 (2004)
[247] M S Diakhate E S Zijlstra M E Garcia ldquoQuantum dynamical study of the
amplitude collapse and revival of coherent A 1g phonons in bismuth a classical
phenomenon rdquo Appl Phys A 96 5 (2009)
Bibliography
154
[248] D Boschetto E G Gamaly A V Rode B Luther-Davies D Glijer T Garl
O Albert A Rousse and J Etchepare ldquoSmall Atomic Displacements Recorded
in Bismuth by the Optical Reflectivity of Femtosecond Laser-Pulse
Excitationsrdquo Phys Rev Lett 100 027404 (2008)
[249] M Hase M Kitajima S-i Nakashima and K Mizoguchi ldquoDynamics of
Coherent Anharmonic Phonons in Bismuth Using High Density
Photoexcitationrdquo Phys Rev Lett 88 067401 (2002)
[250] M Hase K Mizoguchi H Harima S Nakashima M Tani K Sakai and M
Hangyo ldquoOptical control of coherent optical phonons in bismuth filmsrdquo Appl
Phys Lett 69 2474 (1996)
[251] C Blome ldquoUntersuchung schneller Strukturbullanderungen mit Hilfe ultrakurzer
Rbullontgenimpulserdquo Dissertation (2003)
[252] S L Johnson P Beaud E Vorobeva C J Milne Eacute D Murray S Fahy and
G Ingold ldquoDirectly Observing Squeezed Phonon States with Femtosecond X-
Ray Diffractionrdquo Phys Rev Lett 102 175503 (2009)
[253] M Ligges ldquoUntersuchung der schnellen Gitteraufheizung in duumlnnen (Halb-)
Metallfilmen mit Hilfe zeitaufgeloumlster Elektronenbeugungrdquo Dissertation (2009)
[254] A Bugayev A Esmail M Abdel-Fattah and H E Elsayed-Ali ldquoCoherent
phonons in bismuth film observed by ultrafast electron diffractionrdquo AIP
Advances 1 012117 (2011)
[255] A Authier S Lagomarsino and BK Tanner (Eds) X-ray and Neutron
Dynamical Diffraction Theory and Applications New York Plenum Press
(1996)
[256] J Daillant and A Gibaud (Eds) X-ray and Neutron Reflectivity Principles and
Applications Lecture Notes in Physics 770 Springer (2009)
[257] M Cornacchia J Arthur L Bentson R Carr P Emma J Galayda P Krejcik
I Lindau J Safranek J Schmerge J Stohr R Tatchyn and A Wootton ldquoA
Sub-Picosecond Photon Pulse Facility for SLACrdquo SLAC-PUB-8950 (2001)
[258] P Tangney and S Fahy ldquoDensity-functional theory approach to ultrafast laser
excitation of semiconductors Application to the A1 phonon in telluriumrdquo Phys
Rev B 65 054302 (2002)
[259] O V Misochko K Ishioka M Hase and M Kitajima ldquoFully symmetric and
doubly degenerate coherent phonons in semimetals at low temperature and high
excitation similarities and differencesrdquo J Phys Condens Matter 18 10571
(2006)
[260] E S Zijlstra L L Tatarinova and M E Garcia ldquoLaser-induced phonon-
phonon interactions in bismuthrdquo Phys Rev B 74 220301 (2006)
[261] S Bluumlgel and G Bihlmayer ldquoFull-Potential Linearized Augmented Planewave
Methodrdquo Computational Nanoscience Do It Yourself (J Grotendorst S
Bluumlgel D Marx (Eds)) NIC Series 31 85 (2006)
Bibliography
155
[262] P Blaha K Schwarz G K H Madsen D Kvasnicka and J Luitz ldquoWIEN2k
An Augmented Plane Wave+Local Orbitals Program for Calculating Crystal
Propertiesrdquo Karlheinz Schwarz Techn Universitaumlt Wien Austria (2001)
[263] Z Yang C Ko and S Ramanathan ldquoOxide Electronics Utilizing Ultrafast
Metal-Insulator Transitionsrdquo Annu Rev Mater Res 41 337 (2011)
[264] A Pashkin C Kuumlbler H Ehrke R Lopez A Halabica R F Haglund Jr R
Huber A Leitenstorfer ldquoUltrafast Insulator-Metal Phase Transition in VO2
Studied by Multiterahertz Spectroscopyrdquo Phys Rev B 83 195120 (2011)
[265] M Wuttig N Yamada ldquoPhase-change materials for rewriteable data storagerdquo
Nature Mater 6 824 (2007)
[266] T Siegrist P Jost H Volker M Woda P Merkelbach C Schlockermann and
M Wuttig ldquoDisorder-induced localization in crystalline phase-change
materialsrdquo Nature Mater 10 202 (2011)
[267] P Debye and P Scherrer ldquoInterferenzen an regellos orientierten Teilchen im
Roumlntgenlichtrdquo Phys Z 17 277 (1916)
[268] httpwwwlebowcompanycomspecificationshtm
[269] E Zolotoyabko D Shilo W Sauer E Pernot and J Baruchel ldquoVisualization
of 10 μm surface acoustic waves by stroboscopic x-ray topographyrdquo Appl
Phys Lett 73 2278 (1998)
[270] W Sauer M Streibl T Metzger A Haubrich S Manus W A J Peisl J
Mazuelas J Haumlrtwig and J Baruchel ldquoX-ray imaging and diffraction from
surface phonons on GaAsrdquo ApplPhysLett 75 1709 (1999)
[271] C Voisin D Christofilos N Del Fatti F Valleacutee ldquoEnvironment effect on the
acoustic vibration of metal nanoparticlesrdquo Physica B Condensed Matter 316
89 (2002)
[272] P P Ewald ldquoIntroduction to the dynamical theory of X-ray diffractionldquo Acta
CrystA 25 103 (1969)
[273] httpphotonic-sciencecoukproductsXRAY-cameras-detectorshtml
[274] C Bressler and M Chergui ldquoUltrafast X-ray Absorption Spectroscopyrdquo Chem
Rev 104 1781 (2004)
[275] C Bressler and M Chergui Molecular structural dynamics probed by ultrafast
X-ray absorption spectroscopy Annu Rev Phys Chem 61 263 (2010)
[276] A O Er J Chen and P M Rentzepis Ultrafast time resolved x-ray
diffraction extended x-ray absorption fine structure and x-ray absorption near
edge structure J Appl Phys 112 031101 (2012)
[277] E Papalazarou J Faure J Mauchain M Marsi A Taleb-Ibrahimi I
Reshetnyak A van Roekeghem I Timrov N Vast B Arnaud and L Perfetti
ldquoCoherent Phonon Coupling to Individual Bloch States in Photoexcited
Bismuthrdquo Phys Rev Lett 108 256808 (2012)
Bibliography
156
[278] M Nakajima N Takubo Z Hiroi Y Ueda and T Suemoto ldquoPhotoinduced
metallic state in VO2 proved by the terahertz pump-probe spectroscopyrdquo Appl
Phys Lett 92 011907 (2008)
[279] R Ulbricht E Hendry J Shan T F Heinz and M Bonn ldquoCarrier dynamics
in semiconductors studied with time-resolved terahertz spectroscopyrdquo Rev Mod
Phys 83 543 (2011)
[280] Time-resolved THz studies of carrier dynamics in semiconductors
superconductors and strongly-correlated electron materials Lawrence Berkeley
National Laboratory Lawrence Berkeley National Laboratory LBNL
Paper LBNL-597E Retrieved from httpescholarshiporgucitem2m32w0fs
[281] O V Misochko K Ishioka M Hase and M Kitajima ldquoFully symmetric and
doubly degenerate coherent phonons in semimetals at low temperature and high
excitation similarities and differencesrdquo J Phys Condens Matter 18 10571
(2006)
[282] arXiv12122348 (httparxivorgpdf12122348pdf )(2013)
[283] M Holt Z Wu H Hong P Zschack P Jemian J Tischler H Chen and T-C
Chiang ldquoDetermination of Phonon Dispersions from X-Ray Transmission
Scattering The Example of Siliconrdquo Phys Rev Lett 83 3317 (1999)
[284] httpwwwrigakucomproductscomponents
[285] httpwwwroperscientificdedatasheetsPrinceton_Instruments_PI-
MTE_1300B_RevA0pdf
[286] httpwwwadvancedphotonixcomap_productspdfsSD394-70-74-591pdf
Erklaumlrung
157
Ich bestaumltige dass ich die vorliegende Dissertation bdquoUltrafast time-resolved X-ray
diffraction using an optimized laser-plasma based X-ray sourceldquo selbststaumlndig
verfasst habe und dabei nur die angegebenen Hilfsmittel verwendet habe
Daruumlber hinaus bestaumltige ich dass ich die vorliegende Dissertation bdquoUltrafast time-
resolved X-ray diffraction using an optimized laser-plasma based X-ray sourceldquo nur
in diesem Promotionsverfahren an der Fakultaumlt fuumlr Physik der Universitaumlt Duisburg-
Essen eingereicht wurde
Wei Lu
Duisburg den 01022013