Embed Size (px)
Citation preview
Desalination 281 (2011) 142–150
Contents lists available at ScienceDirect
Desalination
j ourna l homepage: www.e lsev ie r.com/ locate /desa l
Ultrafiltration of activated sludge: Flocculation and membrane fouling
María Matos a, José M. Benito b, Ángel Cambiella c, José Coca a, Carmen Pazos a,⁎a Department of Chemical and Environmental Engineering, University of Oviedo, Julián Clavería 8, 33006 Oviedo, Spainb Department of Chemical Engineering, University of Burgos, Plaza Misael Bañuelos s/n, 09001 Burgos, Spainc Wehrle Medioambiente S.L., Belice 1-3°C, 33212 Gijón, Spain
⁎ Corresponding author. Tel.: +34 985103509; fax: +E-mail address: [email protected] (C. Pazos).
0011-9164/$ – see front matter © 2011 Elsevier B.V. Adoi:10.1016/j.desal.2011.07.058
a b s t r a c t
a r t i c l e i n f oArticle history:Received 27 April 2011Received in revised form 22 July 2011Accepted 24 July 2011Available online 8 September 2011
Keywords:Activated sludgeUltrafiltrationOrganic membranesFoulingFlocculation
The effect of flocculants on the ultrafiltration (UF) of activated sludge from a wastewater treatment plant,using organic membranes, was investigated. Flocculation trials were performed with commercial flocculants,ZETAG 7197 (an aliphatic polyamine) and Nalco MPE30 and MPE50 (cationic polymers). Optimal dosage wasdetermined as a function of the mean floc size. Experiments were performed in a dead-end UF unit usingpolyethersulfone (PES) and regenerated cellulose (YM) flat membranes (10, 30, and 100 kDa) and in acrossflow UF-pilot plant unit, with a polyethersulfone (PES) membrane (100 kDa). Best results were obtainedfor the MPE50 flocculant. Membrane fouling was reduced at the optimal dosage of flocculant, while permeatecollected was up to 20% of the feed volume. The total amount of permeate at the optimal dosage of MPE50flocculant was 16–69% higher than without additives, depending on the MWCO (molecular weight cut-off),with an initial permeate flux increase of up to 80%. In the UF-pilot plant unit, a slight increase of permeate fluxwas observed at the optimal dosage of the flocculant, and more than 98% of chemical oxygen demand (COD)reduction was achieved.
34 985103434.
ll rights reserved.
© 2011 Elsevier B.V. All rights reserved.
1. Introduction
Membrane bioreactors (MBRs) are widely used for industrial andurban wastewater treatment because of their high operationefficiencies. The membrane process coupled with the activated sludgetreatment allows degradation of the organic material and removal ofthe suspended solids. Higher biomass concentrations can be treatedwith high-quality permeate [1,2]. Membrane fouling is the mainlimitation, increasing operating costs associated with membranecleaning and reduced membrane life [2–5].
Aeration rate, mechanical mixing, and feed flow through themembrane have been studied to improve the performance of MBRs.These variables affect the size distribution of the activated sludge flocsand consequently the performance of the membrane [5,6]. Membraneparameters such as pore size, crossflow velocity and transmembranepressure have also been investigated [4,7–9].
The influence on biofouling of activated sludge parameters, such assuspended solids concentration, particle size distribution, viscosity,hydrophobicity, extracellular polymeric substances (EPS), soluble orcolloidal material, etc., has been reported [4,10–13]. The identity anddiversity of bacterial populations on MBR operation also affect fouling,though to a lesser extent.
Several approaches to reduce biofouling in MBRs have beenattempted. Modified biopolymers with a net cationic charge are
membrane performance enhancers (MPE) that react with biomass,decreasing fouling [14–16]. Flocculation of the activated sludge leads toorganic colloids aggregation, increasing membrane filterability andfouling control, due to the decrease of soluble foulant concentration, likeSMP(solublemicrobialproducts). Thus, by increasing theporosityof thecake layer on the membrane, an increase in filterability and cleaningreduction may be achieved. The effect of other enhancers such aspowdered activated carbon, polyaluminium chloride, chitosan, starch,alumina, ferric salts, etc., on MBRs performance, as a function of COD,TOC, SMP, and N and P removal, transmembrane pressure (TMP) andoxygen uptake rate, has been reported [14–26].
The purpose of this study was to determine the effect of flocculantson membrane fouling for the UF of activated sludge from an industrialwastewater treatment plant. Laboratory tests were performed in adead-end UF unit with flat membranes and crossflow tests in a UF-pilotplant unit with tubular organic membranes.
2. Materials and methods
2.1. Activated sludge and flocculants
Activated sludge samples with a COD of 12,000 mg/L from a localwastewater treatment facility in northern Spain were used as the rawinfluent in this study. Theywere taken before a set of experimentswascarried out. Their properties (pH, conductivity and mixed liquorsuspended solid (MLSS) concentration) are shown in Table 1.
Three liquid commercial flocculants were used: two cationicpolymers (MPE30 and MPE50, PermaCare® MPE), supplied by Nalco
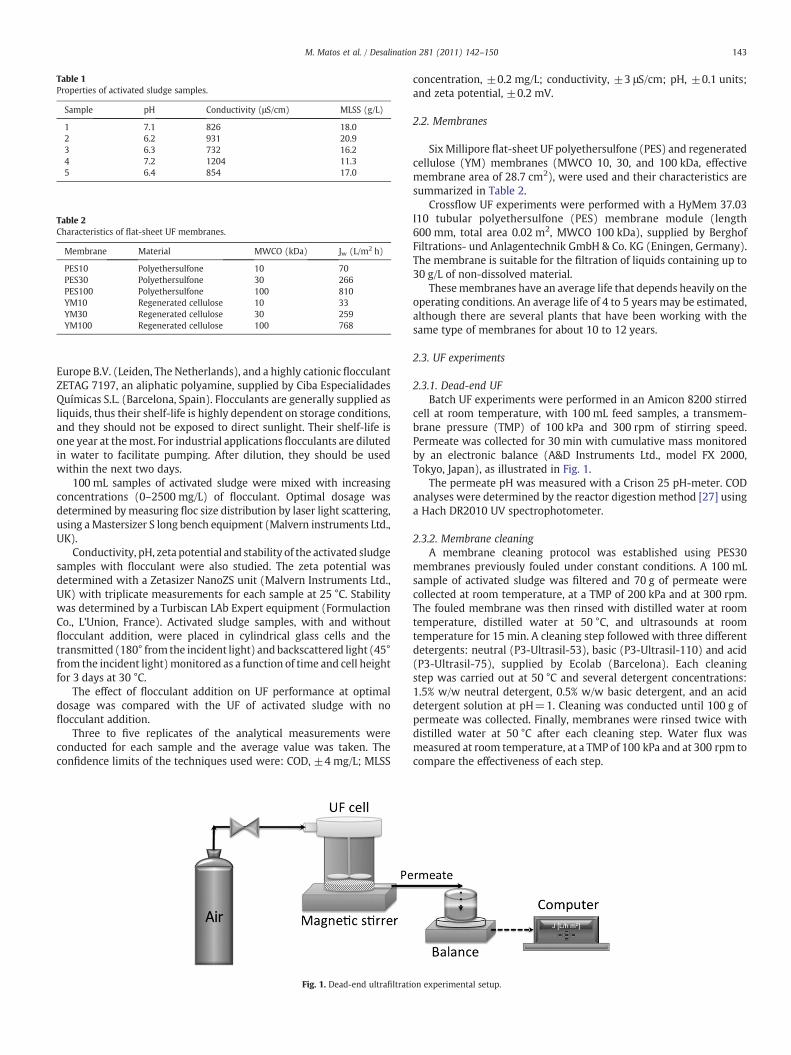
Table 1Properties of activated sludge samples.
Sample pH Conductivity (μS/cm) MLSS (g/L)
1 7.1 826 18.02 6.2 931 20.93 6.3 732 16.24 7.2 1204 11.35 6.4 854 17.0
Table 2Characteristics of flat-sheet UF membranes.
Membrane Material MWCO (kDa) Jw (L/m2 h)
PES10 Polyethersulfone 10 70PES30 Polyethersulfone 30 266PES100 Polyethersulfone 100 810YM10 Regenerated cellulose 10 33YM30 Regenerated cellulose 30 259YM100 Regenerated cellulose 100 768
143M. Matos et al. / Desalination 281 (2011) 142–150
Europe B.V. (Leiden, The Netherlands), and a highly cationic flocculantZETAG 7197, an aliphatic polyamine, supplied by Ciba EspecialidadesQuímicas S.L. (Barcelona, Spain). Flocculants are generally supplied asliquids, thus their shelf-life is highly dependent on storage conditions,and they should not be exposed to direct sunlight. Their shelf-life isone year at themost. For industrial applications flocculants are dilutedin water to facilitate pumping. After dilution, they should be usedwithin the next two days.
100 mL samples of activated sludge were mixed with increasingconcentrations (0–2500 mg/L) of flocculant. Optimal dosage wasdetermined bymeasuring floc size distribution by laser light scattering,using aMastersizer S long bench equipment (Malvern instruments Ltd.,UK).
Conductivity, pH, zeta potential and stability of the activated sludgesamples with flocculant were also studied. The zeta potential wasdetermined with a Zetasizer NanoZS unit (Malvern Instruments Ltd.,UK) with triplicate measurements for each sample at 25 °C. Stabilitywas determined by a Turbiscan LAb Expert equipment (FormulactionCo., L'Union, France). Activated sludge samples, with and withoutflocculant addition, were placed in cylindrical glass cells and thetransmitted (180° from the incident light) and backscattered light (45°from the incident light)monitored as a function of time and cell heightfor 3 days at 30 °C.
The effect of flocculant addition on UF performance at optimaldosage was compared with the UF of activated sludge with noflocculant addition.
Three to five replicates of the analytical measurements wereconducted for each sample and the average value was taken. Theconfidence limits of the techniques used were: COD, ±4 mg/L; MLSS
Fig. 1. Dead-end ultrafiltrati
concentration, ±0.2 mg/L; conductivity, ±3 μS/cm; pH, ±0.1 units;and zeta potential, ±0.2 mV.
2.2. Membranes
SixMillipore flat-sheet UF polyethersulfone (PES) and regeneratedcellulose (YM) membranes (MWCO 10, 30, and 100 kDa, effectivemembrane area of 28.7 cm2), were used and their characteristics aresummarized in Table 2.
Crossflow UF experiments were performed with a HyMem 37.03I10 tubular polyethersulfone (PES) membrane module (length600 mm, total area 0.02 m2, MWCO 100 kDa), supplied by BerghofFiltrations- und Anlagentechnik GmbH & Co. KG (Eningen, Germany).The membrane is suitable for the filtration of liquids containing up to30 g/L of non-dissolved material.
Thesemembranes have an average life that depends heavily on theoperating conditions. An average life of 4 to 5 years may be estimated,although there are several plants that have been working with thesame type of membranes for about 10 to 12 years.
2.3. UF experiments
2.3.1. Dead-end UFBatch UF experiments were performed in an Amicon 8200 stirred
cell at room temperature, with 100 mL feed samples, a transmem-brane pressure (TMP) of 100 kPa and 300 rpm of stirring speed.Permeate was collected for 30 min with cumulative mass monitoredby an electronic balance (A&D Instruments Ltd., model FX 2000,Tokyo, Japan), as illustrated in Fig. 1.
The permeate pH was measured with a Crison 25 pH-meter. CODanalyses were determined by the reactor digestion method [27] usinga Hach DR2010 UV spectrophotometer.
2.3.2. Membrane cleaningA membrane cleaning protocol was established using PES30
membranes previously fouled under constant conditions. A 100 mLsample of activated sludge was filtered and 70 g of permeate werecollected at room temperature, at a TMP of 200 kPa and at 300 rpm.The fouled membrane was then rinsed with distilled water at roomtemperature, distilled water at 50 °C, and ultrasounds at roomtemperature for 15 min. A cleaning step followed with three differentdetergents: neutral (P3-Ultrasil-53), basic (P3-Ultrasil-110) and acid(P3-Ultrasil-75), supplied by Ecolab (Barcelona). Each cleaningstep was carried out at 50 °C and several detergent concentrations:1.5% w/w neutral detergent, 0.5% w/w basic detergent, and an aciddetergent solution at pH=1. Cleaning was conducted until 100 g ofpermeate was collected. Finally, membranes were rinsed twice withdistilled water at 50 °C after each cleaning step. Water flux wasmeasured at room temperature, at a TMP of 100 kPa and at 300 rpm tocompare the effectiveness of each step.
on experimental setup.
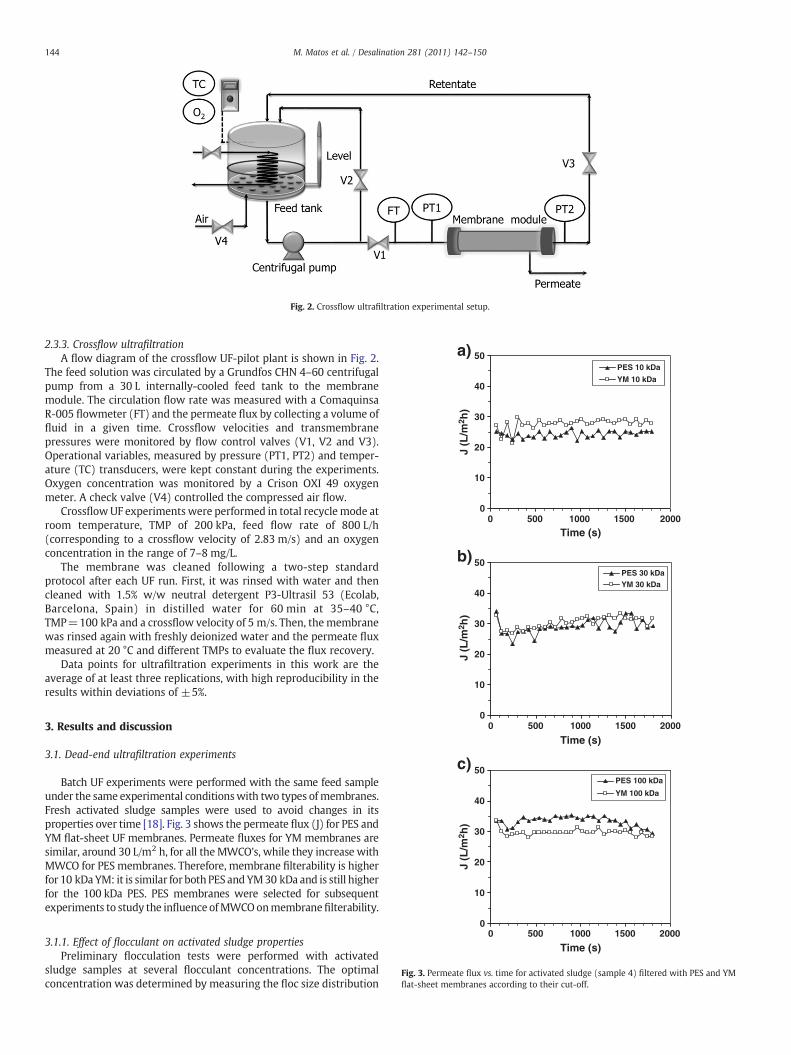
Fig. 2. Crossflow ultrafiltration experimental setup.
0
10
20
30
40
50
0 500 1000 1500 2000
Time (s)
J (L
/m2 h
)J
(L/m
2 h)
J (L
/m2 h
)
PES 10 kDa
YM 10 kDa
a)
0
10
20
30
40
50
0 500 1000 1500 2000
Time (s)
PES 30 kDaYM 30 kDa
b)
0
10
20
30
40
50
0 500 1000 1500 2000
Time (s)
PES 100 kDa
YM 100 kDa
c)
Fig. 3. Permeate flux vs. time for activated sludge (sample 4) filtered with PES and YMflat-sheet membranes according to their cut-off.
144 M. Matos et al. / Desalination 281 (2011) 142–150
2.3.3. Crossflow ultrafiltrationA flow diagram of the crossflow UF-pilot plant is shown in Fig. 2.
The feed solution was circulated by a Grundfos CHN 4–60 centrifugalpump from a 30 L internally-cooled feed tank to the membranemodule. The circulation flow rate was measured with a ComaquinsaR-005 flowmeter (FT) and the permeate flux by collecting a volume offluid in a given time. Crossflow velocities and transmembranepressures were monitored by flow control valves (V1, V2 and V3).Operational variables, measured by pressure (PT1, PT2) and temper-ature (TC) transducers, were kept constant during the experiments.Oxygen concentration was monitored by a Crison OXI 49 oxygenmeter. A check valve (V4) controlled the compressed air flow.
CrossflowUF experiments were performed in total recyclemode atroom temperature, TMP of 200 kPa, feed flow rate of 800 L/h(corresponding to a crossflow velocity of 2.83 m/s) and an oxygenconcentration in the range of 7–8 mg/L.
The membrane was cleaned following a two-step standardprotocol after each UF run. First, it was rinsed with water and thencleaned with 1.5% w/w neutral detergent P3-Ultrasil 53 (Ecolab,Barcelona, Spain) in distilled water for 60 min at 35–40 °C,TMP=100 kPa and a crossflow velocity of 5 m/s. Then, themembranewas rinsed again with freshly deionized water and the permeate fluxmeasured at 20 °C and different TMPs to evaluate the flux recovery.
Data points for ultrafiltration experiments in this work are theaverage of at least three replications, with high reproducibility in theresults within deviations of ±5%.
3. Results and discussion
3.1. Dead-end ultrafiltration experiments
Batch UF experiments were performed with the same feed sampleunder the same experimental conditionswith two types ofmembranes.Fresh activated sludge samples were used to avoid changes in itsproperties over time [18]. Fig. 3 shows the permeate flux (J) for PES andYM flat-sheet UF membranes. Permeate fluxes for YM membranes aresimilar, around 30 L/m2 h, for all theMWCO's, while they increase withMWCO for PES membranes. Therefore, membrane filterability is higherfor 10 kDaYM: it is similar for bothPES andYM30 kDa and is still higherfor the 100 kDa PES. PES membranes were selected for subsequentexperiments to study the influence ofMWCOonmembranefilterability.
3.1.1. Effect of flocculant on activated sludge propertiesPreliminary flocculation tests were performed with activated
sludge samples at several flocculant concentrations. The optimalconcentration was determined by measuring the floc size distribution
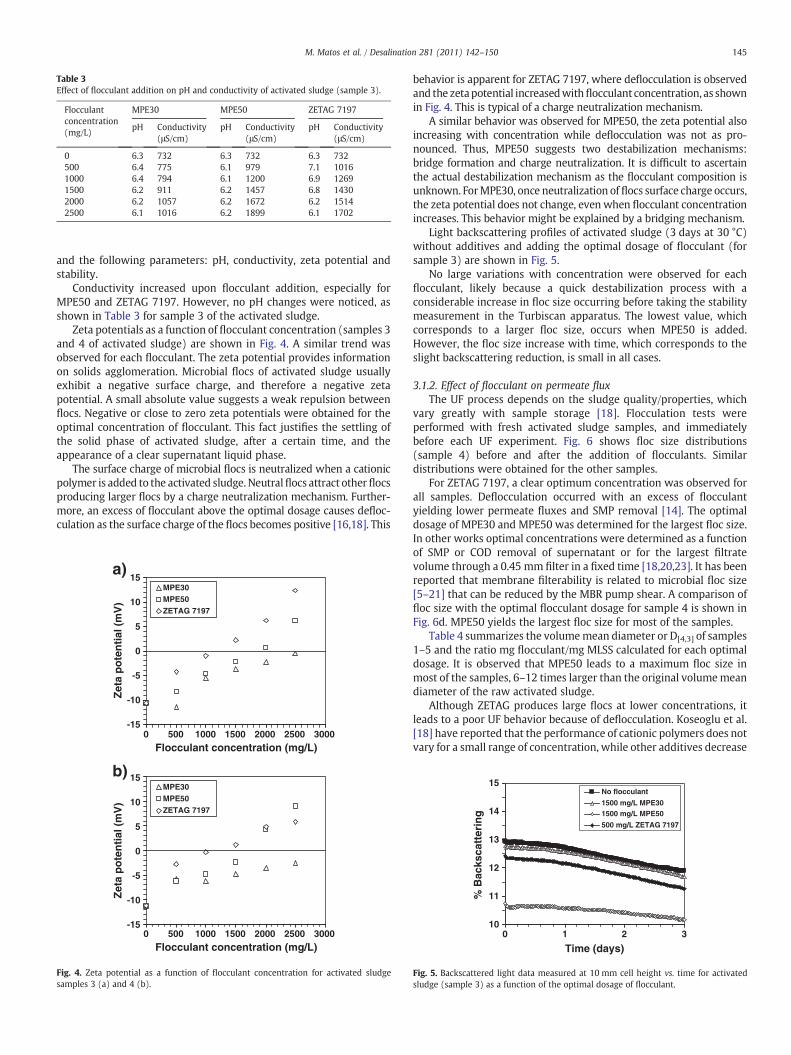
Table 3Effect of flocculant addition on pH and conductivity of activated sludge (sample 3).
Flocculantconcentration(mg/L)
MPE30 MPE50 ZETAG 7197
pH Conductivity(μS/cm)
pH Conductivity(μS/cm)
pH Conductivity(μS/cm)
0 6.3 732 6.3 732 6.3 732500 6.4 775 6.1 979 7.1 10161000 6.4 794 6.1 1200 6.9 12691500 6.2 911 6.2 1457 6.8 14302000 6.2 1057 6.2 1672 6.2 15142500 6.1 1016 6.2 1899 6.1 1702
145M. Matos et al. / Desalination 281 (2011) 142–150
and the following parameters: pH, conductivity, zeta potential andstability.
Conductivity increased upon flocculant addition, especially forMPE50 and ZETAG 7197. However, no pH changes were noticed, asshown in Table 3 for sample 3 of the activated sludge.
Zeta potentials as a function of flocculant concentration (samples 3and 4 of activated sludge) are shown in Fig. 4. A similar trend wasobserved for each flocculant. The zeta potential provides informationon solids agglomeration. Microbial flocs of activated sludge usuallyexhibit a negative surface charge, and therefore a negative zetapotential. A small absolute value suggests a weak repulsion betweenflocs. Negative or close to zero zeta potentials were obtained for theoptimal concentration of flocculant. This fact justifies the settling ofthe solid phase of activated sludge, after a certain time, and theappearance of a clear supernatant liquid phase.
The surface charge of microbial flocs is neutralized when a cationicpolymer is added to the activated sludge. Neutralflocs attract otherflocsproducing larger flocs by a charge neutralization mechanism. Further-more, an excess of flocculant above the optimal dosage causes defloc-culation as the surface charge of the flocs becomes positive [16,18]. This
-15
-10
-5
0
5
10
15
0 500 1000 1500 2000 2500 3000
Flocculant concentration (mg/L)
0 500 1000 1500 2000 2500 3000
Flocculant concentration (mg/L)
MPE30MPE50ZETAG 7197
a)
Zet
a p
ote
nti
al (
mV
)
-15
-10
-5
0
5
10
15
Zet
a p
ote
nti
al (
mV
)
MPE30MPE50ZETAG 7197
b)
Fig. 4. Zeta potential as a function of flocculant concentration for activated sludgesamples 3 (a) and 4 (b).
behavior is apparent for ZETAG 7197, where deflocculation is observedand the zetapotential increasedwithflocculant concentration, as shownin Fig. 4. This is typical of a charge neutralization mechanism.
A similar behavior was observed for MPE50, the zeta potential alsoincreasing with concentration while deflocculation was not as pro-nounced. Thus, MPE50 suggests two destabilization mechanisms:bridge formation and charge neutralization. It is difficult to ascertainthe actual destabilization mechanism as the flocculant composition isunknown. ForMPE30, once neutralization of flocs surface charge occurs,the zeta potential does not change, even when flocculant concentrationincreases. This behavior might be explained by a bridging mechanism.
Light backscattering profiles of activated sludge (3 days at 30 °C)without additives and adding the optimal dosage of flocculant (forsample 3) are shown in Fig. 5.
No large variations with concentration were observed for eachflocculant, likely because a quick destabilization process with aconsiderable increase in floc size occurring before taking the stabilitymeasurement in the Turbiscan apparatus. The lowest value, whichcorresponds to a larger floc size, occurs when MPE50 is added.However, the floc size increase with time, which corresponds to theslight backscattering reduction, is small in all cases.
3.1.2. Effect of flocculant on permeate fluxThe UF process depends on the sludge quality/properties, which
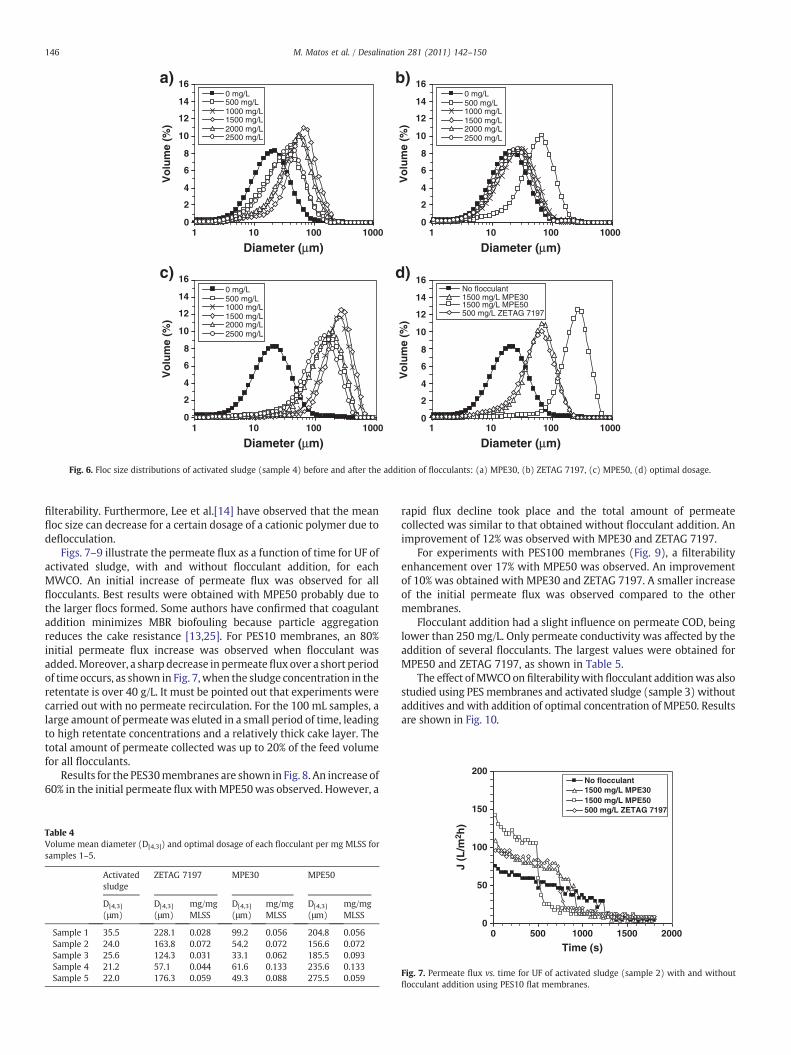
vary greatly with sample storage [18]. Flocculation tests wereperformed with fresh activated sludge samples, and immediatelybefore each UF experiment. Fig. 6 shows floc size distributions(sample 4) before and after the addition of flocculants. Similardistributions were obtained for the other samples.
For ZETAG 7197, a clear optimum concentration was observed forall samples. Deflocculation occurred with an excess of flocculantyielding lower permeate fluxes and SMP removal [14]. The optimaldosage of MPE30 and MPE50 was determined for the largest floc size.In other works optimal concentrations were determined as a functionof SMP or COD removal of supernatant or for the largest filtratevolume through a 0.45 mm filter in a fixed time [18,20,23]. It has beenreported that membrane filterability is related to microbial floc size[5–21] that can be reduced by the MBR pump shear. A comparison offloc size with the optimal flocculant dosage for sample 4 is shown inFig. 6d. MPE50 yields the largest floc size for most of the samples.
Table 4 summarizes the volumemean diameter or D[4,3] of samples1–5 and the ratio mg flocculant/mg MLSS calculated for each optimaldosage. It is observed that MPE50 leads to a maximum floc size inmost of the samples, 6–12 times larger than the original volumemeandiameter of the raw activated sludge.
Although ZETAG produces large flocs at lower concentrations, itleads to a poor UF behavior because of deflocculation. Koseoglu et al.[18] have reported that the performance of cationic polymers does notvary for a small range of concentration, while other additives decrease
10
11
12
13
14
15
0 1 2 3
Time (days)
% B
acks
catt
erin
g
No flocculant
1500 mg/L MPE301500 mg/L MPE50
500 mg/L ZETAG 7197
Fig. 5. Backscattered light data measured at 10 mm cell height vs. time for activatedsludge (sample 3) as a function of the optimal dosage of flocculant.
0
2
4
6
8
10
12
14
16
1 10 100 1000
Diameter (µm)
1 10 100 1000
Diameter (µm)
1 10 100 1000
Diameter (µm)
1 10 100 1000
Diameter (µm)
Vo
lum
e (%
)
0
2
4
6
8
10
12
14
16
Vo
lum
e (%
)
0
2
4
6
8
10
12
14
16
Vo
lum
e (%
)0
2
4
6
8
10
12
14
16
Vo
lum
e (%
)
0 mg/L500 mg/L1000 mg/L1500 mg/L2000 mg/L2500 mg/L
0 mg/L500 mg/L1000 mg/L1500 mg/L2000 mg/L2500 mg/L
0 mg/L500 mg/L1000 mg/L1500 mg/L2000 mg/L2500 mg/L
No flocculant1500 mg/L MPE301500 mg/L MPE50500 mg/L ZETAG 7197
c) d)
a) b)
Fig. 6. Floc size distributions of activated sludge (sample 4) before and after the addition of flocculants: (a) MPE30, (b) ZETAG 7197, (c) MPE50, (d) optimal dosage.
200No flocculant1500 mg/L MPE30
146 M. Matos et al. / Desalination 281 (2011) 142–150
filterability. Furthermore, Lee et al.[14] have observed that the meanfloc size can decrease for a certain dosage of a cationic polymer due todeflocculation.
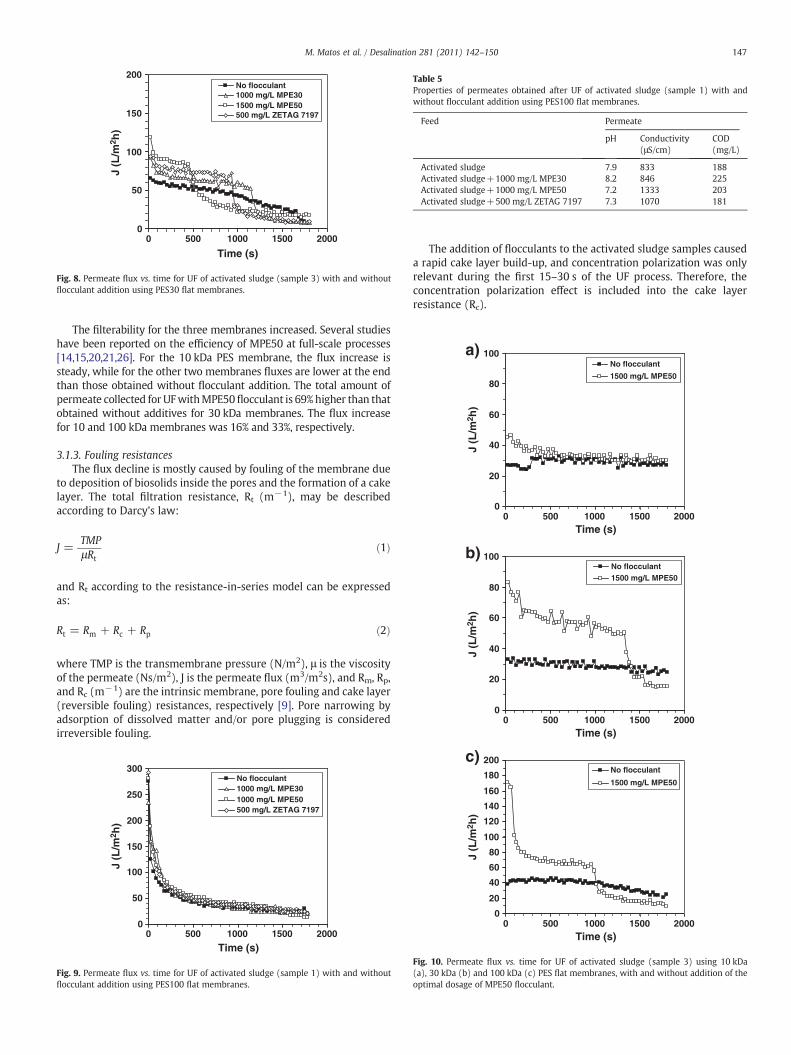
Figs. 7–9 illustrate the permeate flux as a function of time for UF ofactivated sludge, with and without flocculant addition, for eachMWCO. An initial increase of permeate flux was observed for allflocculants. Best results were obtained with MPE50 probably due tothe larger flocs formed. Some authors have confirmed that coagulantaddition minimizes MBR biofouling because particle aggregationreduces the cake resistance [13,25]. For PES10 membranes, an 80%initial permeate flux increase was observed when flocculant wasadded.Moreover, a sharp decrease in permeateflux over a short periodof time occurs, as shown in Fig. 7, when the sludge concentration in theretentate is over 40 g/L. It must be pointed out that experiments werecarried out with no permeate recirculation. For the 100 mL samples, alarge amount of permeatewas eluted in a small period of time, leadingto high retentate concentrations and a relatively thick cake layer. Thetotal amount of permeate collected was up to 20% of the feed volumefor all flocculants.
Results for the PES30membranes are shown in Fig. 8. An increase of60% in the initial permeate fluxwithMPE50was observed. However, a
Table 4Volume mean diameter (D[4,3]) and optimal dosage of each flocculant per mg MLSS forsamples 1–5.
Activatedsludge
ZETAG 7197 MPE30 MPE50
D[4,3]
(μm)D[4,3]
(μm)mg/mgMLSS
D[4,3]
(μm)mg/mgMLSS
D[4,3]
(μm)mg/mgMLSS
Sample 1 35.5 228.1 0.028 99.2 0.056 204.8 0.056Sample 2 24.0 163.8 0.072 54.2 0.072 156.6 0.072Sample 3 25.6 124.3 0.031 33.1 0.062 185.5 0.093Sample 4 21.2 57.1 0.044 61.6 0.133 235.6 0.133Sample 5 22.0 176.3 0.059 49.3 0.088 275.5 0.059
rapid flux decline took place and the total amount of permeatecollected was similar to that obtained without flocculant addition. Animprovement of 12% was observed with MPE30 and ZETAG 7197.
For experiments with PES100 membranes (Fig. 9), a filterabilityenhancement over 17% with MPE50 was observed. An improvementof 10% was obtained with MPE30 and ZETAG 7197. A smaller increaseof the initial permeate flux was observed compared to the othermembranes.
Flocculant addition had a slight influence on permeate COD, beinglower than 250 mg/L. Only permeate conductivity was affected by theaddition of several flocculants. The largest values were obtained forMPE50 and ZETAG 7197, as shown in Table 5.
The effect ofMWCOon filterabilitywith flocculant additionwas alsostudied using PES membranes and activated sludge (sample 3) withoutadditives and with addition of optimal concentration of MPE50. Resultsare shown in Fig. 10.
0
50
100
150
0 500 1000 1500 2000
Time (s)
J (L
/m2 h
)
1500 mg/L MPE50500 mg/L ZETAG 7197
Fig. 7. Permeate flux vs. time for UF of activated sludge (sample 2) with and withoutflocculant addition using PES10 flat membranes.
0
50
100
150
200
0 500 1000 1500 2000
Time (s)
J (L
/m2 h
)
No flocculant1000 mg/L MPE301500 mg/L MPE50500 mg/L ZETAG 7197
Fig. 8. Permeate flux vs. time for UF of activated sludge (sample 3) with and withoutflocculant addition using PES30 flat membranes.
Table 5Properties of permeates obtained after UF of activated sludge (sample 1) with andwithout flocculant addition using PES100 flat membranes.
Feed Permeate
pH Conductivity(μS/cm)
COD(mg/L)
Activated sludge 7.9 833 188Activated sludge+1000 mg/L MPE30 8.2 846 225Activated sludge+1000 mg/L MPE50 7.2 1333 203Activated sludge+500 mg/L ZETAG 7197 7.3 1070 181
0
20
40
60
80
100
0 500 1000 1500 2000Time (s)
0 500 1000 1500 2000Time (s)
J (L
/m2 h
)J
(L/m
2 h)
No flocculant
1500 mg/L MPE50
a)
0
20
40
60
80
100No flocculant1500 mg/L MPE50
b)
147M. Matos et al. / Desalination 281 (2011) 142–150
The filterability for the three membranes increased. Several studieshave been reported on the efficiency of MPE50 at full-scale processes[14,15,20,21,26]. For the 10 kDa PES membrane, the flux increase issteady, while for the other two membranes fluxes are lower at the endthan those obtained without flocculant addition. The total amount ofpermeate collected for UFwithMPE50flocculant is 69%higher than thatobtained without additives for 30 kDa membranes. The flux increasefor 10 and 100 kDa membranes was 16% and 33%, respectively.
3.1.3. Fouling resistancesThe flux decline is mostly caused by fouling of the membrane due
to deposition of biosolids inside the pores and the formation of a cakelayer. The total filtration resistance, Rt (m−1), may be describedaccording to Darcy's law:
J =TMPμRt
ð1Þ
and Rt according to the resistance-in-series model can be expressedas:
Rt = Rm + Rc + Rp ð2Þ
where TMP is the transmembrane pressure (N/m2), μ is the viscosityof the permeate (Ns/m2), J is the permeate flux (m3/m2s), and Rm, Rp,and Rc (m−1) are the intrinsic membrane, pore fouling and cake layer(reversible fouling) resistances, respectively [9]. Pore narrowing byadsorption of dissolved matter and/or pore plugging is consideredirreversible fouling.
0
50
100
150
200
250
300
0 500 1000 1500 2000
Time (s)
J (L
/m2 h
)
No flocculant1000 mg/L MPE301000 mg/L MPE50500 mg/L ZETAG 7197
Fig. 9. Permeate flux vs. time for UF of activated sludge (sample 1) with and withoutflocculant addition using PES100 flat membranes.
The addition of flocculants to the activated sludge samples causeda rapid cake layer build-up, and concentration polarization was onlyrelevant during the first 15–30 s of the UF process. Therefore, theconcentration polarization effect is included into the cake layerresistance (Rc).
0 500 1000 1500 2000Time (s)
J (L
/m2 h
)
0
20
40
60
80
100
120
140
160
180
200No flocculant
1500 mg/L MPE50
c)
Fig. 10. Permeate flux vs. time for UF of activated sludge (sample 3) using 10 kDa(a), 30 kDa (b) and 100 kDa (c) PES flat membranes, with and without addition of theoptimal dosage of MPE50 flocculant.
0
10
20
30
40
0 500 1000 1500 2000
Time (s)
Rf x
10-
12 (
m-1
)No flocculant, PES 10 kDa1500 mg/L MPE50, PES 10 kDaNo flocculant, PES 30 kDa1500 mg/L MPE50, PES 30 kDaNo flocculant, PES 100 kDa1500 mg/L MPE50, PES 100 kDa
Fig. 11. Fouling resistance vs. time for UF of activated sludge (sample 3) using 10 kDa,30 kDa and 100 kDa PES flat membranes, with and without addition of the optimaldosage of MPE50 flocculant.
Table 6Cake resistances (αCw) for UF of activated sludge with and without flocculant additionusing PES100 flat membranes.
UF test r2 αCw×10−15 (m−2)
Activated sludge 0.999 3.44Activated sludge+1500 mg/L MPE30 0.995 2.33Activated sludge+1500 mg/L MPE50 0.992 2.93Activated sludge+1500 mg/L ZETAG 7197 0.999 2.63
148 M. Matos et al. / Desalination 281 (2011) 142–150
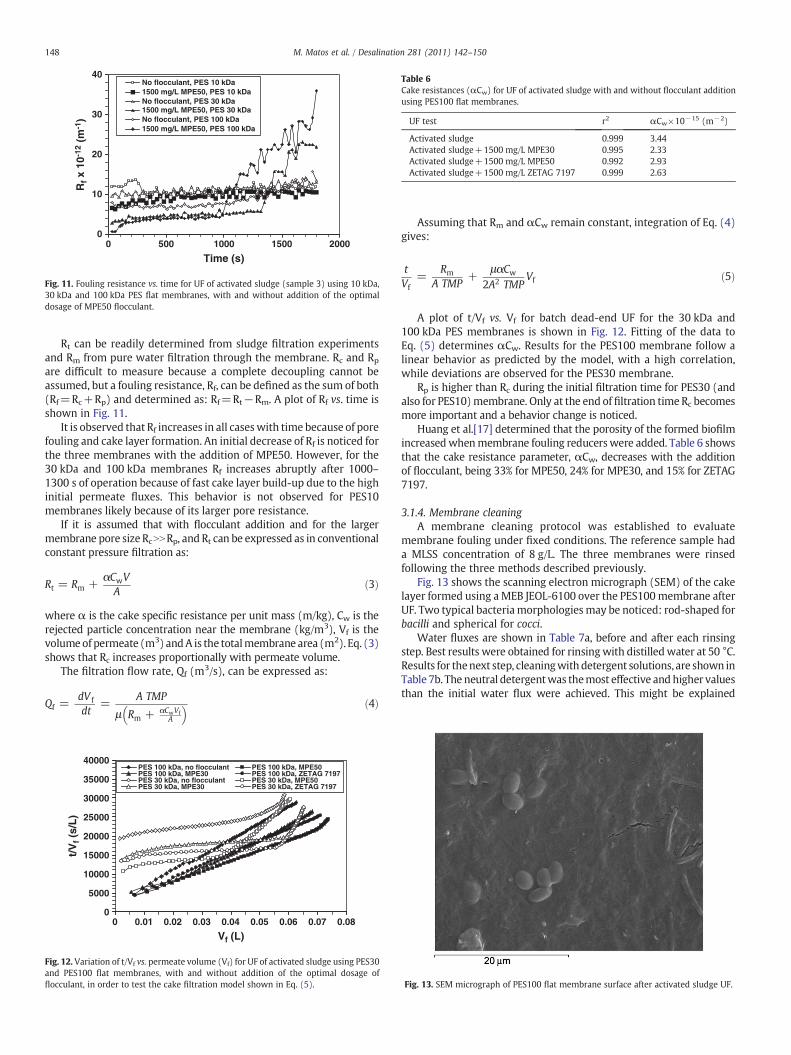
Rt can be readily determined from sludge filtration experimentsand Rm from pure water filtration through the membrane. Rc and Rp
are difficult to measure because a complete decoupling cannot beassumed, but a fouling resistance, Rf, can be defined as the sum of both(Rf=Rc+Rp) and determined as: Rf=Rt−Rm. A plot of Rf vs. time isshown in Fig. 11.
It is observed that Rf increases in all caseswith time because of porefouling and cake layer formation. An initial decrease of Rf is noticed forthe three membranes with the addition of MPE50. However, for the30 kDa and 100 kDa membranes Rf increases abruptly after 1000–1300 s of operation because of fast cake layer build-up due to the highinitial permeate fluxes. This behavior is not observed for PES10membranes likely because of its larger pore resistance.
If it is assumed that with flocculant addition and for the largermembrane pore size RcNNRp, and Rt can be expressed as in conventionalconstant pressure filtration as:
Rt = Rm +αCwVA
ð3Þ
where α is the cake specific resistance per unit mass (m/kg), Cw is therejected particle concentration near the membrane (kg/m3), Vf is thevolumeof permeate (m3) andA is the totalmembrane area (m2). Eq. (3)shows that Rc increases proportionally with permeate volume.
The filtration flow rate, Qf (m3/s), can be expressed as:
Qf =dV f
dt=
A TMP
μ Rm + αCwVfA
� � ð4Þ
0
5000
10000
15000
20000
25000
30000
35000
40000
0 0.01 0.02 0.03 0.04 0.05 0.06 0.07 0.08
Vf (L)
t/V
f (s/
L)
PES 100 kDa, no flocculant PES 100 kDa, MPE50PES 100 kDa, MPE30 PES 100 kDa, ZETAG 7197PES 30 kDa, no flocculant PES 30 kDa, MPE50PES 30 kDa, MPE30 PES 30 kDa, ZETAG 7197
Fig. 12. Variation of t/Vf vs. permeate volume (Vf) for UF of activated sludge using PES30and PES100 flat membranes, with and without addition of the optimal dosage offlocculant, in order to test the cake filtration model shown in Eq. (5).
Assuming that Rm and αCw remain constant, integration of Eq. (4)gives:
tVf
=Rm
A TMP+
μαCw
2A2 TMPVf ð5Þ
A plot of t/Vf vs. Vf for batch dead-end UF for the 30 kDa and100 kDa PES membranes is shown in Fig. 12. Fitting of the data toEq. (5) determines αCw. Results for the PES100 membrane follow alinear behavior as predicted by the model, with a high correlation,while deviations are observed for the PES30 membrane.
Rp is higher than Rc during the initial filtration time for PES30 (andalso for PES10)membrane. Only at the end of filtration time Rc becomesmore important and a behavior change is noticed.
Huang et al.[17] determined that the porosity of the formed biofilmincreasedwhenmembrane fouling reducerswere added. Table 6 showsthat the cake resistance parameter, αCw, decreases with the additionof flocculant, being 33% for MPE50, 24% for MPE30, and 15% for ZETAG7197.
3.1.4. Membrane cleaningA membrane cleaning protocol was established to evaluate
membrane fouling under fixed conditions. The reference sample hada MLSS concentration of 8 g/L. The three membranes were rinsedfollowing the three methods described previously.
Fig. 13 shows the scanning electron micrograph (SEM) of the cakelayer formed using a MEB JEOL-6100 over the PES100membrane afterUF. Two typical bacteriamorphologiesmay be noticed: rod-shaped forbacilli and spherical for cocci.
Water fluxes are shown in Table 7a, before and after each rinsingstep. Best results were obtained for rinsingwith distilledwater at 50 °C.Results for thenext step, cleaningwithdetergent solutions, are shown inTable 7b. The neutral detergentwas themost effective andhigher valuesthan the initial water flux were achieved. This might be explained
Fig. 13. SEM micrograph of PES100 flat membrane surface after activated sludge UF.
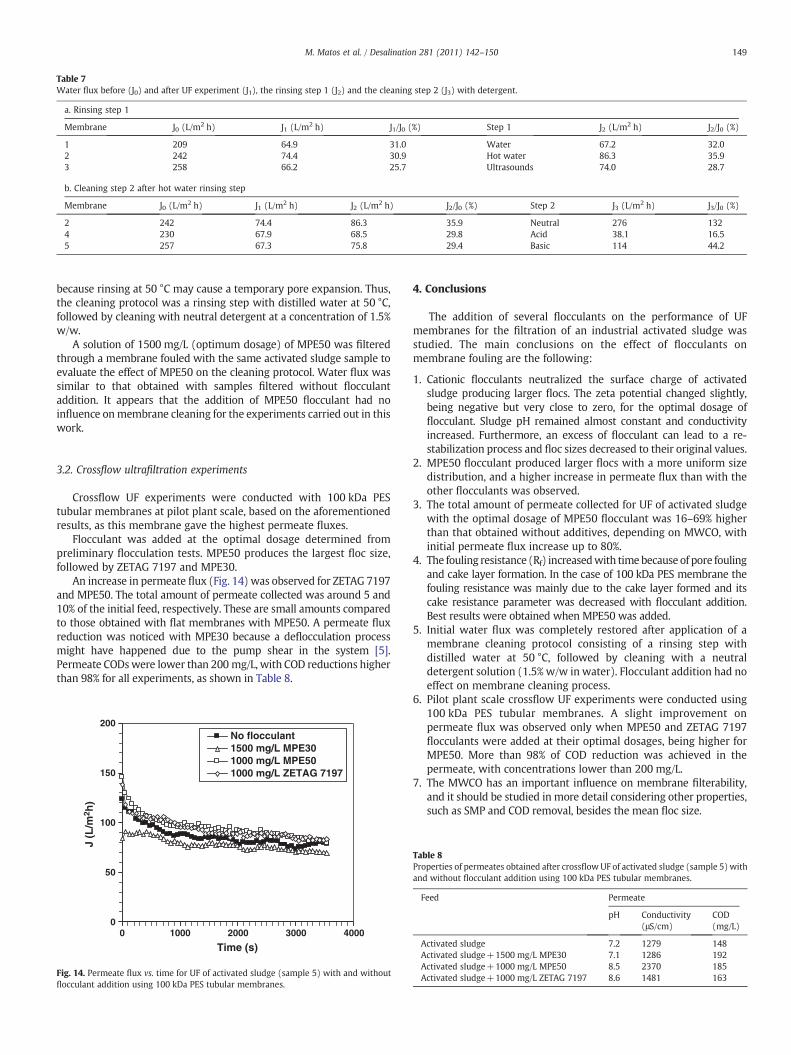
Table 7Water flux before (J0) and after UF experiment (J1), the rinsing step 1 (J2) and the cleaning step 2 (J3) with detergent.
a. Rinsing step 1
Membrane J0 (L/m2 h) J1 (L/m2 h) J1/J0 (%) Step 1 J2 (L/m2 h) J2/J0 (%)
1 209 64.9 31.0 Water 67.2 32.02 242 74.4 30.9 Hot water 86.3 35.93 258 66.2 25.7 Ultrasounds 74.0 28.7
b. Cleaning step 2 after hot water rinsing step
Membrane J0 (L/m2 h) J1 (L/m2 h) J2 (L/m2 h) J2/J0 (%) Step 2 J3 (L/m2 h) J3/J0 (%)
2 242 74.4 86.3 35.9 Neutral 276 1324 230 67.9 68.5 29.8 Acid 38.1 16.55 257 67.3 75.8 29.4 Basic 114 44.2
149M. Matos et al. / Desalination 281 (2011) 142–150
because rinsing at 50 °C may cause a temporary pore expansion. Thus,the cleaning protocol was a rinsing step with distilled water at 50 °C,followed by cleaning with neutral detergent at a concentration of 1.5%w/w.
A solution of 1500 mg/L (optimum dosage) of MPE50 was filteredthrough a membrane fouled with the same activated sludge sample toevaluate the effect of MPE50 on the cleaning protocol. Water flux wassimilar to that obtained with samples filtered without flocculantaddition. It appears that the addition of MPE50 flocculant had noinfluence onmembrane cleaning for the experiments carried out in thiswork.
3.2. Crossflow ultrafiltration experiments
Crossflow UF experiments were conducted with 100 kDa PEStubular membranes at pilot plant scale, based on the aforementionedresults, as this membrane gave the highest permeate fluxes.
Flocculant was added at the optimal dosage determined frompreliminary flocculation tests. MPE50 produces the largest floc size,followed by ZETAG 7197 and MPE30.
An increase in permeate flux (Fig. 14) was observed for ZETAG 7197and MPE50. The total amount of permeate collected was around 5 and10% of the initial feed, respectively. These are small amounts comparedto those obtained with flat membranes with MPE50. A permeate fluxreduction was noticed with MPE30 because a deflocculation processmight have happened due to the pump shear in the system [5].Permeate CODswere lower than 200 mg/L, with COD reductions higherthan 98% for all experiments, as shown in Table 8.
0
50
100
150
200
0 1000 2000 3000 4000
Time (s)
J (L
/m2 h
)
No flocculant1500 mg/L MPE301000 mg/L MPE501000 mg/L ZETAG 7197
Fig. 14. Permeate flux vs. time for UF of activated sludge (sample 5) with and withoutflocculant addition using 100 kDa PES tubular membranes.
4. Conclusions
The addition of several flocculants on the performance of UFmembranes for the filtration of an industrial activated sludge wasstudied. The main conclusions on the effect of flocculants onmembrane fouling are the following:
1. Cationic flocculants neutralized the surface charge of activatedsludge producing larger flocs. The zeta potential changed slightly,being negative but very close to zero, for the optimal dosage offlocculant. Sludge pH remained almost constant and conductivityincreased. Furthermore, an excess of flocculant can lead to a re-stabilization process and floc sizes decreased to their original values.
2. MPE50 flocculant produced larger flocs with a more uniform sizedistribution, and a higher increase in permeate flux than with theother flocculants was observed.
3. The total amount of permeate collected for UF of activated sludgewith the optimal dosage of MPE50 flocculant was 16–69% higherthan that obtained without additives, depending on MWCO, withinitial permeate flux increase up to 80%.
4. The fouling resistance (Rf) increasedwith timebecause of pore foulingand cake layer formation. In the case of 100 kDa PES membrane thefouling resistance was mainly due to the cake layer formed and itscake resistance parameter was decreased with flocculant addition.Best results were obtained when MPE50 was added.
5. Initial water flux was completely restored after application of amembrane cleaning protocol consisting of a rinsing step withdistilled water at 50 °C, followed by cleaning with a neutraldetergent solution (1.5% w/w in water). Flocculant addition had noeffect on membrane cleaning process.
6. Pilot plant scale crossflow UF experiments were conducted using100 kDa PES tubular membranes. A slight improvement onpermeate flux was observed only when MPE50 and ZETAG 7197flocculants were added at their optimal dosages, being higher forMPE50. More than 98% of COD reduction was achieved in thepermeate, with concentrations lower than 200 mg/L.
7. The MWCO has an important influence on membrane filterability,and it should be studied in more detail considering other properties,such as SMP and COD removal, besides the mean floc size.
Table 8Properties of permeates obtained after crossflowUF of activated sludge (sample 5) withand without flocculant addition using 100 kDa PES tubular membranes.
Feed Permeate
pH Conductivity(μS/cm)
COD(mg/L)
Activated sludge 7.2 1279 148Activated sludge+1500 mg/L MPE30 7.1 1286 192Activated sludge+1000 mg/L MPE50 8.5 2370 185Activated sludge+1000 mg/L ZETAG 7197 8.6 1481 163
150 M. Matos et al. / Desalination 281 (2011) 142–150
References
[1] S. Rosenberger, U. Krüger, R. Witzig, W. Manz, U. Szewzyk, M. Kraume,Performance of a bioreactor with submerged membranes for aerobic treatmentof municipal waste water, Water Res. 36 (2002) 413–420.
[2] T. Stephenson, S. Judd, B. Jefferson, K. Brindle (Eds.), Membrane Bioreactors forWastewater Treatment, IWA Publishing, London, 2000.
[3] I.-S. Chang, C.-H. Lee, Membrane filtration characteristics in membrane-coupledactivate sludge system — the effect of physiological states of activate sludge onmembrane fouling, Desalination 120 (1998) 221–233.
[4] H. Choi, K. Zhang, D.D. Dionysiou, D.B. Oerther, G.A. Sorial, Effect of activatedsludge properties and membrane operation conditions on fouling characteristicsin membrane bioreactors, Chemosphere 63 (2006) 1699–1708.
[5] J.-S. Kim, C.-H. Lee, I.-S. Chang, Effect of pump shear on the performance of acrossflow membrane bioreactor, Water Res. 35 (2001) 2137–2144.
[6] S.P. Hong, T.H. Bae, T.M. Tak, S. Hong, A. Randall, Fouling control in activatedsludge submerged hollow fiber membrane bioreactors, Desalination 143 (2002)219–228.
[7] R. Bai, H.F. Leow, Microfiltration of activated sludge wastewater — the effect ofsystem operation parameters, Sep. Purif. Technol. 29 (2002) 189–198.
[8] H. Choi, K. Zhang, D.D. Dionysiou, D.B. Oerther, G.A. Sorial, Effect of permeate fluxand tangential flow on membrane fouling for wastewater treatment, Sep. Purif.Technol. 45 (2005) 68–78.
[9] H.H.P. Fang, X. Shi, Pore fouling of microfiltration membranes by activated sludge,J. Membr. Sci. 264 (2005) 161–166.
[10] D.J. Barker, D.C. Stuckey, A review of soluble microbial products (SMP) inwastewater treatment systems, Water Res. 33 (1999) 3063–3082.
[11] H. Nagaoka, S. Ueda, A. Miya, Influence of bacterial extracellular polymers on themembrane separation activated sludge process, Water Sci. Technol. 34 (9) (1996)165–172.
[12] S. Rosenberger, H. Evenblij, S. te Poele, T. Wintgens, C. Laabs, The importance ofliquid phase analyses to understand fouling in membrane assisted activatedsludge processes — six case studies of different European research groups,J. Membr. Sci. 263 (2005) 113–126.
[13] Z. Ahmed, J. Cho, B.-R. Lim, K.-G. Song, K.-H. Ahn, Effects of sludge retention time onmembrane fouling and microbial community structure in a membrane bioreactor,J. Membr. Sci. 287 (2007) 211–218.
[14] S.-H. Yoon, J.H. Collins, D. Musale, S. Sundarajaran, S.-P. Tsai, G.A. Hallsby, J.F. Kong,J. Koppes, P. Cachia, Effects of flux enhancing polymer on the characteristics ofsludge in membrane bioreactor process, Water Sci. Technol. 51 (2005) 151–157.
[15] T. Wozniak, MBR design and operation using MPE-technology (MembranePerformance Enhancer), Desalination 250 (2010) 723–728.
[16] W.-N. Lee, I.-S. Chang, B.-K. Hwang, P.-K. Park, C.-H. Lee, X. Huang, Changes inbiofilm architecture with addition of membrane fouling reducer in a membranebioreactor, Process. Biochem. 42 (2007) 655–661.
[17] B.-K. Hwang, W.-N. Lee, P.-K. Park, C.-H. Lee, I.-S. Chang, Effect of membranefouling reducer on cake structure and membrane permeability in membranebioreactor, J. Membr. Sci. 288 (2007) 149–156.
[18] H. Koseoglu, N.O. Yigit, V. Iversen, A. Drews, M. Kitis, B. Lesjean, M. Kraume, Effectsof several different flux enhancing chemicals on filterability and fouling reductionof membrane bioreactor (MBR) mixed liquors, J. Membr. Sci. 320 (2008) 57–64.
[19] J. Wu, F. Chen, X. Huang, W. Geng, X. Wen, Using inorganic coagulants to controlmembrane fouling in a submerged membrane bioreactor, Desalination 197 (2006)124–136.
[20] S.-H. Yoon, J.H. Collins, A novel flux enhancing method for membrane bioreactor(MBR) process using polymer, Desalination 191 (2006) 52–61.
[21] A. Drews, Membrane fouling in membrane bioreactors — Characterisation,contradictions, cause and cures, J. Membr. Sci. 363 (2010) 1–28.
[22] V. Iversen, R. Mehrez, R.Y. Horng, C.H. Chen, F. Meng, A. Drews, B. Lesjean, M. Ernst, M.Kraume, Foulingmitigation throughflocculants andadsorbents addition inmembranebioreactors: comparing lab and pilot studies, J. Membr. Sci. 345 (2009) 21–30.
[23] V. Iversen, H. Koseoglu, N.O. Yigit, A. Drews, M. Kitis, B. Lesjean, M. Kraume,Impacts of membrane flux enhancers on activated sludge respiration and nutrientremoval in MBRs, Water Res. 43 (2009) 822–830.
[24] K.-G. Song, Y. Kim, K.-H. Ahn, Effect of coagulant addition on membrane fouling andnutrient removal in a submerged membrane bioreactor, Desalination 221 (2008)467–474.
[25] S. Omer, S. Yaxi, H. Ailing, G. Ping, Effect of PAC addition on MBR process fordrinking water treatment, Sep. Purif. Technol. 58 (2008) 320–327.
[26] W.S. Guo, S. Vigneswaran, H.H. Ngo, J. Kandasamy, S. Yoon, The role of amembrane performance enhancer in a membrane bioreactor: a comparison withother submerged membrane hybrid systems, Desalination 231 (2008) 305–313.
[27] L.H. Keith, Compilation of EPA's Sampling and Analysis Methods, CRC Press,London, 1996.