Embed Size (px)
Citation preview

ULTRASONIC ATTENUATION IN BIS^rUTH SILICON OXIDE AND BISMUTH GERMANIUM OXIDE
by
Partnjit Kaur Sandhu M.Sc., Physics Department, Bedford College,
University of London.
A thesis submitted for the degree of Doctor of Philosophy
at the University of London
September,I98O

ProQuest Number: 10098393
All rights reserved
INFORMATION TO ALL USERS The quality of this reproduction is dependent upon the quality of the copy submitted.
In the unlikely event that the author did not send a complete manuscript and there are missing pages, these will be noted. Also, if material had to be removed,
a note will indicate the deletion.
uest.
ProQuest 10098393
Published by ProQuest LLC(2016). Copyright of the Dissertation is held by the Author.
All rights reserved.This work is protected against unauthorized copying under Title 17, United States Code.
Microform Edition © ProQuest LLC.
ProQuest LLC 789 East Eisenhower Parkway
P.Q. Box 1346 Ann Arbor, Ml 48106-1346
11
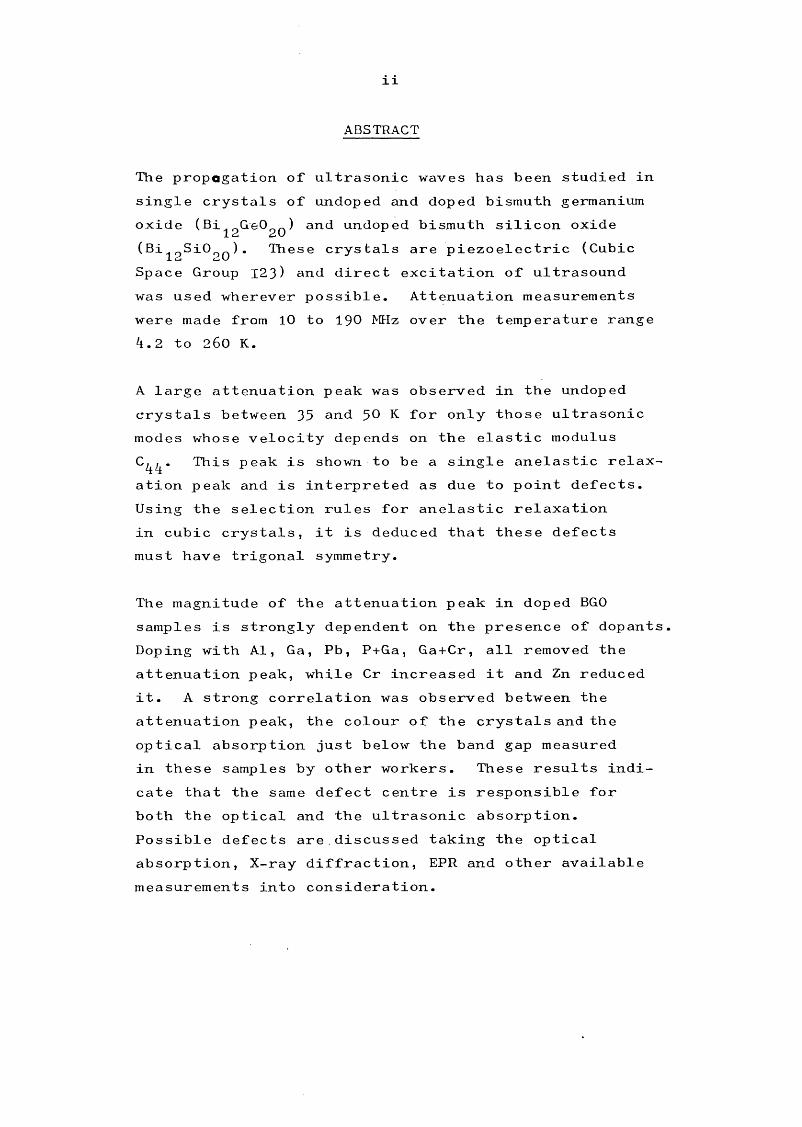
ABSTRACT
The propagation of ultrasonic waves has been studied in single crystals of undoped and doped bismuth germanium oxide (Bi^^GeOgQ) and undoped bismuth silicon oxide (Bi^gSiO^^). These crystals are piezoelectric (Cubic Space Group 123) and direct excitation of ultrasound was used wherever possible. Attenuation measurements were made from 10 to I90 MHz over the temperature range4.2 to 260 K.
A large attenuation peak was observed in the undoped crystals between 35 and 50 K for only those ultrasonic modes whose velocity depends on the elastic modulus C^^. This peak is shown to be a single anelastic relaxation peak and is interpreted as due to point defects. Using the selection rules for anelastic relaxation in cubic crystals, it is deduced that these defects must have trigonal symmetry.
The magnitude of the attenuation peak in doped BGO samples is strongly dependent on the presence of dopants Doping with A1, Ga, P b , P+Ga, Ga+Cr, all removed the attenuation peak, while Cr increased it and Zn reduced it. A strong correlation was observed between the attenuation peak, the colour of the crystals and the optical absorption just below the band gap measured in these samples by other workers. These results indicate that the same defect centre is responsible for both the optical and the ultrasonic absorption.Possible defects are discussed taking the optical absorption. X-ray diffraction, EPR and other available measurements into consideration.

I l l
The ultrasonic attenuation was measured before and after annealing at in vacuo or in pure oxygen. No changewas observed for an undoped sample. However, for the Cr doped sample the attenuation was reduced by vacuum annealing and restored by oxygen annealing. This seems to be closely related to previous observations of photo- chromic behaviour in BSO doped with Cr. Measurements were also made to study the effects of gamma irradiation on the attenuation in undoped BSO.

I V
CONTENTSPage
Acknowledgements viiList of figures viii
List of tables xiv
CHAPTER 1 BISMUIH GERMANIUM OXIDE AND BISMUTH SILICON OXIDE
1
1. 1 History 21.2 Structure 7
1.3 Stochiometry 14
1.4 Piezoelectricity i61.5 Elastic properties 191.6 Optical properties 231.7 Photochromism 251.8 Semiconducting properties 26.
1.9 Technical applications 27
CHAPTER 2 EXPERIMENTAL TECHNIQUES 282.1 Electronics 292.2 Transducers, delay rods and samples 372.3 Sample preparation 392.4 Measurements in the temperature
range 4.2 to 230 K45
2.5 Thermometry 512.6 Experimental procedure 55
CHAPTER 3
3.13.23.33.43.5
RELAXATION ATTENUATION AND MEASUREMENTS IN UNDOPED BGO AND BSORelaxationRelaxation strengthRelaxation processesExperimental resultsAnalysis of experimental results
Page
60
6l
69798493
CHAPTER 4
4.14.2
4.34.4
4.54.6
ATTENUATION MEASUREMENTS IN DOPED, ll6ANNEALED BGO AND y-lRRADlATED BSODoped BGO samples 117Ultrasonic attenuation results and 119analysisCorrelation with optical absorption 138Effects of annealing and y— irradiation l43on point defects in BGO, BSOExperimental results in annealed BGO 146Experimental results in 153y-irradiated BSO
CHAPTER 35.15.2
5.35.4
PHONON-PHONON ATTENUATION IntroductionLow temperature region, (jO t > 1 High temperature region ü)r < 1Experimental results
159160161 164167
CHAPTER 6 DISCUSSION AND CONCLUSION6.1 Introduction6.2 Experimental evidence
173176

V I
6.36.4 6.3
Other available measurements Possible defect centre Conclusion
Page
187
189193
APPENDIX 1
APPENDIX 2Computer program for data analysis 2O3
Ultrasonic attenuation in doped 206bismuth germanium oxide(Reprint: Proceedings of the Institute
of Acoustics 1980)
Cj> Cfi- '.Une tlfo
vil
ACKNOWLEDGEMENTS
It is a pleasure to thank my supervisor, Dr M. J. Lea, for his constant advice, encouragement and availability for discussion. 1 am also grateful to Professor E, R. Dobbs for his help and guidance from time to time during my stay in this College.
1 am indebeted to Dr, Grabmaier and R. Oberschmid of Siemens Research Laboratories (Germany) for supplying us with single crystals of doped BGO.
1 would like to thank Mr. A. K. Betts for his help with electronics throughout the work; Mr S. Sen for his assistance in orientation and polishing of the crystals; Mr A.O.T. Le Motte, Mr. F. Greenpugh,Mr. W. Baldock and other technical staff of the Department for their assistance.
Mr. P.A. Grimes and Mr A.W. King are also gratefully acknowledged for their help in designing the sonic cells. 1 would like to thank Miss A. LeaKer for her timely hplp in typing this thesis.
Finally, 1 would like to thank the British Council for granting me a Fee Award.
P. K . SANDHU

V l X l
FIGURES Page
1.1 Schematic diagram for growing 5BGO/BSO crystals
1.2 Heptacoordinated bismuth in BGO 9
1.3 Arrangement of bismuth atoms and 11GeO^ tetrahedra in a unit cell of BGO
1.4 Connection of two GeO^ tetrahedra bymeans of two Bi-polyhedra
12
1.5 A unit cell of BGO showing the I8tetrahedra around each Ge atom
1.6 Optical absorption for undoped BSO 24
2.1 Block diagram of Matec 9OOO 30
2.2 Block diagram of complete 32experimental set up
2.3 Calibration curve for Matec detector 34
2.4 Boxcar echo monitoring 35
2.5 Calibration curve for Matec detector 36using a Marconi pulse generator
2.6 A typical pulse-echo train * 44
2.7 Block diagram of experimental probe 46
2.8 Sonic cell 48

X X
Page
2.9 Sonic cell 52
2.10 Calibration curve for the 54carbon-glass resistor
2.11 A raw data plot from X-Y recorder 57
2.12 Attenuation as a function of 58temp erature
3.1 Strain ellipsoid 66
3-2 Attenuation of transverse (110,001 ) ^5mode in BGO as a function of temperature and frequency
3-3 Temperature and frequency dependence Qyof T(100,001) and longitudinal (100,100) mode in BGO
3-4 Attenuation of longitudinal(111,111) mode
3-5 Attenuation as a function of 89temperature for all modes
3-6 Attenuation of transverse (llO,OOl) 90mode in BSO
3-7 Logarithm of the frequency versus 95reciprocal of peak temperatures for BSO and BGO
3-8 Normalized attenuation for the 9?transverse (lOO,OOl) mode versus l/T
Page3.9 Logarithm of the relaxation time 101
versus reciprocal temperature for the transverse (llO,OOl) mode in BGO
3-10 Logarithm of the relaxation time 102versus reciprocal temperature for the transverse (100,001) mode in BGO
3.11 Logarithm of the relaxation time IO3versus reciprocal temperature for the transverse wave (llO,OOl) in BSO
3-12 Attenuation of T(lOO,OOl) mode, 10fitted to equation 3-5.4
4-1 Ultrasonic attenuation for the 120transverse (llO,OOl) mode in (BGO + Cr), as a function of temperature and frequency
4-2 Ultrasonic attenuation versus 121temperature for the transverse wave(110,001) in (BGO + Zn) at various frequencies
4-3 Logarithm of the relaxation time 124versus reciprocal temperature for a crystal of BGO doped with Cr. The dashed line corresponds to the undoped BGO crystal

X IPage
4.4 Logarithm of the relaxation time 125versus reciprocal temperaturefor a Zn doped crystal of BGO
4.5 Normalized attenuation as a 127function of reciprocal temperaturefor the Cr doped BGO sample at two frequencies
4.6 Attenuation as a function of 129temperature and frequency forthe transverse (llO,OOl) mode in (BGO + A1 ) .
4.7 Attenuation for the transverse 131(110.001) mode in BGO doped with Ga
4.8 Attenuation for the transverse 132(110.001) mode in a crystal of BGO + (Pb)
4.9 Attenuation as a function of 133temperature in BGO + (P + Ga)for the transverse (110,001) wave
4.10 Attenuation in BGO + (Ga + Cr) 134crystal as a function of temperatureand frequency
4.11 Attenuation as a function of 136temperature for all doped BGOcrystals
4.12 Ultrasonic attenuation of longitudinal 137waves (111,111) in undoped and dopedBSO crystals

X l l
Page4.13 Optical absorption versus photon 140
energy for undoped and doped BGO
4.14 Optical absorption coefficient at l4lliquid nitrogen temperature forundoped and doped BSO
4.15 Effect of irradiation on optical l44absorption in BGO
4.16 Block diagram of experimental set 1^7up for annealing
4.17 Raw data plot for attenuation of the 1^8longitudinal (ill,111) mode inundoped BGO
4.18 Raw data plot for attenuation of 1^8L(lll,lll) mode in vacuum annealed BGO
4.19 Raw data plot for attenuation of 48L(lll,lll) mode in oxygen annealed BGO
4.20 Attenuation for the transverse 150(110.001) mode in an annealed sample of Cr doped BGO
4.21 Logarithm of the relaxation time 152versus reciprocal temperature forthe annealed (BGO + Cr) sample
4.22 Attenuation for the transverse 154(110.001) mode in y-irradiated BSO
4.23 Logarithm of the relaxation time 156versus reciprocal temperature in y-irradiated BSO
4.24 Effect of irradiation on attenuation ^57

Page5.1 Log-log plot of attenuation 170
versus temperature
6.1 Plot of defect concentration versus X I81for BGO
6.2 Plot of defect concentration versus X l82for BSO.
6.3 Lattice constant as a function of I84ionic radius for various crystals with structure Bi^^MO^^
6.4 A graph showing the relation of bismuth I88content in the melt and the crystal
6.5 Diagram of a trigonal defect 190

X I V
TABLES Page
1.1 Lattice constants of various 3compounds of type Bi^^MO^Q
1.2 Physical constants for BGO/BSO 8
1.3 Ge-0 distances in the tetrahedra 8GeO^
1.4 Site symmetries of various atoms 13
1.5 Elasto-piezo-dielectric matrix 17
1.6 Elastic constants 20
1.7 Acoustic wave velocities 22
3.1 Selection rules for anelastic 65relaxation
3.2 Peak attenuation and peak temperatures 92for various modes and frequencies
3.3 Activation energies and attempt 104frequencies for different modes
3.4 Relaxation strengths for various modes 108-
3-5 Effective elastic and compliance 109constants for various modes

X V
Page
4.1 Doped BGO samples, dopant concentrations and effects of dopants
4.2 Peak attenuation and temperature for 122doped BGO crystals
4.3 Activation energies and attempt 126frequencies, for doped BGO
4.4 Attenuation as a function of 155temperature and frequency^Effect of irradiation on attenuation
5.1 Attenuation as afunction of dopant I68and frequency at 100 K
6.1 Activation energy, attempt frequency. 1?8and the product | andBSO

CHAPTER ONE
BISMUTH GERMANIUM OXIDE AND BISMUTH SILICON OXIDE
Bismuth germanium oxide, Bi^^GeO^^, and bismuth silicon oxide, Bi^^SiO^Q have attracted a great deal of attention because of their potential for use in electrooptic and piezooptic devices. A wide range of work has been carried out to study the elastic and optical properties of these crystals over the past decade.
This thesis presents measurements made on the propagation of ultrasonic waves in undoped Bi^^GeO^Q, doped Bi^gGeO^Q and undoped Bi^^SiOgo" Some measurements were also made on annealed Bi^^GeO^Q and y-irradiated
BiiaSiOzO-
In this chapter a brief review of the history of the material is given. The structure and many other properties related to this work studied by various workers have been discussed. Discussion of other measurements of ultrasonic attenuation is given in Chapter Three.

1.1 History
Bismuth trioxide is known to exist in three modificationsas reported by Schumb and Rittner (1943)• The commonlyoccurring a-Bi 0 variety corresponds to the ortho- 2 3rhombic form reported by Gurtler (1903) and theP~Bi 0 or tetragonal phase represents a high temper- ^ Jature modification of the a-phase, first prepared bySillen (1937)- A new form of Bi^O^ denoted by y-Bi^O^was prepared by Schumb and Rittner (1943)- Theyobserved that if P~Bi 0 was first placed in a platinum2 3crucible at a temperature of 750-800°C and allowed to cool at a proper rate, a bright yellow product with a body centered cubic lattice, with a^ = 1-025 nm was obtained. But this phase was found to be unstable above 25°C. Later, Sillen and Aurvillius (1945) observed that Bi20 forms a stable body-centered cubic phase on addition of small amounts of certain metal oxides.A number of isomorphous compounds with formula Bi^^MO^Q, where M represents the second metal ion, have been prepared from Bi^O^ and Al^O^, Fe^O^, GeO^, SiO^ etc.The lattice constants of these compounds range froml.OlO nm for B i (BSO) to 1-023 nm for a compound formed with PbO^ as given in Table 1-1.
Ballman (1966) while studying bismuth germanate;Bi^(GeO^)^, found that small transparent crystals of y-BigO^ were formed when bismuth germanate decomposed.The phase diagram of bismuth-trioxide - and germanium

TABLE 1.1 Sillen and Aurivillius's proposed lattice constants of various compounds of type
Bil2M020-
Metal a (nm )Ionic radius
of metal (nm )
Al3 + 1.014 0.053Tl3 + 1.015 0.10Fe3 + 1.016 0.067Bi3 + 1.0243 0.10Si^+ 1.010 0.040Ce4 + 1.020 0.102Zr^ + 1.021 0.083Pb4 + 1.023 0.084Ge4+ ' 1.0143 0.055
* J.L. Bernstein (1967)

oxide also indicated the formation of a compound at the mole ratio of 6 : 1 (Spranskaya, 1964). Later,large single crystals of Bi^^GeO^Q(BGO) were grown by Ballman (1967) from melts prepared at mole ratio of 6B± 0 : 1 GeOg. The lattice constant for BGOcrystals is also given in Table 1.1.
The Czochralski technique is used for growing large single crystals of BGO, BSO. A detailed description of the method and conditions required for growing good quality crystals is given by Brice (1977)- Crystals used in this work were grown by Dr Grabmeier and Oberschmid (1976) using, the same method. A brief account of the method is given here. Fig. 1.1 shows the essential parts of the system used by them.
A melt made from weighed amounts of the component oxides (BigO^ and SiO^ or GeO^) are mixed and filled in a rf heated platinum crucible. A seed crystal is placed in contact with the melt and the melt temperature adjusted so that a small amount of the seed melts.To start the growth of the crystal, the melt temperature is slightly lowered and the seed is slowly raised. The seed crystal is continuously rotated during growth to ensure an even temperature distribution and to improve the mixing in the melt.Different diameter crystals can be grown by changing the heat flow into the crystal. Crystals with diameter
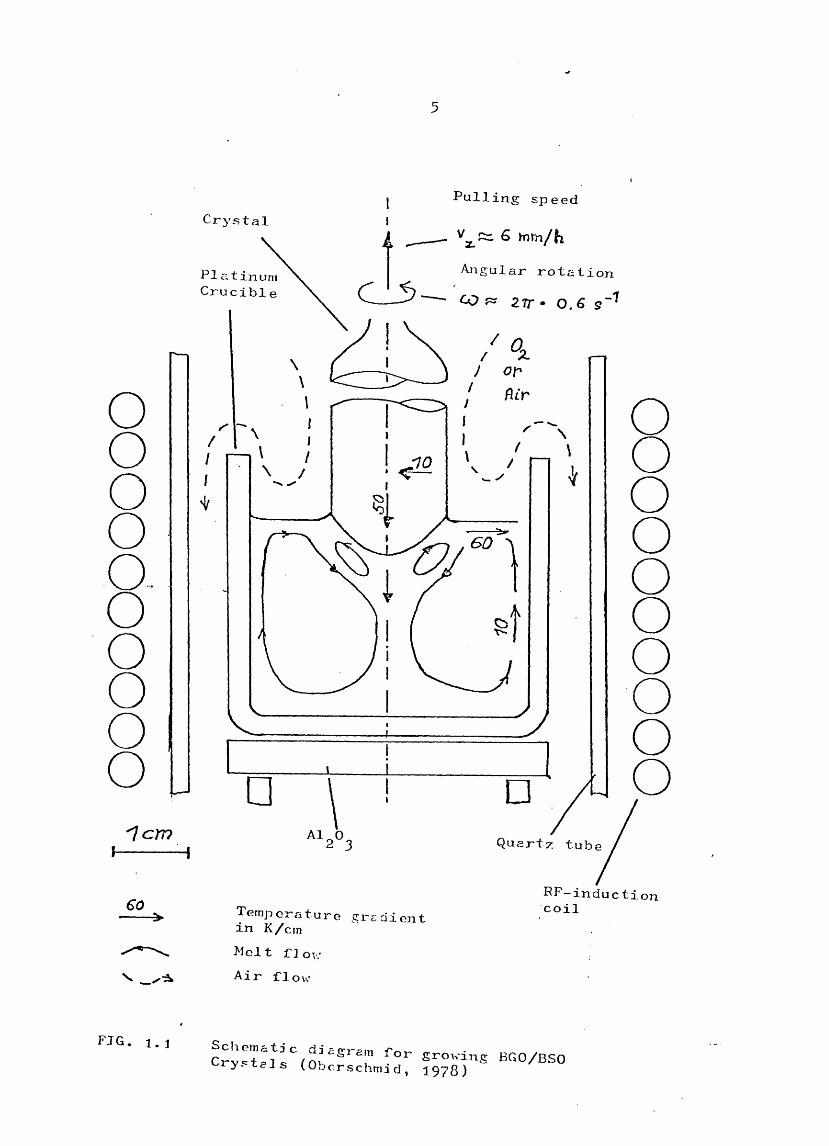
Pulling speedCrystal
z.Angular rotation ^ Zrr • o GC13
SO
I
Al.O Quartz tube
PP-inductioncoil€0 Temporatur in K/cm e gradient
>lolt fJov; Air flow
FJG. 1.1 Schematjc diagram for growing BGO/BSO Crystals (Oberschmid, 19?S)

of about 1 cm can be grown at rates of about 6 mm per hour. Considerable care is needed to avoid cracking of crystals during growth; When the mechanical stress due to the thermal gradient reaches tensile stress, crystals can crack. So, to keep the mechanical tensions as low as possible, crystal diameter is increased slowly in the start and decreased slowly at the end.
Brice and Grabmaier have observed that when the curved face intersects the natural (lOO) or (llO) faces of the crystal, flat regions called facets are formed.The material grown on these facets has been found to be slightly different in colour and a larger lattice constant compared with the rest of the crystal is reported. Clegg and Millet (1974) analysed the crystals grown by Brice and found no difference in the impurity content, on and away from the facets.
Crystals can also be grown with impurities or dopants.A desired amount of the dopant oxide e.g. (Al^O^,^^2^3’ PgO^) i® mixed with the component oxides corresponding to the formula Bi^^SiO^Q or Bi^^GeO^Q.
Grabmaier (19?8) has grown the highly doped crystals at a lower speed of 3 mm per hour and of smaller diameter to avoid cracking.

Pure BGO and BSO crystals are pale and brownish yellow in colour, but even small amounts of dopants have been observed to have considerable effect on the colour. Other effects of dopants are discussed in the following chapters.
1.2 Structure
^^12^^20 ~ Ge, Si) crystals are of body centeredcubic symmetry and have space group 123 (Bernstein, 1967). This rare symmetry gives these crystals an unusual mixture of optical and piezoelectric properties Although several water soluble compounds like NaClO^, NaBrO^ etc. are known, BMO seems to be the first refractory material having this symmetry. A few properties of BGO, BSO are given in Table 1.2.
The overall structure of BGO has been described by Abraham, Jamieson, Bernstein (1967) and of BSO by Abraham, Bernstein, Svensson (1979)î in terms of the seven oxygen coordinated bismuth polyhedra which share corners with other identical bismuth polyhedra and with GfeO^ tetrahedra. The four oxygen atoms around each germanium atom form a perfect tetrahedron. The Ge-0 or Si-0 bond lengths and O-Ge-0 or O-Si-0 bond

8
TABLE 1,2 Physical constants for BGO/BSO
BGO BSO
Lattice constant a (nm) Density (gm cm ^) Molecular weight
1.01439-22
2901
1.01049.26
2857
TABLE 1.3 Ge-0 distances in the tetrahedra GeO^
Crystal M-0(3) 0(3)-M-0(3)y\,yfL
®^12^®^20 1.717 44.428 109.47°
BI12S1O20 1.647 +. .003 109.47°

0(la)
0(lc)
0(lb)
0 (2 )
O(le)
O(ld)
FIG, 1.2 Heptacoordinated bismuth in Bi^^GeO^Q (Abraham et al, 196?)

10
angles are as given in Table 1-3- The arrangement of the first coordination shell around a bismuth atom is as in Fig. 1.2.
Each bismuth atom is surrounded by four oxygen atoms lying nearly in a plane, and shares two oxygen atoms with a second bismuth atom. Figure 1-3 shows all Bi-atoms and GeO^ tetrahedron within a unit cell.
Two GeO^ tetrahedra connected by means of two Bi- polyhedra are shown in Fig. 1.4. The site symmetries of Bi, Si or Ge and the three inequivalent oxygen atoms are. as given in Table 1.4.
By studying the 'temperature dependence of the optical rotatory power from 1-3 to $00 K (melting point ~ 1223 K) Tanguay (1977) has concluded that there is no crystal- lographic phase transition over this temperature range.

11
o Bi atom
GeO^ tetrahedron
82
685232
82
13268 5068,10262
118
0 132524868
11882
FIG, 1.3 Arrangement of bismuth atoms and GeO^ tetrahedron in unit cell of BGO
C M e s C—J»A - v A a S '2~ " ~ C-^’

12
Bi atom
FIG. 1.4 Connection of two GeO^ tetrahedra by means of two Bi-polyhedra

13
TABLE 1.4 Site symmetries of various atoms
Atomsite of * symmetry
Si (Ge) a(23)
Bi f (1)
0 (1 ) f (l)0 (2 ) c (3 )
0 (3 ) c (3 )
a,f,c are Wycoff notations corresponding to cubic,monoclinic and trigonal site symmetries. Brackets give the International Symbols for these symmetries.

14
1.3 Stochiometry
The formula describes the ideal or stochiometricspecies in which particular cationic and anionic sites in the bcc cell are fully occupied. If Bi : M ratio differs from 12 : 1, or if M is other than a quadrivalent ion, then the bcc structure must contain fractionally occupied ionic sites or else accommodate the change in stochiometry in some other way.
While refining the structure of BGO, Abraham et al (1967) deduced that only Bi atom has anisotropic motion in the crystal and obtained the occupancy factor at the Ge sites to be O.9I +_ .084. But in their recent work (Abraham, Bernstein, Svensson, 1979), the occupancy factor is reported to be O .87 _+ for Ge and0.87 + .08 for Si.
The bcc cubic structure with formula Bi^^MO^^ is known to accommodate a variety of different M atoms with radii between 0.025 nm and 0.079 nm. Craig and Stephenson (l975) have studieeL two mixed oxides,Big^FeO^Q and Bi^gZnO^^, with body centered cubic structure, which involve Bi 0 .
By X-ray studies they observed a higher electron population than expected at tetrahedral sites which were supposed to be occupied by Zn and Fe respectively.

15
After a detailed analysis they suggested that y-Bi^O^structure can contain some Bi^^ ions in addition to
3 + 5 +Bi ions, and these Bi ions may occupy some ofthe tetrahedral sites to provide the higher occupancyobserved at these sites.
Brice, Hill (1977) and Grabmaier, Oberschmid (1978) have observed that BSO, BGO crystals can be grown with melt compositions Bi^O^ ; GeO^ or SiO^ varying from 5 : 1 to 7 : 1 without largely affecting itsproperties. Describing BSO as Bi^SiO^ 5x+2’ Brice and Hill have reported that if x in the melt was varied from 10 to l4, x in the solid varied frem 11^77 to 12.05. They also observed that the maximum and minimum values of x in the solid did not correspond to the maximum and minimum values in the melt.
These observations suggest that BGO, BSO can have Ge, Si or Bi vacancies in the lattice.

16
1.4 Piezoelectricity
BGO, BSO crystals lack a centre of symmetry and arethus piezoelectric. Since BGO (BSO) is a cubic crystalof class 23, it has only one independent piezoelectricconstant, e^^ = e^^ = (Nye, 1957), as shown in theelasto-piezo-dielectric matrix given by Table 1.5- e^2j has a value O .987 m .
The origin of piezoelectricity and its resulting polarity in BGO (BSO) has been explained by Abraham, Bernstein and Jamieson (1967); Abraham, Bernstein and Svensson (1979), considering a single GeO^ or SiO^ tetrahedron.The four oxygen atoms are required to lie on unit ^ell body diagonals by symmetry as in Fig. 1.5. The total electric dipole moment associated with a GeO^(SiO^) tetrahedron in the absence of stress is zero.The component along a body diagonal is given by
^ Cos 109.47°
U -— is the electric dipole of the Ge-0 bond. A Ue-Ucompressive stress applied along a body diagonal reduces the tetrahedral angle to 109.47-6°. Therefore a net electric dipole moment is generated, with a sense +-^- from the Ge atom to the face as shown in Fig. 1.5 .

17
TABLE 1.5 Elasto-piezo-dielectric matrix
^11 ^12 ^12 0 0 0 0 0 0
^12 ^11 ^12 0 0 0 0 0 0
^12 ^12 ^11 0 0 0 0 0 0
0 0 0 ^44 0 0 ®14 0 0
0 0 0 0 ""44 0 0 ®14 0.
0 0 0 0 0 ""44 0 0 ®14
0 0 0 ®14 0 0 ^11 0 0
0 0 0 0 ®14 0 0 ^11 0
0 0 0 0 0®14 0 0 ^11

18
0 (2)
0(3)
0(3)0(3)
0 (2)♦ YX
FIG. 1.5a r Z d ::ch Ge tetrahedra
191.5 Elastic properties
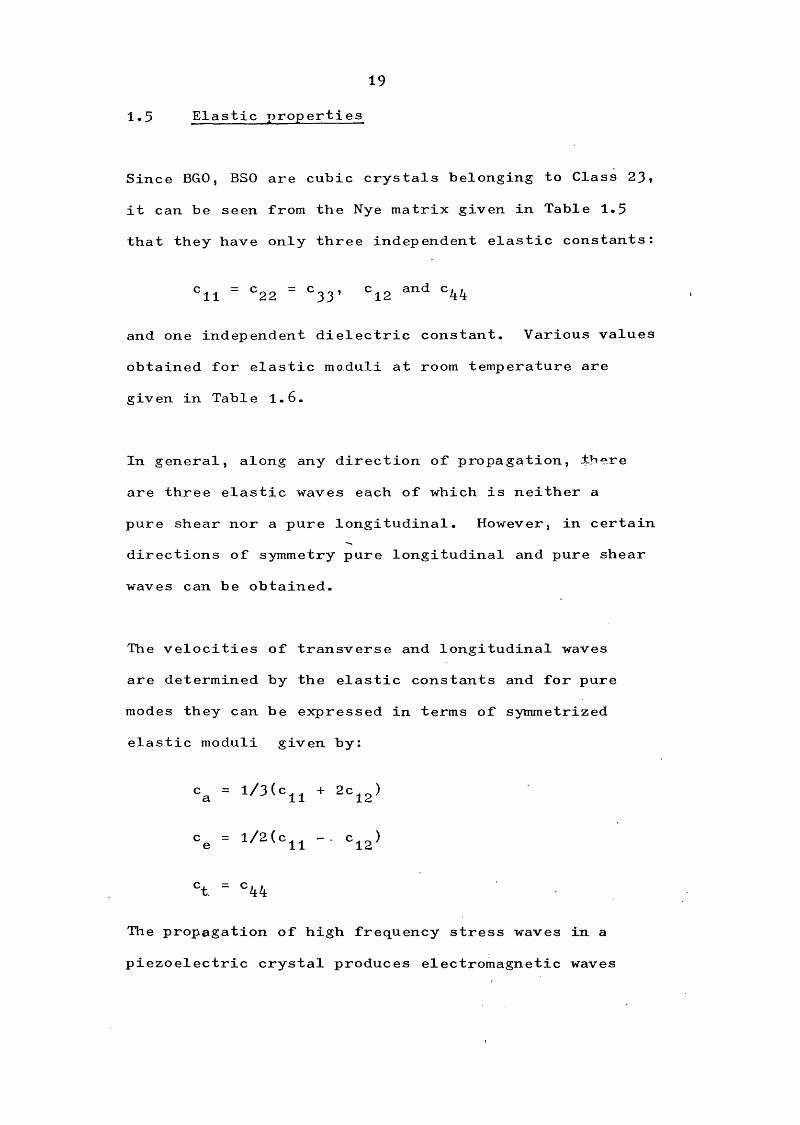
Since BGO, BSO are cubic crystals belonging to Class 25, it can be seen from the Nye matrix given in Table 1.5 that they have only three independent elastic constants :
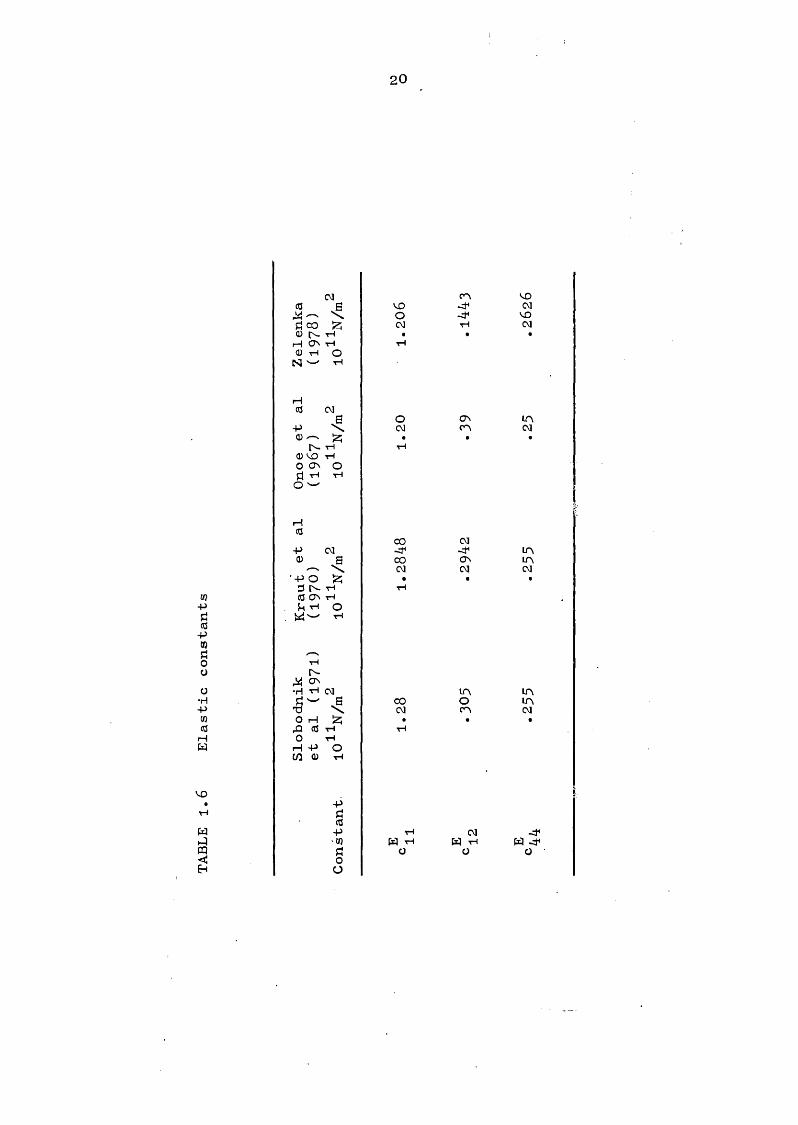
"=11 " * 22 " ^ 3 3 ’ " 12 " 44and one independent dielectric constant. Various values obtained for elastic moduli at room temperature are given in Table 1.6.
In general, along any direction of propagation, there are three elastic waves each of which is neither a pure shear nor a pure longitudinal. However, in certain directions of symmetry pure longitudinal and pure shear waves can be obtained.
The velocities of transverse and longitudinal waves are determined by the elastic constants and for pure modes they can be expressed in terms of symmetrized elastic moduli given by:
<=0 = - Ciz)
t. - ^44
The propagation of high frequency stress waves in a piezoelectric crystal produces electromagnetic waves
20
(M cn VOcc s VO CMilH \ o VOri CO Iz; CM P CM(D PH ON P PO P oN P
PCO CMa o CJN IP
p \ CM CP CM0) Iz; • • •
N P PO VO P0 ON opj P PO
pCOCO CM
P CM PQ) a CO CJN P' \ CM CM CM
'p o Iz; • # *PJ fN- P P
V) (0 CJN P-p h p O
. p(C•p(QÜ /— '0 pÜ r-
M CTNÜ P P CM IP P•H a CO O PP € \ CM CP CMto O P iz; • « •CC rO CO P PH 0 PW P P ot/3 O P
VO !• Pp ÜCO
w P P CMk:| •to W p W P W ^cq Ü Ü Ü< oEh O

21
that accompany the stress waves, and vice versa. The presence of electromagnetic waves coupled to the stress waves leads to an increase in the effective values of the relevant elastic constants or piezoelectric stiffening of the crystal. For all these stiffened modes, adding the piezoelectric stress constant and the dielectric constant the velocities for various modesstudied are given by Table 1.7- The values given inTable 1.7 agree with our measured values to within
r s"’± 0.00k The relative dielectric constant is 40 for BGO and 56 for BSO.

22
tf)<DTOOBV)3
Ü* CDto
•H Ü ÜO PP oCD P >
(MPPP
VOo[N-p
VOVOp
o•H p
CM P to PcC CD w> ■cflPShO +P CM to p CD
> j p Üto Q_ CM P Ml PCD -4-jP CD to <^|P•HP + 4 +•HÜ CC p p CCO J Ü ÜP> P pCD cC cC> 1 CD (D sCC H to to •H
(D X3 4 h TdTl 3 CD (D 3
Ü o P > > P•H •r4 to to •HP faO : FI bOto 1 CC CC Ü3 3 4 0O e4 E-t 1-1Ü<
f!o|N- •HPtH CC p , o O oP p p O ow d p p P pIP CDCQ •H< F,O
IN.VDON
HCCPCUCDO<§

23
1.6 Optical properties
Pure BGO, BSO crystals are pale yellow and brownish yellow in colour. Since the band gap is 3*25 eV, which is above the visible range, it shows that there is absorption within the band gap which gives colour to these crystals. The optical absorption in BSO,BGO has been studied by Hou (1972) and Tanguay (1977)- The room temperature band gap is assigned at 3»25 eV where the optical absorption coefficient o is 1000 cm as shown in Fig. 1.6. A. broad absorption shoulder has also been observed in the region 2.3 eV to 3*1 GV with a maximum near 2.7 eV. This shouTder in the optical absorption spectrum has been suggested to be related to the ultrasonic attenuation peaks observed in these crystals. A possible explanation given by Hou and Aldrich (1973) is discussed in the later chapters.
Doping BSO crystals with At, Ga, B was found^by Hou and Aldrich (1973) and Rehwald, Frick (1976) to strongly effect the optical absorption below the band gap.

24
1000
BSO- 16ICO
o
LuUJ
10
CO2 9 5
1.9 2.0 2.1 2 2 2.3 2.4 2 5 2.6 2.7 2.0 2.9 3.0 3.1 3.2 3.3
ENERGY (cV)
FIG. 1.6 Optical absorption for undoped BSO ~ T c ( ^ I97<
25
1.7 Photochromism
Certain boules of Bi^^SiO^Q have been noticed by Tanguay (19?7), Brice (l977, Feigelson (1977) to change colour from pale yellow to dark yellow shortly after removal from the growth apparatus. These crystals show some additional optical absorption to that mentioned in Section 1.6. Tanguay (1977) and Brice (1977) have conducted a series of experiments to reveal the cause of this effect and from the observations indicated an extrinsic photochromie mechanism, due to the presence of Or or Mn at levels of 1 ppm or above. The depth of the colour and the resulting photochrom&c behaviour were netted to correlate quite well with the optical absorption. Oxygen and vacuum annealing have been observed to effect the additional optical absorption and the photochromism. These are discussed in Chapter 4.

26
1.8 Semiconducting properties
These are intermediate band gap materials having electrical resistivity value of 8 x 10^^ fi cm for BGO and 5 X 10^^ ÇI cm for BSO (Aldrich and Hou, 1971).The dark conductivity is p type.
The spectral response of the photocurrent was measured byAldrich and Albova (1977) for BSO and by Douglas,Zitter (1967) for BGO. The photoconductivity was found to be dominated by photoinduced electrons.Doping the material with A1 has been reported to make the material p-type and holes dominate the photocurnent. The effects of different dopants measured by Oberschmid(1978) have been given in Table 4.1.

27
1.9 Technical applications
The unusual combination of properties in this materialmake it a technologically attractive material. Thelow acoustic wave velocity of BGO has made it anattractive delay line material. Its high couplingfactor means low insertion loss, high efficiencyacoustic delay lines. A rod of BGO (3mm x 12.5mm)was used by Lea, Butcher and Dobbs (1977) as a lowloss delay line, for studying the transverse acoustic
3impedance of normal liquid He. About 5000 echoes could be obtained below 4.2K (Butcher 1978).
The pockels readout optical memory relies for its operation on a combination of properties as photoconductivity with high quantum efficiency, optical transparency in the visible spectrum, a large die- electric constant, high resistivity and a sizeable electrooptic effect. BGO and BSO are the materials at present which satisfy all these requirements, in addition to ease of growth and control of crystal perfection (Feinleib and Oliver 1972). BSO has been reported to have the highest known photorefractive sensitivity for read-write volume holographic storage (Huignard and Micheron, 1976).
28CHAPTER TWO
EXPERIMENTAL TECHNIQUES
In order to study the ultrasonic attenuation in BGO and BSO, detailed measurements were made as a function of temperature, at a number of frequencies and for various sound modes. Measurements were made in the frequency range 10 to 19O MHz over the temperature range 4.2 to 26O K. In this chapter the techniques used for measurements and sample preparation are discussed.
The conventional pulse-echo method was used to mea\sure the ultrasonic attenuation. This method has been described in detail by Truell et al (1969) and its use at low temperatures explained by Dobbs et al (1973) Short duration rf pulses are applied to the sample, or to a transducer, which, as a consequence of the piezoelectric effect causes ultrasonic waves to be propagated through the sample. The pulse sent into the sample is reflected at the opposite end face and it returns to the first face where it is reflected again, the process, is repeated a number of times.The ultrasonic wave is detected either at the same end (reflection mode) or at the other end (transmission mode) of the sample. As the ultrasonic wave travels through the sample it is attenuated and a series of exponentially decaying echoes are detected.

29
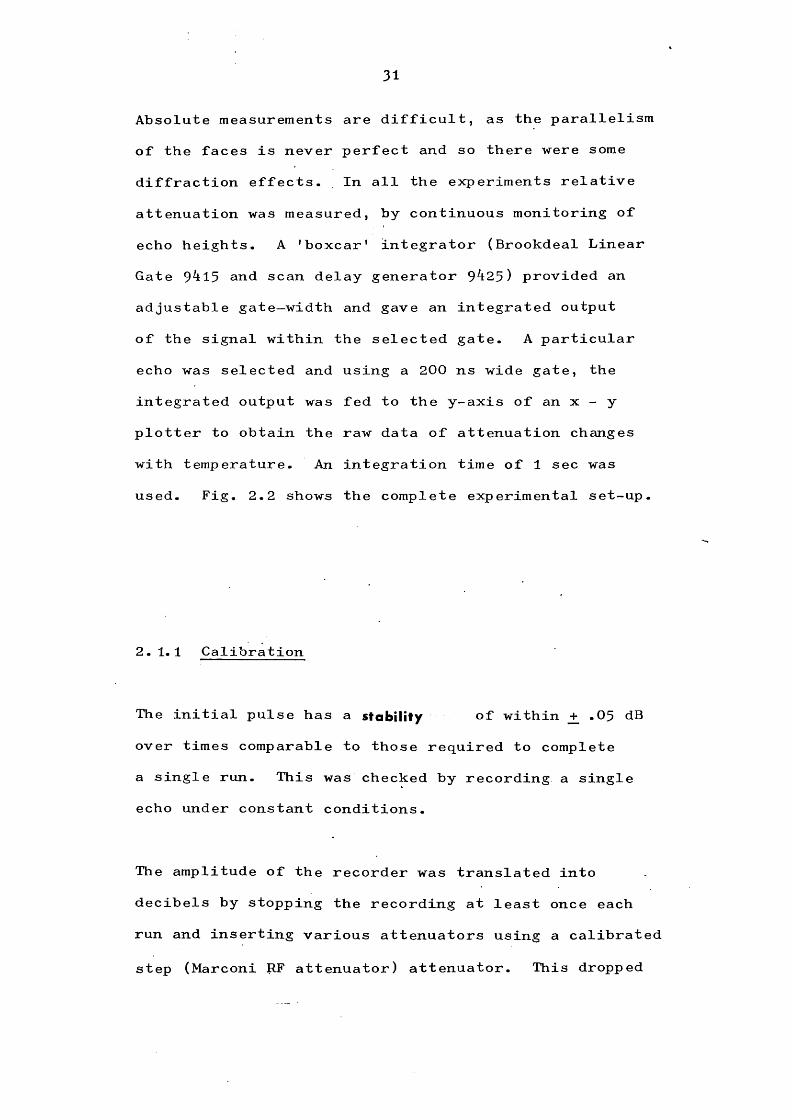
2.1 Electronics
Matec (model 9000) attenuation comparator, which has a pulsed oscillator and receiver in the common chassis was used. The Matec 9000 used with a 9^0 rf series plug-in unit covered the frequency range from 10 to 300 MHz. Operation of Matec has been described in detail by Chick, Anderson, Truell (196O). Fig. 2.1 shows a block diagram of its components. Short bursts of rf energy generated in the plug-in unit were applied to the appropriate transducer or sample. The pulsed oscillator of Matec 9OOO provides pulses of . 5 ]i sec to 5 y. sec duration, with pulse amplitude up to about 200 volts at frequencies from 10 MHz to 300 MHz\^The natural piezoelectric properties of the BGO samples were used for generation and detection purposes wherever possible. The returning rf signal from the sample was amplified using a preamplifier (Avantek - low noise amplifier). The amplified signal was then mixed with a local oscillator to obtain an IF ( 60 MHz') signal, which was amplified and detected. The detected video output was displayed on an oscill oscope screen (Tektronix Type 581, with a Type 81 plug-in adaptor).The receiver associated with model 9000 provides a gain of about 80 dB.

30
RFout.
iransinissio:mode
FREQ. 10-300 MHZ (Amplitude ( < 3OOV)
RCVRin
C.W.X + 60 MHZ \ /
\ /
Mixer60 MHZ
Echo 2ndde^tec tor
Pr e ampli
fter
I.F.amplifier
Triggercircuits
display
Localoscillator
Videodetector
Puls ed oscillator
FIQ. 2.1 Block diagram of Matec 9OOO
31
Absolute measurements are difficult, as the parallelism of the faces is never perfect and so there were some diffraction effects. In all the experiments relative attenuation was measured, by continuous monitoring of echo heights. A 'boxcar' integrator (Brookdeal Linear Gate 94l3 and scan delay generator 9^25) provided an adjustable gate—width and gave an integrated output of the signal within the selected gate. A particular echo was selected and using a 200 ns wide gate, the integrated output was fed to the y-axis of an x - y plotter to obtain the raw data of attenuation changes with temperature. An integration time of 1 sec was used. Fig. 2.2 shows the complete experimental set-up.
2. 1.1 Calibration
The initial pulse has a stability of within _+ .05 dBover times comparable to those required to complete a single run. This was checked by recording a single echo under constant conditions.
The amplitude of the recorder was translated into decibels by stopping the recording at least once each run and inserting various attenuators using a calibrated step (Marconi RF attenuator) attenuator. This dropped

32
OUTTrigger
IN
\/
\ /
/ \
Thermometer
Sample
tector.
155 B Null _
Ampli-fier
Lineargate
Scandelay
generator
Recorder
Video Out
Matec
FIG.-' 2.2 Block diagram of complete experimental set up

33
the entire echo train by known factors and furnished a scale against which to measure the echo amplitude.The detection system was found to be linear within the dynamic range of 30 dB. Fig. 2.3 shows the echo heights in arbitrary units versus attenuation (dB) inserted.
As a second method for calibration, the output of a Marconi 801D/1 signal generator pulsed by Marconi pulse generator was fed to the Matecreceiver system as in Fig. 2.4. The height of the pulse was varied using a precision calibrated attenuator in the Marconi signal generator. The integrated output from Boxcar was read using a l60 B Keithley digi/tal multimeter. The pulse height as a function of dBm is shown in Fig. 2.5* As can be seen from Fig. 2.3 and 2.5, the pulse height V obeys a square law given by 20 log^^V down to the noise level. Therefore the attenuation in decibels could be obtained by simply
Vgtaking 20 log , V and V being the echo heights1 ,
at two temperatures. The reference for is the low temperature limit where attenuation is assumed to be zero. The calibration obtained using the two methods were comparable to within _+ . 1 dB. The signal to noise ratio was 40 dB.

34
m-p•H
U(0u-p•HU<
1.
10
10
4010 20 a (dB)
30
FIG. 2.3 Calibration curve for Matec detector

35
Boxcar
integrator
DC Pulse generator
Recorder
X -Y
Marconi Signal Generator
Mateo
gate
FIG. 2.4 Boxcar echo monitoring

36
to-p•H
u(Cu-p■HI
10
2 0 l o g ^ o
1
-10 -20 -30o<*r&,r (dBm)
FIG, 2.5 Calibration curve for Matec detector using a Marconi pulse generator
37
2.2 Transducers, delay rods and samples
2.2.1 Transducers
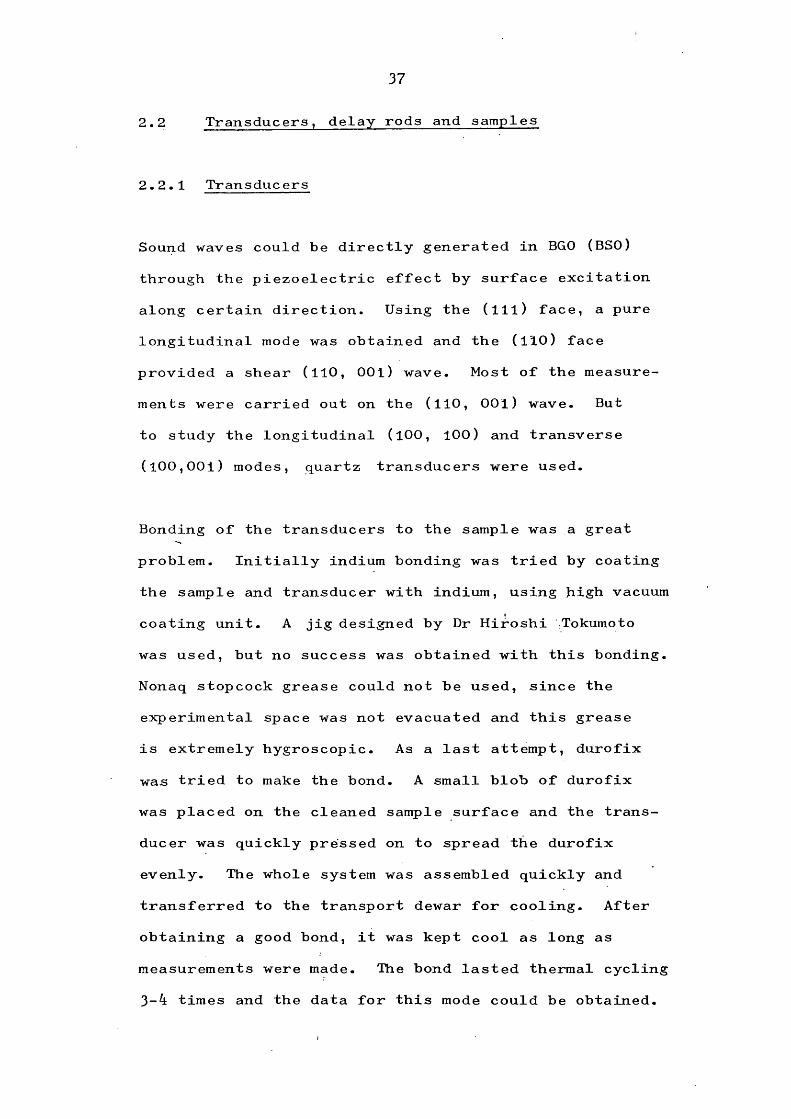
Sound waves could be directly generated in BGO (BSO) through the piezoelectric effect by surface excitation along certain direction. Using the (ill) face, a pure longitudinal mode was obtained and the (llO) face provided a shear (llO, OOl) wave. Most of the measurements were carried out on the (llO, OOl) wave. But to study the longitudinal (lOO, 100) and transverse (100,001) modes, quartz transducers were used.
Bonding of the transducers to the sample was a great problem. Initially indium bonding was tried by coating the sample and transducer with indium, using Jiigh vacuum coating unit. A jig designed by Dr Hiroshi Tokumoto was used, but no success was obtained with this bonding. Nonaq stopcock grease could not be used, since the experimental space was not evacuated and this grease is extremely hygroscopic. As a last attempt, durofix was tried to make the bond. A small blob of durofix was placed on the cleaned sample surface and the transducer was quickly pressed on to spread the durofix evenly. The whole system was assembled quickly and transferred to the transport dewar for cooling. After obtaining a good bond, it was kept cool as long as measurements were made. The bond lasted thermal cycling 3-4 times and the data for this mode could be obtained.

38
2.2.2 Delay rods
Measurements were made.in both reflection and transmission modes. In the region of very high attenuation only the first echo could be observed. Since the attenuation in this material is extremely large in the temperature region 3O-6O K, thinner samples would be useful to obtain the data at higher frequencies. But, using thinner samples decreased the transit time and the first few echoes could not be resolved. Delay rods suitably bonded to the sample could serve the purpose of additional delay. But several delay rods (LiNbO^, quartz, cadium) were tried using different bonding agents, without success. The bonds could not withstand . cooling below 77K and resulted in cracking many crystals. This limited the maximum frequency used for measurements to 90 MHZ in the case of large attenuation samples.
2.2.3 Samples
The doped BGO samples used for this work were provided by R Obserschmid and Grabmaier (Siemens, Germany). These crystals were grown by Dr Grabmaier, using the usual Czochralski technique described in Section 1.1.

39Table 4.1 gives the list of samples used for measurements Samples were of various lengths from 2 mm to 6 mm and diameters from 3 to 5 m m .
2.3 Sample preparation
2.3-1 Orientation
Crystals of BGO were received in the form of unoriented boules or discs. Crystals were first oriented using the Philips X-ray set by the Laue back reflection technique. Beam currents of 40 mA at 30 KV incident on a W anode were normally used. Exposure times varied from two to three hours. Crystals could be oriented to within 0.5°. Mounting of the crystals on to the goniometer needed great care. This material being very fragile and thermally sensitive, some cold setting adhesive was required. Dental wax with a low melting point ( 70° C ) was found to be suitable. It provided • the bonding strength required with minimum strain on the sample.An X-ray picture for the <110> direction for BGO is shown on the next page.

40
4
An Y_ray picture for <110> direction in BGO
41
2.3-2 Cutting
A Microslice II annular precision diamond saw was used for cutting the crystals. Samples had to be embedded in dental wax to provide the strength needed to hold the crystal in place while cutting. A speed of 150 - 200 revolutions per minute was used. The diamond blade and sample were continuously cooled with a cutting fluid to avoid cracks due to over heating and friction between the sample and the blade. Normally three to four hours were needed to cut a 5 - 6 mm deep crystal. The samples could be easily removed from the wax. Sample cutting was quite successful using this machine, but a lot of patience was required. After cutting, samples were X-rayed again to check their orientation.
2.3-3 Polishing
Accurately oriented samples, with optically flat faces, parallel to within a few seconds of arc, were needed to obtain a good echo train. The first few samples, which were in the form of small rods, were polished using a Logitech DM2 precision polishing machine. Details of this machine and polishing techniques have been given by Fynn and Powell (1979).

42
Samples were mounted onto a brass plate which could be screwed on to the precision jig- A very thin layer of dental wax was spread on the brass plate and sample was placed on it and slightly pressed to form a uniform layer. The initial grinding of crystal faces was done using fine grades of silicon carbide grinding paper fixed to a flat glass reference plate.A slurry of silicon carbide powder in Hyprez fluid was used. A 240 and 600 grit silicon carbide papers were used in succession.
The polishing jig is basically a steel cylinder with the base supported by three legs. The legs are waxed into an^optically flat steel ring. The brass plate is attached to a spring arrangement on the bottom of the central cylinder. This spring arrangement helps in lowering the sample slowly inside the conditioning ring. The weight of the jig is supported by the ring.The jig stands on the lapping plate and is guided in its motion by a steel arm, which sweeps the jig across the revolving lapping plate.
For finer polishing, diamond paste starting with 10 p,m down to 1/4 pm was used, on softer lapping plates. Polishing times of one to two hours were needed to get an estimated surface flatness of X/lO of sodium light. After polishing one side, the sample was reversed

43
and the second face was then polished flat and parallel to the first face. But, since wax was used to hold the samples on the brass plate, perfect parallelism could not be obtained.
Later, small brass jigs were designed, to hold the samples The two faces of the brass jigs were made flat using the spark erosion machine. Samples were supported in the jig using wax on the sides, so that both faces to be polished were free. Three small pieces of the crystal were fixed with wax on each side of the brass plate.These pieces helped to make polishing quicker, by avoiding polishing of the brass surfaces. Crystals were polished by hand on an optically flat glass plate using successively finer powders. Both faces were polished alternatively and the echoes obtained
were checked to see the improvement in parallelism. A parallelism of within 2 sec of arc was obtained. A train of more than 100 echoes could be obtained as can be seen in Fig. 2.6.

44
FIG. 2.6 A typical pulse-echo train

45
2.4 Measurements in the temperature range 4.2 to 300 K
At the start of this work a few experiments were performed t>y placing the experimental probe in a glass dewar, into which helium could be transferred. But this needed a large amount of helium and the whole system needed precooling with nitrogen. To reduce the cost of running these experiments, a much smaller apparatus was designed, so that the experiment could be carried out in the liquid helium storage vessel. The main problem in this case was the small size of the apparatus required to go through the neck of the storage vessel (diameter 1.95 cm). Fig. 2.7 shows the system used for ultrasonic measurements, which will now be described in detail.
2.4.1 Sonic cell
The sample holders used for ultrasonic measurements at low temperatures are known as sonic cells. Sonic cells used here were constructed from oxygen-free copper. A schematic diagram of the cell is shown in Fig. 2.8. It consists of four parts. The top fixed plate (a) of the shape shown in the figure carried two Cu-Ni coaxial lines for rf in and out to and from

46
c m
(B)(T)
Neoprene ring
(E)
(D)Helium recovery
0-ring
Helium storage vessel
Electrical leads
Teflon spacers
(P)Copper can C
Sonic cell
FIG. 2.7 Block d i a g r am o f experimental probe

47
the cell. The thermometer leads were passed through a small hole in this plate. The second plate (b) had a central 5 nim hole to accommodate samples of varying lengths. A 3 mm space alongside the sample space carried the resistor to ensure that the resistor and sample were in good thermal contact. This plate(b) was kept fixed for all the samples to give minimum possible shock to the thermometer. The third plate(c) had a 2 cm diameter stem which carried a minicoaxial cable for rf out and the thermometer leads were epphored to it using N-grease. For samples smaller in size, special copper plates were machined to locate the samples.
Spring contacts were used to couple rf power to the samples. The contacts were made from small copper discs polished flat and soldered onto the springs made from phosphorbronze. Spring contacts were isolated from the sample holder by teflon spacers. The samples were electrically connected to the cell with silver dag. All these plates had three equally spaced screws (s) to help proper alignment of the cell. The overall diameter of the cell was 1.6 cm.

48
Threeequallyspacedscrews
c>
r r ? ^
\
RF lines
( a )
Teflon
Sample
(b)Resistor ( c )
Spring contact
RF out
FIG. 2.8 Sonic cell

492.4.2 Coaxial transmission lines
Coaxial transmission lines used for rf into and out from the sample were made from concentric cupronickel tubes. A 2 mm tube (D2) surrounded by a 3 mm tube (D3) and held separated from it using teflon spacers, provided a 50 SÎ impedance. Glass to metal seals were used at the 'top ends to which standard BNC connectors could be fixed. The lower ends of these cables were passed through a copper plate which formed a part of the sonic cell and the outer 5 mm tubes were soldered in place. In this way the coaxial lines also provided a rigid support for the sonic cell. The loss in these lines was less than 1 dB at all frequencies.
2 .4.3 Temperature control
The electrical leads were taken down through a thin stainless steel tube. The two coaxial lines and this third tube were passed through a brass plate B and soldered in place. A larger stainless steel tube, T, was slipped over all three tubes and soldered in a small g]^ove in the brass plate as shown in Fig. 2.7. This whole system could slide through a short brass tube D which fits onto the neck of the storage vessel

50
by means of an 0-ring. To make a gas tight seal between D and T, a demountable Edwards coupling E was used, with a neoprene ring. The sonic cell was contained in a very thin walled copper can C (diameter 1.675 cm) which screwed on to the top fixed plate, P. The experimental space is full of helium gas, keeping the temperature throughout the interior of the chamber constant. The apparatus was lowered slowly into the vessel so that it cools gradually. Hie whole apparatus was balanced using counter weights attached to the plate B through a pulley system.
A copper rod was screwed onto the bottom of the can, C. When the rod dips into the liquid helium, the experimental space is slowly cooled down to the liquid temperature. To raise the temperature above 4-2 K a copper constantan wire (38 swg ) around around the copper rod was used as a heater.

512-5 Thermometry
Due to the limited space available, a carbon-glass thermometer was used for temperature measurements. Extensive literature on low temperature carbon thermometers exists (Clement and Quinnell, I952). Two types of resistors are mainly used, the carbon radio resistors (Allen-Bradley and Speer resistors) and carbon film resistors. But these are useful mainly below 20 K. In the temperature range from 4.2 to 3OO K, carbon-glass resistors are suitable. These first developed by Lawless (l97l) at C o m i n g Glass works are quite similar to carbon resistors. It consists of high purity carbon filaments deposited in the voids of a leached borosilicate glass.
2.5.1 Calibration
R(T) for carbon glass resistor is qualitatively similar to that of Allen-Bradley resistor , but sensitivity is
higher - R^^/R^^^ ^ 2. and \ 2 300 — Testsperformed by Lawless indicate that reproducibility of the encapsulated models is better and cycling does not give changes significantly greater than +. 1 mK at 4.2 K. The resistor (CG 638) used in this work

52
— o
V
FIG.2.y Sonic cell

33
was calibrated against another carbon glass resistor (CG 628) calibrated by Cryotech. The R(T) curve for this sensor is given in Fig. 2.10. It is more sensitive below nitrogen temperature, with resistance going from 4l A at room temperature to only 77 A at nitrogen temperature, but rises rapidly to 69OO A at 4.2 K.
2.5-2 Thermal contact
Thermal heat sink^^s very important for all resistor thermometers. Since the carbon glass resistors - are constructed so that the sensing element is thermally and electrically isolated from.its case, the main thermal input is through the electrical leads, and considerable care was needed to heat sink these leads. The resistor was mounted in a 3 mm diameter space in.the sample holder as shown in Fig. 2.9- The thermometer leads made of phosphor bronze and insulated with pol^^ide were thermally anchored to the copper post of the sample holder using Apiezon-N . grease. Electrical leads ( 44 swg copper) from room temperature were also thermally anchored to the sonic cell before going to the resistor as in Fig. 2-9-

54
10 100 TEMPERATURE (K)
300
FIG. 2.10 Calibration curve for a carbon glass(CG 638) resistor

55
A constant current of* ly,A was used throughout the temperature range to keep the ohmic heating as low as possible. No heating effects due to stray rf fields were detected.
2.6 Experimental procedure
For a typical run, sample and sonic cell were cleaned and assembled as in Fig. 2.9. To set the rf transmitter at a certain frequency, a Marconi signal generator and a Mixer (Hewlett Packard) were used.The signal generator was set at the desired frequency. The rf output was mixed with the output from the Matec transmitter and the resultant output displayed on a CRO, Frequency of the Matec transmitter was adjusted till there were no beats in the output signal- Using this procedure the frequency could be set to within . 1 MHz. After setting the frequency, a pulse from
the Matec was applied to the transducer or the sample and the reflected or transmitted signal was receiv ed by carefully tuned receiver system. The experimental probe was slowly lowered into the helium vessel.
56
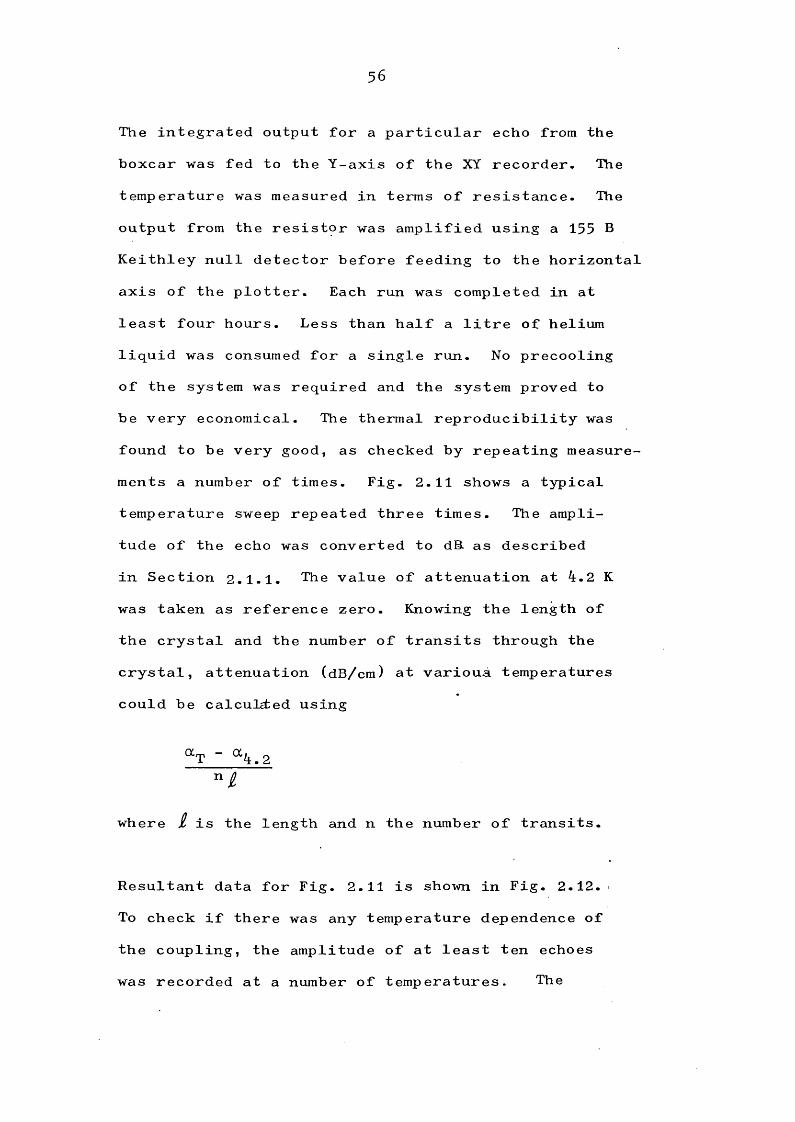
The integrated output for a particular echo from the boxcar was fed to the Y-axis of the XY recorder- The temperature was measured in terms of resistance. The output from the resistor was amplified using a 155 B Keithley null detector before feeding to the horizontal axis of the plotter. Each run was completed in at least four hours. Less than half a litre of helium liquid was consumed for a single run. No precooling of the system was required and the system proved to be very economical. The thermal reproducibility was found to be very good, as checked by repeating measurements a number of times. Fig. 2.11 shows a typical temperature sweep repeated three times. The amplitude of the echo was converted to dB. as described in Section 2.1.1. The value of attenuation at 4.2 K was taken as reference zero. Knowing the length of the crystal and the number of transits through the crystal, attenuation (dB/cm) at variouà temperatures could be calcuLted using
° T ^4.2n n
where t is the length and n the number of transits.
Resultant data for Fig. 2.11 is shown in Fig. 2.12. To check if there was any temperature dependence of the coupling, the amplitude of at least ten echoes was recorded at a number of temperatures. The

37
B 5 0
F r e g l.
(iio,ooi)T, IS MHz
l!K.t ..I.-14. 'ant
11
ilUlIIHrrzsK
jIÛÛ IZO IlfO \60 ISO
R (fl)
20D 220 ZifO 250
FIG. 2.11 A raw data plot from X-Y recorder

58
BSO (110,001)12
10
Bü
OHH<D§HH<
60.040.00.0 20.0TEMPERATURE (K)
FIG. 2.12 Atténuation as a function of temperatureobtained from the raw data given in fig. 2.11

59
attenuation (dB/cm) was calculated from successive echoes, but no temperature dependence of the coupling was observed. Measurements repeated over a period of more than a year show the reproducibility of the initial calibration. The same procedure was used for all attenuation measurements, throughout this work.The data plots given in the following Chapters have been plotted by computer using the attenuation values calculated as explained above. The program used for data analysis, to calculate the activation energies and relaxation times has been given in Appendix I.

6o
CHAPTER THREE
RELAXATION ATTENUATION AND MEASUREMENTS IN UNDOPED BGO, BSO
The first part of this chapter deals with the basic theory for anelastic relaxation in crystals, discussed in detail by Nowick, Berry and Heller in their various publications. Various possible relaxation processes are discussed.
In the second section, experimental results of ultrasonic attenuation in undoped BGO and BSO are presented and discussed.

6i
3.1 Relaxation
The term relaxation is used to denote the time-dependent self-adjustment of a system to a new equilibrium condition when an external variable is changed. When the external variable is stress on a crystal it induces an appropriate strain. In a perfectly elastic crystal an alternating stress produces a strain which is in phase and no energy is dissipated. However, when defects are present, the strain will lag behind the applied stress (Zener, 1948), and such a response is called anelastic relaxation. Considering a stress of the form:
cr = cr exp ( iwt )
the strain can be written as
£ = (e^ - iSg) exp(iwt)
The value of e/cr immediately upon application of the stress is the elastic compliance s, and the magnitude of the time-dependent change in strain per unit stress e(t)/(T is known as the relaxation of the compliance 5s.
In the case of a suddenly applied static field, the time-dependent behaviour obeys an exponential relaxation, whereas under an a.c. field the components

62
depend on the frequency, 0), through the Debye equations
and
The out-of-phase component of strain, , gives rise to damping or internal friction in the sample. The two parameters 5s and r are known as the magnitude of relaxation and relaxation time. These equations are analogous to those obtained for the case of dielectric relaxation.
3-1-1 Origin of, Anelasticity
The state of a standard anelastic solid can be completely described by some internal variable, which may describe the distribution of a collection of defects or the electronic distribution in the solid. This indicates that anelasticity occurs as a result of the relaxation of internal variables that are coupled to the elastic properties of the crystal. Point defect relaxation or electronic relaxations mainly occur in the case of semiconductors or insulators.

63
3-1-2 Electronic relaxation
Stress may induce a change in the electronic configuration of a crystal provided that a redistribution of electrons can produce a corresponding strain. For piezoelectric semiconductors, an ultrasonic wave propagating through the crystal is accompanied by a piezoelectric field which acts on the mobile charge carriers. These carriers move toward regions of potential minima in’, the piezoelectrically induced electric field.
In insulating crystals, electronic relaxation can occur due to the redistribution of bound electrons among two or more equivalent sites.
3-1-3 Point defect relaxation
The presence of defects in a crystal destroys its translational symmetry- The simplest point defects are, a vacancy, an interstitial atom or a single substitutional atom. The defect symmetry is the point group symmetry of the crystal and defect at the site at which the defect is present. The defect symmetry may be lower than or equal to that of the equivalent point in the perfect crystal. If the defect has a

64
lower symmetry than the perfect crystal, there must exist more than one distinguishable orientation of the defect. In such cases relaxation occurs because of the redistribution of defects among sites which are initially equivalent but become inequivalent in the presence of an external field. The various possible defects in cubic crystals are given in Table j.l.A defect present in the crystal will interact with a homogeneous stress applied to the crystal, as an electric dipole interacts with an applied electric field. Due to this analogy, Krdner (1958) called such a defect an elastic dipole. The change in strain of a crystal in the presence of defects is given by
®ij - 1], % (3-1-3)J iJ P
. and G9. are the strains with and without defects ij iJand p is the index giving one of the possible orientations of the defects. C is the mole fraction ofPdefects in orientation p given by
represents the sity of defects in orientation pand ( = l/N , where N is the number of molecules/p, p,unit volume) is the molecular volume. Equation 3.1.3defines a tensor X ? . which characterizes the elasticij

65
(pCMrHr<
*O ülcn or< 1
O0 T"4 ulcnE O r< 1 Ok r<0-p 00 ü|A 3 r< |rr\ O•H 1—1 CM O0•o >■Hf< H0 cn CM 0 onSh A r< % r<0 -H <<(p UP!0 -HÜ k CM CM 0 CM0 Ph CM c<t e*i. f<!•H000P, rH rH 0 rHA rH r< r<
o W•H-p(CXcC -P 0iH Ü 0O EU -H -H O TH o-CM -P -Po CÔ “ 0•H 0 •H Ü4") Üp 13 0CC 0 (p -PrH •H O 00) (H CM . Mri A ■H Pi 0CO E W : 0 Ho 1 ^ 0 ■ H O CM CMÜ r-i . B U0 ■H 3(H w -jz;to(Ur43 Ü•HI—1 rOfl 0 s A Ü0 S H O O -H•H 0 0 Æ o p!-P bO Pi H 'HÜ -p 0 O 0 w 1—10 Ü Pi Ü) jO ÜiH 0 P -H P -H0 (p 0 Pi k Pnt/3 0 H E-f O HQ
tH• 1—10 Ü-P -HW 0% 3PQ P, O< o
OJO] CM
I<<
03 U

66
A3
FIG. 3.1 Strain ellipsoid

67
dipole with components given by
Therefore is the strain per unit mole fraction of
defects having the orientation p. Since A?j represents a strain tensor, it must by symmetric and therefore can be characterized by a strain ellipsoid with three mutually perpendicular principal axes.
In the coordinate system of the principal axes, the A tensor becomes
0 00 00 0 A
The principal values A^, A^ , A^ are independent ofthe orientation p. The A. . components can be relatedijto the principal values (Nye 195?) by the equation
= i: “L “ j m <3.1.4)m=l
The index m ranges over the three principal values,
OC? is the direction cosine between the fixed axis and imthe m^^ principal axis of the dipole^ of orientation p. The symmetry of the A tensor must reflect the symmetry

68
of the defect it represents. So, the principal axes are limited to lie along the symmetry axes of the defect, and the number of principal values is also sometimes limited. It means that more than one physically distinguishable defect orientation may give the same X tensor. If all defect orientations have identical response tensors, then relaxation cannot take place. If the number of independent tensors, n^ is greater than one, an arbitrary stress interacts differently with defects having different X tensors. This gives rise to redistribution of defects and to anelasticity.From this argument Nowick and Berry have derived a general rule called the n^ criterion.
A crystal containing defects will undergo relaxation if n^ is greater than one. The n^ values for various defects in a cubic crystal are given in Table 3.1 In this table,-presence of a zero implies the relaxation of that particular compliance does not occur.A number 1, 2 or 3 tells how many distinct relaxation times the designated compliance will manifest.

69
3-2 Relaxation strength
Nowick and Berry ( 1972) have derived an expression for the relaxation strength making the following assumptions. All defects may be represented as elastic dipoles with n^ crystallographically equivalent orientation of the X tensor and the total concentration ofdefects per formula u n i t , c a n n o t change; but dipoles
OlCi a c TLof one interact!on can go into another orientation. Since all orientations are crystallographically equivalent, at zero stress the mole fraction of defects having a X tensor in the orientation p is given by C^/n^ for all p. Considering a uniaxial homogeneous stress the change in strain is given by
*t .. =11 = "u' <3.2.1)
P = 1
s^ is the unrelaxed compliance for the crystal orientation parallel to the applied stress. The summation term represents the anelastic strain.
Using the differential form of Gibbs function, they have calculated the change produced by a stress <r, in the free energy level, , for dipole p,to be

70
- g E _ % -Vq \<P^ (3.2.2)
Integrating for small values of the stress
P,P
i.e. free energy levels depend only on stress and not on defect concentration, if the concentration is small enough defect interactions do not take place. Once the levels are split, they will be re populated in accordance with the Boltzmann distribution law. Thus the equilibrium values for the concentrations at any given stress and temperature is
C -(YpAT)P e
q
Expanding the exponentials under the assumption thatY /kT « 1 and substituting for y and v gives 'q 'p 'q
C -“ t
- 2 ] 1 ( 3 - 2 -q J
3)
so deviation of from C^/n^ is proportional to a and Cq. This redistribution of dipoles is known as stress induced ordering. Substituting Eq. (3-2.3) in to Eq. (3-2.1)

71
ôs =— an V o
ntkT P
This relation applies for relaxation under any simple stress. Since there exist several compliances which can undergo relaxation, it is needed to know which of the various compliances undergo relaxation.
Nowick and Heller (I965) have generalised the above expression to calculate the magnitude of relaxation for symmetrized compliances. The relaxation of the symmetrized compliance 6s' has been expressed in theYform
(3-2.4)
where is the symmetrized component of the X tensor for the symmetry designation y- Expressing the quantity X ' in terms of the components X. . of the X Y ijtensor, they have obtained the magnitude of relaxation for shear compliances.
For a cubic crystal the magnitudes of relaxation are given by

72
6 (s^^ T 312^ 6kT ^22^ ^^22 ^33^]
(3-2.5)
and
^^44 3kT [^23 ^31 '*■ ^12] (3-2.6)
These equations are applicable for defects of any allowed symmetry in the cubic crystals. The number of independent values of the X . . coefficients for various defects,ijdepends on the symmetry of the defect. The X^^ components can be expressed in terms of the principal values as given in Table 3-1- Using Eq. (3-1-4) and substituting in Eq. (3-2.5 and 3-2.6), the magnitude of relaxation for various defect symmetries can be obtained. This helps in finding which compliances relax, when defects of a certain symmetry are present.
Considering a trigonal defect and expressing X^^ in terms of principal values, it can be seen that
f ■ ®12^' = ° (3-2-7)
and
73
a ( = 44) = ? ^ (3.2.8)
Similar expressions have been obtained for defects of other symmetries. Table 3-1 gives the possible defect symmetries and the corresponding compliances that undergo relaxation in cubic crystals. It can be seen from Eq. (3-2.8) and other equations obtained by Noifick et al for various defect symmetries, that the magnitude of relaxation due to point defects is proportional to the total defect concentration and varies inversely as kT. It also varies as the square of some difference in principal values of the X tensor.
Therefore, if the total defect concentration is known, an anelasticity experiment can provide |X^ - X ^ .
The presence of a collection of randomly orienteddefects changes the lattice parameters of a crystaland from this change some parameters of the X tensorcan be obtained. From the definition of the xf^^ijcoefficients,

74and for a hydrostatic strain per unit concentration of defects
Since the strain is invariant to the rotation of the axes, therefore
This shows that the .fractional change in lattice parameter a^per unit concentration of defects is equal to y ( + X^ + X^).
This equation provides another relation involving the principal values of X.
For a trigonal defect, if \ = X , then2 J
3a + 2Xg) ( 3 . 2 . 9 )
For a substitutional atom on a site of cubic symmetry, x^ = X^ x^ =. X
and there is no relaxation. From Eq. 3 * 2 .9 ,
da * y d-„ == ^
75
3.2.1 Relation between attenuation, velocity and elastic modulus
For cubic crystals the elastic constants and elastic moduli are related as
C44 - 1/344and
To obtain an expression for attenuation in terms of s. . and we will consider the ( 100,001) transverse wave and the (111,111) longitudinal wave.
For the (100,001) transverse wave, the velocity is given by
pVg =
or in terms of elastic modulus
uV (100,001) =_____ ___
44P
If 5^2. Î3 the modulus that relaxes, let us assume
0 . , *=44 - =44 *=44
i 0 ' "= =44 + 5«44 - j^®44

76
= [p(s°4 + *=44 - ->*=44)] ^
= V 1 -6 s2s
#044
= V
2 J •PV3 ]Therefore
pv w a = Ss%4 ( nepers/m)
Using Debye equations as discussed in Section 3.1,
PV,a = 2 1 + w2r2 44
(3.2.10)
For the longitudinal (ill, 111) mode, the velocity is given by
P L 3 (=11 + 2Cj2) + 4/ 3 (044) + 4/3 1411
So, expressing this in terms of compliance constants, the attenuation is given by

77
2 1 OO r ÔS,,(111, 111) - 32^ ,,„2^2 -
= 3 7 ^ 2 *=44 (3.2.10a)L 1+ÜJ r
As discussed in Section 3-2, 6s^^ or 6 s in general is proportional to the total defect concentration and varies inversely as kT. Therefore the attenuation, a, is given by.
“ = (*^)^ -“ ^2 2 (3.2.11)l+uTT^
Here (3 is a numerical factor, 6X the appropriate difference in principal values of the X tensor and is the molecular volume. So the attenuation is proportional to the number of defects and inversely to the termperature. We can write
OC = 4 — p (3.2.11a)1+0)
The corresponding change in velocity would be

78
V - Vp l «S44
PV3 1
79
3-3 Relaxation processes
A number of relaxation processes have been considered by various workers to explain the change of position of an atom or ion in crystals.
3-3-1 Thermal activation
At a temperature, T, such that kT approaches Q, the height of the potential barrier, the relaxation mechanism is considered to be thermal activation across the barrier (Zener 1952). In this case, the relaxation rate is given by the Ai^henius equation
X = esp (^) (3.3.1)
where k is the Boltzmann’s constant and l/x^, the attempt frequency. l/x^ is a product of a vibration frequency and an entropy factor (Zener 1952). From Eq. (3-3-1) it can be seen that in such a case x may be varied over a wide range by simply changing the temperature.

80
From Eq. (3-3.1)
In (jOX = In (A)r + (Q/k)(l/T) (3.3.2 )
Since for the case of a Debye peak, In wx = 0 at the peak, therefore
In COX + (Q/k)(l/T ) = 0 (3-3-3)^ M
Here is the temperature at the peak. From a series of peaks obtained at different frequencies. In CO plotted versus l/Tjq would give a straight line whose slope is ;Q/k. This provides the activation energy of the process involved.
But when k T « Q , the process of thermal activation does not contribute, and to explain the observation of a finite X a number of other mechanisms have been considered by Sussman (1964, I967), Pire, Zeks (1966) and Orbach etal (1961).

81
3«3*2 Tunnelling process
Sussman has treated the passage of a particle from one potential well to an adjacent one by quantum mechanical tunnelling. Considering a particle moving in a potential well consisting of two adjacent parabolic wells, whenever the two wells are equivalent the particle can be described by symmetric and antisymmetric wave functions.A particle in such a case has equal probability to be in either of the two wells and cannot be considered localized in any of the two wells.
If the potential wells are made inequivalent by random internal strain or external applied fields, the wave functions are in general assymetric and localize the ^partiele. Phonons can induce transitions from the localized state in one well to the localized state in the other well. Three types of transition processes have been discussed.
(a ) One Phonon Process
This process also known as the direct process, involves the emission or absorption of a single phonon. Sussman (1964) considers this relaxation mechanism to be tunneling accompanied by simultaneous emission or absorption of a phonon, but Pire et al (1966) considered the successive processes of tunnelling and the phonon

82
emission or absorption. Using first order perturbation theory, the relaxation time is given by
(b) Raman Process
The single phonon process dominates only at the lowest temperatures (below 20 K). At slightly higher temperatures, the second order processes, involving virtual intermediate states may occur. In this case, the relaxation time for temperatures below the Debye temperature has been calculated to. be
X - T 7; T<K 0Q
For temperatures above the Debye temperature, X ~ T"2 ; T >
(c ) Indirect Process
The third type of transition is considered to be multi phonon or an indirect process involving intermediate states. The relaxation time is given by

83
7 ~ [1 / exp (A. AT)- 1 ]
is the energy difference between the initial and intermediate states. When A^» kT, the expression 3.2.2 reduces to rate equation. Similar processes are discussed by Van Vleck (1967) and Scott and Jeffries (1962) for the case of spin lattice relaxations- When all three processes are present the relaxation time x is given by
X Ç e x p ( A ^ A T ) - 1
Experimental measurements can yield x as a function of temperature which provides evidence for the relaxation process involved. From the measured relaxation times and a model of defects in the crystal, the jump rates of an atom or ion that change position in the process of reorientation of the defect may be determined.

84
3-4 Experimental results
The attenuation measurements were made on the undoped, doped, irradiated and annealed Samples of BGO and BSO. Results for undoped crystals only are discussed in this chapter. The attenuation was measured for various modes as a function of temperature, T, and frequency, 0),
3-4.1 Data for BGO
Three samples were prepared as described in Section 2-4 with < 100>, <111> and < 110> orientation from the same boule of BGO. IVo transverse (llO, OOl), (l00,00l) and two longitudinal (lOO, 100) and (ill. 111) modes were studied. The data was obtained at three frequencies over the temperature range from 4.2 to 260 K using the method described in Ch ^ t e r Two. Each set of results was obtained by carrying out a number of warming and cooling runs. From the raw data (plots from the XY recorder), as shown in Section 3-7, the relative attenuation was calculated taking the attenuation value at 4.2 K as a reference zero value.
FIG. 3-2 shows the attenuation as a function of temper-? ature for the transverse (llO, OOl) mode at 15, 25 and

85
BGO (110. 001)>4.00
15 MHz
25 MHz
55 MHz
BümT3
$.00
$.00
<S
4.00
0.00100.000.00 20.00 80.0060.00
TEMPERATURE (K)
FIG. 3.2 Attenuation of T(llO, OOl) mode as afunction of temperature and frequency

86
35 MHz. A large attenuation peak was observed between 35 and 60 K. As can be seen from Fig. 3-2, the peaks shifted to higher temperatures as frequency was increased.
FIG. 3*3 shows the results for transverse (lOO, OOl) and longitudinal (lOO, lOO) modes. Transverse (lOO, OOl) mode showed a similar attenuation peak, with larger amplitude, but no peak was seen for the (lOO, lOO) longitudinal mode. A similar, but much smaller peak was seen for the longitudinal (ill, 111) mode as in Fig. 3*4. These results show that ultrasonic waves are attenuated selectively in this temperaturerr^uge.
3.4.2 Data for BSO
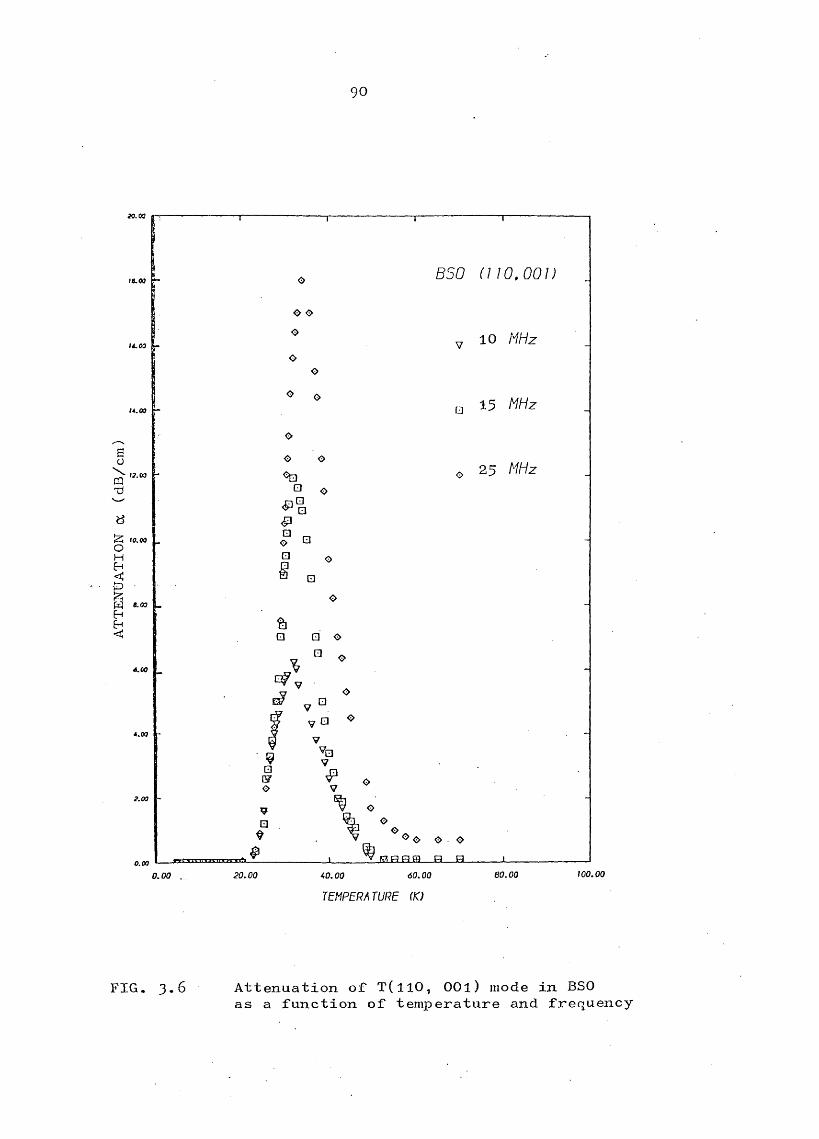
For Bi^gSiOgQ, only the transverse (100, OOl) mode was studied, using a cylind rical rod sample. The attenuation peaks were found to be at slightly lower temperatures (30 - 50 K) and larger in amplitude comparedwith those for transverse (llO, OOl) mode in BGO.
i
For BSO, a smaller peak at 15O K was also observed.The height of this second peak also increased with increasing frequency, but the shift in position was

87
6o\03 le.oo T)
IHf - l 14.00
I
5 “
0.00
Æ I M # g20.00
caS
□ □ □ a
□
%]o
BGO (WO. 001)
„ 25 A//Vz
□
□□□
00
b 0% 0V 0
0V0
VV 0V %
oo
o
o
o
VV
□□
45 MHz
90 MHz
(100,100)25 MHz
<s>o
□%
f • # • •40.00 60.00
TEMPERATURE (K)
â 80.00 100.00
FIG. 3»3 Temperature and frequency dependence ofattenuation for the transverse (lOO, OOl) and longitudinal (lOO, 100) mode

88
10.00
BGO (111,111)45 MHz 90 MHz
a. 00
ë
54.00
2.00
0.00,
TEMPERATURE (K)
FIG. 3.4 Attenuation of L(lll,lll) mode

89
10• •• •
*
BGOFreq. 25 MHz
(100,001) * (110,001) □ (111,11 1) ® (100,100)
H-
0.*_o° #
° o *_«L
0 50TEMPERATURE (K)
100
FIG. 3«5 Attenuation as a function of temperature for all modes studied for BGO
90
Bo\pq
^ 10.090H
<1 'f£] «.«H
0.00
o o oo oo o
% a o<po G □g □
%□
V ° ,
V GOo
■□o9□
%VfV o
o
10 MHz
□ 1 5 MHz
25 M2z
20.00 40.00 <50.00
TEMPERATURE (K)
80.00 roo.oo
FIG. 3,6 Attenuation of T(llO, OOl) mode in BSOas a function of temperature and frequency
91
negligible. But for BGO no corresponding peaks were observed up to 250 K. Fig. 3«5 shows the attenuation as a function of temperature for all modes for the complete temperature range from 4.2 to 120 k .
The peak attenuation was unchanged by changing the input acoustic power by 20 dB. Attenuation could be measured to within . 1 dB. Table 3-2 gives the peak attenuation values and the corresponding peak temperatures, T^, for various frequencies.

92
TABLE 3*2 Peak attenuation and peak temperatures for various modes and frequencies
S amp1e Orientation ModeFrequency
MHz< M
(dB/cm)±-l (K)
BGO 110 T, 15 4.6 44.625 9.3 47.835 13-7 51.5
II 100 T 25 13.04 46.2545 21.9 49.590 52.5
II 100 L 2545 - -
It 111 L 45 4.36 46.590 9.55 51.0
BSO 110 T 10 6.2 31.515 11.9 32.2525 17.0 34

93
3-5 Analysis of the experimental results
3-5-1 Shape of the attenuation peaks
The attenuation peaks show the usual features of a relaxation phenomenon.
(i) The peaks shift to higher temperatures withincreasing frequency as shown "in Fig. 3.7 . IP,.,
(ii) The peak amplitude increases with frequency (1).
(iii) On the higher temperature side of the peak, the2attenuation varies with frequency as ~ 0) .
(iv) Curves for all frequencies overlap on the lowtemperature side of the peak.

94
3.5-2 Relaxation time
The next problem was to characterize the unknown relaxation time spectrum from the experimental attenuation curves. Various relaxation processes are possible as discussed in the previous sections, and the relaxation time spectrum may be composed of a set of relaxation times or it may be a continuous spectrum characterized by a particular distribution function-
From the attenuation curves obtained at different frequencies, 0), log 0) was plotted versus l/T^^ as in Fig.3- 7- A straight line plot was obtained for both _BGO and BSO. Since for a relaxation peak, 0)x = 1 at the peak temperature, so the straight line plot suggests that the relaxation time, x, obeys an Arhenius relation given by
From Eq. (3.3.2 ),
In (jOx = In W x ^ + 0 (^) where 0 = Q/k (3-5-1)
Since at the peak temperature T , COx equals unity and In COx = 0, therefore
In COX + 0(l/Tj^) = 0

95
100
BGO BSO
20
(l/T) K'*‘ .03.02
FIG. 3.7 Logarithm of the frequency versus reciprocalof peak temperature for BSO and BGO

96
and the slope of the straight line plot obtained above (Fig. 3*7) gives 0 and hence the activation energy of the process involved.
The slopes of the two straight lines give
Crystal 0 QK eV
BGO 511 0.044
BSO 367 0.031
since a small range of frequencies^was covered, this method gives approximate value of the activation energy,
A precise way of calculating the activation energy described by Nowick and Heller was used. If the normalized dynamic response function of a standard anelastic solid is plotted versus l/T, equivalent values of the response function taken at different frequencies correspond to the same value of OOr. If l/T^ and l/T^ are the values corresponding to a certain value of the response functions at frequencies 00 and , then from Eq. (3-5-1) ‘
in (^) = e(T-^ - T - h (3.5.2)

97
L O O
.80
60
8-JI ,40
.20
0.00
□V
a
□□□
909
0 900 9
V
V
□ Vg□ V
V
0□
V
□□□V
VV
a
0VV
0V
00
000
BGO (100,001)
V
0
25 MHz
45 MHz
00 V
V
0 90 V
V0 V
9t?0 97
0 ^ 90 9
;.40 1.60 1.80 2.00 2.20 2.40 2.60 2.80 5.00 5.20 3.40
• T'(K-') x/o"
FIG. 3.8 Normalized attenuation for thetransverse (lOO, OOl) mode versus l/T
98
This equation should be satisfied at all points on thecurve.
If 0, i.e. the activation energy is constant, curves for two frequencies should be displaced by a constant shift 6T along the l/T axis, which is equal to l/0(ln From the shift 5T ^, 0 can be calculated
Fig. 3,8 shows a plot of normalized attenuation versus l/T for the transverse (100, 010) mode at 25 and 45 MHz. From the shift 6T“ at a-number of points; the value of activation energy^ calculated by using Eq- (3-5.2) is tabulated below.
S. No. 0K Q eV
1 485-7 0.0422 413-9 0.0363 477.8 0.0414 416.8 0.0365 425-9 0,0376 445.0 0.0387 413-9 ' 0.036
This gives the average activation energy to be O.O38 + .002 eV.

99
Using Eq. (3»5«1)î the width of the Debye peak versus l/T is given by
A(T"1) = (1.144)(2 .303/e)
Therefore the peak width is inversely proportional to the activation energy, if the peak is truly a Debye p eak.
From Fig. 3-8, using the peak width at half maximum.
Frequency Width athalfmaximum
0
. MHz A(T-l) K eV
25 5.2 X 1 0 " ^ 504.8 .04345 5.4 X 1 0 “ ^ 4 8 0 . 8 . 0 4 1
This gives average activation energy to be 0.042 .001 eV,which agrees quite well with the values obtained above.This shows that attenuation peaks are single Debye p eaks.

100
3.5.3 Least square fittings
The relaxation time as a function of temperature was. calculated by computer fittings.
As derived in Section 3-2.1, the relaxation attenuation is given by
^ <3.5.4)
where A is a constant depending on the number of defects and the relaxation strength. The relaxation time z obeys the Arhenius relation.
From the experimental value of attenuation a, at peak temperature for a certain mode and frequency A was calculated. Using least square fitting methods, by varying Xqq and 0, the relaxation time r(T) was obtained for temperatures, T, from 20 K to 80 K. Plots for In (x) versus l/T are shown in Fig. 3-9, 3-10, 3-11- The computed values of activation energy attempt frequency l/z and A''s are given in Table 3-3-
An example of a fit produced using A = 34.8 dBK/cm/MHz and l/^oo = 4.6 x lO^^Hz for the transverse (lOO, OOl) mode is shown in Fig. 3-12.

.01
-6
-7
-8
-9
-10
1.00 1.20 r.«0 1.60 1.80 2.00 2 .20 2 .tQ 2 .60 2 .80 3.00 3.20 3 . i0 3 .60 5 .80
T" ( n x/O -2
FIG. 3-9 Logarithm of the relaxation time versusreciprocal temperature at different frequenciesfor the transverse wave (llO, OOl) in BGO

102
f/00, 0 0 /;
-6
45 Af/'/z
-7
-8
-9
-10
1.00 1.20 l . * 0 1.60 2 .00 2 .20 2. to 2 .60 2 .00 5 .00 5 .20 5 .tO 5 .60
r ( n x/O -2
FIG. 3.10 Logarithm of the relaxation time versus' reciprocal temperature for the transverse
(lOO, OOl) mode in BGO

103
B50 (110/001)
10 MHz
15 MHz
- 7 25 m z
-8
- 9
-w
-ff1.00 1.20 l . * 0 l . iO 1.80 2 .00 2 .20 2 .^0 2 .60 2 .80 5.00 3.20 5.40 3 .60 3 .80 4 .00
r ( n x/O
FIG. 3» 11 Logarithm of the relaxatioil time versusreciprocal temperatute for the transverse(110, OOl) mode in BSO

104
0)T3OB
-p
gü0)
(H(H
P
SIK
(MtHo
tH+ 1lA 3
lA
+ 1LA
CM
3LA
i'P
3LA
3
p
+ 1LA
•HXi
> LA LAu o tH rH P o rH O O0 o o O o O o O O(H o o O o O o O O
< +1 +1 + 1 +1 + 1 + 1 +1 + 1CA CM rH CM CO LA
xi CM CM CMti O o O o O O O O(0 O' • • • • • • • •>>üd<D w CM O
o\, P , LA, CA rH r - , •cr* + 1 + 1 + 1 + 1 +1 +1 + 1 + 10) CJN CX> P p o COU C7N O CO A- CO i>- CA fN-
(H CD lA CM CA CM
Aa N0)
•p S '' LA CT'p E-4 p vp O CM P O O COce % a • • • • • •
d ü r - vp CO MD CO CJN o -4\ CM CA CA LA -4
%fao
II Ui
a>fj
< CQTd
CD
ti %O ü■H tiP CD lA lA LA LÀ o O LA LAce 3 P CM CM CJN p p CM> a*
•H CDP UÜ Pce 'POo P P p0) CD O O o3 73 O O OH 0ce S o o O> p .o P
p p P'—'
c* '• Pen 3
P o OM (f) a enJ % m 03PQ k< üH

105
CO
en
-fui
U1
CM
oCM
oI—1 o
o-pTJ0-PP>•H(HOgTl0A0'd§PÎ §•H s0 Ü•dOe P3■dT-t COoo
(T \
b IIotH <
rd-P(p 'Ho
X—o•H *P> lACOd CAd '—0-p »
-p<
03tH
CJ3H
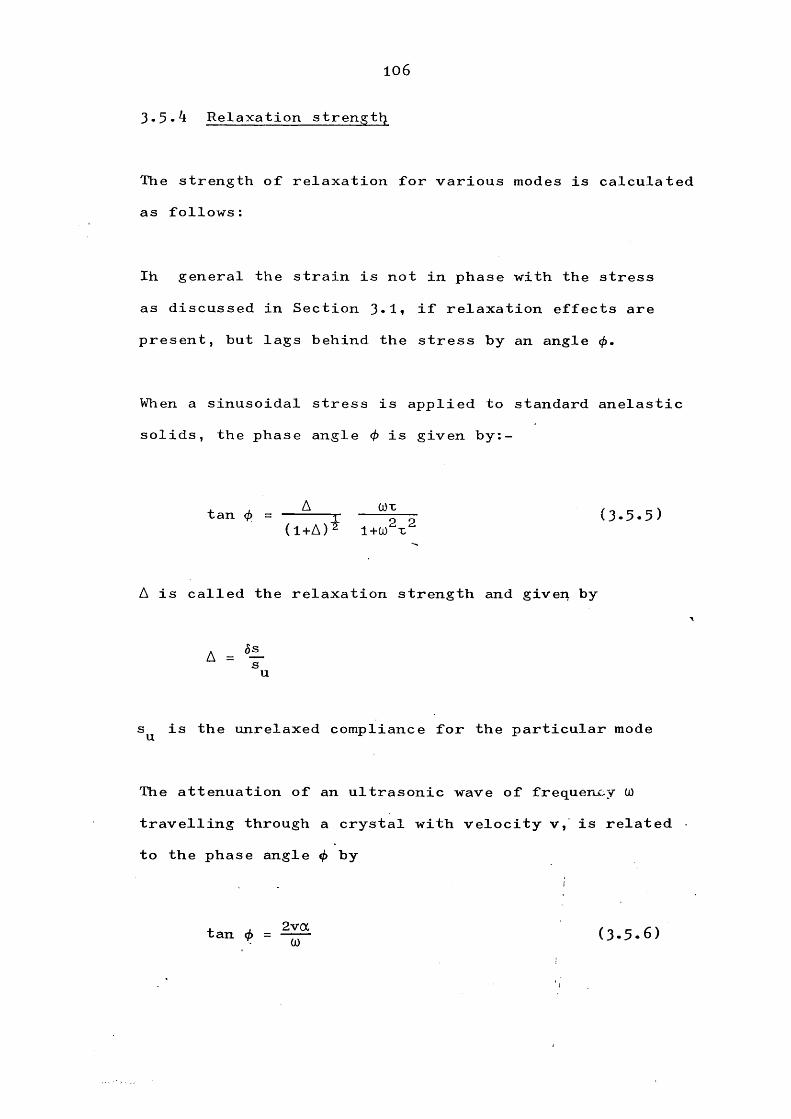
106
3.5.4 Relaxation strength
The strength of relaxation for various modes is calculated as follows :
Ih general the strain is not in phase with the stress as discussed in Section 3.1, if relaxation effects are present, but lags behind the stress by an angle 0.
When a sinusoidal stress is applied to standard anelastic solids, the phase angle (f> is given by:-
tan * = — -— X — (3.5.5)(l+A)2 1+ca X
A is called the relaxation strength and given by
u
s^ is the unrelaxed compliance for the particular mode
The attenuation of an ultrasonic wave of frequency W travelling through a crystal with velocity v, is related to the phase angle 0 by
tan <f> = (3.3 .6 )

107
From Eq. i (3^5.5 ) and (3.5 .6 ) and the experimental value of attenuation, the relaxation strengths for various modes were calculated and are given by Table 3.4.This shows that the strength of relaxation depends on the mode.
The relaxation strength A is much less than one, for all modes. Nowick and Heller have derived that if A < O.Ol there is no interaction between the defects.
3.5.5 Discussion
(a) As can be seen from the experimental results the transverse (lOO, OOl), (llO, OOl) and the longitudinal (ill, 111) modes show similar attenuation peaks. But no peak was observed for the longitudinal (lOO, 100) mode.
The strength of relaxation as given in Table 3.4 depends on the mode. The experimental results for various modes studied for BGO and BSO are summarized along with the effective elastic constants in Table 3.5*
This table shows that the low temperature attenuation peak is shown only by those modes whose' velocity depends on the s^^ compliance constant. --

108
B <oU -(H P
n faO ^Q) Fl 14-> 0 O(0 U rH LArH P 13 W X CA CO CD CO o CA O CO, oc 03Ü PrH F! c\J CD LA CM 03 CA -zf ^(C O VÜ •H +1P% (0 CA0 0 X 1"0p (0 oO rH rH rHa 3 0
0 FdH-> 0ti Sh0u rH tA0 (Q ÜCh -p f!Ch ü 0 N•H 0 F! K LA LA lA LA LA O O LA LAE O' § (N 03 CA ^ OC H P 03
•H 0k FhO 0 ÀCh -Æ!
X0-P ÜbO 0Ü % 00 P \ CD CM *U •H S O CA CA O-P Ü Ü CD r- CA CA rCO 0 • • • • •
rH LA P p CA CA p •0 Oo > rH
■H■P -•(0 H H b HXca p p P O prH O o P o O0 0 o o P p oP4 'd - »-0 o o P o o% o p P o pp p P rH p' ' ' ""
• rHCA caP o oM 0 enb % m mm U< oH
KOr-o\
X)utcK

109
00■doG0do•HuCO>FiO(H0PgP0FîOÜ
0Üdce•HPGoü
T(§Ü•HP0ce
0>•HPÜ0PPH
lACA
W
g
IS O gfî P P ce p p 0< ce A
0üg•HiHGoO0>•HPÜ0PPW
Ü•HP0cepw0•Spü0
ppH
0"dS
d o0 -H •H PU ce o p
pcep0%do
0 O 0 0 00 |2i 0 0 0
>4 >4
03P
0cmJca
+pI
03P0
03+PP0
p Ica
0
-:t jcA +
PICMP0CM+
P|CA
CM 03P
0 PLO1P (AP 4-
Ü'—'
0]|CA Ü
+ " |CA+
^ CM CMÜ P P P
Ü 03 p 0 P ÜCM 0 W 03+ +P h PP P
Ü üw
pjcA J pjcA
03 P 0 0 PW
Ü
oO
oo opp
pp
op
og
owpq

110
Similar results were obtained by Rehwald (1973) From Table 3*5 » the velocity for two transverse (lOO, OOl) and (llO,OOl) modes is given by
2pv (100, 001) = c
and
^2PVg (110, 001) =
®11
Both modes show similar attenuation peaks, therefore contribution from dielectic loss through piezoelectric coupling must be a small fraction.
If s ^ is the elastic compliance that undergoes relaxation, then as derived in Section 3.2.1, the attenuation can be written as
8s(100,001) = 2 44
page 92From Table 3 •2. using the peak attenuation, &s^^ can be calculated for both transverse modes.
Similarly 5s^^ can be calculated for the longitudinal (ill. 111) mode using Eq. (3.2.10a). The calculated values for 5s^^ are tabulated below.

Ill
Crystal Mode
Frequency
MHz
5^44 *10"13
(100,001)T 25 2.3 _+2 X .10“^^45 2.2
(110,001)T2 25 1:635 1.8
BGO(ill,111)L 25 2.
45 2.090 2.6
BSO (llO,OOl)Tg 10 1-825 2. 1
* M o?ijvvaxU^e_Jl gX 5 'o (C
As can be seen from Table 3*5i the transverse (llO, OOl)and (lOO, OOl) modes have s j as the effective complianceconstant, while the longitudinal (ill, 111) involvesboth (s^^ + 2s^2,) and s^^. but the values of 8s^^for all three modes are the same within an order ofmagnitude- Further, the longitudinal (100,*100) modewhich has (s - s ) and (s + 2s ) as the effective 11 Tl £-1 11 X id
compliances shows no attenuation peak. This confirmsthat s j. is the only compliance that undergoes relaxation.

112
(b ) Defect symmetry
As shown by Nowick et al, for cubic crystals the compliance + 2s ) does not undergo relaxation,therefore only (s^^ - s^^) and s^^ have to be considered. The selection rules given in Table 3-1 show that for a tetragonal defect only (s^^ - s^^) relaxes and for a triclinic defect both (s^^ - 2^^) and s^^ relax.But for a trigonal defect only s^^ relaxes.
Therefore, the defect responsible for the attenuation peaks observed in BGO, BSO must have a trigonal symmetry.

113
(c ) Defect concentration
As derived in Section 3-2.1, when a trigonal defect is the cause of relaxation attenuation, the attenuation can be given by
a(nepers/tn) = pv^ IEt™ I ^^ l+W^T^
V M 2 W^T2 0 s X, - Xnl — 0- 0- (3-5-5)9 kT ' 1 2 1
Here M is the molecular weight.
Using the experimental values of peak attenuation, the product of defect concentrations and square of the difference I - A^jcan be calculated. The values of Cq I - Ag I for the samples used in this work are given below.
114
Crystal ModeFrequency
MHzS 1^1 -
10-7
(110,001)T 15 3.825 4.6335 5.6
BGO (100,001)T 25 6.745 6.7
(111,111)L 45 5.190 6.1
BSO (110,001)T2 15 7.125 6.4
From this product, | - A^ | can be estimated if thenumber of defects is known or if |A^ - A l is known from some other measurements then the defect concentration can be calculated.
115
(d) As seen in Section 3.5.3, the attenuation peaks are simple Debye peaks with a single relaxation time.The plots of T versus l/T show that the process is the thermal activation of an atom or defect from one site to another. The values of activation energies given in Table 3.3 suggest that the same relaxation process is responsible for all modes in BGO. But comparing the attenuation curves for BGO and BSO, slight differences are noticed. For BSO, the attenuation peaks were observed at lower temperatures and the activation energy is much smaller (0.028 eV) for BSO than that for BGO (0.04 eV). Since only one atom in 33 has been changed, it suggests the involvement of Ge or Si sites.
The site symmetries of different atoms given in Table 1.4 also shows 'that the defect must be associated with the oxygen atoms in the GeO^ or SiO^ tetrahedron which lie at the cubic 23 sites.
The various possible defects are discussed in Chapter Six.
116
CHAPTER FOUR
ATTENUATION MEASUREMENTS IN DOPED, ANNEALED BGO AND Y-IRRADIATED BSO
In the first part of this chapter, measurements of attenuation in doped single crystals of BGO are presented and discussed. In the later, sections, effects of annealing and y-irradiation are discussed.
Effects of some dopants on the acoustic and optical properties of BSO have previously been studied by Rehwald (1976) and Hou et al (1973)- Recently Obserchmid and Grabmaier have studied the effects of many dopants on the optical absorption in BGO
Since it has been suggested by various workers that there is a correlation between the optical absorption below the band gap and the ultrasonic attenuation peaks, the aim of this work was to try and establish the possible absorption centre by studying the doped BGO crystals in detail.
117
4.1 Doped BGO samples
The doped BGO samples were kindly provided by Dr Grabmeierand Oberschmid. Due to the small size of Crystals available, samples were prepared with only < 110> orientation as described in Section 2.4. Measurements were made using the same method as for the undoped samples at a number of frequencies.
Table 4.1 gives the samples studied along with their colours, dopant concentration and other properties measured by Oberschmid (1978). The dopant concentrationwas found by chemical analysis. As can be seen fromthe table, the colour of the crystals depends strongly on the dopant, going from nearly transparent when doped with A1 , Ga, P+Ga, to dark red-brown when doped with Cr,

118
TABLE 4.1 Doped BGO samples, dopant concentrations and some effects of dopants
SampleNo
Dopant
*Dopant fraction in the crystal per formula unit Colour Conductivity
11 A1 0.033 Transparent P
13 Ga .003 Ga II n
253 Ga + Cr 0.006 Ga .00005 Cr
Pale brown -
24l Cr .009 Cr Dark brown -1 Zn < .009 Zn Y ellow -
15 Pb >0.2 Pb Pale yellow -268 P + Ga .029 P
.004 GaII n
Chemical analysis

119
4.2 Ultrasonic attenuation results
4.2. 1
(1) BGO + Cr. Measurements were made for the (110,001)
transverse mode in a sample of BGO doped with (0.J)09)C.r
Fig. 4.1 shows the attenuation versus temperature for 25,45 and 90 MHz waves. The attenuation curves show a relaxation behaviour as for the undoped BGO. As givenin Table 4.2, the peak positions were within j 2K of the corresponding peak positions for the undoped sample, but the height of the peaks (relative attenuation in dB/cm) was largely increased.
(2) BGO + Zn. Fig. 4.2 presents the results obtainedfor a crystal of BGO doped with < 0.0 09 Zn. < Only one transverse (llO, OOl) mode was studied. Identical relaxation peaks were seen, but Zn dopant reduced the peak attenuation to 0.72 of the value for undoped crystals.
4.2.2 Analysis of relaxation peaks
The attenuation peaks observed for Cr and Zn doped samples also show all the features of relaxation peaks Increasing the frequency shifted peaks to higher

120
Bü\cqTS
o V ) .«
(Qdg-p >.00 ■p <
o.oa
FIG, 4.1
J EL20.00
□□a□
g a □ □
BGO-i-Cr ' (110.001)
2 5 MHz
45 MHz
90 A/Hz
□oo
o □□□- □
o □□
- □v %VË ^
%- V V □
oooo
VV %
oo
□■ □
w GOOg «<vv □
V9YIAO.OO 60.00 eo.oo 100.00
TEMPERATURE (K)
Ultrasonic attenuation for the transverse (no, OOl) mode in (BGO + Cr) , as a function of temperature and frequency

121
eü\cq 18.00 x i
16.00O•rl+>ds-p4J 12.00 <
0.00 20.00
o O
o>o
BGO+Zn (110.001 )_
y 25 MHz
45 MHz
90 MHz
□
oo
□□□
V □V □□V %
oo
\ \
000000
0%
40.00 60.00
TEMPERATURE (K)
eo.oo 100.00
FIG. 4.2 Ultrasonic attenuation versus temperature for the transverse wave (llO, OOl) in (BGO + Zn) at various frequencies

122
TABLE 4.2 Peak, attenuation and temperature for doped crystals
Crystal Dopant ModeFreq.MHz
Peakattenuation 0( ( dB/cm )
Peaktemp erature
BGO - (110,001) 25 9.3 48.5Cr II 25 19.8 46.0
45 39.2 48.7590 > 6o 53.3
Zn II 25 6.7 46.3545 10.7 48.590 26 54.3
BSO* - (111,111) 600 185 -
A1 II 600 - -Ga II 600 77 -B II 600 49 -
Rehwald (1976)

123
temperatures and the height of peaks increased approximately as w. These peaks were analysed as explained in Section 3-5 -2 , using the equation
A O)^r(T)OC = TfT
From the experimental values of peak attenuation, A was calculated and 0) and r were varied to give least squares fitting. The relaxation time was calculated as a function of temperature. Fig. 4.3 and 4.4 give r versus l/T from 20 to 80 K. The dashed line on these graphs corresponds to the r versus l/T for the undoped sample. This shows that the activation energies of the process involved are the same as for the undoped crystal. The activation energies, attempt frequencies and the corresponding relaxation strengths are given in Table 4.3*
For the Cr doped sample, small deviations were observed at the ends of the peak. The normalized attenuation at two frequencies was plotted as a function of l/T for this sample as in Fig, 4.5» This also shows that T ^ , the shift between the peaks, is constant only
from 33 to 60 K. But using equation
A(T"1) = (1.144)(2.303/9 )

124
8G0+Cr f/70,00/;
BGO
45 MHz
-7
-8
-9
-10
1.00 UPO /.< 0 U60 I.e o P.OO P.IO P.AO 2.60 2 .60 5.00 5 .20 5 .60 5.60 5.80 6.00
r ( n w
FIG. 4.3 Logarithm of the relaxation time versus reciprocal temperature for a crystal of BGO doped with Cr. The dashed line corresponds to the undoped BGO crystal

125
BGO+Zn (110,001)
/ V
-F
-8
-9
-10
-U1.00 1.20 l . * 0 1.60 I.e o 2.00 2 .20 2 .*0 2 .60 2 .80 3 .00 5.20 3 .*0 3.60 3.B0 * .0 0
r (K") xIO
FIG. 4.4 Logarithm of the relaxation time versusreciprocal temperature for a Zn dopedcrystal of BGO

126
ce-pCO%uüO(Jcq"OCl)
o'd
Uo(HCOCD•HÜ
Sdu*CDu«H-p
I-p-pce
COCD•HfaoCDs
g•H■Pce>•HPü<
W
i
g
p
N
rHs
tHvS'
ps ' 1 '
CM3
> 00 r- MO MO 00CD o o O O OO o O O oO o O O o+ 1 + 1 + I + 1 + 1Vû CT\ OA 's£>0^ CA (A CA CAO O O O O
cy • • • •
Ui O<3\. '00. r- [S. p+ 1 + 1 + 1 +1 +1CM T4 lA oO tH lA CO p
CD CA -ct
Nz
H s P 00 as lA t^y B • • • • •OJ ü 00 r- CM r- -cf
\ P p CM MO MO11 CQ<i V
XüÜ NCD lA lA O lA Od CM OS OSCDUk
ri0•H- P ri rip ce N O
ri rice p as CAA ri o Oo 0) o OQ ü • •
ri oooHcepCO OX ori CQO

127
1.00
V □
.80
. 60
.20
0. 001.80 2.00 2.20 2.40 2. <50 2.80 5.00 5.20 3.401.60
r ( n w -2
FIG. 4.5 Normalized attenuation as a function of reciprocal temperature for Cr doped BGO sample at two frequencies

128
the width of peaks at half maximum gives
Crystal DopantFrequency
MHz0
KQ
eV
BGO Cr 25 455 .03945 510 .044
This gives the activation energy to be 0.04l .002 eV.
These results indicate that the same relaxation process is responsible for the attenuation peaks as in undoped crystals, but the strength of relaxation, i.e. the number of defects, has changed.
4.2.3 Results for nearly transparent doped BGO crystals
(1) BGO + A1. A sample of BGO doped with (0.033J A1was transparent unlike the Cr and Zn doped crystals which were dark brown and yellow in colour. Measurements for the transverse T (llO, OOl) mode at frequencies 15» 30 and 90 MHz are given in Fig. 4.6. TTiis figure shows that the peaks observed for the undoped and Cr,Zn doped BGO crystals are absent. A very small attenuation was . observed which increased slowly to 1.5 dB/cm

129
BGO^AL (110,001)
3. 50
15 MHz
3.0050 MHz
6 2.50U%
o
s1.50
1.00
CP.50
O 9 V V ^J n nnn 1 i tu H r%A fLlT* SB l____________ 1___________0 . 0 0 2 0 . 0 0 4 0 . 0 0 6 0 . 0 0 8 0 . 0 0 /O O .O O
0.00
r u
FIG. 4.6 Attenuation as a function of temperatureand frequency for the transverse (llO,OOl)mode in (BGO+Al)

130
at lOO K and then became temperature-independent at ~ 240 K. These measurements complement the work of Rehwald et al (1970) on crystals of the isomorphous material, Bismuth Silicon Oxide, doped with A1 (0.008). They also found that Ga (0.002) and B (O.OO3) reduced the attenuation peaks in BSO. These results are shown in Fig. 4.12.
(2 ) BGO + Ga. Measurements for a crystal of BGO doped with (0.004) Ga are shown in Fig. 4.7» No peaks were observed even at I90 MHz. Rehwald has reported that (0 .002) Ga doping reduced the peak height to approximately 1/3 the value for undoped crystals.
(3) BGO + Pb. Fig. 4.8 shows the results for a (0 .5 ) Pb doped sample. Attenuation increased gradually to about 0.5 dB/cm at 9O MHz.
(4) BGO + P + G a . This sample doped with (O.O29) P ,a Group V element, and (0.004) G a , a Group 111 element, did not show any peaks. The attenuation versus temperature is shown in Fig. 4.9 for the T (llO, OOl) mode at 251 45 and 90 MHz.
(5 ) BGO + Ga + Cr. Cr concentration in this crystal(5 X 10 ^ ) is much smaller than in Sample No. (24l)No peak was seen at 45» 90 and I90 MHz for the transverse (110, 001) mode as in Fig. 4.10.
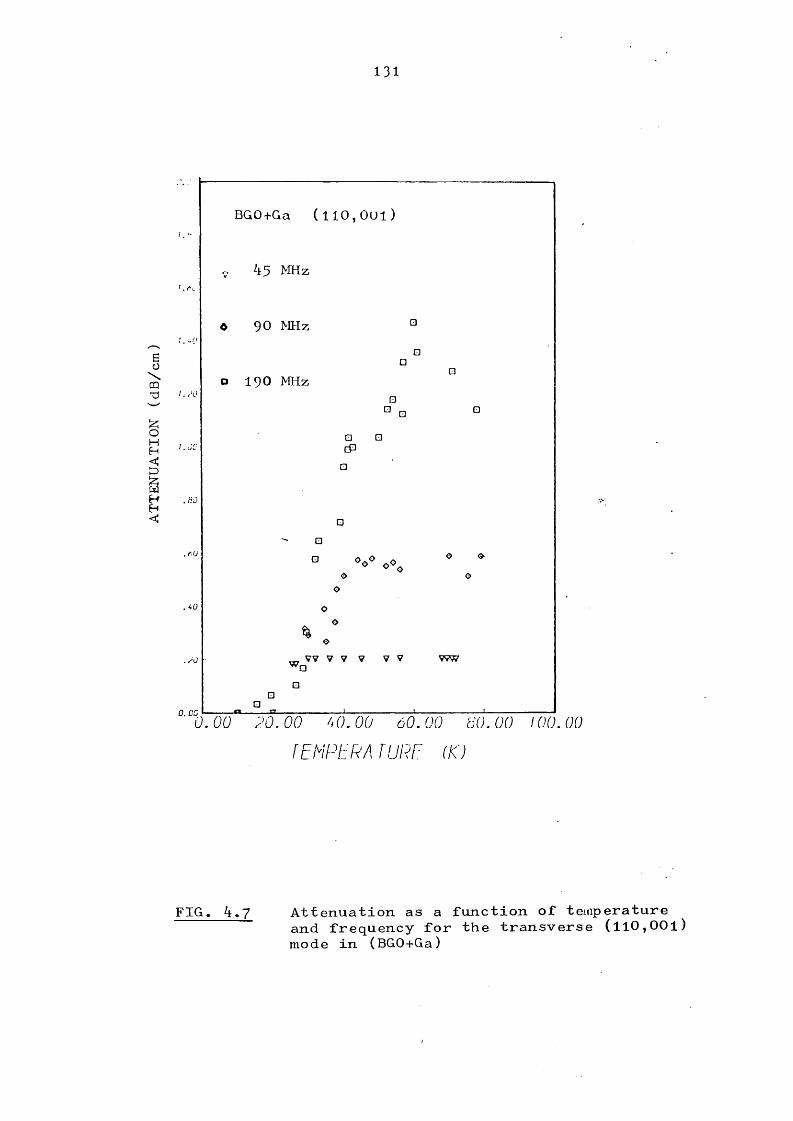
131
BGO+Ga (110,oui)
45 MHz
90 MHzBü
o 190 MHzCQQ
.ÜJ
W,
0. DGÜ. Oü 2 0 . 0 0 4 0 . 0 0 6 0 . 0 0 6 0 . 0 0 / O O .O O
f E N P E R (K)
FIG. 4.7 Atténuation as a function of temperatureand frequency for the transverse (llO,OOl)mode in (BGO+Ga)
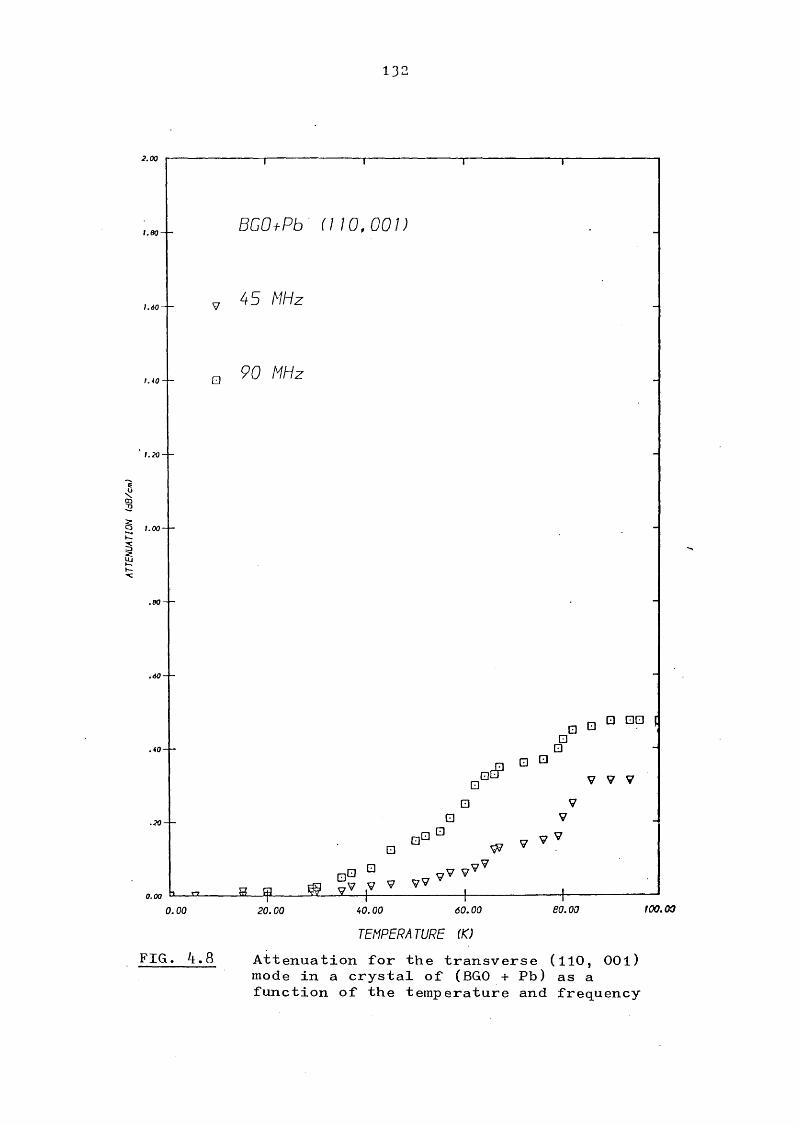
§ 1.00-
13:
45 M/iz
□ 90 MPz
0.00
FIG. 4.8
20.00
□ □ □°0 Q G 00 (
0G V V V
40.00 60.00
TEMPERATURE (K)eo.oo 100.00
Attenuation for the transverse (llO, OOl) mode in a crystal of (BGO + Pb) as a function of the temperature and frequency

133
1.60-- V
/.♦O— Q
§ 1.00-
2 5 /VPz
t.20 - - O
45 MPz
90 Mb;
OO
oo
o o 0 0 0%00
0o 0 -0 <
0
□ □ □ [
00 □
□
V V□□□ V V0 y W 7
V ^V VF
a
Vvvv.
0.00 20.00 40.00 60.00 eo.oo 100.00
FIG. 4.9TEMPERATURE (K)
Attenuation as a function of temperature in BGO +(P + Ga) for the transverse wave (110, 001)
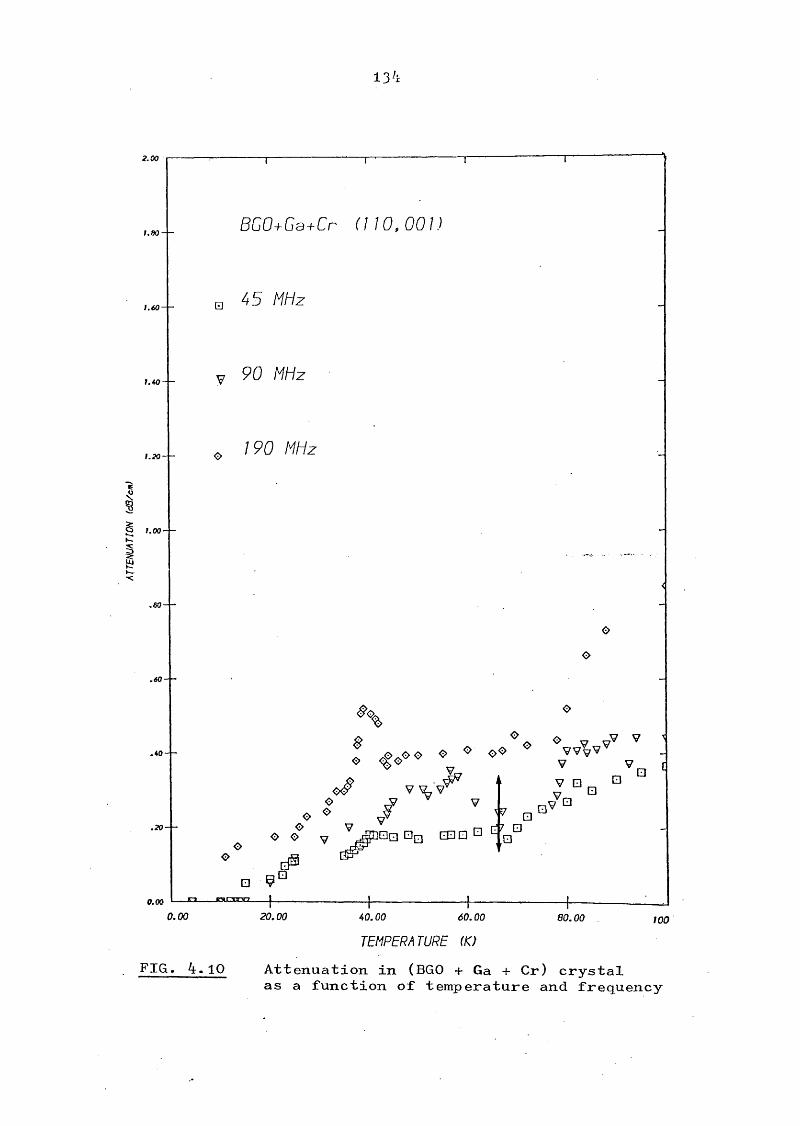
134
§ t.oo-
71 4 5 M H z0
y 90 M H z
0 7 90
%0
f o ^ oe ^ ' j v W
v ^ v :O J? 9 „ V So O G
o < V ^ ^ 0 0 □□ a D a Q ^ g G eJS
a go0.00 _a K5lE3EDn_
0.00 20.00 40.00 60.00
TEMPERATURE (K)eo.oo too
FIG. 4.10 Attenuation in (BGO + Ga + Cr) crystalas a function of temperature and frequency

135
Fig. 4.11 shows the attenuation for all doped crystals at 90 MHz from 4.2 to 240 K. The attenuation for samples with A 1 , Pb , G a , P + Ga and Cr + Ga show the usual phenon-phonon behaviour and is discussed in the next chapter.
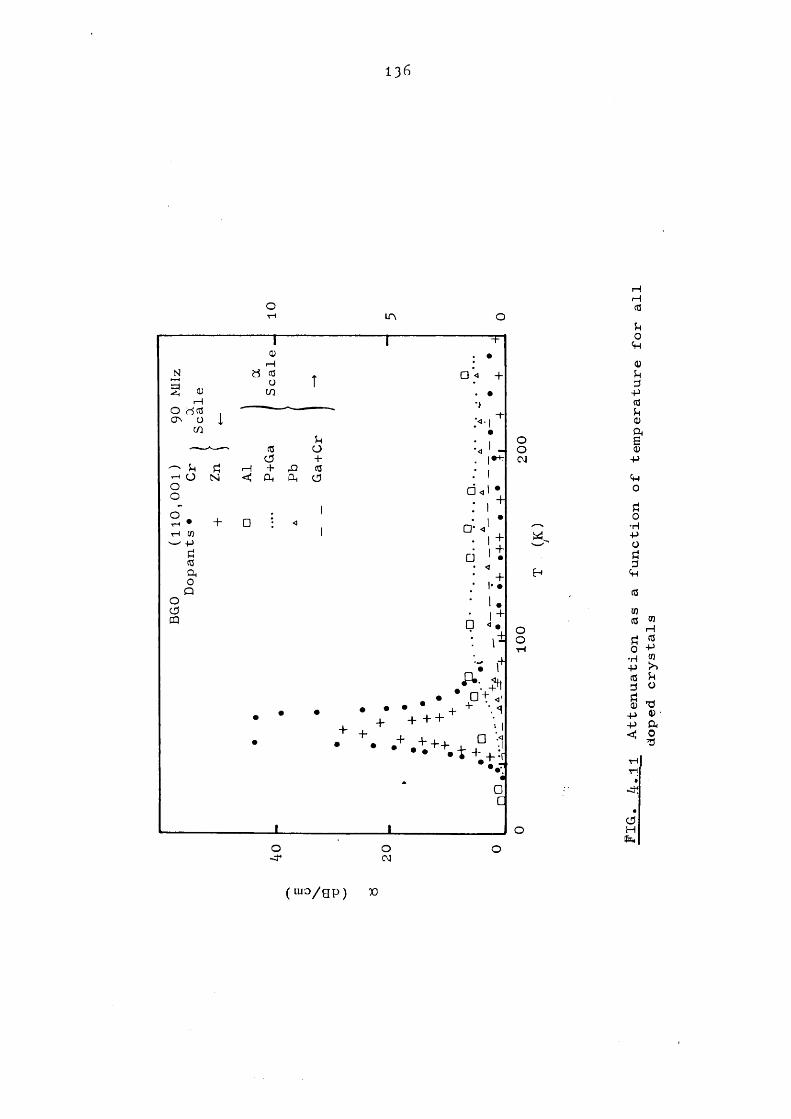
136
+ + +
o O o
ooC\J
ootH
I—I—(0
c(H(D3(0uo
sOJ+JCm0t i0•H-PÜ3(MCCtoCC to
Hri (C0 -P•H to4-) X(C u3 Ürio-p @)-p A< 0■3■HTl
,aH
(luo/gp) 30

137
Go - dopeddBcm30
600 MHzundoped
20
A I-doped
0 50 100 K T
FIG. 4.12 Ultrasonic attenuation of longitudinalwaves (ill, 111) at 600 MHz, as a function of temperature for undoped, Ga-doped and Al-doped BSO (Rehwald, 1976).

138
4.3 Correlation with optical absorption
The optical absorption in undoped single crystals of BSO has been studied by Hou, Aldrich and Harvill (l97l), Tanguay (1977) and for BGO by Oberschmid (1978). As shown in Fig.1.6 the absorption coefficient shows a broad shoulder between 2.3 and 3-1 eV, and an Urbach-like exponential absorption beyond 3-1 eV. All theseresults give the room temperature band gap as 3-25 eV.The cause of the broad shoulder is not clear, but Houet al (1973) explained the additional absorption to be due to a Si vacancy complex situated 2.6 eV below the conduction band when occupied by an electron. The optical absorption spectrum for the doped BGO samples which were used for attenuation measurements in this work have also been studied by Oberschmid and Grabmaier (1978). As can be seen from Fig. 4.13, the absorption depends strongly on the dopant present.
4.3*1 Effect of Cr dopant on optical absorption
As shown in Fig. 4.13, Cr doping^increased the optical absorption to approximately 20 times the absorption in an undoped sample (Oberschmid), throughout the wavelength range from 2.1 eV to beyond 3*23 eV.

139
Tanguay (1977) has also recorded the transition spectra for the undoped and Cr doped BSO. He noticed a significant increase in the strength of the optical absorption peaks for the Cr doped sample, compared to that for the undoped.
4.3*2 Effect of Zn dopant on optical absorption
Oberschmid (1979) reports that Zn dopant did not change the optical absorption significantly.
4.3*3 Effects of other dopants
Doping BGO with A 1 , Ga, P, P + Ga have been observed(Oberschmid 1978) to reduce the optical absorptionwithin the band gap, from 2.1 eV to 3*23 eV. ■ Thisreduces the shoulder observed for the undoped samples.These results complement the previous work of Rehwald(1976) and Hou et al (1973) on doped BSO. They studied
1 +the effect of doping BSO with A1 and Gallium as shown in Fig. 4.l4.
4.3*4
The attenuation results for doped BGO crystals given in Section 4.2 show that Cr-doping increases the peak attenuation, Zn reduces it and all others, A1, Ga, P etc. remove the peak. The optical absorption results

140
BGO •BGO "Core"200BGO+P+Ga100BGO+Ga
50 BGO+P20
Ü 10oCJ
0.5
2-62 .2hu (eV)
FIG- 4.13 Optical absorption versus photon energy for undoped and doped BGO
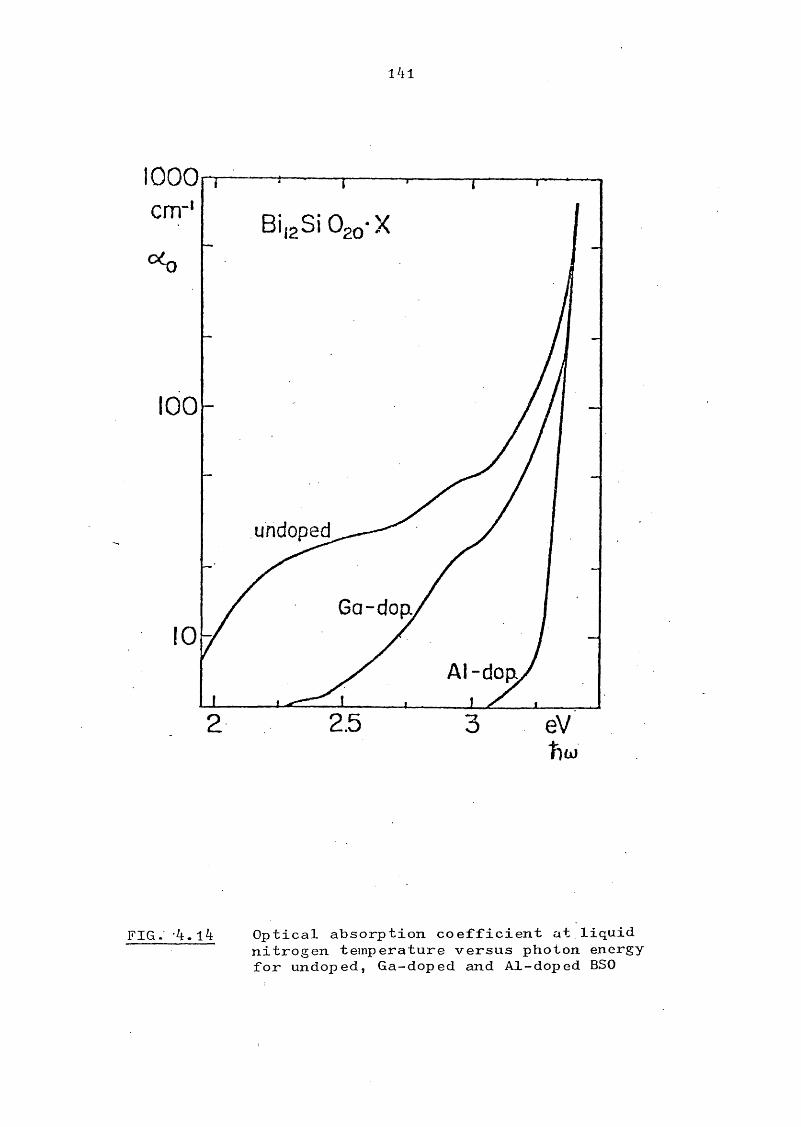
l4l
1000cm"'
100
undoped
Ga-dopL
Al-doa
2.5 eVt)ÜJ
FIG. 4.l4 Optical absorption coefficient at,liquidnitrogen temperature versus photon energy for undoped, Ga-doped and Al-doped BSO

142
for all these samples quoted above indicate that dopants have similar effects on the optical absorption and ultrasonic attenuation peaks. Therefore, as previously suggested by other workers, the optical and ultrasonic absorption centres seem to be related. The possible centres responsible for these effects are discussed in the last chapter.

143
4.4 Effects of annealing and y-irradiation onpoint defects in BGO, BSO__________________
Since this material shows interesting optical and photo- conductive properties, Autnov, Arsenyer et al (19?6) have carried out a detailed study on point defects in single crystals of BGO. Effects of annealing in reducing or oxidising atmospheres and y-irradiation, on the optical absorption have been studied. They report that in the absorption spectrum of BGO a weak, wide band. A, is always present in the range of 700 nm and they assign this band to a constant structural defect. By exposing the samples to ultra violet light, two bands,B and C, were observed. To examine the defects produced in reducing the atmosphere, samples were annealed in vacuo and in hydrogen, in the temperature range 400 to 800^0. As shown in Fig. 4.15 (a ) and (b), bands A,B, C were intensified and another band, D, was also noted.
An intensive growth of the four bands was also reported by treating BGO samples by gamma irradiation.
Annealing in oxidising atmospheres up to yOO°C has been reported to destroy all colour centers produced by vacuum annealing or irradiation.

144
m ' 50 500 550 600 650 700 750 660 850 X ( n m )
{ a ) Absorption spectra of crystals Bii9Ge02g. 1. Initial sample. 2. Irradiation by ultra-violet radiation for 10 hours. 3. Irradiation by gamma-rays, 150 megaroentgens dose
660 650 560 550 600 650 760 750 BOO 650 SOOXlnm)
( b ) Absorption spectra of crystals EliijGc02o treated In vacuum for G hours at temperatures CCO C(2), 740''*C (3), 1. Initial material
FIG. 4.15 Effects of irradiation on optical absorption

145
Since the ultrasonic attenuation peaks observed in the low temperature region are due to the anelastic relaxation of point defects, attenuation measurements were made on the annealed and irradiated samples to investigate the effects of changing defect concentration on attenuation.

l46
4.5 Experimental results in annealed BGO
4.5*1 Undoped BGO
A crystal of BGO with < 111> orientation was used to study the effects of annealing on the attenuation peaks. The crystal was first annealed in vacuo at 450^0 for 24 hours, using a resistance-heated (JMC- type T) furnace, modified to give a controlled heating and cooling rate (less than 50°C per hour), as shownin Fig. 4.16.
A slight change in colour (from pale yellow to pale greenish-yellow) was observed but there was no change in the attenuation for the L(lll, 111) mode. A vacuum annealed sample was then annealed under similar conditions, in an oxygen atmosphere of 2 -sdL. Attenuation measurements were repeated again but no change was noticed, as can be seen from the raw data in Fig.4 .17, 4.18 and 4.19.
Antonov et al (l9?6) from studies of the kinetics of. defect formation, reported that up to 500^C the rate of defect formation is not high and increases sharply above 500^C. It may be possible that if we annealed the samples at higher temperatures ( > 450°C) we could observe some effect, but because of lack of time further annealing was not carried out.

147
Sample holder Tube
Oxygen Cylinder
Temp eratureUniti6o b
DigitalMeter
HighVacuumPump
FIG. 4.16 Block diagram of experimental set upused for annealing

I I
148
• I I I I I , ,
CDT3O£
■HT-l
(H0ÎH0•H o-P oCO «3tiCD CD-P r4-P COCO CDU 30(H T)
tiW CO■Po "d7-4 CDA -pCOCO CD■P hCO -PT)CO •H
ONtH
CX)tH
r-T-(
(JHk

149
Tanguay (l97?) also studied the effects of annealing on the optical absorption of BSO, He found that, the absorption in undoped BSO was unaffected by vacuum or oxygen annealing. This correlates with our results of undoped BGO.
4.5-2 Data for Cr-doped BGO
Wardzynski and Lukasiewicz (1979) have observed that the Mn and Cr doped crystals of BGO changed colour from pale yellow and red to brown and dark red on illumination with visible light, but could be switched back to the original colour by heating the crystals to about 150°C in dark. They have measured the absorption spectrum before and after illumination and also after annealing. The spectrum before illumination and after annealing was found to be the same.
Some attenuation measurements were made on annealed Cr-doped crystals, to see the effect, if any- Ihe sample was annealed in vacuo as previously explained and the attenuation was measured. The peak attenuation was found to be reduced to 0.57 of its original value.
The vacuum annealed sample was then annealed in oxygen atmosphere under similar conditions. Oxygen annealing restored the attenuation to its original value. All three curves are shown in Fig. 4.20. These peaks were

0.00
150
F r e q . 4 5 t IHz
O r i g i n a l C r y s t a l
Vacuum A n n e a l e d
^ O x y g e n A n n e a l e d
V
V
V ^
• •
V
o0V#
• 0V • 0
V 0<2>
20.00 '• 0.00 60.00 BO. 00
TEM PER A TU R E (K)
100.00
FIG. 4.20 Ultrasonic attenuation for the transverse (110, 001) mode in a Cr-doped crystal
( V ) initial sample, (•) vacuum- annealed and (o ) Oxygen-annealed.

151
analysed as before and Fig. 4.21 shows the relaxation time versus l/T for the three cases. This indicates that the activation energy of the relaxation process is unchanged, and only the relaxation strength has changed. Therefore, the relaxing defect density seems to be changed by vacuum-annealing.
But, for Cr-doped BSO, Tanguay found strong photochromie behaviour with strong optical absoprtion bands which would be bleached by oxygen annealing, but reappeared after illumination by light pulses.
To explain this behaviour, Wardzynski et al (1979) assumed a light-induced charge transfer process.From EPR measurements they indicate that Cr occupies the Ge or Si sites. Tanguay also considers a. charge transfer process to be responsible for this opticalabsorption behaviour. He assumes that addition of
3 5 •Cr on a tetravalent site induces a Bi ion to4 +occupy an adjacent Si site for charge compensation.
A charge transfer mechanism between neighbouring substitutional Cr and Bi ions on tetrahedral sites could produce two metastable states (absorbing and nonabsorbing). Our data on Cr-doped BGO suggests that one of these states may be the centre responsible for the ultrasonic attenuation.
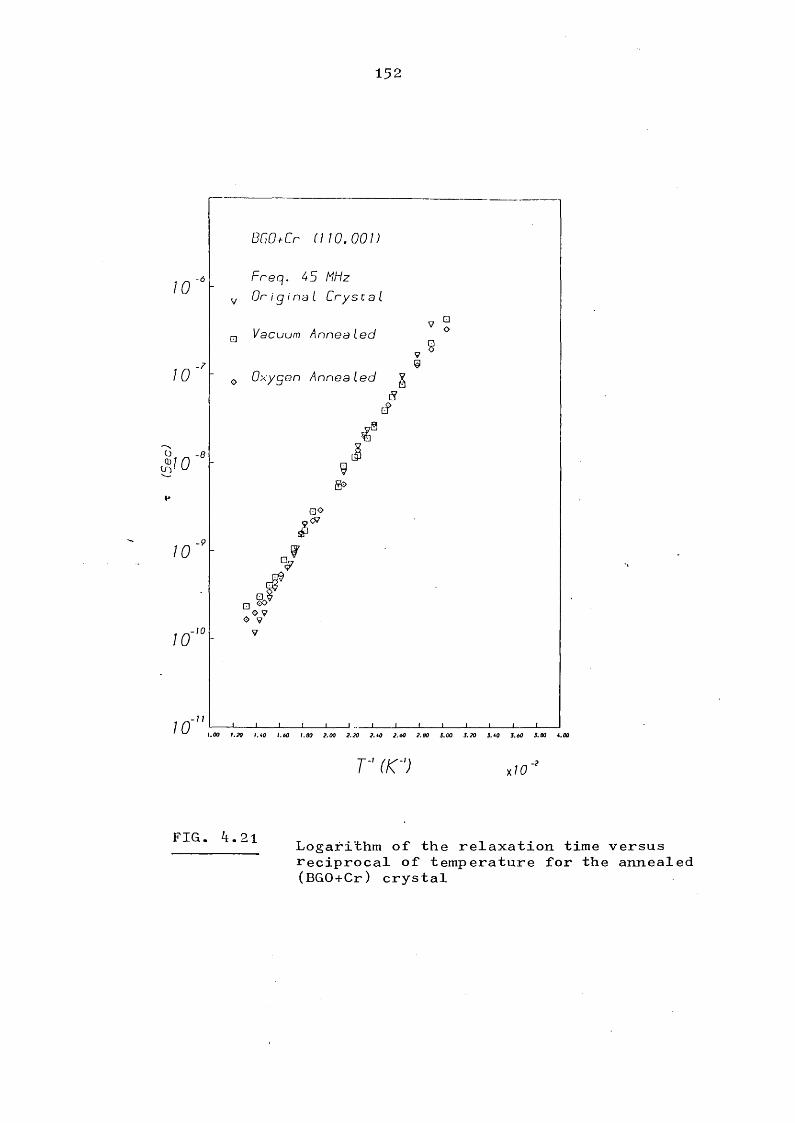
152
Freq. 45 MHz Originel Crystal
-6
Vacuum Annealed
-7Oxygen Annealed
o V-;o
-2
FIG. 4.21 Logarithm of the relaxation time versus reciprocal of temperature for the annealed (BGO+Cr) crystal

153
4*. 6 Experimental results in gamma-irradiated BSO
In order to study the effects of defects produced by irradiation on the ultrasonic attenuation, a cylindrical rod of Bi^^SiO^Q, with <110 > orientation, was used.
Gamma irradiation was carried out using a cobalt-60 source (Imperial College, London) at room temperature. Successive doses of .5, 1, 1-5- 3«0, 6.0 and 12 Mradwere used and the attenuation measurements repeated after each dosage. Fig. 4.22 shows the attenuation measured at 25 'lHz for the transverse (llO, 001 ) wave as a function of temperature for various doses. Below the peak temperature, i.e. in the region OOr > 1, the attenuation was unchanged for irradiation doses from .5 to 12 Mrad. The peak attenuation and the attenuation above the peak temperature was unchanged after a dose, R, of -5 Mrad but decreased by about 20^ for R = 1 Mrad. As the dose was further increased, reaching 3 Mrad, the peak attenuation started increasing again. But further increas in dose, i.e. 6 and 12 Mrad, had no appreciable effect. Table 4.4 gives the attenuation as a function of temperature and irradiation.Fig. 4.24 shows the effect of various doses on the peak attenuation and peak temperature.

154
l8
16
12
10
Sü ? 8d ■
BSO (110,001)0 Freq. 25 MHz•fK 0 Untreated
.5 Mrad— • 1 "0 0
• 0 9 1.5 ".
X + 3 "X * X 6 "
+
•X
■♦0 + 0
X«
•
+ 0X * X
- 0 •+9 9 **
* 0X0
'9
+ X♦ 0.•
09* • +
• X • X
09 9 +
* 0+ 9
J ® I 1 1 î10 20 30 40 50 60 70
T (K)
FIG. 4.22 Attenuation for the transverse (110,001)mode in y-irradiated BSO

155TABLE 4.4 Effect of irradiation on attenuation
DoseMrad
Temp erature K
Attenuation(dB cm ^ )
25" 2.034.5 18.40. 11.
1. 25. 0.733. 14.140. 3.4
1.5 25. 0.933. 15.40 3.6
3- 25 1.2... • ■" 33.5 17.3
40 6.6
6 . 25 1.133.5 17-340 7.0

156
10-7
10-^-
BSO (110,001) FREQ. 25 MHz
□ Un treated
• 1 Mrad
A 1.5 "* 12 II
Q*A
□
□ *
□ *
ÜCDin
□
□
□
.A
□
“ 1 (T )3.0
13*5 _2
10
FIG, 4.23 Logrithm of the relaxation time versusreciprocal of temperature for transverse(110,001) mode in y-irradiated BSO

157
4.0 25 MHz
3.0
NIco\cqX i
15 .MHz
4.0Hd
3.0
0R (Mrad)
10
FIG. 4.24 Effect of irradiation on^attenuation

138
The attenuation peaks were analysed using the equation
kT 2 r -, 21+00 [ r (T) ]
Fig. 4.23 shows the plot of relaxation time r versus l/T at 23 MHz for various doses. This plot shows that the activation energy varies from 0.025 eV to0.031 eV.
y-rays are likely to produce, displacement of single atoms, or produce colour centres. But no obvious change in colour was noticed.
Since the peak attenuation decreased and increased with increasing doses and also the activation energies changed, nothing very conclusive can be decided.

159
CHAPTER FIVE
PHONON-PHONON ATTENUATION
The experimental results given in Chapters Three and Four show that the attenuation curves for the undoped and doped BGO crystals can be regarded as consisting of two components, one due to phonon-phonon attenuation and the second due to the relaxation effects. The attenuation due to relaxation effects has been discussed in previous chapters. The first component is present for all the samples and the magnitude of this attenuation would give a correction factor for the attenuation peaks . To calculate this factor, the attenuation curves which did not show any peaks have been used.A brief review of various theories for phonon-phonon interactions is given in the first section.

l60
5.1 Introduction
A given ultrasonic wave interacts with the thermal phonons due to the anharmonic nature of interatomic forces in dielectrics. The thermal phonons also undergo interactions and have a mean free path.
Tw o regions of temperature are generally considered.In the low temperature region, T « , where isthe Debye temperature; the ultrasonic wave passingthrough the crystal has a wavelength, Â., smaller than the mean free path, and is defined by the condition 00 Tth > 11 where 00 is the sound frequency, and r^^.the thermal phonon relaxation time.
As the temperature is increased, the collision time between thermal phonons decreases and the mean free path becomes smaller than the impressed sound wavelength given by 00 < 1.
In this second region, the sound wave causes a disturbance in the distribution of phonons. The increase in entropy required to restore these phonons to thermal equilibriumleads to an absorption of acoustical energy. Differenttheories explaining interactions in these two regions are given briefly in the next section.

i6l
5.2 Low temperature region 00 r > 1
In this region, the sound wave is considered to interact with individual phonon modes The mechanisms involved were first discussed by Landau, Rumer, Slominskii (1937)- They considered three phonon collisions, in which one thermal phonon collides with an incoming phonon to generate a third phonon.
Since measurements were made only for the transverse mode,(110, 001), the possible interactions only for the transverse ultrasonic waves are discussed.
(1) For an isotropic non-dispe^^sive medium, thedominant process is generally assumed to be a non- collinear interaction
T + L^ L^ (3.2.1)
known as the Landau-Rumer process.
Here T and L represent transverse and longitudinal modes and subscripts 1 and 2 refer to the thermal phonons involved in the interactions. Notations are as used by Simpson (1974). Landau and Rumer derived
OCm =' 60p37' lo r [ f ]
for shear waves.

162
and s ' are complicated averages of third order elastic constants and phonon phase velocities. p is the density of the material.
(2 ) Collinear processes. Interactions like
T + (5.2.3)
are also possible but are less dominant.
Dispersion and anisotropy prevent collinear interactions with thermal phonons. Simpson (1974) explains that for transverse acoustic modes propagating along high symmetry directions, pure collinear interactions are forbidden, since the anharmonic coupling between three phonons vanishes. But certain shear modes have been found to have an attenuation dependence of 1^ with n > 4 (e.g. quartz and Al^O^ ). Thishigher te/mperature dependence was explained by Simon (1963) and Maris (1964). They pointed out that the energy time uncertainty principle due to the thermal phonons having finite life times could relax the conservation of energy condition. If is thethermal phonon life time, the energy uncertainty is
^ /^th-
0) + 0)' = 0)” + ll

163
CO, 00' and 00" are the angular frequencies for the phonons involved. This allows the process (5.2.3) to take place and the attenuation is given by
OCrp = (Landau-Rumer) + r dependent term(smaller than
Simpson has performed detailed calculations for transverse waves propagating along high symmetry directions in a number of cubic crystals. He has taken full account of anisotropy and finite thermal phonon life times to determine when non-energy conserving interactions are of importance. He has shown that in many cases the main contribution to absorption comes from interaction with slow transverse thermal phonons; that are non-energy conserving, and near collinear.In the case of strong anisotropy^ interactions are energy conserving interactions. The former processes are shown to give a temperature dependence of 1^ -where n > 4 and a less than linear frequency dependence; and for the latter processes the presence of anisotropy and finite thermal phonon lifetimes have been used to explain experimentaly-observed value of n < 4 and a frequency dependence greater than linear.

164
5-3 High temperature region COr < 1
When 0)r < 1, direct interaction of sound wave with phonons cannot be followed and is treated macroscopically,
According to Akhieser (1939) the presence of sound wave causes a change in the frequency of the Debye phonons.The thermal phonon frequency for phonons of different polarisation and propagation is changed by different values. The perturbed system comes to equilibrium by collisions among phonons in different modes and the resulting increase in entropy gives rise to the sound absorption.
Akhieser calculated the absorption coefficient to be as
a = b2(1)2 0)2pv5
where B - bulk modulusp - density of the material V - the compressional wave velocity K - the thermal conductivity C - the specific heat/cc
At high temperatures, K a so a is independent of temperature.

165
Woodruff and Ehrenreich (1961) obtained similar expression for a. By considering three systems; the driving sound wave, the dissipating system (taken to be the phonon gas occupying the dielectric) and external heat bath , the attenuation of the acoustic wave is then regarded as being due to the transfer of energy from the wave to the phonon gas which in turn transfers an equal amount to the heat bath. They calculated
a = G,Ty^ 0)2 /3pv^ (5.2.4)V a v
K = I c v2^3 V
then a = KTT^OQ^/ov^ av
At higher temperatures K œ — so a is independent of temperature.
Bommel and Dransfeld (1965) modified the above expression. They divided all branches of phonons into two groups, one containing branches that suffer a large positive temperature change and the rest belonging to the other group. When a compressional wave propagates through the crystal, a time-dependent temperature difference is produced between the two groups of phonons. Heat exchange between them leads to an increase of entropy and hence absorption of sound. The attenuation coefficient is given by

166
4 p l + o ) ^ T ^
Y is the average Gruneisen constant. C is the ' av Vspecific heat/cc.
Mason and Batemann (1964) have also obtained an ecpression relating the attenuation to the known third order elastic constant as
a = AC /2pv^ \l+(j0^r^
AC is the instantaneous increase in the elastic modulus caused by separation of the phonon modes.

167
5.4 Experimental results
Figure 4.11 shows the results for doped BGO crystals at 90 MHz from 4.2 to 250 K. This figure shows that one component of attenuation due to phonon-phonon attenuation is present for all the samples and its magnitude depends on the dopant present.
The attenuation curves without any relaxation peaks consist of three regions, first the low temperature region from 4.2 to about 50 K in which the attenuation is very small.
In the second region, from 5O K to about 100 K, the attenuation increases with temperature and in the third region above 100 K, the attenuation was again independent of temperature.
Table 5.1 gives the attenuation values at 100 K for various samples and frequencies.

168
TABLE 5 » 1 Attenuation as a function of dopanand frequency at 100 K
Crystal Dopant Temp erature
KFrequency
MHzAttenuation OC
(dB cm ^)
BGO Or 100 25 1.045 1.490 ^ 1.9
Zn 100 25 0.445 0.72
A1 100 30 0.690 0.7
Pb 100 45 0 .390 0.5
P+ Ga 100 25 0.345 0.690 1.3
Or + Ga 100- 45 0.390 0.45190 0.8

169
5.4.1 Analysis of experimental results
In the low temperature region, if is greater thanunity, the most probable interaction is the Landau Rumer interaction given by Eq. (5-2.1). From Eq. (5-2.2), the attenuation for transverse waves can be expressed in the form of a power law given by
a = A (joT^
Here A^ is some constant, T the absolute temperature and n the power index.
A log-log plot of attenuation versus temperature would give the value of n. According to Eq. (5-2.2), the attenuation should show approximately T dependence and should increase linearly with frequency.
But this effect is usually observable only at much higher frequencies and lower temperatures than used in this work.
Figure 5-1 shows the log-log plot of attenuation versus temperature from 50 to lOO K for various doped samples and frequencies. This plot shows that the attenuation depends strongly on the dopant present (dopant concentration also varies from one sample to another).The frequency dependence lies between linear and quadratic
3.5The slope of these graphs gives approximately a T

0

171
dependence. Since the value of attenuation at Helium temperature is subtracted from the data at all temperatures, the additive temperature independent contributions to the attenuation are eliminated.
According to Silverman (1968), the presence of imperfections in a crystal should reduce the thermal phonon life time -e from its value in a perfect crystal. The reduction in life time affects the ultrasonic attenuation in the low and high temperature regions in opposite ways. At high temperatures, a decrease in life time results in a decrease in attenuation, due to a rapid relaxation towards the equilibrium phonon distribution. At low temperatures, a decrease in life time increases the attenuation by relaxing the energy conservation restriction. He suggests, that a cross over point should be observed for pure and impure attenuation curves - about 0) r ~ 1, But no such cross over-point was observed in our measurements. This confirms that above 30 K , w < 1 for thesecrystals.
In the region where < 1, the attenuation is givenby Eq. (5.3.1), to be
K T

172
i.e., the attenuation should be proportional to 0) and the thermal conductivity, K.
If the temperature T is much larger than the Debye temperature of the material, K is usually a l/T and the attenuation becomes independent of temperature.But for BGO the Debye temperature is ^ 240 K, therefore we have not reached this limit. Since no values for the thermal conductivity are available in this temperature range, therefore no satisfactory explanation can be given for the attenuation observed in these crystals.Further experiments over a wider frequency range and on crystals doped with different concentration may clarify this.

173
CHAPTER SIX
DISCUSSION AND CONCLUSION
6 .1 Introduction
Experiments employed for studying the propagation of ultrasonic waves
in BGO-BSO have been described in the previous chapters. Data was
obtained for attenuation in undoped, doped, annealed and Y-irradiated
crystals. Two transverse and two longitudinal modes were studied
for undoped BGO. For all other cases, results were obtained for only
transverse T^ (110,001) mode.
As shown in Chapter Three, large attenuation peaks were/abserved
for certain modes in undoped crystals in the temperature range from
30 to 60 K. All these peaks were found to be typical relaxation
peaks as discussed in Section 3.5. As seen in Section 3.5, the same
relaxation process seems to be responsible for the attenuation peaks
observed for different modes. Detailed analysis of the peaks indi
cates that these attenuation peaks may be due to relaxation of point
defects.
Results on doped BGO crystals given in Chapter Four show that dopants
have a marked effect on the ultrasonic - attenuation.
Vacuum and oxygen annealing had no effect on the ultrasonic attenuation
in undoped crystals. But, for Cr-doped crystals vacuum annealing
reduced the peak attenuation, while oxygen annealing restored it to
its original value. The activation energy of the process was unchanged
and only the number of defects changed.

174Effects of Y-irradiation on the ultrasonic attenuation were not very
conclusive. As described in Chapter Four, an optical absorption
shoulder is observed below the band gap for undoped crystals. Hou
et al (1972) and Rehwald (1976), after studying the optical absorp
tion and ultrasonic attenuation in Al, Ga-doped BSO crystals, have
suggested a correlation between these two effects. Our attenuation
measurements on doped BGO crystals given in Fig. 4.11 and the optical
absorption measurements made by Oberschmid (1978) given in Fig. 4.13,
also suggest a correlation between the attenuation peak and the optical
absorption shoulder below the band gap. Therefore it seems probable
that the same defect may be responsible for both these effects.
Therefore the problem is to find the possible defects present in the
undoped crystals of BGO/BSO and the mechanism by which dopartsStcf f ect
the defects. The properties of BGO and BSO are very similar and any
models should relate to both crystals.
The undoped nominally pure crystals of BGO/BSO show the attenuation
peaks and are coloured (pale yellow or brown). Since Brice (1977)
has reported that BSO crystals typically contain only two to ten ppm
of impurities irrespective of the content in the melts; this suggests
that the large attenuation peak is an intrinsic property of the
material.
In many insulating crystals, relaxation effects have been observed
which are attributed to the redistribution of bound electrons among
two or more equivalent sites. Such effects are analogous to point
defects relaxation, but the activated process is the jump of an
electron rather than of an ion. For an electronic relaxation, the
change in velocity would be negligible but an appreciable change in

175
velocity was observed for BSO (Hardy, 1976); for the transverse
(110, 001) mode, in the temperature range where the attenuation
peak occurs. This suggests a mechanical relaxation rather than an
electronic relaxation.
A number of point defects are possible, such as the simple vacancy (v),
substitutionals (s), or interstitials (i), or the composite defects
such as (i-i) or (s-v) pairs. The concentration of defects can be
approximated from various available measurements.
Dopants can change the number of defects in a number of ways.
(a) By changing the number of defects.
(b) If the dopant atom is not isovalent to the atom it replaces,
it may change the defects by changing the electron population.
(c) The dopants may enter as interstitials next to the defects and
change the symmetry of the defect.
Due to the complex structure of this material, it is difficult to
say definitely what sites are occupied by dopants; however various
available measurements are used to decide the possible site occupied.

176
6.2 Experimental Evidence
6.2.1 Ultrasonic measurements
As described in Chapter Three, the temperature and frequency dependence
of attenuation lead to the conclusion that the attenuation peaks are
due to a relaxation attenuation of the usual form
a = Y * — (6.1)1+m T
where T = exp(Qk /kT). The peak is a single Debye relaxation with
a well-defined activation energy q and an attempt frequency 1/x^
approximately equal to a lattice phonon frequency. As discussed in
Section 3.5, the selection rules for anelastic relaxation show that
the peak is due to a relaxation of the elastic constant c^^ only,
which implies that the defect causing the attenuation has trigonal
symmetry.
Various parameters extracted from the experimental data are given in
Table 6.1.
2The values of the product - ^2 | given in the table are for
the samples used in this work, but these figures should give an order
of magnitude for all nominally pure and stochiometric crystals of
BGO/BSO, because of the following reasons:
(i) All measured samples of undoped BGO/BSO (Spencer; 1972, Rehwald,
1975) show similar attenuation peaks.
(ii) Measurements of the acoustic surface wave propagation loss
in vacuum on b q q have been made by Slobodnik et al (1972). Temper
ature dependence measurements show loss peaks in the vicinity of 50-100 K

177(iii) All undoped samples have similar colour and show an optical
absorption shoulder below the band gap.
6.2.2 Correlation with optical absorption
If the concentration of defects C is known, the absolute value of01 ^ - ^ 2 1 be obtained and this would provide the degree of
ellipicity of the distortion. As mentioned in Section 3.2, if the
lattice parameter change per unit concentration of defects is known,
an additional expression involving the sum + %2 + Ag) can be
obtained for calculating |a^ - A2 | as
è I T ° + X3) (6.2)0
where 'a' is the lattice parameter.
Since, as concluded in Chapter Three, the defects responsible for these
large attenuation peaks must have trigonal symmetry and for a trigonal
defect A2 “ A g , therefore Equation 6.2 becomes
IT " I + 2X3 ) (6.3)
The change in lattice parameter due to defects is calculated from
the data for optical absorption in BGO crystals.
As discussed in the first Chapter, facets are formed during the growth
of BGO and BSO which are darker yellow in colour and show an increased
’a'. Obserchmid and Grabmeier (1978) have measured a small difference
in lattice constant
A f _ - ( I . + 0.3 ) X 10"4 for BGOain the facets (core) region compared with the rest of.the crystal.
Similar increase in lattice constant

178TABLE 6.1 Activation energy, attempt frequency,
and the product of
Crystal Activationenergy
eV
Attemptfrequency
1/r lO^^Hz00
CqIV^sI'10-7
BGO 0.043+ .001 5 + 1 4+ 1BSO 0 .026+ .002 2 + .5 6+ 1
BGO+Zn 0 .036+ .002 1 + .5 3+ 1
BGO+Cr 0 .035+ .001 . 6 + . 2 4+ 1

179
^ (0.5 ± 0.1) X 10 4
in the facets was observed by Brice (1977) for BSO.
Oberschmid and Grabmeier also report that a higher absorption shoulder
was observed in the facet material compared with the rest of the
corresponding crystal as shown in Fig. 4.13.
If we assume that the increase in the lattice constant, , in the
core is entirely due to the absorbing centres, then an increase in
the optical absorption by a factor of a. 0.63 for BGO corresponds to
the change
^ of (1 + 0.3)10"4
Therefore we can calculate the appropriate change in.,the lattice
parameter due to all the defects present in the crystal. Using
Equation 6.3,
(-g-) = (A + 2A2) (6.4)
2From the calculated values of C^jA^ - A2 | and Equation 6.4, A^ and
A2 can be obtained.
6.2.3 A-tensor
From Equation 3.2.11,
(A, - Ao) - " (6.5)
Here B is a constant and the peak attenuation. And from Equation 6.4,

180
A + 2A - — (— ) • (6.6)1 z. p a .
^0
So and A^ can be given by
4
and A = — (— ) + h / ~ ^ 2 Cq a
These equations provide two values of A^ and A^ depending on whether
A^ is < A .
Using these values, graphs were plotted from A. and A,, versus r ,
as shown in Figs. 6.1 and 6.2. These graphs show that the difference
(Af - A^) is appreciable for from (0.005) to (0.05) and then
decreases rapidly.

l8l
.02
.01
0
.01 1 1.0
FIG. 6,1 Plot of defect concentration versus X for BGO

182
c\]%
.02
01
0
005 010
FIG. 6.2 Plot of defect concentration versus X for BSO

1836.2.4 Range of A
As described in Section 1.2, Craig et al (1975) have shown that the
body centered cubic structure with formula can accommodate
a variety of different M atoms. If the lattice constants for these
crystals are plotted versus the ionic radii given in Table 1.1,
it can be seen from Graph 6.3 that the lattice constant increases
linearly with the ionic radius.
A comparison with close-packing shown by the dotted line suggests a
relatively loose structure.
Crystals of BMO with M being a Bi atom, have been prepared but are
found to be unstable at room temperature. To obtain an order of
magnitude of \ tensor for a Bi substitution on Ge sites, let us
that all Ge atoms in BGO are replaced by Bi atoms. From Equation 3.12 for
a substitutional atom, the increase in the lattice constant isa
From the graph in Fig. 6.3, we can calculate approximate value for
This gives
X % 0,01 For Bi substitution on Ge sites,X « - 0,004 For Si on Ge si'tes,X w 0,004 For Ge on Si sites.
and for vacancies on Ge or Si sites, X would be -0.004).
Various figures have been given by different workers for the number
of defects in BGO/BSO.

184
BiPb
2 +Zn 4 +Zr
Ge Fe
Si Al1.01
1.00 I--0 . 0 4 0.06 0.08 0.1
(nm )
FIG, 6.3 Lattice constant versus ionic radius

185(i) Brice (1977) has shown that these crystals typically contain
-5impurities up to about 10 ppm (i.e. 1 x 10 ). If these impur
ities are the cause of attenuation peaks and the optical
absorption, A would have to be enormously large.
(ii) Abraham et al (1967) have shown by X-ray analysis that Si or
Ge vacancies of the order of (0.13) can be present in these
crystals. But for vacancies X would have (-ve) value.
(iii) Oberschmid (1979) has mentioned that Bi substituting for Ge
or Si is always less than (0.035).
(iv) Tanguay (1976) also reports that the number of defects is less
than (0 .01).
(v) As seen in Ghapter Four, a sample of BGO doped with Ga (0.004)
showed no attenuation peak and the optical absorption shoulder
within the band gap was also removed. If this dopant concen
tration corresponds to the number of defects present in the
undoped crystal, this would give c Co be % (0.004).0
Rehwald (1976) also found that doping with Ga (0.002) reduced the
attenuation peak to about (1/3) of its undoped value. Therefore
it indicates that the defect concentration should be (> 0 .002).
Therefore, considering the defect concentration of the order of
C 0.005 o
X would be positive and have reasonable values of the order of
X ~ (+ 0.01 to 0 .02).

186
This value corresponds to the A value calculated for a substitution
on Ge or Si sites. But this conclusion depends on defect being the
only cause of expansions on facets.
The activation energies obtained from our results are given in Table 6.1
Rehwald (1975) obtained values for activation energies for BGO and
BSO to be 0.045 and 0.033, which agree with values obtained in this
work. Spencer (1972) obtained a much lower value of 0.005 eV.

1876.3 Other available measurements
To help identify the defect, various available measurements
for BGO, BSO are considered.
(a) From ESR measurements in BSO Tanguay (1976) concluded that
the number of unpaired spins is less than 5 ppm in undoped
pair BSO (i.e., with absorbing centres). This indicates that
the number of unpaired electrons is very small in these crystals.
(b) As described in the first Ghapter, the dark conductivity is
p-type in these crystals, but photoconductivity measurements
show that the electrons dominate the photocurrent in undoped
crystals.
(c) Abraham et al (1967, 1979) has reported from the X-ray dif
fraction studies on BGO and BSO that the occupancy factor
of the Ge sites is 0.87 ± .02 and 0.87 ± 0.08 for Si.
But, Brice, Hill (1974) and Wilkes (1978) in reports on the
growth of BSO crystals show that the Bismuth to Silicon2"
ratio in the crystal varies from 11.77 : 1 to 12.05 : 1, as
the ratio in the melt is varied from 10 : 1 to 15 : 1, as
shown in Table 6.2 and Graph given in Fig. 6.4.
(d) Rehwald (1975) also reports that the dielectric loss measure
ments show no temperature dependence. Therefore there is no
electric dipole associated with the elastic dipole.
Taking all these measurements into account, the possible defect centres
are discussed below.

188
12.1
12.0
Xs 11.9
11.8
11.7
FIG. 6.4 Relation of bismuth content in. the melt andthe crystal (Brice, 19?4)
TABLE 6.2 Lattice constant for crystals groi<n from different melt compositions (Brice,1974)
Compositions Lattice constant (^0 - 10.1000) X IQ4Melt (jfi.) Crystal (.v.s)
10.6 11.90 ± 0 .0 7 33 ± 3 *11.5 11.85 ± 0 .0 3 30 ± 311.7 11.77 ± 0-03 30 ± 112.1 11.92 ± 0.04 31 ± 212.8 12.03 ± 0.06 32 ± 413.3 12.05 ± 0 .1 0 33 ± 414.4 12.03 ± 0 .0 3 32 ± 1
*The Jallice constant for crystal grown from melt .vr. = 10.6 is 10.1033 ± 0.0003 A.

1896.4 Possible defect: centre
As discussed before the defects responsible for the ultrasonic
attenuation peaks and optical absorption shoulder is an intrinsic
defect. This defect must have trigonal symmetry. If the defect is
trigonal, it must lie on <111> axis through the Si site as shown in
Fig. 6.5. The site symmetries of various atoms discussed in Section 1.2
suggest that the defects must be associated with GeO^ or SiO^ tetrahedra,
The various possibilities are:
6.4.1 Ge or Si vacancy (v)
A simple Ge or Si vacancy cannot give rise to anelasticity since its
site symmetry is cubic 23 and . However, as assumed by
Scholtz and Seegar (1963) for vacancies in germanium, i&.»thc bonds
which are broken to form a vacancy are reformed between pairs of atoms
nearest neighbours to the vacancy, the defect formed may have lower
than cubic symmetry and give rise to relaxation. This .is really a
manifestation of Jahn Teller effect (Watkins, 1972).
6.4.2 Oxygen-vacancy
An oxygen vacancy on 0(3) or 0(2) site forming the tetrahedron would
have the trigonal symmetry. The oxygen will have four different sites
on the tetrahedron surrounding the silicon or germanium site.
6.4.3 Divacancy (v-v)
In stochiometric compounds, it is possible^to have an equal number of
vacancies on the cation and anion lattices for charge neutrality.
Therefore if there are Ge or Si vacancies there may be oxygen vacan
cies associated with these and form divacancies as [GeO] or [Sio]

190
0(2)
0(3)
Ge
0(3)
0(2)/
/
FIG. 6.5 Diagram of a trigonal defect

1916.4.4 Vacancy substitutional pair (v-s)
If certain ions of a lower valence substitute for Ge or Si, the presence
of a vacancy on an oxygen site is required for charge neutrality. Due
to strong coulomb attraction, it can be expected that the substituted
ion and vacancy are located on adjacent sites. Thus the vacancy can
be on one of the four tetrahedron sites and the defect so formed is
trigonal.
6.4.5 Substitutional-interstitial pair (s-i)
In certain insulators and semiconductors, defects consisting of an
interstitial atom bound to a substitutional impurity have been observed.
Therefore a defect consisting of an atom on Ge or Si site associated
with an interstitial oxygen may form the required defect.
Some of these defects have been considered by other workers. From
Abraham's X-ray data, Hou et al (1972) assume that Ge or Si vacancies19 3of the order of 10 /cm can exist in BGO, BSO and for charge neutral
ity oxygen vacancies are needed. Therefore a Ge, Si and oxygen
divacancy complex is regarded as the possible absorption centre.
They have explained the optical absorption shoulder by electronic
transitions from this Ge, Si vacancy complex level.
Rehwald has assumed that if this level is degenerate and splits
under the external strain, it can cause the ultrasonic attenuation
observed.
Hou et al (1972) and Rehwald (1976) have expressed the opinion that
various dopants shift the Fermi level thereby effecting the optical
and ultrasonic attenuation. A1 doping is assumed to occupy Si sites
and lower the Fermi level by creating acceptor levels. If has been

192indicated that addition of P brings the Fermi level back to the
original position and restores the absorption shoulder. But there
are a few inconsistencies. Firstly, as mentioned before, Brice
(1974) reports that when crystals are grown from a stochiometric
melt (i.e. 6 Bi^O^ : 1 GeOg), the Bi : Si ratio in the crystal is
always less than 12 : 1. This indicates a Bi deficiency in the
crystal.
A second puzzling feature is the fact that a (P + Ga)-doped BGO sample
used in this work did not show any attenuation peak. This crystal
was nearly transparent and Oberschmid (1977) found these samples to
be n-type. But the optical absorption within the band gap was reduced
compared to that for the undoped crystals as in Fig. 4.13. This is
contrary to what should have been expected, according to the explan
ation given by Hqu et al (1972).
A second type of centre (s-v) pair is suggested by Oberschmid et al
(1979). They assume a Bi atom on Ge/Si site, because of the large
lattice constant observed in the facets, and a hole on the surrounding
oxygen tetrahedra sites associated with the Bi^ . centre.Ge,Si
They explain the dopant bleaching of the BGO, BSO crystals by the
following mechanism:
(a) Deep acceptor levels of A1 or Ga . site may reduceCt0 , ul. Cj0 , blthe absorption centre like

193(b) Electrons from donor levels of or P^^ site may compen
sate the hole of the absorption centre like
Bice.Si + h + e -
These effects are assumed to shift the optical transition energy levels
and cause the absorption shoulder to vanish.
This defect would have the right symmetry and would give a (+ve) X. 3-tvalue. But, some workers argue that Bi ion being too large and
as^ym^tric cannot occupy a position with site symmetries 23. Levin
and Roth (1964) have commented that metastable bcc phases are formed2+ 4+if oxides involving large ions such as Cd , Ce are added to Bi^O^.
Presumably these structures involve the large cations occupying the
tetrahedral sites thereby causing distortions. Therefore it seems
less likely that Bi^ is substituting for Ge/Si.
Craig and Stephenson (1975) have studied the structure.of two compounds
^^25^^^40 BiggZnO^Q involving Bi^Og. These crystals are also
body-centred cubic. They found that for both these crystals the elec
tron concentration on the tetrahedral sites was much higher than it
should be if these sites were fully occupied by Zn in the case of
BiggZnOgQ and Fe in the case of Big^FeO^^. They have explained this
higher electron population by assuming that there must be some Bismuth
substitution on the tetrahedral sites. They have assumed that5+ _ 3+
Y - Bi20g structure contains some Bi ions in addition to Bi , and
these smaller Bi^ ions can occupy the tetrahedral sites.
.5+ .Brice et al (1977) have also assumed the presence of some Bi in
Y - Bi20g in order to explain the larger lattice constant observed
in the facetyfs.

194. 5+ ,Therefore if Bi ions can be present in 7 - BigOg, these ions may
occupy some of Ge/Si sites in BGO/BSO crystals. The substitution . 5+of Bi on Ge/Si sites would give a (+) X value and the increased
lattice constant observed in the facets. If the pentavalent Bi^^
ion replaces Si^ or Ge^^ ions in the crystal, the mode of charge
compensation is the introduction of extra (0 ”) ions.
The relaxation of (O ) ions can therefore possibly give rise to the
effects observed in these crystals. The addition of Al, Ga, may
reduce the content of Bi^ ions present in BGO/BSO, thus removing
the attenuation peaks and the optical absorption shoulder below the
band gap.
Wardzynskii et al (1979) have mentioned (ESR measurements) that Cr
added as a dopant to BGO occupies tetrahedral sites. The presence3+ 5+
of a Cr on a tetrahedral site would cause a Bi ion to"‘occupy the.5+neighbouring tetrahedral site for charge i|,trality, thus increasing.the Bi
content. This would explain the larger ultrasonic attenuation and
optical absorption shoulder observed in Cr-doped BGO cyrstals. Due
to the complex structure of these crystals, it is difficult to say
exactly what is causing the effects observed in this material, but .5+ . 'the presence of Bi ions may be the possible cause.
It was assumed in section 6 .2.2 that the larger opcical absorption and
a larger lattice constant in fa-' f -, is due to fhe incje>. ;cd number of
defects', and would give a corresponding increase in attenuation peaks;
therefore it would be required to do some measurements on attenuation in the
facet regions, to confirm this assumption.
It would also be intersting to make some attenuation measurements in crystals. 5+of Bi2gFeO^0 and BiggZnOg^, in which the presence of Bi ions has been
indicated by Craig and Stephonson(1975),

195
6.5 Conclusion
The aim of this work was to try and establish the possible- cause of large
attenuation peaks observed at low temperatures in single crystals of BGO
and BSO. Measurements of the attenuation in undoped BGO crystals, for
different modes have shot-m that these peaks are single Debye peaks,
probably due to the relaxation of point defects.Measurements suggest that
the defects must have a trigonal symmetry.
Measurements made on doped BGO crystals have shoxm that the attenuation
in these crystals depends strongly on the dopant present. A correlation
has been observed between the attenuation peak and the optical absorption
shoulder below the band gap, confirming the suggestion that the same
defect centre is responsible for both these effects. It was hoped that
this work would provide enough information to decide the possible defect
centre, but due to the com^icated structure of the material and certain
inconsisteacies; with various experiments it is not possible to positively
identify the defects at this time,although various suggestic^ are made.
Further experiments in these and related materials would be required to solve this
problem.

196
REFERENCES
Abraham SC, Jamieson PB and Bernstein JL 196? J. Chem. Phys. 4?i 40 34.
Abraham SC, Bernstein JL and Svensson C 1979 J. Chem. Phys. 7 1 , 788.
Akhieser A 1939 J. Phys. (U.S.S.R. ) 1_, 277-
Albova MS, Andreev AA1977 Sov. Tech. Phys. Lett. 3(6), 219.
Aldrich RE, Hou SL, Harvill ML 1971 J. Appl. Phys. 42, 493.
Autonov VA, Arsenyev PA et al 1976Kristall und Technik (Germany) 1 0 , k59-
Ballman AA 1967 Journal of Crystal Growth _1,
Bernstein JL 1967 Journal of Crystal Growth _1, 45-
Berry BS, Nowick AS 1966 Physical Acoustics lllA, 1
Bommel H, Dransfeld K 196O Phys. Rev. 117, 1245-
Brice JC 1977 Journal of Crystal Growth 42, 427-
Brice JC 1977 Report on Progress in Physics 40, 575
Brice JC, Right M J , Hill OF, Whiffins PAC 1977 Philips Technical Review 37» 250.

197
Butcher KJ 1978 Ph .D . Thesis, University of London.
Clegg JB, Millet EJ 1974 Philips Tech. Rev. ]4, 344.
Clement JR, Quinnell EH 1952 Rev. Sci. Instru. 23 » 213
Craig DC, Stephenson NC 1975J. of Solid State Chemistry 15 » 1.
Cryotech Lake Shore Cryotronics,Sandrock RD, Eden.N.Y.14057 .
Dobbs ER, Hughes E. Lawson N S , Lea M J , Meredith DJ and Timms WE 197 3 J. Phys. E. 309-
Douglas GG, Zitter RN I968 J. Appl. Phys. 39 » 2133-
Feigelson 1976 Tanguay's Thesis..
Feinlab I, Oliver DS 1972 Apl. Opt. 11, 2752
Fynn GW, Powell WJA 1979 The Cutting and Polishing of Electro-optic Materials (Adam, Hilger Ltd).
Grambaier 1978 Private Communication.
Gur.tler I9O 3 Z. Anorg. Allgen. Chem. 37 » 222.
Gyorgy EM, Krause JT, Lecraw RC, Merritt FR,Sturge MD 1967 Phys. Rev. 155, 2l8.

198
Hardy K 197b M.Sc. Project Report, University of London.Hill OF, Brice JC 1974 J. of Materials Science 2652.
Hou SL, Oliver DS 1972 Appl. Phys. Letters 18 , 32-5.
Hou SL, Lauer RB, Aldrich RE 1973 J. Appl. Phys. 44, 2652.
Huignard JP, Micheron F 1976 Appl. Phys. Letters 29, 591.
Keyes R I967 Solid State Series 20, 37.
King PJ, Monk DJ, Oates SG I978 J. Phys. C. 11, IO67
Kraut EA, Tittmann BR, Graham LJ and Lim TC 1970 Appl. Phys. Lett*. 17, 271.
Krdner 1958 Kontinumstheorie der Versetzungen und Eigenspannungen Springer Berlin
Landau L D , Rumer G 1937 Phys. Z. Sowjun 11, I8
Lange J 1973 J. Phys. Rev. B8 , 5999.
Lawless WN 1971 Rev. Sci. Instrum. 32, 9.

199
Lea MJ , Butcher KJ , Dobbs ER 1978 Proceedings of The Institute of Acoustics.
Maris HJ 1964 Phil. Mag. 901-
Mason WP and Batemann 1966 J. Acoust. SocAmerica 40, 1343-
Nowick AS 1967 Advan. Phys. 16, 1.
Nowick AS 1970 J. Phys. Chem. Solids 31, 1819-
Nowick AS, Berry BS 1961 IBM J. Res. Dev. 297-
Nowick AS, Berry BS 1972 Anelastic Relaxation inCrystalline Solids (Academic Press).
Nowick AS, Heller WR 1963 Advan. Phys. 13, 251-
Nowick AS, Heller WR 1956 Advan. Phys. l4, 101.
Nye JF 1957 Physical Properties of Crystals (Oxford Press)
Oberschmid R 1978 German Physical Society Meeting, Freudenstadt.
Onoe M, Warner AW and Ballman AA 1967 IEEE Transactions on Sonics and Ultrasonics SU-l4, 165-
Orbach R 1967 Proc. Roy. Soc. A261, 458.

200
Peletier M, Micheron F 1977 J. Appl. Phys. 48, 3683.
Pire B, Zeks B and Gosar P 1966 J. Phys. Chem. Solids27, 1219.
Rehwald W 1973 J. Appl. Phys. 44, 3017-
Rehwald W, Frick K. Lang GK, Meier E 1976 J. Appl. Phys. 47 1292.
Scott P and Jeffries C 1962 Phys. Rev. 127 » 32.#
Schumb W and Rittner EJ 1943 Amer. Chem. Soc. 63, 1033-
Sillen LG 1937 Arkiv. Kem. Mineral. Geol. 12A , 1.
Sillen LG and Aurvillius B 1943 Nature 133 » 303-
Silverman BD 1968 Prog. Theor. Phys. 39, 245-
Simons S 1963 Proc. Phys. Soc. 8 2 , 40l,
Simpson IC 1975 J . Phys. C . 399-
Slobodnik AJ and Sethares JC 1971 Physical Sciences Research Papers, No. 467-
Spranskaya and Arshakuni AA 1964 Zh. Neorg. Khim. 226
Spencer EG, Lenzo PV and Ballman AA 1966 Appl. Phys. Lett. 290.
Scholz A, Seegar A I963 Phys. Status Solidi (Germany)

201
Sussmann J 1^64 Phys. Condensed Matter l46.
Sussmann J 19^7 J. Phys. Chem. Solids 28, l643
Tanguay A 1977 Ph.D. Thesis Yale University.
Tanguay A 1977 J. of Crystal Growth 42, 431.
Truell R, Chick BB and Anderson G 196O The J. of the Acoustical Society of America 32, I86.
Truell R, Elbaum C and Chick BB I969 UltrasonicMethods in Solid State Physics (Academic Press)
Van Vleck J 1967 U « Phys. Rev. 37, 426.
Watkins GD 1972 Radiation damage and defects in SemicoductorsConf. Series I6 , 228.
Wardzynskii W, Lukasiewicz T et al 1979 Optics Communication 30, 2O 3.
Woodruff TO, Ehrenreich H 1961 Phys. Rev. 123, 1353-
Wilkes J 1978 Private Communication.
Zelenka J 1978 Czech. J. Phys. B28, 163.
Zener C 1948 Elasticity and Aneleasticity in Metals (University of Chicago Press).

202
Zener C 1950 Acta Crystallogr. 2? 346
2 0 3 APPENDIX. 1
- - - V P R O G R A M H E C A X C I N F U T , O U T P U T , TARE/? = a U T P U r )L ' l l i f . i S I u U A T T f l i C P n J , / ) , A [ j O R ! 1 C 2 U 0 , 7 ) , 1 t ' i P ( P » . - . 0 ) ' 7 f R L U ( 7 ) , A ( 7 ) ,
1 T P ( 7 ) , D A T A ( 2 0 0 , G ) , C O D E ( a ) , X H A R ( 3 ) , S T D ( 3 ] / 5 K E H ( H ) ÿ C U R T / Ü ) k ± z y 5 7 ± E ^ Ë ± ^ 5 ca Ô ), .i c a , 3 ), c f G , 3 ), 0 ( a , a ), 5 (0,8 ) ; tiiE TA ( 7 ) t a t t f r f 7). . . . . . . . . . . . .N O . OF.-- 0 A T A -- P 0 I .M T S . AND: N O . 0 F ■ D A T A z S E T S .' - R E A D l ' J i h U : J , | l --------------------------------------------------- -------------------------------------------- ------------------------------------------ - ---- ----------------
: v±.±:±.LCALL FI T ( A T T E N ) A N O R M / T F M P , . F R F O , A , - T P y D A J A , C 0 D _ 5 X R A K y 5 T q ; S ^ l R , U , C , n , S u N O , M , M l , T U E T A ^ A T T F R ) --- - - - - - - - - - -
E N D
^ - • ^ ^ S U & P n U T I : ; F - F I T ( A T T F n V A N O I ? M , T F H P ; F R E n 7 A 7 T P , ( > A X A i C r s p F , X ^ f T ^ T P I ^ ^ Ï S K E P , C U R T , R , N , C , 8 , 3 , N O , M , H I , T H E T A , A T T F Ü ) :
. D1N F .0 S X 0 1} • A T T E N C N 0 , ?• 1 ) > A U 0 R .M (MO, H 1 ) , T E M P ( M 0 F R F 0 ( M I ) 7 ZZY:- Z 3 ±E5 - "■■ • l A ( r i ) , T P ( H l ) , D A T A ( N Ü , H ) , C 0 U E ( M ) , X A A R ( M ) , S T 0 ( M ) 7 i K F X ( M i , C U R T ( M y y ± ± . - . r . . 2 K ( r i A ! 0 , M ( M , M ) , C ( H , M ) , n ( H , M ) , ? ( M , H ) , T H E T A ( M l ) , A T T F R ( H i î , : Ë ^ ^ = = L ± T aaâ * * r EAD 'THE'iJEXT' t h r e e CARPS WHICll GtVE THE FREGUElCfCS USED, C * * * 1 ^ P P R 0 : < A VALUES AMO PEAK-TEMPEHATURES±±1 Z -— IMZEz—'■ “'kfad 1 Ji, crREQ(T),i = i',H-i)---------- ------:------ -— -
~ i< E A 0 1 0 I , ( T P CI ) # 1 = 1, M “ I r ~ ~ —1 IX I - F 0 R H A T ( fl IM U , 4 ) r -
C***aaREADTHE NO DATA SETS OF ATTÊNCD3/CM) AND' fEMPÊRATÜRr':-.= czr.:_.T lOU ( A f f En ( 17'j )")ïï^, M-Ï) 7 T E H P lT )----- ------
: :zZ 'DATA( I ,M) = 14/TEMP( I i COU-TIMUE' .............. .............
DO 11 1=1,M -------------..CODE(r)=:!:*o.ç;^ËË==■" 11 COflTINUF
7.iC.4_x* *()(iït/RECRES.S%02rAUALY.SISËnN::THETM DAC A L L " H r 3 ;< ( N O /M, D A TA, COD EJX (3 A R/STD^Sj<EW, CUR 17 R7N", C, B ,S j I ER T
'C**^*AN0(?riALISE^HE>DATArT0;;=(AnEN7:*±îy^ .... 00 10 J=1,M-1 .C ALL- NORII (AITP.N f.ANpRM, TEMP, FREO,, Ag.QATAy TP, NO j /J~ T9 C O N T I N U E ..................
-T~ _,2 yfeCOl-Ll J.N-- - - . — j----------r_c * * * *;* VARY r- a:-; T n±c i v E^-i h E--m i m i m um - S ta n da r d/-D ev .i A n c m:
l'^COufÎHÙE-^g±E^C:AI:E=HORMl Anni) ANORHIJEHRIFREnTAT^ T, JT^
'C A Li; " H IS R I f] 0 7>77D ATÂ7C0DE7X0 A R75TD7SKE «1, C U R T7 R 7hT7C, 0 7 5 7 1E RT j=sxakFS(H53LÏY=IY+I
... Q Â ir N0R;-i(ÂTTEH7AN0RM,TEHP,FRFa7A7PATA7Tr7N07M7>ir,'J) :-------S fU |T07H 7D A T^C 0pF lX M R 7S I£ l^
- — ^ = S(! Î7J 5------------------------------------ —F C.S I n Si 01=310%
=G'0.èT.0.Ëï4Ë13 1 Fl 1 Y 70 T 7 T riTA-^N A -1“"iF(UA^Eor^y)nfonb"T3 -
G li T IN =
204
L t " * * A C A L C l i L A T E RESULTS7 :yI = t / M ? 1 "THETA(l)--'GCM/n ■LfPüLzizIf ( I ) = I V/C ( I /M )
A r T F U n n 2 . A P r A F RE ;J Cl ) *77 E6 a exP ( -C ( .H7I )')17. CUNT luvry-;
C* AAAAPRINT 'DATA"WRITE (zTTFZirREOCJr FORMAT (/, l3H±FREOUENCY5%±ŸK10TAy3HHHZlS=
“ 1F ( IX Vf. a ; i y go ' 10-22 IÎE (2,100 ) A ( J
■ I 0U f o r m a t ( / , loH -D EST-A “"V Â rD E ''= '-;F lO V 57T 3H “ DB' K/CM TÎHZ)
' " 22■■ WKITr (2, uItToT™'£. 1 l7/.-h.0KMAT c/,j.9rif7>uT.r-Ai Aggj[LLyE=:g.?7a ^2 5'c o n t i n u e ■ " "
R 1T E ( 2 , 1 :''9 l tP C J ~ ' Ï 0 ‘r rn iT H À r( 7 ,? :Vn L -F A iX ~T En P E R AT û R r = TmTTTïTTKy • A, z = C A c J ) A F R E Q c J y ) /:{ T P c J ). * 27
■ '■ " " W R l T [ ( Z , i l O ) Z ---------------------------------------. ■ 1 1 3 F ü R M A T C / , 2 3 H P E A F - A TTENUAI IO F. 1.0 F4 > 5HQ 3 /C % 5±
" WRI T E ( 2 , 4 I l ) T H E T A ( J ) , S ( M , j y - :L 1 1- .FORMAT ( / , 2 1 H A C T I V A T l O H I £N£KG Y±=Rr', E l 3 7 3 ', 9 H 7 R E ^ V > ^ , F 1 2 7 3 T 4 H 3 3 Z X > 3 ^
■ ERR~='(EX? ( ALOG ( AT T F R U ) y k (S ( M , j y / T P C J ) y y - E X P T A L O G C A T T f R C j y y - ( S C H Ï j )
WRITE ( 2 , 1 1 2 ) A T T F R ( J j 7 ERP--------- = - - ' ' =--------------- -^.jM l l 2 -FORFAT ( / , 2 IH :A-TTLMP,F:FfiF.Gl)EMCY.±s77EXg7/IV 9 » F ^ ± ± y ± : - ; 7 Elg;aT/4H-3±HZ)-±F7
- - ÿ H a FORMAT C / A , 5X ,J .H T i RX ,~3HT / F , 5X7 5H A ET E N 7 5 X , 6 H A L T E ^ * 7 6 X } 2 H H T T / 7 J ^ 3 E 5 5 5 = 3■' ’ 00 r> i.-:T'/ro“— ----------------------------------------------
. - . - k .~ ± X A=E X p c D A T A.{I , J ) ) F ~------- W RIT r ( 2 , T 0 3 y T F M P CI y , D A T A ( I , H y 7 A T T E N C I7 ‘J y / A N 0 R M CT > J y 7 X A~:F:Fi M3 FORMAT (5F IC.Sl^FE^' ■■■ 8 CONTINUE"F C IX. E0 71 TRiCnFr072 C *7 * * * pR1\T REGRESSION MATRICE3'
F IF 7 2 R l T E ( 2 , ±04 ) .F z ^ t? F F - ■ 104 FORMAT(/,iüH-GRADIEüT-MAfRlXT
. 0 0 ± 7 : 15 i ,H F 3------------- ii RI T L ( 2 , 1 G 5 y C G C I7'J i 7J"=17M T;^^fr7ÿC0NTINVRS=" 135 F0RMAT(8GllT4y"
r.:TW R lTE(2,13 6 1 ^ 106 FORMAT(/ , 17H" TNTERCEPr"MÀTRIXy". 0 .9 1 = 1,
WR I t e C 2 7 10 5 ] ce CI71T )7 3 = IThH". -F177F 9- CONTINUE=-F=±±±%:
H R l T E ( 2 , F 0 7 r FL^l OT^FORM AI Ç / D 0 ' l S T = r7M".r3 F ± ^ c W R lT E (2 7 lB5.y^S(:nUF7J=yi^ TÛ“CONTINUE
F. T U H N:

:05
SÜDROÜT I n E- .MOR' î CATTEM, -AM(; î î : W T E H F , F R E Q , A, D ATA , TP , MO , M , îl I / 'J ) : —:■■ ■ [j] f'.f USiûri ATTEK(;iüVHl) /Ari01-:M(N0,r:l ) ,TFF.PCMO);FREQ(hn,
A - , % ; - A N û Rp C r , j j ) = ç 2 , T P ç i y?. Cû:■ T I NUE
C * * * * * T R A N S F O R M : T n ■ î; f ; C ^ T )-V. A : J DE t / T - A N D F, l.L A T A 7A R R A Y^EEEE^F^EEEEEFrFEE^r::.: 7'J'ô 5 ïr:l ,N0 ..
. • I F ( AMÛRP C I / J y . G T . ITE-fe ) ECnETO E 1 EE EE7EEZE 7£EEEFEE~.-±r;E:.EE:H7E±±EEY£Er:■■ D A T A ( I , J ) = - 1 0 0 . ■ “ ■ •■ -------------------------------------------------------------------------------------------------
' 1 2 C O U T I N U E
D A T A C I , J 3 = û E a ~ " — ------- --— - - - ------------------------ ---------------- --
I F ( T E U P C I ) 7 0 ËÊ T P U 31 — — = = = ^ rr= i= .-
N )j!ALÇGlÇl.y A;OM ( I,^}WSnHH_C:t:V/(AH: DATA (I/ J)_=ALaG(.iTT%Ajiam.(I:,;:n ): : S q g T y , ( 2
206APPENDIX 2
Proceedings of The Institute of Acoustics
ultrasonic Attenuation in Doped Bismuth Germanium Oxide P.K. Sandhu and M.J, LeaDepartment of Physics, Bedford College, University of London
We have measured the ultrasonic attenuation in single crystals of bismuth germanium oxide, Bij2 Ge O20 (BGO) at frequencies (o)/2tt) from 10 to 190 MHz at temperatures (T) from 4.2 to 260K. We have studied both undoped crystals and crystals doped with A£, Ga, Pb, Zn, Cr, P + Ga and Cr + Ga. The doped crystals were very kindly provided by Frau Dr. Grabmeier and R. Oberschmid of Siemens, München.
BGO is one of a group of isomorphous crystals whose formula is approximately Bii2 MO2Q where M represents a metal (usually, but not necessarily, quadrivalent). These are cubic crystals, space group I23, and have interesting piezoelectric, photoconductive and optical properties which have found applications in surface acoustic wave and electro-optic devices.
Some of our measurements in undoped BGO are shov/n in Figures 1 and 2 and confirm previous results by Rehwald and his c o - w o r k e r s (1'2)_ The most striking feature is a very strong attenuation peak at low temperatures only for thct e modes which involve the elastic constant Ci/ such as the transverse modes/T (100,001) and Tj(110,001) but not for the longitudinal mode L(100,100). This attenuation peak is typical of an anelastic relaxation due to point defedts' with the attenuation (a) given by
A .“ “ F (1 + co2t2) (1)
where A is a constant proportional to the defect concentration and the relaxa- . tion strength. t is a relaxation time which is well described by the Arrhenius relation
T (T) = exp (9/T) (2)where kg8 is an activation energy and the attempt frequency, 1/t^, is of the order of that for a lattice optical phonon. Our data has been fitted to . !equation (1), as shovm in Figure 2, for the T%(100,001) mode, to obtain values : of A, 0 and 1/t -
The magnitude of this attenuation peak in BGO is strongly affected by the presence of dopants, as sho;vn in Figure 3.Doping with the Group H element 'Zn (dopant fraction per formula unit ^0.009 ( ■ reduced the peak to 0.77 of its undoped value while doping with A&(0.033), Ga (0.004) and Pb (-0.5) removed the attenuation peak completely. However, doping with Cr (0.009) increased the attenuation by a factor of 2.3. The crystals with two dopants, Ga (0.005)+ Cr (5 X 10“^), P (0.029) + Ga (0.004), also showed no large attenuation peak although some very small relaxation peaks may be discernible in the data.These measurements complement %he work by Rehwald et al on crystals of the_isomorphous crystal, bismuth silicon oxide (BSO), doped with Group III elements. They found that Ga (0.002) and B (0.003) reduced the corresponding peak in BSO ' while AJl (0.008) removed it completely. ..... _ _ _ ___________
We have also investigated the effects of annealing on the ultrasonic attenuation by measuring the low temperature relaxation peak before and after

207Proceedings of The Institute of Acoustics
Ul Lraso'i Lc Attenuation in Doped Bismuth Germanium Oxide
annealing at 425°C either in a vacuum or in a pure atmosphere. For an undoped crystal no change in the attenuation peak was found. However, for the Cr doped sample the attenuation was reduced by vacuum annealing to 0.57 of its original value and was restored by oxygon annealing as shown in Figure 4.
There seems to be a strong correlation between the ultrasonic attenuation,a, and the optical absorption, a, in these crystals. . BGO is an insulator with adirect band gap of 3.25 eV but the undoped crystals are a pale yellow colour andhave considerable optical absorption in the visible region below the band edge.This absorption is not present in those doped crystals which show noultrasonic attenuation peak and these crystals are nearly transparent. Similarresults in BSO. were found by Rehwald et al (“). Hence it seems probable that thesame defect centre may be responsible for both the c^tical absorption and theultrasonic attenuation in these crystals'. Tanguay found that the opticalabsorption in undoped BSO was unaffected by vacuum or O2 annealing and, by .inference, this correlates with our results on the annealing of undoped BGOcrystals. However, for Cr doped BsO Tanguay found strong photochromie behaviourwith very strong optical absorption 6ands v/hich could be bleached by oxygenannealing and restored by vacuum annealing. This is exactly the opposite to .the behaviour of the ultrasonic attenuation in our Cr doped BGO crystal (whichis almost black). '
*The defects responsible for these effects are not yet known. If we assume a point defect is responsible for the ultrasonic attenuation then we. can obtain jits symmetry from selection r u l e s " (3) Since the relaxation affects-C^tf but not- (C] 'j-Ci2) then the defect must have trigonal symmetry. It must therefore be associated with the oxygen atoms in the GeOi tetrahedra which lie at the cubic [ (23) sites in the crystal. Several possible defects have been suggested for the optical absorption, a recent p r o p o s a l ( ) being a Bi " ion on a Ge site with a | hole ! on one of the surrounding 0^~ sites. Such a defect would have the correct symmetry to produce the ultrasonic attenuation observed. Several mechanisms for the dopant-bleaching of the optical and ultrasonic absorptions can be envisaged but more work is needed to elucidate the'exact mechanism. ’ ‘
For the photochromie effects Tanguay; ( ) i as suggested that a charge transfer mechanism between neighbouring substitutional Cr and Bi ions on tetrahedral jsites could produce two metastable states (absorbing and non-absorbing). Our Idata: on Cr doped BGO suggests that one of these states may be the centre 1responsible for the ultrasonic attenuation- ;
We V70uld like to thank Frau Dr. Grabmeier and R. Oberschmid for supplying 'the doped crystals and for details of their extensive electrical and optical measurements on these crystals. We are grateful for the assistance of S. Sen, A.K. Betts and other members of the Physics Department.
• iReferences1. Rehwald, W., J.Appl.Phys. 44, 3017 (1973) '2. . Rehwald, .W. /i Frick,- K. Lang,' G.K. and.Meier, ..E..,.. J .Appl.Phys.,47 .1292_.(197.6).3. Nowick, A.S. and Berry, B.S., Anelastic relaxation in crystalline solids’, ;
AP (1972) . ............ !4. . Oberschmid, R. . and Grabmeier, B.C.private.communication and .German _____ '
Physical Society, Freudenstadt, 1978. ;5. Tanguay, A., Ph.D. thesis, Yale University (1977). '

200Proceedings of The Institute of Acoustics
Ü1 LtrasoM Lc; A c teriu.iti.on in Doped Diurnuth flerinaniuni Oxide
BGO 2 5 MHz
(dB/cm) T (100,001) Tp (110,001)L (111,111) L (100,100)
40 60 80 lOi20T (K)
Fig, 1 Ultrasonic attenuation in undoped BGO for several acoustic modes
BGOT (100,001)
20
(dB/cm)
lO^5
<25
O8040 6020
Fig-2 Attenuation of'T (100’,00r) mode in ' undoped "BGO fitted toeq.(1) with A = 34.8 dBK/cm MHz, 0 = 460K, l/i = 4.6x10^^Hz

209Proceedings of The InsUiute of Acoustics
Ul tr.rûfjonic; Attenuation in Doped Bismuth Germanium Oxide
Doped BGO (110,001)
90 MFIX40Cr a scaleZn(dB/cm)
AS, scale20 PbCr + Ga
80T (K) 6020 40Fig- 3 Attenuation of (110,001) mode in doped BGO
30
20
a(dB/cm)
10
BGO + Cr4- • +
» +(110,001) Unnanealed +
— 45 MHz • ^ Vacuum X
+annealed
^ 0 annealedX .
—
+X f +
. X*
f '
Ï * .
+" *
X ^X •>
X V"x + .
Î • a •; 1 1 t ^20 40 60 80
Fig. 4 Attenuation _bf T ' (110,001) mode in Cr_coped BGOafter __annealing in vacuum and in oxygen