Embed Size (px)
Citation preview

ULTRASONIC CUTTING OF CHEESE AND APPLES – EFFECT ON QUALITY ATTRIBUTES DURING STORAGE
BY
GULCIN YILDIZ
THESIS
Submitted in partial fulfillment of the requirements for the degree of Master of Science in Food Science and Human Nutrition
with a concentration in Food Science in the Graduate College of the
University of Illinois at Urbana-Champaign, 2013
Urbana, Illinois
Adviser:
Associate Professor Hao Feng

ii
ABSTRACT
With advantages such as having excellent cut face, reduced smearing, low product lost,
less deformation, less tendency to shatter for brittle products, and being able to handle sticky or
brittle foods, ultrasonic cutting has become increasingly popular in the food processing industry
in recent years. Although a number of publications have documented the use of ultrasound to cut
food with an improved end-product quality, all previous works were focused on ultrasound or
mechanical aspects of cutting process. No study has been published to investigating the effect of
ultrasound cutting on food quality during storage. My thesis research was conducted to
investigate the effect of ultrasound amplitude on the surface appearance and quality of selected
cheese (Cheddar, mozzarella, and Swiss cheese) and fresh cut apples (red delicious and golden
delicious) during storage.
To examine the effect of ultrasonic cutting on quality of cheese products, cheddar,
mozzarella, and Swiss cheeses were chosen because of their popularity. The focus of the
investigation was on quality changes of cheese samples cut with ultrasound and without
ultrasound in three-weeks of storage. Quality attributes such as total color difference, surface
topography, peroxide values, pH, and sensory characteristics (taste, odor, and overall
acceptability) of the samples were compared. General chemical parameters in ultrasonic cut
samples including lipid oxidation and pH value showed significant differences from that of the
Control. In addition, the L (lightness) values of samples cut with and without ultrasound were
significantly different. Furthermore, all cheeses cut with ultrasound showed shiny and smooth
surface appearance, while the surfaces were relatively rough for samples cut without ultrasound.
The microscope images indicated that ultrasonic cutting resulted in a smoother surface compared
to the Control.

iii
In the experiments with apples, red delicious and golden delicious apples were used
because of their popular use in fresh-cut apples and the rapid browning of slices (especially red
delicious apple which has a high susceptibility to browning) after preparation. The quality of
apple samples cut with and without ultrasound was evaluated for a period of two weeks. A
significant difference in polyphenol oxidase activity and pH levels was found between samples
cut with and without ultrasound. The L (lightness) values of apples cut with ultrasound were
significantly higher than that in the Control. Furthermore, both types of apples cut with
ultrasound exhibited smooth surface appearance, while the surfaces were relatively rough for
samples cut without ultrasound. The environmental scanning electron microscope images
indicated that ultrasonic cutting resulted in a smoother surface compared to the Control. Sensory
evaluation of cut apples by panelists showed that people favored apples cut with ultrasound.

iv
ACKNOWLEDGEMENTS
This thesis would not have been possible without the assistance of many people whose
contributions I gratefully acknowledge.
First and foremost thanks and appreciations especially go to my advisor and mentor, Dr.
Hao Feng, who has guided me on each step: research process, scientific thinking, writing and
financial support. I am indebted for the opportunity to do my master’s degree under his guidance.
Without his encouragement, I don’t know if I could go further in academics.
I would also like to thank Dr. Keith Cadwallader and Dr. Graciela Padua for their
willingness to serve on my committee and their support and contribution to my thesis
preparation.
My many thanks must also go to my friends and lab mates for their willingness to share
their knowledge of research with me and for their technical assistance. Thank you all for being
with me during all that stressful time.
I am grateful to my parents for their unconditional and endless love and the values they
have instilled in me since my childhood time. Their care, understanding, trust, and guidance are
essential in my quest for a science career.

v
TABLE OF CONTENTS
CHAPTER 1: INTRODUCTION …………………………………………………...……………1
CHAPTER 2: LITERATURE REVIEW………………………………………………………….3
2.1 Fresh-Cut Industry………………………………………...……………………..…....3
2.2 Lipid Oxidation….………………………………………………….…….……….…..6
2.3 Ultrasonic Cutting……….………………………………...…..…………………..…..8
2.4 Figures and Tables…………………………………………………………………...10
CHAPTER 3: ULTRASONIC CUTTING OF CHEDDAR, MOZZARELLA AND SWISS
CHEESES – EFFECT ON QUALITY ATTRIBUTES DURING STORAGE………………….14
3.1 Introduction …………………………………………………...…………….….……14
3.2 Materials and Methods …………………………………………………………..…..15
3.3 Results and Discussion …………………………………………..……………….....19
3.4 Conclusion..…………………………………………………………………….…....26
3.5 Figures and Tables…………………………………………………………………...28
CHAPTER 4: ULTRASONIC CUTTING OF RED AND GOLDEN DELICIOUS APPLES –
EFFECT ON QUALITY ATTRIBUTES DURING STORAGE………………………………..37
4.1 Introduction …………………………………………………...……………….…….37
4.2 Materials and Methods …………………………….……………………….………..39
4.3 Results and Discussion ………………………………..…………………….……....43
4.4 Conclusion. …………………………………………………………………….…....51
4.5 Figures and Tables…………………………………………………………………...53
CHAPTER 5: OVERALL CONCLUSIONS AND FUTURE WORK………………………….63
REFERENCES …………………………………………………………….………………...….65
APPENDIX A: PREPARATION SOLUTION
FOR PPO ACTIVITY….………………………………………………………………………..78
APPENDIX B: ABSORBANCE VS. TIME CURVE AND SLOPE OF THE CURVE OF RED
DELICIOUS APPLES CUT WITH AND WITHOUT ULTRASOUND FOR THE FIRST
DAY……………………………………………………………………………………………...79
APPENDIX C: ABSORBANCE VS. TIME CURVE AND SLOPE OF THE CURVE OF
GOLDEN DELICIOUS APPLES CUT WITH AND WITHOUT ULTRASOUND FOR THE
FIRST DAY………………………………………………………………………...……………81
APPENDIX D: ABSORBANCE VS. TIME CURVE AND SLOPE OF THE CURVE OF RED
DELICIOUS APPLES TREATED WITH 1% CaA SOLUTION IN COMBINED WITH
ULTRASOUND (50% AMPLITUDE) AND WITHOUT ULTRASOUND FOR THE FIRST
DAY…………………………………………………………………………..………………….83

vi
APPENDIX E: ABSORBANCE VS. TIME CURVE AND SLOPE OF THE CURVE OF
GOLDEN DELICIOUS APPLES TREATED WITH 1% CaA SOLUTION IN COMBINED
WITH ULTRASOUND (50% AMPLITUDE) AND WITHOUT ULTRASOUND FOR THE
FIRST DAY……………………………………………………………………………..……….84

1
CHAPTER 1
INTRODUCTION
Ultrasonic cutting has become increasingly popular in the food processing industry in
recent years as the technology produces cuts of high quality and accuracy (Lucas et al., 2006).
Poor cutting results in crushed, crumbled or torn products with significant waste. With
conventional cutting methods, the multilayered or textured products are smeared and separated.
In addition, portions are misshapen, distorted, overweight or underweight (Mason, 1998). On the
other hand, ultrasound-assisted cutting of food has several advantages such as having excellent
cut face, reduced smearing, low product lost, less deformation, less tendency to shatter for brittle
products, and being able to handle sticky or brittle foods (Rawson, 1998). The quality of food
cut by ultrasound is affected by the food type and conditions such as frozen and thawed (Brown
et al., 2005). Ultrasound-assisted cutting finds applications in the cutting of fragile and
heterogeneous products (cakes, pastry and bakery products), and fatty (cheeses) or sticky
products (Arnold et al., 2009). This cutting method has been used for cutting of cheese, candy
bars, bakery, confectionary products, and other convenience foods (Schneider et al., 2002).
Cheese cutting is an essential operation as many cheese products are sold in sliced or
other cut forms. In addition, the fresh-cut fruit and vegetable market, especially ready-to-eat
sliced apples, has rapidly grown in recent years due to the health benefits associated with these
foods. However, the processing of these foods has a number of problems. A major problem of
minimally processed apples is enzymatic browning. Because of enzymatic browning some fruits
are discarded. Similarly, for cheese products, lipid oxidation is the main concern. To address

2
these issues, this study was undertaken to investigate ultrasonic cutting and its effect on selected
cheese (Cheddar, mozzarella, and Swiss cheese) and apple (red delicious and golden delicious
apple) products.
Although a number of publications have documented the use of ultrasound to cut food
with an improved end-product quality, all previous works were focused on ultrasound or
mechanical aspects of the cutting process. No study has been published to investigate the effect
of ultrasound cutting on food quality during storage. It was hypothesized that ultrasonic cutting
will improve cut surface appearance and quality of food products compared to conventional
cutting methods. The overall objective of this research was to investigate the effect of ultrasonic
cutting on the quality of two types of products, a fatty product (cheese) sensitive to oxidation and
a porous colloidal product (apple) sensitive to browning reaction during storage.
In the study to cut high fat products with ultrasound, the quality changes in 3 selected
cheeses products, i.e., cheddar, mozzarella, and Swiss cheeses cut with and without ultrasound
was examined during a 3-week period under refrigeration conditions. Quality attributes evaluated
included lipid oxidation, pH, color, surface topography, and sensory properties. The effect of
ultrasonic cutting on plant tissues was conducted with apples during a 2-week period under
refrigeration conditions. Besides considering the polyphenol oxidase (PPO) activities of fresh-
cut red delicious and golden delicious apples, other quality attributes similar to that in cheese
quality evaluations were also evaluated, including pH, color, surface morphology, and sensory
properties.

3
CHAPTER 2
LITERATURE REVIEW
2.1 Fresh-Cut Industry
2.1.1 Fresh-cut produce
The International Fresh-cut Produce Association (IFPA) defines fresh-cut products as
fruits or vegetables that have been trimmed and/or peeled and/or cut into 100% usable product
that is bagged or pre-packaged to offer consumers high nutrition, convenience, and flavor while
still maintaining its freshness (Lamikanra, 2002).
The fresh-cut fruit and vegetable market has rapidly grown in recent years due to the
health benefits associated with these foods (Luo and Barbosa-Canovas, 1996). Ready-to-eat
sliced apples, for example, are now being offered by fast-food chains and school cafeterias. With
high fiber and low calorie content, precut produce provides busy consumers with healthful
options.
Fresh-cut produce quality is related to appearance, texture, flavor, and nutritional and
safety aspects of fruits and vegetables. Appearance ranks first affecting consumer purchase
preferences (Lund and Snowdon, 2000). In addition, other organoleptic characteristics such as
aroma, taste, and texture impact on purchase decision.
4
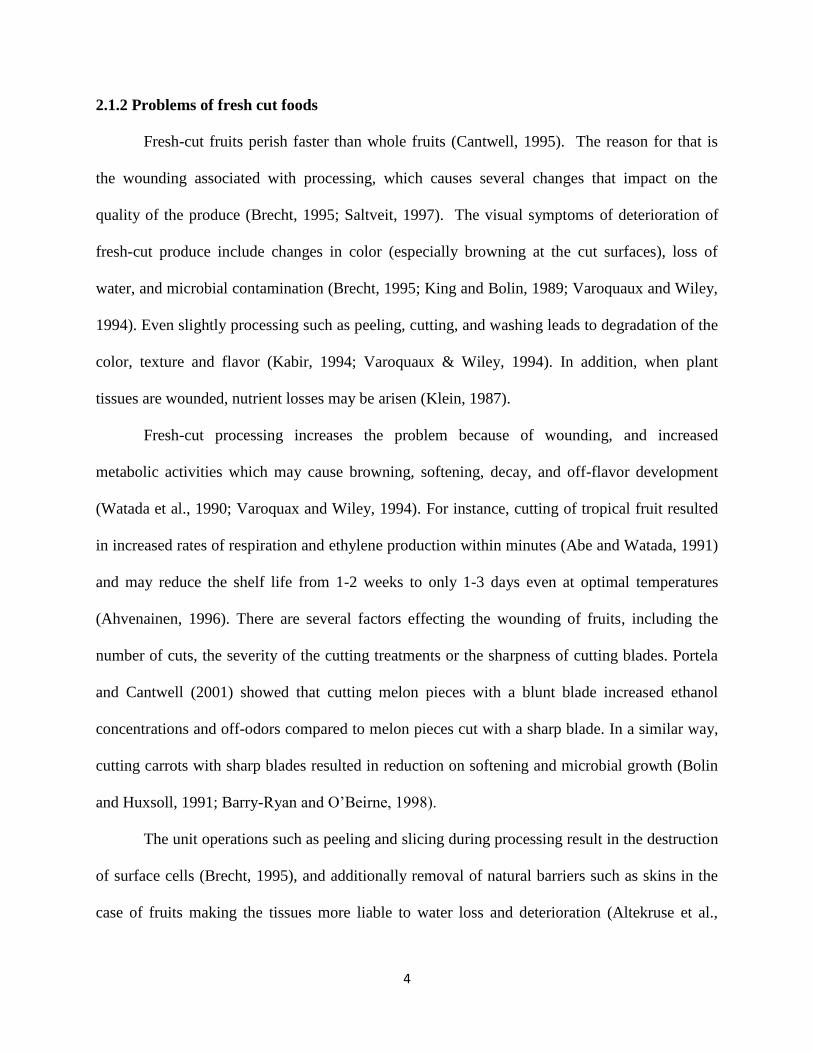
2.1.2 Problems of fresh cut foods
Fresh-cut fruits perish faster than whole fruits (Cantwell, 1995). The reason for that is
the wounding associated with processing, which causes several changes that impact on the
quality of the produce (Brecht, 1995; Saltveit, 1997). The visual symptoms of deterioration of
fresh-cut produce include changes in color (especially browning at the cut surfaces), loss of
water, and microbial contamination (Brecht, 1995; King and Bolin, 1989; Varoquaux and Wiley,
1994). Even slightly processing such as peeling, cutting, and washing leads to degradation of the
color, texture and flavor (Kabir, 1994; Varoquaux & Wiley, 1994). In addition, when plant
tissues are wounded, nutrient losses may be arisen (Klein, 1987).
Fresh-cut processing increases the problem because of wounding, and increased
metabolic activities which may cause browning, softening, decay, and off-flavor development
(Watada et al., 1990; Varoquax and Wiley, 1994). For instance, cutting of tropical fruit resulted
in increased rates of respiration and ethylene production within minutes (Abe and Watada, 1991)
and may reduce the shelf life from 1-2 weeks to only 1-3 days even at optimal temperatures
(Ahvenainen, 1996). There are several factors effecting the wounding of fruits, including the
number of cuts, the severity of the cutting treatments or the sharpness of cutting blades. Portela
and Cantwell (2001) showed that cutting melon pieces with a blunt blade increased ethanol
concentrations and off-odors compared to melon pieces cut with a sharp blade. In a similar way,
cutting carrots with sharp blades resulted in reduction on softening and microbial growth (Bolin
and Huxsoll, 1991; Barry-Ryan and O’Beirne, 1998).
The unit operations such as peeling and slicing during processing result in the destruction
of surface cells (Brecht, 1995), and additionally removal of natural barriers such as skins in the
case of fruits making the tissues more liable to water loss and deterioration (Altekruse et al.,

5
1997; Agar et al., 1999). This leads to an increase in respiration rate and ethylene production
(Saltveit, 1997; Saltveit et al., 2005). Furthermore, reaction between phenols and polyphenol
oxidase (PPO) causes browning discoloration (Martinez and Whitaker, 1995; Heaton and
Marangoni, 1996).
2.1.2.1 Enzymatic browning and polyphenol oxidase (PPO)
In the fresh cut food industry, enzymatic browning has a very important role. This type of
browning discoloration not only reduces the shelf life of several processed foods, but also
negatively impacts the quality of frozen fruits and vegetables (Shewfelt, 1986; Huxsoll and
Bolin, 1989). Because of enzymatic browning almost half of tropical fruits are discarded due to
quality defects (Whitaker, 1996). Even though enzymatic browning causes unwanted
discoloration, it is a desired reaction in some processes like tea and cocoa fermentation (Haard
and Chism, 1996).
The browning is mainly catalyzed by the enzyme polyphenol oxidase (1,2 benzenedio;
oxygen oxidoreductase; EC 1.10.3.1) which is also known as phenoloxidase, phenolase,
monophenol oxidase, diphenol oxidase and tyrosinase (Marshall et al., 2000). When plant tissues
undergo physical damage such as cutting, bruising or blending, PPO is activated by releasing
into the cytosol. In the presence of atmospheric oxygen and PPO, monophenol is hydrooxylated
to o-diphenol and diphenol can be oxidized to o-quinones, which then undergoes polymerization
to yield dark brown polymers (Fig. 2.1).
Polyphenol oxidase is consisted of monophenol oxidase or diphenol oxidase. Previous
studies on fruits and vegetables, such as apple (Goodenough et al., 1983), avocado (Kahn and
Pomerantz, 1980), eggplant (Perez-Gilabert and Carmona, 2000), grape (Ferrer et al., 1989), and

6
potato (Ferrer et al., 1993) showed PPO has both types of activities. On the other hand, those
from lettuce (Heimdal el al., 1994), longan (Jiang, 1999), pineapple (Das et al., 1997), field bean
(Paul and Gowda, 2000) and sunflower (Raymond et al., 1993) lack the hydroxylation properties
and act only on o-diphenols. Diphenol oxidase is the most prevalent form of PPO (Yoruk and
Marshall, 2003) and very important due to its leading reactions to form quinones, which produce
brown pigments, named melanin (Marshall et al., 2000).
2.2 Lipid Oxidation
Lipid oxidation refers to the spontaneous reaction of oxygen with unsaturated lipids and
is often noted by its characteristic ‘rancid’ off-flavors and odors by consumers (Schaich et al.,
2013). In addition to producing off-flavors and odors, oxidation of unsaturated lipids can also
decrease the nutritional quality and safety of foods after cooking and processing due to the
formation of secondary reaction products (Frankel, 1980). Lipid oxidation is a main contributor
to quality degradation in both natural and processed foods. In the presence of catalytic systems
such as light, heat, enzymes, and metals, oxidation of lipids has several negative impacts on
foods such as loss of flavor, development of off-flavors, loss of essential amino acids, loss of
color, nutrient value and functionality (Addis, 1986; Shahidi, 2000; Vercellotti et al.,1992).
2.2.1 Mechanism of lipid oxidation
In general, a lipid oxidation process is described as a complex sequence of chemical
reactions between unsaturated fatty acids and active oxygen species (Frankel, 1998; Nawar,
1996; McClements and Decker, 2000; Min and Boff, 2002). Lipid oxidation involves three

7
stages: initiation, propagation, and termination subsequently (Farmer et al., 1943; Farmer and
Sutton, 1943; Bolland, 1945, 1949; Swern, 1961).
A short explanation of the stages is as below and the possible reaction mechanism is
illustrated in Figure 2.2.
1. Initiation: Formation of free radicals
2. Propagation: Free-radical chain reactions
3. Termination: Formation of non-radical products
2.2.2 Measurements of lipid oxidation
Organoleptic evaluation is used by consumers to evaluate the quality of fats and oils.
Rancidity is the objectionable flavors that result from oxidation reaction of lipids. The test can be
done by individuals tasting or smelling the oil. It is possible to prevent human-error by using
several panels for evaluation of odor and taste and then statistical experimental design
conducted. However, this type of analysis has their own disadvantages such as the length of time
requirement and poor reproducibility. To improve the reproducibility, sensitivity, and
quantitativeness, a number of chemical methods were developed to measure lipid oxidation
(Gray, 1978).
Common assessments of lipid oxidation are shown in Table 2.1. The most common
methods are Peroxide Value (PV) and thiobarbituric acid (TBA) tests.
2.2.2.1 Peroxide method
Peroxide Value (PV) is the parameter which measures the amount of peroxides and
hydroperoxides (primary products) formed during oxidation of unsaturated fats and is one of the

8
most common quality indicators of fats and oils during production and storage (Antolovich et al.,
2002; Kanner and Rosenthal, 1992; Riuz et al., 2001). Hydroperoxides and peroxides oxidize
aqueous iodide to iodine, and then the iodine can be titrated with thiosulfate solution and starch
as end-point indicator (Kanner and Rosenthal, 1992). The primary products of lipid oxidation are
hydroperoxides which are generally referred to as peroxides. Therefore, determining the
concentration of peroxides as a measure of the extent of oxidation seems reasonable (Holman,
1954).
2.3 Ultrasonic Cutting
2.3.1 Introduction of ultrasonic cutting
Ultrasonic cutting is different from conventional cutting because the cutting motion is a
superposition of the conventional cutting movement of a blade and the vibrational movement
generated by ultrasound (Schneider et al, 2011). A typical ultrasonic food cutting system
includes four major components: a power supply, a converter, a booster and a cutting horn (or
knife). The ultrasonic power supply (generator) is an electronic device which converts standard
50/60 Hz AC line voltage to a high frequency electrical energy. The ultrasonic converter is a
sealed electro/mechanical device which is responsible to receive the high frequency electrical
energy, at 20 kHz for instance, from the generator and converts it to high frequency mechanical
vibrations using PZT (piezoelectric) ceramic discs. The booster is a metal mechanical amplifier
which will either raise or lower the amplitude of the horn’s mechanical motion, depending on the
arrangement of the masses at each end. The cutting horn, in other words a knife or a blade horn,
is the device that performs the actual cutting (Muccio, 1999).

9
2.3.2 Ultrasonic cutting of foods
Ultrasonic cutting has become increasingly popular in the food processing industry in
recent years as the technology produces cuts of high quality and accuracy (Lucas et al., 2006).
Poor cutting results in crushed, crumbled or torn product with significant waste. The
multilayered or textured products are smeared and separated. Portions are misshapen, distorted,
overweight or underweight (Mason, 1998). On the other hand, ultrasound assisted cutting of food
has several advantages such as having excellent cut face, reduced smearing, low product lost,
less deformation, less tendency to shatter for brittle products, and being able to handle sticky or
brittle foods (Rawson, 1998). The quality of food cut by ultrasound is affected by the food type
and conditions such as frozen and thawed (Brown et al., 2005). The most common application of
ultrasound is in the cutting of fragile foodstuffs. It finds uses in the particular cases of fragile and
heterogeneous products (cakes, pastry and bakery products) and fatty (cheeses) or sticky
products (Arnold et al., 2009). The foods such as cheese, candy bars, bakery and confectionary
products and convenience foods are mainly targeted for ultrasonic cutting (Schneider et al.,
2002). Table 2.2 shows some generic types of food products being successfully cut commercially
(Mason, 1998).
General benefits for the ultrasound-induced cutting of food are:
The quality of the cut face is visually excellent
The product is virtually undisturbed
Smearing is reduced
Multilayered products cut easily
Crumb and debris is significantly reduced
Brittle products have less tendency to shatter (Mason, 1998).

10
2.4 Figures and Tables
Figure 2.1. Schematic representation of oxidation reaction by PPO
(Caodi, 2007)

11
Figure 2.2. Schematic representation of the lipid oxidation mechanism
Initiation RH + Initial → R•
R’-CH=CH-R’’ + O2 → ROOH
Propagation R• + O2 → ROO•
ROO• + RH → ROOH + R•
ROOH → RO• + HO•
Termination R• + R• → Nonradical products
ROO• + ROO• → R1-CO-R2 +R1-CHOH-R2 + O2
(Kanner and Rosenthal, 1992)

12
Table 2.1. Common assay for lipid oxidation detection
Principle Assay Reference
Lipid substrate loss Gas chromatography Slater, 1984
Oxygen consumed for oxidation Oxygen uptake assay Slater, 1984
Generation of peroxides,
hydroperoxides
PV assay Kanner and Rosethal, 1992
Formation of malonaldehyde HPLC; TBA at 532 nm;
Fluorescence at 553 nm
Esterbauer et al., 1984
Formation of conjugated dienes OD at 234 nm Recknagel and Glende, 1984
Formation of carbonyl
compounds
GC-MS; HPLC Esterbauer and Zollner,
1989
Formation of free fatty acids Titration; electric
conductivity
Laubli et al., 1986

13
Table 2.2. Types of food suitable for ultrasonic cutting
Bakery products Frozen products Fresh products Bread Cream cakes Fish
Pastry Pies Meat
Pies Ice cream Vegetables
Cakes Ice cream cakes Bakery
Swiss rolls Composite Confectionery
Rich fruit cakes Sorbets (not water ices) Biscuits
Date and nut cakes Cakes
Cream cakes Bread
Tarts
Lemon meringue pie
Meringue
Oatmeal biscuits
(Mason, 1998).

14
CHAPTER 3
ULTRASONIC CUTTING OF CHEDDAR, MOZZARELLA AND SWISS CHEESES –
EFFECT ON QUALITY ATTRIBUTES DURING STORAGE
3.1 Introduction
Cheese is one of the most popular food products consumed in the world. The average
U.S. cheese consumption increased from 11 pounds per person in 1970 to 31 pounds per person
in 2003 (Buzby, 2005). Mozzarella and cheddar are the two most consumed types of cheeses,
accounting for 20.9% and 36.7% of the total volume sales of natural cheese in the U.S.,
respectively (IDFA, 2010). Cheeses are rich in high-quality protein, calcium, vitamins, minerals,
and essential fatty acids (Wong, 1974). Texture and color are two important criteria used to
evaluate cheese quality; they are often the primary considerations of consumers when making
purchasing decisions (Lebecque et al., 2001). Retail sales of cheeses are primarily in the form of
processed slices, accounting for 74% of the total supermarket sales (IDFA, 2006). In the United
States, processed cheese is produced and sold in various forms such as loaves (20%), slices
(74%), shreds (1.1.%), cubed (0.3%), spreads (4.5%), and others (0.1%) and is used as an
ingredient in numerous products (IDFA, 2006). Cheese cutting is therefore an essential operation
as many cheese products are sold in sliced or other cut forms. Proper cheese cutting is important
to ensure quality of cheese; it is also an area needing more attention from industry and academia.
Although a number of publications have documented the use of ultrasound to cut foods
with an improved end-product quality mainly from visual observations, all previous works were

15
focused on ultrasound or mechanical aspects of the cutting process (Arnold et al. 2009; Zahn et
al., 2005; Zahn et al., 2006;). No study has been published to investigate the effect of ultrasonic
cutting on the physical, chemical, and sensory quality attributes of a food product right after
cutting and during storage. This work was undertaken to investigate the effect of ultrasound
amplitude on the surface appearance and quality of selected cheese products immediately after
cutting and during a 3-week storage period at refrigeration temperature. Lipid oxidation level of
three different types of cheeses (Cheddar, mozzarella, and Swiss cheeses) cut with and without
ultrasound was compared. Color changes, pH, and surface topography (determined with a
SteREO Discovery V20 microscope) of the cheese samples were measured. Finally, a sensory
study was conducted to discern potential changes of Cheddar, mozzarella, and Swiss cheeses cut
with and without ultrasound on days 0 and 21.
3.2 Materials and Methods
3.2.1 Sample preparation
Cheddar, mozzarella, and Swiss cheeses were chosen for this study because of they are
among the most popular cheese products and all sold in cut forms. Cheddar, mozzarella and
Swiss cheeses produced from the same company (Kraft Foods Inc.) were purchased from a local
market in Springfield, IL. Ultrasonic knife was provided by Sonics & Materials, Inc. (Fig. 3.1).
All cheeses were cut without (control) and with ultrasound at three amplitudes (30%, 40%, and
50%) with the ultrasonic knife.
After being cut with and without ultrasound Cheddar, mozzarella, and Swiss cheeses
were kept under refrigeration conditions (0-4 0C) in wax paper for three weeks, and analyses

16
were done right after cutting and once per week during 3 weeks except sensory analysis. Sensory
analysis was done at 0 and 21 days of storage.
3.2.2 Color measurement
Color measurements were done with a Minolta Chroma Meter CR-300 (Minolta Camera
Co. Ltd., Osaka, Japan) by directly holding the device vertically to the surface of the cut
samples. The color meter was calibrated with a white standard plate. The color readings were
expressed by the lightness (L), redness (a, ±red-green) and yellowness (b, ±yellow-blue). For
each sample, three color readings (L, a, and b values) were taken (one at the center, one from the
left side, and the other from the right side of the sample) at room temperature. The averaged L, a,
and b values were reported. For each treatment, colors of 3 replicated samples were measured.
Color readings were taken right after cutting and once per week during the 3-week storage.
3.2.3 pH
For pH measurement, cut samples (2 g each, small cheese pieces got from the cheese
surface using knife) were placed in 30 ml of deionized distilled water (DDW) and homogenized
for 15 seconds using an Osterizer 12 speed blender (450 W) (Kim et al., 2010). The pH changes
of the homogenate were measured using an Accumet Research AR15 pH meter (Fisher
Scientific, USA). Three replications were used. The pH readings were taken right after cutting
and once per week during the 3-week storage period.

17
3.2.4 Lipid extraction and oxidation
Cheese samples were extracted with a Soxtec HT 1043 automated soxhlet extraction unit
following the method described by Soxhlet in 1879 and Priego-Capote et al. (2004) with
modifications. In brief, the cheese samples (10 g, with 2 replications) were dried, ground into
small particles using Osterizer 12 speed blender (450 W), and placed in a Whatman cellulose
extraction thimble and covered with a cotton plug. Extraction cups were filled with 50 milliliters
of hexane. A Thermo Neslab RTE 7 water bath set at 15°C was connected to the extraction unit.
The extraction thimbles were immersed in the boiling solvent for four hours, then raised above
the extraction cup, and rinsed for another four hours. The condenser valves were then closed and
the fan was turned on for approximately twenty minutes for evaporation. After that, the mixture
of lipids and hexane was put into a Precision 14 EG oven (Precision Scientific Inc., Chicago, IL)
at 105 0F and dried for 4 hours to remove all hexane from the mixture. After removal of residual
solvent, the extracted lipid was exposed to a peroxide value test in order to determine lipid
oxidation level of the cheeses. Lipid oxidation was assessed using peroxide value (PV) followed
the AOCS (1998; Cd 8-53) method. Five grams of extracted samples from the cheeses cut with
and without ultrasound were weighed into a 250 mL Erlenmeyer flask with addition of 30 ml
acetic acid - chloroform (3:2) solution. The flask was swirled until the samples were dissolved
and added 0.5 ml saturated potassium iodide (KI) solution. Waited for one minute and then
added 30 ml distilled water. The solution was titrated with 0.01 N sodium thiosulfate (Na2S2O3)
with constant and vigorous shaking. The liberated iodine (I2) was then titrated until the color
changed to light yellow. Added 0.5 ml of 1% soluble starch indicator which gave the solution a
blue color. Shaking the flask vigorously near the endpoint which was a faint blue color in order
to release all of the iodine from the chloroform (CHCl3) layer. Then, the sodium thiosulfate

18
(Na2S2O3) drop-wise until the blue color just disappeared was added. The PV was calculated and
reported as milliequivalents of oxygen per kilogram of sample (meq/kg).
The peroxide value as meq of peroxide /kg of oil was calculated according to the following
formula:
[meq. / kg]
where S = volume of thiosulfate solution (Na2S2O3) required to titrate the sample [ml];
M = 0.01, the concentration of the Na2S2O3 solution.
3.2.5 Sensory evaluation
Panelists (n =7) were used to evaluate sensory properties of the cheeses treated with and
without ultrasound. The sensory parameters were color, odor, taste, overall acceptability, and
off- odor. A 7-point hedonic scale was provided to the panelists as follows: like very much (7),
like moderately (6), like slightly (5), neither like nor dislike (4), dislike slightly (3), dislike
moderately (2), and dislike very much (1). For off-odor, no off-odor (1) and very strong off-odor
(7) were provided. Sensory analysis was done at 0 and 21 days of storage. (Kim et al., 2010).
3.2.6 Surface appearance and surface topography
Photos of the cheddar, Swiss and mozzarella cheeses cut with and without ultrasound
were taken by camera (Sony Cyber-Shot DSC-W570 16.1 MP Digital Still Camera). Surface
topography of the samples was measured by a digital stereo-microscope (ZEISS-SteREO:
Discovery.V20). In order to determine surface profile, samples were cut with and without
ultrasound into 4” × 4” pieces. After the placement of the specimens on the base, the images of

19
surface topography of cheddar, mozzarella, and Swiss cheeses were obtained with a Zeiss
Axiocam MRc color camera associated with the microscope (Zoom factor: 20, magnification:
30×, working distance: 30 mm).
3.2.7 Statistical analysis
Three replications for each treatment were used for all measurements, unless otherwise
stated. The results were analyzed statistically by analysis of variance using the General Linear
Models (PROC GLM) procedure in SAS (version 9.3, SAS Institute, Inc., Cary, North Carolina,
USA). Differences among the mean values were obtained by Fisher's least significant difference
(LSD) test at alpha=0.05.
3.3 Results and Discussion
3.3.1 Color changes
The color changes of the cheddar, mozzarella and Swiss cheeses cut with and without
ultrasound are shown in Tables 3.1, 3.2, and 3.3. The L (lightness) values of all ultrasound cut
cheeses were significantly higher than the control for all storage times. The L values increased
with an increase of ultrasound amplitude in all the samples, and the highest L value was observed
for the samples cut with 50% amplitude. No significant changes were observed between cheeses
cut with ultrasound and w/o ultrasound in their a (redness) and b (yellowness) values during 3
weeks of storage. The L values decreased slightly with the storage time in all the samples
(Cheddar, mozzarella, and Swiss) and all treatments (0%, 30%, 40%, and 50% amplitude). The
highest L value was observed for the samples on day 0, and the lowest L value was observed for
the last (third) week samples. Especially, a significant decrease in L values was observed

20
between day 0 and day 21 of the Swiss cheese cut w/o ultrasound. The a values slightly
increased with the storage time in all the samples. Similarly, the b values in all cheeses slightly
increased during storage, with the lowest b values observed on day 0 (all types of cheeses and
methods as well) and the highest observed on day 21.
Color is an important quality attribute of cheese, and it can range from pale yellow to
deep red-orange, depending on the production method and consumer preference (EL-Nimr et al.,
2010). The color of a food product is mostly due to the presence of natural colorant(s). Color can
also be changed by enzymatic and non-enzymatic reactions (Francis, 1980). Usually, a decrease
in L value indicates browning development (Rico et al., 2007). In this study, the browning of the
cheese was monitored using the L*a*b system. The L (lightness) values of all types of cheeses
and treatments decreased, while a (redness) and b (yellowness) increased during the storage,
indicating browning activities. Piergiovanni et al. (1989) found a similar result from a model
cheese system, for which zero-order kinetics was found to yield an adequate description of the
non-enzymatic browning at 20 0C, 25
0C and 30
0C. During peeling and cutting operations, if the
equipment used is not in the best condition, for example, if dull knives and blades are used,
damage to the product will occur; thus, the sharpness of knife blades can significantly affect
product quality (Bolin et al., 1977). In addition, browning is easy to develop when the product is
cut because the cut surfaces allow oxygen in the air to react with the enzyme and other chemicals
(Brecht, 1995). In ultrasonic cutting, less damage and a relatively smooth surface was observed
on the cheese surfaces (Figure 3.2 & 3.3). Cheese samples cut with ultrasound were less
susceptible to browning development or lipid oxidation. This can be attributed to less surface
damage and relatively smooth cut surface from ultrasonic cutting that reduce the surface area and
thus access of oxygen responsible to lipid oxidation and subsequent color changes. Barnicoat

21
(1950) studied the mechanism of discoloration in cheeses and concluded that it was resulted from
oxidation and the more open-textured cheeses tended to be more discolored. Additionally,
ultrasonic cutting reduced the contact time of the knife with cheese. The contact time between
the knife and the cheeses was 1.2 seconds for the samples cut with 50% amplitude ultrasound
and 2.1 seconds for the samples cut w/o ultrasound. Results of visual color evaluations by the
panelists showed that even though there were slight differences between samples cut with and
w/o ultrasound, people liked the color of cheeses cut with ultrasound compared to the cheeses cut
without ultrasound.
3.3.2 pH changes
The pH changes measured at room temperature for cheddar, Swiss and mozzarella
cheeses treated with and without ultrasound are shown in Table 3.4. The pH values of the
cheddar cheese were in the range of 5.63 to 6.07 on day 0, and they were from 5.82 to 5.98 for
the Swiss cheese, and 5.78 to 5.86 for the mozzarella cheese, respectively. The changes in pH
values of three cheeses followed the same trend in the following storage times. A decrease in pH
values was recorded for all types of cheeses cut with ultrasound during three weeks. The pH
values increased slightly with the storage time in all samples (Cheddar, mozzarella, and Swiss)
and all methods (0%, 30%, 40%, and 50% amplitude). The lowest pH value was observed for the
samples on day 0, and the highest pH value was observed for the last (twenty-first) day samples.
This is in agreement with the work of Hassan et al. (2004) who reported a slight increase in pH
during storage for Cheddar cheese. Changes in pH plays an important role in the development of
the texture and a decrease in pH is a main determinant of the hardness and fracture properties of
cheese (Fox et al., 1993; Creamer & Olson, 2005). The pH changes reported in this study might

22
be due to the surface textural changes during cutting since during ultrasonic cutting the texture of
cheeses did not get any severe damages compared to the cheeses cut w/o ultrasound. The pH of
cheese is an important attribute that influences its quality (Upreti & Metzger, 2007). Cheeses
that have a higher pH values spoil most quickly. Conversely, cheeses have low pH and low water
activity retain their desirable eating qualities for long periods (Ledenbach & Marshall, 2010). It
is therefore a favorable outcome when the pH values of cheeses were lowered by ultrasonic
cutting.
3.3.3 Lipid oxidation
The peroxide values (PV) of cheddar, Swiss and mozzarella cheeses as affected by
treatment and storage time are tabulated in Table 3.5. On day 0, no lipid peroxidation was
observed. Starting from day 7, lipid peroxidation was detected. The peroxide values of the
cheddar cheese were in the range of 3 to 4.5 meq/kg, and they were from 3 to 5 meq/kg for the
Swiss cheese, and 2 to 3.5 meq/kg for the mozzarella cheese, respectively. The peroxide values
for all three cheeses kept increasing on day 14 and reached the highest values on day 21. The
ultrasonic cutting helped to reduce lipid peroxidation, as shown by lower peroxide values in the
ultrasound cut cheeses, especially in the samples cut with 50% amplitude ultrasound. Even
though for the fourteenth and twenty-first days there was no significant differences between
samples cut with and w/o ultrasound, a decrease in PV was observed for the samples cut with
ultrasound for all types of cheeses.
The oxidation in the Swiss cheese was more pronounced as shown by higher PV values
during storage. The PV values in the cheddar were moderate while those in the mozzarella were
the lowest. Cheddar whey is more prone to lipid oxidation than mozzarella whey, resulting in a

23
higher concentration of rancid flavors such as sour aromatic and cardboard notes. Researchers
believe that the mesophilic starter cultures used in Cheddar manufacturing initiate the oxidation
process and produce more rancid off-flavors compared with thermophilic starter cultures used in
mozzarella manufacturing (Campbell et al., 2011a,b). It might be the reason why the PV values
in cheddar cheese were higher compared to the mozzarella cheese. Sensory evaluation of cheeses
by panelists supported the result. Even though no off-odor was observed for all types of cheeses
on both days 14 and 21, the panelists that evaluated the cheeses odor gave the highest scores to
Mozzarella cheeses where the least lipid peroxidation (i.e. lowest PVs) was reported among the
cheese samples.
The amount of peroxides of lipids indicates the degree of primary oxidation and therefore
its likeliness of becoming rancid. A lower number of peroxides indicate a good quality of oil and
a good preservation status. A suggested limit of peroxide value for quality and acceptability of
oils for human consumption is 8 meq/kg (Boran et al. 2006). The data reported in this work
demonstrated that cheeses cut with ultrasound were less susceptible to lipid peroxidation. This
may be due to the fact that the cut samples had less open/damaged surfaces and thus less
exposure to air/oxygen compared to those cut with a conventional cutting method.
3.3.4 Sensory evaluation
Table 3.6 show scores of visual evaluation on cheddar, Swiss and mozzarella cheeses
treated by ultrasound and w/o ultrasound on day 0 and day 21, respectively. The panel seemed to
like the colors of ultrasound cut cheeses slightly more than the control as can be seen by higher
scores for all ultrasonic cut cheeses. However, the differences in color scores between the
ultrasound cut cheeses and the control were not significantly different. Since visual color

24
evaluation is a measure of the overall liking of the individuals on the color of the cheeses, it is
understandable that it did not yield a significant difference among the treated samples while the
machine color readings in L values reported significant differences. This may be caused by the
fact that the visual color scores were from seven individual who may have different color
perception of cheese whereas the L values were from a single instrument and thus were with less
variation. Similarly, the differences among the treatments for other visual quality parameters,
i.e., odor, taste and overall acceptability were not statistically different, although slightly higher
scores were reported for the ultrasound cut samples. In addition, on days 0 and 21, no off-odor
was detected by panelists (n=7) for all 3 types of cheeses and treatments (control, with 30%,
40%, and 50% amplitude). The sensory scores of all three cheeses on day 21 were lower
compared to that on day 0, showing a quality degradation during the 3-week storage. Among the
samples, the lowest sensory scores for color, odor, taste, and overall acceptability were reported
in the Swiss cheese. The lower scores of Swiss cheese in the sensory tests may be a reflection of
the preferences of the panel among the cheese types rather than being an indication of the overall
quality the Swiss cheese among the three cheese types.
3.3.5 Surface topography and surface appearance
The surface topography of cheddar, Swiss and mozzarella cheeses cut with and without
ultrasound obtained by Zeiss SteREO is shown in Figure 3.2.
It can be seen that the surfaces of cheeses from ultrasonic cutting were smooth (Fig. 3.2a,
3.2c, and 3.2e), and that cut without ultrasound were rough (Fig. 3.2b, 3.2d, and 3.2f). Schneider
et al. (2011) observed the plastic deformation of cutting surfaces of some products such as short
pastry dough, hamburger bun, and multiple-layer bakery products were avoided with ultrasonic

25
cutting. In addition, a better quality of the cutting surface and less damaged product structure
was observed for yeast dumplings, hamburger buns, and whole-grain bread after ultrasonic
cutting (Zahn et al., 2005). It is known that ultrasonic cutting reduces the friction between the
blade and the product (i.e. cheese) (Feng and Yang, 2005) and thus less tearing and relocation of
the materials on cheese surfaces is expected. The relatively smooth surface of cheeses cut with
ultrasound can thus be attributed to the reduced friction and resistance to cutting. There is also a
difference among the 3 cheeses on their surface topography. The Swiss cheese samples exhibited
a much rougher surface topography compared to the others when observed with under a
magnification of 30. Cutting with ultrasound can cause a secondary effect, resulting in a rise of
cut surface temperature due to absorption of acoustic energy (Schneider et al., 2011). The small
“lumps” on the surface of Swiss cheese may be an indication of melting of the fat due to heat for
the fat fractions in Swiss cheese with a low melting point.
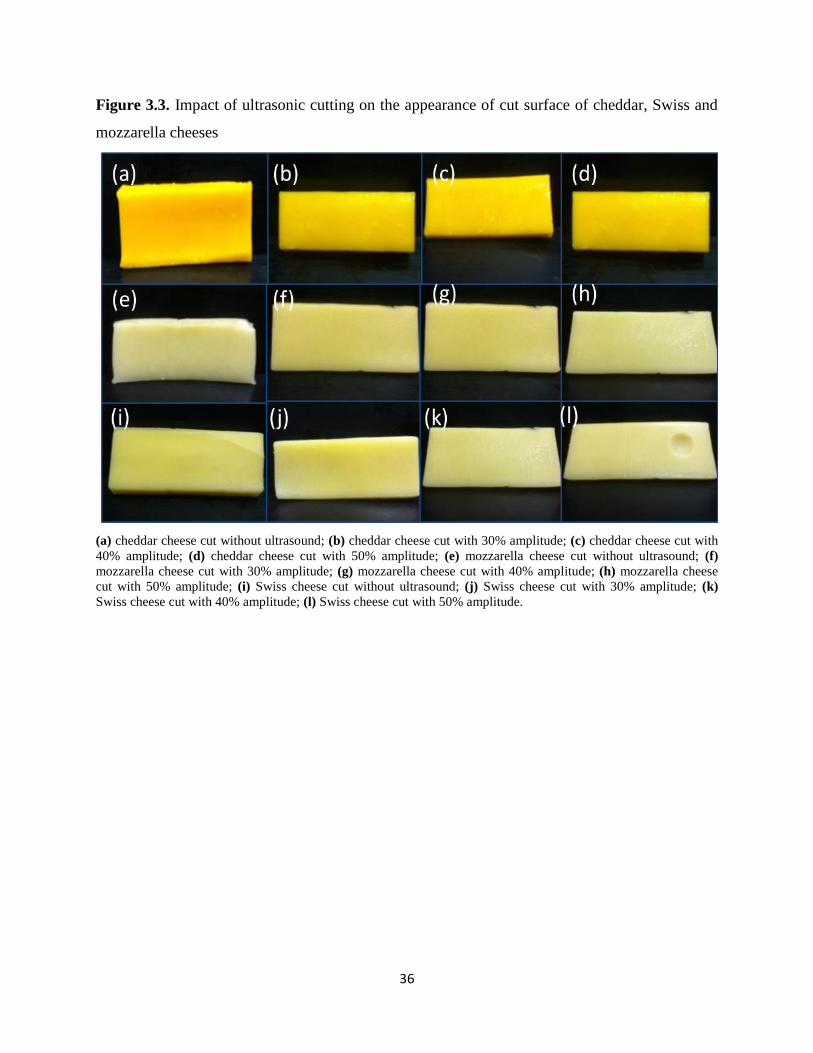
The impact of ultrasonic cutting on the appearance of cut surface of cheddar, Swiss and
mozzarella cheeses is shown in Figure 3.3. All cheeses cut with ultrasound showed shiny and
smooth surface, while the surfaces were less smooth for cheeses cut without ultrasound. An
overall color change among the three cheese types when the ultrasound amplitude increased from
0 to 50% can be observed in Fig. 3.3; the cheese turned to a whiter and less yellow color. This
observation was in good agreement with the Hunter L (lightness) readings, and was especially
true for Swiss cheeses cut with ultrasound. Sensory evaluations of panelists showed that people
liked the lighter color of cheeses and all types of cheeses cut with ultrasound were given higher
scores in color evaluation.

26
3.4 Conclusion
Cheese is a dynamic system; it continuously undergoes microbial, enzymatic and
chemical modifications. For cheddar, mozzarella, and Swiss cheese types, the focus of the
investigation was on quality changes of cheese samples cut with and without ultrasound during a
three-week storage period. General chemical parameters in ultrasonic cut samples such as lipid
oxidation as well as the pH-value showed significant differences. The ultrasonic cutting helped
to reduce lipid peroxidation, as shown by lower peroxide values in the ultrasound cut cheeses,
especially in the samples cut with 50% amplitude ultrasound. Even though for the fourteenth and
twenty-first days there was no significant differences between samples cut with and w/o
ultrasound, a decrease in PV was observed for the samples cut with ultrasound for all types of
cheeses. Moreover, a decrease in pH values was recorded for all types of cheeses cut with
ultrasound during three weeks. The pH values increased slightly with the storage time in all
samples (Cheddar, mozzarella, and Swiss) and all methods (0%, 30%, 40%, and 50% amplitude).
The lowest pH value was observed for the samples on day 0, and the highest pH value was
observed for the last (twenty-first) day samples. In addition, the L (lightness) values of samples
cut with ultrasound and w/o ultrasound showed significant differences. The L values increased
with an increase of ultrasound amplitude in all the samples, and the highest L value was observed
for the samples cut with 50% amplitude. The L values decreased slightly with the storage time in
all the samples (Cheddar, mozzarella, and Swiss) and all treatments (0%, 30%, 40%, and 50%
amplitude). The highest L value was observed for the samples on day 0, and the lowest L value
was observed for the last (twenty-first) day samples. Furthermore, all cheeses cut with ultrasound
showed shiny and smooth surface appearance, while the surfaces were relatively rough for

27
samples cut without ultrasound. The microscope images indicated that ultrasonic cutting resulted
in a smoother surface compared to the Control. In visual quality evaluation, the panel seemed to
like the colors of ultrasound cut cheeses slightly more than the control. However, the differences
in color scores between the ultrasound cut cheeses and the control were not significantly
different. Similarly, the differences among the treatments for other visual quality parameters, i.e.,
odor, taste and overall acceptability were not statistically different, although slightly higher
scores were reported for the ultrasound cut samples. In addition, on days 0 and 21, no off-odor
was detected by panelists (n=7) for all 3 types of cheeses and treatments (control, with 30%,
40%, and 50% amplitude). The sensory scores of all three cheeses on day 21 were lower
compared to that on day 0, showing quality degradation during a 3-week storage period. Overall,
cheeses cut with ultrasound showed a better quality during storage compared to the control.

28
3.5 Figures and Tables
Figure 3.1. Ultrasonic knife used for cutting tests (Sonics& Materials, Inc.)
Booster
Cutting horn
Power supply
Converter

29
Table 3.1. Changes in L (lightness) values for cheddar, Swiss and mozzarella cheeses treated
with ultrasound and w/o ultrasound during a three-week period
Sample and amplitude (%) L ( lightness) values
Day 0 Day 7 Day 14 Day 21
Cheddar cheese
0% amplitude 68.287c (x)
67.933b (x)
65.537b (x)
64.890b (x)
30% amplitude 69.703b (x)
68.777ab (x)
66.693b (x)
66.777b (x)
40% amplitude 70.363ab (x)
70.120a (x)
66.883b (x)
66.900b (x)
50% amplitude 70.750a (x)
70.263a (x)
68.857a (x)
68.230a (x)
Mozzarella cheese
0% amplitude 80.333b (x)
78.940b (x)
78.363b (x)
73.173b (x)
30% amplitude 80.563b(x)
78.963b (x)
78.067b (x)
76.640a (x)
40% amplitude 81.820a (x)
78.720b (x)
79.367b (x)
76.950a (x)
50% amplitude 82.243a (x)
81.097a (x)
80.967a (x)
77.380a (x)
Swiss cheese
0% amplitude 73.780c (x)
73.523b (x)
72.077c (x)
55.183b (y)
30% amplitude 75.883b (x)
75.450ab (x)
72.597bc (x)
71.870a (x)
40% amplitude 78.303a (x)
76.103a (x)
75.617ab (x)
73.623a (x)
50% amplitude 78.707a (x)
76.383a (x)
76.063a (x)
74.467a (x)
a-c Treatment means within treatments (columns) with the same letter in each sample are not significantly different
(p<0.05).
x-y Treatment means within time (rows) with the same letter in each sample are not significantly different (p<0.05).

30
Table 3.2. Changes in a (redness) values for cheddar, Swiss and mozzarella cheeses treated with
ultrasound and w/o ultrasound during a three-week period
Sample and amplitude (%) a (redness) values
Day 0 Day 7 Day 14 Day 21
Cheddar cheese
0% amplitude 11.843a (x)
12.567a (x)
12.817a (x)
13.827a (x)
30% amplitude 11.593a (x)
12.567a (x)
12.353a (x)
13.207a (x)
40% amplitude 11.520a (x)
12.567a (x)
12.800a (x)
13.421a (x)
50% amplitude 11.827a (x)
12.567a (x)
12.760a (x)
13.723a (x)
Mozzarella cheese
0% amplitude -5.280a (x)
-5.140
a (x) -5.100
a (x) -4.640
a (x)
30% amplitude -5.183a (x)
-5.117a (x)
-5.113a (x)
-4.530a (x)
30% amplitude -5.140a (x)
-5.114a (x)
-4.980a (x)
-4.530a (x)
30% amplitude -5.100a (x)
-5.053a (x)
-4.960a (x)
-4.600a (x)
Swiss cheese
0% amplitude -4.212a (x)
-4.098a (x)
-3.490a (x)
-3.360a (x)
30% amplitude -4.217a (x)
-4.185a (x)
-3.560a (x)
-3.412a (x)
40% amplitude -4.243a (x)
-4.183a (x)
-3.580a (x)
-3.400
a (x)
50% amplitude -4.470a (x)
-4.087a (x)
-3.580a (x)
-3.352a (x)
a Treatment means within treatments (columns) with the same letter in each sample are not significantly different
(p<0.05).
x Treatment means within time (rows) with the same letter in each sample are not significantly different (p<0.05).

31
Table 3.3. Changes in b (yellowness) values for cheddar, Swiss and mozzarella cheeses treated
with ultrasound and w/o ultrasound during a three-week period
Sample and amplitude (%) b (yellowness) values
Day 0 Day 7 Day 14 Day 21
Cheddar cheese
0% amplitude 54.897a (x)
56.567a (x)
59.540a (x)
59.800a (x)
30% amplitude 56.707a (x)
56.823a (x)
59.540
a (x)
59.730
a (x)
40% amplitude 55.363a (x)
55.800a (x)
59.540a (x)
60.067a (x)
50% amplitude 55.927a (x)
56.650a (x)
59.540a (x)
60.067a (x)
Mozzarella cheese
0% amplitude 21.003a (x)
21.453a (x)
23.693a (x)
24.470a (x)
30% amplitude 21.290a (x)
21.633a (x)
23.633a (x)
25.150a (x)
40% amplitude 21.297a (x)
21.830a (x)
23.047a (x)
25.153
a (x)
50% amplitude 21.800a (x)
21.930a (x)
23.100a (x)
24.470a (x)
Swiss cheese
0% amplitude 26.770a (x)
29.010a (x)
30.093a (x)
30.981a (x)
30% amplitude 26.407a (x)
29.221a (x)
29.033a (x)
31.190a (x)
40% amplitude 26.400a (x)
29.220a (x)
29.173a (x)
31.190a (x)
50% amplitude 26.120a (x)
29.080a (x)
28.863a (x)
31.713a (x)
a Treatment means within treatments (columns) with the same letter in each sample are not significantly different
(p<0.05).
x Treatment means within time (rows) with the same letter in each sample are not significantly different (p<0.05).

32
Table 3.4. Changes in pH for cheddar, Swiss and mozzarella cheeses treated with ultrasound and
w/o ultrasound during a three-week period
Sample Treatment Amplitude pH changes
Day 0 Day 7 Day 14 Day 21
Cheddar cheese cut w/o ultrasound 0% 6.07a (x)
5.97a (x)
6.03a (x)
6.08a (x)
cut with ultrasound 30% 5.87b (x)
5.88ab (x)
5.81b (x)
6.05a (x)
cut with ultrasound 40% 5.84b (x)
5.84b (x)
5.75bc (x)
6.02a (x)
cut with ultrasound 50% 5.63c (x)
5.78b (x)
5.71c (x)
5.90b (x)
Mozzarella cheese cut w/o ultrasound 0% 5.86a (x)
5.86a (x)
5.93a (x)
5.93a (x)
cut with ultrasound 30% 5.84ab (x)
5.73ab (x)
5.88ab (x)
5.88a (x)
cut with ultrasound 40% 5.80ab (x)
5.71ab (x)
5.84ab (x)
5.82b (x)
cut with ultrasound 50% 5.78b (x)
5.60b (x)
5.78b (x)
5.79b (x)
Swiss cheese cut w/o ultrasound 0% 5.98a (x)
5.94a (x)
5.95a (x)
5.98a (x)
cut with ultrasound 30% 5.85b (x)
5.81b (x)
5.82b (x)
5.87b (x)
cut with ultrasound 40% 5.84b (x)
5.79b (x)
5.81b (x)
5.85b (x)
cut with ultrasound 50% 5.82b (x)
5.77b (x)
5.65c (x)
5.84c (x)
a-c Treatment means within treatments (columns) with the same letter in each sample are not significantly different
(p<0.05).
x Treatment means within time (rows) with the same letter in each sample are not significantly different (p<0.05).

33
Table 3.5. Peroxide values for cheddar, Swiss and mozzarella cheeses treated with ultrasound
and w/o ultrasound during a three-week period
Sample Treatment Amplitude Peroxide values (meq/kg)
Day 0 Day 7 Day 14 Day 21
Cheddar cheese cut w/o ultrasound 0% Nd
4.5a (z)
8a (y)
11a (x)
cut with ultrasound 30% Nd 4ab (z)
8a (y)
11a (x)
cut with ultrasound 40% Nd
3b (z)
7a (y)
10a (x)
cut with ultrasound 50% Nd
3b (z)
5
a (y) 10
a (x)
Mozzarella cheese cut w/o ultrasound 0% Nd
3.5a (z)
6a (y)
9a (x)
cut with ultrasound 30% Nd 3ab (z)
6a (y)
8a (x)
cut with ultrasound 40% Nd
2.5ab (z)
5a (y)
8a (x)
cut with ultrasound 50% Nd
2b (z)
5a (y)
7.5a (x)
Swiss cheese cut w/o ultrasound 0% Nd
5a (z)
8a (y)
13a (x)
cut with ultrasound 30% Nd 4.5a (z)
7a (y)
12a (x)
cut with ultrasound 40% Nd
4a (z)
7a (y)
10a (x)
cut with ultrasound 50% Nd
3b (z)
7a (y)
10a (x)
a-b Treatment means within treatments (columns) with the same letter in each sample are not significantly different
(p<0.05).
x-z Treatment means within time (rows) with the same letter in each sample are not significantly different (p<0.05).
Nd: Not detected

34
Table 3.6. Sensory attributes changes for cheddar, Swiss and mozzarella cheeses treated with
ultrasound and w/o ultrasound during a three-week period
Amplitude (%) Color Odor Taste Overall acceptability
Day 0 Day 21 Day 0 Day 21 Day 0 Day 21 Day 0 Day 21
Cheddar cheese
0% amplitude 6.00a (x)
5.57a (x)
5.57a (x)
5.50a (x)
6.00a (x)
5.79a (x)
6.07a (x)
5.79a (x)
30% amplitude 6.14a (x)
5.71a (x)
5.71a (x)
5.50a (x)
6.00a (x)
5.86a (x)
6.07a (x)
5.93a (x)
40% amplitude 6.07a (x)
5.64a (x)
5.71a (x)
5.57a (x)
6.14a (x)
5.93a (x)
6.14a (x)
5.93a (x)
50% amplitude 6.29a (x)
6.00a (x)
5.71a (x)
5.57a (x)
6.14a (x)
5.93a (x)
6.21a (x)
6.00a (x)
Mozzarella cheese
0% amplitude 5.57a (x)
5.57a (x)
6.00a (x)
5.57a (x)
5.71a (x)
5.50a (x)
5.86a (x)
5.57a (x)
30% amplitude 5.71a (x)
5.64a (x)
6.00a (x)
5.86a (x)
5.71a (x)
5.57a (x)
5.93a (x)
5.57a (x)
40% amplitude 5.86a (x)
5.57a (x)
6.00a (x)
5.86a (x)
5.79a (x)
5.57a (x)
5.93a (x)
5.64a (x)
50% amplitude 6.00a (x)
5.71a (x)
6.14a (x)
6.00a (x)
5.86a (x)
5.64a (x)
6.00a (x)
5.64a (x)
Swiss cheese
0% amplitude 5.14a (x)
4.71a (y)
5.29a (x)
5.21a (x)
5.14a (x)
3.86a (y)
5.36a (x)
4.79a (y)
30% amplitude 5.29a (x)
4.79a (y)
5.50a (x)
5.29a (x)
5.29a (x)
4.00a (y)
5.36a (x)
4.79a (y)
40% amplitude 5.50a (x)
4.71a (y)
5.50a (x)
5.29a (x)
5.14a (x)
4.14a (y)
5.43a (x)
4.79a (y)
50% amplitude 5.71a (x)
4.93a (y)
5.64a (x)
5.50a (x)
5.29a (x)
4.14a (y)
5.50a (x)
4.86a (y)
a Treatment means within treatments (columns) with the same letter in each sample are not significantly different
(p<0.05).
x-y Treatment means within time (rows) with the same letter in each sample are not significantly different (p<0.05).
* On days 0 and 21, no off-odor was detected by panelists (n=7) for all 3 types of cheeses and treatments (control,
with 30%, 40%, and 50% amplitude).

35
Figure 3.2. Surface topography of cheddar, Swiss and mozzarella cheeses cut with and without
ultrasound
(a) cheddar cheese cut with ultrasound (50% amplitude-30x magnification); (b) cheddar cheese cut without
ultrasound (30x magnification); (c) mozzarella cheese cut with ultrasound (50%amplitude-30x magnification); (d)
mozzarella cheese cut without ultrasound (30x magnification); (e) Swiss cheese cut with ultrasound (50%amplitude-
30x magnification); (f) Swiss cheese cut without ultrasound (30x magnification).
36
Figure 3.3. Impact of ultrasonic cutting on the appearance of cut surface of cheddar, Swiss and
mozzarella cheeses
(a) cheddar cheese cut without ultrasound; (b) cheddar cheese cut with 30% amplitude; (c) cheddar cheese cut with
40% amplitude; (d) cheddar cheese cut with 50% amplitude; (e) mozzarella cheese cut without ultrasound; (f)
mozzarella cheese cut with 30% amplitude; (g) mozzarella cheese cut with 40% amplitude; (h) mozzarella cheese
cut with 50% amplitude; (i) Swiss cheese cut without ultrasound; (j) Swiss cheese cut with 30% amplitude; (k)
Swiss cheese cut with 40% amplitude; (l) Swiss cheese cut with 50% amplitude.

37
CHAPTER 4
ULTRASONIC CUTTING OF RED DELICIOUS AND GOLDEN DELICIOUS APPLES
– EFFECT ON QUALITY ATTRIBUTES DURING STORAGE
4.1 Introduction
The fresh-cut fruit and vegetable market has grown rapidly in recent years due to
consumers’ demand for fresh, convenient and nutritious foods (Luo et al., 2011). Currently,
ready-to-eat sliced apples have been distributed to fast-food and grocery chains and also
approved for school lunch programs in the US. However, the production of fresh-cut fruits and
vegetables are facing two challenges, one is the preservation of their quality during storage and
the other is microbial safety. The major quality problem of minimally processes apples is
enzymatic browning (Kim et al., 1993). The cells of apples and other products such as pears,
bananas, peaches, potatoes contain an enzyme called polyphenol oxidase (PPO) or tyrosinase.
When the enzyme is in contact with oxygen, it causes biochemical conversion of plant phenolic
compounds to brown pigments known as melanins. The browning can be seen when the fruit is
cut or bruised because these actions damage the cells and allow oxygen in the air to react with
the enzyme and other chemicals. This reaction occurs at warm temperatures when the pH of the
plant tissues is between 5.0 and 7.0. Enzymatic browning also speeds up by the presence of irons
from a rusted knife or copper bowl. Portela and Cantwell (2001) showed that cutting melon
pieces with a blunt blade resulted in increased ethanol concentrations and off-odors compared to
the melon pieces cut with a sharp blade. In a similar way, carrots cut with sharp cutting blades

38
showed reduced softening and microbial growth (Bolin and Huxsoll, 1991; Barry-Ryan and
O’Beirne, 1998). On the other hand, there are several ways to prevent the browning. For
example, the reaction can be slowed or prevented by inactivating the enzyme with heat, reducing
the pH on the surface of the fruit (by adding lemon juice or another acids), reducing the amount
of available oxygen (by putting cut fruit under water or vacuum packing it), or by adding certain
preservative chemicals (like sulfur dioxide). Studies have been conducted to develop strategies to
prevent enzymatic browning. Apple slices were packaged by different modified atmosphere
(N2/CO2) methods at 0 °C by Annese et al. (1997). However, the methods were not effective; the
high phenolic contents in fresh-cut apples and pears seemed to have decreased the effectiveness
of high CO2 packaging. Gorny (1997) concluded that the reduction of O2 levels to near 0% was
necessary to prevent polyphenol oxidase (PPO) browning of many fresh-cut fruits. Another
approach is using reducing agents such as ascorbic acid or sodium erythorbate (isoascorbate) to
prevent the browning of apple slices (Sapers et al., 1990).
Because of the advantages associated with ultrasonic cutting, this new cutting method has
been proposed for cutting of fresh produce by the industry and academia. It is expected that
cutting produce with ultrasound will help to resolve the current problems facing the industry and
may also provide improved product quality. To the best of our knowledge, there is no
documented research that has explored cutting apples or other produce with an ultrasonic device.
The purpose of this pilot project was to test the concept of cutting apples with an ultrasonic knife
with a focus on the effect of cutting on the quality of cut apples. Specifically, the effects of
ultrasound amplitude on the surface appearance and selected quality indexes of two apple
varieties right after cutting and during 2-week storage at refrigeration temperature were
examined. Polyphenol oxidase (PPO) activities, the enzyme responsible for post-harvest

39
browning, of red delicious and golden delicious apples cut with and without ultrasound were
compared. Color changes, pH, surface morphology (determined with an Environmental scanning
electron microscope) of the samples were measured. A sensory study was conducted to discern
potential changes of the cut apples during 2 weeks. Finally, the PPO activity of the apple samples
treated by a CaA solution were measured during storage.
4.2 Materials and Methods
4.2.1 Sample preparation
Red delicious and golden delicious apples were chosen for this study because of their
popularity and rapid browning of cut pieces. The red delicious apples are especially
susceptibility to browning. Red delicious and golden delicious apples (Washington Apple
Commission) were purchased from a local market in Springfield, IL. Ultrasonic knife was
provided by Sonics& Materials, Inc. (Fig.3.1). All apples were cut without (Control) and with
ultrasound at three amplitudes (30%, 40%, 50%) by avoiding the core with an ultrasonic knife.
Cut apples were placed into the polyethylene bags and kept in the refrigerated conditions (0-4
0C) for two weeks with samples taken for analysis at the 0, seventh and fourteenth days.
4.2.2 Color measurement
Colors of the sample surfaces were measured with a Minolta Chroma Meter CR-300
(Minolta Camera Co. Ltd., Osaka, Japan) by directly holding the device vertically to the surface
of the samples. The color meter was calibrated with a white standard plate. The numerical values
of the color readings were expressed by the lightness (L), redness (a, ±red-green) and yellowness

40
(b, ±yellow-blue). For each samples color values (L, a, and b) were read 5 times at different
locations on the sample surface (one reading was from the center, one from the left-top side, one
from the right-top side, one from the left-bottom, and one from right-bottom of the sample) at
room temperature. Then these values were averaged, and only one number was obtained for L, a,
and b values. For color analysis, 3 replications were used. Color analysis was done for the 0,
seventh and fourteenth days.
4.2.3 pH
Two grams of apple pieces (obtained from the apple surface using a knife) and 30 ml of
deionized distilled water (DDW) were homogenized for 15 seconds using an Osterizer 12 speed
blender (450 W) (Kim et al., 2010). The pH changes of the homogenate were measured using an
Accumet Research AR15 pH meter (Fisher Scientific, USA). pH analysis was done in triplicates
on the 0, seventh and fourteenth days.
4.2.4 PPO activity analysis
The method proposed by Montgomery and Sgarbieri (1975) was followed to determine
polyphenol oxidase (PPO) activity in the apple samples using an Infinite M200 microplate
spectrophotometer (Tecan). Thirty grams of tissue (from 3 apple surfaces - each slices about 1
cm thick) using were homogenized using an Osterizer 12 speed blender (450 W) in 0.2 g
polyvinylpolypirrolidone (PVPP) and 70 mL of 0.5 M phosphate buffer (pH 6.8) for 50 seconds.
The homogenate was filtered through filter paper (Whatman No. 41) under vacuum to remove
cellular debris. The clear supernatant after centrifugation at 12000 rpm (16,099 X g) (Sorvall

41
Instruments Model RC5C centrifuge, SM10 rotor) for 15 minutes at 4 oC was collected as
enzyme extracts.
Two milliliters of phosphate buffer (0.05 M) stored in the refrigerator at 4 0C and 0.5 mL
enzyme extract were added to a glass tube. Before the reading, 0.5 mL catechol (0.02 M)
prepared fresh daily was added to the mixture. The mixture was poured into cuvettes and
inserted in a plate reader (TECAN-infinite M200). The increase in absorbance was read over 3
minutes in every 15 seconds at 420 nm. PPO activity was reported as “U/mL” according to
formula proposed by Cemeroglu (2007). PPO activity analysis was done for the first (after 24
hours later), seventh and fourteenth days.
The absorbance (420 nm) of the assay solution was plotted against the reaction time (180
s) to demonstrate the enzyme kinetics. Slope of the absorbance vs. time curve was calculated,
and the result was reported as a “unit/FW”. Since one unit of enzyme activity is defined as the
amount enzyme causing a change in absorbance of 0.001 per minute (Yue-Ming, et al. 1997), the
data was divided by 0.001 and PPO activity was reported as “U/mL” according to formula
proposed by Cemeroglu (2007) (1).
(1)
where E is the slope of the absorbance vs. time curve, 0.001 is a constant value (using for
converting abs/min to unit), He is the volume of the enzyme extract in the reaction mixture (mL),
Hrk is the total volume of the reaction mixture (mL), and Sf is a dilution factor.
4.2.5 Sensory analysis
Panelists (n =10) were used to evaluate sensory properties of the apples treated with and
without ultrasound. The sensory parameters were color, odor, overall acceptability, and off-odor.

42
A 9 point hedonic scale was provided to the panelists as follows: like extremely (9), like very
much (8), like moderately (7), like slightly (6), neither like nor dislike (5), dislike slightly (4),
dislike moderately (3), dislike very much (2), and dislike extremely (1). For off-odor, no off-odor
(1) and very strong off-odor (9) were provided. The form that used to evaluate the sensory
properties of apples treated with ultrasound and w/o ultrasound is shown in the Fig. 4.1. Sensory
analysis was done on the first (24 hours later), seventh and fourteenth days.
4.2.6 Surface appearance and surface morphology
Photos of red delicious and golden delicious apples cut with and without ultrasound were
taken by a camera (Sony Cyber-Shot DSC-W570 16.1 MP Digital Still Camera). Surface
morphology of the samples was obtained using an Environmental scanning electron microscope
(ESEM). In order to determine surface profile, samples cut with and without ultrasound in four
pieces equally from the center and one piece of them was taken for the surface analysis. After the
placement of the specimens in the microscope, the images of surface morphology of red
delicious and golden delicious apples were obtained with the microscope (D8.7, magnification:
40x, 2 mm, and D4.8, magnification: 100x, 1mm).
4.2.7 Calcium ascorbate (CaA) application
To prevent PPO browning on the apples, calcium ascorbate (Ca-A, SIGMA-ALDRICH,
Inc.) solution was used and effect of CaA on browning were compared with ultrasonic cutting
and without ultrasonic cutting. After cutting, the apple slices were dipped into solutions of 1%
CaA for 3 minutes, drained with towel, placed into the polyethylene bags, and kept under the
refrigerated conditions (0-4 0C). At the end of the first day (24 hours later), cut surface PPO

43
activity (cut with 50% amplitude) were evaluated and combined with CaA treatment were
measured. For the seventh and fourteenth days PPO activity of samples were also evaluated.
4.2.8 Statistical analysis
The results were analyzed statistically by analysis of variance using the General Linear
Models (PROC GLM) procedure in SAS (version 9.3, SAS Institute, Inc., Cary, North Carolina,
USA). The results analyzed were obtained in triplicate, unless otherwise stated. Differences
among the mean values were obtained by Fisher's least significant difference (LSD) test at
alpha=0.05.
4.3 Results and Discussion
4.3.1 Color changes
The color changes of the red delicious and golden delicious apples cut with and w/o
ultrasound are shown in Tables 4.1, 4.2, and 4.3. The L (lightness) values of ultrasound-cut
apples for both types (red delicious and golden delicious) were significantly higher than the
control during two weeks. The L values increased with an increase of ultrasound amplitude in
both samples, and the highest L values were observed for the samples cut with 50% amplitude.
No significant changes were observed between apples cut with ultrasound and w/o ultrasound in
their a (redness) and b (yellowness) values during two weeks. The L values decreased
significantly with the storage time in both apples and all treatments (0%, 30%, 40%, and 50%
amplitude). The highest L value was observed for the 0 day samples, and the lowest L value was

44
observed for the last (second) week samples. When comparing the a (redness) values of the
apples during storage, a significant increase were observed. While the lowest a values were
observed on day 0 (both types of apples and all the treatments), the highest a values were
observed on day 14. Similarly, when b (yellowness) values of samples compared during storage,
they significantly increased with the storage time in all samples. While the lowest b values were
observed on day 0 (both types of apples and methods as well), the highest b values were
observed on day 14. An increase in redness (a) and yellowness (b) values, and a decrease in
lightness (L) values indicated an increased enzymatic browning in all cut apples during storage.
Pérez-Gago et al. (2005) also reported similar results where color changes of apple pieces were
featured by a decrease in L (lightness) values, and increase in a (redness) and b (yellowness)
values during the storage.
Fresh-cut products should have a bright surface color and be free of decay. Appearance
characteristics can be measured subjectively by using naked eyes or objectively by using the
specific instruments. For visual evaluation, color charts may be used as references but results
may be affected by human error and evaluation conditions such as type of lighting. Several
authors employed subjective rating scales to evaluate general appearance of fresh-cut produce
such as peaches and nectarines (Gorny et al., 1999; Aguayo et al., 2006; Amodio & Colelli,
2008), and vegetable mix (Amodio et al., 2006). Kader and Cantwell (2004) used rating scales
and color charts to evaluate the appearance of both whole and fresh-cut produce.
In this study, sensory panelists showed that there were significantly differences between
their color evaluations’ of samples cut with and w/o ultrasound. They liked the color of apples
cut with ultrasound compared to the apples cut without ultrasound. Usually, an increase in L
(lightness) value shows the development of whiteness in samples, and a decrease in this

45
parameter is correlated with the development of browning (Rico et al., 2007). Since the apples
cut without ultrasound had lower L values, the browning development on the apple surface was
more obvious when compared to those cut with ultrasound. The PPO activity measurement of the
fresh-cut apples supported the claim that the browning development on the apple surface cut
without ultrasound since the samples cut with ultrasound had lower PPO activity compared to the
control. During peeling and cutting operations, if the equipment used is not in the best condition,
for example, if dull knives and blades are used, damage occurs in more tissue layers than
intended; thus, the sharpness of knife blades can significantly affect product storage life (Bolin et
al., 1977). In addition, the browning can be seen when the product is cut because these actions
damage the cells in/on the food and allow oxygen in the air to react with the enzyme and other
chemicals. The unit operations such as peeling and slicing during processing result in the
destruction of surface cells (Brecht, 1995). By applying ultrasonic knife, less damage was
observed on the apples’ surface. Thus, samples cut with ultrasound were less susceptible to
browning development. Additionally, apples cut with ultrasound were exposed to the air less
time due to the ultrasonic knife made the cutting process faster. The contact time between knife
and the apples during cutting for the samples cut with 50% amplitude was: 1.8 seconds while it
was 2.4 seconds for the samples cut w/o ultrasound.
4.3.2 pH changes
The pH changes measured of red delicious and golden delicious treated with and without
ultrasound are shown in Table 4.4. The pH values of the red delicious were in the range of 4.10
to 4.20 in day 0, and were from 3.84 to 3.98 for the golden delicious. The pH of red delicious
apple ranged from 4.16 to 4.29 in day 7, and that for golden delicious was 3.90 to 4.05. On day

46
14, the ranges of pH were from 4.38 to 4.64 for red delicious, from 3.98 to 4.14 for golden
delicious. The pH values of the red delicious and golden delicious apple were affected by
ultrasound cutting and a significant decrease in pH values was recorded for both types of apples
cut with ultrasound during two weeks. Kim et al. (1993) indicated that compared to other
compounds acids are used during respiration quickly. This decrease in pH values might be
related to increased respiration rates following cutting process. The pH values were increased
significantly with the storage time in both samples (red delicious and golden delicious) and all
treatments (0%, 30%, 40%, and 50% amplitude) probably due to the buffering capacity of the
apple tissue. The lowest pH value was observed for the 0 day samples, and the highest pH value
was observed for the last (second) week samples.
While the optimum PPO has been reported as ranging from acid to neutral, little PPO
activity is detected below pH 4.5 in most fruits and vegetables (Whitaker, 1994). However,
apple and grape PPO have broad acidic pH optima with the values between pH 3.5 to 4.5 (Valero
et. al., 1988; Marques et. al., 1995). It has also been reported that irreversible inactivation of
PPO might be achieved below 3.0 (Richardson& Hyslop, 1985). On the other hand, it has also
been reported that apple PPO is tolerant to acidity. It retains 40% of its maximum activity at pH
3.0 (Nicolas et al., 1994). The optimal pH values of the two apples used in this study were not
determined. But from literature data mentioned above, the changes in pH caused by ultrasonic
cutting may have several positive implications such as low activity of polyphenol oxidases in
these ranges of pH and reduced microbiological development which will contribute to the
preservation of the apple (Frazier & Westhoff, 1988).

47
4.3.3 PPO activity
The PPO activities of red delicious and golden delicious apples treated with and w/o
ultrasound are shown in Table 4.5. The PPO activities of the red delicious were in the range of
360 to 792 U/mL on day 1, and they were from 288 to 684 U/mL for golden delicious. On day 7,
the PPO activities of the red delicious were in the range of 432 to 828 U/mL, and those for the
golden delicious were from 360 to 720 U/mL. The PPO activities of the red delicious were in the
range of 504 to 864 U/mL on the fourteenth day, and they were from 432 to 756 U/mL for
golden delicious. The ultrasound cutting affected the PPO activities during two weeks and a
significant decrease in the PPO activity was recorded for samples cut with ultrasound. The PPO
activities increased with the storage time. While the first day PPO activities of the samples were
low, they were increased when measured on the seventh and fourteenth day. The highest PPO
activities occurred in the second week samples. It was observed that red delicious samples had a
higher PPO activity compared to golden delicious. Sensory evaluation by the panelists supported
the result. The panelists evaluated the apples color according to the browning on the apple slices
and gave higher scores to samples cut with ultrasound for both types of apples. In addition, they
gave higher color scores to the golden delicious rather than the red delicious which supported the
claim that red delicious had higher PPO activities compared to the golden delicious.
Fresh-cut process creates wounding on fruits, and thus increases metabolic activities
which may cause browning, softening, decay, and off-flavor development (Watada et al., 1990;
Varoquax and Wiley, 1994). There are several factors affecting the wounding of fruits. For
example, the number of cuts, the severity of the cutting treatments, and the sharpness of cutting
blades all influence the extent of wounding. Portela and Cantwell (2001) showed that cutting
melon pieces with a blunt blade showed increased ethanol concentrations and off-odors

48
compared to melon pieces cut with a sharp blade. In a similar way, cutting with sharp blades
showed reduced softening and microbial growth in fresh-cut carrots (Bolin and Huxsoll, 1991;
Barry-Ryan and O’Beirne, 1998). The unit operations such as peeling and slicing result in the
destruction of surface cells (Brecht, 1995) and removal of natural barriers such as skins in the
case of fruits which causes water loss and deterioration (Altekruse et al., 1997; Agar et al.,
1999). It also leads to an increase in respiration rate and ethylene production (Saltveit, 1997;
Saltveit et al., 2005). Furthermore, reaction between phenols and PPO causes browning
discoloration (Martinez and Whitaker, 1995; Heaton and Marangoni, 1996).
Cutting apples with ultrasound produced less damage on the cut apple surfaces. Thus,
samples cut with ultrasound were less susceptible to browning development since they had less
open/damaged surfaces that exposed to air/oxygen. Besides the differences shown in color
readings and PPO activity measurements among the samples cut with and without ultrasound,
this is also evidenced by the sensory test. The sensory (color) scores showed that people were
favor of the color of apples cut with ultrasound.
4.3.4 Surface morphology and surface appearance
The Environmental Scanning Electron Microscope (ESEM) images of the surface
morphology of red delicious apples treated by ultrasound and w/o ultrasound are shown in Figure
4.2. It can be seen from the ESEM images that the samples cut by ultrasound exhibited a dense
and relatively smooth surface morphology with less cell damage. In contrary, the surface cut
without ultrasound was rugged with more cells tore open. In addition, a macro-crack with a
longitudinal dimension of a few millimeters can be seen on the surface. Obviously, the apple cut

49
without ultrasound had more surfaces and damaged cells exposed to the air which may lead to
more enzymatic browning and quality degradation.
The surface pictures of ultrasonic cut red delicious and golden delicious are shown in
Figure 4.3. Both types of apples cut with ultrasound showed smooth surface appearance, while
the surfaces were rough for samples cut without ultrasound. The samples cut without ultrasound
had a darker color compared to the ultrasound cut especially for the golden delicious apple. This
is in agreement with the Hunter L (lightness) readings where both types of apples cut with
ultrasound had significantly higher L values compared to the control. Color scores given by the
panelists showed that they were favor of the samples cut with ultrasound compared to the
control. Appearance plays a significant role influencing consumer’s perception and subsequent
acceptance of a food product. Appearance ranks first affected consumer purchase preferences
(Lund and Snowdon, 2000). It is possible to predict that people will be favor of purchasing
apples cut with ultrasound rather than apples cut w/o ultrasound since they have less deformation
on the surface and preferable color.
4.3.5 Sensory evaluation
Table 4.6 shows the sensory scores of red delicious and golden delicious treated with
ultrasound and w/o ultrasound during two weeks. The observations on color indicated that there
was a significant difference between the samples cut with and w/o ultrasound for both types of
apples. It seems that the changes of in lightness (L value) were also recognized by the panelists.
Significant differences between the control and ultrasound cut samples were also observed in
odor and overall acceptability evaluation of both type of apple samples on the first, seventh and
fourteenth days. In addition, on day 1, there is no off-odor was observed by panelists (n=10) for
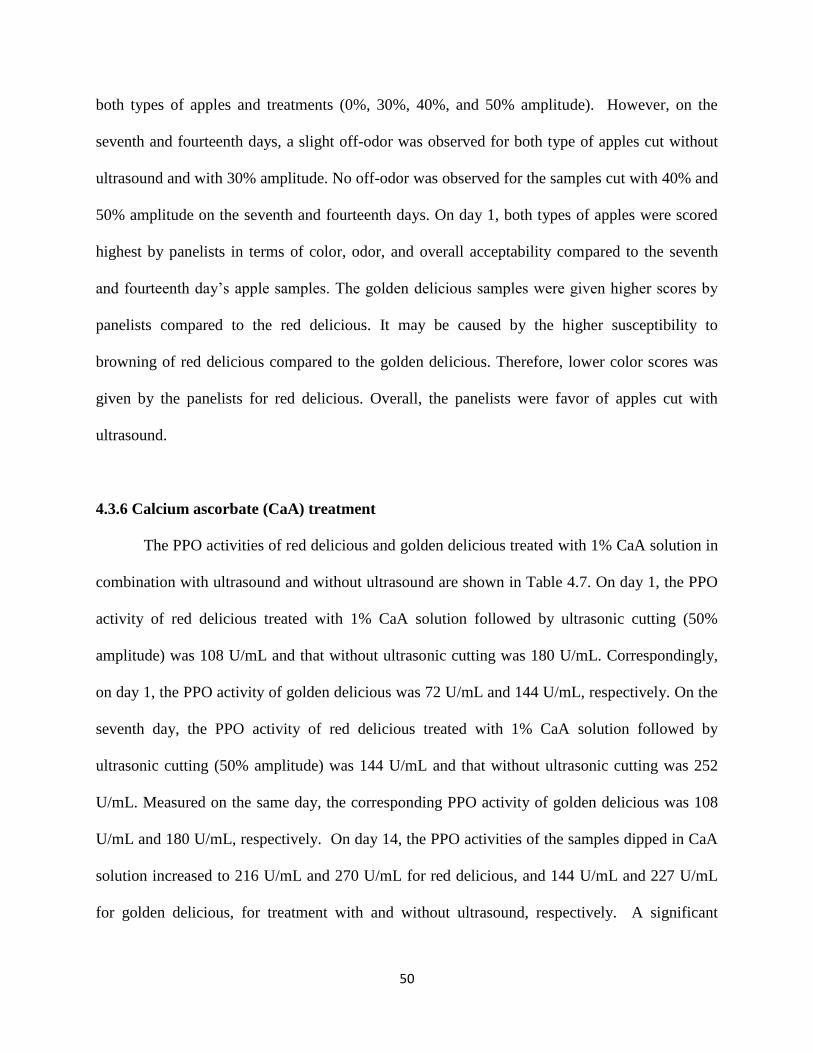
50
both types of apples and treatments (0%, 30%, 40%, and 50% amplitude). However, on the
seventh and fourteenth days, a slight off-odor was observed for both type of apples cut without
ultrasound and with 30% amplitude. No off-odor was observed for the samples cut with 40% and
50% amplitude on the seventh and fourteenth days. On day 1, both types of apples were scored
highest by panelists in terms of color, odor, and overall acceptability compared to the seventh
and fourteenth day’s apple samples. The golden delicious samples were given higher scores by
panelists compared to the red delicious. It may be caused by the higher susceptibility to
browning of red delicious compared to the golden delicious. Therefore, lower color scores was
given by the panelists for red delicious. Overall, the panelists were favor of apples cut with
ultrasound.
4.3.6 Calcium ascorbate (CaA) treatment
The PPO activities of red delicious and golden delicious treated with 1% CaA solution in
combination with ultrasound and without ultrasound are shown in Table 4.7. On day 1, the PPO
activity of red delicious treated with 1% CaA solution followed by ultrasonic cutting (50%
amplitude) was 108 U/mL and that without ultrasonic cutting was 180 U/mL. Correspondingly,
on day 1, the PPO activity of golden delicious was 72 U/mL and 144 U/mL, respectively. On the
seventh day, the PPO activity of red delicious treated with 1% CaA solution followed by
ultrasonic cutting (50% amplitude) was 144 U/mL and that without ultrasonic cutting was 252
U/mL. Measured on the same day, the corresponding PPO activity of golden delicious was 108
U/mL and 180 U/mL, respectively. On day 14, the PPO activities of the samples dipped in CaA
solution increased to 216 U/mL and 270 U/mL for red delicious, and 144 U/mL and 227 U/mL
for golden delicious, for treatment with and without ultrasound, respectively. A significant

51
decrease in PPO activity was recorded for samples treated with CaA solution (1%). The lowest
PPO activity among the samples was found in the samples treated by CaA solution and cut with
ultrasound. On the other hand, apples cut without ultrasound and no CaA application had the
highest PPO activity. PPO activities of all samples were increased with the storage time. While
the first day PPO activities of samples were low, they were increased for the seventh and
fourteenth day. It was observed that red delicious samples had a higher PPO activity compared to
golden delicious.
Enzymatic browning can be slowed or prevented by inactivating the enzyme with heat
(cooking), reducing the pH on the surface of the fruit (by adding lemon juice or another acids),
reducing the reaction rate by storing the fruit in the refrigerator, reducing the amount of available
oxygen (by putting cut fruit under water or vacuum packing it), or by adding certain preservative
chemicals (like sulfur dioxide). Several studies have been done to control extent of browning.
One of the approaches to prevent the browning of apple slices is that using reducing agents such
as ascorbic acid or sodium erythorbate (isoascorbate) (Sapers et al., 1990). In this study, calcium
ascorbate was used to prevent/slow down the browning of apple slices. The combination of CaA
treatment in combination with ultrasonic cutting yielded the best result showing less browning
and optimum quality of fresh-cut apples.
4.4 Conclusion
Ultrasonic cutting of apples significantly affected chemical parameters such as
polyphenol oxidase (PPO) and pH-value showed. The ultrasound cutting affected the polyphenol
oxidase (PPO) activities during two weeks and a significant decrease in the PPO activity was

52
recorded for samples cut with ultrasound. The PPO activities increased with the storage time.
While the first day PPO activities of the samples were low, they were increased when measured
on the seventh and fourteenth day. The highest PPO activities occurred in the second week
samples. It was observed that red delicious samples had a higher PPO activity compared to
golden delicious. The pH values of the red delicious and golden delicious apple were affected by
ultrasound cutting and a significant decrease in pH values was recorded for both types of apples
cut with ultrasound during two weeks. The pH values were increased significantly with the
storage time in both samples (red delicious and golden delicious) and all treatments (0%, 30%,
40%, and 50% amplitude). The lowest pH value was observed for the 0 day samples, and the
highest pH value was observed for the last (second) week samples. The samples cut with
ultrasound exhibited a significantly higher L (lightness) value compared to that cut without
ultrasound. The L values increased with an increase of ultrasound amplitude in both samples, and
the highest L values were observed for the samples cut with 50% amplitude. Furthermore, both
types of apples cut with ultrasound showed smooth surface appearance, while the surfaces were
rough for samples cut without ultrasound. ESEM images that the samples cut by ultrasound
exhibited a dense and relatively smooth surface morphology with less cell damage. On the other
hand, the surface cut without ultrasound was rugged with more cells tore open. In visual quality
evaluation, panelists showed higher liking of apples cut with ultrasound. Overall, apples cut
with ultrasound showed a better quality during storage compared to the control, as evidenced by
both measurements with instruments and scores of sensory evaluation.

53
4.5 Figures and Tables
Name:
Date:
Put the numbers (1 to 9) in boxes according to explanation shown in the below (*).
Color evaluation will be done according to the browning on the apple slices.
Odor evaluation will be done according to the characteristic odor of the apples.
Overall acceptability is your point of view about the apple product in terms of appearance,
smell, texture, and etc.
Off-odor evaluation will be done whether the apple product has off-odor or not.
COLOR ODOR OVERALL ACCEPTABILTY OFF-ODOR
SAMPLE 1
SAMPLE 2
SAMPLE 3
SAMPLE 4
SAMPLE 5
SAMPLE 6
SAMPLE 7
SAMPLE 8
*9 Point Hedonic Scale: For off-odor;
9: like extremely
8: like very much 1: no off-odor
7: like moderately 9: very strong off-odor
6: like slightly
5: neither like nor dislike
4: dislike slightly
3: dislike moderately
2: dislike very much
1: dislike extremely
Figure 4.1. The form that used to evaluate the sensory properties of apples treated with
ultrasound and w/o ultrasound

54
Table 4.1. Changes in L (lightness) values for red delicious and golden delicious apples treated
with ultrasound and w/o ultrasound during a two-week period
Sample Treatment Amplitude L ( lightness) values
Day 0 Day 7 Day 14
Red delicious cut w/o ultrasound 0% 75.560b (x)
63.360c (y)
62.460b (y)
cut with ultrasound 30% 77.757ab (x)
69.520b (y)
68.947a (y)
cut with ultrasound 40% 79.160a (x)
72.207ab (y)
70.803a (y)
cut with ultrasound 50% 80.503a (x)
74.923a (y)
73.330a (y)
Golden delicious cut w/o ultrasound 0% 76.013b (x)
67.183c (y)
65.487b (y)
cut with ultrasound 30% 78.313ab (x)
69.213bc (y)
68.520ab (y)
cut with ultrasound 40% 79.070ab (x)
71.830b (y)
69.873a (y)
cut with ultrasound 50% 81.370a (x)
75.560a (y)
71.927a (z)
a-c Treatment means within treatments (columns) with the same letter in each sample are not significantly different
(p<0.05).
x-z Treatment means within time (rows) with the same letter in each sample are not significantly different (p<0.05).

55
Table 4.2. Changes in a (redness) values for red delicious and golden delicious apples treated
with ultrasound and w/o ultrasound during a two-week period
Sample Treatment Amplitude a (redness) values
Day 0 Day 7 Day 14
Red delicious cut w/o ultrasound 0% -4.9433a (z)
0.6700a (y)
1.3600a (x)
cut with ultrasound 30% -5.0533a (z)
0.8067a (y)
1.3533
a (x)
cut with ultrasound 40% -5.6067a (z)
1.0067a (y)
1.3500a (x)
cut with ultrasound 50% -5.6800a (z)
1.7833a (y)
1.2567a (x)
Golden delicious cut w/o ultrasound 0% -7.4867a (z)
-0.4833a (y)
0.6100
a (x)
cut with ultrasound 30% -7.9233a (z)
-0.5767a (y)
0.5500a (x)
cut with ultrasound 40% -7.9400a (z)
-0.8200a (y)
0.5433a (x)
cut with ultrasound 50% -7.9500a (z)
-0.8433a (y)
0.2567a (x)
a Treatment means within treatments (columns) with the same letter in each sample are not significantly different
(p<0.05).
x-z Treatment means within time (rows) with the same letter in each sample are not significantly different (p<0.05).

56
Table 4.3. Changes in b (yellowness) values for red delicious and golden delicious apples treated
with ultrasound and w/o ultrasound during a two-week period
Sample Treatment Amplitude b (yellowness) values
Day 0 Day 7 Day 14
Red delicious cut w/o ultrasound 0% 24.743a (y)
34.283
a (x)
34.940
a (x)
cut with ultrasound 30% 23.753a (y)
32.703a (x)
33.770a (x)
cut with ultrasound 40% 22.927a (y)
32.387a (x)
32.983
a (x)
cut with ultrasound 50% 21.640a (y)
31.480a (x)
32.013a (x)
Golden delicious cut w/o ultrasound 0% 29.410a (y)
36.713a (x)
38.133a (x)
cut with ultrasound 30% 28.417a (y)
36.623a (x)
36.743
a (x)
cut with ultrasound 40% 28.160a (y)
36.117a (x)
36.173a (x)
cut with ultrasound 50% 27.260a (y)
34.713a (x)
36.117a (x)
a Treatment means within treatments (columns) with the same letter in each sample are not significantly different
(p<0.05).
x-y Treatment means within time (rows) with the same letter in each sample are not significantly different (p<0.05).

57
Table 4.4. Changes in pH for red delicious and golden delicious apples treated with ultrasound
and w/o ultrasound during a two-week period
Sample Treatment Amplitude pH changes
Day 0 Day 7 Day 14
Red delicious cut w/o ultrasound 0% 4.20a (y)
4.29a (y)
4.64a (x)
cut with ultrasound 30% 4.12ab (y)
4.26ab (y)
4.45b (x)
cut with ultrasound 40% 4.10b (y)
4.18bc (y)
4.41b (x)
cut with ultrasound 50% 4.10b (y)
4.16c (y)
4.38b (x)
Golden delicious cut w/o ultrasound 0% 3.98a (y)
4.05a (xy)
4.14a (x)
cut with ultrasound 30% 3.87b (y)
3.99b (xy)
4.02ab (x)
cut with ultrasound 40% 3.87b (y)
3.94bc (xy)
3.99b (x)
cut with ultrasound 50% 3.84b (y)
3.90c (xy)
3.98b (x)
a-c Treatment means within treatments (columns) with the same letter in each sample are not significantly different
(p<0.05).
x-y Treatment means within time (rows) with the same letter in each sample are not significantly different (p<0.05).

58
Table 4.5. Polyphenol oxidase (PPO) activity changes for red delicious and golden delicious
apples treated with ultrasound and w/o ultrasound during a two-week period
Sample Treatment Amplitude PPO activity (U/mL)
1st day 7
th day 14
th day
Red delicious cut w/o ultrasound 0% 792a (z)
828a (y)
864a (x)
cut with ultrasound 30% 468b (z)
504b (y)
612b (x)
cut with ultrasound 40% 450bc (z)
480b (y)
540c (x)
cut with ultrasound 50% 360c (z)
432c (y)
504d (x)
Golden delicious cut w/o ultrasound 0% 684a (z)
720a (y)
756a (x)
cut with ultrasound 30% 396b (z)
408b (y)
504b (x)
cut with ultrasound 40% 360b (z)
385bc (y)
468c (x)
cut with ultrasound 50% 288c (z)
360c (y)
432d (x)
a-d
Treatment means within treatments (columns) with the same letter in each sample are not significantly different
(p<0.05).
x-z Treatment means within time (rows) with the same letter in each sample are not significantly different (p<0.05).

59
Figure 4.2. Environmental Scanning Electron Microscope (ESEM) images of the surface
morphology of red delicious apples treated by ultrasound and w/o ultrasound
Left-top image: red delicious apple cut with ultrasound (50% amplitude-40x magnification); right-top image: red
delicious apple cut without ultrasound (40x magnification); left-bottom image: red delicious apple cut with
ultrasound (50% amplitude-100x magnification); right-bottom image: red delicious apple cut without ultrasound
(100x magnification).

60
Figure 4.3. Surface pictures of ultrasonic cut red delicious and golden delicious
Left -top image: red delicious apple cut with ultrasound (50% amplitude); right-top image: red delicious apple cut
without ultrasound; left-bottom image: golden delicious apple cut with ultrasound (50% amplitude); left-bottom
image: golden delicious apple cut without ultrasound.

61
Table 4.6. Sensory attributes changes for red delicious and golden delicious apples treated with ultrasound and w/o ultrasound during
a two-week period
Amplitude (%) Color Odor Overall acceptability Off-odor
1st day 7
th days 14
th days 1
st day 7
th days 14
th days 1
st day 7
th days 14
th days 1
st day 7
th days 14
th days
Red delicious
0% amplitude 5.3d (x)
1.9d (y)
1.6b (y)
5.2c (x)
2.2c (y)
1.9b (y)
4.7c (x)
2.4c (y)
1.7b (y)
1.0a (x)
1.7a (x)
2.6a (x)
30%amplitude 6.8c (x)
4.3c (y)
3.8a (y)
6.0bc (x)
4.3b (y)
4.2a (y)
6.4b (x)
4.7b (y)
4.3a (y)
1.0a (x)
1.4ab (x)
1.9a (x)
40% amplitude 8.1b (x)
5.2b (y)
4.6a (y)
6.6ab (x)
4.7b (y)
4.5a (y)
6.6b (x)
5.0b (y)
4.6a (z)
1.0a (x)
1.0b (x)
1.0b (x)
50% amplitude 8.7a (x)
6.3a (y)
5.2a (z)
7.2a (x)
5.8a (y)
5.3a (y)
8.3a (x)
6.1a (y)
5.7a (y)
1.0a (x)
1.0b (x)
1.0b (x)
Golden delicious
0% amplitude 5.5d (x)
5.1c (y)
3.8c (z)
4.5c (x)
4.3c (xy)
3.8b (y)
4.5d (x)
4.3c (xy)
3.3c (y)
1.0a (x)
1.3a (x)
2.3a (x)
30%amplitude 7.2c (x)
6.3b (y)
4.6b (z)
6.5b (x)
5.4b (y)
3.9b (z)
5.9c (x)
5.7b (xy)
3.9bc (y)
1.0a (x)
1.3a (x)
1.8a (x)
40% amplitude 8.3b (x)
6.8ab (y)
4.8b (z)
7.2b (x)
6.0b (y)
4.6b (z)
7.4b (x)
6.1b (y)
4.6b (z)
1.0a (x)
1.0a (x)
1.0b (x)
50% amplitude 8.8a (x)
7.6a (y)
5.8a (z)
8.3a (x)
7.0a (y)
5.5a (z)
8.4a (x)
7.1a (y)
5.7a (z)
1.0a (x)
1.0a (x)
1.0b (x)
a-d Treatment means within treatments (columns) with the same letter in each sample are not significantly different (p<0.05).
x-z Treatment means within time (rows) with the same letter in each sample are not significantly different (p<0.05).

62
Table 4.7. Polyphenol oxidase (PPO) activity changes for red delicious and golden delicious
apples treated with 1% CaA solution in combined with ultrasound and w/o ultrasound during a
two-week period
Sample Treatment Amplitude PPO activity (U/mL)
1st day 7
th day 14
th day
Red delicious cut w/o ultrasound 0% 792a (z)
828a (y)
864a (x)
cut with ultrasound 50% 360b (z)
432b (y)
504b (x)
w/o ultrasound+CaA 0% 180c (z)
252c (y)
270c (x)
with ultrasound+CaA 50% 108d (z)
144d (y)
216d (x)
Golden delicious cut w/o ultrasound 0% 684a (z)
720a (y)
756a (x)
cut with ultrasound 50% 288b (z)
360b (y)
432b (x)
w/o ultrasound+CaA 0% 144c (z)
180c (y)
227c (x)
with ultrasound+CaA 50% 72d (z)
108d (y)
144d (x)
a-d Treatment means within treatments (columns) with the same letter in each sample are not significantly different
(p<0.05).
x-z Treatment means within time (rows) with the same letter in each sample are not significantly different (p<0.05).

63
CHAPTER 5
OVERALL CONCLUSIONS AND FUTURE WORK
This thesis describes the effect of ultrasonic cutting on the surface appearance and quality
of selected food products (cheese and apple). Apples and cheeses cut without (control) and with
ultrasound at three amplitudes (30%, 40%, and 50%) with an ultrasonic knife. Quality attributes
such as total color difference, surface texture, peroxide values (for cheeses), pH, polyphenol
oxidase (PPO) activity (for apples) and sensory characteristics of cheeses and apples cut with and
w/o ultrasound were measured and compared. According to the results, a significant difference in
quality and surface appearance of selected food products cut with and without ultrasound were
observed.
By taking into account of the advantages of using ultrasonic knife, it may be possible to
get much more qualified foods, and preserve the foods much longer. In addition, using ultrasonic
knife may help to save the time, and lower the product loss for the food industry.
Overall, this thesis research demonstrated that ultrasonic cutting may provide a promising
alternative to traditional cutting for improving the surface appearance and quality of cut
products.
For future studies, modified atmosphere packaging (MAP) can be combined and designed
with ultrasound and without ultrasound to optimize the quality and shelf-life of fresh-cut apples.
Synergism of the MAP system with an antioxidant treatment (calcium ascorbate) on food quality
and shelf-life can be also investigated. Finally, more detailed analysis based on quality of

64
different food products such as bakery and frozen products should be conducted to fully
understand the benefits of using ultrasound in food cutting.

65
REFERENCES
Abe, K., and Watada, A. E. (1991). Ethylene absorbent to maintain quality of lightly processed
fruits and vegetables. J. Food Sci. 56: 1589-1592.
Addis, P.B. (1986). Occurrence of lipid oxidation products in foods. Food Chem. Toxicol. 24:
1021-1030.
Agar, I. T., Massantini, R., Hess-Pierce, B., and Kader, A. A. (1999). Postharvest CO2 and
ethylene production and quality maintenance of fresh-cut kiwifruit slices. J. Food Sci. 64: 433–
440.
Aguayo, E., Jansasithorn, R., and Kader, A. A. (2006). Combined effects of 1-
methylcyclopropene, calcium chloride dip, and/or atmospheric modification on quality changes
in fresh-cut strawberries. Postharv. Biol. Technol. 40: 269–278.
Ahvenainen, R. (1996). New approaches in improving the shelf life of minimally processed fruit
and vegetables. Trends Food Sci. Technol. 7: 179-187.
Altekruse, S. F., Cohen, M. L., and Swerdlow, D. L. (1997). Emerging foodborne diseases.
Emerg. Infect. Dis. 3: 285–293.
Amodio, M. L., Rinaldi, R., and Coltelli, G. (2006). Influence of atmosphere composition on
quality attributes of ready-to- cook fresh-cut vegetable soup. Acta Hort. 712: 677–684.
Amodio, M. L., and Colelli, G. (2008). Effect of thermal treatment and dipping on quality and
shelf-life of fresh-cut peaches. Advances in Horticultural Science. 1: 21–26.
Annese, M., Manzano, M., and Nicoli, M. C. (1997). Quality of minimally processed apple slices
using different modified atmosphere conditions. J. Food Qual. 20: 359-370.

66
Antolovich, M., Prenzler, P. D., Patsalides, E., Mcdonald, S., and Robards, K. (2002). Analyst.
127: 183–198.
AOCS Official Methods and Recommended Practices. 5th edit. (1998). Official Method Cd 8-
53: Peroxide value. Acetic acid-chloroform method. Am. Oil Chem. Soc., Champaign, IL, USA.
Arnold, G., Leiteritz, L., Zahn, S., and Rohm, H. (2009). Ultrasonic cutting of cheese:
composition affects cutting work reduction and energy demand. Int. Dairy J. 19: 314-320.
Barnicoat, C. R. (1950). Cheese discoloration: oxidation of bixin in annatto-coloured cheeses
promoted by sulphydryl compounds. J. Dairy Res. 8: 209-213.
Barry-Ryan, C., and O’Beirne, D. (1998). Effects of slicing method on the quality and storage-
life of modified atmosphere packaged carrot discs. J. Food Sci. 63: 851–856.
Bolin, H. R., Staftord, A. E. King, A. D. Jr., and Huxsoll, C. C. (1977). Factors affecting the
storage stability of shredded lettuce. J. Food Sci. 42(5): 1319-1321.
Bolin, H. R., and Huxsoll, C. C. (1991). Control of minimally processed carrot (Daucus carota)
surface discoloration caused by abrasion peeling. J. Food Sci. 56: 416–418.
Bolland, J. L. (1945). The course of autoxidation reactions in polyisoprenes and allied
compounds. Part IX. The primary thermal oxidation products of ethyl linoleate. J. Chem. Soc.
445-447.
Bolland, J. L. (1949). Kinetics of olefin oxidation. Q. Rev. 3: 1-21.
Boran, G., Karacam, H., and Boran, M. (2006). Changes in the quality of fish oil due to storage
temperature and time. Food Chemistry. 98: 693–698.

67
Brecht, J. K. (1995). Physiology of lightly processed fruits and vegetables. HortScience. 30:18-
22.
Brown, T., James, S. J., and Purnell, G. L. (2005). Cutting forces in foods: experimental
measurements. J. Food Eng. 70: 165-170.
Buzby, J. C. (2005). Cheese consumption continues to rise. Amber waves. Volume 3, Issue 1.
Retrieved from http://purl.umn.edu/130593.
Campbell, R. E, Miracle, R. E, Gerard, P. D., and Drake, M. A. (2011-a). Effects of Starter
Culture and Storage on the Flavor of Liquid Whey. J Food Sci. 76(5): 354-361.
Campbell, R. E., Miracle, R. E., and Drake, M. A. (2011-b). The effect of starter culture and
annatto on the flavor and functionality of whey protein concentrate. J Dairy Sci. 94(3): 1185-
1193.
Cantwell, M. (1995). Fresh-cut product biology and requirements. Perishables Handling
Newsletter. 81: 4-9.
Caodi, F. (2007). Characterization of polyphenol oxidase and antioxidants from pawpaw
(asimina tribola) fruit. University of Kentucky Master's Theses. Paper 477.
Retrieved from http://uknowledge.uky.edu/gradschool_theses/477.
Cemeroglu, B. (2007). Gıda analizleri. Gıda Teknolojisi Dernegi Yayınları. No: 34, Bizim Büro
Basımevi. Ankara, 535 s.
Creamer, L. K., and Olson, N. F. (2005). Rheological evaluation of maturing cheddar cheese.
Journal of Food Science. 47: 631- 646.

68
Das, J. R., Bhat, S. G., and Gowda, L. R. (1997). Purification and characterization of a
polyphenol oxidase from the Kew cultivar of Indian pineapple fruit. J. Agric. Food Chem. 45:
2031–2035.
EL-Nimr, A. A, Hesham, A. E., El-Abd, M. M., Mehriz A. A, Abbas, H. M., and Bayoumi, H.
M. (2010). Water activity, color characteristics and sensory properties of egyptian gouda cheese
during ripening. JAm Sci. 6(10):447-453.
Esterbauer, H., Lang, J., Zadravec S., and Slater, T. S. (1984). Detection of malonaldehyde by
high-performance liquid chromatography. Methods Enzymol. 105: 319–328.
Esterbauer, H., and Zollner, H. (1989). Methods for dctcrminatioll of aldehydic lipid
peroxidation products. Free Rad. Biol. Med. 7: 197–203.
Farmer, E. H., and Sutton, D. A., (1943). Course of autoxidation reactions in polyisoprenes and
allied compounds. IV. The isolation and constitution of photochemically-formed methyl oleate
peroxide. J. Chem. Soc. 119-122.
Farmer, E. H., Koch, H. P., and Sutton, D. A., (1943). The course of autoxidation reactions in
polyisoprenes and allied compounds. VII. Rearrangement of double bonds during autoxidation.
J. Chem. Soc. 541-547.
Feng, H., and Yang, W. (2005). Power ultrasound. In Handbook of Food Science, Technology,
and Engineering. 121-1-121-9, (ed.) Hui, Y.H. CRC Press, New York.
Ferrer, A. S., Bru, R., and Carmona, F. G. (1989). Novel procedure for extraction of a latent
grape polyphenoloxidase using temperature--induced phase separation in Triton X-114. Plant
Physiol. 91:1481–1487.

69
Ferrer, A. S., Laveda, F., and Carmona, F. G. (1993). Partial purification of soluble potato
polyphenol oxidase by partitioning in aqueous two-phase system. J. Agric. Food. Chem. 41:
1219–1224.
Fox, P. F., Law, J., McSweeney, P. L. H., and Wallace, J. (1993). Biochemistry of cheese
ripening. In P. F. Fox (Eds.). Cheese, chemistry, physics and microbiology. Vol. 1 (pp. 389-438).
UK: Chapman and Hall.
Francis, F. (1980). Color quality evaluation of horticultural crops. Hort. Science. 5: 58-59.
Frankel, E. N. (1980). Lipid oxidation. Pray. Lipid Res. VoL 19. pp. 1-22.
Frankel, E.N. (1998). Lipid Oxidation. The Oily Press. Dundee, Scotland.
Frazier, W. C., and Westhoff, D. C. (1988). In E. Dollinger (Ed.), Food Microbiology (p. 196).
Singapore: McGraw-Hill Book Co.
Goodenough, P. W., Kessell, S., Lea, A. G. H., and Loeffler, T. (1983). Mono- and diphenolase
activity from fruit of Mulus pumilu. Phytochemistry. 22: 359–363.
Gorny, J. R. (1997). Summary of CA and MA requirements and recommendations for fresh - cut
(minimally processed) fruits and vegetables. In: Gorny, J.R. (Ed.), Proceedings of Seventh
International Controlled Atmosphere Conference, Vol. 5. Postharvest Outreach Program,
University of California, Davis, CA, 30 - 66.
Gorny, J. R., Hess-Pierce, B., and Kader, A. A. (1999). Quality changes in freshcut peach and
nectarine slices as affected by cultivar, storage atmosphere and chemical treatments. J. Food Sci.
64: 429–432.
Gray, J. I. (1978). Measurement of lipid oxidation. A review. J. Am. Oil Chem. Soc.,55, 539-46.

70
Haard, N. F., and Chism, G. W. (1996). Characteristics of Edible Plant Tissues. In Food
Chemistry, O.R. Fennema (Eds), p. 994–1007. Marcel Dekker Inc., New York.
Hassan A., Johnson M. E., and Lucey J. A. (2004). Changes in the proportions of soluble and
insoluble calcium during the ripening of Cheddar cheese. J. Dairy Sci. 87 854–862.
Heaton, J. W., and Marangoni, A. G. (1996). Chlorophyll degradation in processed foods and
senescent plant tissues. Trends Food Sci. Technol. 7: 8–15.
Heimdal, H., Larsen, L. M., and Poll, L. (1994). Characterization of polyphenol oxidase from
photosynthetic and vascular lettuce tissues (Lactucu saliva). J. Agric. Food. Chem. 42: 1428–
1433.
Holman, R.T. (1954) in Progress in the Chemistry of Fats and Other Lipids, Vol. 2, Edited by
R.T. Holman, Pergamon Press, London.
Huxsoll, C. C., and Bolin, H. R. (1989). Processing and distribution alternatives for minimally
processed fruits and vegetables. Food Technol. 43:124–128.
IDFA (2006). Dairy facts. Washington, D.C.: Intl. Dairy Foods Assn.
IDFA (2010). Dairy facts. International Dairy Foods Association, Washington, DC.
Jiang, Y. (1999). Purification and some properties of polyphenol oxidase of longan fruit. Food
Chem. 66: 75–79.
Kabir, H. (1994). Fresh-cut vegetables. In A. L. Brods, & V. A. Herndon (Eds.). Modified
atmosphere food packaging (pp. 155-160). Naperville, Illinois: Institute of Packaging
Professionals.

71
Kader, A. A., and Cantwell, M. (2004). Produce Quality Rating Scales and Color Charts.
Postharvest Horticulture Series Number 23, September 2004, revised May 2007. Postharvest
Technology Research and Information Center. University of California Davis, CA.
Kahn, V., and Pomerantz, S. H. (1980). Monophenolase activity of avocado polyphenoloxidases.
Phytochemistry. 19: 379–385.
Kanner, J., and Rosenthal, I. (1992). An assessment of lipid oxidation in foods. Pure & Appl.
Chem. 64: 1959–1964.
Kim, D. M., Smith, N. L., and Lee, C. Y. (1993). Quality of minimally processed apple slices
from selected cultivars. J. Food Sci. 58:1115-1117-1175.
Kim, H. J., Ham, J. S., Kim, K., Ha, J. H., Ha, S. D., and Jo, C. (2010). Quality Evaluation of
Sliced and Pizza Cheeses Treated by Gamma and Electron Beam Irradiation. Asian-Aust. J.
Anim. Sci. 23(8):1112-111.
King, A. D., and Bolin, H. R. (1989). Physiological and microbiological storage stability of
minimally processed fruits and vegetables. Food Technol. 43:132-135.
Klein, B. P. (1987). Nutritional consequences of minimal processing on fruits and vegetables.
Journal of Food Quality. 10: 179-193.
Lamikanra, O. (2002). Preface. In O. Lamikanra (Ed.). Fresh-cut fruits and vegetables. Science,
technology and market. Boca cRaton, FL: CRC Press.
Laubli, M. W., Bruttel, P. A., and Schalch, E. (1986). Determination of the oxidative stability of
fats and oils: comparison between the active oxygen method and the Rancimat method. J. Am.
Oil Chem. Soc. 63: 792–795.

72
Lebecque A., Laguet A., Devaux M. F., and Dufour, E. (2001). Delineation of the texture of
Salers cheese by sensory analysis and physical methods. Le Lait. 81: 609-623.
Ledenbach, L. H., and Marshall R. T. (2010). Microbiological Spoilage of Dairy Products. (Eds.)
W.H. Sperber; M.P.Doyle, Compendium of the Microbiological Spoilage of Foods and
Beverages. Springer-Verlag New York, LLC, pp. 41-67.
Lucas, M., MacBeath, A., McCulloch, E., and Cardoni, A. (2006). A finite element model for
ultrasonic cutting. Department of Mechanical Engineering, University of Glasgow, Glasgow G12
8QQ, United Kingdom, Volume 44, Supplement, 22 December 2006, Pages 503–509.
Lund, B. M., and Snowdon, A. L. (2000). Fresh and processed fruits. Chapter 27. In: The
Microbiological Safety and Quality of Food. Vol. 1, pp. 738–758. Lund, B. M., Baird-Parker, T.
C., and Gould, G. W., Eds., Gaithersburg, Aspen, CO.
Luo, Y., and Barbosa-Canovas, G. V. (1996). Preservation of apple slices using ascorbic acid
and 4-hexylresorcinol. Food Sci. Technol. Int. 2: 315-321.
Luo, Y., Lu, S., Zhou, B., and Feng, H. (2011). Dual effectiveness of sodium chlorite for
enzymatic browning inhibition and microbial inactivation on fresh-cut apples. LTW-Food
Science and Technology 44(7): 1621-1625.
Marques, L., Fleuriet, A., and Macheix, J. (1995). Characterization of multiple forms of
polyphenoloxidase from apple fruit. Plant Physiol. Biochem. 33: 193-200.
Marshall, M. R., Kim, J. M., and Wei, C. I. (2000). Enzymatic browning in fruits, vegetables and
seafoods. http://www.fao.org/ag/ags/agsi/ENZYMEFINAL/Enzymatic%20Browning.html
Martinez, M. V., and Whitaker, J. R. (1995). The biochemistry and control of enzymatic
browning. Trends Food Sci. Technol. 6: 195–200.

73
Mason, T. J. (1998). An introduction to ultrasonic food cutting. In: Ultrasound in Food
Processing, edited by Povey, M.J.W. and Mason, T.J. New York: Blackie Academic&
Professional, pp.254-269.
McClements, D. J., and Decker, E. A. (2000). Lipid oxidation in oil-in-water emulsions: impact
of molecular environment on chemical reactions in heterogeneous food systems. J. Food Sci.
65(8): 1270–1282.
Min, D. B., and Boff, J. M. (2002). Lipid oxidation of edible oil. In: Akoh, C.C., and Min, D.B.,
Eds., Food Lipids: Chemistry, Nutrition, and Biotechnology. Marcel Dekker, New York.
Montgomery, M. W., and Sgarbieri, V. C. (1975). Isoenzymes of banana polyphenol oxidase.
Phytochemistry. 14: p. 1245.
Muccio, E. A. (1999). Decoration and assembly of plastic parts. Materials Park, OH: ASM
International.
Nawar, W. W. (1996). Lipids. In Food Chemistry, O.R. Fennema (Eds), p. 225–235. Marcel
Dekker Inc., New York.
Nicolas, J. J., Richard-forget, F. C., Goupy, P. M., Amiot, M., and Aubert, S. Y. (1994).
Enzymatic browning reactions in apple and apple products. Crit. Rev. Food Sci. Nutr. 34: 109-
157.
Paul, B., and Gowda, L. R. (2000). Purification and characterization of polyphenol oxidase from
the seeds of field bean (Dolichos lablab). J. Agric. Food Chem. 48: 3839–3846.
Perez-Gilabert, M., and Carmona, F. G. (2000). Characterization of catecholase and cresolase
activities of eggplant polyphenol oxidase. J. Agric. Food Chem. 48: 695–700.
74
Pérez-Gago, M. B., Serra, M., Alonso, M., Mateos, M., and del Río, M. A. (2005). Effect of
whey protein and hydroxypropyl methylcellulose-based edible composite coatings on color
change of fresh-cut apples. Postharvest Biol and Tech. 36: 77-85.
Piergiovanni, L., Noni, I. D., Fava, P., and Schiraldi, A. (1989). Nonenzymatic browning in
processed cheeses. Kinetics of the Maillard reaction during processing and storage. Italian
Journal of Food Science. 2: 11–20.
Portela, S. I., and Cantwell, M. I. (2001). Cutting blade sharpness affects appearance and other
quality attributes of fresh-cut cantaloupe melon. J. Food Sci. 66: 1265–1270.
Priego-Capote, F., Ruiz-Jimenez, J., Garcia-Olmo, J., and Luque de Castro, M. D. (2004). Fast
method for the determination of total fat and trans fatty-acids content in bakery products based
on microwave-assisted Soxhlet extraction and medium infrared spectroscopy detection.
Analytica Chimica Acta. 517: 13-20
Rawson, F. F. (1998). An introduction to ultrasonic food cutting. In: Povey, M.J.W., Mason, T.J.
(Eds.), Ultrasound in Food Processing. Blackie Academic, London, UK, pp. 254–269.
Raymond, J., Rakariyatham, N., and Azanza, J. L. (1993). Purification and some properties of
polyphenoloxidase from sunflower seeds. Phytochemistry. 34: 927–931.
Recknagel, R. O., and Glende, E.A. (1984). Spectrophotomctric detection of lipid conjugated
dienes. Methods Enzymol. 105: 331–337.
Richardson, T., and Hyslop, D. B. (1985). Enzymes. In Food Chemistry; Fennema, O. R., Ed.;
Marcel Dekker: New York, pp. 371-476.
Rico, D., Mart´ın-Diana, A. B., Barat, J. M., and Barry-Ryan, C. (2007). Extending and
measuring the quality of fresh-cut fruit and vegetables: A review. Trends Food Scie. Technol.
18: 373–386.

75
Riuz, A., Ayora-Canada, M. J., and Lendl, B. (2001). Bead injection for surface enhanced
Raman spectroscopy: automated on-line monitoring of substrate generation and application in
quantitative analysis. Analyst. 126: 242–246.
Saltveit, M. E. (1997). Physical and physiological changes in minimally processed fruits and
vegetables. In: Phytochemistry of Fruits and Vegetables, pp. 205–220. Tom´as-Barberan, F. A.,
and Robins, R. J., Eds., Phytochemistry Society Europa, Clarendon, Oxford.
Saltveit, M. E., Choi, Y. J., and Tom´as-Barber´an, F. A. (2005). Involvement of components of
the phosopholipid-signalling pathway in wound-induced phenylpropanoid metabolism in lettuce
(Lactuca sativa) leaf tissue. Physiol. Plant. 125: 345–355.
Sapers, G. M., Garzarella, L., and Pilizota, V. (1990). Application of browning inhibitors to cut
apple and potato by vacuum and pressure infiltration. J. Food Sci. 55: 1049-1053.
Schaich, K. M., Shahidi, F., Ying Zhong, N. A., and Eskin, M. (2013). Biochemistry of Foods
Third edition, p. 419-529.
Schneider, Y., Zahn, S., and Linke, L. (2002). Qualitative process evaluation for
ultrasoniccutting of Food. Engineering in Life Sciences. 2: 153-157.
Schneider, Y., Zahn, S., and Rohm, H. (2011). Ultrasonic cutting of foods. In Ultrasound
Technologies for Food and Bioprocessing, (eds.) Feng, H., Barbosa, G.V., Weiss, J. Springer,
New York, NY.
Shahidi, F. (2000). Antioxidants in food and food antioxidants. Nahrung. 44: 158–163.
Shewfelt, R. L. (1986). Flavor and color of fruits as affected by processing. In Commercial Fruit
Processing, J.G. Woodroof and B.S. Luh (Eds), p. 481–529, Avi Publishing Co., Westport, CT.
Slater, T. F. (1984). “Overview of methods for detecting lipid peroxidation.” Methods Enzymol.
105: 283–293.
76
Soxhlet, F. (1879). Die gewichtsanalytische bestimmung des milchfettes. Dingler’s Polyt. J. 232:
461-465.
Swern, D. (1961). Primary products of olefinic autoxidation. In: Lundberg, W.O. (Ed.),
Autoxidation and Antioxidants, Vol. 1. Interscience, New York, pp. 1-54.
Upreti, P., and Metzger L. E. (2007). Influence of calcium and phosphorus, lactose, and salt-to-
moisture ratio on cheddar cheese quality: pH changes during ripening. J Dairy Science. 90(1):1-
12.
Valero, E., Varon, R., and Garcia-carmona, F. (1988). Characterization of polyphenol oxidase
from Airen grapes. J. Food Sci. 53: 1482-1485.
Varoquaux, P., and Wiley, R.C. (1994). Biological and biochemical changes in minimally
processed refrigerated fruits and vegetables. p. 226-268. In: R.C. Wiley (ed.). Minimally
processed refrigerated fruits and vegetables. Chapman and Hall, New York.
Vercellotti, J. R., St. Angelo, A. J., and Spanier, A. M. (1992). in A. J. St. Angelo, ed., Lipid
Oxidation in Food. ACS Symposium Series 500, American Chemical Society, Washington, D.C.,
pp. 1–11.
Watada, A. E., Abe, K., and Yamauchi, N. (1990). Physiological activities of partially processed
fruits and vegetables. Food Technol. 44:116, 118, 120-122.
Whitaker, J. R. (1994). Principles of Enzymology for the Food Sciences. Second Ed., pp. 271-
556, Marcel Dekker, New York.
Whitaker, J. R. (1996). Enzymes. In Food Chemistry, O.R. Fennema (Eds), p. 431–530, Marcel
Dekker Inc., New York, NY.

77
Wong, N. P. (1974). Milk clotting enzymes and cheese chemistry part II. Cheese chemistry. In
"Fundamentals of Dairy Chemistry" 2ed Ed. Edited by web, B.H., Johnson, Company, westport,
Conneticut, USA.
Yoruk, R., and Marshall, M. R. (2003). Physicochemical properties and function of plant
polyphenol oxidase: a review. J. Food Biochem. 27: 361–422.
Yue-Ming, J., Zauberman, G., and Fuchs, Y. (1997). Partial purification and some properties of
polyphenol oxidase extracted from litchi fruit pericarp. Postharvest Biol. Tech. 10: 221-228.
Zahn, S., Schneider, Y., and Rohm, H. (2005). Impact of excitation and material parameters on
the efficiency of ultrasonic cutting of bakery products. Journal of Food Science. 70: 510-513.
Zahn, S., Schneider, Y., and Rohm, H. (2006). Ultrasonic cutting of foods: Effects of excitation
magnitude and cutting velocity on the reduction of cutting work. Innovative Food Science &
Emerging Technologies. 7: 288-293.

78
Appendix A. Preparation solution for PPO activity
0.5 M phosphate buffer
Na2HPO4 (sodium phosphate, dibasic): 14.196 g + 2 L distilled water
NaH2PO4 (monosodium phosphate):15.602 g + 2 L distilled water
Combine these solutions with a magnetic mixer to prepare 0.5 M phosphate buffer.
0.05 M phosphate buffer
Na2HPO4 (sodium phosphate, dibasic): 70.98 g + 1 L distilled water
NaH2PO4 (monosodium phosphate):78.01 g + 1 L distilled water
Combine these solutions with a magnetic mixer to prepare 0.05 M phosphate buffer.

79
Appendix B. Absorbance vs. time curve and slope of the curve of red delicious apples cut
with and without ultrasound for the first day
(a)
The slope of the curve: 0.0022
(b)
The slope of the curve: 0.0013
Time (s)
Absorbance (420nm)
0 0.9321
15 0.9349
30 0.9455
45 0.9522
60 0.9535
75 0.9543
90 0.9552
105 0.9568
120 0.9579
135 0.9592
150 0.9599
165 0.9609
180 0.9628
Time (s) Absorbance
(420nm)
0 0.7371
15 0.7389
30 0.7405
45 0.7432
60 0.7442
75 0.7443
90 0.7462
105 0.7472
120 0.7487
135 0.7492
150 0.7502
165 0.7515
180 0.7533
y = 0.0022x + 0.9372
0.91
0.92
0.93
0.94
0.95
0.96
0.97
0 30 60 90 120 150 180
Ab
sorb
ance
(4
20
nm
)
Time (s)
Absorbance(420nm)
Linear(Absorbance(420nm))
y = 0.0013x + 0.7369
0.725
0.73
0.735
0.74
0.745
0.75
0.755
0 30 60 90 120 150 180
Ab
sorb
ance
(4
20
nm
)
Time (s)
Absorbance(420nm)
Linear(Absorbance(420nm))

80
(c)
The slope of the curve: 0.0125
(d)
The slope of the curve: 0.001
(a) absorbance vs. time curve of red delicious apples cut without ultrasound for the first day; (b) absorbance vs. time
curve of red delicious apples cut with ultrasound (30% amplitude) for the first day; (c) absorbance vs. time curve of
red delicious apples cut with ultrasound (40% amplitude) for the first day; (d) absorbance vs. time curve of red
delicious apples cut with ultrasound (50% amplitude) for the first day.
Time (s) Absorbance
(420nm)
0 0.822
15 0.824
30 0.827
45 0.83
60 0.835
75 0.84
90 0.848
105 0.855
120 0.895
135 0.905
150 0.925
165 0.948
180 0.972
Time (s) Absorbance
(420nm)
0 0.1085
15 0.1087
30 0.1089
45 0.1092
60 0.1097
75 0.11
90 0.1111
105 0.1123
120 0.1151
135 0.1165
150 0.1173
165 0.1187
180 0.1201
y = 0.0125x + 0.7838
0
0.2
0.4
0.6
0.8
1
1.2
0 30 60 90 120 150 180
Ab
sorb
ance
(4
20
nm
)
Time (s)
Absorbance(420nm)
Linear(Absorbance(420nm))
y = 0.001x + 0.1055
0.095
0.1
0.105
0.11
0.115
0.12
0.125
0 30 60 90 120 150 180
Ab
sorb
ance
(4
20
nm
)
Time (s)
Absorbance(420nm)
Linear(Absorbance(420nm))

81
Appendix C. Absorbance vs. time curve and slope of the curve of golden delicious apples
cut with and without ultrasound for the first day
(a)
The slope of the curve: 0.0019
(b)
The slope of the curve: 0.0011
Time (s) Absorbance
(420nm)
0 0.8361
15 0.8379
30 0.8495
45 0.8522
60 0.8532
75 0.8543
90 0.8552
105 0.8562
120 0.8577
135 0.8582
150 0.8592
165 0.8605
180 0.8605
Time (s) Absorbance (420nm)
0 0.3826
15 0.384
30 0.3852
45 0.3862
60 0.3872
75 0.3887
90 0.3894
105 0.3921
120 0.3922
135 0.3934
150 0.3938
165 0.3941
180 0.3954
y = 0.0019x + 0.8403
0.82
0.825
0.83
0.835
0.84
0.845
0.85
0.855
0.86
0.865
0.87
0 30 60 90 120 150 180
Ab
sorb
ance
(4
20
nm
)
Time (s)
Absorbance(420nm)
Linear(Absorbance(420nm))
y = 0.0011x + 0.382
0.375
0.38
0.385
0.39
0.395
0.4
0 30 60 90 120 150 180
Ab
sorb
ance
(4
20
nm
)
Time (s)
Absorbance(420nm)
Linear(Absorbance(420nm))

82
(c)
The slope of the curve: 0.001
(d)
The slope of the curve: 0.0008
(a) absorbance vs. time curve of golden delicious apples cut without ultrasound for the first day; (b) absorbance vs.
time curve of golden delicious apples cut with ultrasound (30% amplitude) for the first day; (c) absorbance vs. time
curve of golden delicious apples cut with ultrasound (40% amplitude) for the first day; (d) absorbance vs. time curve
of golden delicious apples cut with ultrasound (50% amplitude) for the first day.
y = 0.0008x + 0.1135
0.1080.11
0.1120.1140.1160.118
0.120.1220.1240.126
0 30 60 90 120 150 180
Ab
sorb
ance
(4
20
nm
)
Time (s)
Absorbance(420nm)
Linear(Absorbance(420nm))
Time (s) Absorbance (420nm)
0 0.296
15 0.2961
30 0.297
45 0.2974
60 0.2985
75 0.2991
90 0.2998
105 0.301
120 0.3025
135 0.3042
150 0.3052
165 0.306
180 0.3086
Time
(s)
Absorbance
(420nm)
0 0.1139
15 0.1155
30 0.116
45 0.1167
60 0.1173
75 0.1178
90 0.1188
105 0.1193
120 0.1201
135 0.1209
150 0.1217
165 0.1225
180 0.1238
y = 0.001x + 0.2936
0.285
0.29
0.295
0.3
0.305
0.31
0 30 60 90 120 150 180A
bso
rban
ce (
42
0 n
m)
Time (s)
Absorbance(420nm)
Linear(Absorbance(420nm))

83
Appendix D. Absorbance vs. time curve and slope of the curve of red delicious apples
treated with 1% CaA solution in combined with ultrasound (50% amplitude) and without
ultrasound for the first day
(a)
0.0003 is the graph's slope.
(b)
0.0005 is the graph's slope.
(a) absorbance vs. time curve of red delicious apples treated with 1% CaA solution in combined with ultrasound
(50% amplitude); (b) absorbance vs. time curve of red delicious apples treated with 1% CaA solution in combined
without ultrasound.
y = 0.0003x + 0.1192
0.116
0.118
0.12
0.122
0.124
0 30 60 90 120 150 180Ab
sorb
ance
(4
20
nm
)
Time (s)
Absorbance(420nm)
Linear(Absorbance(420nm))
y = 0.0005x + 0.1108
0.106
0.108
0.11
0.112
0.114
0.116
0.118
0 30 60 90 120 150 180
Ab
sorb
ance
(4
20
nm
)
Time (s)
Absorbance(420nm)
Linear(Absorbance(420nm))
Time (s) Absorbance
(420nm)
0 0.1186
15 0.1195
30 0.1205
45 0.1209
60 0.1211
75 0.1211
90 0.1213
105 0.1214
120 0.1215
135 0.1218
150 0.122
165 0.1225
180 0.1231
Time (s) Absorbance
(420nm)
0 0.1109
15 0.1115
30 0.1121
45 0.1126
60 0.1132
75 0.1144
90 0.1145
105 0.1148
120 0.1151
135 0.1155
150 0.1158
165 0.1161
180 0.1165

84
Appendix E. Absorbance vs. time curve and slope of the curve of golden delicious apples
treated with 1% CaA solution in combined with ultrasound (50% amplitude) and without
ultrasound for the first day
(a)
0.0002 is the graph's slope.
(b)
0.0004 is the graph's slope.
(a) Absorbance vs. time curve of golden delicious apples treated with 1% CaA solution in combined with ultrasound
(50% amplitude); (b) absorbance vs. time curve of golden delicious apples treated with 1% CaA solution in
combined without ultrasound.
y = 0.0002x + 0.1205
0.119
0.12
0.121
0.122
0.123
0 30 60 90 120 150 180
Ab
sorb
ance
(4
20
nm
)
Time (s)
Absorbance(420nm)
Linear(Absorbance(420nm))
y = 0.0004x + 0.108
0.1
0.102
0.104
0.106
0.108
0.11
0.112
0.114
0 30 60 90 120 150 180
Ab
sorb
ance
(4
20
nm
)
Time (s)
Absorbance(420nm)
Linear(Absorbance(420nm))
Time (s) Absorbance (420nm)
0 0.1208
15 0.1209
30 0.1209
45 0.1211
60 0.1213
75 0.1214
90 0.1214
105 0.1219
120 0.1222
135 0.1223
150 0.1225
165 0.1225
180 0.1227
Time (s) Absorbance
(420nm)
0 0.1056
15 0.1085
30 0.1105
45 0.1109
60 0.1111
75 0.1111
90 0.1114
105 0.1114
120 0.1115
135 0.1118
150 0.1122
165 0.1125
180 0.1131