Embed Size (px)
Citation preview
ULTRASONIC METER CONDITION BASED MONITORING – A NEW AND SIMPLIFIED SOLUTION
MR. JOHN LANSING, Director of Ultrasonic Products, SICK │Maihak, Inc., Houston, Texas
1. ABSTRACT
During the past several years the use of ultrasonic meters (USMs) has gained world-wide acceptance for fiscal applications. The many benefits of USMs have been documented in several papers at virtually every major conference. As the cost of gas continues to increase, the importance of knowing that the ultrasonic meter is operating accurately has never been more important. The use of diagnostics to help identify metering issues has been discussed in several papers over the past few years [Ref 1 & 2].
The traditional method of verifying whether the USM is operating accurately essentially requires using
the USMs’ diagnostic information to help understand the meter’s health. This has often been referred to as Conditioned Based Maintenance, or CBM for short. Different USM meter designs require different analysis techniques, especially for the velocity profile analysis. For the field technician, it is often difficult to understand all the diagnostic features of each USM meter design. Through the years software has been developed to help determine if the meter is operating correctly or not. However, it is still very difficult to clearly define limits on some of the diagnostic parameters that translate into a quantifiable metering error.
This paper will discuss a new CBM concept to assist in understanding if the fiscal 4-path USM meter
is operating accurately. Rather than relying entirely on the understanding and interpretation of the meter’s diagnostics, a meter designed with an additional built-in diagnostic path has been developed. In this paper the meter design will be referred to as the CBM 4+1 meter.
2. INTRODUCTION
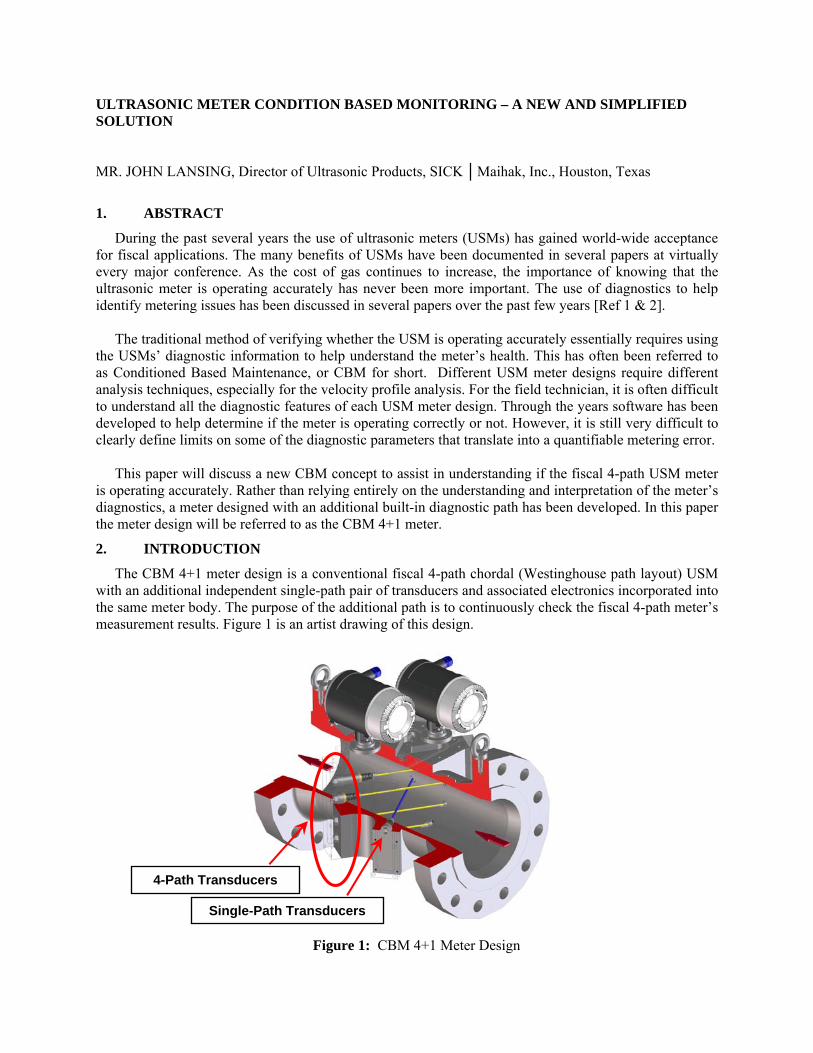
The CBM 4+1 meter design is a conventional fiscal 4-path chordal (Westinghouse path layout) USM with an additional independent single-path pair of transducers and associated electronics incorporated into the same meter body. The purpose of the additional path is to continuously check the fiscal 4-path meter’s measurement results. Figure 1 is an artist drawing of this design.
Figure 1: CBM 4+1 Meter Design
4-Path Transducers
Single-Path Transducers

The single path transducers are located in such a fashion as to traverse the meter in the center of the meter body. The 4-path transducers are located in the traditional Westinghouse configuration common to many 4-path chordal meters. The reason for locating the single-path transducers in the middle is to put them in the most sensitive position of the meter, thus providing more difference between this pair of sensors and the fiscal 4-path transducers. That is, the single-path meter, with the sensors located in the middle of the flowing gas, is more sensitive to flow disturbances than the 4-path transducers.
Figures 2 through 4 show a meter with plastic covers to provide a better view of the transducer
locations.
Figure 2: 8-inch CBM 4+1-Path Meter
Figure 2 shows an 8-inch 4+1 meter with plastic covers over the transducer mounting area. The plastic is simply for demonstration and certainly would not be used in the field. Figures 3 and 4 show the transducer locations as well as the installation of the two electronics.
Figure 3: CBM 4+1 Transducers Figure 4: CBM 4+1 Dual Electronics

Figure 3 shows a close-up of the transducers. The single-path transducers on the right of the meter are located in the center of the meter. As Figure 1 shows it is not a bounce path but rather a direct path at the traditional angle of 60 degrees. Thus the overall path length of this single-path pair of transducers is only slightly longer than the longest paths (paths 2 and 3) in a 4-path meter.
Two independent Signal Processing Units (SPU) are used, one for the 4-path configuration, and one
for the single-path configuration. Both electronics fire their transducers independently of the other. There is also no communication between the electronics, and no interaction between the sound pulses from one “meter” to the other. Figure 4 shows the dual electronics and the mounting on the top of the meter.
The concept of comparing the flow determined by the 4-path to that of the single-path is not new. This
technique has been used by TransCanada Pipelines for many years. In their installation configuration they often utilize a single-path center-line bounce meter installed approximately 5 nominal diameters downstream of a 4 path chordal custody transfer meter. The single path meter would be adjusted to agree with the calibrated 4-path at the time of commissioning. In other words, the single path meter would not be flow calibrated at a laboratory, but rather “in situ” calibrated after installation in the field. This would be performed at the time of commissioning when the meter station piping was clean and there were no measurement problems.
The theory behind this technique is relatively simple. The purpose of using 4 paths to measure gas
volumes in fiscal applications is to reduce measurement uncertainty due to changes in the profile that can occur over time. As the profile may change due to operating conditions, it is desired that the accuracy of the fiscal meter not be affected. The TransCanada Pipeline installations, as well as most other North American designs, utilize a perforated plate style of flow conditioner, known as the CPA 50E, to reduce the effects of upstream piping disturbances. The flow conditioner produces a relatively symmetrical, non-swirling and repeatable velocity profile throughout the operational velocity range of the meter.
The frequency of comparing the output of both meters is not on a real-time basis, but rather this check
is performed once per hour. That is, the uncorrected accumulated volumes in the 4 path meter are compared to the single path meter at the hourly level. This check frequency helps eliminate the minor differences that will occur on a real-time basis between the two meters due to their different velocity sampling techniques. This also permits using a tighter tolerance difference and increases the reliability of the testing.
Over time conditions can change in the piping system that can impact the accuracy of the meter, even
when using a flow conditioner. These changes include blockage of the flow conditioner with a foreign object, contamination over time from oil and mill scale, unexpected or unanticipated pulsation of gas, and potential changes within the 4-path meter electronics and transducers. By incorporating a second independent electronics and pair of transducers, this design essentially provides a real-time flow check against the 4-path meter. But why use a single path design to check the 4-path meter instead of another 4-path design checking the fiscal 4-path meter?
During the past several years data has shown that single path meters, with the transducers located to
send sound pulses through the middle of the meter body, are more sensitive to profile changes. These include asymmetry, swirl and other profile changes that occur due to contamination.
In a paper published in 1998 by Terry Grimley [Ref 3], installation effects were measured on two
multi-path meters, and on two single-path meters. A variety of installation effects were tested including two elbows in and out of plane upstream of the four meters. The multipath meters performed relatively well with errors attributed to the installation effects on the order of 0.5% or less. In the same piping

configuration the single path meters had errors that were on the order of 2-5%. Clearly the multipath meters could deal with the asymmetrical and swirling profiles far better than the single-path meters.
Profile changes also occur when contamination develops on the inside of the piping and meter. As the
buildup occurs, the wall friction increases causing the velocity profile in the center of the meter to be higher relative to the area along the pipe wall. A paper published at the North Sea Flow Measurement Workshop (NSFMW) in 2005 [Ref 1] discusses how the profile changed over time due to internal pipeline contamination. This paper also shows two examples of the meter’s response when blockage occurs upstream at the flow conditioner. Clearly the velocity profile from the chordal meter design changed significantly in both examples.
Placing the single-path pair of sensors in the center of the meter body was done intentionally as this is
the most sensitive location for flow measurement. That is the center-line sensors will shift far more than if located at any other position within the meter. This makes it an excellent check against the 4-path that will experience very little shift when the profile changes.
The benefit of the chordal design and understanding the velocity profile has been discussed in several
published papers [Ref 1, 4 & 5]. When the meter is installed with a flow conditioner, the technician can identify problems by looking at the velocity profile. Some problems develop over time, some occur very quickly as in the case of a foreign object lodging itself against the flow conditioner. Other blockage conditions can occur due to hydrate formation when the gas may be cold, or encounters significant pressure change. This hydrate condition has been known to completely block the transducer ports and thus render the meter inoperative.
Through the use of meter diagnostics, and the associated manufacturer’s software, many of the above
problems can be identified. The problem with the conventional method of identifying potential measurement errors is that most users only check the meter’s diagnostics on a monthly basis, and sometimes less often that that. When a problem occurs, it may be weeks before it is identified, and thus the impact on billing can be substantial.
By using the CBM 4+1 method of comparing the output of a single-path meter to that of the fiscal 4-
path chordal meter, the performance of the two meters is validated every hour. This means if a problem occurs, a potential measurement error can be identified by the system within one hour. Once a problem has been identified, technicians can be dispatched to investigate or the meter can be monitored more closely for further action. In today’s environment where the price of gas is ever increasing, errors in transportation, buying and selling of natural gas can lead to more significant financial risk than ever before. Knowing a meter has a potential problem within an hour will help reduce the unaccounted for gas (UAF) that all companies are striving to do.
3. PROVING THE CONCEPT 3.1 Baseline Testing
But does this technique really work when it is contained within only one meter body? To answer this question, testing was conducted at the CEESI Iowa high flow calibration facility in Garner, Iowa. For this test a 10-inch 4+1 meter was installed with a CPA 50E flow conditioner upstream. This type of flow conditioner has been used in many USM applications in North America.
One of the issues with using a flow conditioner is that debris can collect in front of the flow
conditioner. When this occurs there can be an affect on the USM accuracy. The effect has been documented in several presentations [Ref 1, 5 & 6].

There was a significant length of straight piping upstream of the metering package. This significant length of straight pipe would present a very symmetrical and non-swirling profile to the CPA 50E flow conditioner.
Figure 5: 10-Inch CBM 4+1 Meter Run Assembly for Baseline Testing
Figure 5 shows the CBM 4+1 meter with upstream and downstream piping, including the dual pressure and temperature transmitters used by the CEESI calibration facility. Figure 6 shows the 4+1 meter close up.
Figure 6: 10-inch CBM 4+1 Meter During Testing
The electronics in the foreground is for the 4-path part of the meter, and the background electronics is for the single-path. Baseline testing was conducted and Figures 7 and 8 show the “As Left” results (once the piece-wise linearization (PWL) coefficients were written to the meter configuration) along with the verification points.

4-Path As Left and Verification Results
-1.4-1.2-1.0-0.8-0.6-0.4-0.20.00.20.40.60.81.01.21.4
0 20 40 60 80 100 120 140
Meter Velocity (fps)
% E
rror
As Left Verification Points
Figure 7: 10-inch 4-Path Meter As-Left and Verification Results
Figure 7 shows the results of the 4-path meter repeated to within 0.06% or less for each of the three verification points. This is the typical repeatability of the meter and the facility.
As this meter was to be installed in a location where contamination was known to occur, it was tested
only over the gas velocity range that has been seen by the current installation. After several months of testing the meter will then be returned to the CEESI facility for testing in a “dirty” condition. At that time a full range flow calibration from 3-120 fps will be performed. Since the meter will be returned for this testing within 4-6 months, only 5 flow calibration points were taken.
Figure 8 shows the results of the single-path meter after entering the calibration coefficients, and also
the verification points to show the meter is very repeatable.
Single-Path As Left and Verification Results
-1.4-1.2-1.0-0.8-0.6-0.4-0.20.00.20.40.60.81.01.21.4
0 20 40 60 80 100 120 140Meter Velocity (ft/sec)
% E
rror
As Left Verification Points
Figure 8: 10-inch Single-Path Meter As-Left and Verification Results

The “As Found” and Verification tests for the single-path meter and the 4-path data were performed simultaneously. The single-path meter repeatability was just as good as the 4-path with results that were less than 0.06% compared to the CEESI facility. This shows the single path meter can provide very repeatable results if the profile has not changed.
Figure 9 shows the velocity profile of the 4-path meter. Only one velocity profile is shown but it is the
same at the other velocities tested.
Path Ratios at 44.1 fps
0.905
1.025
1.020
0.912
0.80 0.85 0.90 0.95 1.00 1.05 1.10
Path 1
Path 2
Path 3
Path 4
Path Ratios
Figure 9: 4-Path Ratios at 44 fps
Figure 9 shows the chord ratios for the 4-path at 44 fps. The chord ratios for all velocities are essentially the same so only one is shown here. From this we can see the profile is very symmetrical with the Asymmetry reading 0.999. This equates to about 0.1% difference between the average of the upper two path and the lower two paths. Thus, this is an excellent symmetrical profile, one that would be expected under ideal conditions.
3.2 Effect of Flow Conditioner Blockage
During the construction phase of a typical meter station, and its’ associated piping in the real world, some construction materials (including wood, paper and other debris) may have inadvertently been left in the piping. When the meter station is put into service, the velocity of the flowing gas may move the material down the pipe until it becomes lodged against a fitting or other obstruction. Frequently this ends up being the flow conditioner upstream of the meter.
Users have often asked questions about the impact on accuracy of such blockage of the flow
conditioner. With little data published, a test was conducted in 2004 and published at the CEESI USM Conference [Ref 5] and also at the 2005 NSFMW Conference [Ref 1]. To assess the impact of a significant obstruction in front of the flow conditioner, the previous test condition was duplicated (simulating a potential field type of blockage) by placing duct tape over approximately 40% of the flow conditioner. Figure 10 shows the blocked flow conditioner prior to testing. The blockage was installed at the bottom of the pipe.

Figure 10: 10-inch Blocked CPA Flow Conditioner Used for Test
This was the same amount of blockage used for the previous 12 inch testing and published in 2004, 2005 and 2006 conference proceedings [Ref 1, 5 & 6]. After installation of the blockage in front of the CBM 4+1 meter, Figure 11 shows the results of the velocity profile.
Path Ratios at 43.9 fps
0.884
0.963
1.042
1.019
0.80 0.85 0.90 0.95 1.00 1.05 1.10
Path 1
Path 2
Path 3
Path 4
Path Ratios
Figure 11: 4-Path Ratios at 44 fps – Blocked CPA
Figure 11 shows how distorted profile becomes with the blockage compared to the profile without blockage in Figure 10. It is clear that the meter has a significantly different profile as the asymmetry has gone from 0.999 to 0.897. This equates to a shift of more than 10% in profile from top to bottom. The next question one might ask is what is the impact on the accuracy of the 4-path meter? Figure 12 shows the results of the 4-path meter after the blockage is installed.
10-inch, 4-Path As Left and Blocked Results
-1.4-1.2-1.0-0.8-0.6-0.4-0.20.00.20.40.60.81.01.21.4
0 20 40 60 80 100 120 140Meter Velocity (fps)
% E
rror
As Left Blocked Flow Conditioner
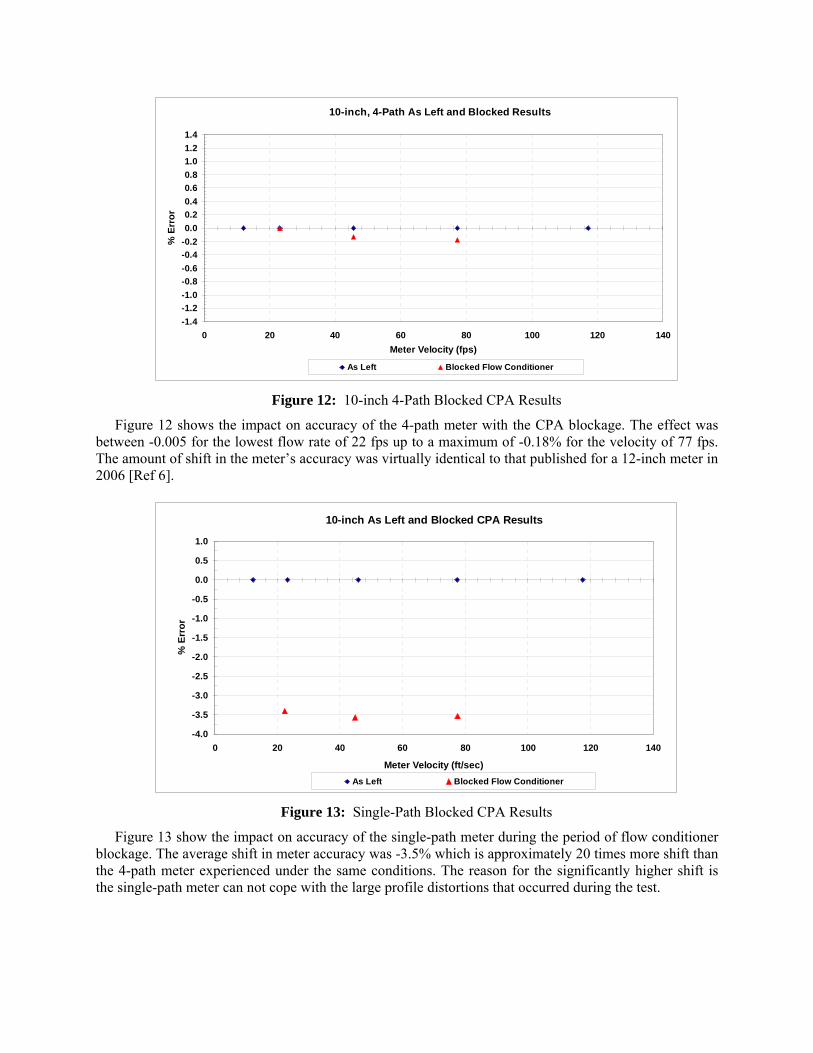
Figure 12: 10-inch 4-Path Blocked CPA Results
Figure 12 shows the impact on accuracy of the 4-path meter with the CPA blockage. The effect was between -0.005 for the lowest flow rate of 22 fps up to a maximum of -0.18% for the velocity of 77 fps. The amount of shift in the meter’s accuracy was virtually identical to that published for a 12-inch meter in 2006 [Ref 6].
10-inch As Left and Blocked CPA Results
-4.0
-3.5
-3.0
-2.5
-2.0
-1.5
-1.0
-0.5
0.0
0.5
1.0
0 20 40 60 80 100 120 140
Meter Velocity (ft/sec)
% E
rror
As Left Blocked Flow Conditioner
Figure 13: Single-Path Blocked CPA Results
Figure 13 show the impact on accuracy of the single-path meter during the period of flow conditioner blockage. The average shift in meter accuracy was -3.5% which is approximately 20 times more shift than the 4-path meter experienced under the same conditions. The reason for the significantly higher shift is the single-path meter can not cope with the large profile distortions that occurred during the test.

3.3 Additional Testing One question that might be asked is the following: “Is the previously shown 10-inch data unique to
this line size, and will this CBM 4+1 design identify much less blockage?” To answer that question two additional CBM 4+1 meters, one 8-inch and one 12-inch, were also tested at CEESI. Not only were the 40% blockage tests duplicated, but additional testing was done with just 3 holes blocked on the CPA, and with only 1 hole blocked. In order to identify whether location of the blockage was an influence, the 3 holes blockage test was performed with the blocked holes on the bottom, and then also with the blocked holes located 90 degrees from the bottom. The same three velocities were used for all of these tests.
Figure 14: 12-inch 4+1 CBM Meter CEESI
Figure 14 shows a 12 inch meter installed at the CEESI facility for the testing. A CPA was installed 10D upstream for baseline testing. After the baseline testing was complete, and the adjusted output for both the 4 path meter and the single path meter were verified, the 12-inch CPA was covered with duct tape (40% blockage). Figure 15 shows the flow conditioner prior to testing.
Figure 15: 12-inch CPA with 40% Blockage

Figure 16 shows the results of the baseline calibration and the results of the 4-path with 40% blockage.
12-inch, 4-Path Meter - 40% Blocked Results
-1.00
-0.75
-0.50
-0.25
0.00
0.25
0.50
0.75
1.00
0 10 20 30 40 50 60 70 80
Meter Velocity (ft/sec)
% E
rror
Un-Blocked CPA 40 Percent Blocked CPA
Figure 16: 12-inch 4-Path Meter Results with 40% Blockage
Figure 16 shows that the 12-inch, 4-path meter shifted on the order of 0.15% or less for all three velocities tested. Figure 17 shows the results of the single-path during this same time.
12-inch, Single-Path Meter, 40% Blocked Results
-4.0
-3.5
-3.0
-2.5
-2.0
-1.5
-1.0
-0.5
0.0
0.5
1.0
0 10 20 30 40 50 60 70 80
Meter Velocity (ft/sec)
% E
rror
Un-Blocked 40% Blocked
Figure 17: 12-inch 4-Path Meter Results with 40% Blockage
Figure 17 shows the impact on the single-path meter to be on the order of 3.5%. This is about the same effect as was seen on the 10-inch meter. Thus for the same blockage the 12-inch meter, both the single-path and 4-path, had approximately the same shift in accuracy as that seen on the 10-inch meter.
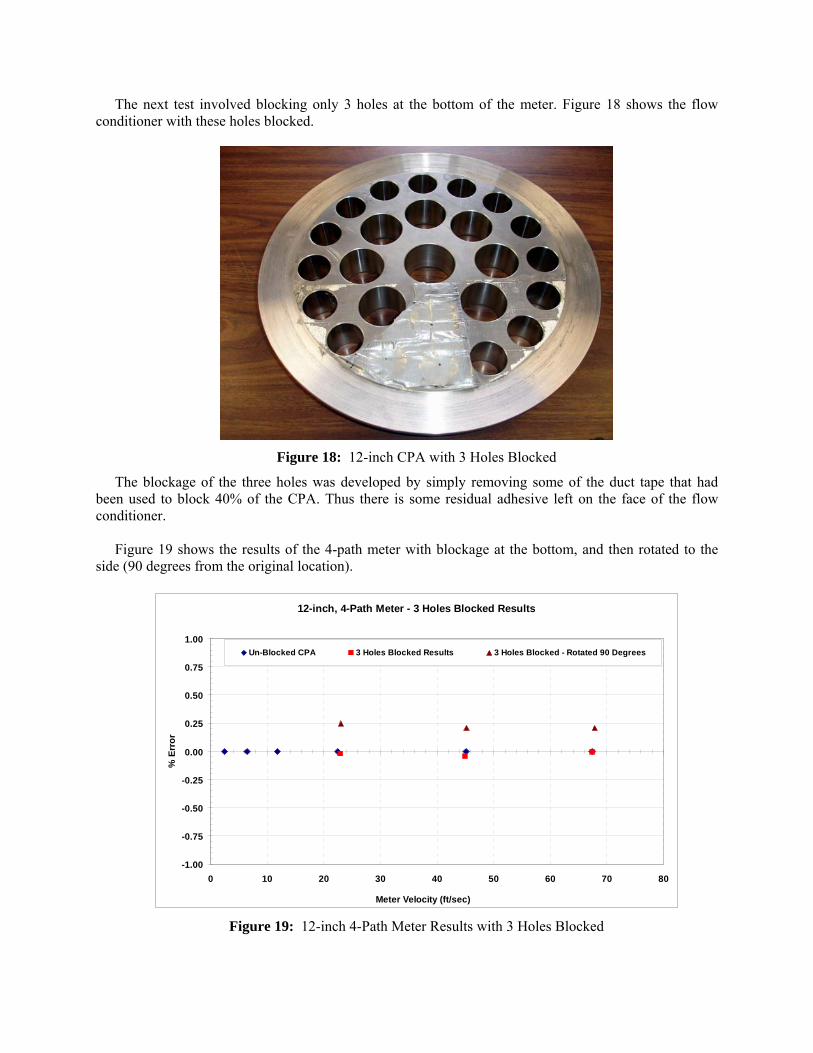
The next test involved blocking only 3 holes at the bottom of the meter. Figure 18 shows the flow conditioner with these holes blocked.
Figure 18: 12-inch CPA with 3 Holes Blocked
The blockage of the three holes was developed by simply removing some of the duct tape that had been used to block 40% of the CPA. Thus there is some residual adhesive left on the face of the flow conditioner.
Figure 19 shows the results of the 4-path meter with blockage at the bottom, and then rotated to the
side (90 degrees from the original location).
12-inch, 4-Path Meter - 3 Holes Blocked Results
-1.00
-0.75
-0.50
-0.25
0.00
0.25
0.50
0.75
1.00
0 10 20 30 40 50 60 70 80
Meter Velocity (ft/sec)
% E
rror
Un-Blocked CPA 3 Holes Blocked Results 3 Holes Blocked - Rotated 90 Degrees
Figure 19: 12-inch 4-Path Meter Results with 3 Holes Blocked

When the blockage was at the bottom of the meter run, there was very little impact on accuracy. When the blockage was rotated 90 degrees to the side, the meter responded with a shift of about +0.25%. All other blockage tests to date had show the meter to respond with a negative shift in error, but for the first time the meter now measured fast with this blockage.
Figure 20 shows the results of the single-path during these tests.
12-inch, Single-Path Meter, 3 Holes Blocked Results
-3.0
-2.5
-2.0
-1.5
-1.0
-0.5
0.0
0.5
1.0
0 10 20 30 40 50 60 70 80
Meter Velocity (ft/sec)
% E
rror
Un-Blocked CPA 3 Holes Blocked CPA 3 Holes Blocked - CPA Rotated 90 Degrees
`
Figure 20: 12-inch Single-Path Meter Results with 3 Holes Blocked
The single path meter shifted more than 2% slow when the blockage was at the bottom, and about 0.3% slow when the blockage was on the side. Even though the shift in the single-path meter was only 0.3% slow, the difference between the 4-path and the single-path was still approximately 0.5%. The next step was to test the meter with only one blocked hole. Figure 21 is a picture of the CPA prior to the testing.
Figure 21: 12-inch CPA with 1 Hole Blocked
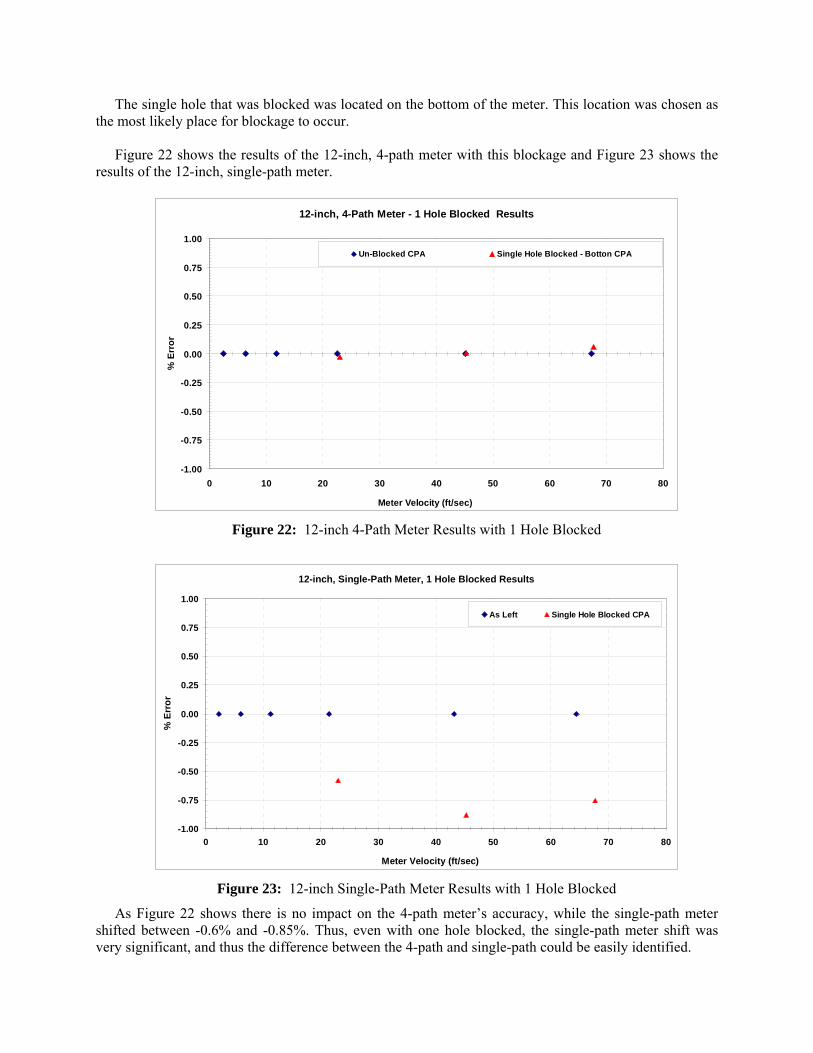
The single hole that was blocked was located on the bottom of the meter. This location was chosen as the most likely place for blockage to occur.
Figure 22 shows the results of the 12-inch, 4-path meter with this blockage and Figure 23 shows the
results of the 12-inch, single-path meter.
12-inch, 4-Path Meter - 1 Hole Blocked Results
-1.00
-0.75
-0.50
-0.25
0.00
0.25
0.50
0.75
1.00
0 10 20 30 40 50 60 70 80
Meter Velocity (ft/sec)
% E
rror
Un-Blocked CPA Single Hole Blocked - Botton CPA
Figure 22: 12-inch 4-Path Meter Results with 1 Hole Blocked
12-inch, Single-Path Meter, 1 Hole Blocked Results
-1.00
-0.75
-0.50
-0.25
0.00
0.25
0.50
0.75
1.00
0 10 20 30 40 50 60 70 80
Meter Velocity (ft/sec)
% E
rror
As Left Single Hole Blocked CPA
Figure 23: 12-inch Single-Path Meter Results with 1 Hole Blocked
As Figure 22 shows there is no impact on the 4-path meter’s accuracy, while the single-path meter shifted between -0.6% and -0.85%. Thus, even with one hole blocked, the single-path meter shift was very significant, and thus the difference between the 4-path and single-path could be easily identified.
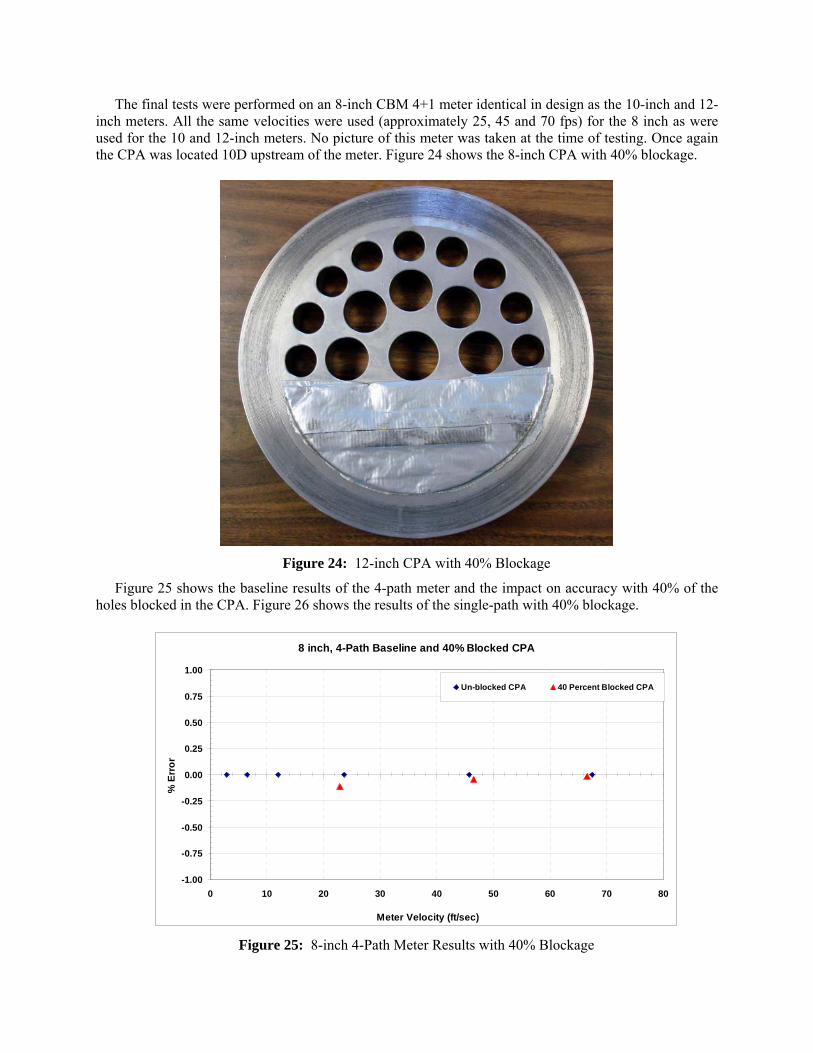
The final tests were performed on an 8-inch CBM 4+1 meter identical in design as the 10-inch and 12-inch meters. All the same velocities were used (approximately 25, 45 and 70 fps) for the 8 inch as were used for the 10 and 12-inch meters. No picture of this meter was taken at the time of testing. Once again the CPA was located 10D upstream of the meter. Figure 24 shows the 8-inch CPA with 40% blockage.
Figure 24: 12-inch CPA with 40% Blockage
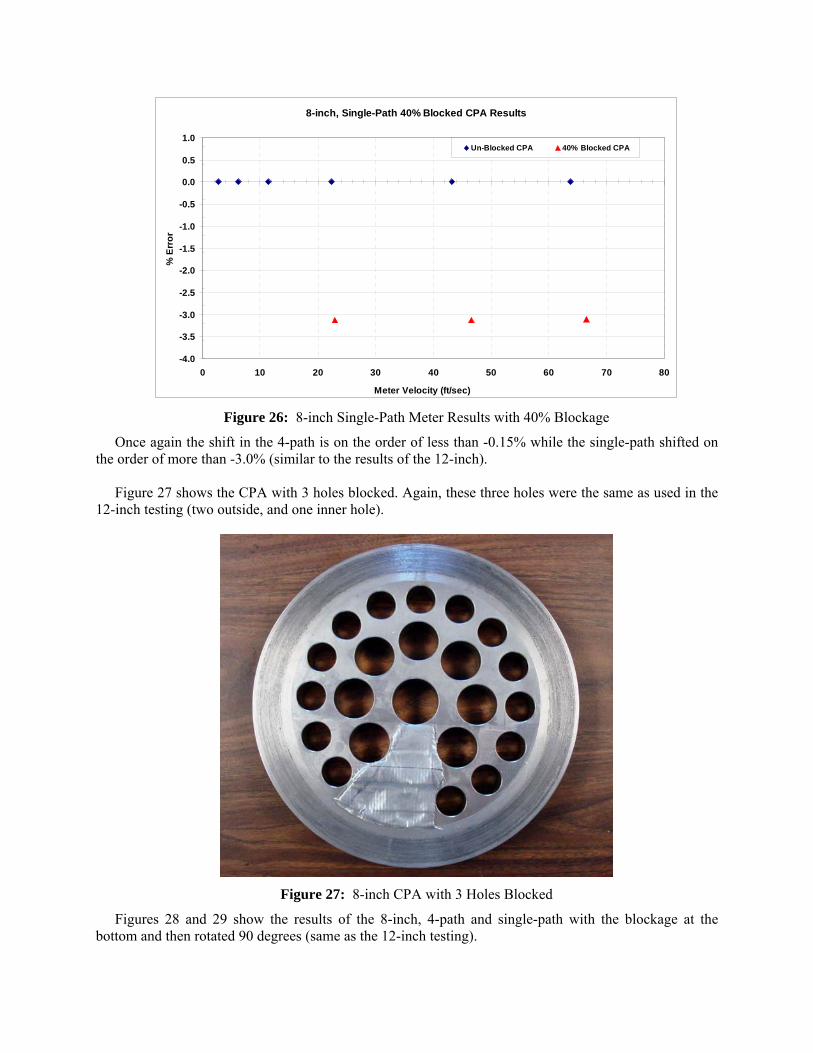
Figure 25 shows the baseline results of the 4-path meter and the impact on accuracy with 40% of the holes blocked in the CPA. Figure 26 shows the results of the single-path with 40% blockage.
8 inch, 4-Path Baseline and 40% Blocked CPA
-1.00
-0.75
-0.50
-0.25
0.00
0.25
0.50
0.75
1.00
0 10 20 30 40 50 60 70 80
Meter Velocity (ft/sec)
% E
rror
Un-blocked CPA 40 Percent Blocked CPA
Figure 25: 8-inch 4-Path Meter Results with 40% Blockage
8-inch, Single-Path 40% Blocked CPA Results
-4.0
-3.5
-3.0
-2.5
-2.0
-1.5
-1.0
-0.5
0.0
0.5
1.0
0 10 20 30 40 50 60 70 80
Meter Velocity (ft/sec)
% E
rror
Un-Blocked CPA 40% Blocked CPA
Figure 26: 8-inch Single-Path Meter Results with 40% Blockage
Once again the shift in the 4-path is on the order of less than -0.15% while the single-path shifted on the order of more than -3.0% (similar to the results of the 12-inch).
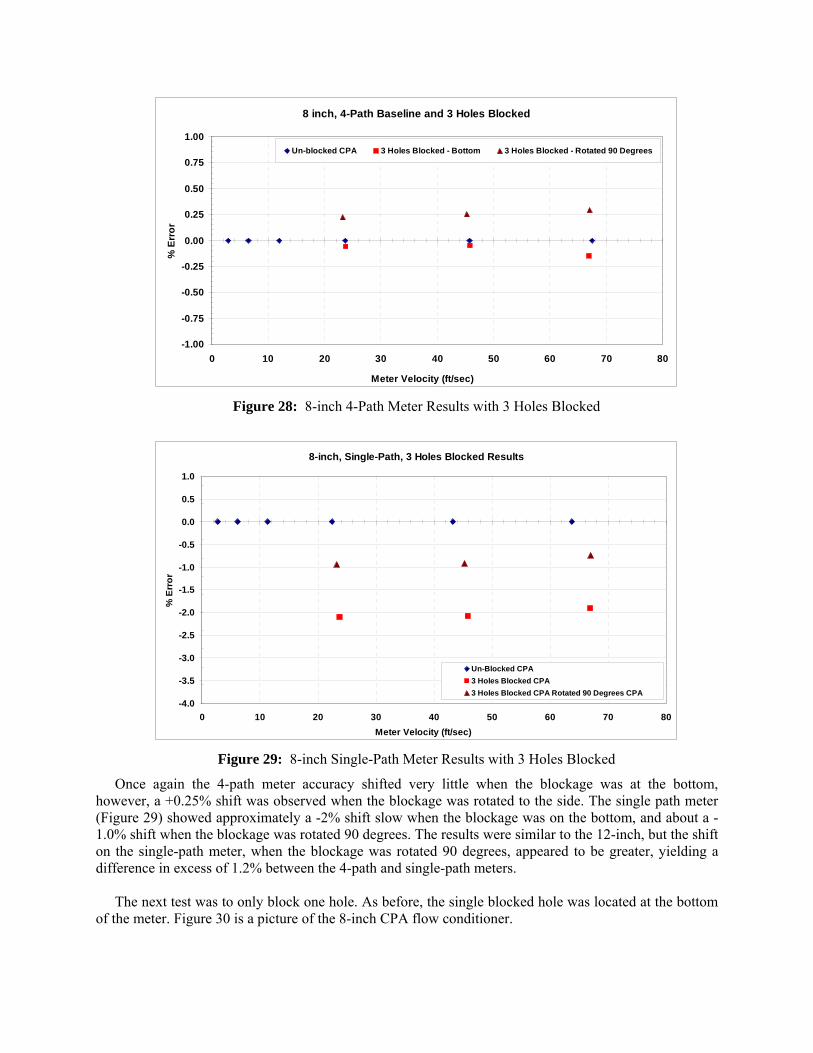
Figure 27 shows the CPA with 3 holes blocked. Again, these three holes were the same as used in the
12-inch testing (two outside, and one inner hole).
Figure 27: 8-inch CPA with 3 Holes Blocked
Figures 28 and 29 show the results of the 8-inch, 4-path and single-path with the blockage at the bottom and then rotated 90 degrees (same as the 12-inch testing).
8 inch, 4-Path Baseline and 3 Holes Blocked
-1.00
-0.75
-0.50
-0.25
0.00
0.25
0.50
0.75
1.00
0 10 20 30 40 50 60 70 80
Meter Velocity (ft/sec)
% E
rror
Un-blocked CPA 3 Holes Blocked - Bottom 3 Holes Blocked - Rotated 90 Degrees
Figure 28: 8-inch 4-Path Meter Results with 3 Holes Blocked
8-inch, Single-Path, 3 Holes Blocked Results
-4.0
-3.5
-3.0
-2.5
-2.0
-1.5
-1.0
-0.5
0.0
0.5
1.0
0 10 20 30 40 50 60 70 80Meter Velocity (ft/sec)
% E
rror
Un-Blocked CPA3 Holes Blocked CPA3 Holes Blocked CPA Rotated 90 Degrees CPA
Figure 29: 8-inch Single-Path Meter Results with 3 Holes Blocked
Once again the 4-path meter accuracy shifted very little when the blockage was at the bottom, however, a +0.25% shift was observed when the blockage was rotated to the side. The single path meter (Figure 29) showed approximately a -2% shift slow when the blockage was on the bottom, and about a -1.0% shift when the blockage was rotated 90 degrees. The results were similar to the 12-inch, but the shift on the single-path meter, when the blockage was rotated 90 degrees, appeared to be greater, yielding a difference in excess of 1.2% between the 4-path and single-path meters.
The next test was to only block one hole. As before, the single blocked hole was located at the bottom
of the meter. Figure 30 is a picture of the 8-inch CPA flow conditioner.

Figure 30: 8-inch CPA with 1 Hole Blocked
Figures 31 and 32 show results of the 8-inch, 4-path and single-path with only one hole blocked.
8 inch, 4-Path Baseline and 1 Hole Blocked
-1.00
-0.75
-0.50
-0.25
0.00
0.25
0.50
0.75
1.00
0 10 20 30 40 50 60 70 80
Meter Velocity (ft/sec)
% E
rror
As Left Single Hole Blocked - Botton CPA
Figure 31: 8-inch 4-Path Meter Results with 1 Hole Blocked

8-inch, Single-Path, 1 Hole Blocked CPA Results
-1.00
-0.75
-0.50
-0.25
0.00
0.25
0.50
0.75
1.00
0 10 20 30 40 50 60 70 80
Meter Velocity (ft/sec)
% E
rror
As Left Single Hole Blocked - Botton CPA
Figure 32: 8-inch Single-Path Meter Results with 1 Hole Blocked
Once again the results of the 4-path meter showed virtually no shift in accuracy with a single hole blocked. The single-path meter showed a shift from -0.15% to about -0.4%. Although the shift of the 8-inch, single-path meter was less than shift on the 12-inch, it showed the same trend, and in the same direction.
4.0 IMPLEMENTING THIS DESIGN
As discussed earlier in this paper, both electronics operate independently. The output of each meter needs only to be brought into the same flow computer and volumes stored for both as would normally be done for two separate meters. To take advantage of this feature, the hourly uncorrected volumes would then be compared and an adjustable tolerance set based upon some history established during commissioning. The tolerance may vary slightly from site to site, and will depend slightly upon the upstream piping conditions and the symmetry of the profile downstream of the flow conditioner. However, the typical agreement that has been mentioned is on the order of 0.2%.
The comparison test probably should not be conducted when meter velocities are below perhaps 3 fps
as the profile effects can become more significant. For this reason the flow computer should accumulate separate totals for comparison testing since the effective cutoff for the comparison would be perhaps 3 fps. Thus it may not be practical to use the absolute uncorrected volumes through each meter if the flow rate is frequently below 3 fps.
For many installations meter velocities are always above 3 fps. This is common in mainline stations
where there is always flow. For these cases a direct comparison of hourly uncorrected volumes would suffice. Many users already have this feature built in to their flow computers. They do comparisons of “run ratios” in order to spot potential problems. For these users they simply have to connect the meter to the flow computer, set the comparison ratio to a value, and start monitoring for the alarm. Thus taking full advantage of this meter design can be incorporated immediately with no special flow computer programming. 4.1 Long-Term Testing
The next phase of testing will be to determine how much the single-path meter will shift when installed in “real-world’ conditions where contamination exists. Papers have been published [Ref 1 & 7]

showing that the chordal design meter is relatively insensitive to contamination over time. It is expected the single-path meter will shift significantly during this period. The real question is “can the use of the 4+1 CBM meter design predict when the 4-path fiscal meter error exceeds a prescribed amount?”
Many users today know they have contamination in their metering systems. They periodically clean
the meter in order to minimize the uncertainty effect due to contamination. If the amount of difference between the 4-path meter and the single-path meter can be used to determine the cleaning interval, these users will then benefit from extended inspection intervals and thus save significant O&M expenses.
5. CONCLUSIONS
Today the cost of energy is higher than it was several years ago, and it is not likely this trend will reverse itself. By implementing ultrasonic metering technology users have been able to improve their measurement and reduce their UAF during the past several years. One thing task always remains for the technician and that is to insure the meter is operating correctly and accurately. This applies to all measurement technologies, not just USMs. The significant benefit of the USM is the ability to provide diagnostic information for the user to help determine the meter’s “health.”
Today technicians have software to help understand the operation of their USM. Since different
manufacturers use different velocity integration techniques (different path configurations), it is often difficult for the technician to fully understand whether his USM is operating correctly or not. Additionally, since most only inspect the meter’s operation once per month, problems can occur and go undetected for many days or weeks. This can significantly increase measurement uncertainty during this time.
The CBM 4+1 meter design relies on basically two principles. First, the fiscal meter is chosen to be
the least sensitive to any flow profile changes that may occur in normal operation. And second, the “check” meter design is chosen to be one that is the most sensitive to any flow profile changes. Ideally any affect of profile changes would not only have a significantly different impact on accuracy, but the effect would be in opposite directions, making the difference much easier to detect.
The benefit of the CBM 4+1 meter design is that the flow computer is used to check the health of the
fiscal 4-path chordal meter by simply comparing it to the single-path meter. If the velocity profile remains relatively constant, both meters will agree. Should some process condition upset the normal profile, the single-path meter will respond significantly different than the 4-path. These upsets can include the following:
• Blockage in front of the flow conditioner, • Contamination due to oil and mill scale buildup over time, • Pulsation in the pipeline due to compressors (sampling rate for the single-path exceeds 75 times
per second, thus virtually making the single-path insensitive to pulsation), • Potential problems with the fiscal meter including transducers and electronics problems, • And the CBM 4+1 design provides full redundancy should there be a failure of the electronics. Today the cost of accuracy has never been more important. There are many applications where the
accuracy of the measurement must be maintained to the highest degree possible. This CBM 4+1 meter design provides a “real-time health check” on the custody transfer meter. This significantly reduces the overall uncertainty of the measurement, and also reduces the O&M costs attributable to the technician by providing an almost immediate warning when a problem occurs.

5. REFERENCES
1. John Lansing, How Today’s USM Diagnostics Solve Metering Problems, North Sea Flow Measurement Conference, October 2005, Tonsberg, Norway
2. Klaus Zanker, Diagnostic Ability of the Daniel Four-Path Ultrasonic Flow Meter, Southeast Asia Flow Measurement Workshop, 2003, Kuala Lumpur, Malaysia
3. T. A. Grimley, The Influence of Velocity Profile on ultrasonic Flow Meter Performance, AGA Operations Conference, 1998
4. John Lansing, Dirty vs. Clean Ultrasonic Flow Meter Performance, North Sea Flow Measurement Conference, October 2004, St. Andrews, Scotland
5. Larry Garner & Joel Clancy, Ultrasonic Meter Performance – Flow Calibration Results – CEESI Iowa – Inspection Tees vs. Elbows, CEESI Ultrasonic Conference, June 2004, Estes Park, CO
6. John Lansing, Features and Benefits of the SICK Maihak USM, CEESI Ultrasonic Conference, June 2006, Estes Park, CO
7. John Lansing, Dirty, vs. Clean Ultrasonic Gas Flow Meter Performance, AGA Operations Conference, May 2002, Chicago, IL