Embed Size (px)
Citation preview

UltrasonographyArdo Asperk
t01055210.12.2010 Tallinn
Topics
What is ultrosonography Where used
Diagnostics Therapeutics
How the result is generated Equipmend general block schema Generating soundwave Generating picture Ultrasound modes
Sample video
Definition
Diagnostic sonography (ultrasonography) is an ultrasound-based diagnostic imaging technique used for visualizing subcutaneous body structures including tendons, muscles, joints, vessels and internal organs for possible pathology or lesions.

Diagnostic applicationsSystem Description
CardiologyEchocardiography is an essential tool in cardiology, to diagnose e.g. dilatation of parts of the heart and function of heart ventricles and valves
Emergency Medicine
Point of care ultrasound has many applications in the Emergency Department, including the Focused Assessment with Sonography for Trauma (FAST) exam for assessing significant hemoperitoneum or pericardial tamponade after trauma. Ultrasound is routinely used in the Emergency Department to expedite the care of patients with right upper quadrant abdominal pain who may have gallstones or cholecystitis.
Gastroenterology
In abdominal sonography, the solid organs of the abdomen such as the pancreas, aorta, inferior vena cava, liver, gall bladder, bile ducts, kidneys, and spleen are imaged. Sound waves are blocked by gas in the bowel and attenuated in different degree by fat, therefore there are limited diagnostic capabilities in this area. The appendix can sometimes be seen when inflamed e.g.: appendicitis.
Gynecology
Neurology for assessing blood flow and stenoses in the carotid arteries (Carotid ultrasonography) and the big intracerebral arteries
Obstetrics Obstetrical ultrasound is commonly used during pregnancy to check on the development of the fetus.
Ophthalmology
Urology
to determine, for example, the amount of fluid retained in a patient's bladder. In a pelvic sonogram, organs of the pelvic region are imaged. This includes the uterus and ovaries or urinary bladder. Men are sometimes given a pelvic sonogram to check on the health of their bladder and prostate. There are two methods of performing a pelvic sonography - externally or internally. The internal pelvic sonogram is performed either transvaginally (in a woman) or transrectally (in a man). Sonographic imaging of the pelvic floor can produce important diagnostic information regarding the precise relationship of abnormal structures with other pelvic organs and it represents a useful hint to treat patients with symptoms related to pelvic prolapse, double incontinence and obstructed defecation.
Musculoskeletal tendons, muscles, nerves, ligaments, soft tissue masses, and bone surfaces
Cardiovascular systemTo assess patency and possible obstruction of arteries Arterial sonography, diagnose DVT (Thrombosonography) and determine extent and severity of venous insufficiency (venosonography)

Therapeutic applications
bring heat or agitation into the body. clean teeth in dental hygiene. generate regional heating and mechanical changes in biological tissue, e.g. in occupational
therapy, physical therapy and cancer treatment. Focused ultrasound may be used to generate highly localized heating to treat cysts and tumors break up kidney stones by lithotripsy. cataract treatment by phacoemulsification. Additional physiological effects of low-intensity ultrasound have recently been discovered, e.g.
its ability to stimulate bone-growth and its potential to disrupt the blood-brain barrier for drug delivery.
How it works (diagnostiks)
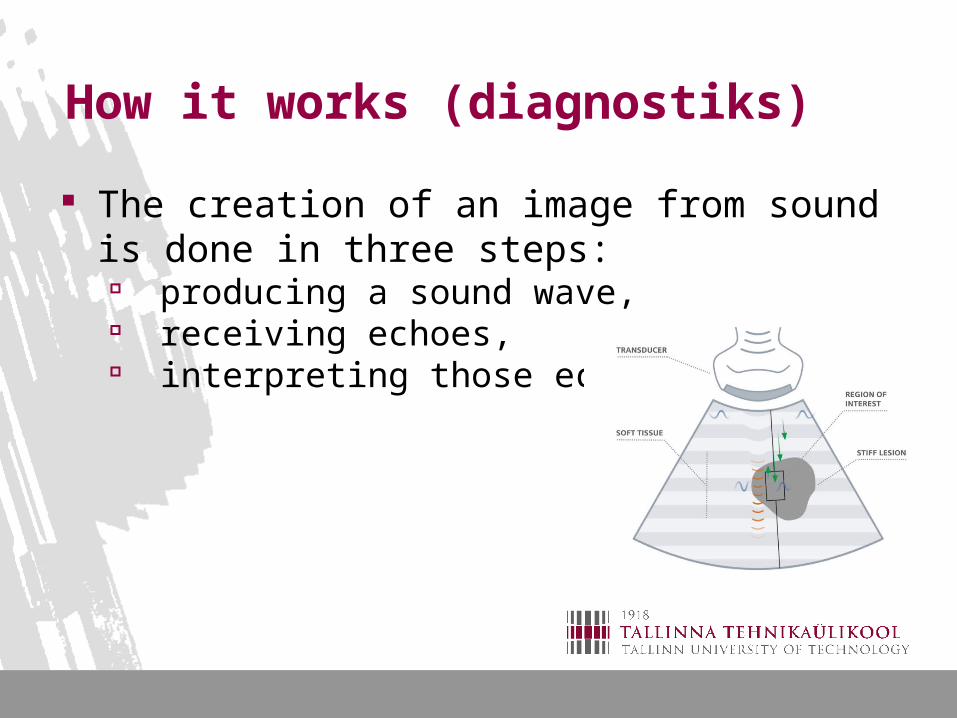
The creation of an image from sound is done in three steps:
producing a sound wave, receiving echoes, interpreting those echoes.
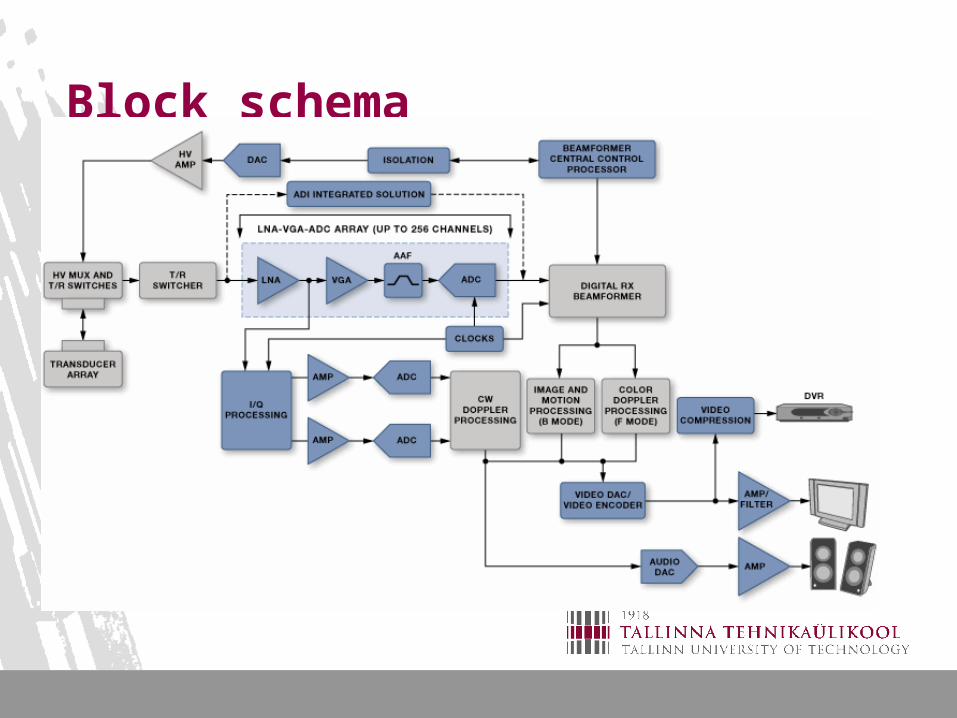
Block schema

Generating and receiving wave
Producing a sound wave A sound wave is typically produced by a piezoelectric transducer encased in a housing which can take a
number of forms. Strong, short electrical pulses from the ultrasound machine make the transducer ring at the desired frequency. The frequencies can be anywhere between 2 and 18 MHz. The sound is focused either by the shape of the transducer, a lens in front of the transducer, or a complex set of control pulses from the ultrasound scanner machine (Beamforming). This focusing produces an arc-shaped sound wave from the face of the transducer. The wave travels into the body and comes into focus at a desired depth.
Older technology transducers focus their beam with physical lenses. Newer technology transducers use phased array techniques to enable the sonographic machine to change the direction and depth of focus. Almost all piezoelectric transducers are made of ceramic.
Materials on the face of the transducer enable the sound to be transmitted efficiently into the body (usually seeming to be a rubbery coating, a form of impedance matching). In addition, a water-based gel is placed between the patient's skin and the probe.
The sound wave is partially reflected from the layers between different tissues. Specifically, sound is reflected anywhere there are density changes in the body: e.g. blood cells in blood plasma, small structures in organs, etc. Some of the reflections return to the transducer.
Receiving the echoes The return of the sound wave to the transducer results in the same process that it took to send the sound
wave, except in reverse. The return sound wave vibrates the transducer, the transducer turns the vibrations into electrical pulses that travel to the ultrasonic scanner where they are processed and transformed into a digital image.
Energy losses -
Forming and Displaying the image
Forming the image The sonographic scanner must determine three things from each received echo: How long it took the echo to be received from when the sound was transmitted. From this the focal length for the phased array is deduced, enabling a sharp image of that echo at that
depth (this is not possible while producing a sound wave). How strong the echo was. It could be noted that sound wave is not a click, but a pulse with a specific
carrier frequency. Moving objects change this frequency on reflection, so that it is only a matter of electronics to have simultaneous Doppler sonography.
Once the ultrasonic scanner determines these three things, it can locate which pixel in the image to light up and to what intensity and at what hue if frequency is processed (see redshift for a natural mapping to hue).
Transforming the received signal into a digital image may be explained by using a blank spreadsheet as an analogy. First picture a long, flat transducer at the top of the sheet. Send pulses down the 'columns' of the spreadsheet (A, B, C, etc.). Listen at each column for any return echoes. When an echo is heard, note how long it took for the echo to return. The longer the wait, the deeper the row (1,2,3, etc.). The strength of the echo determines the brightness setting for that cell (white for a strong echo, black for a weak echo, and varying shades of grey for everything in between.) When all the echoes are recorded on the sheet, we have a greyscale image.
Displaying the image Images from the sonographic scanner can be displayed, captured, and broadcast through a computer
using a frame grabber to capture and digitize the analog video signal. The captured signal can then be post-processed on the computer itself.
Ultrasound modes
A-mode: A-mode is the simplest type of ultrasound. A single transducer scans a line through the body with the echoes plotted on screen as a function of depth. Therapeutic ultrasound aimed at a specific tumor or calculus is also A-mode, to allow for pinpoint accurate focus of the destructive wave energy.
B-mode: In B-mode ultrasound, a linear array of transducers simultaneously scans a plane through the body that can be viewed as a two-dimensional image on screen.
M-mode: M stands for motion. In m-mode a rapid sequence of B-mode scans whose images follow each other in sequence on screen enables doctors to see and measure range of motion, as the organ boundaries that produce reflections move relative to the probe.
Doppler mode: This mode makes use of the Doppler effect in measuring and visualizing blood flow Color doppler: Velocity information is presented as a color coded overlay on top of a B-mode image Continuous doppler: Doppler information is sampled along a line through the body, and all velocities
detected at each time point is presented (on a time line) Pulsed wave (PW) doppler: Doppler information is sampled from only a small sample volume (defined in
2D image), and presented on a timeline Duplex: a common name for the simultaneous presentation of 2D and (usually) PW doppler information.
(Using modern ultrasound machines color doppler is almost always also used, hence the alternative name Triplex.)
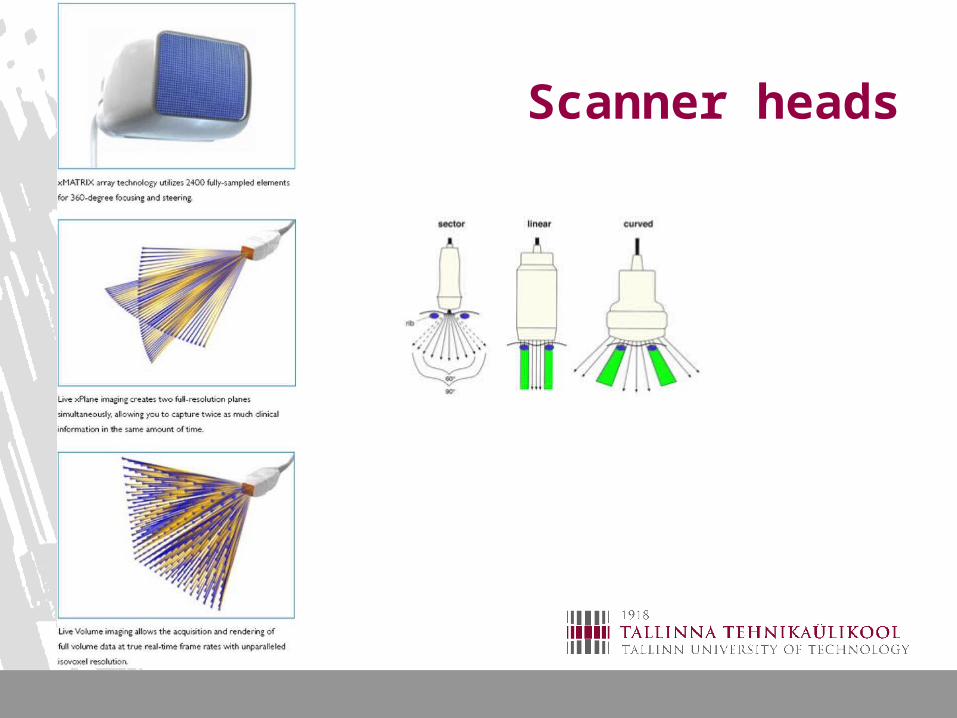
Scanner heads
Video
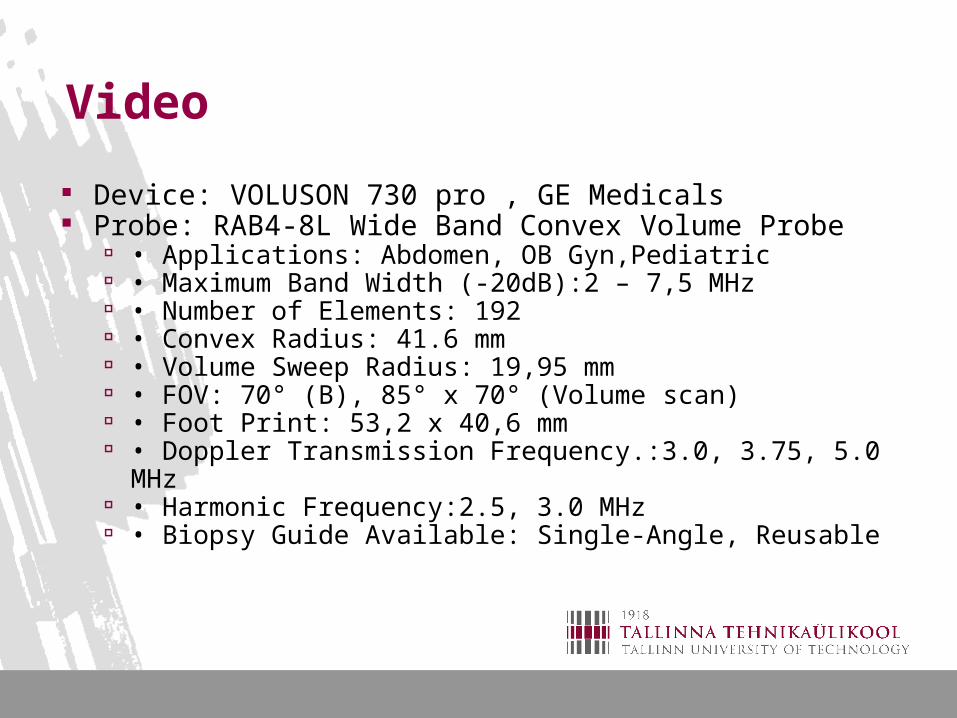
Device: VOLUSON 730 pro , GE Medicals Probe: RAB4-8L Wide Band Convex Volume Probe
• Applications: Abdomen, OB Gyn,Pediatric • Maximum Band Width (-20dB):2 – 7,5 MHz • Number of Elements: 192 • Convex Radius: 41.6 mm • Volume Sweep Radius: 19,95 mm • FOV: 70° (B), 85° x 70° (Volume scan) • Foot Print: 53,2 x 40,6 mm • Doppler Transmission Frequency.:3.0, 3.75, 5.0 MHz • Harmonic Frequency:2.5, 3.0 MHz • Biopsy Guide Available: Single-Angle, Reusable


Used literature
1. http://en.wikipedia.org/wiki/Medical_ultrasonography 9.12.2010 2. http://www.wikiradiography.com/page/Ultrasound+Physics 9.12.20103. http://www.waveimaging.net/ultrasound-machines/GE-ultrasound/images/
VOLUSON-730-Pro-DataSheet.pdf 9.12.20104. http://www.medical.siemens.com/siemens/en_INT/gg_us_FBAs/files/
misc_downloads/Whitepaper_VirtualTouch.pdf 9.12.20105. http://server.elektro.dtu.dk/personal/jw/Publications/pdf/p41.pdf 9.12.20106. http://healthcare.analog.com/en/imaging/ultrasound/segment/health.html
9.12.20107. Ardo Asperk’s personal video archive


![Superinfo [broj 100, 10.12.2010]](https://img.pdfslide.net/doc/110x75/577d33c41a28ab3a6b8baf1c/superinfo-broj-100-10122010.jpg)